UNITED STATES
SECURITIES AND EXCHANGE COMMISSION
Washington, D.C. 20549
Form N-CSR
CERTIFIED SHAREHOLDER REPORT OF REGISTERED
MANAGEMENT INVESTMENT COMPANIES
Investment Company Act File Number: 811-04015
Eaton Vance Mutual Funds Trust
(Exact Name of Registrant as Specified in Charter)
One Post Office Square, Boston, Massachusetts 02109
(Address of Principal Executive Offices)
Deidre E. Walsh
One Post Office Square, Boston, Massachusetts 02109
(Name and Address of Agent for Services)
(617) 482-8260
(Registrant’s Telephone Number)
October 31
Date of Fiscal Year End
April 30, 2024
Date of Reporting Period
Item 1. Reports to Stockholders
Eaton Vance
Global Macro Absolute Return Fund
Semi-Annual Report
April 30, 2024
Commodity Futures Trading Commission Registration. The Commodity Futures Trading Commission (“CFTC”) has adopted regulations that subject registered investment companies and advisers to regulation by the CFTC if a fund invests more than a prescribed level of its assets in certain CFTC-regulated instruments (including futures, certain options and swap agreements) or markets itself as providing investment exposure to such instruments. The adviser is registered with the CFTC as a commodity pool operator with respect to its management of the Fund. As the commodity pool operator of the Fund, the adviser has claimed relief under the Commodity Exchange Act from certain reporting and recordkeeping requirements. The adviser is also registered as a commodity trading advisor.
Fund shares are not insured by the FDIC and are not deposits or other obligations of, or guaranteed by, any depository institution. Shares are subject to investment risks, including possible loss of principal invested.
This report must be preceded or accompanied by a current summary prospectus or prospectus. Before investing, investors should consider carefully the investment objective, risks, and charges and expenses of a mutual fund. This and other important information is contained in the summary prospectus and prospectus, which can be obtained from a financial intermediary. Prospective investors should read the prospectus carefully before investing. For further information, please call 1-800-262-1122.
Semi-Annual Report April 30, 2024
Eaton Vance
Global Macro Absolute Return Fund
Eaton Vance
Global Macro Absolute Return Fund
April 30, 2024
Performance
Portfolio Manager(s) Patrick Campbell, CFA, Kyle Lee, CFA, Federico Sequeda, CFA each of Eaton Vance Management and Hussein Khattab, CFA of Eaton Vance Advisers International Ltd.
| % Average Annual Total Returns1,2 | Class
Inception Date | Performance
Inception Date | Six Months | One Year | Five Years | Ten Years |
| Class A at NAV | 06/27/2007 | 10/31/1997 | 5.42% | 8.22% | 4.29% | 3.24% |
| Class A with 3.25% Maximum Sales Charge | — | — | 2.04 | 4.76 | 3.60 | 2.91 |
| Class C at NAV | 10/01/2009 | 10/31/1997 | 5.14 | 7.41 | 3.58 | 2.68 |
| Class C with 1% Maximum Deferred Sales Charge | — | — | 4.14 | 6.41 | 3.58 | 2.68 |
| Class I at NAV | 06/27/2007 | 10/31/1997 | 5.69 | 8.51 | 4.63 | 3.56 |
| Class R at NAV | 04/08/2010 | 10/31/1997 | 5.41 | 7.96 | 4.08 | 3.04 |
| Class R6 at NAV | 05/31/2017 | 10/31/1997 | 5.61 | 8.61 | 4.68 | 3.60 |
|
| ICE BofA 3-Month U.S. Treasury Bill Index | — | — | 2.66% | 5.36% | 2.07% | 1.42% |
| % Total Annual Operating Expense Ratios3 | Class A | Class C | Class I | Class R | Class R6 |
| | 1.36% | 2.12% | 1.13% | 1.63% | 1.05% |
See Endnotes and Additional Disclosures in this report.
Past performance is no guarantee of future results. Returns are historical and are calculated by determining the percentage change in net asset value (NAV) or offering price (as applicable) with all distributions reinvested. Furthermore, returns do not reflect the deduction of taxes that shareholders may have to pay on Fund distributions or upon the redemption of Fund shares. Investment return and principal value will fluctuate so that shares, when redeemed, may be worth more or less than their original cost. Performance for periods less than or equal to one year is cumulative. Performance is for the stated time period only; due to market volatility, current Fund performance may be lower or higher than the quoted return. For performance as of the most recent month-end, please refer to eatonvance.com.
Eaton Vance
Global Macro Absolute Return Fund
April 30, 2024
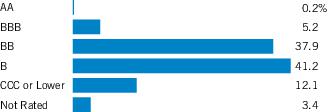
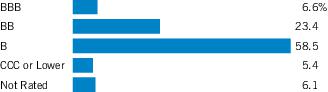
| Asset Allocation (% of net assets)1 |
| Foreign Currency Exposures (% of net assets)2 |
| Egypt | 8.2% |
| Serbia | 3.6 |
| Uzbekistan | 3.6 |
| Poland | 3.6 |
| Turkey | 3.6 |
| India | 3.1 |
| Iceland | 2.7 |
| Dominican Republic | 2.6 |
| Hungary | 2.0 |
| Canada | 1.8 |
| Singapore | 1.8 |
| Mexico | 1.7 |
| Taiwan | 1.6 |
| Australia | 1.5 |
| South Korea | 1.5 |
| Nigeria | 1.5 |
| Armenia | 1.1 |
| Uruguay | 1.0 |
| Kenya | 1.0 |
| Other | 5.9 4 |
| Bahrain | -1.0 |
| Oman | -1.2 |
| Philippines | -1.4 |
| New Zealand | -1.7 |
| South Africa | -4.0 |
| China | -5.3 |
| Euro | -13.9 |
| Total Long | 56.4% |
| Total Short | -31.5% |
| Total Net | 24.9% |
Fund invests in an affiliated investment company (Portfolio) with the same objective(s) and policies as the Fund. References to investments are to the Portfolio’s holdings.
Footnotes:
1 Other Net Assets represents other assets less liabilities and includes any investment type that represents less than 1% of net assets.
2 Currency exposures include all foreign exchange denominated assets, currency derivatives and commodities (including commodity derivatives). Total exposures may exceed 100% due to implicit leverage created by derivatives.
3 Net of securities sold short.
4 Includes amounts each less than 1.0% or –1.0%, as applicable.
Eaton Vance
Global Macro Absolute Return Fund
April 30, 2024
Endnotes and Additional Disclosures
| 1 | ICE BofA 3-Month U.S. Treasury Bill Index is an unmanaged index of U.S. Treasury securities maturing in 90 days. ICE® BofA® indices are not for redistribution or other uses; provided “as is”, without warranties, and with no liability. Eaton Vance has prepared this report and ICE Data Indices, LLC does not endorse it, or guarantee, review, or endorse Eaton Vance’s products. BofA® is a licensed registered trademark of Bank of America Corporation in the United States and other countries. Unless otherwise stated, index returns do not reflect the effect of any applicable sales charges, commissions, expenses, taxes or leverage, as applicable. It is not possible to invest directly in an index. |
| 2 | Total Returns at NAV do not include applicable sales charges. If sales charges were deducted, the returns would be lower. Total Returns shown with maximum sales charge reflect the stated maximum sales charge. Unless otherwise stated, performance does not reflect the deduction of taxes on Fund distributions or redemptions of Fund shares.Performance prior to the inception date of a class may be linked to the performance of an older class of the Fund. This linked performance is adjusted for any applicable sales charge, but is not adjusted for class expense differences. If adjusted for such differences, the performance would be different. The performance of Class R6 is linked to Class I. Performance presented in the Financial Highlights included in the financial statements is not linked.Effective November 5, 2020, Class C shares automatically convert to Class A shares eight years after purchase. The average annual total returns listed for Class C reflect conversion to Class A shares after eight years. Prior to November 5, 2020, Class C shares automatically converted to Class A shares ten years after purchase. |
| 3 | Source: Fund prospectus. The expense ratios for the current reporting period can be found in the Financial Highlights section of this report. Performance reflects expenses waived and/or reimbursed, if applicable. Without such waivers and/or reimbursements, performance would have been lower. |
| | Fund profile subject to change due to active management. |
Eaton Vance
Global Macro Absolute Return Fund
April 30, 2024
Example
As a Fund shareholder, you incur two types of costs: (1) transaction costs, including sales charges (loads) on purchases; and (2) ongoing costs, including management fees; distribution and/or service fees; and other Fund expenses. This Example is intended to help you understand your ongoing costs (in dollars) of Fund investing and to compare these costs with the ongoing costs of investing in other mutual funds. The Example is based on an investment of $1,000 invested at the beginning of the period and held for the entire period (November 1, 2023 to April 30, 2024).
Actual Expenses
The first section of the table below provides information about actual account values and actual expenses. You may use the information in this section, together with the amount you invested, to estimate the expenses that you paid over the period. Simply divide your account value by $1,000 (for example, an $8,600 account value divided by $1,000 = 8.6), then multiply the result by the number in the first section under the heading entitled “Expenses Paid During Period” to estimate the expenses you paid on your account during this period.
Hypothetical Example for Comparison Purposes
The second section of the table below provides information about hypothetical account values and hypothetical expenses based on the actual Fund expense ratio and an assumed rate of return of 5% per year (before expenses), which is not the actual Fund return. The hypothetical account values and expenses may not be used to estimate the actual ending account balance or expenses you paid for the period. You may use this information to compare the ongoing costs of investing in your Fund and other funds. To do so, compare this 5% hypothetical example with the 5% hypothetical examples that appear in the shareholder reports of the other funds.
Please note that the expenses shown in the table are meant to highlight your ongoing costs only and do not reflect any transactional costs, such as sales charges (loads). Therefore, the second section of the table is useful in comparing ongoing costs only, and will not help you determine the relative total costs of owning different funds. In addition, if these transactional costs were included, your costs would be higher.
| | Beginning
Account Value
(11/1/23) | Ending
Account Value
(4/30/24) | Expenses Paid
During Period*
(11/1/23 – 4/30/24) | Annualized
Expense
Ratio |
| Actual | | | | |
| Class A | $1,000.00 | $1,054.20 | $ 7.92 | 1.55% |
| Class C | $1,000.00 | $1,051.40 | $11.68 | 2.29% |
| Class I | $1,000.00 | $1,056.90 | $ 6.65 | 1.30% |
| Class R | $1,000.00 | $1,054.10 | $ 9.19 | 1.80% |
| Class R6 | $1,000.00 | $1,056.10 | $ 6.24 | 1.22% |
| |
| Hypothetical | | | | |
| (5% return per year before expenses) | | | | |
| Class A | $1,000.00 | $1,017.16 | $ 7.77 | 1.55% |
| Class C | $1,000.00 | $1,013.48 | $11.46 | 2.29% |
| Class I | $1,000.00 | $1,018.40 | $ 6.52 | 1.30% |
| Class R | $1,000.00 | $1,015.91 | $ 9.02 | 1.80% |
| Class R6 | $1,000.00 | $1,018.80 | $ 6.12 | 1.22% |
| * | Expenses are equal to the Fund’s annualized expense ratio for the indicated Class, multiplied by the average account value over the period, multiplied by 182/366 (to reflect the one-half year period). The Example assumes that the $1,000 was invested at the net asset value per share determined at the close of business on October 31, 2023. The Example reflects the expenses of both the Fund and the Portfolio. |
Eaton Vance
Global Macro Absolute Return Fund
April 30, 2024
Statement of Assets and Liabilities (Unaudited)
| | April 30, 2024 |
| Assets | |
| Investment in Global Macro Portfolio, at value (identified cost $1,719,144,919) | $ 1,681,397,452 |
| Receivable for Fund shares sold | 4,357,911 |
| Total assets | $1,685,755,363 |
| Liabilities | |
| Payable for Fund shares redeemed | $ 2,693,673 |
| Payable to affiliates: | |
| Distribution and service fees | 46,888 |
| Trustees' fees | 43 |
| Payable for transfer and dividend disbursing agent fees | 270,950 |
| Accrued expenses | 144,099 |
| Total liabilities | $ 3,155,653 |
| Net Assets | $1,682,599,710 |
| Sources of Net Assets | |
| Paid-in capital | $ 2,302,759,735 |
| Accumulated loss | (620,160,025) |
| Net Assets | $1,682,599,710 |
| Class A Shares | |
| Net Assets | $ 151,388,106 |
| Shares Outstanding | 18,085,077 |
Net Asset Value and Redemption Price Per Share
(net assets ÷ shares of beneficial interest outstanding) | $ 8.37 |
Maximum Offering Price Per Share
(100 ÷ 96.75 of net asset value per share) | $ 8.65 |
| Class C Shares | |
| Net Assets | $ 18,382,615 |
| Shares Outstanding | 2,187,044 |
Net Asset Value and Offering Price Per Share*
(net assets ÷ shares of beneficial interest outstanding) | $ 8.41 |
| Class I Shares | |
| Net Assets | $ 1,319,610,146 |
| Shares Outstanding | 157,968,902 |
Net Asset Value, Offering Price and Redemption Price Per Share
(net assets ÷ shares of beneficial interest outstanding) | $ 8.35 |
| Class R Shares | |
| Net Assets | $ 1,476,969 |
| Shares Outstanding | 176,116 |
Net Asset Value, Offering Price and Redemption Price Per Share
(net assets ÷ shares of beneficial interest outstanding) | $ 8.39 |
6
See Notes to Financial Statements.
Eaton Vance
Global Macro Absolute Return Fund
April 30, 2024
Statement of Assets and Liabilities (Unaudited) — continued
| | April 30, 2024 |
| Class R6 Shares | |
| Net Assets | $191,741,874 |
| Shares Outstanding | 22,970,212 |
Net Asset Value, Offering Price and Redemption Price Per Share
(net assets ÷ shares of beneficial interest outstanding) | $ 8.35 |
| On sales of $100,000 or more, the offering price of Class A shares is reduced. |
| * | Redemption price per share is equal to the net asset value less any applicable contingent deferred sales charge. |
7
See Notes to Financial Statements.
Eaton Vance
Global Macro Absolute Return Fund
April 30, 2024
Statement of Operations (Unaudited)
| | Six Months Ended |
| | April 30, 2024 |
| Investment Income | |
| Dividend income allocated from Portfolio (net of foreign taxes withheld of $115,341) | $ 4,044,166 |
| Interest income allocated from Portfolio (net of foreign taxes withheld of $582,751) | 56,451,887 |
| Other income allocated from Portfolio | 59,959 |
| Expenses, excluding interest and dividend expense, allocated from Portfolio | (5,598,492) |
| Interest and dividend expense allocated from Portfolio | (3,974,819) |
| Total investment income from Portfolio | $ 50,982,701 |
| Expenses | |
| Distribution and service fees: | |
| Class A | $ 187,010 |
| Class C | 97,653 |
| Class R | 2,960 |
| Trustees’ fees and expenses | 250 |
| Custodian fee | 28,938 |
| Transfer and dividend disbursing agent fees | 633,814 |
| Legal and accounting services | 59,052 |
| Printing and postage | 181,950 |
| Registration fees | 58,504 |
| Miscellaneous | 16,705 |
| Total expenses | $ 1,266,836 |
| Net investment income | $ 49,715,865 |
| Realized and Unrealized Gain (Loss) from Portfolio | |
| Net realized gain (loss): | |
| Investment transactions | $ (2,746,298) |
| Written options | 215,859 |
| Securities sold short | (4,352,754) |
| Futures contracts | (6,045,898) |
| Swap contracts | (9,426,229) |
| Foreign currency transactions | 2,979,799 |
| Forward foreign currency exchange contracts | (7,188,695) |
| Net realized loss | $(26,564,216) |
| Change in unrealized appreciation (depreciation): | |
| Investments (including net increase in accrued foreign capital gains taxes of $140) | $ 66,540,515 |
| Written options | 201,275 |
| Securities sold short | (3,895,136) |
| Futures contracts | 1,078,850 |
| Swap contracts | (6,914,968) |
| Foreign currency | 330,060 |
| Forward foreign currency exchange contracts | 9,132,633 |
| Net change in unrealized appreciation (depreciation) | $ 66,473,229 |
| Net realized and unrealized gain | $ 39,909,013 |
| Net increase in net assets from operations | $ 89,624,878 |
8
See Notes to Financial Statements.
Eaton Vance
Global Macro Absolute Return Fund
April 30, 2024
Statements of Changes in Net Assets
| | Six Months Ended
April 30, 2024
(Unaudited) | Year Ended
October 31, 2023 |
| Increase (Decrease) in Net Assets | | |
| From operations: | | |
| Net investment income | $ 49,715,865 | $ 110,841,354 |
| Net realized loss | (26,564,216) | (180,694,373) |
| Net change in unrealized appreciation (depreciation) | 66,473,229 | 230,134,183 |
| Net increase in net assets from operations | $ 89,624,878 | $ 160,281,164 |
| Distributions to shareholders: | | |
| Class A | $ (4,117,965) | $ (7,161,278) |
| Class C | (456,641) | (976,813) |
| Class I | (36,605,706) | (67,278,432) |
| Class R | (32,040) | (58,071) |
| Class R6 | (5,774,710) | (11,553,886) |
| Total distributions to shareholders | $ (46,987,062) | $ (87,028,480) |
| Tax return of capital to shareholders: | | |
| Class A | $ — | $ (1,392,886) |
| Class C | — | (187,468) |
| Class I | — | (13,198,515) |
| Class R | — | (11,216) |
| Class R6 | — | (2,239,903) |
| Total tax return of capital to shareholders | $ — | $ (17,029,988) |
| Transactions in shares of beneficial interest: | | |
| Class A | $ (1,198,662) | $ (19,774,332) |
| Class C | (3,224,727) | (6,429,832) |
| Class I | (114,763,982) | (54,773,375) |
| Class R | 275,916 | (134,355) |
| Class R6 | (41,270,796) | (31,965,995) |
| Net decrease in net assets from Fund share transactions | $ (160,182,251) | $ (113,077,889) |
| Net decrease in net assets | $ (117,544,435) | $ (56,855,193) |
| Net Assets | | |
| At beginning of period | $ 1,800,144,145 | $ 1,856,999,338 |
| At end of period | $1,682,599,710 | $1,800,144,145 |
9
See Notes to Financial Statements.
Eaton Vance
Global Macro Absolute Return Fund
April 30, 2024
| | Class A |
| | Six Months Ended
April 30, 2024
(Unaudited) | Year Ended October 31, |
| | 2023 | 2022 | 2021 | 2020 | 2019 |
| Net asset value — Beginning of period | $ 8.160 | $ 7.910 | $ 8.660 | $ 8.640 | $ 8.740 | $ 8.590 |
| Income (Loss) From Operations | | | | | | |
| Net investment income(1) | $ 0.240 | $ 0.483 | $ 0.418 | $ 0.368 | $ 0.356 | $ 0.438 |
| Net realized and unrealized gain (loss) | 0.198 | 0.220 | (0.792) | (0.016) | (0.046) | 0.078 |
| Total income (loss) from operations | $ 0.438 | $ 0.703 | $ (0.374) | $ 0.352 | $ 0.310 | $ 0.516 |
| Less Distributions | | | | | | |
| From net investment income | $ (0.228) | $ (0.378) | $ (0.325) | $ (0.332) | $ (0.410) | $ (0.366) |
| Tax return of capital | — | (0.075) | (0.051) | — | — | — |
| Total distributions | $ (0.228) | $ (0.453) | $ (0.376) | $ (0.332) | $ (0.410) | $ (0.366) |
| Net asset value — End of period | $ 8.370 | $ 8.160 | $ 7.910 | $ 8.660 | $ 8.640 | $ 8.740 |
| Total Return(2) | 5.42% (3) | 8.86% | (4.27)% | 4.11% | 3.63% | 6.14% |
| Ratios/Supplemental Data | | | | | | |
| Net assets, end of period (000’s omitted) | $151,388 | $148,689 | $163,369 | $276,486 | $398,174 | $366,740 |
| Ratios (as a percentage of average daily net assets):(4) | | | | | | |
| Expenses (5) | 1.55% (6)(7) | 1.41% (7) | 1.14% (7) | 1.10% | 1.05% | 1.04% |
| Net investment income | 5.83% (6) | 5.88% | 5.03% | 4.20% | 4.11% | 5.06% |
| Portfolio Turnover of the Portfolio | 70% (3) | 96% | 81% | 88% | 81% | 61% |
| (1) | Computed using average shares outstanding. |
| (2) | Returns are historical and are calculated by determining the percentage change in net asset value with all distributions reinvested and do not reflect the effect of sales charges. |
| (3) | Not annualized. |
| (4) | Includes the Fund’s share of the Portfolio's allocated expenses. |
| (5) | Includes interest and/or dividend expense, including on securities sold short and/or reverse repurchase agreements if applicable, of 0.48%, 0.37%, 0.08%, 0.06%, 0.01% and 0.01% of average daily net assets for the six months ended April 30, 2024 and the years ended October 31, 2023, 2022, 2021, 2020 and 2019, respectively. |
| (6) | Annualized. |
| (7) | Includes a reduction by the investment adviser of a portion of the Portfolio’s adviser fee due to the Portfolio’s investment in the Liquidity Fund (equal to less than 0.01%, 0.01% and less than 0.01% of average daily net assets for the six months ended April 30, 2024 and the years ended October 31, 2023 and 2022, respectively). |
10
See Notes to Financial Statements.
Eaton Vance
Global Macro Absolute Return Fund
April 30, 2024
Financial Highlights — continued
| | Class C |
| | Six Months Ended
April 30, 2024
(Unaudited) | Year Ended October 31, |
| | 2023 | 2022 | 2021 | 2020 | 2019 |
| Net asset value — Beginning of period | $ 8.190 | $ 7.950 | $ 8.690 | $ 8.680 | $ 8.770 | $ 8.620 |
| Income (Loss) From Operations | | | | | | |
| Net investment income(1) | $ 0.210 | $ 0.427 | $ 0.365 | $ 0.307 | $ 0.305 | $ 0.374 |
| Net realized and unrealized gain (loss) | 0.207 | 0.208 | (0.786) | (0.026) | (0.044) | 0.082 |
| Total income (loss) from operations | $ 0.417 | $ 0.635 | $ (0.421) | $ 0.281 | $ 0.261 | $ 0.456 |
| Less Distributions | | | | | | |
| From net investment income | $ (0.197) | $ (0.330) | $ (0.276) | $ (0.271) | $ (0.351) | $ (0.306) |
| Tax return of capital | — | (0.065) | (0.043) | — | — | — |
| Total distributions | $ (0.197) | $ (0.395) | $ (0.319) | $ (0.271) | $ (0.351) | $ (0.306) |
| Net asset value — End of period | $ 8.410 | $ 8.190 | $ 7.950 | $ 8.690 | $ 8.680 | $ 8.770 |
| Total Return(2) | 5.14% (3) | 8.06% | (4.91)% | 3.37% | 2.91% | 5.39% |
| Ratios/Supplemental Data | | | | | | |
| Net assets, end of period (000’s omitted) | $18,383 | $21,089 | $26,640 | $36,557 | $54,464 | $106,291 |
| Ratios (as a percentage of average daily net assets):(4) | | | | | | |
| Expenses (5) | 2.29% (6)(7) | 2.12% (7) | 1.84% (7) | 1.80% | 1.75% | 1.76% |
| Net investment income | 5.07% (6) | 5.18% | 4.38% | 3.49% | 3.51% | 4.31% |
| Portfolio Turnover of the Portfolio | 70% (3) | 96% | 81% | 88% | 81% | 61% |
| (1) | Computed using average shares outstanding. |
| (2) | Returns are historical and are calculated by determining the percentage change in net asset value with all distributions reinvested and do not reflect the effect of sales charges. |
| (3) | Not annualized. |
| (4) | Includes the Fund’s share of the Portfolio's allocated expenses. |
| (5) | Includes interest and/or dividend expense, including on securities sold short and/or reverse repurchase agreements if applicable, of 0.48%, 0.37%, 0.08%, 0.06%, 0.01% and 0.01% of average daily net assets for the six months ended April 30, 2024 and the years ended October 31, 2023, 2022, 2021, 2020 and 2019, respectively. |
| (6) | Annualized. |
| (7) | Includes a reduction by the investment adviser of a portion of the Portfolio’s adviser fee due to the Portfolio’s investment in the Liquidity Fund (equal to less than 0.01%, 0.01% and less than 0.01% of average daily net assets for the six months ended April 30, 2024 and the years ended October 31, 2023 and 2022, respectively). |
11
See Notes to Financial Statements.
Eaton Vance
Global Macro Absolute Return Fund
April 30, 2024
Financial Highlights — continued
| | Class I |
| | Six Months Ended
April 30, 2024
(Unaudited) | Year Ended October 31, |
| | 2023 | 2022 | 2021 | 2020 | 2019 |
| Net asset value — Beginning of period | $ 8.140 | $ 7.900 | $ 8.640 | $ 8.630 | $ 8.720 | $ 8.580 |
| Income (Loss) From Operations | | | | | | |
| Net investment income(1) | $ 0.251 | $ 0.504 | $ 0.446 | $ 0.393 | $ 0.385 | $ 0.458 |
| Net realized and unrealized gain (loss) | 0.197 | 0.211 | (0.786) | (0.024) | (0.039) | 0.074 |
| Total income (loss) from operations | $ 0.448 | $ 0.715 | $ (0.340) | $ 0.369 | $ 0.346 | $ 0.532 |
| Less Distributions | | | | | | |
| From net investment income | $ (0.238) | $ (0.397) | $ (0.345) | $ (0.359) | $ (0.436) | $ (0.392) |
| Tax return of capital | — | (0.078) | (0.055) | — | — | — |
| Total distributions | $ (0.238) | $ (0.475) | $ (0.400) | $ (0.359) | $ (0.436) | $ (0.392) |
| Net asset value — End of period | $ 8.350 | $ 8.140 | $ 7.900 | $ 8.640 | $ 8.630 | $ 8.720 |
| Total Return(2) | 5.69% (3) | 9.17% | (4.00)% | 4.31% | 4.07% | 6.34% |
| Ratios/Supplemental Data | | | | | | |
| Net assets, end of period (000’s omitted) | $1,319,610 | $1,401,233 | $1,413,454 | $1,851,665 | $2,323,831 | $2,859,484 |
| Ratios (as a percentage of average daily net assets):(4) | | | | | | |
| Expenses (5) | 1.30% (6)(7) | 1.13% (7) | 0.84% (7) | 0.80% | 0.75% | 0.75% |
| Net investment income | 6.09% (6) | 6.14% | 5.39% | 4.50% | 4.45% | 5.31% |
| Portfolio Turnover of the Portfolio | 70% (3) | 96% | 81% | 88% | 81% | 61% |
| (1) | Computed using average shares outstanding. |
| (2) | Returns are historical and are calculated by determining the percentage change in net asset value with all distributions reinvested. |
| (3) | Not annualized. |
| (4) | Includes the Fund’s share of the Portfolio's allocated expenses. |
| (5) | Includes interest and/or dividend expense, including on securities sold short and/or reverse repurchase agreements if applicable, of 0.48%, 0.37%, 0.08%, 0.06%, 0.01% and 0.01% of average daily net assets for the six months ended April 30, 2024 and the years ended October 31, 2023, 2022, 2021, 2020 and 2019, respectively. |
| (6) | Annualized. |
| (7) | Includes a reduction by the investment adviser of a portion of the Portfolio’s adviser fee due to the Portfolio’s investment in the Liquidity Fund (equal to less than 0.01%, 0.01% and less than 0.01% of average daily net assets for the six months ended April 30, 2024 and the years ended October 31, 2023 and 2022, respectively). |
12
See Notes to Financial Statements.
Eaton Vance
Global Macro Absolute Return Fund
April 30, 2024
Financial Highlights — continued
| | Class R |
| | Six Months Ended
April 30, 2024
(Unaudited) | Year Ended October 31, |
| | 2023 | 2022 | 2021 | 2020 | 2019 |
| Net asset value — Beginning of period | $ 8.170 | $ 7.930 | $ 8.670 | $ 8.660 | $ 8.750 | $ 8.610 |
| Income (Loss) From Operations | | | | | | |
| Net investment income(1) | $ 0.231 | $ 0.465 | $ 0.410 | $ 0.352 | $ 0.338 | $ 0.417 |
| Net realized and unrealized gain (loss) | 0.207 | 0.211 | (0.790) | (0.027) | (0.034) | 0.073 |
| Total income (loss) from operations | $ 0.438 | $ 0.676 | $(0.380) | $ 0.325 | $ 0.304 | $ 0.490 |
| Less Distributions | | | | | | |
| From net investment income | $ (0.218) | $ (0.364) | $ (0.311) | $ (0.315) | $ (0.394) | $ (0.350) |
| Tax return of capital | — | (0.072) | (0.049) | — | — | — |
| Total distributions | $(0.218) | $(0.436) | $(0.360) | $(0.315) | $(0.394) | $(0.350) |
| Net asset value — End of period | $ 8.390 | $ 8.170 | $ 7.930 | $ 8.670 | $ 8.660 | $ 8.750 |
| Total Return(2) | 5.41% (3) | 8.62% | (4.45)% | 3.78% | 3.55% | 5.80% |
| Ratios/Supplemental Data | | | | | | |
| Net assets, end of period (000’s omitted) | $ 1,477 | $ 1,171 | $ 1,267 | $ 1,274 | $ 968 | $ 861 |
| Ratios (as a percentage of average daily net assets):(4) | | | | | | |
| Expenses (5) | 1.80% (6)(7) | 1.63% (7) | 1.33% (7) | 1.29% | 1.25% | 1.26% |
| Net investment income | 5.59% (6) | 5.65% | 4.95% | 4.02% | 3.89% | 4.82% |
| Portfolio Turnover of the Portfolio | 70% (3) | 96% | 81% | 88% | 81% | 61% |
| (1) | Computed using average shares outstanding. |
| (2) | Returns are historical and are calculated by determining the percentage change in net asset value with all distributions reinvested. |
| (3) | Not annualized. |
| (4) | Includes the Fund’s share of the Portfolio's allocated expenses. |
| (5) | Includes interest and/or dividend expense, including on securities sold short and/or reverse repurchase agreements if applicable, of 0.48%, 0.37%, 0.08%, 0.06%, 0.01% and 0.01% of average daily net assets for the six months ended April 30, 2024 and the years ended October 31, 2023, 2022, 2021, 2020 and 2019, respectively. |
| (6) | Annualized. |
| (7) | Includes a reduction by the investment adviser of a portion of the Portfolio’s adviser fee due to the Portfolio’s investment in the Liquidity Fund (equal to less than 0.01%, 0.01% and less than 0.01% of average daily net assets for the six months ended April 30, 2024 and the years ended October 31, 2023 and 2022, respectively). |
13
See Notes to Financial Statements.
Eaton Vance
Global Macro Absolute Return Fund
April 30, 2024
Financial Highlights — continued
| | Class R6 |
| | Six Months Ended
April 30, 2024
(Unaudited) | Year Ended October 31, |
| | 2023 | 2022 | 2021 | 2020 | 2019 |
| Net asset value — Beginning of period | $ 8.130 | $ 7.890 | $ 8.630 | $ 8.620 | $ 8.710 | $ 8.570 |
| Income (Loss) From Operations | | | | | | |
| Net investment income(1) | $ 0.253 | $ 0.510 | $ 0.450 | $ 0.398 | $ 0.391 | $ 0.464 |
| Net realized and unrealized gain (loss) | 0.208 | 0.212 | (0.783) | (0.024) | (0.040) | 0.073 |
| Total income (loss) from operations | $ 0.461 | $ 0.722 | $ (0.333) | $ 0.374 | $ 0.351 | $ 0.537 |
| Less Distributions | | | | | | |
| From net investment income | $ (0.241) | $ (0.403) | $ (0.351) | $ (0.364) | $ (0.441) | $ (0.397) |
| Tax return of capital | — | (0.079) | (0.056) | — | — | — |
| Total distributions | $ (0.241) | $ (0.482) | $ (0.407) | $ (0.364) | $ (0.441) | $ (0.397) |
| Net asset value — End of period | $ 8.350 | $ 8.130 | $ 7.890 | $ 8.630 | $ 8.620 | $ 8.710 |
| Total Return(2) | 5.61% (3) | 9.27% | (3.80)% | 4.37% | 4.01% | 6.53% |
| Ratios/Supplemental Data | | | | | | |
| Net assets, end of period (000’s omitted) | $191,742 | $227,962 | $252,269 | $376,984 | $390,210 | $224,436 |
| Ratios (as a percentage of average daily net assets):(4) | | | | | | |
| Expenses (5) | 1.22% (6)(7) | 1.05% (7) | 0.77% (7) | 0.73% | 0.68% | 0.69% |
| Net investment income | 6.15% (6) | 6.23% | 5.44% | 4.56% | 4.51% | 5.37% |
| Portfolio Turnover of the Portfolio | 70% (3) | 96% | 81% | 88% | 81% | 61% |
| (1) | Computed using average shares outstanding. |
| (2) | Returns are historical and are calculated by determining the percentage change in net asset value with all distributions reinvested. |
| (3) | Not annualized. |
| (4) | Includes the Fund’s share of the Portfolio's allocated expenses. |
| (5) | Includes interest and/or dividend expense, including on securities sold short and/or reverse repurchase agreements if applicable, of 0.48%, 0.37%, 0.08%, 0.06%, 0.01% and 0.01% of average daily net assets for the six months ended April 30, 2024 and the years ended October 31, 2023, 2022, 2021, 2020 and 2019, respectively. |
| (6) | Annualized. |
| (7) | Includes a reduction by the investment adviser of a portion of the Portfolio’s adviser fee due to the Portfolio’s investment in the Liquidity Fund (equal to less than 0.01%, 0.01% and less than 0.01% of average daily net assets for the six months ended April 30, 2024 and the years ended October 31, 2023 and 2022, respectively). |
14
See Notes to Financial Statements.
Eaton Vance
Global Macro Absolute Return Fund
April 30, 2024
Notes to Financial Statements (Unaudited)
1 Significant Accounting Policies
Eaton Vance Global Macro Absolute Return Fund (the Fund) is a non-diversified series of Eaton Vance Mutual Funds Trust (the Trust). The Trust is a Massachusetts business trust registered under the Investment Company Act of 1940, as amended (the 1940 Act), as an open-end management investment company. The Fund offers five classes of shares. Class A shares are generally sold subject to a sales charge imposed at time of purchase. Class C shares are sold at net asset value and are generally subject to a contingent deferred sales charge (see Note 5). Effective November 5, 2020, Class C shares automatically convert to Class A shares eight years after their purchase as described in the Fund’s prospectus. Class I, Class R and Class R6 shares are sold at net asset value and are not subject to a sales charge. Each class represents a pro rata interest in the Fund, but votes separately on class-specific matters and (as noted below) is subject to different expenses. Realized and unrealized gains and losses and net investment income and losses, other than class-specific expenses, are allocated daily to each class of shares based on the relative net assets of each class to the total net assets of the Fund. Sub-accounting, recordkeeping and similar administrative fees payable to financial intermediaries, which are a component of transfer and dividend disbursing agent fees on the Statement of Operations, are not allocated to Class R6 shares. Each class of shares differs in its distribution plan and certain other class-specific expenses. The Fund invests its assets in interests in Global Macro Portfolio (the Portfolio), a Massachusetts business trust, having the same investment objective and policies as the Fund. The value of the Fund’s investment in the Portfolio reflects the Fund’s proportionate interest in the net assets of the Portfolio (approximately 100% at April 30, 2024). The performance of the Fund is directly affected by the performance of the Portfolio. The consolidated financial statements of the Portfolio, including the consolidated portfolio of investments, are included elsewhere in this report and should be read in conjunction with the Fund’s financial statements.
The following is a summary of significant accounting policies of the Fund. The policies are in conformity with accounting principles generally accepted in the United States of America (U.S. GAAP). The Fund is an investment company and follows accounting and reporting guidance in the Financial Accounting Standards Board (FASB) Accounting Standards Codification Topic 946.
A Investment Valuation—Valuation of securities by the Portfolio is discussed in Note 1A of the Portfolio's Notes to Consolidated Financial Statements, which are included elsewhere in this report.
B Income—The Fund's net investment income or loss consists of the Fund's pro rata share of the net investment income or loss of the Portfolio, less all actual and accrued expenses of the Fund.
C Federal and Other Taxes—The Fund’s policy is to comply with the provisions of the Internal Revenue Code applicable to regulated investment companies and to distribute to shareholders each year substantially all of its net investment income, and all or substantially all of its net realized capital gains. Accordingly, no provision for federal income or excise tax is necessary.
In addition to the requirements of the Internal Revenue Code, the Fund may also be required to recognize its pro rata share of the capital gains taxes incurred by the Portfolio. In doing so, the daily net asset value would reflect the Fund’s pro rata share of the estimated reserve for such taxes incurred by the Portfolio.
As of April 30, 2024, the Fund had no uncertain tax positions that would require financial statement recognition, de-recognition, or disclosure. The Fund files a U.S. federal income tax return annually after its fiscal year-end, which is subject to examination by the Internal Revenue Service for a period of three years from the date of filing.
D Expenses—The majority of expenses of the Trust are directly identifiable to an individual fund. Expenses which are not readily identifiable to a specific fund are allocated taking into consideration, among other things, the nature and type of expense and the relative size of the funds.
E Use of Estimates—The preparation of the financial statements in conformity with U.S. GAAP requires management to make estimates and assumptions that affect the reported amounts of assets and liabilities at the date of the financial statements and the reported amounts of income and expense during the reporting period. Actual results could differ from those estimates.
F Indemnifications—Under the Trust’s organizational documents, its officers and Trustees may be indemnified against certain liabilities and expenses arising out of the performance of their duties to the Fund. Under Massachusetts law, if certain conditions prevail, shareholders of a Massachusetts business trust (such as the Trust) could be deemed to have personal liability for the obligations of the Trust. However, the Trust’s Declaration of Trust contains an express disclaimer of liability on the part of Fund shareholders and the By-laws provide that the Trust shall assume, upon request by the shareholder, the defense on behalf of any Fund shareholders. Moreover, the By-laws also provide for indemnification out of Fund property of any shareholder held personally liable solely by reason of being or having been a shareholder for all loss or expense arising from such liability. Additionally, in the normal course of business, the Fund enters into agreements with service providers that may contain indemnification clauses. The Fund's maximum exposure under these arrangements is unknown as this would involve future claims that may be made against the Fund that have not yet occurred.
G Other—Investment transactions are accounted for on a trade date basis.
H Interim Financial Statements—The interim financial statements relating to April 30, 2024 and for the six months then ended have not been audited by an independent registered public accounting firm, but in the opinion of the Fund’s management, reflect all adjustments, consisting only of normal recurring adjustments, necessary for the fair presentation of the financial statements.
Eaton Vance
Global Macro Absolute Return Fund
April 30, 2024
Notes to Financial Statements (Unaudited) — continued
2 Distributions to Shareholders and Income Tax Information
The Fund expects to pay any required income distributions monthly and intends to distribute annually all or substantially all of its net realized capital gains. The Fund may include in its distributions amounts attributable to the imputed interest on foreign currency exposures and certain other derivative positions which, in certain circumstances, may result in a return of capital for federal income tax purposes. Distributions to shareholders are recorded on the ex-dividend date. Distributions are declared separately for each class of shares. Shareholders may reinvest income and capital gain distributions in additional shares of the same class of the Fund at the net asset value as of the ex-dividend date or, at the election of the shareholder, receive distributions in cash. Distributions to shareholders are determined in accordance with income tax regulations, which may differ from U.S. GAAP. As required by U.S. GAAP, only distributions in excess of tax basis earnings and profits are reported in the financial statements as a return of capital. Permanent differences between book and tax accounting relating to distributions are reclassified to paid-in capital. For tax purposes, distributions from short-term capital gains are considered to be from ordinary income. For the six months ended April 30, 2024, management estimates that a portion of distributions for the period will be a tax return of capital. The final determination of tax characteristics of the Fund’s distributions will occur at the end of the year and will be reported to the shareholders.
At October 31, 2023, the Fund, for federal income tax purposes, had deferred capital losses of $401,170,448 which would reduce its taxable income arising from future net realized gains on investment transactions, if any, to the extent permitted by the Internal Revenue Code, and thus would reduce the amount of distributions to shareholders, which would otherwise be necessary to relieve the Fund of any liability for federal income or excise tax. The deferred capital losses are treated as arising on the first day of the Fund’s next taxable year and retain the same short-term or long-term character as when originally deferred. Of the deferred capital losses at October 31, 2023, $27,231,590 are short-term and $373,938,858 are long-term.
3 Investment Adviser Fee and Other Transactions with Affiliates
The investment adviser fee is earned by Eaton Vance Management (EVM), an indirect, wholly-owned subsidiary of Morgan Stanley, as compensation for investment advisory services rendered to the Fund. The investment adviser fee is computed at an annual rate as a percentage of the Fund’s average daily net assets that are not invested in other investment companies for which EVM or its affiliates serve as investment adviser or administrator as follows and is payable monthly:
| Average Daily Net Assets | Annual Fee Rate |
| Up to $500 million | 0.615% |
| $500 million but less than $1 billion | 0.595% |
| $1 billion but less than $1.5 billion | 0.575% |
| $1.5 billion but less than $2 billion | 0.555% |
| $2 billion but less than $3 billion | 0.520% |
| $3 billion but less than $5 billion | 0.490% |
| $5 billion but less than $10 billion | 0.475% |
| $10 billion and over | 0.465% |
For the six months ended April 30, 2024, the Fund incurred no investment adviser fee on such assets. Pursuant to an investment sub-advisory agreement, EVM has delegated a portion of the investment management of the Fund to Eaton Vance Advisers International Ltd. (EVAIL), an affiliate of EVM and an indirect, wholly-owned subsidiary of Morgan Stanley. EVM pays EVAIL a portion of its investment adviser fee for sub-advisory services provided to the Fund. To the extent the Fund’s assets are invested in the Portfolio, the Fund is allocated its share of the Portfolio’s investment adviser fee. The Portfolio has engaged Boston Management and Research (BMR) to render investment advisory services. See Note 2 of the Portfolio’s Notes to Consolidated Financial Statements which are included elsewhere in this report. EVM also serves as the administrator of the Fund, but receives no compensation.
EVM provides sub-transfer agency and related services to the Fund pursuant to a Sub-Transfer Agency Support Services Agreement. For the six months ended April 30, 2024, EVM earned $29,180 from the Fund pursuant to such agreement, which is included in transfer and dividend disbursing agent fees on the Statement of Operations. The Fund was informed that Eaton Vance Distributors, Inc. (EVD), an affiliate of EVM and the Fund's principal underwriter, received $2,452 as its portion of the sales charge on sales of Class A shares for the six months ended April 30, 2024. EVD also received distribution and service fees from Class A, Class C and Class R shares (see Note 4) and contingent deferred sales charges (see Note 5).
Trustees and officers of the Fund who are members of EVM’s or BMR's organizations receive remuneration for their services to the Fund out of the investment adviser fee. Certain officers and Trustees of the Fund and the Portfolio are officers of the above organizations.
Eaton Vance
Global Macro Absolute Return Fund
April 30, 2024
Notes to Financial Statements (Unaudited) — continued
4 Distribution Plans
The Fund has in effect a distribution plan for Class A shares (Class A Plan) pursuant to Rule 12b-1 under the 1940 Act. Pursuant to the Class A Plan, the Fund pays EVD a distribution and service fee of 0.25% per annum of its average daily net assets attributable to Class A shares for distribution services and facilities provided to the Fund by EVD, as well as for personal services and/or the maintenance of shareholder accounts. Distribution and service fees paid or accrued to EVD for the six months ended April 30, 2024 amounted to $187,010 for Class A shares.
The Fund also has in effect distribution plans for Class C shares (Class C Plan) and Class R shares (Class R Plan) pursuant to Rule 12b-1 under the 1940 Act. Pursuant to the Class C Plan, the Fund pays EVD amounts equal to 0.75% per annum of its average daily net assets attributable to Class C shares for providing ongoing distribution services and facilities to the Fund. For the six months ended April 30, 2024, the Fund paid or accrued to EVD $73,240 for Class C shares. The Class R Plan requires the Fund to pay EVD an amount up to 0.50% per annum of its average daily net assets attributable to Class R shares for providing ongoing distribution services and facilities to the Fund. The Trustees of the Trust have currently limited Class R distribution payments to 0.25% per annum of the average daily net assets attributable to Class R shares. For the six months ended April 30, 2024, the Fund paid or accrued to EVD $1,480 for Class R shares.
Pursuant to the Class C and Class R Plans, the Fund also makes payments of service fees to EVD, financial intermediaries and other persons in amounts equal to 0.25% per annum of its average daily net assets attributable to that class. Service fees paid or accrued are for personal services and/or the maintenance of shareholder accounts. They are separate and distinct from the sales commissions and distribution fees payable to EVD. Service fees paid or accrued for the six months ended April 30, 2024 amounted to $24,413 and $1,480 for Class C and Class R shares, respectively.
Distribution and service fees are subject to the limitations contained in the Financial Industry Regulatory Authority Rule 2341(d).
5 Contingent Deferred Sales Charges
A contingent deferred sales charge (CDSC) of 1% generally is imposed on redemptions of Class C shares made within 12 months of purchase. Class A shares may be subject to a 0.75% CDSC if redeemed within 12 months of purchase (depending on the circumstances of purchase). Generally, the CDSC is based upon the lower of the net asset value at date of redemption or date of purchase. No charge is levied on shares acquired by reinvestment of dividends or capital gain distributions. For the six months ended April 30, 2024, the Fund was informed that EVD received $708 of CDSCs paid by Class C shareholders and no CDSCs paid by Class A shareholders.
6 Investment Transactions
For the six months ended April 30, 2024, increases and decreases in the Fund's investment in the Portfolio aggregated $70,467,869 and $272,098,566, respectively.
7 Shares of Beneficial Interest
The Fund’s Declaration of Trust permits the Trustees to issue an unlimited number of full and fractional shares of beneficial interest (without par value). Such shares may be issued in a number of different series (such as the Fund) and classes. Transactions in Fund shares, including direct exchanges
pursuant to share class conversions, were as follows:
| | Six Months Ended
April 30, 2024
(Unaudited) | | Year Ended
October 31, 2023 |
| | Shares | Amount | | Shares | Amount |
| Class A | | | | | |
| Sales | 1,574,347 | $ 13,010,702 | | 2,582,682 | $ 21,176,228 |
| Issued to shareholders electing to receive payments of distributions in Fund shares | 463,779 | 3,845,729 | | 961,393 | 7,894,152 |
| Redemptions | (2,181,285) | (18,055,093) | | (5,962,136) | (48,844,712) |
| Net decrease | (143,159) | $ (1,198,662) | | (2,418,061) | $ (19,774,332) |
Eaton Vance
Global Macro Absolute Return Fund
April 30, 2024
Notes to Financial Statements (Unaudited) — continued
| | Six Months Ended
April 30, 2024
(Unaudited) | | Year Ended
October 31, 2023 |
| | Shares | Amount | | Shares | Amount |
| Class C | | | | | |
| Sales | 73,364 | $ 609,548 | | 251,217 | $ 2,070,905 |
| Issued to shareholders electing to receive payments of distributions in Fund shares | 52,883 | 440,270 | | 137,435 | 1,132,928 |
| Redemptions | (514,073) | (4,274,545) | | (1,166,680) | (9,633,665) |
| Net decrease | (387,826) | $ (3,224,727) | | (778,028) | $ (6,429,832) |
| Class I | | | | | |
| Sales | 25,226,525 | $ 208,700,433 | | 56,538,440 | $ 462,831,949 |
| Issued to shareholders electing to receive payments of distributions in Fund shares | 3,618,826 | 29,950,212 | | 8,312,329 | 68,104,954 |
| Redemptions | (43,014,302) | (353,414,627) | | (71,703,485) | (585,710,278) |
| Net decrease | (14,168,951) | $(114,763,982) | | (6,852,716) | $ (54,773,375) |
| Class R | | | | | |
| Sales | 42,300 | $ 355,352 | | 55,567 | $ 454,739 |
| Issued to shareholders electing to receive payments of distributions in Fund shares | 3,854 | 32,040 | | 8,421 | 69,287 |
| Redemptions | (13,372) | (111,476) | | (80,439) | (658,381) |
| Net increase (decrease) | 32,782 | $ 275,916 | | (16,451) | $ (134,355) |
| Class R6 | | | | | |
| Sales | 1,365,174 | $ 11,305,050 | | 4,150,302 | $ 34,107,676 |
| Issued to shareholders electing to receive payments of distributions in Fund shares | 108,465 | 895,830 | | 297,034 | 2,432,730 |
| Redemptions | (6,527,525) | (53,471,676) | | (8,387,320) | (68,506,401) |
| Net decrease | (5,053,886) | $ (41,270,796) | | (3,939,984) | $ (31,965,995) |
Global Macro Portfolio
April 30, 2024
Consolidated Portfolio of Investments (Unaudited)
| Collateralized Mortgage Obligations — 3.7% |
| Security | Principal
Amount
(000's omitted) | Value |
| Federal Home Loan Mortgage Corp.: | | | |
| Series 1817, Class Z, 6.50%, 2/15/26 | $ | 2 | $ 2,286 |
| Series 1927, Class ZA, 6.50%, 1/15/27 | | 18 | 17,984 |
| Series 2344, Class ZD, 6.50%, 8/15/31 | | 135 | 135,310 |
| Series 2458, Class ZB, 7.00%, 6/15/32 | | 290 | 297,501 |
Interest Only:(1)
Series 4791, Class JI, 4.00%, 5/15/48 | | 3,854 | 854,324 |
| Federal National Mortgage Association: | | | |
| Series G94-7, Class PJ, 7.50%, 5/17/24 | | 0 (2) | 6 |
| Series 1994-89, Class ZQ, 8.00%, 7/25/24 | | 2 | 2,477 |
| Series 1996-35, Class Z, 7.00%, 7/25/26 | | 5 | 4,679 |
| Series 1998-16, Class H, 7.00%, 4/18/28 | | 53 | 53,246 |
| Series 1998-44, Class ZA, 6.50%, 7/20/28 | | 80 | 80,935 |
| Series 1999-25, Class Z, 6.00%, 6/25/29 | | 86 | 85,222 |
| Series 2000-2, Class ZE, 7.50%, 2/25/30 | | 16 | 16,901 |
| Series 2000-49, Class A, 8.00%, 3/18/27 | | 19 | 19,261 |
| Series 2001-31, Class ZA, 6.00%, 7/25/31 | | 671 | 663,269 |
| Series 2001-74, Class QE, 6.00%, 12/25/31 | | 215 | 215,865 |
| Series 2009-48, Class WA, 5.798%, 7/25/39(3) | | 974 | 973,319 |
| Series 2011-38, Class SA, 0.00%, (13.157% - 30-day SOFR Average x 3, Floor 0.00%), 5/25/41(4) | | 648 | 413,461 |
| Series 2023-54, Class C, 6.50%, 11/25/53 | | 2,610 | 2,659,765 |
| Interest Only:(1) | | | |
| Series 424, Class C8, 3.50%, 2/25/48 | | 4,901 | 884,489 |
| Series 2018-21, Class IO, 3.00%, 4/25/48 | | 4,338 | 755,421 |
| Series 2018-58, Class BI, 4.00%, 8/25/48 | | 677 | 141,908 |
| Government National Mortgage Association: | | | |
| Series 2023-148, Class HL, 6.50%, 10/20/53 | | 2,610 | 2,648,554 |
| Sereis 2023-151, Class GL, 6.50%, 10/20/53 | | 1,890 | 1,918,072 |
| Series 2023-155, Class CH, 6.50%, 10/20/53 | | 7,140 | 7,249,622 |
| Series 2023-165, Class EY, 6.50%, 11/20/53 | | 13,070 | 13,277,580 |
| Series 2023-169, Class JW, 6.50%, 11/20/53 | | 1,400 | 1,423,847 |
| Series 2024-1, Class GL, 6.00%, 1/20/54 | | 1,384 | 1,359,026 |
| Series 2024-3, Class CY, 6.00%, 1/20/54 | | 544 | 534,210 |
| Series 2024-6, Class CB, 6.00%, 1/20/54 | | 2,427 | 2,382,806 |
| Series 2024-6, Class LB, 6.00%, 1/20/54 | | 462 | 453,484 |
| Series 2024-25, Class GL, 6.00%, 2/20/54 | | 792 | 774,844 |
| PNMAC GMSR Issuer Trust, 2024 Participation, 11.068%, (30-day SOFR Average + 5.75%), 12/24/24(5) | | 2,105 | 2,121,803 |
| Unison Trust, Series 2021-1, Class A, 4.50%, 4/25/50(3)(6) | | 21,847 | 19,505,689 |
Total Collateralized Mortgage Obligations
(identified cost $77,219,842) | | | $ 61,927,166 |
| Security | Shares | Value |
| Bulgaria — 0.2% |
| Eurohold Bulgaria AD(7) | | 5,122,901 | $ 3,668,358 |
| | | | $ 3,668,358 |
| Cyprus — 0.5% |
| Bank of Cyprus Holdings PLC | | 1,975,000 | $ 7,886,116 |
| Galaxy Cosmos Mezz PLC | | 23,855 | 19,966 |
| Sunrisemezz PLC | | 134,028 | 48,848 |
| | | | $ 7,954,930 |
| Georgia — 0.5% |
| Bank of Georgia Group PLC | | 41,717 | $ 2,793,331 |
| Georgia Capital PLC(7) | | 176,100 | 2,991,967 |
| TBC Bank Group PLC | | 66,105 | 2,852,039 |
| | | | $ 8,637,337 |
| Greece — 1.4% |
| Alpha Services and Holdings SA(7) | | 740,700 | $ 1,250,759 |
| Athens International Airport SA(7) | | 13,728 | 121,746 |
| Cenergy Holdings SA | | 75,300 | 635,677 |
| Eurobank Ergasias Services and Holdings SA, Class A(7) | | 1,206,500 | 2,581,001 |
| Hellenic Telecommunications Organization SA | | 127,496 | 1,936,874 |
| Ideal Holdings SA | | 15,100 | 100,587 |
| JUMBO SA | | 79,363 | 2,469,983 |
| Motor Oil (Hellas) Corinth Refineries SA | | 41,500 | 1,204,081 |
| Mytilineos SA | | 56,975 | 2,311,482 |
| National Bank of Greece SA(7) | | 316,244 | 2,545,043 |
| OPAP SA | | 92,863 | 1,544,924 |
| Optima bank SA(7) | | 68,150 | 773,248 |
| Piraeus Financial Holdings SA(7) | | 1,256,190 | 5,032,237 |
| Public Power Corp. SA(7) | | 65,900 | 786,611 |
| Titan Cement International SA | | 3,416 | 108,128 |
| | | | $ 23,402,381 |
| Iceland — 0.2% |
| Arion Banki Hf.(6) | | 1,015,472 | $ 1,031,210 |
| Eik fasteignafelag Hf. | | 3,253,209 | 224,321 |
| Eimskipafelag Islands Hf. | | 220,734 | 509,456 |
| Hagar Hf. | | 921,987 | 488,459 |
| Islandsbanki Hf. | | 668,258 | 491,866 |
| Reginn Hf.(7) | | 1,291,872 | 205,781 |
19
See Notes to Consolidated Financial Statements.
Global Macro Portfolio
April 30, 2024
Consolidated Portfolio of Investments (Unaudited) — continued
| Security | Shares | Value |
| Iceland (continued) |
| Reitir fasteignafelag Hf. | | 875,641 | $ 467,634 |
| Siminn Hf. | | 1,879,514 | 133,211 |
| | | | $ 3,551,938 |
| Poland — 1.2% |
| Alior Bank SA(7) | | 19,839 | $ 505,404 |
| Allegro.eu SA(6)(7) | | 124,596 | 1,038,646 |
| AmRest Holdings SE(7) | | 17,192 | 111,397 |
| Asseco Poland SA | | 12,187 | 239,511 |
| Bank Millennium SA(7) | | 134,948 | 307,261 |
| Bank Polska Kasa Opieki SA | | 42,212 | 1,747,589 |
| Budimex SA | | 3,057 | 517,132 |
| CCC SA(7) | | 11,431 | 264,969 |
| CD Projekt SA | | 15,056 | 438,014 |
| Cyfrowy Polsat SA(7) | | 59,278 | 146,086 |
| Dino Polska SA(6)(7) | | 11,292 | 1,081,802 |
| Enea SA(7) | | 61,023 | 127,307 |
| Eurocash SA | | 18,615 | 62,582 |
| Grupa Azoty SA(7) | | 10,261 | 55,423 |
| Grupa Kety SA | | 2,286 | 473,693 |
| Jastrzebska Spolka Weglowa SA(7) | | 12,190 | 91,771 |
| KGHM Polska Miedz SA | | 30,908 | 1,062,606 |
| KRUK SA | | 3,667 | 416,831 |
| LPP SA | | 247 | 951,738 |
| mBank SA(7) | | 3,357 | 563,770 |
| Orange Polska SA | | 142,356 | 275,180 |
| ORLEN SA | | 124,840 | 2,035,439 |
| Pepco Group NV(7)(8) | | 37,199 | 175,384 |
| PGE Polska Grupa Energetyczna SA(7) | | 211,837 | 315,742 |
| Powszechna Kasa Oszczednosci Bank Polski SA | | 196,461 | 2,916,881 |
| Powszechny Zaklad Ubezpieczen SA | | 145,584 | 1,832,304 |
| Santander Bank Polska SA | | 8,023 | 1,099,415 |
| Tauron Polska Energia SA(7) | | 236,747 | 169,918 |
| Text SA | | 3,961 | 87,706 |
| Warsaw Stock Exchange | | 6,256 | 69,286 |
| XTB SA(6) | | 11,631 | 181,769 |
| | | | $ 19,362,556 |
| United Kingdom — 0.0%(9) |
| Tesnik Cuatro Ltd.(10) | | 409,000 | $ 257,179 |
| | | | $ 257,179 |
| Vietnam — 0.6% |
| Bank for Foreign Trade of Vietnam JSC(7) | | 99,972 | $ 359,158 |
| Coteccons Construction JSC(7) | | 12,000 | 31,258 |
| Duc Giang Chemicals JSC | | 62,000 | 289,369 |
| Security | Shares | Value |
| Vietnam (continued) |
| FPT Corp. | | 662,286 | $ 3,443,014 |
| FPT Digital Retail JSC | | 21,900 | 138,707 |
| Gemadept Corp. | | 50,200 | 166,149 |
| Hoa Phat Group JSC(7) | | 475,478 | 532,314 |
| KIDO Group Corp. | | 10,295 | 25,344 |
| Military Commercial Joint Stock Bank | | 914,921 | 856,361 |
| Mobile World Investment Corp. | | 1,082,498 | 2,334,945 |
| Phu Nhuan Jewelry JSC | | 348,840 | 1,344,702 |
| Refrigeration Electrical Engineering Corp. | | 287,788 | 747,261 |
| Vietnam Dairy Products JSC | | 90,281 | 231,218 |
| Vingroup JSC(7) | | 78,738 | 137,707 |
| | | | $ 10,637,507 |
Total Common Stocks
(identified cost $61,152,191) | | | $ 77,472,186 |
| Security | Principal
Amount
(000's omitted) | Value |
| China — 0.0%(9) |
| Sunac China Holdings Ltd., 1.00%, 9/30/32(8)(11) | USD | 592 | $ 32,560 |
| | | | $ 32,560 |
| India — 0.2% |
| Indiabulls Housing Finance Ltd., 4.50%, 9/28/26(8) | USD | 2,970 | $ 2,911,669 |
| | | | $ 2,911,669 |
Total Convertible Bonds
(identified cost $3,494,141) | | | $ 2,944,229 |
| Foreign Corporate Bonds — 2.9% |
| Security | Principal
Amount
(000's omitted) | Value |
| Brazil — 0.0%(9) |
| Coruripe Netherlands BV: | | | |
| 10.00%, 2/10/27(6) | USD | 270 | $ 241,455 |
| 10.00%, 2/10/27(8) | USD | 624 | 558,030 |
| | | | $ 799,485 |
| China — 0.1% |
| KWG Group Holdings Ltd., 7.875%, 8/30/24(12) | USD | 1,571 | $ 78,550 |
| Shimao Group Holdings Ltd., 5.60%, 7/15/26(8)(12) | USD | 5,100 | 178,500 |
20
See Notes to Consolidated Financial Statements.
Global Macro Portfolio
April 30, 2024
Consolidated Portfolio of Investments (Unaudited) — continued
| Security | Principal
Amount
(000's omitted) | Value |
| China (continued) |
| Sunac China Holdings Ltd.: | | | |
| 6.00%, (5.00% cash or 6.00% PIK), 9/30/26(8)(11) | USD | 491 | $ 51,537 |
| 6.25%, (5.25% cash or 6.25% PIK), 9/30/27(8)(11) | USD | 491 | 47,997 |
| 6.50%, (5.50% cash or 6.50% PIK), 9/30/27(8)(11) | USD | 984 | 78,723 |
| 6.75%, (5.75% cash or 6.75% PIK), 9/30/28(8)(11) | USD | 1,478 | 110,203 |
| 7.00%, (6.00% cash or 7.00% PIK), 9/30/29(8)(11) | USD | 1,480 | 98,026 |
| 7.25%, (6.25% cash or 7.25% PIK), 9/30/30(8)(11) | USD | 696 | 38,274 |
| Times China Holdings Ltd.: | | | |
| 5.55%, 6/4/24(8)(12) | USD | 3,999 | 103,574 |
| 6.75%, 7/16/23(8)(12) | USD | 2,966 | 66,735 |
| | | | $ 852,119 |
| Georgia — 0.6% |
| Bank of Georgia JSC: | | | |
| 9.50% to 7/16/29(6)(13)(14) | USD | 200 | $ 198,566 |
| 9.50% to 7/16/29(8)(13)(14) | USD | 6,263 | 6,218,094 |
| TBC Bank JSC, 10.25% to 7/30/29(8)(13)(14) | USD | 3,320 | 3,317,277 |
| | | | $ 9,733,937 |
| Hungary — 0.1% |
| MBH Bank Nyrt, 8.625% to 10/19/26, 10/19/27(8)(14) | EUR | 1,243 | $ 1,400,239 |
| | | | $ 1,400,239 |
| Iceland — 0.0% |
| Wow Air Hf.: | | | |
| 0.00% (10)(12)(13) | EUR | 79 | $ 0 |
| 0.00%, (3 mo. EURIBOR + 9.00%)(10)(12)(13) | EUR | 3,600 | 0 |
| | | | $ 0 |
| India — 0.0%(9) |
| Reliance Communications Ltd., 6.50%, 11/6/20(8)(12) | USD | 1,800 | $ 58,500 |
| Vedanta Resources Finance II PLC, 13.875%, 1/21/27(8) | USD | 696 | 652,957 |
| | | | $ 711,457 |
| Kazakhstan — 0.5% |
| Development Bank of Kazakhstan JSC, 13.00%, 4/15/27(6) | KZT | 3,466,500 | $ 7,752,457 |
| | | | $ 7,752,457 |
| Mexico — 0.1% |
| Alpha Holding SA de CV: | | | |
| 9.00%, 2/10/25(8)(12) | USD | 3,667 | $ 55,008 |
| 10.00%, 12/19/22(8)(12) | USD | 1,741 | 26,117 |
| Security | Principal
Amount
(000's omitted) | Value |
| Mexico (continued) |
| Grupo Kaltex SA de CV, 14.50%, (13.00% cash and 1.50% PIK), 9/30/25(6) | USD | 1,124 | $ 927,300 |
| | | | $ 1,008,425 |
| Moldova — 0.1% |
| Aragvi Finance International DAC, 8.45%, 4/29/26(8) | USD | 1,493 | $ 1,223,663 |
| | | | $ 1,223,663 |
| Paraguay — 0.2% |
| Itau BBA International PLC, 9.03%, 2/19/30 | PYG | 27,417,630 | $ 3,961,930 |
| | | | $ 3,961,930 |
| Saint Lucia — 0.0%(9) |
| Digicel Intermediate Holdings Ltd./Digicel International Finance Ltd./DIFL U.S., 10.50%, (9.00% cash and 1.50% PIK), 5/25/27 | USD | 0 (2) | $ 365 |
| | | | $ 365 |
| Supranational — 0.2% |
| European Bank for Reconstruction & Development: | | | |
| 17.20%, 4/9/26(8) | USD | 2,600 | $ 2,600,205 |
| 17.35%, 3/1/27(8) | USD | 1,000 | 984,114 |
| | | | $ 3,584,319 |
| United Arab Emirates — 0.6% |
| Abu Dhabi Developmental Holding Co. PJSC, 5.50%, 5/8/34(6) | USD | 10,870 | $ 10,816,411 |
| | | | $ 10,816,411 |
| Uzbekistan — 0.3% |
| International Finance Corp., 16.00%, 2/21/25 | UZS | 16,000,000 | $ 1,254,632 |
| Ipoteka-Bank ATIB, 20.50%, 4/25/27(8) | UZS | 42,080,000 | 3,336,989 |
| | | | $ 4,591,621 |
| Venezuela — 0.1% |
| Petroleos de Venezuela SA: | | | |
| 5.375%, 4/12/27(8)(12) | USD | 2,416 | $ 302,017 |
| 6.00%, 5/16/24(8)(12) | USD | 1,180 | 147,500 |
| 6.00%, 11/15/26(8)(12) | USD | 1,180 | 147,795 |
| 8.50%, 10/27/20(8)(12) | USD | 825 | 650,589 |
| 9.00%, 11/17/21(8)(12) | USD | 1,180 | 157,926 |
| 9.75%, 5/17/35(8)(12) | USD | 1,180 | 179,360 |
21
See Notes to Consolidated Financial Statements.
Global Macro Portfolio
April 30, 2024
Consolidated Portfolio of Investments (Unaudited) — continued
| Security | Principal
Amount
(000's omitted) | Value |
| Venezuela (continued) |
| Petroleos de Venezuela SA: (continued) | | | |
| 12.75%, 2/17/22(8)(12) | USD | 1,190 | $ 183,874 |
| | | | $ 1,769,061 |
Total Foreign Corporate Bonds
(identified cost $69,667,112) | | | $ 48,205,489 |
| Loan Participation Notes — 1.4% |
| Security | Principal
Amount
(000's omitted) | Value |
| Uzbekistan — 1.4% |
| Daryo Finance BV (borrower - Uzbek Industrial and Construction Bank ATB), 18.75%, 6/15/25(8)(10)(15) | UZS | 151,973,440 | $ 12,946,661 |
| Europe Asia Investment Finance BV (borrower - Joint Stock Commercial Bank “Asaka”), 18.70%, 7/21/26(8)(10)(15) | UZS | 125,249,130 | 10,277,014 |
Total Loan Participation Notes
(identified cost $25,156,596) | | | $ 23,223,675 |
| Reinsurance Side Cars — 1.2% |
| Security | Shares | Value |
| Eden Re II Ltd.: | | | |
| Series 2021A, 0.00%, 3/21/25(6)(10)(16)(17) | | 160,708 | $ 46,123 |
| Series 2022A, 0.00%, 3/20/26(6)(10)(16)(17) | | 115,487 | 66,705 |
| Series 2022B, 0.00%, 3/20/26(6)(10)(16)(17) | | 236,592 | 134,361 |
| Series 2023B, 0.00%, 3/19/27(6)(10)(16)(17) | | 28,000 | 33,208 |
| Series 2024A, 0.00%, 3/17/28(6)(10)(16)(17) | | 3,000,000 | 3,096,300 |
| Series 2024B, 0.00%, 3/17/28(6)(10)(16)(17) | | 2,700,000 | 2,793,960 |
| Mt. Logan Re Ltd., Series A-1(7)(10)(17)(18) | | 4,400 | 6,044,892 |
| PartnerRe ILS Fund SAC Ltd.(10)(17)(18) | | 5,700,000 | 5,897,220 |
| Sussex Capital Ltd.: | | | |
| Designated Investment Series 16, 12/21(7)(10)(17)(18) | | 817 | 17,651 |
| Designated Investment Series 16, 11/22(7)(10)(17)(18) | | 793 | 224,316 |
| Series 16, Preference Shares(10)(17)(18) | | 1,075 | 1,367,535 |
Total Reinsurance Side Cars
(identified cost $18,706,147) | | | $ 19,722,271 |
| Senior Floating-Rate Loans — 0.0%(9)(19) |
| Borrower/Description | Principal
Amount
(000's omitted) | Value |
| Argentina — 0.0%(9) |
| Desa LLC, Term Loan, 2.50%, 6/30/24(10)(20) | $ | 298 | $ 285,519 |
Total Senior Floating-Rate Loans
(identified cost $295,382) | | | $ 285,519 |
| Sovereign Government Bonds — 48.8% |
| Security | Principal
Amount
(000's omitted) | Value |
| Albania — 1.5% |
| Albania Government International Bonds: | | | |
| 3.50%, 6/16/27(8) | EUR | 209 | $ 216,548 |
| 3.50%, 11/23/31(8) | EUR | 3,050 | 2,933,762 |
| 5.90%, 6/9/28(8) | EUR | 17,872 | 19,663,318 |
| Albanian Government Bonds, 5.25%, 1/26/29 | ALL | 200,700 | 2,159,779 |
| | | | $ 24,973,407 |
| Angola — 0.9% |
| Angola Government International Bonds: | | | |
| 8.75%, 4/14/32(8) | USD | 5,068 | $ 4,598,399 |
| 9.125%, 11/26/49(8) | USD | 5,467 | 4,562,594 |
| 9.375%, 5/8/48(8) | USD | 6,225 | 5,309,116 |
| | | | $ 14,470,109 |
| Argentina — 0.2% |
| Bonos Para La Reconstruccion De Una Argentina Libre: | | | |
| 0.00%, 6/30/25 | USD | 1,668 | $ 1,540,090 |
| 3.00%, 5/31/26 | USD | 1,638 | 1,289,972 |
| | | | $ 2,830,062 |
| Armenia — 1.1% |
| Republic of Armenia Treasury Bonds: | | | |
| 9.00%, 4/29/26 | AMD | 254,810 | $ 650,814 |
| 9.25%, 4/29/28 | AMD | 1,791,660 | 4,560,408 |
| 9.60%, 10/29/33 | AMD | 3,725,215 | 9,609,615 |
| 9.75%, 10/29/50 | AMD | 618,877 | 1,611,589 |
| 9.75%, 10/29/52 | AMD | 673,150 | 1,750,273 |
| | | | $ 18,182,699 |
22
See Notes to Consolidated Financial Statements.
Global Macro Portfolio
April 30, 2024
Consolidated Portfolio of Investments (Unaudited) — continued
| Security | Principal
Amount
(000's omitted) | Value |
| Bahamas — 0.2% |
| Bahamas Government International Bonds: | | | |
| 6.00%, 11/21/28(8) | USD | 2,350 | $ 2,101,749 |
| 8.95%, 10/15/32(8) | USD | 2,000 | 1,929,450 |
| | | | $ 4,031,199 |
| Barbados — 0.5% |
| Barbados Government International Bonds, 6.50%, 10/1/29(8) | USD | 9,176 | $ 8,689,956 |
| | | | $ 8,689,956 |
| Benin — 1.4% |
| Benin Government International Bonds: | | | |
| 4.875%, 1/19/32(8) | EUR | 8,006 | $ 7,260,911 |
| 4.95%, 1/22/35(8) | EUR | 3,809 | 3,293,761 |
| 6.875%, 1/19/52(8) | EUR | 13,654 | 11,891,629 |
| 7.96%, 2/13/38(8) | USD | 1,471 | 1,390,610 |
| | | | $ 23,836,911 |
| Cameroon — 0.2% |
| Republic of Cameroon International Bonds, 5.95%, 7/7/32(8) | EUR | 4,763 | $ 3,994,002 |
| | | | $ 3,994,002 |
| China — 0.7% |
| China Government Bonds: | | | |
| 2.67%, 11/25/33 | CNY | 43,500 | $ 6,164,748 |
| 3.00%, 10/15/53 | CNY | 38,000 | 5,751,532 |
| | | | $ 11,916,280 |
| Colombia — 0.6% |
| Titulos De Tesoreria B: | | | |
| 6.25%, 7/9/36 | COP | 13,978,800 | $ 2,481,092 |
| 9.25%, 5/28/42 | COP | 35,459,000 | 7,735,431 |
| | | | $ 10,216,523 |
| Czech Republic — 4.0% |
| Czech Republic Government Bonds: | | | |
| 2.00%, 10/13/33 | CZK | 514,000 | $ 18,008,930 |
| 4.50%, 11/11/32 | CZK | 146,610 | 6,307,492 |
| 4.90%, 4/14/34 | CZK | 976,070 | 43,317,941 |
| | | | $ 67,634,363 |
| Security | Principal
Amount
(000's omitted) | Value |
| Dominican Republic — 2.5% |
| Dominican Republic Bonds: | | | |
| 8.00%, 1/15/27(8) | DOP | 96,000 | $ 1,530,399 |
| 8.00%, 2/12/27(8) | DOP | 490,340 | 7,821,934 |
| 11.25%, 9/15/35(6) | DOP | 106,250 | 1,919,054 |
| 12.00%, 8/8/25(6) | DOP | 332,200 | 5,781,925 |
| 12.75%, 9/23/29(6) | DOP | 368,500 | 7,139,878 |
| 13.00%, 6/10/34(8) | DOP | 232,600 | 4,761,323 |
| 13.625%, 2/3/33(6) | DOP | 206,150 | 4,211,008 |
| Dominican Republic Central Bank Notes: | | | |
| 8.00%, 3/12/27(8) | DOP | 31,580 | 508,363 |
| 12.00%, 10/3/25(6) | DOP | 138,420 | 2,414,359 |
| 13.00%, 12/5/25(6) | DOP | 216,700 | 3,808,352 |
| 13.00%, 1/30/26(6) | DOP | 161,230 | 2,844,409 |
| | | | $ 42,741,004 |
| Ecuador — 1.1% |
| Ecuador Government International Bonds: | | | |
| 0.00%, 7/31/30(8) | USD | 17,777 | $ 9,729,754 |
| 2.50% to 7/31/24, 7/31/40(8)(21) | USD | 1,130 | 471,215 |
| 2.50% to 7/31/24, 7/31/40(8)(21) | USD | 1,709 | 712,523 |
| 2.50% to 7/31/24, 7/31/40(8)(21) | USD | 1,814 | 932,496 |
| 3.50% to 7/31/24, 7/31/35(8)(21) | USD | 8,002 | 4,414,834 |
| 6.00% to 7/31/24, 7/31/30(8)(21) | USD | 3,410 | 2,406,736 |
| | | | $ 18,667,558 |
| El Salvador — 0.5% |
| El Salvador Government International Bonds: | | | |
| 6.375%, 1/18/27(8) | USD | 1,782 | $ 1,586,453 |
| 7.625%, 2/1/41(8) | USD | 2,863 | 1,979,587 |
| 7.65%, 6/15/35(8) | USD | 196 | 142,046 |
| 8.25%, 4/10/32(8) | USD | 5,998 | 4,826,687 |
| | | | $ 8,534,773 |
| Ethiopia — 1.0% |
| Ethiopia International Bonds, 6.625%, 12/11/24(8)(12) | USD | 22,833 | $ 16,171,701 |
| | | | $ 16,171,701 |
| Ghana — 1.2% |
| Ghana Government International Bonds: | | | |
| 6.375%, 2/11/27(8)(12) | USD | 2,752 | $ 1,332,447 |
| 7.625%, 5/16/29(8)(12) | USD | 6,228 | 3,034,282 |
| 7.75%, 4/7/29(8)(12) | USD | 4,066 | 1,983,639 |
| 7.875%, 3/26/27(8)(12) | USD | 1,156 | 564,973 |
| 7.875%, 2/11/35(8)(12) | USD | 2,491 | 1,214,362 |
23
See Notes to Consolidated Financial Statements.
Global Macro Portfolio
April 30, 2024
Consolidated Portfolio of Investments (Unaudited) — continued
| Security | Principal
Amount
(000's omitted) | Value |
| Ghana (continued) |
| Ghana Government International Bonds: (continued) | | | |
| 8.125%, 1/18/26(8)(12) | USD | 1,474 | $ 740,649 |
| 8.125%, 3/26/32(8)(12) | USD | 4,775 | 2,326,690 |
| 8.625%, 4/7/34(8)(12) | USD | 4,553 | 2,226,417 |
| 8.627%, 6/16/49(8)(12) | USD | 3,315 | 1,577,128 |
| 8.75%, 3/11/61(8)(12) | USD | 4,701 | 2,287,624 |
| 8.875%, 5/7/42(8)(12) | USD | 2,354 | 1,142,891 |
| 8.95%, 3/26/51(8)(12) | USD | 2,574 | 1,250,647 |
| | | | $ 19,681,749 |
| Greece — 0.0%(9) |
| Hellenic Republic Government Bonds, 0.00%, GDP-Linked, 10/15/42 | EUR | 185,016 | $ 552,857 |
| | | | $ 552,857 |
| Hungary — 3.4% |
| Hungary Government Bonds: | | | |
| 3.00%, 4/25/41 | HUF | 1,484,250 | $ 2,452,128 |
| 4.00%, 4/28/51 | HUF | 1,143,090 | 2,004,818 |
| 4.75%, 11/24/32 | HUF | 22,760,050 | 52,787,541 |
| | | | $ 57,244,487 |
| Iceland — 2.4% |
| Republic of Iceland: | | | |
| 6.50%, 1/24/31 | ISK | 4,578,073 | $ 31,217,763 |
| 7.00%, 9/17/35 | ISK | 732,032 | 5,227,681 |
| 8.00%, 6/12/25 | ISK | 600,760 | 4,231,195 |
| | | | $ 40,676,639 |
| India — 0.6% |
| Export-Import Bank of India, 3.25%, 1/15/30(8) | USD | 10,500 | $ 9,242,449 |
| | | | $ 9,242,449 |
| Indonesia — 2.8% |
| Indonesia Treasury Bonds: | | | |
| 6.125%, 5/15/28 | IDR | 550,220,000 | $ 32,588,766 |
| 6.625%, 2/15/34 | IDR | 204,241,000 | 12,035,899 |
| 7.125%, 6/15/42 | IDR | 26,112,000 | 1,588,331 |
| 7.125%, 6/15/43 | IDR | 14,081,000 | 863,293 |
| 7.375%, 5/15/48 | IDR | 9,373,000 | 590,021 |
| | | | $ 47,666,310 |
| Security | Principal
Amount
(000's omitted) | Value |
| Ivory Coast — 1.2% |
| Ivory Coast Government International Bonds: | | | |
| 6.625%, 3/22/48(8) | EUR | 15,634 | $ 13,087,578 |
| 6.875%, 10/17/40(8) | EUR | 2,000 | 1,792,491 |
| 8.25%, 1/30/37(8) | USD | 4,746 | 4,549,041 |
| | | | $ 19,429,110 |
| Jordan — 0.1% |
| Jordan Government International Bonds, 7.50%, 1/13/29(8) | USD | 1,159 | $ 1,144,611 |
| | | | $ 1,144,611 |
| Kenya — 2.3% |
| Republic of Kenya Government International Bonds, 9.75%, 2/16/31(8) | USD | 16,430 | $ 16,491,612 |
| Republic of Kenya Infrastructure Bonds: | | | |
| 17.933%, 5/6/30 | KES | 15,600 | 119,312 |
| 18.461%, 8/9/32 | KES | 2,940,950 | 22,699,298 |
| | | | $ 39,310,222 |
| Montenegro — 0.4% |
| Montenegro Government International Bonds: | | | |
| 2.875%, 12/16/27(8) | EUR | 1,264 | $ 1,234,911 |
| 7.25%, 3/12/31(8) | USD | 5,839 | 5,847,724 |
| | | | $ 7,082,635 |
| Nigeria — 0.1% |
| Nigeria Government International Bonds, 8.25%, 9/28/51(8) | USD | 1,294 | $ 1,018,300 |
| | | | $ 1,018,300 |
| North Macedonia — 1.5% |
| North Macedonia Government International Bonds: | | | |
| 1.625%, 3/10/28(8) | EUR | 10,491 | $ 9,803,341 |
| 2.75%, 1/18/25(8) | EUR | 2,570 | 2,696,406 |
| 3.675%, 6/3/26(8) | EUR | 2,647 | 2,753,476 |
| 6.96%, 3/13/27(8) | EUR | 8,303 | 9,280,681 |
| | | | $ 24,533,904 |
| Panama — 1.1% |
| Panama Government International Bonds: | | | |
| 2.252%, 9/29/32 | USD | 5,498 | $ 3,815,896 |
| 3.16%, 1/23/30 | USD | 10,193 | 8,328,443 |
| 7.50%, 3/1/31 | USD | 6,978 | 7,074,304 |
| | | | $ 19,218,643 |
24
See Notes to Consolidated Financial Statements.
Global Macro Portfolio
April 30, 2024
Consolidated Portfolio of Investments (Unaudited) — continued
| Security | Principal
Amount
(000's omitted) | Value |
| Paraguay — 0.5% |
| Paraguay Government Bonds, 7.90%, 2/9/31(6) | PYG | 60,295,000 | $ 8,328,183 |
| | | | $ 8,328,183 |
| Peru — 2.9% |
| Peru Government Bonds: | | | |
| 5.40%, 8/12/34 | PEN | 30,420 | $ 6,988,532 |
| 5.94%, 2/12/29 | PEN | 88,317 | 23,380,725 |
| 6.15%, 8/12/32 | PEN | 31,156 | 7,818,984 |
| 6.35%, 8/12/28 | PEN | 10,491 | 2,840,088 |
| 6.95%, 8/12/31 | PEN | 3,691 | 989,212 |
| 7.30%, 8/12/33(6)(8) | PEN | 26,106 | 6,989,242 |
| | | | $ 49,006,783 |
| Philippines — 1.0% |
| Philippines Government International Bonds, 6.25%, 1/14/36 | PHP | 1,024,000 | $ 16,669,544 |
| | | | $ 16,669,544 |
| Serbia — 4.0% |
| Serbia International Bonds: | | | |
| 1.50%, 6/26/29(8) | EUR | 9,604 | $ 8,602,880 |
| 1.65%, 3/3/33(8) | EUR | 368 | 290,907 |
| Serbia Treasury Bonds: | | | |
| 4.50%, 8/20/32 | RSD | 1,539,040 | 12,817,304 |
| 5.875%, 2/8/28 | RSD | 2,181,570 | 20,515,533 |
| 7.00%, 10/26/31 | RSD | 2,632,630 | 25,658,124 |
| | | | $ 67,884,748 |
| South Korea — 1.3% |
| Korea Treasury Bonds, 1.875%, 12/10/24 | KRW | 31,500,000 | $ 22,571,376 |
| | | | $ 22,571,376 |
| Sri Lanka — 1.1% |
| Sri Lanka Government International Bonds: | | | |
| 5.75%, 4/18/23(8)(12) | USD | 5,207 | $ 2,973,390 |
| 6.20%, 5/11/27(8)(12) | USD | 814 | 464,116 |
| 6.35%, 6/28/24(8)(12) | USD | 2,900 | 1,646,151 |
| 6.75%, 4/18/28(8)(12) | USD | 400 | 228,142 |
| 6.825%, 7/18/26(8)(12) | USD | 16,330 | 9,353,618 |
| 6.85%, 3/14/24(8)(12) | USD | 1,711 | 977,044 |
| 6.85%, 11/3/25(8)(12) | USD | 5,900 | 3,381,932 |
| | | | $ 19,024,393 |
| Security | Principal
Amount
(000's omitted) | Value |
| Suriname — 1.4% |
| Suriname Government International Bonds: | | | |
| 0.00%, Oil-Linked, 12/31/50(6) | USD | 11,871 | $ 8,944,798 |
| 7.95%, (4.95% cash and 3.00% PIK), 7/15/33(6)(11) | USD | 15,492 | 14,384,432 |
| | | | $ 23,329,230 |
| Tajikistan — 0.0%(9) |
| Republic of Tajikistan International Bonds, 7.125%, 9/14/27(8) | USD | 426 | $ 394,050 |
| | | | $ 394,050 |
| Tunisia — 0.4% |
| Tunisian Republic: | | | |
| 3.50%, 2/3/33 | JPY | 300,000 | $ 1,134,599 |
| 4.20%, 3/17/31 | JPY | 30,000 | 117,268 |
| 5.75%, 1/30/25(8) | USD | 1,984 | 1,871,309 |
| 6.375%, 7/15/26(8) | EUR | 3,752 | 3,363,779 |
| | | | $ 6,486,955 |
| Ukraine — 0.3% |
| Ukraine Government Bonds: | | | |
| 15.84%, 2/26/25 | UAH | 25,942 | $ 518,121 |
| 19.19%, 9/30/26 | UAH | 49,039 | 961,829 |
| Ukraine Government International Bonds: | | | |
| 4.375%, 1/27/32(8)(12) | EUR | 242 | 63,326 |
| 6.876%, 5/21/31(8)(12) | USD | 200 | 50,625 |
| 7.253%, 3/15/35(8)(12) | USD | 6,651 | 1,664,958 |
| 7.375%, 9/25/34(8)(12) | USD | 800 | 201,000 |
| 7.75%, 9/1/25(8)(12) | USD | 100 | 31,851 |
| 7.75%, 9/1/26(8)(12) | USD | 225 | 66,242 |
| 7.75%, 9/1/29(8)(12) | USD | 1,248 | 356,067 |
| 9.75%, 11/1/30(8)(12) | USD | 4,091 | 1,260,641 |
| | | | $ 5,174,660 |
| Uruguay — 1.0% |
| Uruguay Government Bonds: | | | |
| 3.875%, 7/2/40(22) | UYU | 234,246 | $ 6,605,432 |
| 9.75%, 7/20/33 | UYU | 357,889 | 9,735,588 |
| | | | $ 16,341,020 |
| Uzbekistan — 0.6% |
| Republic of Uzbekistan Bonds: | | | |
| 14.00%, 7/19/24(8) | UZS | 2,500,000 | $ 196,443 |
25
See Notes to Consolidated Financial Statements.
Global Macro Portfolio
April 30, 2024
Consolidated Portfolio of Investments (Unaudited) — continued
| Security | Principal
Amount
(000's omitted) | Value |
| Uzbekistan (continued) |
| Republic of Uzbekistan Bonds: (continued) | | | |
| 16.25%, 10/12/26(8) | UZS | 112,430,000 | $ 8,953,498 |
| | | | $ 9,149,941 |
| Venezuela — 0.3% |
| Venezuela Government International Bonds: | | | |
| 6.00%, 12/9/20(8)(12) | USD | 1,499 | $ 243,651 |
| 7.00%, 3/31/38(8)(12) | USD | 1,498 | 257,865 |
| 7.65%, 4/21/25(8)(12) | USD | 3,491 | 638,034 |
| 7.75%, 10/13/19(8)(12) | USD | 400 | 68,967 |
| 8.25%, 10/13/24(8)(12) | USD | 4,156 | 765,626 |
| 9.00%, 5/7/23(8)(12) | USD | 1,213 | 239,252 |
| 9.25%, 9/15/27(12) | USD | 4,453 | 956,504 |
| 9.25%, 5/7/28(8)(12) | USD | 3,502 | 694,048 |
| 9.375%, 1/13/34(12) | USD | 496 | 102,923 |
| 11.75%, 10/21/26(8)(12) | USD | 636 | 138,169 |
| 11.95%, 8/5/31(8)(12) | USD | 1,097 | 237,812 |
| 12.75%, 8/23/22(8)(12) | USD | 468 | 100,662 |
| | | | $ 4,443,513 |
| Zambia — 0.5% |
| Zambia Government International Bonds: | | | |
| 5.375%, 9/20/22(8)(12) | USD | 2,443 | $ 1,617,681 |
| 8.50%, 4/14/24(8)(12) | USD | 6,733 | 4,961,986 |
| 8.97%, 7/30/27(8)(12) | USD | 2,528 | 1,858,737 |
| | | | $ 8,438,404 |
Total Sovereign Government Bonds
(identified cost $820,099,326) | | | $820,935,263 |
| Borrower/Description | Principal
Amount
(000's omitted) | Value |
| Ivory Coast — 0.2% |
| Republic of Ivory Coast, Term Loan, 9.623%, (6 mo. EURIBOR + 5.75%), 1/6/28(5) | EUR | 2,132 | $ 2,536,941 |
| | | | $ 2,536,941 |
| Kenya — 0.1% |
| Government of Kenya, Term Loan, 12.062%, (6 mo. SOFR + 6.45%), 6/29/25(5) | USD | 2,304 | $ 2,316,688 |
| | | | $ 2,316,688 |
| Borrower/Description | Principal
Amount
(000's omitted) | Value |
| Tanzania — 2.9% |
| Government of the United Republic of Tanzania, Term Loan, 12.022%, (6 mo. SOFR + 6.30%), 4/28/31(5) | USD | 48,386 | $ 49,477,344 |
| | | | $ 49,477,344 |
Total Sovereign Loans
(identified cost $53,187,506) | | | $ 54,330,973 |
| U.S. Government Agency Mortgage-Backed Securities — 0.3% |
| Security | Principal
Amount
(000's omitted) | Value |
| Federal Home Loan Mortgage Corp.: | | | |
| 4.401%, (COF + 1.254%), with maturity at 2029(23) | $ | 5 | $ 4,443 |
| 4.462%, (COF + 1.254%), with maturity at 2035(23) | | 154 | 150,765 |
| 4.50%, with maturity at 2035 | | 91 | 87,026 |
| 4.745%, (COF + 1.251%), with maturity at 2030(23) | | 89 | 86,985 |
| 6.297%, (1 yr. CMT + 2.308%), with maturity at 2036(23) | | 414 | 417,734 |
| 6.60%, with maturity at 2030 | | 253 | 257,222 |
| 7.00%, with various maturities to 2035 | | 513 | 518,309 |
| 7.50%, with various maturities to 2035 | | 922 | 954,218 |
| 8.00%, with various maturities to 2030 | | 123 | 122,627 |
| 8.50%, with maturity at 2025 | | 1 | 698 |
| 9.00%, with maturity at 2027 | | 2 | 1,960 |
| 9.50%, with maturity at 2027 | | 2 | 1,820 |
| Federal National Mortgage Association: | | | |
| 4.414%, (COF + 1.254%), with maturity at 2034(23) | | 77 | 73,970 |
| 4.424%, (COF + 1.298%), with maturity at 2033(23) | | 313 | 303,797 |
| 4.437%, (COF + 1.254%), with maturity at 2035(23) | | 118 | 116,257 |
| 4.514%, (COF + 1.35%), with maturity at 2027(23) | | 17 | 17,007 |
| 4.56%, (COF + 1.40%), with maturity at 2025(23) | | 19 | 18,544 |
| 4.76%, (COF + 1.60%), with maturity at 2024(23) | | 3 | 3,488 |
| 5.224%, (COF + 1.791%), with maturity at 2035(23) | | 661 | 646,683 |
| 6.00%, with maturity at 2033 | | 38 | 38,782 |
| 6.35%, (COF + 2.004%), with maturity at 2032(23) | | 139 | 142,033 |
| 6.375%, (1 yr. CMT + 2.15%), with maturity at 2028(23) | | 18 | 18,444 |
| 6.50%, with maturity at 2030 | | 367 | 367,279 |
| 7.00%, with various maturities to 2031 | | 392 | 395,227 |
26
See Notes to Consolidated Financial Statements.
Global Macro Portfolio
April 30, 2024
Consolidated Portfolio of Investments (Unaudited) — continued
| Security | Principal
Amount
(000's omitted) | Value |
| Federal National Mortgage Association: (continued) | | | |
| 7.50%, with various maturities to 2027 | $ | 2 | $ 1,572 |
| 8.00%, with maturity at 2026 | | 0 (2) | 81 |
| 8.50%, with various maturities to 2037 | | 551 | 574,922 |
| 9.00%, with various maturities to 2032 | | 28 | 28,642 |
| 9.50%, with various maturities to 2031 | | 2 | 2,090 |
| 11.50%, with maturity at 2031 | | 54 | 58,051 |
| Government National Mortgage Association: | | | |
| 4.00%, (1 yr. CMT + 1.50%), with maturity at 2024(23) | | 5 | 5,344 |
| 6.50%, with various maturities to 2032 | | 115 | 117,438 |
| 7.00%, with various maturities to 2031 | | 164 | 168,869 |
| 7.50%, with maturity at 2028 | | 11 | 11,495 |
| 9.00%, with maturity at 2025 | | 0 (2) | 314 |
Total U.S. Government Agency Mortgage-Backed Securities
(identified cost $6,148,712) | | | $ 5,714,136 |
| U.S. Government Guaranteed Small Business Administration Loans — 0.2% |
| Security | Principal
Amount
(000's omitted) | Value |
SBA IO Trust:
Interest Only:(24)(25)
Series 2018-2, Class A, 2.573%, 7/25/44(3)(6) | $ | 72,842 | $ 3,887,563 |
Total U.S. Government Guaranteed Small Business Administration Loans
(identified cost $15,417,046) | | | $ 3,887,563 |
| U.S. Treasury Obligations — 0.7% |
| Security | Principal
Amount
(000's omitted) | Value |
| U.S. Treasury Inflation-Protected Bonds, 0.625%, 7/15/32(26) | $ | 12,605 | $ 11,112,578 |
Total U.S. Treasury Obligations
(identified cost $12,021,843) | | | $ 11,112,578 |
| Security | Shares | Value |
| Financial Intermediaries — 0.0% |
| Alpha Holding SA, Escrow Certificates(7)(10) | | 3,698,000 | $ 0 |
| Alpha Holding SA, Escrow Certificates(7)(10) | | 7,780,000 | 0 |
Total Miscellaneous
(identified cost $0) | | | $ 0 |
| Short-Term Investments — 27.6% |
| Security | Shares | Value |
| Morgan Stanley Institutional Liquidity Funds - Government Portfolio, Institutional Class, 5.22%(27) | | 152,463,740 | $ 152,463,740 |
Total Affiliated Fund
(identified cost $152,463,740) | | | $152,463,740 |
| Repurchase Agreements — 2.0% |
| Description | Principal
Amount
(000's omitted) | Value |
| Barclays Bank PLC: | | | |
| Dated 12/5/23 with an interest rate of 4.00%, collateralized by USD 200,000 Bolivian Government International Bonds, 4.50%, due 3/30/28 and a market value, including accrued interest, of $201,025(28) | USD | 97 | $ 97,250 |
| Dated 1/3/24 with an interest rate of 2.60%, collateralized by EUR 2,000,000 Republic of Poland Government International Bonds, 2.75%, due 5/25/32 and a market value, including accrued interest, of $2,075,027(28) | EUR | 2,058 | 2,195,765 |
| Dated 1/3/24 with an interest rate of 2.75%, collateralized by EUR 1,200,000 Republic of Poland Government International Bonds, 1.00%, due 3/7/29 and a market value, including accrued interest, of $1,163,407(28) | EUR | 1,167 | 1,245,423 |
| Dated 1/3/24 with an interest rate of 3.10%, collateralized by EUR 4,000,000 Republic of Poland Government International Bonds, 1.00%, due 3/7/29 and a market value, including accrued interest, of $3,878,023(28) | EUR | 3,890 | 4,151,410 |
| Dated 1/19/24 with an interest rate of 4.95%, collateralized by USD 1,351,000 Republic of Armenia International Bonds, 3.60%, due 2/2/31 and a market value, including accrued interest, of $1,085,261(28) | USD | 1,162 | 1,161,860 |
| JPMorgan Chase Bank, N.A.: | | | |
| Dated 1/8/24 with an interest rate of 10.70%, collateralized by MXN 324,000,000 Mexican Bonos, 8.00%, due 7/31/53 and a market value, including accrued interest, of $15,574,583(28) | MXN | 292,101 | 17,051,296 |
27
See Notes to Consolidated Financial Statements.
Global Macro Portfolio
April 30, 2024
Consolidated Portfolio of Investments (Unaudited) — continued
| Description | Principal
Amount
(000's omitted) | Value |
| Nomura International PLC: | | | |
| Dated 12/19/23 with an interest rate of 3.40%, collateralized by EUR 1,956,000 Republic of Poland Government International Bonds, 1.00%, due 3/7/29 and a market value, including accrued interest, of $1,896,353(28) | USD | 2,082 | $ 2,081,776 |
| Dated 12/19/23 with an interest rate of 4.75%, collateralized by USD 1,621,000 Republic of Armenia International Bonds, 3.60%, due 2/2/31 and a market value, including accrued interest, of $1,302,153(28) | USD | 1,403 | 1,402,949 |
| Dated 12/22/23 with an interest rate of 4.85%, collateralized by USD 5,107,000 Republic of Azerbaijan International Bonds, 3.50%, due 9/1/32 and a market value, including accrued interest, of $4,258,111(28) | USD | 4,692 | 4,692,056 |
Total Repurchase Agreements
(identified cost $34,563,026) | | | $ 34,079,785 |
| Sovereign Government Securities — 8.9% |
| Security | Principal
Amount
(000's omitted) | Value |
| Egypt — 7.8% |
| Egypt Treasury Bills: | | | |
| 0.00%, 9/24/24 | EGP | 2,822,000 | $ 53,653,572 |
| 0.00%, 12/3/24 | EGP | 248,925 | 4,528,736 |
| 0.00%, 12/10/24 | EGP | 1,686,950 | 30,558,492 |
| 0.00%, 12/17/24 | EGP | 1,370,650 | 24,721,937 |
| 0.00%, 3/11/25 | EGP | 947,825 | 16,259,126 |
| 0.00%, 3/18/25 | EGP | 96,700 | 1,652,116 |
| | | | $131,373,979 |
| Nigeria — 1.1% |
| Nigeria OMO Bills: | | | |
| 0.00%, 6/4/24 | NGN | 2,133,879 | $ 1,538,985 |
| 0.00%, 7/9/24 | NGN | 177,078 | 125,399 |
| 0.00%, 1/28/25 | NGN | 710,322 | 445,397 |
| 0.00%, 2/25/25 | NGN | 1,185,489 | 729,957 |
| 0.00%, 4/1/25 | NGN | 1,478,606 | 902,529 |
| Nigeria Treasury Bills: | | | |
| 0.00%, 2/6/25 | NGN | 1,477,509 | 921,046 |
| 0.00%, 2/20/25 | NGN | 6,098,016 | 3,767,042 |
| 0.00%, 3/6/25 | NGN | 2,660,526 | 1,628,596 |
| 0.00%, 3/27/25 | NGN | 8,957,521 | 5,407,986 |
| Security | Principal
Amount
(000's omitted) | Value |
| Nigeria (continued) |
| Nigeria Treasury Bills: (continued) | | | |
| 0.00%, 4/10/25 | NGN | 5,755,052 | $ 3,442,460 |
| | | | $ 18,909,397 |
Total Sovereign Government Securities
(identified cost $149,852,764) | | | $150,283,376 |
| U.S. Treasury Obligations — 7.6% |
| Security | Principal
Amount
(000's omitted) | Value |
| U.S. Treasury Bills: | | | |
| 0.00%, 5/9/24(29) | $ | 45,524 | $ 45,470,620 |
| 0.00%, 5/30/24(29) | | 30,000 | 29,872,642 |
| 0.00%, 6/13/24(29) | | 20,228 | 20,100,920 |
| 0.00%, 6/20/24 | | 1,639 | 1,627,003 |
| 0.00%, 7/11/24(29) | | 30,000 | 29,689,079 |
Total U.S. Treasury Obligations
(identified cost $126,764,249) | | | $126,760,264 |
Total Short-Term Investments
(identified cost $463,643,779) | | | $463,587,165 |
| | | |
Total Purchased Options — 0.0%(9)
(identified cost $1,654,642) | | | $ 549,366 |
Total Investments — 94.8%
(identified cost $1,627,864,265) | | | $1,593,897,579 |
Total Written Options — (0.0)%(9)
(premiums received $323,828) | | | $ (64,066) |
| Securities Sold Short — (3.6)% |
| Common Stocks — (0.8)% |
| Security | Shares | Value |
| New Zealand — (0.8)% |
| a2 Milk Co. Ltd.(7) | | (219,100) | $ (863,040) |
| Air New Zealand Ltd. | | (436,600) | (141,422) |
| Auckland International Airport Ltd. | | (316,002) | (1,460,898) |
| Chorus Ltd. | | (86,192) | (365,207) |
| Contact Energy Ltd. | | (204,200) | (1,042,522) |
| EBOS Group Ltd. | | (13,109) | (270,137) |
| Fisher & Paykel Healthcare Corp. Ltd. | | (123,800) | (2,073,371) |
28
See Notes to Consolidated Financial Statements.
Global Macro Portfolio
April 30, 2024
Consolidated Portfolio of Investments (Unaudited) — continued
| Security | Shares | Value |
| New Zealand (continued) |
| Fletcher Building Ltd. | | (235,800) | $ (527,771) |
| Freightways Group Ltd. | | (17,382) | (85,950) |
| Goodman Property Trust | | (210,200) | (281,915) |
| Infratil Ltd. | | (200,700) | (1,288,643) |
| Kiwi Property Group Ltd. | | (236,899) | (112,796) |
| Mainfreight Ltd. | | (21,500) | (859,296) |
| Mercury NZ Ltd. | | (156,572) | (587,594) |
| Meridian Energy Ltd. | | (323,600) | (1,141,298) |
| Precinct Properties New Zealand Ltd. | | (369,107) | (254,041) |
| Ryman Healthcare Ltd.(7) | | (139,400) | (332,739) |
| SKYCITY Entertainment Group Ltd. | | (133,500) | (139,906) |
| Spark New Zealand Ltd. | | (502,600) | (1,412,383) |
Total Common Stocks
(proceeds $13,980,370) | | | $(13,240,929) |
| Exchange-Traded Funds — (1.0)% |
| United States — (1.0)% |
| iShares JPMorgan USD Emerging Markets Bond ETF | | (186,398) | $ (16,244,586) |
Total Exchange-Traded Funds
(proceeds $16,683,060) | | | $(16,244,586) |
| Sovereign Government Bonds — (1.8)% |
| Security | Principal
Amount
(000's omitted) | Value |
| Armenia — (0.1)% |
| Republic of Armenia International Bonds, 3.60%, 2/2/31(8) | USD | (2,972) | $ (2,360,963) |
| | | | $ (2,360,963) |
| Azerbaijan — (0.3)% |
| Republic of Azerbaijan International Bonds, 3.50%, 9/1/32(8) | USD | (5,107) | $ (4,228,320) |
| | | | $ (4,228,320) |
| Mexico — (0.9)% |
| Mexican Bonos, 8.00%, 7/31/53 | MXN | (324,000) | $ (15,347,622) |
| | | | $(15,347,622) |
| Poland — (0.5)% |
| Republic of Poland Government International Bonds: | | | |
| 1.00%, 3/7/29(8) | EUR | (7,156) | $ (6,926,275) |
| Security | Principal
Amount
(000's omitted) | Value |
| Poland (continued) |
Republic of Poland Government International Bonds:
(continued) | | | |
| 2.75%, 5/25/32(8) | EUR | (2,000) | $ (2,020,029) |
| | | | $ (8,946,304) |
Total Sovereign Government Bonds
(proceeds $30,943,824) | | | $(30,883,209) |
Total Securities Sold Short
(proceeds $61,607,254) | | | $(60,368,724) |
| | | |
| Other Assets, Less Liabilities — 8.8% | | | $ 147,932,679 |
| Net Assets — 100.0% | | | $1,681,397,468 |
| The percentage shown for each investment category in the Consolidated Portfolio of Investments is based on net assets. |
| (1) | Interest only security that entitles the holder to receive only interest payments on the underlying mortgages. Principal amount shown is the notional amount of the underlying mortgages on which coupon interest is calculated. |
| (2) | Principal amount is less than $500. |
| (3) | Weighted average fixed-rate coupon that changes/updates monthly. Rate shown is the rate at April 30, 2024. |
| (4) | Inverse floating-rate security whose coupon varies inversely with changes in the interest rate index. The stated interest rate represents the coupon rate in effect at April 30, 2024. |
| (5) | Variable rate security. The stated interest rate represents the rate in effect at April 30, 2024. |
| (6) | Security exempt from registration under Rule 144A of the Securities Act of 1933, as amended. These securities may be sold in certain transactions in reliance on an exemption from registration (normally to qualified institutional buyers). At April 30, 2024, the aggregate value of these securities is $119,599,165 or 7.1% of the Portfolio's net assets. |
| (7) | Non-income producing security. |
| (8) | Security exempt from registration under Regulation S of the Securities Act of 1933, as amended, which exempts from registration securities offered and sold outside the United States. Security may not be offered or sold in the United States except pursuant to an exemption from, or in a transaction not subject to, the registration requirements of the Securities Act of 1933, as amended. At April 30, 2024, the aggregate value of these securities is $333,441,451 or 19.8% of the Portfolio's net assets. |
| (9) | Amount is less than 0.05% or (0.05)%, as applicable. |
| (10) | For fair value measurement disclosure purposes, security is categorized as Level 3 (see Note 10). |
| (11) | Represents a payment-in-kind security which may pay interest in additional principal at the issuer’s discretion. |
29
See Notes to Consolidated Financial Statements.
Global Macro Portfolio
April 30, 2024
Consolidated Portfolio of Investments (Unaudited) — continued
| (12) | Issuer is in default with respect to interest and/or principal payments or has declared bankruptcy. For a variable rate security, interest rate has been adjusted to reflect non-accrual status. |
| (13) | Perpetual security with no stated maturity date but may be subject to calls by the issuer. |
| (14) | Security converts to variable rate after the indicated fixed-rate coupon period. |
| (15) | Limited recourse note whose payments by the issuer are limited to amounts received by the issuer from the borrower pursuant to a loan agreement with the borrower. |
| (16) | Quantity held represents principal in USD. |
| (17) | Security is subject to risk of loss depending on the occurrence, frequency and severity of the loss events that are covered by underlying reinsurance contracts and that may occur during a specified risk period. |
| (18) | Restricted security (see Note 5). |
| (19) | Senior floating-rate loans (Senior Loans) often require prepayments from excess cash flows or permit the borrowers to repay at their election. The degree to which borrowers repay, whether as a contractual requirement or at their election, cannot be predicted with accuracy. As a result, the actual remaining maturity may be substantially less than the stated maturities shown. However, Senior Loans will typically have an expected average life of approximately two to four years. Senior Loans typically have rates of interest which are redetermined periodically by reference to a base lending rate, plus a spread. These base lending rates are primarily the Secured Overnight Financing Rate (“SOFR”) and secondarily, the prime rate offered by one or more major United States banks (the “Prime Rate”). Base lending rates may be subject to a floor, or minimum rate. Rates for SOFR are generally 1 or 3-month tenors and may also be subject to a credit spread adjustment. Senior Loans are generally subject to contractual restrictions that must be satisfied before they can be bought or sold. |
| (20) | Fixed-rate loan. |
| (21) | Step coupon security. Interest rate represents the rate in effect at April 30, 2024. |
| (22) | Inflation-linked security whose principal is adjusted for inflation based on changes in a designated inflation index or inflation rate for the applicable country. Interest is calculated based on the inflation-adjusted principal. |
| (23) | Adjustable rate mortgage security whose interest rate generally adjusts monthly based on a weighted average of interest rates on the underlying mortgages. The coupon rate may not reflect the applicable index value as interest rates on the underlying mortgages may adjust on various dates and at various intervals and may be subject to lifetime ceilings and lifetime floors and lookback periods. Rate shown is the coupon rate at April 30, 2024. |
| (24) | Interest only security that entitles the holder to receive only a portion of the interest payments on the underlying loans. Principal amount shown is the notional amount of the underlying loans on which coupon interest is calculated. |
| (25) | The stated interest rate represents the weighted average fixed interest rate at April 30, 2024 of all interest only securities comprising the trust. |
| (26) | Inflation-linked security whose principal is adjusted for inflation based on changes in the U.S. Consumer Price Index. Interest is calculated based on the inflation-adjusted principal. |
| (27) | May be deemed to be an affiliated investment company. The rate shown is the annualized seven-day yield as of April 30, 2024. |
| (28) | Open repurchase agreement with no specific maturity date. Either party may terminate the agreement upon demand. |
| (29) | Security (or a portion thereof) has been pledged to cover collateral requirements on open derivative contracts. |
| Purchased Currency Options (OTC) — 0.0%(1) |
| Description | Counterparty | Notional Amount | Exercise
Price | Expiration
Date | Value |
| Put USD vs. Call BRL | Goldman Sachs International | USD | 17,805,000 | BRL | 5.01 | 6/11/24 | $ 38,103 |
| Put USD vs. Call BRL | JPMorgan Chase Bank, N.A. | USD | 15,115,000 | BRL | 5.01 | 6/11/24 | 32,573 |
| Put USD vs. Call INR | JPMorgan Chase Bank, N.A. | USD | 15,600,000 | INR | 85.50 | 1/25/29 | 126,532 |
| Put USD vs. Call INR | JPMorgan Chase Bank, N.A. | USD | 8,400,000 | INR | 85.50 | 1/25/29 | 68,132 |
| Put USD vs. Call INR | JPMorgan Chase Bank, N.A. | USD | 8,000,000 | INR | 85.50 | 1/30/29 | 65,008 |
| Put USD vs. Call MXN | Citibank, N.A. | USD | 10,600,000 | MXN | 17.02 | 5/17/24 | 64,066 |
| Put USD vs. Call MXN | Standard Chartered Bank | USD | 16,700,000 | MXN | 16.74 | 6/20/24 | 69,505 |
| Put USD vs. Call MXN | Standard Chartered Bank | USD | 6,200,000 | MXN | 16.82 | 7/2/24 | 37,206 |
| Put USD vs. Call MXN | Standard Chartered Bank | USD | 10,600,000 | MXN | 16.71 | 7/5/24 | 48,241 |
| Total | | | | | | | $549,366 |
| (1) | Amount is less than 0.05%. |
30
See Notes to Consolidated Financial Statements.
Global Macro Portfolio
April 30, 2024
Consolidated Portfolio of Investments (Unaudited) — continued
| Written Currency Options (OTC) — (0.0)%(1) |
| Description | Counterparty | Notional Amount | Exercise
Price | Expiration
Date | Value |
| Put USD vs. Call MXN | Standard Chartered Bank | USD | 10,600,000 | MXN | 17.02 | 5/17/24 | $(64,066) |
| Total | | | | | | | $(64,066) |
| (1) | Amount is less than (0.05)%. |
| Forward Foreign Currency Exchange Contracts (Centrally Cleared) |
| Currency Purchased | Currency Sold | Settlement
Date | Value/Unrealized
Appreciation
(Depreciation) |
| USD | 2,032,093 | PHP | 116,000,000 | 5/17/24 | $ 24,384 |
| TWD | 46,920,000 | USD | 1,440,859 | 5/29/24 | (3,321) |
| COP | 11,128,430,000 | USD | 2,793,246 | 6/20/24 | 22,727 |
| COP | 2,623,000,000 | USD | 661,128 | 6/20/24 | 2,604 |
| EUR | 892,690 | USD | 968,763 | 6/20/24 | (14,187) |
| EUR | 1,359,094 | USD | 1,474,914 | 6/20/24 | (21,600) |
| EUR | 1,770,319 | USD | 1,921,182 | 6/20/24 | (28,135) |
| EUR | 1,941,857 | USD | 2,122,325 | 6/20/24 | (45,848) |
| EUR | 5,158,394 | USD | 5,597,982 | 6/20/24 | (81,982) |
| EUR | 6,107,078 | USD | 6,627,511 | 6/20/24 | (97,059) |
| EUR | 7,900,119 | USD | 8,573,351 | 6/20/24 | (125,555) |
| EUR | 22,700,000 | USD | 24,809,639 | 6/20/24 | (535,958) |
| IDR | 209,697,227,492 | USD | 13,424,918 | 6/20/24 | (546,706) |
| INR | 1,905,064,300 | USD | 22,922,203 | 6/20/24 | (142,209) |
| INR | 2,645,998,000 | USD | 31,837,300 | 6/20/24 | (197,519) |
| KRW | 7,255,800,000 | USD | 5,223,457 | 6/20/24 | 23,942 |
| KRW | 87,340,473 | USD | 66,894 | 6/20/24 | (3,730) |
| PEN | 100,000 | USD | 26,900 | 6/20/24 | (353) |
| PEN | 551,000 | USD | 147,999 | 6/20/24 | (1,720) |
| PEN | 1,229,000 | USD | 330,110 | 6/20/24 | (3,837) |
| PEN | 2,575,700 | USD | 694,989 | 6/20/24 | (11,197) |
| PEN | 2,631,700 | USD | 710,598 | 6/20/24 | (11,939) |
| PEN | 14,850,221 | USD | 3,961,010 | 6/20/24 | (18,599) |
| PEN | 6,078,000 | USD | 1,647,154 | 6/20/24 | (33,578) |
| PEN | 7,601,000 | USD | 2,058,776 | 6/20/24 | (40,875) |
| PEN | 18,527,000 | USD | 4,997,505 | 6/20/24 | (78,989) |
| PEN | 26,100,000 | USD | 7,056,299 | 6/20/24 | (127,316) |
| TWD | 82,000,000 | USD | 2,562,372 | 6/20/24 | (47,844) |
| TWD | 176,000,000 | USD | 5,474,339 | 6/20/24 | (77,304) |
| USD | 3,742,758 | COP | 14,786,700,000 | 6/20/24 | 1,085 |
| USD | 2,164,760 | COP | 8,567,579,000 | 6/20/24 | (3,207) |
| USD | 4,913,097 | COP | 19,475,271,000 | 6/20/24 | (14,987) |
| USD | 57,902,424 | EUR | 52,978,805 | 6/20/24 | 1,250,855 |
| USD | 44,361,013 | EUR | 40,588,862 | 6/20/24 | 958,322 |
31
See Notes to Consolidated Financial Statements.
Global Macro Portfolio
April 30, 2024
Consolidated Portfolio of Investments (Unaudited) — continued
| Forward Foreign Currency Exchange Contracts (Centrally Cleared) (continued) |
| Currency Purchased | Currency Sold | Settlement
Date | Value/Unrealized
Appreciation
(Depreciation) |
| USD | 29,537,236 | EUR | 27,025,595 | 6/20/24 | $ 638,087 |
| USD | 27,620,669 | EUR | 25,271,999 | 6/20/24 | 596,684 |
| USD | 24,809,639 | EUR | 22,700,000 | 6/20/24 | 535,958 |
| USD | 24,016,009 | EUR | 21,973,855 | 6/20/24 | 518,813 |
| USD | 22,908,019 | EUR | 20,960,081 | 6/20/24 | 494,878 |
| USD | 18,931,796 | EUR | 17,321,968 | 6/20/24 | 408,980 |
| USD | 17,129,643 | EUR | 15,673,057 | 6/20/24 | 370,048 |
| USD | 16,700,056 | EUR | 15,280,000 | 6/20/24 | 360,768 |
| USD | 24,437,685 | EUR | 22,518,688 | 6/20/24 | 357,886 |
| USD | 13,874,945 | EUR | 12,695,116 | 6/20/24 | 299,738 |
| USD | 12,708,122 | EUR | 11,627,512 | 6/20/24 | 274,531 |
| USD | 10,562,811 | EUR | 9,664,623 | 6/20/24 | 228,186 |
| USD | 8,634,321 | EUR | 7,900,119 | 6/20/24 | 186,526 |
| USD | 7,270,717 | EUR | 6,652,466 | 6/20/24 | 157,068 |
| USD | 6,543,039 | EUR | 5,986,664 | 6/20/24 | 141,348 |
| USD | 3,879,540 | EUR | 3,549,651 | 6/20/24 | 83,809 |
| USD | 3,326,768 | EUR | 3,043,883 | 6/20/24 | 71,868 |
| USD | 2,495,243 | EUR | 2,283,065 | 6/20/24 | 53,904 |
| USD | 1,694,050 | EUR | 1,550,000 | 6/20/24 | 36,596 |
| USD | 1,358,519 | EUR | 1,243,000 | 6/20/24 | 29,348 |
| USD | 921,106 | EUR | 842,782 | 6/20/24 | 19,899 |
| USD | 894,845 | EUR | 818,754 | 6/20/24 | 19,331 |
| USD | 675,539 | EUR | 618,096 | 6/20/24 | 14,594 |
| USD | 643,193 | EUR | 592,686 | 6/20/24 | 9,419 |
| USD | 299,720 | EUR | 274,234 | 6/20/24 | 6,475 |
| USD | 241,296 | EUR | 220,778 | 6/20/24 | 5,213 |
| USD | 345,046 | EUR | 317,951 | 6/20/24 | 5,053 |
| USD | 129,544 | EUR | 118,528 | 6/20/24 | 2,799 |
| USD | 173,304 | EUR | 159,695 | 6/20/24 | 2,538 |
| USD | 77,320 | EUR | 70,746 | 6/20/24 | 1,670 |
| USD | 66,719 | EUR | 61,480 | 6/20/24 | 977 |
| USD | 20,615 | EUR | 18,996 | 6/20/24 | 302 |
| USD | 35,997,237 | IDR | 562,276,836,823 | 6/20/24 | 1,465,923 |
| USD | 7,208,438 | IDR | 112,596,519,633 | 6/20/24 | 293,506 |
| USD | 2,407,687 | IDR | 37,605,429,840 | 6/20/24 | 98,211 |
| USD | 1,594,616 | IDR | 24,936,285,183 | 6/20/24 | 63,195 |
| USD | 194,422 | IDR | 3,036,870,225 | 6/20/24 | 7,917 |
| USD | 1,163,204 | IDR | 18,881,180,000 | 6/20/24 | 3,647 |
| USD | 5,131,291 | INR | 426,400,000 | 6/20/24 | 32,571 |
| USD | 10,960,834 | PEN | 40,383,000 | 6/20/24 | 240,025 |
| USD | 7,307,494 | PEN | 26,923,000 | 6/20/24 | 160,023 |
| USD | 7,946,100 | PEN | 29,391,219 | 6/20/24 | 143,371 |
| USD | 9,541,226 | PEN | 35,896,000 | 6/20/24 | 11,618 |
| USD | 16,212,730 | PEN | 61,251,693 | 6/20/24 | (48,264) |
32
See Notes to Consolidated Financial Statements.
Global Macro Portfolio
April 30, 2024
Consolidated Portfolio of Investments (Unaudited) — continued
| Forward Foreign Currency Exchange Contracts (Centrally Cleared) (continued) |
| Currency Purchased | Currency Sold | Settlement
Date | Value/Unrealized
Appreciation
(Depreciation) |
| USD | 14,243,202 | PEN | 53,845,000 | 6/20/24 | $ (51,476) |
| USD | 17,454,833 | PHP | 970,000,000 | 6/20/24 | 677,954 |
| USD | 3,138,473 | PHP | 179,370,000 | 6/20/24 | 36,134 |
| BRL | 4,450,258 | USD | 882,286 | 7/2/24 | (30,326) |
| BRL | 4,668,000 | USD | 925,786 | 7/2/24 | (32,142) |
| BRL | 7,003,000 | USD | 1,388,272 | 7/2/24 | (47,614) |
| BRL | 7,016,000 | USD | 1,391,015 | 7/2/24 | (47,868) |
| BRL | 7,562,742 | USD | 1,500,428 | 7/2/24 | (52,612) |
| BRL | 12,500,000 | USD | 2,481,045 | 7/2/24 | (88,038) |
| BRL | 15,318,000 | USD | 3,046,297 | 7/2/24 | (113,810) |
| | | | | | $8,623,604 |
| Forward Foreign Currency Exchange Contracts (OTC) |
| Currency Purchased | Currency Sold | Counterparty | Settlement
Date | Unrealized
Appreciation | Unrealized
(Depreciation) |
| HUF | 1,221,924,846 | EUR | 3,085,680 | BNP Paribas | 5/2/24 | $ 38,476 | $ — |
| HUF | 1,241,361,268 | EUR | 3,129,495 | UBS AG | 5/2/24 | 44,708 | — |
| CZK | 104,499,541 | EUR | 4,120,092 | Goldman Sachs International | 5/6/24 | 36,170 | — |
| CZK | 103,500,459 | EUR | 4,080,600 | HSBC Bank USA, N.A. | 5/6/24 | 35,933 | — |
| EUR | 8,259,155 | CZK | 208,000,000 | Societe Generale | 5/6/24 | — | (9,704) |
| USD | 1,222,601 | KES | 169,146,898 | Citibank, N.A. | 5/6/24 | — | (29,779) |
| EUR | 1,342,901 | USD | 1,440,856 | Barclays Bank PLC | 5/10/24 | — | (7,321) |
| USD | 18,154,592 | EUR | 16,919,261 | Australia and New Zealand Banking Group Limited | 5/10/24 | 93,424 | — |
| USD | 1,213,169 | EUR | 1,129,386 | Australia and New Zealand Banking Group Limited | 5/10/24 | 7,559 | — |
| USD | 6,035,603 | EUR | 5,668,505 | Australia and New Zealand Banking Group Limited | 5/10/24 | — | (15,478) |
| USD | 26,989,558 | EUR | 25,355,521 | Australia and New Zealand Banking Group Limited | 5/10/24 | — | (77,247) |
| USD | 28,443 | EUR | 26,241 | BNP Paribas | 5/10/24 | 432 | — |
| USD | 456,199 | EUR | 428,506 | Citibank, N.A. | 5/10/24 | — | (1,228) |
| USD | 9,508 | EUR | 8,815 | JPMorgan Chase Bank, N.A. | 5/10/24 | 98 | — |
| USD | 4,450 | EUR | 4,127 | JPMorgan Chase Bank, N.A. | 5/10/24 | 45 | — |
| USD | 2,299,350 | EUR | 2,114,511 | Standard Chartered Bank | 5/10/24 | 42,127 | — |
| USD | 4,924,993 | EUR | 4,599,353 | Standard Chartered Bank | 5/10/24 | 15,223 | — |
| USD | 1,782,082 | EUR | 1,662,925 | UBS AG | 5/10/24 | 6,924 | — |
| USD | 293,286 | EUR | 269,790 | UBS AG | 5/10/24 | 5,287 | — |
| USD | 2,966,291 | EUR | 2,780,292 | UBS AG | 5/10/24 | — | (1,647) |
| EUR | 1,126,114 | HUF | 439,963,761 | HSBC Bank USA, N.A. | 5/13/24 | 3,425 | — |
| HUF | 1,400,506,095 | EUR | 3,550,950 | HSBC Bank USA, N.A. | 5/13/24 | 25,108 | — |
| HUF | 2,622,229,210 | EUR | 6,691,921 | JPMorgan Chase Bank, N.A. | 5/13/24 | 760 | — |
33
See Notes to Consolidated Financial Statements.
Global Macro Portfolio
April 30, 2024
Consolidated Portfolio of Investments (Unaudited) — continued
| Forward Foreign Currency Exchange Contracts (OTC) (continued) |
| Currency Purchased | Currency Sold | Counterparty | Settlement
Date | Unrealized
Appreciation | Unrealized
(Depreciation) |
| HUF | 1,340,911,629 | EUR | 3,396,476 | UBS AG | 5/13/24 | $ 27,642 | $ — |
| ILS | 32,810,269 | USD | 8,747,073 | Bank of America, N.A. | 5/13/24 | 25,929 | — |
| ILS | 30,289,731 | USD | 8,081,141 | BNP Paribas | 5/13/24 | 17,905 | — |
| TRY | 98,758,776 | USD | 2,942,250 | Standard Chartered Bank | 5/13/24 | 79,341 | — |
| TRY | 87,531,067 | USD | 2,603,764 | Standard Chartered Bank | 5/13/24 | 74,308 | — |
| TRY | 88,835,201 | USD | 2,647,077 | Standard Chartered Bank | 5/13/24 | 70,895 | — |
| USD | 17,104,443 | ILS | 63,100,000 | JPMorgan Chase Bank, N.A. | 5/13/24 | 232,396 | — |
| USD | 850,970 | UZS | 10,905,186,000 | ICBC Standard Bank plc | 5/14/24 | — | (9,189) |
| UZS | 10,905,186,000 | USD | 836,159 | ICBC Standard Bank plc | 5/14/24 | 24,000 | — |
| EUR | 16,867,086 | HUF | 6,590,898,037 | BNP Paribas | 5/15/24 | 51,763 | — |
| HUF | 991,943,494 | EUR | 2,535,892 | UBS AG | 5/15/24 | — | (4,974) |
| EUR | 8,137,882 | HUF | 3,206,121,991 | JPMorgan Chase Bank, N.A. | 5/17/24 | — | (44,795) |
| HUF | 498,647,713 | EUR | 1,265,684 | JPMorgan Chase Bank, N.A. | 5/17/24 | 6,967 | — |
| USD | 10,823,396 | PHP | 617,711,000 | Standard Chartered Bank | 5/17/24 | 132,742 | — |
| USD | 3,350,521 | KRW | 4,667,830,506 | Standard Chartered Bank | 5/20/24 | — | (24,282) |
| MXN | 39,515,000 | USD | 2,323,763 | Bank of America, N.A. | 5/21/24 | — | (23,686) |
| MXN | 9,980,626 | USD | 587,714 | Goldman Sachs International | 5/21/24 | — | (6,765) |
| MXN | 10,080,932 | USD | 593,592 | Goldman Sachs International | 5/21/24 | — | (6,804) |
| MXN | 29,996,000 | USD | 1,762,627 | Goldman Sachs International | 5/21/24 | — | (16,630) |
| MXN | 36,870,000 | USD | 2,167,407 | Goldman Sachs International | 5/21/24 | — | (21,290) |
| MXN | 38,924,442 | USD | 2,290,422 | Goldman Sachs International | 5/21/24 | — | (24,720) |
| USD | 6,249,398 | MXN | 106,381,000 | Citibank, N.A. | 5/21/24 | 57,206 | — |
| USD | 3,467,725 | MXN | 58,986,000 | JPMorgan Chase Bank, N.A. | 5/21/24 | 34,286 | — |
| TRY | 83,849,784 | USD | 2,461,405 | Standard Chartered Bank | 5/22/24 | 78,990 | — |
| USD | 2,880,153 | PHP | 165,940,000 | Societe Generale | 5/23/24 | 8,401 | — |
| USD | 5,702,066 | PHP | 328,060,000 | Standard Chartered Bank | 5/23/24 | 24,872 | — |
| OMR | 6,000,000 | USD | 15,554,519 | Standard Chartered Bank | 5/28/24 | 28,262 | — |
| USD | 16,212,793 | OMR | 6,400,000 | Standard Chartered Bank | 5/28/24 | — | (408,840) |
| EUR | 15,438,869 | HUF | 6,102,521,593 | Bank of America, N.A. | 5/29/24 | — | (120,922) |
| EUR | 15,439,709 | HUF | 6,105,000,000 | BNP Paribas | 5/29/24 | — | (126,771) |
| HUF | 1,796,571,775 | EUR | 4,545,176 | Bank of America, N.A. | 5/29/24 | 35,599 | — |
| HUF | 1,796,466,089 | EUR | 4,543,311 | BNP Paribas | 5/29/24 | 37,304 | — |
| TWD | 284,880,000 | USD | 8,744,924 | Standard Chartered Bank | 5/29/24 | — | (12,719) |
| HUF | 1,283,816,645 | EUR | 3,265,795 | BNP Paribas | 6/3/24 | 4,746 | — |
| HUF | 1,179,469,469 | EUR | 2,998,905 | Citibank, N.A. | 6/3/24 | 5,909 | — |
| PLN | 33,000,000 | EUR | 7,619,118 | Barclays Bank PLC | 6/5/24 | — | (9,405) |
| CZK | 208,000,000 | EUR | 8,249,246 | Societe Generale | 6/6/24 | 10,074 | — |
| BRL | 49,666,000 | USD | 9,913,373 | Goldman Sachs International | 6/13/24 | — | (384,606) |
| EGP | 71,463,499 | USD | 1,553,554 | Citibank, N.A. | 6/13/24 | — | (75,176) |
| EGP | 71,582,501 | USD | 1,331,767 | Standard Chartered Bank | 6/13/24 | 149,072 | — |
| USD | 9,907,441 | BRL | 49,666,000 | Goldman Sachs International | 6/13/24 | 378,673 | — |
| USD | 3,727,097 | EGP | 143,046,000 | Citibank, N.A. | 6/13/24 | 767,879 | — |
| KZT | 921,592,000 | USD | 1,876,969 | JPMorgan Chase Bank, N.A. | 6/18/24 | 184,758 | — |
| USD | 1,824,935 | KZT | 921,592,000 | ICBC Standard Bank plc | 6/18/24 | — | (236,792) |
34
See Notes to Consolidated Financial Statements.
Global Macro Portfolio
April 30, 2024
Consolidated Portfolio of Investments (Unaudited) — continued
| Forward Foreign Currency Exchange Contracts (OTC) (continued) |
| Currency Purchased | Currency Sold | Counterparty | Settlement
Date | Unrealized
Appreciation | Unrealized
(Depreciation) |
| AUD | 3,880,000 | USD | 2,542,545 | BNP Paribas | 6/20/24 | $ — | $ (25,422) |
| AUD | 20,000,000 | USD | 13,273,584 | BNP Paribas | 6/20/24 | — | (298,728) |
| AUD | 24,000,000 | USD | 15,921,576 | Citibank, N.A. | 6/20/24 | — | (351,748) |
| AUD | 9,181,049 | USD | 6,047,419 | UBS AG | 6/20/24 | — | (91,280) |
| AUD | 14,000,000 | USD | 9,211,510 | UBS AG | 6/20/24 | — | (129,111) |
| CAD | 1,810,400 | USD | 1,343,338 | Bank of America, N.A. | 6/20/24 | — | (27,206) |
| CAD | 5,733,100 | USD | 4,254,026 | Bank of America, N.A. | 6/20/24 | — | (86,154) |
| CAD | 2,129,000 | USD | 1,579,397 | Goldman Sachs International | 6/20/24 | — | (31,648) |
| CAD | 6,740,000 | USD | 5,000,063 | Goldman Sachs International | 6/20/24 | — | (100,190) |
| CAD | 2,661,000 | USD | 1,974,958 | HSBC Bank USA, N.A. | 6/20/24 | — | (40,454) |
| CAD | 8,425,000 | USD | 6,252,921 | HSBC Bank USA, N.A. | 6/20/24 | — | (128,080) |
| CAD | 1,331,000 | USD | 990,081 | Standard Chartered Bank | 6/20/24 | — | (22,465) |
| CAD | 4,212,000 | USD | 3,133,148 | Standard Chartered Bank | 6/20/24 | — | (71,091) |
| CAD | 2,128,600 | USD | 1,586,290 | UBS AG | 6/20/24 | — | (38,832) |
| CAD | 6,739,900 | USD | 5,022,756 | UBS AG | 6/20/24 | — | (122,955) |
| CZK | 34,020,000 | EUR | 1,345,245 | Bank of America, N.A. | 6/20/24 | 5,209 | — |
| EUR | 712,507 | CZK | 18,100,000 | Bank of America, N.A. | 6/20/24 | — | (6,211) |
| EUR | 3,520,183 | CZK | 89,115,894 | Citibank, N.A. | 6/20/24 | — | (17,609) |
| EUR | 6,481,559 | CZK | 164,085,212 | Citibank, N.A. | 6/20/24 | — | (32,422) |
| EUR | 16,129,291 | CZK | 408,165,914 | Goldman Sachs International | 6/20/24 | — | (73,960) |
| EUR | 22,424,974 | CZK | 571,186,512 | HSBC Bank USA, N.A. | 6/20/24 | — | (259,966) |
| EUR | 617,800 | CZK | 15,742,155 | JPMorgan Chase Bank, N.A. | 6/20/24 | — | (7,424) |
| EUR | 16,777,360 | CZK | 427,503,910 | JPMorgan Chase Bank, N.A. | 6/20/24 | — | (201,614) |
| EUR | 590,650 | PLN | 2,542,647 | Citibank, N.A. | 6/20/24 | 5,102 | — |
| EUR | 609,936 | PLN | 2,624,739 | Goldman Sachs International | 6/20/24 | 5,498 | — |
| EUR | 2,561,907 | USD | 2,752,394 | JPMorgan Chase Bank, N.A. | 6/20/24 | — | (12,883) |
| EUR | 5,048,093 | USD | 5,423,129 | JPMorgan Chase Bank, N.A. | 6/20/24 | — | (25,076) |
| JPY | 848,610,000 | USD | 5,751,161 | Citibank, N.A. | 6/20/24 | — | (330,458) |
| JPY | 1,239,966,653 | USD | 8,403,446 | Citibank, N.A. | 6/20/24 | — | (482,856) |
| MXN | 17,981,000 | USD | 1,049,640 | Bank of America, N.A. | 6/20/24 | — | (7,998) |
| MXN | 907,185 | USD | 53,425 | Goldman Sachs International | 6/20/24 | — | (872) |
| MXN | 17,506,900 | USD | 1,031,000 | Goldman Sachs International | 6/20/24 | — | (16,823) |
| MXN | 24,759,000 | USD | 1,451,625 | Goldman Sachs International | 6/20/24 | — | (17,333) |
| MXN | 150,015,100 | USD | 8,834,551 | Goldman Sachs International | 6/20/24 | — | (144,156) |
| MXN | 10,052,000 | USD | 592,869 | Societe Generale | 6/20/24 | — | (10,556) |
| MXN | 764,000 | USD | 44,719 | Standard Chartered Bank | 6/20/24 | — | (460) |
| MXN | 800,000 | USD | 47,097 | Standard Chartered Bank | 6/20/24 | — | (753) |
| MXN | 14,189,100 | USD | 830,525 | Standard Chartered Bank | 6/20/24 | — | (8,548) |
| MXN | 14,200,000 | USD | 835,970 | Standard Chartered Bank | 6/20/24 | — | (13,362) |
| MXN | 121,504,900 | USD | 7,111,996 | Standard Chartered Bank | 6/20/24 | — | (73,201) |
| MXN | 121,500,000 | USD | 7,152,838 | Standard Chartered Bank | 6/20/24 | — | (114,326) |
| MXN | 1,162,000 | USD | 67,721 | State Street Bank and Trust Company | 6/20/24 | — | (406) |
| MXN | 3,356,856 | USD | 196,623 | State Street Bank and Trust Company | 6/20/24 | — | (2,160) |
| MXN | 24,290,000 | USD | 1,409,631 | State Street Bank and Trust Company | 6/20/24 | — | (2,508) |
35
See Notes to Consolidated Financial Statements.
Global Macro Portfolio
April 30, 2024
Consolidated Portfolio of Investments (Unaudited) — continued
| Forward Foreign Currency Exchange Contracts (OTC) (continued) |
| Currency Purchased | Currency Sold | Counterparty | Settlement
Date | Unrealized
Appreciation | Unrealized
(Depreciation) |
| MXN | 4,056,580 | USD | 237,598 | State Street Bank and Trust Company | 6/20/24 | $ — | $ (2,600) |
| MXN | 21,574,000 | USD | 1,257,321 | State Street Bank and Trust Company | 6/20/24 | — | (7,537) |
| MXN | 24,110,000 | USD | 1,417,791 | State Street Bank and Trust Company | 6/20/24 | — | (21,095) |
| MXN | 184,740,000 | USD | 10,766,550 | State Street Bank and Trust Company | 6/20/24 | — | (64,536) |
| NGN | 194,367,272 | USD | 228,667 | JPMorgan Chase Bank, N.A. | 6/20/24 | — | (89,186) |
| NZD | 9,884,000 | USD | 5,924,741 | BNP Paribas | 6/20/24 | — | (100,614) |
| NZD | 14,020,000 | USD | 8,378,244 | BNP Paribas | 6/20/24 | — | (116,987) |
| NZD | 22,966,441 | USD | 14,199,007 | BNP Paribas | 6/20/24 | — | (666,078) |
| NZD | 10,516,000 | USD | 6,308,097 | JPMorgan Chase Bank, N.A. | 6/20/24 | — | (111,565) |
| PLN | 33,456,936 | EUR | 7,639,268 | Barclays Bank PLC | 6/20/24 | 74,752 | — |
| SEK | 84,998,000 | EUR | 7,585,535 | UBS AG | 6/20/24 | — | (381,829) |
| SGD | 1,130,000 | USD | 841,478 | Citibank, N.A. | 6/20/24 | — | (11,805) |
| SGD | 6,000,000 | USD | 4,502,568 | Citibank, N.A. | 6/20/24 | — | (97,222) |
| SGD | 6,000,000 | USD | 4,501,574 | Goldman Sachs International | 6/20/24 | — | (96,229) |
| SGD | 6,000,000 | USD | 4,502,037 | Goldman Sachs International | 6/20/24 | — | (96,692) |
| SGD | 6,000,000 | USD | 4,503,592 | Goldman Sachs International | 6/20/24 | — | (98,246) |
| SGD | 15,620,000 | USD | 11,769,138 | Goldman Sachs International | 6/20/24 | — | (300,556) |
| TRY | 144,936,794 | USD | 4,071,279 | Standard Chartered Bank | 6/20/24 | 186,944 | — |
| TRY | 149,314,000 | USD | 4,388,784 | Standard Chartered Bank | 6/20/24 | — | (1,958) |
| TWD | 115,000,000 | USD | 3,593,307 | Standard Chartered Bank | 6/20/24 | — | (66,836) |
| TWD | 146,000,000 | USD | 4,563,078 | Standard Chartered Bank | 6/20/24 | — | (85,993) |
| USD | 6,608,091 | AUD | 10,049,000 | BNP Paribas | 6/20/24 | 88,874 | — |
| USD | 8,357,694 | AUD | 12,810,000 | HSBC Bank USA, N.A. | 6/20/24 | 47,298 | — |
| USD | 6,678,524 | AUD | 10,151,000 | Standard Chartered Bank | 6/20/24 | 93,135 | — |
| USD | 6,564,933 | CNH | 47,000,000 | BNP Paribas | 6/20/24 | 71,757 | — |
| USD | 1,396,794 | CNH | 10,000,000 | BNP Paribas | 6/20/24 | 15,267 | — |
| USD | 7,703,135 | CNH | 55,000,000 | Citibank, N.A. | 6/20/24 | 104,737 | — |
| USD | 7,245,522 | CNH | 51,730,000 | Goldman Sachs International | 6/20/24 | 98,883 | — |
| USD | 4,613,649 | CNH | 32,930,000 | Goldman Sachs International | 6/20/24 | 64,280 | — |
| USD | 6,843,595 | CNH | 49,000,000 | HSBC Bank USA, N.A. | 6/20/24 | 74,114 | — |
| USD | 1,396,652 | CNH | 10,000,000 | HSBC Bank USA, N.A. | 6/20/24 | 15,125 | — |
| USD | 11,737,794 | CNH | 84,000,000 | JPMorgan Chase Bank, N.A. | 6/20/24 | 132,968 | — |
| USD | 2,375,506 | CNH | 17,000,000 | JPMorgan Chase Bank, N.A. | 6/20/24 | 26,910 | — |
| USD | 2,507,559 | CNH | 18,211,000 | Standard Chartered Bank | 6/20/24 | — | (8,339) |
| USD | 31,228,590 | CNH | 223,470,200 | UBS AG | 6/20/24 | 355,580 | — |
| USD | 6,542,684 | CNH | 46,819,115 | UBS AG | 6/20/24 | 74,497 | — |
| USD | 4,269,146 | EUR | 4,004,127 | Australia and New Zealand Banking Group Limited | 6/20/24 | — | (12,568) |
| USD | 12,970,319 | EUR | 12,165,150 | Australia and New Zealand Banking Group Limited | 6/20/24 | — | (38,182) |
| USD | 3,769,427 | EUR | 3,528,225 | Bank of America, N.A. | 6/20/24 | — | (3,393) |
| USD | 6,940,481 | EUR | 6,496,366 | Bank of America, N.A. | 6/20/24 | — | (6,247) |
| USD | 1,066,376 | JPY | 157,348,610 | Citibank, N.A. | 6/20/24 | 61,273 | — |
| USD | 128,371 | JPY | 18,689,465 | UBS AG | 6/20/24 | 8,987 | — |
| USD | 6,234,746 | MXN | 103,700,000 | Goldman Sachs International | 6/20/24 | 227,390 | — |
36
See Notes to Consolidated Financial Statements.
Global Macro Portfolio
April 30, 2024
Consolidated Portfolio of Investments (Unaudited) — continued
| Forward Foreign Currency Exchange Contracts (OTC) (continued) |
| Currency Purchased | Currency Sold | Counterparty | Settlement
Date | Unrealized
Appreciation | Unrealized
(Depreciation) |
| USD | 5,939,996 | MXN | 100,864,107 | Goldman Sachs International | 6/20/24 | $ 96,925 | $ — |
| USD | 11,785,095 | MXN | 196,300,000 | Standard Chartered Bank | 6/20/24 | 413,408 | — |
| USD | 7,420,684 | MYR | 34,570,000 | Barclays Bank PLC | 6/20/24 | 187,997 | — |
| USD | 13,991,589 | NZD | 22,630,949 | BNP Paribas | 6/20/24 | 656,348 | — |
| USD | 1,292,143 | NZD | 2,090,000 | BNP Paribas | 6/20/24 | 60,615 | — |
| USD | 635,422 | NZD | 1,058,596 | Citibank, N.A. | 6/20/24 | 11,647 | — |
| USD | 547,025 | NZD | 911,404 | Citibank, N.A. | 6/20/24 | 9,982 | — |
| USD | 32,672,703 | NZD | 53,000,000 | HSBC Bank USA, N.A. | 6/20/24 | 1,442,560 | — |
| USD | 3,082,331 | NZD | 5,000,000 | HSBC Bank USA, N.A. | 6/20/24 | 136,091 | — |
| USD | 238,685 | NZD | 398,304 | State Street Bank and Trust Company | 6/20/24 | 3,985 | — |
| USD | 15,467,249 | THB | 545,460,000 | Standard Chartered Bank | 6/20/24 | 693,384 | — |
| USD | 4,814,900 | ZAR | 91,670,632 | Barclays Bank PLC | 6/20/24 | — | (36,856) |
| USD | 2,296,301 | ZAR | 43,693,138 | BNP Paribas | 6/20/24 | — | (16,200) |
| USD | 2,924,958 | ZAR | 54,750,946 | Goldman Sachs International | 6/20/24 | 27,212 | — |
| USD | 2,939,400 | ZAR | 55,050,197 | Goldman Sachs International | 6/20/24 | 25,816 | — |
| USD | 14,278,964 | ZAR | 269,138,472 | HSBC Bank USA, N.A. | 6/20/24 | 34,554 | — |
| USD | 2,280,167 | ZAR | 43,382,432 | HSBC Bank USA, N.A. | 6/20/24 | — | (15,889) |
| USD | 6,255,144 | ZAR | 117,748,081 | JPMorgan Chase Bank, N.A. | 6/20/24 | 23,215 | — |
| USD | 3,763,026 | ZAR | 70,956,152 | JPMorgan Chase Bank, N.A. | 6/20/24 | 7,605 | — |
| USD | 3,760,658 | ZAR | 70,956,152 | JPMorgan Chase Bank, N.A. | 6/20/24 | 5,237 | — |
| USD | 11,276,339 | ZAR | 211,923,000 | UBS AG | 6/20/24 | 60,113 | — |
| USD | 2,104,227 | ZAR | 39,546,003 | UBS AG | 6/20/24 | 11,217 | — |
| USD | 4,492,022 | ZAR | 85,332,700 | UBS AG | 6/20/24 | — | (24,292) |
| USD | 7,062,309 | ZAR | 134,991,098 | UBS AG | 6/20/24 | — | (82,223) |
| NGN | 1,020,857,426 | USD | 1,237,403 | Societe Generale | 6/21/24 | — | (505,081) |
| TRY | 48,061,285 | USD | 1,421,943 | Standard Chartered Bank | 6/21/24 | — | (11,373) |
| USD | 1,368,866 | TRY | 48,061,285 | Standard Chartered Bank | 6/21/24 | — | (41,703) |
| NGN | 530,630,105 | USD | 624,276 | Standard Chartered Bank | 6/24/24 | — | (244,032) |
| KZT | 801,667,000 | USD | 1,568,053 | Societe Generale | 6/25/24 | 222,619 | — |
| USD | 1,564,228 | KZT | 801,667,000 | ICBC Standard Bank plc | 6/25/24 | — | (226,443) |
| NGN | 546,549,008 | USD | 624,276 | Standard Chartered Bank | 6/26/24 | — | (232,905) |
| ILS | 29,920,764 | USD | 7,995,928 | Barclays Bank PLC | 7/2/24 | 22,392 | — |
| ILS | 29,676,068 | USD | 7,937,961 | Goldman Sachs International | 7/2/24 | 14,784 | — |
| USD | 4,083,904 | ILS | 15,070,872 | Bank of America, N.A. | 7/2/24 | 45,134 | — |
| USD | 8,055,393 | ILS | 29,676,068 | Barclays Bank PLC | 7/2/24 | 102,647 | — |
| USD | 4,023,862 | ILS | 14,849,892 | Goldman Sachs International | 7/2/24 | 44,311 | — |
| NGN | 515,167,294 | USD | 578,844 | Standard Chartered Bank | 7/3/24 | — | (210,868) |
| NGN | 554,934,742 | USD | 616,594 | Societe Generale | 7/8/24 | — | (220,855) |
| OMR | 3,571,000 | USD | 9,258,491 | Standard Chartered Bank | 7/8/24 | 14,911 | — |
| OMR | 208,000 | USD | 539,633 | Standard Chartered Bank | 7/8/24 | 514 | — |
| USD | 9,388,519 | OMR | 3,711,000 | BNP Paribas | 7/8/24 | — | (248,443) |
| USD | 9,916,350 | OMR | 3,912,000 | Standard Chartered Bank | 7/8/24 | — | (242,582) |
| ILS | 33,423,932 | USD | 8,953,399 | Barclays Bank PLC | 7/10/24 | 7,313 | — |
| USD | 9,116,612 | ILS | 33,423,932 | Citibank, N.A. | 7/10/24 | 155,900 | — |
37
See Notes to Consolidated Financial Statements.
Global Macro Portfolio
April 30, 2024
Consolidated Portfolio of Investments (Unaudited) — continued
| Forward Foreign Currency Exchange Contracts (OTC) (continued) |
| Currency Purchased | Currency Sold | Counterparty | Settlement
Date | Unrealized
Appreciation | Unrealized
(Depreciation) |
| PLN | 42,909,873 | EUR | 9,829,934 | Citibank, N.A. | 7/19/24 | $ 43,917 | $ — |
| PLN | 28,457,999 | EUR | 6,503,050 | UBS AG | 7/19/24 | 46,473 | — |
| UZS | 30,555,145,519 | USD | 2,304,310 | ICBC Standard Bank plc | 7/22/24 | 54,978 | — |
| USD | 8,357,531 | OMR | 3,310,000 | BNP Paribas | 7/29/24 | — | (237,711) |
| UZS | 5,093,847,982 | USD | 384,383 | ICBC Standard Bank plc | 8/26/24 | 877 | — |
| UZS | 24,188,881,000 | USD | 1,789,780 | ICBC Standard Bank plc | 8/30/24 | 54,798 | — |
| UZS | 22,609,741,000 | USD | 1,672,318 | JPMorgan Chase Bank, N.A. | 8/30/24 | 51,839 | — |
| USD | 322,732 | AMD | 128,705,675 | Citibank, N.A. | 9/6/24 | — | (4,318) |
| EGP | 14,017,368 | USD | 239,532 | Citibank, N.A. | 9/11/24 | 42,105 | — |
| USD | 330,137 | EGP | 14,017,368 | Standard Chartered Bank | 9/11/24 | 48,500 | — |
| KZT | 1,359,576,031 | USD | 2,607,049 | Citibank, N.A. | 9/16/24 | 376,347 | — |
| KZT | 870,689,175 | USD | 1,668,786 | Citibank, N.A. | 9/16/24 | 241,817 | — |
| KZT | 680,439,778 | USD | 1,303,525 | Citibank, N.A. | 9/16/24 | 189,604 | — |
| KZT | 679,788,016 | USD | 1,303,525 | Citibank, N.A. | 9/16/24 | 188,174 | — |
| USD | 448,066 | AMD | 182,027,000 | Citibank, N.A. | 9/16/24 | — | (13,953) |
| USD | 1,303,525 | KZT | 666,427,000 | Citibank, N.A. | 9/16/24 | — | (158,854) |
| USD | 2,607,048 | KZT | 1,323,077,000 | Citibank, N.A. | 9/16/24 | — | (296,256) |
| USD | 3,128,459 | KZT | 1,600,989,000 | Citibank, N.A. | 9/16/24 | — | (384,683) |
| EGP | 125,096,044 | USD | 2,696,035 | HSBC Bank USA, N.A. | 9/17/24 | — | (187,107) |
| EGP | 71,623,956 | USD | 1,463,206 | ICBC Standard Bank plc | 9/17/24 | — | (26,715) |
| USD | 4,863,288 | EGP | 196,720,000 | Citibank, N.A. | 9/17/24 | 917,869 | — |
| KZT | 676,529,000 | USD | 1,344,988 | Citibank, N.A. | 9/19/24 | 138,538 | — |
| USD | 1,303,524 | KZT | 676,529,000 | Citibank, N.A. | 9/19/24 | — | (180,002) |
| TRY | 23,891,755 | USD | 656,751 | Standard Chartered Bank | 9/20/24 | — | (22,788) |
| TRY | 23,891,754 | USD | 656,975 | Standard Chartered Bank | 9/20/24 | — | (23,012) |
| TRY | 59,625,000 | USD | 1,626,002 | Standard Chartered Bank | 9/20/24 | — | (43,864) |
| TRY | 238,255,000 | USD | 6,505,113 | Standard Chartered Bank | 9/20/24 | — | (183,063) |
| USD | 6,220,500 | TRY | 238,255,000 | Standard Chartered Bank | 9/20/24 | — | (101,550) |
| TRY | 160,529,262 | USD | 4,071,247 | Standard Chartered Bank | 9/23/24 | 173,982 | — |
| TRY | 150,286,305 | USD | 3,837,781 | Standard Chartered Bank | 9/23/24 | 136,571 | — |
| TRY | 64,768,000 | USD | 1,744,137 | Standard Chartered Bank | 9/23/24 | — | (31,334) |
| USD | 1,689,161 | TRY | 64,768,000 | Standard Chartered Bank | 9/23/24 | — | (23,642) |
| KZT | 691,976,000 | USD | 1,375,698 | Societe Generale | 9/30/24 | 137,886 | — |
| USD | 1,328,169 | KZT | 691,976,000 | Bank of America, N.A. | 9/30/24 | — | (185,415) |
| UZS | 7,833,244,114 | USD | 583,482 | JPMorgan Chase Bank, N.A. | 10/4/24 | 7,290 | — |
| TRY | 39,856,193 | USD | 987,489 | Standard Chartered Bank | 10/17/24 | 38,793 | — |
| TRY | 39,829,282 | USD | 987,348 | Standard Chartered Bank | 10/17/24 | 38,241 | — |
| PLN | 30,375,192 | EUR | 6,912,879 | Bank of America, N.A. | 10/21/24 | 37,072 | — |
| USD | 1,297,814 | OMR | 500,000 | Standard Chartered Bank | 10/22/24 | — | (158) |
| UZS | 4,986,956,612 | USD | 366,688 | JPMorgan Chase Bank, N.A. | 10/22/24 | 7,539 | — |
| UZS | 5,005,291,011 | USD | 366,688 | JPMorgan Chase Bank, N.A. | 10/24/24 | 8,681 | — |
| EGP | 23,324,710 | USD | 450,719 | HSBC Bank USA, N.A. | 11/27/24 | 6,866 | — |
| USD | 4,337,898 | HKD | 33,700,000 | BNP Paribas | 12/9/24 | 7,427 | — |
| USD | 11,933,727 | HKD | 92,700,000 | Deutsche Bank AG | 12/9/24 | 21,720 | — |
38
See Notes to Consolidated Financial Statements.
Global Macro Portfolio
April 30, 2024
Consolidated Portfolio of Investments (Unaudited) — continued
| Forward Foreign Currency Exchange Contracts (OTC) (continued) |
| Currency Purchased | Currency Sold | Counterparty | Settlement
Date | Unrealized
Appreciation | Unrealized
(Depreciation) |
| TRY | 256,907,557 | USD | 6,600,119 | Standard Chartered Bank | 12/16/24 | $ — | $ (383,407) |
| TRY | 64,327,715 | USD | 1,541,892 | Standard Chartered Bank | 12/18/24 | 11,641 | — |
| USD | 758,751 | KES | 111,536,419 | Standard Chartered Bank | 12/18/24 | — | (38,575) |
| TRY | 169,761,372 | USD | 4,015,677 | Standard Chartered Bank | 1/6/25 | 8,331 | — |
| TRY | 80,088,000 | USD | 1,894,580 | Standard Chartered Bank | 1/6/25 | 3,818 | — |
| TRY | 57,009,900 | USD | 1,347,568 | Standard Chartered Bank | 1/6/25 | 3,789 | — |
| TRY | 60,062,400 | USD | 1,420,923 | Standard Chartered Bank | 1/6/25 | 2,791 | — |
| UZS | 15,376,313,000 | USD | 1,098,308 | JPMorgan Chase Bank, N.A. | 1/6/25 | 28,437 | — |
| SAR | 5,828,000 | USD | 1,549,642 | Standard Chartered Bank | 1/8/25 | 1,758 | — |
| TRY | 72,990,000 | USD | 1,699,432 | Standard Chartered Bank | 1/15/25 | 15,700 | — |
| UZS | 16,702,683,000 | USD | 1,187,113 | ICBC Standard Bank plc | 1/23/25 | 63,587 | — |
| UZS | 11,266,196,720 | USD | 806,168 | ICBC Standard Bank plc | 1/23/25 | 37,447 | — |
| TRY | 54,319,443 | USD | 1,237,947 | Standard Chartered Bank | 1/29/25 | 21,458 | — |
| TRY | 99,122,295 | USD | 2,283,293 | Standard Chartered Bank | 1/29/25 | 14,873 | — |
| TRY | 51,738,000 | USD | 1,191,278 | Standard Chartered Bank | 1/29/25 | 8,275 | — |
| TRY | 102,687,143 | USD | 2,372,642 | Standard Chartered Bank | 2/10/25 | — | (16,883) |
| UZS | 16,619,585,000 | USD | 1,187,113 | ICBC Standard Bank plc | 2/10/25 | 18,369 | — |
| EGP | 160,694,420 | USD | 2,669,343 | Citibank, N.A. | 2/13/25 | 400,171 | — |
| UZS | 12,273,226,786 | USD | 873,539 | JPMorgan Chase Bank, N.A. | 2/13/25 | 15,911 | — |
| UZS | 14,963,793,783 | USD | 1,064,281 | JPMorgan Chase Bank, N.A. | 2/18/25 | 18,587 | — |
| EGP | 53,831,741 | USD | 889,781 | Citibank, N.A. | 2/20/25 | 135,722 | — |
| EGP | 33,046,461 | USD | 533,869 | Citibank, N.A. | 2/20/25 | 95,672 | — |
| EGP | 27,805,651 | USD | 444,890 | Citibank, N.A. | 2/20/25 | 84,812 | — |
| NGN | 1,567,021,679 | USD | 851,642 | Standard Chartered Bank | 2/24/25 | 168,963 | — |
| NGN | 794,156,367 | USD | 425,821 | Standard Chartered Bank | 2/24/25 | 91,415 | — |
| NGN | 1,216,220,810 | USD | 735,321 | JPMorgan Chase Bank, N.A. | 2/25/25 | 56,552 | — |
| EGP | 13,292,925 | USD | 245,938 | Goldman Sachs International | 2/26/25 | 6,712 | — |
| EGP | 29,051,345 | USD | 444,890 | Citibank, N.A. | 2/27/25 | 107,057 | — |
| EGP | 25,014,906 | USD | 450,719 | HSBC Bank USA, N.A. | 2/27/25 | 24,540 | — |
| UZS | 13,634,050,578 | USD | 968,671 | ICBC Standard Bank plc | 2/28/25 | 15,121 | — |
| UZS | 5,369,835,218 | USD | 384,383 | ICBC Standard Bank plc | 3/5/25 | 2,529 | — |
| UZS | 4,968,301,730 | USD | 352,237 | JPMorgan Chase Bank, N.A. | 3/17/25 | 4,510 | — |
| UZS | 4,160,754,064 | USD | 294,880 | JPMorgan Chase Bank, N.A. | 3/20/25 | 3,625 | — |
| USD | 758,751 | KES | 113,812,672 | Standard Chartered Bank | 3/21/25 | — | (40,036) |
| USD | 1,138,113 | KES | 165,880,000 | Standard Chartered Bank | 4/4/25 | — | (22,874) |
| UZS | 4,142,721,282 | USD | 291,741 | JPMorgan Chase Bank, N.A. | 4/4/25 | 2,013 | — |
| TRY | 75,590,000 | USD | 1,646,854 | Standard Chartered Bank | 4/8/25 | 8,839 | — |
| TRY | 67,960,000 | USD | 1,482,237 | Standard Chartered Bank | 4/8/25 | 6,332 | — |
| USD | 1,380,117 | KES | 201,497,151 | Standard Chartered Bank | 4/9/25 | — | (28,756) |
| UZS | 3,689,671,414 | USD | 257,659 | Standard Chartered Bank | 4/15/25 | 3,971 | — |
| USD | 1,380,117 | KES | 201,290,134 | Standard Chartered Bank | 4/16/25 | 66,537 | — |
| UZS | 12,250,550,000 | USD | 859,989 | ICBC Standard Bank plc | 4/17/25 | 11,894 | — |
| USD | 845,646 | KES | 130,652,250 | Standard Chartered Bank | 5/5/25 | — | (63,200) |
| USD | 845,646 | KES | 130,652,250 | Standard Chartered Bank | 5/5/25 | — | (63,200) |
39
See Notes to Consolidated Financial Statements.
Global Macro Portfolio
April 30, 2024
Consolidated Portfolio of Investments (Unaudited) — continued
| Forward Foreign Currency Exchange Contracts (OTC) (continued) |
| Currency Purchased | Currency Sold | Counterparty | Settlement
Date | Unrealized
Appreciation | Unrealized
(Depreciation) |
| USD | 17,699,754 | BHD | 6,766,439 | Standard Chartered Bank | 6/18/25 | $ — | $ (174,676) |
| USD | 5,911,596 | SAR | 22,308,000 | Standard Chartered Bank | 6/18/25 | — | (20,502) |
| UZS | 11,412,500,000 | USD | 711,059 | Standard Chartered Bank | 3/25/26 | 13,796 | — |
| | | | | | | $13,886,093 | $(12,932,647) |
| Futures Contracts |
| Description | Number of
Contracts | Position | Expiration
Date | Notional
Amount | Value/Unrealized
Appreciation
(Depreciation) |
| Equity Futures | | | | | |
| Nikkei 225 Index | 49 | Long | 6/13/24 | $ 9,356,550 | $ (357,700) |
| Euro Stoxx 50 Index | (354) | Short | 6/21/24 | (18,424,513) | (12,266) |
| IFSC Nifty 50 Index | (188) | Short | 5/30/24 | (8,533,695) | (58,900) |
| S&P/TSX 60 Index | (48) | Short | 6/20/24 | (9,103,839) | 107,311 |
| Interest Rate Futures | | | | | |
| Euro-Bobl | (252) | Short | 6/6/24 | (31,312,048) | 416,849 |
| Euro-BTP | (164) | Short | 6/6/24 | (20,475,694) | 459,141 |
| Euro-Bund | (475) | Short | 6/6/24 | (65,940,188) | 1,447,690 |
| Euro-Buxl | (76) | Short | 6/6/24 | (10,456,346) | 358,709 |
| Euro-Schatz | (53) | Short | 6/6/24 | (5,945,193) | 31,957 |
| Japan 10-Year Bond | (48) | Short | 6/13/24 | (43,978,062) | 316,520 |
| U.S. 2-Year Treasury Note | (1) | Short | 6/28/24 | (202,656) | 1,945 |
| U.S. 5-Year Treasury Note | (127) | Short | 6/28/24 | (13,302,258) | 59,344 |
| U.S. 10-Year Treasury Note | (448) | Short | 6/18/24 | (48,132,000) | 830,744 |
| U.S. Long Treasury Bond | (79) | Short | 6/18/24 | (8,991,188) | 50,938 |
| U.S. Ultra 10-Year Treasury Note | (72) | Short | 6/18/24 | (7,935,750) | 250,530 |
| U.S. Ultra-Long Treasury Bond | (163) | Short | 6/18/24 | (19,488,688) | 1,000,073 |
| | | | | | $4,902,885 |
| Inflation Swaps (Centrally Cleared) |
Notional Amount
(000's omitted) | Portfolio
Pays/Receives
Return on
Reference Index | Reference Index | Portfolio
Pays/Receives
Rate | Annual
Rate | Termination
Date | Value/Unrealized
Appreciation
(Depreciation) |
| EUR | 5,900 | Receives | Eurostat Eurozone HICP ex Tobacco NSA
(pays upon termination) | Pays | 2.20%
(pays upon termination) | 10/15/36 | $ 742,593 |
| EUR | 5,900 | Receives | Eurostat Eurozone HICP ex Tobacco NSA
(pays upon termination) | Pays | 2.20%
(pays upon termination) | 10/15/36 | 742,593 |
40
See Notes to Consolidated Financial Statements.
Global Macro Portfolio
April 30, 2024
Consolidated Portfolio of Investments (Unaudited) — continued
| Inflation Swaps (Centrally Cleared) (continued) |
Notional Amount
(000's omitted) | Portfolio
Pays/Receives
Return on
Reference Index | Reference Index | Portfolio
Pays/Receives
Rate | Annual
Rate | Termination
Date | Value/Unrealized
Appreciation
(Depreciation) |
| EUR | 5,900 | Receives | Eurostat Eurozone HICP ex Tobacco NSA
(pays upon termination) | Pays | 2.20%
(pays upon termination) | 10/15/36 | $ 741,833 |
| EUR | 6,070 | Receives | Eurostat Eurozone HICP ex Tobacco NSA
(pays upon termination) | Pays | 2.08%
(pays upon termination) | 1/15/37 | 815,931 |
| EUR | 5,900 | Pays | Eurostat Eurozone HICP ex Tobacco NSA
(pays upon termination) | Receives | 2.29%
(pays upon termination) | 10/15/46 | (895,131) |
| EUR | 5,900 | Pays | Eurostat Eurozone HICP ex Tobacco NSA
(pays upon termination) | Receives | 2.29%
(pays upon termination) | 10/15/46 | (895,131) |
| EUR | 5,900 | Pays | Eurostat Eurozone HICP ex Tobacco NSA
(pays upon termination) | Receives | 2.29%
(pays upon termination) | 10/15/46 | (897,358) |
| EUR | 6,070 | Pays | Eurostat Eurozone HICP ex Tobacco NSA
(pays upon termination) | Receives | 2.18%
(pays upon termination) | 1/15/47 | (1,037,052) |
| EUR | 2,590 | Pays | Eurostat Eurozone HICP ex Tobacco NSA
(pays upon termination) | Receives | 2.64%
(pays upon termination) | 3/13/53 | 45,358 |
| USD | 28,400 | Pays | Return on CPI-U (NSA)
(pays upon termination) | Receives | 2.75%
(pays upon termination) | 10/29/36 | (1,192,179) |
| USD | 9,970 | Pays | Return on CPI-U (NSA)
(pays upon termination) | Receives | 2.67%
(pays upon termination) | 1/7/37 | (424,586) |
| USD | 19,000 | Receives | Return on CPI-U (NSA)
(pays upon termination) | Pays | 2.62%
(pays upon termination) | 10/29/46 | 763,985 |
| USD | 9,450 | Receives | Return on CPI-U (NSA)
(pays upon termination) | Pays | 2.62%
(pays upon termination) | 10/29/46 | 376,487 |
| USD | 9,950 | Receives | Return on CPI-U (NSA)
(pays upon termination) | Pays | 2.54%
(pays upon termination) | 1/7/47 | 472,038 |
| USD | 3,510 | Receives | Return on CPI-U (NSA)
(pays upon termination) | Pays | 2.40%
(pays upon termination) | 3/13/53 | 131,053 |
| | | | | | | | $ (509,566) |
| Interest Rate Swaps (Centrally Cleared) |
Notional Amount
(000's omitted) | Portfolio
Pays/
Receives
Floating
Rate | Floating Rate | Annual
Fixed Rate | Termination
Date | Value | Unamortized
Upfront
Receipts
(Payments) | Unrealized
Appreciation
(Depreciation) |
| BRL | 68,700 | Pays | Brazil CETIP Interbank Deposit Rate
(pays upon termination) | 10.34%
(pays upon termination) | 7/1/25 | $ (16,285) | $ — | $ (16,285) |
| BRL | 103,200 | Pays | Brazil CETIP Interbank Deposit Rate
(pays upon termination) | 10.43%
(pays upon termination) | 7/1/25 | (4,333) | — | (4,333) |
| BRL | 144,100 | Pays | Brazil CETIP Interbank Deposit Rate
(pays upon termination) | 10.52%
(pays upon termination) | 7/1/25 | 21,759 | — | 21,759 |
41
See Notes to Consolidated Financial Statements.
Global Macro Portfolio
April 30, 2024
Consolidated Portfolio of Investments (Unaudited) — continued
| Interest Rate Swaps (Centrally Cleared) (continued) |
Notional Amount
(000's omitted) | Portfolio
Pays/
Receives
Floating
Rate | Floating Rate | Annual
Fixed Rate | Termination
Date | Value | Unamortized
Upfront
Receipts
(Payments) | Unrealized
Appreciation
(Depreciation) |
| BRL | 48,800 | Pays | Brazil CETIP Interbank Deposit Rate
(pays upon termination) | 10.56%
(pays upon termination) | 7/1/25 | $ 11,909 | $ — | $ 11,909 |
| BRL | 23,600 | Pays | Brazil CETIP Interbank Deposit Rate
(pays upon termination) | 10.60%
(pays upon termination) | 7/1/25 | 7,640 | — | 7,640 |
| BRL | 265,610 | Pays | Brazil CETIP Interbank Deposit Rate
(pays upon termination) | 9.96%
(pays upon termination) | 1/2/26 | (549,727) | — | (549,727) |
| BRL | 296,860 | Pays | Brazil CETIP Interbank Deposit Rate
(pays upon termination) | 9.98%
(pays upon termination) | 1/2/26 | (589,026) | — | (589,026) |
| CLP | 16,042,220 | Receives | 6-month Sinacofi Chile Interbank Rate
(pays semi-annually) | 4.77%
(pays semi-annually) | 6/6/33 | 348,103 | 4,803 | 352,906 |
| CLP | 5,387,780 | Receives | 6-month Sinacofi Chile Interbank Rate
(pays semi-annually) | 4.65%
(pays semi-annually) | 6/14/33 | 141,991 | — | 141,991 |
| CLP | 4,336,000 | Receives | 6-month Sinacofi Chile Interbank Rate
(pays semi-annually) | 5.00%
(pays semi-annually) | 6/22/33 | 147,870 | — | 147,870 |
| CLP | 4,643,000 | Receives | 6-month Sinacofi Chile Interbank Rate
(pays semi-annually) | 5.20%
(pays semi-annually) | 6/22/33 | 82,729 | — | 82,729 |
| CLP | 4,537,000 | Receives | 6-month Sinacofi Chile Interbank Rate
(pays semi-annually) | 4.94%
(pays semi-annually) | 6/21/34 | 149,437 | — | 149,437 |
| CLP | 3,099,000 | Receives | 6-month Sinacofi Chile Interbank Rate
(pays semi-annually) | 4.94%
(pays semi-annually) | 6/21/34 | 100,826 | — | 100,826 |
| CLP | 1,500,000 | Receives | 6-month Sinacofi Chile Interbank Rate
(pays semi-annually) | 5.06%
(pays semi-annually) | 6/21/34 | 34,922 | — | 34,922 |
| CLP | 3,719,000 | Receives | 6-month Sinacofi Chile Interbank Rate
(pays semi-annually) | 5.07%
(pays semi-annually) | 6/21/34 | 82,094 | — | 82,094 |
| CLP | 2,023,966 | Receives | 6-month Sinacofi Chile Interbank Rate
(pays semi-annually) | 5.08%
(pays semi-annually) | 6/21/34 | 43,049 | — | 43,049 |
| CLP | 3,719,000 | Receives | 6-month Sinacofi Chile Interbank Rate
(pays semi-annually) | 5.09%
(pays semi-annually) | 6/21/34 | 76,109 | — | 76,109 |
| CLP | 1,860,034 | Receives | 6-month Sinacofi Chile Interbank Rate
(pays semi-annually) | 5.12%
(pays semi-annually) | 6/21/34 | 33,575 | — | 33,575 |
| COP | 62,519,600 | Receives | Colombia Overnight Interbank Reference Rate
(pays quarterly) | 3.84%
(pays quarterly) | 5/5/25 | 1,188,831 | — | 1,188,831 |
| COP | 29,306,100 | Pays | Colombia Overnight Interbank Reference Rate
(pays quarterly) | 3.19%
(pays quarterly) | 6/4/25 | (592,031) | — | (592,031) |
| COP | 44,982,400 | Pays | Colombia Overnight Interbank Reference Rate
(pays quarterly) | 3.26%
(pays quarterly) | 6/5/25 | (898,440) | — | (898,440) |
42
See Notes to Consolidated Financial Statements.
Global Macro Portfolio
April 30, 2024
Consolidated Portfolio of Investments (Unaudited) — continued
| Interest Rate Swaps (Centrally Cleared) (continued) |
Notional Amount
(000's omitted) | Portfolio
Pays/
Receives
Floating
Rate | Floating Rate | Annual
Fixed Rate | Termination
Date | Value | Unamortized
Upfront
Receipts
(Payments) | Unrealized
Appreciation
(Depreciation) |
| COP | 59,477,600 | Pays | Colombia Overnight Interbank Reference Rate
(pays quarterly) | 3.34%
(pays quarterly) | 6/8/25 | $(1,172,819) | $ — | $ (1,172,819) |
| COP | 29,163,200 | Pays | Colombia Overnight Interbank Reference Rate
(pays quarterly) | 3.44%
(pays quarterly) | 6/9/25 | (570,366) | — | (570,366) |
| COP | 7,412,000 | Receives | Colombia Overnight Interbank Reference Rate
(pays quarterly) | 3.76%
(pays quarterly) | 11/26/25 | 172,398 | — | 172,398 |
| COP | 2,672,700 | Receives | Colombia Overnight Interbank Reference Rate
(pays quarterly) | 4.02%
(pays quarterly) | 11/26/25 | 59,313 | — | 59,313 |
| COP | 14,824,000 | Receives | Colombia Overnight Interbank Reference Rate
(pays quarterly) | 4.07%
(pays quarterly) | 11/26/25 | 325,565 | — | 325,565 |
| COP | 8,554,300 | Receives | Colombia Overnight Interbank Reference Rate
(pays quarterly) | 4.11%
(pays quarterly) | 11/26/25 | 186,617 | — | 186,617 |
| COP | 2,605,900 | Receives | Colombia Overnight Interbank Reference Rate
(pays quarterly) | 4.21%
(pays quarterly) | 11/26/25 | 55,759 | — | 55,759 |
| COP | 7,973,800 | Receives | Colombia Overnight Interbank Reference Rate
(pays quarterly) | 4.34%
(pays quarterly) | 11/26/25 | 165,984 | — | 165,984 |
| COP | 11,377,600 | Pays | Colombia Overnight Interbank Reference Rate
(pays quarterly) | 5.68%
(pays quarterly) | 11/26/25 | (173,217) | — | (173,217) |
| COP | 34,340,000 | Receives | Colombia Overnight Interbank Reference Rate
(pays quarterly) | 7.03%
(pays quarterly) | 11/26/25 | 328,798 | — | 328,798 |
| COP | 4,471,000 | Receives | Colombia Overnight Interbank Reference Rate
(pays quarterly) | 10.17%
(pays quarterly) | 11/26/25 | (15,943) | (38) | (15,981) |
| CZK | 223,000 | Pays | 6-month CZK PRIBOR
(pays semi-annually) | 4.18%
(pays annually) | 9/20/28 | 169,175 | — | 169,175 |
| CZK | 104,061 | Pays | 6-month CZK PRIBOR
(pays semi-annually) | 3.96%
(pays annually) | 9/20/33 | (8,334) | — | (8,334) |
| CZK | 183,208 | Pays | 6-month CZK PRIBOR
(pays semi-annually) | 3.96%
(pays annually) | 9/20/33 | (9,609) | — | (9,609) |
| CZK | 52,000 | Pays | 6-month CZK PRIBOR
(pays semi-annually) | 4.31%
(pays annually) | 12/20/33 | (4,844) | — | (4,844) |
| EUR | 2,000 | Receives | 1-day Euro Short-Term Rate
(pays annually) | 2.60%
(pays annually) | 1/24/28 | 29,260 | (32) | 29,228 |
| EUR | 3,629 | Pays | 6-month EURIBOR
(pays semi-annually) | 3.03%
(pays annually) | 10/10/29 | 71,861 | — | 71,861 |
| EUR | 1,200 | Pays | 6-month EURIBOR
(pays semi-annually) | 3.17%
(pays annually) | 10/17/29 | 34,441 | — | 34,441 |
| EUR | 1,781 | Pays | 6-month EURIBOR
(pays semi-annually) | 3.01%
(pays annually) | 10/27/29 | 34,642 | — | 34,642 |
| EUR | 400 | Pays | 6-month EURIBOR
(pays semi-annually) | 3.26%
(pays annually) | 10/17/32 | 19,149 | — | 19,149 |
| EUR | 800 | Pays | 6-month EURIBOR
(pays semi-annually) | 3.31%
(pays annually) | 10/18/32 | 42,002 | — | 42,002 |
43
See Notes to Consolidated Financial Statements.
Global Macro Portfolio
April 30, 2024
Consolidated Portfolio of Investments (Unaudited) — continued
| Interest Rate Swaps (Centrally Cleared) (continued) |
Notional Amount
(000's omitted) | Portfolio
Pays/
Receives
Floating
Rate | Floating Rate | Annual
Fixed Rate | Termination
Date | Value | Unamortized
Upfront
Receipts
(Payments) | Unrealized
Appreciation
(Depreciation) |
| EUR | 800 | Pays | 6-month EURIBOR
(pays semi-annually) | 3.20%
(pays annually) | 10/19/32 | $ 34,596 | $ — | $ 34,596 |
| GBP | 5,154 | Pays | 1-day Sterling Overnight Index Average
(pays annually) | 4.56%
(pays annually) | 10/2/28 | 39,733 | — | 39,733 |
| GBP | 3,359 | Pays | 1-day Sterling Overnight Index Average
(pays annually) | 3.61%
(pays annually) | 12/20/28 | (142,382) | — | (142,382) |
| GBP | 3,359 | Pays | 1-day Sterling Overnight Index Average
(pays annually) | 3.64%
(pays annually) | 12/20/28 | (136,756) | — | (136,756) |
| GBP | 3,359 | Pays | 1-day Sterling Overnight Index Average
(pays annually) | 3.69%
(pays annually) | 12/20/28 | (127,257) | — | (127,257) |
| GBP | 3,422 | Pays | 1-day Sterling Overnight Index Average
(pays annually) | 3.72%
(pays annually) | 12/20/28 | (124,853) | — | (124,853) |
| GBP | 4,702 | Pays | 1-day Sterling Overnight Index Average
(pays annually) | 4.27%
(pays annually) | 12/20/28 | (24,770) | — | (24,770) |
| GBP | 4,698 | Pays | 1-day Sterling Overnight Index Average
(pays annually) | 4.28%
(pays annually) | 12/20/28 | (22,117) | — | (22,117) |
| GBP | 10,164 | Pays | 1-day Sterling Overnight Index Average
(pays annually) | 4.39%
(pays annually) | 12/20/28 | 14,920 | — | 14,920 |
| GBP | 5,082 | Pays | 1-day Sterling Overnight Index Average
(pays annually) | 4.59%
(pays annually) | 12/20/28 | 63,514 | — | 63,514 |
| GBP | 5,472 | Pays | 1-day Sterling Overnight Index Average
(pays annually) | 3.73%
(pays annually) | 3/20/29 | (168,936) | — | (168,936) |
| GBP | 5,472 | Pays | 1-day Sterling Overnight Index Average
(pays annually) | 3.76%
(pays annually) | 3/20/29 | (161,359) | — | (161,359) |
| GBP | 5,536 | Pays | 1-day Sterling Overnight Index Average
(pays annually) | 3.76%
(pays annually) | 3/20/29 | (162,785) | — | (162,785) |
| GBP | 5,472 | Pays | 1-day Sterling Overnight Index Average
(pays annually) | 3.77%
(pays annually) | 3/20/29 | (157,722) | — | (157,722) |
| GBP | 5,495 | Pays | 1-day Sterling Overnight Index Average
(pays annually) | 3.83%
(pays annually) | 3/20/29 | (139,968) | — | (139,968) |
| INR | 1,450,300 | Pays | 1-day INR FBIL MIBOR
(pays semi-annually) | 6.53%
(pays semi-annually) | 9/18/26 | (21,743) | — | (21,743) |
| INR | 1,450,000 | Pays | 1-day INR FBIL MIBOR
(pays semi-annually) | 6.55%
(pays semi-annually) | 9/18/26 | (15,839) | — | (15,839) |
| INR | 725,200 | Pays | 1-day INR FBIL MIBOR
(pays semi-annually) | 6.57%
(pays semi-annually) | 9/18/26 | (5,437) | — | (5,437) |
| INR | 725,000 | Pays | 1-day INR FBIL MIBOR
(pays semi-annually) | 6.59%
(pays semi-annually) | 9/18/26 | (2,097) | — | (2,097) |
| INR | 725,000 | Pays | 1-day INR FBIL MIBOR
(pays semi-annually) | 6.61%
(pays semi-annually) | 9/18/26 | 620 | — | 620 |
44
See Notes to Consolidated Financial Statements.
Global Macro Portfolio
April 30, 2024
Consolidated Portfolio of Investments (Unaudited) — continued
| Interest Rate Swaps (Centrally Cleared) (continued) |
Notional Amount
(000's omitted) | Portfolio
Pays/
Receives
Floating
Rate | Floating Rate | Annual
Fixed Rate | Termination
Date | Value | Unamortized
Upfront
Receipts
(Payments) | Unrealized
Appreciation
(Depreciation) |
| INR | 725,000 | Pays | 1-day INR FBIL MIBOR
(pays semi-annually) | 6.61%
(pays semi-annually) | 9/18/26 | $ 1,396 | $ — | $ 1,396 |
| INR | 539,200 | Pays | 1-day INR FBIL MIBOR
(pays semi-annually) | 6.62%
(pays semi-annually) | 9/18/26 | 1,616 | — | 1,616 |
| INR | 725,300 | Pays | 1-day INR FBIL MIBOR
(pays semi-annually) | 6.64%
(pays semi-annually) | 9/18/26 | 6,368 | — | 6,368 |
| INR | 725,200 | Pays | 1-day INR FBIL MIBOR
(pays semi-annually) | 6.66%
(pays semi-annually) | 9/18/26 | 9,163 | — | 9,163 |
| INR | 5,057,900 | Pays | 1-day INR FBIL MIBOR
(pays semi-annually) | 6.23%
(pays semi-annually) | 3/20/29 | (911,190) | — | (911,190) |
| JPY | 2,838,000 | Receives | 1-day Overnight Tokyo Average Rate
(pays annually) | 0.31%
(pays annually) | 12/1/27 | 84,501 | — | 84,501 |
| JPY | 2,405,000 | Receives | 1-day Overnight Tokyo Average Rate
(pays annually) | 0.32%
(pays annually) | 12/1/27 | 67,698 | — | 67,698 |
| JPY | 564,000 | Receives | 1-day Overnight Tokyo Average Rate
(pays annually) | 0.41%
(pays annually) | 9/20/28 | 10,164 | — | 10,164 |
| JPY | 718,000 | Receives | 1-day Overnight Tokyo Average Rate
(pays annually) | 0.57%
(pays annually) | 6/19/29 | 8,395 | — | 8,395 |
| JPY | 16,000 | Receives | 1-day Overnight Tokyo Average Rate
(pays annually) | 0.80%
(pays annually) | 9/20/33 | 483 | — | 483 |
| JPY | 21,000 | Receives | 1-day Overnight Tokyo Average Rate
(pays annually) | 0.80%
(pays annually) | 9/20/33 | 620 | — | 620 |
| JPY | 13,000 | Receives | 1-day Overnight Tokyo Average Rate
(pays annually) | 0.81%
(pays annually) | 9/20/33 | 344 | — | 344 |
| JPY | 2,050,000 | Receives | 1-day Overnight Tokyo Average Rate
(pays annually) | 0.82%
(pays annually) | 9/20/33 | 38,530 | — | 38,530 |
| JPY | 1,054,000 | Receives | 1-day Overnight Tokyo Average Rate
(pays annually) | 0.86%
(pays annually) | 9/20/33 | (10,434) | — | (10,434) |
| JPY | 649,000 | Receives | 1-day Overnight Tokyo Average Rate
(pays annually) | 1.07%
(pays annually) | 12/20/33 | (71,965) | — | (71,965) |
| JPY | 1,117,000 | Receives | 1-day Overnight Tokyo Average Rate
(pays annually) | 0.95%
(pays annually) | 3/21/34 | (8,863) | (5) | (8,868) |
| JPY | 841,000 | Receives | 1-day Overnight Tokyo Average Rate
(pays annually) | 1.55%
(pays annually) | 6/19/54 | 149,570 | — | 149,570 |
| KRW | 613,331 | Pays | 3-month KRW Certificate of Deposit Rate
(pays quarterly) | 3.31%
(pays quarterly) | 9/20/33 | (8,122) | — | (8,122) |
| KRW | 2,915,000 | Pays | 3-month KRW Certificate of Deposit Rate
(pays quarterly) | 3.40%
(pays quarterly) | 9/20/33 | (22,410) | — | (22,410) |
45
See Notes to Consolidated Financial Statements.
Global Macro Portfolio
April 30, 2024
Consolidated Portfolio of Investments (Unaudited) — continued
| Interest Rate Swaps (Centrally Cleared) (continued) |
Notional Amount
(000's omitted) | Portfolio
Pays/
Receives
Floating
Rate | Floating Rate | Annual
Fixed Rate | Termination
Date | Value | Unamortized
Upfront
Receipts
(Payments) | Unrealized
Appreciation
(Depreciation) |
| KRW | 2,976,000 | Pays | 3-month KRW Certificate of Deposit Rate
(pays quarterly) | 3.52%
(pays quarterly) | 9/20/33 | $ (2,328) | $ — | $ (2,328) |
| KRW | 2,770,000 | Pays | 3-month KRW Certificate of Deposit Rate
(pays quarterly) | 3.56%
(pays quarterly) | 9/20/33 | 4,237 | — | 4,237 |
| KRW | 2,806,000 | Pays | 3-month KRW Certificate of Deposit Rate
(pays quarterly) | 3.59%
(pays quarterly) | 9/20/33 | 10,021 | — | 10,021 |
| MXN | 745,010 | Pays | Mexico Interbank TIIE 28 Day
(pays monthly) | 10.88%
(pays monthly) | 1/6/25 | (57,643) | — | (57,643) |
| MXN | 2,045,310 | Pays | Mexico Interbank TIIE 28 Day
(pays monthly) | 10.82%
(pays monthly) | 1/7/25 | (204,183) | — | (204,183) |
| MXN | 1,804,480 | Pays | Mexico Interbank TIIE 28 Day
(pays monthly) | 10.80%
(pays monthly) | 1/8/25 | (232,536) | — | (232,536) |
| MXN | 143,110 | Pays | Mexico Interbank TIIE 28 Day
(pays monthly) | 8.71%
(pays monthly) | 12/1/33 | (470,202) | — | (470,202) |
| MXN | 137,600 | Pays | Mexico Interbank TIIE 28 Day
(pays monthly) | 8.77%
(pays monthly) | 12/1/33 | (421,085) | — | (421,085) |
| MXN | 85,220 | Pays | Mexico Interbank TIIE 28 Day
(pays monthly) | 8.43%
(pays monthly) | 12/2/33 | (369,318) | — | (369,318) |
| MXN | 88,070 | Pays | Mexico Interbank TIIE 28 Day
(pays monthly) | 8.49%
(pays monthly) | 12/2/33 | (363,478) | — | (363,478) |
| TWD | 108,000 | Receives | 3-month TWD TAIBOR
(pays quarterly) | 1.26%
(pays quarterly) | 3/20/29 | 97,076 | — | 97,076 |
| TWD | 143,600 | Receives | 3-month TWD TAIBOR
(pays quarterly) | 1.27%
(pays quarterly) | 3/20/29 | 125,894 | — | 125,894 |
| TWD | 145,900 | Receives | 3-month TWD TAIBOR
(pays quarterly) | 1.32%
(pays quarterly) | 3/20/29 | 117,137 | — | 117,137 |
| TWD | 343,900 | Receives | 3-month TWD TAIBOR
(pays quarterly) | 1.33%
(pays quarterly) | 3/20/29 | 269,753 | — | 269,753 |
| TWD | 118,000 | Receives | 3-month TWD TAIBOR
(pays quarterly) | 1.35%
(pays quarterly) | 3/20/29 | 89,509 | — | 89,509 |
| TWD | 473,400 | Receives | 3-month TWD TAIBOR
(pays quarterly) | 1.36%
(pays quarterly) | 3/20/29 | 352,106 | — | 352,106 |
| TWD | 143,600 | Receives | 3-month TWD TAIBOR
(pays quarterly) | 1.37%
(pays quarterly) | 3/20/29 | 104,686 | — | 104,686 |
| TWD | 143,600 | Receives | 3-month TWD TAIBOR
(pays quarterly) | 1.38%
(pays quarterly) | 3/20/29 | 103,626 | — | 103,626 |
| TWD | 566,200 | Receives | 3-month TWD TAIBOR
(pays quarterly) | 1.64%
(pays quarterly) | 6/19/29 | 211,916 | — | 211,916 |
| TWD | 229,200 | Receives | 3-month TWD TAIBOR
(pays quarterly) | 1.95%
(pays quarterly) | 6/19/29 | (21,271) | — | (21,271) |
| USD | 20,300 | Pays | SOFR
(pays annually) | 4.01%
(pays annually) | 8/4/28 | (616,682) | — | (616,682) |
46
See Notes to Consolidated Financial Statements.
Global Macro Portfolio
April 30, 2024
Consolidated Portfolio of Investments (Unaudited) — continued
| Interest Rate Swaps (Centrally Cleared) (continued) |
Notional Amount
(000's omitted) | Portfolio
Pays/
Receives
Floating
Rate | Floating Rate | Annual
Fixed Rate | Termination
Date | Value | Unamortized
Upfront
Receipts
(Payments) | Unrealized
Appreciation
(Depreciation) |
| USD | 20,300 | Pays | SOFR
(pays annually) | 4.01%
(pays annually) | 8/4/28 | $ (615,749) | $ — | $ (615,749) |
| USD | 4,500 | Pays | SOFR
(pays annually) | 4.05%
(pays annually) | 9/20/28 | (120,837) | — | (120,837) |
| USD | 4,500 | Pays | SOFR
(pays annually) | 4.06%
(pays annually) | 9/20/28 | (120,325) | — | (120,325) |
| USD | 12,600 | Pays | SOFR
(pays annually) | 3.76%
(pays annually) | 9/20/33 | (157,228) | — | (157,228) |
| Total | | | | | | $(4,640,844) | $4,728 | $(4,636,116) |
| Interest Rate Swaps (OTC) |
| Counterparty | Notional Amount
(000's omitted) | Portfolio
Pays/Receives
Floating Rate | Floating Rate | Annual
Fixed Rate | Termination
Date | Value/Unrealized
Appreciation
(Depreciation) |
| Citibank, N.A. | MYR | 64,000 | Receives | 3-month MYR KLIBOR
(pays quarterly) | 3.62%
(pays quarterly) | 3/20/29 | $ 108,556 |
| JPMorgan Chase Bank, N.A. | MYR | 39,000 | Receives | 3-month MYR KLIBOR
(pays quarterly) | 3.63%
(pays quarterly) | 3/20/29 | 62,369 |
| JPMorgan Chase Bank, N.A. | MYR | 37,100 | Receives | 3-month MYR KLIBOR
(pays quarterly) | 3.63%
(pays quarterly) | 3/20/29 | 58,971 |
| Nomura International PLC | MYR | 78,000 | Receives | 3-month MYR KLIBOR
(pays quarterly) | 3.60%
(pays quarterly) | 3/20/29 | 147,433 |
| Standard Chartered Bank | MYR | 39,000 | Receives | 3-month MYR KLIBOR
(pays quarterly) | 3.62%
(pays quarterly) | 3/20/29 | 66,151 |
| Total | | | | | | | $443,480 |
| Credit Default Swaps - Sell Protection (Centrally Cleared) |
| Reference Entity | Notional
Amount*
(000's omitted) | Contract Annual
Fixed Rate** | Current
Market Annual
Fixed Rate*** | Termination
Date | Value | Unamortized
Upfront
Receipts
(Payments) | Unrealized
Appreciation
(Depreciation) |
| Panama | $ 5,517 | 1.00%
(pays quarterly)(1) | 1.80% | 6/20/29 | $ (212,191) | $ 210,209 | $ (1,982) |
| Total | $5,517 | | | | $(212,191) | $210,209 | $(1,982) |
47
See Notes to Consolidated Financial Statements.
Global Macro Portfolio
April 30, 2024
Consolidated Portfolio of Investments (Unaudited) — continued
| Credit Default Swaps - Buy Protection (Centrally Cleared) | |
| Reference Entity | Notional
Amount
(000's omitted) | Contract
Annual
Fixed Rate** | Termination
Date | Value | Unamortized
Upfront
Receipts
(Payments) | Unrealized
Appreciation
(Depreciation) |
| Austria | | $ 4,140 | 1.00%
(pays quarterly)(1) | 6/20/29 | $ (163,599) | $ 159,977 | $ (3,622) |
| Export-Import Bank of India | | 9,000 | 1.00%
(pays quarterly)(1) | 6/20/29 | (228,093) | 205,309 | (22,784) |
| Finland | | 8,420 | 0.25%
(pays quarterly)(1) | 6/20/29 | (17,974) | 9,717 | (8,257) |
| France | | 17,660 | 0.25%
(pays quarterly)(1) | 6/20/29 | (7,305) | (4,071) | (11,376) |
| Germany | | 36,910 | 0.25%
(pays quarterly)(1) | 6/20/29 | (262,160) | 213,877 | (48,283) |
| Hungary | | 4,410 | 1.00%
(pays quarterly)(1) | 6/20/29 | 45,526 | (78,406) | (32,880) |
| Malaysia | | 122,530 | 1.00%
(pays quarterly)(1) | 6/20/29 | (3,065,660) | 3,259,152 | 193,492 |
| Markit CDX Emerging Markets Index (CDX.EM.31.V3) | | 2,580 | 1.00%
(pays quarterly)(1) | 6/20/24 | (5,839) | (10,843) | (16,682) |
| Markit CDX Emerging Markets Index (CDX.EM.IG.41.V1) | | 107,000 | 1.00%
(pays quarterly)(1) | 6/20/29 | (1,296,798) | 1,488,361 | 191,563 |
| Philippines | | 45,000 | 1.00%
(pays quarterly)(1) | 6/20/29 | (719,860) | 657,775 | (62,085) |
| Poland | | 27,220 | 1.00%
(pays quarterly)(1) | 6/20/29 | (365,366) | 332,852 | (32,514) |
| Qatar | | 5,300 | 1.00%
(pays quarterly)(1) | 6/20/29 | (141,667) | 146,197 | 4,530 |
| Romania | | 3,920 | 1.00%
(pays quarterly)(1) | 6/20/29 | 86,755 | (108,926) | (22,171) |
| Saudi Arabia | | 24,613 | 1.00%
(pays quarterly)(1) | 6/20/29 | (541,306) | 525,199 | (16,107) |
| South Africa | | 162,351 | 1.00%
(pays quarterly)(1) | 6/20/29 | 9,610,271 | (10,942,301) | (1,332,030) |
| South Africa | | 9,666 | 1.00%
(pays quarterly)(1) | 6/20/31 | 1,064,027 | (1,052,025) | 12,002 |
| Sweden | | 17,470 | 0.25%
(pays quarterly)(1) | 6/20/29 | (95,380) | 76,837 | (18,543) |
| Turkey | | 41,088 | 1.00%
(pays quarterly)(1) | 6/20/29 | 3,331,361 | (3,858,155) | (526,794) |
| United Kingdom | | 17,630 | 1.00%
(pays quarterly)(1) | 6/20/29 | (609,886) | 563,668 | (46,218) |
| Total | | | | | $ 6,617,047 | $ (8,415,806) | $ (1,798,759) |
48
See Notes to Consolidated Financial Statements.
Global Macro Portfolio
April 30, 2024
Consolidated Portfolio of Investments (Unaudited) — continued
| Credit Default Swaps - Sell Protection (OTC) |
| Reference Entity | Counterparty | Notional
Amount*
(000's omitted) | Contract Annual
Fixed Rate** | Current
Market
Annual
Fixed Rate*** | Termination
Date | Value | Unamortized
Upfront
Receipts
(Payments) | Unrealized
Appreciation
(Depreciation) |
| Indonesia | Barclays Bank PLC | $ 13,000 | 1.00%
(pays quarterly)(1) | 0.76% | 6/20/29 | $ 155,567 | $ (133,851) | $ 21,716 |
| Indonesia | BNP Paribas | 7,000 | 1.00%
(pays quarterly)(1) | 0.76 | 6/20/29 | 83,849 | (74,663) | 9,186 |
| Indonesia | Deutsche Bank AG | 7,000 | 1.00%
(pays quarterly)(1) | 0.76 | 6/20/29 | 83,849 | (68,953) | 14,896 |
| Indonesia | Goldman Sachs International | 5,000 | 1.00%
(pays quarterly)(1) | 0.76 | 6/20/29 | 59,892 | (49,252) | 10,640 |
| Indonesia | JPMorgan Chase Bank, N.A. | 6,000 | 1.00%
(pays quarterly)(1) | 0.76 | 6/20/29 | 71,870 | (60,458) | 11,412 |
| Panama | Goldman Sachs International | 8,690 | 1.00%
(pays quarterly)(1) | 1.80 | 6/20/29 | (297,992) | 275,513 | (22,479) |
| Petroleos Mexicanos | Bank of America, N.A. | 18,707 | 1.00%
(pays quarterly)(1) | 1.89 | 3/20/25 | (122,033) | 276,169 | 154,136 |
| Petroleos Mexicanos | Barclays Bank PLC | 8,020 | 1.00%
(pays quarterly)(1) | 1.37 | 6/20/24 | 5,124 | 8,665 | 13,789 |
| Vietnam | Bank of America, N.A. | 1,000 | 1.00%
(pays quarterly)(1) | 1.18 | 6/20/29 | (6,899) | 8,397 | 1,498 |
| Vietnam | BNP Paribas | 2,000 | 1.00%
(pays quarterly)(1) | 1.18 | 6/20/29 | (13,798) | 18,567 | 4,769 |
| Vietnam | Goldman Sachs International | 9,100 | 1.00%
(pays quarterly)(1) | 0.49 | 6/20/24 | 17,122 | (3,723) | 13,399 |
| Vietnam | Goldman Sachs International | 3,100 | 1.00%
(pays quarterly)(1) | 1.18 | 6/20/29 | (21,404) | 27,465 | 6,061 |
| Vietnam | Goldman Sachs International | 2,500 | 1.00%
(pays quarterly)(1) | 1.30 | 6/20/29 | (25,252) | 22,112 | (3,140) |
| Total | | $91,117 | | | | $ (10,105) | $ 245,988 | $235,883 |
| Credit Default Swaps - Buy Protection (OTC) |
| Reference Entity | Counterparty | Notional
Amount
(000's omitted) | Contract
Annual
Fixed Rate** | Termination
Date | Value | Unamortized
Upfront
Receipts
(Payments) | Unrealized
Appreciation
(Depreciation) |
| Czech Republic | JPMorgan Chase Bank, N.A. | $ 8,580 | 1.00%
(pays quarterly)(1) | 6/20/29 | $ (277,648) | $ 281,112 | $ 3,464 |
| Dubai | Barclays Bank PLC | 3,357 | 1.00%
(pays quarterly)(1) | 12/20/24 | (20,483) | (7,118) | (27,601) |
| Dubai | Barclays Bank PLC | 5,058 | 1.00%
(pays quarterly)(1) | 12/20/24 | (30,861) | (10,734) | (41,595) |
| Qatar | Goldman Sachs International | 3,090 | 1.00%
(pays quarterly)(1) | 9/20/24 | (14,112) | 103 | (14,009) |
| Qatar | Nomura International PLC | 9,620 | 1.00%
(pays quarterly)(1) | 9/20/24 | (43,934) | 1,282 | (42,652) |
| Saudi Arabia | Barclays Bank PLC | 14,533 | 1.00%
(pays quarterly)(1) | 6/20/31 | (312,096) | (191,089) | (503,185) |
49
See Notes to Consolidated Financial Statements.
Global Macro Portfolio
April 30, 2024
Consolidated Portfolio of Investments (Unaudited) — continued
| Credit Default Swaps - Buy Protection (OTC) (continued) |
| Reference Entity | Counterparty | Notional
Amount
(000's omitted) | Contract
Annual
Fixed Rate** | Termination
Date | Value | Unamortized
Upfront
Receipts
(Payments) | Unrealized
Appreciation
(Depreciation) |
| Saudi Arabia | Goldman Sachs International | $28,800 | 1.00%
(pays quarterly)(1) | 6/20/34 | $ (431,102) | $ 368,063 | $ (63,039) |
| Total | | | | | $(1,130,236) | $ 441,619 | $(688,617) |
| * | If the Portfolio is the seller of credit protection, the notional amount is the maximum potential amount of future payments the Portfolio could be required to make if a credit event, as defined in the credit default swap agreement, were to occur. At April 30, 2024, such maximum potential amount for all open credit default swaps in which the Portfolio is the seller was $96,634,206. |
| ** | The contract annual fixed rate represents the fixed rate of interest received by the Portfolio (as a seller of protection) or paid by the Portfolio (as a buyer of protection) on the notional amount of the credit default swap contract. |
| *** | Current market annual fixed rates, utilized in determining the net unrealized appreciation or depreciation as of period end, serve as an indicator of the market’s perception of the current status of the payment/performance risk associated with the credit derivative. The current market annual fixed rate of a particular reference entity reflects the cost, as quoted by the pricing vendor, of selling protection against default of that entity as of period end and may include upfront payments required to be made to enter into the agreement. The higher the fixed rate, the greater the market perceived risk of a credit event involving the reference entity. A rate identified as “Defaulted” indicates a credit event has occurred for the reference entity. |
| (1) | Upfront payment is exchanged with the counterparty as a result of the standardized trading coupon. |
| Total Return Swaps (OTC) |
| Counterparty | Notional Amount
(000's omitted) | Portfolio Receives | Portfolio Pays | Termination
Date | Value/Unrealized
Appreciation
(Depreciation) |
| BNP Paribas | USD | 74,500 | Excess Return on Bloomberg Commodity 3 Month Forward Index (pays upon termination) | Excess Return on Bloomberg Commodity Index + 0.12% (pays upon termination) | 8/26/24 | $ 62,362 |
| Citibank, N.A. | USD | 16,000 | Excess Return on Bloomberg Commodity 3 Month Forward Index (pays upon termination) | Excess Return on Bloomberg Commodity Index + 0.12% (pays upon termination) | 6/18/24 | 66,226 |
| Citibank, N.A. | KRW | 18,000 | Positive Return on KOSPI 200 Index Futures 6/2024 (pays upon termination) | Negative Return on KOSPI 200 Index Futures 6/2024 (pays upon termination) | 6/13/24 | 87,660 |
| | | | | | | $216,248 |
50
See Notes to Consolidated Financial Statements.
Global Macro Portfolio
April 30, 2024
Consolidated Portfolio of Investments (Unaudited) — continued
| Cross-Currency Swaps (OTC) | | |
| Counterparty | Portfolio Receives | Portfolio Pays | Termination
Date | Value/Unrealized
Appreciation
(Depreciation) |
| Barclays Bank PLC | 1-day Indice Camara Promedio Rate on CLP 3,452,164,660 (pays semi-annually)* | 1.41% on CLP equivalent of CLF 98,000 (pays semi-annually)* | 1/13/33 | $ 144,986 |
| Goldman Sachs International | 1-day Indice Camara Promedio Rate on CLP 1,333,595,340 (pays semi-annually)* | 2.10% on CLP equivalent of CLF 42,000 (pays semi-annually)* | 4/8/32 | (207,548) |
| Goldman Sachs International | 1-day Indice Camara Promedio Rate on CLP 4,064,683,520 (pays semi-annually)* | 2.25% on CLP equivalent of
CLF 128,000 (pays semi-annually)* | 4/11/32 | (688,266) |
| Goldman Sachs International | 1-day Indice Camara Promedio Rate on CLP 757,813,425 (pays semi-annually)* | 1.85% on CLP equivalent of CLF 23,700 (pays semi-annually)* | 4/20/32 | (95,788) |
| | | | | $(846,616) |
| * | At the termination date, the Portfolio will either pay or receive the USD equivalent of the difference between the initial CLP notional amount and the CLP equivalent of the CLF notional amount on such date. |
| Abbreviations: |
| CMT | – Constant Maturity Treasury |
| COF | – Cost of Funds 11th District |
| CPI-U (NSA) | – Consumer Price Index All Urban Non-Seasonally Adjusted |
| EURIBOR | – Euro Interbank Offered Rate |
| FBIL | – Financial Benchmarks India Ltd. |
| GDP | – Gross Domestic Product |
| HICP | – Harmonised Indices of Consumer Prices |
| |
| KLIBOR | – Kuala Lumpur Interbank Offered Rate |
| MIBOR | – Mumbai Interbank Offered Rate |
| OTC | – Over-the-counter |
| PIK | – Payment In Kind |
| PRIBOR | – Prague Interbank Offered Rate |
| SOFR | – Secured Overnight Financing Rate |
| TAIBOR | – Taipei Interbank Offered Rate |
| Currency Abbreviations: |
| ALL | – Albanian Lek |
| AMD | – Armenian Dram |
| AUD | – Australian Dollar |
| BHD | – Bahraini Dinar |
| BRL | – Brazilian Real |
| CAD | – Canadian Dollar |
| CLF | – Chilean Unidad de Fomento |
| CLP | – Chilean Peso |
| CNH | – Yuan Renminbi Offshore |
| CNY | – Yuan Renminbi |
| COP | – Colombian Peso |
| CZK | – Czech Koruna |
| DOP | – Dominican Peso |
| EGP | – Egyptian Pound |
| EUR | – Euro |
| GBP | – British Pound Sterling |
| HKD | – Hong Kong Dollar |
| HUF | – Hungarian Forint |
| IDR | – Indonesian Rupiah |
| |
| ILS | – Israeli Shekel |
| INR | – Indian Rupee |
| ISK | – Icelandic Krona |
| JPY | – Japanese Yen |
| KES | – Kenyan Shilling |
| KRW | – South Korean Won |
| KZT | – Kazakhstani Tenge |
| MXN | – Mexican Peso |
| MYR | – Malaysian Ringgit |
| NGN | – Nigerian Naira |
| NZD | – New Zealand Dollar |
| OMR | – Omani Rial |
| PEN | – Peruvian Sol |
| PHP | – Philippine Peso |
| PLN | – Polish Zloty |
| PYG | – Paraguayan Guarani |
| RSD | – Serbian Dinar |
| SAR | – Saudi Riyal |
| SEK | – Swedish Krona |
51
See Notes to Consolidated Financial Statements.
Global Macro Portfolio
April 30, 2024
Consolidated Portfolio of Investments (Unaudited) — continued
| |
| SGD | – Singapore Dollar |
| THB | – Thai Baht |
| TRY | – Turkish Lira |
| TWD | – New Taiwan Dollar |
| UAH | – Ukrainian Hryvnia |
| |
| USD | – United States Dollar |
| UYU | – Uruguayan Peso |
| UZS | – Uzbekistani Som |
| ZAR | – South African Rand |
52
See Notes to Consolidated Financial Statements.
Global Macro Portfolio
April 30, 2024
Consolidated Statement of Assets and Liabilities (Unaudited)
| | April 30, 2024 |
| Assets | |
| Unaffiliated investments, at value (identified cost $1,475,400,525) | $ 1,441,433,839 |
| Affiliated investments, at value (identified cost $152,463,740) | 152,463,740 |
| Cash | 9,454,149 |
| Deposits for derivatives collateral: | |
| Centrally cleared derivatives | 49,477,576 |
| OTC derivatives | 1,240,000 |
| Cash collateral for securities sold short | 44,806,689 |
| Foreign currency, at value (identified cost $9,393,213) | 9,304,043 |
| Interest and dividends receivable | 21,757,213 |
| Dividends receivable from affiliated investments | 724,265 |
| Receivable for investments sold | 27,454,284 |
| Receivable for variation margin on open futures contracts | 1,373,033 |
| Receivable for variation margin on open centrally cleared derivatives | 641,538 |
| Receivable for open forward foreign currency exchange contracts | 13,886,093 |
| Receivable for open swap contracts | 1,069,680 |
| Upfront payments on open non-centrally cleared swap contracts | 599,841 |
| Receivable for closed swap contracts | 923,867 |
| Tax reclaims receivable | 131,733 |
| Receivable from affiliates | 22 |
| Trustees' deferred compensation plan | 268,838 |
| Total assets | $1,777,010,443 |
| Liabilities | |
| Cash collateral due to brokers | $ 1,240,000 |
| Written options outstanding, at value (premiums received $323,828) | 64,066 |
| Payable for investments purchased | 14,197,671 |
| Payable for securities sold short, at value (proceeds $61,607,254) | 60,368,724 |
| Payable for open forward foreign currency exchange contracts | 12,932,647 |
| Payable for open swap contracts | 1,709,302 |
| Upfront receipts on open non-centrally cleared swap contracts | 1,287,448 |
| Payable to affiliates: | |
| Investment adviser fee | 792,512 |
| Trustees' fees | 8,833 |
| Trustees' deferred compensation plan | 268,838 |
| Interest payable on securities sold short | 1,868,237 |
| Accrued foreign capital gains taxes | 3,187 |
| Accrued expenses and other liabilities | 871,510 |
| Total liabilities | $ 95,612,975 |
| Net Assets applicable to investors' interest in Portfolio | $1,681,397,468 |
53
See Notes to Consolidated Financial Statements.
Global Macro Portfolio
April 30, 2024
Consolidated Statement of Operations (Unaudited)
| | Six Months Ended |
| | April 30, 2024 |
| Investment Income | |
| Dividend income (net of foreign taxes withheld of $115,341) | $ 1,272,383 |
| Dividend income from affiliated investments | 2,771,783 |
| Interest income (net of foreign taxes withheld of $582,751) | 56,451,887 |
| Other income | 59,959 |
| Total investment income | $ 60,556,012 |
| Expenses | |
| Investment adviser fee | $ 4,859,884 |
| Trustees’ fees and expenses | 51,758 |
| Custodian fee | 591,912 |
| Legal and accounting services | 137,260 |
| Interest expense and fees | 424,921 |
| Interest and dividend expense on securities sold short | 3,549,898 |
| Miscellaneous | 38,459 |
| Total expenses | $ 9,654,092 |
| Deduct: | |
| Waiver and/or reimbursement of expenses by affiliates | $ 80,781 |
| Total expense reductions | $ 80,781 |
| Net expenses | $ 9,573,311 |
| Net investment income | $ 50,982,701 |
| Realized and Unrealized Gain (Loss) | |
| Net realized gain (loss): | |
| Investment transactions | $ (2,746,298) |
| Written options | 215,859 |
| Securities sold short | (4,352,754) |
| Futures contracts | (6,045,898) |
| Swap contracts | (9,426,229) |
| Foreign currency transactions | 2,979,799 |
| Forward foreign currency exchange contracts | (7,188,695) |
| Net realized loss | $(26,564,216) |
| Change in unrealized appreciation (depreciation): | |
| Investments (including net increase in accrued foreign capital gains taxes of $140) | $ 66,540,515 |
| Written options | 201,275 |
| Securities sold short | (3,895,136) |
| Futures contracts | 1,078,850 |
| Swap contracts | (6,914,968) |
| Foreign currency | 330,060 |
| Forward foreign currency exchange contracts | 9,132,633 |
| Net change in unrealized appreciation (depreciation) | $ 66,473,229 |
| Net realized and unrealized gain | $ 39,909,013 |
| Net increase in net assets from operations | $ 90,891,714 |
54
See Notes to Consolidated Financial Statements.
Global Macro Portfolio
April 30, 2024
Consolidated Statements of Changes in Net Assets
| | Six Months Ended
April 30, 2024
(Unaudited) | Year Ended
October 31, 2023 |
| Increase (Decrease) in Net Assets | | |
| From operations: | | |
| Net investment income | $ 50,982,701 | $ 113,439,876 |
| Net realized loss | (26,564,216) | (180,694,373) |
| Net change in unrealized appreciation (depreciation) | 66,473,229 | 230,134,183 |
| Net increase in net assets from operations | $ 90,891,714 | $ 162,879,686 |
| Capital transactions: | | |
| Contributions | $ 70,467,869 | $ 98,428,362 |
| Withdrawals | (272,098,566) | (324,965,141) |
| Net decrease in net assets from capital transactions | $ (201,630,697) | $ (226,536,779) |
| Net decrease in net assets | $ (110,738,983) | $ (63,657,093) |
| Net Assets | | |
| At beginning of period | $ 1,792,136,451 | $ 1,855,793,544 |
| At end of period | $1,681,397,468 | $1,792,136,451 |
55
See Notes to Consolidated Financial Statements.
Global Macro Portfolio
April 30, 2024
Consolidated Financial Highlights
| | Six Months Ended
April 30, 2024
(Unaudited) | Year Ended October 31, |
| Ratios/Supplemental Data | 2023 | 2022 | 2021 | 2020 | 2019 |
| Ratios (as a percentage of average daily net assets): | | | | | | |
| Expenses (1) | 1.17% (2)(3) | 1.01% (3) | 0.73% (3) | 0.70% | 0.66% | 0.65% |
| Net investment income | 6.21% (2) | 6.26% | 5.49% | 4.60% | 4.53% | 5.41% |
| Portfolio Turnover | 70% (4) | 96% | 81% | 88% | 81% | 61% |
| Total Return | 5.69% (4) | 9.29% | (3.93)% | 4.52% | 4.03% | 6.56% |
| Net assets, end of period (000’s omitted) | $1,681,397 | $1,792,136 | $1,855,794 | $2,563,864 | $3,165,729 | $3,559,727 |
| (1) | Includes interest and/or dividend expense, including on securities sold short and/or reverse repurchase agreements if applicable, of 0.48%, 0.37%, 0.08%, 0.06%, 0.01% and 0.01% of average daily net assets for the six months ended April 30, 2024 and the years ended October 31, 2023, 2022, 2021, 2020 and 2019, respectively. |
| (2) | Annualized. |
| (3) | Includes a reduction by the investment adviser of a portion of its adviser fee due to the Portfolio’s investment in the Liquidity Fund (equal to 0.01%, 0.01% and less than 0.01% of average daily net assets for the six months ended April 30, 2024 and the years ended October 31, 2023 and 2022, respectively). |
| (4) | Not annualized. |
56
See Notes to Consolidated Financial Statements.
Global Macro Portfolio
April 30, 2024
Notes to Consolidated Financial Statements (Unaudited)
1 Significant Accounting Policies
Global Macro Portfolio (the Portfolio) is a Massachusetts business trust registered under the Investment Company Act of 1940, as amended (the 1940 Act), as a non-diversified, open-end management investment company. The Portfolio’s investment objective is total return. The Declaration of Trust permits the Trustees to issue interests in the Portfolio. At April 30, 2024, Eaton Vance Global Macro Absolute Return Fund held an interest of approximately 100% in the Portfolio.
The Portfolio seeks to gain exposure to the commodity markets, in whole or in part, through investments in Eaton Vance GMP Commodity Subsidiary, Ltd. (the Subsidiary), a wholly-owned subsidiary of the Portfolio organized under the laws of the Cayman Islands with the same objective and investment policies and restrictions as the Portfolio. The Portfolio may invest up to 25% of its total assets in the Subsidiary. The net assets of the Subsidiary at April 30, 2024 were $8,031,495 or 0.5% of the Portfolio’s consolidated net assets. The accompanying consolidated financial statements include the accounts of the Subsidiary. Intercompany balances and transactions have been eliminated in consolidation.
The following is a summary of significant accounting policies of the Portfolio. The policies are in conformity with accounting principles generally accepted in the United States of America (U.S. GAAP). The Portfolio is an investment company and follows accounting and reporting guidance in the Financial Accounting Standards Board (FASB) Accounting Standards Codification Topic 946.
A Investment Valuation—The following methodologies are used to determine the market value or fair value of investments.
Debt Obligations. Debt obligations are generally valued on the basis of valuations provided by third party pricing services, as derived from such services’ pricing models. Inputs to the models may include, but are not limited to, reported trades, executable bid and ask prices, broker/dealer quotations, prices or yields of securities with similar characteristics, interest rates, anticipated prepayments, benchmark curves or information pertaining to the issuer, as well as industry and economic events. The pricing services may use a matrix approach, which considers information regarding securities with similar characteristics to determine the valuation for a security. Short-term debt obligations purchased with a remaining maturity of sixty days or less for which a valuation from a third party pricing service is not readily available may be valued at amortized cost, which approximates fair value.
Senior Floating-Rate Loans. Interests in senior floating-rate loans (Senior Loans) are valued generally at the average mean of bid and ask quotations obtained from a third party pricing service.
Equity Securities. Equity securities listed on a U.S. securities exchange generally are valued at the last sale or closing price on the day of valuation or, if no sales took place on such date, at the mean between the closing bid and ask prices on the exchange where such securities are principally traded. Equity securities listed on the NASDAQ National Market System are valued at the NASDAQ official closing price. Unlisted or listed securities for which closing sales prices or closing quotations are not available are valued at the mean between the latest available bid and ask prices.
Derivatives. U.S. exchange-traded options are valued at the mean between the bid and ask prices at valuation time as reported by the Options Price Reporting Authority. Non-U.S. exchange-traded options and over-the-counter options (including options on securities, indices and foreign currencies) are valued by a third party pricing service using techniques that consider factors including the value of the underlying instrument, the volatility of the underlying instrument and the period of time until option expiration. Futures contracts are valued at the closing settlement price established by the board of trade or exchange on which they are traded, with adjustments for fair valuation for certain foreign futures contracts as described below. Forward foreign currency exchange contracts are generally valued at the mean of the average bid and average ask prices that are reported by currency dealers to a third party pricing service at the valuation time. Such third party pricing service valuations are supplied for specific settlement periods and the Portfolio’s forward foreign currency exchange contracts are valued at an interpolated rate between the closest preceding and subsequent settlement period reported by the third party pricing service. Swaps are normally valued using valuations provided by a third party pricing service. Such pricing service valuations are based on the present value of fixed and projected floating rate cash flows over the term of the swap contract, and in the case of credit default swaps, based on credit spread quotations obtained from broker/dealers and expected default recovery rates determined by the pricing service using proprietary models. In the case of total return swaps, pricing service valuations are based on the value of the underlying index or instrument and reference interest rate. Future cash flows on swaps are discounted to their present value using swap rates provided by electronic data services or by broker/dealers.
Foreign Securities, Futures Contracts and Currencies. Foreign securities, futures contracts and currencies are valued in U.S. dollars, based on foreign currency exchange rate quotations supplied by a third party pricing service. The pricing service uses a proprietary model to determine the exchange rate. Inputs to the model include reported trades and implied bid/ask spreads. The daily valuation of exchange-traded foreign securities and certain exchange-traded foreign futures contracts generally is determined as of the close of trading on the principal exchange on which such securities and contracts trade. Events occurring after the close of trading on foreign exchanges may result in adjustments to the valuation of foreign securities and certain foreign futures contracts to more accurately reflect their fair value as of the close of regular trading on the New York Stock Exchange. When valuing foreign equity securities and foreign futures contracts that meet certain criteria, the Portfolio’s Trustees have approved the use of a fair value service that values such securities and foreign futures contracts to reflect market trading that occurs after the close of the applicable foreign markets of comparable securities or other instruments that have a strong correlation to the fair-valued securities and foreign futures contracts.
Other. Investments in management investment companies (including money market funds) that do not trade on an exchange are valued at the net asset value as of the close of each business day.
Global Macro Portfolio
April 30, 2024
Notes to Consolidated Financial Statements (Unaudited) — continued
Fair Valuation. In connection with Rule 2a-5 of the 1940 Act, the Trustees have designated the Portfolio’s investment adviser as its valuation designee. Investments for which valuations or market quotations are not readily available or are deemed unreliable are valued by the investment adviser, as valuation designee, at fair value using methods that most fairly reflect the security’s “fair value”, which is the amount that the Portfolio might reasonably expect to receive for the security upon its current sale in the ordinary course. Each such determination is based on a consideration of relevant factors, which are likely to vary from one pricing context to another. These factors may include, but are not limited to, the type of security, the existence of any contractual restrictions on the security’s disposition, the price and extent of public trading in similar securities of the issuer or of comparable companies or entities, quotations or relevant information obtained from broker/dealers or other market participants, information obtained from the issuer, analysts, and/or the appropriate stock exchange (for exchange-traded securities), an analysis of the company’s or entity’s financial statements, and an evaluation of the forces that influence the issuer and the market(s) in which the security is purchased and sold.
B Investment Transactions—Investment transactions for financial statement purposes are accounted for on a trade date basis. Realized gains and losses on investments sold are determined on the basis of identified cost.
C Income—Interest income is recorded on the basis of interest accrued, adjusted for amortization of premium or accretion of discount. Inflation adjustments to the principal amount of inflation-adjusted bonds and notes are reflected as interest income. Deflation adjustments to the principal amount of an inflation-adjusted bond or note are reflected as reductions to interest income to the extent of interest income previously recorded on such bond or note. Dividend income is recorded on the ex-dividend date for dividends received in cash and/or securities. However, if the ex-dividend date has passed, certain dividends from foreign securities are recorded as the Portfolio is informed of the ex-dividend date. Withholding taxes on foreign interest, dividends and capital gains have been provided for in accordance with the Portfolio's understanding of the applicable countries’ tax rules and rates. In consideration of recent decisions rendered by European courts, the Portfolio has filed additional tax reclaims for previously withheld taxes on dividends earned in certain European Union countries. These filings are subject to various administrative and judicial proceedings within these countries. Due to the uncertainty as to the ultimate resolution of these proceedings, the likelihood of receipt of these reclaims, and the potential timing of payment, no amounts are reflected in the Portfolio’s consolidated financial statements for such outstanding reclaims.
D Federal and Other Taxes—The Portfolio has elected to be treated as a partnership for federal tax purposes. No provision is made by the Portfolio for federal or state taxes on any taxable income of the Portfolio because each investor in the Portfolio is ultimately responsible for the payment of any taxes on its share of taxable income. Since at least one of the Portfolio’s investors is a regulated investment company that invests all or substantially all of its assets in the Portfolio, the Portfolio normally must satisfy the applicable source of income and diversification requirements (under the Internal Revenue Code) in order for its investors to satisfy them. The Portfolio will allocate, at least annually among its investors, each investor’s distributive share of the Portfolio’s net investment income, net realized capital gains and losses and any other items of income, gain, loss, deduction or credit.
In addition to the requirements of the Internal Revenue Code, the Portfolio may also be subject to local taxes on the recognition of capital gains in certain countries. In determining the daily net asset value, the Portfolio estimates the accrual for such taxes, if any, based on the unrealized appreciation on certain portfolio securities and the related tax rates. Taxes attributable to unrealized appreciation are included in the change in unrealized appreciation (depreciation) on investments. Capital gains taxes on securities sold are included in net realized gain (loss) on investments.
The Subsidiary is treated as a controlled foreign corporation under the Internal Revenue Code and is not expected to be subject to U.S. federal income tax. The Portfolio is treated as a U.S. shareholder of the Subsidiary. As a result, the Portfolio is required to include in gross income for U.S. federal tax purposes all of the Subsidiary’s income, whether or not such income is distributed by the Subsidiary. If a net loss is realized by the Subsidiary, such loss is not generally available to offset the income earned by the Portfolio.
As of April 30, 2024, the Portfolio had no uncertain tax positions that would require financial statement recognition, de-recognition, or disclosure. The Portfolio files a U.S. federal income tax return annually after its fiscal year-end, which is subject to examination by the Internal Revenue Service for a period of three years from the date of filing.
E Foreign Currency Translation—Investment valuations, other assets, and liabilities initially expressed in foreign currencies are translated each business day into U.S. dollars based upon current exchange rates. Purchases and sales of foreign investment securities and income and expenses denominated in foreign currencies are translated into U.S. dollars based upon currency exchange rates in effect on the respective dates of such transactions. Recognized gains or losses on investment transactions attributable to changes in foreign currency exchange rates are recorded for financial statement purposes as net realized gains and losses on investments. That portion of unrealized gains and losses on investments that results from fluctuations in foreign currency exchange rates is not separately disclosed.
F Unfunded Loan Commitments—The Portfolio may enter into certain loan agreements all or a portion of which may be unfunded. The Portfolio is obligated to fund these commitments at the borrower's discretion. These commitments, if any, are disclosed in the accompanying Consolidated Portfolio of Investments.
G Use of Estimates—The preparation of the consolidated financial statements in conformity with U.S. GAAP requires management to make estimates and assumptions that affect the reported amounts of assets and liabilities at the date of the consolidated financial statements and the reported amounts of income and expense during the reporting period. Actual results could differ from those estimates.
Global Macro Portfolio
April 30, 2024
Notes to Consolidated Financial Statements (Unaudited) — continued
H Indemnifications—Under the Portfolio’s organizational documents, its officers and Trustees may be indemnified against certain liabilities and expenses arising out of the performance of their duties to the Portfolio. Under Massachusetts law, if certain conditions prevail, interestholders in the Portfolio could be deemed to have personal liability for the obligations of the Portfolio. However, the Portfolio’s Declaration of Trust contains an express disclaimer of liability on the part of Portfolio interestholders. Additionally, in the normal course of business, the Portfolio enters into agreements with service providers that may contain indemnification clauses. The Portfolio’s maximum exposure under these arrangements is unknown as this would involve future claims that may be made against the Portfolio that have not yet occurred.
I Futures Contracts—Upon entering into a futures contract, the Portfolio is required to deposit with the broker, either in cash or securities, an amount equal to a certain percentage of the contract amount (initial margin). Subsequent payments, known as variation margin, are made or received by the Portfolio each business day, depending on the daily fluctuations in the value of the underlying security, index or commodity, and are recorded as unrealized gains or losses by the Portfolio. Gains (losses) are realized upon the expiration or closing of the futures contracts. Should market conditions change unexpectedly, the Portfolio may not achieve the anticipated benefits of the futures contracts and may realize a loss. Futures contracts have minimal counterparty risk as they are exchange traded and the clearinghouse for the exchange is substituted as the counterparty, guaranteeing counterparty performance.
J Forward Foreign Currency Exchange Contracts—The Portfolio may enter into forward foreign currency exchange contracts for the purchase or sale of a specific foreign currency at a fixed price on a future date. The forward foreign currency exchange contracts are adjusted by the daily exchange rate of the underlying currency and any gains or losses are recorded as unrealized until such time as the contracts have been closed. While forward foreign currency exchange contracts are privately negotiated agreements between the Portfolio and a counterparty, certain contracts may be “centrally cleared”, whereby all payments made or received by the Portfolio pursuant to the contract are with a central clearing party (CCP) rather than the original counterparty. The CCP guarantees the performance of the original parties to the contract. Upon entering into centrally cleared contracts, the Portfolio is required to deposit with the CCP, either in cash or securities, an amount of initial margin determined by the CCP, which is subject to adjustment. For centrally cleared contracts, the daily change in valuation is recorded as a receivable or payable for variation margin and settled in cash with the CCP daily. Risks may arise upon entering these contracts from the potential inability of counterparties to meet the terms of their contracts and from movements in the value of a foreign currency relative to the U.S. dollar. In the case of centrally cleared contracts, counterparty risk is minimal due to protections provided by the CCP.
K Purchased Options—Upon the purchase of a call or put option, the premium paid by the Portfolio is included in the Consolidated Statement of Assets and Liabilities as an investment. The amount of the investment is subsequently marked-to-market to reflect the current market value of the option purchased, in accordance with the Portfolio’s policies on investment valuations discussed above. Premiums paid for purchasing options that expire are treated as realized losses. Premiums paid for purchasing options that are exercised or closed are added to the amounts paid or offset against the proceeds on the underlying investment transaction to determine the realized gain or loss. The risk associated with purchasing options is limited to the premium originally paid. Purchased options traded over-the-counter involve risk that the issuer or counterparty will fail to perform its contractual obligations.
L Written Options—Upon the writing of a call or a put option, the premium received by the Portfolio is included in the Consolidated Statement of Assets and Liabilities as a liability. The amount of the liability is subsequently marked-to-market to reflect the current market value of the option written, in accordance with the Portfolio’s policies on investment valuations discussed above. Premiums received from writing options that expire are treated as realized gains. Premiums received from writing options that are exercised or are closed are added to or offset against the proceeds or amount paid on the transaction to determine the realized gain or loss. The Portfolio, as a writer of an option, may have no control over whether the underlying instrument may be sold (call) or purchased (put) and, as a result, bears the market risk of an unfavorable change in the price of the instrument underlying the written option. The Portfolio may also bear the risk of not being able to enter into a closing transaction if a liquid secondary market does not exist.
M Interest Rate Swaps—Swap contracts are privately negotiated agreements between the Portfolio and a counterparty. Certain swap contracts may be centrally cleared. Pursuant to interest rate swap agreements, the Portfolio either makes floating-rate payments to the counterparty (or CCP in the case of centrally cleared swaps) based on a benchmark interest rate in exchange for fixed-rate payments or the Portfolio makes fixed-rate payments to the counterparty (or CCP in the case of a centrally cleared swap) in exchange for payments on a floating benchmark interest rate. Payments received or made, including amortization of upfront payments/receipts, if any (which are amortized over the life of the swap contract), are recorded as realized gains or losses. During the term of the outstanding swap agreement, changes in the underlying value of the swap are recorded as unrealized gains or losses. For centrally cleared swaps, the daily change in valuation is recorded as a receivable or payable for variation margin and settled in cash with the CCP daily. The value of the swap is determined by changes in the relationship between two rates of interest. The Portfolio is exposed to credit loss in the event of non-performance by the swap counterparty. In the case of centrally cleared swaps, counterparty risk is minimal due to protections provided by the CCP. Risk may also arise from movements in interest rates.
N Inflation Swaps—Pursuant to inflation swap agreements, the Portfolio either makes floating-rate payments to the counterparty (or CCP in the case of centrally cleared swaps) based on a benchmark index in exchange for fixed-rate payments or the Portfolio makes fixed-rate payments to the counterparty (or CCP in the case of centrally cleared swaps) in exchange for floating-rate payments based on the return of a benchmark index. By design, the benchmark index is an inflation index, such as the Consumer Price Index. The accounting policy for payments received or made and changes in the underlying value of the inflation swap are the same as for interest rate swaps as described above. The value of the swap is determined by changes in the relationship between
Global Macro Portfolio
April 30, 2024
Notes to Consolidated Financial Statements (Unaudited) — continued
the rate of interest and the benchmark index. The Portfolio is exposed to credit loss in the event of nonperformance by the swap counterparty. In the case of centrally cleared swaps, counterparty risk is minimal due to protections provided by the CCP. Risk may also arise from the unanticipated movements in value of interest rates or the index.
O Cross-Currency Swaps—Cross-currency swaps are interest rate swaps in which interest cash flows are exchanged between two parties based on the notional amounts of two different currencies. The notional amounts are typically determined based on the spot exchange rates at the inception of the trade. Cross-currency swaps also involve the exchange of the notional amounts at the start of the contract at the current spot rate with an agreement to re-exchange such amounts at a later date at either the same exchange rate, a specified rate or the then current spot rate. The entire principal value of a cross-currency swap is subject to the risk that the counterparty to the swap will default on its contractual delivery obligations.
P Credit Default Swaps—When the Portfolio is the buyer of a credit default swap contract, the Portfolio is entitled to receive the par (or other agreed-upon) value of a referenced debt obligation (or basket of debt obligations) from the counterparty (or CCP in the case of a centrally cleared swap) to the contract if a credit event by a third party, such as a U.S. or foreign corporate issuer or sovereign issuer, on the debt obligation occurs. In return, the Portfolio pays the counterparty a periodic stream of payments over the term of the contract provided that no credit event has occurred. If no credit event occurs, the Portfolio would have spent the stream of payments and received no proceeds from the contract. When the Portfolio is the seller of a credit default swap contract, it receives the stream of payments, but is obligated to pay to the buyer of the protection an amount up to the notional amount of the swap and in certain instances take delivery of securities of the reference entity upon the occurrence of a credit event, as defined under the terms of that particular swap agreement. Credit events are contract specific but may include bankruptcy, failure to pay, restructuring, obligation acceleration and repudiation/moratorium. If the Portfolio is a seller of protection and a credit event occurs, the maximum potential amount of future payments that the Portfolio could be required to make would be an amount equal to the notional amount of the agreement. This potential amount would be partially offset by any recovery value of the respective referenced obligation, or net amount received from the settlement of a buy protection credit default swap agreement entered into by the Portfolio for the same referenced obligation. As the seller, the Portfolio may create economic leverage to its portfolio because, in addition to its total net assets, the Portfolio is subject to investment exposure on the notional amount of the swap. The interest fee paid or received on the swap contract, which is based on a specified interest rate on a fixed notional amount, is accrued daily as a component of unrealized appreciation (depreciation) and is recorded as realized gain upon receipt or realized loss upon payment. The Portfolio also records an increase or decrease to unrealized appreciation (depreciation) in an amount equal to the daily valuation. For centrally cleared swaps, the daily change in valuation is recorded as a receivable or payable for variation margin and settled in cash with the CCP daily. All upfront payments and receipts, if any, are amortized over the life of the swap contract as realized gains or losses. Those upfront payments or receipts for non-centrally cleared swaps are recorded as other assets or other liabilities, respectively, net of amortization. For financial reporting purposes, unamortized upfront payments or receipts, if any, are netted with unrealized appreciation or depreciation on swap contracts to determine the market value of swaps as presented in Notes 6 and 10. These transactions involve certain risks, including the risk that the seller may be unable to fulfill the transaction. In the case of centrally cleared swaps, counterparty risk is minimal due to protections provided by the CCP.
Q Total Return Swaps—In a total return swap, the buyer receives a periodic return equal to the total return of a specified security, securities or index for a specified period of time. In return, the buyer pays the counterparty a fixed or variable stream of payments, typically based upon short-term interest rates, possibly plus or minus an agreed upon spread. During the term of the outstanding swap agreement, changes in the underlying value of the swap are recorded as unrealized gains and losses. Periodic payments received or made are recorded as realized gains or losses. The Portfolio is exposed to credit loss in the event of nonperformance by the swap counterparty. Risk may also arise from the unanticipated movements in value of exchange rates, interest rates, securities, or the index.
R Repurchase Agreements—A repurchase agreement is the purchase by the Portfolio of securities from a counterparty in exchange for cash that is coupled with an agreement to resell those securities to the counterparty at a specified date and price. When a repurchase agreement is entered, the Portfolio typically receives securities with a value that equals or exceeds the repurchase price, including any accrued interest earned on the agreement. The value of such securities will be marked-to-market daily, and cash or additional securities will be exchanged between the parties as needed. Except in the case of a repurchase agreement entered to settle a short sale, the value of the securities delivered to the Portfolio will be at least equal to 90% of the repurchase price during the term of the repurchase agreement. The terms of a repurchase agreement entered to settle a short sale may provide that the cash purchase price paid by the Portfolio is more than the value of purchased securities that effectively collateralize the repurchase price payable by the counterparty. In the event of insolvency of the counterparty to a repurchase agreement, recovery of the repurchase price owed to the Portfolio may be delayed. Such an insolvency also may result in a loss to the extent that the value of the purchased securities decreases during the delay or that value has otherwise not been maintained at an amount at least equal to the repurchase price.
S Reverse Repurchase Agreements—Under a reverse repurchase agreement, the Portfolio temporarily transfers possession of a portfolio security to another party, such as a bank or broker/dealer, in return for cash. At the same time, the Portfolio agrees to repurchase the security at an agreed upon time and price, which reflects an interest payment. In periods of increased demand for a security, the Portfolio may receive a payment from the counterparty for the use of the security, which is recorded as interest income. Because the Portfolio retains effective control over the transferred security, the transaction is accounted for as a secured borrowing. The Portfolio may enter into such agreements when it believes it is able to invest the cash acquired at a rate higher than the cost of the agreement, which would increase earned income. When the Portfolio enters into a reverse repurchase agreement, any fluctuations in the market value of either the securities transferred to another party or the securities in which the proceeds may be invested would affect the market value of the Portfolio’s assets. Because reverse repurchase agreements may be considered to be the practical equivalent of borrowing funds (and the counterparty
Global Macro Portfolio
April 30, 2024
Notes to Consolidated Financial Statements (Unaudited) — continued
making a loan), they constitute a form of leverage. The Portfolio segregates cash or liquid assets equal to its obligation to repurchase the security. During the term of the agreement, the Portfolio may also be obligated to pledge additional cash and/or securities in the event of a decline in the fair value of the transferred security. In the event the counterparty to a reverse repurchase agreement becomes insolvent, recovery of the security transferred by the Portfolio may be delayed or the Portfolio may incur a loss equal to the amount by which the value of the security transferred by the Portfolio exceeds the repurchase price payable by the Portfolio.
T Securities Sold Short—A short sale is a transaction in which the Portfolio sells a security it does not own in anticipation of a decline in the market value of that security. To complete such a transaction, the Portfolio must borrow the security to make delivery to the buyer with an obligation to replace such borrowed security at a later date. Until the security is replaced, the Portfolio is required to repay the lender any dividends or interest, which accrue during the period of the loan. The proceeds received from a short sale are recorded as a liability and the Portfolio records an unrealized gain or loss to the extent of the difference between the proceeds received and the value of the open short position on the day of determination. A gain, limited to the price at which the Portfolio sold the security short, or a loss, potentially unlimited as there is no upward limit on the price of a security, is recorded when the short position is terminated. Interest and dividends payable on securities sold short are recorded as an expense.
U Stripped Mortgage-Backed Securities—The Portfolio may invest in Interest Only (IO) and Principal Only (PO) securities, forms of stripped mortgage-backed securities, whereby the IO security receives all the interest and the PO security receives all the principal on a pool of mortgage assets. The yield to maturity on an IO security is extremely sensitive to the rate of principal payments (including prepayments) on the related underlying mortgage assets, and a rapid rate of principal payments may have a material adverse effect on the yield to maturity from these securities. If the underlying mortgages experience greater than anticipated prepayments of principal, the Portfolio may fail to recoup its initial investment in an IO security. The market value of IO and PO securities can be unusually volatile due to changes in interest rates.
V Interim Consolidated Financial Statements—The interim consolidated financial statements relating to April 30, 2024 and for the six months then ended have not been audited by an independent registered public accounting firm, but in the opinion of the Portfolio’s management, reflect all adjustments, consisting only of normal recurring adjustments, necessary for the fair presentation of the consolidated financial statements.
2 Investment Adviser Fee and Other Transactions with Affiliates
The investment adviser fee is earned by Boston Management and Research (BMR), an indirect, wholly-owned subsidiary of Morgan Stanley, as compensation for investment advisory services rendered to the Portfolio and the Subsidiary. The Portfolio and Subsidiary each pay BMR a fee computed at an annual rate as a percentage of its respective average daily net assets as follows and is payable monthly:
| Average Daily Net Assets | Annual Fee Rate |
| Up to $500 million | 0.615% |
| $500 million but less than $1 billion | 0.595% |
| $1 billion but less than $1.5 billion | 0.575% |
| $1.5 billion but less than $2 billion | 0.555% |
| $2 billion but less than $3 billion | 0.520% |
| $3 billion but less than $5 billion | 0.490% |
| $5 billion but less than $10 billion | 0.475% |
| $10 billion and over | 0.465% |
BMR contractually agreed to reduce its investment advisory fee rate on average daily net assets of $5 billion and over from 0.490% to the rates as stated above. This contractual reduction cannot be terminated or reduced without Trustee and shareholder approval. In determining the investment adviser fee for the Portfolio and Subsidiary, the applicable advisory fee rate is based on the average daily net assets of the Portfolio (inclusive of its interest in the Subsidiary). Such fee rate is then assessed separately on the Portfolio’s average daily net assets (exclusive of its interest in the Subsidiary) and the Subsidiary’s average daily net assets to determine the amount of the investment adviser fee. For the six months ended April 30, 2024, the Portfolio’s investment adviser fee amounted to $4,859,884 or 0.59% (annualized) of the Portfolio’s consolidated average daily net assets.
The Portfolio may invest in a money market fund, the Institutional Class of the Morgan Stanley Institutional Liquidity Funds - Government Portfolio (the “Liquidity Fund”), an open-end management investment company managed by Morgan Stanley Investment Management Inc., a wholly-owned subsidiary of Morgan Stanley. The investment adviser fee paid by the Portfolio is reduced by an amount equal to its pro rata share of the advisory and administration fees paid by the Portfolio due to its investment in the Liquidity Fund. For the six months ended April 30, 2024, the investment adviser fee paid was reduced by $80,781 relating to the Portfolio’s investment in the Liquidity Fund.
Global Macro Portfolio
April 30, 2024
Notes to Consolidated Financial Statements (Unaudited) — continued
Pursuant to an investment sub-advisory agreement, BMR has delegated a portion of the investment management of the Portfolio to Eaton Vance Advisers International Ltd. (EVAIL), an affiliate of BMR and an indirect, wholly-owned subsidiary of Morgan Stanley. BMR pays EVAIL a portion of its investment adviser fee for sub-advisory services provided to the Portfolio.
Trustees and officers of the Portfolio who are members of BMR’s organization receive remuneration for their services to the Portfolio out of the investment adviser fee. Trustees of the Portfolio who are not affiliated with the investment adviser may elect to defer receipt of all or a percentage of their annual fees in accordance with the terms of the Trustees Deferred Compensation Plan. Certain officers and Trustees of the Portfolio are officers of the above organization.
3 Purchases and Sales of Investments
Purchases and sales of investments, other than short-term obligations and including maturities, paydowns and securities sold short, for the six months ended April 30, 2024 were as follows:
| | Purchases | Sales |
| Investments (non-U.S. Government) | $ 801,832,864 | $ 599,663,893 |
| U.S. Government and Agency Securities | 20,542,387 | 141,127,420 |
| | $822,375,251 | $740,791,313 |
4 Federal Income Tax Basis of Investments
The cost and unrealized appreciation (depreciation) of investments of the Portfolio, including open derivative contracts and the Portfolio's investment in the Subsidiary at April 30, 2024, as determined on a federal income tax basis, were as follows:
| Aggregate cost | $1,838,425,753 |
| Gross unrealized appreciation | $ 71,749,639 |
| Gross unrealized depreciation | (308,685,343) |
| Net unrealized depreciation | $ (236,935,704) |
5 Restricted Securities
At April 30, 2024, the Portfolio owned the following securities (representing 0.8% of net assets) which were restricted as to public resale and not registered under the Securities Act of 1933 (excluding Rule 144A securities). The Portfolio has various registration rights (exercisable under a variety of circumstances) with respect to these securities. The value of these securities is determined based on valuations provided by brokers when available, or if not available, they are valued at fair value using methods determined in good faith by or at the direction of the Trustees’ valuation designee.
| Description | Date(s) of
Acquisition | Shares | Cost | Value |
| Reinsurance Side Cars | | | | |
| Mt. Logan Re Ltd., Series A-1 | 12/30/20 | 4,400 | $ 4,400,000 | $ 6,044,892 |
| PartnerRe ILS Fund SAC Ltd. | 1/2/24 | 5,700,000 | 5,700,000 | 5,897,220 |
| Sussex Capital Ltd., Designated Investment Series 16, 12/21 | 11/30/22 | 817 | 811,902 | 17,651 |
| Sussex Capital Ltd., Designated Investment Series 16, 11/22 | 1/24/22 | 793 | 792,084 | 224,316 |
| Sussex Capital Ltd., Series 16, Preference Shares | 6/1/21 | 1,075 | 761,374 | 1,367,535 |
| Total Restricted Securities | | | $12,465,360 | $13,551,614 |
Global Macro Portfolio
April 30, 2024
Notes to Consolidated Financial Statements (Unaudited) — continued
6 Financial Instruments
The Portfolio may trade in financial instruments with off-balance sheet risk in the normal course of its investing activities. These financial instruments may include written options, forward foreign currency exchange contracts, futures contracts and swap contracts and may involve, to a varying degree, elements of risk in excess of the amounts recognized for financial statement purposes. The notional or contractual amounts of these instruments represent the investment the Portfolio has in particular classes of financial instruments and do not necessarily represent the amounts potentially subject to risk. The measurement of the risks associated with these instruments is meaningful only when all related and offsetting transactions are considered. A summary of obligations under these financial instruments at April 30, 2024 is included in the Consolidated Portfolio of Investments. At April 30, 2024, the Portfolio had sufficient cash and/or securities to cover commitments under these contracts.
In the normal course of pursuing its investment objective, the Portfolio is subject to the following risks:
Commodity Risk: During the six months ended April 30, 2024, the Portfolio invested in commodities-linked derivative instruments, including commodity futures contracts and total return swap contracts based on commodity indices, that provide exposure to the investment returns of certain commodities. Commodities-linked derivative instruments are used to enhance total return and/or as a substitute for the purchase or sale of commodities and to manage certain investment risks.
Credit Risk: The Portfolio enters into credit default swap contracts to manage certain investment risks and/or to enhance total return or as a substitute for the purchase or sale of securities.
Equity Price Risk: The Portfolio enters into equity index futures contracts and total return swaps to enhance total return and/or to manage certain investment risks.
Foreign Exchange Risk: The Portfolio engages in forward foreign currency exchange contracts, currency options and cross-currency swaps to enhance total return, to seek to hedge against fluctuations in currency exchange rates and/or as a substitute for the purchase or sale of securities or currencies.
Interest Rate Risk: During the six months ended April 30, 2024, the Portfolio utilized various interest rate derivatives including interest rate futures contracts, interest rate swaps, inflation swaps, cross-currency swaps and option contracts to enhance total return, to seek to hedge against fluctuations in interest rates and/or to change the effective duration of its portfolio.
The Portfolio enters into over-the-counter (OTC) derivatives that may contain provisions whereby the counterparty may terminate the contract under certain conditions, including but not limited to a decline in the Portfolio’s net assets below a certain level over a certain period of time, which would trigger a payment by the Portfolio for those derivatives in a liability position. At April 30, 2024, the fair value of derivatives with credit-related contingent features in a net liability position was $15,605,929. The aggregate fair value of assets pledged as collateral by the Portfolio for such liability was $20,448,998 at April 30, 2024.
The OTC derivatives in which the Portfolio invests (except for written options as the Portfolio, not the counterparty, is obligated to perform) are subject to the risk that the counterparty to the contract fails to perform its obligations under the contract. To mitigate this risk, the Portfolio (and Subsidiary) has entered into an International Swaps and Derivatives Association, Inc. Master Agreement (“ISDA Master Agreement”) or similar agreement with substantially all its derivative counterparties. An ISDA Master Agreement is a bilateral agreement between the Portfolio and a counterparty that governs certain OTC derivatives and typically contains, among other things, set-off provisions in the event of a default and/or termination event as defined under the relevant ISDA Master Agreement. Under an ISDA Master Agreement, the Portfolio (and Subsidiary) may, under certain circumstances, offset with the counterparty certain derivative financial instruments’ payables and/or receivables with collateral held and/or posted and create one single net payment. The provisions of the ISDA Master Agreement typically permit a single net payment in the event of default including the bankruptcy or insolvency of the counterparty. However, bankruptcy or insolvency laws of a particular jurisdiction may impose restrictions on or prohibitions against the right of offset in bankruptcy or insolvency. Certain ISDA Master Agreements allow counterparties to OTC derivatives to terminate derivative contracts prior to maturity in the event the Portfolio’s net assets decline by a stated percentage or the Portfolio fails to meet the terms of its ISDA Master Agreements, which would cause the counterparty to accelerate payment by the Portfolio of any net liability owed to it.
The collateral requirements for derivatives traded under an ISDA Master Agreement are governed by a Credit Support Annex to the ISDA Master Agreement. Collateral requirements are determined at the close of business each day and are typically based on changes in market values for each transaction under an ISDA Master Agreement and netted into one amount for such agreement. Generally, the amount of collateral due from or to a counterparty is subject to a minimum transfer threshold amount before a transfer is required, which may vary by counterparty. Collateral pledged for the benefit of the Portfolio (and Subsidiary) and/or counterparty is held in segregated accounts by the Portfolio’s custodian and cannot be sold, re-pledged, assigned or otherwise used while pledged. The portion of such collateral representing cash, if any, is reflected as deposits for derivatives collateral and, in the case of cash pledged by a counterparty for the benefit of the Portfolio, a corresponding liability on the Consolidated Statement of Assets and Liabilities. Securities pledged by the Portfolio as collateral, if any, are identified as such in the Consolidated Portfolio of Investments. The carrying amount of the liability for cash collateral due to brokers at April 30, 2024 approximated its fair value. If measured at fair value, such liability would have been considered as Level 2 in the fair value hierarchy (see Note 10) at April 30, 2024. Because the Subsidiary is not registered under the 1940 Act, it may not be able to negotiate terms with its counterparties that are equivalent to those a registered portfolio may negotiate. As a result, the Subsidiary may have greater exposure to those counterparties than a registered portfolio.
Global Macro Portfolio
April 30, 2024
Notes to Consolidated Financial Statements (Unaudited) — continued
The fair value of open derivative instruments (not considered to be hedging instruments for accounting disclosure purposes) by risk exposure at April 30, 2024 was as follows:
| | Fair Value |
| Consolidated Statement of Assets and Liabilities Caption | Commodity | Credit | Equity
Price | Foreign
Exchange | Interest
Rate | Total |
| Unaffiliated investments, at value | $ — | $ — | $ — | $ 549,366 | $ — | $ 549,366 |
| Not applicable | — | 14,137,940* | 107,311* | 11,451,308* | 16,240,311* | 41,936,870 |
| Receivable for open forward foreign currency exchange contracts | — | — | — | 13,886,093 | — | 13,886,093 |
| Receivable/Payable for open swap contracts; Upfront payments/receipts on open non-centrally cleared swap contracts | 128,588 | 477,273 | 87,660 | — | 588,466 | 1,281,987 |
| Total Asset Derivatives | $128,588 | $14,615,213 | $ 194,971 | $ 25,886,767 | $ 16,828,777 | $ 57,654,316 |
| Derivatives not subject to master netting or similar agreements | $ — | $14,137,940 | $ 107,311 | $ 11,451,308 | $ 16,240,311 | $ 41,936,870 |
| Total Asset Derivatives subject to master netting or similar agreements | $128,588 | $ 477,273 | $ 87,660 | $ 14,435,459 | $ 588,466 | $ 15,717,446 |
| Written options outstanding, at value | $ — | $ — | $ — | $ (64,066) | $ — | $ (64,066) |
| Not applicable | — | (7,733,084)* | (428,866)* | (2,827,704)* | (16,166,281)* | (27,155,935) |
| Payable for open forward foreign currency exchange contracts | — | — | — | (12,932,647) | — | (12,932,647) |
| Payable/Receivable for open swap contracts; Upfront payments/receipts on open non-centrally cleared swap contracts | — | (1,617,614) | — | — | (991,602) | (2,609,216) |
| Total Liability Derivatives | $ — | $ (9,350,698) | $(428,866) | $(15,824,417) | $(17,157,883) | $(42,761,864) |
| Derivatives not subject to master netting or similar agreements | $ — | $ (7,733,084) | $(428,866) | $ (2,827,704) | $(16,166,281) | $(27,155,935) |
| Total Liability Derivatives subject to master netting or similar agreements | $ — | $ (1,617,614) | $ — | $(12,996,713) | $ (991,602) | $(15,605,929) |
| * | Only the current day’s variation margin on open futures contracts and centrally cleared derivatives is reported within the Consolidated Statement of Assets and Liabilities as Receivable or Payable for variation margin on open futures contracts and centrally cleared derivatives, as applicable. |
The Portfolio's derivative assets and liabilities at fair value by risk, which are reported gross in the Consolidated Statement of Assets and Liabilities, are presented in the table above. The following tables present the Portfolio's derivative assets and liabilities by counterparty, net of amounts available for offset under a master netting agreement and net of the related collateral received by the Portfolio (and Subsidiary) for such assets and pledged by the Portfolio (and Subsidiary) for such liabilities as of April 30, 2024.
| Counterparty | Derivative
Assets Subject to
Master Netting
Agreement | Derivatives
Available
for Offset | Non-cash
Collateral
Received(a) | Cash
Collateral
Received(a) | Net Amount
of Derivative
Assets(b) | Total Cash
Collateral
Received |
| Australia and New Zealand Banking Group Limited | $ 100,983 | $ (100,983) | $ — | $ — | $ — | $ — |
| Bank of America, N.A. | 148,943 | (148,943) | — | — | — | — |
| Barclays Bank PLC | 700,778 | (417,022) | — | (10,000) | 273,756 | 10,000 |
Global Macro Portfolio
April 30, 2024
Notes to Consolidated Financial Statements (Unaudited) — continued
| Counterparty | Derivative
Assets Subject to
Master Netting
Agreement | Derivatives
Available
for Offset | Non-cash
Collateral
Received(a) | Cash
Collateral
Received(a) | Net Amount
of Derivative
Assets(b) | Total Cash
Collateral
Received |
| BNP Paribas | $ 1,197,125 | $ (1,134,763) | $ (62,362) | $ — | $ — | $ — |
| Citibank, N.A. | 4,467,948 | (2,468,369) | — | — | 1,999,579 | — |
| Deutsche Bank AG | 105,569 | — | — | — | 105,569 | — |
| Goldman Sachs International | 1,141,771 | (1,141,771) | — | — | — | — |
| HSBC Bank USA, N.A. | 1,845,614 | (631,496) | (548,472) | — | 665,646 | — |
| ICBC Standard Bank plc | 283,600 | (283,600) | — | — | — | — |
| JPMorgan Chase Bank, N.A. | 1,345,684 | (770,191) | — | (575,493) | — | 1,100,000 |
| Nomura International PLC | 147,433 | (43,934) | — | (103,499) | — | 130,000 |
| Societe Generale | 378,980 | (378,980) | — | — | — | — |
| Standard Chartered Bank | 3,207,605 | (3,207,605) | — | — | — | — |
| State Street Bank and Trust Company | 3,985 | (3,985) | — | — | — | — |
| UBS AG | 641,428 | (641,428) | — | — | — | — |
| | $15,717,446 | $(11,373,070) | $(610,834) | $(688,992) | $3,044,550 | $1,240,000 |
| Counterparty | Derivative
Liabilities Subject to
Master Netting
Agreement | Derivatives
Available
for Offset | Non-cash
Collateral
Pledged(a) | Cash
Collateral
Pledged(a) | Net Amount
of Derivative
Liabilities(c) | Total Cash
Collateral
Pledged |
| Australia and New Zealand Banking Group Limited | $ (143,475) | $ 100,983 | $ 42,492 | $ — | $ — | $ — |
| Bank of America, N.A. | (596,164) | 148,943 | 339,154 | — | (108,067) | — |
| Barclays Bank PLC | (417,022) | 417,022 | — | — | — | — |
| BNP Paribas | (1,850,752) | 1,134,763 | 531,639 | — | (184,350) | — |
| Citibank, N.A. | (2,468,369) | 2,468,369 | — | — | — | — |
| Goldman Sachs International | (3,218,984) | 1,141,771 | 1,831,850 | — | (245,363) | — |
| HSBC Bank USA, N.A. | (631,496) | 631,496 | — | — | — | — |
| ICBC Standard Bank plc | (499,139) | 283,600 | 215,539 | — | — | — |
| JPMorgan Chase Bank, N.A. | (770,191) | 770,191 | — | — | — | — |
| Nomura International PLC | (43,934) | 43,934 | — | — | — | — |
| Societe Generale | (746,196) | 378,980 | 289,963 | — | (77,253) | — |
| Standard Chartered Bank | (3,242,222) | 3,207,605 | 34,617 | — | — | — |
| State Street Bank and Trust Company | (100,842) | 3,985 | — | — | (96,857) | — |
| UBS AG | (877,143) | 641,428 | 235,715 | — | — | — |
| | $(15,605,929) | $11,373,070 | $3,520,969 | $ — | $(711,890) | $ — |
| Total — Deposits for derivatives collateral — OTC derivatives | | | | $1,240,000 |
| (a) | In some instances, the total collateral received and/or pledged may be more than the amount shown due to overcollateralization. |
| (b) | Net amount represents the net amount due from the counterparty in the event of default. |
| (c) | Net amount represents the net amount payable to the counterparty in the event of default. |
Information with respect to reverse repurchase agreements at April 30, 2024 is included at Note 8.
Global Macro Portfolio
April 30, 2024
Notes to Consolidated Financial Statements (Unaudited) — continued
The effect of derivative instruments (not considered to be hedging instruments for accounting disclosure purposes) on the Consolidated Statement of Operations by risk exposure for the six months ended April 30, 2024 was as follows:
| Consolidated Statement of Operations Caption | Commodity | Credit | Equity
Price | Foreign
Exchange | Interest
Rate | Total |
| Net realized gain (loss): | | | | | | |
| Investment transactions | $ — | $ — | $ — | $ (496,670) | $ — | $ (496,670) |
| Written options | — | — | — | 215,859 | — | 215,859 |
| Futures contracts | (770,866) | — | (2,951,318) | — | (2,323,714) | (6,045,898) |
| Swap contracts | 1,728,991 | (13,627,029) | 454,113 | — | 2,017,696 | (9,426,229) |
| Forward foreign currency exchange contracts | — | — | — | (7,188,695) | — | (7,188,695) |
| Total | $ 958,125 | $(13,627,029) | $(2,497,205) | $(7,469,506) | $ (306,018) | $(22,941,633) |
| Change in unrealized appreciation (depreciation): | | | | | | |
| Investments | $ — | $ — | $ — | $ (1,027,605) | $ — | $ (1,027,605) |
| Written options | — | — | — | 201,275 | — | 201,275 |
| Futures contracts | 266,159 | — | (1,223,708) | — | 2,036,399 | 1,078,850 |
| Swap contracts | 108,419 | (4,149,081) | 740,220 | — | (3,614,526) | (6,914,968) |
| Forward foreign currency exchange contracts | — | — | — | 9,132,633 | — | 9,132,633 |
| Total | $ 374,578 | $ (4,149,081) | $ (483,488) | $ 8,306,303 | $(1,578,127) | $ 2,470,185 |
The average notional cost of futures contracts and average notional amounts of other derivative contracts outstanding during the six months ended April 30, 2024, which are indicative of the volume of these derivative types, were approximately as follows:
Futures
Contracts — Long | Futures
Contracts — Short | Forward
Foreign Currency
Exchange Contracts* | Swap
Contracts |
| $25,131,000 | $432,365,000 | $1,660,985,000 | $2,504,501,000 |
| * | The average notional amount for forward foreign currency exchange contracts is based on the absolute value of notional amounts of currency purchased and currency sold. |
The average principal amount of purchased and written currency options contracts outstanding during the six months ended April 30, 2024, which are indicative of the volume of these derivative types, were approximately $55,106,000 and $18,177,000, respectively.
7 Line of Credit
The Portfolio participates with other portfolios and funds managed by BMR and its affiliates in a $650 million unsecured revolving line of credit agreement with a group of banks, which is in effect through October 22, 2024. Borrowings are made by the Portfolio solely for temporary purposes related to redemptions and other short-term cash needs. Interest is charged to the Portfolio based on its borrowings at an amount above either the Secured Overnight Financing Rate (SOFR) or Federal Funds rate. In addition, a fee computed at an annual rate of 0.15% on the daily unused portion of the line of credit is allocated among the participating portfolios and funds at the end of each quarter. In connection with the renewal of the agreement in October 2023, an arrangement fee of $150,000 was incurred that was allocated to the participating portfolios and funds. Because the line of credit is not available exclusively to the Portfolio, it may be unable to borrow some or all of its requested amounts at any particular time. The Portfolio did not have any significant borrowings or allocated fees during the six months ended April 30, 2024.
8 Reverse Repurchase Agreements
There were no open reverse repurchase agreements outstanding as of April 30, 2024. For the six months ended April 30, 2024, the average borrowings under settled reverse repurchase agreements and the average annual interest rate paid were approximately $14,127,000 and 5.65%, respectively.
Global Macro Portfolio
April 30, 2024
Notes to Consolidated Financial Statements (Unaudited) — continued
9 Affiliated Investments
At April 30, 2024, the value of the Portfolio's investment in funds that may be deemed to be affiliated was $152,463,740, which represents 9.1% of the Portfolio's net assets. Transactions in such investments by the Portfolio for the six months ended April 30, 2024 were as follows:
| Name | Value,
beginning
of period | Purchases | Sales
proceeds | Net realized
gain (loss) | Change in
unrealized
appreciation
(depreciation) | Value, end
of period | Dividend
income | Shares,
end of period |
| Short-Term Investments |
| Liquidity Fund | $283,898,491 | $733,810,844 | $(865,245,595) | $ — | $ — | $152,463,740 | $2,771,783 | 152,463,740 |
10 Fair Value Measurements
Under generally accepted accounting principles for fair value measurements, a three-tier hierarchy to prioritize the assumptions, referred to as inputs, is used in valuation techniques to measure fair value. The three-tier hierarchy of inputs is summarized in the three broad levels listed below.
| • | Level 1 – quoted prices in active markets for identical investments |
| • | Level 2 – other significant observable inputs (including quoted prices for similar investments, interest rates, prepayment speeds, credit risk, etc.) |
| • | Level 3 – significant unobservable inputs (including a fund's own assumptions in determining the fair value of investments) |
In cases where the inputs used to measure fair value fall in different levels of the fair value hierarchy, the level disclosed is determined based on the lowest level input that is significant to the fair value measurement in its entirety. The inputs or methodology used for valuing securities are not necessarily an indication of the risk associated with investing in those securities.
At April 30, 2024, the hierarchy of inputs used in valuing the Portfolio's investments and open derivative instruments, which are carried at fair value, were as follows:
| Asset Description | Level 1 | Level 2 | Level 3 | Total |
| Collateralized Mortgage Obligations | $ — | $ 61,927,166 | $ — | $ 61,927,166 |
| Common Stocks | 121,746 | 77,093,261* | 257,179 | 77,472,186 |
| Convertible Bonds | — | 2,944,229 | — | 2,944,229 |
| Foreign Corporate Bonds | — | 48,205,489 | 0 | 48,205,489 |
| Loan Participation Notes | — | — | 23,223,675 | 23,223,675 |
| Reinsurance Side Cars | — | — | 19,722,271 | 19,722,271 |
| Senior Floating-Rate Loans | — | — | 285,519 | 285,519 |
| Sovereign Government Bonds | — | 820,935,263 | — | 820,935,263 |
| Sovereign Loans | — | 54,330,973 | — | 54,330,973 |
| U.S. Government Agency Mortgage-Backed Securities | — | 5,714,136 | — | 5,714,136 |
| U.S. Government Guaranteed Small Business Administration Loans | — | 3,887,563 | — | 3,887,563 |
| U.S. Treasury Obligations | — | 11,112,578 | — | 11,112,578 |
| Miscellaneous | — | — | 0 | 0 |
| Short-Term Investments: | | | | |
| Affiliated Fund | 152,463,740 | — | — | 152,463,740 |
| Repurchase Agreements | — | 34,079,785 | — | 34,079,785 |
| Sovereign Government Securities | — | 150,283,376 | — | 150,283,376 |
| U.S. Treasury Obligations | — | 126,760,264 | — | 126,760,264 |
| Purchased Currency Options | — | 549,366 | — | 549,366 |
| Total Investments | $ 152,585,486 | $ 1,397,823,449 | $ 43,488,644 | $ 1,593,897,579 |
Global Macro Portfolio
April 30, 2024
Notes to Consolidated Financial Statements (Unaudited) — continued
| Asset Description (continued) | Level 1 | Level 2 | Level 3 | Total |
| Forward Foreign Currency Exchange Contracts | $ — | $ 25,337,401 | $ — | $ 25,337,401 |
| Futures Contracts | 5,331,751 | — | — | 5,331,751 |
| Swap Contracts | — | 26,435,798 | — | 26,435,798 |
| Total | $ 157,917,237 | $ 1,449,596,648 | $ 43,488,644 | $ 1,651,002,529 |
| Liability Description | | | | |
| Securities Sold Short | $ (16,244,586) | $ (44,124,138) | $ — | $ (60,368,724) |
| Written Currency Options | — | (64,066) | — | (64,066) |
| Forward Foreign Currency Exchange Contracts | — | (15,760,351) | — | (15,760,351) |
| Futures Contracts | (357,700) | (71,166) | — | (428,866) |
| Swap Contracts | — | (26,508,581) | — | (26,508,581) |
| Total | $ (16,602,286) | $ (86,528,302) | $ — | $ (103,130,588) |
| * | Includes foreign equity securities whose values were adjusted to reflect market trading of comparable securities or other correlated instruments that occurred after the close of trading in their applicable foreign markets. |
The following is a reconciliation of Level 3 investments for which significant unobservable inputs were used to determine fair value:
| | Common
Stocks | Foreign
Corporate
Bonds | Loan
Participation
Notes | Reinsurance
Side Cars* | Senior
Floating-Rate
Loans | Miscellaneous | Total |
| Balance as of October 31, 2023 | $ 572,723 | $ 0 | $21,688,264 | $15,481,804 | $ 278,045 | $ 0 | $38,020,836 |
| Realized gains (losses) | — | — | — | 2,220,187 | 9,400 | 76,222 | 2,305,809 |
| Change in net unrealized appreciation (depreciation) | (315,544) | — | 1,338,583 | (900,728) | 469,328 | — | 591,639 |
| Cost of purchases | — | — | — | 11,400,000 | — | — | 11,400,000 |
| Proceeds from sales, including return of capital | — | — | — | (8,478,992) | (489,492) | (76,222) | (9,044,706) |
| Accrued discount (premium) | — | — | 196,828 | — | 18,238 | — | 215,066 |
| Transfers to Level 3 | — | — | — | — | — | — | — |
| Transfers from Level 3 | — | — | — | — | — | — | — |
| Balance as of April 30, 2024 | $ 257,179 | $ 0 | $23,223,675 | $19,722,271 | $ 285,519 | $ 0 | $43,488,644 |
| Change in net unrealized appreciation (depreciation) on investments still held as of April 30, 2024 | $(315,544) | $ — | $ 1,338,583 | $ (469,037) | $ 443,703 | $ — | $ 997,705 |
| * | The Portfolio’s investments in Reinsurance Side Cars were primarily valued on the basis of broker quotations. |
Global Macro Portfolio
April 30, 2024
Notes to Consolidated Financial Statements (Unaudited) — continued
The following is a summary of quantitative information about significant unobservable valuation inputs for Level 3 investments held as of April 30, 2024:
| Type of Investment | Fair Value as of
April 30, 2024 | Valuation Technique | Unobservable Input | Range of Unobservable Input | Impact to
Valuation from an
Increase to Input* |
| Common Stocks | $ 257,179 | Market Approach | Discount Rate | 30% | Decrease |
| Foreign Corporate Bonds | 0 | Estimated Recovery Value | Estimated Recovery Value Percentage | 0% | Increase |
| Loan Participation Notes | 23,223,675 | Matrix Pricing | Adjusted Credit Spread to the Central Bank of Uzbekistan Quoted Policy Rate | 4.38% - 6.67%** | Decrease |
| Miscellaneous | 0 | Estimated Value | Estimated Recovery Value Percentage | 0% | Increase |
| Senior Floating-Rate Loans | 285,519 | Market Approach | Discount Rate | 10% | Decrease |
| * | Represents the directional change in the fair value of the Level 3 investments that would result from an increase to the corresponding unobservable input. A decrease to the unobservable input would have the opposite effect. |
| ** | The weighted average of the unobservable input is 5.41% based on relative principal amounts. |
11 Risks and Uncertainties
Risks Associated with Foreign Investments
Foreign investments can be adversely affected by political, economic and market developments abroad, including the imposition of economic and other sanctions by the United States or another country, and by acts of terrorism and war. There may be less publicly available information about foreign issuers because they may not be subject to reporting practices, requirements or regulations comparable to those to which United States companies are subject. Foreign markets may be smaller, less liquid and more volatile than the major markets in the United States. Trading in foreign markets typically involves higher expense than trading in the United States. The Portfolio may have difficulties enforcing its legal or contractual rights in a foreign country. Securities that trade or are denominated in currencies other than the U.S. dollar may be adversely affected by fluctuations in currency exchange rates.
Emerging market securities often involve greater risks than developed market securities. Investment markets within emerging market countries are typically smaller, less liquid, less developed and more volatile than those in more developed markets like the United States, and may be focused in certain economic sectors. The information available about an emerging market issuer may be less reliable than for comparable issuers in more developed capital markets. Governmental actions can have a significant effect on the economic conditions in emerging market countries. It may be more difficult to make a claim or obtain a judgment in the courts of these countries than it is in the United States. The possibility of fraud, negligence, undue influence being exerted by an issuer or refusal to recognize ownership exists in some emerging markets. Disruptions due to work stoppages and trading improprieties in foreign securities markets have caused such markets to close. Emerging market securities are also subject to speculative trading, which contributes to their volatility.
Economic data as reported by sovereign entities may be delayed, inaccurate or fraudulent. In the event of a default by a sovereign entity, there are typically no assets to be seized or cash flows to be attached. Furthermore, the willingness or ability of a sovereign entity to restructure defaulted debt may be limited. Therefore, losses on sovereign defaults may far exceed the losses from the default of a similarly rated U.S. debt issuer.
Eaton Vance
Global Macro Absolute Return Fund
April 30, 2024
| Officers of Eaton Vance Global Macro Absolute Return Fund and Global Macro Portfolio |
Kenneth A. Topping
President | Nicholas S. Di Lorenzo
Secretary |
Deidre E. Walsh
Vice President and Chief Legal Officer | Laura T. Donovan
Chief Compliance Officer |
James F. Kirchner
Treasurer | |
| Trustees of Eaton Vance Global Macro Absolute Return Fund and Global Macro Portfolio | |
George J. Gorman
Chairperson | |
| Alan C. Bowser | |
| Mark R. Fetting | |
| Cynthia E. Frost | |
| Valerie A. Mosley | |
| Anchal Pachnanda* | |
| Keith Quinton | |
| Marcus L. Smith | |
| Susan J. Sutherland | |
| Scott E. Wennerholm | |
| Nancy A. Wiser | |
| U.S. Customer Privacy Notice | March 2024 |
| FACTS | WHAT DOES EATON VANCE DO WITH YOUR PERSONAL INFORMATION? |
| Why? | Financial companies choose how they share your personal information. Federal law gives consumers the right to limit some but not all sharing. Federal law also requires us to tell you how we collect, share, and protect your personal information. Please read this notice carefully to understand what we do. |
| |
| What? | The types of personal information we collect and share depend on the product or service you have with us. This information can include:■ Social Security number and income
■ investment experience and risk tolerance
■ checking account information and wire transfer instructions |
| |
| How? | All financial companies need to share customers’ personal information to run their everyday business. In the section below, we list the reasons financial companies can share their customers’ personal information; the reasons Eaton Vance chooses to share; and whether you can limit this sharing. |
| Reasons we can share your personal information | Does Eaton Vance
share? | Can you limit
this sharing? |
| For our everyday business purposes — such as to process your transactions, maintain your account(s), respond to court orders and legal investigations, or report to credit bureaus | Yes | No |
| For our marketing purposes — to offer our products and services to you | Yes | No |
| For joint marketing with other financial companies | No | We don’t share |
| For our affiliates’ everyday business purposes — information about your transactions and experiences | Yes | No* |
| For our affiliates’ everyday business purposes — information about your creditworthiness | Yes | Yes* |
| For our affiliates to market to you | Yes | Yes* |
| For nonaffiliates to market to you | No | We don’t share |
To limit our
sharing | Call toll-free 1-800-262-1122 or email: EVPrivacy@eatonvance.comPlease note:If you are a new customer, we can begin sharing your information 30 days from the date we sent this notice. When you are no longer our customer, we continue to share your information as described in this notice. However, you can contact us at any time to limit our sharing. |
| Questions? | Call toll-free 1-800-262-1122 or email: EVPrivacy@eatonvance.com |
| U.S. Customer Privacy Notice — continued | March 2024 |
| Who we are |
| Who is providing this notice? | Eaton Vance Management and our investment management affiliates (“Eaton Vance”) (see Affiliates definition below.) |
| What we do |
How does Eaton Vance
protect my personal
information? | To protect your personal information from unauthorized access and use, we use security measures that comply with federal law. These measures include computer safeguards and secured files and buildings. We have policies governing the proper handling of customer information by personnel and requiring third parties that provide support to adhere to appropriate security standards with respect to such information. |
How does Eaton Vance
collect my personal
information? | We collect your personal information, for example, when you■ open an account or make deposits or withdrawals from your account
■ buy securities from us or make a wire transfer
■ give us your contact informationWe also collect your personal information from others, such as credit bureaus, affiliates, or other companies. |
| Why can’t I limit all sharing? | Federal law gives you the right to limit only■ sharing for affiliates’ everyday business purposes — information about your creditworthiness
■ affiliates from using your information to market to you
■ sharing for nonaffiliates to market to youState laws and individual companies may give you additional rights to limit sharing. (See below for more on your rights under state law.) |
What happens when I limit
sharing for an account I hold
jointly with someone else? | Your choices will apply to everyone on your account. |
| Definitions |
| Affiliates | Companies related by common ownership or control. They can be financial and nonfinancial companies.■ Our affiliates include registered investment advisers such as Eaton Vance Management, Eaton Vance Advisers International Ltd., Boston Management and Research, Calvert Research and Management, Parametric Portfolio Associates LLC, Atlanta Capital Management Company LLC, Morgan Stanley Investment Management Inc., Morgan Stanley Investment Management Co.; registered broker-dealers such as Morgan Stanley Distributors Inc. and Eaton Vance Distributors, Inc. (together, the “Investment Management Affiliates”); and companies with a Morgan Stanley name and financial companies such as Morgan Stanley Smith Barney LLC and Morgan Stanley & Co. (the “Morgan Stanley Affiliates”). |
| Nonaffiliates | Companies not related by common ownership or control. They can be financial and nonfinancial companies.■ Eaton Vance does not share with nonaffiliates so they can market to you. |
| Joint marketing | A formal agreement between nonaffiliated financial companies that together market financial products or services to you.■ Eaton Vance does not jointly market. |
| U.S. Customer Privacy Notice — continued | March 2024 |
| Other important information |
| *PLEASE NOTE: Eaton Vance does not share your creditworthiness information or your transactions and experiences information with the Morgan Stanley Affiliates, nor does Eaton Vance enable the Morgan Stanley Affiliates to market to you. Your opt outs will prevent Eaton Vance from sharing your creditworthiness information with the Investment Management Affiliates and will prevent the Investment Management Affiliates from marketing their products to you.Vermont: Except as permitted by law, we will not share personal information we collect about Vermont residents with Nonaffiliates unless you provide us with your written consent to share such information.California: Except as permitted by law, we will not share personal information we collect about California residents with Nonaffiliates and we will limit sharing such personal information with our Affiliates to comply with California privacy laws that apply to us. |
Delivery of Shareholder Documents. The Securities and Exchange Commission (SEC) permits funds to deliver only one copy of shareholder documents, including prospectuses, proxy statements and shareholder reports, to fund investors with multiple accounts at the same residential or post office box address. This practice is often called “householding” and it helps eliminate duplicate mailings to shareholders. Eaton Vance, or your financial intermediary, may household the mailing of your documents indefinitely unless you instruct Eaton Vance, or your financial intermediary, otherwise. If you would prefer that your Eaton Vance documents not be householded, please contact Eaton Vance at 1-800-262-1122, or contact your financial intermediary. Your instructions that householding not apply to delivery of your Eaton Vance documents will typically be effective within 30 days of receipt by Eaton Vance or your financial intermediary.
Portfolio Holdings. Each Eaton Vance Fund and its underlying Portfolio(s) (if applicable) files a schedule of portfolio holdings on Part F to Form N-PORT with the SEC. Certain information filed on Form N-PORT may be viewed on the Eaton Vance website at www.eatonvance.com, by calling Eaton Vance at 1-800-262-1122 or in the EDGAR database on the SEC’s website at www.sec.gov.
Proxy Voting. From time to time, funds are required to vote proxies related to the securities held by the funds. The Eaton Vance Funds or their underlying Portfolios (if applicable) vote proxies according to a set of policies and procedures approved by the Funds’ and Portfolios’ Boards. You may obtain a description of these policies and procedures and information on how the Funds or Portfolios voted proxies relating to portfolio securities during the most recent 12-month period ended June 30, without charge, upon request, by calling 1-800-262-1122 and by accessing the SEC’s website at www.sec.gov.
Tailored Shareholder Reports. Effective January 24, 2023, the SEC adopted rule and form amendments to require open-end mutual funds and ETFs to transmit concise and visually engaging streamlined annual and semi-annual reports to shareholders that highlight key information. Other information, including financial statements, will no longer appear in a streamlined shareholder report but must be available online, delivered free of charge upon request, and filed on a semi-annual basis on Form N-CSR. The rule and form amendments have a compliance date of July 24, 2024. At this time, management is evaluating the impact of these amendments on the shareholder reports for the Eaton Vance Funds.
This Page Intentionally Left Blank
This Page Intentionally Left Blank
Investment Adviser of Global Macro Portfolio
Boston Management and Research
One Post Office Square
Boston, MA 02109
Investment Adviser and Administrator of Eaton Vance Global
Macro Absolute Return Fund
Eaton Vance Management
One Post Office Square
Boston, MA 02109
Investment Sub-Adviser
Eaton Vance Advisers International Ltd.
125 Old Broad Street
London, EC2N 1AR
United Kingdom
Principal Underwriter*
Eaton Vance Distributors, Inc.
One Post Office Square
Boston, MA 02109
(617) 482-8260
Custodian
State Street Bank and Trust Company
One Congress Street, Suite 1
Boston, MA 02114-2016
Transfer Agent
BNY Mellon Investment Servicing (US) Inc.
Attn: Eaton Vance Funds
P.O. Box 534439
Pittsburgh, PA 15253-4439
(800) 262-1122
Fund Offices
One Post Office Square
Boston, MA 02109
* FINRA BrokerCheck. Investors may check the background of their Investment Professional by contacting the Financial Industry Regulatory Authority (FINRA). FINRA BrokerCheck is a free tool to help investors check the professional background of current and former FINRA-registered securities firms and brokers. FINRA BrokerCheck is available by calling 1-800-289-9999 and at www.FINRA.org. The FINRA BrokerCheck brochure describing this program is available to investors at www.FINRA.org.
Eaton Vance
Strategic Income Fund (formerly, Eaton Vance Short Duration Strategic Income Fund)
Semi-Annual Report
April 30, 2024
Commodity Futures Trading Commission Registration. The Commodity Futures Trading Commission (“CFTC”) has adopted regulations that subject registered investment companies and advisers to regulation by the CFTC if a fund invests more than a prescribed level of its assets in certain CFTC-regulated instruments (including futures, certain options and swap agreements) or markets itself as providing investment exposure to such instruments. The investment adviser has claimed an exclusion from the definition of “commodity pool operator” under the Commodity Exchange Act with respect to its management of the Fund. Accordingly, neither the Fund nor the adviser with respect to the operation of the Fund is subject to CFTC regulation. Because of its management of other strategies, the Fund's adviser is registered with the CFTC as a commodity pool operator. The adviser is also registered as a commodity trading advisor.
Fund shares are not insured by the FDIC and are not deposits or other obligations of, or guaranteed by, any depository institution. Shares are subject to investment risks, including possible loss of principal invested.
This report must be preceded or accompanied by a current summary prospectus or prospectus. Before investing, investors should consider carefully the investment objective, risks, and charges and expenses of a mutual fund. This and other important information is contained in the summary prospectus and prospectus, which can be obtained from a financial intermediary. Prospective investors should read the prospectus carefully before investing. For further information, please call 1-800-262-1122.
Semi-Annual Report April 30, 2024
Eaton Vance
Strategic Income Fund
Eaton Vance
Strategic Income Fund
April 30, 2024
Performance
Portfolio Manager(s) Andrew Szczurowski, CFA, Justin Bourgette, CFA and Brian Shaw, CFA
| % Average Annual Total Returns1,2 | Class
Inception Date | Performance
Inception Date | Six Months | One Year | Five Years | Ten Years |
| Class A at NAV | 01/23/1998 | 11/26/1990 | 5.20% | 4.85% | 3.69% | 3.18% |
| Class A with 3.25% Maximum Sales Charge | — | — | 1.83 | 1.47 | 3.01 | 2.84 |
| Class C at NAV | 05/25/1994 | 11/26/1990 | 4.90 | 4.09 | 2.91 | 2.57 |
| Class C with 1% Maximum Deferred Sales Charge | — | — | 3.90 | 3.11 | 2.91 | 2.57 |
| Class I at NAV | 04/03/2009 | 11/26/1990 | 5.33 | 5.11 | 3.95 | 3.44 |
| Class R at NAV | 08/03/2009 | 11/26/1990 | 5.06 | 4.44 | 3.44 | 2.92 |
|
| Bloomberg U.S. Aggregate Bond Index | — | — | 4.97% | (1.47)% | (0.16)% | 1.20% |
| % Total Annual Operating Expense Ratios3 | Class A | Class C | Class I | Class R |
| | 1.20% | 1.95% | 0.95% | 1.45% |
See Endnotes and Additional Disclosures in this report.
Past performance is no guarantee of future results. Returns are historical and are calculated by determining the percentage change in net asset value (NAV) or offering price (as applicable) with all distributions reinvested. Furthermore, returns do not reflect the deduction of taxes that shareholders may have to pay on Fund distributions or upon the redemption of Fund shares. Investment return and principal value will fluctuate so that shares, when redeemed, may be worth more or less than their original cost. Performance for periods less than or equal to one year is cumulative. Performance is for the stated time period only; due to market volatility, current Fund performance may be lower or higher than the quoted return. For performance as of the most recent month-end, please refer to eatonvance.com.
Eaton Vance
Strategic Income Fund
April 30, 2024
| Allocation to Portfolios and Funds (% of net assets) |
| Asset Allocation (% of net assets)1 |
Fund primarily invests in one or more affiliated investment companies (Portfolios). Unless otherwise noted, references to investments are to the aggregate holdings of the Fund, including its pro rata share of each Portfolio in which it invests.
Footnotes:
1 Other Net Assets represents other assets less liabilities and includes any investment type that represents less than 1% of net assets.
2 Net of TBA sale commitments.
3 Net of securities sold short.
4 Net of unfunded loan commitments.
Eaton Vance
Strategic Income Fund
April 30, 2024
Endnotes and Additional Disclosures
| 1 | Bloomberg U.S. Aggregate Bond Index is an unmanaged index of domestic investment-grade bonds, including corporate, government and mortgage-backed securities. Unless otherwise stated, index returns do not reflect the effect of any applicable sales charges, commissions, expenses, taxes or leverage, as applicable. It is not possible to invest directly in an index. |
| 2 | Total Returns at NAV do not include applicable sales charges. If sales charges were deducted, the returns would be lower. Total Returns shown with maximum sales charge reflect the stated maximum sales charge. Unless otherwise stated, performance does not reflect the deduction of taxes on Fund distributions or redemptions of Fund shares.Effective November 5, 2020, Class C shares automatically convert to Class A shares eight years after purchase. The average annual total returns listed for Class C reflect conversion to Class A shares after eight years. Prior to November 5, 2020, Class C shares automatically converted to Class A shares ten years after purchase. |
| 3 | Source: Fund prospectus. The expense ratios for the current reporting period can be found in the Financial Highlights section of this report. Performance reflects expenses waived and/or reimbursed, if applicable. Without such waivers and/or reimbursements, performance would have been lower. |
| | Fund profile subject to change due to active management. |
| | Important Notice to Shareholders |
| | Effective January 16, 2024, the Fund changed its name to Eaton Vance Strategic Income Fund and amended its principal investment strategy to no longer limit its average duration under normal market conditions to 3.5 years or less. |
Eaton Vance
Strategic Income Fund
April 30, 2024
Example
As a Fund shareholder, you incur two types of costs: (1) transaction costs, including sales charges (loads) on purchases; and (2) ongoing costs, including management fees; distribution and/or service fees; and other Fund expenses. This Example is intended to help you understand your ongoing costs (in dollars) of Fund investing and to compare these costs with the ongoing costs of investing in other mutual funds. The Example is based on an investment of $1,000 invested at the beginning of the period and held for the entire period (November 1, 2023 to April 30, 2024).
Actual Expenses
The first section of the table below provides information about actual account values and actual expenses. You may use the information in this section, together with the amount you invested, to estimate the expenses that you paid over the period. Simply divide your account value by $1,000 (for example, an $8,600 account value divided by $1,000 = 8.6), then multiply the result by the number in the first section under the heading entitled “Expenses Paid During Period” to estimate the expenses you paid on your account during this period.
Hypothetical Example for Comparison Purposes
The second section of the table below provides information about hypothetical account values and hypothetical expenses based on the actual Fund expense ratio and an assumed rate of return of 5% per year (before expenses), which is not the actual Fund return. The hypothetical account values and expenses may not be used to estimate the actual ending account balance or expenses you paid for the period. You may use this information to compare the ongoing costs of investing in your Fund and other funds. To do so, compare this 5% hypothetical example with the 5% hypothetical examples that appear in the shareholder reports of the other funds.
Please note that the expenses shown in the table are meant to highlight your ongoing costs only and do not reflect any transactional costs, such as sales charges (loads). Therefore, the second section of the table is useful in comparing ongoing costs only, and will not help you determine the relative total costs of owning different funds. In addition, if these transactional costs were included, your costs would be higher.
| | Beginning
Account Value
(11/1/23) | Ending
Account Value
(4/30/24) | Expenses Paid
During Period*
(11/1/23 – 4/30/24) | Annualized
Expense
Ratio |
| Actual | | | | |
| Class A | $1,000.00 | $1,052.00 | $ 6.53 | 1.28% |
| Class C | $1,000.00 | $1,049.00 | $10.34 | 2.03% |
| Class I | $1,000.00 | $1,053.30 | $ 5.26 | 1.03% |
| Class R | $1,000.00 | $1,050.60 | $ 7.80 | 1.53% |
| |
| Hypothetical | | | | |
| (5% return per year before expenses) | | | | |
| Class A | $1,000.00 | $1,018.50 | $ 6.42 | 1.28% |
| Class C | $1,000.00 | $1,014.77 | $10.17 | 2.03% |
| Class I | $1,000.00 | $1,019.74 | $ 5.17 | 1.03% |
| Class R | $1,000.00 | $1,017.26 | $ 7.67 | 1.53% |
| * | Expenses are equal to the Fund's annualized expense ratio for the indicated Class, multiplied by the average account value over the period, multiplied by 182/366 (to reflect the one-half year period). The Example assumes that the $1,000 was invested at the net asset value per share determined at the close of business on October 31, 2023. The Example reflects the expenses of both the Fund and the Portfolios. |
Eaton Vance
Strategic Income Fund
April 30, 2024
Portfolio of Investments (Unaudited)
| Investments in Affiliated Portfolios (the Portfolios) |
| Description | | Value | % of Net
Assets |
| Emerging Markets Local Income Portfolio | | | |
| (identified cost $208,565,299) | | $ 202,807,522 | 4.0 % |
| Global Macro Absolute Return Advantage Portfolio | | | |
| (identified cost $850,533,590) | | 885,834,013 | 17.4 |
| Global Opportunities Portfolio | | | |
| (identified cost $3,649,437,581) | | 3,471,457,246 | 68.1 |
| High Income Opportunities Portfolio | | | |
| (identified cost $233,944,213) | | 230,701,181 | 4.5 |
| Senior Debt Portfolio | | | |
| (identified cost $99,759,400) | | 103,232,893 | 2.0 |
Total Investments in Affiliated Portfolios
(identified cost $5,042,240,083) | | $4,894,032,855 | 96.0% |
| Investments in Affiliated Investment Funds |
| Security | Shares | Value | % of Net
Assets |
| Fixed Income Funds | | | |
| Eaton Vance Emerging Markets Debt Opportunities Fund, Class R6 | 25,788,371 | $ 200,117,761 | 3.9 % |
Total Investments in Affiliated Investment Funds
(identified cost $213,067,299) | | $ 200,117,761 | 3.9% |
Total Investments
(identified cost $5,255,307,382) | | $5,094,150,616 | 99.9% |
| Other Assets, Less Liabilities | | $ 6,468,080 | 0.1% |
| Net Assets | | $5,100,618,696 | 100.0% |
6
See Notes to Financial Statements.
Eaton Vance
Strategic Income Fund
April 30, 2024
Statement of Assets and Liabilities (Unaudited)
| | April 30, 2024 |
| Assets | |
| Affiliated investments, at value (identified cost, $5,255,307,382) | $ 5,094,150,616 |
| Cash | 3,710 |
| Receivable for Fund shares sold | 17,090,361 |
| Trustees' deferred compensation plan | 11,220 |
| Other assets | 249,546 |
| Total assets | $5,111,505,453 |
| Liabilities | |
| Payable for Fund shares redeemed | $ 9,891,909 |
| Payable to affiliates: | |
| Distribution and service fees | 244,804 |
| Trustees' fees | 42 |
| Trustees' deferred compensation plan | 11,220 |
| Payable for transfer and dividend disbursing agent fees | 570,229 |
| Accrued expenses | 168,553 |
| Total liabilities | $ 10,886,757 |
| Net Assets | $5,100,618,696 |
| Sources of Net Assets | |
| Paid-in capital | $ 5,596,524,555 |
| Accumulated loss | (495,905,859) |
| Net Assets | $5,100,618,696 |
| Class A Shares | |
| Net Assets | $ 653,631,498 |
| Shares Outstanding | 101,407,504 |
Net Asset Value and Redemption Price Per Share
(net assets ÷ shares of beneficial interest outstanding) | $ 6.45 |
Maximum Offering Price Per Share
(100 ÷ 96.75 of net asset value per share) | $ 6.67 |
| Class C Shares | |
| Net Assets | $ 129,006,012 |
| Shares Outstanding | 21,240,399 |
Net Asset Value and Offering Price Per Share*
(net assets ÷ shares of beneficial interest outstanding) | $ 6.07 |
| Class I Shares | |
| Net Assets | $ 4,314,196,044 |
| Shares Outstanding | 670,314,909 |
Net Asset Value, Offering Price and Redemption Price Per Share
(net assets ÷ shares of beneficial interest outstanding) | $ 6.44 |
| Class R Shares | |
| Net Assets | $ 3,785,142 |
| Shares Outstanding | 586,232 |
Net Asset Value, Offering Price and Redemption Price Per Share
(net assets ÷ shares of beneficial interest outstanding) | $ 6.46 |
| On sales of $100,000 or more, the offering price of Class A shares is reduced. |
| * | Redemption price per share is equal to the net asset value less any applicable contingent deferred sales charge. |
7
See Notes to Financial Statements.
Eaton Vance
Strategic Income Fund
April 30, 2024
Statement of Operations (Unaudited)
| | Six Months Ended |
| | April 30, 2024 |
| Investment Income | |
| Dividends allocated from Portfolios (net of foreign taxes withheld of $116,226) | $ 3,943,765 |
| Dividend income from Affiliated Investment Funds | 8,151,032 |
| Interest income | 124 |
| Interest income allocated from Portfolios (net of foreign taxes withheld of $807,944) | 152,460,937 |
| Other income allocated from Portfolios | 343,160 |
| Expenses, excluding interest and dividend expense, allocated from Portfolios | (14,754,804) |
| Interest and dividend expense and fees allocated from Portfolios | (6,648,747) |
| Total investment income | $143,495,467 |
| Expenses | |
| Distribution and service fees: | |
| Class A | $ 847,659 |
| Class C | 595,976 |
| Class R | 7,980 |
| Trustees’ fees and expenses | 250 |
| Custodian fee | 34,228 |
| Transfer and dividend disbursing agent fees | 1,487,523 |
| Legal and accounting services | 131,572 |
| Printing and postage | 492,537 |
| Registration fees | 128,918 |
| Miscellaneous | 17,306 |
| Total expenses | $ 3,743,949 |
| Net investment income | $139,751,518 |
| Realized and Unrealized Gain (Loss) | |
| Net realized gain (loss) allocated from Portfolios: | |
| Investment transactions (net of foreign capital gains taxes of $1,279) | $ (21,629,712) |
| Written options | 214,880 |
| Securities sold short | (7,238,008) |
| Futures contracts | (35,394,220) |
| Swap contracts | (15,904,020) |
| Foreign currency transactions | (264,157) |
| Forward foreign currency exchange contracts | (5,714,090) |
| Non-deliverable bond forward contracts | 1,324,596 |
| Net realized loss | $ (84,604,731) |
| Change in unrealized appreciation (depreciation): | |
| Investments — Affiliated Investment Funds | $ 11,219,215 |
| Change in unrealized appreciation (depreciation) allocated from Portfolios: | |
| Investments (including net decrease in accrued foreign capital gains taxes of $17,520) | 175,088,358 |
| Written swaptions | (4,650,290) |
| Securities sold short | (1,969,262) |
| TBA sale commitments | (545,157) |
| Futures contracts | (31,356,588) |
| Swap contracts | (1,469,959) |
| Foreign currency | 534,626 |
| Forward foreign currency exchange contracts | 10,444,120 |
| Non-deliverable bond forward contracts | (96,096) |
| Net change in unrealized appreciation (depreciation) | $157,198,967 |
| Net realized and unrealized gain | $ 72,594,236 |
| Net increase in net assets from operations | $212,345,754 |
8
See Notes to Financial Statements.
Eaton Vance
Strategic Income Fund
April 30, 2024
Statements of Changes in Net Assets
| | Six Months Ended
April 30, 2024
(Unaudited) | Year Ended
October 31, 2023 |
| Increase (Decrease) in Net Assets | | |
| From operations: | | |
| Net investment income | $ 139,751,518 | $ 209,838,123 |
| Net realized loss | (84,604,731) | (120,041,027) |
| Net change in unrealized appreciation (depreciation) | 157,198,967 | 69,863,846 |
| Net increase in net assets from operations | $ 212,345,754 | $ 159,660,942 |
| Distributions to shareholders: | | |
| Class A | $ (23,927,211) | $ (37,528,959) |
| Class C | (3,788,781) | (6,105,135) |
| Class I | (141,537,339) | (166,471,817) |
| Class R | (110,928) | (134,084) |
| Total distributions to shareholders | $ (169,364,259) | $ (210,239,995) |
| Tax return of capital to shareholders: | | |
| Class A | $ — | $ (8,294,327) |
| Class C | — | (1,313,902) |
| Class I | — | (37,731,239) |
| Class R | — | (29,370) |
| Total tax return of capital to shareholders | $ — | $ (47,368,838) |
| Transactions in shares of beneficial interest: | | |
| Class A | $ (6,984,130) | $ 47,659,414 |
| Class C | 19,041,233 | (15,813,159) |
| Class I | 966,878,952 | 1,106,958,884 |
| Class R | 1,088,475 | 486,216 |
| Net increase in net assets from Fund share transactions | $ 980,024,530 | $1,139,291,355 |
| Net increase in net assets | $1,023,006,025 | $1,041,343,464 |
| Net Assets | | |
| At beginning of period | $ 4,077,612,671 | $ 3,036,269,207 |
| At end of period | $5,100,618,696 | $4,077,612,671 |
9
See Notes to Financial Statements.
Eaton Vance
Strategic Income Fund
April 30, 2024
| | Class A |
| | Six Months Ended
April 30, 2024
(Unaudited) | Year Ended October 31, |
| | 2023 | 2022 | 2021 | 2020 | 2019 |
| Net asset value — Beginning of period | $ 6.350 | $ 6.480 | $ 7.180 | $ 7.180 | $ 7.210 | $ 7.180 |
| Income (Loss) From Operations | | | | | | |
| Net investment income(1) | $ 0.192 | $ 0.377 | $ 0.302 | $ 0.298 | $ 0.234 | $ 0.337 |
| Net realized and unrealized gain (loss) | 0.138 | (0.046) | (0.662) | 0.009 (2) | 0.227 | (0.004) |
| Total income (loss) from operations | $ 0.330 | $ 0.331 | $ (0.360) | $ 0.307 | $ 0.461 | $ 0.333 |
| Less Distributions | | | | | | |
| From net investment income | $ (0.230) | $ (0.378) | $ (0.316) | $ (0.274) | $ (0.491) | $ (0.303) |
| From net realized gain | — | — | (0.001) | (0.002) | — | — |
| Tax return of capital | — | (0.083) | (0.023) | (0.031) | — | — |
| Total distributions | $ (0.230) | $ (0.461) | $ (0.340) | $ (0.307) | $ (0.491) | $ (0.303) |
| Net asset value — End of period | $ 6.450 | $ 6.350 | $ 6.480 | $ 7.180 | $ 7.180 | $ 7.210 |
| Total Return(3) | 5.20% (4) | 5.11% | (4.99)% | 4.01% | 6.83% | 4.60% |
| Ratios/Supplemental Data | | | | | | |
| Net assets, end of period (000’s omitted) | $653,631 | $650,558 | $617,011 | $697,690 | $545,014 | $539,448 |
| Ratios (as a percentage of average daily net assets):(5) | | | | | | |
| Expenses (6) | 1.28% (7)(8) | 1.20% (8) | 1.07% (8) | 1.08% | 1.11% | 1.18% |
| Net investment income | 5.87% (7) | 5.74% | 4.40% | 4.08% | 3.30% | 4.70% |
| Portfolio Turnover of the Fund(9) | 6% (4) | 14% | 22% | 14% | 18% | 11% |
| (1) | Computed using average shares outstanding. |
| (2) | The per share amount is not in accord with the net realized and unrealized gain (loss) for the period because of the timing of Fund share transactions and the amount of the per share realized and unrealized gains and losses at such time. |
| (3) | Returns are historical and are calculated by determining the percentage change in net asset value with all distributions reinvested and do not reflect the effect of sales charges. |
| (4) | Not annualized. |
| (5) | Includes the Fund’s share of the Portfolios' allocated expenses. |
| (6) | Includes interest and/or dividend expense, including on securities sold short and/or reverse repurchase agreements if applicable, of 0.29%, 0.20%, 0.06%, 0.06%, 0.04% and 0.10% of average daily net assets for the six months ended April 30, 2024 and the years ended October 31, 2023, 2022, 2021, 2020 and 2019, respectively. |
| (7) | Annualized. |
| (8) | Includes a reduction by the investment adviser of a portion of the Portfolios’ adviser fee due to the Portfolios’ investment in the Liquidity Fund (equal to 0.01%, 0.02% and less than 0.01% of average daily net assets for the six months ended April 30, 2024 and the years ended October 31, 2023 and 2022, respectively). |
| (9) | Percentage includes both the Fund's contributions to and withdrawals from the Portfolios and purchases and sales of securities held directly by the Fund, if any. |
10
See Notes to Financial Statements.
Eaton Vance
Strategic Income Fund
April 30, 2024
Financial Highlights — continued
| | Class C |
| | Six Months Ended
April 30, 2024
(Unaudited) | Year Ended October 31, |
| | 2023 | 2022 | 2021 | 2020 | 2019 |
| Net asset value — Beginning of period | $ 5.980 | $ 6.100 | $ 6.760 | $ 6.770 | $ 6.800 | $ 6.780 |
| Income (Loss) From Operations | | | | | | |
| Net investment income(1) | $ 0.157 | $ 0.309 | $ 0.235 | $ 0.230 | $ 0.172 | $ 0.269 |
| Net realized and unrealized gain (loss) | 0.127 | (0.042) | (0.623) | (0.002) | 0.221 | (0.014) |
| Total income (loss) from operations | $ 0.284 | $ 0.267 | $ (0.388) | $ 0.228 | $ 0.393 | $ 0.255 |
| Less Distributions | | | | | | |
| From net investment income | $ (0.194) | $ (0.318) | $ (0.252) | $ (0.212) | $ (0.423) | $ (0.235) |
| From net realized gain | — | — | (0.001) | (0.002) | — | — |
| Tax return of capital | — | (0.069) | (0.019) | (0.024) | — | — |
| Total distributions | $ (0.194) | $ (0.387) | $ (0.272) | $ (0.238) | $ (0.423) | $ (0.235) |
| Net asset value — End of period | $ 6.070 | $ 5.980 | $ 6.100 | $ 6.760 | $ 6.770 | $ 6.800 |
| Total Return(2) | 4.90% (3) | 4.36% | (5.85)% | 3.36% | 6.02% | 3.84% |
| Ratios/Supplemental Data | | | | | | |
| Net assets, end of period (000’s omitted) | $129,006 | $108,638 | $126,342 | $160,918 | $201,798 | $251,581 |
| Ratios (as a percentage of average daily net assets):(4) | | | | | | |
| Expenses (5) | 2.03% (6)(7) | 1.95% (7) | 1.82% (7) | 1.83% | 1.86% | 1.93% |
| Net investment income | 5.12% (6) | 4.99% | 3.63% | 3.35% | 2.57% | 3.98% |
| Portfolio Turnover of the Fund(8) | 6% (3) | 14% | 22% | 14% | 18% | 11% |
| (1) | Computed using average shares outstanding. |
| (2) | Returns are historical and are calculated by determining the percentage change in net asset value with all distributions reinvested and do not reflect the effect of sales charges. |
| (3) | Not annualized. |
| (4) | Includes the Fund’s share of the Portfolios' allocated expenses. |
| (5) | Includes interest and/or dividend expense, including on securities sold short and/or reverse repurchase agreements if applicable, of 0.29%, 0.20%, 0.06%, 0.06%, 0.04% and 0.10% of average daily net assets for the six months ended April 30, 2024 and the years ended October 31, 2023, 2022, 2021, 2020 and 2019, respectively. |
| (6) | Annualized. |
| (7) | Includes a reduction by the investment adviser of a portion of the Portfolios’ adviser fee due to the Portfolios’ investment in the Liquidity Fund (equal to 0.01%, 0.02% and less than 0.01% of average daily net assets for the six months ended April 30, 2024 and the years ended October 31, 2023 and 2022, respectively). |
| (8) | Percentage includes both the Fund's contributions to and withdrawals from the Portfolios and purchases and sales of securities held directly by the Fund, if any. |
11
See Notes to Financial Statements.
Eaton Vance
Strategic Income Fund
April 30, 2024
Financial Highlights — continued
| | Class I |
| | Six Months Ended
April 30, 2024
(Unaudited) | Year Ended October 31, |
| | 2023 | 2022 | 2021 | 2020 | 2019 |
| Net asset value — Beginning of period | $ 6.340 | $ 6.470 | $ 7.160 | $ 7.170 | $ 7.200 | $ 7.170 |
| Income (Loss) From Operations | | | | | | |
| Net investment income(1) | $ 0.199 | $ 0.393 | $ 0.320 | $ 0.313 | $ 0.252 | $ 0.354 |
| Net realized and unrealized gain (loss) | 0.139 | (0.047) | (0.653) | 0.002 (2) | 0.226 | (0.004) |
| Total income (loss) from operations | $ 0.338 | $ 0.346 | $ (0.333) | $ 0.315 | $ 0.478 | $ 0.350 |
| Less Distributions | | | | | | |
| From net investment income | $ (0.238) | $ (0.391) | $ (0.331) | $ (0.290) | $ (0.508) | $ (0.320) |
| From net realized gain | — | — | (0.001) | (0.002) | — | — |
| Tax return of capital | — | (0.085) | (0.025) | (0.033) | — | — |
| Total distributions | $ (0.238) | $ (0.476) | $ (0.357) | $ (0.325) | $ (0.508) | $ (0.320) |
| Net asset value — End of period | $ 6.440 | $ 6.340 | $ 6.470 | $ 7.160 | $ 7.170 | $ 7.200 |
| Total Return(3) | 5.33% (4) | 5.37% | (4.77)% | 4.27% | 7.10% | 4.87% |
| Ratios/Supplemental Data | | | | | | |
| Net assets, end of period (000’s omitted) | $4,314,196 | $3,315,739 | $2,290,663 | $2,075,516 | $967,716 | $919,828 |
| Ratios (as a percentage of average daily net assets):(5) | | | | | | |
| Expenses (6) | 1.03% (7)(8) | 0.95% (8) | 0.82% (8) | 0.83% | 0.84% | 0.91% |
| Net investment income | 6.12% (7) | 5.98% | 4.67% | 4.30% | 3.55% | 4.95% |
| Portfolio Turnover of the Fund(9) | 6% (4) | 14% | 22% | 14% | 18% | 11% |
| (1) | Computed using average shares outstanding. |
| (2) | The per share amount is not in accord with the net realized and unrealized gain (loss) for the period because of the timing of Fund share transactions and the amount of the per share realized and unrealized gains and losses at such time. |
| (3) | Returns are historical and are calculated by determining the percentage change in net asset value with all distributions reinvested. |
| (4) | Not annualized. |
| (5) | Includes the Fund’s share of the Portfolios' allocated expenses. |
| (6) | Includes interest and/or dividend expense, including on securities sold short and/or reverse repurchase agreements if applicable, of 0.29%, 0.20%, 0.06%, 0.06%, 0.04% and 0.10% of average daily net assets for the six months ended April 30, 2024 and the years ended October 31, 2023, 2022, 2021, 2020 and 2019, respectively. |
| (7) | Annualized. |
| (8) | Includes a reduction by the investment adviser of a portion of the Portfolios’ adviser fee due to the Portfolios’ investment in the Liquidity Fund (equal to 0.01%, 0.02% and less than 0.01% of average daily net assets for the six months ended April 30, 2024 and the years ended October 31, 2023 and 2022, respectively). |
| (9) | Percentage includes both the Fund's contributions to and withdrawals from the Portfolios and purchases and sales of securities held directly by the Fund, if any. |
12
See Notes to Financial Statements.
Eaton Vance
Strategic Income Fund
April 30, 2024
Financial Highlights — continued
| | Class R |
| | Six Months Ended
April 30, 2024
(Unaudited) | Year Ended October 31, |
| | 2023 | 2022 | 2021 | 2020 | 2019 |
| Net asset value — Beginning of period | $ 6.360 | $ 6.490 | $ 7.190 | $ 7.200 | $ 7.220 | $ 7.190 |
| Income (Loss) From Operations | | | | | | |
| Net investment income(1) | $ 0.184 | $ 0.361 | $ 0.285 | $ 0.261 | $ 0.192 | $ 0.300 |
| Net realized and unrealized gain (loss) | 0.138 | (0.046) | (0.661) | 0.018 (2) | 0.262 | 0.015 |
| Total income (loss) from operations | $ 0.322 | $ 0.315 | $(0.376) | $ 0.279 | $ 0.454 | $ 0.315 |
| Less Distributions | | | | | | |
| From net investment income | $ (0.222) | $ (0.365) | $ (0.301) | $ (0.258) | $ (0.474) | $ (0.285) |
| From net realized gain | — | — | (0.001) | (0.002) | — | — |
| Tax return of capital | — | (0.080) | (0.022) | (0.029) | — | — |
| Total distributions | $(0.222) | $(0.445) | $(0.324) | $(0.289) | $(0.474) | $(0.285) |
| Net asset value — End of period | $ 6.460 | $ 6.360 | $ 6.490 | $ 7.190 | $ 7.200 | $ 7.220 |
| Total Return(3) | 5.06% (4) | 4.85% | (5.21)% | 3.75% | 6.56% | 4.34% |
| Ratios/Supplemental Data | | | | | | |
| Net assets, end of period (000’s omitted) | $ 3,785 | $ 2,678 | $ 2,254 | $ 2,720 | $ 2,528 | $ 1,949 |
| Ratios (as a percentage of average daily net assets):(5) | | | | | | |
| Expenses (6) | 1.53% (7)(8) | 1.45% (8) | 1.32% (8) | 1.33% | 1.36% | 1.44% |
| Net investment income | 5.62% (7) | 5.48% | 4.12% | 3.57% | 2.71% | 4.18% |
| Portfolio Turnover of the Fund(9) | 6% (4) | 14% | 22% | 14% | 18% | 11% |
| (1) | Computed using average shares outstanding. |
| (2) | The per share amount is not in accord with the net realized and unrealized gain (loss) for the period because of the timing of Fund share transactions and the amount of the per share realized and unrealized gains and losses at such time. |
| (3) | Returns are historical and are calculated by determining the percentage change in net asset value with all distributions reinvested. |
| (4) | Not annualized. |
| (5) | Includes the Fund’s share of the Portfolios' allocated expenses. |
| (6) | Includes interest and/or dividend expense, including on securities sold short and/or reverse repurchase agreements if applicable, of 0.29%, 0.20%, 0.06%, 0.06%, 0.04% and 0.10% of average daily net assets for the six months ended April 30, 2024 and the years ended October 31, 2023, 2022, 2021, 2020 and 2019, respectively. |
| (7) | Annualized. |
| (8) | Includes a reduction by the investment adviser of a portion of the Portfolios’ adviser fee due to the Portfolios’ investment in the Liquidity Fund (equal to 0.01%, 0.02% and less than 0.01% of average daily net assets for the six months ended April 30, 2024 and the years ended October 31, 2023 and 2022, respectively). |
| (9) | Percentage includes both the Fund's contributions to and withdrawals from the Portfolios and purchases and sales of securities held directly by the Fund, if any. |
13
See Notes to Financial Statements.
Eaton Vance
Strategic Income Fund
April 30, 2024
Notes to Financial Statements (Unaudited)
1 Significant Accounting Policies
Eaton Vance Strategic Income Fund (the Fund) (formerly, Eaton Vance Short Duration Strategic Income Fund) is a diversified series of Eaton Vance Mutual Funds Trust (the Trust). The Trust is a Massachusetts business trust registered under the Investment Company Act of 1940, as amended (the 1940 Act), as an open-end management investment company. The Fund offers four classes of shares. Class A shares are generally sold subject to a sales charge imposed at time of purchase. Class C shares are sold at net asset value and are generally subject to a contingent deferred sales charge (see Note 6). Effective November 5, 2020, Class C shares automatically convert to Class A shares eight years after their purchase as described in the Fund's prospectus. Class I and Class R shares are sold at net asset value and are not subject to a sales charge. Each class represents a pro rata interest in the Fund, but votes separately on class-specific matters and (as noted below) is subject to different expenses. Realized and unrealized gains and losses and net investment income and losses, other than class-specific expenses, are allocated daily to each class of shares based on the relative net assets of each class to the total net assets of the Fund. Each class of shares differs in its distribution plan and certain other class-specific expenses. The Fund’s investment objective is total return. The Fund currently pursues its objective by investing in interests in five portfolios (the Portfolios) managed by an affiliate of Eaton Vance Management (EVM), which are Massachusetts business trusts, and in shares of Eaton Vance Emerging Markets Debt Opportunities Fund, a series of Eaton Vance Series Fund, Inc., a Maryland corporation (the Affiliated Investment Fund). The value of the Fund’s investments in the Portfolios reflects the Fund’s proportionate interest in each Portfolio's net assets. The Portfolios and the Fund’s proportionate interest in each of their net assets at April 30, 2024 were as follows: Emerging Markets Local Income Portfolio (16.5%), Global Macro Absolute Return Advantage Portfolio (31.5%), Global Opportunities Portfolio (98.8%), High Income Opportunities Portfolio (17.1%) and Senior Debt Portfolio (1.7%). The performance of the Fund is directly affected by the performance of the Portfolios and the Affiliated Investment Fund. The financial statements of Global Opportunities Portfolio, including the portfolio of investments, are included elsewhere in this report and should be read in conjunction with the Fund’s financial statements. A copy of each other Portfolio’s financial statements and the Affiliated Investment Fund’s financial statements are available by calling Eaton Vance at 1-800-262-1122 or in the EDGAR database on the Securities and Exchange Commission’s website at www.sec.gov.
The following is a summary of significant accounting policies of the Fund. The policies are in conformity with accounting principles generally accepted in the United States of America (U.S. GAAP). The Fund is an investment company and follows accounting and reporting guidance in the Financial Accounting Standards Board (FASB) Accounting Standards Codification Topic 946.
A Investment Valuation— Valuation of securities by Global Opportunities Portfolio is discussed in Note 1A of such Portfolio’s Notes to Consolidated Financial Statements, which are included elsewhere in this report. Such policies are consistent with those of the other Portfolios in which the Fund invests.
Additional valuation policies for the other Portfolios are as follows:
Derivatives. U.S. exchange-traded options are valued at the mean between the bid and ask prices at valuation time as reported by the Options Price Reporting Authority. Non-U.S. exchange-traded options and over-the-counter options (including options on securities, indices and foreign currencies) are valued by a third party pricing service using techniques that consider factors including the value of the underlying instrument, the volatility of the underlying instrument and the period of time until option expiration. Total return swaps are valued using valuations provided by a third party pricing service based on the value of the underlying index or instrument and reference interest rate.
The Fund’s investment in the Affiliated Investment Fund is valued at the closing net asset value per share.
B Income—The Fund’s net investment income or loss includes the Fund’s pro rata share of the net investment income or loss of the Portfolios, less all actual and accrued expenses of the Fund. Dividend income on investments in the Affiliated Investment Fund is recorded on the ex-dividend date for dividends received in cash and/or securities. Distributions from the Affiliated Investment Fund are recorded as dividend income, capital gains or return of capital based on the nature of the distribution.
C Federal and Other Taxes—The Fund’s policy is to comply with the provisions of the Internal Revenue Code applicable to regulated investment companies and to distribute to shareholders each year substantially all of its net investment income, and all or substantially all of its net realized capital gains. Accordingly, no provision for federal income or excise tax is necessary.
In addition to the requirements of the Internal Revenue Code, the Fund may also be required to recognize its pro rata share of the capital gains taxes incurred by the Portfolios. In doing so, the daily net asset value would reflect the Fund’s pro rata share of the estimated reserve for such taxes incurred by the Portfolios.
As of April 30, 2024, the Fund had no uncertain tax positions that would require financial statement recognition, de-recognition, or disclosure. The Fund files a U.S. federal income tax return annually after its fiscal year-end, which is subject to examination by the Internal Revenue Service for a period of three years from the date of filing.
D Expenses—The majority of expenses of the Trust are directly identifiable to an individual fund. Expenses which are not readily identifiable to a specific fund are allocated taking into consideration, among other things, the nature and type of expense and the relative size of the funds.
E Use of Estimates—The preparation of the financial statements in conformity with U.S. GAAP requires management to make estimates and assumptions that affect the reported amounts of assets and liabilities at the date of the financial statements and the reported amounts of income and expense during the reporting period. Actual results could differ from those estimates.
Eaton Vance
Strategic Income Fund
April 30, 2024
Notes to Financial Statements (Unaudited) — continued
F Indemnifications—Under the Trust’s organizational documents, its officers and Trustees may be indemnified against certain liabilities and expenses arising out of the performance of their duties to the Fund. Under Massachusetts law, if certain conditions prevail, shareholders of a Massachusetts business trust (such as the Trust) could be deemed to have personal liability for the obligations of the Trust. However, the Trust’s Declaration of Trust contains an express disclaimer of liability on the part of Fund shareholders and the By-laws provide that the Trust shall assume, upon request by the shareholder, the defense on behalf of any Fund shareholders. Moreover, the By-laws also provide for indemnification out of Fund property of any shareholder held personally liable solely by reason of being or having been a shareholder for all loss or expense arising from such liability. Additionally, in the normal course of business, the Fund enters into agreements with service providers that may contain indemnification clauses. The Fund’s maximum exposure under these arrangements is unknown as this would involve future claims that may be made against the Fund that have not yet occurred.
G Other—Investment transactions are accounted for on a trade date basis. Realized gains and losses on investments sold are determined on the basis of identified cost.
H Interim Financial Statements—The interim financial statements relating to April 30, 2024 and for the six months then ended have not been audited by an independent registered public accounting firm, but in the opinion of the Fund’s management, reflect all adjustments, consisting only of normal recurring adjustments, necessary for the fair presentation of the financial statements.
2 Distributions to Shareholders and Income Tax Information
The Fund expects to pay any required income distributions monthly and intends to distribute annually all or substantially all of its net realized capital gains. The Fund may include in its distributions amounts attributable to the imputed interest on foreign currency exposures and certain other derivative positions which, in certain circumstances, may result in a return of capital for federal income tax purposes. Distributions to shareholders are recorded on the ex-dividend date. Distributions are declared separately for each class of shares. Shareholders may reinvest income and capital gain distributions in additional shares of the same class of the Fund at the net asset value as of the ex-dividend date or, at the election of the shareholder, receive distributions in cash. Distributions to shareholders are determined in accordance with income tax regulations, which may differ from U.S. GAAP. As required by U.S. GAAP, only distributions in excess of tax basis earnings and profits are reported in the financial statements as a return of capital. Permanent differences between book and tax accounting relating to distributions are reclassified to paid-in capital. For tax purposes, distributions from short-term capital gains are considered to be from ordinary income. For the six months ended April 30, 2024, management estimates that a portion of distributions for the period will be a tax return of capital. The final determination of tax characteristics of the Fund’s distributions will occur at the end of the year and will be reported to the shareholders.
At October 31, 2023, the Fund, for federal income tax purposes, had deferred capital losses of $143,836,476 which would reduce its taxable income arising from future net realized gains on investment transactions, if any, to the extent permitted by the Internal Revenue Code, and thus would reduce the amount of distributions to shareholders, which would otherwise be necessary to relieve the Fund of any liability for federal income or excise tax. The deferred capital losses are treated as arising on the first day of the Fund’s next taxable year and retain the same short-term or long-term character as when originally deferred. Of the deferred capital losses at October 31, 2023, $45,826,179 are short-term and $98,010,297 are long-term. Utilization of these deferred capital losses may be limited in accordance with certain income tax regulations.
The cost and unrealized appreciation (depreciation) of investments of the Fund, including the Portfolios, at April 30, 2024, as determined on a federal income tax basis, were as follows:
| Aggregate cost | $5,338,461,569 |
| Gross unrealized appreciation | $ 37,456,475 |
| Gross unrealized depreciation | (281,767,428) |
| Net unrealized depreciation | $ (244,310,953) |
Eaton Vance
Strategic Income Fund
April 30, 2024
Notes to Financial Statements (Unaudited) — continued
3 Investment Adviser Fee and Other Transactions with Affiliates
The investment adviser fee is earned by EVM, an indirect, wholly-owned subsidiary of Morgan Stanley, as compensation for investment advisory services rendered to the Fund. The investment adviser fee is computed at an annual rate as a percentage of the Fund’s average daily net assets that are not invested in other investment companies for which EVM or its affiliates serve as investment adviser or administrator as follows and is payable monthly:
| Average Daily Net Assets | Annual Fee Rate |
| Up to $500 million | 0.615% |
| $500 million but less than $1 billion | 0.595% |
| $1 billion but less than $1.5 billion | 0.575% |
| $1.5 billion but less than $2 billion | 0.555% |
| $2 billion but less than $3 billion | 0.520% |
| $3 billion and over | 0.490% |
For the six months ended April 30, 2024, the Fund incurred no investment adviser fee on such assets. To the extent the Fund’s assets are invested in the Portfolios, the Fund is allocated its share of the Portfolios’ investment adviser fees. The Portfolios have engaged Boston Management and Research (BMR), to render investment advisory services. For the six months ended April 30, 2024, the Fund’s allocated portion of the investment adviser fees paid by the Portfolios totaled $13,816,764 or 0.60% (annualized) of the Fund’s average daily net assets. EVM also serves as the administrator of the Fund, but receives no compensation.
The Portfolios may invest in a money market fund, the Institutional Class of the Morgan Stanley Institutional Liquidity Funds - Government Portfolio (the Liquidity Fund), an open-end management investment company managed by Morgan Stanley Investment Management Inc., a wholly-owned subsidiary of Morgan Stanley. The investment adviser fee paid by the Portfolios is reduced by an amount equal to their pro rata share of the advisory and administration fees paid by the Portfolios due to their investments in the Liquidity Fund. For the six months ended April 30, 2024, the Fund’s allocated share of the reduction of the investment adviser fee paid by the Portfolios was $248,976 relating to the Portfolios’ investments in the Liquidity Fund.
EVM provides sub-transfer agency and related services to the Fund pursuant to a Sub-Transfer Agency Support Services Agreement. For the six months ended April 30, 2024, EVM earned $69,411 from the Fund pursuant to such agreement, which is included in transfer and dividend disbursing agent fees on the Statement of Operations. The Fund was informed that Eaton Vance Distributors, Inc. (EVD), an affiliate of EVM and the Fund’s principal underwriter, received $43,188 as its portion of the sales charge on sales of Class A shares for the six months ended April 30, 2024. The Fund was informed that Morgan Stanley affiliated broker-dealers, which may be deemed to be affiliates of EVM, BMR and EVD, also received a portion of the sales charge on sales of Class A shares for the six months ended April 30, 2024 in the amount of $16,080. EVD also received distribution and service fees from Class A, Class C and Class R shares (see Note 5) and contingent deferred sales charges (see Note 6).
Trustees and officers of the Fund and the Portfolios who are members of EVM’s or BMR’s organizations receive remuneration for their services to the Fund out of the investment adviser fee. Certain officers and Trustees of the Fund and the Portfolios are officers of the above organizations.
4 Purchases and Sales of Investments
Purchases and sales of investments, other than short-term obligations and investments in the Portfolios, aggregated $34,789,032 and $0, respectively, for the six months ended April 30, 2024.
5 Distribution Plans
The Fund has in effect a distribution plan for Class A shares (Class A Plan) pursuant to Rule 12b-1 under the 1940 Act. Pursuant to the Class A Plan, the Fund pays EVD a distribution and service fee of 0.25% per annum of its average daily net assets attributable to Class A shares for distribution services and facilities provided to the Fund by EVD, as well as for personal services and/or the maintenance of shareholder accounts. Distribution and service fees paid or accrued to EVD for the six months ended April 30, 2024 amounted to $847,659 for Class A shares.
The Fund also has in effect distribution plans for Class C shares (Class C Plan) and Class R shares (Class R Plan) pursuant to Rule 12b-1 under the 1940 Act. Pursuant to the Class C Plan, the Fund pays EVD amounts equal to 0.75% per annum of its average daily net assets attributable to Class C shares for providing ongoing distribution services and facilities to the Fund. For the six months ended April 30, 2024, the Fund paid or accrued to EVD $446,982 for Class C shares.
The Class R Plan requires the Fund to pay EVD an amount up to 0.50% per annum of its average daily net assets attributable to Class R shares for providing ongoing distribution services and facilities to the Fund. The Trustees of the Trust have currently limited Class R distribution payments to 0.25% per annum of the average daily net assets attributable to Class R shares. For the six months ended April 30, 2024, the Fund paid or accrued to EVD $3,990 for Class R shares.
Eaton Vance
Strategic Income Fund
April 30, 2024
Notes to Financial Statements (Unaudited) — continued
Pursuant to the Class C and Class R Plans, the Fund also makes payments of service fees to EVD, financial intermediaries and other persons in amounts equal to 0.25% per annum of its average daily net assets attributable to that class. Service fees paid or accrued are for personal services and/or the maintenance of shareholder accounts. They are separate and distinct from the sales commissions and distribution fees payable to EVD. Service fees paid or accrued for the six months ended April 30, 2024 amounted to $148,994 and $3,990 for Class C and Class R shares, respectively.
Distribution and service fees are subject to the limitations contained in the Financial Industry Regulatory Authority Rule 2341(d).
6 Contingent Deferred Sales Charges
A contingent deferred sales charge (CDSC) of 1% generally is imposed on redemptions of Class C shares made within 12 months of purchase. Class A shares may be subject to a 0.75% CDSC if redeemed within 12 months of purchase (depending on the circumstances of purchase). Generally, the CDSC is based upon the lower of the net asset value at date of redemption or date of purchase. No charge is levied on shares acquired by reinvestment of dividends or capital gain distributions. For the six months ended April 30, 2024, the Fund was informed that EVD received $11,305 and $15,517 of CDSCs paid by Class A and Class C shareholders, respectively.
7 Investment Transactions
For the six months ended April 30, 2024, increases and decreases in the Fund's investments in the Portfolios were as follows:
| Portfolio | Contributions | Withdrawals |
| Emerging Markets Local Income Portfolio | $ 86,266,202 | $ (3,059,857) |
| Global Macro Absolute Return Advantage Portfolio | 179,004,841 | (5,547,537) |
| Global Opportunities Portfolio | 652,751,179 | (249,349,060) |
| High Income Opportunities Portfolio | 123,883,136 | (1,573,374) |
| Senior Debt Portfolio | 10,266,805 | (18,931,842) |
8 Shares of Beneficial Interest
The Fund’s Declaration of Trust permits the Trustees to issue an unlimited number of full and fractional shares of beneficial interest (without par value). Such shares may be issued in a number of different series (such as the Fund) and classes. Transactions in Fund shares, including direct exchanges pursuant to share class conversions, were as follows:
| | Six Months Ended
April 30, 2024
(Unaudited) | | Year Ended
October 31, 2023 |
| | Shares | Amount | | Shares | Amount |
| Class A | | | | | |
| Sales | 12,577,758 | $ 82,278,354 | | 35,980,990 | $ 237,067,338 |
| Issued to shareholders electing to receive payments of distributions in Fund shares | 3,415,917 | 22,391,252 | | 6,513,602 | 42,668,531 |
| Redemptions | (17,052,739) | (111,653,736) | | (35,298,867) | (232,076,455) |
| Net increase (decrease) | (1,059,064) | $ (6,984,130) | | 7,195,725 | $ 47,659,414 |
| Class C | | | | | |
| Sales | 5,292,762 | $ 32,708,134 | | 6,171,903 | $ 38,197,100 |
| Issued to shareholders electing to receive payments of distributions in Fund shares | 574,466 | 3,548,398 | | 1,153,290 | 7,122,726 |
| Redemptions | (2,786,843) | (17,215,299) | | (9,870,547) | (61,132,985) |
| Net increase (decrease) | 3,080,385 | $ 19,041,233 | | (2,545,354) | $ (15,813,159) |
Eaton Vance
Strategic Income Fund
April 30, 2024
Notes to Financial Statements (Unaudited) — continued
| | Six Months Ended
April 30, 2024
(Unaudited) | | Year Ended
October 31, 2023 |
| | Shares | Amount | | Shares | Amount |
| Class I | | | | | |
| Sales | 249,390,605 | $ 1,635,366,131 | | 318,604,510 | $ 2,091,777,974 |
| Issued to shareholders electing to receive payments of distributions in Fund shares | 20,332,444 | 133,035,152 | | 29,362,563 | 191,869,761 |
| Redemptions | (122,437,310) | (801,522,331) | | (179,166,371) | (1,176,688,851) |
| Net increase | 147,285,739 | $ 966,878,952 | | 168,800,702 | $ 1,106,958,884 |
| Class R | | | | | |
| Sales | 175,595 | $ 1,158,263 | | 262,726 | $ 1,745,077 |
| Issued to shareholders electing to receive payments of distributions in Fund shares | 16,444 | 107,941 | | 24,062 | 157,798 |
| Redemptions | (26,917) | (177,729) | | (213,108) | (1,416,659) |
| Net increase | 165,122 | $ 1,088,475 | | 73,680 | $ 486,216 |
9 Affiliated Investments
At April 30, 2024, the value of the Fund's investment in affiliated funds was $200,117,761, which represents 3.9% of the Fund's net assets. Transactions in such investments by the Fund for the six months ended April 30, 2024 were as follows:
| Name | Value,
beginning
of period | Purchases | Sales
proceeds | Net realized
gain (loss) | Change in
unrealized
appreciation
(depreciation) | Value, end
of period | Dividend
income | Shares,
end of period |
| Eaton Vance Emerging Markets Debt Opportunities Fund, Class R6 | $154,109,514 | $34,789,032 | $ — | $ — | $11,219,215 | $200,117,761 | $8,151,032 | 25,788,371 |
10 Fair Value Measurements
Under generally accepted accounting principles for fair value measurements, a three-tier hierarchy to prioritize the assumptions, referred to as inputs, is used in valuation techniques to measure fair value. The three-tier hierarchy of inputs is summarized in the three broad levels listed below.
| • | Level 1 – quoted prices in active markets for identical investments |
| • | Level 2 – other significant observable inputs (including quoted prices for similar investments, interest rates, prepayment speeds, credit risk, etc.) |
| • | Level 3 – significant unobservable inputs (including a fund's own assumptions in determining the fair value of investments) |
In cases where the inputs used to measure fair value fall in different levels of the fair value hierarchy, the level disclosed is determined based on the lowest level input that is significant to the fair value measurement in its entirety. The inputs or methodology used for valuing securities are not necessarily an indication of the risk associated with investing in those securities.
Eaton Vance
Strategic Income Fund
April 30, 2024
Notes to Financial Statements (Unaudited) — continued
At April 30, 2024, the hierarchy of inputs used in valuing the Fund's investments in securities and investments in the Portfolios, which are carried at fair value, were as follows:
| Asset Description | Level 1 | Level 2 | Level 3 | Total |
| Investments in Portfolios | $ 4,894,032,855 | $ — | $ — | $ 4,894,032,855 |
| Investments in Affiliated Investment Funds | 200,117,761 | — | — | 200,117,761 |
| Total Investments | $5,094,150,616 | $ — | $ — | $5,094,150,616 |
11 Name Change
Effective January 16, 2024, the Fund changed its name from Eaton Vance Short Duration Strategic Income Fund and amended its principal investment strategy to no longer limit its average duration under normal market conditions to 3.5 years or less.
Eaton Vance
Strategic Income Fund
April 30, 2024
| Officers |
Kenneth A. Topping
President | Nicholas S. Di Lorenzo
Secretary |
Deidre E. Walsh
Vice President and Chief Legal Officer | Laura T. Donovan
Chief Compliance Officer |
James F. Kirchner
Treasurer | |
George J. Gorman
Chairperson | |
| Alan C. Bowser | |
| Mark R. Fetting | |
| Cynthia E. Frost | |
| Valerie A. Mosley | |
| Anchal Pachnanda* | |
| Keith Quinton | |
| Marcus L. Smith | |
| Susan J. Sutherland | |
| Scott E. Wennerholm | |
| Nancy A. Wiser | |
Global Opportunities Portfolio
April 30, 2024
Consolidated Portfolio of Investments (Unaudited)
| Asset-Backed Securities — 11.5% |
| Security | Principal
Amount
(000's omitted) | Value |
| ACHM Mortgage Trust, Series 2024-HE1, Class B, 7.26%, 5/25/39(1)(2) | $ | 1,000 | $ 999,822 |
| ACHV ABS Trust, Series 2023-1PL, Class B, 6.80%, 3/18/30(1) | | 1,022 | 1,023,510 |
| Alinea CLO Ltd., Series 2018-1A, Class E, 11.586%, (3 mo. SOFR + 6.262%), 7/20/31(1)(3) | | 2,000 | 1,977,970 |
| Allegany Park CLO Ltd., Series 2019-1A, Class ER, 11.725%, (3 mo. SOFR + 6.40%), 1/20/35(1)(3) | | 1,000 | 987,505 |
| AMMC CLO XII Ltd., Series 2013-12A, Class ER, 11.743%, (3 mo. SOFR + 6.442%), 11/10/30(1)(3) | | 2,000 | 1,952,704 |
| AMSR Trust, Series 2021-SFR1, Class G, 4.612%, 6/17/38(1) | | 2,250 | 1,911,089 |
| ARES LVIII CLO Ltd., Series 2020-58A, Class ER, 12.029%, (3 mo. SOFR + 6.70%), 1/15/35(1)(3) | | 2,000 | 1,998,180 |
| ARES XXXIIR CLO Ltd., Series 2014-32RA, Class D, 11.419%, (3 mo. SOFR + 6.112%), 5/15/30(1)(3) | | 4,000 | 3,825,720 |
| ARES XXXVR CLO Ltd., Series 2015-35RA, Class E, 11.29%, (3 mo. SOFR + 5.962%), 7/15/30(1)(3) | | 3,000 | 2,966,394 |
| Atlas Senior Loan Fund XX Ltd., Series 2022-20A, Class B1, 8.477%, (3 mo. SOFR + 3.15%), 10/19/35(1)(3) | | 6,000 | 6,049,176 |
| Bain Capital Credit CLO Ltd., Series 2018-1A, Class E, 10.938%, (3 mo. SOFR + 5.612%), 4/23/31(1)(3) | | 3,500 | 3,267,058 |
| Barings CLO Ltd., Series 2018-1A, Class D, 11.09%, (3 mo. SOFR + 5.762%), 4/15/31(1)(3) | | 5,000 | 4,738,725 |
| Battalion CLO 18 Ltd., Series 2024-25A, Class D, 9.622%, (3 mo. SOFR + 4.35%), 3/13/37(1)(3) | | 5,000 | 5,006,415 |
| Battalion CLO XXII Ltd., Series 2021-22A, Class D, 8.936%, (3 mo. SOFR + 3.612%), 1/20/35(1)(3) | | 2,000 | 1,891,098 |
| Benefit Street Partners CLO VIII Ltd., Series 2015-8A, Class DR, 11.186%, (3 mo. SOFR + 5.862%), 1/20/31(1)(3) | | 5,000 | 4,948,570 |
| Benefit Street Partners CLO XIV Ltd., Series 2018-14A, Class E, 10.936%, (3 mo. SOFR + 5.612%), 4/20/31(1)(3) | | 3,000 | 2,957,706 |
| Benefit Street Partners CLO XVI Ltd.: | | | |
| Series 2018-16A, Class DR, 8.579%, (3 mo. SOFR + 3.262%), 1/17/32(1)(3) | | 2,000 | 2,002,064 |
| Series 2018-16A, Class E, 12.279%, (3 mo. SOFR + 6.962%), 1/17/32(1)(3) | | 2,000 | 2,008,770 |
| Security | Principal
Amount
(000's omitted) | Value |
| Benefit Street Partners CLO XXII Ltd.: | | | |
| Series 2020-22A, Class DR, 8.675%, (3 mo. SOFR + 3.35%), 4/20/35(1)(3) | $ | 2,000 | $ 2,002,694 |
| Series 2020-22A, Class ER, 12.255%, (3 mo. SOFR + 6.93%), 4/20/35(1)(3) | | 2,000 | 2,006,200 |
| Benefit Street Partners CLO XXV Ltd., Series 2021-25A, Class E, 12.44%, (3 mo. SOFR + 7.112%), 1/15/35(1)(3) | | 1,000 | 1,002,888 |
| Betony CLO 2 Ltd., Series 2018-1A, Class D, 11.241%, (3 mo. SOFR + 5.912%), 4/30/31(1)(3) | | 3,000 | 2,969,433 |
| BlueMountain CLO Ltd.: | | | |
| Series 2015-3A, Class A1R, 6.586%, (3 mo. SOFR + 1.262%), 4/20/31(1)(3) | | 2,748 | 2,750,916 |
| Series 2015-3A, Class DR, 10.986%, (3 mo. SOFR + 5.662%), 4/20/31(1)(3) | | 2,000 | 1,849,742 |
| Series 2016-3A, Class ER, 11.519%, (3 mo. SOFR + 6.212%), 11/15/30(1)(3) | | 1,000 | 960,836 |
| BlueMountain CLO XXVI Ltd., Series 2019-26A, Class D1R, 9.086%, (3 mo. SOFR + 3.762%), 10/20/34(1)(3) | | 3,500 | 3,504,823 |
| BlueMountain CLO XXX Ltd., Series 2020-30A, Class ER, 12.029%, (3 mo. SOFR + 6.70%), 4/15/35(1)(3) | | 2,000 | 1,955,000 |
| BlueMountain CLO XXXIV Ltd., Series 2022-34A, Class E, 12.875%, (3 mo. SOFR + 7.55%), 4/20/35(1)(3) | | 1,000 | 988,008 |
| BlueMountain CLO XXXV Ltd., Series 2022-35A, Class E, 13.075%, (3 mo. SOFR + 7.75%), 7/22/35(1)(3) | | 2,000 | 1,978,702 |
| Bridge Trust, Series 2022-SFR1, Class E2, 6.30%, 11/17/37(1) | | 14,428 | 13,789,148 |
| Brookhaven Park CLO Ltd., Series 2024-1A, Class D, 8.894%, (3 mo. SOFR + 3.60%), 4/19/37(1)(3) | | 3,000 | 3,004,944 |
| Bryant Park Funding Ltd., Series 2024-22A, Class D, 9.613%, (3 mo. SOFR + 4.30%), 4/15/37(1)(3) | | 6,000 | 5,977,314 |
| Canyon Capital CLO Ltd.: | | | |
| Series 2016-1A, Class ER, 11.34%, (3 mo. SOFR + 6.012%), 7/15/31(1)(3) | | 4,000 | 3,923,540 |
| Series 2016-2A, Class ER, 11.59%, (3 mo. SOFR + 6.262%), 10/15/31(1)(3) | | 1,000 | 987,706 |
| Series 2017-1A, Class E, 11.84%, (3 mo. SOFR + 6.512%), 7/15/30(1)(3) | | 1,000 | 985,954 |
| Series 2018-1A, Class E, 11.34%, (3 mo. SOFR + 6.012%), 7/15/31(1)(3) | | 2,000 | 1,965,000 |
| Series 2022-1A, Class D, 8.528%, (3 mo. SOFR + 3.20%), 4/15/35(1)(3) | | 1,900 | 1,901,486 |
| Carlyle C17 CLO Ltd., Series C17A, Class DR, 11.579%, (3 mo. SOFR + 6.262%), 4/30/31(1)(3) | | 3,000 | 2,920,377 |
21
See Notes to Consolidated Financial Statements.
Global Opportunities Portfolio
April 30, 2024
Consolidated Portfolio of Investments (Unaudited) — continued
| Security | Principal
Amount
(000's omitted) | Value |
| Carlyle Global Market Strategies CLO Ltd.: | | | |
| Series 2012-3A, Class DR2, 12.09%, (3 mo. SOFR + 6.762%), 1/14/32(1)(3) | $ | 1,000 | $ 986,550 |
| Series 2014-3RA, Class D, 10.987%, (3 mo. SOFR + 5.662%), 7/27/31(1)(3) | | 2,000 | 1,957,992 |
| Carlyle U.S. CLO Ltd.: | | | |
| Series 2019-4A, Class CR, 8.529%, (3 mo. SOFR + 3.20%), 4/15/35(1)(3) | | 1,750 | 1,752,004 |
| Series 2019-4A, Class DR, 11.929%, (3 mo. SOFR + 6.60%), 4/15/35(1)(3) | | 2,000 | 1,979,860 |
| Series 2022-AA, Class C, 8.875%, (3 mo. SOFR + 3.55%), 4/20/35(1)(3) | | 3,000 | 3,006,756 |
| CarVal CLO IV Ltd., Series 2021-1A, Class E, 12.186%, (3 mo. SOFR + 6.862%), 7/20/34(1)(3) | | 1,000 | 1,003,442 |
| CFMT LLC: | | | |
| Series 2023-HB11, Class M3, 4.00%, 2/25/37(1)(4) | | 7,600 | 6,487,297 |
| Series 2023-HB11, Class M4, 4.00%, 2/25/37(1)(4) | | 2,075 | 1,688,486 |
| Series 2023-HB12, Class M4, 4.25%, 4/25/33(1)(4) | | 11,000 | 8,976,761 |
| Crown City CLO III, Series 2021-1A, Class C, 8.886%, (3 mo. SOFR + 3.562%), 7/20/34(1)(3) | | 1,000 | 971,503 |
| Dryden CLO Ltd., Series 2018-55A, Class E, 10.99%, (3 mo. SOFR + 5.662%), 4/15/31(1)(3) | | 1,000 | 935,567 |
| Dryden Senior Loan Fund, Series 2016-42A, Class ER, 11.14%, (3 mo. SOFR + 5.812%), 7/15/30(1)(3) | | 2,000 | 1,892,254 |
| Elmwood CLO 14 Ltd., Series 2022-1A, Class D, 8.475%, (3 mo. SOFR + 3.15%), 4/20/35(1)(3) | | 2,000 | 1,983,374 |
| Elmwood CLO 16 Ltd., Series 2022-3A, Class DR, 9.119%, (3 mo. SOFR + 3.80%), 4/20/37(1)(3) | | 2,000 | 2,009,168 |
| Elmwood CLO 17 Ltd., Series 2022-4A, Class E, 12.467%, (3 mo. SOFR + 7.15%), 7/17/35(1)(3) | | 2,000 | 2,015,158 |
| Empower CLO Ltd., Series 2024-1A, Class D1, 9.061%, (3 mo. SOFR + 3.75%), 4/25/37(1)(3) | | 3,000 | 3,019,620 |
| FirstKey Homes Trust: | | | |
| Series 2021-SFR1, Class F1, 3.238%, 8/17/38(1) | | 3,000 | 2,691,839 |
| Series 2021-SFR1, Class F2, 3.452%, 8/17/38(1) | | 3,712 | 3,303,257 |
| Series 2021-SFR1, Class F3, 3.686%, 8/17/38(1) | | 4,339 | 3,822,416 |
| Series 2021-SFR1, Class G, 3.835%, 8/17/38(1) | | 5,939 | 5,159,449 |
| Series 2021-SFR2, Class G, 3.406%, 9/17/38(1) | | 12,501 | 10,981,816 |
| Series 2021-SFR3, Class G, 3.981%, 12/17/38(1) | | 9,268 | 8,164,124 |
| Security | Principal
Amount
(000's omitted) | Value |
| FMC GMSR Issuer Trust, Series 2022-GT2, Class A, 7.90%, 7/25/27(1) | $ | 6,250 | $ 6,245,434 |
| Galaxy 31 CLO Ltd., Series 2023-31A, Class D, 10.579%, (3 mo. SOFR + 5.25%), 4/15/36(1)(3) | | 2,300 | 2,331,119 |
| Galaxy 33 CLO Ltd.: | | | |
| Series 2024-33A, Class D1, (3 mo. SOFR + 3.55%), 4/20/37(1)(3)(5) | | 2,000 | 2,009,204 |
| Series 2024-33A, Class E, (3 mo. SOFR + 6.65%), 4/20/37(1)(3)(5) | | 2,300 | 2,313,460 |
| Galaxy XXI CLO Ltd.: | | | |
| Series 2015-21A, Class DR, 8.236%, (3 mo. SOFR + 2.912%), 4/20/31(1)(3) | | 5,000 | 4,956,710 |
| Series 2015-21A, Class ER, 10.836%, (3 mo. SOFR + 5.512%), 4/20/31(1)(3) | | 4,000 | 3,961,692 |
| Golub Capital Partners 48 LP, Series 2020-48A, Class D, 9.379%, (3 mo. SOFR + 4.062%), 4/17/33(1)(3) | | 3,000 | 3,005,937 |
| Golub Capital Partners CLO 50B-R Ltd., Series 2020-50A, Class ER, 12.425%, (3 mo. SOFR + 7.10%), 4/20/35(1)(3) | | 2,000 | 2,005,836 |
| Golub Capital Partners CLO 53B Ltd.: | | | |
| Series 2021-53A, Class D, 8.636%, (3 mo. SOFR + 3.312%), 7/20/34(1)(3) | | 2,000 | 2,003,978 |
| Series 2021-53A, Class E, 12.286%, (3 mo. SOFR + 6.962%), 7/20/34(1)(3) | | 1,000 | 1,003,058 |
| Golub Capital Partners CLO 60B Ltd., Series 2022-60A, Class D, 9.094%, (3 mo. SOFR + 3.77%), 10/25/34(1)(3) | | 1,800 | 1,803,650 |
| Golub Capital Partners CLO 72 B Ltd., Series 2024-72A, Class D, 9.296%, (3 mo. SOFR + 4.00%), 4/25/37(1)(3) | | 3,500 | 3,504,826 |
| HalseyPoint CLO 5 Ltd., Series 2021-5A, Class D, 9.091%, (3 mo. SOFR + 3.762%), 1/30/35(1)(3) | | 3,500 | 3,467,418 |
| Harriman Park CLO Ltd., Series 2020-1A, Class ER, 11.986%, (3 mo. SOFR + 6.662%), 4/20/34(1)(3) | | 1,000 | 1,004,415 |
| Highbridge Loan Management, Series 3A-2014, Class DR, 12.089%, (3 mo. SOFR + 6.762%), 7/18/29(1)(3) | | 2,750 | 2,697,959 |
| Home Partners of America Trust, Series 2021-2, Class F, 3.799%, 12/17/26(1) | | 23,654 | 21,036,719 |
| ICG U.S. CLO Ltd., Series 2018-2A, Class E, 11.336%, (3 mo. SOFR + 6.012%), 7/22/31(1)(3) | | 1,000 | 909,326 |
| KKR SFR Warehouse Participation, 8.815%, (30-day SOFR Average + 3.50%), 12/13/24(3) | | 13,475 | 13,478,824 |
| Loandepot GMSR Master Trust, Series 2018-GT1, Class A, 8.984%, (1 mo. SOFR + 3.664%), 10/16/25(1)(3) | | 4,000 | 3,888,808 |
22
See Notes to Consolidated Financial Statements.
Global Opportunities Portfolio
April 30, 2024
Consolidated Portfolio of Investments (Unaudited) — continued
| Security | Principal
Amount
(000's omitted) | Value |
| Madison Park Funding XVII Ltd., Series 2015-17A, Class ER, 12.086%, (3 mo. SOFR + 6.762%), 7/21/30(1)(3) | $ | 2,500 | $ 2,506,250 |
| Madison Park Funding XXXVI Ltd.: | | | |
| Series 2019-36A, Class D1R, 8.829%, (3 mo. SOFR + 3.50%), 4/15/35(1)(3) | | 1,000 | 1,002,954 |
| Series 2019-36A, Class ER, 12.379%, (3 mo. SOFR + 7.05%), 4/15/35(1)(3) | | 2,000 | 2,006,808 |
| Marble Point CLO XXIV Ltd., Series 2022-1A, Class D1, 9.565%, (3 mo. SOFR + 4.24%), 4/20/35(1)(3) | | 2,000 | 1,951,146 |
| MetroNet Infrastructure Issuer LLC: | | | |
| Series 2024-1A, Class B, 7.59%, 4/20/54(1) | | 1,375 | 1,378,522 |
| Series 2024-1A, Class C, 10.86%, 4/20/54(1) | | 2,000 | 1,977,813 |
| Mountain View CLO LLC, Series 2017-2A, Class AR, 6.629%, (3 mo. SOFR + 1.302%), 1/16/31(1)(3) | | 4,830 | 4,835,930 |
| Neuberger Berman CLO XXII Ltd., Series 2016-22A, Class ER, 11.639%, (3 mo. SOFR + 6.322%), 10/17/30(1)(3) | | 2,000 | 2,005,522 |
| Neuberger Berman Loan Advisers CLO 30 Ltd., Series 2018-30A, Class ER, 11.786%, (3 mo. SOFR + 6.462%), 1/20/31(1)(3) | | 2,000 | 2,006,490 |
| Neuberger Berman Loan Advisers CLO Ltd., Series 2022-49A, Class E, 12.324%, (3 mo. SOFR + 7.00%), 7/25/34(1)(3) | | 2,000 | 2,007,696 |
| Northwoods Capital XI-B Ltd., Series 2018-11B1, Class A1, 6.688%, (3 mo. SOFR + 1.362%), 4/19/31(1)(3) | | 8,609 | 8,612,997 |
| NRZ Excess Spread-Collateralized Notes: | | | |
| Series 2021-FNT1, Class A, 2.981%, 3/25/26(1) | | 600 | 563,227 |
| Series 2021-GNT1, Class A, 3.474%, 11/25/26(1) | | 2,338 | 2,161,072 |
| OCP CLO Ltd., Series 2024-32A, Class D1, 9.076%, (3 mo. SOFR + 3.75%), 4/23/37(1)(3) | | 5,000 | 5,007,825 |
| Octagon Investment Partners 49 Ltd., Series 2020-5A, Class D1R, 9.341%, (3 mo. SOFR + 4.05%), 4/15/37(1)(3) | | 2,000 | 2,019,464 |
| Pagaya AI Technology in Housing Trust, Series 2023-1, Class F, 3.60%, 10/25/40(1) | | 4,500 | 3,341,363 |
| Palmer Square CLO Ltd.: | | | |
| Series 2015-1A, Class DR4, 12.076%, (3 mo. SOFR + 6.762%), 5/21/34(1)(3) | | 2,000 | 2,005,212 |
| Series 2018-1A, Class CR, 9.224%, (3 mo. SOFR + 3.90%), 4/18/37(1)(3) | | 4,500 | 4,509,625 |
| Series 2021-2A, Class E, 11.94%, (3 mo. SOFR + 6.612%), 7/15/34(1)(3) | | 1,000 | 1,002,878 |
| Series 2022-1A, Class D, 8.375%, (3 mo. SOFR + 3.05%), 4/20/35(1)(3) | | 2,450 | 2,453,205 |
| Security | Principal
Amount
(000's omitted) | Value |
| PMT Issuer Trust - FMSR, Series 2022-FT1, Class A, 9.52%, (30-day SOFR Average + 4.19%), 6/25/27(1)(3) | $ | 3,000 | $ 3,042,861 |
| Progress Residential Trust, Series 2021-SFR9, Class F, 4.053%, 11/17/40(1) | | 1,000 | 857,239 |
| Regatta XIII Funding Ltd., Series 2018-2A, Class D, 11.54%, (3 mo. SOFR + 6.212%), 7/15/31(1)(3) | | 3,000 | 2,817,489 |
| Retained Vantage Data Centers Issuer LLC, Series 2023-1A, Class A2B, 5.25%, 9/15/48(1) | | 10,000 | 6,842,099 |
| Sandstone Peak Ltd., Series 2021-1A, Class D, 9.14%, (3 mo. SOFR + 3.812%), 10/15/34(1)(3) | | 4,000 | 3,980,108 |
| Shackleton CLO Ltd., Series 2015-7RA, Class AR, 6.74%, (3 mo. SOFR + 1.412%), 7/15/31(1)(3) | | 10,272 | 10,286,211 |
| STAR Trust: | | | |
| Series 2021-SFR1, Class G, 8.636%, (1 mo. SOFR + 3.314%), 4/17/38(1)(3) | | 5,644 | 5,483,395 |
| Series 2021-SFR1, Class H, 9.886%, (1 mo. SOFR + 4.564%), 4/17/38(1)(3) | | 1,600 | 1,496,487 |
| Steele Creek CLO Ltd., Series 2014-1RA, Class A, 6.656%, (3 mo. SOFR + 1.332%), 4/21/31(1)(3) | | 4,727 | 4,730,365 |
| TCW CLO Ltd., Series 2019-2A, Class DR, 8.535%, (3 mo. SOFR + 3.21%), 10/20/32(1)(3) | | 5,000 | 4,870,990 |
| Tricon Residential Trust: | | | |
| Series 2021-SFR1, Class F, 3.692%, 7/17/38(1) | | 5,500 | 4,999,958 |
| Series 2021-SFR1, Class G, 4.133%, 7/17/38(1) | | 3,551 | 3,200,591 |
| Vibrant CLO IX, Ltd., Series 2018-9A, Class D, 11.836%, (3 mo. SOFR + 6.512%), 7/20/31(1)(3) | | 2,000 | 1,883,058 |
| VINE Trust, Series 2023-SFR1, Class E1, 4.75%, 12/17/40(1) | | 15,000 | 13,126,518 |
| Voya CLO Ltd.: | | | |
| Series 2013-1A, Class DR, 12.07%, (3 mo. SOFR + 6.742%), 10/15/30(1)(3) | | 5,000 | 4,488,650 |
| Series 2014-1A, Class DR2, 11.589%, (3 mo. SOFR + 6.262%), 4/18/31(1)(3) | | 2,000 | 1,916,940 |
| Series 2015-3A, Class DR, 11.786%, (3 mo. SOFR + 6.462%), 10/20/31(1)(3) | | 2,000 | 1,789,488 |
| Series 2017-4A, Class A1, 6.72%, (3 mo. SOFR + 1.392%), 10/15/30(1)(3) | | 2,757 | 2,765,497 |
| Series 2018-2A, Class E, 10.84%, (3 mo. SOFR + 5.512%), 7/15/31(1)(3) | | 1,000 | 919,042 |
| Wellfleet CLO Ltd.: | | | |
| Series 2019-1A, Class CR, 9.136%, (3 mo. SOFR + 3.812%), 7/20/32(1)(3) | | 2,500 | 2,445,005 |
| Series 2021-2A, Class E, 12.55%, (3 mo. SOFR + 7.222%), 7/15/34(1)(3) | | 1,000 | 921,356 |
| Series 2022-1A, Class E, 13.189%, (3 mo. SOFR + 7.86%), 4/15/34(1)(3) | | 2,000 | 1,997,284 |
23
See Notes to Consolidated Financial Statements.
Global Opportunities Portfolio
April 30, 2024
Consolidated Portfolio of Investments (Unaudited) — continued
| Security | Principal
Amount
(000's omitted) | Value |
| Wellfleet CLO Ltd.: (continued) | | | |
| Series 2022-2A, Class E, 13.887%, (3 mo. SOFR + 8.56%), 10/18/35(1)(3) | $ | 2,000 | $ 2,037,412 |
Total Asset-Backed Securities
(identified cost $404,931,475) | | | $ 404,608,295 |
| Security | Shares | Value |
| Nuveen Global High Income Fund | | 83,400 | $ 1,049,172 |
| PGIM Global High Yield Fund, Inc. | | 430,326 | 4,953,052 |
| Western Asset High Income Opportunity Fund, Inc. | | 383,997 | 1,424,629 |
Total Closed-End Funds
(identified cost $8,409,895) | | | $ 7,426,853 |
| Collateralized Mortgage Obligations — 36.9% |
| Security | Principal
Amount
(000's omitted) | Value |
| Angel Oak Mortgage Trust I LLC, Series 2019-1, Class B1, 5.40%, 11/25/48(1)(4) | $ | 3,939 | $ 3,855,895 |
| Brean Asset-Backed Securities Trust, Series 2023-RM6, Class A1, 5.25% to 1/25/28, 1/25/63(1)(6) | | 3,836 | 3,576,100 |
| Cascade MH Asset Trust, Series 2022-MH1, Class A, 4.25% to 7/25/27, 8/25/54(1)(6) | | 2,743 | 2,470,823 |
| CHNGE Mortgage Trust: | | | |
| Series 2022-4, Class A1, 6.00% to 9/25/24, 10/25/57(1)(6) | | 11,028 | 10,887,954 |
| Series 2022-NQ, Class M1, 5.82% to 8/25/25, 6/25/67(1)(6) | | 1,764 | 1,707,724 |
| Deephaven Residential Mortgage Trust, Series 2020-2, Class B2, 5.798%, 5/25/65(1)(4) | | 4,273 | 4,158,966 |
| FARM Mortgage Trust: | | | |
| Series 2022-1, Class B, 2.948%, 1/25/52(1)(4) | | 2,606 | 1,818,037 |
| Series 2023-1, Class B, 3.034%, 3/25/52(1)(4) | | 2,627 | 1,842,953 |
| Series 2024-1, Class B, 5.122%, 10/1/53(1)(4) | | 2,350 | 1,888,317 |
| Federal Home Loan Mortgage Corp.: | | | |
| Series 2182, Class ZC, 7.50%, 9/15/29 | | 30 | 30,057 |
| Series 4273, Class SP, 0.00%, (11.695% - 30-day SOFR Average x 2.667, Floor 0.00%), 11/15/43(7) | | 516 | 375,049 |
| Series 5071, Class SP, 0.00%, (3.30% - 30-day SOFR Average, Floor 0.00%), 2/25/51(7) | | 4,319 | 1,588,956 |
| Series 5083, Class SK, 0.00%, (3.867% - 30-day SOFR Average x 1.333, Floor 0.00%), 3/25/51(7) | | 3,411 | 1,807,882 |
| Series 5139, Class DZ, 2.50%, 9/25/51 | | 2,077 | 1,101,382 |
| Security | Principal
Amount
(000's omitted) | Value |
| Federal Home Loan Mortgage Corp.: (continued) | | | |
| Series 5150, Class QZ, 2.50%, 10/25/51 | $ | 2,675 | $ 1,475,548 |
| Series 5150, Class ZJ, 2.50%, 10/25/51 | | 4,309 | 2,380,140 |
| Series 5152, Class ZP, 3.00%, 7/25/50 | | 10,311 | 5,673,516 |
| Series 5159, Class ZP, 3.00%, 11/25/51 | | 873 | 505,190 |
| Series 5159, Class ZT, 3.00%, 11/25/51 | | 1,550 | 949,339 |
| Series 5163, Class Z, 3.00%, 11/25/51 | | 1,096 | 603,257 |
| Series 5168, Class MZ, 3.00%, 10/25/51 | | 2,084 | 1,249,677 |
| Series 5270, Class ZU, 6.00%, 11/25/52 | | 3,461 | 3,365,253 |
| Series 5300, Class EY, 6.00%, 12/25/52 | | 10,900 | 10,623,416 |
| Series 5324, Class MZ, 6.00%, 7/25/53 | | 3,495 | 3,362,324 |
| Series 5327, Class B, 6.00%, 8/25/53 | | 20,000 | 19,461,372 |
| Series 5353, Class AZ, 6.50%, 11/25/53 | | 8,780 | 8,874,548 |
| Series 5362, Class JB, 6.00%, 12/25/53 | | 14,599 | 14,226,794 |
| Series 5399, Class MZ, 6.00%, 4/25/54 | | 4,595 | 4,443,406 |
| Series 5402, Class BZ, 6.00%, 4/25/54 | | 8,040 | 7,775,460 |
| Series 5413, Class MZ, 6.00%, 5/25/54 | | 11,752 | 11,637,566 |
| Interest Only:(8) | | | |
| Series 380, Class C1, 3.00%, 1/25/50 | | 29,565 | 5,140,201 |
| Series 380, Class C5, 3.50%, 1/25/50 | | 9,178 | 1,795,880 |
| Series 2631, Class DS, 1.656%, (6.986% - 30-day SOFR Average), 6/15/33(7) | | 317 | 5,188 |
| Series 2956, Class SL, 1.556%, (6.886% - 30-day SOFR Average), 6/15/32(7) | | 412 | 25,185 |
| Series 3114, Class TS, 1.206%, (6.536% - 30-day SOFR Average), 9/15/30(7) | | 854 | 23,333 |
| Series 3153, Class JI, 1.176%, (6.506% - 30-day SOFR Average), 5/15/36(7) | | 1,062 | 58,362 |
| Series 4007, Class JI, 4.00%, 2/15/42 | | 525 | 81,437 |
| Series 4067, Class JI, 3.50%, 6/15/27 | | 1,074 | 36,838 |
| Series 4070, Class S, 0.656%, (5.986% - 30-day SOFR Average), 6/15/32(7) | | 4,169 | 188,531 |
| Series 4095, Class HS, 0.656%, (5.986% - 30-day SOFR Average), 7/15/32(7) | | 774 | 20,350 |
| Series 4109, Class ES, 0.706%, (6.036% - 30-day SOFR Average), 12/15/41(7) | | 81 | 6,660 |
| Series 4109, Class SA, 0.756%, (6.086% - 30-day SOFR Average), 9/15/32(7) | | 1,888 | 81,144 |
| Series 4149, Class S, 0.806%, (6.136% - 30-day SOFR Average), 1/15/33(7) | | 1,315 | 64,464 |
| Series 4163, Class GS, 0.756%, (6.086% - 30-day SOFR Average), 11/15/32(7) | | 1,192 | 52,763 |
| Series 4169, Class AS, 0.806%, (6.136% - 30-day SOFR Average), 2/15/33(7) | | 1,695 | 72,401 |
| Series 4188, Class AI, 3.50%, 4/15/28 | | 866 | 25,169 |
| Series 4189, Class SQ, 0.706%, (6.036% - 30-day SOFR Average), 12/15/42(7) | | 474 | 38,888 |
| Series 4203, Class QS, 0.806%, (6.136% - 30-day SOFR Average), 5/15/43(7) | | 1,233 | 59,316 |
| Series 4332, Class IK, 4.00%, 4/15/44 | | 442 | 70,407 |
| Series 4343, Class PI, 4.00%, 5/15/44 | | 1,347 | 222,333 |
24
See Notes to Consolidated Financial Statements.
Global Opportunities Portfolio
April 30, 2024
Consolidated Portfolio of Investments (Unaudited) — continued
| Security | Principal
Amount
(000's omitted) | Value |
| Interest Only: (continued) | | | |
| Series 4370, Class IO, 3.50%, 9/15/41 | $ | 168 | $ 3,704 |
| Series 4381, Class SK, 0.706%, (6.036% - 30-day SOFR Average), 6/15/44(7) | | 1,257 | 87,790 |
| Series 4388, Class MS, 0.656%, (5.986% - 30-day SOFR Average), 9/15/44(7) | | 1,222 | 105,420 |
| Series 4408, Class IP, 3.50%, 4/15/44 | | 1,821 | 232,582 |
| Series 4497, Class CS, 0.756%, (6.086% - 30-day SOFR Average), 9/15/44(7) | | 984 | 12,847 |
| Series 4507, Class MI, 3.50%, 8/15/44 | | 471 | 17,057 |
| Series 4507, Class SJ, 0.736%, (6.066% - 30-day SOFR Average), 9/15/45(7) | | 3,415 | 296,895 |
| Series 4520, Class PI, 4.00%, 8/15/45 | | 8,154 | 1,067,238 |
| Series 4528, Class BS, 0.706%, (6.036% - 30-day SOFR Average), 7/15/45(7) | | 1,607 | 120,582 |
| Series 4629, Class QI, 3.50%, 11/15/46 | | 1,745 | 344,751 |
| Series 4637, Class IP, 3.50%, 4/15/44 | | 190 | 5,935 |
| Series 4644, Class TI, 3.50%, 1/15/45 | | 1,548 | 223,031 |
| Series 4744, Class IO, 4.00%, 11/15/47 | | 1,558 | 327,269 |
| Series 4749, Class IL, 4.00%, 12/15/47 | | 1,236 | 260,136 |
| Series 4768, Class IO, 4.00%, 3/15/48 | | 1,515 | 320,340 |
| Series 5051, Class S, 0.00%, (3.60% - 30-day SOFR Average, Floor 0.00%), 12/25/50(7) | | 17,554 | 355,537 |
| Series 5070, Class CI, 2.00%, 2/25/51 | | 37,647 | 4,925,297 |
| Series 5156, Class IP, 3.00%, 12/25/49 | | 19,193 | 3,034,572 |
| Series 5236, Class TI, 3.00%, 1/25/51 | | 70,271 | 12,082,536 |
| Principal Only:(9) | | | |
| Series 4417, Class KO, 0.00%, 12/15/43 | | 539 | 341,890 |
| Series 4478, Class PO, 0.00%, 5/15/45 | | 822 | 574,208 |
| Series 5357, Class EO, 0.00%, 11/25/53 | | 6,597 | 5,252,543 |
| Federal Home Loan Mortgage Corp. STACR REMICS Trust: | | | |
| Series 2019-HQA3, Class B2, 12.945%, (30-day SOFR Average + 7.614%), 9/25/49(1)(3) | | 1,250 | 1,424,225 |
| Series 2020-DNA6, Class B2, 10.98%, (30-day SOFR Average + 5.65%), 12/25/50(1)(3) | | 6,900 | 7,688,630 |
| Series 2021-DNA3, Class B2, 11.58%, (30-day SOFR Average + 6.25%), 10/25/33(1)(3) | | 6,500 | 7,604,279 |
| Series 2021-DNA5, Class B2, 10.83%, (30-day SOFR Average + 5.50%), 1/25/34(1)(3) | | 14,500 | 16,013,203 |
| Series 2021-DNA6, Class B2, 12.83%, (30-day SOFR Average + 7.50%), 10/25/41(1)(3) | | 16,140 | 17,682,447 |
| Federal National Mortgage Association: | | | |
| Series G94-7, Class PJ, 7.50%, 5/17/24 | | 0 (10) | 6 |
| Series 2009-62, Class WA, 5.579%, 8/25/39(4) | | 508 | 505,084 |
| Series 2013-6, Class TA, 1.50%, 1/25/43 | | 497 | 413,620 |
| Series 2021-56, Class GZ, 3.00%, 7/25/51 | | 1,374 | 788,784 |
| Series 2021-56, Class LZ, 2.50%, 9/25/51 | | 5,571 | 3,208,692 |
| Series 2021-61, Class LZ, 2.50%, 9/25/51 | | 3,870 | 2,151,685 |
| Series 2021-61, Class Z, 2.50%, 9/25/51 | | 8,220 | 4,581,369 |
| Security | Principal
Amount
(000's omitted) | Value |
Federal National Mortgage Association:
(continued) | | | |
| Series 2021-77, Class WZ, 3.00%, 8/25/50 | $ | 425 | $ 226,980 |
| Series 2023-12, Class LW, 6.00%, 4/25/53 | | 11,482 | 11,180,213 |
| Series 2023-14, Class EL, 6.00%, 4/25/53 | | 63,163 | 62,387,755 |
| Interest Only:(8) | | | |
| Series 2004-46, Class SI, 0.556%, (5.886% - 30-day SOFR Average), 5/25/34(7) | | 815 | 21,011 |
| Series 2005-17, Class SA, 1.256%, (6.586% - 30-day SOFR Average), 3/25/35(7) | | 870 | 62,830 |
| Series 2005-71, Class SA, 1.306%, (6.636% - 30-day SOFR Average), 8/25/25(7) | | 7 | 21 |
| Series 2005-105, Class S, 1.256%, (6.586% - 30-day SOFR Average), 12/25/35(7) | | 707 | 51,885 |
| Series 2006-44, Class IS, 1.156%, (6.486% - 30-day SOFR Average), 6/25/36(7) | | 631 | 41,977 |
| Series 2006-65, Class PS, 1.776%, (7.106% - 30-day SOFR Average), 7/25/36(7) | | 622 | 60,305 |
| Series 2006-96, Class SN, 1.756%, (7.086% - 30-day SOFR Average), 10/25/36(7) | | 649 | 38,747 |
| Series 2006-104, Class SD, 1.196%, (6.526% - 30-day SOFR Average), 11/25/36(7) | | 667 | 51,340 |
| Series 2006-104, Class SE, 1.186%, (6.516% - 30-day SOFR Average), 11/25/36(7) | | 445 | 33,938 |
| Series 2007-50, Class LS, 1.006%, (6.336% - 30-day SOFR Average), 6/25/37(7) | | 983 | 68,382 |
| Series 2008-26, Class SA, 0.756%, (6.086% - 30-day SOFR Average), 4/25/38(7) | | 1,045 | 75,258 |
| Series 2008-61, Class S, 0.656%, (5.986% - 30-day SOFR Average), 7/25/38(7) | | 1,827 | 88,271 |
| Series 2011-101, Class IC, 3.50%, 10/25/26 | | 409 | 9,037 |
| Series 2011-101, Class IE, 3.50%, 10/25/26 | | 302 | 6,594 |
| Series 2011-104, Class IM, 3.50%, 10/25/26 | | 560 | 13,257 |
| Series 2012-52, Class DI, 3.50%, 5/25/27 | | 1,294 | 43,018 |
| Series 2012-124, Class IO, 1.582%, 11/25/42(4) | | 2,249 | 99,454 |
| Series 2012-139, Class LS, 0.713%, (6.036% - 30-day SOFR Average), 12/25/42(7) | | 2,370 | 259,596 |
| Series 2012-147, Class SA, 0.656%, (5.986% - 30-day SOFR Average), 1/25/43(7) | | 2,725 | 207,965 |
| Series 2012-150, Class PS, 0.706%, (6.036% - 30-day SOFR Average), 1/25/43(7) | | 3,504 | 267,106 |
| Series 2012-150, Class SK, 0.706%, (6.036% - 30-day SOFR Average), 1/25/43(7) | | 4,079 | 328,186 |
| Series 2013-11, Class IO, 4.00%, 1/25/43 | | 8,147 | 953,651 |
| Series 2013-12, Class SP, 0.206%, (5.536% - 30-day SOFR Average), 11/25/41(7) | | 386 | 3,480 |
| Series 2013-15, Class DS, 0.756%, (6.086% - 30-day SOFR Average), 3/25/33(7) | | 3,023 | 124,498 |
| Series 2013-23, Class CS, 0.806%, (6.136% - 30-day SOFR Average), 3/25/33(7) | | 1,583 | 67,153 |
| Series 2013-64, Class PS, 0.806%, (6.136% - 30-day SOFR Average), 4/25/43(7) | | 1,789 | 90,493 |
| Series 2013-66, Class JI, 3.00%, 7/25/43 | | 2,977 | 452,123 |
25
See Notes to Consolidated Financial Statements.
Global Opportunities Portfolio
April 30, 2024
Consolidated Portfolio of Investments (Unaudited) — continued
| Security | Principal
Amount
(000's omitted) | Value |
| Interest Only: (continued) | | | |
| Series 2013-75, Class SC, 0.806%, (6.136% - 30-day SOFR Average), 7/25/42(7) | $ | 2,247 | $ 35,189 |
| Series 2014-32, Class EI, 4.00%, 6/25/44 | | 679 | 117,407 |
| Series 2014-41, Class SA, 0.606%, (5.936% - 30-day SOFR Average), 7/25/44(7) | | 1,148 | 130,155 |
| Series 2014-43, Class PS, 0.656%, (5.986% - 30-day SOFR Average), 3/25/42(7) | | 974 | 45,139 |
| Series 2014-55, Class IN, 3.50%, 7/25/44 | | 1,718 | 321,410 |
| Series 2014-64, Class BI, 3.50%, 3/25/44 | | 177 | 4,789 |
| Series 2014-67, Class IH, 4.00%, 10/25/44 | | 1,132 | 241,298 |
| Series 2014-80, Class CI, 3.50%, 12/25/44 | | 1,168 | 224,598 |
| Series 2014-89, Class IO, 3.50%, 1/25/45 | | 1,813 | 344,404 |
| Series 2015-6, Class IM, 0.00%, (5.181% - 30-day SOFR Average x 1.333, Floor 0.00%), 6/25/43(7) | | 1,960 | 5,956 |
| Series 2015-14, Class KI, 3.00%, 3/25/45 | | 2,131 | 336,705 |
| Series 2015-22, Class GI, 3.50%, 4/25/45 | | 657 | 108,947 |
| Series 2015-31, Class SG, 0.656%, (5.986% - 30-day SOFR Average), 5/25/45(7) | | 2,421 | 339,375 |
| Series 2015-36, Class IL, 3.00%, 6/25/45 | | 1,407 | 199,280 |
| Series 2015-52, Class MI, 3.50%, 7/25/45 | | 3,003 | 569,145 |
| Series 2015-93, Class BS, 0.706%, (6.036% - 30-day SOFR Average), 8/25/45(7) | | 1,281 | 49,956 |
| Series 2018-21, Class IO, 3.00%, 4/25/48 | | 3,890 | 677,381 |
| Series 2021-94, Class CI, 3.00%, 1/25/52 | | 11,027 | 1,831,322 |
| Series 2023-39, Class AI, 2.00%, 7/25/52 | | 95,958 | 12,311,101 |
| Federal National Mortgage Association Connecticut Avenue Securities: | | | |
| Series 2019-R04, Class 2B1, 10.695%, (30-day SOFR Average + 5.364%), 6/25/39(1)(3) | | 15,139 | 16,296,387 |
| Series 2019-R06, Class 2B1, 9.195%, (30-day SOFR Average + 3.864%), 9/25/39(1)(3) | | 876 | 914,630 |
| Series 2021-R01, Class 1B2, 11.33%, (30-day SOFR Average + 6.00%), 10/25/41(1)(3) | | 8,500 | 9,033,795 |
| FIGRE Trust: | | | |
| Series 2023-HE2, Class A, 6.512%, 5/25/53(1)(4) | | 4,971 | 4,993,341 |
| Series 2023-HE3, Class A, 6.436%, 11/25/53(1)(4) | | 6,192 | 6,228,179 |
| Series 2024-HE1, Class C, 6.749%, 3/25/54(1)(4) | | 1,462 | 1,463,579 |
| Finance of America HECM Buyout, Series 2022-HB2, Class M5, 6.00%, 8/1/32(1)(4) | | 1,000 | 654,262 |
| Flagstar Mortgage Trust: | | | |
| Series 2023-10IN, Class B4, 3.508%, 10/25/51(1)(4) | | 6,835 | 5,223,375 |
| Series 2023-6INV, Class B4, 3.485%, 8/25/51(1)(4) | | 4,155 | 3,172,536 |
| FREED Mortgage Trust, Series 2022-HE1, Class A, 7.00%, 10/25/37(1) | | 2,480 | 2,486,211 |
| Security | Principal
Amount
(000's omitted) | Value |
| Government National Mortgage Association: | | | |
| Series 2021-136, Class Z, 2.50%, 8/20/51 | $ | 8,915 | $ 4,863,927 |
| Series 2021-139, Class ZJ, 2.50%, 8/20/51 | | 1,727 | 954,545 |
| Series 2021-154, Class ZC, 2.50%, 9/20/51 | | 1,795 | 987,066 |
| Series 2021-154, Class ZL, 3.00%, 9/20/51 | | 2,900 | 1,527,135 |
| Series 2021-165, Class MZ, 2.50%, 9/20/51 | | 14,875 | 8,161,021 |
| Series 2022-31, Class ZD, 3.00%, 2/20/52 | | 287 | 104,921 |
| Series 2022-173, Class S, 3.189%, (22.733% - 30-day SOFR Average x 3.667), 10/20/52(7) | | 7,307 | 7,109,249 |
| Series 2022-189, Class US, 3.189%, (22.733% - 30-day SOFR Average x 3.667), 11/20/52(7) | | 10,642 | 10,347,022 |
| Series 2022-195, Class AS, 3.403%, (23.125% - 30-day SOFR Average x 3.70), 11/20/52(7) | | 4,746 | 4,751,902 |
| Series 2022-197, Class SW, 3.527%, (16.32% - 30-day SOFR Average x 2.40), 11/20/52(7) | | 8,037 | 7,452,744 |
| Series 2023-53, Class AL, 5.50%, 4/20/53 | | 20,000 | 19,110,298 |
| Series 2023-53, Class SE, 3.005%, (22.55% - 30-day SOFR Average x 3.667), 4/20/53(7) | | 17,493 | 16,731,587 |
| Series 2023-56, Class ZE, 6.00%, 4/20/53 | | 16,796 | 16,518,640 |
| Series 2023-63, Class LB, 6.00%, 5/20/53 | | 12,347 | 12,069,018 |
| Series 2023-63, Class S, 3.005%, (22.55% - 30-day SOFR Average x 3.667), 5/20/53(7) | | 34,123 | 32,615,039 |
| Series 2023-64, Class LB, 6.00%, 5/20/53 | | 5,036 | 4,923,875 |
| Series 2023-65, Class SB, 3.005%, (22.55% - 30-day SOFR Average x 3.667), 5/20/53(7) | | 7,400 | 7,094,514 |
| Series 2023-65, Class SD, 3.005%, (22.55% - 30-day SOFR Average x 3.667), 5/20/53(7) | | 14,495 | 14,050,572 |
| Series 2023-66, Class S, 3.005%, (22.55% - 30-day SOFR Average x 3.667), 5/20/53(7) | | 6,304 | 6,021,912 |
| Series 2023-66, Class SD, 3.005%, (22.55% - 30-day SOFR Average x 3.667), 5/20/53(7) | | 5,627 | 5,375,503 |
| Series 2023-83, Class S, 2.72%, (22.868% - 30-day SOFR Average x 3.78), 6/20/53(7) | | 7,141 | 6,790,739 |
| Series 2023-84, Class MW, 6.00%, 6/20/53 | | 5,478 | 5,353,408 |
| Series 2023-84, Class SN, 2.825%, (22.387% - 30-day SOFR Average x 3.67), 6/20/53(7) | | 7,492 | 7,114,153 |
| Series 2023-89, Class SD, 2.639%, (22.183% - 30-day SOFR Average x 3.667), 6/20/53(7) | | 8,921 | 8,436,648 |
| Series 2023-96, Class BL, 6.00%, 7/20/53 | | 10,000 | 9,785,772 |
| Series 2023-96, Class DB, 6.00%, 7/20/53 | | 8,000 | 7,818,897 |
| Series 2023-97, Class CB, 6.00%, 7/20/53 | | 20,000 | 19,729,480 |
| Series 2023-99, Class AL, 6.00%, 7/20/53 | | 3,000 | 2,932,578 |
| Series 2023-100, Class AY, 6.00%, 7/20/53 | | 13,236 | 12,941,873 |
| Series 2023-100, Class JL, 6.00%, 7/20/53 | | 11,099 | 10,860,179 |
| Series 2023-116, Class CY, 6.00%, 8/20/53 | | 2,618 | 2,571,139 |
| Series 2023-133, Class S, 5.609%, (21.60% - 30-day SOFR Average x 3.00), 9/20/53(7) | | 14,512 | 14,064,112 |
| Series 2023-146, Class BY, 6.00%, 10/20/53 | | 5,318 | 5,270,968 |
26
See Notes to Consolidated Financial Statements.
Global Opportunities Portfolio
April 30, 2024
Consolidated Portfolio of Investments (Unaudited) — continued
| Security | Principal
Amount
(000's omitted) | Value |
Government National Mortgage Association:
(continued) | | | |
| Series 2023-149, Class S, 5.459%, (21.45% - 30-day SOFR Average x 3.00), 10/20/53(7) | $ | 9,066 | $ 9,025,599 |
| Series 2023-150, Class AS, 7.006%, (27.528% - 30-day SOFR Average x 3.85), 10/20/53(7) | | 5,152 | 5,252,808 |
| Series 2023-150, Class ZH, 6.00%, 10/20/53 | | 2,287 | 2,254,587 |
| Series 2023-153, Class SM, 6.679%, (28.00% - 30-day SOFR Average x 4.00), 10/20/53(7) | | 15,599 | 15,840,280 |
| Series 2023-164, Class EL, 6.00%, 11/20/53 | | 9,325 | 9,259,330 |
| Series 2023-165, Class DY, 6.00%, 11/20/53 | | 81,056 | 80,157,259 |
| Series 2023-165, Class EY, 6.50%, 11/20/53 | | 25,000 | 25,397,055 |
| Series 2023-169, Class JW, 6.50%, 11/20/53 | | 5,000 | 5,085,168 |
| Series 2023-173, Class AX, 6.00%, 11/20/53 | | 8,555 | 8,483,207 |
| Series 2023-173, Class UZ, 7.00%, 11/20/53 | | 5,485 | 5,429,187 |
| Series 2023-182, Class EL, 6.00%, 12/20/53 | | 12,883 | 12,503,634 |
| Series 2023-186, Class HL, 6.00%, 12/20/53 | | 5,445 | 5,372,764 |
| Series 2024-1, Class GL, 6.00%, 1/20/54 | | 2,500 | 2,454,888 |
| Series 2024-3, Class CY, 6.00%, 1/20/54 | | 2,073 | 2,036,120 |
| Series 2024-6, Class CB, 6.00%, 1/20/54 | | 5,000 | 4,908,953 |
| Series 2024-6, Class LB, 6.00%, 1/20/54 | | 6,784 | 6,659,305 |
| Series 2024-20, Class PZ, 7.50%, 2/20/54 | | 32,010 | 31,991,133 |
| Series 2024-25, Class GL, 6.00%, 2/20/54 | | 2,804 | 2,743,253 |
| Series 2024-26, Class NZ, 6.00%, 2/20/54 | | 14,388 | 13,919,098 |
| Series 2024-40, Class DB, 6.00%, 1/20/54 | | 1,906 | 1,869,374 |
| Series 2024-42, Class DZ, 6.00%, 3/20/54 | | 8,711 | 8,422,264 |
| Series 2024-44, Class LM, 6.00%, 3/20/54 | | 24,976 | 24,537,662 |
| Series 2024-44, Class ML, 6.00%, 3/20/54 | | 10,835 | 10,644,924 |
| Series 2024-45, Class DN, 6.00%, 3/20/54 | | 4,214 | 4,085,466 |
| Series 2024-46, Class AL, 6.00%, 3/20/54 | | 30,945 | 30,312,336 |
| Series 2024-59, Class LG, 6.00%, 4/20/54 | | 12,663 | 12,892,284 |
| Interest Only:(8) | | | |
| Series 2014-68, Class KI, 0.00%, 10/20/42(4) | | 2,313 | 52,083 |
| Series 2017-104, Class SD, 0.77%, (6.086% - 1 mo. SOFR), 7/20/47(7) | | 4,174 | 384,014 |
| Series 2017-121, Class DS, 0.00%, (4.386% - 1 mo. SOFR, Floor 0.00%), 8/20/47(7) | | 2,719 | 76,227 |
| Series 2017-137, Class AS, 0.00%, (4.386% - 1 mo. SOFR, Floor 0.00%), 9/20/47(7) | | 3,739 | 102,703 |
| Series 2020-116, Class MI, 2.00%, 8/20/50 | | 16,305 | 2,089,047 |
| Series 2020-134, Class LI, 2.50%, 9/20/50 | | 7,220 | 1,003,590 |
| Series 2020-146, Class IQ, 2.00%, 10/20/50 | | 16,795 | 1,948,569 |
| Series 2020-146, Class QI, 2.00%, 10/20/50 | | 8,886 | 1,016,566 |
| Series 2020-149, Class NI, 2.50%, 10/20/50 | | 13,199 | 1,748,009 |
| Series 2020-151, Class AI, 2.00%, 10/20/50 | | 49,566 | 5,884,682 |
| Series 2020-151, Class HI, 2.50%, 10/20/50 | | 1,149 | 167,352 |
| Series 2020-154, Class PI, 2.50%, 10/20/50 | | 11,703 | 1,547,135 |
| Series 2020-167, Class KI, 2.00%, 11/20/50 | | 27,437 | 3,175,803 |
| Security | Principal
Amount
(000's omitted) | Value |
| Interest Only: (continued) | | | |
| Series 2020-173, Class DI, 2.00%, 11/20/50 | $ | 20,658 | $ 2,445,393 |
| Series 2020-176, Class HI, 2.50%, 11/20/50 | | 28,599 | 3,790,358 |
| Series 2020-185, Class BI, 2.00%, 12/20/50 | | 7,073 | 860,902 |
| Series 2020-191, Class AI, 2.00%, 12/20/50 | | 26,484 | 2,999,000 |
| Series 2021-15, Class AI, 2.00%, 1/20/51 | | 30,489 | 3,625,769 |
| Series 2021-23, Class TI, 2.50%, 2/20/51 | | 10,936 | 1,399,684 |
| Series 2021-30, Class AI, 2.00%, 2/20/51 | | 3,744 | 439,892 |
| Series 2021-46, Class IM, 2.50%, 3/20/51 | | 2,485 | 322,746 |
| Series 2021-56, Class SE, 0.00%, (2.30% - 30-day SOFR Average, Floor 0.00%), 10/20/50(7) | | 5,141 | 46,572 |
| Series 2021-77, Class SB, 0.00%, (3.636% - 1 mo. SOFR, Floor 0.00%), 5/20/51(7) | | 11,713 | 209,736 |
| Series 2021-97, Class IG, 2.50%, 8/20/49 | | 35,661 | 4,062,796 |
| Series 2021-114, Class MI, 3.00%, 6/20/51 | | 8,911 | 1,441,111 |
| Series 2021-121, Class TI, 3.00%, 7/20/51 | | 32,268 | 4,355,791 |
| Series 2021-122, Class NI, 3.00%, 7/20/51 | | 5,946 | 966,153 |
| Series 2021-125, Class SA, 0.00%, (3.636% - 1 mo. SOFR, Floor 0.00%), 7/20/51(7) | | 15,623 | 311,911 |
| Series 2021-154, Class MI, 3.00%, 9/20/51 | | 44,239 | 6,123,224 |
| Series 2021-160, Class IT, 2.50%, 9/20/51 | | 16,576 | 1,760,715 |
| Series 2021-175, Class AS, 0.00%, (1.686% - 1 mo. SOFR, Floor 0.00%), 10/20/51(7) | | 25,180 | 135,730 |
| Series 2021-175, Class SB, 0.00%, (1.686% - 1 mo. SOFR, Floor 0.00%), 10/20/51(7) | | 12,734 | 68,264 |
| Series 2021-193, Class IU, 3.00%, 11/20/49 | | 39,990 | 5,560,458 |
| Series 2021-193, Class YS, 0.00%, (2.45% - 30-day SOFR Average, Floor 0.00%), 11/20/51(7) | | 24,332 | 151,832 |
| Series 2021-201, Class PI, 3.00%, 11/20/51 | | 24,864 | 2,879,912 |
| Series 2021-209, Class IW, 3.00%, 11/20/51 | | 17,720 | 2,348,593 |
| Series 2022-104, Class IO, 2.50%, 6/20/51 | | 24,109 | 3,299,570 |
| Series 2022-119, Class CS, 0.00%, (3.00% - 30-day SOFR Average, Floor 0.00%), 7/20/52(7) | | 199,511 | 1,137,031 |
| Series 2022-119, Class SC, 0.00%, (3.00% - 30-day SOFR Average, Floor 0.00%), 7/20/52(7) | | 22,168 | 126,337 |
| Series 2022-119, Class TA, 0.00%, (3.90% - 30-day SOFR Average, Floor 0.00%), 7/20/52(7) | | 44,336 | 379,877 |
| Series 2022-119, Class TI, 0.00%, (3.85% - 30-day SOFR Average, Floor 0.00%), 7/20/52(7) | | 443,357 | 3,831,491 |
| Series 2022-126, Class AS, 0.00%, (3.69% - 30-day SOFR Average, Floor 0.00%), 7/20/52(7) | | 59,494 | 641,578 |
| Series 2022-126, Class SC, 0.00%, (3.73% - 30-day SOFR Average, Floor 0.00%), 7/20/52(7) | | 44,336 | 496,870 |
| Series 2022-135, Class SA, 0.00%, (3.00% - 30-day SOFR Average, Floor 0.00%), 6/20/52(7) | | 124,530 | 777,725 |
27
See Notes to Consolidated Financial Statements.
Global Opportunities Portfolio
April 30, 2024
Consolidated Portfolio of Investments (Unaudited) — continued
| Security | Principal
Amount
(000's omitted) | Value |
| Interest Only: (continued) | | | |
| Series 2023-13, Class SA, 0.07%, (5.40% - 30-day SOFR Average), 1/20/53(7) | $ | 12,752 | $ 305,655 |
| Series 2023-19, Class SD, 0.97%, (6.30% - 30-day SOFR Average), 2/20/53(7) | | 18,121 | 862,243 |
| Series 2023-20, Class HS, 0.97%, (6.30% - 30-day SOFR Average), 2/20/53(7) | | 12,655 | 595,031 |
| Series 2023-22, Class ES, 0.97%, (6.30% - 30-day SOFR Average), 2/20/53(7) | | 16,873 | 793,375 |
| Series 2023-22, Class SA, 0.37%, (5.70% - 30-day SOFR Average), 2/20/53(7) | | 24,843 | 748,177 |
| Series 2023-24, Class SB, 0.00%, (5.15% - 30-day SOFR Average, Floor 0.00%), 2/20/53(7) | | 33,746 | 720,393 |
| Series 2023-24, Class SG, 0.97%, (6.30% - 30-day SOFR Average), 2/20/53(7) | | 16,873 | 793,375 |
| Series 2023-32, Class SA, 0.97%, (6.30% - 30-day SOFR Average), 2/20/53(7) | | 56,946 | 2,677,641 |
| Series 2023-38, Class LS, 0.97%, (6.30% - 30-day SOFR Average), 3/20/53(7) | | 54,396 | 2,547,942 |
| Series 2023-38, Class SD, 0.92%, (6.25% - 30-day SOFR Average), 3/20/53(7) | | 75,014 | 3,164,770 |
| Series 2023-38, Class SG, 0.87%, (6.20% - 30-day SOFR Average), 3/20/53(7) | | 42,304 | 1,884,142 |
| Series 2023-47, Class HS, 0.97%, (6.30% - 30-day SOFR Average), 3/20/53(7) | | 18,132 | 849,314 |
| Series 2023-47, Class SC, 0.92%, (6.25% - 30-day SOFR Average), 3/20/53(7) | | 27,154 | 1,241,917 |
| Series 2023-53, Class SK, 0.87%, (6.20% - 30-day SOFR Average), 4/20/53(7) | | 34,677 | 1,727,492 |
| Series 2024-64, Class EI, 6.50%, 4/20/64 | | 28,146 | 4,193,116 |
| GS Mortgage-Backed Securities Trust: | | | |
| Series 2022-PJ6, Class B4, 3.183%, 1/25/53(1)(4) | | 1,921 | 1,056,150 |
| Series 2024-PJ1, Class B3, 7.293%, 6/25/54(1)(4) | | 5,757 | 5,873,543 |
| LHOME Mortgage Trust: | | | |
| Series 2023-RTL2, Class A1, 8.00% to 1/25/26, 6/25/28(1)(6) | | 2,775 | 2,821,931 |
| Series 2023-RTL3, Class A1, 8.00% to 3/25/26, 8/25/28(1)(6) | | 13,700 | 13,953,425 |
| Series 2023-RTL4, Class A1, 7.628% to 8/25/25, 11/25/28(1)(6) | | 13,631 | 13,832,660 |
| Mello Warehouse Securitization Trust, Series 2021-3, Class E, 8.681%, (1 mo. SOFR + 3.364%), 11/25/55(1)(3) | | 1,500 | 1,510,526 |
| MFRA Trust, Series 2023-NQM1, Class A2, 5.75% to 1/25/26, 11/25/67(1)(6) | | 853 | 845,914 |
| NYMT Loan Trust, Series 2024-BPL1, Class A1, 7.154% to 7/25/26, 2/25/29(1)(6) | | 11,820 | 11,751,166 |
| PNMAC GMSR Issuer Trust: | | | |
| 2024 Participation, 11.068%, (30-day SOFR Average + 5.75%), 12/24/24(3) | | 14,326 | 14,438,746 |
| Security | Principal
Amount
(000's omitted) | Value |
| PNMAC GMSR Issuer Trust: (continued) | | | |
| Series 2022-GT1, Class A, 9.58%, (30-day SOFR Average + 4.25%), 5/25/27(1)(3) | $ | 6,000 | $ 6,091,890 |
| Series 2024-GT1, Class A, 8.517%, (1 mo. SOFR + 3.20%), 3/25/29(1)(3) | | 25,000 | 25,294,918 |
| PRPM LLC: | | | |
| Series 2024-RCF1, Class A3, 4.00% to 1/25/26, 1/25/54(1)(6) | | 2,700 | 2,393,606 |
| Series 2024-RCF2, Class A3, 3.75% to 3/25/26, 3/25/54(1)(6) | | 2,000 | 1,744,845 |
| Radnor RE Ltd., Series 2022-1, Class M1A, 9.08%, (30-day SOFR Average + 3.75%), 9/25/32(1)(3) | | 5,087 | 5,161,065 |
| Saluda Grade Alternative Mortgage Trust: | | | |
| Series 2024-RTL4, Class A1, 7.50% to 7/25/26, 2/25/30(1)(6) | | 15,500 | 15,613,685 |
| Series 2024-RTL5, Class A1, 7.762% to 9/25/26, 4/25/30(1)(6) | | 12,000 | 12,107,827 |
| Sequoia Mortgage Trust, Series 2024-3, Class B4, 6.561%, 4/25/54(1)(4) | | 1,551 | 1,430,639 |
| Unison Trust, Series 2021-1, Class A, 4.50%, 4/25/50(1)(4) | | 52,433 | 46,813,654 |
Total Collateralized Mortgage Obligations
(identified cost $1,410,749,894) | | | $1,297,526,259 |
| Commercial Mortgage-Backed Securities — 0.7% |
| Security | Principal
Amount
(000's omitted) | Value |
| CSMC Trust, Series 2022-NWPT, Class A, 8.464%, (1 mo. SOFR + 3.143%), 9/9/24(1)(3) | $ | 4,200 | $ 4,220,876 |
| GWT Trust, Series 2024-WLF2, Class D, (1 mo. SOFR + 2.939%), 5/15/41(1)(3)(5) | | 8,000 | 7,980,000 |
| JPMBB Commercial Mortgage Securities Trust: | | | |
| Series 2014-C22, Class D, 4.71%, 9/15/47(1)(4) | | 2,160 | 1,297,787 |
| Series 2014-C25, Class D, 4.079%, 11/15/47(1)(4) | | 5,855 | 3,166,410 |
| Med Trust, Series 2021-MDLN, Class E, 8.586%, (1 mo. SOFR + 3.264%), 11/15/38(1)(3) | | 5,265 | 5,253,524 |
| WF-RBS Commercial Mortgage Trust, Series 2014-C24, Class D, 3.692%, 11/15/47(1) | | 4,000 | 2,220,496 |
Total Commercial Mortgage-Backed Securities
(identified cost $28,029,577) | | | $ 24,139,093 |
28
See Notes to Consolidated Financial Statements.
Global Opportunities Portfolio
April 30, 2024
Consolidated Portfolio of Investments (Unaudited) — continued
| Security | Shares | Value |
| Bermuda — 0.0%(11) |
| Liberty Latin America Ltd., Class A(12) | | 105,100 | $ 793,505 |
| | | | $ 793,505 |
| Bulgaria — 0.1% |
| Eurohold Bulgaria AD(12) | | 5,122,844 | $ 3,668,317 |
| | | | $ 3,668,317 |
| Canada — 0.0%(11) |
| Canacol Energy Ltd. | | 147,000 | $ 528,566 |
| | | | $ 528,566 |
| Iceland — 0.0%(11) |
| Siminn Hf. | | 2,023,336 | $ 143,404 |
| | | | $ 143,404 |
Total Common Stocks
(identified cost $6,369,220) | | | $ 5,133,792 |
| Security | Principal
Amount
(000's omitted) | Value |
| Bermuda — 0.1% |
| Jazz Investments I Ltd., 2.00%, 6/15/26 | USD | 1,305 | $ 1,260,956 |
| NCL Corp. Ltd., 1.125%, 2/15/27 | USD | 1,610 | 1,479,711 |
| | | | $ 2,740,667 |
| Canada — 0.1% |
| Shopify, Inc., 0.125%, 11/1/25 | USD | 1,395 | $ 1,310,603 |
| | | | $ 1,310,603 |
| Cayman Islands — 0.2% |
| Li Auto, Inc., 0.25%, 5/1/28 | USD | 890 | $ 1,019,717 |
| Poseidon Finance 1 Ltd., 0.00%, 2/1/25(13) | USD | 1,260 | 1,282,995 |
| Sea Ltd., 2.375%, 12/1/25 | USD | 2,090 | 2,196,590 |
| ZTO Express Cayman, Inc., 1.50%, 9/1/27 | USD | 1,308 | 1,267,779 |
| | | | $ 5,767,081 |
| China — 0.2% |
| Meituan, 0.00%, 4/27/27(13) | USD | 4,400 | $ 4,139,300 |
| Security | Principal
Amount
(000's omitted) | Value |
| China (continued) |
| PDD Holdings, Inc., 0.00%, 12/1/25 | USD | 1,260 | $ 1,234,674 |
| Sunac China Holdings Ltd., 1.00%, 9/30/32(13)(14) | USD | 257 | 14,113 |
| | | | $ 5,388,087 |
| France — 0.0%(11) |
| Veolia Environnement SA, 0.00%, 1/1/25(13) | EUR | 2,000 | $ 667,272 |
| | | | $ 667,272 |
| Germany — 0.0%(11) |
| Deutsche Post AG, 0.05%, 6/30/25(13) | EUR | 1,200 | $ 1,227,956 |
| | | | $ 1,227,956 |
| India — 0.1% |
| Indiabulls Housing Finance Ltd., 4.50%, 9/28/26(13) | USD | 1,325 | $ 1,298,977 |
| | | | $ 1,298,977 |
| Israel — 0.0%(11) |
| Nice Ltd., 0.00%, 9/15/25 | USD | 765 | $ 760,410 |
| | | | $ 760,410 |
| Luxembourg — 0.0%(11) |
| Citigroup Global Markets Funding Luxembourg SCA, 0.00%, 7/25/24(13) | HKD | 6,000 | $ 754,727 |
| | | | $ 754,727 |
| Netherlands — 0.0%(11) |
| STMicroelectronics NV, Series A, 0.00%, 8/4/25(13) | USD | 400 | $ 425,247 |
| | | | $ 425,247 |
| South Africa — 0.0%(11) |
| HTA Group Ltd., 2.875%, 3/18/27(13) | USD | 600 | $ 535,172 |
| | | | $ 535,172 |
| South Korea — 0.0%(11) |
| LG Chem Ltd., 1.60%, 7/18/30(13) | USD | 1,300 | $ 1,175,200 |
| | | | $ 1,175,200 |
| Spain — 0.0%(11) |
| Cellnex Telecom SA, 0.50%, 7/5/28(13) | EUR | 800 | $ 870,301 |
| | | | $ 870,301 |
29
See Notes to Consolidated Financial Statements.
Global Opportunities Portfolio
April 30, 2024
Consolidated Portfolio of Investments (Unaudited) — continued
| Security | Principal
Amount
(000's omitted) | Value |
| United Arab Emirates — 0.0%(11) |
| Abu Dhabi National Oil Co., 0.70%, 6/4/24(13) | USD | 400 | $ 395,618 |
| | | | $ 395,618 |
| United Kingdom — 0.0%(11) |
| Barclays Bank PLC, 1.00%, 2/16/29 | USD | 1,151 | $ 1,146,937 |
| | | | $ 1,146,937 |
| United States — 2.7% |
| Airbnb, Inc., 0.00%, 3/15/26 | USD | 2,025 | $ 1,866,037 |
| Akamai Technologies, Inc., 1.125%, 2/15/29(1) | USD | 2,715 | 2,683,777 |
| Alnylam Pharmaceuticals, Inc., 1.00%, 9/15/27 | USD | 1,230 | 1,131,969 |
| Amphastar Pharmaceuticals, Inc., 2.00%, 3/15/29(1) | USD | 1,210 | 1,173,942 |
| Axon Enterprise, Inc., 0.50%, 12/15/27 | USD | 870 | 1,270,635 |
| Bentley Systems, Inc., 0.125%, 1/15/26 | USD | 1,325 | 1,346,200 |
| BILL Holdings, Inc., 0.00%, 12/1/25 | USD | 970 | 896,765 |
| BioMarin Pharmaceutical, Inc., 1.25%, 5/15/27 | USD | 1,500 | 1,467,375 |
| BlackLine, Inc., 0.00%, 3/15/26 | USD | 975 | 879,328 |
| Block, Inc., 0.25%, 11/1/27 | USD | 1,990 | 1,633,292 |
| Burlington Stores, Inc., 2.25%, 4/15/25 | USD | 845 | 888,518 |
| Cable One, Inc., 0.00%, 3/15/26 | USD | 800 | 694,000 |
| Carnival Corp., 5.75%, 12/1/27 | USD | 630 | 888,300 |
| Cloudflare, Inc., 0.00%, 8/15/26 | USD | 1,200 | 1,095,900 |
| Confluent, Inc., 0.00%, 1/15/27(1) | USD | 1,285 | 1,092,250 |
| CryoPort, Inc., 0.75%, 12/1/26(1) | USD | 820 | 711,104 |
| Cytokinetics, Inc., 3.50%, 7/1/27 | USD | 665 | 951,257 |
| Datadog, Inc., 0.125%, 6/15/25 | USD | 1,045 | 1,494,872 |
| Dayforce, Inc., 0.25%, 3/15/26 | USD | 1,290 | 1,176,480 |
| Dexcom, Inc., 0.375%, 5/15/28(1) | USD | 2,025 | 2,060,868 |
| DraftKings Holdings, Inc., 0.00%, 3/15/28 | USD | 1,725 | 1,436,062 |
| Dropbox, Inc., 0.00%, 3/1/26 | USD | 1,265 | 1,188,220 |
| Duke Energy Corp., 4.125%, 4/15/26 | USD | 1,330 | 1,322,346 |
| Enphase Energy, Inc., 0.00%, 3/1/26 | USD | 1,045 | 946,493 |
| Envista Holdings Corp., 1.75%, 8/15/28(1) | USD | 1,120 | 956,200 |
| Etsy, Inc., 0.25%, 6/15/28 | USD | 1,520 | 1,198,520 |
| Euronet Worldwide, Inc., 0.75%, 3/15/49 | USD | 560 | 545,160 |
| Evergy, Inc., 4.50%, 12/15/27(1) | USD | 1,295 | 1,296,779 |
| Evolent Health, Inc., 3.50%, 12/1/29(1) | USD | 805 | 841,842 |
| Exact Sciences Corp.: | | | |
| 0.375%, 3/1/28 | USD | 1,415 | 1,230,342 |
| 2.00%, 3/1/30(1) | USD | 500 | 516,250 |
| Expedia Group, Inc., 0.00%, 2/15/26 | USD | 1,120 | 1,034,359 |
| Federal Realty OP LP, 3.25%, 1/15/29(1) | USD | 975 | 952,088 |
| Five9, Inc., 1.00%, 3/15/29(1) | USD | 1,635 | 1,618,241 |
| Ford Motor Co., 0.00%, 3/15/26 | USD | 2,200 | 2,198,900 |
| Security | Principal
Amount
(000's omitted) | Value |
| United States (continued) |
| Glencore Funding LLC, 0.00%, 3/27/25(13) | USD | 1,400 | $ 1,508,817 |
| Global Payments, Inc., 1.50%, 3/1/31(1) | USD | 2,200 | 2,197,800 |
| Halozyme Therapeutics, Inc., 1.00%, 8/15/28 | USD | 1,155 | 1,089,165 |
| Insmed, Inc., 0.75%, 6/1/28 | USD | 1,105 | 1,129,223 |
| Insulet Corp., 0.375%, 9/1/26 | USD | 1,200 | 1,237,321 |
| Integra LifeSciences Holdings Corp., 0.50%, 8/15/25 | USD | 560 | 524,580 |
| InterDigital, Inc.: | | | |
| 2.00%, 6/1/24 | USD | 250 | 303,594 |
| 3.50%, 6/1/27 | USD | 455 | 618,664 |
| Ionis Pharmaceuticals, Inc., 0.00%, 4/1/26 | USD | 1,335 | 1,290,420 |
| Lantheus Holdings, Inc., 2.625%, 12/15/27 | USD | 940 | 1,063,423 |
| Liberty Broadband Corp., 3.125%, 3/31/53(1) | USD | 1,075 | 1,003,943 |
| Liberty Media Corp.-Liberty Formula One, 2.25%, 8/15/27 | USD | 1,255 | 1,308,442 |
| Live Nation Entertainment, Inc., 2.00%, 2/15/25 | USD | 770 | 790,752 |
| Lumentum Holdings, Inc., 0.50%, 6/15/28 | USD | 665 | 506,580 |
| Marriott Vacations Worldwide Corp., 3.25%, 12/15/27 | USD | 1,170 | 1,073,475 |
| Match Group Financeco 3, Inc., 2.00%, 1/15/30(1) | USD | 750 | 612,900 |
| Merit Medical Systems, Inc., 3.00%, 2/1/29(1) | USD | 855 | 919,125 |
| MongoDB, Inc., 0.25%, 1/15/26 | USD | 600 | 1,066,777 |
| NextEra Energy Capital Holdings, Inc., 3.00%, 3/1/27(1) | USD | 1,440 | 1,573,200 |
| NextEra Energy Partners LP, 2.50%, 6/15/26(1) | USD | 1,730 | 1,560,832 |
| NRG Energy, Inc., 2.75%, 6/1/48 | USD | 1,205 | 2,159,962 |
| NuVasive, Inc., 0.375%, 3/15/25 | USD | 805 | 768,574 |
| Okta, Inc., 0.125%, 9/1/25 | USD | 1,075 | 1,018,563 |
| ON Semiconductor Corp., 0.50%, 3/1/29 | USD | 2,535 | 2,455,781 |
| Palo Alto Networks, Inc., 0.375%, 6/1/25 | USD | 880 | 2,576,200 |
| PG&E Corp., 4.25%, 12/1/27(1) | USD | 1,585 | 1,589,359 |
| Post Holdings, Inc., 2.50%, 8/15/27 | USD | 1,140 | 1,277,940 |
| PPL Capital Funding, Inc., 2.875%, 3/15/28 | USD | 1,275 | 1,212,844 |
| Rapid7, Inc.: | | | |
| 0.25%, 3/15/27 | USD | 1,040 | 901,550 |
| 1.25%, 3/15/29(1) | USD | 400 | 388,720 |
| Rivian Automotive, Inc., 4.625%, 3/15/29 | USD | 985 | 673,740 |
| Sarepta Therapeutics, Inc., 1.25%, 9/15/27 | USD | 1,110 | 1,272,282 |
| Shift4 Payments, Inc., 0.50%, 8/1/27 | USD | 1,525 | 1,360,452 |
| Shockwave Medical, Inc., 1.00%, 8/15/28(1) | USD | 895 | 1,138,595 |
| Snap, Inc., 0.00%, 5/1/27 | USD | 1,375 | 1,121,313 |
| Southwest Airlines Co., 1.25%, 5/1/25 | USD | 747 | 734,861 |
| Spotify USA, Inc., 0.00%, 3/15/26 | USD | 1,325 | 1,232,250 |
| Super Micro Computer, Inc., 0.00%, 3/1/29(1) | USD | 645 | 659,835 |
| Tyler Technologies, Inc., 0.25%, 3/15/26 | USD | 1,240 | 1,305,720 |
30
See Notes to Consolidated Financial Statements.
Global Opportunities Portfolio
April 30, 2024
Consolidated Portfolio of Investments (Unaudited) — continued
| Security | Principal
Amount
(000's omitted) | Value |
| United States (continued) |
| Uber Technologies, Inc., 0.00%, 12/15/25 | USD | 2,235 | $ 2,329,987 |
| Western Digital Corp., 3.00%, 11/15/28(1) | USD | 1,180 | 1,785,340 |
| Wolfspeed, Inc., 1.875%, 12/1/29 | USD | 1,695 | 980,134 |
| Ziff Davis, Inc., 1.75%, 11/1/26 | USD | 630 | 572,906 |
| Zscaler, Inc., 0.125%, 7/1/25 | USD | 1,025 | 1,302,775 |
| | | | $ 94,883,387 |
Total Convertible Bonds
(identified cost $119,114,076) | | | $ 119,347,642 |
| Convertible Preferred Stocks — 0.2% |
| Security | Shares | Value |
| United States — 0.2% |
| Bank of America Corp., Series L, 7.25% | | 2,150 | $ 2,472,500 |
| Wells Fargo & Co., Series L, Class A, 7.50% | | 2,400 | 2,749,056 |
Total Convertible Preferred Stocks
(identified cost $5,508,019) | | | $ 5,221,556 |
| Exchange-Traded Funds — 0.4% |
| Security | Shares | Value |
| Equity Funds — 0.4% |
| ProShares Short VIX Short-Term Futures ETF | | 224,200 | $ 12,281,676 |
Total Exchange-Traded Funds
(identified cost $11,075,571) | | | $ 12,281,676 |
| Foreign Corporate Bonds — 7.3% |
| Security | Principal
Amount
(000's omitted) | Value |
| Argentina — 0.1% |
| Pan American Energy LLC, 8.50%, 4/30/32(1) | USD | 3,560 | $ 3,592,040 |
| | | | $ 3,592,040 |
| Brazil — 1.1% |
| 3R Lux SARL, 9.75%, 2/5/31(1) | USD | 2,558 | $ 2,691,291 |
| Banco BTG Pactual SA, 6.25%, 4/8/29(1) | USD | 2,438 | 2,420,459 |
| Braskem Netherlands Finance BV, 8.50% to 10/24/25, 1/23/81(13)(15) | USD | 4,982 | 4,888,409 |
| Coruripe Netherlands BV, 10.00%, 2/10/27(13) | USD | 5,979 | 5,346,893 |
| Security | Principal
Amount
(000's omitted) | Value |
| Brazil (continued) |
| FORESEA Holding SA, 7.50%, 6/15/30(13) | USD | 7,190 | $ 6,677,075 |
| Gol Finance SA, 15.813%, (1 mo. SOFR + 10.50%), 1/29/25(1)(3) | USD | 1,069 | 1,159,992 |
| MC Brazil Downstream Trading SARL: | | | |
| 7.25%, 6/30/31(1) | USD | 2,305 | 1,998,378 |
| 7.25%, 6/30/31(13) | USD | 2,661 | 2,307,101 |
| MV24 Capital BV, 6.748%, 6/1/34(13) | USD | 5,140 | 4,731,425 |
| Samarco Mineracao SA, 9.50%, 6/30/31(13)(14) | USD | 5,915 | 5,401,954 |
| Vale SA, Series A6, 1.378%(16)(17) | BRL | 14,736 | 950,717 |
| | | | $ 38,573,694 |
| Bulgaria — 0.1% |
| Bulgarian Energy Holding EAD, 2.45%, 7/22/28(13) | EUR | 3,738 | $ 3,565,224 |
| | | | $ 3,565,224 |
| Burkina Faso — 0.1% |
| Endeavour Mining PLC, 5.00%, 10/14/26(13) | USD | 3,883 | $ 3,659,724 |
| | | | $ 3,659,724 |
| Canada — 0.1% |
| Aris Gold Corp., 7.50%, 8/26/27 | USD | 2,105 | $ 2,141,569 |
| | | | $ 2,141,569 |
| Chile — 0.4% |
| AES Andes SA: | | | |
| 6.30%, 3/15/29(1) | USD | 1,541 | $ 1,520,497 |
| 6.35% to 1/7/25, 10/7/79(13)(15) | USD | 1,001 | 975,470 |
| 7.125% to 5/20/24, 3/26/79(13)(15) | USD | 3,738 | 3,699,394 |
| Banco de Credito e Inversiones SA, 8.75% to 2/8/29(1)(15)(16) | USD | 1,161 | 1,190,635 |
| Inversiones La Construccion SA, 4.75%, 2/7/32(13) | USD | 6,359 | 5,484,638 |
| | | | $ 12,870,634 |
| China — 0.2% |
| China Oil & Gas Group Ltd., 4.70%, 6/30/26(13) | USD | 5,244 | $ 4,553,320 |
| Kaisa Group Holdings Ltd., 9.375%, 6/30/24(13)(18) | USD | 850 | 24,437 |
| KWG Group Holdings Ltd., 7.875%, 8/30/24(18) | USD | 519 | 25,950 |
| Longfor Group Holdings Ltd., 3.85%, 1/13/32(13) | USD | 1,699 | 905,773 |
| Shimao Group Holdings Ltd., 5.60%, 7/15/26(13)(18) | USD | 4,343 | 152,005 |
| Sunac China Holdings Ltd.: | | | |
| 6.00%, (5.00% cash or 6.00% PIK), 9/30/26(13)(14) | USD | 213 | 22,339 |
31
See Notes to Consolidated Financial Statements.
Global Opportunities Portfolio
April 30, 2024
Consolidated Portfolio of Investments (Unaudited) — continued
| Security | Principal
Amount
(000's omitted) | Value |
| China (continued) |
| Sunac China Holdings Ltd.: (continued) | | | |
| 6.25%, (5.25% cash or 6.25% PIK), 9/30/27(13)(14) | USD | 213 | $ 20,804 |
| 6.50%, (5.50% cash or 6.50% PIK), 9/30/27(13)(14) | USD | 427 | 34,122 |
| 6.75%, (5.75% cash or 6.75% PIK), 9/30/28(13)(14) | USD | 641 | 47,767 |
| 7.00%, (6.00% cash or 7.00% PIK), 9/30/29(13)(14) | USD | 641 | 42,489 |
| 7.25%, (6.25% cash or 7.25% PIK), 9/30/30(13)(14) | USD | 302 | 16,590 |
| Times China Holdings Ltd.: | | | |
| 5.55%, 6/4/24(13)(18) | USD | 2,221 | 57,524 |
| 6.75%, 7/16/23(13)(18) | USD | 1,041 | 23,422 |
| West China Cement Ltd., 4.95%, 7/8/26(13) | USD | 530 | 432,192 |
| | | | $ 6,358,734 |
| Colombia — 0.4% |
| ABRA Global Finance, 11.50%, (6.00% cash and 5.50% PIK), 3/2/28(1) | USD | 1,655 | $ 1,499,531 |
| Aris Mining Corp., 6.875%, 8/9/26(13) | USD | 1,758 | 1,632,461 |
| Avianca Midco 2 PLC, 9.00%, 12/1/28(13) | USD | 4,301 | 4,064,437 |
| Banco Davivienda SA, 6.65% to 4/22/31(13)(15)(16) | USD | 1,417 | 993,755 |
| Bancolombia SA, 6.909%, 10/18/27 | USD | 485 | 480,400 |
| Canacol Energy Ltd., 5.75%, 11/24/28(13) | USD | 6,429 | 3,033,427 |
| SierraCol Energy Andina LLC, 6.00%, 6/15/28(13) | USD | 2,114 | 1,831,724 |
| | | | $ 13,535,735 |
| Costa Rica — 0.1% |
| Liberty Costa Rica Senior Secured Finance, 10.875%, 1/15/31(1) | USD | 2,290 | $ 2,380,146 |
| | | | $ 2,380,146 |
| Cyprus — 0.0%(11) |
| Bank of Cyprus PLC: | | | |
| 7.375% to 7/25/27, 7/25/28(13)(15) | EUR | 615 | $ 704,634 |
| 11.875% to 12/21/28(13)(15)(16) | EUR | 213 | 249,977 |
| | | | $ 954,611 |
| Georgia — 0.4% |
| Bank of Georgia JSC: | | | |
| 9.50% to 7/16/29(1)(15)(16) | USD | 200 | $ 198,566 |
| 9.50% to 7/16/29(13)(15)(16) | USD | 3,971 | 3,942,528 |
| TBC Bank JSC: | | | |
| 8.894% to 11/6/26(13)(15)(16) | USD | 3,132 | 3,006,720 |
| Security | Principal
Amount
(000's omitted) | Value |
| Georgia (continued) |
| TBC Bank JSC: (continued) | | | |
| 10.25% to 7/30/29(13)(15)(16) | USD | 5,170 | $ 5,165,759 |
| | | | $ 12,313,573 |
| Ghana — 0.1% |
| Kosmos Energy Ltd., 7.50%, 3/1/28(13) | USD | 2,199 | $ 2,102,364 |
| Tullow Oil PLC, 10.25%, 5/15/26(13) | USD | 2,624 | 2,558,531 |
| | | | $ 4,660,895 |
| Greece — 0.4% |
| Alpha Services & Holdings SA, 5.50% to 3/11/26, 6/11/31(13)(15) | EUR | 2,712 | $ 2,854,452 |
| National Bank of Greece SA, 8.00% to 10/3/28, 1/3/34(13)(15) | EUR | 1,745 | 2,029,813 |
| Piraeus Financial Holdings SA: | | | |
| 5.50% to 2/19/25, 2/19/30(13)(15) | EUR | 810 | 855,715 |
| 7.25% to 1/17/29, 4/17/34(13)(15) | EUR | 2,200 | 2,429,264 |
| 8.75% to 6/16/26(13)(15)(16) | EUR | 4,978 | 5,273,557 |
| | | | $ 13,442,801 |
| Honduras — 0.0%(11) |
| Inversiones Atlantida SA, 7.50%, 5/19/26(13) | USD | 787 | $ 770,866 |
| | | | $ 770,866 |
| Hong Kong — 0.1% |
| Yuexiu REIT MTN Co. Ltd., 2.65%, 2/2/26(13) | USD | 5,517 | $ 4,871,928 |
| | | | $ 4,871,928 |
| Hungary — 0.2% |
| MBH Bank Nyrt, 8.625% to 10/19/26, 10/19/27(13)(15) | EUR | 3,074 | $ 3,462,859 |
| OTP Bank Nyrt, 8.75% to 2/15/28, 5/15/33(13)(15) | USD | 3,696 | 3,816,120 |
| | | | $ 7,278,979 |
| Iceland — 0.0% |
| Wow Air Hf.: | | | |
| 0.00% (16)(18)(19) | EUR | 20 | $ 0 |
| 0.00%, (3 mo. EURIBOR + 9.00%)(16)(18)(19) | EUR | 900 | 0 |
| | | | $ 0 |
| India — 0.2% |
| Vedanta Resources Finance II PLC: | | | |
| 13.875%, 1/21/27(13) | USD | 2,246 | $ 2,106,569 |
32
See Notes to Consolidated Financial Statements.
Global Opportunities Portfolio
April 30, 2024
Consolidated Portfolio of Investments (Unaudited) — continued
| Security | Principal
Amount
(000's omitted) | Value |
| India (continued) |
| Vedanta Resources Finance II PLC: (continued) | | | |
| 13.875%, 12/9/28(13) | USD | 6,073 | $ 5,528,453 |
| | | | $ 7,635,022 |
| Indonesia — 0.4% |
| Indika Energy Tbk. PT, 8.75%, 5/7/29(1)(2) | USD | 5,330 | $ 5,265,115 |
| LLPL Capital Pte. Ltd., 6.875%, 2/4/39(13) | USD | 3,538 | 3,411,533 |
| Minejesa Capital BV: | | | |
| 4.625%, 8/10/30(13) | USD | 4,110 | 3,847,153 |
| 5.625%, 8/10/37(13) | USD | 1,343 | 1,164,916 |
| | | | $ 13,688,717 |
| Kazakhstan — 0.0%(11) |
| Tengizchevroil Finance Co. International Ltd., 4.00%, 8/15/26(13) | USD | 1,482 | $ 1,398,583 |
| | | | $ 1,398,583 |
| Mauritius — 0.1% |
| Azure Power Energy Ltd., 3.575%, 8/19/26(13) | USD | 3,706 | $ 3,317,807 |
| | | | $ 3,317,807 |
| Mexico — 0.9% |
| Alpha Holding SA de CV: | | | |
| 9.00%, 2/10/25(13)(18) | USD | 2,654 | $ 39,807 |
| 10.00%, 12/19/22(13)(18) | USD | 1,440 | 21,597 |
| Banco Mercantil del Norte SA: | | | |
| 5.875% to 1/24/27(13)(15)(16) | USD | 433 | 404,245 |
| 7.625% to 1/10/28(13)(15)(16) | USD | 563 | 549,359 |
| 8.375% to 10/14/30(13)(15)(16) | USD | 1,314 | 1,309,079 |
| BBVA Bancomer SA: | | | |
| 5.125% to 1/17/28, 1/18/33(13)(15) | USD | 2,994 | 2,735,075 |
| 8.45% to 6/29/33, 6/29/38(1)(15) | USD | 1,097 | 1,133,295 |
| Grupo Aeromexico SAB de CV, 8.50%, 3/17/27(13) | USD | 2,422 | 2,376,390 |
| Grupo Kaltex SA de CV, 14.50%, (13.00% cash and 1.50% PIK), 9/30/25(1) | USD | 2,592 | 2,138,400 |
| Petroleos Mexicanos: | | | |
| 6.75%, 9/21/47 | USD | 6,226 | 3,978,821 |
| 6.84%, 1/23/30 | USD | 9,213 | 7,990,749 |
| 6.875%, 8/4/26 | USD | 5,578 | 5,417,439 |
| Total Play Telecomunicaciones SA de CV: | | | |
| 6.375%, 9/20/28(13) | USD | 3,653 | 1,952,331 |
| 10.50%, 12/31/28(1) | USD | 1,896 | 1,534,537 |
| | | | $ 31,581,124 |
| Security | Principal
Amount
(000's omitted) | Value |
| Moldova — 0.1% |
| Aragvi Finance International DAC, 8.45%, 4/29/26(13) | USD | 4,037 | $ 3,308,725 |
| | | | $ 3,308,725 |
| Nigeria — 0.1% |
| Access Bank PLC, 6.125%, 9/21/26(13) | USD | 2,608 | $ 2,425,440 |
| SEPLAT Energy PLC, 7.75%, 4/1/26(13) | USD | 1,280 | 1,239,903 |
| | | | $ 3,665,343 |
| Panama — 0.2% |
| AES Panama Generation Holdings SRL, 4.375%, 5/31/30(13) | USD | 6,435 | $ 5,415,978 |
| | | | $ 5,415,978 |
| Paraguay — 0.1% |
| Frigorifico Concepcion SA: | | | |
| 7.70%, 7/21/28(1) | USD | 2,421 | $ 2,118,054 |
| 7.70%, 7/21/28(13) | USD | 2,453 | 2,146,049 |
| | | | $ 4,264,103 |
| Peru — 0.3% |
| Auna SAA, 10.00%, 12/15/29(1) | USD | 5,696 | $ 5,859,027 |
| Peru LNG SRL, 5.375%, 3/22/30(13) | USD | 3,067 | 2,619,785 |
| Telefonica del Peru SAA, 7.375%, 4/10/27(13) | PEN | 4,500 | 921,385 |
| | | | $ 9,400,197 |
| Romania — 0.1% |
| Banca Transilvania SA: | | | |
| 7.25% to 12/7/27, 12/7/28(13)(15) | EUR | 2,058 | $ 2,287,447 |
| 8.875% to 4/27/26, 4/27/27(13)(15) | EUR | 482 | 544,596 |
| | | | $ 2,832,043 |
| Russia — 0.0% |
| Tinkoff Bank JSC Via TCS Finance Ltd., 6.00% to 12/20/26(13)(15)(16)(19) | USD | 1,226 | $ 0 |
| | | | $ 0 |
| Saint Lucia — 0.1% |
| Digicel Intermediate Holdings Ltd./Digicel International Finance Ltd./DIFL U.S., 10.50%, (9.00% cash and 1.50% PIK), 5/25/27 | USD | 4,218 | $ 4,094,882 |
| | | | $ 4,094,882 |
33
See Notes to Consolidated Financial Statements.
Global Opportunities Portfolio
April 30, 2024
Consolidated Portfolio of Investments (Unaudited) — continued
| Security | Principal
Amount
(000's omitted) | Value |
| Singapore — 0.2% |
| Indika Energy Capital IV Pte. Ltd., 8.25%, 10/22/25(13) | USD | 2,913 | $ 2,936,658 |
| Puma International Financing SA, 7.75%, 4/25/29(1) | USD | 2,737 | 2,771,951 |
| | | | $ 5,708,609 |
| South Africa — 0.1% |
| Sasol Financing USA LLC: | | | |
| 5.50%, 3/18/31 | USD | 3,249 | $ 2,703,366 |
| 6.50%, 9/27/28 | USD | 2,105 | 2,000,752 |
| | | | $ 4,704,118 |
| Spain — 0.0%(11) |
| International Airport Finance SA, 12.00%, 3/15/33(13) | USD | 610 | $ 650,455 |
| | | | $ 650,455 |
| Trinidad and Tobago — 0.0%(11) |
| Telecommunications Services of Trinidad & Tobago Ltd., 8.875%, 10/18/29(13) | USD | 784 | $ 760,586 |
| | | | $ 760,586 |
| Turkey — 0.4% |
| Limak Iskenderun Uluslararasi Liman Isletmeciligi AS, 9.50%, 7/10/36(13) | USD | 3,229 | $ 2,985,728 |
| Sisecam U.K. PLC, 8.25%, 5/2/29(1)(2) | USD | 3,190 | 3,250,948 |
| Ulker Biskuvi Sanayi AS, 6.95%, 10/30/25(13) | USD | 2,437 | 2,429,799 |
| WE Soda Investments Holding PLC, 9.50%, 10/6/28(13) | USD | 3,999 | 4,138,677 |
| | | | $ 12,805,152 |
| United Kingdom — 0.0%(11) |
| Avianca Midco 2 PLC, 9.00%, 12/1/28(13) | USD | 708 | $ 668,755 |
| | | | $ 668,755 |
| Uzbekistan — 0.1% |
| Ipoteka-Bank ATIB, 20.50%, 4/25/27(13) | UZS | 51,340,000 | $ 4,071,317 |
| | | | $ 4,071,317 |
| Security | Principal
Amount
(000's omitted) | Value |
| Vietnam — 0.1% |
| Mong Duong Finance Holdings BV, 5.125%, 5/7/29(13) | USD | 4,440 | $ 4,238,426 |
| | | | $ 4,238,426 |
Total Foreign Corporate Bonds
(identified cost $265,447,329) | | | $ 255,181,095 |
| Loan Participation Notes — 0.5% |
| Security | Principal
Amount
(000's omitted) | Value |
| Uzbekistan — 0.5% |
| Daryo Finance BV (borrower - Uzbek Industrial and Construction Bank ATB), 18.75%, 6/15/25(13)(19)(20) | UZS | 195,502,870 | $ 16,654,946 |
| Europe Asia Investment Finance BV (borrower - Joint Stock Commercial Bank “Asaka”), 18.70%, 7/21/26(13)(19)(20) | UZS | 3,683,800 | 302,265 |
Total Loan Participation Notes
(identified cost $17,103,490) | | | $ 16,957,211 |
| Reinsurance Side Cars — 2.9% |
| Security | Shares | Value |
| Eden Re II Ltd.: | | | |
| Series 2020A, 0.00%, 3/22/24(1)(19)(21)(22) | | 429,924 | $ 147,894 |
| Series 2021A, 0.00%, 3/21/25(1)(19)(21)(22) | | 41,325 | 11,860 |
| Series 2021B, 0.00%, 3/21/25(1)(19)(21)(22) | | 394,291 | 135,242 |
| Series 2022A, 0.00%, 3/20/26(1)(19)(21)(22) | | 839,905 | 485,129 |
| Series 2022B, 0.00%, 3/20/26(1)(19)(21)(22) | | 690,061 | 391,886 |
| Series 2023A, 0.00%, 3/19/27(1)(19)(21)(22) | | 300,000 | 354,600 |
| Series 2023B, 0.00%, 3/19/27(1)(19)(21)(22) | | 118,000 | 139,948 |
| Series 2024A, 0.00%, 3/17/28(1)(19)(21)(22) | | 7,700,000 | 7,947,170 |
| Series 2024B, 0.00%, 3/17/28(1)(19)(21)(22) | | 26,300,000 | 27,215,240 |
| Mt. Logan Re Ltd.: | | | |
| Series 13, Preference Shares(19)(22)(23) | | 10,000 | 17,801,622 |
| Series 17, Preference Shares(12)(19)(22)(23) | | 860 | 1,510,828 |
| Series 19, Preference Shares(12)(19)(22)(23) | | 7,464 | 7,970,859 |
| PartnerRe ILS Fund SAC Ltd.(19)(22)(23) | | 34,000,000 | 35,176,400 |
| Sussex Capital Ltd.: | | | |
| Designated Investment Series 5, 5/19(12)(19)(22)(23) | | 249 | 11,429 |
| Designated Investment Series 5, 12/19(12)(19)(22)(23) | | 791 | 25,264 |
| Designated Investment Series 5, 6/20(12)(19)(22)(23) | | 434 | 30,657 |
| Designated Investment Series 5, 4/21(12)(19)(22)(23) | | 247 | 12,906 |
34
See Notes to Consolidated Financial Statements.
Global Opportunities Portfolio
April 30, 2024
Consolidated Portfolio of Investments (Unaudited) — continued
| Security | Shares | Value |
| Sussex Capital Ltd.: (continued) | | | |
| Designated Investment Series 5, 12/21(12)(19)(22)(23) | | 958 | $ 20,684 |
| Designated Investment Series 5, 11/22(12)(19)(22)(23) | | 958 | 270,936 |
| Designated Investment Series 15, 12/21(12)(19)(22)(23) | | 743 | 16,031 |
| Designated Investment Series 15, 11/22(12)(19)(22)(23) | | 721 | 203,920 |
| Series 5, Preference Shares(12)(19)(22)(23) | | 1,172 | 1,681,380 |
| Series 15, Preference Shares(12)(19)(22)(23) | | 977 | 1,243,212 |
| Sussex Re Ltd.: | | | |
| Series 2020A(12)(19)(22)(23) | | 4,081,939 | 154,706 |
| Series 2021A(12)(19)(22)(23) | | 4,154,232 | 304,505 |
Total Reinsurance Side Cars
(identified cost $91,232,564) | | | $ 103,264,308 |
| Senior Floating-Rate Loans — 0.2%(24) |
| Borrower/Description | Principal
Amount
(000's omitted) | Value |
| Paraguay — 0.1% |
| Frigorifico Concepcion SA, Term Loan, 10.829%, (SOFR + 5.50%), 12/8/26 | $ | 5,420 | $ 5,406,450 |
| | | | $ 5,406,450 |
| Saint Lucia — 0.1% |
| Digicel International Finance Ltd., Term Loan, 5/25/27(25) | $ | 2,994 | $ 2,863,110 |
| | | | $ 2,863,110 |
Total Senior Floating-Rate Loans
(identified cost $8,276,659) | | | $ 8,269,560 |
| Sovereign Government Bonds — 10.3% |
| Security | Principal
Amount
(000's omitted) | Value |
| Benin — 0.1% |
| Benin Government International Bonds: | | | |
| 4.875%, 1/19/32(13) | EUR | 120 | $ 108,832 |
| 6.875%, 1/19/52(13) | EUR | 1,733 | 1,509,315 |
| | | | $ 1,618,147 |
| Security | Principal
Amount
(000's omitted) | Value |
| Czech Republic — 1.4% |
| Czech Republic Government Bonds, 2.00%, 10/13/33 | CZK | 1,436,300 | $ 50,323,396 |
| | | | $ 50,323,396 |
| Dominican Republic — 0.8% |
| Dominican Republic Bonds: | | | |
| 12.00%, 8/8/25(1) | DOP | 450,030 | $ 7,832,751 |
| 12.75%, 9/23/29(1) | DOP | 794,700 | 15,397,724 |
| 13.625%, 2/3/33(1) | DOP | 8,000 | 163,415 |
| Dominican Republic Central Bank Notes: | | | |
| 12.00%, 10/3/25(1) | DOP | 299,010 | 5,215,414 |
| 13.00%, 12/5/25(1) | DOP | 12,940 | 227,412 |
| | | | $ 28,836,716 |
| Egypt — 0.1% |
| Egypt Government International Bonds, 5.625%, 4/16/30(13) | EUR | 5,830 | $ 4,983,365 |
| | | | $ 4,983,365 |
| Iceland — 0.4% |
| Republic of Iceland: | | | |
| 4.50%, 2/17/42 | ISK | 1,468,763 | $ 8,347,477 |
| 6.50%, 1/24/31 | ISK | 285,839 | 1,949,128 |
| 7.00%, 9/17/35 | ISK | 553,340 | 3,951,585 |
| | | | $ 14,248,190 |
| Indonesia — 1.9% |
| Indonesia Treasury Bonds, 7.125%, 6/15/43 | IDR | 1,093,548,000 | $ 67,044,379 |
| | | | $ 67,044,379 |
| Peru — 4.4% |
| Peru Government Bonds: | | | |
| 5.40%, 8/12/34 | PEN | 230,015 | $ 52,842,446 |
| 5.94%, 2/12/29 | PEN | 199,073 | 52,701,871 |
| 6.15%, 8/12/32 | PEN | 65,080 | 16,332,633 |
| 6.714%, 2/12/55 | PEN | 5,641 | 1,364,978 |
| 7.30%, 8/12/33(13) | PEN | 112,565 | 30,136,521 |
| | | | $ 153,378,449 |
| Serbia — 0.8% |
| Serbia Treasury Bonds: | | | |
| 4.50%, 8/20/32 | RSD | 3,319,480 | $ 27,645,016 |
| 5.875%, 2/8/28 | RSD | 3,280 | 30,845 |
| | | | $ 27,675,861 |
35
See Notes to Consolidated Financial Statements.
Global Opportunities Portfolio
April 30, 2024
Consolidated Portfolio of Investments (Unaudited) — continued
| Security | Principal
Amount
(000's omitted) | Value |
| Suriname — 0.4% |
| Suriname Government International Bonds: | | | |
| 0.00%, Oil-Linked, 12/31/50(1) | USD | 4,795 | $ 3,613,032 |
| 7.95%, (4.95% cash and 3.00% PIK), 7/15/33(1) | USD | 10,846 | 10,070,915 |
| | | | $ 13,683,947 |
| Ukraine — 0.0%(11) |
| Ukraine Government Bonds: | | | |
| 15.84%, 2/26/25 | UAH | 2,861 | $ 57,141 |
| 19.19%, 9/30/26 | UAH | 5,023 | 98,519 |
| | | | $ 155,660 |
| Uzbekistan — 0.0%(11) |
| Republic of Uzbekistan Bonds, 16.25%, 10/12/26(13) | UZS | 6,450,000 | $ 513,654 |
| | | | $ 513,654 |
Total Sovereign Government Bonds
(identified cost $378,108,958) | | | $ 362,461,764 |
| U.S. Department of Agriculture Loans — 0.4% |
| Security | Principal
Amount
(000's omitted) | Value |
| USDA Guaranteed Loans: | | | |
| 8.00%, (U.S. (Fed) Prime Rate - 0.50%), 2/16/43(3) | $ | 186 | $ 185,719 |
| 8.00%, (U.S. (Fed) Prime Rate - 0.50%), 2/16/43(3) | | 5,813 | 5,815,627 |
| 8.00%, (U.S. (Fed) Prime Rate - 0.50%), 2/16/43(3) | | 6,225 | 6,227,610 |
| 8.00%, (U.S. (Fed) Prime Rate - 0.50%), 2/16/63(3) | | 1,104 | 1,104,701 |
Total U.S. Department of Agriculture Loans
(identified cost $13,328,294) | | | $ 13,333,657 |
| U.S. Government Agency Commercial Mortgage-Backed Securities — 0.4% |
| Security | Principal
Amount
(000's omitted) | Value |
| FRESB Mortgage Trust: | | | |
| Interest Only:(8) | | | |
| Series 2021-SB91, Class X1, 0.681%, 8/25/41(4) | $ | 23,596 | $ 624,912 |
| Series 2021-SB92, Class X1, 0.682%, 8/25/41(4) | | 23,362 | 495,215 |
| Security | Principal
Amount
(000's omitted) | Value |
| Government National Mortgage Association: | | | |
| Interest Only:(8) | | | |
| Series 2021-101, Class IO, 0.677%, 4/16/63(4) | $ | 26,527 | $ 1,374,352 |
| Series 2021-132, Class IO, 0.726%, 4/16/63(4) | | 64,917 | 3,521,151 |
| Series 2021-144, Class IO, 0.825%, 4/16/63(4) | | 25,526 | 1,535,659 |
| Series 2021-186, Class IO, 0.764%, 5/16/63(4) | | 47,132 | 2,644,777 |
| Series 2022-3, Class IO, 0.64%, 2/16/61(4) | | 67,124 | 3,264,918 |
Total U.S. Government Agency Commercial Mortgage-Backed Securities
(identified cost $17,519,962) | | | $ 13,460,984 |
| U.S. Government Agency Mortgage-Backed Securities — 33.1% |
| Security | Principal
Amount
(000's omitted) | Value |
| Federal Home Loan Mortgage Corp.: | | | |
| 4.462%, (COF + 1.254%), with maturity at 2035(26) | $ | 46 | $ 44,891 |
| 4.745%, (COF + 1.251%), with maturity at 2030(26) | | 45 | 43,493 |
| 6.00%, with various maturities to 2053 | | 4,556 | 4,533,869 |
| 6.50%, with maturity at 2053 | | 5,874 | 5,950,731 |
| 7.00%, with various maturities to 2053 | | 1,337 | 1,389,095 |
| 8.00%, with maturity at 2026 | | 0 (10) | 287 |
| Federal National Mortgage Association: | | | |
| 4.437%, (COF + 1.254%), with maturity at 2035(26) | | 19 | 18,909 |
| 5.224%, (COF + 1.791%), with maturity at 2035(26) | | 281 | 275,343 |
| 5.50%, with maturity at 2052 | | 18,361 | 17,867,329 |
| 6.00%, with various maturities to 2053 | | 17,964 | 17,857,361 |
| 6.50%, with various maturities to 2053 | | 17,117 | 17,363,334 |
| 8.50%, with maturity at 2032 | | 72 | 75,210 |
| 9.50%, with maturity at 2028 | | 7 | 6,906 |
| Government National Mortgage Association: | | | |
| 5.00%, with maturity at 2052 | | 18,297 | 17,564,141 |
| 5.50%, with various maturities to 2063 | | 68,185 | 67,081,578 |
| 6.00%, 30-Year, TBA(27) | | 50,450 | 50,355,777 |
| 6.00%, with various maturities to 2063 | | 183,468 | 184,998,590 |
| 6.50%, with various maturities to 2064 | | 137,052 | 139,912,020 |
| 7.00%, with various maturities to 2063 | | 33,791 | 34,512,904 |
| 7.00%, 30-Year, TBA(27) | | 100,000 | 101,822,015 |
| 7.50%, with various maturities to 2054 | | 57,393 | 57,866,210 |
| 8.00%, with various maturities to 2054 | | 20,511 | 20,900,287 |
| Uniform Mortgage-Backed Security: | | | |
| 5.00%, 30-Year, TBA(27) | | 8,671 | 8,222,208 |
| 5.50%, 30-Year, TBA(27) | | 257,700 | 250,301,188 |
36
See Notes to Consolidated Financial Statements.
Global Opportunities Portfolio
April 30, 2024
Consolidated Portfolio of Investments (Unaudited) — continued
| Security | Principal
Amount
(000's omitted) | Value |
| Uniform Mortgage-Backed Security: (continued) | | | |
| 6.00%, 30-Year, TBA(27) | $ | 165,400 | $ 163,985,061 |
Total U.S. Government Agency Mortgage-Backed Securities
(identified cost $1,169,346,062) | | | $1,162,948,737 |
| U.S. Government Guaranteed Small Business Administration Loans — 0.2% |
| Security | Principal
Amount
(000's omitted) | Value |
SBA IO Trust:
Interest Only:(28)(29)
Series 2018-1, Class A, 2.455%, 3/25/44(1) | $ | 153,527 | $ 8,574,073 |
Total U.S. Government Guaranteed Small Business Administration Loans
(identified cost $32,145,516) | | | $ 8,574,073 |
| U.S. Treasury Obligations — 0.3% |
| Security | Principal
Amount
(000's omitted) | Value |
| U.S. Treasury Inflation-Protected Bonds, 0.625%, 7/15/32(30) | $ | 11,782 | $ 10,387,286 |
Total U.S. Treasury Obligations
(identified cost $11,191,857) | | | $ 10,387,286 |
| Security | Shares | Value |
| Financial Intermediaries — 0.0% |
| Alpha Holding SA, Escrow Certificates(12)(19) | | 3,058,000 | $ 0 |
| Alpha Holding SA, Escrow Certificates(12)(19) | | 5,630,000 | 0 |
Total Miscellaneous
(identified cost $0) | | | $ 0 |
| Short-Term Investments — 7.1% |
| Security | Shares | Value |
| Morgan Stanley Institutional Liquidity Funds - Government Portfolio, Institutional Class, 5.22%(31) | | 136,713,931 | $ 136,713,931 |
Total Affiliated Fund
(identified cost $136,713,931) | | | $ 136,713,931 |
| Repurchase Agreements — 1.4% |
| Description | Principal
Amount
(000's omitted) | Value |
| Bank of America: | | | |
| Dated 4/25/24 with an interest rate of 5.10%, collateralized by $5,000,000 Republic of Poland Government International Bonds, 4.875%, due 10/4/33 and a market value, including accrued interest, of $4,795,301(32) | USD | 4,775 | $ 4,775,000 |
| Dated 4/25/24 with an interest rate of 5.10%, collateralized by $5,000,000 Romania Government International Bonds, 7.125%, due 1/17/33 and a market value, including accrued interest, of $5,276,377(32) | USD | 5,238 | 5,237,500 |
| Barclays Bank PLC: | | | |
| Dated 2/12/24 with an interest rate of 5.00%, collateralized by $5,000,000 Brazil Government International Bonds, 6.125%, due 3/15/34 and a market value, including accrued interest, of $5,078,264(32) | USD | 5,219 | 5,218,750 |
| Dated 2/29/24 with an interest rate of 5.00%, collateralized by $5,000,000 Peru Government International Bonds, 3.00%, due 1/15/34 and a market value, including accrued interest, of $3,972,917(32) | USD | 4,288 | 4,287,500 |
| Dated 4/11/24 with an interest rate of 5.05%, collateralized by $5,000,000 Republic of South Africa Government International Bonds, 5.875%, due 4/20/32 and a market value, including accrued interest, of $5,008,976(32) | USD | 4,831 | 4,831,250 |
| JP Morgan Chase Bank, N.A.: | | | |
| Dated 4/12/24 with an interest rate of 4.80%, collateralized by $5,000,000 Colombia Government International Bonds, 7.50%, due 2/2/34 and a market value, including accrued interest, of $5,092,708(32) | USD | 5,101 | 5,101,041 |
| Dated 4/12/24 with an interest rate of 5.10%, collateralized by $5,000,000 Brazil Government International Bonds, 6.125%, due 3/15/34 and a market value, including accrued interest, of $5,078,264(32) | USD | 4,895 | 4,894,653 |
37
See Notes to Consolidated Financial Statements.
Global Opportunities Portfolio
April 30, 2024
Consolidated Portfolio of Investments (Unaudited) — continued
| Description | Principal
Amount
(000's omitted) | Value |
| Nomura International PLC: | | | |
| Dated 3/18/24 with an interest rate of 5.05%, collateralized by $5,000,000 Indonesia Government International Bonds, 4.85%, due 1/11/33 and a market value, including accrued interest, of $4,860,656(32) | USD | 5,195 | $ 5,194,875 |
| Dated 3/20/24 with an interest rate of 5.05%, collateralized by $5,000,000 Mexico Government International Bonds, 6.00%, due 5/7/36 and a market value, including accrued interest, of $4,919,340(32) | USD | 5,263 | 5,262,500 |
| Dated 3/26/24 with an interest rate of 4.90%, collateralized by $5,000,000 Philippines Government International Bonds, 5.00%, due 7/17/33 and a market value, including accrued interest, of $4,913,089(32) | USD | 5,292 | 5,292,000 |
Total Repurchase Agreements
(identified cost $50,095,069) | | | $ 50,095,069 |
| Sovereign Government Securities — 0.7% |
| Security | Principal
Amount
(000's omitted) | Value |
| Egypt — 0.7% |
| Egypt Treasury Bills: | | | |
| 0.00%, 9/24/24 | EGP | 1,475 | $ 28,044 |
| 0.00%, 12/10/24 | EGP | 438,200 | 7,937,835 |
| 0.00%, 3/11/25 | EGP | 938,950 | 16,106,883 |
Total Sovereign Government Securities
(identified cost $22,605,229) | | | $ 24,072,762 |
| U.S. Treasury Obligations — 1.1% |
| Security | Principal
Amount
(000's omitted) | Value |
| U.S. Treasury Bills: | | | |
| 0.00%, 5/9/24(33) | $ | 13,488 | $ 13,472,185 |
| 0.00%, 6/13/24(33) | | 13,500 | 13,415,188 |
| 0.00%, 6/20/24(33) | | 13,000 | 12,904,847 |
Total U.S. Treasury Obligations
(identified cost $39,793,790) | | | $ 39,792,220 |
Total Short-Term Investments
(identified cost $249,208,019) | | | $ 250,673,982 |
| | | Value |
Total Investments — 116.1%
(identified cost $4,247,096,437) | | | $4,081,197,823 |
Total Written Swaptions — (0.2)%
(premiums received $2,815,400) | | | $ (7,813,528) |
| Securities Sold Short — (0.8)% |
| Sovereign Government Bonds — (0.8)% |
| Security | Principal
Amount
(000's omitted) | Value |
| Indonesia — (0.1)% |
| Indonesia Government International Bonds, 4.85%, 1/11/33 | USD | (5,000) | $ (4,786,559) |
| | | | $ (4,786,559) |
| Mexico — (0.1)% |
| Mexico Government International Bonds, 6.00%, 5/7/36 | USD | (5,000) | $ (4,825,174) |
| | | | $ (4,825,174) |
| Peru — (0.1)% |
| Peru Government International Bonds, 3.00%, 1/15/34 | USD | (5,000) | $ (3,928,750) |
| | | | $ (3,928,750) |
| Philippines — (0.2)% |
| Philippines Government International Bonds, 5.00%, 7/17/33 | USD | (5,000) | $ (4,840,866) |
| | | | $ (4,840,866) |
| Poland — (0.1)% |
| Republic of Poland Government International Bonds, 4.875%, 10/4/33 | USD | (5,000) | $ (4,777,020) |
| | | | $ (4,777,020) |
| Romania — (0.2)% |
| Romania Government International Bonds, 7.125%, 1/17/33(13) | USD | (5,000) | $ (5,173,460) |
| | | | $ (5,173,460) |
Total Sovereign Government Bonds
(proceeds $29,019,718) | | | $ (28,331,829) |
Total Securities Sold Short
(proceeds $29,019,718) | | | $ (28,331,829) |
38
See Notes to Consolidated Financial Statements.
Global Opportunities Portfolio
April 30, 2024
Consolidated Portfolio of Investments (Unaudited) — continued
| | | Value |
| Other Assets, Less Liabilities — (15.1)% | | | $ (531,063,512) |
| Net Assets — 100.0% | | | $3,513,988,954 |
| The percentage shown for each investment category in the Consolidated Portfolio of Investments is based on net assets. |
| (1) | Security exempt from registration under Rule 144A of the Securities Act of 1933, as amended. These securities may be sold in certain transactions in reliance on an exemption from registration (normally to qualified institutional buyers). At April 30, 2024, the aggregate value of these securities is $874,631,413 or 24.9% of the Portfolio's net assets. |
| (2) | When-issued security. |
| (3) | Variable rate security. The stated interest rate represents the rate in effect at April 30, 2024. |
| (4) | Weighted average fixed-rate coupon that changes/updates monthly. Rate shown is the rate at April 30, 2024. |
| (5) | When-issued, variable rate security whose interest rate will be determined after April 30, 2024 |
| (6) | Step coupon security. Interest rate represents the rate in effect at April 30, 2024. |
| (7) | Inverse floating-rate security whose coupon varies inversely with changes in the interest rate index. The stated interest rate represents the coupon rate in effect at April 30, 2024. |
| (8) | Interest only security that entitles the holder to receive only interest payments on the underlying mortgages. Principal amount shown is the notional amount of the underlying mortgages on which coupon interest is calculated. |
| (9) | Principal only security that entitles the holder to receive only principal payments on the underlying mortgages. |
| (10) | Principal amount is less than $500. |
| (11) | Amount is less than 0.05%. |
| (12) | Non-income producing security. |
| (13) | Security exempt from registration under Regulation S of the Securities Act of 1933, as amended, which exempts from registration securities offered and sold outside the United States. Security may not be offered or sold in the United States except pursuant to an exemption from, or in a transaction not subject to, the registration requirements of the Securities Act of 1933, as amended. At April 30, 2024, the aggregate value of these securities is $246,004,721 or 7.0% of the Portfolio's net assets. |
| (14) | Represents a payment-in-kind security which may pay interest in additional principal at the issuer’s discretion. |
| (15) | Security converts to variable rate after the indicated fixed-rate coupon period. |
| (16) | Perpetual security with no stated maturity date but may be subject to calls by the issuer. |
| (17) | Variable rate security whose coupon rate is linked to the issuer’s mining activities revenue. The coupon rate shown represents the rate in effect at April 30, 2024. |
| (18) | Issuer is in default with respect to interest and/or principal payments or has declared bankruptcy. For a variable rate security, interest rate has been adjusted to reflect non-accrual status. |
| (19) | For fair value measurement disclosure purposes, security is categorized as Level 3 (see Note 10). |
| (20) | Limited recourse note whose payments by the issuer are limited to amounts received by the issuer from the borrower pursuant to a loan agreement with the borrower. |
| (21) | Quantity held represents principal in USD. |
| (22) | Security is subject to risk of loss depending on the occurrence, frequency and severity of the loss events that are covered by underlying reinsurance contracts and that may occur during a specified risk period. |
| (23) | Restricted security (see Note 5). |
| (24) | Senior floating-rate loans (Senior Loans) often require prepayments from excess cash flows or permit the borrowers to repay at their election. The degree to which borrowers repay, whether as a contractual requirement or at their election, cannot be predicted with accuracy. As a result, the actual remaining maturity may be substantially less than the stated maturities shown. However, Senior Loans will typically have an expected average life of approximately two to four years. Senior Loans typically have rates of interest which are redetermined periodically by reference to a base lending rate, plus a spread. These base lending rates are primarily the Secured Overnight Financing Rate (“SOFR”) (or the London Interbank Offered Rate (“LIBOR”) for those loans whose rates reset prior to the discontinuance of LIBOR on June 30, 2023) and secondarily, the prime rate offered by one or more major United States banks (the “Prime Rate”). Base lending rates may be subject to a floor, or minimum rate. Rates for SOFR are generally 1 or 3-month tenors and may also be subject to a credit spread adjustment. Senior Loans are generally subject to contractual restrictions that must be satisfied before they can be bought or sold. |
| (25) | This Senior Loan will settle after April 30, 2024, at which time the interest rate will be determined. |
| (26) | Adjustable rate mortgage security whose interest rate generally adjusts monthly based on a weighted average of interest rates on the underlying mortgages. The coupon rate may not reflect the applicable index value as interest rates on the underlying mortgages may adjust on various dates and at various intervals and may be subject to lifetime ceilings and lifetime floors and lookback periods. Rate shown is the coupon rate at April 30, 2024. |
| (27) | TBA (To Be Announced) securities are purchased or sold on a forward commitment basis with an approximate principal amount and maturity date. The actual principal amount, which is not expected to differ significantly from the commitment amount, and maturity date are determined upon settlement. |
| (28) | Interest only security that entitles the holder to receive only a portion of the interest payments on the underlying loans. Principal amount shown is the notional amount of the underlying loans on which coupon interest is calculated. |
| (29) | The stated interest rate represents the weighted average fixed interest rate at April 30, 2024 of all interest only securities comprising the trust. |
| (30) | Inflation-linked security whose principal is adjusted for inflation based on changes in the U.S. Consumer Price Index. Interest is calculated based on the inflation-adjusted principal. |
| (31) | May be deemed to be an affiliated investment company. The rate shown is the annualized seven-day yield as of April 30, 2024. |
| (32) | Open repurchase agreement with no specific maturity date. Either party may terminate the agreement upon demand. |
| (33) | Security (or a portion thereof) has been pledged to cover collateral requirements on open derivative contracts. |
39
See Notes to Consolidated Financial Statements.
Global Opportunities Portfolio
April 30, 2024
Consolidated Portfolio of Investments (Unaudited) — continued
| Written Interest Rate Swaptions (OTC) — (0.2)% |
| Description | Counterparty | Notional
Amount | Expiration
Date | Value |
| Option to enter into interest rate swap expiring 5/9/34 to pay SOFR and receive 3.93% | JPMorgan Chase Bank, N.A. | USD | (129,000,000) | 5/7/24 | $ (4,074,363) |
| Option to enter into interest rate swap expiring 8/9/34 to pay SOFR and receive 4.14% | Citibank, N.A. | USD | (157,000,000) | 8/7/24 | (3,739,165) |
| Total | | | | | $(7,813,528) |
| Forward Foreign Currency Exchange Contracts (Centrally Cleared) |
| Currency Purchased | Currency Sold | Settlement
Date | Value/Unrealized
Appreciation
(Depreciation) |
| EUR | 208,628 | USD | 226,407 | 6/20/24 | $ (3,316) |
| EUR | 864,633 | USD | 938,315 | 6/20/24 | (13,741) |
| EUR | 1,084,472 | USD | 1,185,258 | 6/20/24 | (25,605) |
| IDR | 459,893,067,351 | USD | 29,180,107 | 6/20/24 | (936,525) |
| USD | 51,784,363 | EUR | 47,380,982 | 6/20/24 | 1,118,688 |
| USD | 24,813,555 | EUR | 22,703,583 | 6/20/24 | 536,043 |
| USD | 17,580,004 | EUR | 16,085,123 | 6/20/24 | 379,777 |
| USD | 9,075,339 | EUR | 8,303,635 | 6/20/24 | 196,053 |
| USD | 6,773,019 | EUR | 6,197,089 | 6/20/24 | 146,316 |
| USD | 5,290,380 | EUR | 4,840,523 | 6/20/24 | 114,287 |
| USD | 4,616,699 | EUR | 4,224,127 | 6/20/24 | 99,734 |
| USD | 2,871,953 | EUR | 2,627,742 | 6/20/24 | 62,042 |
| USD | 1,923,918 | EUR | 1,760,322 | 6/20/24 | 41,562 |
| USD | 1,850,262 | EUR | 1,692,929 | 6/20/24 | 39,971 |
| USD | 1,512,005 | EUR | 1,383,434 | 6/20/24 | 32,664 |
| USD | 1,324,550 | EUR | 1,211,919 | 6/20/24 | 28,614 |
| USD | 1,323,210 | EUR | 1,210,694 | 6/20/24 | 28,585 |
| USD | 983,642 | EUR | 900,000 | 6/20/24 | 21,249 |
| USD | 221,866 | EUR | 203,000 | 6/20/24 | 4,793 |
| USD | 55,022,709 | IDR | 859,344,661,284 | 6/20/24 | 2,247,459 |
| USD | 29,423,521 | IDR | 459,548,319,478 | 6/20/24 | 1,201,111 |
| USD | 9,989,948 | IDR | 156,043,988,306 | 6/20/24 | 406,761 |
| USD | 8,216,833 | IDR | 128,337,893,938 | 6/20/24 | 335,171 |
| USD | 22,071 | IDR | 344,747,873 | 6/20/24 | 899 |
| USD | 26,790,164 | PEN | 98,703,000 | 6/20/24 | 586,662 |
| USD | 17,859,838 | PEN | 65,801,000 | 6/20/24 | 391,102 |
| USD | 19,421,814 | PEN | 71,837,853 | 6/20/24 | 350,425 |
| USD | 23,320,663 | PEN | 87,737,000 | 6/20/24 | 28,397 |
| USD | 203,295 | PEN | 749,000 | 6/20/24 | 4,452 |
| USD | 135,711 | PEN | 500,000 | 6/20/24 | 2,972 |
| USD | 147,459 | PEN | 545,424 | 6/20/24 | 2,661 |
| USD | 177,024 | PEN | 666,000 | 6/20/24 | 216 |
| USD | 300,862 | PEN | 1,136,656 | 6/20/24 | (896) |
40
See Notes to Consolidated Financial Statements.
Global Opportunities Portfolio
April 30, 2024
Consolidated Portfolio of Investments (Unaudited) — continued
| Forward Foreign Currency Exchange Contracts (Centrally Cleared) (continued) |
| Currency Purchased | Currency Sold | Settlement
Date | Value/Unrealized
Appreciation
(Depreciation) |
| USD | 264,258 | PEN | 999,000 | 6/20/24 | $ (955) |
| USD | 39,626,233 | PEN | 149,707,910 | 6/20/24 | (117,963) |
| USD | 34,812,189 | PEN | 131,604,000 | 6/20/24 | (125,813) |
| | | | | | $7,183,852 |
| Forward Foreign Currency Exchange Contracts (OTC) |
| Currency Purchased | Currency Sold | Counterparty | Settlement
Date | Unrealized
Appreciation | Unrealized
(Depreciation) |
| USD | 1,372,646 | EUR | 1,273,775 | Goldman Sachs International | 5/2/24 | $ 13,272 | $ — |
| USD | 636,924 | EUR | 585,991 | Goldman Sachs International | 5/2/24 | 11,554 | — |
| USD | 508,355 | EUR | 468,990 | UBS AG | 5/2/24 | 7,849 | — |
| USD | 243,969 | EUR | 224,578 | UBS AG | 5/2/24 | 4,299 | — |
| EUR | 5,105,073 | USD | 5,467,849 | Bank of America, N.A. | 5/3/24 | — | (19,712) |
| USD | 5,502,528 | EUR | 5,105,073 | Barclays Bank PLC | 5/3/24 | 54,392 | — |
| USD | 5,469,344 | EUR | 5,105,073 | Bank of America, N.A. | 5/10/24 | 19,722 | — |
| USD | 2,736,059 | EUR | 2,553,335 | UBS AG | 5/10/24 | 10,396 | — |
| AUD | 25,000,000 | USD | 16,591,980 | BNP Paribas | 6/20/24 | — | (373,409) |
| AUD | 29,000,000 | USD | 19,238,571 | Citibank, N.A. | 6/20/24 | — | (425,029) |
| AUD | 11,745,000 | USD | 7,736,255 | UBS AG | 6/20/24 | — | (116,771) |
| AUD | 16,000,000 | USD | 10,527,440 | UBS AG | 6/20/24 | — | (147,555) |
| EUR | 45,762,259 | CZK | 1,166,068,117 | JPMorgan Chase Bank, N.A. | 6/20/24 | — | (549,927) |
| MXN | 43,842,000 | USD | 2,559,276 | Bank of America, N.A. | 6/20/24 | — | (19,502) |
| MXN | 58,227,000 | USD | 3,413,861 | Goldman Sachs International | 6/20/24 | — | (40,763) |
| MXN | 23,693,000 | USD | 1,397,419 | Societe Generale | 6/20/24 | — | (24,880) |
| MXN | 47,511,000 | USD | 2,757,225 | State Street Bank and Trust Company | 6/20/24 | — | (4,906) |
| MXN | 11,649,916 | USD | 682,379 | State Street Bank and Trust Company | 6/20/24 | — | (7,497) |
| MXN | 14,078,293 | USD | 824,579 | State Street Bank and Trust Company | 6/20/24 | — | (9,022) |
| MXN | 56,700,000 | USD | 3,334,249 | State Street Bank and Trust Company | 6/20/24 | — | (49,610) |
| USD | 26,467,080 | AUD | 40,000,000 | Australia and New Zealand Banking Group Limited | 6/20/24 | 517,367 | — |
| USD | 27,620,467 | AUD | 41,745,000 | State Street Bank and Trust Company | 6/20/24 | 538,697 | — |
| USD | 6,597,104 | CAD | 8,888,742 | HSBC Bank USA, N.A. | 6/20/24 | 135,130 | — |
| USD | 40,316 | CAD | 54,320 | HSBC Bank USA, N.A. | 6/20/24 | 826 | — |
| USD | 7,263,331 | CNH | 52,000,000 | BNP Paribas | 6/20/24 | 79,391 | — |
| USD | 7,402,256 | CNH | 53,000,000 | HSBC Bank USA, N.A. | 6/20/24 | 80,164 | — |
| USD | 12,855,680 | CNH | 92,000,000 | JPMorgan Chase Bank, N.A. | 6/20/24 | 145,632 | — |
| USD | 33,882,281 | CNH | 242,459,877 | UBS AG | 6/20/24 | 385,796 | — |
| USD | 13,986,674 | MXN | 237,500,717 | Goldman Sachs International | 6/20/24 | 228,224 | — |
| USD | 361,338 | NZD | 584,452 | BNP Paribas | 6/20/24 | 16,950 | — |
| USD | 609,218 | ZAR | 11,449,397 | UBS AG | 6/20/24 | 3,248 | — |
| OMR | 2,000,000 | USD | 5,183,496 | Standard Chartered Bank | 7/8/24 | 10,232 | — |
41
See Notes to Consolidated Financial Statements.
Global Opportunities Portfolio
April 30, 2024
Consolidated Portfolio of Investments (Unaudited) — continued
| Forward Foreign Currency Exchange Contracts (OTC) (continued) |
| Currency Purchased | Currency Sold | Counterparty | Settlement
Date | Unrealized
Appreciation | Unrealized
(Depreciation) |
| USD | 8,189,339 | OMR | 3,237,000 | BNP Paribas | 7/8/24 | $ — | $ (216,710) |
| USD | 5,155,499 | OMR | 2,039,000 | Standard Chartered Bank | 7/15/24 | — | (139,429) |
| USD | 954,425 | OMR | 378,000 | BNP Paribas | 7/29/24 | — | (27,147) |
| USD | 23,985,158 | OMR | 9,293,625 | BNP Paribas | 7/29/24 | — | (148,062) |
| USD | 2,784,227 | EUR | 2,595,051 | HSBC Bank USA, N.A. | 7/31/24 | 4,076 | — |
| USD | 756,322 | HKD | 5,904,000 | Goldman Sachs International | 7/31/24 | — | (375) |
| USD | 4,828,281 | SAR | 18,220,000 | Standard Chartered Bank | 6/18/25 | — | (16,745) |
| | | | | | | $2,267,217 | $(2,337,051) |
| Futures Contracts |
| Description | Number of
Contracts | Position | Expiration
Date | Notional
Amount | Value/Unrealized
Appreciation
(Depreciation) |
| Interest Rate Futures | | | | | |
| U.S. 5-Year Treasury Note | 19,400 | Long | 6/28/24 | $2,031,998,447 | $ (38,388,897) |
| U.S. 10-Year Treasury Note | 330 | Long | 6/18/24 | 35,454,375 | (356,857) |
| U.S. Long Treasury Bond | 66 | Long | 6/18/24 | 7,511,626 | (365,183) |
| U.S. Ultra 10-Year Treasury Note | 81 | Long | 6/18/24 | 8,927,719 | (278,375) |
| U.S. Ultra-Long Treasury Bond | 34 | Long | 6/18/24 | 4,065,125 | (250,936) |
| Euro-Bobl | (139) | Short | 6/6/24 | (17,271,328) | 226,003 |
| Euro-Bund | (371) | Short | 6/6/24 | (51,502,757) | 1,218,915 |
| Euro-Buxl | (1) | Short | 6/6/24 | (137,583) | 4,439 |
| Euro-Schatz | (76) | Short | 6/6/24 | (8,525,182) | 43,343 |
| Japan 10-Year Bond | (193) | Short | 6/13/24 | (176,828,456) | 1,271,054 |
| U.S. 2-Year Treasury Note | (18) | Short | 6/28/24 | (3,647,813) | 10,639 |
| U.S. 5-Year Treasury Note | (56) | Short | 6/28/24 | (5,865,563) | 16,416 |
| U.S. 10-Year Treasury Note | (89) | Short | 6/18/24 | (9,561,938) | 74,813 |
| U.S. Long Treasury Bond | (385) | Short | 6/18/24 | (43,817,813) | 1,857,279 |
| U.S. Ultra-Long Treasury Bond | (1,044) | Short | 6/18/24 | (124,823,250) | 7,757,707 |
| | | | | | $ (27,159,640) |
42
See Notes to Consolidated Financial Statements.
Global Opportunities Portfolio
April 30, 2024
Consolidated Portfolio of Investments (Unaudited) — continued
| Inflation Swaps (Centrally Cleared) |
Notional Amount
(000's omitted) | Portfolio
Pays/Receives
Return on
Reference Index | Reference Index | Portfolio
Pays/Receives
Rate | Annual
Rate | Termination
Date | Value/Unrealized
Appreciation
(Depreciation) |
| EUR | 5,003 | Receives | Eurostat Eurozone HICP ex Tobacco NSA
(pays upon termination) | Pays | 1.60%
(pays upon termination) | 8/15/32 | $ 898,766 |
| EUR | 19,000 | Receives | Eurostat Eurozone HICP ex Tobacco NSA
(pays upon termination) | Pays | 1.69%
(pays upon termination) | 11/15/32 | 3,235,729 |
| EUR | 5,000 | Receives | Eurostat Eurozone HICP ex Tobacco NSA
(pays upon termination) | Pays | 2.20%
(pays upon termination) | 10/15/36 | 629,316 |
| EUR | 5,000 | Receives | Eurostat Eurozone HICP ex Tobacco NSA
(pays upon termination) | Pays | 2.20%
(pays upon termination) | 10/15/36 | 629,316 |
| EUR | 5,000 | Receives | Eurostat Eurozone HICP ex Tobacco NSA
(pays upon termination) | Pays | 2.20%
(pays upon termination) | 10/15/36 | 628,672 |
| EUR | 5,260 | Receives | Eurostat Eurozone HICP ex Tobacco NSA
(pays upon termination) | Pays | 2.08%
(pays upon termination) | 1/15/37 | 707,051 |
| EUR | 5,003 | Pays | Eurostat Eurozone HICP ex Tobacco NSA
(pays upon termination) | Receives | 1.79%
(pays upon termination) | 8/15/42 | (1,127,123) |
| EUR | 19,000 | Pays | Eurostat Eurozone HICP ex Tobacco NSA
(pays upon termination) | Receives | 1.89%
(pays upon termination) | 11/15/42 | (3,888,786) |
| EUR | 5,000 | Pays | Eurostat Eurozone HICP ex Tobacco NSA
(pays upon termination) | Receives | 2.29%
(pays upon termination) | 10/15/46 | (758,586) |
| EUR | 5,000 | Pays | Eurostat Eurozone HICP ex Tobacco NSA
(pays upon termination) | Receives | 2.29%
(pays upon termination) | 10/15/46 | (758,586) |
| EUR | 5,000 | Pays | Eurostat Eurozone HICP ex Tobacco NSA
(pays upon termination) | Receives | 2.29%
(pays upon termination) | 10/15/46 | (760,473) |
| EUR | 5,260 | Pays | Eurostat Eurozone HICP ex Tobacco NSA
(pays upon termination) | Receives | 2.18%
(pays upon termination) | 1/15/47 | (898,665) |
| EUR | 5,870 | Pays | Eurostat Eurozone HICP ex Tobacco NSA
(pays upon termination) | Receives | 2.64%
(pays upon termination) | 3/13/53 | 102,799 |
| USD | 19,500 | Pays | Return on CPI-U (NSA)
(pays upon termination) | Receives | 2.09%
(pays upon termination) | 4/2/29 | (1,464,119) |
| USD | 25,300 | Pays | Return on CPI-U (NSA)
(pays upon termination) | Receives | 2.22%
(pays upon termination) | 11/14/32 | (3,287,928) |
| USD | 24,200 | Pays | Return on CPI-U (NSA)
(pays upon termination) | Receives | 2.75%
(pays upon termination) | 10/29/36 | (1,015,871) |
| USD | 8,500 | Pays | Return on CPI-U (NSA)
(pays upon termination) | Receives | 2.67%
(pays upon termination) | 1/7/37 | (361,984) |
| USD | 25,300 | Receives | Return on CPI-U (NSA)
(pays upon termination) | Pays | 2.20%
(pays upon termination) | 11/14/42 | 3,576,067 |
| USD | 16,200 | Receives | Return on CPI-U (NSA)
(pays upon termination) | Pays | 2.62%
(pays upon termination) | 10/29/46 | 651,398 |
| USD | 8,000 | Receives | Return on CPI-U (NSA)
(pays upon termination) | Pays | 2.62%
(pays upon termination) | 10/29/46 | 318,719 |
| USD | 8,500 | Receives | Return on CPI-U (NSA)
(pays upon termination) | Pays | 2.54%
(pays upon termination) | 1/7/47 | 403,249 |
43
See Notes to Consolidated Financial Statements.
Global Opportunities Portfolio
April 30, 2024
Consolidated Portfolio of Investments (Unaudited) — continued
| Inflation Swaps (Centrally Cleared) (continued) |
Notional Amount
(000's omitted) | Portfolio
Pays/Receives
Return on
Reference Index | Reference Index | Portfolio
Pays/Receives
Rate | Annual
Rate | Termination
Date | Value/Unrealized
Appreciation
(Depreciation) |
| USD | 2,309 | Receives | Return on CPI-U (NSA)
(pays upon termination) | Pays | 2.13%
(pays upon termination) | 8/22/47 | $ 366,752 |
| USD | 2,295 | Receives | Return on CPI-U (NSA)
(pays upon termination) | Pays | 2.15%
(pays upon termination) | 8/25/47 | 357,991 |
| USD | 4,400 | Receives | Return on CPI-U (NSA)
(pays upon termination) | Pays | 2.42%
(pays upon termination) | 6/8/48 | 398,114 |
| USD | 7,955 | Receives | Return on CPI-U (NSA)
(pays upon termination) | Pays | 2.40%
(pays upon termination) | 3/13/53 | 297,015 |
| | | | | | | | $ (1,121,167) |
| Inflation Swaps (OTC) |
| Counterparty | Notional
Amount
(000's omitted) | Portfolio
Pays/Receives
Return on
Reference Index | Reference Index | Portfolio
Pays/Receives
Rate | Annual
Rate | Termination
Date | Value/Unrealized
Appreciation
(Depreciation) |
| Bank of America, N.A. | USD | 19,500 | Receives | Return on CPI-U (NSA)
(pays upon termination) | Pays | 2.09%
(pays upon termination) | 4/2/29 | $ 2,607,797 |
| | | | | | | | | $2,607,797 |
| Interest Rate Swaps (Centrally Cleared) |
Notional Amount
(000's omitted) | Portfolio
Pays/
Receives
Floating
Rate | Floating Rate | Annual
Fixed Rate | Termination
Date | Value | Unamortized
Upfront
Receipts
(Payments) | Unrealized
Appreciation
(Depreciation) |
| CLP | 19,488,000 | Receives | 6-month Sinacofi Chile Interbank Rate
(pays semi-annually) | 4.53%
(pays semi-annually) | 3/20/29 | $ 695,862 | $ — | $ 695,862 |
| CLP | 65,644,190 | Receives | 6-month Sinacofi Chile Interbank Rate
(pays semi-annually) | 4.77%
(pays semi-annually) | 6/6/33 | 1,424,425 | 19,652 | 1,444,077 |
| CLP | 22,046,810 | Receives | 6-month Sinacofi Chile Interbank Rate
(pays semi-annually) | 4.65%
(pays semi-annually) | 6/14/33 | 581,029 | — | 581,029 |
| CLP | 15,985,000 | Receives | 6-month Sinacofi Chile Interbank Rate
(pays semi-annually) | 4.94%
(pays semi-annually) | 6/21/34 | 526,503 | — | 526,503 |
| CLP | 10,920,000 | Receives | 6-month Sinacofi Chile Interbank Rate
(pays semi-annually) | 4.94%
(pays semi-annually) | 6/21/34 | 355,282 | — | 355,282 |
| CLP | 5,285,000 | Receives | 6-month Sinacofi Chile Interbank Rate
(pays semi-annually) | 5.06%
(pays semi-annually) | 6/21/34 | 123,041 | — | 123,041 |
44
See Notes to Consolidated Financial Statements.
Global Opportunities Portfolio
April 30, 2024
Consolidated Portfolio of Investments (Unaudited) — continued
| Interest Rate Swaps (Centrally Cleared) (continued) |
Notional Amount
(000's omitted) | Portfolio
Pays/
Receives
Floating
Rate | Floating Rate | Annual
Fixed Rate | Termination
Date | Value | Unamortized
Upfront
Receipts
(Payments) | Unrealized
Appreciation
(Depreciation) |
| CLP | 13,103,000 | Receives | 6-month Sinacofi Chile Interbank Rate
(pays semi-annually) | 5.07%
(pays semi-annually) | 6/21/34 | $ 289,238 | $ — | $ 289,238 |
| CLP | 7,128,694 | Receives | 6-month Sinacofi Chile Interbank Rate
(pays semi-annually) | 5.08%
(pays semi-annually) | 6/21/34 | 151,624 | — | 151,624 |
| CLP | 13,102,000 | Receives | 6-month Sinacofi Chile Interbank Rate
(pays semi-annually) | 5.09%
(pays semi-annually) | 6/21/34 | 268,131 | — | 268,131 |
| CLP | 6,551,306 | Receives | 6-month Sinacofi Chile Interbank Rate
(pays semi-annually) | 5.12%
(pays semi-annually) | 6/21/34 | 118,257 | — | 118,257 |
| CNY | 305,000 | Pays | 7-day China Fixing Repo Rates
(pays quarterly) | 2.25%
(pays quarterly) | 3/20/29 | 261,779 | — | 261,779 |
| CNY | 770,000 | Pays | 7-day China Fixing Repo Rates
(pays quarterly) | 2.26%
(pays quarterly) | 3/20/29 | 483,140 | — | 483,140 |
| CNY | 336,700 | Receives | 7-day China Fixing Repo Rates
(pays quarterly) | 2.20%
(pays quarterly) | 6/19/29 | (113,399) | — | (113,399) |
| COP | 59,721,000 | Receives | Colombia Overnight Interbank Reference Rate
(pays quarterly) | 8.35%
(pays quarterly) | 6/20/29 | (75,433) | — | (75,433) |
| CZK | 699,300 | Receives | 6-month CZK PRIBOR
(pays semi-annually) | 3.53%
(pays annually) | 3/20/29 | 964,938 | — | 964,938 |
| CZK | 99,886 | Pays | 6-month CZK PRIBOR
(pays semi-annually) | 3.94%
(pays annually) | 9/20/33 | (162,800) | — | (162,800) |
| CZK | 199,772 | Pays | 6-month CZK PRIBOR
(pays semi-annually) | 3.96%
(pays annually) | 9/20/33 | (315,571) | — | (315,571) |
| CZK | 300,341 | Pays | 6-month CZK PRIBOR
(pays semi-annually) | 3.96%
(pays annually) | 9/20/33 | (466,573) | — | (466,573) |
| CZK | 386,000 | Pays | 6-month CZK PRIBOR
(pays semi-annually) | 3.98%
(pays annually) | 9/20/33 | (582,060) | — | (582,060) |
| ILS | 127,200 | Receives | 3-month ILS TELBOR
(pays quarterly) | 4.09%
(pays annually) | 6/19/29 | 459,727 | — | 459,727 |
| INR | 3,044,800 | Receives | 1-day INR FBIL MIBOR
(pays semi-annually) | 6.54%
(pays semi-annually) | 6/19/29 | 81,922 | — | 81,922 |
| JPY | 45,000 | Receives | 1-day Overnight Tokyo Average Rate
(pays annually) | 0.33%
(pays annually) | 12/20/25 | (469) | — | (469) |
| JPY | 12,019,000 | Receives | 1-day Overnight Tokyo Average Rate
(pays annually) | 0.33%
(pays annually) | 12/20/25 | (126,908) | 159 | (126,749) |
| JPY | 15,542,000 | Receives | 1-day Overnight Tokyo Average Rate
(pays annually) | 0.33%
(pays annually) | 12/20/25 | (165,916) | 206 | (165,710) |
| JPY | 2,500,000 | Receives | 1-day Overnight Tokyo Average Rate
(pays annually) | 1.41%
(pays annually) | 9/20/53 | 796,139 | — | 796,139 |
| KRW | 21,823,000 | Receives | 3-month KRW Certificate of Deposit Rate
(pays quarterly) | 3.41%
(pays quarterly) | 6/19/29 | 83,049 | — | 83,049 |
45
See Notes to Consolidated Financial Statements.
Global Opportunities Portfolio
April 30, 2024
Consolidated Portfolio of Investments (Unaudited) — continued
| Interest Rate Swaps (Centrally Cleared) (continued) |
Notional Amount
(000's omitted) | Portfolio
Pays/
Receives
Floating
Rate | Floating Rate | Annual
Fixed Rate | Termination
Date | Value | Unamortized
Upfront
Receipts
(Payments) | Unrealized
Appreciation
(Depreciation) |
| KRW | 27,125,000 | Receives | 3-month KRW Certificate of Deposit Rate
(pays quarterly) | 3.42%
(pays quarterly) | 6/19/29 | $ 94,177 | $ — | $ 94,177 |
| MXN | 451,420 | Receives | Mexico Interbank TIIE 28 Day
(pays monthly) | 9.02%
(pays monthly) | 3/28/29 | 809,355 | — | 809,355 |
| PLN | 94,100 | Receives | 6-month PLN WIBOR
(pays semi-annually) | 4.79%
(pays annually) | 3/20/29 | 505,851 | — | 505,851 |
| THB | 641,000 | Receives | Thai Overnight Repurchase Rate
(pays semi-annually) | 2.59%
(pays semi-annually) | 6/19/29 | 37,804 | — | 37,804 |
| THB | 359,600 | Receives | Thai Overnight Repurchase Rate
(pays semi-annually) | 2.61%
(pays semi-annually) | 6/19/29 | 12,092 | — | 12,092 |
| THB | 422,000 | Receives | Thai Overnight Repurchase Rate
(pays semi-annually) | 2.61%
(pays semi-annually) | 6/19/29 | 12,585 | — | 12,585 |
| TWD | 469,200 | Receives | 3-month TWD TAIBOR
(pays quarterly) | 1.26%
(pays quarterly) | 3/20/29 | 422,289 | — | 422,289 |
| TWD | 623,800 | Receives | 3-month TWD TAIBOR
(pays quarterly) | 1.27%
(pays quarterly) | 3/20/29 | 547,585 | — | 547,585 |
| TWD | 633,800 | Receives | 3-month TWD TAIBOR
(pays quarterly) | 1.32%
(pays quarterly) | 3/20/29 | 509,463 | — | 509,463 |
| TWD | 1,493,400 | Receives | 3-month TWD TAIBOR
(pays quarterly) | 1.33%
(pays quarterly) | 3/20/29 | 1,172,802 | — | 1,172,802 |
| TWD | 514,000 | Receives | 3-month TWD TAIBOR
(pays quarterly) | 1.35%
(pays quarterly) | 3/20/29 | 390,345 | — | 390,345 |
| TWD | 2,056,500 | Receives | 3-month TWD TAIBOR
(pays quarterly) | 1.36%
(pays quarterly) | 3/20/29 | 1,531,322 | — | 1,531,322 |
| TWD | 623,900 | Receives | 3-month TWD TAIBOR
(pays quarterly) | 1.37%
(pays quarterly) | 3/20/29 | 455,339 | — | 455,339 |
| TWD | 623,800 | Receives | 3-month TWD TAIBOR
(pays quarterly) | 1.38%
(pays quarterly) | 3/20/29 | 450,650 | — | 450,650 |
| USD | 10,000 | Pays | SOFR
(pays annually) | 4.01%
(pays annually) | 8/4/28 | (303,784) | — | (303,784) |
| USD | 65,150 | Pays | SOFR
(pays annually) | 4.01%
(pays annually) | 8/4/28 | (1,976,161) | — | (1,976,161) |
| USD | 38,900 | Pays | SOFR
(pays annually) | 4.05%
(pays annually) | 9/20/28 | (1,049,584) | — | (1,049,584) |
| USD | 38,900 | Pays | SOFR
(pays annually) | 4.06%
(pays annually) | 9/20/28 | (1,045,148) | — | (1,045,148) |
| USD | 18,760 | Pays | SOFR
(pays annually) | 3.22%
(pays annually) | 6/6/33 | (609,381) | — | (609,381) |
| USD | 26,270 | Pays | SOFR
(pays annually) | 3.25%
(pays annually) | 6/6/33 | (831,729) | — | (831,729) |
| USD | 25,325 | Pays | SOFR
(pays annually) | 3.26%
(pays annually) | 6/7/33 | (790,408) | — | (790,408) |
| USD | 23,445 | Pays | SOFR
(pays annually) | 3.26%
(pays annually) | 6/14/33 | (726,619) | — | (726,619) |
| Total | | | | | | $5,273,802 | $20,017 | $ 5,293,819 |
46
See Notes to Consolidated Financial Statements.
Global Opportunities Portfolio
April 30, 2024
Consolidated Portfolio of Investments (Unaudited) — continued
| Interest Rate Swaps (OTC) |
| Counterparty | Notional Amount
(000's omitted) | Portfolio
Pays/Receives
Floating Rate | Floating Rate | Annual
Fixed Rate | Termination
Date | Value/Unrealized
Appreciation
(Depreciation) |
| Citibank, N.A. | MYR | 192,000 | Receives | 3-month MYR KLIBOR
(pays quarterly) | 3.62%
(pays quarterly) | 3/20/29 | $ 325,667 |
| Goldman Sachs International | MYR | 221,200 | Receives | 3-month MYR KLIBOR
(pays quarterly) | 3.73%
(pays quarterly) | 6/19/29 | 204,853 |
| JPMorgan Chase Bank, N.A. | MYR | 119,000 | Receives | 3-month MYR KLIBOR
(pays quarterly) | 3.63%
(pays quarterly) | 3/20/29 | 190,304 |
| JPMorgan Chase Bank, N.A. | MYR | 112,900 | Receives | 3-month MYR KLIBOR
(pays quarterly) | 3.63%
(pays quarterly) | 3/20/29 | 179,455 |
| Nomura International PLC | MYR | 238,000 | Receives | 3-month MYR KLIBOR
(pays quarterly) | 3.60%
(pays quarterly) | 3/20/29 | 449,861 |
| Standard Chartered Bank | MYR | 119,000 | Receives | 3-month MYR KLIBOR
(pays quarterly) | 3.62%
(pays quarterly) | 3/20/29 | 201,846 |
| Total | | | | | | | $1,551,986 |
| Credit Default Swaps - Buy Protection (Centrally Cleared) | |
| Reference Entity | Notional
Amount
(000's omitted) | Contract
Annual
Fixed Rate* | Termination
Date | Value | Unamortized
Upfront
Receipts
(Payments) | Unrealized
Appreciation
(Depreciation) |
| Brazil | | $ 7,651 | 1.00%
(pays quarterly)(1) | 6/20/29 | $ 151,834 | $ (116,182) | $ 35,652 |
| Malaysia | | 20,400 | 1.00%
(pays quarterly)(1) | 6/20/29 | (510,137) | 534,438 | 24,301 |
| Total | | | | | $ (358,303) | $ 418,256 | $59,953 |
| * | The contract annual fixed rate represents the fixed rate of interest paid by the Portfolio (as a buyer of protection) on the notional amount of the credit default swap contract. |
| (1) | Upfront payment is exchanged with the counterparty as a result of the standardized trading coupon. |
47
See Notes to Consolidated Financial Statements.
Global Opportunities Portfolio
April 30, 2024
Consolidated Portfolio of Investments (Unaudited) — continued
| Cross-Currency Swaps (OTC) | | |
| Counterparty | Portfolio Receives | Portfolio Pays | Termination
Date | Value/Unrealized
Appreciation
(Depreciation) |
| Barclays Bank PLC | 1-day Indice Camara Promedio Rate on CLP 6,058,901,240 (pays semi-annually)* | 1.41% on CLP equivalent of
CLF 172,000
(pays semi-annually)* | 1/13/33 | $ 254,465 |
| Goldman Sachs International | 1-day Indice Camara Promedio Rate on CLP 952,568,100 (pays semi-annually)* | 2.10% on CLP equivalent of CLF 30,000
(pays semi-annually)* | 4/8/32 | (148,249) |
| Goldman Sachs International | 1-day Indice Camara Promedio Rate on CLP 2,921,491,280 (pays semi-annually)* | 2.25% on CLP equivalent of CLF 92,000
(pays semi-annually)* | 4/11/32 | (494,691) |
| | | | | $(388,475) |
| * | At the termination date, the Portfolio will either pay or receive the USD equivalent of the difference between the initial CLP notional amount and the CLP equivalent of the CLF notional amount on such date. |
| Abbreviations: |
| COF | – Cost of Funds 11th District |
| CPI-U (NSA) | – Consumer Price Index All Urban Non-Seasonally Adjusted |
| EURIBOR | – Euro Interbank Offered Rate |
| FBIL | – Financial Benchmarks India Ltd. |
| HICP | – Harmonised Indices of Consumer Prices |
| KLIBOR | – Kuala Lumpur Interbank Offered Rate |
| MIBOR | – Mumbai Interbank Offered Rate |
| OTC | – Over-the-counter |
| |
| PIK | – Payment In Kind |
| PRIBOR | – Prague Interbank Offered Rate |
| SOFR | – Secured Overnight Financing Rate |
| STACR | – Structured Agency Credit Risk |
| TAIBOR | – Taipei Interbank Offered Rate |
| TBA | – To Be Announced |
| TELBOR | – Tel Aviv Interbank Offered Rate |
| WIBOR | – Warsaw Interbank Offered Rate |
| Currency Abbreviations: |
| AUD | – Australian Dollar |
| BRL | – Brazilian Real |
| CAD | – Canadian Dollar |
| CLF | – Chilean Unidad de Fomento |
| CLP | – Chilean Peso |
| CNH | – Yuan Renminbi Offshore |
| CNY | – Yuan Renminbi |
| COP | – Colombian Peso |
| CZK | – Czech Koruna |
| DOP | – Dominican Peso |
| EGP | – Egyptian Pound |
| EUR | – Euro |
| HKD | – Hong Kong Dollar |
| IDR | – Indonesian Rupiah |
| ILS | – Israeli Shekel |
| INR | – Indian Rupee |
| ISK | – Icelandic Krona |
| |
| JPY | – Japanese Yen |
| KRW | – South Korean Won |
| MXN | – Mexican Peso |
| MYR | – Malaysian Ringgit |
| NZD | – New Zealand Dollar |
| OMR | – Omani Rial |
| PEN | – Peruvian Sol |
| PLN | – Polish Zloty |
| RSD | – Serbian Dinar |
| SAR | – Saudi Riyal |
| THB | – Thai Baht |
| TWD | – New Taiwan Dollar |
| UAH | – Ukrainian Hryvnia |
| USD | – United States Dollar |
| UZS | – Uzbekistani Som |
| ZAR | – South African Rand |
48
See Notes to Consolidated Financial Statements.
Global Opportunities Portfolio
April 30, 2024
Consolidated Statement of Assets and Liabilities (Unaudited)
| | April 30, 2024 |
| Assets | |
| Unaffiliated investments, at value (identified cost $4,110,382,506) | $ 3,944,483,892 |
| Affiliated investments, at value (identified cost $136,713,931) | 136,713,931 |
| Cash | 21,067,827 |
| Deposits for forward commitment securities | 4,308,000 |
| Deposits for derivatives collateral: | |
| Futures contracts | 843,457 |
| Centrally cleared derivatives | 39,145,688 |
| OTC derivatives | 1,060,000 |
| Foreign currency, at value (identified cost $10,972,980) | 10,916,012 |
| Interest and dividends receivable | 28,871,858 |
| Dividends receivable from affiliated investments | 532,494 |
| Receivable for investments sold | 5,117,216 |
| Receivable for TBA sale commitments | 55,027,548 |
| Receivable for open forward foreign currency exchange contracts | 2,267,217 |
| Receivable for open swap contracts | 4,414,248 |
| Receivable for closed swap contracts | 5,538,523 |
| Tax reclaims receivable | 2,776 |
| Trustees' deferred compensation plan | 116,199 |
| Total assets | $4,260,426,886 |
| Liabilities | |
| Cash collateral due to brokers | $ 1,060,000 |
| Written swaptions outstanding, at value (premiums received $2,815,400) | 7,813,528 |
| Payable for investments purchased | 36,507,120 |
| Payable for when-issued/delayed delivery/forward commitment securities | 659,417,536 |
| Payable for securities sold short, at value (proceeds $29,019,718) | 28,331,829 |
| Payable for variation margin on open futures contracts | 6,036,953 |
| Payable for variation margin on open centrally cleared derivatives | 511,788 |
| Payable for open forward foreign currency exchange contracts | 2,337,051 |
| Payable for open swap contracts | 642,940 |
| Payable to affiliates: | |
| Investment adviser fee | 1,572,500 |
| Trustees' fees | 9,223 |
| Trustees' deferred compensation plan | 116,199 |
| Interest payable on securities sold short | 1,172,629 |
| Accrued expenses | 908,636 |
| Total liabilities | $ 746,437,932 |
| Net Assets applicable to investors' interest in Portfolio | $3,513,988,954 |
49
See Notes to Consolidated Financial Statements.
Global Opportunities Portfolio
April 30, 2024
Consolidated Statement of Operations (Unaudited)
| | Six Months Ended |
| | April 30, 2024 |
| Investment Income | |
| Dividend income (net of foreign taxes withheld of $26,617) | $ 942,320 |
| Dividend income from affiliated investments | 6,829,656 |
| Interest income (net of foreign taxes withheld of $439,887) | 98,755,094 |
| Other income | 161,957 |
| Total investment income | $106,689,027 |
| Expenses | |
| Investment adviser fee | $ 9,023,064 |
| Trustees’ fees and expenses | 54,250 |
| Custodian fee | 507,872 |
| Legal and accounting services | 147,604 |
| Interest expense and fees | 1,199,116 |
| Interest expense on securities sold short | 897,533 |
| Miscellaneous | 49,424 |
| Total expenses | $ 11,878,863 |
| Deduct: | |
| Waiver and/or reimbursement of expenses by affiliates | $ 200,296 |
| Total expense reductions | $ 200,296 |
| Net expenses | $ 11,678,567 |
| Net investment income | $ 95,010,460 |
| Realized and Unrealized Gain (Loss) | |
| Net realized gain (loss): | |
| Investment transactions | $ (15,765,864) |
| Securities sold short | (4,040,842) |
| Futures contracts | (32,042,268) |
| Swap contracts | (4,351,027) |
| Foreign currency transactions | (1,253,233) |
| Forward foreign currency exchange contracts | (8,182,535) |
| Net realized loss | $ (65,635,769) |
| Change in unrealized appreciation (depreciation): | |
| Investments | $ 104,931,108 |
| Written swaptions | (4,998,128) |
| Securities sold short | (204,072) |
| TBA sale commitments | (552,734) |
| Futures contracts | (34,068,697) |
| Swap contracts | 15,046,449 |
| Foreign currency | 291,013 |
| Forward foreign currency exchange contracts | 7,488,300 |
| Net change in unrealized appreciation (depreciation) | $ 87,933,239 |
| Net realized and unrealized gain | $ 22,297,470 |
| Net increase in net assets from operations | $117,307,930 |
50
See Notes to Consolidated Financial Statements.
Global Opportunities Portfolio
April 30, 2024
Consolidated Statements of Changes in Net Assets
| | Six Months Ended
April 30, 2024
(Unaudited) | Year Ended
October 31, 2023 |
| Increase (Decrease) in Net Assets | | |
| From operations: | | |
| Net investment income | $ 95,010,460 | $ 144,422,412 |
| Net realized loss | (65,635,769) | (58,852,265) |
| Net change in unrealized appreciation (depreciation) | 87,933,239 | (26,687,036) |
| Net increase in net assets from operations | $ 117,307,930 | $ 58,883,111 |
| Capital transactions: | | |
| Contributions | $ 658,977,975 | $ 1,068,753,875 |
| Withdrawals | (255,759,585) | (317,425,020) |
| Net increase in net assets from capital transactions | $ 403,218,390 | $ 751,328,855 |
| Net increase in net assets | $ 520,526,320 | $ 810,211,966 |
| Net Assets | | |
| At beginning of period | $ 2,993,462,634 | $ 2,183,250,668 |
| At end of period | $3,513,988,954 | $2,993,462,634 |
51
See Notes to Consolidated Financial Statements.
Global Opportunities Portfolio
April 30, 2024
Consolidated Financial Highlights
| | Six Months Ended
April 30, 2024
(Unaudited) | Year Ended October 31, |
| Ratios/Supplemental Data | 2023 | 2022 | 2021 | 2020 | 2019 |
| Ratios (as a percentage of average daily net assets): | | | | | | |
| Expenses | 0.72% (1)(2)(3) | 0.64% | 0.66% | 0.70% | 0.69% | 0.69% |
| Net investment income | 5.86% (1) | 5.82% | 4.04% | 4.22% | 2.85% | 4.61% |
| Portfolio Turnover | 149% (4)(5) | 526% (5) | 400% (5) | 218% (5) | 87% (5) | 39% |
| Total Return | 3.88% (4) | 2.94% | (2.97)% | 3.53% | 7.52% | 3.21% |
| Net assets, end of period (000’s omitted) | $3,513,989 | $2,993,463 | $2,183,251 | $1,881,061 | $1,359,116 | $1,367,072 |
| (1) | Annualized. |
| (2) | Includes interest and/or dividend expense on securities sold short and/or reverse repurchase agreements of 0.13%, 0.01%, 0.02%, 0.03% and 0.01% of average daily net assets for the six months ended April 30, 2024 and the years ended October 31, 2023, 2022, 2021 and 2020, respectively. |
| (3) | Includes a reduction by the investment adviser of a portion of its adviser fee due to the Portfolio’s investment in the Liquidity Fund (equal to 0.01%, 0.02% and 0.01% of average daily net assets for the six months ended April 30, 2024 and the years ended October 31, 2023 and 2022, respectively). |
| (4) | Not annualized. |
| (5) | Includes the effect of To Be Announced (TBA) transactions. |
52
See Notes to Consolidated Financial Statements.
Global Opportunities Portfolio
April 30, 2024
Notes to Consolidated Financial Statements (Unaudited)
1 Significant Accounting Policies
Global Opportunities Portfolio (the Portfolio) is a Massachusetts business trust registered under the Investment Company Act of 1940, as amended (the 1940 Act), as a non-diversified, open-end management investment company. The Portfolio’s investment objective is total return. The Declaration of Trust permits the Trustees to issue interests in the Portfolio. At April 30, 2024, Eaton Vance Strategic Income Fund (formerly, Short Duration Strategic Income Fund) and Eaton Vance International (Cayman Islands) Strategic Income Fund (formerly, Eaton Vance International (Cayman Islands) Short Duration Strategic Income Fund) held an interest of 98.8% and 1.2%, respectively, in the Portfolio.
The Portfolio seeks to gain exposure to the commodity markets, in whole or in part, through investments in Eaton Vance GOP Commodity Subsidiary, Ltd. (the Subsidiary), a wholly-owned subsidiary of the Portfolio organized under the laws of the Cayman Islands with the same objective and investment policies and restrictions as the Portfolio. The net assets of the Subsidiary at April 30, 2024 were $919,862 or less than 0.1% of the Portfolio’s consolidated net assets. The accompanying consolidated financial statements include the accounts of the Subsidiary. Intercompany balances and transactions have been eliminated in consolidation.
The following is a summary of significant accounting policies of the Portfolio. The policies are in conformity with accounting principles generally accepted in the United States of America (U.S. GAAP). The Portfolio is an investment company and follows accounting and reporting guidance in the Financial Accounting Standards Board (FASB) Accounting Standards Codification Topic 946.
A Investment Valuation—The following methodologies are used to determine the market value or fair value of investments.
Debt Obligations. Debt obligations are generally valued on the basis of valuations provided by third party pricing services, as derived from such services’ pricing models. Inputs to the models may include, but are not limited to, reported trades, executable bid and ask prices, broker/dealer quotations, prices or yields of securities with similar characteristics, interest rates, anticipated prepayments, benchmark curves or information pertaining to the issuer, as well as industry and economic events. The pricing services may use a matrix approach, which considers information regarding securities with similar characteristics to determine the valuation for a security. Short-term debt obligations purchased with a remaining maturity of sixty days or less for which a valuation from a third party pricing service is not readily available may be valued at amortized cost, which approximates fair value.
Senior Floating-Rate Loans. Interests in senior floating-rate loans (Senior Loans) for which reliable market quotations are readily available are valued generally at the average mean of bid and ask quotations obtained from a third party pricing service.
Equity Securities. Equity securities listed on a U.S. securities exchange generally are valued at the last sale or closing price on the day of valuation or, if no sales took place on such date, at the mean between the closing bid and ask prices on the exchange where such securities are principally traded. Equity securities listed on the NASDAQ National Market System are valued at the NASDAQ official closing price. Unlisted or listed securities for which closing sales prices or closing quotations are not available are valued at the mean between the latest available bid and ask prices or, in the case of preferred equity securities that are not listed or traded in the over-the-counter market, by a third party pricing service that uses various techniques that consider factors including, but not limited to, prices or yields of securities with similar characteristics, benchmark yields, broker/dealer quotes, quotes of underlying common stock, issuer spreads, as well as industry and economic events.
Derivatives. Futures contracts are valued at the closing settlement price established by the board of trade or exchange on which they are traded. Forward foreign currency exchange contracts are generally valued at the mean of the average bid and average ask prices that are reported by currency dealers to a third party pricing service at the valuation time. Such third party pricing service valuations are supplied for specific settlement periods and the Portfolio’s forward foreign currency exchange contracts are valued at an interpolated rate between the closest preceding and subsequent settlement period reported by the third party pricing service. Swaps and options on swaps (“swaptions”) are normally valued using valuations provided by a third party pricing service. Such pricing service valuations are based on the present value of fixed and projected floating rate cash flows over the term of the swap contract, and in the case of credit default swaps, based on credit spread quotations obtained from broker/dealers and expected default recovery rates determined by the pricing service using proprietary models. Future cash flows on swaps are discounted to their present value using swap rates provided by electronic data services or by broker/dealers. Alternatively, swaptions may be valued at the valuation provided by a broker/dealer (usually the counterparty to the option), so determined using similar techniques as those employed by the pricing service.
Foreign Securities and Currencies. Foreign securities and currencies are valued in U.S. dollars, based on foreign currency exchange rate quotations supplied by a third party pricing service. The pricing service uses a proprietary model to determine the exchange rate. Inputs to the model include reported trades and implied bid/ask spreads. The daily valuation of exchange-traded foreign securities generally is determined as of the close of trading on the principal exchange on which such securities trade. Events occurring after the close of trading on foreign exchanges may result in adjustments to the valuation of foreign securities to more accurately reflect their fair value as of the close of regular trading on the New York Stock Exchange. When valuing foreign equity securities that meet certain criteria, the Portfolio’s Trustees have approved the use of a fair value service that values such securities to reflect market trading that occurs after the close of the applicable foreign markets of comparable securities or other instruments that have a strong correlation to the fair-valued securities.
Other. Investments in management investment companies (including money market funds) that do not trade on an exchange are valued at the net asset value as of the close of each business day.
Global Opportunities Portfolio
April 30, 2024
Notes to Consolidated Financial Statements (Unaudited) — continued
Fair Valuation. In connection with Rule 2a-5 of the 1940 Act, the Trustees have designated the Portfolio’s investment adviser as its valuation designee. Investments for which valuations or market quotations are not readily available or are deemed unreliable are valued by the investment adviser, as valuation designee, at fair value using methods that most fairly reflect the security’s “fair value”, which is the amount that the Portfolio might reasonably expect to receive for the security upon its current sale in the ordinary course. Each such determination is based on a consideration of relevant factors, which are likely to vary from one pricing context to another. These factors may include, but are not limited to, the type of security, the existence of any contractual restrictions on the security’s disposition, the price and extent of public trading in similar securities of the issuer or of comparable companies or entities, quotations or relevant information obtained from broker/dealers or other market participants, information obtained from the issuer, analysts, and/or the appropriate stock exchange (for exchange-traded securities), an analysis of the company’s or entity’s financial statements, and an evaluation of the forces that influence the issuer and the market(s) in which the security is purchased and sold.
B Investment Transactions—Investment transactions for financial statement purposes are accounted for on a trade date basis. Realized gains and losses on investments sold are determined on the basis of identified cost.
C Income—Interest income is recorded on the basis of interest accrued, adjusted for amortization of premium or accretion of discount. Inflation adjustments to the principal amount of inflation-adjusted bonds and notes are reflected as interest income. Deflation adjustments to the principal amount of an inflation-adjusted bond or note are reflected as reductions to interest income to the extent of interest income previously recorded on such bond or note. Dividend income is recorded on the ex-dividend date for dividends received in cash and/or securities. However, if the ex-dividend date has passed, certain dividends from foreign securities are recorded as the Portfolio is informed of the ex-dividend date. Withholding taxes on foreign interest, dividends and capital gains have been provided for in accordance with the Portfolio’s understanding of the applicable countries’ tax rules and rates. Distributions from investment companies are recorded as dividend income, capital gains or return of capital based on the nature of the distribution.
D Federal and Other Taxes—The Portfolio has elected to be treated as a partnership for federal tax purposes. No provision is made by the Portfolio for federal or state taxes on any taxable income of the Portfolio because each investor in the Portfolio is ultimately responsible for the payment of any taxes on its share of taxable income. If one of the Portfolio's investors is a regulated investment company that invests all or substantially all of its assets in the Portfolio, the Portfolio normally must satisfy the applicable source of income and diversification requirements (under the Internal Revenue Code) in order for its investors to satisfy them. The Portfolio will allocate, at least annually among its investors, each investor's distributive share of the Portfolio's net investment income, net realized capital gains and losses and any other items of income, gain, loss, deduction or credit.
In addition to the requirements of the Internal Revenue Code, the Portfolio may also be subject to local taxes on the recognition of capital gains in certain countries. In determining the daily net asset value, the Portfolio estimates the accrual for such taxes, if any, based on the unrealized appreciation on certain portfolio securities and the related tax rates. Taxes attributable to unrealized appreciation are included in the change in unrealized appreciation (depreciation) on investments. Capital gains taxes on securities sold are included in net realized gain (loss) on investments.
The Subsidiary is treated as a controlled foreign corporation under the Internal Revenue Code and is not expected to be subject to U.S. federal income tax. The Portfolio is treated as a U.S. shareholder of the Subsidiary. As a result, the Portfolio is required to include in gross income for U.S. federal tax purposes all of the Subsidiary's income, whether or not such income is distributed by the Subsidiary. If a net loss is realized by the Subsidiary, such loss is not generally available to offset the income earned by the Portfolio.
As of April 30, 2024, the Portfolio had no uncertain tax positions that would require financial statement recognition, de-recognition, or disclosure. The Portfolio files a U.S. federal income tax return annually after its fiscal year-end, which is subject to examination by the Internal Revenue Service for a period of three years from the date of filing.
E Foreign Currency Translation—Investment valuations, other assets, and liabilities initially expressed in foreign currencies are translated each business day into U.S. dollars based upon current exchange rates. Purchases and sales of foreign investment securities and income and expenses denominated in foreign currencies are translated into U.S. dollars based upon currency exchange rates in effect on the respective dates of such transactions. Recognized gains or losses on investment transactions attributable to changes in foreign currency exchange rates are recorded for financial statement purposes as net realized gains and losses on investments. That portion of unrealized gains and losses on investments that results from fluctuations in foreign currency exchange rates is not separately disclosed.
F Unfunded Loan Commitments—The Portfolio may enter into certain loan agreements all or a portion of which may be unfunded. The Portfolio is obligated to fund these commitments at the borrower's discretion. These commitments, if any, are disclosed in the accompanying Consolidated Portfolio of Investments.
G Use of Estimates—The preparation of the consolidated financial statements in conformity with U.S. GAAP requires management to make estimates and assumptions that affect the reported amounts of assets and liabilities at the date of the consolidated financial statements and the reported amounts of income and expense during the reporting period. Actual results could differ from those estimates.
H Indemnifications—Under the Portfolio’s organizational documents, its officers and Trustees may be indemnified against certain liabilities and expenses arising out of the performance of their duties to the Portfolio. Under Massachusetts law, if certain conditions prevail, interestholders in the Portfolio could be deemed to have personal liability for the obligations of the Portfolio. However, the Portfolio’s Declaration of Trust contains an express disclaimer of
Global Opportunities Portfolio
April 30, 2024
Notes to Consolidated Financial Statements (Unaudited) — continued
liability on the part of Portfolio interestholders. Additionally, in the normal course of business, the Portfolio enters into agreements with service providers that may contain indemnification clauses. The Portfolio’s maximum exposure under these arrangements is unknown as this would involve future claims that may be made against the Portfolio that have not yet occurred.
I Futures Contracts—Upon entering into a futures contract, the Portfolio is required to deposit with the broker, either in cash or securities, an amount equal to a certain percentage of the contract amount (initial margin). Subsequent payments, known as variation margin, are made or received by the Portfolio each business day, depending on the daily fluctuations in the value of the underlying security or index, and are recorded as unrealized gains or losses by the Portfolio. Gains (losses) are realized upon the expiration or closing of the futures contracts. Should market conditions change unexpectedly, the Portfolio may not achieve the anticipated benefits of the futures contracts and may realize a loss. Futures contracts have minimal counterparty risk as they are exchange traded and the clearinghouse for the exchange is substituted as the counterparty, guaranteeing counterparty performance.
J Forward Foreign Currency Exchange Contracts—The Portfolio may enter into forward foreign currency exchange contracts for the purchase or sale of a specific foreign currency at a fixed price on a future date. The forward foreign currency exchange contracts are adjusted by the daily exchange rate of the underlying currency and any gains or losses are recorded as unrealized until such time as the contracts have been closed. While forward foreign currency exchange contracts are privately negotiated agreements between the Portfolio and a counterparty, certain contracts may be “centrally cleared”, whereby all payments made or received by the Portfolio pursuant to the contract are with a central clearing party (CCP) rather than the original counterparty. The CCP guarantees the performance of the original parties to the contract. Upon entering into centrally cleared contracts, the Portfolio is required to deposit with the CCP, either in cash or securities, an amount of initial margin determined by the CCP, which is subject to adjustment. For centrally cleared contracts, the daily change in valuation is recorded as a receivable or payable for variation margin and settled in cash with the CCP daily. Risks may arise upon entering these contracts from the potential inability of counterparties to meet the terms of their contracts and from movements in the value of a foreign currency relative to the U.S. dollar. In the case of centrally cleared contracts, counterparty risk is minimal due to protections provided by the CCP.
K Interest Rate Swaps—Swap contracts are privately negotiated agreements between the Portfolio and a counterparty. Certain swap contracts may be centrally cleared. Pursuant to interest rate swap agreements, the Portfolio either makes floating-rate payments to the counterparty (or CCP in the case of centrally cleared swaps) based on a benchmark interest rate in exchange for fixed-rate payments or the Portfolio makes fixed-rate payments to the counterparty (or CCP in the case of a centrally cleared swap) in exchange for payments on a floating benchmark interest rate. Payments received or made, including amortization of upfront payments/receipts, if any (which are amortized over the life of the swap contract), are recorded as realized gains or losses. During the term of the outstanding swap agreement, changes in the underlying value of the swap are recorded as unrealized gains or losses. For centrally cleared swaps, the daily change in valuation is recorded as a receivable or payable for variation margin and settled in cash with the CCP daily. The value of the swap is determined by changes in the relationship between two rates of interest. The Portfolio is exposed to credit loss in the event of non-performance by the swap counterparty. In the case of centrally cleared swaps, counterparty risk is minimal due to protections provided by the CCP. Risk may also arise from movements in interest rates.
L Inflation Swaps—Pursuant to inflation swap agreements, the Portfolio either makes floating-rate payments to the counterparty (or CCP in the case of centrally cleared swaps) based on a benchmark index in exchange for fixed-rate payments or the Portfolio makes fixed-rate payments to the counterparty (or CCP in the case of centrally cleared swaps) in exchange for floating-rate payments based on the return of a benchmark index. By design, the benchmark index is an inflation index, such as the Consumer Price Index. The accounting policy for payments received or made and changes in the underlying value of the inflation swap are the same as for interest rate swaps as described above. The value of the swap is determined by changes in the relationship between the rate of interest and the benchmark index. The Portfolio is exposed to credit loss in the event of nonperformance by the swap counterparty. In the case of centrally cleared swaps, counterparty risk is minimal due to protections provided by the CCP. Risk may also arise from the unanticipated movements in value of interest rates or the index.
M Cross-Currency Swaps—Cross-currency swaps are interest rate swaps in which interest cash flows are exchanged between two parties based on the notional amounts of two different currencies. The notional amounts are typically determined based on the spot exchange rates at the inception of the trade. Cross-currency swaps also involve the exchange of the notional amounts at the start of the contract at the current spot rate with an agreement to re-exchange such amounts at a later date at either the same exchange rate, a specified rate or the then current spot rate. The entire principal value of a cross-currency swap is subject to the risk that the counterparty to the swap will default on its contractual delivery obligations.
N Credit Default Swaps—When the Portfolio is the buyer of a credit default swap contract, the Portfolio is entitled to receive the par (or other agreed-upon) value of a referenced debt obligation (or basket of debt obligations) from the counterparty (or CCP in the case of a centrally cleared swap) to the contract if a credit event by a third party, such as a U.S. or foreign corporate issuer or sovereign issuer, on the debt obligation occurs. In return, the Portfolio pays the counterparty a periodic stream of payments over the term of the contract provided that no credit event has occurred. If no credit event occurs, the Portfolio would have spent the stream of payments and received no proceeds from the contract. When the Portfolio is the seller of a credit default swap contract, it receives the stream of payments, but is obligated to pay to the buyer of the protection an amount up to the notional amount of the swap and in certain instances take delivery of securities of the reference entity upon the occurrence of a credit event, as defined under the terms of that particular swap agreement. Credit events are contract specific but may include bankruptcy, failure to pay, restructuring, obligation acceleration and repudiation/moratorium. If the Portfolio is a seller of protection and a credit event occurs, the maximum potential amount of future payments that the Portfolio could be required to make would be an amount equal to the notional amount of the agreement. This potential amount would be partially offset by any recovery value of the respective referenced obligation, or net amount received from the settlement of a buy protection credit default swap agreement
Global Opportunities Portfolio
April 30, 2024
Notes to Consolidated Financial Statements (Unaudited) — continued
entered into by the Portfolio for the same referenced obligation. As the seller, the Portfolio may create economic leverage to its portfolio because, in addition to its total net assets, the Portfolio is subject to investment exposure on the notional amount of the swap. The interest fee paid or received on the swap contract, which is based on a specified interest rate on a fixed notional amount, is accrued daily as a component of unrealized appreciation (depreciation) and is recorded as realized gain upon receipt or realized loss upon payment. The Portfolio also records an increase or decrease to unrealized appreciation (depreciation) in an amount equal to the daily valuation. For centrally cleared swaps, the daily change in valuation is recorded as a receivable or payable for variation margin and settled in cash with the CCP daily. All upfront payments and receipts, if any, are amortized over the life of the swap contract as realized gains or losses. Those upfront payments or receipts for non-centrally cleared swaps are recorded as other assets or other liabilities, respectively, net of amortization. For financial reporting purposes, unamortized upfront payments or receipts, if any, are netted with unrealized appreciation or depreciation on swap contracts to determine the market value of swaps as presented in Notes 6 and 10. These transactions involve certain risks, including the risk that the seller may be unable to fulfill the transaction. In the case of centrally cleared swaps, counterparty risk is minimal due to protections provided by the CCP.
O Swaptions—A purchased swaption contract grants the Portfolio, in return for payment of the purchase price, the right, but not the obligation, to enter into a new swap agreement or to shorten, extend, cancel or otherwise modify an existing swap agreement, at some designated future time on specified terms. When the Portfolio purchases a swaption, the premium paid to the writer is recorded as an investment and subsequently marked-to-market to reflect the current value of the swaption. A written swaption gives the Portfolio the obligation, if exercised by the purchaser, to enter into a swap contract according to the terms of the underlying agreement. When the Portfolio writes a swaption, the premium received by the Portfolio is recorded as a liability and subsequently marked-to-market to reflect the current value of the swaption. When a swaption is exercised, the cost of the swap is adjusted by the amount of the premium paid or received. When a swaption expires or an unexercised swaption is closed, a gain or loss is recognized in the amount of the premium paid or received, plus the cost to close. The Portfolio’s risk for purchased swaptions is limited to the premium paid. The writer of a swaption bears the risk of unfavorable changes in the preset terms of the underlying swap contract.
P When-Issued Securities and Delayed Delivery Transactions—The Portfolio may purchase securities on a delayed delivery, when-issued or forward commitment basis, including TBA (To Be Announced) securities. Payment and delivery may take place after the customary settlement period for that security. At the time the transaction is negotiated, the price of the security that will be delivered is fixed. Securities purchased on a delayed delivery, when-issued or forward commitment basis are marked-to-market daily and begin earning interest on settlement date. Such security purchases are subject to the risk that when delivered they will be worth less than the agreed upon payment price. Losses may also arise if the counterparty does not perform under the contract. A forward purchase commitment may also be closed by entering into an offsetting commitment. If an offsetting commitment is entered into, the Portfolio will realize a gain or loss on investments based on the price established when the Portfolio entered into the commitment.
Q Repurchase Agreements—A repurchase agreement is the purchase by the Portfolio of securities from a counterparty in exchange for cash that is coupled with an agreement to resell those securities to the counterparty at a specified date and price. When a repurchase agreement is entered, the Portfolio typically receives securities with a value that equals or exceeds the repurchase price, including any accrued interest earned on the agreement. The value of such securities will be marked-to-market daily, and cash or additional securities will be exchanged between the parties as needed. Except in the case of a repurchase agreement entered to settle a short sale, the value of the securities delivered to the Portfolio will be at least equal to 90% of the repurchase price during the term of the repurchase agreement. The terms of a repurchase agreement entered to settle a short sale may provide that the cash purchase price paid by the Portfolio is more than the value of purchased securities that effectively collateralize the repurchase price payable by the counterparty. In the event of insolvency of the counterparty to a repurchase agreement, recovery of the repurchase price owed to the Portfolio may be delayed. Such an insolvency also may result in a loss to the extent that the value of the purchased securities decreases during the delay or that value has otherwise not been maintained at an amount at least equal to the repurchase price.
R Reverse Repurchase Agreements—Under a reverse repurchase agreement, the Portfolio temporarily transfers possession of a portfolio security to another party, such as a bank or broker/dealer, in return for cash. At the same time, the Portfolio agrees to repurchase the security at an agreed upon time and price, which reflects an interest payment. In periods of increased demand for a security, the Portfolio may receive a payment from the counterparty for the use of the security, which is recorded as interest income. Because the Portfolio retains effective control over the transferred security, the transaction is accounted for as a secured borrowing. The Portfolio may enter into such agreements when it believes it is able to invest the cash acquired at a rate higher than the cost of the agreement, which would increase earned income. When the Portfolio enters into a reverse repurchase agreement, any fluctuations in the market value of either the securities transferred to another party or the securities in which the proceeds may be invested would affect the market value of the Portfolio’s assets. Because reverse repurchase agreements may be considered to be the practical equivalent of borrowing funds (and the counterparty making a loan), they constitute a form of leverage. The Portfolio segregates cash or liquid assets equal to its obligation to repurchase the security. During the term of the agreement, the Portfolio may also be obligated to pledge additional cash and/or securities in the event of a decline in the fair value of the transferred security. In the event the counterparty to a reverse repurchase agreement becomes insolvent, recovery of the security transferred by the Portfolio may be delayed or the Portfolio may incur a loss equal to the amount by which the value of the security transferred by the Portfolio exceeds the repurchase price payable by the Portfolio.
S Securities Sold Short—A short sale is a transaction in which the Portfolio sells a security it does not own in anticipation of a decline in the market value of that security. To complete such a transaction, the Portfolio must borrow the security to make delivery to the buyer with an obligation to replace such borrowed security at a later date. Until the security is replaced, the Portfolio is required to repay the lender any dividends or interest, which accrue during the period of the loan. The proceeds received from a short sale are recorded as a liability and the Portfolio records an unrealized gain or loss to the extent of
Global Opportunities Portfolio
April 30, 2024
Notes to Consolidated Financial Statements (Unaudited) — continued
the difference between the proceeds received and the value of the open short position on the day of determination. A gain, limited to the price at which the Portfolio sold the security short, or a loss, potentially unlimited as there is no upward limit on the price of a security, is recorded when the short position is terminated. Interest and dividends payable on securities sold short are recorded as an expense.
T Stripped Mortgage-Backed Securities—The Portfolio may invest in Interest Only (IO) and Principal Only (PO) securities, forms of stripped mortgage-
backed securities, whereby the IO security receives all the interest and the PO security receives all the principal on a pool of mortgage assets. The yield to maturity on an IO security is extremely sensitive to the rate of principal payments (including prepayments) on the related underlying mortgage assets, and a rapid rate of principal payments may have a material adverse effect on the yield to maturity from these securities. If the underlying mortgages experience greater than anticipated prepayments of principal, the Portfolio may fail to recoup its initial investment in an IO security. The market value of IO and PO securities can be unusually volatile due to changes in interest rates.
U Interim Consolidated Financial Statements—The interim consolidated financial statements relating to April 30, 2024 and for the six months then ended have not been audited by an independent registered public accounting firm, but in the opinion of the Portfolio’s management, reflect all adjustments, consisting only of normal recurring adjustments, necessary for the fair presentation of the consolidated financial statements.
2 Investment Adviser Fee and Other Transactions with Affiliates
The investment adviser fee is earned by Boston Management and Research (BMR), an indirect, wholly-owned subsidiary of Morgan Stanley, as compensation for investment advisory services rendered to the Portfolio and the Subsidiary. The Portfolio and Subsidiary each pay BMR a fee computed at an annual rate as a percentage of its respective average daily net assets as follows and is payable monthly:
| Average Daily Net Assets | Annual Fee Rate |
| Up to $500 million | 0.615% |
| $500 million but less than $1 billion | 0.595% |
| $1 billion but less than $1.5 billion | 0.575% |
| $1.5 billion but less than $2 billion | 0.555% |
| $2 billion but less than $3 billion | 0.520% |
| $3 billion and over | 0.490% |
In determining the investment adviser fee for the Portfolio and Subsidiary, the applicable advisory fee rate is based on the average daily net assets of the Portfolio (inclusive of its interest in the Subsidiary). Such fee rate is then assessed separately on the Portfolio’s average daily net assets (exclusive of its interest in the Subsidiary) and the Subsidiary’s average daily net assets to determine the amount of the investment adviser fee. For the six months ended April 30, 2024, the Portfolio’s investment adviser fee amounted to $9,023,064 or 0.56% (annualized) of the Portfolio's consolidated average daily net assets.
The Portfolio may invest in a money market fund, the Institutional Class of the Morgan Stanley Institutional Liquidity Funds - Government Portfolio (the “Liquidity Fund”), an open-end management investment company managed by Morgan Stanley Investment Management Inc., a wholly-owned subsidiary of Morgan Stanley. The investment adviser fee paid by the Portfolio is reduced by an amount equal to its pro rata share of the advisory and administration fees paid by the Portfolio due to its investment in the Liquidity Fund. For the six months ended April 30, 2024, the investment adviser fee paid was reduced by $200,296 relating to the Portfolio's investment in the Liquidity Fund.
Trustees and officers of the Portfolio who are members of BMR’s organization receive remuneration for their services to the Portfolio out of the investment adviser fee. Trustees of the Portfolio who are not affiliated with the investment adviser may elect to defer receipt of all or a percentage of their annual fees in accordance with the terms of the Trustees Deferred Compensation Plan. Certain officers and Trustees of the Portfolio are officers of the above organization.
Global Opportunities Portfolio
April 30, 2024
Notes to Consolidated Financial Statements (Unaudited) — continued
3 Purchases and Sales of Investments
Purchases and sales of investments, other than short-term obligations and including maturities, paydowns, principal repayments on Senior Loans, TBA transactions and securities sold short, for the six months ended April 30, 2024 were as follows:
| | Purchases | Sales |
| Investments (non-U.S. Government) | $ 1,205,436,981 | $ 804,949,627 |
| U.S. Government and Agency Securities | 4,714,753,810 | 4,085,577,648 |
| | $5,920,190,791 | $4,890,527,275 |
4 Federal Income Tax Basis of Investments
The cost and unrealized appreciation (depreciation) of investments of the Portfolio, including open derivative contracts and the Portfolio's investment in the Subsidiary at April 30, 2024, as determined on a federal income tax basis, were as follows:
| Aggregate cost | $4,274,390,704 |
| Gross unrealized appreciation | $ 86,747,838 |
| Gross unrealized depreciation | (299,814,424) |
| Net unrealized depreciation | $ (213,066,586) |
Global Opportunities Portfolio
April 30, 2024
Notes to Consolidated Financial Statements (Unaudited) — continued
5 Restricted Securities
At April 30, 2024, the Portfolio owned the following securities (representing 1.9% of net assets) which were restricted as to public resale and not registered under the Securities Act of 1933 (excluding Rule 144A securities). The Portfolio has various registration rights (exercisable under a variety of circumstances) with respect to these securities. The value of these securities is determined based on valuations provided by brokers when available, or if not available, they are valued at fair value using methods determined in good faith by or at the direction of the Trustees’ valuation designee.
| Description | Date(s) of
Acquisition | Shares | Cost | Value |
| Reinsurance Side Cars | | | | |
| Mt. Logan Re Ltd., Series 13, Preference Shares | 1/2/18 | 10,000 | $ 6,658,283 | $ 17,801,622 |
| Mt. Logan Re Ltd., Series 17, Preference Shares | 1/26/21 | 860 | 572,931 | 1,510,828 |
| Mt. Logan Re Ltd., Series 19, Preference Shares | 2/6/24 | 7,464 | 7,463,900 | 7,970,859 |
| PartnerRe ILS Fund SAC Ltd. | 1/2/24 | 34,000,000 | 34,000,000 | 35,176,400 |
| Sussex Capital Ltd., Designated Investment Series 5, 5/19 | 5/31/19 | 249 | 212,150 | 11,429 |
| Sussex Capital Ltd., Designated Investment Series 5, 12/19 | 1/17/20 | 791 | 673,953 | 25,264 |
| Sussex Capital Ltd., Designated Investment Series 5, 6/20 | 6/30/20 | 434 | 64,320 | 30,657 |
| Sussex Capital Ltd., Designated Investment Series 5, 4/21 | 4/1/21 | 247 | 195,858 | 12,906 |
| Sussex Capital Ltd., Designated Investment Series 5, 12/21 | 1/24/22 | 958 | 952,280 | 20,684 |
| Sussex Capital Ltd., Designated Investment Series 5, 11/22 | 3/11/22 | 958 | 956,716 | 270,936 |
| Sussex Capital Ltd., Designated Investment Series 15, 12/21 | 1/24/22 | 743 | 738,092 | 16,031 |
| Sussex Capital Ltd., Designated Investment Series 15, 11/22 | 3/11/22 | 721 | 720,077 | 203,920 |
| Sussex Capital Ltd., Series 5, Preference Shares | 12/17/18 | 1,172 | 518,340 | 1,681,380 |
| Sussex Capital Ltd., Series 15, Preference Shares | 6/1/21 | 977 | 692,158 | 1,243,212 |
| Sussex Re Ltd., Series 2020A | 1/21/20 | 4,081,939 | 0 | 154,706 |
| Sussex Re Ltd., Series 2021A | 1/14/21 | 4,154,232 | 0 | 304,505 |
| Total Restricted Securities | | | $54,419,058 | $66,435,339 |
6 Financial Instruments
The Portfolio may trade in financial instruments with off-balance sheet risk in the normal course of its investing activities. These financial instruments may include written swaptions, forward foreign currency exchange contracts, futures contracts and swap contracts and may involve, to a varying degree, elements of risk in excess of the amounts recognized for financial statement purposes. The notional or contractual amounts of these instruments represent the investment the Portfolio has in particular classes of financial instruments and do not necessarily represent the amounts potentially subject to risk. The measurement of the risks associated with these instruments is meaningful only when all related and offsetting transactions are considered. A summary of obligations under these financial instruments at April 30, 2024 is included in the Consolidated Portfolio of Investments. At April 30, 2024, the Portfolio had sufficient cash and/or securities to cover commitments under these contracts.
In the normal course of pursuing its investment objective, the Portfolio is subject to the following risks:
Credit Risk: During the six months ended April 30, 2024, the Portfolio entered into credit default swaps to manage certain investment risks and/or to enhance total return or as a substitute for the purchase or sale of securities.
Foreign Exchange Risk: The Portfolio engages in forward foreign currency exchange contracts and cross-currency swaps to enhance total return, to seek to hedge against fluctuations in currency exchange rates and/or as a substitute for the purchase or sale of securities or currencies.
Interest Rate Risk: During the six months ended April 30, 2024, the Portfolio utilized various interest rate derivatives including interest rate futures contracts, interest rate swaps and swaptions, inflation swaps and cross-currency swaps to enhance total return, to seek to hedge against fluctuations in interest rates and/or to change the effective duration of its portfolio.
The Portfolio enters into over-the-counter (OTC) derivatives that may contain provisions whereby the counterparty may terminate the contract under certain conditions, including but not limited to a decline in the Portfolio’s net assets below a certain level over a certain period of time, which would trigger a payment by the Portfolio for those derivatives in a liability position. At April 30, 2024, the fair value of derivatives with credit-related contingent features in a net liability position was $10,793,519. The aggregate fair value of assets pledged as collateral by the Portfolio for such liability was $7,722,800 at April 30, 2024.
Global Opportunities Portfolio
April 30, 2024
Notes to Consolidated Financial Statements (Unaudited) — continued
The OTC derivatives in which the Portfolio invests (except for written swaptions as the Portfolio, not the counterparty, is obligated to perform) are subject to the risk that the counterparty to the contract fails to perform its obligations under the contract. To mitigate this risk, the Portfolio (and Subsidiary) has entered into an International Swaps and Derivatives Association, Inc. Master Agreement (“ISDA Master Agreement”) or similar agreement with substantially all its derivative counterparties. An ISDA Master Agreement is a bilateral agreement between the Portfolio and a counterparty that governs certain OTC derivatives and typically contains, among other things, set-off provisions in the event of a default and/or termination event as defined under the relevant ISDA Master Agreement. Under an ISDA Master Agreement, the Portfolio (and Subsidiary) may, under certain circumstances, offset with the counterparty certain derivative financial instruments’ payables and/or receivables with collateral held and/or posted and create one single net payment. The provisions of the ISDA Master Agreement typically permit a single net payment in the event of default including the bankruptcy or insolvency of the counterparty. However, bankruptcy or insolvency laws of a particular jurisdiction may impose restrictions on or prohibitions against the right of offset in bankruptcy or insolvency. Certain ISDA Master Agreements allow counterparties to OTC derivatives to terminate derivative contracts prior to maturity in the event the Portfolio’s net assets decline by a stated percentage or the Portfolio fails to meet the terms of its ISDA Master Agreements, which would cause the counterparty to accelerate payment by the Portfolio of any net liability owed to it.
The collateral requirements for derivatives traded under an ISDA Master Agreement are governed by a Credit Support Annex to the ISDA Master Agreement. Collateral requirements are determined at the close of business each day and are typically based on changes in market values for each transaction under an ISDA Master Agreement and netted into one amount for such agreement. Generally, the amount of collateral due from or to a counterparty is subject to a minimum transfer threshold amount before a transfer is required, which may vary by counterparty. Collateral pledged for the benefit of the Portfolio (and Subsidiary) and/or counterparty is held in segregated accounts by the Portfolio’s custodian and cannot be sold, re-pledged, assigned or otherwise used while pledged. The portion of such collateral representing cash, if any, is reflected as deposits for derivatives collateral and, in the case of cash pledged by a counterparty for the benefit of the Portfolio, a corresponding liability on the Consolidated Statement of Assets and Liabilities. Securities pledged by the Portfolio as collateral, if any, are identified as such in the Consolidated Portfolio of Investments. The carrying amount of the liability for cash collateral due to brokers at April 30, 2024 approximated its fair value. If measured at fair value, such liability would have been considered as Level 2 in the fair value hierarchy (see Note 10) at April 30, 2024. Because the Subsidiary is not registered under the 1940 Act, it may not be able to negotiate terms with its counterparties that are equivalent to those a registered portfolio may negotiate. As a result, the Subsidiary may have greater exposure to those counterparties than a registered portfolio.
The fair value of open derivative instruments (not considered to be hedging instruments for accounting disclosure purposes) by risk exposure at April 30, 2024 was as follows:
| | Fair Value |
| Consolidated Statement of Assets and Liabilities Caption | Credit | Foreign
Exchange | Interest
Rate | Total |
| Not applicable | $ 151,834* | $ 8,408,666* | $ 40,297,307* | $ 48,857,807 |
| Receivable for open forward foreign currency exchange contracts | — | 2,267,217 | — | 2,267,217 |
| Receivable for open swap contracts | — | — | 4,414,248 | 4,414,248 |
| Total Asset Derivatives | $ 151,834 | $10,675,883 | $ 44,711,555 | $ 55,539,272 |
| Derivatives not subject to master netting or similar agreements | $ 151,834 | $ 8,408,666 | $ 40,297,307 | $ 48,857,807 |
| Total Asset Derivatives subject to master netting or similar agreements | $ — | $ 2,267,217 | $ 4,414,248 | $ 6,681,465 |
| Written swaptions outstanding, at value | $ — | $ — | $ (7,813,528) | $ (7,813,528) |
| Not applicable | (510,137)* | (1,224,814)* | (63,304,312)* | (65,039,263) |
| Payable for open forward foreign currency exchange contracts | — | (2,337,051) | — | (2,337,051) |
| Payable for open swap contracts | — | — | (642,940) | (642,940) |
| Total Liability Derivatives | $(510,137) | $ (3,561,865) | $(71,760,780) | $(75,832,782) |
| Derivatives not subject to master netting or similar agreements | $(510,137) | $ (1,224,814) | $(63,304,312) | $(65,039,263) |
| Total Liability Derivatives subject to master netting or similar agreements | $ — | $ (2,337,051) | $ (8,456,468) | $(10,793,519) |
| * | Only the current day’s variation margin on open futures contracts and centrally cleared derivatives is reported within the Consolidated Statement of Assets and Liabilities as Receivable or Payable for variation margin on open futures contracts and centrally cleared derivatives, as applicable. |
Global Opportunities Portfolio
April 30, 2024
Notes to Consolidated Financial Statements (Unaudited) — continued
The Portfolio's derivative assets and liabilities at fair value by risk, which are reported gross in the Consolidated Statement of Assets and Liabilities, are presented in the table above. The following tables present the Portfolio's derivative assets and liabilities by counterparty, net of amounts available for offset under a master netting agreement and net of the related collateral received by the Portfolio (and Subsidiary) for such assets and pledged by the Portfolio (and Subsidiary) for such liabilities as of April 30, 2024.
| Counterparty | Derivative
Assets Subject to
Master Netting
Agreement | Derivatives
Available
for Offset | Non-cash
Collateral
Received(a) | Cash
Collateral
Received(a) | Net Amount
of Derivative
Assets(b) | Total Cash
Collateral
Received |
| Australia and New Zealand Banking Group Limited | $ 517,367 | $ — | $ — | $ (430,000) | $ 87,367 | $ 430,000 |
| Bank of America, N.A. | 2,627,519 | (39,214) | (2,588,305) | — | — | — |
| Barclays Bank PLC | 308,857 | — | — | (130,000) | 178,857 | 130,000 |
| BNP Paribas | 96,341 | (96,341) | — | — | — | — |
| Citibank, N.A. | 325,667 | (325,667) | — | — | — | — |
| Goldman Sachs International | 457,903 | (457,903) | — | — | — | — |
| HSBC Bank USA, N.A. | 220,196 | — | (184,169) | — | 36,027 | — |
| JPMorgan Chase Bank, N.A. | 515,391 | (515,391) | — | — | — | — |
| Nomura International PLC | 449,861 | — | — | (449,861) | — | 500,000 |
| Standard Chartered Bank | 212,078 | (156,174) | — | — | 55,904 | — |
| State Street Bank and Trust Company | 538,697 | (71,035) | (244,060) | — | 223,602 | — |
| UBS AG | 411,588 | (264,326) | (147,262) | — | — | — |
| | $6,681,465 | $(1,926,051) | $(3,163,796) | $(1,009,861) | $581,757 | $1,060,000 |
| Counterparty | Derivative
Liabilities Subject to
Master Netting
Agreement | Derivatives
Available
for Offset | Non-cash
Collateral
Pledged(a) | Cash
Collateral
Pledged(a) | Net Amount
of Derivative
Liabilities(c) | Total Cash
Collateral
Pledged |
| Bank of America, N.A. | $ (39,214) | $ 39,214 | $ — | $ — | $ — | $ — |
| BNP Paribas | (765,328) | 96,341 | 562,954 | — | (106,033) | — |
| Citibank, N.A. | (4,164,194) | 325,667 | 3,621,306 | — | (217,221) | — |
| Goldman Sachs International | (684,078) | 457,903 | 146,077 | — | (80,098) | — |
| JPMorgan Chase Bank, N.A. | (4,624,290) | 515,391 | 3,307,092 | — | (801,807) | — |
| Societe Generale | (24,880) | — | — | — | (24,880) | — |
| Standard Chartered Bank | (156,174) | 156,174 | — | — | — | — |
| State Street Bank and Trust Company | (71,035) | 71,035 | — | — | — | — |
| UBS AG | (264,326) | 264,326 | — | — | — | — |
| | $(10,793,519) | $1,926,051 | $7,637,429 | $ — | $(1,230,039) | $ — |
| Total — Deposits for derivatives collateral — OTC derivatives | | | | $1,060,000 |
| (a) | In some instances, the total collateral received and/or pledged may be more than the amount shown due to overcollateralization. |
| (b) | Net amount represents the net amount due from the counterparty in the event of default. |
| (c) | Net amount represents the net amount payable to the counterparty in the event of default. |
Global Opportunities Portfolio
April 30, 2024
Notes to Consolidated Financial Statements (Unaudited) — continued
The effect of derivative instruments (not considered to be hedging instruments for accounting disclosure purposes) on the Consolidated Statement of Operations by risk exposure for the six months ended April 30, 2024 was as follows:
| Consolidated Statement of Operations Caption | Credit | Foreign
Exchange | Interest
Rate | Total |
| Net realized gain (loss): | | | | |
| Futures contracts | $ — | $ — | $ (32,042,268) | $ (32,042,268) |
| Swap contracts | (567,329) | — | (3,783,698) | (4,351,027) |
| Forward foreign currency exchange contracts | — | (8,182,535) | — | (8,182,535) |
| Total | $(567,329) | $(8,182,535) | $(35,825,966) | $(44,575,830) |
| Change in unrealized appreciation (depreciation): | | | | |
| Written swaptions | $ — | $ — | $ (4,998,128) | $ (4,998,128) |
| Futures contracts | — | — | (34,068,697) | (34,068,697) |
| Swap contracts | (28,425) | — | 15,074,874 | 15,046,449 |
| Forward foreign currency exchange contracts | — | 7,488,300 | — | 7,488,300 |
| Total | $ (28,425) | $ 7,488,300 | $(23,991,951) | $(16,532,076) |
The average notional cost of futures contracts and average notional amounts of other derivative contracts outstanding during the six months ended April 30, 2024, which are indicative of the volume of these derivative types, were approximately as follows:
Futures
Contracts — Long | Futures
Contracts — Short | Forward
Foreign Currency
Exchange Contracts* | Written
Swaptions | Swap
Contracts |
| $1,725,295,000 | $791,507,000 | $827,557,000 | $122,571,000 | $1,965,456,000 |
| * | The average notional amount for forward foreign currency exchange contracts is based on the absolute value of notional amounts of currency purchased and currency sold. |
7 Line of Credit
The Portfolio participates with other portfolios and funds managed by BMR and its affiliates in a $650 million unsecured revolving line of credit agreement with a group of banks, which is in effect through October 22, 2024. Borrowings are made by the Portfolio solely for temporary purposes related to redemptions and other short-term cash needs. Interest is charged to the Portfolio based on its borrowings at an amount above either the Secured Overnight Financing Rate (SOFR) or Federal Funds rate. In addition, a fee computed at an annual rate of 0.15% on the daily unused portion of the line of credit is allocated among the participating portfolios and funds at the end of each quarter. In connection with the renewal of the agreement in October 2023, an arrangement fee of $150,000 was incurred that was allocated to the participating portfolios and funds. Because the line of credit is not available exclusively to the Portfolio, it may be unable to borrow some or all of its requested amounts at any particular time. The Portfolio did not have any significant borrowings or allocated fees during the six months ended April 30, 2024.
8 Reverse Repurchase Agreements
There were no reverse repurchase agreements outstanding as of April 30, 2024. For the six months ended April 30, 2024, the average borrowings under settled reverse repurchase agreements and the average annual interest rate paid were approximately $33,238,000 and 5.65%, respectively.
Global Opportunities Portfolio
April 30, 2024
Notes to Consolidated Financial Statements (Unaudited) — continued
9 Affiliated Investments
At April 30, 2024, the value of the Portfolio's investment in funds that may be deemed to be affiliated was $136,713,931, which represents 3.9% of the Portfolio's net assets. Transactions in such investments by the Portfolio for the six months ended April 30, 2024 were as follows:
| Name | Value,
beginning
of period | Purchases | Sales
proceeds | Net realized
gain (loss) | Change in
unrealized
appreciation
(depreciation) | Value, end
of period | Dividend
income | Shares,
end of period |
| Short-Term Investments |
| Liquidity Fund | $422,234,524 | $1,284,862,972 | $(1,570,383,565) | $ — | $ — | $136,713,931 | $6,829,656 | 136,713,931 |
10 Fair Value Measurements
Under generally accepted accounting principles for fair value measurements, a three-tier hierarchy to prioritize the assumptions, referred to as inputs, is used in valuation techniques to measure fair value. The three-tier hierarchy of inputs is summarized in the three broad levels listed below.
| • | Level 1 – quoted prices in active markets for identical investments |
| • | Level 2 – other significant observable inputs (including quoted prices for similar investments, interest rates, prepayment speeds, credit risk, etc.) |
| • | Level 3 – significant unobservable inputs (including a fund's own assumptions in determining the fair value of investments) |
In cases where the inputs used to measure fair value fall in different levels of the fair value hierarchy, the level disclosed is determined based on the lowest level input that is significant to the fair value measurement in its entirety. The inputs or methodology used for valuing securities are not necessarily an indication of the risk associated with investing in those securities.
At April 30, 2024, the hierarchy of inputs used in valuing the Portfolio’s investments and open derivative instruments, which are carried at fair value, were as follows:
| Asset Description | Level 1 | Level 2 | Level 3 | Total |
| Asset-Backed Securities | $ — | $ 404,608,295 | $ — | $ 404,608,295 |
| Closed-End Funds | 7,426,853 | — | — | 7,426,853 |
| Collateralized Mortgage Obligations | — | 1,297,526,259 | — | 1,297,526,259 |
| Commercial Mortgage-Backed Securities | — | 24,139,093 | — | 24,139,093 |
| Common Stocks | 1,322,071 | 3,811,721* | — | 5,133,792 |
| Convertible Bonds | — | 119,347,642 | — | 119,347,642 |
| Convertible Preferred Stocks | 5,221,556 | — | — | 5,221,556 |
| Exchange-Traded Funds | 12,281,676 | — | — | 12,281,676 |
| Foreign Corporate Bonds | — | 255,181,095 | 0 | 255,181,095 |
| Loan Participation Notes | — | — | 16,957,211 | 16,957,211 |
| Reinsurance Side Cars | — | — | 103,264,308 | 103,264,308 |
| Senior Floating-Rate Loans | — | 8,269,560 | — | 8,269,560 |
| Sovereign Government Bonds | — | 362,461,764 | — | 362,461,764 |
| U.S. Department of Agriculture Loans | — | 13,333,657 | — | 13,333,657 |
| U.S. Government Agency Commercial Mortgage-Backed Securities | — | 13,460,984 | — | 13,460,984 |
| U.S. Government Agency Mortgage-Backed Securities | — | 1,162,948,737 | — | 1,162,948,737 |
| U.S. Government Guaranteed Small Business Administration Loans | — | 8,574,073 | — | 8,574,073 |
| U.S. Treasury Obligations | — | 10,387,286 | — | 10,387,286 |
| Miscellaneous | — | — | 0 | 0 |
| Short-Term Investments: | | | | |
| Affiliated Fund | 136,713,931 | — | — | 136,713,931 |
| Repurchase Agreements | — | 50,095,069 | — | 50,095,069 |
Global Opportunities Portfolio
April 30, 2024
Notes to Consolidated Financial Statements (Unaudited) — continued
| Asset Description (continued) | Level 1 | Level 2 | Level 3 | Total |
| Sovereign Government Securities | $ — | $ 24,072,762 | $ — | $ 24,072,762 |
| U.S. Treasury Obligations | — | 39,792,220 | — | 39,792,220 |
| Total Investments | $ 162,966,087 | $ 3,798,010,217 | $ 120,221,519 | $ 4,081,197,823 |
| Forward Foreign Currency Exchange Contracts | $ — | $ 10,675,883 | $ — | $ 10,675,883 |
| Futures Contracts | 12,480,608 | — | — | 12,480,608 |
| Swap Contracts | — | 32,382,781 | — | 32,382,781 |
| Total | $ 175,446,695 | $ 3,841,068,881 | $ 120,221,519 | $ 4,136,737,095 |
| Liability Description | | | | |
| Securities Sold Short | $ — | $ (28,331,829) | $ — | $ (28,331,829) |
| Written Interest Rate Swaptions | — | (7,813,528) | — | (7,813,528) |
| Forward Foreign Currency Exchange Contracts | — | (3,561,865) | — | (3,561,865) |
| Futures Contracts | (39,640,248) | — | — | (39,640,248) |
| Swap Contracts | — | (24,817,141) | — | (24,817,141) |
| Total | $ (39,640,248) | $ (64,524,363) | $ — | $ (104,164,611) |
| * | Includes foreign equity securities whose values were adjusted to reflect market trading of comparable securities or other correlated instruments that occurred after the close of trading in their applicable foreign markets. |
The following is a reconciliation of Level 3 investments for which significant unobservable inputs were used to determine fair value:
| | Foreign
Corporate Bonds | Loan
Participation Notes | Reinsurance
Side Cars* | Miscellaneous | Total |
| Balance as of October 31, 2023 | $ 0 | $15,902,788 | $ 63,870,436 | $ 0 | $ 79,773,224 |
| Realized gains (losses) | — | — | 6,348,565 | 57,727 | 6,406,292 |
| Change in net unrealized appreciation (depreciation) | (628,325) | 916,938 | (3,000,736) | — | (2,712,123) |
| Cost of purchases | — | — | 75,463,900 | — | 75,463,900 |
| Proceeds from sales, including return of capital | — | — | (39,417,857) | (57,727) | (39,475,584) |
| Accrued discount (premium) | — | 137,485 | — | — | 137,485 |
| Transfers to Level 3(1) | 628,325 | — | — | — | 628,325 |
| Transfers from Level 3 | — | — | — | — | — |
| Balance as of April 30, 2024 | $ 0 | $16,957,211 | $103,264,308 | $ 0 | $120,221,519 |
| Change in net unrealized appreciation (depreciation) on investments still held as of April 30, 2024 | $(628,325) | $ 916,938 | $ 787,070 | $ — | $ 1,075,683 |
| * | The Portfolio’s investments in Reinsurance Side Cars were primarily valued on the basis of broker quotations. |
| (1) | Transferred from Level 2 to Level 3 due to restrictions imposed on the sale of the investment. |
Global Opportunities Portfolio
April 30, 2024
Notes to Consolidated Financial Statements (Unaudited) — continued
The following is a summary of quantitative information about significant unobservable valuation inputs for Level 3 investments held as of April 30, 2024:
| Type of Investment | Fair Value as of
April 30, 2024 | Valuation Technique | Unobservable Input | Range of Unobservable Input | Impact to
Valuation from an
Increase to Input* |
| Foreign Corporate Bonds | $ 0 | Estimated Recovery Value | Estimated Recovery Value Percentage | 0% | Increase |
| Loan Participation Notes | 16,957,211 | Matrix Pricing | Adjusted Credit Spread to the Central Bank of Uzbekistan Quoted Policy Rate | 4.38% - 6.67%** | Decrease |
| Miscellaneous | 0 | Estimated Value | Estimated Recovery Value Percentage | 0% | Increase |
| * | Represents the directional change in the fair value of the Level 3 investments that would result from an increase to the corresponding unobservable input. A decrease to the unobservable input would have the opposite effect. |
| ** | The weighted average of the unobservable input is 4.42% based on relative principal amounts. |
11 Risks and Uncertainties
Risks Associated with Foreign Investments
Foreign investments can be adversely affected by political, economic and market developments abroad, including the imposition of economic and other sanctions by the United States or another country, and by acts of terrorism and war. There may be less publicly available information about foreign issuers because they may not be subject to reporting practices, requirements or regulations comparable to those to which United States companies are subject. Foreign markets may be smaller, less liquid and more volatile than the major markets in the United States. Trading in foreign markets typically involves higher expense than trading in the United States. The Portfolio may have difficulties enforcing its legal or contractual rights in a foreign country. Securities that trade or are denominated in currencies other than the U.S. dollar may be adversely affected by fluctuations in currency exchange rates.
Emerging market securities often involve greater risks than developed market securities. Investment markets within emerging market countries are typically smaller, less liquid, less developed and more volatile than those in more developed markets like the United States, and may be focused in certain economic sectors. The information available about an emerging market issuer may be less reliable than for comparable issuers in more developed capital markets. Governmental actions can have a significant effect on the economic conditions in emerging market countries. It may be more difficult to make a claim or obtain a judgment in the courts of these countries than it is in the United States. The possibility of fraud, negligence, undue influence being exerted by an issuer or refusal to recognize ownership exists in some emerging markets. Disruptions due to work stoppages and trading improprieties in foreign securities markets have caused such markets to close. Emerging market securities are also subject to speculative trading, which contributes to their volatility.
Economic data as reported by sovereign entities may be delayed, inaccurate or fraudulent. In the event of a default by a sovereign entity, there are typically no assets to be seized or cash flows to be attached. Furthermore, the willingness or ability of a sovereign entity to restructure defaulted debt may be limited. Therefore, losses on sovereign defaults may far exceed the losses from the default of a similarly rated U.S. debt issuer.
Global Opportunities Portfolio
April 30, 2024
| Officers |
Kenneth A. Topping
President | Nicholas S. Di Lorenzo
Secretary |
Deidre E. Walsh
Vice President and Chief Legal Officer | Laura T. Donovan
Chief Compliance Officer |
James F. Kirchner
Treasurer | |
George J. Gorman
Chairperson | |
| Alan C. Bowser | |
| Mark R. Fetting | |
| Cynthia E. Frost | |
| Valerie A. Mosley | |
| Anchal Pachnanda* | |
| Keith Quinton | |
| Marcus L. Smith | |
| Susan J. Sutherland | |
| Scott E. Wennerholm | |
| Nancy A. Wiser | |
| U.S. Customer Privacy Notice | March 2024 |
| FACTS | WHAT DOES EATON VANCE DO WITH YOUR PERSONAL INFORMATION? |
| Why? | Financial companies choose how they share your personal information. Federal law gives consumers the right to limit some but not all sharing. Federal law also requires us to tell you how we collect, share, and protect your personal information. Please read this notice carefully to understand what we do. |
| |
| What? | The types of personal information we collect and share depend on the product or service you have with us. This information can include:■ Social Security number and income
■ investment experience and risk tolerance
■ checking account information and wire transfer instructions |
| |
| How? | All financial companies need to share customers’ personal information to run their everyday business. In the section below, we list the reasons financial companies can share their customers’ personal information; the reasons Eaton Vance chooses to share; and whether you can limit this sharing. |
| Reasons we can share your personal information | Does Eaton Vance
share? | Can you limit
this sharing? |
| For our everyday business purposes — such as to process your transactions, maintain your account(s), respond to court orders and legal investigations, or report to credit bureaus | Yes | No |
| For our marketing purposes — to offer our products and services to you | Yes | No |
| For joint marketing with other financial companies | No | We don’t share |
| For our affiliates’ everyday business purposes — information about your transactions and experiences | Yes | No* |
| For our affiliates’ everyday business purposes — information about your creditworthiness | Yes | Yes* |
| For our affiliates to market to you | Yes | Yes* |
| For nonaffiliates to market to you | No | We don’t share |
To limit our
sharing | Call toll-free 1-800-262-1122 or email: EVPrivacy@eatonvance.comPlease note:If you are a new customer, we can begin sharing your information 30 days from the date we sent this notice. When you are no longer our customer, we continue to share your information as described in this notice. However, you can contact us at any time to limit our sharing. |
| Questions? | Call toll-free 1-800-262-1122 or email: EVPrivacy@eatonvance.com |
| U.S. Customer Privacy Notice — continued | March 2024 |
| Who we are |
| Who is providing this notice? | Eaton Vance Management and our investment management affiliates (“Eaton Vance”) (see Affiliates definition below.) |
| What we do |
How does Eaton Vance
protect my personal
information? | To protect your personal information from unauthorized access and use, we use security measures that comply with federal law. These measures include computer safeguards and secured files and buildings. We have policies governing the proper handling of customer information by personnel and requiring third parties that provide support to adhere to appropriate security standards with respect to such information. |
How does Eaton Vance
collect my personal
information? | We collect your personal information, for example, when you■ open an account or make deposits or withdrawals from your account
■ buy securities from us or make a wire transfer
■ give us your contact informationWe also collect your personal information from others, such as credit bureaus, affiliates, or other companies. |
| Why can’t I limit all sharing? | Federal law gives you the right to limit only■ sharing for affiliates’ everyday business purposes — information about your creditworthiness
■ affiliates from using your information to market to you
■ sharing for nonaffiliates to market to youState laws and individual companies may give you additional rights to limit sharing. (See below for more on your rights under state law.) |
What happens when I limit
sharing for an account I hold
jointly with someone else? | Your choices will apply to everyone on your account. |
| Definitions |
| Affiliates | Companies related by common ownership or control. They can be financial and nonfinancial companies.■ Our affiliates include registered investment advisers such as Eaton Vance Management, Eaton Vance Advisers International Ltd., Boston Management and Research, Calvert Research and Management, Parametric Portfolio Associates LLC, Atlanta Capital Management Company LLC, Morgan Stanley Investment Management Inc., Morgan Stanley Investment Management Co.; registered broker-dealers such as Morgan Stanley Distributors Inc. and Eaton Vance Distributors, Inc. (together, the “Investment Management Affiliates”); and companies with a Morgan Stanley name and financial companies such as Morgan Stanley Smith Barney LLC and Morgan Stanley & Co. (the “Morgan Stanley Affiliates”). |
| Nonaffiliates | Companies not related by common ownership or control. They can be financial and nonfinancial companies.■ Eaton Vance does not share with nonaffiliates so they can market to you. |
| Joint marketing | A formal agreement between nonaffiliated financial companies that together market financial products or services to you.■ Eaton Vance does not jointly market. |
| U.S. Customer Privacy Notice — continued | March 2024 |
| Other important information |
| *PLEASE NOTE: Eaton Vance does not share your creditworthiness information or your transactions and experiences information with the Morgan Stanley Affiliates, nor does Eaton Vance enable the Morgan Stanley Affiliates to market to you. Your opt outs will prevent Eaton Vance from sharing your creditworthiness information with the Investment Management Affiliates and will prevent the Investment Management Affiliates from marketing their products to you.Vermont: Except as permitted by law, we will not share personal information we collect about Vermont residents with Nonaffiliates unless you provide us with your written consent to share such information.California: Except as permitted by law, we will not share personal information we collect about California residents with Nonaffiliates and we will limit sharing such personal information with our Affiliates to comply with California privacy laws that apply to us. |
Delivery of Shareholder Documents. The Securities and Exchange Commission (SEC) permits funds to deliver only one copy of shareholder documents, including prospectuses, proxy statements and shareholder reports, to fund investors with multiple accounts at the same residential or post office box address. This practice is often called “householding” and it helps eliminate duplicate mailings to shareholders. Eaton Vance, or your financial intermediary, may household the mailing of your documents indefinitely unless you instruct Eaton Vance, or your financial intermediary, otherwise. If you would prefer that your Eaton Vance documents not be householded, please contact Eaton Vance at 1-800-262-1122, or contact your financial intermediary. Your instructions that householding not apply to delivery of your Eaton Vance documents will typically be effective within 30 days of receipt by Eaton Vance or your financial intermediary.
Portfolio Holdings. Each Eaton Vance Fund and its underlying Portfolio(s) (if applicable) files a schedule of portfolio holdings on Part F to Form N-PORT with the SEC. Certain information filed on Form N-PORT may be viewed on the Eaton Vance website at www.eatonvance.com, by calling Eaton Vance at 1-800-262-1122 or in the EDGAR database on the SEC’s website at www.sec.gov.
Proxy Voting. From time to time, funds are required to vote proxies related to the securities held by the funds. The Eaton Vance Funds or their underlying Portfolios (if applicable) vote proxies according to a set of policies and procedures approved by the Funds’ and Portfolios’ Boards. You may obtain a description of these policies and procedures and information on how the Funds or Portfolios voted proxies relating to portfolio securities during the most recent 12-month period ended June 30, without charge, upon request, by calling 1-800-262-1122 and by accessing the SEC’s website at www.sec.gov.
Tailored Shareholder Reports. Effective January 24, 2023, the SEC adopted rule and form amendments to require open-end mutual funds and ETFs to transmit concise and visually engaging streamlined annual and semi-annual reports to shareholders that highlight key information. Other information, including financial statements, will no longer appear in a streamlined shareholder report but must be available online, delivered free of charge upon request, and filed on a semi-annual basis on Form N-CSR. The rule and form amendments have a compliance date of July 24, 2024. At this time, management is evaluating the impact of these amendments on the shareholder reports for the Eaton Vance Funds.
This Page Intentionally Left Blank
This Page Intentionally Left Blank
Investment Adviser of Emerging Markets Local Income Portfolio,
Global Macro Absolute Return Advantage Portfolio,
Global Opportunities Portfolio,
High Income Opportunities Portfolio and
Senior Debt Portfolio
Boston Management and Research
One Post Office Square
Boston, MA 02109
Investment Adviser and Administrator of Eaton Vance
Strategic Income Fund
Eaton Vance Management
One Post Office Square
Boston, MA 02109
Principal Underwriter*
Eaton Vance Distributors, Inc.
One Post Office Square
Boston, MA 02109
(617) 482-8260
Custodian
State Street Bank and Trust Company
One Congress Street, Suite 1
Boston, MA 02114-2016
Transfer Agent
BNY Mellon Investment Servicing (US) Inc.
Attn: Eaton Vance Funds
P.O. Box 534439
Pittsburgh, PA 15253-4439
(800) 262-1122
Fund Offices
One Post Office Square
Boston, MA 02109
* FINRA BrokerCheck. Investors may check the background of their Investment Professional by contacting the Financial Industry Regulatory Authority (FINRA). FINRA BrokerCheck is a free tool to help investors check the professional background of current and former FINRA-registered securities firms and brokers. FINRA BrokerCheck is available by calling 1-800-289-9999 and at www.FINRA.org. The FINRA BrokerCheck brochure describing this program is available to investors at www.FINRA.org.
Eaton Vance
Tax-Managed Equity Asset Allocation Fund
Semi-Annual Report
April 30, 2024
Commodity Futures Trading Commission Registration. The Commodity Futures Trading Commission (“CFTC”) has adopted regulations that subject registered investment companies and advisers to regulation by the CFTC if a fund invests more than a prescribed level of its assets in certain CFTC-regulated instruments (including futures, certain options and swap agreements) or markets itself as providing investment exposure to such instruments. The investment adviser has claimed an exclusion from the definition of “commodity pool operator” under the Commodity Exchange Act with respect to its management of the Fund. Accordingly, neither the Fund nor the adviser with respect to the operation of the Fund is subject to CFTC regulation. Because of its management of other strategies, the Fund's adviser is registered with the CFTC as a commodity pool operator. The adviser is also registered as a commodity trading advisor.
Fund shares are not insured by the FDIC and are not deposits or other obligations of, or guaranteed by, any depository institution. Shares are subject to investment risks, including possible loss of principal invested.
This report must be preceded or accompanied by a current summary prospectus or prospectus. Before investing, investors should consider carefully the investment objective, risks, and charges and expenses of a mutual fund. This and other important information is contained in the summary prospectus and prospectus, which can be obtained from a financial intermediary. Prospective investors should read the prospectus carefully before investing. For further information, please call 1-800-262-1122.
Semi-Annual Report April 30, 2024
Eaton Vance
Tax-Managed Equity Asset Allocation Fund
Eaton Vance
Tax-Managed Equity Asset Allocation Fund
April 30, 2024
Performance
Portfolio Manager(s) Douglas R. Rogers, CFA, CMT
| % Average Annual Total Returns1,2 | Class
Inception Date | Performance
Inception Date | Six Months | One Year | Five Years | Ten Years |
| Class A at NAV | 03/04/2002 | 03/04/2002 | 19.85% | 17.54% | 9.44% | 9.01% |
| Class A with 5.25% Maximum Sales Charge | — | — | 13.54 | 11.35 | 8.26 | 8.43 |
| Class C at NAV | 03/04/2002 | 03/04/2002 | 19.40 | 16.67 | 8.61 | 8.36 |
| Class C with 1% Maximum Deferred Sales Charge | — | — | 18.40 | 15.67 | 8.61 | 8.36 |
| Class I at NAV | 09/11/2015 | 03/04/2002 | 19.99 | 17.85 | 9.71 | 9.24 |
|
| Russell 3000® Index | — | — | 21.09% | 22.30% | 12.41% | 11.80% |
| MSCI EAFE Index | — | — | 18.63 | 9.28 | 6.17 | 4.37 |
| ICE BofA Fixed Rate Preferred Securities Index | — | — | 12.17 | 6.76 | 2.32 | 4.20 |
| Blended Index | — | — | 19.94 | 19.37 | 10.84 | 10.35 |
| % After-Tax Returns with Maximum Sales Charge2 | Class
Inception Date | Performance
Inception Date | One Year | Five Years | Ten Years |
| Class A After Taxes on Distributions | 03/04/2002 | 03/04/2002 | 17.40% | 9.16% | 8.42% |
| Class A After Taxes on Distributions and Sale of Fund Shares | — | — | 10.48 | 7.48 | 7.22 |
| Class C After Taxes on Distributions | 03/04/2002 | 03/04/2002 | 16.67 | 8.45 | 7.87 |
| Class C After Taxes on Distributions and Sale of Fund Shares | — | — | 9.87 | 6.81 | 6.69 |
| Class I After Taxes on Distributions | 09/11/2015 | 03/04/2002 | 17.64 | 9.37 | 8.60 |
| Class I After Taxes on Distributions and Sale of Fund Shares | — | — | 10.70 | 7.70 | 7.40 |
| % Total Annual Operating Expense Ratios3 | Class A | Class C | Class I |
| | 1.22% | 1.97% | 0.97% |
See Endnotes and Additional Disclosures in this report.
Past performance is no guarantee of future results. Returns are historical and are calculated by determining the percentage change in net asset value (NAV) or offering price (as applicable) with all distributions reinvested. Furthermore, returns do not reflect the deduction of taxes that shareholders may have to pay on Fund distributions or upon the redemption of Fund shares. Investment return and principal value will fluctuate so that shares, when redeemed, may be worth more or less than their original cost. Performance for periods less than or equal to one year is cumulative. Performance is for the stated time period only; due to market volatility, current Fund performance may be lower or higher than the quoted return. For performance as of the most recent month-end, please refer to eatonvance.com.
Eaton Vance
Tax-Managed Equity Asset Allocation Fund
April 30, 2024
| Portfolio Allocation (% of total investments)1 |
Footnotes:
| 1 | Fund primarily invests in one or more affiliated investment companies (Portfolios) and may also invest directly. Unless otherwise noted, references to investments are to the aggregate holdings of the Fund, including its pro rata share of each Portfolio in which it invests. Debt obligations are hybrid instruments, as determined by the investment adviser. These instruments have characteristics of both equity and debt. |
Eaton Vance
Tax-Managed Equity Asset Allocation Fund
April 30, 2024
Endnotes and Additional Disclosures
| 1 | Russell 3000® Index is an unmanaged index of the 3,000 largest U.S. stocks. MSCI EAFE Index is an unmanaged index of equities in the developed markets, excluding the U.S. and Canada. MSCI indexes are net of foreign withholding taxes. Source: MSCI. MSCI data may not be reproduced or used for any other purpose. MSCI provides no warranties, has not prepared or approved this report, and has no liability hereunder. ICE BofA Fixed Rate Preferred Securities Index is an unmanaged index of fixed-rate, preferred securities issued in the U.S. ICE® BofA® indices are not for redistribution or other uses; provided “as is”, without warranties, and with no liability. Eaton Vance has prepared this report and ICE Data Indices, LLC does not endorse it, or guarantee, review, or endorse Eaton Vance’s products. BofA® is a licensed registered trademark of Bank of America Corporation in the United States and other countries. The Blended Index consists of 80% Russell 3000® Index, 10% MSCI EAFE Index and 10% ICE BofA Fixed Rate Preferred Securities Index, rebalanced monthly. Unless otherwise stated, index returns do not reflect the effect of any applicable sales charges, commissions, expenses, taxes or leverage, as applicable. It is not possible to invest directly in an index. |
| 2 | Total Returns at NAV do not include applicable sales charges. If sales charges were deducted, the returns would be lower. Total Returns shown with maximum sales charge reflect the stated maximum sales charge. Unless otherwise stated, performance does not reflect the deduction of taxes on Fund distributions or redemptions of Fund shares. After-tax returns are calculated using certain assumptions, including using the highest historical individual federal income tax rates, and do not reflect the impact of state/local taxes. Actual after-tax returns depend on a shareholder’s tax situation and the actual characterization of distributions and may differ from those shown. After-tax returns are not relevant to shareholders who hold shares in tax-deferred accounts or shares held by nontaxable entities. Return After Taxes on Distributions may be the same as Return Before Taxes for the same period because no taxable distributions were made during that period. Return After Taxes on Distributions and Sale of Fund Shares may be greater than or equal to Return After Taxes on Distributions for the same period because of losses realized on the sale of Fund shares. The Fund’s after-tax returns also may reflect foreign tax credits passed by the Fund to its shareholders.Performance prior to the inception date of a class may be linked to the performance of an older class of the Fund. This linked performance is adjusted for any applicable sales charge, but is not adjusted for class expense differences. If adjusted for such differences, the performance would be different. The performance of Class I is linked to Class A. Performance presented in the Financial Highlights included in the financial statements is not linked.Effective November 5, 2020, Class C shares automatically convert to Class A shares eight years after purchase. The average annual total returns listed for Class C reflect conversion to Class A shares after eight years. Prior to November 5, 2020, Class C shares automatically
converted to Class A shares ten years after purchase. |
| 3 | Source: Fund prospectus. The expense ratios for the current reporting period can be found in the Financial Highlights section of this report. Performance reflects expenses waived and/or reimbursed, if applicable. Without such waivers and/or reimbursements, performance would have been lower. |
| | Fund profile subject to change due to active management. |
Eaton Vance
Tax-Managed Equity Asset Allocation Fund
April 30, 2024
Example
As a Fund shareholder, you incur two types of costs: (1) transaction costs, including sales charges (loads) on purchases; and (2) ongoing costs, including management fees; distribution and/or service fees; and other Fund expenses. This Example is intended to help you understand your ongoing costs (in dollars) of Fund investing and to compare these costs with the ongoing costs of investing in other mutual funds. The Example is based on an investment of $1,000 invested at the beginning of the period and held for the entire period (November 1, 2023 to April 30, 2024).
Actual Expenses
The first section of the table below provides information about actual account values and actual expenses. You may use the information in this section, together with the amount you invested, to estimate the expenses that you paid over the period. Simply divide your account value by $1,000 (for example, an $8,600 account value divided by $1,000 = 8.6), then multiply the result by the number in the first section under the heading entitled “Expenses Paid During Period” to estimate the expenses you paid on your account during this period.
Hypothetical Example for Comparison Purposes
The second section of the table below provides information about hypothetical account values and hypothetical expenses based on the actual Fund expense ratio and an assumed rate of return of 5% per year (before expenses), which is not the actual Fund return. The hypothetical account values and expenses may not be used to estimate the actual ending account balance or expenses you paid for the period. You may use this information to compare the ongoing costs of investing in your Fund and other funds. To do so, compare this 5% hypothetical example with the 5% hypothetical examples that appear in the shareholder reports of the other funds.
Please note that the expenses shown in the table are meant to highlight your ongoing costs only and do not reflect any transactional costs, such as sales charges (loads). Therefore, the second section of the table is useful in comparing ongoing costs only, and will not help you determine the relative total costs of owning different funds. In addition, if these transactional costs were included, your costs would be higher.
| | Beginning
Account Value
(11/1/23) | Ending
Account Value
(4/30/24) | Expenses Paid
During Period*
(11/1/23 – 4/30/24) | Annualized
Expense
Ratio |
| Actual | | | | |
| Class A | $1,000.00 | $1,198.50 | $ 6.56 | 1.20% |
| Class C | $1,000.00 | $1,194.00 | $10.64 | 1.95% |
| Class I | $1,000.00 | $1,199.90 | $ 5.20 | 0.95% |
| |
| Hypothetical | | | | |
| (5% return per year before expenses) | | | | |
| Class A | $1,000.00 | $1,018.90 | $ 6.02 | 1.20% |
| Class C | $1,000.00 | $1,015.17 | $ 9.77 | 1.95% |
| Class I | $1,000.00 | $1,020.14 | $ 4.77 | 0.95% |
| * | Expenses are equal to the Fund's annualized expense ratio for the indicated Class, multiplied by the average account value over the period, multiplied by 182/366 (to reflect the one-half year period). The Example assumes that the $1,000 was invested at the net asset value per share determined at the close of business on October 31, 2023. The Example reflects the expenses of both the Fund and the Portfolios. |
Eaton Vance
Tax-Managed Equity Asset Allocation Fund
April 30, 2024
Portfolio of Investments (Unaudited)
| Investments in Affiliated Portfolios — 96.8% |
| Description | | | Value |
Tax-Managed Growth Portfolio
(identified cost, $84,288,832) | | | $ 271,413,993 |
Tax-Managed International Equity Portfolio
(identified cost, $26,827,450) | | | 32,554,196 |
Tax-Managed Multi-Cap Growth Portfolio
(identified cost, $36,292,137) | | | 109,398,631 |
Tax-Managed Small-Cap Portfolio
(identified cost, $57,031,968) | | | 66,767,810 |
Tax-Managed Value Portfolio
(identified cost, $112,583,160) | | | 189,966,254 |
Total Investments in Affiliated Portfolios
(identified cost $317,023,547) | | | $670,100,884 |
| Debt Obligations — 3.0%(1) |
| Security | Principal
Amount
(000's omitted) | Value |
| Banks — 1.9% |
| Banco Davivienda SA, 6.65% to 4/22/31(2)(3)(4) | $ | 200 | $ 140,262 |
| Banco Mercantil del Norte SA/Grand Cayman, 8.375% to 10/14/30(2)(3)(4) | | 600 | 597,753 |
| Banco Santander SA, 9.625% to 5/21/33(3)(4) | | 400 | 428,036 |
| Bank of America Corp., Series TT, 6.125% to 4/27/27(3)(4) | | 425 | 421,036 |
| Bank of Montreal, 7.70% to 5/26/29, 5/26/84(4) | | 340 | 340,252 |
| Bank of Nova Scotia, 4.90% to 6/4/25(3)(4) | | 775 | 759,107 |
| Barclays PLC: | | | |
| 6.125% to 12/15/25(3)(4) | | 471 | 453,336 |
| 8.00% to 3/15/29(3)(4) | | 526 | 518,559 |
| BNP Paribas SA: | | | |
| 4.625% to 2/25/31(2)(3)(4) | | 203 | 163,391 |
| 7.75% to 8/16/29(2)(3)(4) | | 675 | 682,366 |
| Citigroup, Inc., Series W, 4.00% to 12/10/25(3)(4) | | 1,038 | 993,658 |
| Farm Credit Bank of Texas, Series 3, 6.20% to 6/15/28(2)(3)(4) | | 473 | 434,919 |
| Huntington Bancshares, Inc., Series F, 5.625% to 7/15/30(3)(4) | | 395 | 354,756 |
| ING Groep NV, 6.50% to 4/16/25(3)(4) | | 243 | 239,908 |
| JPMorgan Chase & Co., Series KK, 3.65% to 6/1/26(3)(4) | | 364 | 341,465 |
| KeyCorp, Series D, 5.00% to 9/15/26(3)(4) | | 975 | 824,770 |
| Lloyds Banking Group PLC, 7.50% to 6/27/24(3)(4) | | 600 | 601,103 |
| NatWest Group PLC: | | | |
| 4.60% to 6/28/31(3)(4) | | 200 | 152,516 |
| 6.00% to 12/29/25(3)(4) | | 229 | 223,140 |
| PNC Financial Services Group, Inc., Series U, 6.00% to 5/15/27(3)(4) | | 800 | 771,517 |
| Security | Principal
Amount
(000's omitted) | Value |
| Banks (continued) |
| Societe Generale SA: | | | |
| 5.375% to 11/18/30(2)(3)(4) | $ | 506 | $ 410,543 |
| 9.375% to 11/22/27(2)(3)(4) | | 200 | 204,063 |
| Swedbank AB, Series NC5, 5.625% to 9/17/24(3)(4)(5) | | 400 | 397,224 |
| Toronto-Dominion Bank, 8.125% to 10/31/27, 10/31/82(4) | | 775 | 798,872 |
| Truist Financial Corp.: | | | |
| Series P, 4.95% to 9/1/25(3)(4) | | 125 | 121,780 |
| Series Q, 5.10% to 3/1/30(3)(4) | | 134 | 121,721 |
| UBS Group AG: | | | |
| 4.375% to 2/10/31(2)(3)(4) | | 419 | 335,682 |
| 6.875% to 8/7/25(3)(4)(5) | | 348 | 342,847 |
| Wells Fargo & Co., Series BB, 3.90% to 3/15/26(3)(4) | | 984 | 933,927 |
| | | | $ 13,108,509 |
| Capital Markets — 0.1% |
| Charles Schwab Corp.: | | | |
| Series G, 5.375% to 6/1/25(3)(4) | $ | 651 | $ 645,386 |
| Series I, 4.00% to 6/1/26(3)(4) | | 467 | 430,863 |
| | | | $ 1,076,249 |
| Diversified Financial Services — 0.2% |
| Air Lease Corp., Series B, 4.65% to 6/15/26(3)(4) | $ | 410 | $ 387,463 |
| American AgCredit Corp., Series A, 5.25% to 6/15/26(2)(3)(4) | | 914 | 859,160 |
| Goldman Sachs Group, Inc., Series V, 4.125% to 11/10/26(3)(4) | | 143 | 132,377 |
| | | | $ 1,379,000 |
| Electric Utilities — 0.3% |
| Dominion Energy, Inc., Series C, 4.35% to 1/15/27(3)(4) | $ | 583 | $ 536,733 |
| Edison International, Series B, 5.00% to 12/15/26(3)(4) | | 199 | 187,499 |
| Emera, Inc., Series 16-A, 6.75% to 6/15/26, 6/15/76(4) | | 450 | 446,557 |
| Sempra, 4.125% to 1/1/27, 4/1/52(4) | | 581 | 528,285 |
| Southern California Edison Co., Series E, 9.787%, (3 mo. SOFR + 4.461%)(3)(6) | | 249 | 250,163 |
| | | | $ 1,949,237 |
| Food Products — 0.1% |
| Land O' Lakes, Inc., 8.00%(2)(3) | $ | 824 | $ 721,000 |
| | | | $ 721,000 |
| Independent Power and Renewable Electricity Producers — 0.0%(7) |
| Algonquin Power & Utilities Corp., 4.75% to 1/18/27, 1/18/82(4) | $ | 408 | $ 354,262 |
| | | | $ 354,262 |
Eaton Vance
Tax-Managed Equity Asset Allocation Fund
April 30, 2024
Portfolio of Investments (Unaudited) — continued
| Security | Principal
Amount
(000's omitted) | Value |
| Insurance — 0.2% |
| Liberty Mutual Group, Inc., 4.125% to 9/15/26, 12/15/51(2)(4) | $ | 258 | $ 235,452 |
| QBE Insurance Group Ltd., 5.875% to 5/12/25(2)(3)(4) | | 1,004 | 994,563 |
| | | | $ 1,230,015 |
| Pipelines — 0.1% |
| Enbridge, Inc., Series NC5, 8.25% to 10/15/28, 1/15/84(4) | $ | 606 | $ 621,757 |
| Energy Transfer LP, Series B, 6.625% to 2/15/28(3)(4) | | 359 | 331,114 |
| | | | $ 952,871 |
| Telecommunications — 0.1% |
| Rogers Communications, Inc., 5.25% to 3/15/27, 3/15/82(2)(4) | $ | 450 | $ 428,353 |
| | | | $ 428,353 |
Total Debt Obligations
(identified cost $21,855,151) | | | $ 21,199,496 |
| Security | Shares | Value |
| Electric Utilities — 0.1% |
| Brookfield BRP Holdings Canada, Inc.: | | | |
| 4.625% | | 17,551 | $ 272,918 |
| 7.25% | | 4,870 | 120,922 |
| SCE Trust III, Series H, 8.581% to 5/30/24(4) | | 6,321 | 159,732 |
| SCE Trust IV, Series J, 5.375% to 9/15/25(4) | | 2,004 | 47,274 |
| | | | $ 600,846 |
| Insurance — 0.1% |
| American Equity Investment Life Holding Co., Series B, 6.625% to 9/1/25(4) | | 12,251 | $ 301,007 |
| Athene Holding Ltd., Series C, 6.375% to 6/30/25(4) | | 9,631 | 241,064 |
| | | | $ 542,071 |
| Security | Shares | Value |
| Oil, Gas & Consumable Fuels — 0.0%(7) |
| Energy Transfer LP, Series E, 7.60% to 5/15/24(4) | | 14,960 | $ 373,103 |
| | | | $ 373,103 |
Total Preferred Stocks
(identified cost $1,642,166) | | | $ 1,516,020 |
Total Investments — 100.0%
(identified cost $340,520,864) | | | $692,816,400 |
| Other Assets, Less Liabilities — (0.0)%(7) | | | $ (294,601) |
| Net Assets — 100.0% | | | $692,521,799 |
| The percentage shown for each investment category in the Portfolio of Investments is based on net assets. |
| (1) | Debt obligations are hybrid instruments, as determined by the investment adviser. These instruments have characteristics of both equity and debt. |
| (2) | Security exempt from registration under Rule 144A of the Securities Act of 1933, as amended. These securities may be sold in certain transactions in reliance on an exemption from registration (normally to qualified institutional buyers). At April 30, 2024, the aggregate value of these securities is $6,207,507 or 0.9% of the Fund's net assets. |
| (3) | Perpetual security with no stated maturity date but may be subject to calls by the issuer. |
| (4) | Security converts to variable rate after the indicated fixed-rate coupon period. |
| (5) | Security exempt from registration under Regulation S of the Securities Act of 1933, as amended, which exempts from registration securities offered and sold outside the United States. Security may not be offered or sold in the United States except pursuant to an exemption from, or in a transaction not subject to, the registration requirements of the Securities Act of 1933, as amended. At April 30, 2024, the aggregate value of these securities is $740,071 or 0.1% of the Fund's net assets. |
| (6) | Variable rate security. The stated interest rate represents the rate in effect at April 30, 2024. |
| (7) | Amount is less than 0.05% or (0.05)%, as applicable. |
| Abbreviations: |
| SOFR | – Secured Overnight Financing Rate |
Eaton Vance
Tax-Managed Equity Asset Allocation Fund
April 30, 2024
Statement of Assets and Liabilities (Unaudited)
| | April 30, 2024 |
| Assets | |
| Unaffiliated investments, at value (identified cost $23,497,317) | $ 22,715,516 |
| Affiliated investments, at value (identified cost $317,023,547) | 670,100,884 |
| Cash | 890 |
| Interest and dividends receivable | 249,729 |
| Receivable for Fund shares sold | 270,674 |
| Total assets | $693,337,693 |
| Liabilities | |
| Payable for Fund shares redeemed | $ 378,121 |
| Payable to affiliates: | |
| Investment adviser fee | 87,048 |
| Administration fee | 86,411 |
| Distribution and service fees | 131,333 |
| Payable for Trustees’ fees and expenses | 69,354 |
| Payable for legal and accounting services | 43,673 |
| Accrued expenses | 19,954 |
| Total liabilities | $ 815,894 |
| Net Assets | $692,521,799 |
| Sources of Net Assets | |
| Paid-in capital | $ 198,375,659 |
| Distributable earnings | 494,146,140 |
| Net Assets | $692,521,799 |
| Class A Shares | |
| Net Assets | $ 478,787,394 |
| Shares Outstanding | 14,875,596 |
Net Asset Value and Redemption Price Per Share
(net assets ÷ shares of beneficial interest outstanding) | $ 32.19 |
Maximum Offering Price Per Share
(100 ÷ 94.75 of net asset value per share) | $ 33.97 |
| Class C Shares | |
| Net Assets | $ 37,969,204 |
| Shares Outstanding | 1,285,342 |
Net Asset Value and Offering Price Per Share*
(net assets ÷ shares of beneficial interest outstanding) | $ 29.54 |
| Class I Shares | |
| Net Assets | $ 175,765,201 |
| Shares Outstanding | 5,468,223 |
Net Asset Value, Offering Price and Redemption Price Per Share
(net assets ÷ shares of beneficial interest outstanding) | $ 32.14 |
| On sales of $50,000 or more, the offering price of Class A shares is reduced. |
| * | Redemption price per share is equal to the net asset value less any applicable contingent deferred sales charge. |
8
See Notes to Financial Statements.
Eaton Vance
Tax-Managed Equity Asset Allocation Fund
April 30, 2024
Statement of Operations (Unaudited)
| | Six Months Ended |
| | April 30, 2024 |
| Investment Income | |
| Dividend income (net of foreign taxes withheld of $716) | $ 110,864 |
| Dividend income allocated from affiliated Portfolios (net of foreign taxes withheld of $91,300) | 4,573,702 |
| Interest income | 676,692 |
| Securities lending income allocated from affiliated Portfolios, net | 17,702 |
| Expenses allocated from affiliated Portfolios | (1,880,591) |
| Total investment income | $ 3,498,369 |
| Expenses | |
| Investment adviser fee | $ 517,893 |
| Administration fee | 499,720 |
| Distribution and service fees: | |
| Class A | 578,551 |
| Class C | 187,200 |
| Trustees’ fees and expenses | 200 |
| Custodian fee | 23,902 |
| Transfer and dividend disbursing agent fees | 155,964 |
| Legal and accounting services | 50,351 |
| Printing and postage | 17,348 |
| Registration fees | 25,655 |
| Miscellaneous | 9,154 |
| Total expenses | $ 2,065,938 |
| Net investment income | $ 1,432,431 |
| Realized and Unrealized Gain (Loss) | |
| Net realized gain (loss): | |
| Investment transactions | $ (983,347) |
| Payment by affiliate for realized loss on disposal of investment not meeting investment guidelines | 79,092 |
| Net realized gain (loss) allocated from affiliated Portfolios: | |
| Investment transactions | 20,015,922 (1) |
| Foreign currency transactions | 2,247 |
| Net realized gain | $ 19,113,914 |
| Change in unrealized appreciation (depreciation): | |
| Investments | $ 2,989,548 |
| Change in unrealized appreciation (depreciation) allocated from affiliated Portfolios: | |
| Investments | 91,486,882 |
| Foreign currency | (3,819) |
| Net change in unrealized appreciation (depreciation) | $ 94,472,611 |
| Net realized and unrealized gain | $113,586,525 |
| Net increase in net assets from operations | $115,018,956 |
| (1) | Includes $8,969,813 of net realized gains from redemptions in-kind. |
9
See Notes to Financial Statements.
Eaton Vance
Tax-Managed Equity Asset Allocation Fund
April 30, 2024
Statements of Changes in Net Assets
| | Six Months Ended
April 30, 2024
(Unaudited) | Year Ended
October 31, 2023 |
| Increase (Decrease) in Net Assets | | |
| From operations: | | |
| Net investment income | $ 1,432,431 | $ 3,994,756 |
| Net realized gain | 19,113,914 (1) | 12,312,375 (2) |
| Net change in unrealized appreciation (depreciation) | 94,472,611 | 17,522,080 |
| Net increase in net assets from operations | $115,018,956 | $ 33,829,211 |
| Distributions to shareholders: | | |
| Class A | $ (2,419,217) | $ (3,164,977) |
| Class C | — | (86,016) |
| Class I | (1,234,357) | (1,305,229) |
| Total distributions to shareholders | $ (3,653,574) | $ (4,556,222) |
| Transactions in shares of beneficial interest: | | |
| Class A | $ (5,501,999) | $ (20,159,478) |
| Class C | (1,101,761) | (3,587,785) |
| Class I | 6,593,857 | 10,104,782 |
| Net decrease in net assets from Fund share transactions | $ (9,903) | $ (13,642,481) |
| Net increase in net assets | $111,355,479 | $ 15,630,508 |
| Net Assets | | |
| At beginning of period | $ 581,166,320 | $ 565,535,812 |
| At end of period | $692,521,799 | $581,166,320 |
| (1) | Includes $8,969,813 of net realized gains from redemptions in-kind. |
| (2) | Includes $13,930,792 of net realized gains from redemptions in-kind. |
10
See Notes to Financial Statements.
Eaton Vance
Tax-Managed Equity Asset Allocation Fund
April 30, 2024
| | Class A |
| | Six Months Ended
April 30, 2024
(Unaudited) | Year Ended October 31, |
| | 2023 | 2022 | 2021 | 2020 | 2019 |
| Net asset value — Beginning of period | $ 27.000 | $ 25.670 | $ 31.710 | $ 23.070 | $ 22.370 | $ 20.450 |
| Income (Loss) From Operations | | | | | | |
| Net investment income(1) | $ 0.064 | $ 0.180 | $ 0.157 | $ 0.102 | $ 0.165 | $ 0.193 |
| Net realized and unrealized gain (loss) | 5.288 | 1.351 | (5.384) | 8.690 | 0.969 | 2.122 |
| Total income (loss) from operations | $ 5.352 | $ 1.531 | $ (5.227) | $ 8.792 | $ 1.134 | $ 2.315 |
| Less Distributions | | | | | | |
| From net investment income | $ (0.162) | $ (0.143) | $ (0.104) | $ (0.152) | $ (0.154) | $ (0.163) |
| From net realized gain | — | (0.058) | (0.709) | — | (0.280) | (0.232) |
| Total distributions | $ (0.162) | $ (0.201) | $ (0.813) | $ (0.152) | $ (0.434) | $ (0.395) |
| Net asset value — End of period | $ 32.190 | $ 27.000 | $ 25.670 | $ 31.710 | $ 23.070 | $ 22.370 |
| Total Return(2) | 19.85% (3) | 6.01% | (16.91)% | 38.24% | 5.07% | 11.75% |
| Ratios/Supplemental Data | | | | | | |
| Net assets, end of period (000’s omitted) | $478,787 | $406,567 | $405,236 | $513,507 | $373,289 | $379,547 |
| Ratios (as a percentage of average daily net assets):(4) | | | | | | |
| Expenses | 1.20% (5)(6) | 1.22% (6) | 1.25% (6) | 1.26% | 1.28% | 1.33% |
| Net investment income | 0.41% (5) | 0.66% | 0.56% | 0.35% | 0.74% | 0.91% |
| Portfolio Turnover of the Fund(7) | 2% (3) | 4% | 5% | 6% | 7% | 7% |
| (1) | Computed using average shares outstanding. |
| (2) | Returns are historical and are calculated by determining the percentage change in net asset value with all distributions reinvested and do not reflect the effect of sales charges. |
| (3) | Not annualized. |
| (4) | Includes the Fund’s share of the Portfolios’ allocated expenses. |
| (5) | Annualized. |
| (6) | Includes a reduction by the investment adviser of a portion of the Portfolios' adviser fees due to the Portfolios' investments in the Liquidity Fund (equal to less than 0.005% of average daily net assets for the six months ended April 30, 2024 and the years ended October 31, 2023 and 2022). |
| (7) | Percentage includes both the Fund’s contributions to and withdrawals from the Portfolios and purchases and sales of securities held directly by the Fund, if any. |
11
See Notes to Financial Statements.
Eaton Vance
Tax-Managed Equity Asset Allocation Fund
April 30, 2024
Financial Highlights — continued
| | Class C |
| | Six Months Ended
April 30, 2024
(Unaudited) | Year Ended October 31, |
| | 2023 | 2022 | 2021 | 2020 | 2019 |
| Net asset value — Beginning of period | $ 24.740 | $ 23.570 | $ 29.230 | $ 21.310 | $ 20.700 | $ 18.930 |
| Income (Loss) From Operations | | | | | | |
| Net investment income (loss)(1) | $ (0.048) | $ (0.022) | $ (0.049) | $ (0.102) | $ 0.001 | $ 0.043 |
| Net realized and unrealized gain (loss) | 4.848 | 1.250 | (4.963) | 8.022 | 0.889 | 1.965 |
| Total income (loss) from operations | $ 4.800 | $ 1.228 | $ (5.012) | $ 7.920 | $ 0.890 | $ 2.008 |
| Less Distributions | | | | | | |
| From net investment income | $ — | $ — | $ — | $ — | $ — | $ (0.006) |
| From net realized gain | — | (0.058) | (0.648) | — | (0.280) | (0.232) |
| Total distributions | $ — | $ (0.058) | $ (0.648) | $ — | $ (0.280) | $ (0.238) |
| Net asset value — End of period | $29.540 | $24.740 | $23.570 | $29.230 | $21.310 | $20.700 |
| Total Return(2) | 19.40% (3) | 5.22% | (17.53)% | 37.17% | 4.29% | 10.88% |
| Ratios/Supplemental Data | | | | | | |
| Net assets, end of period (000’s omitted) | $ 37,969 | $ 32,698 | $ 34,490 | $ 43,788 | $ 44,822 | $ 56,979 |
| Ratios (as a percentage of average daily net assets):(4) | | | | | | |
| Expenses | 1.95% (5)(6) | 1.97% (6) | 2.00% (6) | 2.01% | 2.03% | 2.08% |
| Net investment income (loss) | (0.34)% (5) | (0.09)% | (0.19)% | (0.38)% | 0.00% (7) | 0.23% |
| Portfolio Turnover of the Fund(8) | 2% (3) | 4% | 5% | 6% | 7% | 7% |
| (1) | Computed using average shares outstanding. |
| (2) | Returns are historical and are calculated by determining the percentage change in net asset value with all distributions reinvested and do not reflect the effect of sales charges. |
| (3) | Not annualized. |
| (4) | Includes the Fund’s share of the Portfolios’ allocated expenses. |
| (5) | Annualized. |
| (6) | Includes a reduction by the investment adviser of a portion of the Portfolios' adviser fees due to the Portfolios' investments in the Liquidity Fund (equal to less than 0.005% of average daily net assets for the six months ended April 30, 2024 and the years ended October 31, 2023 and 2022). |
| (7) | Amount is less than 0.005%. |
| (8) | Percentage includes both the Fund’s contributions to and withdrawals from the Portfolios and purchases and sales of securities held directly by the Fund, if any. |
12
See Notes to Financial Statements.
Eaton Vance
Tax-Managed Equity Asset Allocation Fund
April 30, 2024
Financial Highlights — continued
| | Class I |
| | Six Months Ended
April 30, 2024
(Unaudited) | Year Ended October 31, |
| | 2023 | 2022 | 2021 | 2020 | 2019 |
| Net asset value — Beginning of period | $ 26.990 | $ 25.670 | $ 31.700 | $ 23.060 | $ 22.360 | $ 20.450 |
| Income (Loss) From Operations | | | | | | |
| Net investment income(1) | $ 0.102 | $ 0.246 | $ 0.227 | $ 0.172 | $ 0.220 | $ 0.244 |
| Net realized and unrealized gain (loss) | 5.282 | 1.345 | (5.369) | 8.678 | 0.968 | 2.113 |
| Total income (loss) from operations | $ 5.384 | $ 1.591 | $ (5.142) | $ 8.850 | $ 1.188 | $ 2.357 |
| Less Distributions | | | | | | |
| From net investment income | $ (0.234) | $ (0.213) | $ (0.179) | $ (0.210) | $ (0.208) | $ (0.215) |
| From net realized gain | — | (0.058) | (0.709) | — | (0.280) | (0.232) |
| Total distributions | $ (0.234) | $ (0.271) | $ (0.888) | $ (0.210) | $ (0.488) | $ (0.447) |
| Net asset value — End of period | $ 32.140 | $ 26.990 | $ 25.670 | $ 31.700 | $23.060 | $22.360 |
| Total Return(2) | 19.99% (3) | 6.26% | (16.68)% | 38.56% | 5.31% | 12.02% |
| Ratios/Supplemental Data | | | | | | |
| Net assets, end of period (000’s omitted) | $175,765 | $141,901 | $125,810 | $149,762 | $ 97,355 | $ 89,758 |
| Ratios (as a percentage of average daily net assets):(4) | | | | | | |
| Expenses | 0.95% (5)(6) | 0.97% (6) | 1.00% (6) | 1.01% | 1.03% | 1.08% |
| Net investment income | 0.66% (5) | 0.90% | 0.81% | 0.60% | 0.99% | 1.16% |
| Portfolio Turnover of the Fund(7) | 2% (3) | 4% | 5% | 6% | 7% | 7% |
| (1) | Computed using average shares outstanding. |
| (2) | Returns are historical and are calculated by determining the percentage change in net asset value with all distributions reinvested. |
| (3) | Not annualized. |
| (4) | Includes the Fund’s share of the Portfolios’ allocated expenses. |
| (5) | Annualized. |
| (6) | Includes a reduction by the investment adviser of a portion of the Portfolios' adviser fees due to the Portfolios' investments in the Liquidity Fund (equal to less than 0.005% of average daily net assets for the six months ended April 30, 2024 and the years ended October 31, 2023 and 2022). |
| (7) | Percentage includes both the Fund’s contributions to and withdrawals from the Portfolios and purchases and sales of securities held directly by the Fund, if any. |
13
See Notes to Financial Statements.
Eaton Vance
Tax-Managed Equity Asset Allocation Fund
April 30, 2024
Notes to Financial Statements (Unaudited)
1 Significant Accounting Policies
Eaton Vance Tax-Managed Equity Asset Allocation Fund (the Fund) is a diversified series of Eaton Vance Mutual Funds Trust (the Trust). The Trust is a Massachusetts business trust registered under the Investment Company Act of 1940, as amended (the 1940 Act), as an open-end management investment company. The Fund offers three classes of shares. Class A shares are generally sold subject to a sales charge imposed at time of purchase. Class C shares are sold at net asset value and are generally subject to a contingent deferred sales charge (see Note 5). Effective November 5, 2020, Class C shares automatically convert to Class A shares eight years after their purchase as described in the Fund’s prospectus. Class I shares are sold at net asset value and are not subject to a sales charge. Each class represents a pro rata interest in the Fund, but votes separately on class-specific matters and (as noted below) is subject to different expenses. Realized and unrealized gains and losses and net investment income and losses, other than class-specific expenses, are allocated daily to each class of shares based on the relative net assets of each class to the total net assets of the Fund. Each class of shares differs in its distribution plan and certain other class-specific expenses. The Fund’s investment objective is to achieve long-term, after-tax returns for its shareholders. The Fund currently pursues its objective by investing directly in securities and in interests in five tax-managed equity portfolios managed by Eaton Vance Management (EVM) or its affiliates (the Portfolios), which are Massachusetts business trusts. The value of the Fund’s investments in the Portfolios reflects the Fund’s proportionate interest in their net assets. The Portfolios and the Fund’s proportionate interest in each of their net assets at April 30, 2024 were as follows: Tax-Managed Growth Portfolio (5.2%), Tax-Managed Value Portfolio (19.6%), Tax-Managed International Equity Portfolio (47.3%), Tax-Managed Multi-Cap Growth Portfolio (44.5%) and Tax-Managed Small-Cap Portfolio (34.9%). The performance of the Fund is directly affected by the performance of the Portfolios. A copy of each Portfolio’s financial statements is available by calling Eaton Vance at 1-800-262-1122 or in the EDGAR database on the Securities and Exchange Commission’s website at www.sec.gov.
The following is a summary of significant accounting policies of the Fund. The policies are in conformity with accounting principles generally accepted in the United States of America (U.S. GAAP). The Fund is an investment company and follows accounting and reporting guidance in the Financial Accounting Standards Board (FASB) Accounting Standards Codification Topic 946.
A Investment Valuation—The valuation policies common to the Portfolios are as follows:
Equity Securities. Equity securities listed on a U.S. securities exchange generally are valued at the last sale or closing price on the day of valuation or, if no sales took place on such date, at the mean between the closing bid and ask prices on the exchange where such securities are principally traded. Equity securities listed on the NASDAQ National Market System are valued at the NASDAQ official closing price. Unlisted or listed securities for which closing sales prices or closing quotations are not available are valued at the mean between the latest available bid and ask prices.
Foreign Securities and Currencies. Foreign securities and currencies are valued in U.S. dollars, based on foreign currency exchange rate quotations supplied by a third party pricing service. The pricing service uses a proprietary model to determine the exchange rate. Inputs to the model include reported trades and implied bid/ask spreads. The daily valuation of exchange-traded foreign securities generally is determined as of the close of trading on the principal exchange on which such securities trade. Events occurring after the close of trading on foreign exchanges may result in adjustments to the valuation of foreign securities to more accurately reflect their fair value as of the close of regular trading on the New York Stock Exchange. When valuing foreign equity securities that meet certain criteria, the Fund's Trustees have approved the use of a fair value service that values such securities to reflect market trading that occurs after the close of the applicable foreign markets of comparable securities or other instruments that have a strong correlation to the fair-valued securities.
Other. Investments in management investment companies (including money market funds) that do not trade on an exchange are valued at the net asset value as of the close of each business day.
Fair Valuation. In connection with Rule 2a-5 of the 1940 Act, the Trustees have designated the Portfolios' investment adviser as its valuation designee. Investments for which valuations or market quotations are not readily available or are deemed unreliable are valued by the investment adviser, as valuation designee, at fair value using methods that most fairly reflect the security’s “fair value”, which is the amount that the Portfolios might reasonably expect to receive for the security upon its current sale in the ordinary course. Each such determination is based on a consideration of relevant factors, which are likely to vary from one pricing context to another. These factors may include, but are not limited to, the type of security, the existence of any contractual restrictions on the security’s disposition, the price and extent of public trading in similar securities of the issuer or of comparable companies or entities, quotations or relevant information obtained from broker/dealers or other market participants, information obtained from the issuer, analysts, and/or the appropriate stock exchange (for exchange-traded securities), an analysis of the company’s or entity’s financial statements, and an evaluation of the forces that influence the issuer and the market(s) in which the security is purchased and sold.
In addition to investing in the Portfolios, the Fund may invest directly in securities. The valuation policies of the Fund are consistent with the valuation policies of the Portfolios. Additional valuation policies of the Fund are as follows:
Debt Obligations. Debt obligations are generally valued on the basis of valuations provided by third party pricing services, as derived from such services’ pricing models. Inputs to the models may include, but are not limited to, reported trades, executable bid and ask prices, broker/dealer quotations, prices or yields of securities with similar characteristics, interest rates, anticipated prepayments, benchmark curves or information pertaining to the issuer, as well as industry and economic events. The pricing services may use a matrix approach, which considers information regarding securities with similar characteristics to determine the valuation for a security. Short-term debt obligations purchased with a remaining maturity of sixty days or less for which a valuation from a third party pricing service is not readily available may be valued at amortized cost, which approximates fair value.
Eaton Vance
Tax-Managed Equity Asset Allocation Fund
April 30, 2024
Notes to Financial Statements (Unaudited) — continued
Preferred Equity Securities. Preferred equity securities that are not listed or traded in the over-the-counter market are valued by a third party pricing service that uses various techniques that consider factors including, but not limited to, prices or yields of securities with similar characteristics, benchmark yields, broker/dealer quotes, quotes of underlying common stock, issuer spreads, as well as industry and economic events.
B Income—The Fund's net investment income or loss includes the Fund's pro rata share of the net investment income or loss of the Portfolios, less all actual and accrued expenses of the Fund. Dividend income is recorded on the ex-dividend date for dividends received in cash and/or securities. However, if the ex-dividend date has passed, certain dividends from foreign securities are recorded as the Fund is informed of the ex-dividend date. Withholding taxes on foreign dividends and capital gains have been provided for in accordance with the Fund’s understanding of the applicable countries’ tax rules and rates. Distributions from investment companies are recorded as dividend income, capital gains or return of capital based on the nature of the distribution. Interest income is recorded on the basis of interest accrued, adjusted for amortization of premium or accretion of discount.
C Federal Taxes—The Fund’s policy is to comply with the provisions of the Internal Revenue Code applicable to regulated investment companies and to distribute to shareholders each year substantially all of its net investment income, and all or substantially all of its net realized capital gains. Accordingly, no provision for federal income or excise tax is necessary.
As of April 30, 2024, the Fund had no uncertain tax positions that would require financial statement recognition, de-recognition, or disclosure. The Fund files a U.S. federal income tax return annually after its fiscal year-end, which is subject to examination by the Internal Revenue Service for a period of three years from the date of filing.
D Foreign Currency Translation—Investment valuations, other assets, and liabilities initially expressed in foreign currencies are translated each business day into U.S. dollars based upon current exchange rates. Purchases and sales of foreign investment securities and income and expenses denominated in foreign currencies are translated into U.S. dollars based upon currency exchange rates in effect on the respective dates of such transactions. Recognized gains or losses on investment transactions attributable to changes in foreign currency exchange rates are recorded for financial statement purposes as net realized gains and losses on investments. That portion of unrealized gains and losses on investments that results from fluctuations in foreign currency exchange rates is not separately disclosed.
E Expenses—The majority of expenses of the Trust are directly identifiable to an individual fund. Expenses which are not readily identifiable to a specific fund are allocated taking into consideration, among other things, the nature and type of expense and the relative size of the funds.
F Use of Estimates—The preparation of the financial statements in conformity with U.S. GAAP requires management to make estimates and assumptions that affect the reported amounts of assets and liabilities at the date of the financial statements and the reported amounts of income and expense during the reporting period. Actual results could differ from those estimates.
G Indemnifications— Under the Trust’s organizational documents, its officers and Trustees may be indemnified against certain liabilities and expenses arising out of the performance of their duties to the Fund. Under Massachusetts law, if certain conditions prevail, shareholders of a Massachusetts business trust (such as the Trust) could be deemed to have personal liability for the obligations of the Trust. However, the Trust’s Declaration of Trust contains an express disclaimer of liability on the part of Fund shareholders and the By-laws provide that the Trust shall assume, upon request by the shareholder, the defense on behalf of any Fund shareholders. Moreover, the By-laws also provide for indemnification out of Fund property of any shareholder held personally liable solely by reason of being or having been a shareholder for all loss or expense arising from such liability. Additionally, in the normal course of business, the Fund enters into agreements with service providers that may contain indemnification clauses. The Fund’s maximum exposure under these arrangements is unknown as this would involve future claims that may be made against the Fund that have not yet occurred.
H Other—Investment transactions are accounted for on a trade date basis. Realized gains and losses on investments sold are determined on the basis of identified cost.
I Interim Financial Statements—The interim financial statements relating to April 30, 2024 and for the six months then ended have not been audited by an independent registered public accounting firm, but in the opinion of the Fund’s management, reflect all adjustments, consisting only of normal recurring adjustments, necessary for the fair presentation of the financial statements.
2 Distributions to Shareholders and Income Tax Information
It is the present policy of the Fund to make at least one distribution annually (normally in December) of all or substantially all of its net investment income and to distribute annually all or substantially all of its net realized capital gains. Distributions to shareholders are recorded on the ex-dividend date. Distributions are declared separately for each class of shares. Shareholders may reinvest income and capital gain distributions in additional shares of the same class of the Fund at the net asset value as of the ex-dividend date or, at the election of the shareholder, receive distributions in cash. Distributions to shareholders are determined in accordance with income tax regulations, which may differ from U.S. GAAP. As required by U.S. GAAP, only distributions in excess of tax basis earnings and profits are reported in the financial statements as a return of capital. Permanent differences between book and tax accounting relating to distributions are reclassified to paid-in capital. For tax purposes, distributions from short-term capital gains are considered to be from ordinary income.
Eaton Vance
Tax-Managed Equity Asset Allocation Fund
April 30, 2024
Notes to Financial Statements (Unaudited) — continued
At October 31, 2023, the Fund, for federal income tax purposes, had deferred capital losses of $1,765,695 which would reduce its taxable income arising from future net realized gains on investment transactions, if any, to the extent permitted by the Internal Revenue Code, and thus would reduce the amount of distributions to shareholders, which would otherwise be necessary to relieve the Fund of any liability for federal income or excise tax. The deferred capital losses are treated as arising on the first day of the Fund’s next taxable year and retain the same short-term or long-term character as when originally deferred. Of the deferred capital losses at October 31, 2023, $1,765,695 are short-term.
The cost and unrealized appreciation (depreciation) of investments of the Fund, including the affiliated Portfolios, at April 30, 2024, as determined on a federal income tax basis, were as follows:
| Aggregate cost | $216,663,995 |
| Gross unrealized appreciation | $ 477,529,526 |
| Gross unrealized depreciation | (1,377,121) |
| Net unrealized appreciation | $476,152,405 |
3 Investment Adviser Fee and Other Transactions with Affiliates
The investment adviser fee is earned by EVM, an indirect, wholly-owned subsidiary of Morgan Stanley, as compensation for investment advisory services rendered to the Fund. The fee is computed at an annual rate as a percentage of the Fund’s average daily net assets as follows and is payable monthly:
| Average Daily Net Assets | Annual Fee Rate |
| Up to $500 million | 0.700% |
| $500 million but less than $1 billion | 0.600% |
| $1 billion but less than $1.5 billion | 0.575% |
| $1.5 billion but less than $2.5 billion | 0.550% |
| $2.5 billion and over | 0.525% |
The investment adviser fee payable by the Fund is reduced by the Fund’s allocable share of any fee paid pursuant to an investment advisory agreement by any investment company advised by EVM or its affiliates in which the Fund invests. The Portfolios may invest in a money market fund, the Institutional Class of the Morgan Stanley Institutional Liquidity Funds - Government Portfolio (the “Liquidity Fund”), an open-end management investment company managed by Morgan Stanley Investment Management Inc., a wholly-owned subsidiary of Morgan Stanley. The investment adviser fee paid by the Portfolios is reduced by an amount equal to their pro rata share of the advisory and administration fees paid by the Portfolios due to their investments in the Liquidity Fund. For the six months ended April 30, 2024, the Fund’s allocated share of the reduction of the investment adviser fee paid by the Portfolios was $1,823 relating to the Portfolios’ investments in the Liquidity Fund.
For the six months ended April 30, 2024, the Fund’s investment adviser fee totaled $2,247,371, of which $1,729,478 was allocated from the Portfolios and $517,893 was paid or accrued directly by the Fund. For the six months ended April 30, 2024, the Fund’s investment adviser fee, including the fees allocated from the Portfolios, was 0.67% (annualized) of the Fund’s average daily net assets. The administration fee is earned by EVM as compensation for administering the business affairs of the Fund and is computed at an annual rate of 0.15% of the Fund’s average daily net assets. For the six months ended April 30, 2024, the administration fee amounted to $499,720.
EVM provides sub-transfer agency and related services to the Fund pursuant to a Sub-Transfer Agency Support Services Agreement. For the six months ended April 30, 2024, EVM earned $39,442 from the Fund pursuant to such agreement, which is included in transfer and dividend disbursing agent fees on the Statement of Operations. The Fund was informed that Eaton Vance Distributors, Inc. (EVD), an affiliate of EVM and the Fund’s principal underwriter, received $9,500 as its portion of the sales charge on sales of Class A shares for the six months ended April 30, 2024. EVD also received distribution and service fees from Class A and Class C shares (see Note 4) and contingent deferred sales charges (see Note 5).
During the six months ended April 30, 2024, EVM reimbursed the Fund $79,092 for a net realized loss on the sale of an investment security not meeting the Fund's investment guidelines. The reimbursement had no significant impact on total return for each class.
Trustees and officers of the Fund and the Portfolios who are members of EVM’s organization receive remuneration for their services to the Fund out of the investment adviser fee. Certain officers and Trustees of the Fund and the Portfolios are officers of EVM.
Eaton Vance
Tax-Managed Equity Asset Allocation Fund
April 30, 2024
Notes to Financial Statements (Unaudited) — continued
4 Distribution Plans
The Fund has in effect a distribution plan for Class A shares (Class A Plan) pursuant to Rule 12b-1 under the 1940 Act. Pursuant to the Class A Plan, the Fund pays EVD a distribution and service fee of 0.25% per annum of its average daily net assets attributable to Class A shares for distribution services and facilities provided to the Fund by EVD, as well as for personal services and/or the maintenance of shareholder accounts. Distribution and service fees paid or accrued to EVD for the six months ended April 30, 2024 amounted to $578,551 for Class A shares.
The Fund also has in effect a distribution plan for Class C shares (Class C Plan) pursuant to Rule 12b-1 under the 1940 Act. Pursuant to the Class C Plan, the Fund pays EVD amounts equal to 0.75% per annum of its average daily net assets attributable to Class C shares for providing ongoing distribution services and facilities to the Fund. For the six months ended April 30, 2024, the Fund paid or accrued to EVD $140,400 for Class C shares.
Pursuant to the Class C Plan, the Fund also makes payments of service fees to EVD, financial intermediaries and other persons in amounts equal to 0.25% per annum of its average daily net assets attributable to that class. Service fees paid or accrued are for personal services and/or the maintenance of shareholder accounts. They are separate and distinct from the sales commissions and distribution fees payable to EVD. Service fees paid or accrued for the six months ended April 30, 2024 amounted to $46,800 for Class C shares.
Distribution and service fees are subject to the limitations contained in the Financial Industry Regulatory Authority Rule 2341(d).
5 Contingent Deferred Sales Charges
A contingent deferred sales charge (CDSC) of 1% generally is imposed on redemptions of Class C shares made within 12 months of purchase. Class A shares may be subject to a 1% CDSC if redeemed within 12 months of purchase (depending on the circumstances of purchase). Generally, the CDSC is based upon the lower of the net asset value at date of redemption or date of purchase. No charge is levied on shares acquired by reinvestment of dividends or capital gain distributions. For the six months ended April 30, 2024, the Fund was informed that EVD received $119 of CDSCs paid by Class A shareholders and $1,901 of CDSCs paid by Class C shareholders.
6 Investment Transactions
For the six months ended April 30, 2024, increases and decreases in the Fund's investments in the Portfolios were as follows:
| Portfolio | Contributions | Withdrawals |
| Tax-Managed Growth Portfolio | $3,788,193 | $3,864,678 |
| Tax-Managed International Equity Portfolio | 1,002,187 | 1,022,433 |
| Tax-Managed Multi-Cap Growth Portfolio | 1,503,280 | 1,533,649 |
| Tax-Managed Small-Cap Portfolio | 1,391,926 | 1,420,046 |
| Tax-Managed Value Portfolio | 3,451,976 | 3,521,713 |
7 Purchases and Sales of Investments
Purchases and sales of investments, other than short-term obligations and investments in the Portfolios, aggregated $1,658,760 and $6,386,017, respectively, for the six months ended April 30, 2024.
Eaton Vance
Tax-Managed Equity Asset Allocation Fund
April 30, 2024
Notes to Financial Statements (Unaudited) — continued
8 Shares of Beneficial Interest
The Fund’s Declaration of Trust permits the Trustees to issue an unlimited number of full and fractional shares of beneficial interest (without par value). Such shares may be issued in a number of different series (such as the Fund) and classes. Transactions in Fund shares, including direct exchanges pursuant to share class conversions, were as follows:
| | Six Months Ended
April 30, 2024
(Unaudited) | | Year Ended
October 31, 2023 |
| | Shares | Amount | | Shares | Amount |
| Class A | | | | | |
| Sales | 300,975 | $ 9,456,112 | | 638,605 | $ 17,459,127 |
| Issued to shareholders electing to receive payments of distributions in Fund shares | 72,058 | 2,219,392 | | 113,819 | 2,905,787 |
| Redemptions | (555,535) | (17,177,503) | | (1,481,156) | (40,524,392) |
| Net decrease | (182,502) | $ (5,501,999) | | (728,732) | $(20,159,478) |
| Class C | | | | | |
| Sales | 126,685 | $ 3,577,337 | | 264,803 | $ 6,591,501 |
| Issued to shareholders electing to receive payments of distributions in Fund shares | — | — | | 3,594 | 84,643 |
| Redemptions | (162,874) | (4,679,098) | | (409,940) | (10,263,929) |
| Net decrease | (36,189) | $ (1,101,761) | | (141,543) | $ (3,587,785) |
| Class I | | | | | |
| Sales | 474,232 | $ 14,836,463 | | 1,016,149 | $ 27,963,225 |
| Issued to shareholders electing to receive payments of distributions in Fund shares | 38,518 | 1,183,648 | | 48,921 | 1,246,030 |
| Redemptions | (301,445) | (9,426,254) | | (709,260) | (19,104,473) |
| Net increase | 211,305 | $ 6,593,857 | | 355,810 | $ 10,104,782 |
9 Fair Value Measurements
Under generally accepted accounting principles for fair value measurements, a three-tier hierarchy to prioritize the assumptions, referred to as inputs, is used in valuation techniques to measure fair value. The three-tier hierarchy of inputs is summarized in the three broad levels listed below.
| • | Level 1 – quoted prices in active markets for identical investments |
| • | Level 2 – other significant observable inputs (including quoted prices for similar investments, interest rates, prepayment speeds, credit risk, etc.) |
| • | Level 3 – significant unobservable inputs (including a fund's own assumptions in determining the fair value of investments) |
In cases where the inputs used to measure fair value fall in different levels of the fair value hierarchy, the level disclosed is determined based on the lowest level input that is significant to the fair value measurement in its entirety. The inputs or methodology used for valuing securities are not necessarily an indication of the risk associated with investing in those securities.
Eaton Vance
Tax-Managed Equity Asset Allocation Fund
April 30, 2024
Notes to Financial Statements (Unaudited) — continued
At April 30, 2024, the hierarchy of inputs used in valuing the Fund's investments in securities and investments in the Portfolios, which are carried at fair value, were as follows:
| Asset Description | Level 1 | Level 2 | Level 3 | Total |
| Investments in Affiliated Portfolios | $ 670,100,884 | $ — | $ — | $ 670,100,884 |
| Debt Obligations | — | 21,199,496 | — | 21,199,496 |
| Preferred Stocks | 1,516,020 | — | — | 1,516,020 |
| Total Investments | $ 671,616,904 | $ 21,199,496 | $ — | $692,816,400 |
Eaton Vance
Tax-Managed Equity Asset Allocation Fund
April 30, 2024
| Officers |
Kenneth A. Topping
President | Nicholas S. Di Lorenzo
Secretary |
Deidre E. Walsh
Vice President and Chief Legal Officer | Laura T. Donovan
Chief Compliance Officer |
James F. Kirchner
Treasurer | |
George J. Gorman
Chairperson | |
| Alan C. Bowser | |
| Mark R. Fetting | |
| Cynthia E. Frost | |
| Valerie A. Mosley | |
| Anchal Pachnanda* | |
| Keith Quinton | |
| Marcus L. Smith | |
| Susan J. Sutherland | |
| Scott E. Wennerholm | |
| Nancy A. Wiser | |
| U.S. Customer Privacy Notice | March 2024 |
| FACTS | WHAT DOES EATON VANCE DO WITH YOUR PERSONAL INFORMATION? |
| Why? | Financial companies choose how they share your personal information. Federal law gives consumers the right to limit some but not all sharing. Federal law also requires us to tell you how we collect, share, and protect your personal information. Please read this notice carefully to understand what we do. |
| |
| What? | The types of personal information we collect and share depend on the product or service you have with us. This information can include:■ Social Security number and income
■ investment experience and risk tolerance
■ checking account information and wire transfer instructions |
| |
| How? | All financial companies need to share customers’ personal information to run their everyday business. In the section below, we list the reasons financial companies can share their customers’ personal information; the reasons Eaton Vance chooses to share; and whether you can limit this sharing. |
| Reasons we can share your personal information | Does Eaton Vance
share? | Can you limit
this sharing? |
| For our everyday business purposes — such as to process your transactions, maintain your account(s), respond to court orders and legal investigations, or report to credit bureaus | Yes | No |
| For our marketing purposes — to offer our products and services to you | Yes | No |
| For joint marketing with other financial companies | No | We don’t share |
| For our affiliates’ everyday business purposes — information about your transactions and experiences | Yes | No* |
| For our affiliates’ everyday business purposes — information about your creditworthiness | Yes | Yes* |
| For our affiliates to market to you | Yes | Yes* |
| For nonaffiliates to market to you | No | We don’t share |
To limit our
sharing | Call toll-free 1-800-262-1122 or email: EVPrivacy@eatonvance.comPlease note:If you are a new customer, we can begin sharing your information 30 days from the date we sent this notice. When you are no longer our customer, we continue to share your information as described in this notice. However, you can contact us at any time to limit our sharing. |
| Questions? | Call toll-free 1-800-262-1122 or email: EVPrivacy@eatonvance.com |
| U.S. Customer Privacy Notice — continued | March 2024 |
| Who we are |
| Who is providing this notice? | Eaton Vance Management and our investment management affiliates (“Eaton Vance”) (see Affiliates definition below.) |
| What we do |
How does Eaton Vance
protect my personal
information? | To protect your personal information from unauthorized access and use, we use security measures that comply with federal law. These measures include computer safeguards and secured files and buildings. We have policies governing the proper handling of customer information by personnel and requiring third parties that provide support to adhere to appropriate security standards with respect to such information. |
How does Eaton Vance
collect my personal
information? | We collect your personal information, for example, when you■ open an account or make deposits or withdrawals from your account
■ buy securities from us or make a wire transfer
■ give us your contact informationWe also collect your personal information from others, such as credit bureaus, affiliates, or other companies. |
| Why can’t I limit all sharing? | Federal law gives you the right to limit only■ sharing for affiliates’ everyday business purposes — information about your creditworthiness
■ affiliates from using your information to market to you
■ sharing for nonaffiliates to market to youState laws and individual companies may give you additional rights to limit sharing. (See below for more on your rights under state law.) |
What happens when I limit
sharing for an account I hold
jointly with someone else? | Your choices will apply to everyone on your account. |
| Definitions |
| Affiliates | Companies related by common ownership or control. They can be financial and nonfinancial companies.■ Our affiliates include registered investment advisers such as Eaton Vance Management, Eaton Vance Advisers International Ltd., Boston Management and Research, Calvert Research and Management, Parametric Portfolio Associates LLC, Atlanta Capital Management Company LLC, Morgan Stanley Investment Management Inc., Morgan Stanley Investment Management Co.; registered broker-dealers such as Morgan Stanley Distributors Inc. and Eaton Vance Distributors, Inc. (together, the “Investment Management Affiliates”); and companies with a Morgan Stanley name and financial companies such as Morgan Stanley Smith Barney LLC and Morgan Stanley & Co. (the “Morgan Stanley Affiliates”). |
| Nonaffiliates | Companies not related by common ownership or control. They can be financial and nonfinancial companies.■ Eaton Vance does not share with nonaffiliates so they can market to you. |
| Joint marketing | A formal agreement between nonaffiliated financial companies that together market financial products or services to you.■ Eaton Vance does not jointly market. |
| U.S. Customer Privacy Notice — continued | March 2024 |
| Other important information |
| *PLEASE NOTE: Eaton Vance does not share your creditworthiness information or your transactions and experiences information with the Morgan Stanley Affiliates, nor does Eaton Vance enable the Morgan Stanley Affiliates to market to you. Your opt outs will prevent Eaton Vance from sharing your creditworthiness information with the Investment Management Affiliates and will prevent the Investment Management Affiliates from marketing their products to you.Vermont: Except as permitted by law, we will not share personal information we collect about Vermont residents with Nonaffiliates unless you provide us with your written consent to share such information.California: Except as permitted by law, we will not share personal information we collect about California residents with Nonaffiliates and we will limit sharing such personal information with our Affiliates to comply with California privacy laws that apply to us. |
Delivery of Shareholder Documents. The Securities and Exchange Commission (SEC) permits funds to deliver only one copy of shareholder documents, including prospectuses, proxy statements and shareholder reports, to fund investors with multiple accounts at the same residential or post office box address. This practice is often called “householding” and it helps eliminate duplicate mailings to shareholders. Eaton Vance, or your financial intermediary, may household the mailing of your documents indefinitely unless you instruct Eaton Vance, or your financial intermediary, otherwise. If you would prefer that your Eaton Vance documents not be householded, please contact Eaton Vance at 1-800-262-1122, or contact your financial intermediary. Your instructions that householding not apply to delivery of your Eaton Vance documents will typically be effective within 30 days of receipt by Eaton Vance or your financial intermediary.
Portfolio Holdings. Each Eaton Vance Fund and its underlying Portfolio(s) (if applicable) files a schedule of portfolio holdings on Part F to Form N-PORT with the SEC. Certain information filed on Form N-PORT may be viewed on the Eaton Vance website at www.eatonvance.com, by calling Eaton Vance at 1-800-262-1122 or in the EDGAR database on the SEC’s website at www.sec.gov.
Proxy Voting. From time to time, funds are required to vote proxies related to the securities held by the funds. The Eaton Vance Funds or their underlying Portfolios (if applicable) vote proxies according to a set of policies and procedures approved by the Funds’ and Portfolios’ Boards. You may obtain a description of these policies and procedures and information on how the Funds or Portfolios voted proxies relating to portfolio securities during the most recent 12-month period ended June 30, without charge, upon request, by calling 1-800-262-1122 and by accessing the SEC’s website at www.sec.gov.
Tailored Shareholder Reports. Effective January 24, 2023, the SEC adopted rule and form amendments to require open-end mutual funds and ETFs to transmit concise and visually engaging streamlined annual and semi-annual reports to shareholders that highlight key information. Other information, including financial statements, will no longer appear in a streamlined shareholder report but must be available online, delivered free of charge upon request, and filed on a semi-annual basis on Form N-CSR. The rule and form amendments have a compliance date of July 24, 2024. At this time, management is evaluating the impact of these amendments on the shareholder reports for the Eaton Vance Funds.
Investment Adviser and Administrator
Eaton Vance Management
One Post Office Square
Boston, MA 02109
Principal Underwriter*
Eaton Vance Distributors, Inc.
One Post Office Square
Boston, MA 02109
(617) 482-8260
Custodian
State Street Bank and Trust Company
One Congress Street, Suite 1
Boston, MA 02114-2016
Transfer Agent
BNY Mellon Investment Servicing (US) Inc.
Attn: Eaton Vance Funds
P.O. Box 534439
Pittsburgh, PA 15253-4439
(800) 262-1122
Fund Offices
One Post Office Square
Boston, MA 02109
* FINRA BrokerCheck. Investors may check the background of their Investment Professional by contacting the Financial Industry Regulatory Authority (FINRA). FINRA BrokerCheck is a free tool to help investors check the professional background of current and former FINRA-registered securities firms and brokers. FINRA BrokerCheck is available by calling 1-800-289-9999 and at www.FINRA.org. The FINRA BrokerCheck brochure describing this program is available to investors at www.FINRA.org.
Eaton Vance
Global Income Builder Fund
Semi-Annual Report
April 30, 2024
Commodity Futures Trading Commission Registration. The Commodity Futures Trading Commission (“CFTC”) has adopted regulations that subject registered investment companies and advisers to regulation by the CFTC if a fund invests more than a prescribed level of its assets in certain CFTC-regulated instruments (including futures, certain options and swap agreements) or markets itself as providing investment exposure to such instruments. The investment adviser has claimed an exclusion from the definition of “commodity pool operator” under the Commodity Exchange Act with respect to its management of the Fund. Accordingly, neither the Fund nor the adviser with respect to the operation of the Fund is subject to CFTC regulation. Because of its management of other strategies, the Fund's adviser is registered with the CFTC as a commodity pool operator. The adviser is also registered as a commodity trading advisor.
Fund shares are not insured by the FDIC and are not deposits or other obligations of, or guaranteed by, any depository institution. Shares are subject to investment risks, including possible loss of principal invested.
This report must be preceded or accompanied by a current summary prospectus or prospectus. Before investing, investors should consider carefully the investment objective, risks, and charges and expenses of a mutual fund. This and other important information is contained in the summary prospectus and prospectus, which can be obtained from a financial intermediary. Prospective investors should read the prospectus carefully before investing. For further information, please call 1-800-262-1122.
Semi-Annual Report April 30, 2024
Eaton Vance
Global Income Builder Fund
Eaton Vance
Global Income Builder Fund
April 30, 2024
Performance
Portfolio Manager(s) Christopher M. Dyer, CFA and Jeffrey D. Mueller, of Eaton Vance Advisers International Ltd.; Derek J.V. DiGregorio of Boston Management and Research
| % Average Annual Total Returns1,2 | Class
Inception Date | Performance
Inception Date | Six Months | One Year | Five Years | Ten Years |
| Class A at NAV | 11/30/2005 | 11/30/2005 | 15.30% | 13.24% | 7.03% | 6.21% |
| Class A with 5.25% Maximum Sales Charge | — | — | 9.26 | 7.29 | 5.89 | 5.64 |
| Class C at NAV | 11/30/2005 | 11/30/2005 | 14.88 | 12.38 | 6.26 | 5.59 |
| Class C with 1% Maximum Deferred Sales Charge | — | — | 13.88 | 11.38 | 6.26 | 5.59 |
| Class I at NAV | 01/31/2006 | 11/30/2005 | 15.34 | 13.53 | 7.29 | 6.48 |
| Class R at NAV | 01/31/2006 | 11/30/2005 | 15.24 | 13.04 | 6.78 | 5.94 |
|
| MSCI World Index | — | — | 20.29% | 18.39% | 10.44% | 8.86% |
| ICE BofA Developed Markets High Yield Ex-Subordinated Financial Index | — | — | 8.90 | 8.45 | 2.95 | 3.35 |
| Blended Index | — | — | 16.24 | 14.92 | 7.90 | 7.00 |
| % Total Annual Operating Expense Ratios3 | Class A | Class C | Class I | Class R |
| Gross | 1.20% | 1.95% | 0.95% | 1.45% |
| Net | 1.17 | 1.92 | 0.92 | 1.42 |
See Endnotes and Additional Disclosures in this report.
Past performance is no guarantee of future results. Returns are historical and are calculated by determining the percentage change in net asset value (NAV) or offering price (as applicable) with all distributions reinvested. Furthermore, returns do not reflect the deduction of taxes that shareholders may have to pay on Fund distributions or upon the redemption of Fund shares. Investment return and principal value will fluctuate so that shares, when redeemed, may be worth more or less than their original cost. Performance for periods less than or equal to one year is cumulative. Performance is for the stated time period only; due to market volatility, current Fund performance may be lower or higher than the quoted return. For performance as of the most recent month-end, please refer to eatonvance.com.
Eaton Vance
Global Income Builder Fund
April 30, 2024
| Country Allocation (% of net assets) |
| Asset Allocation (% of net assets)1 |
| Top 10 Holdings (% of net assets)2 |
| Microsoft Corp. | 3.0% |
| Alphabet, Inc., Class C | 2.5 |
| Eli Lilly & Co. | 2.4 |
| Novo Nordisk AS, Class B | 2.0 |
| Amazon.com, Inc. | 1.6 |
| EOG Resources, Inc. | 1.6 |
| ASML Holding NV | 1.4 |
| Apple, Inc. | 1.4 |
| NVIDIA Corp. | 1.3 |
| Schneider Electric SE | 1.0 |
| Total | 18.2% |
Footnotes:
| 1 | Other Net Assets represents other assets less liabilities and includes any investment type that represents less than 1% of net assets. |
| 2 | Excludes cash and cash equivalents. |
Eaton Vance
Global Income Builder Fund
April 30, 2024
Endnotes and Additional Disclosures
| 1 | MSCI World Index is an unmanaged index of equity securities in the developed markets. MSCI indexes are net of foreign withholding taxes. Source: MSCI. MSCI data may not be reproduced or used for any other purpose. MSCI provides no warranties, has not prepared or approved this report, and has no liability hereunder. ICE BofA Developed Markets High Yield Ex-Subordinated Financial Index is an unmanaged index of global developed market, below investment grade corporate bonds. ICE® BofA® indices are not for redistribution or other uses; provided “as is”, without warranties, and with no liability. Eaton Vance has prepared this report and ICE Data Indices, LLC does not endorse it, or guarantee, review, or endorse Eaton Vance’s products. BofA® is a licensed registered trademark of Bank of America Corporation in the United States and other countries. The Blended Index consists of 65% MSCI World Index and 35% ICE BofA Developed Markets High Yield Ex-Subordinated Financial Index, rebalanced monthly. Unless otherwise stated, index returns do not reflect the effect of any applicable sales charges, commissions, expenses, taxes or leverage, as applicable. It is not possible to invest directly in an index. |
| 2 | Total Returns at NAV do not include applicable sales charges. If sales charges were deducted, the returns would be lower. Total Returns shown with maximum sales charge reflect the stated maximum sales charge. Unless otherwise stated, performance does not reflect the deduction of taxes on Fund distributions or redemptions of Fund shares.Effective December 7, 2015, the Fund changed its name and principal investment strategies to invest in common stocks, preferred stocks and other hybrid securities and income instruments of U.S. and foreign issuers. As of such date, the Fund was no longer required to invest at least 80% of its net assets in dividend-paying common and preferred stocks. Performance prior to December 7, 2015 reflects the Fund’s performance under its former principal investment strategies.Effective November 5, 2020, Class C shares automatically convert to Class A shares eight years after purchase. The average annual total returns listed for Class C reflect conversion to Class A shares after eight years. Prior to November 5, 2020, Class C shares automatically converted to Class A shares ten years after purchase. |
| 3 | Source: Fund prospectus. Net expense ratios reflect a contractual expense reimbursement that continues through 3/1/25. The expense ratios for the current reporting period can be found in the Financial Highlights section of this report. Performance reflects expenses waived and/or reimbursed, if applicable. Without such waivers and/or reimbursements, performance would have been lower. |
| | Fund profile subject to change due to active management |
Eaton Vance
Global Income Builder Fund
April 30, 2024
Example
As a Fund shareholder, you incur two types of costs: (1) transaction costs, including sales charges (loads) on purchases; and (2) ongoing costs, including management fees; distribution and/or service fees; and other Fund expenses. This Example is intended to help you understand your ongoing costs (in dollars) of Fund investing and to compare these costs with the ongoing costs of investing in other mutual funds. The Example is based on an investment of $1,000 invested at the beginning of the period and held for the entire period (November 1, 2023 to April 30, 2024).
Actual Expenses
The first section of the table below provides information about actual account values and actual expenses. You may use the information in this section, together with the amount you invested, to estimate the expenses that you paid over the period. Simply divide your account value by $1,000 (for example, an $8,600 account value divided by $1,000 = 8.6), then multiply the result by the number in the first section under the heading entitled “Expenses Paid During Period” to estimate the expenses you paid on your account during this period.
Hypothetical Example for Comparison Purposes
The second section of the table below provides information about hypothetical account values and hypothetical expenses based on the actual Fund expense ratio and an assumed rate of return of 5% per year (before expenses), which is not the actual Fund return. The hypothetical account values and expenses may not be used to estimate the actual ending account balance or expenses you paid for the period. You may use this information to compare the ongoing costs of investing in your Fund and other funds. To do so, compare this 5% hypothetical example with the 5% hypothetical examples that appear in the shareholder reports of the other funds.
Please note that the expenses shown in the table are meant to highlight your ongoing costs only and do not reflect any transactional costs, such as sales charges (loads). Therefore, the second section of the table is useful in comparing ongoing costs only, and will not help you determine the relative total costs of owning different funds. In addition, if these transactional costs were included, your costs would be higher.
| | Beginning
Account Value
(11/1/23) | Ending
Account Value
(4/30/24) | Expenses Paid
During Period*
(11/1/23 – 4/30/24) | Annualized
Expense
Ratio |
| Actual | | | | |
| Class A | $1,000.00 | $1,153.00 | $ 6.26** | 1.17% |
| Class C | $1,000.00 | $1,148.80 | $10.26** | 1.92% |
| Class I | $1,000.00 | $1,153.40 | $ 4.93** | 0.92% |
| Class R | $1,000.00 | $1,152.40 | $ 7.60** | 1.42% |
| |
| Hypothetical | | | | |
| (5% return per year before expenses) | | | | |
| Class A | $1,000.00 | $1,019.05 | $ 5.87** | 1.17% |
| Class C | $1,000.00 | $1,015.32 | $ 9.62** | 1.92% |
| Class I | $1,000.00 | $1,020.29 | $ 4.62** | 0.92% |
| Class R | $1,000.00 | $1,017.80 | $ 7.12** | 1.42% |
| * | Expenses are equal to the Fund’s annualized expense ratio for the indicated Class, multiplied by the average account value over the period, multiplied by 182/366 (to reflect the one-half year period). The Example assumes that the $1,000 was invested at the net asset value per share determined at the close of business on October 31, 2023. |
| ** | Absent an allocation of certain expenses to affiliate(s), expenses would be higher. |
Eaton Vance
Global Income Builder Fund
April 30, 2024
Portfolio of Investments (Unaudited)
| Security | Shares | Value |
| Aerospace & Defense — 0.7% |
| Safran SA | | 7,735 | $ 1,677,196 |
| | | | $ 1,677,196 |
| Air Freight & Logistics — 0.4% |
| GXO Logistics, Inc.(1) | | 19,185 | $ 952,727 |
| | | | $ 952,727 |
| Automobiles — 1.2% |
| Bayerische Motoren Werke AG | | 8,430 | $ 918,443 |
| Mercedes-Benz Group AG | | 17,612 | 1,332,187 |
| Stellantis NV | | 29,499 | 652,709 |
| Tesla, Inc.(1) | | 735 | 134,711 |
| | | | $ 3,038,050 |
| Banks — 5.6% |
| Banco Santander SA | | 122,177 | $ 594,468 |
| Barclays PLC | | 457,319 | 1,153,035 |
| BNP Paribas SA | | 14,347 | 1,032,437 |
| CaixaBank SA | | 253,871 | 1,338,803 |
| Credit Agricole SA | | 87,964 | 1,361,087 |
| DNB Bank ASA | | 43,012 | 749,662 |
| HDFC Bank Ltd. ADR | | 14,341 | 826,042 |
| HSBC Holdings PLC | | 102,551 | 888,907 |
| ING Groep NV | | 37,596 | 594,403 |
| KBC Group NV | | 6,936 | 515,235 |
| Lloyds Banking Group PLC | | 1,554,060 | 1,002,963 |
| Nordea Bank Abp | | 34,721 | 406,870 |
| Societe Generale SA | | 30,081 | 810,534 |
| Svenska Handelsbanken AB, Class A | | 25,235 | 216,398 |
| Toronto-Dominion Bank | | 13,774 | 817,145 |
| Truist Financial Corp. | | 19,951 | 749,160 |
| UniCredit SpA | | 28,073 | 1,030,402 |
| | | | $ 14,087,551 |
| Beverages — 0.4% |
| Diageo PLC | | 17,621 | $ 608,976 |
| Pernod Ricard SA | | 3,318 | 501,821 |
| | | | $ 1,110,797 |
| Biotechnology — 0.4% |
| CSL Ltd. | | 5,833 | $ 1,036,385 |
| | | | $ 1,036,385 |
| Security | Shares | Value |
| Broadline Retail — 1.6% |
| Amazon.com, Inc.(1) | | 23,900 | $ 4,182,500 |
| | | | $ 4,182,500 |
| Capital Markets — 0.3% |
| Intercontinental Exchange, Inc. | | 5,017 | $ 645,989 |
| | | | $ 645,989 |
| Chemicals — 0.3% |
| Sika AG | | 2,394 | $ 681,001 |
| | | | $ 681,001 |
| Commercial Services & Supplies — 0.4% |
| Waste Management, Inc. | | 4,364 | $ 907,799 |
| | | | $ 907,799 |
| Construction & Engineering — 0.4% |
| Bouygues SA | | 24,893 | $ 917,439 |
| | | | $ 917,439 |
| Consumer Finance — 0.4% |
| Discover Financial Services | | 7,117 | $ 901,937 |
| | | | $ 901,937 |
| Consumer Staples Distribution & Retail — 0.7% |
| Carrefour SA | | 51,156 | $ 860,609 |
| Dollar Tree, Inc.(1) | | 7,933 | 938,077 |
| | | | $ 1,798,686 |
| Diversified Telecommunication Services — 0.4% |
| Deutsche Telekom AG | | 19,060 | $ 436,580 |
| Zegona Communications PLC(1) | | 181,045 | 518,223 |
| | | | $ 954,803 |
| Electric Utilities — 0.7% |
| Iberdrola SA | | 85,006 | $ 1,042,308 |
| NextEra Energy, Inc. | | 11,961 | 801,028 |
| | | | $ 1,843,336 |
| Electrical Equipment — 1.5% |
| AMETEK, Inc. | | 7,135 | $ 1,246,199 |
| Schneider Electric SE | | 11,295 | 2,575,411 |
| | | | $ 3,821,610 |
| Electronic Equipment, Instruments & Components — 1.6% |
| CDW Corp. | | 7,997 | $ 1,934,154 |
6
See Notes to Financial Statements.
Eaton Vance
Global Income Builder Fund
April 30, 2024
Portfolio of Investments (Unaudited) — continued
| Security | Shares | Value |
| Electronic Equipment, Instruments & Components (continued) |
| Halma PLC | | 38,350 | $ 1,051,052 |
| Keyence Corp. | | 2,254 | 991,241 |
| | | | $ 3,976,447 |
| Entertainment — 0.7% |
| Walt Disney Co. | | 16,690 | $ 1,854,259 |
| | | | $ 1,854,259 |
| Financial Services — 0.8% |
| Fidelity National Information Services, Inc. | | 9,554 | $ 648,908 |
| Visa, Inc., Class A | | 5,435 | 1,459,895 |
| | | | $ 2,108,803 |
| Food Products — 0.8% |
| Nestle SA | | 19,395 | $ 1,947,261 |
| | | | $ 1,947,261 |
| Ground Transportation — 0.3% |
| Union Pacific Corp. | | 3,127 | $ 741,599 |
| | | | $ 741,599 |
| Health Care Equipment & Supplies — 2.3% |
| Alcon, Inc. | | 8,626 | $ 661,414 |
| Boston Scientific Corp.(1) | | 34,158 | 2,454,935 |
| Coloplast AS, Class B | | 6,362 | 767,035 |
| Intuitive Surgical, Inc.(1) | | 3,338 | 1,237,130 |
| Straumann Holding AG | | 4,806 | 638,898 |
| | | | $ 5,759,412 |
| Health Care Providers & Services — 0.3% |
| Elevance Health, Inc. | | 295 | $ 155,931 |
| UnitedHealth Group, Inc. | | 1,371 | 663,153 |
| | | | $ 819,084 |
| Health Care REITs — 0.3% |
| Healthpeak Properties, Inc. | | 45,832 | $ 852,934 |
| | | | $ 852,934 |
| Healthcare-Services — 0.0%(2) |
| Endo, Inc.(1) | | 3,591 | $ 102,801 |
| Endo, Inc.(1)(3) | | 54 | 1,546 |
| | | | $ 104,347 |
| Hotels, Restaurants & Leisure — 1.8% |
| Amadeus IT Group SA | | 19,804 | $ 1,257,038 |
| Security | Shares | Value |
| Hotels, Restaurants & Leisure (continued) |
| Compass Group PLC | | 80,468 | $ 2,238,113 |
| InterContinental Hotels Group PLC | | 11,108 | 1,083,407 |
| | | | $ 4,578,558 |
| Household Products — 0.4% |
| Reckitt Benckiser Group PLC | | 17,390 | $ 972,223 |
| | | | $ 972,223 |
| Industrial Conglomerates — 0.8% |
| Siemens AG | | 10,463 | $ 1,960,070 |
| | | | $ 1,960,070 |
| Insurance — 3.7% |
| AIA Group Ltd. | | 131,714 | $ 964,720 |
| Allianz SE | | 2,750 | 780,409 |
| Allstate Corp. | | 4,925 | 837,546 |
| Assicurazioni Generali SpA | | 29,326 | 715,039 |
| Assurant, Inc. | | 3,878 | 676,323 |
| AXA SA | | 22,734 | 785,496 |
| Baloise Holding AG | | 3,025 | 457,116 |
| NN Group NV | | 9,400 | 433,630 |
| RenaissanceRe Holdings Ltd. | | 3,625 | 794,781 |
| SCOR SE | | 12,454 | 406,346 |
| Swiss Life Holding AG | | 1,199 | 809,032 |
| Swiss Re AG | | 15,949 | 1,733,742 |
| | | | $ 9,394,180 |
| Interactive Media & Services — 2.5% |
| Alphabet, Inc., Class C(1)(4) | | 39,100 | $ 6,437,424 |
| | | | $ 6,437,424 |
| IT Services — 0.4% |
| Accenture PLC, Class A | | 3,051 | $ 918,076 |
| | | | $ 918,076 |
| Life Sciences Tools & Services — 0.7% |
| Danaher Corp. | | 4,595 | $ 1,133,219 |
| Sartorius AG, PFC Shares | | 2,252 | 673,249 |
| | | | $ 1,806,468 |
| Machinery — 1.1% |
| Ingersoll Rand, Inc. | | 23,086 | $ 2,154,385 |
| Parker-Hannifin Corp. | | 1,179 | 642,449 |
| | | | $ 2,796,834 |
7
See Notes to Financial Statements.
Eaton Vance
Global Income Builder Fund
April 30, 2024
Portfolio of Investments (Unaudited) — continued
| Security | Shares | Value |
| Metals & Mining — 1.4% |
| Anglo American PLC | | 16,157 | $ 527,970 |
| Rio Tinto Ltd. | | 11,311 | 941,350 |
| Rio Tinto PLC | | 21,374 | 1,446,180 |
| SSAB AB, Class B | | 130,380 | 729,549 |
| | | | $ 3,645,049 |
| Multi-Utilities — 0.9% |
| A2A SpA | | 317,081 | $ 625,332 |
| CMS Energy Corp. | | 5,813 | 352,326 |
| Engie SA(1) | | 73,751 | 1,280,362 |
| | | | $ 2,258,020 |
| Oil, Gas & Consumable Fuels — 2.7% |
| Chevron Corp. | | 5,714 | $ 921,497 |
| ConocoPhillips | | 14,513 | 1,823,123 |
| EOG Resources, Inc. | | 30,347 | 4,009,749 |
| Phillips 66 | | 862 | 123,447 |
| | | | $ 6,877,816 |
| Pharmaceuticals — 6.7% |
| AstraZeneca PLC | | 14,916 | $ 2,256,028 |
| Eli Lilly & Co. | | 7,625 | 5,955,888 |
| Novo Nordisk AS, Class B | | 40,266 | 5,163,800 |
| Sanofi SA | | 21,304 | 2,104,687 |
| Zoetis, Inc. | | 9,931 | 1,581,413 |
| | | | $ 17,061,816 |
| Professional Services — 1.7% |
| Adecco Group AG | | 34,950 | $ 1,222,637 |
| Randstad NV | | 5,629 | 282,300 |
| Recruit Holdings Co. Ltd. | | 23,232 | 1,000,541 |
| RELX PLC | | 25,806 | 1,060,288 |
| Verisk Analytics, Inc. | | 2,897 | 631,430 |
| | | | $ 4,197,196 |
| Semiconductors & Semiconductor Equipment — 4.9% |
| ASML Holding NV | | 4,067 | $ 3,542,409 |
| Infineon Technologies AG | | 47,626 | 1,652,767 |
| Micron Technology, Inc. | | 16,320 | 1,843,507 |
| NVIDIA Corp. | | 3,807 | 3,289,324 |
| Taiwan Semiconductor Manufacturing Co. Ltd. ADR | | 14,193 | 1,949,267 |
| | | | $ 12,277,274 |
| Software — 4.2% |
| Adobe, Inc.(1) | | 2,859 | $ 1,323,231 |
| Security | Shares | Value |
| Software (continued) |
| Intuit, Inc. | | 2,868 | $ 1,794,278 |
| Microsoft Corp.(4) | | 19,085 | 7,430,363 |
| | | | $ 10,547,872 |
| Specialty Retail — 1.3% |
| Lowe's Cos., Inc. | | 6,798 | $ 1,549,876 |
| TJX Cos., Inc. | | 17,590 | 1,655,043 |
| | | | $ 3,204,919 |
| Technology Hardware, Storage & Peripherals — 1.4% |
| Apple, Inc. | | 20,514 | $ 3,494,150 |
| | | | $ 3,494,150 |
| Textiles, Apparel & Luxury Goods — 0.5% |
| LVMH Moet Hennessy Louis Vuitton SE | | 1,613 | $ 1,324,976 |
| | | | $ 1,324,976 |
| Trading Companies & Distributors — 1.2% |
| Ashtead Group PLC | | 12,913 | $ 937,637 |
| IMCD NV(1) | | 9,785 | 1,476,308 |
| Rexel SA | | 25,793 | 668,551 |
| | | | $ 3,082,496 |
Total Common Stocks
(identified cost $96,911,025) | | | $153,557,369 |
| Security | Principal
Amount
(000's omitted)* | Value |
| Electric Utilities — 0.1% |
| NextEra Energy Partners LP, 2.50%, 6/15/26(5) | | 236 | $ 212,923 |
| | | | $ 212,923 |
| Leisure Products — 0.1% |
| Peloton Interactive, Inc., 0.00%, 2/15/26 | | 246 | $ 202,029 |
| | | | $ 202,029 |
| Semiconductors & Semiconductor Equipment — 0.1% |
| ams-OSRAM AG, 0.00%, 3/5/25(6) | EUR | 200 | $ 202,558 |
| | | | $ 202,558 |
8
See Notes to Financial Statements.
Eaton Vance
Global Income Builder Fund
April 30, 2024
Portfolio of Investments (Unaudited) — continued
| Security | Principal
Amount
(000's omitted)* | Value |
| Transportation — 0.1% |
| CryoPort, Inc., 0.75%, 12/1/26(5) | | 364 | $ 315,661 |
| | | | $ 315,661 |
Total Convertible Bonds
(identified cost $959,264) | | | $ 933,171 |
| Security | Principal
Amount
(000's omitted)* | Value |
| Advertising — 0.1% |
| Stagwell Global LLC, 5.625%, 8/15/29(5) | | 190 | $ 170,293 |
| | | | $ 170,293 |
| Aerospace & Defense — 0.7% |
| Bombardier, Inc.: | | | |
| 7.25%, 7/1/31(5) | | 158 | $ 158,586 |
| 8.75%, 11/15/30(5) | | 135 | 143,794 |
| Moog, Inc., 4.25%, 12/15/27(5) | | 170 | 158,866 |
| Rolls-Royce PLC, 5.75%, 10/15/27(5) | | 492 | 487,076 |
| Spirit AeroSystems, Inc.: | | | |
| 4.60%, 6/15/28 | | 69 | 63,653 |
| 9.375%, 11/30/29(5) | | 26 | 28,152 |
| TransDigm, Inc.: | | | |
| 4.625%, 1/15/29 | | 335 | 307,213 |
| 5.50%, 11/15/27 | | 106 | 103,102 |
| 6.375%, 3/1/29(5) | | 80 | 79,489 |
| 6.625%, 3/1/32(5) | | 80 | 79,964 |
| 6.75%, 8/15/28(5) | | 221 | 222,215 |
| | | | $ 1,832,110 |
| Auto Components — 0.0%(2) |
| Forvia SE, 3.75%, 6/15/28(6) | EUR | 100 | $ 103,615 |
| | | | $ 103,615 |
| Automobile Components — 0.5% |
| Clarios Global LP/Clarios U.S. Finance Co.: | | | |
| 4.375%, 5/15/26(6) | EUR | 378 | $ 400,193 |
| 8.50%, 5/15/27(5) | | 194 | 194,619 |
| IHO Verwaltungs GmbH: | | | |
| 6.375%, (6.375% cash or 7.125% PIK), 5/15/29(5)(7) | | 200 | 196,816 |
| 8.75%, (8.75% cash or 9.50% PIK), 5/15/28(6)(7) | EUR | 100 | 114,924 |
| Real Hero Merger Sub 2, Inc., 6.25%, 2/1/29(5) | | 252 | 216,171 |
| Security | Principal
Amount
(000's omitted)* | Value |
| Automobile Components (continued) |
| TI Automotive Finance PLC, 3.75%, 4/15/29(6) | EUR | 200 | $ 197,380 |
| Wheel Pros, Inc., 6.50%, 5/15/29(5) | | 174 | 54,158 |
| | | | $ 1,374,261 |
| Automobiles — 0.3% |
| Ford Motor Co.: | | | |
| 4.75%, 1/15/43 | | 197 | $ 155,199 |
| 9.625%, 4/22/30 | | 26 | 29,882 |
| Ford Motor Credit Co. LLC, 4.125%, 8/17/27 | | 555 | 521,432 |
| | | | $ 706,513 |
| Automotives — 0.2% |
| Dornoch Debt Merger Sub, Inc., 6.625%, 10/15/29(5) | | 213 | $ 176,179 |
| Goodyear Tire & Rubber Co., 5.00%, 7/15/29 | | 228 | 207,017 |
| | | | $ 383,196 |
| Banks — 1.7% |
| Banco Mercantil del Norte SA/Grand Cayman, 7.625% to 1/10/28(5)(8)(9) | | 200 | $ 195,154 |
| Banco Santander SA, 9.625% to 5/21/33(8)(9) | | 200 | 214,018 |
| Bank of America Corp., Series TT, 6.125% to 4/27/27(8)(9) | | 89 | 88,170 |
| Bank of Montreal, 7.70% to 5/26/29, 5/26/84(9) | | 200 | 200,148 |
| Bank of Nova Scotia, 8.625% to 10/27/27, 10/27/82(9) | | 200 | 206,408 |
| Barclays PLC, 8.00% to 3/15/29(8)(9) | | 200 | 197,171 |
| BNP Paribas SA, 7.75% to 8/16/29(5)(8)(9) | | 200 | 202,183 |
| Citigroup, Inc., Series W, 4.00% to 12/10/25(8)(9) | | 301 | 288,142 |
| Farm Credit Bank of Texas, Series 3, 6.20% to 6/15/28(5)(8)(9) | | 220 | 202,288 |
| HSBC Holdings PLC, 4.60% to 12/17/30(8)(9) | | 200 | 165,071 |
| Huntington Bancshares, Inc., Series F, 5.625% to 7/15/30(8)(9) | | 125 | 112,265 |
| ING Groep NV, 6.50% to 4/16/25(8)(9) | | 200 | 197,455 |
| JPMorgan Chase & Co., Series KK, 3.65% to 6/1/26(8)(9) | | 251 | 235,461 |
| Lloyds Banking Group PLC, 7.50% to 9/27/25(8)(9) | | 200 | 198,480 |
| PNC Financial Services Group, Inc., Series V, 6.20% to 9/15/27(8)(9) | | 100 | 98,280 |
| Regions Financial Corp., Series D, 5.75% to 6/15/25(8)(9) | | 75 | 73,699 |
| Royal Bank of Canada, 7.50% to 5/2/29, 5/2/84(9) | | 200 | 200,727 |
| Societe Generale SA, 5.375% to 11/18/30(5)(8)(9) | | 200 | 162,270 |
| Sumitomo Mitsui Financial Group, Inc., 6.60% to 6/5/34(8)(9) | | 200 | 192,829 |
| Toronto-Dominion Bank, 8.125% to 10/31/27, 10/31/82(9) | | 200 | 206,160 |
| Truist Financial Corp., Series Q, 5.10% to 3/1/30(8)(9) | | 174 | 158,056 |
| UBS Group AG, 4.375% to 2/10/31(5)(8)(9) | | 200 | 160,230 |
9
See Notes to Financial Statements.
Eaton Vance
Global Income Builder Fund
April 30, 2024
Portfolio of Investments (Unaudited) — continued
| Security | Principal
Amount
(000's omitted)* | Value |
| Banks (continued) |
| UniCredit SpA, 7.296% to 4/2/29, 4/2/34(5)(9) | | 200 | $ 201,768 |
| Wells Fargo & Co., Series BB, 3.90% to 3/15/26(8)(9) | | 267 | 253,413 |
| | | | $ 4,409,846 |
| Beverages — 0.1% |
| Triton Water Holdings, Inc., 6.25%, 4/1/29(5) | | 256 | $ 229,819 |
| | | | $ 229,819 |
| Biotechnology — 0.1% |
| Grifols SA: | | | |
| 3.20%, 5/1/25(6) | EUR | 100 | $ 106,437 |
| 3.875%, 10/15/28(6) | EUR | 100 | 84,772 |
| | | | $ 191,209 |
| Building Products — 0.7% |
| Builders FirstSource, Inc.: | | | |
| 4.25%, 2/1/32(5) | | 249 | $ 217,086 |
| 5.00%, 3/1/30(5) | | 90 | 84,349 |
| CP Atlas Buyer, Inc., 7.00%, 12/1/28(5) | | 335 | 302,192 |
| EMRLD Borrower LP/Emerald Co-Issuer, Inc., 6.625%, 12/15/30(5) | | 215 | 213,342 |
| Standard Industries, Inc.: | | | |
| 3.375%, 1/15/31(5) | | 90 | 73,805 |
| 4.375%, 7/15/30(5) | | 275 | 243,779 |
| Summit Materials LLC/Summit Materials Finance Corp., 7.25%, 1/15/31(5) | | 207 | 212,808 |
| WASH Multifamily Acquisition, Inc., 5.75%, 4/15/26(5) | | 346 | 335,800 |
| | | | $ 1,683,161 |
| Capital Markets — 0.1% |
| Charles Schwab Corp., Series I, 4.00% to 6/1/26(8)(9) | | 259 | $ 238,958 |
| | | | $ 238,958 |
| Casino & Gaming — 0.1% |
| Cinemark USA, Inc., 5.875%, 3/15/26(5) | | 67 | $ 66,372 |
| Speedway Motorsports LLC/Speedway Funding II, Inc., 4.875%, 11/1/27(5) | | 250 | 235,567 |
| | | | $ 301,939 |
| Chemicals — 0.7% |
| Avient Corp., 7.125%, 8/1/30(5) | | 102 | $ 103,292 |
| Herens Holdco SARL, 4.75%, 5/15/28(5) | | 201 | 173,733 |
| Herens Midco SARL, 5.25%, 5/15/29(6) | EUR | 200 | 153,280 |
| INEOS Finance PLC, 6.375%, 4/15/29(6) | EUR | 100 | 107,587 |
| Italmatch Chemicals SpA, 10.00%, 2/6/28(6) | EUR | 250 | 281,041 |
| Security | Principal
Amount
(000's omitted)* | Value |
| Chemicals (continued) |
| NOVA Chemicals Corp., 4.25%, 5/15/29(5) | | 12 | $ 10,056 |
| Nufarm Australia Ltd./Nufarm Americas, Inc., 5.00%, 1/27/30(5) | | 236 | 216,593 |
| Olympus Water U.S. Holding Corp.: | | | |
| 9.625%, 11/15/28(6) | EUR | 100 | 113,913 |
| 9.75%, 11/15/28(5) | | 399 | 423,885 |
| Valvoline, Inc., 3.625%, 6/15/31(5) | | 199 | 167,576 |
| | | | $ 1,750,956 |
| Commercial Services & Supplies — 2.1% |
| Adtalem Global Education, Inc., 5.50%, 3/1/28(5) | | 290 | $ 275,065 |
| Allied Universal Holdco LLC/Allied Universal Finance Corp./Atlas Luxco 4 SARL, 4.625%, 6/1/28(5) | | 200 | 179,621 |
| AMN Healthcare, Inc., 4.625%, 10/1/27(5) | | 19 | 17,868 |
| APi Group DE, Inc., 4.75%, 10/15/29(5) | | 55 | 50,230 |
| Boels Topholding BV, 5.75%, 5/15/30(6)(10) | EUR | 450 | 481,775 |
| Clean Harbors, Inc.: | | | |
| 4.875%, 7/15/27(5) | | 101 | 97,377 |
| 6.375%, 2/1/31(5) | | 38 | 37,682 |
| Covanta Holding Corp., 4.875%, 12/1/29(5) | | 430 | 377,379 |
| Gartner, Inc., 3.75%, 10/1/30(5) | | 187 | 162,923 |
| GFL Environmental, Inc.: | | | |
| 3.50%, 9/1/28(5) | | 265 | 238,497 |
| 3.75%, 8/1/25(5) | | 130 | 126,555 |
| 4.75%, 6/15/29(5) | | 343 | 316,803 |
| HealthEquity, Inc., 4.50%, 10/1/29(5) | | 212 | 193,360 |
| Hertz Corp.: | | | |
| 4.625%, 12/1/26(5) | | 29 | 22,492 |
| 5.00%, 12/1/29(5) | | 149 | 102,460 |
| IPD 3 BV, 8.00%, 6/15/28(6) | EUR | 200 | 226,636 |
| Korn Ferry, 4.625%, 12/15/27(5) | | 233 | 221,148 |
| Madison IAQ LLC, 5.875%, 6/30/29(5) | | 323 | 299,928 |
| Mavis Tire Express Services Topco Corp., 6.50%, 5/15/29(5) | | 439 | 407,129 |
| Neptune Bidco U.S., Inc., 9.29%, 4/15/29(5) | | 180 | 170,069 |
| NESCO Holdings II, Inc., 5.50%, 4/15/29(5) | | 206 | 191,979 |
| Paprec Holding SA, 7.25%, 11/17/29(6) | EUR | 180 | 204,977 |
| Team Health Holdings, Inc., 6.375%, 2/1/25(5) | | 235 | 218,771 |
| VT Topco, Inc., 8.50%, 8/15/30(5) | | 402 | 416,409 |
| Wand NewCo 3, Inc., 7.625%, 1/30/32(5) | | 256 | 260,466 |
| | | | $ 5,297,599 |
| Construction & Engineering — 0.1% |
| TopBuild Corp., 4.125%, 2/15/32(5) | | 201 | $ 174,204 |
| | | | $ 174,204 |
10
See Notes to Financial Statements.
Eaton Vance
Global Income Builder Fund
April 30, 2024
Portfolio of Investments (Unaudited) — continued
| Security | Principal
Amount
(000's omitted)* | Value |
| Construction Materials — 0.2% |
| Smyrna Ready Mix Concrete LLC, 6.00%, 11/1/28(5) | | 454 | $ 439,606 |
| | | | $ 439,606 |
| Consumer Finance — 0.2% |
| CPUK Finance Ltd., 4.875%, 2/28/47(6) | GBP | 278 | $ 341,661 |
| PRA Group, Inc., 7.375%, 9/1/25(5) | | 73 | 72,727 |
| | | | $ 414,388 |
| Containers & Packaging — 0.5% |
| Ardagh Metal Packaging Finance USA LLC/Ardagh Metal Packaging Finance PLC, 3.00%, 9/1/29(6) | EUR | 300 | $ 258,225 |
| Ball Corp., 6.875%, 3/15/28 | | 59 | 59,988 |
| Berry Global, Inc., 5.625%, 7/15/27(5) | | 117 | 114,228 |
| Canpack SA/Canpack U.S. LLC, 3.875%, 11/15/29(5) | | 312 | 273,729 |
| Fiber Bidco SpA, 7.908%, (3 mo. EURIBOR + 4.00%), 1/15/30(6)(11) | EUR | 310 | 333,213 |
| Kleopatra Finco SARL, 4.25%, 3/1/26(6) | EUR | 229 | 203,845 |
| | | | $ 1,243,228 |
| Cosmetics/Personal Care — 0.0%(2) |
| Edgewell Personal Care Co., 4.125%, 4/1/29(5) | | 74 | $ 66,967 |
| | | | $ 66,967 |
| Distributors — 0.6% |
| BCPE Empire Holdings, Inc., 7.625%, 5/1/27(5) | | 270 | $ 263,038 |
| Performance Food Group, Inc.: | | | |
| 4.25%, 8/1/29(5) | | 315 | 282,567 |
| 5.50%, 10/15/27(5) | | 169 | 163,745 |
| Rexel SA, 5.25%, 9/15/30(6) | EUR | 400 | 440,784 |
| Ritchie Bros Holdings, Inc.: | | | |
| 6.75%, 3/15/28(5) | | 147 | 148,573 |
| 7.75%, 3/15/31(5) | | 56 | 58,149 |
| Windsor Holdings III LLC, 8.50%, 6/15/30(5) | | 252 | 262,779 |
| | | | $ 1,619,635 |
| Diversified Consumer Services — 0.3% |
| GEMS MENASA Cayman Ltd./GEMS Education Delaware LLC, 7.125%, 7/31/26(6) | | 750 | $ 745,956 |
| | | | $ 745,956 |
| Diversified Financial Services — 0.4% |
| Air Lease Corp., Series B, 4.65% to 6/15/26(8)(9) | | 100 | $ 94,503 |
| Ally Financial, Inc., 6.70%, 2/14/33 | | 40 | 39,262 |
| Alpha Holding SA de CV, 9.00%, 2/10/25(5)(12) | | 189 | 2,828 |
| Security | Principal
Amount
(000's omitted)* | Value |
| Diversified Financial Services (continued) |
| American AgCredit Corp., Series A, 5.25% to 6/15/26(5)(8)(9) | | 250 | $ 235,000 |
| Goldman Sachs Group, Inc., Series W, 7.50% to 2/10/29(8)(9) | | 125 | 129,672 |
| Macquarie Airfinance Holdings Ltd.: | | | |
| 6.40%, 3/26/29(5) | | 55 | 54,896 |
| 6.50%, 3/26/31(5) | | 72 | 72,121 |
| 8.125%, 3/30/29(5) | | 242 | 253,321 |
| | | | $ 881,603 |
| Diversified REITs — 0.2% |
| CTR Partnership LP/CareTrust Capital Corp., 3.875%, 6/30/28(5) | | 250 | $ 226,546 |
| HAT Holdings I LLC/HAT Holdings II LLC, 3.375%, 6/15/26(5) | | 327 | 304,283 |
| | | | $ 530,829 |
| Diversified Telecommunication Services — 0.2% |
| Level 3 Financing, Inc., 4.50%, 4/1/30(5) | | 324 | $ 186,906 |
| Lorca Telecom Bondco SA, 4.00%, 9/18/27(6) | EUR | 400 | 417,072 |
| | | | $ 603,978 |
| Electric Utilities — 1.1% |
| Dominion Energy, Inc., Series C, 4.35% to 1/15/27(8)(9) | | 93 | $ 85,620 |
| Electricite de France SA, 7.50% to 9/6/28(6)(8)(9) | EUR | 200 | 233,285 |
| Enviva Partners LP/Enviva Partners Finance Corp., 6.50%, 1/15/26(5)(12) | | 435 | 189,795 |
| EquipmentShare.com, Inc., 8.625%, 5/15/32(5) | | 178 | 181,323 |
| Imola Merger Corp., 4.75%, 5/15/29(5) | | 378 | 348,373 |
| NextEra Energy Operating Partners LP, 4.50%, 9/15/27(5) | | 90 | 83,947 |
| NRG Energy, Inc.: | | | |
| 3.625%, 2/15/31(5) | | 177 | 150,018 |
| 3.875%, 2/15/32(5) | | 95 | 80,129 |
| Pattern Energy Operations LP/Pattern Energy Operations, Inc., 4.50%, 8/15/28(5) | | 152 | 136,076 |
| Sempra, 4.125% to 1/1/27, 4/1/52(9) | | 167 | 151,848 |
| Southern California Edison Co., Series E, 9.787%, (3 mo. SOFR + 4.461%)(8)(11) | | 101 | 101,472 |
| Southern Co.: | | | |
| Series 21-A, 3.75% to 6/15/26, 9/15/51(9) | | 120 | 110,141 |
| Series B, 4.00% to 10/15/25, 1/15/51(9) | | 56 | 53,492 |
| TerraForm Power Operating LLC, 5.00%, 1/31/28(5) | | 237 | 221,385 |
| TransAlta Corp., 7.75%, 11/15/29 | | 166 | 170,075 |
| Vistra Operations Co. LLC: | | | |
| 4.375%, 5/1/29(5) | | 173 | 157,676 |
| 5.00%, 7/31/27(5) | | 232 | 221,002 |
11
See Notes to Financial Statements.
Eaton Vance
Global Income Builder Fund
April 30, 2024
Portfolio of Investments (Unaudited) — continued
| Security | Principal
Amount
(000's omitted)* | Value |
| Electric Utilities (continued) |
| Vistra Operations Co. LLC: (continued) | | | |
| 6.875%, 4/15/32(5) | | 175 | $ 174,390 |
| | | | $ 2,850,047 |
| Electrical Equipment — 0.1% |
| Sensata Technologies, Inc., 4.375%, 2/15/30(5) | | 150 | $ 134,458 |
| | | | $ 134,458 |
| Electronic Equipment, Instruments & Components — 0.2% |
| Energizer Gamma Acquisition BV, 3.50%, 6/30/29(6) | EUR | 117 | $ 111,805 |
| Sensata Technologies BV, 5.00%, 10/1/25(5) | | 57 | 56,318 |
| WESCO Distribution, Inc.: | | | |
| 6.375%, 3/15/29(5) | | 102 | 101,454 |
| 6.625%, 3/15/32(5) | | 102 | 101,650 |
| 7.25%, 6/15/28(5) | | 153 | 155,567 |
| | | | $ 526,794 |
| Entertainment — 1.5% |
| Allwyn Entertainment Financing U.K. PLC, 7.25%, 4/30/30(6) | EUR | 400 | $ 445,823 |
| Boyne USA, Inc., 4.75%, 5/15/29(5) | | 218 | 198,509 |
| Caesars Entertainment, Inc.: | | | |
| 6.50%, 2/15/32(5) | | 126 | 124,227 |
| 7.00%, 2/15/30(5) | | 100 | 100,765 |
| 8.125%, 7/1/27(5) | | 56 | 56,796 |
| Churchill Downs, Inc., 5.75%, 4/1/30(5) | | 233 | 221,874 |
| Cinemark USA, Inc., 5.25%, 7/15/28(5) | | 206 | 191,504 |
| Cirsa Finance International SARL, 6.50%, 3/15/29(6) | EUR | 375 | 408,859 |
| Flutter Treasury DAC, 5.00%, 4/29/29(6) | EUR | 250 | 270,862 |
| Inter Media & Communication SpA, 6.75%, 2/9/27(6) | EUR | 200 | 210,493 |
| Jacobs Entertainment, Inc., 6.75%, 2/15/29(5) | | 278 | 264,145 |
| LHMC Finco 2 SARL, 7.25%, (7.25% cash or 8.00% PIK), 10/2/25(6)(7) | EUR | 341 | 364,801 |
| Light & Wonder International, Inc., 7.00%, 5/15/28(5) | | 216 | 216,908 |
| Lottomatica SpA, 7.942%, (3 mo. EURIBOR + 4.00%), 12/15/30(6)(11) | EUR | 355 | 383,829 |
| Resorts World Las Vegas LLC/RWLV Capital, Inc., 8.45%, 7/27/30(5) | | 200 | 209,671 |
| | | | $ 3,669,066 |
| Financial Services — 1.2% |
| AG TTMT Escrow Issuer LLC, 8.625%, 9/30/27(5) | | 111 | $ 114,450 |
| Allied Universal Holdco LLC/Allied Universal Finance Corp.: | | | |
| 6.625%, 7/15/26(5) | | 88 | 87,857 |
| Security | Principal
Amount
(000's omitted)* | Value |
| Financial Services (continued) |
| Allied Universal Holdco LLC/Allied Universal Finance Corp.: (continued) | | | |
| 9.75%, 7/15/27(5) | | 203 | $ 202,451 |
| Ally Financial, Inc., Series B, 4.70% to 5/15/26(8)(9) | | 320 | 272,655 |
| Boost Newco Borrower LLC/GTCR W Dutch Finance Sub BV, 8.50%, 1/15/31(6) | GBP | 200 | 266,998 |
| Compass Group Diversified Holdings LLC, 5.25%, 4/15/29(5) | | 274 | 256,406 |
| Encore Capital Group, Inc., 5.375%, 2/15/26(6) | GBP | 180 | 218,996 |
| Jane Street Group/JSG Finance, Inc., 4.50%, 11/15/29(5) | | 315 | 286,763 |
| Jefferson Capital Holdings LLC, 6.00%, 8/15/26(5) | | 320 | 314,867 |
| Rocket Mortgage LLC/Rocket Mortgage Co-Issuer, Inc.: | | | |
| 2.875%, 10/15/26(5) | | 156 | 143,360 |
| 3.625%, 3/1/29(5) | | 259 | 228,423 |
| 4.00%, 10/15/33(5) | | 30 | 24,519 |
| Sherwood Financing PLC, 6.00%, 11/15/26(6) | GBP | 420 | 431,618 |
| VistaJet Malta Finance PLC/Vista Management Holding, Inc., 6.375%, 2/1/30(5) | | 348 | 269,781 |
| | | | $ 3,119,144 |
| Food Products — 0.7% |
| Albertsons Cos., Inc./Safeway, Inc./New Albertsons LP/Albertsons LLC, 5.875%, 2/15/28(5) | | 181 | $ 177,527 |
| Bellis Acquisition Co. PLC, 4.50%, 2/16/26(6) | GBP | 100 | 124,655 |
| Chobani LLC/Chobani Finance Corp., Inc.: | | | |
| 4.625%, 11/15/28(5) | | 160 | 148,268 |
| 7.625%, 7/1/29(5) | | 211 | 213,495 |
| Darling Ingredients, Inc., 6.00%, 6/15/30(5) | | 177 | 172,056 |
| Fiesta Purchaser, Inc., 7.875%, 3/1/31(5) | | 98 | 99,937 |
| Ingles Markets, Inc., 4.00%, 6/15/31(5) | | 249 | 214,569 |
| Land O' Lakes, Inc., 8.00%(5)(8) | | 235 | 205,625 |
| Pilgrim's Pride Corp.: | | | |
| 3.50%, 3/1/32 | | 252 | 207,699 |
| 6.875%, 5/15/34 | | 90 | 93,405 |
| Post Holdings, Inc., 6.25%, 2/15/32(5) | | 141 | 139,293 |
| | | | $ 1,796,529 |
| Health Care Equipment & Supplies — 1.2% |
| Catalent Pharma Solutions, Inc., 2.375%, 3/1/28(6) | EUR | 205 | $ 208,068 |
| Compass Minerals International, Inc., 6.75%, 12/1/27(5) | | 290 | 272,292 |
| LifePoint Health, Inc.: | | | |
| 5.375%, 1/15/29(5) | | 200 | 160,110 |
| 9.875%, 8/15/30(5) | | 105 | 109,468 |
| Medline Borrower LP, 5.25%, 10/1/29(5) | | 603 | 561,896 |
| ModivCare Escrow Issuer, Inc., 5.00%, 10/1/29(5) | | 122 | 84,873 |
12
See Notes to Financial Statements.
Eaton Vance
Global Income Builder Fund
April 30, 2024
Portfolio of Investments (Unaudited) — continued
| Security | Principal
Amount
(000's omitted)* | Value |
| Health Care Equipment & Supplies (continued) |
| Molina Healthcare, Inc.: | | | |
| 3.875%, 11/15/30(5) | | 245 | $ 212,728 |
| 3.875%, 5/15/32(5) | | 189 | 158,306 |
| RegionalCare Hospital Partners Holdings, Inc./LifePoint Health, Inc., 9.75%, 12/1/26(5) | | 240 | 239,203 |
| Tenet Healthcare Corp.: | | | |
| 4.375%, 1/15/30 | | 17 | 15,452 |
| 5.125%, 11/1/27 | | 138 | 133,631 |
| 6.875%, 11/15/31 | | 133 | 137,200 |
| U.S. Acute Care Solutions LLC: | | | |
| 6.375%, 3/1/26(5) | | 355 | 359,798 |
| 9.75%, 5/15/29(5)(10) | | 150 | 147,283 |
| Varex Imaging Corp., 7.875%, 10/15/27(5) | | 148 | 151,005 |
| | | | $ 2,951,313 |
| Health Care Providers & Services — 0.8% |
| AMN Healthcare, Inc., 4.00%, 4/15/29(5) | | 386 | $ 342,392 |
| Cerba Healthcare SACA, 3.50%, 5/31/28(6) | EUR | 500 | 437,616 |
| Ephios Subco 3 SARL, 7.875%, 1/31/31(6) | EUR | 305 | 334,675 |
| IQVIA, Inc., 2.875%, 6/15/28(6) | EUR | 150 | 151,426 |
| Legacy LifePoint Health LLC, 4.375%, 2/15/27(5) | | 173 | 162,186 |
| ModivCare, Inc., 5.875%, 11/15/25(5) | | 207 | 202,106 |
| Surgery Center Holdings, Inc., 7.25%, 4/15/32(5) | | 150 | 149,983 |
| Verisure Holding AB, 3.25%, 2/15/27(6) | EUR | 335 | 343,882 |
| | | | $ 2,124,266 |
| Healthcare-Services — 0.3% |
| AHP Health Partners, Inc., 5.75%, 7/15/29(5) | | 75 | $ 68,791 |
| Fortrea Holdings, Inc., 7.50%, 7/1/30(5) | | 234 | 236,334 |
| Heartland Dental LLC/Heartland Dental Finance Corp., 10.50%, 4/30/28(5) | | 374 | 394,144 |
| | | | $ 699,269 |
| Home Builders — 0.1% |
| Ashton Woods USA LLC/Ashton Woods Finance Co.: | | | |
| 4.625%, 8/1/29(5) | | 48 | $ 43,462 |
| 4.625%, 4/1/30(5) | | 92 | 82,307 |
| Meritage Homes Corp., 3.875%, 4/15/29(5) | | 95 | 86,213 |
| | | | $ 211,982 |
| Hotels, Restaurants & Leisure — 0.3% |
| 1011778 BC ULC/New Red Finance, Inc.: | | | |
| 3.875%, 1/15/28(5) | | 286 | $ 264,089 |
| 4.375%, 1/15/28(5) | | 182 | 169,428 |
| 5.75%, 4/15/25(5) | | 66 | 65,757 |
| Security | Principal
Amount
(000's omitted)* | Value |
| Hotels, Restaurants & Leisure (continued) |
| Lithia Motors, Inc., 4.625%, 12/15/27(5) | | 91 | $ 85,877 |
| Viking Cruises Ltd., 5.875%, 9/15/27(5) | | 279 | 270,728 |
| | | | $ 855,879 |
| Household Products — 0.2% |
| Kronos Acquisition Holdings, Inc./KIK Custom Products, Inc., 7.00%, 12/31/27(5) | | 214 | $ 207,217 |
| Spectrum Brands, Inc., 3.875%, 3/15/31(5) | | 136 | 127,389 |
| Tempur Sealy International, Inc., 3.875%, 10/15/31(5) | | 323 | 266,243 |
| | | | $ 600,849 |
| Housewares — 0.2% |
| ProGroup AG: | | | |
| 5.125%, 4/15/29(6) | EUR | 167 | $ 178,807 |
| 5.375%, 4/15/31(6) | EUR | 262 | 278,733 |
| | | | $ 457,540 |
| Independent Power and Renewable Electricity Producers — 0.2% |
| Algonquin Power & Utilities Corp., 4.75% to 1/18/27, 1/18/82(9) | | 113 | $ 98,117 |
| Calpine Corp.: | | | |
| 5.125%, 3/15/28(5) | | 179 | 169,953 |
| 5.25%, 6/1/26(5) | | 50 | 49,332 |
| NRG Energy, Inc., 10.25% to 3/15/28(5)(8)(9) | | 210 | 226,574 |
| | | | $ 543,976 |
| Industrial Conglomerates — 0.5% |
| Abertis Infraestructuras Finance BV, 3.248% to 11/24/25(6)(8)(9) | EUR | 200 | $ 207,783 |
| Artera Services LLC, 8.50%, 2/15/31(5) | | 160 | 163,846 |
| Brundage-Bone Concrete Pumping Holdings, Inc., 6.00%, 2/1/26(5) | | 162 | 159,608 |
| Gatwick Airport Finance PLC, 4.375%, 4/7/26(6) | GBP | 245 | 295,768 |
| Heathrow Finance PLC, 6.625%, 3/1/31(6) | GBP | 440 | 537,036 |
| | | | $ 1,364,041 |
| Insurance — 0.8% |
| Alliant Holdings Intermediate LLC/Alliant Holdings Co-Issuer: | | | |
| 6.75%, 10/15/27(5) | | 96 | $ 94,219 |
| 7.00%, 1/15/31(5) | | 173 | 173,663 |
| Allianz SE, 3.50% to 11/17/25(5)(8)(9) | | 200 | 183,005 |
| Corebridge Financial, Inc., 6.875% to 9/15/27, 12/15/52(9) | | 187 | 185,183 |
| Galaxy Finco Ltd., 9.25%, 7/31/27(6) | GBP | 300 | 361,104 |
13
See Notes to Financial Statements.
Eaton Vance
Global Income Builder Fund
April 30, 2024
Portfolio of Investments (Unaudited) — continued
| Security | Principal
Amount
(000's omitted)* | Value |
| Insurance (continued) |
| Howden U.K. Refinance PLC/Howden U.K. Refinance 2 PLC/Howden U.S. Refinance LLC, 7.25%, 2/15/31(5) | | 200 | $ 197,597 |
| Jones Deslauriers Insurance Management, Inc., 10.50%, 12/15/30(5) | | 243 | 257,448 |
| Liberty Mutual Group, Inc., 4.125% to 9/15/26, 12/15/51(5)(9) | | 216 | 197,123 |
| Panther Escrow Issuer LLC, 7.125%, 6/1/31(5) | | 135 | 135,786 |
| Prudential Financial, Inc., 5.125% to 11/28/31, 3/1/52(9) | | 60 | 55,448 |
| QBE Insurance Group Ltd., 5.875% to 5/12/25(5)(8)(9) | | 222 | 219,913 |
| | | | $ 2,060,489 |
| Internet — 0.1% |
| Cars.com, Inc., 6.375%, 11/1/28(5) | | 220 | $ 210,500 |
| | | | $ 210,500 |
| Internet & Direct Marketing Retail — 0.3% |
| Arches Buyer, Inc.: | | | |
| 4.25%, 6/1/28(5) | | 82 | $ 70,393 |
| 6.125%, 12/1/28(5) | | 282 | 229,624 |
| Match Group Holdings II LLC, 3.625%, 10/1/31(5) | | 273 | 225,649 |
| United Group BV: | | | |
| 6.75%, 2/15/31(6) | EUR | 125 | 137,169 |
| 8.134%, (3 mo. EURIBOR + 4.25%), 2/15/31(6)(11) | EUR | 200 | 214,107 |
| | | | $ 876,942 |
| Leisure Products — 0.8% |
| Acushnet Co., 7.375%, 10/15/28(5) | | 136 | $ 139,753 |
| Carnival Corp., 6.00%, 5/1/29(5) | | 90 | 87,270 |
| Life Time, Inc.: | | | |
| 5.75%, 1/15/26(5) | | 199 | 196,983 |
| 8.00%, 4/15/26(5) | | 278 | 278,710 |
| Lindblad Expeditions Holdings, Inc., 9.00%, 5/15/28(5) | | 91 | 95,269 |
| Lindblad Expeditions LLC, 6.75%, 2/15/27(5) | | 44 | 43,624 |
| NCL Corp. Ltd.: | | | |
| 5.875%, 3/15/26(5) | | 160 | 156,885 |
| 5.875%, 2/15/27(5) | | 67 | 65,499 |
| 7.75%, 2/15/29(5) | | 56 | 57,244 |
| NCL Finance Ltd., 6.125%, 3/15/28(5) | | 136 | 132,810 |
| Royal Caribbean Cruises Ltd.: | | | |
| 3.70%, 3/15/28 | | 70 | 64,374 |
| 6.25%, 3/15/32(5) | | 100 | 98,647 |
| TUI AG, 5.875%, 3/15/29(6) | EUR | 350 | 378,803 |
| Security | Principal
Amount
(000's omitted)* | Value |
| Leisure Products (continued) |
| Viking Cruises Ltd., 7.00%, 2/15/29(5) | | 104 | $ 103,691 |
| Viking Ocean Cruises Ship VII Ltd., 5.625%, 2/15/29(5) | | 66 | 63,211 |
| | | | $ 1,962,773 |
| Life Sciences Tools & Services — 0.1% |
| WR Grace Holdings LLC: | | | |
| 4.875%, 6/15/27(5) | | 124 | $ 117,847 |
| 7.375%, 3/1/31(5) | | 73 | 74,065 |
| | | | $ 191,912 |
| Machinery — 0.4% |
| Chart Industries, Inc., 9.50%, 1/1/31(5) | | 140 | $ 150,436 |
| ESAB Corp., 6.25%, 4/15/29(5) | | 134 | 133,665 |
| Husky Injection Molding Systems Ltd./Titan Co-Borrower LLC, 9.00%, 2/15/29(5) | | 70 | 72,142 |
| IMA Industria Macchine Automatiche SpA: | | | |
| 3.75%, 1/15/28(6) | EUR | 236 | 237,035 |
| 7.654%, (3 mo. EURIBOR + 3.75%), 4/15/29(6)(11) | EUR | 290 | 311,036 |
| TK Elevator Holdco GmbH, 6.625%, 7/15/28(6) | EUR | 90 | 91,708 |
| | | | $ 996,022 |
| Media — 1.9% |
| Altice Financing SA, 5.00%, 1/15/28(5) | | 280 | $ 221,286 |
| CCO Holdings LLC/CCO Holdings Capital Corp.: | | | |
| 4.25%, 2/1/31(5) | | 264 | 206,814 |
| 4.50%, 8/15/30(5) | | 343 | 278,993 |
| 4.75%, 3/1/30(5) | | 322 | 267,824 |
| 5.375%, 6/1/29(5) | | 110 | 96,967 |
| 6.375%, 9/1/29(5) | | 253 | 232,096 |
| Clear Channel Outdoor Holdings, Inc.: | | | |
| 7.75%, 4/15/28(5) | | 237 | 201,154 |
| 7.875%, 4/1/30(5) | | 148 | 145,218 |
| CSC Holdings LLC, 11.75%, 1/31/29(5) | | 200 | 177,810 |
| DISH Network Corp., 11.75%, 11/15/27(5) | | 160 | 161,424 |
| LCPR Senior Secured Financing DAC, 5.125%, 7/15/29(5) | | 200 | 167,236 |
| McGraw-Hill Education, Inc.: | | | |
| 5.75%, 8/1/28(5) | | 57 | 52,923 |
| 8.00%, 8/1/29(5) | | 212 | 194,919 |
| Outfront Media Capital LLC/Outfront Media Capital Corp.: | | | |
| 4.25%, 1/15/29(5) | | 145 | 129,208 |
| 4.625%, 3/15/30(5) | | 151 | 133,432 |
| 7.375%, 2/15/31(5) | | 176 | 180,767 |
| Summer (BC) Holdco A SARL, 9.25%, 10/31/27(6) | EUR | 129 | 132,023 |
14
See Notes to Financial Statements.
Eaton Vance
Global Income Builder Fund
April 30, 2024
Portfolio of Investments (Unaudited) — continued
| Security | Principal
Amount
(000's omitted)* | Value |
| Media (continued) |
| Summer (BC) Holdco B SARL, 5.75%, 10/31/26(6) | EUR | 300 | $ 315,038 |
| Summer BidCo BV, 10.00%, (10.00% cash or 10.75% PIK), 2/15/29(6)(7) | EUR | 100 | 107,944 |
| Townsquare Media, Inc., 6.875%, 2/1/26(5) | | 182 | 176,794 |
| Univision Communications, Inc.: | | | |
| 7.375%, 6/30/30(5) | | 86 | 82,417 |
| 8.00%, 8/15/28(5) | | 57 | 56,985 |
| Virgin Media Vendor Financing Notes III DAC, 4.875%, 7/15/28(6) | GBP | 810 | 906,013 |
| Ziggo Bond Co. BV, 5.125%, 2/28/30(5) | | 300 | 249,232 |
| | | | $ 4,874,517 |
| Metals & Mining — 1.2% |
| Allegheny Ludlum LLC, 6.95%, 12/15/25 | | 200 | $ 202,893 |
| Arsenal AIC Parent LLC, 11.50%, 10/1/31(5) | | 379 | 422,486 |
| BWX Technologies, Inc.: | | | |
| 4.125%, 6/30/28(5) | | 159 | 145,417 |
| 4.125%, 4/15/29(5) | | 118 | 107,625 |
| Calderys Financing LLC, 11.25%, 6/1/28(5) | | 287 | 305,089 |
| Eldorado Gold Corp., 6.25%, 9/1/29(5) | | 251 | 236,668 |
| Freeport-McMoRan, Inc., 5.45%, 3/15/43 | | 267 | 245,005 |
| Hudbay Minerals, Inc.: | | | |
| 4.50%, 4/1/26(5) | | 204 | 197,521 |
| 6.125%, 4/1/29(5) | | 96 | 94,079 |
| New Gold, Inc., 7.50%, 7/15/27(5) | | 222 | 220,844 |
| Novelis Corp., 3.25%, 11/15/26(5) | | 89 | 83,308 |
| Novelis Sheet Ingot GmbH, 3.375%, 4/15/29(6) | EUR | 300 | 302,083 |
| Permian Resources Operating LLC, 5.375%, 1/15/26(5) | | 225 | 222,532 |
| Roller Bearing Co. of America, Inc., 4.375%, 10/15/29(5) | | 187 | 169,238 |
| TMS International Corp., 6.25%, 4/15/29(5) | | 196 | 180,828 |
| | | | $ 3,135,616 |
| Oil and Gas — 0.0%(2) |
| BP Capital Markets PLC, 6.45% to 12/1/33(8)(9) | | 120 | $ 121,366 |
| | | | $ 121,366 |
| Oil, Gas & Consumable Fuels — 1.5% |
| Aethon United BR LP/Aethon United Finance Corp., 8.25%, 2/15/26(5) | | 555 | $ 559,100 |
| Civitas Resources, Inc.: | | | |
| 8.625%, 11/1/30(5) | | 350 | 372,700 |
| 8.75%, 7/1/31(5) | | 50 | 53,100 |
| Matador Resources Co., 6.50%, 4/15/32(5) | | 175 | 173,562 |
| Parkland Corp.: | | | |
| 4.50%, 10/1/29(5) | | 110 | 99,782 |
| Security | Principal
Amount
(000's omitted)* | Value |
| Oil, Gas & Consumable Fuels (continued) |
| Parkland Corp.: (continued) | | | |
| 4.625%, 5/1/30(5) | | 202 | $ 182,711 |
| Permian Resources Operating LLC: | | | |
| 5.875%, 7/1/29(5) | | 260 | 252,882 |
| 7.00%, 1/15/32(5) | | 147 | 149,951 |
| Plains All American Pipeline LP, Series B, 9.679%, (3 mo. SOFR + 4.372%)(8)(11) | | 305 | 303,078 |
| Precision Drilling Corp.: | | | |
| 6.875%, 1/15/29(5) | | 152 | 150,557 |
| 7.125%, 1/15/26(5) | | 90 | 90,070 |
| Southwestern Energy Co., 4.75%, 2/1/32 | | 285 | 256,862 |
| Sunoco LP, 7.25%, 5/1/32(5) | | 145 | 147,388 |
| Sunoco LP/Sunoco Finance Corp., 4.50%, 4/30/30 | | 226 | 203,543 |
| Transocean Poseidon Ltd., 6.875%, 2/1/27(5) | | 122 | 121,882 |
| Transocean, Inc., 8.75%, 2/15/30(5) | | 79 | 82,637 |
| Vital Energy, Inc.: | | | |
| 7.875%, 4/15/32(5) | | 153 | 155,351 |
| 9.75%, 10/15/30 | | 125 | 136,302 |
| Wintershall Dea Finance 2 BV, Series NC5, 2.499% to 4/20/26(6)(8)(9) | EUR | 400 | 395,276 |
| | | | $ 3,886,734 |
| Packaging & Containers — 0.3% |
| Owens-Brockway Glass Container, Inc., 7.25%, 5/15/31(5) | | 223 | $ 223,620 |
| Trivium Packaging Finance BV: | | | |
| 7.651%, (3 mo. EURIBOR + 3.75%), 8/15/26(6)(11) | EUR | 200 | 214,477 |
| 8.50%, 8/15/27(5) | | 200 | 198,266 |
| | | | $ 636,363 |
| Passenger Airlines — 0.1% |
| American Airlines, Inc./AAdvantage Loyalty IP Ltd., 5.50%, 4/20/26(5) | | 209 | $ 207,097 |
| | | | $ 207,097 |
| Pharmaceuticals — 0.8% |
| Bayer AG, 5.375% to 6/25/30, 3/25/82(6)(9) | EUR | 200 | $ 198,882 |
| BellRing Brands, Inc., 7.00%, 3/15/30(5) | | 163 | 165,097 |
| Cheplapharm Arzneimittel GmbH, 8.651%, (3 mo. EURIBOR + 4.75%), 5/15/30(6)(11) | EUR | 300 | 324,831 |
| Endo Finance Holdings, Inc., 8.50%, 4/15/31(5) | | 110 | 111,905 |
| Gruenenthal GmbH, 3.625%, 11/15/26(6) | EUR | 220 | 230,228 |
| Option Care Health, Inc., 4.375%, 10/31/29(5) | | 382 | 342,455 |
| P&L Development LLC/PLD Finance Corp., 7.75%, 11/15/25(5) | | 187 | 158,558 |
15
See Notes to Financial Statements.
Eaton Vance
Global Income Builder Fund
April 30, 2024
Portfolio of Investments (Unaudited) — continued
| Security | Principal
Amount
(000's omitted)* | Value |
| Pharmaceuticals (continued) |
| Perrigo Finance Unlimited Co., 4.65%, 6/15/30 | | 400 | $ 366,887 |
| Prestige Brands, Inc., 3.75%, 4/1/31(5) | | 70 | 59,616 |
| | | | $ 1,958,459 |
| Pipelines — 1.1% |
| Antero Midstream Partners LP/Antero Midstream Finance Corp.: | | | |
| 5.75%, 3/1/27(5) | | 102 | $ 100,229 |
| 7.875%, 5/15/26(5) | | 109 | 111,075 |
| Cheniere Energy Partners LP, 4.00%, 3/1/31 | | 138 | 123,237 |
| DT Midstream, Inc., 4.125%, 6/15/29(5) | | 172 | 156,032 |
| Enbridge, Inc., Series NC5, 8.25% to 10/15/28, 1/15/84(9) | | 200 | 205,200 |
| Energy Transfer LP, 5.00%, 5/15/50 | | 136 | 112,806 |
| EQM Midstream Partners LP: | | | |
| 4.50%, 1/15/29(5) | | 364 | 337,103 |
| 6.00%, 7/1/25(5) | | 43 | 42,964 |
| 6.50%, 7/1/27(5) | | 116 | 116,254 |
| 7.50%, 6/1/30(5) | | 126 | 132,220 |
| Global Partners LP/GLP Finance Corp., 8.25%, 1/15/32(5) | | 210 | 215,291 |
| Kinetik Holdings LP, 5.875%, 6/15/30(5) | | 237 | 229,332 |
| Venture Global LNG, Inc.: | | | |
| 8.125%, 6/1/28(5) | | 139 | 142,242 |
| 8.375%, 6/1/31(5) | | 222 | 227,966 |
| 9.50%, 2/1/29(5) | | 193 | 207,569 |
| 9.875%, 2/1/32(5) | | 184 | 196,463 |
| | | | $ 2,655,983 |
| Real Estate Investment Trusts (REITs) — 0.3% |
| Greystar Real Estate Partners LLC, 7.75%, 9/1/30(5) | | 339 | $ 349,511 |
| HAT Holdings I LLC/HAT Holdings II LLC, 3.75%, 9/15/30(5) | | 266 | 220,985 |
| Heimstaden Bostad AB: | | | |
| 3.00% to 10/29/27(6)(8)(9) | EUR | 115 | 71,434 |
| 3.375% to 1/15/26(6)(8)(9) | EUR | 300 | 209,705 |
| | | | $ 851,635 |
| Real Estate Management & Development — 0.2% |
| Cushman & Wakefield U.S. Borrower LLC: | | | |
| 6.75%, 5/15/28(5) | | 87 | $ 85,855 |
| 8.875%, 9/1/31(5) | | 117 | 121,491 |
| Emeria SASU, 7.75%, 3/31/28(6) | EUR | 340 | 351,101 |
| | | | $ 558,447 |
| Security | Principal
Amount
(000's omitted)* | Value |
| Retail — 0.4% |
| B&M European Value Retail SA, 8.125%, 11/15/30(6) | GBP | 125 | $ 166,639 |
| NMG Holding Co., Inc./Neiman Marcus Group LLC, 7.125%, 4/1/26(5) | | 250 | 249,075 |
| PEU (Fin) PLC, 7.25%, 7/1/28(6) | EUR | 200 | 219,616 |
| Raising Cane's Restaurants LLC, 9.375%, 5/1/29(5) | | 229 | 245,891 |
| | | | $ 881,221 |
| Semiconductors & Semiconductor Equipment — 0.2% |
| ams-OSRAM AG, 10.50%, 3/30/29(6) | EUR | 425 | $ 455,828 |
| ON Semiconductor Corp., 3.875%, 9/1/28(5) | | 185 | 168,046 |
| | | | $ 623,874 |
| Software — 0.6% |
| athenahealth Group, Inc., 6.50%, 2/15/30(5) | | 306 | $ 275,760 |
| Central Parent LLC/CDK Global II LLC/CDK Financing Co., Inc., 8.00%, 6/15/29(5) | | 134 | 137,969 |
| Clarivate Science Holdings Corp., 4.875%, 7/1/29(5) | | 243 | 221,553 |
| Cloud Software Group, Inc.: | | | |
| 6.50%, 3/31/29(5) | | 122 | 115,804 |
| 9.00%, 9/30/29(5) | | 362 | 348,603 |
| Playtika Holding Corp., 4.25%, 3/15/29(5) | | 303 | 260,997 |
| Rocket Software, Inc., 9.00%, 11/28/28(5)(10) | | 65 | 65,306 |
| | | | $ 1,425,992 |
| Specialty Retail — 2.2% |
| Asbury Automotive Group, Inc.: | | | |
| 4.625%, 11/15/29(5) | | 27 | $ 24,441 |
| 4.75%, 3/1/30 | | 228 | 206,908 |
| 5.00%, 2/15/32(5) | | 28 | 24,914 |
| Bath & Body Works, Inc.: | | | |
| 6.625%, 10/1/30(5) | | 45 | 45,001 |
| 6.75%, 7/1/36 | | 80 | 78,145 |
| 6.95%, 3/1/33 | | 168 | 162,501 |
| 9.375%, 7/1/25(5) | | 31 | 32,112 |
| Bausch & Lomb Corp., 8.375%, 10/1/28(5) | | 210 | 217,140 |
| CD&R Firefly Bidco PLC, 8.625%, 4/30/29(6) | GBP | 245 | 305,283 |
| Dave & Buster's, Inc., 7.625%, 11/1/25(5) | | 457 | 460,384 |
| Dufry One BV, 3.375%, 4/15/28(6) | EUR | 479 | 493,522 |
| Evergreen AcqCo 1 LP/TVI, Inc., 9.75%, 4/26/28(5) | | 245 | 259,772 |
| Ferrellgas LP/Ferrellgas Finance Corp., 5.875%, 4/1/29(5) | | 246 | 233,317 |
| Group 1 Automotive, Inc., 4.00%, 8/15/28(5) | | 203 | 184,823 |
| IRB Holding Corp., 7.00%, 6/15/25(5) | | 98 | 97,875 |
| Ken Garff Automotive LLC, 4.875%, 9/15/28(5) | | 155 | 143,959 |
16
See Notes to Financial Statements.
Eaton Vance
Global Income Builder Fund
April 30, 2024
Portfolio of Investments (Unaudited) — continued
| Security | Principal
Amount
(000's omitted)* | Value |
| Specialty Retail (continued) |
| LCM Investments Holdings II LLC: | | | |
| 4.875%, 5/1/29(5) | | 257 | $ 234,970 |
| 8.25%, 8/1/31(5) | | 32 | 33,273 |
| Lithia Motors, Inc., 3.875%, 6/1/29(5) | | 86 | 76,042 |
| Midco GB SASU, 7.75%, (7.75% cash or 8.50% PIK), 11/1/27(6)(7) | EUR | 285 | 309,353 |
| Patrick Industries, Inc.: | | | |
| 4.75%, 5/1/29(5) | | 217 | 197,496 |
| 7.50%, 10/15/27(5) | | 30 | 30,388 |
| PetSmart, Inc./PetSmart Finance Corp.: | | | |
| 4.75%, 2/15/28(5) | | 250 | 230,973 |
| 7.75%, 2/15/29(5) | | 250 | 237,881 |
| Punch Finance PLC, 6.125%, 6/30/26(6) | GBP | 200 | 240,213 |
| Sonic Automotive, Inc.: | | | |
| 4.625%, 11/15/29(5) | | 172 | 154,128 |
| 4.875%, 11/15/31(5) | | 143 | 124,915 |
| Suburban Propane Partners LP/Suburban Energy Finance Corp., 5.00%, 6/1/31(5) | | 135 | 120,041 |
| Superior Plus LP/Superior General Partner, Inc., 4.50%, 3/15/29(5) | | 233 | 210,966 |
| White Cap Buyer LLC, 6.875%, 10/15/28(5) | | 312 | 301,797 |
| Yum! Brands, Inc., 3.625%, 3/15/31 | | 147 | 127,139 |
| | | | $ 5,599,672 |
| Technology Hardware, Storage & Peripherals — 0.5% |
| McAfee Corp., 7.375%, 2/15/30(5) | | 293 | $ 271,674 |
| NCR Voyix Corp.: | | | |
| 5.125%, 4/15/29(5) | | 116 | 106,712 |
| 5.25%, 10/1/30(5) | | 104 | 92,741 |
| Presidio Holdings, Inc.: | | | |
| 4.875%, 2/1/27(5) | | 17 | 17,033 |
| 8.25%, 2/1/28(5) | | 296 | 299,582 |
| Science Applications International Corp., 4.875%, 4/1/28(5) | | 260 | 245,678 |
| Seagate HDD Cayman: | | | |
| 4.091%, 6/1/29 | | 52 | 47,363 |
| 9.625%, 12/1/32 | | 248 | 278,852 |
| | | | $ 1,359,635 |
| Telecommunications — 0.9% |
| Ciena Corp., 4.00%, 1/31/30(5) | | 194 | $ 170,347 |
| Connect Finco SARL/Connect U.S. Finco LLC, 6.75%, 10/1/26(5) | | 421 | 408,102 |
| Rogers Communications, Inc., 5.25% to 3/15/27, 3/15/82(5)(9) | | 125 | 118,987 |
| Security | Principal
Amount
(000's omitted)* | Value |
| Telecommunications (continued) |
| Telecom Italia Finance SA, 7.75%, 1/24/33 | EUR | 100 | $ 117,840 |
| Telecom Italia SpA: | | | |
| 6.875%, 2/15/28(6) | EUR | 100 | 111,869 |
| 7.875%, 7/31/28(6) | EUR | 300 | 348,565 |
| Telefonica Europe BV, 7.125% to 8/23/28(6)(8)(9) | EUR | 200 | 231,716 |
| Vodafone Group PLC: | | | |
| 2.625% to 5/27/26, 8/27/80(6)(9) | EUR | 220 | 225,305 |
| 4.875% to 7/3/25, 10/3/78(6)(9) | GBP | 215 | 263,703 |
| Wp/ap Telecom Holdings III BV, 5.50%, 1/15/30(6) | EUR | 259 | 251,479 |
| | | | $ 2,247,913 |
| Textiles, Apparel & Luxury Goods — 0.1% |
| Hanesbrands, Inc., 9.00%, 2/15/31(5) | | 210 | $ 209,162 |
| | | | $ 209,162 |
| Transportation — 0.3% |
| Cargo Aircraft Management, Inc., 4.75%, 2/1/28(5) | | 249 | $ 225,130 |
| Seaspan Corp., 5.50%, 8/1/29(5) | | 304 | 261,876 |
| Watco Cos. LLC/Watco Finance Corp., 6.50%, 6/15/27(5) | | 214 | 211,534 |
| | | | $ 698,540 |
| Wireless Telecommunication Services — 0.1% |
| Iliad Holding SASU, 6.50%, 10/15/26(5) | | 258 | $ 257,004 |
| | | | $ 257,004 |
Total Corporate Bonds
(identified cost $89,064,691) | | | $ 85,786,890 |
| Security | Shares | Value |
| Banks — 0.0%(2) |
| Farm Credit Bank of Texas, 9.601%, (3 mo. SOFR + 4.01%)(5)(11) | | 669 | $ 66,900 |
| | | | $ 66,900 |
| Capital Markets — 0.1% |
| Affiliated Managers Group, Inc., 4.75% | | 5,486 | $ 101,546 |
| | | | $ 101,546 |
| Electric Utilities — 0.1% |
| Brookfield BRP Holdings Canada, Inc.: | | | |
| 4.625% | | 5,119 | $ 79,601 |
17
See Notes to Financial Statements.
Eaton Vance
Global Income Builder Fund
April 30, 2024
Portfolio of Investments (Unaudited) — continued
| Security | Shares | Value |
| Electric Utilities (continued) |
| Brookfield BRP Holdings Canada, Inc.: (continued) | | | |
| 7.25% | | 3,146 | $ 78,115 |
| SCE Trust III, Series H, 8.581% to 5/30/24(9) | | 4,892 | 123,621 |
| SCE Trust IV, Series J, 5.375% to 9/15/25(9) | | 651 | 15,357 |
| | | | $ 296,694 |
| Insurance — 0.1% |
| American Equity Investment Life Holding Co., Series B, 6.625% to 9/1/25(9) | | 5,460 | $ 134,152 |
| Athene Holding Ltd., Series C, 6.375% to 6/30/25(9) | | 3,208 | 80,296 |
| | | | $ 214,448 |
| Trading Companies & Distributors — 0.1% |
| WESCO International, Inc., Series A, 10.625% to 6/22/25(9) | | 8,139 | $ 214,788 |
| | | | $ 214,788 |
| Wireless Telecommunication Services — 0.0%(2) |
| U.S. Cellular Corp., 5.50% | | 5,573 | $ 99,032 |
| | | | $ 99,032 |
Total Preferred Stocks
(identified cost $1,099,200) | | | $ 993,408 |
| Senior Floating-Rate Loans — 2.1%(13) |
| Borrower/Description | Principal
Amount
(000's omitted) | Value |
| Airlines — 0.2% |
| American Airlines, Inc., Term Loan, 10.336%, (SOFR + 4.75%), 4/20/28 | $ | 200 | $ 208,587 |
| Mileage Plus Holdings LLC, Term Loan, 10.733%, (SOFR + 5.25%), 6/21/27 | | 277 | 284,629 |
| | | | $ 493,216 |
| Apparel & Luxury Goods — 0.1% |
| ABG Intermediate Holdings 2 LLC, Term Loan, 8.918%, (SOFR + 3.50%), 12/21/28 | $ | 217 | $ 218,131 |
| | | | $ 218,131 |
| Auto Components — 0.1% |
| Clarios Global LP, Term Loan, 8.316%, (SOFR + 3.00%), 5/6/30 | $ | 176 | $ 176,748 |
| DexKo Global, Inc., Term Loan, 9.559%, (SOFR + 4.25%), 10/4/28 | | 93 | 92,782 |
| | | | $ 269,530 |
| Borrower/Description | Principal
Amount
(000's omitted) | Value |
| Beverages — 0.1% |
| Triton Water Holdings, Inc., Term Loan, 3/31/28(14) | $ | 178 | $ 177,444 |
| | | | $ 177,444 |
| Distributors — 0.1% |
| Parts Europe SA, Term Loan, 2/3/31(14) | $ | 207 | $ 221,786 |
| | | | $ 221,786 |
| Gas Utilities — 0.1% |
| Epic Y-Grade Services LP, Term Loan, 6/29/29(14) | $ | 196 | $ 193,669 |
| | | | $ 193,669 |
| Health Care Equipment & Supplies — 0.0%(2) |
| Bausch & Lomb Corp., Term Loan, 8.669%, (SOFR + 3.25%), 5/10/27 | $ | 117 | $ 116,930 |
| | | | $ 116,930 |
| Health Care Providers & Services — 0.2% |
| Pluto Acquisition I, Inc.: | | | |
| Term Loan, 10.687%, (SOFR + 5.50%), 6/20/28 | $ | 76 | $ 76,636 |
| Term Loan - Second Lien, 9.316%, (SOFR + 4.00%), 9/20/28 | | 219 | 194,523 |
| Team Health Holdings, Inc., Term Loan, 10.58%, (SOFR + 5.25%), 3/2/27(15) | | 259 | 228,342 |
| | | | $ 499,501 |
| Health Care Technology — 0.1% |
| Verscend Holding Corp., Term Loan, 11.50%, (USD Prime + 3.00%), 8/27/25 | $ | 289 | $ 288,861 |
| | | | $ 288,861 |
| Hotels, Restaurants & Leisure — 0.2% |
| IRB Holding Corp., Term Loan, 8.166%, (SOFR + 2.75%), 12/15/27 | $ | 354 | $ 355,109 |
| Spectacle Gary Holdings LLC, Term Loan, 9.702%, (SOFR + 4.25%), 12/11/28 | | 176 | 173,125 |
| | | | $ 528,234 |
| Insurance — 0.2% |
| Truist Insurance Holdings LLC, Term Loan - Second Lien, 3/8/32(14) | $ | 440 | $ 444,015 |
| | | | $ 444,015 |
18
See Notes to Financial Statements.
Eaton Vance
Global Income Builder Fund
April 30, 2024
Portfolio of Investments (Unaudited) — continued
| Borrower/Description | Principal
Amount
(000's omitted) | Value |
| IT Services — 0.1% |
| Travelport Finance (Luxembourg) SARL, Term Loan, 13.564%, (SOFR + 8.00%), 9/30/28 | $ | 221 | $ 204,844 |
| | | | $ 204,844 |
| Leisure Products — 0.0%(2) |
| Peloton Interactive, Inc., Term Loan, 12.477%, (SOFR + 7.00%), 5/25/27 | $ | 138 | $ 137,464 |
| | | | $ 137,464 |
| Machinery — 0.1% |
| EMRLD Borrower LP, Term Loan, 7.816%, (SOFR + 2.50%), 5/31/30 | $ | 163 | $ 163,072 |
| | | | $ 163,072 |
| Paper & Forest Products — 0.1% |
| Enviva Partners LP/Enviva Partners Finance Corp.: | | | |
| Term Loan, 4.00%, 12/13/24(16) | $ | 76 | $ 77,365 |
| Term Loan, 4.00%, 12/13/24(16) | | 30 | 35,584 |
| Term Loan, 13.297%, (SOFR + 8.00%), 12/13/24 | | 46 | 53,376 |
| | | | $ 166,325 |
| Professional Services — 0.1% |
| AlixPartners LLP, Term Loan, 7.93%, (SOFR + 2.50%), 2/4/28 | $ | 352 | $ 353,428 |
| | | | $ 353,428 |
| Software — 0.1% |
| Central Parent, Inc., Term Loan, 7/6/29(14) | $ | 167 | $ 167,827 |
| Cloud Software Group, Inc., Term Loan, 3/30/29(14) | | 74 | 73,757 |
| GoTo Group, Inc., Term Loan, 10.074%, (SOFR + 4.75%), 8/31/27 | | 0 (17) | 59 |
| Riverbed Technology, Inc., Term Loan, 9.809%, (SOFR + 4.50%), 7.809% cash, 2.00% PIK, 7/1/28 | | 56 | 34,609 |
| | | | $ 276,252 |
| Specialty Retail — 0.2% |
| Mavis Tire Express Services Corp., Term Loan, 9.066%, (SOFR + 3.75%), 5/4/28 | $ | 140 | $ 140,481 |
| PetSmart, Inc., Term Loan, 9.166%, (SOFR + 3.75%), 2/11/28 | | 376 | 371,300 |
| | | | $ 511,781 |
Total Senior Floating-Rate Loans
(identified cost $5,285,396) | | | $ 5,264,483 |
| Security | Principal
Amount/
Shares | Value |
| Diversified Financial Services — 0.0% |
| Alpha Holding SA, Escrow Certificates(1)(18) | | 400,000 | $ 0 |
| | | | $ 0 |
| Entertainment — 0.0% |
| National CineMedia, Inc., Escrow Certificates(1)(18) | $ | 189,000 | $ 0 |
| | | | $ 0 |
| Pharmaceuticals — 0.0% |
| Endo Design LLC, Escrow Certificates(1)(18) | $ | 200,000 | $ 0 |
| Endo Luxembourg Finance SARL, Escrow Certificates(1)(18) | $ | 171,000 | 0 |
| | | | $ 0 |
| Transportation — 0.0%(2) |
| Hertz Corp., Escrow Certificates(1) | $ | 58,000 | $ 5,800 |
| Hertz Corp., Escrow Certificates(1) | $ | 167,000 | 6,680 |
| Hertz Corp., Escrow Certificates(1) | $ | 110,000 | 4,400 |
| | | | $ 16,880 |
Total Miscellaneous
(identified cost $75,751) | | | $ 16,880 |
| Short-Term Investments — 2.5% |
| Security | Shares | Value |
| Morgan Stanley Institutional Liquidity Funds - Government Portfolio, Institutional Class, 5.22%(19) | | 6,335,541 | $ 6,335,541 |
Total Short-Term Investments
(identified cost $6,335,541) | | | $ 6,335,541 |
Total Investments — 100.1%
(identified cost $199,730,868) | | | $252,887,742 |
| Less Unfunded Loan Commitments — (0.1)% | | | $ (106,448) |
Net Investments — 100.0%
(identified cost $199,624,420) | | | $252,781,294 |
| Other Assets, Less Liabilities — (0.0)%(2) | | | $ (28,674) |
| Net Assets — 100.0% | | | $252,752,620 |
19
See Notes to Financial Statements.
Eaton Vance
Global Income Builder Fund
April 30, 2024
Portfolio of Investments (Unaudited) — continued
| The percentage shown for each investment category in the Portfolio of Investments is based on net assets. |
| * | In U.S. dollars unless otherwise indicated. |
| (1) | Non-income producing security. |
| (2) | Amount is less than 0.05% or (0.05)%, as applicable. |
| (3) | Restricted security (see Note 8). |
| (4) | Security (or a portion thereof) has been pledged to cover margin requirements on open futures contracts. |
| (5) | Security exempt from registration under Rule 144A of the Securities Act of 1933, as amended. These securities may be sold in certain transactions in reliance on an exemption from registration (normally to qualified institutional buyers). At April 30, 2024, the aggregate value of these securities is $55,038,609 or 21.8% of the Fund's net assets. |
| (6) | Security exempt from registration under Regulation S of the Securities Act of 1933, as amended, which exempts from registration securities offered and sold outside the United States. Security may not be offered or sold in the United States except pursuant to an exemption from, or in a transaction not subject to, the registration requirements of the Securities Act of 1933, as amended. At April 30, 2024, the aggregate value of these securities is $21,078,750 or 8.3% of the Fund's net assets. |
| (7) | Represents a payment-in-kind security which may pay interest in additional principal at the issuer’s discretion. |
| (8) | Perpetual security with no stated maturity date but may be subject to calls by the issuer. |
| (9) | Security converts to variable rate after the indicated fixed-rate coupon period. |
| (10) | When-issued security. |
| (11) | Variable rate security. The stated interest rate represents the rate in effect at April 30, 2024. |
| (12) | Issuer is in default with respect to interest and/or principal payments. |
| (13) | Senior floating-rate loans (Senior Loans) often require prepayments from excess cash flows or permit the borrowers to repay at their election. The degree to which borrowers repay, whether as a contractual requirement or at their election, cannot be predicted with accuracy. As a result, the actual remaining maturity may be substantially less than the stated maturities shown. However, Senior Loans will typically have an expected average life of approximately two to four years. Senior Loans typically have rates of interest which are redetermined periodically by reference to a base lending rate, plus a spread. These base lending rates are primarily the Secured Overnight Financing Rate (“SOFR”) and secondarily, the prime rate offered by one or more major United States banks (the “Prime Rate”). Base lending rates may be subject to a floor, or minimum rate. Rates for SOFR are generally 1 or 3-month tenors and may also be subject to a credit spread adjustment. Senior Loans are generally subject to contractual restrictions that must be satisfied before they can be bought or sold. |
| (14) | This Senior Loan will settle after April 30, 2024, at which time the interest rate will be determined. |
| (15) | The stated interest rate represents the weighted average interest rate at April 30, 2024 of contracts within the senior loan facility. Interest rates on contracts are primarily redetermined either monthly or quarterly by reference to the indicated base lending rate and spread and the reset period. |
| (16) | Unfunded or partially unfunded loan commitments. The stated interest rate reflects the weighted average of the reference rate and spread for the funded portion, if any, and the commitment fees on the portion of the loan that is unfunded. At April 30, 2024, the total value of unfunded loan commitments is $112,949. See Note 1G for description. |
| (17) | Principal amount is less than $500. |
| (18) | For fair value measurement disclosure purposes, security is categorized as Level 3 (see Note 12). |
| (19) | May be deemed to be an affiliated investment company. The rate shown is the annualized seven-day yield as of April 30, 2024. |
| Country Concentration of Portfolio |
| Country | Percentage of
Total Investments | Value |
| United States | 55.6% | $140,700,871 |
| United Kingdom | 8.8 | 22,205,503 |
| France | 7.6 | 19,230,926 |
| Germany | 4.0 | 10,232,525 |
| Netherlands | 4.0 | 10,019,732 |
| Switzerland | 3.4 | 8,581,112 |
| Denmark | 2.3 | 5,930,835 |
| Canada | 2.3 | 5,894,253 |
| Spain | 2.2 | 5,463,775 |
| Italy | 2.1 | 5,442,331 |
| Australia | 1.0 | 2,414,241 |
| Luxembourg | 0.9 | 2,328,952 |
| Japan | 0.9 | 2,184,611 |
| Ireland | 0.8 | 1,991,325 |
| Taiwan | 0.8 | 1,949,267 |
| Sweden | 0.6 | 1,570,968 |
| Hong Kong | 0.5 | 1,226,596 |
| India | 0.3 | 826,042 |
| Bermuda | 0.3 | 794,781 |
| Norway | 0.3 | 749,662 |
| United Arab Emirates | 0.3 | 745,956 |
| Austria | 0.3 | 658,386 |
| Belgium | 0.2 | 515,235 |
| Finland | 0.2 | 406,870 |
| Slovenia | 0.1 | 351,276 |
| Poland | 0.1 | 273,729 |
| Mexico | 0.1 | 197,982 |
| Total Investments | 100.0% | $252,887,742 |
20
See Notes to Financial Statements.
Eaton Vance
Global Income Builder Fund
April 30, 2024
Portfolio of Investments (Unaudited) — continued
| Forward Foreign Currency Exchange Contracts (OTC) |
| Currency Purchased | Currency Sold | Counterparty | Settlement
Date | Unrealized
Appreciation | Unrealized
(Depreciation) |
| EUR | 292,991 | USD | 312,893 | JPMorgan Chase Bank, N.A. | 5/13/24 | $ — | $ (90) |
| | | | | | | $ — | $(90) |
| Futures Contracts |
| Description | Number of
Contracts | Position | Expiration
Date | Notional
Amount | Value/Unrealized
Appreciation
(Depreciation) |
| Equity Futures | | | | | |
| E-Mini S&P 500 Index | 45 | Long | 6/21/24 | $11,400,750 | $ (269,485) |
| STOXX 600 Banks Index | (309) | Short | 6/21/24 | (3,197,896) | (328,680) |
| STOXX 600 Insurance Index | (59) | Short | 6/21/24 | (1,133,052) | (4,209) |
| STOXX Europe 600 Index | (282) | Short | 6/21/24 | (7,570,411) | (41,566) |
| | | | | | $(643,940) |
| Abbreviations: |
| ADR | – American Depositary Receipt |
| EURIBOR | – Euro Interbank Offered Rate |
| OTC | – Over-the-counter |
| PFC Shares | – Preference Shares |
| PIK | – Payment In Kind |
| REITs | – Real Estate Investment Trusts |
| SOFR | – Secured Overnight Financing Rate |
| Currency Abbreviations: |
| EUR | – Euro |
| GBP | – British Pound Sterling |
| USD | – United States Dollar |
21
See Notes to Financial Statements.
Eaton Vance
Global Income Builder Fund
April 30, 2024
Statement of Assets and Liabilities (Unaudited)
| | April 30, 2024 |
| Assets | |
| Unaffiliated investments, at value (identified cost $193,288,879) | $ 246,445,753 |
| Affiliated investments, at value (identified cost $6,335,541) | 6,335,541 |
| Cash | 133,225 |
| Foreign currency, at value (identified cost $540,039) | 538,647 |
| Interest and dividends receivable | 1,899,017 |
| Dividends receivable from affiliated investments | 23,324 |
| Receivable for investments sold | 7,561,609 |
| Receivable for Fund shares sold | 386,462 |
| Tax reclaims receivable | 1,352,597 |
| Receivable from affiliates | 37,592 |
| Trustees' deferred compensation plan | 58,723 |
| Total assets | $264,772,490 |
| Liabilities | |
| Payable for investments purchased | $ 10,581,984 |
| Payable for when-issued securities | 692,347 |
| Payable for Fund shares redeemed | 226,158 |
| Payable for variation margin on open futures contracts | 79,819 |
| Payable for open forward foreign currency exchange contracts | 90 |
| Payable to affiliates: | |
| Investment adviser fee | 114,205 |
| Administration fee | 31,317 |
| Distribution and service fees | 39,577 |
| Trustees' fees | 1,332 |
| Trustees' deferred compensation plan | 58,723 |
| Accrued expenses | 194,318 |
| Total liabilities | $ 12,019,870 |
| Net Assets | $252,752,620 |
| Sources of Net Assets | |
| Paid-in capital | $ 200,736,773 |
| Distributable earnings | 52,015,847 |
| Net Assets | $252,752,620 |
| Class A Shares | |
| Net Assets | $ 135,089,375 |
| Shares Outstanding | 12,721,855 |
Net Asset Value and Redemption Price Per Share
(net assets ÷ shares of beneficial interest outstanding) | $ 10.62 |
Maximum Offering Price Per Share
(100 ÷ 94.75 of net asset value per share) | $ 11.21 |
| Class C Shares | |
| Net Assets | $ 12,923,945 |
| Shares Outstanding | 1,233,439 |
Net Asset Value and Offering Price Per Share*
(net assets ÷ shares of beneficial interest outstanding) | $ 10.48 |
| Class I Shares | |
| Net Assets | $ 102,732,016 |
| Shares Outstanding | 9,687,901 |
Net Asset Value, Offering Price and Redemption Price Per Share
(net assets ÷ shares of beneficial interest outstanding) | $ 10.60 |
22
See Notes to Financial Statements.
Eaton Vance
Global Income Builder Fund
April 30, 2024
Statement of Assets and Liabilities (Unaudited) — continued
| | April 30, 2024 |
| Class R Shares | |
| Net Assets | $2,007,284 |
| Shares Outstanding | 189,798 |
Net Asset Value, Offering Price and Redemption Price Per Share
(net assets ÷ shares of beneficial interest outstanding) | $ 10.58 |
| On sales of $50,000 or more, the offering price of Class A shares is reduced. |
| * | Redemption price per share is equal to the net asset value less any applicable contingent deferred sales charge. |
23
See Notes to Financial Statements.
Eaton Vance
Global Income Builder Fund
April 30, 2024
Statement of Operations (Unaudited)
| | Six Months Ended |
| | April 30, 2024 |
| Investment Income | |
| Dividend income (net of foreign taxes withheld of $601,147) | $ 4,324,926 |
| Dividend income from affiliated investments | 74,828 |
| Interest income | 2,870,909 |
| Other income | 1,843 |
| Total investment income | $ 7,272,506 |
| Expenses | |
| Investment adviser fee | $ 666,210 |
| Administration fee | 181,694 |
| Distribution and service fees: | |
| Class A | 164,760 |
| Class C | 66,835 |
| Class R | 4,472 |
| Trustees’ fees and expenses | 7,891 |
| Custodian fee | 42,046 |
| Transfer and dividend disbursing agent fees | 77,716 |
| Legal and accounting services | 55,104 |
| Printing and postage | 37,650 |
| Registration fees | 34,762 |
| Miscellaneous | 54,610 |
| Total expenses | $ 1,393,750 |
| Deduct: | |
| Waiver and/or reimbursement of expenses by affiliates | $ 44,482 |
| Total expense reductions | $ 44,482 |
| Net expenses | $ 1,349,268 |
| Net investment income | $ 5,923,238 |
| Realized and Unrealized Gain (Loss) | |
| Net realized gain (loss): | |
| Investment transactions | $ 2,205,497 |
| Payment by affiliate for realized loss on disposal of investment not meeting investment guidelines | 23,322 |
| Futures contracts | (1,768,016) |
| Foreign currency transactions | (413,891) |
| Forward foreign currency exchange contracts | 1,672,122 |
| Net realized gain | $ 1,719,034 |
| Change in unrealized appreciation (depreciation): | |
| Investments | $ 26,074,077 |
| Futures contracts | (643,940) |
| Foreign currency | 17,710 |
| Forward foreign currency exchange contracts | (90) |
| Net change in unrealized appreciation (depreciation) | $25,447,757 |
| Net realized and unrealized gain | $27,166,791 |
| Net increase in net assets from operations | $33,090,029 |
24
See Notes to Financial Statements.
Eaton Vance
Global Income Builder Fund
April 30, 2024
Statements of Changes in Net Assets
| | Six Months Ended
April 30, 2024
(Unaudited) | Year Ended
October 31, 2023 |
| Increase (Decrease) in Net Assets | | |
| From operations: | | |
| Net investment income | $ 5,923,238 | $ 8,429,448 |
| Net realized gain (loss) | 1,719,034 | (648,804) |
| Net change in unrealized appreciation (depreciation) | 25,447,757 | 11,932,789 |
| Net increase in net assets from operations | $ 33,090,029 | $ 19,713,433 |
| Distributions to shareholders: | | |
| Class A | $ (2,706,487) | $ (4,271,637) |
| Class C | (229,717) | (386,469) |
| Class I | (2,085,155) | (3,109,444) |
| Class R | (34,623) | (33,320) |
| Total distributions to shareholders | $ (5,055,982) | $ (7,800,870) |
| Transactions in shares of beneficial interest: | | |
| Class A | $ (70,397) | $ (10,618,949) |
| Class C | (1,418,385) | (3,179,436) |
| Class I | 8,161,281 | (1,169,662) |
| Class R | 706,342 | 154,845 |
| Net increase (decrease) in net assets from Fund share transactions | $ 7,378,841 | $ (14,813,202) |
| Other capital: | | |
| Portfolio transaction fee contributed to Portfolio | $ — | $ (14,541) |
| Portfolio transaction fee allocated from Portfolio | — | 14,534 |
| Net decrease in net assets from other capital | $ — | $ (7) |
| Net increase (decrease) in net assets | $ 35,412,888 | $ (2,900,646) |
| Net Assets | | |
| At beginning of period | $ 217,339,732 | $ 220,240,378 |
| At end of period | $252,752,620 | $217,339,732 |
25
See Notes to Financial Statements.
Eaton Vance
Global Income Builder Fund
April 30, 2024
| | Class A | |
| | Six Months Ended
April 30, 2024
(Unaudited) Test | | Year Ended October 31, |
| | | 2023 Test | 2022 Test | 2021 Test | 2020 Test | 2019 Test |
| Net asset value — Beginning of period | $ 9.400 | | $ 8.920 | $ 11.360 | $ 9.070 | $ 9.210 | $ 8.620 |
| Income (Loss) From Operations | | | | | | | |
| Net investment income(1) | $ 0.250 | | $ 0.351 | $ 0.343 | $ 0.272 | $ 0.330 | $ 0.372 |
| Net realized and unrealized gain (loss) | 1.184 | | 0.453 | (2.321) | 2.342 | (0.146) | 0.542 |
| Total income (loss) from operations | $ 1.434 | | $ 0.804 | $ (1.978) | $ 2.614 | $ 0.184 | $ 0.914 |
| Less Distributions | | | | | | | |
| From net investment income | $ (0.214) | | $ (0.324) | $ (0.324) | $ (0.324) | $ (0.324) | $ (0.324) |
| From net realized gain | — | | — | (0.138) | — | — | — |
| Total distributions | $ (0.214) | | $ (0.324) | $ (0.462) | $ (0.324) | $ (0.324) | $ (0.324) |
| Portfolio transaction fee, net(1) | $ — | | $ (0.000)(2) | $ (0.000)(2) | $ (0.000)(2) | $ (0.000)(2) | $ (0.000)(2) |
| Net asset value — End of period | $ 10.620 | | $ 9.400 | $ 8.920 | $ 11.360 | $ 9.070 | $ 9.210 |
| Total Return(3)(4) | 15.30% (5) | | 9.00% | (17.86)% | 29.08% | 2.12% | 10.97% |
| Ratios/Supplemental Data | | | | | | | |
| Net assets, end of period (000’s omitted) | $135,089 | | $119,712 | $123,589 | $164,778 | $123,152 | $131,104 |
| Ratios (as a percentage of average daily net assets):(6) | | | | | | | |
| Expenses (4) | 1.17% (7)(8) | | 1.17% (8) | 1.17% (8) | 1.17% | 1.17% | 1.24% |
| Net investment income | 4.79% (7) | | 3.65% | 3.42% | 2.52% | 3.65% | 4.22% |
| Portfolio Turnover of the Portfolio(9) | — | | 46% | 59% | 60% | 118% | 86% |
| Portfolio Turnover of the Fund | 62% (5) | | 14% (10) | — | — | — | — |
| (1) | Computed using average shares outstanding. |
| (2) | Amount is less than $(0.0005). |
| (3) | Returns are historical and are calculated by determining the percentage change in net asset value with all distributions reinvested and do not reflect the effect of sales charges. |
| (4) | The administrator and sub-adviser reimbursed certain operating expenses (equal to 0.04%, 0.03%, 0.02%, 0.03% and 0.02% of average daily net assets for the six months ended April 30, 2024 and the years ended October 31, 2023, 2022, 2020 and 2019, respectively). Absent this reimbursement, total return would be lower. |
| (5) | Not annualized. |
| (6) | Includes the Fund’s share of the Portfolio's allocated expenses for the period while the Fund was investing in the Portfolio. |
| (7) | Annualized. |
| (8) | Includes a reduction by the investment adviser of a portion of its adviser fee due to the Fund’s and Portfolio’s investment in the Liquidity Fund (equal to less than 0.005% of average daily net assets for the six months ended April 30, 2024 and the years ended October 31, 2023 and 2022). |
| (9) | Portfolio turnover represents the rate of portfolio activity for the period while the Fund was investing in the Portfolio. |
| (10) | For the period from June 17, 2023 through October 31, 2023 when the Fund was making investments directly in securities. |
| References to Portfolio herein are to Global Income Builder Portfolio, a Massachusetts business trust in which the Fund invested all of its investable assets prior to the close of business on June 16, 2023 and which had the same investment objectives and policies as the Fund during such period. |
26
See Notes to Financial Statements.
Eaton Vance
Global Income Builder Fund
April 30, 2024
Financial Highlights — continued
| | Class C |
| | Six Months Ended
April 30, 2024
(Unaudited) | Year Ended October 31, |
| | 2023 | 2022 | 2021 | 2020 | 2019 |
| Net asset value — Beginning of period | $ 9.280 | $ 8.810 | $11.230 | $ 8.960 | $ 9.110 | $ 8.530 |
| Income (Loss) From Operations | | | | | | |
| Net investment income(1) | $ 0.204 | $ 0.272 | $ 0.263 | $ 0.187 | $ 0.262 | $ 0.292 |
| Net realized and unrealized gain (loss) | 1.174 | 0.450 | (2.290) | 2.328 | (0.153) | 0.546 |
| Total income (loss) from operations | $ 1.378 | $ 0.722 | $ (2.027) | $ 2.515 | $ 0.109 | $ 0.838 |
| Less Distributions | | | | | | |
| From net investment income | $ (0.178) | $ (0.252) | $ (0.255) | $ (0.245) | $ (0.259) | $ (0.258) |
| From net realized gain | — | — | (0.138) | — | — | — |
| Total distributions | $ (0.178) | $ (0.252) | $ (0.393) | $ (0.245) | $ (0.259) | $ (0.258) |
| Portfolio transaction fee, net(1) | $ — | $ (0.000)(2) | $ (0.000)(2) | $ (0.000)(2) | $ (0.000)(2) | $ (0.000)(2) |
| Net asset value — End of period | $10.480 | $ 9.280 | $ 8.810 | $11.230 | $ 8.960 | $ 9.110 |
| Total Return(3)(4) | 14.88% (5) | 8.17% | (18.46)% | 28.26% | 1.29% | 10.13% |
| Ratios/Supplemental Data | | | | | | |
| Net assets, end of period (000’s omitted) | $ 12,924 | $12,724 | $15,093 | $ 24,505 | $37,875 | $56,314 |
| Ratios (as a percentage of average daily net assets):(6) | | | | | | |
| Expenses (4) | 1.92% (7)(8) | 1.92% (8) | 1.92% (8) | 1.92% | 1.92% | 2.00% |
| Net investment income | 3.97% (7) | 2.87% | 2.64% | 1.76% | 2.93% | 3.36% |
| Portfolio Turnover of the Portfolio(9) | — | 46% | 59% | 60% | 118% | 86% |
| Portfolio Turnover of the Fund | 62% (5) | 14% (10) | — | — | — | — |
| (1) | Computed using average shares outstanding. |
| (2) | Amount is less than $(0.0005). |
| (3) | Returns are historical and are calculated by determining the percentage change in net asset value with all distributions reinvested and do not reflect the effect of sales charges. |
| (4) | The administrator and sub-adviser reimbursed certain operating expenses (equal to 0.04%, 0.03%, 0.02%, 0.03% and 0.02% of average daily net assets for the six months ended April 30, 2024 and the years ended October 31, 2023, 2022, 2020 and 2019, respectively). Absent this reimbursement, total return would be lower. |
| (5) | Not annualized. |
| (6) | Includes the Fund’s share of the Portfolio's allocated expenses for the period while the Fund was investing in the Portfolio. |
| (7) | Annualized. |
| (8) | Includes a reduction by the investment adviser of a portion of its adviser fee due to the Fund’s and Portfolio’s investment in the Liquidity Fund (equal to less than 0.005% of average daily net assets for the six months ended April 30, 2024 and the years ended October 31, 2023 and 2022). |
| (9) | Portfolio turnover represents the rate of portfolio activity for the period while the Fund was investing in the Portfolio. |
| (10) | For the period from June 17, 2023 through October 31, 2023 when the Fund was making investments directly in securities. |
| References to Portfolio herein are to Global Income Builder Portfolio, a Massachusetts business trust in which the Fund invested all of its investable assets prior to the close of business on June 16, 2023 and which had the same investment objectives and policies as the Fund during such period. |
27
See Notes to Financial Statements.
Eaton Vance
Global Income Builder Fund
April 30, 2024
Financial Highlights — continued
| | Class I |
| | Six Months Ended
April 30, 2024
(Unaudited) | Year Ended October 31, |
| | 2023 | 2022 | 2021 | 2020 | 2019 |
| Net asset value — Beginning of period | $ 9.390 | $ 8.910 | $11.340 | $ 9.060 | $ 9.190 | $ 8.610 |
| Income (Loss) From Operations | | | | | | |
| Net investment income(1) | $ 0.267 | $ 0.374 | $ 0.368 | $ 0.297 | $ 0.354 | $ 0.386 |
| Net realized and unrealized gain (loss) | 1.169 | 0.454 | (2.311) | 2.333 | (0.136) | 0.542 |
| Total income (loss) from operations | $ 1.436 | $ 0.828 | $ (1.943) | $ 2.630 | $ 0.218 | $ 0.928 |
| Less Distributions | | | | | | |
| From net investment income | $ (0.226) | $ (0.348) | $ (0.349) | $ (0.350) | $ (0.348) | $ (0.348) |
| From net realized gain | — | — | (0.138) | — | — | — |
| Total distributions | $ (0.226) | $ (0.348) | $ (0.487) | $ (0.350) | $ (0.348) | $ (0.348) |
| Portfolio transaction fee, net(1) | $ — | $ (0.000)(2) | $ (0.000)(2) | $ (0.000)(2) | $ (0.000)(2) | $ (0.000)(2) |
| Net asset value — End of period | $ 10.600 | $ 9.390 | $ 8.910 | $ 11.340 | $ 9.060 | $ 9.190 |
| Total Return(3)(4) | 15.34% (5) | 9.28% | (17.60)% | 29.31% | 2.51% | 11.17% |
| Ratios/Supplemental Data | | | | | | |
| Net assets, end of period (000’s omitted) | $102,732 | $83,772 | $80,627 | $113,907 | $94,518 | $107,290 |
| Ratios (as a percentage of average daily net assets):(6) | | | | | | |
| Expenses (4) | 0.92% (7)(8) | 0.92% (8) | 0.92% (8) | 0.92% | 0.92% | 0.99% |
| Net investment income | 5.14% (7) | 3.90% | 3.66% | 2.76% | 3.92% | 4.39% |
| Portfolio Turnover of the Portfolio(9) | — | 46% | 59% | 60% | 118% | 86% |
| Portfolio Turnover of the Fund | 62% (5) | 14% (10) | — | — | — | — |
| (1) | Computed using average shares outstanding. |
| (2) | Amount is less than $(0.0005). |
| (3) | Returns are historical and are calculated by determining the percentage change in net asset value with all distributions reinvested. |
| (4) | The administrator and sub-adviser reimbursed certain operating expenses (equal to 0.04%, 0.03%, 0.02%, 0.03% and 0.02% of average daily net assets for the six months ended April 30, 2024 and the years ended October 31, 2023, 2022, 2020 and 2019, respectively). Absent this reimbursement, total return would be lower. |
| (5) | Not annualized. |
| (6) | Includes the Fund’s share of the Portfolio's allocated expenses for the period while the Fund was investing in the Portfolio. |
| (7) | Annualized. |
| (8) | Includes a reduction by the investment adviser of a portion of its adviser fee due to the Fund’s and Portfolio’s investment in the Liquidity Fund (equal to less than 0.005% of average daily net assets for the six months ended April 30, 2024 and the years ended October 31, 2023 and 2022). |
| (9) | Portfolio turnover represents the rate of portfolio activity for the period while the Fund was investing in the Portfolio. |
| (10) | For the period from June 17, 2023 through October 31, 2023 when the Fund was making investments directly in securities. |
| References to Portfolio herein are to Global Income Builder Portfolio, a Massachusetts business trust in which the Fund invested all of its investable assets prior to the close of business on June 16, 2023 and which had the same investment objectives and policies as the Fund during such period. |
28
See Notes to Financial Statements.
Eaton Vance
Global Income Builder Fund
April 30, 2024
Financial Highlights — continued
| | Class R |
| | Six Months Ended
April 30, 2024
(Unaudited) | Year Ended October 31, |
| | 2023 | 2022 | 2021 | 2020 | 2019 |
| Net asset value — Beginning of period | $ 9.360 | $ 8.890 | $11.320 | $ 9.040 | $ 9.180 | $ 8.600 |
| Income (Loss) From Operations | | | | | | |
| Net investment income(1) | $ 0.256 | $ 0.325 | $ 0.309 | $ 0.247 | $ 0.310 | $ 0.345 |
| Net realized and unrealized gain (loss) | 1.167 | 0.445 | (2.300) | 2.332 | (0.149) | 0.536 |
| Total income (loss) from operations | $ 1.423 | $ 0.770 | $ (1.991) | $ 2.579 | $ 0.161 | $ 0.881 |
| Less Distributions | | | | | | |
| From net investment income | $ (0.203) | $ (0.300) | $ (0.301) | $ (0.299) | $ (0.301) | $ (0.301) |
| From net realized gain | — | — | (0.138) | — | — | — |
| Total distributions | $ (0.203) | $(0.300) | $ (0.439) | $ (0.299) | $(0.301) | $(0.301) |
| Portfolio transaction fee, net(1) | $ — | $(0.000) (2) | $ (0.000)(2) | $ (0.000)(2) | $(0.000) (2) | $(0.000) (2) |
| Net asset value — End of period | $10.580 | $ 9.360 | $ 8.890 | $11.320 | $ 9.040 | $ 9.180 |
| Total Return(3)(4) | 15.24% (5) | 8.64% | (18.02)% | 28.76% | 1.87% | 10.59% |
| Ratios/Supplemental Data | | | | | | |
| Net assets, end of period (000’s omitted) | $ 2,007 | $ 1,131 | $ 932 | $ 827 | $ 610 | $ 629 |
| Ratios (as a percentage of average daily net assets):(6) | | | | | | |
| Expenses (4) | 1.42% (7)(8) | 1.42% (8) | 1.42% (8) | 1.42% | 1.42% | 1.49% |
| Net investment income | 4.92% (7) | 3.39% | 3.13% | 2.29% | 3.44% | 3.92% |
| Portfolio Turnover of the Portfolio(9) | — | 46% | 59% | 60% | 118% | 86% |
| Portfolio Turnover of the Fund | 62% (5) | 14% (10) | — | — | — | — |
| (1) | Computed using average shares outstanding. |
| (2) | Amount is less than $(0.0005). |
| (3) | Returns are historical and are calculated by determining the percentage change in net asset value with all distributions reinvested. |
| (4) | The administrator and sub-adviser reimbursed certain operating expenses (equal to 0.04%, 0.03%, 0.02%, 0.03% and 0.02% of average daily net assets for the six months ended April 30, 2024 and the years ended October 31, 2023, 2022, 2020 and 2019, respectively). Absent this reimbursement, total return would be lower. |
| (5) | Not annualized. |
| (6) | Includes the Fund’s share of the Portfolio's allocated expenses for the period while the Fund was investing in the Portfolio. |
| (7) | Annualized. |
| (8) | Includes a reduction by the investment adviser of a portion of its adviser fee due to the Fund’s and Portfolio’s investment in the Liquidity Fund (equal to less than 0.005% of average daily net assets for the six months ended April 30, 2024 and the years ended October 31, 2023 and 2022). |
| (9) | Portfolio turnover represents the rate of portfolio activity for the period while the Fund was investing in the Portfolio. |
| (10) | For the period from June 17, 2023 through October 31, 2023 when the Fund was making investments directly in securities. |
| References to Portfolio herein are to Global Income Builder Portfolio, a Massachusetts business trust in which the Fund invested all of its investable assets prior to the close of business on June 16, 2023 and which had the same investment objectives and policies as the Fund during such period. |
29
See Notes to Financial Statements.
Eaton Vance
Global Income Builder Fund
April 30, 2024
Notes to Financial Statements (Unaudited)
1 Significant Accounting Policies
Eaton Vance Global Income Builder Fund (the Fund) is a diversified series of Eaton Vance Mutual Funds Trust (the Trust). The Trust is a Massachusetts business trust registered under the Investment Company Act of 1940, as amended (the 1940 Act), as an open-end management investment company. The Fund's investment objective is to achieve total return for its shareholders. The Fund offers four classes of shares. Class A shares are generally sold subject to a sales charge imposed at time of purchase. Class C shares are sold at net asset value and are generally subject to a contingent deferred sales charge (see Note 5). Effective November 5, 2020, Class C shares automatically convert to Class A shares eight years after their purchase as described in the Fund’s prospectus. Class I and Class R shares are sold at net asset value and are not subject to a sales charge. Each class represents a pro rata interest in the Fund, but votes separately on class-specific matters and (as noted below) is subject to different expenses. Realized and unrealized gains and losses and net investment income and losses, other than class-specific expenses, are allocated daily to each class of shares based on the relative net assets of each class to the total net assets of the Fund. Each class of shares differs in its distribution plan and certain other class-specific expenses.
The following is a summary of significant accounting policies of the Fund. The policies are in conformity with accounting principles generally accepted in the United States of America (U.S. GAAP). The Fund is an investment company and follows accounting and reporting guidance in the Financial Accounting Standards Board (FASB) Accounting Standards Codification Topic 946.
A Investment Valuation—The following methodologies are used to determine the market value or fair value of investments.
Equity Securities. Equity securities listed on a U.S. securities exchange generally are valued at the last sale or closing price on the day of valuation or, if no sales took place on such date, at the mean between the closing bid and ask prices on the exchange where such securities are principally traded. Equity securities listed on the NASDAQ National Market System are valued at the NASDAQ official closing price. Unlisted or listed securities for which closing sales prices or closing quotations are not available are valued at the mean between the latest available bid and ask prices or, in the case of preferred equity securities that are not listed or traded in the over-the-counter market, by a third party pricing service that uses various techniques that consider factors including, but not limited to, prices or yields of securities with similar characteristics, benchmark yields, broker/dealer quotes, quotes of underlying common stock, issuer spreads, as well as industry and economic events.
Debt Obligations. Debt obligations are generally valued on the basis of valuations provided by third party pricing services, as derived from such services’ pricing models. Inputs to the models may include, but are not limited to, reported trades, executable bid and ask prices, broker/dealer quotations, prices or yields of securities with similar characteristics, interest rates, anticipated prepayments, benchmark curves or information pertaining to the issuer, as well as industry and economic events. The pricing services may use a matrix approach, which considers information regarding securities with similar characteristics to determine the valuation for a security. Short-term debt obligations purchased with a remaining maturity of sixty days or less for which a valuation from a third party pricing service is not readily available may be valued at amortized cost, which approximates fair value.
Senior Floating-Rate Loans. Interests in senior floating-rate loans (Senior Loans) are valued generally at the average mean of bid and ask quotations obtained from a third party pricing service.
Derivatives. Futures contracts are valued at the closing settlement price established by the board of trade or exchange on which they are traded, with adjustments for fair valuation for certain foreign futures contracts as described below. Forward foreign currency exchange contracts are generally valued at the mean of the average bid and average ask prices that are reported by currency dealers to a third party pricing service at the valuation time. Such third party pricing service valuations are supplied for specific settlement periods and the Fund’s forward foreign currency exchange contracts are valued at an interpolated rate between the closest preceding and subsequent settlement period reported by the third party pricing service.
Foreign Securities, Futures Contracts and Currencies. Foreign securities, futures contracts and currencies are valued in U.S. dollars, based on foreign currency exchange rate quotations supplied by a third party pricing service. The pricing service uses a proprietary model to determine the exchange rate. Inputs to the model include reported trades and implied bid/ask spreads. The daily valuation of exchange-traded foreign securities and certain exchange-traded foreign futures contracts generally is determined as of the close of trading on the principal exchange on which such securities and contracts trade. Events occurring after the close of trading on foreign exchanges may result in adjustments to the valuation of foreign securities and certain foreign futures contracts to more accurately reflect their fair value as of the close of regular trading on the New York Stock Exchange. When valuing foreign equity securities and foreign futures contracts that meet certain criteria, the Fund’s Trustees have approved the use of a fair value service that values such securities and foreign futures contracts to reflect market trading that occurs after the close of the applicable foreign markets of comparable securities or other instruments that have a strong correlation to the fair-valued securities and foreign futures contracts.
Other. Investments in management investment companies (including money market funds) that do not trade on an exchange are valued at the net asset value as of the close of each business day.
Fair Valuation. In connection with Rule 2a-5 of the 1940 Act, the Trustees have designated the Fund’s investment adviser as its valuation designee. Investments for which valuations or market quotations are not readily available or are deemed unreliable are valued by the investment adviser, as valuation designee, at fair value using methods that most fairly reflect the security’s “fair value”, which is the amount that the Fund might reasonably expect to receive for the security upon its current sale in the ordinary course. Each such determination is based on a consideration of relevant factors, which are likely to vary from one pricing context to another. These factors may include, but are not limited to, the type of security, the existence of any contractual restrictions on the security’s disposition, the price and extent of public trading in similar securities of the issuer or of comparable companies or entities,
Eaton Vance
Global Income Builder Fund
April 30, 2024
Notes to Financial Statements (Unaudited) — continued
quotations or relevant information obtained from broker/dealers or other market participants, information obtained from the issuer, analysts, and/or the appropriate stock exchange (for exchange-traded securities), an analysis of the company’s or entity’s financial statements, and an evaluation of the forces that influence the issuer and the market(s) in which the security is purchased and sold.
B Investment Transactions—Investment transactions for financial statement purposes are accounted for on a trade date basis. Realized gains and losses on investments sold are determined on the basis of identified cost.
C Income—Dividend income is recorded on the ex-dividend date for dividends received in cash and/or securities. However, if the ex-dividend date has passed, certain dividends from foreign securities are recorded as the Fund is informed of the ex-dividend date. Withholding taxes on foreign dividends, interest and capital gains have been provided for in accordance with the Fund’s understanding of the applicable countries’ tax rules and rates. In consideration of recent decisions rendered by European courts, the Fund and Portfolio have filed additional tax reclaims for previously withheld taxes on dividends earned in certain European Union countries. These filings are subject to various administrative and judicial proceedings within these countries. Due to the uncertainty as to the ultimate resolution of these proceedings, the likelihood of receipt of these reclaims, and the potential timing of payment, no amounts are reflected in the financial statements for such outstanding reclaims. Interest income is recorded on the basis of interest accrued, adjusted for amortization of premium or accretion of discount. Distributions from investment companies are recorded as dividend income, capital gains or return of capital based on the nature of the distribution.
D Federal and Other Taxes—The Fund’s policy is to comply with the provisions of the Internal Revenue Code applicable to regulated investment companies and to distribute to shareholders each year substantially all of its net investment income, and all or substantially all of its net realized capital gains. Accordingly, no provision for federal income or excise tax is necessary.
In addition to the requirements of the Internal Revenue Code, the Fund may also be subject to local taxes on the recognition of capital gains in certain countries. In determining the daily net asset value, the Fund estimates the accrual for such taxes, if any, based on the unrealized appreciation on certain portfolio securities and the related tax rates. Taxes attributable to unrealized appreciation are included in the change in unrealized appreciation (depreciation) on investments. Capital gains taxes on securities sold are included in net realized gain (loss) on investments.
As of April 30, 2024, the Fund had no uncertain tax positions that would require financial statement recognition, de-recognition, or disclosure. The Fund files a U.S. federal income tax return annually after its fiscal year-end, which is subject to examination by the Internal Revenue Service for a period of three years from the date of filing.
E Expenses—The majority of expenses of the Trust are directly identifiable to an individual fund. Expenses which are not readily identifiable to a specific fund are allocated taking into consideration, among other things, the nature and type of expense and the relative size of the funds.
F Foreign Currency Translation—Investment valuations, other assets, and liabilities initially expressed in foreign currencies are translated each business day into U.S. dollars based upon current exchange rates. Purchases and sales of foreign investment securities and income and expenses denominated in foreign currencies are translated into U.S. dollars based upon currency exchange rates in effect on the respective dates of such transactions. Recognized gains or losses on investment transactions attributable to changes in foreign currency exchange rates are recorded for financial statement purposes as net realized gains and losses on investments. That portion of unrealized gains and losses on investments that results from fluctuations in foreign currency exchange rates is not separately disclosed.
G Unfunded Loan Commitments—The Fund may enter into certain loan agreements all or a portion of which may be unfunded. The Fund is obligated to fund these commitments at the borrower's discretion. These commitments, if any, are disclosed in the accompanying Portfolio of Investments.
H Use of Estimates—The preparation of the financial statements in conformity with U.S. GAAP requires management to make estimates and assumptions that affect the reported amounts of assets and liabilities at the date of the financial statements and the reported amounts of income and expense during the reporting period. Actual results could differ from those estimates.
I Indemnifications—Under the Trust’s organizational documents, its officers and Trustees may be indemnified against certain liabilities and expenses arising out of the performance of their duties to the Fund. Under Massachusetts law, if certain conditions prevail, shareholders of a Massachusetts business trust (such as the Trust) could be deemed to have personal liability for the obligations of the Trust. However, the Trust’s Declaration of Trust contains an express disclaimer of liability on the part of Fund shareholders and the By-laws provide that the Trust shall assume, upon request by the shareholder, the defense on behalf of any Fund shareholders. Moreover, the By-laws also provide for indemnification out of Fund property of any shareholder held personally liable solely by reason of being or having been a shareholder for all loss or expense arising from such liability. Additionally, in the normal course of business, the Fund enters into agreements with service providers that may contain indemnification clauses. The Fund’s maximum exposure under these arrangements is unknown as this would involve future claims that may be made against the Fund that have not yet occurred.
J Futures Contracts—Upon entering into a futures contract, the Fund is required to deposit with the broker, either in cash or securities, an amount equal to a certain percentage of the contract amount (initial margin). Subsequent payments, known as variation margin, are made or received by the Fund each business day, depending on the daily fluctuations in the value of the underlying security or index, and are recorded as unrealized gains or losses by the Fund. Gains (losses) are realized upon the expiration or closing of the futures contracts. Should market conditions change unexpectedly, the Fund may not
Eaton Vance
Global Income Builder Fund
April 30, 2024
Notes to Financial Statements (Unaudited) — continued
achieve the anticipated benefits of the futures contracts and may realize a loss. Futures contracts have minimal counterparty risk as they are exchange traded and the clearinghouse for the exchange is substituted as the counterparty, guaranteeing counterparty performance.
K Forward Foreign Currency Exchange Contracts—The Fund may enter into forward foreign currency exchange contracts for the purchase or sale of a specific foreign currency at a fixed price on a future date. The forward foreign currency exchange contracts are adjusted by the daily exchange rate of the underlying currency and any gains or losses are recorded as unrealized until such time as the contracts have been closed. Risks may arise upon entering these contracts from the potential inability of counterparties to meet the terms of their contracts and from movements in the value of a foreign currency relative to the U.S. dollar.
L Capital Transactions—To seek to protect the Portfolio in which the Fund invested all of its investable assets prior to June 17, 2023, (and, indirectly, other investors in the Portfolio) against the costs of accommodating investor inflows and outflows, prior to December 24, 2022, the Portfolio imposed a fee (“Portfolio transaction fee”) on inflows and outflows by Portfolio investors. The Portfolio transaction fee was sized to cover the estimated cost to the Portfolio of, in connection with issuing interests, converting the cash and/or other instruments it received to the desired composition and, in connection with redeeming its interests, converting Portfolio holdings to cash and/or other instruments to be distributed. Such fee, which may have varied over time, was limited to amounts that had been authorized by the Board of Trustees and determined by Eaton Vance Management (EVM) to be appropriate. The maximum Portfolio transaction fee was 2% of the amount of net contributions or withdrawals. The Portfolio transaction fee was recorded as a component of capital transactions on the Statements of Changes in Net Assets. Effective after the close of business on December 23, 2022, the Portfolio transaction fee was discontinued.
M Interim Financial Statements—The interim financial statements relating to April 30, 2024 and for the six months then ended have not been audited by an independent registered public accounting firm, but in the opinion of the Fund’s management, reflect all adjustments, consisting only of normal recurring adjustments, necessary for the fair presentation of the financial statements.
2 Distributions to Shareholders and Income Tax Information
It is the present policy of the Fund to make monthly distributions of all or substantially all of its net investment income and to distribute annually all or substantially all of its net realized capital gains. Distributions to shareholders are recorded on the ex-dividend date. Distributions are declared separately for each class of shares. Shareholders may reinvest income and capital gain distributions in additional shares of the same class of the Fund at the net asset value as of the ex-dividend date or, at the election of the shareholder, receive distributions in cash. Distributions to shareholders are determined in accordance with income tax regulations, which may differ from U.S. GAAP. As required by U.S. GAAP, only distributions in excess of tax basis earnings and profits are reported in the financial statements as a return of capital. Permanent differences between book and tax accounting relating to distributions are reclassified to paid-in capital. For tax purposes, distributions from short-term capital gains are considered to be from ordinary income.
At October 31, 2023, the Fund, for federal income tax purposes, had deferred capital losses of $5,994,945 which would reduce its taxable income arising from future net realized gains on investment transactions, if any, to the extent permitted by the Internal Revenue Code, and thus would reduce the amount of distributions to shareholders, which would otherwise be necessary to relieve the Fund of any liability for federal income or excise tax. The deferred
capital losses are treated as arising on the first day of the Fund’s next taxable year and retain the same short-term or long-term character as when originally deferred. Of the deferred capital losses at October 31, 2023, $5,994,945 are short-term.
The cost and unrealized appreciation (depreciation) of investments, including open derivative contracts, of the Fund at April 30, 2024, as determined on a federal income tax basis, were as follows:
| Aggregate cost | $197,481,195 |
| Gross unrealized appreciation | $ 61,597,457 |
| Gross unrealized depreciation | (6,941,388) |
| Net unrealized appreciation | $ 54,656,069 |
Eaton Vance
Global Income Builder Fund
April 30, 2024
Notes to Financial Statements (Unaudited) — continued
3 Investment Adviser Fee and Other Transactions with Affiliates
The investment adviser fee is earned by Boston Management and Research (BMR), an indirect, wholly-owned subsidiary of Morgan Stanley, as compensation for investment advisory services rendered to the Fund. The investment adviser fee is computed at an annual rate as a percentage of the Fund’s average daily net assets that are not invested in other investment companies for which BMR or its affiliates serve as investment adviser and receive an advisory fee as follows and is payable monthly:
| Average Daily Net Assets | Annual Fee Rate |
| Up to $500 million | 0.550% |
| $500 million but less than $1 billion | 0.525% |
| $1 billion but less than $2.5 billion | 0.500% |
| $2.5 billion and over | 0.475% |
For the six months ended April 30, 2024, the investment adviser fee amounted to $666,210 or 0.55% (annualized) of the Fund’s average daily net assets. Pursuant to an investment sub-advisory agreement, BMR has delegated a portion of the investment management of the Fund to Eaton Vance Advisers International Ltd. (EVAIL), an affiliate of BMR and an indirect, wholly-owned subsidiary of Morgan Stanley. BMR pays EVAIL a portion of its investment adviser fee for sub-advisory services provided to the Fund. The administration fee is earned by EVM, an affiliate of BMR and an indirect, wholly-owned subsidiary of Morgan Stanley, for administering the business affairs of the Fund and is computed at an annual rate of 0.15% of the Fund’s average daily net assets. For the six months ended April 30, 2024, the administration fee amounted to $181,694.
The Fund may invest in a money market fund, the Institutional Class of the Morgan Stanley Institutional Liquidity Funds - Government Portfolio (the “Liquidity Fund”), an open-end management investment company managed by Morgan Stanley Investment Management Inc., a wholly-owned subsidiary of Morgan Stanley. The investment adviser fee paid by the Fund is reduced by an amount equal to its pro rata share of the advisory and administration fees paid by the Fund due to its investment in the Liquidity Fund. For the six months ended April 30, 2024, the investment adviser fee paid was reduced by $2,096 relating to the Fund’s investment in the Liquidity Fund.
EVM and EVAIL have agreed to reimburse the Fund’s expenses to the extent that total annual operating expenses (relating to ordinary operating expenses only and excluding such expenses as brokerage commissions, acquired fund fees and expenses of unaffiliated funds, borrowing costs, taxes or litigation expenses) exceed 1.17%, 1.92%, 0.92% and 1.42% of the Fund’s average daily net assets for Class A, Class C, Class I and Class R, respectively. This agreement may be changed or terminated after March 1, 2025. Pursuant to this agreement, EVM and EVAIL were allocated $42,386 in total of the Fund's operating expenses for the six months ended April 30, 2024.
EVM provides sub-transfer agency and related services to the Fund pursuant to a Sub-Transfer Agency Support Services Agreement. For the six months ended April 30, 2024, EVM earned $6,166 from the Fund pursuant to such agreement, which is included in transfer and dividend disbursing agent fees on the Statement of Operations. The Fund was informed that Eaton Vance Distributors, Inc. (EVD), an affiliate of EVM and the Fund’s principal underwriter, received $12,004 as its portion of the sales charge on sales of Class A shares for the six months ended April 30, 2024. EVD also received distribution and service fees from Class A, Class C and Class R shares (see Note 4) and contingent deferred sales charges (see Note 5).
During the six months ended April 30, 2024, EVM reimbursed the Fund $23,322 for a net realized loss on the sale of an investment security not meeting the Fund's investment guidelines. The reimbursement had no significant impact on total return for each class.
Trustees and officers of the Fund who are members of EVM’s or BMR’s organizations receive remuneration for their services to the Fund out of the investment adviser fee. Trustees of the Fund who are not affiliated with the investment adviser may elect to defer receipt of all or a percentage of their annual fees in accordance with the terms of the Trustees Deferred Compensation Plan. Certain officers and Trustees of the Fund are officers of the above organizations.
4 Distribution Plans
The Fund has in effect a distribution plan for Class A shares (Class A Plan) pursuant to Rule 12b-1 under the 1940 Act. Pursuant to the Class A Plan, the Fund pays EVD a distribution and service fee of 0.25% per annum of its average daily net assets attributable to Class A shares for distribution services and facilities provided to the Fund by EVD, as well as for personal services and/or the maintenance of shareholder accounts. Distribution and service fees paid or accrued to EVD for the six months ended April 30, 2024 amounted to $164,760 for Class A shares.
The Fund also has in effect distribution plans for Class C shares (Class C Plan) and Class R shares (Class R Plan) pursuant to Rule 12b-1 under the 1940 Act. Pursuant to the Class C Plan, the Fund pays EVD amounts equal to 0.75% per annum of its average daily net assets attributable to Class C shares for providing ongoing distribution services and facilities to the Fund. For the six months ended April 30, 2024, the Fund paid or accrued to EVD $50,126 for Class C shares.
Eaton Vance
Global Income Builder Fund
April 30, 2024
Notes to Financial Statements (Unaudited) — continued
The Class R Plan requires the Fund to pay EVD an amount up to 0.50% per annum of its average daily net assets attributable to Class R shares for providing ongoing distribution services and facilities to the Fund. The Trustees of the Trust have currently limited Class R distribution payments to 0.25% per annum of the average daily net assets attributable to Class R shares. For the six months ended April 30, 2024, the Fund paid or accrued to EVD $2,236 for Class R shares.
Pursuant to the Class C and Class R Plans, the Fund also makes payments of service fees to EVD, financial intermediaries and other persons in amounts equal to 0.25% per annum of its average daily net assets attributable to that class. Service fees paid or accrued are for personal services and/or the maintenance of shareholder accounts. They are separate and distinct from the sales commissions and distribution fees payable to EVD. Service fees paid or accrued for the six months ended April 30, 2024 amounted to $16,709 and $2,236 for Class C and Class R shares, respectively.
Distribution and service fees are subject to the limitations contained in the Financial Industry Regulatory Authority Rule 2341(d).
5 Contingent Deferred Sales Charges
A contingent deferred sales charge (CDSC) of 1% generally is imposed on redemptions of Class C shares made within 12 months of purchase. Class A shares may be subject to a 1% CDSC if redeemed within 12 months of purchase (depending on the circumstances of purchase). Generally, the CDSC is based upon the lower of the net asset value at date of redemption or date of purchase. No charge is levied on shares acquired by reinvestment of dividends or capital gain distributions. For the six months ended April 30, 2024, the Fund was informed that EVD received less than $100 of CDSCs paid by Class A and Class C shareholders.
6 Purchases and Sales of Investments
Purchases and sales of investments, other than short-term obligations and including maturities and principal repayments on Senior Loans, aggregated $149,985,913 and $146,164,771, respectively, for the six months ended April 30, 2024.
7 Shares of Beneficial Interest
The Fund’s Declaration of Trust permits the Trustees to issue an unlimited number of full and fractional shares of beneficial interest (without par value). Such shares may be issued in a number of different series (such as the Fund) and classes. Transactions in Fund shares, including direct exchanges pursuant to share class conversions, were as follows:
| | Six Months Ended
April 30, 2024
(Unaudited) | | Year Ended
October 31, 2023 |
| | Shares | Amount | | Shares | Amount |
| Class A | | | | | |
| Sales | 605,022 | $ 6,380,210 | | 798,192 | $ 7,668,604 |
| Issued to shareholders electing to receive payments of distributions in Fund shares | 239,150 | 2,511,913 | | 411,593 | 3,945,474 |
| Redemptions | (857,907) | (8,962,520) | | (2,323,743) | (22,233,027) |
| Net decrease | (13,735) | $ (70,397) | | (1,113,958) | $(10,618,949) |
| Class C | | | | | |
| Sales | 75,510 | $ 784,404 | | 174,558 | $ 1,683,922 |
| Issued to shareholders electing to receive payments of distributions in Fund shares | 21,906 | 227,251 | | 40,087 | 379,095 |
| Redemptions | (235,020) | (2,430,040) | | (556,106) | (5,242,453) |
| Net decrease | (137,604) | $ (1,418,385) | | (341,461) | $ (3,179,436) |
Eaton Vance
Global Income Builder Fund
April 30, 2024
Notes to Financial Statements (Unaudited) — continued
| | Six Months Ended
April 30, 2024
(Unaudited) | | Year Ended
October 31, 2023 |
| | Shares | Amount | | Shares | Amount |
| Class I | | | | | |
| Sales | 1,466,362 | $ 15,562,052 | | 1,523,994 | $ 14,648,924 |
| Issued to shareholders electing to receive payments of distributions in Fund shares | 197,902 | 2,076,928 | | 323,392 | 3,096,760 |
| Redemptions | (899,946) | (9,477,699) | | (1,970,133) | (18,915,346) |
| Net increase (decrease) | 764,318 | $ 8,161,281 | | (122,747) | $ (1,169,662) |
| Class R | | | | | |
| Sales | 87,102 | $ 900,467 | | 15,784 | $ 153,136 |
| Issued to shareholders electing to receive payments of distributions in Fund shares | 3,296 | 34,623 | | 3,486 | 33,319 |
| Redemptions | (21,411) | (228,748) | | (3,269) | (31,610) |
| Net increase | 68,987 | $ 706,342 | | 16,001 | $ 154,845 |
8 Restricted Securities
At April 30, 2024, the Fund owned the following security (representing less than 0.05% of net assets) which was restricted as to public resale and not registered under the Securities Act of 1933 (excluding Rule 144A securities). The value of restricted securities is determined based on valuations provided by brokers when available, or if not available, they are valued at fair value using methods determined in good faith by or at the direction of the Trustees’ valuation designee.
| Description | Date(s) of
Acquisition | Shares | Cost | Value |
| Common Stocks | | | | |
| Endo, Inc. | 4/23/24 | 54 | $ 690 | $ 1,546 |
| Total Restricted Securities | | | $690 | $1,546 |
9 Financial Instruments
The Fund may trade in financial instruments with off-balance sheet risk in the normal course of its investing activities. These financial instruments may include forward foreign currency exchange contracts and futures contracts and may involve, to a varying degree, elements of risk in excess of the amounts recognized for financial statement purposes. The notional or contractual amounts of these instruments represent the investment the Fund has in particular classes of financial instruments and do not necessarily represent the amounts potentially subject to risk. The measurement of the risks associated with these instruments is meaningful only when all related and offsetting transactions are considered. A summary of obligations under these financial instruments at April 30, 2024 is included in the Portfolio of Investments. At April 30, 2024, the Fund had sufficient cash and/or securities to cover commitments under these contracts.
In the normal course of pursuing its investment objective, the Fund is subject to the following risks:
Equity Price Risk: The Fund enters into equity futures contracts on securities indices to gain or limit exposure to certain markets, particularly in connection with engaging in the dividend capture trading strategy.
Foreign Exchange Risk: Because the Fund holds foreign currency denominated investments, the value of these investments and related receivables and payables may change due to future changes in foreign currency exchange rates. To hedge against this risk, the Fund enters into forward foreign currency exchange contracts.
Eaton Vance
Global Income Builder Fund
April 30, 2024
Notes to Financial Statements (Unaudited) — continued
The Fund enters into forward foreign currency exchange contracts that may contain provisions whereby the counterparty may terminate the contract under certain conditions, including but not limited to a decline in the Fund’s net assets below a certain level over a certain period of time, which would trigger a payment by the Fund for those derivatives in a liability position. At April 30, 2024, the fair value of derivatives with credit-related contingent features in a net liability position was $90. At April 30, 2024, there were no assets pledged by the Fund for such liability.
The over-the-counter (OTC) derivatives in which the Fund invests are subject to the risk that the counterparty to the contract fails to perform its obligations under the contract. To mitigate this risk, the Fund has entered into an International Swaps and Derivatives Association, Inc. Master Agreement (“ISDA Master Agreement”) or similar agreement with substantially all its derivative counterparties. An ISDA Master Agreement is a bilateral agreement between the Fund and a counterparty that governs certain OTC derivatives and typically contains, among other things, set-off provisions in the event of a default and/or termination event as defined under the relevant ISDA Master Agreement. Under an ISDA Master Agreement, the Fund may, under certain circumstances, offset with the counterparty certain derivative financial instruments’ payables and/or receivables with collateral held and/or posted and create one single net payment. The provisions of the ISDA Master Agreement typically permit a single net payment in the event of default including the bankruptcy or insolvency of the counterparty. However, bankruptcy or insolvency laws of a particular jurisdiction may impose restrictions on or prohibitions against the right of offset in bankruptcy or insolvency. Certain ISDA Master Agreements allow counterparties to OTC derivatives to terminate derivative contracts prior to maturity in the event the Fund’s net assets decline by a stated percentage or the Fund fails to meet the terms of its ISDA Master Agreements, which would cause the counterparty to accelerate payment by the Fund of any net liability owed to it.
The collateral requirements for derivatives traded under an ISDA Master Agreement are governed by a Credit Support Annex to the ISDA Master Agreement. Collateral requirements are determined at the close of business each day and are typically based on changes in market values for each transaction under an ISDA Master Agreement and netted into one amount for such agreement. Generally, the amount of collateral due from or to a counterparty is subject to a minimum transfer threshold amount before a transfer is required, which may vary by counterparty. Collateral pledged for the benefit of the Fund and/or counterparty is held in segregated accounts by the Fund’s custodian and cannot be sold, re-pledged, assigned or otherwise used while pledged. The portion of such collateral representing cash, if any, is reflected as deposits for derivatives collateral and, in the case of cash pledged by a counterparty for the benefit of the Fund, a corresponding liability on the Statement of Assets and Liabilities. Securities pledged by the Fund as collateral, if any, are identified as such in the Portfolio of Investments.
The fair value of open derivative instruments (not considered to be hedging instruments for accounting disclosure purposes) by risk exposure at April 30, 2024 was as follows:
| | | Fair Value |
| Risk | Derivative | Asset Derivative | Liability Derivative |
| Equity Price | Futures contracts | $ — | $ (643,940)(1) |
| Foreign Exchange | Forward foreign currency exchange contracts | — | (90) (2) |
| Total | $ — | $(644,030) |
| Derivatives not subject to master netting or similar agreements | $ — | $(643,940) |
| Total Derivatives subject to master netting or similar agreements | $ — | $ (90) |
| (1) | Only the current day’s variation margin on open futures contracts is reported within the Statement of Assets and Liabilities as Receivable or Payable for variation margin on open futures contracts, as applicable. |
| (2) | Statement of Assets and Liabilities location: Payable for open forward foreign currency exchange contracts. |
Eaton Vance
Global Income Builder Fund
April 30, 2024
Notes to Financial Statements (Unaudited) — continued
The Fund’s derivative assets and liabilities at fair value by risk, which are reported gross in the Statement of Assets and Liabilities, are presented in the table above. The following table presents the Fund’s derivative liabilities by counterparty, net of amounts available for offset under a master netting agreement and net of the related collateral pledged by the Fund for such liabilities as of April 30, 2024.
| Counterparty | Derivative
Liabilities Subject to
Master Netting
Agreement | Derivatives
Available
for Offset | Non-cash
Collateral
Pledged(a) | Cash
Collateral
Pledged(a) | Net Amount
of Derivative
Liabilities(b) |
| JPMorgan Chase Bank, N.A. | $(90) | $ — | $ — | $ — | $(90) |
| (a) | In some instances, the total collateral received and/or pledged may be more than the amount shown due to overcollateralization. |
| (b) | Net amount represents the net amount payable to the counterparty in the event of default. |
The effect of derivative instruments (not considered to be hedging instruments for accounting disclosure purposes) on the Statement of Operations by risk exposure for the six months ended April 30, 2024 was as follows:
| Risk | Derivative | Realized Gain (Loss)
on Derivatives Recognized
in Income(1) | Change in Unrealized
Appreciation (Depreciation) on
Derivatives Recognized in Income(2) |
| Equity Price | Futures contracts | $(1,768,016) | $ (643,940) |
| Foreign Exchange | Forward foreign currency exchange contracts | 1,672,122 | (90) |
| Total | $ (95,894) | $(644,030) |
| (1) | Statement of Operations location: Net realized gain (loss): Futures contracts and Forward foreign currency exchange contracts, respectively. |
| (2) | Statement of Operations location: Change in unrealized appreciation (depreciation): Futures contracts and Forward foreign currency exchange contracts, respectively. |
The average notional cost of futures contracts and average notional amounts of other derivative contracts outstanding during the six months ended April 30, 2024, which are indicative of the volume of these derivative types, were approximately as follows:
Futures
Contracts — Long | Futures
Contracts — Short | Forward
Foreign Currency
Exchange Contracts* |
| $10,710,000 | $10,533,000 | $3,020,000 |
| * | The average notional amount for forward foreign currency exchange contracts is based on the absolute value of notional amounts of currency purchased and currency sold. |
10 Line of Credit
The Fund participates with other portfolios and funds managed by EVM and its affiliates in a $650 million unsecured revolving line of credit agreement with a group of banks, which is in effect through October 22, 2024. Borrowings are made by the Fund solely for temporary purposes related to redemptions and other short-term cash needs. Interest is charged to the Fund based on its borrowings at an amount above either the Secured Overnight Financing Rate (SOFR) or Federal Funds rate. In addition, a fee computed at an annual rate of 0.15% on the daily unused portion of the line of credit is allocated among the participating portfolios and funds at the end of each quarter. In connection with the renewal of the agreement in October 2023, an arrangement fee of $150,000 was incurred that was allocated to the participating portfolios and funds. Because the line of credit is not available exclusively to the Fund, it may be unable to borrow some or all of its requested amounts at any particular time. The Fund did not have any significant borrowings or allocated fees during the six months ended April 30, 2024.
Eaton Vance
Global Income Builder Fund
April 30, 2024
Notes to Financial Statements (Unaudited) — continued
11 Affiliated Investments
At April 30, 2024, the value of the Fund's investment in funds that may be deemed to be affiliated was $6,335,541, which represents 2.5% of the Fund's net assets. Transactions in such investments by the Fund for the six months ended April 30, 2024 were as follows:
| Name | Value,
beginning
of period | Purchases | Sales
proceeds | Net realized
gain (loss) | Change in
unrealized
appreciation
(depreciation) | Value, end
of period | Dividend
income | Shares,
end of period |
| Short-Term Investments |
| Liquidity Fund | $1,761,122 | $40,033,569 | $(35,459,150) | $ — | $ — | $6,335,541 | $74,828 | 6,335,541 |
12 Fair Value Measurements
Under generally accepted accounting principles for fair value measurements, a three-tier hierarchy to prioritize the assumptions, referred to as inputs, is used in valuation techniques to measure fair value. The three-tier hierarchy of inputs is summarized in the three broad levels listed below.
| • | Level 1 – quoted prices in active markets for identical investments |
| • | Level 2 – other significant observable inputs (including quoted prices for similar investments, interest rates, prepayment speeds, credit risk, etc.) |
| • | Level 3 – significant unobservable inputs (including a fund's own assumptions in determining the fair value of investments) |
In cases where the inputs used to measure fair value fall in different levels of the fair value hierarchy, the level disclosed is determined based on the lowest level input that is significant to the fair value measurement in its entirety. The inputs or methodology used for valuing securities are not necessarily an indication of the risk associated with investing in those securities.
At April 30, 2024, the hierarchy of inputs used in valuing the Fund’s investments and open derivative instruments, which are carried at fair value, were as follows:
| Asset Description | Level 1 | Level 2 | Level 3* | Total |
| Common Stocks: | | | | |
| Communication Services | $ 8,291,683 | $ 954,803 | $ — | $ 9,246,486 |
| Consumer Discretionary | 7,522,130 | 8,806,873 | — | 16,329,003 |
| Consumer Staples | 938,077 | 4,890,890 | — | 5,828,967 |
| Energy | 6,877,816 | — | — | 6,877,816 |
| Financials | 8,357,726 | 18,780,734 | — | 27,138,460 |
| Health Care | 13,181,669 | 13,405,843 | — | 26,587,512 |
| Industrials | 7,276,588 | 13,778,378 | — | 21,054,966 |
| Information Technology | 23,976,350 | 7,237,469 | — | 31,213,819 |
| Materials | — | 4,326,050 | — | 4,326,050 |
| Real Estate | 852,934 | — | — | 852,934 |
| Utilities | 1,153,354 | 2,948,002 | — | 4,101,356 |
| Total Common Stocks | $ 78,428,327 | $ 75,129,042** | $ — | $ 153,557,369 |
| Convertible Bonds | $ — | $ 933,171 | $ — | $ 933,171 |
| Corporate Bonds | — | 85,786,890 | — | 85,786,890 |
| Preferred Stocks: | | | | |
| Communication Services | 99,032 | — | — | 99,032 |
| Financials | 315,994 | 66,900 | — | 382,894 |
| Industrials | 214,788 | — | — | 214,788 |
Eaton Vance
Global Income Builder Fund
April 30, 2024
Notes to Financial Statements (Unaudited) — continued
| Asset Description (continued) | Level 1 | Level 2 | Level 3* | Total |
| Utilities | $ 296,694 | $ — | $ — | $ 296,694 |
| Total Preferred Stocks | $ 926,508 | $ 66,900 | $ — | $ 993,408 |
| Senior Floating-Rate Loans (Less Unfunded Loan Commitments) | $ — | $ 5,158,035 | $ — | $ 5,158,035 |
| Miscellaneous | — | 16,880 | 0 | 16,880 |
| Short-Term Investments | 6,335,541 | — | — | 6,335,541 |
| Total Investments | $ 85,690,376 | $ 167,090,918 | $ 0 | $ 252,781,294 |
| Liability Description | | | | |
| Forward Foreign Currency Exchange Contracts | $ — | $ (90) | $ — | $ (90) |
| Futures Contracts | (643,940) | — | — | (643,940) |
| Total | $ (643,940) | $ (90) | $ — | $ (644,030) |
| * | None of the unobservable inputs for Level 3 assets, individually or collectively, had a material impact on the Fund. |
| ** | Includes foreign equity securities whose values were adjusted to reflect market trading of comparable securities or other correlated instruments that occurred after the close of trading in their applicable foreign markets. |
Level 3 investments at the beginning and/or end of the period in relation to net assets were not significant and accordingly, a reconciliation of Level 3 assets for the six months ended April 30, 2024 is not presented.
13 Risks and Uncertainties
Risks Associated with Foreign Investments
Foreign investments can be adversely affected by political, economic and market developments abroad, including the imposition of economic and other sanctions by the United States or another country. There may be less publicly available information about foreign issuers because they may not be subject to reporting practices, requirements or regulations comparable to those to which United States companies are subject. Foreign markets may be smaller, less liquid and more volatile than the major markets in the United States. Trading in foreign markets typically involves higher expense than trading in the United States. The Fund may have difficulties enforcing its legal or contractual rights in a foreign country. Securities that trade or are denominated in currencies other than the U.S. dollar may be adversely affected by fluctuations in currency exchange rates.
Eaton Vance
Global Income Builder Fund
April 30, 2024
| Officers |
Kenneth A. Topping
President | Nicholas S. Di Lorenzo
Secretary |
Deidre E. Walsh
Vice President and Chief Legal Officer | Laura T. Donovan
Chief Compliance Officer |
James F. Kirchner
Treasurer | |
George J. Gorman
Chairperson | |
| Alan C. Bowser | |
| Mark R. Fetting | |
| Cynthia E. Frost | |
| Valerie A. Mosley | |
| Anchal Pachnanda* | |
| Keith Quinton | |
| Marcus L. Smith | |
| Susan J. Sutherland | |
| Scott E. Wennerholm | |
| Nancy A. Wiser | |
| U.S. Customer Privacy Notice | March 2024 |
| FACTS | WHAT DOES EATON VANCE DO WITH YOUR PERSONAL INFORMATION? |
| Why? | Financial companies choose how they share your personal information. Federal law gives consumers the right to limit some but not all sharing. Federal law also requires us to tell you how we collect, share, and protect your personal information. Please read this notice carefully to understand what we do. |
| |
| What? | The types of personal information we collect and share depend on the product or service you have with us. This information can include:■ Social Security number and income
■ investment experience and risk tolerance
■ checking account information and wire transfer instructions |
| |
| How? | All financial companies need to share customers’ personal information to run their everyday business. In the section below, we list the reasons financial companies can share their customers’ personal information; the reasons Eaton Vance chooses to share; and whether you can limit this sharing. |
| Reasons we can share your personal information | Does Eaton Vance
share? | Can you limit
this sharing? |
| For our everyday business purposes — such as to process your transactions, maintain your account(s), respond to court orders and legal investigations, or report to credit bureaus | Yes | No |
| For our marketing purposes — to offer our products and services to you | Yes | No |
| For joint marketing with other financial companies | No | We don’t share |
| For our affiliates’ everyday business purposes — information about your transactions and experiences | Yes | No* |
| For our affiliates’ everyday business purposes — information about your creditworthiness | Yes | Yes* |
| For our affiliates to market to you | Yes | Yes* |
| For nonaffiliates to market to you | No | We don’t share |
To limit our
sharing | Call toll-free 1-800-262-1122 or email: EVPrivacy@eatonvance.comPlease note:If you are a new customer, we can begin sharing your information 30 days from the date we sent this notice. When you are no longer our customer, we continue to share your information as described in this notice. However, you can contact us at any time to limit our sharing. |
| Questions? | Call toll-free 1-800-262-1122 or email: EVPrivacy@eatonvance.com |
| U.S. Customer Privacy Notice — continued | March 2024 |
| Who we are |
| Who is providing this notice? | Eaton Vance Management and our investment management affiliates (“Eaton Vance”) (see Affiliates definition below.) |
| What we do |
How does Eaton Vance
protect my personal
information? | To protect your personal information from unauthorized access and use, we use security measures that comply with federal law. These measures include computer safeguards and secured files and buildings. We have policies governing the proper handling of customer information by personnel and requiring third parties that provide support to adhere to appropriate security standards with respect to such information. |
How does Eaton Vance
collect my personal
information? | We collect your personal information, for example, when you■ open an account or make deposits or withdrawals from your account
■ buy securities from us or make a wire transfer
■ give us your contact informationWe also collect your personal information from others, such as credit bureaus, affiliates, or other companies. |
| Why can’t I limit all sharing? | Federal law gives you the right to limit only■ sharing for affiliates’ everyday business purposes — information about your creditworthiness
■ affiliates from using your information to market to you
■ sharing for nonaffiliates to market to youState laws and individual companies may give you additional rights to limit sharing. (See below for more on your rights under state law.) |
What happens when I limit
sharing for an account I hold
jointly with someone else? | Your choices will apply to everyone on your account. |
| Definitions |
| Affiliates | Companies related by common ownership or control. They can be financial and nonfinancial companies.■ Our affiliates include registered investment advisers such as Eaton Vance Management, Eaton Vance Advisers International Ltd., Boston Management and Research, Calvert Research and Management, Parametric Portfolio Associates LLC, Atlanta Capital Management Company LLC, Morgan Stanley Investment Management Inc., Morgan Stanley Investment Management Co.; registered broker-dealers such as Morgan Stanley Distributors Inc. and Eaton Vance Distributors, Inc. (together, the “Investment Management Affiliates”); and companies with a Morgan Stanley name and financial companies such as Morgan Stanley Smith Barney LLC and Morgan Stanley & Co. (the “Morgan Stanley Affiliates”). |
| Nonaffiliates | Companies not related by common ownership or control. They can be financial and nonfinancial companies.■ Eaton Vance does not share with nonaffiliates so they can market to you. |
| Joint marketing | A formal agreement between nonaffiliated financial companies that together market financial products or services to you.■ Eaton Vance does not jointly market. |
| U.S. Customer Privacy Notice — continued | March 2024 |
| Other important information |
| *PLEASE NOTE: Eaton Vance does not share your creditworthiness information or your transactions and experiences information with the Morgan Stanley Affiliates, nor does Eaton Vance enable the Morgan Stanley Affiliates to market to you. Your opt outs will prevent Eaton Vance from sharing your creditworthiness information with the Investment Management Affiliates and will prevent the Investment Management Affiliates from marketing their products to you.Vermont: Except as permitted by law, we will not share personal information we collect about Vermont residents with Nonaffiliates unless you provide us with your written consent to share such information.California: Except as permitted by law, we will not share personal information we collect about California residents with Nonaffiliates and we will limit sharing such personal information with our Affiliates to comply with California privacy laws that apply to us. |
Delivery of Shareholder Documents. The Securities and Exchange Commission (SEC) permits funds to deliver only one copy of shareholder documents, including prospectuses, proxy statements and shareholder reports, to fund investors with multiple accounts at the same residential or post office box address. This practice is often called “householding” and it helps eliminate duplicate mailings to shareholders. Eaton Vance, or your financial intermediary, may household the mailing of your documents indefinitely unless you instruct Eaton Vance, or your financial intermediary, otherwise. If you would prefer that your Eaton Vance documents not be householded, please contact Eaton Vance at 1-800-262-1122, or contact your financial intermediary. Your instructions that householding not apply to delivery of your Eaton Vance documents will typically be effective within 30 days of receipt by Eaton Vance or your financial intermediary.
Portfolio Holdings. Each Eaton Vance Fund and its underlying Portfolio(s) (if applicable) files a schedule of portfolio holdings on Part F to Form N-PORT with the SEC. Certain information filed on Form N-PORT may be viewed on the Eaton Vance website at www.eatonvance.com, by calling Eaton Vance at 1-800-262-1122 or in the EDGAR database on the SEC’s website at www.sec.gov.
Proxy Voting. From time to time, funds are required to vote proxies related to the securities held by the funds. The Eaton Vance Funds or their underlying Portfolios (if applicable) vote proxies according to a set of policies and procedures approved by the Funds’ and Portfolios’ Boards. You may obtain a description of these policies and procedures and information on how the Funds or Portfolios voted proxies relating to portfolio securities during the most recent 12-month period ended June 30, without charge, upon request, by calling 1-800-262-1122 and by accessing the SEC’s website at www.sec.gov.
Tailored Shareholder Reports. Effective January 24, 2023, the SEC adopted rule and form amendments to require open-end mutual funds and ETFs to transmit concise and visually engaging streamlined annual and semi-annual reports to shareholders that highlight key information. Other information, including financial statements, will no longer appear in a streamlined shareholder report but must be available online, delivered free of charge upon request, and filed on a semi-annual basis on Form N-CSR. The rule and form amendments have a compliance date of July 24, 2024. At this time, management is evaluating the impact of these amendments on the shareholder reports for the Eaton Vance Funds.
Investment Adviser
Boston Management and Research
One Post Office Square
Boston, MA 02109
Administrator
Eaton Vance Management
One Post Office Square
Boston, MA 02109
Investment Sub-Adviser
Eaton Vance Advisers International Ltd.
125 Old Broad Street
London, EC2N 1AR
United Kingdom
Principal Underwriter*
Eaton Vance Distributors, Inc.
One Post Office Square
Boston, MA 02109
(617) 482-8260
Custodian
State Street Bank and Trust Company
One Congress Street, Suite 1
Boston, MA 02114-2016
Transfer Agent
BNY Mellon Investment Servicing (US) Inc.
Attn: Eaton Vance Funds
P.O. Box 534439
Pittsburgh, PA 15253-4439
(800) 262-1122
Fund Offices
One Post Office Square
Boston, MA 02109
*FINRA BrokerCheck. Investors may check the background of their Investment Professional by contacting the Financial Industry Regulatory Authority (FINRA). FINRA BrokerCheck is a free tool to help investors check the professional background of current and former FINRA-registered securities firms and brokers. FINRA BrokerCheck is available by calling 1-800-289-9999 and at www.FINRA.org. The FINRA BrokerCheck brochure describing this program is available to investors at www.FINRA.org.
Eaton Vance
Emerging Markets Local Income Fund
Semi-Annual Report
April 30, 2024
Commodity Futures Trading Commission Registration. The Commodity Futures Trading Commission (“CFTC”) has adopted regulations that subject registered investment companies and advisers to regulation by the CFTC if a fund invests more than a prescribed level of its assets in certain CFTC-regulated instruments (including futures, certain options and swap agreements) or markets itself as providing investment exposure to such instruments. The adviser is registered with the CFTC as a commodity pool operator with respect to its management of the Fund. As the commodity pool operator of the Fund, the adviser has claimed relief under the Commodity Exchange Act from certain reporting and recordkeeping requirements. The adviser is also registered as a commodity trading advisor.
Fund shares are not insured by the FDIC and are not deposits or other obligations of, or guaranteed by, any depository institution. Shares are subject to investment risks, including possible loss of principal invested.
This report must be preceded or accompanied by a current summary prospectus or prospectus. Before investing, investors should consider carefully the investment objective, risks, and charges and expenses of a mutual fund. This and other important information is contained in the summary prospectus and prospectus, which can be obtained from a financial intermediary. Prospective investors should read the prospectus carefully before investing. For further information, please call 1-800-262-1122.
Semi-Annual Report April 30, 2024
Eaton Vance
Emerging Markets Local Income Fund
Eaton Vance
Emerging Markets Local Income Fund
April 30, 2024
Performance
Portfolio Manager(s) Brian Shaw, CFA and Patrick Campbell, CFA
| % Average Annual Total Returns1,2 | Class
Inception Date | Performance
Inception Date | Six Months | One Year | Five Years | Ten Years |
| Class A at NAV | 06/27/2007 | 06/27/2007 | 6.19% | 2.45% | 1.99% | 1.10% |
| Class A with 3.25% Maximum Sales Charge | — | — | 2.75 | (0.86) | 1.32 | 0.77 |
| Class C at NAV | 08/03/2010 | 06/27/2007 | 6.10 | 1.78 | 1.28 | 0.54 |
| Class C with 1% Maximum Deferred Sales Charge | — | — | 5.10 | 0.86 | 1.28 | 0.54 |
| Class I at NAV | 11/30/2009 | 06/27/2007 | 6.33 | 2.72 | 2.29 | 1.40 |
|
| J.P. Morgan Government Bond Index: Emerging Markets (JPM GBI-EM) Global Diversified (Unhedged) | — | — | 4.07% | 1.79% | (0.26)% | (0.62)% |
| % Total Annual Operating Expense Ratios3 | Class A | Class C | Class I |
| | 1.13% | 1.85% | 0.85% |
See Endnotes and Additional Disclosures in this report.
Past performance is no guarantee of future results. Returns are historical and are calculated by determining the percentage change in net asset value (NAV) or offering price (as applicable) with all distributions reinvested. Furthermore, returns do not reflect the deduction of taxes that shareholders may have to pay on Fund distributions or upon the redemption of Fund shares. Investment return and principal value will fluctuate so that shares, when redeemed, may be worth more or less than their original cost. Performance for periods less than or equal to one year is cumulative. Performance is for the stated time period only; due to market volatility, current Fund performance may be lower or higher than the quoted return. For performance as of the most recent month-end, please refer to eatonvance.com.
Eaton Vance
Emerging Markets Local Income Fund
April 30, 2024
| Asset Allocation (% of net assets)1 |
| Foreign Currency Exposures (% of net assets)2 |
| Egypt | 16.3% |
| Poland | 12.3 |
| Indonesia | 11.8 |
| Mexico | 11.7 |
| Brazil | 11.4 |
| Malaysia | 10.2 |
| Thailand | 8.1 |
| Uzbekistan | 7.3 |
| Hungary | 7.1 |
| Turkey | 7.1 |
| Czech Republic | 6.6 |
| Colombia | 4.9 |
| Dominican Republic | 4.6 |
| Romania | 4.4 |
| Singapore | 3.6 |
| Serbia | 3.4 |
| Nigeria | 3.1 |
| India | 2.6 |
| South Korea | 2.4 |
| Peru | 2.4 |
| Armenia | 2.2 |
| Taiwan | 2.0 |
| Chile | 1.9 |
| Uruguay | 1.7 |
| Paraguay | 1.6 |
| Kenya | 1.4 |
| Other | 2.2 4 |
| Euro | -13.2 |
| Total Long | 154.8% |
| Total Short | -13.7% |
| Total Net | 141.1% |
Fund invests in an affiliated investment company (Portfolio) with the same objective(s) and policies as the Fund. References to investments are to the Portfolio’s holdings.
Footnotes:
1 Other Net Assets represents other assets less liabilities and includes any investment type that represents less than 1% of net assets.
2 Currency exposures include all foreign exchange denominated assets and currency derivatives. Total exposures may exceed 100% due to implicit leverage created by derivatives.
3 Net of securities sold short.
4 Includes amounts each less than 1.0% or –1.0%, as applicable.
Eaton Vance
Emerging Markets Local Income Fund
April 30, 2024
Endnotes and Additional Disclosures
| 1 | J.P. Morgan Government Bond Index: Emerging Markets (JPM GBI-EM) Global Diversified (Unhedged) is an unmanaged index of local-currency bonds with maturities of more than one year issued by emerging markets governments. Information has been obtained from sources believed to be reliable but J.P. Morgan does not warrant its completeness or accuracy. The Index is used with permission. The Index may not be copied, used, or distributed without J.P. Morgan’s prior written approval. Copyright 2021, J.P. Morgan Chase & Co. All rights reserved. Unless otherwise stated, index returns do not reflect the effect of any applicable sales charges, commissions, expenses, taxes or leverage, as applicable. It is not possible to invest directly in an index. |
| 2 | Total Returns at NAV do not include applicable sales charges. If sales charges were deducted, the returns would be lower. Total Returns shown with maximum sales charge reflect the stated maximum sales charge. Unless otherwise stated, performance does not reflect the deduction of taxes on Fund distributions or redemptions of Fund shares.Effective November 5, 2020, Class C shares automatically convert to Class A shares eight years after purchase. The average annual total returns listed for Class C reflect conversion to Class A shares after eight years. Prior to November 5, 2020, Class C shares automatically converted to Class A shares ten years after purchase. |
| 3 | Source: Fund prospectus. The expense ratios for the current reporting period can be found in the Financial Highlights section of this report. Performance reflects expenses waived and/or reimbursed, if applicable. Without such waivers and/or reimbursements, performance would have been lower. |
| | Fund profile subject to change due to active management. |
Eaton Vance
Emerging Markets Local Income Fund
April 30, 2024
Example
As a Fund shareholder, you incur two types of costs: (1) transaction costs, including sales charges (loads) on purchases; and (2) ongoing costs, including management fees; distribution and/or service fees; and other Fund expenses. This Example is intended to help you understand your ongoing costs (in dollars) of Fund investing and to compare these costs with the ongoing costs of investing in other mutual funds. The Example is based on an investment of $1,000 invested at the beginning of the period and held for the entire period (November 1, 2023 to April 30, 2024).
Actual Expenses
The first section of the table below provides information about actual account values and actual expenses. You may use the information in this section, together with the amount you invested, to estimate the expenses that you paid over the period. Simply divide your account value by $1,000 (for example, an $8,600 account value divided by $1,000 = 8.6), then multiply the result by the number in the first section under the heading entitled “Expenses Paid During Period” to estimate the expenses you paid on your account during this period.
Hypothetical Example for Comparison Purposes
The second section of the table below provides information about hypothetical account values and hypothetical expenses based on the actual Fund expense ratio and an assumed rate of return of 5% per year (before expenses), which is not the actual Fund return. The hypothetical account values and expenses may not be used to estimate the actual ending account balance or expenses you paid for the period. You may use this information to compare the ongoing costs of investing in your Fund and other funds. To do so, compare this 5% hypothetical example with the 5% hypothetical examples that appear in the shareholder reports of the other funds.
Please note that the expenses shown in the table are meant to highlight your ongoing costs only and do not reflect any transactional costs, such as sales charges (loads). Therefore, the second section of the table is useful in comparing ongoing costs only, and will not help you determine the relative total costs of owning different funds. In addition, if these transactional costs were included, your costs would be higher.
| | Beginning
Account Value
(11/1/23) | Ending
Account Value
(4/30/24) | Expenses Paid
During Period*
(11/1/23 – 4/30/24) | Annualized
Expense
Ratio |
| Actual | | | | |
| Class A | $1,000.00 | $1,061.90 | $ 6.51 | 1.27% |
| Class C | $1,000.00 | $1,061.00 | $10.35 | 2.02% |
| Class I | $1,000.00 | $1,063.30 | $ 5.23 | 1.02% |
| |
| Hypothetical | | | | |
| (5% return per year before expenses) | | | | |
| Class A | $1,000.00 | $1,018.55 | $ 6.37 | 1.27% |
| Class C | $1,000.00 | $1,014.82 | $10.12 | 2.02% |
| Class I | $1,000.00 | $1,019.79 | $ 5.12 | 1.02% |
| * | Expenses are equal to the Fund's annualized expense ratio for the indicated Class, multiplied by the average account value over the period, multiplied by 182/366 (to reflect the one-half year period). The Example assumes that the $1,000 was invested at the net asset value per share determined at the close of business on October 31, 2023. The Example reflects the expenses of both the Fund and the Portfolio. |
Eaton Vance
Emerging Markets Local Income Fund
April 30, 2024
Statement of Assets and Liabilities (Unaudited)
| | April 30, 2024 |
| Assets | |
| Investment in Emerging Markets Local Income Portfolio, at value (identified cost $1,140,251,101) | $ 1,021,730,005 |
| Receivable for Fund shares sold | 2,799,343 |
| Total assets | $1,024,529,348 |
| Liabilities | |
| Payable for Fund shares redeemed | $ 5,280,842 |
| Payable to affiliates: | |
| Distribution and service fees | 50,213 |
| Trustees' fees | 43 |
| Accrued expenses | 345,201 |
| Total liabilities | $ 5,676,299 |
| Net Assets | $1,018,853,049 |
| Sources of Net Assets | |
| Paid-in capital | $ 1,146,583,456 |
| Accumulated loss | (127,730,407) |
| Net Assets | $1,018,853,049 |
| Class A Shares | |
| Net Assets | $ 98,333,177 |
| Shares Outstanding | 29,721,166 |
Net Asset Value and Redemption Price Per Share
(net assets ÷ shares of beneficial interest outstanding) | $ 3.31 |
Maximum Offering Price Per Share
(100 ÷ 96.75 of net asset value per share) | $ 3.42 |
| Class C Shares | |
| Net Assets | $ 35,001,428 |
| Shares Outstanding | 10,462,100 |
Net Asset Value and Offering Price Per Share*
(net assets ÷ shares of beneficial interest outstanding) | $ 3.35 |
| Class I Shares | |
| Net Assets | $ 885,518,444 |
| Shares Outstanding | 267,755,064 |
Net Asset Value, Offering Price and Redemption Price Per Share
(net assets ÷ shares of beneficial interest outstanding) | $ 3.31 |
| On sales of $100,000 or more, the offering price of Class A shares is reduced. |
| * | Redemption price per share is equal to the net asset value less any applicable contingent deferred sales charge. |
6
See Notes to Financial Statements.
Eaton Vance
Emerging Markets Local Income Fund
April 30, 2024
Statement of Operations (Unaudited)
| | Six Months Ended |
| | April 30, 2024 |
| Investment Income | |
| Dividend income allocated from Portfolio | $ 1,795,990 |
| Interest income allocated from Portfolio (net of foreign taxes withheld of $576,955) | 40,784,973 |
| Other income allocated from Portfolio | 7,493 |
| Expenses, excluding interest expense, allocated from Portfolio | (3,847,729) |
| Interest expense allocated from Portfolio | (684,154) |
| Total investment income from Portfolio | $ 38,056,573 |
| Expenses | |
| Distribution and service fees: | |
| Class A | $ 128,861 |
| Class C | 182,684 |
| Trustees’ fees and expenses | 250 |
| Custodian fee | 29,878 |
| Transfer and dividend disbursing agent fees | 430,908 |
| Legal and accounting services | 42,098 |
| Printing and postage | 248,538 |
| Registration fees | 45,656 |
| Miscellaneous | 12,859 |
| Total expenses | $ 1,121,732 |
| Net investment income | $ 36,934,841 |
| Realized and Unrealized Gain (Loss) from Portfolio | |
| Net realized gain (loss): | |
| Investment transactions (net of foreign capital gains taxes of $8,847) | $(13,950,075) |
| Written options | 277,009 |
| Securities sold short | (652,071) |
| Futures contracts | 46,362 |
| Swap contracts | (2,111,895) |
| Foreign currency transactions | 5,842,653 |
| Forward foreign currency exchange contracts | 13,498,302 |
| Non-deliverable bond forward contracts | 1,318,231 |
| Net realized gain | $ 4,268,516 |
| Change in unrealized appreciation (depreciation): | |
| Investments (including net increase in accrued foreign capital gains taxes of $14,635) | $ 27,871,004 |
| Written options | 276,931 |
| Securities sold short | 431,765 |
| Futures contracts | 191,470 |
| Swap contracts | (834,710) |
| Foreign currency | 296,799 |
| Forward foreign currency exchange contracts | (8,320,235) |
| Non-deliverable bond forward contracts | (499,018) |
| Net change in unrealized appreciation (depreciation) | $ 19,414,006 |
| Net realized and unrealized gain | $ 23,682,522 |
| Net increase in net assets from operations | $ 60,617,363 |
7
See Notes to Financial Statements.
Eaton Vance
Emerging Markets Local Income Fund
April 30, 2024
Statements of Changes in Net Assets
| | Six Months Ended
April 30, 2024
(Unaudited) | Year Ended
October 31, 2023 |
| Increase (Decrease) in Net Assets | | |
| From operations: | | |
| Net investment income | $ 36,934,841 | $ 59,720,996 |
| Net realized gain (loss) | 4,268,516 | (56,435,756) |
| Net change in unrealized appreciation (depreciation) | 19,414,006 | 111,695,869 |
| Net increase in net assets from operations | $ 60,617,363 | $114,981,109 |
| Distributions to shareholders: | | |
| Class A | $ (5,306,805) | $ (9,847,402) |
| Class C | (1,729,731) | (3,317,933) |
| Class I | (47,889,190) | (79,078,812) |
| Total distributions to shareholders | $ (54,925,726) | $ (92,244,147) |
| Tax return of capital to shareholders: | | |
| Class A | $ — | $ (2,439,355) |
| Class C | — | (806,050) |
| Class I | — | (19,424,563) |
| Total tax return of capital to shareholders | $ — | $ (22,669,968) |
| Transactions in shares of beneficial interest: | | |
| Class A | $ 2,290,910 | $ 7,000,865 |
| Class C | (625,642) | 860,554 |
| Class I | 59,234,285 | 114,542,250 |
| Net increase in net assets from Fund share transactions | $ 60,899,553 | $122,403,669 |
| Net increase in net assets | $ 66,591,190 | $122,470,663 |
| Net Assets | | |
| At beginning of period | $ 952,261,859 | $ 829,791,196 |
| At end of period | $1,018,853,049 | $952,261,859 |
8
See Notes to Financial Statements.
Eaton Vance
Emerging Markets Local Income Fund
April 30, 2024
| | Class A |
| | Six Months Ended
April 30, 2024
(Unaudited) | Year Ended October 31, |
| | 2023 | 2022 | 2021 | 2020 | 2019 |
| Net asset value — Beginning of period | $ 3.280 | $ 3.220 | $ 4.590 | $ 5.030 | $ 5.760 | $ 5.190 |
| Income (Loss) From Operations | | | | | | |
| Net investment income(1) | $ 0.117 | $ 0.211 | $ 0.234 | $ 0.228 | $ 0.286 | $ 0.363 |
| Net realized and unrealized gain (loss) | 0.089 | 0.262 | (1.125) | (0.168) | (0.293) | 0.759 |
| Total income (loss) from operations | $ 0.206 | $ 0.473 | $ (0.891) | $ 0.060 | $ (0.007) | $ 1.122 |
| Less Distributions | | | | | | |
| From net investment income | $ (0.176) | $ (0.333) | $ — | $ (0.123) | $ (0.198) | $ (0.552) |
| Tax return of capital | — | (0.080) | (0.479) | (0.377) | (0.525) | — |
| Total distributions | $ (0.176) | $ (0.413) | $ (0.479) | $ (0.500) | $ (0.723) | $ (0.552) |
| Net asset value — End of period | $ 3.310 | $ 3.280 | $ 3.220 | $ 4.590 | $ 5.030 | $ 5.760 |
| Total Return(2) | 6.19% (3) | 14.53% | (20.47)% | 1.06% | (0.31)% (4) | 22.64% (4) |
| Ratios/Supplemental Data | | | | | | |
| Net assets, end of period (000’s omitted) | $98,333 | $95,333 | $87,883 | $145,043 | $129,954 | $152,308 |
| Ratios (as a percentage of average daily net assets):(5) | | | | | | |
| Expenses | 1.27% (6)(7)(8) | 1.13% (7) | 1.19% (7) | 1.16% | 1.20% (4) | 1.20% (4) |
| Net investment income | 6.84% (6) | 6.00% | 5.99% | 4.53% | 5.40% | 6.57% |
| Portfolio Turnover of the Portfolio | 34% (3) | 67% | 33% | 56% | 56% | 46% |
| (1) | Computed using average shares outstanding. |
| (2) | Returns are historical and are calculated by determining the percentage change in net asset value with all distributions reinvested and do not reflect the effect of sales charges. |
| (3) | Not annualized. |
| (4) | The investment adviser reimbursed certain operating expenses (equal to 0.02% of average daily net assets for the years ended October 31, 2020 and 2019). Absent this reimbursement, total return would be lower. |
| (5) | Includes the Fund’s share of the Portfolio’s allocated expenses. |
| (6) | Annualized. |
| (7) | Includes a reduction by the investment adviser of a portion of the Portfolio’s adviser fee due to the Portfolio’s investment in the Liquidity Fund (equal to 0.01%, 0.01% and less than 0.005% of average daily net assets for the six months ended April 30, 2024 and the years ended October 31, 2023 and 2022, respectively). |
| (8) | Includes interest expense, including on securities sold short and reverse repurchase agreements of 0.13% of average daily net assets for the six months ended April 30, 2024. |
9
See Notes to Financial Statements.
Eaton Vance
Emerging Markets Local Income Fund
April 30, 2024
Financial Highlights — continued
| | Class C |
| | Six Months Ended
April 30, 2024
(Unaudited) | Year Ended October 31, |
| | 2023 | 2022 | 2021 | 2020 | 2019 |
| Net asset value — Beginning of period | $ 3.310 | $ 3.260 | $ 4.650 | $ 5.080 | $ 5.820 | $ 5.240 |
| Income (Loss) From Operations | | | | | | |
| Net investment income(1) | $ 0.105 | $ 0.188 | $ 0.209 | $ 0.194 | $ 0.250 | $ 0.328 |
| Net realized and unrealized gain (loss) | 0.099 | 0.254 | (1.142) | (0.154) | (0.298) | 0.770 |
| Total income (loss) from operations | $ 0.204 | $ 0.442 | $ (0.933) | $ 0.040 | $ (0.048) | $ 1.098 |
| Less Distributions | | | | | | |
| From net investment income | $ (0.164) | $ (0.316) | $ — | $ (0.115) | $ (0.190) | $ (0.518) |
| Tax return of capital | — | (0.076) | (0.457) | (0.355) | (0.502) | — |
| Total distributions | $ (0.164) | $ (0.392) | $ (0.457) | $ (0.470) | $ (0.692) | $ (0.518) |
| Net asset value — End of period | $ 3.350 | $ 3.310 | $ 3.260 | $ 4.650 | $ 5.080 | $ 5.820 |
| Total Return(2) | 6.10% (3) | 13.69% | (21.31)% | 0.46% | (0.90)% (4) | 21.87% (4) |
| Ratios/Supplemental Data | | | | | | |
| Net assets, end of period (000’s omitted) | $35,001 | $35,271 | $33,976 | $58,639 | $59,169 | $62,869 |
| Ratios (as a percentage of average daily net assets):(5) | | | | | | |
| Expenses | 2.02% (6)(7)(8) | 1.85% (7) | 1.89% (7) | 1.86% | 1.90% (4) | 1.90% (4) |
| Net investment income | 6.08% (6) | 5.29% | 5.28% | 3.82% | 4.68% | 5.88% |
| Portfolio Turnover of the Portfolio | 34% (3) | 67% | 33% | 56% | 56% | 46% |
| (1) | Computed using average shares outstanding. |
| (2) | Returns are historical and are calculated by determining the percentage change in net asset value with all distributions reinvested and do not reflect the effect of sales charges. |
| (3) | Not annualized. |
| (4) | The investment adviser reimbursed certain operating expenses (equal to 0.02% of average daily net assets for the years ended October 31, 2020 and 2019). Absent this reimbursement, total return would be lower. |
| (5) | Includes the Fund’s share of the Portfolio’s allocated expenses. |
| (6) | Annualized. |
| (7) | Includes a reduction by the investment adviser of a portion of the Portfolio’s adviser fee due to the Portfolio’s investment in the Liquidity Fund (equal to 0.01%, 0.01% and less than 0.005% of average daily net assets for the six months ended April 30, 2024 and the years ended October 31, 2023 and 2022, respectively). |
| (8) | Includes interest expense, including on securities sold short and reverse repurchase agreements of 0.13% of average daily net assets for the six months ended April 30, 2024. |
10
See Notes to Financial Statements.
Eaton Vance
Emerging Markets Local Income Fund
April 30, 2024
Financial Highlights — continued
| | Class I |
| | Six Months Ended
April 30, 2024
(Unaudited) | Year Ended October 31, |
| | 2023 | 2022 | 2021 | 2020 | 2019 |
| Net asset value — Beginning of period | $ 3.280 | $ 3.220 | $ 4.590 | $ 5.020 | $ 5.760 | $ 5.190 |
| Income (Loss) From Operations | | | | | | |
| Net investment income(1) | $ 0.122 | $ 0.221 | $ 0.246 | $ 0.243 | $ 0.301 | $ 0.381 |
| Net realized and unrealized gain (loss) | 0.088 | 0.262 | (1.126) | (0.158) | (0.302) | 0.757 |
| Total income (loss) from operations | $ 0.210 | $ 0.483 | $ (0.880) | $ 0.085 | $ (0.001) | $ 1.138 |
| Less Distributions | | | | | | |
| From net investment income | $ (0.180) | $ (0.341) | $ — | $ (0.127) | $ (0.202) | $ (0.568) |
| Tax return of capital | — | (0.082) | (0.490) | (0.388) | (0.537) | — |
| Total distributions | $ (0.180) | $ (0.423) | $ (0.490) | $ (0.515) | $ (0.739) | $ (0.568) |
| Net asset value — End of period | $ 3.310 | $ 3.280 | $ 3.220 | $ 4.590 | $ 5.020 | $ 5.760 |
| Total Return(2) | 6.33% (3) | 15.22% | (20.48)% | 1.36% | (0.01)% (4) | 23.00% (4) |
| Ratios/Supplemental Data | | | | | | |
| Net assets, end of period (000’s omitted) | $885,518 | $821,658 | $707,932 | $1,217,836 | $983,273 | $938,608 |
| Ratios (as a percentage of average daily net assets):(5) | | | | | | |
| Expenses | 1.02% (6)(7)(8) | 0.85% (7) | 0.89% (7) | 0.86% | 0.90% (4) | 0.90% (4) |
| Net investment income | 7.11% (6) | 6.28% | 6.28% | 4.86% | 5.68% | 6.90% |
| Portfolio Turnover of the Portfolio | 34% (3) | 67% | 33% | 56% | 56% | 46% |
| (1) | Computed using average shares outstanding. |
| (2) | Returns are historical and are calculated by determining the percentage change in net asset value with all distributions reinvested. |
| (3) | Not annualized. |
| (4) | The investment adviser reimbursed certain operating expenses (equal to 0.02% of average daily net assets for the years ended October 31, 2020 and 2019). Absent this reimbursement, total return would be lower. |
| (5) | Includes the Fund’s share of the Portfolio’s allocated expenses. |
| (6) | Annualized. |
| (7) | Includes a reduction by the investment adviser of a portion of the Portfolio’s adviser fee due to the Portfolio’s investment in the Liquidity Fund (equal to 0.01%, 0.01% and less than 0.005% of average daily net assets for the six months ended April 30, 2024 and the years ended October 31, 2023 and 2022, respectively). |
| (8) | Includes interest expense, including on securities sold short and reverse repurchase agreements of 0.13% of average daily net assets for the six months ended April 30, 2024. |
11
See Notes to Financial Statements.
Eaton Vance
Emerging Markets Local Income Fund
April 30, 2024
Notes to Financial Statements (Unaudited)
1 Significant Accounting Policies
Eaton Vance Emerging Markets Local Income Fund (the Fund) is a non-diversified series of Eaton Vance Mutual Funds Trust (the Trust). The Trust is a Massachusetts business trust registered under the Investment Company Act of 1940, as amended (the 1940 Act), as an open-end management investment company. The Fund offers three classes of shares. Class A shares are generally sold subject to a sales charge imposed at time of purchase. Class C shares are sold at net asset value and are generally subject to a contingent deferred sales charge (see Note 5). Effective November 5, 2020, Class C shares automatically convert to Class A shares eight years after their purchase as described in the Fund’s prospectus. Class I shares are sold at net asset value and are not subject to a sales charge. Each class represents a pro rata interest in the Fund, but votes separately on class-specific matters and (as noted below) is subject to different expenses. Realized and unrealized gains and losses and net investment income and losses, other than class-specific expenses, are allocated daily to each class of shares based on the relative net assets of each class to the total net assets of the Fund. Each class of shares differs in its distribution plan and certain other class-specific expenses. The Fund invests its assets in interests in Emerging Markets Local Income Portfolio (the Portfolio), a Massachusetts business trust, having the same investment objective and policies as the Fund. The value of the Fund’s investment in the Portfolio reflects the Fund’s proportionate interest in the net assets of the Portfolio (83.2% at April 30, 2024). The performance of the Fund is directly affected by the performance of the Portfolio. The financial statements of the Portfolio, including the portfolio of investments, are included elsewhere in this report and should be read in conjunction with the Fund’s financial statements.
The following is a summary of significant accounting policies of the Fund. The policies are in conformity with accounting principles generally accepted in the United States of America (U.S. GAAP). The Fund is an investment company and follows accounting and reporting guidance in the Financial Accounting Standards Board (FASB) Accounting Standards Codification Topic 946.
A Investment Valuation—Valuation of securities by the Portfolio is discussed in Note 1A of the Portfolio's Notes to Financial Statements, which are included elsewhere in this report.
B Income—The Fund's net investment income or loss consists of the Fund's pro rata share of the net investment income or loss of the Portfolio, less all actual and accrued expenses of the Fund.
C Federal and Other Taxes—The Fund’s policy is to comply with the provisions of the Internal Revenue Code applicable to regulated investment companies and to distribute to shareholders each year substantially all of its net investment income, and all or substantially all of its net realized capital gains. Accordingly, no provision for federal income or excise tax is necessary.
In addition to the requirements of the Internal Revenue Code, the Fund may also be required to recognize its pro rata share of the capital gains taxes incurred by the Portfolio. In doing so, the daily net asset value would reflect the Fund’s pro rata share of the estimated reserve for such taxes incurred by the Portfolio.
As of April 30, 2024, the Fund had no uncertain tax positions that would require financial statement recognition, de-recognition, or disclosure. The Fund files a U.S. federal income tax return annually after its fiscal year-end, which is subject to examination by the Internal Revenue Service for a period of three years from the date of filing.
D Expenses—The majority of expenses of the Trust are directly identifiable to an individual fund. Expenses which are not readily identifiable to a specific fund are allocated taking into consideration, among other things, the nature and type of expense and the relative size of the funds.
E Use of Estimates—The preparation of the financial statements in conformity with U.S. GAAP requires management to make estimates and assumptions that affect the reported amounts of assets and liabilities at the date of the financial statements and the reported amounts of income and expense during the reporting period. Actual results could differ from those estimates.
F Indemnifications—Under the Trust’s organizational documents, its officers and Trustees may be indemnified against certain liabilities and expenses arising out of the performance of their duties to the Fund. Under Massachusetts law, if certain conditions prevail, shareholders of a Massachusetts business trust (such as the Trust) could be deemed to have personal liability for the obligations of the Trust. However, the Trust’s Declaration of Trust contains an express disclaimer of liability on the part of Fund shareholders and the By-laws provide that the Trust shall assume, upon request by the shareholder, the defense on behalf of any Fund shareholders. Moreover, the By-laws also provide for indemnification out of Fund property of any shareholder held personally liable solely by reason of being or having been a shareholder for all loss or expense arising from such liability. Additionally, in the normal course of business, the Fund enters into agreements with service providers that may contain indemnification clauses. The Fund's maximum exposure under these arrangements is unknown as this would involve future claims that may be made against the Fund that have not yet occurred.
G Other—Investment transactions are accounted for on a trade date basis.
H Interim Financial Statements—The interim financial statements relating to April 30, 2024 and for the six months then ended have not been audited by an independent registered public accounting firm, but in the opinion of the Fund’s management, reflect all adjustments, consisting only of normal recurring adjustments, necessary for the fair presentation of the financial statements.
Eaton Vance
Emerging Markets Local Income Fund
April 30, 2024
Notes to Financial Statements (Unaudited) — continued
2 Distributions to Shareholders and Income Tax Information
The Fund expects to pay any required income distributions monthly and intends to distribute annually all or substantially all of its net realized capital gains. The Fund may include in its distributions amounts attributable to the imputed interest on foreign currency exposures and certain other derivative positions which, in certain circumstances, may result in a return of capital for federal income tax purposes. Distributions to shareholders are recorded on the ex-dividend date. Distributions are declared separately for each class of shares. Shareholders may reinvest income and capital gain distributions in additional shares of the same class of the Fund at the net asset value as of the ex-dividend date or, at the election of the shareholder, receive distributions in cash. Distributions to shareholders are determined in accordance with income tax regulations, which may differ from U.S. GAAP. As required by U.S. GAAP, only distributions in excess of tax basis earnings and profits are reported in the financial statements as a return of capital. Permanent differences between book and tax accounting relating to distributions are reclassified to paid-in capital. For tax purposes, distributions from short-term capital gains are considered to be from ordinary income. For the six months ended April 30, 2024, management estimates that a portion of distributions for the period will be a tax return of capital. The final determination of tax characteristics of the Fund’s distributions will occur at the end of the year and will be reported to the shareholders.
At October 31, 2023, the Fund, for federal income tax purposes, had deferred capital losses of $87,712,000 which would reduce its taxable income arising from future net realized gains on investment transactions, if any, to the extent permitted by the Internal Revenue Code, and thus would reduce the amount of distributions to shareholders, which would otherwise be necessary to relieve the Fund of any liability for federal income or excise tax. The deferred capital losses are treated as arising on the first day of the Fund’s next taxable year and retain the same short-term or long-term character as when originally deferred. Of the deferred capital losses at October 31, 2023, $49,301,701 are short-term and $38,410,299 are long-term.
3 Investment Adviser Fee and Other Transactions with Affiliates
The investment adviser fee is earned by Eaton Vance Management (EVM), an indirect, wholly-owned subsidiary of Morgan Stanley, as compensation for investment advisory services rendered to the Fund. The investment adviser fee is computed at an annual rate as a percentage of the Fund’s average daily net assets that are not invested in other investment companies for which EVM or its affiliates serve as investment adviser or administrator as follows and is payable monthly:
| Average Daily Net Assets | Annual Fee Rate |
| Up to $1 billion | 0.650% |
| $1 billion but less than $2 billion | 0.625% |
| $2 billion but less than $5 billion | 0.600% |
| $5 billion and over | 0.575% |
For the six months ended April 30, 2024, the Fund incurred no investment adviser fee on such assets. To the extent the Fund’s assets are invested in the Portfolio, the Fund is allocated its share of the Portfolio’s investment adviser fee. The Portfolio has engaged Boston Management and Research (BMR) to render investment advisory services. See Note 2 of the Portfolio’s Notes to Financial Statements which are included elsewhere in this report. EVM also serves as the administrator of the Fund, but receives no compensation. Prior to March 1, 2024, EVM had agreed to reimburse the Fund’s expenses to the extent that total annual operating expenses (relating to ordinary operating expenses only and excluding such expenses as brokerage commissions, acquired fund fees of unaffiliated funds, borrowing costs, taxes or litigation expenses) exceeded 1.15%, 1.90% and 0.90% of the Fund’s average daily net assets for Class A, Class C and Class I, respectively. This agreement expired on March 1, 2024. Pursuant to this agreement, no operating expenses were allocated to EVM for the six months ended April 30, 2024.
EVM provides sub-transfer agency and related services to the Fund pursuant to a Sub-Transfer Agency Support Services Agreement. For the six months ended April 30, 2024, EVM earned $30,964 from the Fund pursuant to such agreement, which is included in transfer and dividend disbursing agent fees on the Statement of Operations. The Fund was informed that Eaton Vance Distributors, Inc. (EVD), an affiliate of EVM and the Fund's principal underwriter, received $12,790 as its portion of the sales charge on sales of Class A shares for the six months ended April 30, 2024. The Fund was informed that Morgan Stanley affiliated broker-dealers, which may be deemed to be affiliates of EVM, BMR and EVD, also received a portion of the sales charge on sales of Class A shares for the six months ended April 30, 2024 in the amount of $4,110. EVD also received distribution and service fees from Class A and Class C shares (see Note 4) and contingent deferred sales charges (see Note 5).
Trustees and officers of the Fund who are members of EVM’s or BMR's organizations receive remuneration for their services to the Fund out of the investment adviser fee. Certain officers and Trustees of the Fund and the Portfolio are officers of the above organizations.
Eaton Vance
Emerging Markets Local Income Fund
April 30, 2024
Notes to Financial Statements (Unaudited) — continued
4 Distribution Plans
The Fund has in effect a distribution plan for Class A shares (Class A Plan) pursuant to Rule 12b-1 under the 1940 Act. Pursuant to the Class A Plan, the Fund pays EVD a distribution and service fee of 0.25% per annum of its average daily net assets attributable to Class A shares for distribution services and facilities provided to the Fund by EVD, as well as for personal services and/or the maintenance of shareholder accounts. Distribution and service fees paid or accrued to EVD for the six months ended April 30, 2024 amounted to $128,861 for Class A shares.
The Fund also has in effect a distribution plan for Class C shares (Class C Plan) pursuant to Rule 12b-1 under the 1940 Act. Pursuant to the Class C Plan, the Fund pays EVD amounts equal to 0.75% per annum of its average daily net assets attributable to Class C shares for providing ongoing distribution services and facilities to the Fund. For the six months ended April 30, 2024, the Fund paid or accrued to EVD $137,013 for Class C shares.
Pursuant to the Class C Plan, the Fund also makes payments of service fees to EVD, financial intermediaries and other persons in amounts equal to 0.25% per annum of its average daily net assets attributable to that class. Service fees paid or accrued are for personal services and/or the maintenance of shareholder accounts. They are separate and distinct from the sales commissions and distribution fees payable to EVD. Service fees paid or accrued for the six months ended April 30, 2024 amounted to $45,671 for Class C shares.
Distribution and service fees are subject to the limitations contained in the Financial Industry Regulatory Authority Rule 2341(d).
5 Contingent Deferred Sales Charges
A contingent deferred sales charge (CDSC) of 1% generally is imposed on redemptions of Class C shares made within 12 months of purchase. Class A shares may be subject to a 0.75% CDSC if redeemed within 12 months of purchase (depending on the circumstances of purchase). Generally, the CDSC is based upon the lower of the net asset value at date of redemption or date of purchase. No charge is levied on shares acquired by reinvestment of dividends or capital gain distributions. For the six months ended April 30, 2024, the Fund was informed that EVD received $231 and $2,175 of CDSCs paid by Class A and Class C shareholders, respectively.
6 Investment Transactions
For the six months ended April 30, 2024, increases and decreases in the Fund's investment in the Portfolio aggregated $79,593,519 and $72,902,252, respectively.
7 Shares of Beneficial Interest
The Fund’s Declaration of Trust permits the Trustees to issue an unlimited number of full and fractional shares of beneficial interest (without par value). Such shares may be issued in a number of different series (such as the Fund) and classes. Transactions in Fund shares, including direct exchanges pursuant to share class conversions, were as follows:
| | Six Months Ended
April 30, 2024
(Unaudited) | | Year Ended
October 31, 2023 |
| | Shares | Amount | | Shares | Amount |
| Class A | | | | | |
| Sales | 4,040,924 | $ 14,028,272 | | 12,408,000 | $ 44,242,529 |
| Issued to shareholders electing to receive payments of distributions in Fund shares | 1,329,203 | 4,563,465 | | 3,193,417 | 11,204,993 |
| Redemptions | (4,734,855) | (16,300,827) | | (13,805,396) | (48,446,657) |
| Net increase | 635,272 | $ 2,290,910 | | 1,796,021 | $ 7,000,865 |
| Class C | | | | | |
| Sales | 711,818 | $ 2,481,944 | | 1,902,700 | $ 6,835,469 |
| Issued to shareholders electing to receive payments of distributions in Fund shares | 481,277 | 1,670,432 | | 1,121,803 | 3,976,048 |
| Redemptions | (1,373,359) | (4,778,018) | | (2,818,064) | (9,950,963) |
| Net increase (decrease) | (180,264) | $ (625,642) | | 206,439 | $ 860,554 |
Eaton Vance
Emerging Markets Local Income Fund
April 30, 2024
Notes to Financial Statements (Unaudited) — continued
| | Six Months Ended
April 30, 2024
(Unaudited) | | Year Ended
October 31, 2023 |
| | Shares | Amount | | Shares | Amount |
| Class I | | | | | |
| Sales | 55,435,780 | $ 190,925,054 | | 152,980,912 | $ 543,646,223 |
| Issued to shareholders electing to receive payments of distributions in Fund shares | 12,207,086 | 41,873,263 | | 25,700,360 | 90,021,581 |
| Redemptions | (50,668,100) | (173,564,032) | | (147,868,299) | (519,125,554) |
| Net increase | 16,974,766 | $ 59,234,285 | | 30,812,973 | $ 114,542,250 |
Emerging Markets Local Income Portfolio
April 30, 2024
Portfolio of Investments (Unaudited)
| Foreign Corporate Bonds — 5.3% |
| Security | Principal
Amount
(000's omitted) | Value |
| Brazil — 0.7% |
| Simpar Finance SARL, 10.75%, 2/12/28(1) | BRL | 53,195 | $ 8,529,289 |
| | | | $ 8,529,289 |
| Colombia — 0.3% |
| Patrimonio Autonomo Union Del Sur, 6.66%, 2/28/41(2) | COP | 18,064,979 | $ 3,937,180 |
| | | | $ 3,937,180 |
| Kazakhstan — 0.9% |
| Development Bank of Kazakhstan JSC, 13.00%, 4/15/27(2) | KZT | 4,727,000 | $ 10,571,430 |
| | | | $ 10,571,430 |
| Mexico — 0.0%(3) |
| Petroleos Mexicanos, 7.19%, 9/12/24(2) | MXN | 10,630 | $ 606,761 |
| | | | $ 606,761 |
| Paraguay — 0.5% |
| Itau BBA International PLC, 9.03%, 2/19/30 | PYG | 41,850,780 | $ 6,047,563 |
| | | | $ 6,047,563 |
| Peru — 1.0% |
| Alicorp SAA, 6.875%, 4/17/27(1) | PEN | 25,530 | $ 6,713,870 |
| Telefonica del Peru SAA, 7.375%, 4/10/27(2) | PEN | 24,500 | 5,016,430 |
| | | | $ 11,730,300 |
| Supranational — 1.4% |
| European Bank for Reconstruction & Development: | | | |
| 17.20%, 4/9/26(1) | USD | 4,100 | $ 4,100,324 |
| 17.35%, 3/1/27(1) | USD | 1,500 | 1,476,171 |
| Inter-American Development Bank, 7.35%, 10/6/30 | INR | 1,000,000 | 12,033,858 |
| | | | $ 17,610,353 |
| Uzbekistan — 0.5% |
| International Finance Corp., 16.00%, 2/21/25 | UZS | 27,000,000 | $ 2,117,191 |
| Ipoteka-Bank ATIB, 20.50%, 4/25/27(1) | UZS | 48,010,000 | 3,807,244 |
| | | | $ 5,924,435 |
Total Foreign Corporate Bonds
(identified cost $71,359,420) | | | $ 64,957,311 |
| Loan Participation Notes — 2.2% |
| Security | Principal
Amount
(000's omitted) | Value |
| Uzbekistan — 2.2% |
| Daryo Finance BV (borrower - Uzbek Industrial and Construction Bank ATB), 18.75%, 6/15/25(1)(4)(5) | UZS | 159,404,590 | $ 13,579,723 |
| Europe Asia Investment Finance BV (borrower - Joint Stock Commercial Bank “Asaka”), 18.70%, 7/21/26(1)(4)(5) | UZS | 168,226,770 | 13,803,441 |
Total Loan Participation Notes
(identified cost $28,546,053) | | | $ 27,383,164 |
| Sovereign Government Bonds — 64.6% |
| Security | Principal
Amount
(000's omitted) | Value |
| Albania — 0.2% |
| Albanian Government Bonds, 5.25%, 1/26/29 | ALL | 233,800 | $ 2,515,976 |
| | | | $ 2,515,976 |
| Argentina — 0.4% |
| Bonos Para La Reconstruccion De Una Argentina Libre: | | | |
| 0.00%, 6/30/25 | USD | 2,564 | $ 2,367,194 |
| 3.00%, 5/31/26 | USD | 2,517 | 1,982,972 |
| | | | $ 4,350,166 |
| Armenia — 2.2% |
| Republic of Armenia Treasury Bonds: | | | |
| 9.00%, 4/29/26 | AMD | 212,760 | $ 543,413 |
| 9.25%, 4/29/28 | AMD | 2,549,070 | 6,488,285 |
| 9.60%, 10/29/33 | AMD | 6,155,594 | 15,879,054 |
| 9.75%, 10/29/50 | AMD | 792,413 | 2,063,485 |
| 9.75%, 10/29/52 | AMD | 862,400 | 2,242,346 |
| | | | $ 27,216,583 |
| Bahrain — 0.2% |
| CBB International Sukuk Programme Co. WLL, 6.25%, 11/14/24(1) | USD | 2,624 | $ 2,624,142 |
| | | | $ 2,624,142 |
| Benin — 1.0% |
| Benin Government International Bonds: | | | |
| 4.875%, 1/19/32(1) | EUR | 4,158 | $ 3,771,030 |
| 6.875%, 1/19/52(1) | EUR | 3,656 | 3,184,107 |
16
See Notes to Financial Statements.
Emerging Markets Local Income Portfolio
April 30, 2024
Portfolio of Investments (Unaudited) — continued
| Security | Principal
Amount
(000's omitted) | Value |
| Benin (continued) |
| Benin Government International Bonds: (continued) | | | |
| 7.96%, 2/13/38(1) | USD | 5,665 | $ 5,355,408 |
| | | | $ 12,310,545 |
| Bosnia and Herzegovina — 0.1% |
| Republic of Srpska Treasury Bonds: | | | |
| 1.50%, 5/31/25 | BAM | 1,112 | $ 601,875 |
| 1.50%, 6/9/25 | BAM | 107 | 57,705 |
| 1.50%, 12/24/25 | BAM | 116 | 62,807 |
| 1.50%, 9/25/26 | BAM | 108 | 59,043 |
| 1.50%, 9/26/27 | BAM | 44 | 22,952 |
| | | | $ 804,382 |
| Brazil — 0.4% |
| Brazil Notas do Tesouro Nacional, 10.00%, 1/1/27 | BRL | 22,375 | $ 4,228,780 |
| | | | $ 4,228,780 |
| Chile — 0.4% |
| Bonos de la Tesoreria de la Republica en pesos, 5.30%, 11/1/37(1)(2) | CLP | 5,355,000 | $ 5,183,542 |
| | | | $ 5,183,542 |
| Colombia — 0.7% |
| Titulos De Tesoreria B: | | | |
| 6.25%, 7/9/36 | COP | 11,202,200 | $ 1,988,275 |
| 9.25%, 5/28/42 | COP | 28,416,100 | 6,199,012 |
| 10.00%, 7/24/24 | COP | 3,528,300 | 896,202 |
| | | | $ 9,083,489 |
| Czech Republic — 1.6% |
| Czech Republic Government Bonds: | | | |
| 2.00%, 10/13/33 | CZK | 338,750 | $ 11,868,725 |
| 4.50%, 11/11/32 | CZK | 56,140 | 2,415,269 |
| 4.90%, 4/14/34 | CZK | 130,960 | 5,811,999 |
| | | | $ 20,095,993 |
| Dominican Republic — 4.5% |
| Dominican Republic Bonds: | | | |
| 8.00%, 1/15/27(1) | DOP | 111,360 | $ 1,775,263 |
| 8.00%, 2/12/27(1) | DOP | 568,540 | 9,069,385 |
| 11.25%, 9/15/35(2) | DOP | 140,600 | 2,539,473 |
| 12.00%, 8/8/25(2) | DOP | 616,460 | 10,729,457 |
| 12.75%, 9/23/29(2) | DOP | 377,800 | 7,320,071 |
| 13.00%, 6/10/34(1) | DOP | 35,400 | 724,638 |
| Security | Principal
Amount
(000's omitted) | Value |
| Dominican Republic (continued) |
| Dominican Republic Bonds: (continued) | | | |
| 13.625%, 2/3/33(2) | DOP | 467,800 | $ 9,555,710 |
| Dominican Republic Central Bank Notes: | | | |
| 8.00%, 3/12/27(1) | DOP | 36,140 | 581,768 |
| 12.00%, 10/3/25(2) | DOP | 221,270 | 3,859,451 |
| 13.00%, 12/5/25(2) | DOP | 383,340 | 6,736,933 |
| 13.00%, 1/30/26(2) | DOP | 105,090 | 1,853,991 |
| | | | $ 54,746,140 |
| Hungary — 1.8% |
| Hungary Government Bonds: | | | |
| 2.25%, 4/20/33 | HUF | 1,109,820 | $ 2,073,403 |
| 3.00%, 4/25/41 | HUF | 4,910,850 | 8,113,210 |
| 3.25%, 10/22/31 | HUF | 2,085,200 | 4,435,000 |
| 4.00%, 4/28/51 | HUF | 524,540 | 919,969 |
| 4.50%, 5/27/32 | HUF | 310,850 | 712,847 |
| 4.75%, 11/24/32 | HUF | 2,389,870 | 5,542,842 |
| | | | $ 21,797,271 |
| Indonesia — 10.1% |
| Indonesia Treasury Bonds: | | | |
| 6.375%, 4/15/32 | IDR | 46,500,000 | $ 2,725,286 |
| 6.50%, 2/15/31 | IDR | 490,135,000 | 28,840,293 |
| 6.625%, 2/15/34 | IDR | 389,674,000 | 22,963,446 |
| 7.00%, 2/15/33 | IDR | 235,674,000 | 14,473,587 |
| 7.125%, 6/15/38 | IDR | 37,641,000 | 2,301,958 |
| 7.125%, 6/15/42 | IDR | 78,761,000 | 4,790,844 |
| 7.125%, 6/15/43 | IDR | 162,709,000 | 9,975,533 |
| 7.375%, 5/15/48 | IDR | 16,622,000 | 1,046,338 |
| 7.50%, 5/15/38 | IDR | 232,589,000 | 14,693,370 |
| 7.50%, 4/15/40 | IDR | 45,427,000 | 2,868,598 |
| 8.25%, 6/15/32 | IDR | 11,609,000 | 764,652 |
| 8.25%, 5/15/36 | IDR | 242,576,000 | 16,149,094 |
| 8.375%, 4/15/39 | IDR | 22,764,000 | 1,550,382 |
| 9.50%, 5/15/41 | IDR | 5,702,000 | 431,377 |
| | | | $123,574,758 |
| Jordan — 0.4% |
| Jordan Government International Bonds, 4.95%, 7/7/25(1) | USD | 4,503 | $ 4,333,165 |
| | | | $ 4,333,165 |
17
See Notes to Financial Statements.
Emerging Markets Local Income Portfolio
April 30, 2024
Portfolio of Investments (Unaudited) — continued
| Security | Principal
Amount
(000's omitted) | Value |
| Kenya — 2.0% |
| Republic of Kenya Infrastructure Bonds, 18.461%, 8/9/32 | KES | 3,203,750 | $ 24,727,682 |
| | | | $ 24,727,682 |
| Malaysia — 4.7% |
| Malaysia Government Bonds: | | | |
| 3.582%, 7/15/32 | MYR | 56,072 | $ 11,416,424 |
| 3.733%, 6/15/28 | MYR | 7,900 | 1,651,211 |
| 3.757%, 5/22/40 | MYR | 17,415 | 3,480,034 |
| 3.828%, 7/5/34 | MYR | 143,700 | 29,599,534 |
| 4.254%, 5/31/35 | MYR | 27,750 | 5,920,116 |
| 4.642%, 11/7/33 | MYR | 25,940 | 5,713,532 |
| | | | $ 57,780,851 |
| Mexico — 2.9% |
| Mexican Bonos: | | | |
| 7.75%, 11/13/42 | MXN | 284,000 | $ 13,391,680 |
| 8.50%, 11/18/38 | MXN | 410,469 | 21,250,470 |
| 10.00%, 11/20/36 | MXN | 22,074 | 1,295,026 |
| | | | $ 35,937,176 |
| North Macedonia — 0.1% |
| North Macedonia Government International Bonds: | | | |
| 2.75%, 1/18/25(1) | EUR | 913 | $ 957,906 |
| 3.675%, 6/3/26(1) | EUR | 600 | 624,135 |
| | | | $ 1,582,041 |
| Oman — 0.3% |
| Oman Government International Bonds, 4.875%, 2/1/25(1) | USD | 3,173 | $ 3,144,522 |
| | | | $ 3,144,522 |
| Paraguay — 1.1% |
| Paraguay Government Bonds, 7.90%, 2/9/31(2) | PYG | 93,641,000 | $ 12,934,064 |
| Paraguay Government International Bonds, 5.00%, 4/15/26(1) | USD | 1,135 | 1,115,467 |
| | | | $ 14,049,531 |
| Peru — 4.6% |
| Peru Government Bonds: | | | |
| 5.40%, 8/12/34 | PEN | 47,682 | $ 10,954,214 |
| 5.94%, 2/12/29 | PEN | 77,721 | 20,575,578 |
| 6.15%, 8/12/32 | PEN | 15,223 | 3,820,400 |
| 6.85%, 2/12/42 | PEN | 14,084 | 3,519,684 |
| 6.90%, 8/12/37 | PEN | 8,763 | 2,212,189 |
| Security | Principal
Amount
(000's omitted) | Value |
| Peru (continued) |
| Peru Government Bonds: (continued) | | | |
| 6.95%, 8/12/31 | PEN | 3,863 | $ 1,035,309 |
| 7.30%, 8/12/33(1)(2) | PEN | 55,477 | 14,852,608 |
| | | | $ 56,969,982 |
| Romania — 5.0% |
| Romania Government Bonds: | | | |
| 2.50%, 10/25/27 | RON | 70,650 | $ 13,426,663 |
| 3.25%, 6/24/26 | RON | 57,650 | 11,692,818 |
| 4.15%, 1/26/28 | RON | 64,045 | 12,787,849 |
| 4.25%, 4/28/36 | RON | 56,270 | 9,475,471 |
| 4.85%, 4/22/26 | RON | 32,030 | 6,722,646 |
| 5.80%, 7/26/27 | RON | 16,020 | 3,390,564 |
| 8.75%, 10/30/28 | RON | 6,025 | 1,402,691 |
| Romania Government International Bonds, 2.75%, 2/26/26(1) | EUR | 2,755 | 2,880,450 |
| | | | $ 61,779,152 |
| Serbia — 3.3% |
| Serbia Treasury Bonds: | | | |
| 4.50%, 8/20/32 | RSD | 1,882,430 | $ 15,677,096 |
| 7.00%, 10/26/31 | RSD | 2,574,480 | 25,091,383 |
| | | | $ 40,768,479 |
| Seychelles — 0.0%(3) |
| Seychelles International Bonds, 8.00%, 1/1/26(1) | USD | 393 | $ 396,564 |
| | | | $ 396,564 |
| South Africa — 10.8% |
| Republic of South Africa Government Bonds: | | | |
| 8.00%, 1/31/30 | ZAR | 361,300 | $ 17,054,550 |
| 8.25%, 3/31/32 | ZAR | 181,004 | 8,005,207 |
| 8.50%, 1/31/37 | ZAR | 369,200 | 14,694,740 |
| 8.75%, 1/31/44 | ZAR | 334,087 | 12,599,320 |
| 8.75%, 2/28/48 | ZAR | 69,430 | 2,607,879 |
| 9.00%, 1/31/40 | ZAR | 334,480 | 13,282,346 |
| 10.50%, 12/21/26 | ZAR | 1,172,646 | 63,818,359 |
| | | | $132,062,401 |
| Suriname — 0.2% |
| Suriname Government International Bonds: | | | |
| 0.00%, Oil-Linked, 12/31/50(2) | USD | 3,760 | $ 2,833,160 |
| 7.95%, (4.95% cash and 3.00% PIK), 7/15/33(2) | USD | 58 | 53,643 |
| | | | $ 2,886,803 |
18
See Notes to Financial Statements.
Emerging Markets Local Income Portfolio
April 30, 2024
Portfolio of Investments (Unaudited) — continued
| Security | Principal
Amount
(000's omitted) | Value |
| Thailand — 1.8% |
| Thailand Government Bonds, 3.30%, 6/17/38 | THB | 794,751 | $ 22,107,316 |
| | | | $ 22,107,316 |
| Turkey — 0.6% |
| Turkiye Government Bonds: | | | |
| 17.30%, 7/19/28 | TRY | 171,300 | $ 4,041,011 |
| 26.20%, 10/5/33 | TRY | 100,000 | 3,084,643 |
| | | | $ 7,125,654 |
| Ukraine — 0.1% |
| Ukraine Government Bonds: | | | |
| 15.84%, 2/26/25 | UAH | 24,447 | $ 488,262 |
| 19.19%, 9/30/26 | UAH | 30,935 | 606,745 |
| | | | $ 1,095,007 |
| United Arab Emirates — 0.2% |
| Sharjah Sukuk Ltd., 3.764%, 9/17/24(1) | USD | 2,747 | $ 2,723,939 |
| | | | $ 2,723,939 |
| Uruguay — 1.6% |
| Uruguay Government Bonds: | | | |
| 3.875%, 7/2/40(6) | UYU | 211,074 | $ 5,952,000 |
| 8.25%, 5/21/31 | UYU | 13,050 | 324,681 |
| 9.75%, 7/20/33 | UYU | 493,145 | 13,414,911 |
| | | | $ 19,691,592 |
| Uzbekistan — 0.8% |
| Republic of Uzbekistan Bonds: | | | |
| 14.00%, 7/19/24(1) | UZS | 10,590,000 | $ 832,133 |
| 16.25%, 10/12/26(1) | UZS | 117,030,000 | 9,319,824 |
| | | | $ 10,151,957 |
| Venezuela — 0.2% |
| Venezuela Government International Bonds: | | | |
| 7.00%, 3/31/38(1)(7) | USD | 1,171 | $ 201,576 |
| 7.65%, 4/21/25(1)(7) | USD | 1,931 | 352,920 |
| 8.25%, 10/13/24(1)(7) | USD | 2,926 | 539,033 |
| 9.00%, 5/7/23(1)(7) | USD | 1,000 | 197,351 |
| 9.25%, 9/15/27(7) | USD | 2,545 | 546,666 |
| 9.25%, 5/7/28(1)(7) | USD | 2,263 | 448,521 |
| 9.375%, 1/13/34(7) | USD | 349 | 72,420 |
| 11.75%, 10/21/26(1)(7) | USD | 447 | 97,211 |
| | | | $ 2,455,698 |
| Security | Principal
Amount
(000's omitted) | Value |
| Vietnam — 0.3% |
| Vietnam Government International Bonds, 4.80%, 11/19/24(1) | USD | 3,124 | $ 3,097,372 |
| | | | $ 3,097,372 |
Total Sovereign Government Bonds
(identified cost $878,354,213) | | | $793,398,651 |
| Short-Term Investments — 21.3% |
| Repurchase Agreements — 1.0% |
| Description | Principal
Amount
(000's omitted) | Value |
| JPMorgan Chase Bank, N.A.: | | | |
| Dated 1/8/24 with an interest rate of 10.70%, collateralized by MXN 226,300,000 Mexican Bonos, 8.00%, due 7/31/53 and a market value, including accrued interest, of $10,878,173(8) | MXN | 204,020 | $ 11,909,593 |
Total Repurchase Agreements
(identified cost $12,123,137) | | | $ 11,909,593 |
| Sovereign Government Securities — 17.9% |
| Security | Principal
Amount
(000's omitted) | Value |
| Egypt — 15.5% |
| Egypt Treasury Bills: | | | |
| 0.00%, 9/24/24 | EGP | 3,645,525 | $ 69,310,928 |
| 0.00%, 12/3/24 | EGP | 390,525 | 7,104,889 |
| 0.00%, 12/10/24 | EGP | 2,633,925 | 47,712,604 |
| 0.00%, 12/17/24 | EGP | 2,150,300 | 38,784,212 |
| 0.00%, 3/11/25 | EGP | 1,459,925 | 25,043,763 |
| 0.00%, 3/18/25 | EGP | 151,700 | 2,591,789 |
| | | | $190,548,185 |
| Nigeria — 2.4% |
| Nigeria OMO Bills: | | | |
| 0.00%, 6/4/24 | NGN | 3,484,915 | $ 2,513,372 |
| 0.00%, 7/9/24 | NGN | 289,175 | 204,781 |
| 0.00%, 1/28/25 | NGN | 1,159,983 | 727,350 |
| 0.00%, 2/25/25 | NGN | 1,936,064 | 1,192,118 |
| 0.00%, 4/1/25 | NGN | 2,309,308 | 1,409,582 |
| Nigeria Treasury Bills: | | | |
| 0.00%, 2/6/25 | NGN | 2,368,683 | 1,476,584 |
19
See Notes to Financial Statements.
Emerging Markets Local Income Portfolio
April 30, 2024
Portfolio of Investments (Unaudited) — continued
| Security | Principal
Amount
(000's omitted) | Value |
| Nigeria (continued) |
| Nigeria Treasury Bills: (continued) | | | |
| 0.00%, 2/20/25 | NGN | 9,421,094 | $ 5,819,870 |
| 0.00%, 3/6/25 | NGN | 3,270,700 | 2,002,104 |
| 0.00%, 3/27/25 | NGN | 13,989,990 | 8,446,273 |
| 0.00%, 4/10/25 | NGN | 8,988,325 | 5,376,485 |
| | | | $ 29,168,519 |
Total Sovereign Government Securities
(identified cost $218,651,633) | | | $219,716,704 |
| U.S. Treasury Obligations — 2.4% |
| Security | Principal
Amount
(000's omitted) | Value |
| U.S. Treasury Bills: | | | |
| 0.00%, 5/9/24(9) | $ | 6,745 | $ 6,737,091 |
| 0.00%, 6/13/24(9) | | 6,700 | 6,657,908 |
| 0.00%, 6/20/24(9) | | 6,500 | 6,452,424 |
| 0.00%, 7/11/24(9) | | 10,000 | 9,896,360 |
Total U.S. Treasury Obligations
(identified cost $29,744,981) | | | $ 29,743,783 |
Total Short-Term Investments
(identified cost $260,519,751) | | | $261,370,080 |
| | | |
Total Purchased Options — 0.1%
(identified cost $3,835,774) | | | $ 1,450,715 |
Total Investments — 93.5%
(identified cost $1,242,615,211) | | | $1,148,559,921 |
Total Written Options — (0.0)%(3)
(premiums received $510,182) | | | $ (100,935) |
| Securities Sold Short — (0.9)% |
| Sovereign Government Bonds — (0.9)% |
| Security | Principal
Amount
(000's omitted) | Value |
| Mexico — (0.9)% |
| Mexican Bonos, 8.00%, 7/31/53 | MXN | (226,300) | $ (10,719,651) |
Total Sovereign Government Bonds
(proceeds $11,465,142) | | | $(10,719,651) |
Total Securities Sold Short
(proceeds $11,465,142) | | | $(10,719,651) |
| | | |
| Other Assets, Less Liabilities — 7.4% | | | $ 90,851,722 |
| Net Assets — 100.0% | | | $1,228,591,057 |
| The percentage shown for each investment category in the Portfolio of Investments is based on net assets. |
| (1) | Security exempt from registration under Regulation S of the Securities Act of 1933, as amended, which exempts from registration securities offered and sold outside the United States. Security may not be offered or sold in the United States except pursuant to an exemption from, or in a transaction not subject to, the registration requirements of the Securities Act of 1933, as amended. At April 30, 2024, the aggregate value of these securities is $130,394,042 or 10.6% of the Portfolio's net assets. |
| (2) | Security exempt from registration under Rule 144A of the Securities Act of 1933, as amended. These securities may be sold in certain transactions in reliance on an exemption from registration (normally to qualified institutional buyers). At April 30, 2024, the aggregate value of these securities is $98,583,904 or 8.0% of the Portfolio's net assets. |
| (3) | Amount is less than 0.05% or (0.05)%, as applicable. |
| (4) | For fair value measurement disclosure purposes, security is categorized as Level 3 (see Note 9). |
| (5) | Limited recourse note whose payments by the issuer are limited to amounts received by the issuer from the borrower pursuant to a loan agreement with the borrower. |
| (6) | Inflation-linked security whose principal is adjusted for inflation based on changes in a designated inflation index or inflation rate for the applicable country. Interest is calculated based on the inflation-adjusted principal. |
| (7) | Issuer is in default with respect to interest and/or principal payments. For a variable rate security, interest rate has been adjusted to reflect non-accrual status. |
| (8) | Open repurchase agreement with no specific maturity date. Either party may terminate the agreement upon demand. |
| (9) | Security (or a portion thereof) has been pledged to cover collateral requirements on open derivative contracts. |
20
See Notes to Financial Statements.
Emerging Markets Local Income Portfolio
April 30, 2024
Portfolio of Investments (Unaudited) — continued
| Purchased Currency Options (OTC) — 0.1% |
| Description | Counterparty | Notional Amount | Exercise
Price | Expiration
Date | Value |
| Put USD vs. Call BRL | Goldman Sachs International | USD | 27,995,000 | BRL | 5.01 | 6/11/24 | $ 59,909 |
| Put USD vs. Call BRL | JPMorgan Chase Bank, N.A. | USD | 23,765,000 | BRL | 5.01 | 6/11/24 | 51,213 |
| Put USD vs. Call INR | Citibank, N.A. | USD | 26,870,000 | INR | 84.75 | 4/2/25 | 363,739 |
| Put USD vs. Call INR | JPMorgan Chase Bank, N.A. | USD | 24,100,000 | INR | 85.50 | 1/25/29 | 195,475 |
| Put USD vs. Call INR | JPMorgan Chase Bank, N.A. | USD | 12,900,000 | INR | 85.50 | 1/25/29 | 104,632 |
| Put USD vs. Call INR | JPMorgan Chase Bank, N.A. | USD | 12,500,000 | INR | 85.50 | 1/30/29 | 101,575 |
| Put USD vs. Call MXN | Citibank, N.A. | USD | 16,700,000 | MXN | 17.02 | 5/17/24 | 100,935 |
| Put USD vs. Call MXN | Standard Chartered Bank | USD | 25,773,000 | MXN | 16.72 | 6/20/24 | 100,618 |
| Put USD vs. Call MXN | Standard Chartered Bank | USD | 26,320,000 | MXN | 16.74 | 6/20/24 | 109,544 |
| Put USD vs. Call MXN | Standard Chartered Bank | USD | 9,710,000 | MXN | 16.82 | 7/2/24 | 58,270 |
| Put USD vs. Call MXN | Standard Chartered Bank | USD | 25,771,000 | MXN | 16.75 | 7/3/24 | 128,803 |
| Put USD vs. Call MXN | Standard Chartered Bank | USD | 16,700,000 | MXN | 16.71 | 7/5/24 | 76,002 |
| Total | | | | | | | $1,450,715 |
| Written Currency Options (OTC) — (0.0)%(1) |
| Description | Counterparty | Notional Amount | Exercise
Price | Expiration
Date | Value |
| Put USD vs. Call MXN | Standard Chartered Bank | USD | 16,700,000 | MXN | 17.02 | 5/17/24 | $(100,935) |
| Total | | | | | | | $(100,935) |
| (1) | Amount is less than (0.05)%. |
| Forward Foreign Currency Exchange Contracts (Centrally Cleared) |
| Currency Purchased | Currency Sold | Settlement
Date | Value/Unrealized
Appreciation
(Depreciation) |
| BRL | 7,378,000 | USD | 1,480,319 | 5/3/24 | $ (59,451) |
| BRL | 20,600,000 | USD | 4,070,664 | 5/3/24 | (103,480) |
| USD | 5,414,905 | BRL | 27,978,000 | 5/3/24 | 26,852 |
| COP | 201,401,015,850 | USD | 50,551,829 | 6/20/24 | 411,318 |
| COP | 47,468,000,000 | USD | 11,964,330 | 6/20/24 | 47,122 |
| COP | 100,000,000 | USD | 25,171 | 6/20/24 | 133 |
| COP | 7,230,000,000 | USD | 1,838,544 | 6/20/24 | (9,042) |
| EUR | 2,468,642 | USD | 2,698,067 | 6/20/24 | (58,286) |
| EUR | 10,518,605 | USD | 11,496,158 | 6/20/24 | (248,349) |
| EUR | 251,106,386 | USD | 274,443,116 | 6/20/24 | (5,928,742) |
| IDR | 42,637,000,000 | USD | 2,622,247 | 6/20/24 | (3,765) |
| IDR | 127,006,239,766 | USD | 8,058,516 | 6/20/24 | (258,635) |
| IDR | 1,146,399,064,599 | USD | 73,393,026 | 6/20/24 | (2,988,799) |
| INR | 190,940,000 | USD | 2,297,790 | 6/20/24 | (14,606) |
| INR | 1,028,556,800 | USD | 12,375,849 | 6/20/24 | (76,780) |
21
See Notes to Financial Statements.
Emerging Markets Local Income Portfolio
April 30, 2024
Portfolio of Investments (Unaudited) — continued
| Forward Foreign Currency Exchange Contracts (Centrally Cleared) (continued) |
| Currency Purchased | Currency Sold | Settlement
Date | Value/Unrealized
Appreciation
(Depreciation) |
| INR | 1,428,400,000 | USD | 17,186,861 | 6/20/24 | $ (106,627) |
| KRW | 2,987,420,000 | USD | 2,226,228 | 6/20/24 | (65,724) |
| KRW | 4,601,400,000 | USD | 3,524,222 | 6/20/24 | (196,486) |
| KRW | 44,510,400,000 | USD | 34,090,606 | 6/20/24 | (1,900,653) |
| PEN | 2,893,600 | USD | 780,767 | 6/20/24 | (12,579) |
| PEN | 2,956,500 | USD | 798,299 | 6/20/24 | (13,412) |
| PEN | 16,684,526 | USD | 4,450,275 | 6/20/24 | (20,896) |
| PEN | 6,828,000 | USD | 1,850,406 | 6/20/24 | (37,721) |
| PEN | 8,539,000 | USD | 2,312,839 | 6/20/24 | (45,920) |
| PEN | 29,383,000 | USD | 7,925,821 | 6/20/24 | (125,273) |
| PEN | 42,968,218 | USD | 11,616,727 | 6/20/24 | (209,599) |
| TWD | 128,000,000 | USD | 3,999,800 | 6/20/24 | (74,684) |
| TWD | 277,000,000 | USD | 8,615,863 | 6/20/24 | (121,667) |
| USD | 2,999,329 | COP | 11,849,600,000 | 6/20/24 | 869 |
| USD | 367,930 | COP | 1,461,400,000 | 6/20/24 | (1,867) |
| USD | 375,181 | COP | 1,490,780,000 | 6/20/24 | (2,051) |
| USD | 1,734,796 | COP | 6,865,890,000 | 6/20/24 | (2,570) |
| USD | 324,620 | COP | 1,293,302,166 | 6/20/24 | (2,641) |
| USD | 505,452 | COP | 2,008,600,000 | 6/20/24 | (2,811) |
| USD | 3,937,260 | COP | 15,607,100,000 | 6/20/24 | (12,010) |
| USD | 2,810,492 | COP | 11,197,140,625 | 6/20/24 | (22,868) |
| USD | 2,225,556 | COP | 8,910,000,000 | 6/20/24 | (29,058) |
| USD | 4,589,049 | COP | 18,283,000,000 | 6/20/24 | (37,339) |
| USD | 56,763,061 | EUR | 51,936,326 | 6/20/24 | 1,226,241 |
| USD | 42,109,286 | EUR | 38,528,606 | 6/20/24 | 909,679 |
| USD | 38,154,801 | EUR | 34,910,383 | 6/20/24 | 824,251 |
| USD | 22,099,772 | EUR | 20,220,561 | 6/20/24 | 477,417 |
| USD | 8,306,311 | EUR | 7,600,000 | 6/20/24 | 179,440 |
| USD | 7,233,238 | EUR | 6,618,174 | 6/20/24 | 156,258 |
| USD | 10,095,477 | EUR | 9,302,718 | 6/20/24 | 147,847 |
| USD | 6,474,166 | EUR | 5,923,648 | 6/20/24 | 139,860 |
| USD | 6,015,481 | EUR | 5,503,966 | 6/20/24 | 129,951 |
| USD | 2,071,471 | EUR | 1,895,328 | 6/20/24 | 44,750 |
| USD | 1,970,652 | EUR | 1,803,082 | 6/20/24 | 42,572 |
| USD | 1,255,064 | EUR | 1,148,342 | 6/20/24 | 27,113 |
| USD | 768,745 | EUR | 703,376 | 6/20/24 | 16,607 |
| USD | 18,491,985 | IDR | 288,844,814,013 | 6/20/24 | 753,053 |
| USD | 12,603,769 | IDR | 196,870,871,041 | 6/20/24 | 513,266 |
| USD | 10,394,554 | IDR | 162,363,974,083 | 6/20/24 | 423,236 |
| USD | 8,125,726 | IDR | 126,910,841,480 | 6/20/24 | 331,704 |
| USD | 6,982,608 | IDR | 109,060,656,512 | 6/20/24 | 284,826 |
| USD | 2,782,086 | IDR | 44,416,000,000 | 6/20/24 | 54,350 |
| USD | 4,744,977 | IDR | 77,152,000,000 | 6/20/24 | 6,813 |
| USD | 6,107 | IDR | 95,398,286 | 6/20/24 | 249 |
22
See Notes to Financial Statements.
Emerging Markets Local Income Portfolio
April 30, 2024
Portfolio of Investments (Unaudited) — continued
| Forward Foreign Currency Exchange Contracts (Centrally Cleared) (continued) |
| Currency Purchased | Currency Sold | Settlement
Date | Value/Unrealized
Appreciation
(Depreciation) |
| USD | 4,463,886 | INR | 370,940,000 | 6/20/24 | $ 28,334 |
| USD | 24,962,058 | INR | 2,086,016,800 | 6/20/24 | 18,307 |
| USD | 2,284,860 | INR | 190,940,000 | 6/20/24 | 1,676 |
| USD | 7,416,063 | PEN | 27,323,000 | 6/20/24 | 162,400 |
| USD | 4,944,223 | PEN | 18,216,000 | 6/20/24 | 108,271 |
| USD | 5,376,310 | PEN | 19,886,019 | 6/20/24 | 97,004 |
| USD | 4,183,970 | PEN | 15,415,000 | 6/20/24 | 91,622 |
| USD | 2,789,404 | PEN | 10,277,000 | 6/20/24 | 61,084 |
| USD | 3,033,095 | PEN | 11,218,880 | 6/20/24 | 54,726 |
| USD | 3,664,171 | PEN | 13,598,105 | 6/20/24 | 54,170 |
| USD | 6,455,531 | PEN | 24,287,000 | 6/20/24 | 7,861 |
| USD | 3,642,018 | PEN | 13,702,000 | 6/20/24 | 4,435 |
| USD | 6,188,659 | PEN | 23,380,754 | 6/20/24 | (18,423) |
| USD | 5,436,991 | PEN | 20,554,000 | 6/20/24 | (19,650) |
| USD | 10,969,479 | PEN | 41,442,693 | 6/20/24 | (32,655) |
| USD | 9,636,811 | PEN | 36,431,000 | 6/20/24 | (34,828) |
| CLP | 23,807,276,480 | USD | 25,041,049 | 6/21/24 | (254,764) |
| USD | 5,760,897 | CLP | 5,477,057,685 | 6/21/24 | 58,610 |
| BRL | 6,726,984 | USD | 1,333,658 | 7/2/24 | (45,840) |
| BRL | 7,056,000 | USD | 1,399,389 | 7/2/24 | (48,585) |
| BRL | 10,583,000 | USD | 2,097,970 | 7/2/24 | (71,955) |
| BRL | 10,604,000 | USD | 2,102,383 | 7/2/24 | (72,347) |
| BRL | 11,430,016 | USD | 2,267,685 | 7/2/24 | (79,516) |
| BRL | 13,381,000 | USD | 2,650,375 | 7/2/24 | (88,709) |
| BRL | 13,381,000 | USD | 2,663,734 | 7/2/24 | (102,068) |
| BRL | 19,000,000 | USD | 3,771,188 | 7/2/24 | (133,817) |
| BRL | 589,992,018 | USD | 117,331,958 | 7/2/24 | (4,383,553) |
| USD | 10,578,913 | BRL | 53,195,005 | 7/2/24 | 395,231 |
| USD | 2,650,375 | BRL | 13,381,000 | 7/2/24 | 88,709 |
| USD | 1,856,388 | BRL | 9,700,000 | 7/2/24 | (585) |
| BRL | 27,978,000 | USD | 5,366,319 | 8/2/24 | (25,491) |
| | | | | | $ (9,798,960) |
| Forward Foreign Currency Exchange Contracts (OTC) |
| Currency Purchased | Currency Sold | Counterparty | Settlement
Date | Unrealized
Appreciation | Unrealized
(Depreciation) |
| HUF | 1,665,477,116 | EUR | 4,205,765 | BNP Paribas | 5/2/24 | $ 52,442 | $ — |
| HUF | 1,691,968,856 | EUR | 4,265,486 | UBS AG | 5/2/24 | 60,937 | — |
| USD | 819,482 | KES | 113,375,302 | Citibank, N.A. | 5/6/24 | — | (19,960) |
| EUR | 23,960,071 | USD | 26,046,869 | State Street Bank and Trust Company | 5/10/24 | — | (469,695) |
| USD | 3,430,178 | EUR | 3,157,742 | Bank of America, N.A. | 5/10/24 | 59,315 | — |
23
See Notes to Financial Statements.
Emerging Markets Local Income Portfolio
April 30, 2024
Portfolio of Investments (Unaudited) — continued
| Forward Foreign Currency Exchange Contracts (OTC) (continued) |
| Currency Purchased | Currency Sold | Counterparty | Settlement
Date | Unrealized
Appreciation | Unrealized
(Depreciation) |
| USD | 2,671,800 | EUR | 2,483,627 | Bank of America, N.A. | 5/10/24 | $ 20,548 | $ — |
| USD | 2,870,430 | EUR | 2,692,561 | JPMorgan Chase Bank, N.A. | 5/10/24 | — | (3,856) |
| USD | 875,970 | EUR | 818,051 | Standard Chartered Bank | 5/10/24 | 2,708 | — |
| HUF | 2,118,857,030 | EUR | 5,372,312 | HSBC Bank USA, N.A. | 5/13/24 | 37,986 | — |
| HUF | 3,967,229,287 | EUR | 10,124,357 | JPMorgan Chase Bank, N.A. | 5/13/24 | 1,150 | — |
| HUF | 2,028,695,228 | EUR | 5,138,604 | UBS AG | 5/13/24 | 41,819 | — |
| TRY | 231,768,945 | USD | 6,685,193 | Standard Chartered Bank | 5/13/24 | 405,934 | — |
| TRY | 174,902,706 | USD | 5,210,752 | Standard Chartered Bank | 5/13/24 | 140,514 | — |
| TRY | 157,327,963 | USD | 4,687,998 | Standard Chartered Bank | 5/13/24 | 125,556 | — |
| USD | 3,866,524 | TRY | 134,200,000 | Standard Chartered Bank | 5/13/24 | — | (239,415) |
| USD | 4,811,215 | TRY | 166,800,000 | Standard Chartered Bank | 5/13/24 | — | (292,143) |
| USD | 4,328,534 | UZS | 55,470,166,000 | ICBC Standard Bank plc | 5/14/24 | — | (46,741) |
| UZS | 25,172,105,000 | USD | 1,925,209 | ICBC Standard Bank plc | 5/14/24 | 60,271 | — |
| UZS | 17,202,441,000 | USD | 1,326,735 | ICBC Standard Bank plc | 5/14/24 | 30,128 | — |
| UZS | 13,095,620,000 | USD | 1,004,111 | ICBC Standard Bank plc | 5/14/24 | 28,821 | — |
| HUF | 3,075,283,831 | EUR | 7,861,929 | UBS AG | 5/15/24 | — | (15,420) |
| EUR | 21,492,179 | HUF | 8,467,381,153 | JPMorgan Chase Bank, N.A. | 5/17/24 | — | (118,304) |
| HUF | 13,472,330,807 | EUR | 34,195,903 | JPMorgan Chase Bank, N.A. | 5/17/24 | 188,232 | — |
| USD | 7,604,693 | KRW | 10,594,596,954 | Standard Chartered Bank | 5/20/24 | — | (55,112) |
| MXN | 62,255,000 | USD | 3,661,036 | Bank of America, N.A. | 5/21/24 | — | (37,317) |
| MXN | 15,631,001 | USD | 920,439 | Goldman Sachs International | 5/21/24 | — | (10,594) |
| MXN | 15,788,093 | USD | 929,645 | Goldman Sachs International | 5/21/24 | — | (10,656) |
| MXN | 47,258,000 | USD | 2,776,978 | Goldman Sachs International | 5/21/24 | — | (26,200) |
| MXN | 58,087,000 | USD | 3,414,651 | Goldman Sachs International | 5/21/24 | — | (33,541) |
| MXN | 60,960,906 | USD | 3,587,109 | Goldman Sachs International | 5/21/24 | — | (38,716) |
| USD | 9,845,735 | MXN | 167,600,000 | Citibank, N.A. | 5/21/24 | 90,127 | — |
| USD | 5,430,923 | MXN | 92,380,000 | JPMorgan Chase Bank, N.A. | 5/21/24 | 53,697 | — |
| HUF | 2,686,568,837 | EUR | 6,796,794 | Bank of America, N.A. | 5/29/24 | 53,235 | — |
| HUF | 2,686,410,796 | EUR | 6,794,005 | BNP Paribas | 5/29/24 | 55,784 | — |
| HUF | 1,749,835,311 | EUR | 4,451,261 | BNP Paribas | 6/3/24 | 6,469 | — |
| HUF | 1,607,610,661 | EUR | 4,087,492 | Citibank, N.A. | 6/3/24 | 8,054 | — |
| BRL | 78,091,000 | USD | 15,587,026 | Goldman Sachs International | 6/13/24 | — | (604,725) |
| USD | 15,577,698 | BRL | 78,091,000 | Goldman Sachs International | 6/13/24 | 595,397 | — |
| CNH | 20,000,000 | USD | 2,794,877 | UBS AG | 6/20/24 | — | (31,824) |
| CNH | 232,776,617 | USD | 32,529,105 | UBS AG | 6/20/24 | — | (370,388) |
| CNH | 661,171,267 | USD | 92,394,631 | UBS AG | 6/20/24 | — | (1,052,040) |
| CZK | 60,000,000 | EUR | 2,363,924 | Barclays Bank PLC | 6/20/24 | 18,429 | — |
| CZK | 609,328,574 | EUR | 23,897,112 | BNP Paribas | 6/20/24 | 304,413 | — |
| CZK | 58,000,000 | EUR | 2,279,119 | BNP Paribas | 6/20/24 | 24,238 | — |
| CZK | 40,000,000 | EUR | 1,573,101 | Citibank, N.A. | 6/20/24 | 15,332 | — |
| CZK | 1,915,354,070 | EUR | 75,167,932 | JPMorgan Chase Bank, N.A. | 6/20/24 | 903,297 | — |
| EUR | 9,264,004 | CZK | 235,963,445 | HSBC Bank USA, N.A. | 6/20/24 | — | (107,395) |
| EUR | 37,976,555 | CZK | 967,680,585 | JPMorgan Chase Bank, N.A. | 6/20/24 | — | (456,366) |
| EUR | 1,367,991 | HUF | 542,000,000 | JPMorgan Chase Bank, N.A. | 6/20/24 | — | (11,348) |
24
See Notes to Financial Statements.
Emerging Markets Local Income Portfolio
April 30, 2024
Portfolio of Investments (Unaudited) — continued
| Forward Foreign Currency Exchange Contracts (OTC) (continued) |
| Currency Purchased | Currency Sold | Counterparty | Settlement
Date | Unrealized
Appreciation | Unrealized
(Depreciation) |
| EUR | 2,318,114 | PLN | 10,000,000 | Barclays Bank PLC | 6/20/24 | $ 14,870 | $ — |
| EUR | 945,156 | PLN | 4,068,736 | Citibank, N.A. | 6/20/24 | 8,164 | — |
| EUR | 976,018 | PLN | 4,200,098 | Goldman Sachs International | 6/20/24 | 8,798 | — |
| EUR | 46,849,231 | RON | 234,025,964 | Barclays Bank PLC | 6/20/24 | — | (56,847) |
| MXN | 12,879,000 | USD | 751,811 | Bank of America, N.A. | 6/20/24 | — | (5,729) |
| MXN | 14,950,000 | USD | 876,521 | Goldman Sachs International | 6/20/24 | — | (10,466) |
| MXN | 12,180,702 | USD | 717,335 | Goldman Sachs International | 6/20/24 | — | (11,705) |
| MXN | 34,147,121 | USD | 1,991,375 | Goldman Sachs International | 6/20/24 | — | (13,227) |
| MXN | 783,076,018 | USD | 46,116,193 | Goldman Sachs International | 6/20/24 | — | (752,491) |
| MXN | 410,237,000 | USD | 23,761,468 | HSBC Bank USA, N.A. | 6/20/24 | 3,618 | — |
| MXN | 37,569,000 | USD | 2,176,046 | HSBC Bank USA, N.A. | 6/20/24 | 331 | — |
| MXN | 6,077,000 | USD | 358,423 | Societe Generale | 6/20/24 | — | (6,381) |
| MXN | 9,881,300 | USD | 578,378 | Standard Chartered Bank | 6/20/24 | — | (5,953) |
| MXN | 9,900,000 | USD | 582,824 | Standard Chartered Bank | 6/20/24 | — | (9,315) |
| MXN | 51,452,879 | USD | 3,000,612 | Standard Chartered Bank | 6/20/24 | — | (19,939) |
| MXN | 634,196,300 | USD | 37,121,151 | Standard Chartered Bank | 6/20/24 | — | (382,071) |
| MXN | 634,100,000 | USD | 37,330,163 | Standard Chartered Bank | 6/20/24 | — | (596,662) |
| MXN | 1,800,774 | USD | 105,478 | State Street Bank and Trust Company | 6/20/24 | — | (1,159) |
| MXN | 13,206,000 | USD | 766,389 | State Street Bank and Trust Company | 6/20/24 | — | (1,364) |
| MXN | 2,176,138 | USD | 127,458 | State Street Bank and Trust Company | 6/20/24 | — | (1,394) |
| MXN | 15,024,000 | USD | 875,591 | State Street Bank and Trust Company | 6/20/24 | — | (5,248) |
| MXN | 14,510,000 | USD | 853,262 | State Street Bank and Trust Company | 6/20/24 | — | (12,696) |
| MXN | 964,256,000 | USD | 56,196,332 | State Street Bank and Trust Company | 6/20/24 | — | (336,848) |
| MYR | 7,000,000 | USD | 1,482,611 | Barclays Bank PLC | 6/20/24 | — | (18,081) |
| MYR | 378,517,772 | USD | 81,251,400 | Barclays Bank PLC | 6/20/24 | — | (2,058,440) |
| MYR | 13,500,000 | USD | 2,861,989 | Goldman Sachs International | 6/20/24 | — | (37,537) |
| MYR | 85,693,645 | USD | 18,395,905 | Goldman Sachs International | 6/20/24 | — | (467,200) |
| NGN | 250,679,285 | USD | 294,917 | JPMorgan Chase Bank, N.A. | 6/20/24 | — | (115,025) |
| PLN | 49,690,478 | EUR | 11,345,894 | Barclays Bank PLC | 6/20/24 | 111,023 | — |
| PLN | 5,200,000 | EUR | 1,198,760 | Citibank, N.A. | 6/20/24 | — | (611) |
| PLN | 3,250,405 | EUR | 755,060 | Citibank, N.A. | 6/20/24 | — | (6,522) |
| PLN | 8,062,144 | EUR | 1,872,813 | Citibank, N.A. | 6/20/24 | — | (16,177) |
| PLN | 204,485,454 | EUR | 47,501,401 | Citibank, N.A. | 6/20/24 | — | (410,301) |
| PLN | 3,249,595 | EUR | 755,140 | Goldman Sachs International | 6/20/24 | — | (6,807) |
| PLN | 8,060,133 | EUR | 1,873,012 | Goldman Sachs International | 6/20/24 | — | (16,885) |
| PLN | 204,434,466 | EUR | 47,506,441 | Goldman Sachs International | 6/20/24 | — | (428,254) |
| PLN | 24,000,000 | EUR | 5,535,097 | HSBC Bank USA, N.A. | 6/20/24 | — | (5,345) |
| RON | 193,891,000 | EUR | 38,814,686 | Barclays Bank PLC | 6/20/24 | 47,098 | — |
| RON | 9,100,000 | EUR | 1,821,702 | Citibank, N.A. | 6/20/24 | 2,221 | — |
| SGD | 2,120,000 | USD | 1,578,702 | Citibank, N.A. | 6/20/24 | — | (22,147) |
| SGD | 9,000,000 | USD | 6,753,851 | Citibank, N.A. | 6/20/24 | — | (145,834) |
| SGD | 9,000,000 | USD | 6,753,056 | Goldman Sachs International | 6/20/24 | — | (145,038) |
| SGD | 9,000,000 | USD | 6,755,387 | Goldman Sachs International | 6/20/24 | — | (147,370) |
| SGD | 11,000,000 | USD | 8,252,886 | Goldman Sachs International | 6/20/24 | — | (176,420) |
25
See Notes to Financial Statements.
Emerging Markets Local Income Portfolio
April 30, 2024
Portfolio of Investments (Unaudited) — continued
| Forward Foreign Currency Exchange Contracts (OTC) (continued) |
| Currency Purchased | Currency Sold | Counterparty | Settlement
Date | Unrealized
Appreciation | Unrealized
(Depreciation) |
| SGD | 23,460,000 | USD | 17,676,311 | Goldman Sachs International | 6/20/24 | $ — | $ (451,411) |
| THB | 146,300,000 | USD | 4,004,411 | Standard Chartered Bank | 6/20/24 | — | (41,854) |
| THB | 79,700,000 | USD | 2,220,723 | Standard Chartered Bank | 6/20/24 | — | (62,037) |
| THB | 600,577,211 | USD | 16,806,549 | Standard Chartered Bank | 6/20/24 | — | (539,826) |
| THB | 653,000,000 | USD | 18,277,471 | Standard Chartered Bank | 6/20/24 | — | (590,869) |
| THB | 3,040,957,013 | USD | 86,231,791 | Standard Chartered Bank | 6/20/24 | — | (3,867,021) |
| TRY | 184,868,866 | USD | 5,192,973 | Standard Chartered Bank | 6/20/24 | 238,450 | — |
| TRY | 229,146,000 | USD | 6,735,284 | Standard Chartered Bank | 6/20/24 | — | (3,006) |
| TWD | 181,000,000 | USD | 5,655,553 | Standard Chartered Bank | 6/20/24 | — | (105,193) |
| TWD | 230,000,000 | USD | 7,188,411 | Standard Chartered Bank | 6/20/24 | — | (135,468) |
| USD | 5,726,857 | CNH | 41,000,000 | BNP Paribas | 6/20/24 | 62,596 | — |
| USD | 3,352,306 | CNH | 24,000,000 | BNP Paribas | 6/20/24 | 36,642 | — |
| USD | 1,257,115 | CNH | 9,000,000 | BNP Paribas | 6/20/24 | 13,741 | — |
| USD | 838,077 | CNH | 6,000,000 | BNP Paribas | 6/20/24 | 9,160 | — |
| USD | 10,364,218 | CNH | 74,000,000 | Citibank, N.A. | 6/20/24 | 140,919 | — |
| USD | 9,852,117 | CNH | 70,340,000 | Goldman Sachs International | 6/20/24 | 134,457 | — |
| USD | 6,273,890 | CNH | 44,780,000 | Goldman Sachs International | 6/20/24 | 87,412 | — |
| USD | 5,726,274 | CNH | 41,000,000 | HSBC Bank USA, N.A. | 6/20/24 | 62,013 | — |
| USD | 3,491,630 | CNH | 25,000,000 | HSBC Bank USA, N.A. | 6/20/24 | 37,813 | — |
| USD | 1,550,095 | CNH | 11,100,000 | HSBC Bank USA, N.A. | 6/20/24 | 16,600 | — |
| USD | 1,396,652 | CNH | 10,000,000 | HSBC Bank USA, N.A. | 6/20/24 | 15,125 | — |
| USD | 837,991 | CNH | 6,000,000 | HSBC Bank USA, N.A. | 6/20/24 | 9,075 | — |
| USD | 9,921,231 | CNH | 71,000,000 | JPMorgan Chase Bank, N.A. | 6/20/24 | 112,390 | — |
| USD | 6,008,633 | CNH | 43,000,000 | JPMorgan Chase Bank, N.A. | 6/20/24 | 68,067 | — |
| USD | 2,375,506 | CNH | 17,000,000 | JPMorgan Chase Bank, N.A. | 6/20/24 | 26,910 | — |
| USD | 1,397,357 | CNH | 10,000,000 | JPMorgan Chase Bank, N.A. | 6/20/24 | 15,830 | — |
| USD | 26,536,734 | CNH | 189,895,515 | UBS AG | 6/20/24 | 302,157 | — |
| USD | 15,960,460 | CNH | 114,212,234 | UBS AG | 6/20/24 | 181,732 | — |
| USD | 6,274,500 | CNH | 44,900,000 | UBS AG | 6/20/24 | 71,444 | — |
| USD | 3,843,834 | CNH | 27,506,280 | UBS AG | 6/20/24 | 43,767 | — |
| USD | 10,993,078 | CNH | 79,461,401 | UBS AG | 6/20/24 | 15,272 | — |
| USD | 59,639,182 | MXN | 1,012,703,123 | Goldman Sachs International | 6/20/24 | 973,149 | — |
| USD | 3,094,032 | MXN | 52,100,000 | Goldman Sachs International | 6/20/24 | 75,871 | — |
| USD | 4,249,286 | MXN | 72,155,007 | Goldman Sachs International | 6/20/24 | 69,337 | — |
| USD | 2,976,135 | MXN | 51,000,000 | Goldman Sachs International | 6/20/24 | 21,698 | — |
| USD | 1,265,667 | MXN | 21,491,654 | Goldman Sachs International | 6/20/24 | 20,652 | — |
| USD | 2,717,826 | MXN | 47,000,000 | Goldman Sachs International | 6/20/24 | — | (4,890) |
| USD | 21,548,876 | MXN | 360,337,600 | JPMorgan Chase Bank, N.A. | 6/20/24 | 674,469 | — |
| USD | 33,213,937 | MYR | 154,730,447 | Barclays Bank PLC | 6/20/24 | 841,449 | — |
| USD | 1,445,935 | MYR | 6,900,000 | Goldman Sachs International | 6/20/24 | 2,326 | — |
| USD | 1,644,245 | SGD | 2,236,011 | Bank of America, N.A. | 6/20/24 | 2,512 | — |
| USD | 22,068,081 | THB | 778,241,524 | Standard Chartered Bank | 6/20/24 | 989,295 | — |
| USD | 21,555,355 | THB | 760,160,000 | Standard Chartered Bank | 6/20/24 | 966,309 | — |
| USD | 1,683,250 | THB | 59,700,000 | Standard Chartered Bank | 6/20/24 | 66,267 | — |
26
See Notes to Financial Statements.
Emerging Markets Local Income Portfolio
April 30, 2024
Portfolio of Investments (Unaudited) — continued
| Forward Foreign Currency Exchange Contracts (OTC) (continued) |
| Currency Purchased | Currency Sold | Counterparty | Settlement
Date | Unrealized
Appreciation | Unrealized
(Depreciation) |
| USD | 2,436,893 | TRY | 87,970,000 | Standard Chartered Bank | 6/20/24 | $ — | $ (147,653) |
| USD | 5,255,162 | ZAR | 100,052,774 | Barclays Bank PLC | 6/20/24 | — | (40,226) |
| USD | 2,506,269 | ZAR | 47,688,334 | BNP Paribas | 6/20/24 | — | (17,681) |
| USD | 24,475,568 | ZAR | 468,340,000 | BNP Paribas | 6/20/24 | — | (311,772) |
| USD | 2,068,906 | ZAR | 38,726,906 | Goldman Sachs International | 6/20/24 | 19,248 | — |
| USD | 2,079,121 | ZAR | 38,938,575 | Goldman Sachs International | 6/20/24 | 18,260 | — |
| USD | 10,099,918 | ZAR | 190,369,320 | HSBC Bank USA, N.A. | 6/20/24 | 24,441 | — |
| USD | 2,488,660 | ZAR | 47,349,217 | HSBC Bank USA, N.A. | 6/20/24 | — | (17,342) |
| USD | 4,424,442 | ZAR | 83,286,577 | JPMorgan Chase Bank, N.A. | 6/20/24 | 16,420 | — |
| USD | 2,661,696 | ZAR | 50,189,311 | JPMorgan Chase Bank, N.A. | 6/20/24 | 5,379 | — |
| USD | 2,660,021 | ZAR | 50,189,311 | JPMorgan Chase Bank, N.A. | 6/20/24 | 3,704 | — |
| USD | 92,064,412 | ZAR | 1,730,221,648 | UBS AG | 6/20/24 | 490,785 | — |
| USD | 46,396,689 | ZAR | 871,960,768 | UBS AG | 6/20/24 | 247,336 | — |
| USD | 4,902,762 | ZAR | 93,135,316 | UBS AG | 6/20/24 | — | (26,513) |
| USD | 7,708,070 | ZAR | 147,334,359 | UBS AG | 6/20/24 | — | (89,741) |
| ZAR | 62,000,000 | USD | 3,250,328 | BNP Paribas | 6/20/24 | 31,081 | — |
| ZAR | 149,670,000 | USD | 7,963,882 | UBS AG | 6/20/24 | — | (42,455) |
| ZAR | 1,232,410,152 | USD | 65,576,059 | UBS AG | 6/20/24 | — | (349,579) |
| NGN | 1,316,619,858 | USD | 1,595,903 | Societe Generale | 6/21/24 | — | (651,412) |
| TRY | 31,652,538 | USD | 936,473 | Standard Chartered Bank | 6/21/24 | — | (7,490) |
| USD | 901,518 | TRY | 31,652,538 | Standard Chartered Bank | 6/21/24 | — | (27,465) |
| NGN | 684,364,061 | USD | 805,141 | Standard Chartered Bank | 6/24/24 | — | (314,733) |
| USD | 15,113,002 | MXN | 252,689,400 | Goldman Sachs International | 6/24/24 | 483,987 | — |
| NGN | 704,894,982 | USD | 805,141 | Standard Chartered Bank | 6/26/24 | — | (300,382) |
| NGN | 664,421,370 | USD | 746,547 | Standard Chartered Bank | 7/3/24 | — | (271,960) |
| NGN | 715,710,229 | USD | 795,234 | Societe Generale | 7/8/24 | — | (284,841) |
| USD | 15,113,001 | MXN | 253,173,000 | Goldman Sachs International | 7/8/24 | 488,483 | — |
| PLN | 63,730,050 | EUR | 14,599,488 | Citibank, N.A. | 7/19/24 | 65,225 | — |
| PLN | 42,266,022 | EUR | 9,658,377 | UBS AG | 7/19/24 | 69,021 | — |
| UZS | 43,293,543,400 | USD | 3,264,973 | ICBC Standard Bank plc | 7/22/24 | 77,899 | — |
| UZS | 15,640,766,000 | USD | 1,175,114 | ICBC Standard Bank plc | 7/22/24 | 32,574 | — |
| UZS | 10,256,783,531 | USD | 773,980 | ICBC Standard Bank plc | 8/26/24 | 1,766 | — |
| UZS | 64,679,524,000 | USD | 4,785,758 | ICBC Standard Bank plc | 8/30/24 | 146,526 | — |
| UZS | 27,151,171,000 | USD | 2,008,223 | JPMorgan Chase Bank, N.A. | 8/30/24 | 62,252 | — |
| USD | 425,197 | AMD | 169,568,504 | Citibank, N.A. | 9/6/24 | — | (5,689) |
| USD | 1,260,027 | AMD | 511,886,000 | Citibank, N.A. | 9/16/24 | — | (39,238) |
| EUR | 2,509,535 | PLN | 11,900,000 | Goldman Sachs International | 9/20/24 | — | (233,539) |
| TRY | 36,665,785 | USD | 1,007,891 | Standard Chartered Bank | 9/20/24 | — | (34,972) |
| TRY | 36,665,785 | USD | 1,008,235 | Standard Chartered Bank | 9/20/24 | — | (35,316) |
| TRY | 91,504,000 | USD | 2,495,357 | Standard Chartered Bank | 9/20/24 | — | (67,316) |
| TRY | 156,911,000 | USD | 4,284,165 | Standard Chartered Bank | 9/20/24 | — | (120,563) |
| USD | 4,096,723 | TRY | 156,911,000 | Standard Chartered Bank | 9/20/24 | — | (66,879) |
| TRY | 204,757,273 | USD | 5,192,931 | Standard Chartered Bank | 9/23/24 | 221,916 | — |
| TRY | 191,692,240 | USD | 4,895,142 | Standard Chartered Bank | 9/23/24 | 174,198 | — |
27
See Notes to Financial Statements.
Emerging Markets Local Income Portfolio
April 30, 2024
Portfolio of Investments (Unaudited) — continued
| Forward Foreign Currency Exchange Contracts (OTC) (continued) |
| Currency Purchased | Currency Sold | Counterparty | Settlement
Date | Unrealized
Appreciation | Unrealized
(Depreciation) |
| TRY | 42,655,000 | USD | 1,148,656 | Standard Chartered Bank | 9/23/24 | $ — | $ (20,636) |
| USD | 1,112,450 | TRY | 42,655,000 | Standard Chartered Bank | 9/23/24 | — | (15,570) |
| UZS | 17,559,584,428 | USD | 1,307,976 | JPMorgan Chase Bank, N.A. | 10/4/24 | 16,342 | — |
| TRY | 122,242,494 | USD | 3,028,716 | Standard Chartered Bank | 10/17/24 | 118,981 | — |
| TRY | 122,159,953 | USD | 3,028,283 | Standard Chartered Bank | 10/17/24 | 117,289 | — |
| PLN | 45,113,450 | EUR | 10,267,057 | Bank of America, N.A. | 10/21/24 | 55,060 | — |
| UZS | 8,143,221,557 | USD | 606,797 | ICBC Standard Bank plc | 10/21/24 | 4,471 | — |
| UZS | 10,493,460,710 | USD | 771,578 | JPMorgan Chase Bank, N.A. | 10/22/24 | 15,864 | — |
| UZS | 10,532,039,610 | USD | 771,578 | JPMorgan Chase Bank, N.A. | 10/24/24 | 18,266 | — |
| UZS | 2,692,778,443 | USD | 197,273 | JPMorgan Chase Bank, N.A. | 11/1/24 | 4,166 | — |
| UZS | 21,331,085,000 | USD | 1,569,963 | ICBC Standard Bank plc | 11/15/24 | 18,826 | — |
| EGP | 36,017,503 | USD | 695,990 | HSBC Bank USA, N.A. | 11/27/24 | 10,603 | — |
| TRY | 394,266,450 | USD | 10,128,956 | Standard Chartered Bank | 12/16/24 | — | (588,400) |
| USD | 3,986,409 | TRY | 176,400,000 | Standard Chartered Bank | 12/16/24 | — | (282,162) |
| TRY | 115,109,241 | USD | 2,759,090 | Standard Chartered Bank | 12/18/24 | 20,830 | — |
| USD | 1,490,049 | KES | 219,037,246 | Standard Chartered Bank | 12/18/24 | — | (75,753) |
| TRY | 216,532,956 | USD | 5,122,051 | Standard Chartered Bank | 1/6/25 | 10,626 | — |
| TRY | 143,310,900 | USD | 3,390,196 | Standard Chartered Bank | 1/6/25 | 6,832 | — |
| TRY | 102,014,600 | USD | 2,411,364 | Standard Chartered Bank | 1/6/25 | 6,780 | — |
| TRY | 107,476,800 | USD | 2,542,626 | Standard Chartered Bank | 1/6/25 | 4,994 | — |
| UZS | 16,001,091,000 | USD | 1,142,935 | JPMorgan Chase Bank, N.A. | 1/6/25 | 29,592 | — |
| TRY | 49,550,000 | USD | 1,153,676 | Standard Chartered Bank | 1/15/25 | 10,658 | — |
| UZS | 23,706,120,153 | USD | 1,696,323 | ICBC Standard Bank plc | 1/23/25 | 78,795 | — |
| UZS | 17,381,356,000 | USD | 1,235,349 | ICBC Standard Bank plc | 1/23/25 | 66,170 | — |
| TRY | 166,602,569 | USD | 3,796,894 | Standard Chartered Bank | 1/29/25 | 65,812 | — |
| TRY | 237,580,198 | USD | 5,470,335 | Standard Chartered Bank | 1/29/25 | 37,998 | — |
| TRY | 17,504,005 | USD | 403,207 | Standard Chartered Bank | 1/29/25 | 2,626 | — |
| TRY | 181,859,880 | USD | 4,201,972 | Standard Chartered Bank | 2/10/25 | — | (29,899) |
| UZS | 17,294,881,000 | USD | 1,235,349 | ICBC Standard Bank plc | 2/10/25 | 19,115 | — |
| EGP | 248,140,782 | USD | 4,121,940 | Citibank, N.A. | 2/13/25 | 617,935 | — |
| UZS | 25,825,093,957 | USD | 1,838,085 | JPMorgan Chase Bank, N.A. | 2/13/25 | 33,479 | — |
| UZS | 30,130,540,638 | USD | 2,142,997 | JPMorgan Chase Bank, N.A. | 2/18/25 | 37,425 | — |
| EGP | 83,125,788 | USD | 1,373,980 | Citibank, N.A. | 2/20/25 | 209,580 | — |
| EGP | 51,029,616 | USD | 824,388 | Citibank, N.A. | 2/20/25 | 147,734 | — |
| EGP | 42,936,874 | USD | 686,990 | Citibank, N.A. | 2/20/25 | 130,964 | — |
| NGN | 2,559,361,560 | USD | 1,390,957 | Standard Chartered Bank | 2/24/25 | 275,961 | — |
| NGN | 1,297,067,747 | USD | 695,479 | Standard Chartered Bank | 2/24/25 | 149,305 | — |
| NGN | 1,986,410,801 | USD | 1,200,974 | JPMorgan Chase Bank, N.A. | 2/25/25 | 92,364 | — |
| EGP | 20,526,642 | USD | 379,771 | Goldman Sachs International | 2/26/25 | 10,365 | — |
| EGP | 44,860,446 | USD | 686,990 | Citibank, N.A. | 2/27/25 | 165,316 | — |
| EGP | 38,627,467 | USD | 695,990 | HSBC Bank USA, N.A. | 2/27/25 | 37,895 | — |
| UZS | 30,563,104,986 | USD | 2,171,446 | ICBC Standard Bank plc | 2/28/25 | 33,896 | — |
| UZS | 10,812,501,201 | USD | 773,980 | ICBC Standard Bank plc | 3/5/25 | 5,093 | — |
| UZS | 10,003,988,251 | USD | 709,251 | JPMorgan Chase Bank, N.A. | 3/17/25 | 9,082 | — |
28
See Notes to Financial Statements.
Emerging Markets Local Income Portfolio
April 30, 2024
Portfolio of Investments (Unaudited) — continued
| Forward Foreign Currency Exchange Contracts (OTC) (continued) |
| Currency Purchased | Currency Sold | Counterparty | Settlement
Date | Unrealized
Appreciation | Unrealized
(Depreciation) |
| UZS | 9,327,056,677 | USD | 661,025 | JPMorgan Chase Bank, N.A. | 3/20/25 | $ 8,125 | $ — |
| USD | 1,490,049 | KES | 223,507,393 | Standard Chartered Bank | 3/21/25 | — | (78,623) |
| USD | 2,235,060 | KES | 325,760,000 | Standard Chartered Bank | 4/4/25 | — | (44,921) |
| UZS | 9,286,633,105 | USD | 653,988 | JPMorgan Chase Bank, N.A. | 4/4/25 | 4,514 | — |
| TRY | 135,270,000 | USD | 2,947,082 | Standard Chartered Bank | 4/8/25 | 15,817 | — |
| TRY | 121,610,000 | USD | 2,652,366 | Standard Chartered Bank | 4/8/25 | 11,331 | — |
| USD | 1,306,364 | KES | 190,729,144 | Standard Chartered Bank | 4/9/25 | — | (27,220) |
| UZS | 8,271,042,722 | USD | 577,587 | Standard Chartered Bank | 4/15/25 | 8,901 | — |
| USD | 1,306,364 | KES | 190,533,189 | Standard Chartered Bank | 4/16/25 | 62,981 | — |
| UZS | 62,313,470,000 | USD | 4,374,410 | ICBC Standard Bank plc | 4/17/25 | 60,501 | — |
| USD | 625,821 | KES | 96,689,323 | Standard Chartered Bank | 5/5/25 | — | (46,771) |
| USD | 625,821 | KES | 96,689,323 | Standard Chartered Bank | 5/5/25 | — | (46,771) |
| UZS | 25,583,110,000 | USD | 1,593,963 | Standard Chartered Bank | 3/25/26 | 30,927 | — |
| | | | | | | $15,566,550 | $(21,068,303) |
| Non-Deliverable Bond Forward Contracts* |
| Settlement Date | Notional Amount
(000's omitted) | Reference Entity | Counterparty | Aggregate Cost | Unrealized
Appreciation
(Depreciation) |
| 5/9/24 | COP | 18,000,000 | Republic of Colombia,
6.00%, 4/28/28 | Goldman Sachs International | $4,588,325 | $ (130,497) |
| 5/9/24 | COP | 17,300,000 | Republic of Colombia,
7.25%, 10/18/34 | Goldman Sachs International | 4,409,890 | (177,084) |
| 6/7/24 | COP | 36,300,000 | Republic of Colombia,
7.25%, 10/18/34 | Goldman Sachs International | 9,253,123 | (247,734) |
| | | | | | | $(555,315) |
| * | Represents a short-term forward contract to purchase the reference entity denominated in a non-deliverable foreign currency. |
| Futures Contracts |
| Description | Number of
Contracts | Position | Expiration
Date | Notional
Amount | Value/Unrealized
Appreciation
(Depreciation) |
| Interest Rate Futures | | | | | |
| Euro-Bobl | (12) | Short | 6/6/24 | $(1,491,050) | $ 19,850 |
| Euro-Bund | (23) | Short | 6/6/24 | (3,192,893) | 63,191 |
| Euro-Buxl | (11) | Short | 6/6/24 | (1,513,419) | 48,835 |
| U.S. 5-Year Treasury Note | (45) | Short | 6/28/24 | (4,713,398) | 87,907 |
| U.S. Ultra 10-Year Treasury Note | (52) | Short | 6/18/24 | (5,731,375) | 173,681 |
| | | | | | $393,464 |
29
See Notes to Financial Statements.
Emerging Markets Local Income Portfolio
April 30, 2024
Portfolio of Investments (Unaudited) — continued
| Interest Rate Swaps (Centrally Cleared) |
Notional Amount
(000's omitted) | Portfolio
Pays/
Receives
Floating
Rate | Floating Rate | Annual
Fixed Rate | Termination
Date | Value | Unamortized
Upfront
Receipts
(Payments) | Unrealized
Appreciation
(Depreciation) |
| BRL | 383,000 | Pays | Brazil CETIP Interbank Deposit Rate
(pays upon termination) | 11.29%
(pays upon termination) | 7/1/24 | $ (132,205) | $ — | $ (132,205) |
| BRL | 72,000 | Receives | Brazil CETIP Interbank Deposit Rate
(pays upon termination) | 6.36%
(pays upon termination) | 1/2/25 | 2,541,732 | — | 2,541,732 |
| BRL | 73,368 | Pays | Brazil CETIP Interbank Deposit Rate
(pays upon termination) | 10.55%
(pays upon termination) | 1/2/25 | (78,787) | — | (78,787) |
| BRL | 97,532 | Pays | Brazil CETIP Interbank Deposit Rate
(pays upon termination) | 10.56%
(pays upon termination) | 1/2/25 | (106,354) | — | (106,354) |
| BRL | 44,130 | Pays | Brazil CETIP Interbank Deposit Rate
(pays upon termination) | 10.92%
(pays upon termination) | 1/2/25 | 13,819 | — | 13,819 |
| BRL | 183,700 | Pays | Brazil CETIP Interbank Deposit Rate
(pays upon termination) | 11.00%
(pays upon termination) | 1/2/25 | 36,899 | — | 36,899 |
| BRL | 94,990 | Pays | Brazil CETIP Interbank Deposit Rate
(pays upon termination) | 11.11%
(pays upon termination) | 1/2/25 | 57,383 | — | 57,383 |
| BRL | 52,200 | Pays | Brazil CETIP Interbank Deposit Rate
(pays upon termination) | 10.34%
(pays upon termination) | 7/1/25 | (12,374) | — | (12,374) |
| BRL | 78,400 | Pays | Brazil CETIP Interbank Deposit Rate
(pays upon termination) | 10.43%
(pays upon termination) | 7/1/25 | (3,291) | — | (3,291) |
| BRL | 109,400 | Pays | Brazil CETIP Interbank Deposit Rate
(pays upon termination) | 10.52%
(pays upon termination) | 7/1/25 | 16,520 | — | 16,520 |
| BRL | 37,100 | Pays | Brazil CETIP Interbank Deposit Rate
(pays upon termination) | 10.56%
(pays upon termination) | 7/1/25 | 9,054 | — | 9,054 |
| BRL | 17,900 | Pays | Brazil CETIP Interbank Deposit Rate
(pays upon termination) | 10.60%
(pays upon termination) | 7/1/25 | 5,794 | — | 5,794 |
| BRL | 219,520 | Pays | Brazil CETIP Interbank Deposit Rate
(pays upon termination) | 9.96%
(pays upon termination) | 1/2/26 | (454,335) | — | (454,335) |
| BRL | 245,352 | Pays | Brazil CETIP Interbank Deposit Rate
(pays upon termination) | 9.98%
(pays upon termination) | 1/2/26 | (486,825) | — | (486,825) |
| BRL | 42,700 | Pays | Brazil CETIP Interbank Deposit Rate
(pays upon termination) | 9.70%
(pays upon termination) | 1/4/27 | (293,379) | — | (293,379) |
| BRL | 29,200 | Pays | Brazil CETIP Interbank Deposit Rate
(pays upon termination) | 9.78%
(pays upon termination) | 1/4/27 | (193,252) | — | (193,252) |
| BRL | 35,200 | Pays | Brazil CETIP Interbank Deposit Rate
(pays upon termination) | 9.88%
(pays upon termination) | 1/4/27 | (199,455) | — | (199,455) |
| BRL | 88,800 | Pays | Brazil CETIP Interbank Deposit Rate
(pays upon termination) | 10.06%
(pays upon termination) | 1/4/27 | (694,774) | — | (694,774) |
30
See Notes to Financial Statements.
Emerging Markets Local Income Portfolio
April 30, 2024
Portfolio of Investments (Unaudited) — continued
| Interest Rate Swaps (Centrally Cleared) (continued) |
Notional Amount
(000's omitted) | Portfolio
Pays/
Receives
Floating
Rate | Floating Rate | Annual
Fixed Rate | Termination
Date | Value | Unamortized
Upfront
Receipts
(Payments) | Unrealized
Appreciation
(Depreciation) |
| BRL | 34,300 | Pays | Brazil CETIP Interbank Deposit Rate
(pays upon termination) | 10.47%
(pays upon termination) | 1/4/27 | $ (179,693) | $ — | $ (179,693) |
| BRL | 37,684 | Pays | Brazil CETIP Interbank Deposit Rate
(pays upon termination) | 10.33%
(pays upon termination) | 1/2/29 | (304,947) | — | (304,947) |
| BRL | 19,090 | Pays | Brazil CETIP Interbank Deposit Rate
(pays upon termination) | 13.20%
(pays upon termination) | 1/2/29 | 393,723 | — | 393,723 |
| BRL | 15,200 | Pays | Brazil CETIP Interbank Deposit Rate
(pays upon termination) | 13.10%
(pays upon termination) | 1/2/31 | 377,483 | — | 377,483 |
| CLP | 2,650,000 | Pays | 6-month Sinacofi Chile Interbank Rate
(pays semi-annually) | 1.38%
(pays semi-annually) | 6/17/25 | (190,481) | — | (190,481) |
| CLP | 3,700,000 | Pays | 6-month Sinacofi Chile Interbank Rate
(pays semi-annually) | 1.33%
(pays semi-annually) | 9/11/25 | (240,844) | — | (240,844) |
| CLP | 5,200,000 | Pays | 6-month Sinacofi Chile Interbank Rate
(pays semi-annually) | 1.48%
(pays semi-annually) | 12/23/25 | (450,749) | — | (450,749) |
| CLP | 2,500,000 | Pays | 6-month Sinacofi Chile Interbank Rate
(pays semi-annually) | 1.59%
(pays semi-annually) | 1/27/26 | (202,295) | — | (202,295) |
| CLP | 2,500,000 | Pays | 6-month Sinacofi Chile Interbank Rate
(pays semi-annually) | 1.92%
(pays semi-annually) | 2/23/26 | (181,266) | — | (181,266) |
| CLP | 584,900 | Pays | 6-month Sinacofi Chile Interbank Rate
(pays semi-annually) | 2.87%
(pays semi-annually) | 5/31/26 | (42,484) | — | (42,484) |
| CLP | 3,362,600 | Pays | 6-month Sinacofi Chile Interbank Rate
(pays semi-annually) | 4.08%
(pays semi-annually) | 7/1/31 | (295,093) | — | (295,093) |
| CLP | 20,798,900 | Receives | 6-month Sinacofi Chile Interbank Rate
(pays semi-annually) | 5.23%
(pays semi-annually) | 9/20/33 | 117,256 | — | 117,256 |
| CLP | 6,236,900 | Receives | 6-month Sinacofi Chile Interbank Rate
(pays semi-annually) | 5.56%
(pays semi-annually) | 12/20/33 | (32,092) | — | (32,092) |
| CNY | 507,400 | Pays | 7-day China Fixing Repo Rates
(pays quarterly) | 2.40%
(pays quarterly) | 12/21/27 | 872,820 | — | 872,820 |
| CNY | 68,700 | Pays | 7-day China Fixing Repo Rates
(pays quarterly) | 2.40%
(pays quarterly) | 12/21/27 | 119,877 | — | 119,877 |
| CNY | 215,650 | Pays | 7-day China Fixing Repo Rates
(pays quarterly) | 2.47%
(pays quarterly) | 12/21/27 | 443,003 | — | 443,003 |
| CNY | 22,000 | Pays | 7-day China Fixing Repo Rates
(pays quarterly) | 2.82%
(pays quarterly) | 6/21/28 | 90,552 | — | 90,552 |
| CNY | 41,300 | Pays | 7-day China Fixing Repo Rates
(pays quarterly) | 2.87%
(pays quarterly) | 6/21/28 | 181,619 | — | 181,619 |
31
See Notes to Financial Statements.
Emerging Markets Local Income Portfolio
April 30, 2024
Portfolio of Investments (Unaudited) — continued
| Interest Rate Swaps (Centrally Cleared) (continued) |
Notional Amount
(000's omitted) | Portfolio
Pays/
Receives
Floating
Rate | Floating Rate | Annual
Fixed Rate | Termination
Date | Value | Unamortized
Upfront
Receipts
(Payments) | Unrealized
Appreciation
(Depreciation) |
| CNY | 45,000 | Pays | 7-day China Fixing Repo Rates
(pays quarterly) | 2.28%
(pays quarterly) | 9/20/28 | $ 49,049 | $ — | $ 49,049 |
| CNY | 108,000 | Pays | 7-day China Fixing Repo Rates
(pays quarterly) | 2.29%
(pays quarterly) | 9/20/28 | 119,943 | — | 119,943 |
| CNY | 45,000 | Pays | 7-day China Fixing Repo Rates
(pays quarterly) | 2.29%
(pays quarterly) | 9/20/28 | 50,374 | — | 50,374 |
| CNY | 95,000 | Pays | 7-day China Fixing Repo Rates
(pays quarterly) | 2.48%
(pays quarterly) | 9/20/28 | 212,063 | — | 212,063 |
| CNY | 62,400 | Pays | 7-day China Fixing Repo Rates
(pays quarterly) | 2.49%
(pays quarterly) | 9/20/28 | 145,905 | — | 145,905 |
| CNY | 38,700 | Pays | 7-day China Fixing Repo Rates
(pays quarterly) | 2.38%
(pays quarterly) | 12/20/28 | 64,988 | — | 64,988 |
| CNY | 32,900 | Pays | 7-day China Fixing Repo Rates
(pays quarterly) | 2.10%
(pays quarterly) | 3/20/29 | (5,282) | — | (5,282) |
| CNY | 38,000 | Pays | 7-day China Fixing Repo Rates
(pays quarterly) | 2.21%
(pays quarterly) | 3/20/29 | 22,536 | — | 22,536 |
| CNY | 100,000 | Pays | 7-day China Fixing Repo Rates
(pays quarterly) | 2.34%
(pays quarterly) | 3/20/29 | 140,515 | — | 140,515 |
| CNY | 34,000 | Pays | 7-day China Fixing Repo Rates
(pays quarterly) | 2.35%
(pays quarterly) | 3/20/29 | 50,205 | — | 50,205 |
| CNY | 43,700 | Pays | 7-day China Fixing Repo Rates
(pays quarterly) | 2.11%
(pays quarterly) | 6/19/29 | (10,800) | — | (10,800) |
| CNY | 47,600 | Pays | 7-day China Fixing Repo Rates
(pays quarterly) | 2.11%
(pays quarterly) | 6/19/29 | (9,153) | — | (9,153) |
| CNY | 85,500 | Receives | 7-day China Fixing Repo Rates
(pays quarterly) | 2.20%
(pays quarterly) | 6/19/29 | (28,796) | — | (28,796) |
| COP | 6,031,600 | Receives | Colombia Overnight Interbank Reference Rate
(pays quarterly) | 3.76%
(pays quarterly) | 11/26/25 | 140,933 | — | 140,933 |
| COP | 6,488,700 | Receives | Colombia Overnight Interbank Reference Rate
(pays quarterly) | 4.34%
(pays quarterly) | 11/26/25 | 135,869 | — | 135,869 |
| COP | 5,979,100 | Receives | Colombia Overnight Interbank Reference Rate
(pays quarterly) | 4.73%
(pays quarterly) | 11/26/25 | 115,600 | — | 115,600 |
| COP | 20,568,100 | Pays | Colombia Overnight Interbank Reference Rate
(pays quarterly) | 5.68%
(pays quarterly) | 11/26/25 | (316,446) | — | (316,446) |
| COP | 3,792,000 | Receives | Colombia Overnight Interbank Reference Rate
(pays quarterly) | 9.42%
(pays quarterly) | 11/26/25 | (529) | — | (529) |
32
See Notes to Financial Statements.
Emerging Markets Local Income Portfolio
April 30, 2024
Portfolio of Investments (Unaudited) — continued
| Interest Rate Swaps (Centrally Cleared) (continued) |
Notional Amount
(000's omitted) | Portfolio
Pays/
Receives
Floating
Rate | Floating Rate | Annual
Fixed Rate | Termination
Date | Value | Unamortized
Upfront
Receipts
(Payments) | Unrealized
Appreciation
(Depreciation) |
| COP | 17,162,000 | Receives | Colombia Overnight Interbank Reference Rate
(pays quarterly) | 8.35%
(pays quarterly) | 6/20/29 | $ (21,677) | $ — | $ (21,677) |
| CZK | 200,800 | Pays | 6-month CZK PRIBOR
(pays semi-annually) | 1.40%
(pays annually) | 3/6/25 | (327,561) | — | (327,561) |
| CZK | 258,400 | Receives | 6-month CZK PRIBOR
(pays semi-annually) | 1.37%
(pays annually) | 3/17/25 | 418,609 | — | 418,609 |
| CZK | 300,000 | Pays | 6-month CZK PRIBOR
(pays semi-annually) | 1.46%
(pays annually) | 3/15/26 | (789,463) | — | (789,463) |
| CZK | 110,000 | Pays | 6-month CZK PRIBOR
(pays semi-annually) | 5.39%
(pays annually) | 3/15/28 | 188,496 | — | 188,496 |
| CZK | 53,900 | Pays | 6-month CZK PRIBOR
(pays semi-annually) | 4.61%
(pays annually) | 6/21/28 | 65,358 | — | 65,358 |
| CZK | 230,500 | Pays | 6-month CZK PRIBOR
(pays semi-annually) | 4.15%
(pays annually) | 9/20/28 | 152,821 | — | 152,821 |
| CZK | 64,000 | Pays | 6-month CZK PRIBOR
(pays semi-annually) | 3.45%
(pays annually) | 3/20/29 | (100,540) | — | (100,540) |
| CZK | 95,400 | Pays | 6-month CZK PRIBOR
(pays semi-annually) | 3.49%
(pays annually) | 3/20/29 | (141,969) | — | (141,969) |
| CZK | 195,800 | Receives | 6-month CZK PRIBOR
(pays semi-annually) | 3.53%
(pays annually) | 3/20/29 | 269,251 | — | 269,251 |
| CZK | 154,000 | Pays | 6-month CZK PRIBOR
(pays semi-annually) | 3.52%
(pays annually) | 6/19/29 | (181,922) | — | (181,922) |
| CZK | 593,000 | Pays | 6-month CZK PRIBOR
(pays semi-annually) | 3.65%
(pays annually) | 6/19/29 | (553,662) | — | (553,662) |
| CZK | 51,941 | Pays | 6-month CZK PRIBOR
(pays semi-annually) | 3.94%
(pays annually) | 9/20/33 | (8,774) | — | (8,774) |
| CZK | 103,882 | Pays | 6-month CZK PRIBOR
(pays semi-annually) | 3.96%
(pays annually) | 9/20/33 | (12,314) | — | (12,314) |
| CZK | 125,800 | Pays | 6-month CZK PRIBOR
(pays semi-annually) | 3.96%
(pays annually) | 9/20/33 | (12,648) | — | (12,648) |
| CZK | 156,178 | Pays | 6-month CZK PRIBOR
(pays semi-annually) | 3.96%
(pays annually) | 9/20/33 | (14,409) | — | (14,409) |
| CZK | 61,000 | Pays | 6-month CZK PRIBOR
(pays semi-annually) | 4.31%
(pays annually) | 12/20/33 | (8,396) | — | (8,396) |
| CZK | 77,800 | Pays | 6-month CZK PRIBOR
(pays semi-annually) | 3.54%
(pays annually) | 3/20/34 | (192,498) | — | (192,498) |
| CZK | 36,600 | Pays | 6-month CZK PRIBOR
(pays semi-annually) | 3.73%
(pays annually) | 6/19/34 | (56,956) | — | (56,956) |
| HUF | 480,000 | Pays | 6-month HUF BUBOR
(pays semi-annually) | 0.79%
(pays annually) | 8/6/24 | (52,411) | — | (52,411) |
| HUF | 3,500,000 | Pays | 6-month HUF BUBOR
(pays semi-annually) | 0.71%
(pays annually) | 11/22/24 | (825,804) | — | (825,804) |
| HUF | 6,619,000 | Receives | 6-month HUF BUBOR
(pays semi-annually) | 1.30%
(pays annually) | 3/16/25 | 1,122,637 | — | 1,122,637 |
| HUF | 1,000,000 | Pays | 6-month HUF BUBOR
(pays semi-annually) | 1.20%
(pays annually) | 11/4/25 | (216,608) | — | (216,608) |
| HUF | 1,114,019 | Pays | 6-month HUF BUBOR
(pays semi-annually) | 6.92%
(pays annually) | 6/19/29 | 3,755 | — | 3,755 |
| HUF | 710,279 | Pays | 6-month HUF BUBOR
(pays semi-annually) | 6.94%
(pays annually) | 6/19/29 | 3,576 | — | 3,576 |
33
See Notes to Financial Statements.
Emerging Markets Local Income Portfolio
April 30, 2024
Portfolio of Investments (Unaudited) — continued
| Interest Rate Swaps (Centrally Cleared) (continued) |
Notional Amount
(000's omitted) | Portfolio
Pays/
Receives
Floating
Rate | Floating Rate | Annual
Fixed Rate | Termination
Date | Value | Unamortized
Upfront
Receipts
(Payments) | Unrealized
Appreciation
(Depreciation) |
| HUF | 1,069,400 | Pays | 6-month HUF BUBOR
(pays semi-annually) | 6.94%
(pays annually) | 6/19/29 | $ 5,976 | $ — | $ 5,976 |
| HUF | 1,940,465 | Pays | 6-month HUF BUBOR
(pays semi-annually) | 6.74%
(pays annually) | 6/19/34 | (98,628) | — | (98,628) |
| HUF | 385,542 | Pays | 6-month HUF BUBOR
(pays semi-annually) | 6.76%
(pays annually) | 6/19/34 | (18,225) | — | (18,225) |
| HUF | 5,207,192 | Pays | 6-month HUF BUBOR
(pays semi-annually) | 6.78%
(pays annually) | 6/19/34 | (226,054) | — | (226,054) |
| HUF | 1,520,390 | Pays | 6-month HUF BUBOR
(pays semi-annually) | 6.99%
(pays annually) | 6/19/34 | (6,091) | — | (6,091) |
| HUF | 3,126,912 | Pays | 6-month HUF BUBOR
(pays semi-annually) | 7.03%
(pays annually) | 6/19/34 | 14,210 | — | 14,210 |
| INR | 1,088,300 | Pays | 1-day INR FBIL MIBOR
(pays semi-annually) | 6.53%
(pays semi-annually) | 9/18/26 | (16,316) | — | (16,316) |
| INR | 1,088,000 | Pays | 1-day INR FBIL MIBOR
(pays semi-annually) | 6.55%
(pays semi-annually) | 9/18/26 | (11,884) | — | (11,884) |
| INR | 544,300 | Pays | 1-day INR FBIL MIBOR
(pays semi-annually) | 6.57%
(pays semi-annually) | 9/18/26 | (4,080) | — | (4,080) |
| INR | 544,000 | Pays | 1-day INR FBIL MIBOR
(pays semi-annually) | 6.59%
(pays semi-annually) | 9/18/26 | (1,573) | — | (1,573) |
| INR | 544,000 | Pays | 1-day INR FBIL MIBOR
(pays semi-annually) | 6.61%
(pays semi-annually) | 9/18/26 | 466 | — | 466 |
| INR | 544,000 | Pays | 1-day INR FBIL MIBOR
(pays semi-annually) | 6.61%
(pays semi-annually) | 9/18/26 | 1,048 | — | 1,048 |
| INR | 404,700 | Pays | 1-day INR FBIL MIBOR
(pays semi-annually) | 6.62%
(pays semi-annually) | 9/18/26 | 1,213 | — | 1,213 |
| INR | 544,200 | Pays | 1-day INR FBIL MIBOR
(pays semi-annually) | 6.64%
(pays semi-annually) | 9/18/26 | 4,778 | — | 4,778 |
| INR | 544,200 | Pays | 1-day INR FBIL MIBOR
(pays semi-annually) | 6.66%
(pays semi-annually) | 9/18/26 | 6,876 | — | 6,876 |
| INR | 2,462,600 | Pays | 1-day INR FBIL MIBOR
(pays semi-annually) | 6.23%
(pays semi-annually) | 3/20/29 | (462,077) | — | (462,077) |
| INR | 806,900 | Receives | 1-day INR FBIL MIBOR
(pays semi-annually) | 6.54%
(pays semi-annually) | 6/19/29 | 21,710 | — | 21,710 |
| KRW | 5,843,000 | Receives | 3-month KRW Certificate of Deposit Rate
(pays quarterly) | 3.41%
(pays quarterly) | 6/19/29 | 22,236 | — | 22,236 |
| KRW | 7,262,000 | Receives | 3-month KRW Certificate of Deposit Rate
(pays quarterly) | 3.42%
(pays quarterly) | 6/19/29 | 25,213 | — | 25,213 |
| KRW | 1,055,244 | Pays | 3-month KRW Certificate of Deposit Rate
(pays quarterly) | 3.33%
(pays quarterly) | 6/21/33 | (12,861) | — | (12,861) |
| KRW | 658,000 | Pays | 3-month KRW Certificate of Deposit Rate
(pays quarterly) | 3.35%
(pays quarterly) | 6/21/33 | (7,011) | — | (7,011) |
| KRW | 1,056,000 | Pays | 3-month KRW Certificate of Deposit Rate
(pays quarterly) | 3.29%
(pays quarterly) | 9/20/33 | (15,349) | — | (15,349) |
| KRW | 766,000 | Pays | 3-month KRW Certificate of Deposit Rate
(pays quarterly) | 3.31%
(pays quarterly) | 9/20/33 | (10,440) | — | (10,440) |
34
See Notes to Financial Statements.
Emerging Markets Local Income Portfolio
April 30, 2024
Portfolio of Investments (Unaudited) — continued
| Interest Rate Swaps (Centrally Cleared) (continued) |
Notional Amount
(000's omitted) | Portfolio
Pays/
Receives
Floating
Rate | Floating Rate | Annual
Fixed Rate | Termination
Date | Value | Unamortized
Upfront
Receipts
(Payments) | Unrealized
Appreciation
(Depreciation) |
| KRW | 191,712 | Pays | 3-month KRW Certificate of Deposit Rate
(pays quarterly) | 3.31%
(pays quarterly) | 9/20/33 | $ (2,555) | $ — | $ (2,555) |
| KRW | 1,021,000 | Pays | 3-month KRW Certificate of Deposit Rate
(pays quarterly) | 3.33%
(pays quarterly) | 9/20/33 | (12,252) | — | (12,252) |
| KRW | 1,021,500 | Pays | 3-month KRW Certificate of Deposit Rate
(pays quarterly) | 3.34%
(pays quarterly) | 9/20/33 | (11,765) | — | (11,765) |
| KRW | 543,000 | Pays | 3-month KRW Certificate of Deposit Rate
(pays quarterly) | 4.02%
(pays quarterly) | 12/20/33 | 16,258 | — | 16,258 |
| KRW | 1,075,000 | Pays | 3-month KRW Certificate of Deposit Rate
(pays quarterly) | 4.03%
(pays quarterly) | 12/20/33 | 32,977 | — | 32,977 |
| KRW | 2,170,000 | Pays | 3-month KRW Certificate of Deposit Rate
(pays quarterly) | 3.27%
(pays quarterly) | 3/20/34 | (35,804) | — | (35,804) |
| MXN | 67,771 | Pays | Mexico Interbank TIIE 28 Day
(pays monthly) | 6.08%
(pays monthly) | 6/27/24 | (42,986) | — | (42,986) |
| MXN | 224,000 | Pays | Mexico Interbank TIIE 28 Day
(pays monthly) | 7.19%
(pays monthly) | 6/27/24 | (111,689) | — | (111,689) |
| MXN | 130,204 | Receives | Mexico Interbank TIIE 28 Day
(pays monthly) | 6.66%
(pays monthly) | 11/7/24 | 199,399 | — | 199,399 |
| MXN | 574,470 | Pays | Mexico Interbank TIIE 28 Day
(pays monthly) | 10.88%
(pays monthly) | 1/6/25 | (47,191) | — | (47,191) |
| MXN | 1,577,110 | Pays | Mexico Interbank TIIE 28 Day
(pays monthly) | 10.82%
(pays monthly) | 1/7/25 | (166,191) | — | (166,191) |
| MXN | 1,391,420 | Pays | Mexico Interbank TIIE 28 Day
(pays monthly) | 10.80%
(pays monthly) | 1/8/25 | (158,380) | — | (158,380) |
| MXN | 391,500 | Pays | Mexico Interbank TIIE 28 Day
(pays monthly) | 4.65%
(pays monthly) | 2/6/25 | (1,169,131) | — | (1,169,131) |
| MXN | 144,000 | Receives | Mexico Interbank TIIE 28 Day
(pays monthly) | 7.40%
(pays monthly) | 3/11/25 | 264,300 | — | 264,300 |
| MXN | 222,000 | Pays | Mexico Interbank TIIE 28 Day
(pays monthly) | 4.71%
(pays monthly) | 12/12/25 | (1,198,268) | — | (1,198,268) |
| MXN | 111,000 | Pays | Mexico Interbank TIIE 28 Day
(pays monthly) | 6.07%
(pays monthly) | 4/28/26 | (540,161) | — | (540,161) |
| MXN | 165,000 | Pays | Mexico Interbank TIIE 28 Day
(pays monthly) | 6.11%
(pays monthly) | 6/8/26 | (806,276) | — | (806,276) |
| MXN | 130,000 | Pays | Mexico Interbank TIIE 28 Day
(pays monthly) | 6.21%
(pays monthly) | 6/29/26 | (639,648) | — | (639,648) |
35
See Notes to Financial Statements.
Emerging Markets Local Income Portfolio
April 30, 2024
Portfolio of Investments (Unaudited) — continued
| Interest Rate Swaps (Centrally Cleared) (continued) |
Notional Amount
(000's omitted) | Portfolio
Pays/
Receives
Floating
Rate | Floating Rate | Annual
Fixed Rate | Termination
Date | Value | Unamortized
Upfront
Receipts
(Payments) | Unrealized
Appreciation
(Depreciation) |
| MXN | 160,000 | Pays | Mexico Interbank TIIE 28 Day
(pays monthly) | 6.54%
(pays monthly) | 9/4/26 | $ (751,627) | $ — | $ (751,627) |
| MXN | 23,000 | Pays | Mexico Interbank TIIE 28 Day
(pays monthly) | 8.71%
(pays monthly) | 4/17/28 | (54,545) | — | (54,545) |
| MXN | 115,000 | Pays | Mexico Interbank TIIE 28 Day
(pays monthly) | 8.52%
(pays monthly) | 12/8/28 | (326,606) | — | (326,606) |
| MXN | 54,600 | Pays | Mexico Interbank TIIE 28 Day
(pays monthly) | 8.69%
(pays monthly) | 1/18/29 | (131,757) | — | (131,757) |
| MXN | 193,000 | Pays | Mexico Interbank TIIE 28 Day
(pays monthly) | 8.66%
(pays monthly) | 3/2/29 | (491,253) | — | (491,253) |
| MXN | 123,030 | Receives | Mexico Interbank TIIE 28 Day
(pays monthly) | 9.02%
(pays monthly) | 3/28/29 | 206,972 | — | 206,972 |
| MXN | 280,800 | Receives | Mexico Interbank TIIE 28 Day
(pays monthly) | 9.64%
(pays monthly) | 4/12/29 | 69,434 | — | 69,434 |
| MXN | 457,000 | Pays | Mexico Interbank TIIE 28 Day
(pays monthly) | 9.61%
(pays monthly) | 4/19/29 | (168,418) | — | (168,418) |
| MXN | 99,960 | Pays | Mexico Interbank TIIE 28 Day
(pays monthly) | 8.71%
(pays monthly) | 12/1/33 | (324,691) | — | (324,691) |
| MXN | 96,100 | Pays | Mexico Interbank TIIE 28 Day
(pays monthly) | 8.77%
(pays monthly) | 12/1/33 | (290,577) | — | (290,577) |
| MXN | 59,530 | Pays | Mexico Interbank TIIE 28 Day
(pays monthly) | 8.43%
(pays monthly) | 12/2/33 | (255,516) | — | (255,516) |
| MXN | 61,510 | Pays | Mexico Interbank TIIE 28 Day
(pays monthly) | 8.49%
(pays monthly) | 12/2/33 | (251,358) | — | (251,358) |
| PLN | 18,000 | Pays | 6-month PLN WIBOR
(pays semi-annually) | 2.00%
(pays annually) | 5/30/24 | (48,518) | — | (48,518) |
| PLN | 37,000 | Pays | 6-month PLN WIBOR
(pays semi-annually) | 1.79%
(pays annually) | 7/5/24 | (119,678) | — | (119,678) |
| PLN | 27,850 | Pays | 6-month PLN WIBOR
(pays semi-annually) | 1.77%
(pays annually) | 8/6/24 | (91,786) | — | (91,786) |
| PLN | 12,200 | Pays | 6-month PLN WIBOR
(pays semi-annually) | 1.66%
(pays annually) | 10/2/24 | (44,255) | — | (44,255) |
| PLN | 11,400 | Pays | 6-month PLN WIBOR
(pays semi-annually) | 2.44%
(pays annually) | 10/28/24 | (19,268) | — | (19,268) |
| PLN | 50,000 | Pays | 6-month PLN WIBOR
(pays semi-annually) | 1.97%
(pays annually) | 1/20/25 | (490,289) | — | (490,289) |
| PLN | 10,800 | Pays | 6-month PLN WIBOR
(pays semi-annually) | 0.48%
(pays annually) | 8/7/25 | (200,376) | — | (200,376) |
| PLN | 11,000 | Pays | 6-month PLN WIBOR
(pays semi-annually) | 0.69%
(pays annually) | 8/26/25 | (191,913) | — | (191,913) |
| PLN | 42,000 | Pays | 6-month PLN WIBOR
(pays semi-annually) | 0.64%
(pays annually) | 1/25/26 | (1,004,238) | — | (1,004,238) |
36
See Notes to Financial Statements.
Emerging Markets Local Income Portfolio
April 30, 2024
Portfolio of Investments (Unaudited) — continued
| Interest Rate Swaps (Centrally Cleared) (continued) |
Notional Amount
(000's omitted) | Portfolio
Pays/
Receives
Floating
Rate | Floating Rate | Annual
Fixed Rate | Termination
Date | Value | Unamortized
Upfront
Receipts
(Payments) | Unrealized
Appreciation
(Depreciation) |
| PLN | 13,250 | Pays | 6-month PLN WIBOR
(pays semi-annually) | 3.87%
(pays annually) | 3/3/27 | $ (142,587) | $ — | $ (142,587) |
| PLN | 99,138 | Pays | 6-month PLN WIBOR
(pays semi-annually) | 3.91%
(pays annually) | 3/3/27 | (1,039,663) | — | (1,039,663) |
| PLN | 75,000 | Pays | 6-month PLN WIBOR
(pays semi-annually) | 2.84%
(pays annually) | 1/10/28 | (1,699,063) | — | (1,699,063) |
| PLN | 20,000 | Pays | 6-month PLN WIBOR
(pays semi-annually) | 5.29%
(pays annually) | 3/15/28 | (7,123) | — | (7,123) |
| PLN | 25,000 | Receives | 6-month PLN WIBOR
(pays semi-annually) | 4.79%
(pays annually) | 3/20/29 | 135,143 | — | 135,143 |
| PLN | 23,914 | Pays | 6-month PLN WIBOR
(pays semi-annually) | 5.41%
(pays annually) | 6/19/29 | 40,032 | — | 40,032 |
| PLN | 58,000 | Pays | 6-month PLN WIBOR
(pays semi-annually) | 5.42%
(pays annually) | 6/19/29 | 107,801 | — | 107,801 |
| PLN | 26,700 | Pays | 6-month PLN WIBOR
(pays semi-annually) | 1.74%
(pays annually) | 7/2/31 | (1,417,678) | — | (1,417,678) |
| PLN | 20,500 | Pays | 6-month PLN WIBOR
(pays semi-annually) | 5.19%
(pays annually) | 9/21/32 | 79,494 | — | 79,494 |
| PLN | 18,000 | Pays | 6-month PLN WIBOR
(pays semi-annually) | 5.50%
(pays annually) | 6/19/34 | 47,010 | — | 47,010 |
| PLN | 7,086 | Pays | 6-month PLN WIBOR
(pays semi-annually) | 5.53%
(pays annually) | 6/19/34 | 22,504 | — | 22,504 |
| THB | 175,000 | Pays | Thai Overnight Repurchase Rate
(pays semi-annually) | 1.29%
(pays semi-annually) | 11/25/24 | (82,893) | — | (82,893) |
| THB | 233,000 | Receives | Thai Overnight Repurchase Rate
(pays semi-annually) | 1.02%
(pays semi-annually) | 3/17/25 | 104,657 | — | 104,657 |
| THB | 291,000 | Pays | Thai Overnight Repurchase Rate
(pays semi-annually) | 0.90%
(pays semi-annually) | 2/23/26 | (267,495) | — | (267,495) |
| THB | 120,000 | Pays | Thai Overnight Repurchase Rate
(pays semi-annually) | 1.30%
(pays semi-annually) | 11/18/26 | (125,697) | — | (125,697) |
| THB | 514,900 | Pays | Thai Overnight Repurchase Rate
(pays semi-annually) | 2.94%
(pays semi-annually) | 12/20/28 | 237,711 | — | 237,711 |
| THB | 177,200 | Pays | Thai Overnight Repurchase Rate
(pays semi-annually) | 2.95%
(pays semi-annually) | 12/20/28 | 83,818 | — | 83,818 |
| THB | 97,000 | Pays | Thai Overnight Repurchase Rate
(pays semi-annually) | 2.19%
(pays semi-annually) | 3/20/29 | (53,823) | — | (53,823) |
| THB | 176,190 | Pays | Thai Overnight Repurchase Rate
(pays semi-annually) | 2.17%
(pays semi-annually) | 6/19/29 | (103,080) | — | (103,080) |
| THB | 830,000 | Pays | Thai Overnight Repurchase Rate
(pays semi-annually) | 2.18%
(pays semi-annually) | 6/19/29 | (479,281) | — | (479,281) |
| THB | 191,300 | Pays | Thai Overnight Repurchase Rate
(pays semi-annually) | 2.22%
(pays semi-annually) | 6/19/29 | (99,796) | — | (99,796) |
37
See Notes to Financial Statements.
Emerging Markets Local Income Portfolio
April 30, 2024
Portfolio of Investments (Unaudited) — continued
| Interest Rate Swaps (Centrally Cleared) (continued) |
Notional Amount
(000's omitted) | Portfolio
Pays/
Receives
Floating
Rate | Floating Rate | Annual
Fixed Rate | Termination
Date | Value | Unamortized
Upfront
Receipts
(Payments) | Unrealized
Appreciation
(Depreciation) |
| THB | 178,000 | Receives | Thai Overnight Repurchase Rate
(pays semi-annually) | 2.59%
(pays semi-annually) | 6/19/29 | $ 10,498 | $ — | $ 10,498 |
| THB | 99,200 | Receives | Thai Overnight Repurchase Rate
(pays semi-annually) | 2.61%
(pays semi-annually) | 6/19/29 | 3,336 | — | 3,336 |
| THB | 117,000 | Receives | Thai Overnight Repurchase Rate
(pays semi-annually) | 2.61%
(pays semi-annually) | 6/19/29 | 3,489 | — | 3,489 |
| THB | 204,600 | Pays | Thai Overnight Repurchase Rate
(pays semi-annually) | 1.72%
(pays semi-annually) | 10/29/31 | (435,541) | — | (435,541) |
| THB | 200,000 | Pays | Thai Overnight Repurchase Rate
(pays semi-annually) | 1.69%
(pays semi-annually) | 11/4/31 | (435,365) | — | (435,365) |
| THB | 108,000 | Pays | Thai Overnight Repurchase Rate
(pays semi-annually) | 2.65%
(pays semi-annually) | 3/20/34 | (67,867) | — | (67,867) |
| THB | 678,000 | Pays | Thai Overnight Repurchase Rate
(pays semi-annually) | 2.48%
(pays semi-annually) | 6/19/34 | (734,743) | — | (734,743) |
| ZAR | 244,000 | Receives | 3-month ZAR JIBAR
(pays quarterly) | 7.04%
(pays quarterly) | 3/12/25 | 178,460 | — | 178,460 |
| ZAR | 65,700 | Receives | 3-month ZAR JIBAR
(pays quarterly) | 6.91%
(pays quarterly) | 3/13/25 | 52,948 | — | 52,948 |
| ZAR | 60,000 | Pays | 3-month ZAR JIBAR
(pays quarterly) | 8.07%
(pays quarterly) | 3/20/29 | (102,922) | — | (102,922) |
| ZAR | 124,310 | Pays | 3-month ZAR JIBAR
(pays quarterly) | 8.56%
(pays quarterly) | 6/19/29 | (103,763) | — | (103,763) |
| Total | | | | | | $(16,401,544) | $ — | $ (16,401,544) |
| Interest Rate Swaps (OTC) |
| Counterparty | Notional Amount
(000's omitted) | Portfolio
Pays/Receives
Floating Rate | Floating Rate | Annual
Fixed Rate | Termination
Date | Value/Unrealized
Appreciation
(Depreciation) |
| BNP Paribas | MYR | 17,413 | Pays | 3-month MYR KLIBOR
(pays quarterly) | 2.95%
(pays quarterly) | 3/16/27 | $ (79,260) |
| Goldman Sachs International | MYR | 61,700 | Receives | 3-month MYR KLIBOR
(pays quarterly) | 3.73%
(pays quarterly) | 6/19/29 | 57,140 |
| JPMorgan Chase Bank, N.A. | MYR | 88,787 | Pays | 3-month MYR KLIBOR
(pays quarterly) | 2.95%
(pays quarterly) | 3/16/27 | (404,696) |
| JPMorgan Chase Bank, N.A. | MYR | 54,800 | Pays | 3-month MYR KLIBOR
(pays quarterly) | 3.72%
(pays quarterly) | 6/20/29 | (53,488) |
| Total | | | | | | | $(480,304) |
38
See Notes to Financial Statements.
Emerging Markets Local Income Portfolio
April 30, 2024
Portfolio of Investments (Unaudited) — continued
| Credit Default Swaps - Buy Protection (Centrally Cleared) | |
| Reference Entity | Notional
Amount
(000's omitted) | Contract
Annual
Fixed Rate* | Termination
Date | Value | Unamortized
Upfront
Receipts
(Payments) | Unrealized
Appreciation
(Depreciation) |
| Markit CDX Emerging Markets Index (CDX.EM.31.V3) | | $86 | 1.00%
(pays quarterly)(1) | 6/20/24 | $ (240) | $ (361) | $ (601) |
| Total | | | | | $(240) | $(361) | $(601) |
| * | The contract annual fixed rate represents the fixed rate of interest paid by the Portfolio (as a buyer of protection) on the notional amount of the credit default swap contract. |
| (1) | Upfront payment is exchanged with the counterparty as a result of the standardized trading coupon. |
| Abbreviations: |
| BUBOR | – Budapest Interbank Offered Rate |
| FBIL | – Financial Benchmarks India Ltd. |
| JIBAR | – Johannesburg Interbank Average Rate |
| KLIBOR | – Kuala Lumpur Interbank Offered Rate |
| MIBOR | – Mumbai Interbank Offered Rate |
| OTC | – Over-the-counter |
| PIK | – Payment In Kind |
| PRIBOR | – Prague Interbank Offered Rate |
| WIBOR | – Warsaw Interbank Offered Rate |
| Currency Abbreviations: |
| ALL | – Albanian Lek |
| AMD | – Armenian Dram |
| BAM | – Bosnia-Herzegovina Convertible Mark |
| BRL | – Brazilian Real |
| CLP | – Chilean Peso |
| CNH | – Yuan Renminbi Offshore |
| CNY | – Yuan Renminbi |
| COP | – Colombian Peso |
| CZK | – Czech Koruna |
| DOP | – Dominican Peso |
| EGP | – Egyptian Pound |
| EUR | – Euro |
| HUF | – Hungarian Forint |
| IDR | – Indonesian Rupiah |
| INR | – Indian Rupee |
| KES | – Kenyan Shilling |
| KRW | – South Korean Won |
| KZT | – Kazakhstani Tenge |
| |
| MXN | – Mexican Peso |
| MYR | – Malaysian Ringgit |
| NGN | – Nigerian Naira |
| PEN | – Peruvian Sol |
| PLN | – Polish Zloty |
| PYG | – Paraguayan Guarani |
| RON | – Romanian Leu |
| RSD | – Serbian Dinar |
| SGD | – Singapore Dollar |
| THB | – Thai Baht |
| TRY | – Turkish Lira |
| TWD | – New Taiwan Dollar |
| UAH | – Ukrainian Hryvnia |
| USD | – United States Dollar |
| UYU | – Uruguayan Peso |
| UZS | – Uzbekistani Som |
| ZAR | – South African Rand |
39
See Notes to Financial Statements.
Emerging Markets Local Income Portfolio
April 30, 2024
Statement of Assets and Liabilities (Unaudited)
| | April 30, 2024 |
| Assets | |
| Investments, at value (identified cost $1,242,615,211) | $ 1,148,559,921 |
| Cash | 2,834,784 |
| Deposits for derivatives collateral: | |
| Centrally cleared derivatives | 42,903,087 |
| OTC derivatives | 11,192,000 |
| Foreign currency, at value (identified cost $27,266,458) | 27,061,575 |
| Interest and dividends receivable | 22,246,486 |
| Dividends receivable from affiliated investments | 7,414 |
| Receivable for investments sold | 1,559,176 |
| Receivable for variation margin on open futures contracts | 84,070 |
| Receivable for open forward foreign currency exchange contracts | 15,566,550 |
| Receivable for open swap contracts | 57,140 |
| Receivable for closed swap contracts | 110,869 |
| Trustees' deferred compensation plan | 82,617 |
| Total assets | $1,272,265,689 |
| Liabilities | |
| Cash collateral due to brokers | $ 1,849,000 |
| Written options outstanding, at value (premiums received $510,182) | 100,935 |
| Payable for investments purchased | 2,667,300 |
| Payable for securities sold short, at value (proceeds $11,465,142) | 10,719,651 |
| Payable for variation margin on open centrally cleared derivatives | 2,095,180 |
| Payable for open forward foreign currency exchange contracts | 21,068,303 |
| Payable for open swap contracts | 537,444 |
| Payable for closed swap contracts | 1,414,447 |
| Payable for open non-deliverable bond forward contracts | 555,315 |
| Payable to affiliates: | |
| Investment adviser fee | 668,982 |
| Trustees' fees | 6,818 |
| Trustees' deferred compensation plan | 82,617 |
| Interest payable on securities sold short | 895,721 |
| Accrued foreign capital gains taxes | 357,451 |
| Accrued expenses | 655,468 |
| Total liabilities | $ 43,674,632 |
| Net Assets applicable to investors' interest in Portfolio | $1,228,591,057 |
40
See Notes to Financial Statements.
Emerging Markets Local Income Portfolio
April 30, 2024
Statement of Operations (Unaudited)
| | Six Months Ended |
| | April 30, 2024 |
| Investment Income | |
| Dividend income from affiliated investments | $ 2,100,134 |
| Interest income (net of foreign taxes withheld of $668,630) | 47,718,998 |
| Other income | 11,488 |
| Total investment income | $ 49,830,620 |
| Expenses | |
| Investment adviser fee | $ 3,947,929 |
| Trustees’ fees and expenses | 40,683 |
| Custodian fee | 454,392 |
| Legal and accounting services | 96,410 |
| Interest expense and fees | 351,374 |
| Interest expense on securities sold short | 471,392 |
| Miscellaneous | 21,682 |
| Total expenses | $ 5,383,862 |
| Deduct: | |
| Waiver and/or reimbursement of expenses by affiliates | $ 62,636 |
| Total expense reductions | $ 62,636 |
| Net expenses | $ 5,321,226 |
| Net investment income | $ 44,509,394 |
| Realized and Unrealized Gain (Loss) | |
| Net realized gain (loss): | |
| Investment transactions (net of foreign capital gains taxes of $10,156) | $ (16,383,898) |
| Written options | 334,533 |
| Securities sold short | (765,836) |
| Futures contracts | 59,065 |
| Swap contracts | (2,467,747) |
| Foreign currency transactions | 6,897,503 |
| Forward foreign currency exchange contracts | 15,868,220 |
| Non-deliverable bond forward contracts | 1,591,371 |
| Net realized gain | $ 5,133,211 |
| Change in unrealized appreciation (depreciation): | |
| Investments (including net increase in accrued foreign capital gains taxes of $3,146) | $ 30,324,758 |
| Written options | 336,706 |
| Securities sold short | 534,243 |
| Futures contracts | 255,282 |
| Swap contracts | (1,998,348) |
| Foreign currency | 317,110 |
| Forward foreign currency exchange contracts | (10,743,562) |
| Non-deliverable bond forward contracts | (597,073) |
| Net change in unrealized appreciation (depreciation) | $ 18,429,116 |
| Net realized and unrealized gain | $ 23,562,327 |
| Net increase in net assets from operations | $ 68,071,721 |
41
See Notes to Financial Statements.
Emerging Markets Local Income Portfolio
April 30, 2024
Statements of Changes in Net Assets
| | Six Months Ended
April 30, 2024
(Unaudited) | Year Ended
October 31, 2023 |
| Increase (Decrease) in Net Assets | | |
| From operations: | | |
| Net investment income | $ 44,509,394 | $ 72,437,283 |
| Net realized gain (loss) | 5,133,211 | (63,719,108) |
| Net change in unrealized appreciation (depreciation) | 18,429,116 | 130,772,686 |
| Net increase in net assets from operations | $ 68,071,721 | $ 139,490,861 |
| Capital transactions: | | |
| Contributions | $ 166,609,283 | $ 327,529,582 |
| Withdrawals | (76,104,110) | (355,736,811) |
| Net increase (decrease) in net assets from capital transactions | $ 90,505,173 | $ (28,207,229) |
| Net increase in net assets | $ 158,576,894 | $ 111,283,632 |
| Net Assets | | |
| At beginning of period | $ 1,070,014,163 | $ 958,730,531 |
| At end of period | $1,228,591,057 | $1,070,014,163 |
42
See Notes to Financial Statements.
Emerging Markets Local Income Portfolio
April 30, 2024
| | Six Months Ended
April 30, 2024
(Unaudited) | Year Ended October 31, |
| Ratios/Supplemental Data | 2023 | 2022 | 2021 | 2020 | 2019 |
| Ratios (as a percentage of average daily net assets): | | | | | | |
| Expenses | 0.87% (1)(2)(3) | 0.72% (3) | 0.76% (3) | 0.75% | 0.79% | 0.78% |
| Net investment income | 7.27% (1) | 6.43% | 6.43% | 4.98% | 5.79% | 7.01% |
| Portfolio Turnover | 34% (4) | 67% | 33% | 56% | 56% | 46% |
| Total Return | 6.41% (4) | 15.00% | (20.12)% | 1.48% | 0.08% | 23.15% |
| Net assets, end of period (000’s omitted) | $1,228,591 | $1,070,014 | $958,731 | $1,561,621 | $1,253,935 | $1,238,490 |
| (1) | Annualized. |
| (2) | Includes interest expense, including on securities sold short and reverse repurchase agreements of 0.13% of average daily net assets for the six months ended April 30, 2024. |
| (3) | Includes a reduction by the investment adviser of a portion of its adviser fee due to the Portfolio’s investment in the Liquidity Fund (equal to 0.01%, 0.01% and less than 0.005% of average daily net assets for the six months ended April 30, 2024 and the years ended October 31, 2023 and 2022, respectively). |
| (4) | Not annualized. |
Emerging Markets Local Income Portfolio
April 30, 2024
Notes to Financial Statements (Unaudited)
1 Significant Accounting Policies
Emerging Markets Local Income Portfolio (the Portfolio) is a Massachusetts business trust registered under the Investment Company Act of 1940, as amended (the 1940 Act), as a non-diversified, open-end management investment company. The Portfolio’s investment objective is total return. The Declaration of Trust permits the Trustees to issue interests in the Portfolio. At April 30, 2024, Eaton Vance Emerging Markets Local Income Fund, Eaton Vance Strategic Income Fund and Eaton Vance International (Cayman Islands) Strategic Income Fund held an interest of 83.2%, 16.5% and 0.3%, respectively, in the Portfolio.
The following is a summary of significant accounting policies of the Portfolio. The policies are in conformity with accounting principles generally accepted in the United States of America (U.S. GAAP). The Portfolio is an investment company and follows accounting and reporting guidance in the Financial Accounting Standards Board (FASB) Accounting Standards Codification Topic 946.
A Investment Valuation—The following methodologies are used to determine the market value or fair value of investments.
Debt Obligations. Debt obligations are generally valued on the basis of valuations provided by third party pricing services, as derived from such services’ pricing models. Inputs to the models may include, but are not limited to, reported trades, executable bid and ask prices, broker/dealer quotations, prices or yields of securities with similar characteristics, interest rates, anticipated prepayments, benchmark curves or information pertaining to the issuer, as well as industry and economic events. The pricing services may use a matrix approach, which considers information regarding securities with similar characteristics to determine the valuation for a security. Short-term debt obligations purchased with a remaining maturity of sixty days or less for which a valuation from a third party pricing service is not readily available may be valued at amortized cost, which approximates fair value.
Derivatives. U.S. exchange-traded options are valued at the mean between the bid and ask prices at valuation time as reported by the Options Price Reporting Authority. Non U.S. exchange-traded options and over-the-counter options (including options on securities, indices and foreign currencies) are valued by a third party pricing service using techniques that consider factors including the value of the underlying instrument, the volatility of the underlying instrument and the period of time until option expiration. Futures contracts are valued at the closing settlement price established by the board of trade or exchange on which they are traded. Forward foreign currency exchange contracts are generally valued at the mean of the average bid and average ask prices that are reported by currency dealers to a third party pricing service at the valuation time. Such third party pricing service valuations are supplied for specific settlement periods and the Portfolio’s forward foreign currency exchange contracts are valued at an interpolated rate between the closest preceding and subsequent settlement period reported by the third party pricing service. Non-deliverable bond forward contracts are generally valued based on the current price of the underlying bond as provided by a third party pricing service and current interest rates. Swaps are normally valued using valuations provided by a third party pricing service. Such pricing service valuations are based on the present value of fixed and projected floating rate cash flows over the term of the swap contract, and in the case of credit default swaps, based on credit spread quotations obtained from broker/dealers and expected default recovery rates determined by the pricing service using proprietary models. Future cash flows on swaps are discounted to their present value using swap rates provided by electronic data services or by broker/dealers.
Foreign Securities and Currencies. Foreign securities and currencies are valued in U.S. dollars, based on foreign currency exchange rate quotations supplied by a third party pricing service. The pricing service uses a proprietary model to determine the exchange rate. Inputs to the model include reported trades and implied bid/ask spreads.
Other. Investments in management investment companies (including money market funds) that do not trade on an exchange are valued at the net asset value as of the close of each business day.
Fair Valuation. In connection with Rule 2a-5 of the 1940 Act, the Trustees have designated the Portfolio’s investment adviser as its valuation designee. Investments for which valuations or market quotations are not readily available or are deemed unreliable are valued by the investment adviser, as valuation designee, at fair value using methods that most fairly reflect the security’s “fair value”, which is the amount that the Portfolio might reasonably expect to receive for the security upon its current sale in the ordinary course. Each such determination is based on a consideration of relevant factors, which are likely to vary from one pricing context to another. These factors may include, but are not limited to, the type of security, the existence of any contractual restrictions on the security’s disposition, the price and extent of public trading in similar securities of the issuer or of comparable companies or entities, quotations or relevant information obtained from broker/dealers or other market participants, information obtained from the issuer, analysts, and/or the appropriate stock exchange (for exchange-traded securities), an analysis of the company’s or entity’s financial statements, and an evaluation of the forces that influence the issuer and the market(s) in which the security is purchased and sold.
B Investment Transactions—Investment transactions for financial statement purposes are accounted for on a trade date basis. Realized gains and losses on investments sold are determined on the basis of identified cost.
C Income—Interest income is recorded on the basis of interest accrued, adjusted for amortization of premium or accretion of discount. Inflation adjustments to the principal amount of inflation-adjusted bonds and notes are reflected as interest income. Deflation adjustments to the principal amount of an inflation-adjusted bond or note are reflected as reductions to interest income to the extent of interest income previously recorded on such bond or note. Dividend income is recorded on the ex-dividend date for dividends received in cash and/or securities. Withholding taxes on foreign interest and capital gains have been provided for in accordance with the Portfolio's understanding of the applicable countries’ tax rules and rates.
Emerging Markets Local Income Portfolio
April 30, 2024
Notes to Financial Statements (Unaudited) — continued
D Federal and Other Taxes—The Portfolio has elected to be treated as a partnership for federal tax purposes. No provision is made by the Portfolio for federal or state taxes on any taxable income of the Portfolio because each investor in the Portfolio is ultimately responsible for the payment of any taxes on its share of taxable income. Since at least one of the Portfolio’s investors is a regulated investment company that invests all or substantially all of its assets in the Portfolio, the Portfolio normally must satisfy the applicable source of income and diversification requirements (under the Internal Revenue Code) in order for its investors to satisfy them. The Portfolio will allocate, at least annually among its investors, each investor’s distributive share of the Portfolio’s net investment income, net realized capital gains and losses and any other items of income, gain, loss, deduction or credit.
In addition to the requirements of the Internal Revenue Code, the Portfolio may also be subject to local taxes on the recognition of capital gains in certain countries. In determining the daily net asset value, the Portfolio estimates the accrual for such taxes, if any, based on the unrealized appreciation on certain portfolio securities and the related tax rates. Taxes attributable to unrealized appreciation are included in the change in unrealized appreciation (depreciation) on investments. Capital gains taxes on securities sold are included in net realized gain (loss) on investments.
As of April 30, 2024, the Portfolio had no uncertain tax positions that would require financial statement recognition, de-recognition, or disclosure. The Portfolio files a U.S. federal income tax return annually after its fiscal year-end, which is subject to examination by the Internal Revenue Service for a period of three years from the date of filing.
E Foreign Currency Translation—Investment valuations, other assets, and liabilities initially expressed in foreign currencies are translated each business day into U.S. dollars based upon current exchange rates. Purchases and sales of foreign investment securities and income and expenses denominated in foreign currencies are translated into U.S. dollars based upon currency exchange rates in effect on the respective dates of such transactions. Recognized gains or losses on investment transactions attributable to changes in foreign currency exchange rates are recorded for financial statement purposes as net realized gains and losses on investments. That portion of unrealized gains and losses on investments that results from fluctuations in foreign currency exchange rates is not separately disclosed.
F Use of Estimates—The preparation of the financial statements in conformity with U.S. GAAP requires management to make estimates and assumptions that affect the reported amounts of assets and liabilities at the date of the financial statements and the reported amounts of income and expense during the reporting period. Actual results could differ from those estimates.
G Indemnifications—Under the Portfolio’s organizational documents, its officers and Trustees may be indemnified against certain liabilities and expenses arising out of the performance of their duties to the Portfolio. Under Massachusetts law, if certain conditions prevail, interestholders in the Portfolio could be deemed to have personal liability for the obligations of the Portfolio. However, the Portfolio’s Declaration of Trust contains an express disclaimer of liability on the part of Portfolio interestholders. Additionally, in the normal course of business, the Portfolio enters into agreements with service providers that may contain indemnification clauses. The Portfolio’s maximum exposure under these arrangements is unknown as this would involve future claims that may be made against the Portfolio that have not yet occurred.
H Futures Contracts—Upon entering into a futures contract, the Portfolio is required to deposit with the broker, either in cash or securities, an amount equal to a certain percentage of the contract amount (initial margin). Subsequent payments, known as variation margin, are made or received by the Portfolio each business day, depending on the daily fluctuations in the value of the underlying security or index, and are recorded as unrealized gains or losses by the Portfolio. Gains (losses) are realized upon the expiration or closing of the futures contracts. Should market conditions change unexpectedly, the Portfolio may not achieve the anticipated benefits of the futures contracts and may realize a loss. Futures contracts have minimal counterparty risk as they are exchange traded and the clearinghouse for the exchange is substituted as the counterparty, guaranteeing counterparty performance.
I Forward Foreign Currency Exchange and Non-Deliverable Bond Forward Contracts—The Portfolio may enter into forward foreign currency exchange contracts for the purchase or sale of a specific foreign currency at a fixed price on a future date. The forward foreign currency exchange contracts are adjusted by the daily exchange rate of the underlying currency and any gains or losses are recorded as unrealized until such time as the contracts have been closed. While forward foreign currency exchange contracts are privately negotiated agreements between the Portfolio and a counterparty, certain contracts may be “centrally cleared”, whereby all payments made or received by the Portfolio pursuant to the contract are with a central clearing party (CCP) rather than the original counterparty. The CCP guarantees the performance of the original parties to the contract. Upon entering into centrally cleared contracts, the Portfolio is required to deposit with the CCP, either in cash or securities, an amount of initial margin determined by the CCP, which is subject to adjustment. For centrally cleared contracts, the daily change in valuation is recorded as a receivable or payable for variation margin and settled in cash with the CCP daily. The Portfolio may also enter into non-deliverable bond forward contracts for the purchase of a bond denominated in a non-deliverable foreign currency at a fixed price on a future date. For non-deliverable bond forward contracts, unrealized gains and losses, based on changes in the value of the contract, and realized gains and losses are accounted for as described above. Risks may arise upon entering these contracts from the potential inability of counterparties to meet the terms of their contracts and from movements in the value of a foreign currency relative to the U.S. dollar. In the case of centrally cleared contracts, counterparty risk is minimal due to protections provided by the CCP.
J Purchased Options—Upon the purchase of a call or put option, the premium paid by the Portfolio is included in the Statement of Assets and Liabilities as an investment. The amount of the investment is subsequently marked-to-market to reflect the current market value of the option purchased, in accordance with the Portfolio’s policies on investment valuations discussed above. Premiums paid for purchasing options that expire are treated as realized losses. Premiums paid for purchasing options that are exercised or closed are added to the amounts paid or offset against the proceeds on the underlying
Emerging Markets Local Income Portfolio
April 30, 2024
Notes to Financial Statements (Unaudited) — continued
investment transaction to determine the realized gain or loss. The risk associated with purchasing options is limited to the premium originally paid. Purchased options traded over-the-counter involve risk that the issuer or counterparty will fail to perform its contractual obligations.
K Written Options—Upon the writing of a call or a put option, the premium received by the Portfolio is included in the Statement of Assets and Liabilities as a liability. The amount of the liability is subsequently marked-to-market to reflect the current market value of the option written, in accordance with the Portfolio’s policies on investment valuations discussed above. Premiums received from writing options that expire are treated as realized gains. Premiums received from writing options that are exercised or are closed are added to or offset against the proceeds or amount paid on the transaction to determine the realized gain or loss. The Portfolio, as a writer of an option, may have no control over whether the underlying instrument may be sold (call) or purchased (put) and, as a result, bears the market risk of an unfavorable change in the price of the instrument underlying the written option. The Portfolio may also bear the risk of not being able to enter into a closing transaction if a liquid secondary market does not exist.
L Interest Rate Swaps—Swap contracts are privately negotiated agreements between the Portfolio and a counterparty. Certain swap contracts may be centrally cleared. Pursuant to interest rate swap agreements, the Portfolio either makes floating-rate payments to the counterparty (or CCP in the case of centrally cleared swaps) based on a benchmark interest rate in exchange for fixed-rate payments or the Portfolio makes fixed-rate payments to the counterparty (or CCP in the case of a centrally cleared swap) in exchange for payments on a floating benchmark interest rate. Payments received or made, including amortization of upfront payments/receipts, if any (which are amortized over the life of the swap contract), are recorded as realized gains or losses. During the term of the outstanding swap agreement, changes in the underlying value of the swap are recorded as unrealized gains or losses. For centrally cleared swaps, the daily change in valuation is recorded as a receivable or payable for variation margin and settled in cash with the CCP daily. The value of the swap is determined by changes in the relationship between two rates of interest. The Portfolio is exposed to credit loss in the event of non-performance by the swap counterparty. In the case of centrally cleared swaps, counterparty risk is minimal due to protections provided by the CCP. Risk may also arise from movements in interest rates.
M Credit Default Swaps—When the Portfolio is the buyer of a credit default swap contract, the Portfolio is entitled to receive the par (or other agreed-upon) value of a referenced debt obligation (or basket of debt obligations) from the counterparty (or CCP in the case of a centrally cleared swap) to the contract if a credit event by a third party, such as a U.S. or foreign corporate issuer or sovereign issuer, on the debt obligation occurs. In return, the Portfolio pays the counterparty a periodic stream of payments over the term of the contract provided that no credit event has occurred. If no credit event occurs, the Portfolio would have spent the stream of payments and received no proceeds from the contract. When the Portfolio is the seller of a credit default swap contract, it receives the stream of payments, but is obligated to pay to the buyer of the protection an amount up to the notional amount of the swap and in certain instances take delivery of securities of the reference entity upon the occurrence of a credit event, as defined under the terms of that particular swap agreement. Credit events are contract specific but may include bankruptcy, failure to pay, restructuring, obligation acceleration and repudiation/moratorium. If the Portfolio is a seller of protection and a credit event occurs, the maximum potential amount of future payments that the Portfolio could be required to make would be an amount equal to the notional amount of the agreement. This potential amount would be partially offset by any recovery value of the respective referenced obligation, or net amount received from the settlement of a buy protection credit default swap agreement entered into by the Portfolio for the same referenced obligation. As the seller, the Portfolio may create economic leverage to its portfolio because, in addition to its total net assets, the Portfolio is subject to investment exposure on the notional amount of the swap. The interest fee paid or received on the swap contract, which is based on a specified interest rate on a fixed notional amount, is accrued daily as a component of unrealized appreciation (depreciation) and is recorded as realized gain upon receipt or realized loss upon payment. The Portfolio also records an increase or decrease to unrealized appreciation (depreciation) in an amount equal to the daily valuation. For centrally cleared swaps, the daily change in valuation is recorded as a receivable or payable for variation margin and settled in cash with the CCP daily. All upfront payments and receipts, if any, are amortized over the life of the swap contract as realized gains or losses. Those upfront payments or receipts for non-centrally cleared swaps are recorded as other assets or other liabilities, respectively, net of amortization. For financial reporting purposes, unamortized upfront payments or receipts, if any, are netted with unrealized appreciation or depreciation on swap contracts to determine the market value of swaps as presented in Notes 5 and 9. These transactions involve certain risks, including the risk that the seller may be unable to fulfill the transaction. In the case of centrally cleared swaps, counterparty risk is minimal due to protections provided by the CCP.
N Repurchase Agreements—A repurchase agreement is the purchase by the Portfolio of securities from a counterparty in exchange for cash that is coupled with an agreement to resell those securities to the counterparty at a specified date and price. When a repurchase agreement is entered, the Portfolio typically receives securities with a value that equals or exceeds the repurchase price, including any accrued interest earned on the agreement. The value of such securities will be marked-to-market daily, and cash or additional securities will be exchanged between the parties as needed. Except in the case of a repurchase agreement entered to settle a short sale, the value of the securities delivered to the Portfolio will be at least equal to 90% of the repurchase price during the term of the repurchase agreement. The terms of a repurchase agreement entered to settle a short sale may provide that the cash purchase price paid by the Portfolio is more than the value of purchased securities that effectively collateralize the repurchase price payable by the counterparty. In the event of insolvency of the counterparty to a repurchase agreement, recovery of the repurchase price owed to the Portfolio may be delayed. Such an insolvency also may result in a loss to the extent that the value of the purchased securities decreases during the delay or that value has otherwise not been maintained at an amount at least equal to the repurchase price.
O Reverse Repurchase Agreements—Under a reverse repurchase agreement, the Portfolio temporarily transfers possession of a portfolio security to another party, such as a bank or broker/dealer, in return for cash. At the same time, the Portfolio agrees to repurchase the security at an agreed upon time and price, which reflects an interest payment. In periods of increased demand for a security, the Portfolio may receive a payment from the counterparty for
Emerging Markets Local Income Portfolio
April 30, 2024
Notes to Financial Statements (Unaudited) — continued
the use of the security, which is recorded as interest income. Because the Portfolio retains effective control over the transferred security, the transaction is accounted for as a secured borrowing. The Portfolio may enter into such agreements when it believes it is able to invest the cash acquired at a rate higher than the cost of the agreement, which would increase earned income. When the Portfolio enters into a reverse repurchase agreement, any fluctuations in the market value of either the securities transferred to another party or the securities in which the proceeds may be invested would affect the market value of the Portfolio’s assets. Because reverse repurchase agreements may be considered to be the practical equivalent of borrowing funds (and the counterparty making a loan), they constitute a form of leverage. The Portfolio segregates cash or liquid assets equal to its obligation to repurchase the security. During the term of the agreement, the Portfolio may also be obligated to pledge additional cash and/or securities in the event of a decline in the fair value of the transferred security. In the event the counterparty to a reverse repurchase agreement becomes insolvent, recovery of the security transferred by the Portfolio may be delayed or the Portfolio may incur a loss equal to the amount by which the value of the security transferred by the Portfolio exceeds the repurchase price payable by the Portfolio.
P Securities Sold Short—A short sale is a transaction in which the Portfolio sells a security it does not own in anticipation of a decline in the market value of that security. To complete such a transaction, the Portfolio must borrow the security to make delivery to the buyer with an obligation to replace such borrowed security at a later date. Until the security is replaced, the Portfolio is required to repay the lender any dividends or interest, which accrue during the period of the loan. The proceeds received from a short sale are recorded as a liability and the Portfolio records an unrealized gain or loss to the extent of the difference between the proceeds received and the value of the open short position on the day of determination. A gain, limited to the price at which the Portfolio sold the security short, or a loss, potentially unlimited as there is no upward limit on the price of a security, is recorded when the short position is terminated. Interest and dividends payable on securities sold short are recorded as an expense.
Q Interim Financial Statements—The interim financial statements relating to April 30, 2024 and for the six months then ended have not been audited by an independent registered public accounting firm, but in the opinion of the Portfolio’s management, reflect all adjustments, consisting only of normal recurring adjustments, necessary for the fair presentation of the financial statements.
2 Investment Adviser Fee and Other Transactions with Affiliates
The investment adviser fee is earned by Boston Management and Research (BMR), an indirect, wholly-owned subsidiary of Morgan Stanley, as compensation for investment advisory services rendered to the Portfolio. The investment adviser fee is computed at an annual rate as a percentage of the Portfolio’s average daily net assets as follows and is payable monthly:
| Average Daily Net Assets | Annual Fee Rate |
| Up to $1 billion | 0.650% |
| $1 billion but less than $2 billion | 0.625% |
| $2 billion but less than $5 billion | 0.600% |
| $5 billion and over | 0.575% |
For the six months ended April 30, 2024, the Portfolio’s investment adviser fee amounted to $3,947,929 or 0.64% (annualized) of the Portfolio’s average daily net assets.
The Portfolio may invest in a money market fund, the Institutional Class of the Morgan Stanley Institutional Liquidity Funds - Government Portfolio (the “Liquidity Fund”), an open-end management investment company managed by Morgan Stanley Investment Management Inc., a wholly-owned subsidiary of Morgan Stanley. The investment adviser fee paid by the Portfolio is reduced by an amount equal to its pro rata share of the advisory and administration fees paid by the Portfolio due to its investment in the Liquidity Fund. For the six months ended April 30, 2024, the investment adviser fee paid was reduced by $62,636 relating to the Portfolio's investment in the Liquidity Fund.
Trustees and officers of the Portfolio who are members of BMR’s organization receive remuneration for their services to the Portfolio out of the investment adviser fee. Trustees of the Portfolio who are not affiliated with the investment adviser may elect to defer receipt of all or a percentage of their annual fees in accordance with the terms of the Trustees Deferred Compensation Plan. Certain officers and Trustees of the Portfolio are officers of the above organization.
3 Purchases and Sales of Investments
Purchases and sales of investments, other than short-term obligations and including maturities, paydowns and securities sold short, aggregated $353,502,993 and $311,255,784, respectively, for the six months ended April 30, 2024.
Emerging Markets Local Income Portfolio
April 30, 2024
Notes to Financial Statements (Unaudited) — continued
4 Federal Income Tax Basis of Investments
The cost and unrealized appreciation (depreciation) of investments, including open derivative contracts, of the Portfolio at April 30, 2024, as determined on a federal income tax basis, were as follows:
| Aggregate cost | $1,243,767,238 |
| Gross unrealized appreciation | $ 18,453,265 |
| Gross unrealized depreciation | (156,826,181) |
| Net unrealized depreciation | $ (138,372,916) |
5 Financial Instruments
The Portfolio may trade in financial instruments with off-balance sheet risk in the normal course of its investing activities. These financial instruments may include written options, forward foreign currency exchange contracts, non-deliverable bond forward contracts, futures contracts and swap contracts and may involve, to a varying degree, elements of risk in excess of the amounts recognized for financial statement purposes. The notional or contractual amounts of these instruments represent the investment the Portfolio has in particular classes of financial instruments and do not necessarily represent the amounts potentially subject to risk. The measurement of the risks associated with these instruments is meaningful only when all related and offsetting transactions are considered. A summary of obligations under these financial instruments at April 30, 2024 is included in the Portfolio of Investments. At April 30, 2024, the Portfolio had sufficient cash and/or securities to cover commitments under these contracts.
In the normal course of pursuing its investment objective, the Portfolio is subject to the following risks:
Credit Risk: The Portfolio enters into credit default swap contracts to enhance total return and/or as a substitute for the purchase or sale of securities.
Foreign Exchange Risk: The Portfolio engages in forward foreign currency exchange contracts and currency options to enhance total return, to seek to hedge against fluctuations in currency exchange rates and/or as a substitute for the purchase or sale of securities or currencies.
Interest Rate Risk: The Portfolio utilizes various interest rate derivatives including non-deliverable bond forward contracts, interest rate futures contracts and interest rate swaps to enhance total return, to seek to hedge against fluctuations in interest rates and/or to change the effective duration of its portfolio.
The Portfolio enters into over-the-counter (OTC) derivatives that may contain provisions whereby the counterparty may terminate the contract under certain conditions, including but not limited to a decline in the Portfolio’s net assets below a certain level over a certain period of time, which would trigger a payment by the Portfolio for those derivatives in a liability position. At April 30, 2024, the fair value of derivatives with credit-related contingent features in a net liability position was $22,261,997. The aggregate fair value of assets pledged as collateral by the Portfolio for such liability was $38,135,590 at April 30, 2024.
The OTC derivatives in which the Portfolio invests (except for written options as the Portfolio, not the counterparty, is obligated to perform) are subject to the risk that the counterparty to the contract fails to perform its obligations under the contract. To mitigate this risk, the Portfolio has entered into an International Swaps and Derivatives Association, Inc. Master Agreement (“ISDA Master Agreement”) or similar agreement with substantially all its derivative counterparties. An ISDA Master Agreement is a bilateral agreement between the Portfolio and a counterparty that governs certain OTC derivatives and typically contains, among other things, set-off provisions in the event of a default and/or termination event as defined under the relevant ISDA Master Agreement. Under an ISDA Master Agreement, the Portfolio may, under certain circumstances, offset with the counterparty certain derivative financial instruments’ payables and/or receivables with collateral held and/or posted and create one single net payment. The provisions of the ISDA Master Agreement typically permit a single net payment in the event of default including the bankruptcy or insolvency of the counterparty. However, bankruptcy or insolvency laws of a particular jurisdiction may impose restrictions on or prohibitions against the right of offset in bankruptcy or insolvency. Certain ISDA Master Agreements allow counterparties to OTC derivatives to terminate derivative contracts prior to maturity in the event the Portfolio’s net assets decline by a stated percentage or the Portfolio fails to meet the terms of its ISDA Master Agreements, which would cause the counterparty to accelerate payment by the Portfolio of any net liability owed to it.
The collateral requirements for derivatives traded under an ISDA Master Agreement are governed by a Credit Support Annex to the ISDA Master Agreement. Collateral requirements are determined at the close of business each day and are typically based on changes in market values for each transaction under an ISDA Master Agreement and netted into one amount for such agreement. Generally, the amount of collateral due from or to a counterparty is subject to a minimum transfer threshold amount before a transfer is required, which may vary by counterparty. Collateral pledged for the benefit of the Portfolio and/or counterparty is held in segregated accounts by the Portfolio’s custodian and cannot be sold, re-pledged, assigned or otherwise used while pledged. The portion of such collateral representing cash, if any, is reflected as deposits for derivatives collateral and, in the case of cash pledged by a counterparty for
Emerging Markets Local Income Portfolio
April 30, 2024
Notes to Financial Statements (Unaudited) — continued
the benefit of the Portfolio, a corresponding liability on the Statement of Assets and Liabilities. Securities pledged by the Portfolio as collateral, if any, are identified as such in the Portfolio of Investments. The carrying amount of the liability for cash collateral due to brokers at April 30, 2024 approximated its fair value. If measured at fair value, such liability would have been considered as Level 2 in the fair value hierarchy (see Note 9) at April 30, 2024.
The fair value of open derivative instruments (not considered to be hedging instruments for accounting disclosure purposes) by risk exposure at April 30, 2024 was as follows:
| | Fair Value |
| Statement of Assets and Liabilities Caption | Credit | Foreign
Exchange | Interest
Rate | Total |
| Unaffiliated investments, at value | $ — | $ 1,450,715 | $ — | $ 1,450,715 |
| Not applicable | — | 8,408,217* | 11,143,448* | 19,551,665 |
| Receivable for open forward foreign currency exchange contracts | — | 15,566,550 | — | 15,566,550 |
| Receivable for open swap contracts | — | — | 57,140 | 57,140 |
| Total Asset Derivatives | $ — | $ 25,425,482 | $ 11,200,588 | $ 36,626,070 |
| Derivatives not subject to master netting or similar agreements | $ — | $ 8,408,217 | $ 11,143,448 | $ 19,551,665 |
| Total Asset Derivatives subject to master netting or similar agreements | $ — | $ 17,017,265 | $ 57,140 | $ 17,074,405 |
| Written options outstanding, at value | $ — | $ (100,935) | $ — | $ (100,935) |
| Not applicable | (240)* | (18,207,177)* | (27,151,528)* | (45,358,945) |
| Payable for open forward foreign currency exchange contracts | — | (21,068,303) | — | (21,068,303) |
| Payable for open swap contracts | — | — | (537,444) | (537,444) |
| Payable for open non-deliverable bond forward contracts | — | — | (555,315) | (555,315) |
| Total Liability Derivatives | $(240) | $(39,376,415) | $(28,244,287) | $(67,620,942) |
| Derivatives not subject to master netting or similar agreements | $(240) | $(18,207,177) | $(27,151,528) | $(45,358,945) |
| Total Liability Derivatives subject to master netting or similar agreements | $ — | $(21,169,238) | $ (1,092,759) | $(22,261,997) |
| * | Only the current day’s variation margin on open futures contracts and centrally cleared derivatives is reported within the Statement of Assets and Liabilities as Receivable or Payable for variation margin on open futures contracts and centrally cleared derivatives, as applicable. |
The Portfolio's derivative assets and liabilities at fair value by risk, which are reported gross in the Statement of Assets and Liabilities, are presented in the table above. The following tables present the Portfolio's derivative assets and liabilities by counterparty, net of amounts available for offset under a master netting agreement and net of the related collateral received by the Portfolio for such assets and pledged by the Portfolio for such liabilities as of April 30, 2024.
| Counterparty | Derivative
Assets Subject to
Master Netting
Agreement | Derivatives
Available
for Offset | Non-cash
Collateral
Received(a) | Cash
Collateral
Received(a) | Net Amount
of Derivative
Assets(b) | Total Cash
Collateral
Received |
| Bank of America, N.A. | $ 190,670 | $ (43,046) | $ — | $ — | $ 147,624 | $ — |
| Barclays Bank PLC | 1,032,869 | (1,032,869) | — | — | — | — |
| BNP Paribas | 596,566 | (408,713) | — | — | 187,853 | — |
| Citibank, N.A. | 2,066,245 | (666,479) | — | — | 1,399,766 | — |
| Goldman Sachs International | 3,126,489 | (3,126,489) | — | — | — | — |
| HSBC Bank USA, N.A. | 255,500 | (130,082) | (125,418) | — | — | — |
| ICBC Standard Bank plc | 664,852 | (46,741) | — | — | 618,111 | — |
| JPMorgan Chase Bank, N.A. | 2,853,911 | (1,163,083) | — | (1,690,828) | — | 1,849,000 |
Emerging Markets Local Income Portfolio
April 30, 2024
Notes to Financial Statements (Unaudited) — continued
| Counterparty | Derivative
Assets Subject to
Master Netting
Agreement | Derivatives
Available
for Offset | Non-cash
Collateral
Received(a) | Cash
Collateral
Received(a) | Net Amount
of Derivative
Assets(b) | Total Cash
Collateral
Received |
| Standard Chartered Bank | $ 4,763,033 | $ (4,763,033) | $ — | $ — | $ — | $ — |
| UBS AG | 1,524,270 | (1,524,270) | — | — | — | — |
| | $17,074,405 | $(12,904,805) | $(125,418) | $(1,690,828) | $2,353,354 | $1,849,000 |
| Counterparty | Derivative
Liabilities Subject to
Master Netting
Agreement | Derivatives
Available
for Offset | Non-cash
Collateral
Pledged(a) | Cash
Collateral
Pledged(a) | Net Amount
of Derivative
Liabilities(c) | Total Cash
Collateral
Pledged |
| Bank of America, N.A. | $ (43,046) | $ 43,046 | $ — | $ — | $ — | $ 419,000 |
| Barclays Bank PLC | (2,173,594) | 1,032,869 | 1,138,383 | — | (2,342) | — |
| BNP Paribas | (408,713) | 408,713 | — | — | — | — |
| Citibank, N.A. | (666,479) | 666,479 | — | — | — | — |
| Goldman Sachs International | (4,182,987) | 3,126,489 | 523,517 | 160,000 | (372,981) | 160,000 |
| HSBC Bank USA, N.A. | (130,082) | 130,082 | — | — | — | — |
| ICBC Standard Bank plc | (46,741) | 46,741 | — | — | — | — |
| JPMorgan Chase Bank, N.A. | (1,163,083) | 1,163,083 | — | — | — | — |
| Societe Generale | (942,634) | — | 773,932 | 168,702 | — | 210,000 |
| Standard Chartered Bank | (9,698,274) | 4,763,033 | 4,935,241 | — | — | 7,477,000 |
| State Street Bank and Trust Company | (828,404) | — | 412,408 | 28,000 | (387,996) | 28,000 |
| UBS AG | (1,977,960) | 1,524,270 | — | 453,690 | — | 1,049,000 |
| | $(22,261,997) | $12,904,805 | $7,783,481 | $810,392 | $(763,319) | $ 9,343,000 |
| Total — Deposits for derivatives collateral — OTC derivatives | | | | $11,192,000 |
| (a) | In some instances, the total collateral received and/or pledged may be more than the amount shown due to overcollateralization. |
| (b) | Net amount represents the net amount due from the counterparty in the event of default. |
| (c) | Net amount represents the net amount payable to the counterparty in the event of default. |
Emerging Markets Local Income Portfolio
April 30, 2024
Notes to Financial Statements (Unaudited) — continued
The effect of derivative instruments (not considered to be hedging instruments for accounting disclosure purposes) on the Statement of Operations by risk exposure for the six months ended April 30, 2024 was as follows:
| Statement of Operations Caption | Credit | Foreign
Exchange | Interest
Rate | Total |
| Net realized gain (loss): | | | | |
| Investment transactions | $ — | $ (642,859) | $ — | $ (642,859) |
| Written options | — | 604,220 | (269,687) | 334,533 |
| Futures contracts | — | — | 59,065 | 59,065 |
| Swap contracts | (1,705) | — | (2,466,042) | (2,467,747) |
| Forward foreign currency exchange contracts | — | 15,868,220 | — | 15,868,220 |
| Non-deliverable bond forward contracts | — | — | 1,591,371 | 1,591,371 |
| Total | $(1,705) | $ 15,829,581 | $(1,085,293) | $ 14,742,583 |
| Change in unrealized appreciation (depreciation): | | | | |
| Investments | $ — | $ (2,292,084) | $ — | $ (2,292,084) |
| Written options | — | 336,706 | — | 336,706 |
| Futures contracts | — | — | 255,282 | 255,282 |
| Swap contracts | 1,467 | — | (1,999,815) | (1,998,348) |
| Forward foreign currency exchange contracts | — | (10,743,562) | — | (10,743,562) |
| Non-deliverable bond forward contracts | — | — | (597,073) | (597,073) |
| Total | $ 1,467 | $(12,698,940) | $(2,341,606) | $(15,039,079) |
The average notional cost of futures contracts and average notional amounts of other derivative contracts outstanding during the six months ended April 30, 2024, which are indicative of the volume of these derivative types, were approximately as follows:
Futures
Contracts — Short | Forward
Foreign Currency
Exchange Contracts* | Non-Deliverable
Bond Forward
Contracts | Swap
Contracts |
| $17,367,000 | $2,898,992,000 | $74,636,000 | $1,485,061,000 |
| * | The average notional amount for forward foreign currency exchange contracts is based on the absolute value of notional amounts of currency purchased and currency sold. |
The average principal amount of purchased and written currency options contracts outstanding during the six months ended April 30, 2024, which are indicative of the volume of these derivative types, were approximately $91,999,000 and $18,300,000, respectively.
6 Line of Credit
The Portfolio participates with other portfolios and funds managed by BMR and its affiliates in a $650 million unsecured revolving line of credit agreement with a group of banks, which is in effect through October 22, 2024. Borrowings are made by the Portfolio solely for temporary purposes related to redemptions and other short-term cash needs. Interest is charged to the Portfolio based on its borrowings at an amount above either the Secured Overnight Financing Rate (SOFR) or Federal Funds rate. In addition, a fee computed at an annual rate of 0.15% on the daily unused portion of the line of credit is allocated among the participating portfolios and funds at the end of each quarter. In connection with the renewal of the agreement in October 2023, an arrangement fee of $150,000 was incurred that was allocated to the participating portfolios and funds. Because the line of credit is not available exclusively to the Portfolio, it may be unable to borrow some or all of its requested amounts at any particular time. The Portfolio did not have any significant borrowings or allocated fees during the six months ended April 30, 2024.
Emerging Markets Local Income Portfolio
April 30, 2024
Notes to Financial Statements (Unaudited) — continued
7 Reverse Repurchase Agreements
There were no reverse repurchase agreements outstanding as of April 30, 2024. For the six months ended April 30, 2024, the average borrowings under settled reverse repurchase agreements and the average annual interest rate paid were approximately $8,270,000 and 5.65%, respectively.
8 Affiliated Investments
Transactions in the Portfolio's investment in funds that may be deemed to be affiliated for the six months ended April 30, 2024 were as follows:
| Name | Value,
beginning
of period | Purchases | Sales
proceeds | Net realized
gain (loss) | Change in
unrealized
appreciation
(depreciation) | Value, end
of period | Dividend
income | Shares,
end of period |
| Short-Term Investments |
| Liquidity Fund | $97,178,009 | $291,176,958 | $(388,354,967) | $ — | $ — | $0 | $2,100,134 | — |
9 Fair Value Measurements
Under generally accepted accounting principles for fair value measurements, a three-tier hierarchy to prioritize the assumptions, referred to as inputs, is used in valuation techniques to measure fair value. The three-tier hierarchy of inputs is summarized in the three broad levels listed below.
| • | Level 1 – quoted prices in active markets for identical investments |
| • | Level 2 – other significant observable inputs (including quoted prices for similar investments, interest rates, prepayment speeds, credit risk, etc.) |
| • | Level 3 – significant unobservable inputs (including a fund's own assumptions in determining the fair value of investments) |
In cases where the inputs used to measure fair value fall in different levels of the fair value hierarchy, the level disclosed is determined based on the lowest level input that is significant to the fair value measurement in its entirety. The inputs or methodology used for valuing securities are not necessarily an indication of the risk associated with investing in those securities.
At April 30, 2024, the hierarchy of inputs used in valuing the Portfolio's investments and open derivative instruments, which are carried at fair value, were as follows:
| Asset Description | Level 1 | Level 2 | Level 3 | Total |
| Foreign Corporate Bonds | $ — | $ 64,957,311 | $ — | $ 64,957,311 |
| Loan Participation Notes | — | — | 27,383,164 | 27,383,164 |
| Sovereign Government Bonds | — | 793,398,651 | — | 793,398,651 |
| Short-Term Investments: | | | | |
| Repurchase Agreements | — | 11,909,593 | — | 11,909,593 |
| Sovereign Government Securities | — | 219,716,704 | — | 219,716,704 |
| U.S. Treasury Obligations | — | 29,743,783 | — | 29,743,783 |
| Purchased Currency Options | — | 1,450,715 | — | 1,450,715 |
| Total Investments | $ — | $ 1,121,176,757 | $ 27,383,164 | $ 1,148,559,921 |
| Forward Foreign Currency Exchange Contracts | $ — | $ 23,974,767 | $ — | $ 23,974,767 |
| Futures Contracts | 393,464 | — | — | 393,464 |
| Swap Contracts | — | 10,807,124 | — | 10,807,124 |
| Total | $ 393,464 | $ 1,155,958,648 | $ 27,383,164 | $ 1,183,735,276 |
| Liability Description | | | | |
| Securities Sold Short | $ — | $ (10,719,651) | $ — | $ (10,719,651) |
Emerging Markets Local Income Portfolio
April 30, 2024
Notes to Financial Statements (Unaudited) — continued
| Liability Description (continued) | Level 1 | Level 2 | Level 3 | Total |
| Written Currency Options | $ — | $ (100,935) | $ — | $ (100,935) |
| Forward Foreign Currency Exchange Contracts | — | (39,275,480) | — | (39,275,480) |
| Non-Deliverable Bond Forward Contracts | — | (555,315) | — | (555,315) |
| Swap Contracts | — | (27,689,212) | — | (27,689,212) |
| Total | $ — | $ (78,340,593) | $ — | $ (78,340,593) |
The following is a reconciliation of Level 3 investments for which significant unobservable inputs were used to determine fair value:
| | Loan
Participation Notes |
| Balance as of October 31, 2023 | $25,557,142 |
| Realized gains (losses) | — |
| Change in net unrealized appreciation (depreciation) | 1,592,482 |
| Cost of purchases | — |
| Proceeds from sales, including return of capital | — |
| Accrued discount (premium) | 233,540 |
| Transfers to Level 3 | — |
| Transfers from Level 3 | — |
| Balance as of April 30, 2024 | $27,383,164 |
| Change in net unrealized appreciation (depreciation) on investments still held as of April 30, 2024 | $ 1,592,482 |
The following is a summary of quantitative information about significant unobservable valuation inputs for Level 3 investments held as of April 30, 2024:
| Type of Investment | Fair Value as of
April 30, 2024 | Valuation Technique | Unobservable Input | Range of Unobservable Input | Impact to
Valuation from an
Increase to Input* |
| Loan Participation Notes | $27,383,164 | Matrix Pricing | Adjusted Credit Spread to the Central Bank of Uzbekistan Quoted Policy Rate | 4.38% - 6.67%** | Decrease |
| * | Represents the directional change in the fair value of the Level 3 investments that would result from an increase to the corresponding unobservable input. A decrease to the unobservable input would have the opposite effect. |
| ** | The weighted average of the unobservable input is 5.56% based on relative principal amounts. |
10 Risks and Uncertainties
Risks Associated with Foreign Investments
Foreign investments can be adversely affected by political, economic and market developments abroad, including the imposition of economic and other sanctions by the United States or another country, and by acts of terrorism and war. There may be less publicly available information about foreign issuers because they may not be subject to reporting practices, requirements or regulations comparable to those to which United States companies are subject. Foreign markets may be smaller, less liquid and more volatile than the major markets in the United States. Trading in foreign markets typically involves higher expense than trading in the United States. The Portfolio may have difficulties enforcing its legal or contractual rights in a foreign country. Securities that trade or are denominated in currencies other than the U.S. dollar may be adversely affected by fluctuations in currency exchange rates.
Emerging Markets Local Income Portfolio
April 30, 2024
Notes to Financial Statements (Unaudited) — continued
Emerging market securities often involve greater risks than developed market securities. Investment markets within emerging market countries are typically smaller, less liquid, less developed and more volatile than those in more developed markets like the United States, and may be focused in certain economic sectors. The information available about an emerging market issuer may be less reliable than for comparable issuers in more developed capital markets. Governmental actions can have a significant effect on the economic conditions in emerging market countries. It may be more difficult to make a claim or obtain a judgment in the courts of these countries than it is in the United States. The possibility of fraud, negligence, undue influence being exerted by an issuer or refusal to recognize ownership exists in some emerging markets. Disruptions due to work stoppages and trading improprieties in foreign securities markets have caused such markets to close. Emerging market securities are also subject to speculative trading, which contributes to their volatility.
Economic data as reported by sovereign entities may be delayed, inaccurate or fraudulent. In the event of a default by a sovereign entity, there are typically no assets to be seized or cash flows to be attached. Furthermore, the willingness or ability of a sovereign entity to restructure defaulted debt may be limited. Therefore, losses on sovereign defaults may far exceed the losses from the default of a similarly rated U.S. debt issuer.
Eaton Vance
Emerging Markets Local Income Fund
April 30, 2024
| Officers of Eaton Vance Emerging Markets Local Income Fund and Emerging Markets Local Income Portfolio |
Kenneth A. Topping
President | Nicholas S. Di Lorenzo
Secretary |
Deidre E. Walsh
Vice President and Chief Legal Officer | Laura T. Donovan
Chief Compliance Officer |
James F. Kirchner
Treasurer | |
| Trustees of Eaton Vance Emerging Markets Local Income Fund and Emerging Markets Local Income Portfolio | |
George J. Gorman
Chairperson | |
| Alan C. Bowser | |
| Mark R. Fetting | |
| Cynthia E. Frost | |
| Valerie A. Mosley | |
| Anchal Pachnanda* | |
| Keith Quinton | |
| Marcus L. Smith | |
| Susan J. Sutherland | |
| Scott E. Wennerholm | |
| Nancy A. Wiser | |
| U.S. Customer Privacy Notice | March 2024 |
| FACTS | WHAT DOES EATON VANCE DO WITH YOUR PERSONAL INFORMATION? |
| Why? | Financial companies choose how they share your personal information. Federal law gives consumers the right to limit some but not all sharing. Federal law also requires us to tell you how we collect, share, and protect your personal information. Please read this notice carefully to understand what we do. |
| |
| What? | The types of personal information we collect and share depend on the product or service you have with us. This information can include:■ Social Security number and income
■ investment experience and risk tolerance
■ checking account information and wire transfer instructions |
| |
| How? | All financial companies need to share customers’ personal information to run their everyday business. In the section below, we list the reasons financial companies can share their customers’ personal information; the reasons Eaton Vance chooses to share; and whether you can limit this sharing. |
| Reasons we can share your personal information | Does Eaton Vance
share? | Can you limit
this sharing? |
| For our everyday business purposes — such as to process your transactions, maintain your account(s), respond to court orders and legal investigations, or report to credit bureaus | Yes | No |
| For our marketing purposes — to offer our products and services to you | Yes | No |
| For joint marketing with other financial companies | No | We don’t share |
| For our affiliates’ everyday business purposes — information about your transactions and experiences | Yes | No* |
| For our affiliates’ everyday business purposes — information about your creditworthiness | Yes | Yes* |
| For our affiliates to market to you | Yes | Yes* |
| For nonaffiliates to market to you | No | We don’t share |
To limit our
sharing | Call toll-free 1-800-262-1122 or email: EVPrivacy@eatonvance.comPlease note:If you are a new customer, we can begin sharing your information 30 days from the date we sent this notice. When you are no longer our customer, we continue to share your information as described in this notice. However, you can contact us at any time to limit our sharing. |
| Questions? | Call toll-free 1-800-262-1122 or email: EVPrivacy@eatonvance.com |
| U.S. Customer Privacy Notice — continued | March 2024 |
| Who we are |
| Who is providing this notice? | Eaton Vance Management and our investment management affiliates (“Eaton Vance”) (see Affiliates definition below.) |
| What we do |
How does Eaton Vance
protect my personal
information? | To protect your personal information from unauthorized access and use, we use security measures that comply with federal law. These measures include computer safeguards and secured files and buildings. We have policies governing the proper handling of customer information by personnel and requiring third parties that provide support to adhere to appropriate security standards with respect to such information. |
How does Eaton Vance
collect my personal
information? | We collect your personal information, for example, when you■ open an account or make deposits or withdrawals from your account
■ buy securities from us or make a wire transfer
■ give us your contact informationWe also collect your personal information from others, such as credit bureaus, affiliates, or other companies. |
| Why can’t I limit all sharing? | Federal law gives you the right to limit only■ sharing for affiliates’ everyday business purposes — information about your creditworthiness
■ affiliates from using your information to market to you
■ sharing for nonaffiliates to market to youState laws and individual companies may give you additional rights to limit sharing. (See below for more on your rights under state law.) |
What happens when I limit
sharing for an account I hold
jointly with someone else? | Your choices will apply to everyone on your account. |
| Definitions |
| Affiliates | Companies related by common ownership or control. They can be financial and nonfinancial companies.■ Our affiliates include registered investment advisers such as Eaton Vance Management, Eaton Vance Advisers International Ltd., Boston Management and Research, Calvert Research and Management, Parametric Portfolio Associates LLC, Atlanta Capital Management Company LLC, Morgan Stanley Investment Management Inc., Morgan Stanley Investment Management Co.; registered broker-dealers such as Morgan Stanley Distributors Inc. and Eaton Vance Distributors, Inc. (together, the “Investment Management Affiliates”); and companies with a Morgan Stanley name and financial companies such as Morgan Stanley Smith Barney LLC and Morgan Stanley & Co. (the “Morgan Stanley Affiliates”). |
| Nonaffiliates | Companies not related by common ownership or control. They can be financial and nonfinancial companies.■ Eaton Vance does not share with nonaffiliates so they can market to you. |
| Joint marketing | A formal agreement between nonaffiliated financial companies that together market financial products or services to you.■ Eaton Vance does not jointly market. |
| U.S. Customer Privacy Notice — continued | March 2024 |
| Other important information |
| *PLEASE NOTE: Eaton Vance does not share your creditworthiness information or your transactions and experiences information with the Morgan Stanley Affiliates, nor does Eaton Vance enable the Morgan Stanley Affiliates to market to you. Your opt outs will prevent Eaton Vance from sharing your creditworthiness information with the Investment Management Affiliates and will prevent the Investment Management Affiliates from marketing their products to you.Vermont: Except as permitted by law, we will not share personal information we collect about Vermont residents with Nonaffiliates unless you provide us with your written consent to share such information.California: Except as permitted by law, we will not share personal information we collect about California residents with Nonaffiliates and we will limit sharing such personal information with our Affiliates to comply with California privacy laws that apply to us. |
Delivery of Shareholder Documents. The Securities and Exchange Commission (SEC) permits funds to deliver only one copy of shareholder documents, including prospectuses, proxy statements and shareholder reports, to fund investors with multiple accounts at the same residential or post office box address. This practice is often called “householding” and it helps eliminate duplicate mailings to shareholders. Eaton Vance, or your financial intermediary, may household the mailing of your documents indefinitely unless you instruct Eaton Vance, or your financial intermediary, otherwise. If you would prefer that your Eaton Vance documents not be householded, please contact Eaton Vance at 1-800-262-1122, or contact your financial intermediary. Your instructions that householding not apply to delivery of your Eaton Vance documents will typically be effective within 30 days of receipt by Eaton Vance or your financial intermediary.
Portfolio Holdings. Each Eaton Vance Fund and its underlying Portfolio(s) (if applicable) files a schedule of portfolio holdings on Part F to Form N-PORT with the SEC. Certain information filed on Form N-PORT may be viewed on the Eaton Vance website at www.eatonvance.com, by calling Eaton Vance at 1-800-262-1122 or in the EDGAR database on the SEC’s website at www.sec.gov.
Proxy Voting. From time to time, funds are required to vote proxies related to the securities held by the funds. The Eaton Vance Funds or their underlying Portfolios (if applicable) vote proxies according to a set of policies and procedures approved by the Funds’ and Portfolios’ Boards. You may obtain a description of these policies and procedures and information on how the Funds or Portfolios voted proxies relating to portfolio securities during the most recent 12-month period ended June 30, without charge, upon request, by calling 1-800-262-1122 and by accessing the SEC’s website at www.sec.gov.
Tailored Shareholder Reports. Effective January 24, 2023, the SEC adopted rule and form amendments to require open-end mutual funds and ETFs to transmit concise and visually engaging streamlined annual and semi-annual reports to shareholders that highlight key information. Other information, including financial statements, will no longer appear in a streamlined shareholder report but must be available online, delivered free of charge upon request, and filed on a semi-annual basis on Form N-CSR. The rule and form amendments have a compliance date of July 24, 2024. At this time, management is evaluating the impact of these amendments on the shareholder reports for the Eaton Vance Funds.
This Page Intentionally Left Blank
Investment Adviser of Emerging Markets Local Income Portfolio
Boston Management and Research
One Post Office Square
Boston, MA 02109
Investment Adviser and Administrator of Eaton Vance Emerging Markets Local Income Fund
Eaton Vance Management
One Post Office Square
Boston, MA 02109
Principal Underwriter*
Eaton Vance Distributors, Inc.
One Post Office Square
Boston, MA 02109
(617) 482-8260
Custodian
State Street Bank and Trust Company
One Congress Street, Suite 1
Boston, MA 02114-2016
Transfer Agent
BNY Mellon Investment Servicing (US) Inc.
Attn: Eaton Vance Funds
P.O. Box 534439
Pittsburgh, PA 15253-4439
(800) 262-1122
Fund Offices
One Post Office Square
Boston, MA 02109
* FINRA BrokerCheck. Investors may check the background of their Investment Professional by contacting the Financial Industry Regulatory Authority (FINRA). FINRA BrokerCheck is a free tool to help investors check the professional background of current and former FINRA-registered securities firms and brokers. FINRA BrokerCheck is available by calling 1-800-289-9999 and at www.FINRA.org. The FINRA BrokerCheck brochure describing this program is available to investors at www.FINRA.org.
Eaton Vance
Floating-Rate Fund
Semi-Annual Report
April 30, 2024
Commodity Futures Trading Commission Registration. The Commodity Futures Trading Commission (“CFTC”) has adopted regulations that subject registered investment companies and advisers to regulation by the CFTC if a fund invests more than a prescribed level of its assets in certain CFTC-regulated instruments (including futures, certain options and swap agreements) or markets itself as providing investment exposure to such instruments. The investment adviser has claimed an exclusion from the definition of “commodity pool operator” under the Commodity Exchange Act with respect to its management of the Fund. Accordingly, neither the Fund nor the adviser with respect to the operation of the Fund is subject to CFTC regulation. Because of its management of other strategies, the Fund's adviser is registered with the CFTC as a commodity pool operator. The adviser is also registered as a commodity trading advisor.
Fund shares are not insured by the FDIC and are not deposits or other obligations of, or guaranteed by, any depository institution. Shares are subject to investment risks, including possible loss of principal invested.
This report must be preceded or accompanied by a current summary prospectus or prospectus. Before investing, investors should consider carefully the investment objective, risks, and charges and expenses of a mutual fund. This and other important information is contained in the summary prospectus and prospectus, which can be obtained from a financial intermediary. Prospective investors should read the prospectus carefully before investing. For further information, please call 1-800-262-1122.
Semi-Annual Report April 30, 2024
Eaton Vance
Floating-Rate Fund
Eaton Vance
Floating-Rate Fund
April 30, 2024
Performance
Portfolio Manager(s) Andrew N. Sveen, CFA, Ralph H. Hinckley, Jr., CFA and Jake T. Lemle, CFA
| % Average Annual Total Returns1,2 | Class
Inception Date | Performance
Inception Date | Six Months | One Year | Five Years | Ten Years |
| Advisers Class at NAV | 02/07/2001 | 02/07/2001 | 5.87% | 10.45% | 3.90% | 3.75% |
| Class A at NAV | 05/05/2003 | 02/07/2001 | 5.95 | 10.40 | 3.90 | 3.75 |
| Class A with 3.25% Maximum Sales Charge | — | — | 2.49 | 6.79 | 3.21 | 3.41 |
| Class C at NAV | 02/01/2001 | 02/07/2001 | 5.48 | 9.63 | 3.12 | 3.13 |
| Class C with 1% Maximum Deferred Sales Charge | — | — | 4.48 | 8.63 | 3.12 | 3.13 |
| Class I at NAV | 01/30/2001 | 02/07/2001 | 6.12 | 10.72 | 4.16 | 4.01 |
| Class R6 at NAV | 12/01/2016 | 02/07/2001 | 6.16 | 10.79 | 4.22 | 4.06 |
|
| Morningstar® LSTA® US Leveraged Loan IndexSM | — | — | 6.05% | 11.97% | 5.26% | 4.59% |
| % Total Annual Operating Expense Ratios3 | Advisers Class | Class A | Class C | Class I | Class R6 |
| | 1.05% | 1.06% | 1.81% | 0.81% | 0.75% |
See Endnotes and Additional Disclosures in this report.
Past performance is no guarantee of future results. Returns are historical and are calculated by determining the percentage change in net asset value (NAV) or offering price (as applicable) with all distributions reinvested. Furthermore, returns do not reflect the deduction of taxes that shareholders may have to pay on Fund distributions or upon the redemption of Fund shares. Investment return and principal value will fluctuate so that shares, when redeemed, may be worth more or less than their original cost. Performance for periods less than or equal to one year is cumulative. Performance is for the stated time period only; due to market volatility, current Fund performance may be lower or higher than the quoted return. For performance as of the most recent month-end, please refer to eatonvance.com.
Eaton Vance
Floating-Rate Fund
April 30, 2024
| Top 10 Issuers (% of total investments)1 | |
| Carnival Corp. | 1.1% |
| TransDigm, Inc. | 1.0 |
| INEOS U.S. Finance LLC | 1.0 |
| Uber Technologies, Inc. | 0.8 |
| Go Daddy Operating Co. LLC | 0.8 |
| Applied Systems, Inc. | 0.8 |
| American Airlines, Inc. | 0.8 |
| UKG, Inc. | 0.8 |
| Avolon TLB Borrower 1 (US) LLC | 0.7 |
| Epicor Software Corp. | 0.7 |
| Total | 8.5% |
| Top 10 Sectors (% of total investments)1 |
| Software | 12.2% |
| Hotels, Restaurants & Leisure | 6.1 |
| Machinery | 5.0 |
| Chemicals | 4.9 |
| Health Care Providers & Services | 4.4 |
| Capital Markets | 4.4 |
| Professional Services | 3.7 |
| IT Services | 3.7 |
| Trading Companies & Distributors | 2.9 |
| Commercial Services & Supplies | 2.1 |
| Total | 49.4% |
| Credit Quality (% of bonds, loans and asset-backed securities)2 |
Fund invests in an affiliated investment company (Portfolio) with the same objective(s) and policies as the Fund. References to investments are to the Portfolio’s holdings.
Footnotes:
| 1 | Excludes cash and cash equivalents. |
| 2 | Credit ratings are categorized using S&P Global Ratings (“S&P”). Ratings, which are subject to change, apply to the creditworthiness of the issuers of the underlying securities and not to the Fund or its shares. Credit ratings measure the quality of a bond based on the issuer’s creditworthiness, with ratings ranging from AAA, being the highest, to D, being the lowest based on S&P’s measures. Ratings of BBB or higher by S&P are considered to be investment-grade quality. Credit ratings are based largely on the ratings agency’s analysis at the time of rating. The rating assigned to any particular security is not necessarily a reflection of the issuer’s current financial condition and does not necessarily reflect its assessment of the volatility of a security’s market value or of the liquidity of an investment in the security. Holdings designated as “Not Rated” (if any) are not rated by S&P. |
Eaton Vance
Floating-Rate Fund
April 30, 2024
Endnotes and Additional Disclosures
| 1 | Morningstar® LSTA® US Leveraged Loan IndexSM is an unmanaged index of the institutional leveraged loan market. Morningstar® LSTA® Leveraged Loan indices are a product of Morningstar, Inc. (“Morningstar”) and have been licensed for use. Morningstar® is a registered trademark of Morningstar licensed for certain use. Loan Syndications and Trading Association® and LSTA® are trademarks of the LSTA licensed for certain use by Morningstar, and further sublicensed by Morningstar for certain use. Neither Morningstar nor LSTA guarantees the accuracy and/or completeness of the Morningstar® LSTA® US Leveraged Loan IndexSM or any data included therein, and shall have no liability for any errors, omissions, or interruptions therein. Unless otherwise stated, index returns do not reflect the effect of any applicable sales charges, commissions, expenses, taxes or leverage, as applicable. It is not possible to invest directly in an index. |
| 2 | Total Returns at NAV do not include applicable sales charges. If sales charges were deducted, the returns would be lower. Total Returns shown with maximum sales charge reflect the stated maximum sales charge. Unless otherwise stated, performance does not reflect the deduction of taxes on Fund distributions or redemptions of Fund shares.Effective November 5, 2020, Class C shares automatically convert to Class A shares eight years after purchase. The average annual total returns listed for Class C reflect conversion to Class A shares after eight years. Prior to November 5, 2020, Class C shares automatically converted to Class A shares ten years after purchase.Performance prior to the inception date of a class may be linked to the performance of an older class of the Fund. This linked performance is adjusted for any applicable sales charge, but is not adjusted for class expense differences. If adjusted for such differences, the performance would be different. The performance of Class R6 is linked to Class I. Performance presented in the Financial Highlights included in the financial statements is not linked. |
| 3 | Source: Fund prospectus. The expense ratios for the current reporting period can be found in the Financial Highlights section of this report. Performance reflects expenses waived and/or reimbursed, if applicable. Without such waivers and/or reimbursements, performance would have been lower. |
| | Fund profile subject to change due to active management. |
Eaton Vance
Floating-Rate Fund
April 30, 2024
Example
As a Fund shareholder, you incur two types of costs: (1) transaction costs, including sales charges (loads) on purchases; and (2) ongoing costs, including management fees; distribution and/or service fees; and other Fund expenses. This Example is intended to help you understand your ongoing costs (in dollars) of Fund investing and to compare these costs with the ongoing costs of investing in other mutual funds. The Example is based on an investment of $1,000 invested at the beginning of the period and held for the entire period (November 1, 2023 to April 30, 2024).
Actual Expenses
The first section of the table below provides information about actual account values and actual expenses. You may use the information in this section, together with the amount you invested, to estimate the expenses that you paid over the period. Simply divide your account value by $1,000 (for example, an $8,600 account value divided by $1,000 = 8.6), then multiply the result by the number in the first section under the heading entitled “Expenses Paid During Period” to estimate the expenses you paid on your account during this period.
Hypothetical Example for Comparison Purposes
The second section of the table below provides information about hypothetical account values and hypothetical expenses based on the actual Fund expense ratio and an assumed rate of return of 5% per year (before expenses), which is not the actual Fund return. The hypothetical account values and expenses may not be used to estimate the actual ending account balance or expenses you paid for the period. You may use this information to compare the ongoing costs of investing in your Fund and other funds. To do so, compare this 5% hypothetical example with the 5% hypothetical examples that appear in the shareholder reports of the other funds.
Please note that the expenses shown in the table are meant to highlight your ongoing costs only and do not reflect any transactional costs, such as sales charges (loads). Therefore, the second section of the table is useful in comparing ongoing costs only, and will not help you determine the relative total costs of owning different funds. In addition, if these transactional costs were included, your costs would be higher.
| | Beginning
Account Value
(11/1/23) | Ending
Account Value
(4/30/24) | Expenses Paid
During Period*
(11/1/23 – 4/30/24) | Annualized
Expense
Ratio |
| Actual | | | | |
| Advisers Class | $1,000.00 | $1,058.70 | $5.48 | 1.07% |
| Class A | $1,000.00 | $1,059.50 | $5.48 | 1.07% |
| Class C | $1,000.00 | $1,054.80 | $9.30 | 1.82% |
| Class I | $1,000.00 | $1,061.20 | $4.20 | 0.82% |
| Class R6 | $1,000.00 | $1,061.60 | $3.84 | 0.75% |
| |
| Hypothetical | | | | |
| (5% return per year before expenses) | | | | |
| Advisers Class | $1,000.00 | $1,019.54 | $5.37 | 1.07% |
| Class A | $1,000.00 | $1,019.54 | $5.37 | 1.07% |
| Class C | $1,000.00 | $1,015.81 | $9.12 | 1.82% |
| Class I | $1,000.00 | $1,020.79 | $4.12 | 0.82% |
| Class R6 | $1,000.00 | $1,021.13 | $3.77 | 0.75% |
| * | Expenses are equal to the Fund's annualized expense ratio for the indicated Class, multiplied by the average account value over the period, multiplied by 182/366 (to reflect the one-half year period). The Example assumes that the $1,000 was invested at the net asset value per share determined at the close of business on October 31, 2023. The Example reflects the expenses of both the Fund and the Portfolio. |
Eaton Vance
Floating-Rate Fund
April 30, 2024
Statement of Assets and Liabilities (Unaudited)
| | April 30, 2024 |
| Assets | |
| Investment in Eaton Vance Floating Rate Portfolio, at value (identified cost $4,954,066,978) | $ 4,782,000,029 |
| Receivable for Fund shares sold | 9,486,537 |
| Total assets | $ 4,791,486,566 |
| Liabilities | |
| Payable for Fund shares redeemed | $ 16,352,414 |
| Distributions payable | 5,636,571 |
| Payable to affiliates: | |
| Administration fee | 585,023 |
| Distribution and service fees | 211,067 |
| Trustees' fees | 42 |
| Accrued expenses | 836,966 |
| Total liabilities | $ 23,622,083 |
| Net Assets | $ 4,767,864,483 |
| Sources of Net Assets | |
| Paid-in capital | $ 5,880,421,097 |
| Accumulated loss | (1,112,556,614) |
| Net Assets | $ 4,767,864,483 |
| Advisers Class Shares | |
| Net Assets | $ 123,157,330 |
| Shares Outstanding | 14,652,407 |
Net Asset Value, Offering Price and Redemption Price Per Share
(net assets ÷ shares of beneficial interest outstanding) | $ 8.41 |
| Class A Shares | |
| Net Assets | $ 571,499,477 |
| Shares Outstanding | 65,717,125 |
Net Asset Value and Redemption Price Per Share
(net assets ÷ shares of beneficial interest outstanding) | $ 8.70 |
Maximum Offering Price Per Share
(100 ÷ 96.75 of net asset value per share) | $ 8.99 |
| Class C Shares | |
| Net Assets | $ 83,455,871 |
| Shares Outstanding | 9,939,863 |
Net Asset Value and Offering Price Per Share*
(net assets ÷ shares of beneficial interest outstanding) | $ 8.40 |
| Class I Shares | |
| Net Assets | $ 3,202,040,222 |
| Shares Outstanding | 380,691,095 |
Net Asset Value, Offering Price and Redemption Price Per Share
(net assets ÷ shares of beneficial interest outstanding) | $ 8.41 |
6
See Notes to Financial Statements.
Eaton Vance
Floating-Rate Fund
April 30, 2024
Statement of Assets and Liabilities (Unaudited) — continued
| | April 30, 2024 |
| Class R6 Shares | |
| Net Assets | $787,711,583 |
| Shares Outstanding | 93,565,390 |
Net Asset Value, Offering Price and Redemption Price Per Share
(net assets ÷ shares of beneficial interest outstanding) | $ 8.42 |
| | On sales of $100,000 or more, the offering price of Class A shares is reduced. |
| * | Redemption price per share is equal to the net asset value less any applicable contingent deferred sales charge. |
7
See Notes to Financial Statements.
Eaton Vance
Floating-Rate Fund
April 30, 2024
Statement of Operations (Unaudited)
| | Six Months Ended |
| | April 30, 2024 |
| Investment Income | |
| Dividend income allocated from Portfolio | $ 3,753,304 |
| Interest income allocated from Portfolio | 218,084,412 |
| Other income allocated from Portfolio | 3,592,180 |
| Expenses allocated from Portfolio | (13,727,309) |
| Total investment income from Portfolio | $211,702,587 |
| Expenses | |
| Administration fee | $ 3,547,270 |
| Distribution and service fees: | |
| Advisers Class | 153,386 |
| Class A | 725,245 |
| Class C | 430,947 |
| Trustees’ fees and expenses | 250 |
| Custodian fee | 30,934 |
| Transfer and dividend disbursing agent fees | 1,500,240 |
| Legal and accounting services | 111,350 |
| Printing and postage | 111,252 |
| Registration fees | 92,202 |
| Miscellaneous | 41,463 |
| Total expenses | $ 6,744,539 |
| Net investment income | $204,958,048 |
| Realized and Unrealized Gain (Loss) from Portfolio | |
| Net realized gain (loss): | |
| Investment transactions | $ (93,959,115) |
| Foreign currency transactions | (78,436) |
| Forward foreign currency exchange contracts | (1,165,575) |
| Net realized loss | $ (95,203,126) |
| Change in unrealized appreciation (depreciation): | |
| Investments | $ 173,992,947 |
| Foreign currency | (1,080,790) |
| Forward foreign currency exchange contracts | 1,432,073 |
| Net change in unrealized appreciation (depreciation) | $174,344,230 |
| Net realized and unrealized gain | $ 79,141,104 |
| Net increase in net assets from operations | $284,099,152 |
8
See Notes to Financial Statements.
Eaton Vance
Floating-Rate Fund
April 30, 2024
Statements of Changes in Net Assets
| | Six Months Ended
April 30, 2024
(Unaudited) | Year Ended
October 31, 2023 |
| Increase (Decrease) in Net Assets | | |
| From operations: | | |
| Net investment income | $ 204,958,048 | $ 441,790,351 |
| Net realized loss | (95,203,126) | (284,912,809) |
| Net change in unrealized appreciation (depreciation) | 174,344,230 | 399,557,092 |
| Net increase in net assets from operations | $ 284,099,152 | $ 556,434,634 |
| Distributions to shareholders: | | |
| Advisers Class | $ (5,595,181) | $ (6,652,329) |
| Class A | (26,445,613) | (50,592,690) |
| Class C | (3,607,955) | (7,196,866) |
| Class I | (149,472,759) | (322,989,148) |
| Class R6 | (35,073,984) | (55,794,960) |
| Total distributions to shareholders | $ (220,195,492) | $ (443,225,993) |
| Transactions in shares of beneficial interest: | | |
| Advisers Class | $ (2,118,784) | $ 45,758,267 |
| Class A | (42,535,564) | (113,678,147) |
| Class C | (6,095,296) | (31,000,899) |
| Class I | (184,522,285) | (2,014,176,168) |
| Class R6 | 5,984,759 | 135,361,177 |
| Net decrease in net assets from Fund share transactions | $ (229,287,170) | $(1,977,735,770) |
| Net decrease in net assets | $ (165,383,510) | $(1,864,527,129) |
| Net Assets | | |
| At beginning of period | $ 4,933,247,993 | $ 6,797,775,122 |
| At end of period | $4,767,864,483 | $ 4,933,247,993 |
9
See Notes to Financial Statements.
Eaton Vance
Floating-Rate Fund
April 30, 2024
| | Advisers Class |
| | Six Months Ended
April 30, 2024
(Unaudited) | Year Ended October 31, |
| | 2023 | 2022 | 2021 | 2020 | 2019 |
| Net asset value — Beginning of period | $ 8.290 | $ 8.150 | $ 8.810 | $ 8.470 | $ 8.740 | $ 9.050 |
| Income (Loss) From Operations | | | | | | |
| Net investment income(1) | $ 0.353 | $ 0.656 | $ 0.318 | $ 0.268 | $ 0.321 | $ 0.411 |
| Net realized and unrealized gain (loss) | 0.147 | 0.134 | (0.639) | 0.345 | (0.267) | (0.310) |
| Total income (loss) from operations | $ 0.500 | $ 0.790 | $ (0.321) | $ 0.613 | $ 0.054 | $ 0.101 |
| Less Distributions | | | | | | |
| From net investment income | $ (0.380) | $ (0.650) | $ (0.339) | $ (0.273) | $ (0.324) | $ (0.411) |
| Total distributions | $ (0.380) | $ (0.650) | $ (0.339) | $ (0.273) | $ (0.324) | $ (0.411) |
| Net asset value — End of period | $ 8.410 | $ 8.290 | $ 8.150 | $ 8.810 | $ 8.470 | $ 8.740 |
| Total Return(2) | 5.87% (3) | 10.11% | (3.70)% | 7.30% | 0.70% | 1.16% |
| Ratios/Supplemental Data | | | | | | |
| Net assets, end of period (000’s omitted) | $123,157 | $123,632 | $77,084 | $157,768 | $94,411 | $364,983 |
| Ratios (as a percentage of average daily net assets):(4) | | | | | | |
| Expenses | 1.07% (5)(6) | 1.05% (6) | 1.01% (6) | 1.03% | 1.08% | 1.03% |
| Net investment income | 8.46% (5) | 7.89% | 3.70% | 3.05% | 3.78% | 4.63% |
| Portfolio Turnover of the Portfolio | 15% (3) | 19% | 27% | 26% | 28% | 16% |
| (1) | Computed using average shares outstanding. |
| (2) | Returns are historical and are calculated by determining the percentage change in net asset value with all distributions reinvested. |
| (3) | Not annualized. |
| (4) | Includes the Fund’s share of the Portfolio’s allocated expenses. |
| (5) | Annualized. |
| (6) | Includes a reduction by the investment adviser of a portion of the Portfolio’s adviser fee due to the Portfolio’s investment in the Liquidity Fund (equal to less than 0.005% of average daily net assets for the six months ended April 30, 2024 and the years ended October 31, 2023 and 2022). |
10
See Notes to Financial Statements.
Eaton Vance
Floating-Rate Fund
April 30, 2024
Financial Highlights — continued
| | Class A |
| | Six Months Ended
April 30, 2024
(Unaudited) | Year Ended October 31, |
| | 2023 | 2022 | 2021 | 2020 | 2019 |
| Net asset value — Beginning of period | $ 8.580 | $ 8.430 | $ 9.120 | $ 8.770 | $ 9.050 | $ 9.360 |
| Income (Loss) From Operations | | | | | | |
| Net investment income(1) | $ 0.366 | $ 0.669 | $ 0.349 | $ 0.278 | $ 0.322 | $ 0.425 |
| Net realized and unrealized gain (loss) | 0.147 | 0.154 | (0.688) | 0.354 | (0.268) | (0.310) |
| Total income (loss) from operations | $ 0.513 | $ 0.823 | $ (0.339) | $ 0.632 | $ 0.054 | $ 0.115 |
| Less Distributions | | | | | | |
| From net investment income | $ (0.393) | $ (0.673) | $ (0.351) | $ (0.282) | $ (0.334) | $ (0.425) |
| Total distributions | $ (0.393) | $ (0.673) | $ (0.351) | $ (0.282) | $ (0.334) | $ (0.425) |
| Net asset value — End of period | $ 8.700 | $ 8.580 | $ 8.430 | $ 9.120 | $ 8.770 | $ 9.050 |
| Total Return(2) | 5.95% (3) | 10.04% | (3.78)% | 7.27% | 0.79% | 1.17% |
| Ratios/Supplemental Data | | | | | | |
| Net assets, end of period (000’s omitted) | $571,499 | $606,136 | $707,666 | $751,136 | $658,206 | $788,125 |
| Ratios (as a percentage of average daily net assets):(4) | | | | | | |
| Expenses | 1.07% (5)(6) | 1.06% (6) | 1.01% (6) | 1.03% | 1.07% | 1.02% |
| Net investment income | 8.47% (5) | 7.79% | 3.96% | 3.06% | 3.68% | 4.63% |
| Portfolio Turnover of the Portfolio | 15% (3) | 19% | 27% | 26% | 28% | 16% |
| (1) | Computed using average shares outstanding. |
| (2) | Returns are historical and are calculated by determining the percentage change in net asset value with all distributions reinvested and do not reflect the effect of sales charges. |
| (3) | Not annualized. |
| (4) | Includes the Fund’s share of the Portfolio’s allocated expenses. |
| (5) | Annualized. |
| (6) | Includes a reduction by the investment adviser of a portion of the Portfolio’s adviser fee due to the Portfolio’s investment in the Liquidity Fund (equal to less than 0.005% of average daily net assets for the six months ended April 30, 2024 and the years ended October 31, 2023 and 2022). |
11
See Notes to Financial Statements.
Eaton Vance
Floating-Rate Fund
April 30, 2024
Financial Highlights — continued
| | Class C |
| | Six Months Ended
April 30, 2024
(Unaudited) | Year Ended October 31, |
| | 2023 | 2022 | 2021 | 2020 | 2019 |
| Net asset value — Beginning of period | $ 8.290 | $ 8.140 | $ 8.800 | $ 8.470 | $ 8.730 | $ 9.040 |
| Income (Loss) From Operations | | | | | | |
| Net investment income(1) | $ 0.322 | $ 0.582 | $ 0.271 | $ 0.203 | $ 0.251 | $ 0.343 |
| Net realized and unrealized gain (loss) | 0.136 | 0.155 | (0.656) | 0.334 | (0.251) | (0.308) |
| Total income (loss) from operations | $ 0.458 | $ 0.737 | $ (0.385) | $ 0.537 | $ — | $ 0.035 |
| Less Distributions | | | | | | |
| From net investment income | $ (0.348) | $ (0.587) | $ (0.275) | $ (0.207) | $ (0.260) | $ (0.345) |
| Total distributions | $ (0.348) | $ (0.587) | $ (0.275) | $ (0.207) | $ (0.260) | $ (0.345) |
| Net asset value — End of period | $ 8.400 | $ 8.290 | $ 8.140 | $ 8.800 | $ 8.470 | $ 8.730 |
| Total Return(2) | 5.48% (3) | 9.29% | (4.43)% | 6.38% | 0.06% | 0.40% |
| Ratios/Supplemental Data | | | | | | |
| Net assets, end of period (000’s omitted) | $83,456 | $88,377 | $117,294 | $135,213 | $189,138 | $328,577 |
| Ratios (as a percentage of average daily net assets):(4) | | | | | | |
| Expenses | 1.82% (5)(6) | 1.81% (6) | 1.76% (6) | 1.79% | 1.82% | 1.78% |
| Net investment income | 7.72% (5) | 7.03% | 3.18% | 2.32% | 2.97% | 3.86% |
| Portfolio Turnover of the Portfolio | 15% (3) | 19% | 27% | 26% | 28% | 16% |
| (1) | Computed using average shares outstanding. |
| (2) | Returns are historical and are calculated by determining the percentage change in net asset value with all distributions reinvested and do not reflect the effect of sales charges. |
| (3) | Not annualized. |
| (4) | Includes the Fund’s share of the Portfolio’s allocated expenses. |
| (5) | Annualized. |
| (6) | Includes a reduction by the investment adviser of a portion of the Portfolio’s adviser fee due to the Portfolio’s investment in the Liquidity Fund (equal to less than 0.005% of average daily net assets for the six months ended April 30, 2024 and the years ended October 31, 2023 and 2022). |
12
See Notes to Financial Statements.
Eaton Vance
Floating-Rate Fund
April 30, 2024
Financial Highlights — continued
| | Class I |
| | Six Months Ended
April 30, 2024
(Unaudited) | Year Ended October 31, |
| | 2023 | 2022 | 2021 | 2020 | 2019 |
| Net asset value — Beginning of period | $ 8.300 | $ 8.150 | $ 8.820 | $ 8.480 | $ 8.750 | $ 9.060 |
| Income (Loss) From Operations | | | | | | |
| Net investment income(1) | $ 0.364 | $ 0.664 | $ 0.356 | $ 0.289 | $ 0.335 | $ 0.433 |
| Net realized and unrealized gain (loss) | 0.137 | 0.158 | (0.665) | 0.346 | (0.260) | (0.309) |
| Total income (loss) from operations | $ 0.501 | $ 0.822 | $ (0.309) | $ 0.635 | $ 0.075 | $ 0.124 |
| Less Distributions | | | | | | |
| From net investment income | $ (0.391) | $ (0.672) | $ (0.361) | $ (0.295) | $ (0.345) | $ (0.434) |
| Total distributions | $ (0.391) | $ (0.672) | $ (0.361) | $ (0.295) | $ (0.345) | $ (0.434) |
| Net asset value — End of period | $ 8.410 | $ 8.300 | $ 8.150 | $ 8.820 | $ 8.480 | $ 8.750 |
| Total Return(2) | 6.12% (3) | 10.38% | (3.57)% | 7.56% | 0.95% | 1.41% |
| Ratios/Supplemental Data | | | | | | |
| Net assets, end of period (000’s omitted) | $3,202,040 | $3,343,188 | $5,269,963 | $5,988,270 | $3,565,898 | $4,985,629 |
| Ratios (as a percentage of average daily net assets):(4) | | | | | | |
| Expenses | 0.82% (5)(6) | 0.81% (6) | 0.76% (6) | 0.78% | 0.82% | 0.77% |
| Net investment income | 8.72% (5) | 8.00% | 4.18% | 3.29% | 3.95% | 4.88% |
| Portfolio Turnover of the Portfolio | 15% (3) | 19% | 27% | 26% | 28% | 16% |
| (1) | Computed using average shares outstanding. |
| (2) | Returns are historical and are calculated by determining the percentage change in net asset value with all distributions reinvested. |
| (3) | Not annualized. |
| (4) | Includes the Fund’s share of the Portfolio’s allocated expenses. |
| (5) | Annualized. |
| (6) | Includes a reduction by the investment adviser of a portion of the Portfolio’s adviser fee due to the Portfolio’s investment in the Liquidity Fund (equal to less than 0.005% of average daily net assets for the six months ended April 30, 2024 and the years ended October 31, 2023 and 2022). |
13
See Notes to Financial Statements.
Eaton Vance
Floating-Rate Fund
April 30, 2024
Financial Highlights — continued
| | Class R6 |
| | Six Months Ended
April 30, 2024
(Unaudited) | Year Ended October 31, |
| | 2023 | 2022 | 2021 | 2020 | 2019 |
| Net asset value — Beginning of period | $ 8.310 | $ 8.160 | $ 8.830 | $ 8.490 | $ 8.760 | $ 9.060 |
| Income (Loss) From Operations | | | | | | |
| Net investment income(1) | $ 0.367 | $ 0.680 | $ 0.358 | $ 0.293 | $ 0.335 | $ 0.437 |
| Net realized and unrealized gain (loss) | 0.137 | 0.147 | (0.662) | 0.347 | (0.254) | (0.299) |
| Total income (loss) from operations | $ 0.504 | $ 0.827 | $ (0.304) | $ 0.640 | $ 0.081 | $ 0.138 |
| Less Distributions | | | | | | |
| From net investment income | $ (0.394) | $ (0.677) | $ (0.366) | $ (0.300) | $ (0.351) | $ (0.438) |
| Total distributions | $ (0.394) | $ (0.677) | $ (0.366) | $ (0.300) | $ (0.351) | $ (0.438) |
| Net asset value — End of period | $ 8.420 | $ 8.310 | $ 8.160 | $ 8.830 | $ 8.490 | $ 8.760 |
| Total Return(2) | 6.16% (3) | 10.44% | (3.51)% | 7.61% | 1.01% | 1.57% |
| Ratios/Supplemental Data | | | | | | |
| Net assets, end of period (000’s omitted) | $787,712 | $771,916 | $625,769 | $718,642 | $386,940 | $399,233 |
| Ratios (as a percentage of average daily net assets):(4) | | | | | | |
| Expenses | 0.75% (5)(6) | 0.75% (6) | 0.71% (6) | 0.73% | 0.76% | 0.72% |
| Net investment income | 8.77% (5) | 8.17% | 4.19% | 3.34% | 3.97% | 4.92% |
| Portfolio Turnover of the Portfolio | 15% (3) | 19% | 27% | 26% | 28% | 16% |
| (1) | Computed using average shares outstanding. |
| (2) | Returns are historical and are calculated by determining the percentage change in net asset value with all distributions reinvested. |
| (3) | Not annualized. |
| (4) | Includes the Fund’s share of the Portfolio’s allocated expenses. |
| (5) | Annualized. |
| (6) | Includes a reduction by the investment adviser of a portion of the Portfolio’s adviser fee due to the Portfolio’s investment in the Liquidity Fund (equal to less than 0.005% of average daily net assets for the six months ended April 30, 2024 and the years ended October 31, 2023 and 2022). |
14
See Notes to Financial Statements.
Eaton Vance
Floating-Rate Fund
April 30, 2024
Notes to Financial Statements (Unaudited)
1 Significant Accounting Policies
Eaton Vance Floating-Rate Fund (the Fund) is a diversified series of Eaton Vance Mutual Funds Trust (the Trust). The Trust is a Massachusetts business trust registered under the Investment Company Act of 1940, as amended (the 1940 Act), as an open-end management investment company. The Fund offers five classes of shares. Class A shares are generally sold subject to a sales charge imposed at time of purchase. Class C shares are sold at net asset value and are generally subject to a contingent deferred sales charge (see Note 5). Effective November 5, 2020, Class C shares automatically convert to Class A shares eight years after their purchase as described in the Fund’s prospectus. Advisers Class, Class I and Class R6 shares are sold at net asset value and are not subject to a sales charge. Each class represents a pro rata interest in the Fund, but votes separately on class-specific matters and (as noted below) is subject to different expenses. Realized and unrealized gains and losses are allocated daily to each class of shares based on the relative net assets of each class to the total net assets of the Fund. Net investment income, other than class-specific expenses, is allocated daily to each class of shares based upon the ratio of the value of each class’s paid shares to the total value of all paid shares. Sub-accounting, recordkeeping and similar administrative fees payable to financial intermediaries, which are a component of transfer and dividend disbursing agent fees on the Statement of Operations, are not allocated to Class R6 shares. Each class of shares differs in its distribution plan and certain other class-specific expenses. The Fund invests its assets in interests in Eaton Vance Floating Rate Portfolio (the Portfolio), a Massachusetts business trust, having the same investment objective and policies as the Fund. The value of the Fund’s investment in the Portfolio reflects the Fund’s proportionate interest in the net assets of the Portfolio (86.1% at April 30, 2024). The performance of the Fund is directly affected by the performance of the Portfolio. The financial statements of the Portfolio, including the portfolio of investments, are included elsewhere in this report and should be read in conjunction with the Fund’s financial statements.
The following is a summary of significant accounting policies of the Fund. The policies are in conformity with accounting principles generally accepted in the United States of America (U.S. GAAP). The Fund is an investment company and follows accounting and reporting guidance in the Financial Accounting Standards Board (FASB) Accounting Standards Codification Topic 946.
A Investment Valuation—Valuation of securities by the Portfolio is discussed in Note 1A of the Portfolio's Notes to Financial Statements, which are included elsewhere in this report.
B Income—The Fund's net investment income or loss consists of the Fund's pro rata share of the net investment income or loss of the Portfolio, less all actual and accrued expenses of the Fund.
C Federal Taxes—The Fund's policy is to comply with the provisions of the Internal Revenue Code applicable to regulated investment companies and to distribute to shareholders each year substantially all of its net investment income, and all or substantially all of its net realized capital gains. Accordingly, no provision for federal income or excise tax is necessary.
As of April 30, 2024, the Fund had no uncertain tax positions that would require financial statement recognition, de-recognition, or disclosure. The Fund files a U.S. federal income tax return annually after its fiscal year-end, which is subject to examination by the Internal Revenue Service for a period of three years from the date of filing.
D Expenses—The majority of expenses of the Trust are directly identifiable to an individual fund. Expenses which are not readily identifiable to a specific fund are allocated taking into consideration, among other things, the nature and type of expense and the relative size of the funds.
E Use of Estimates—The preparation of the financial statements in conformity with U.S. GAAP requires management to make estimates and assumptions that affect the reported amounts of assets and liabilities at the date of the financial statements and the reported amounts of income and expense during the reporting period. Actual results could differ from those estimates.
F Indemnifications—Under the Trust’s organizational documents, its officers and Trustees may be indemnified against certain liabilities and expenses arising out of the performance of their duties to the Fund. Under Massachusetts law, if certain conditions prevail, shareholders of a Massachusetts business trust (such as the Trust) could be deemed to have personal liability for the obligations of the Trust. However, the Trust’s Declaration of Trust contains an express disclaimer of liability on the part of Fund shareholders and the By-laws provide that the Trust shall assume, upon request by the shareholder, the defense on behalf of any Fund shareholders. Moreover, the By-laws also provide for indemnification out of Fund property of any shareholder held personally liable solely by reason of being or having been a shareholder for all loss or expense arising from such liability. Additionally, in the normal course of business, the Fund enters into agreements with service providers that may contain indemnification clauses. The Fund’s maximum exposure under these arrangements is unknown as this would involve future claims that may be made against the Fund that have not yet occurred.
G Other—Investment transactions are accounted for on a trade date basis.
H Interim Financial Statements—The interim financial statements relating to April 30, 2024 and for the six months then ended have not been audited by an independent registered public accounting firm, but in the opinion of the Fund’s management, reflect all adjustments, consisting only of normal recurring adjustments, necessary for the fair presentation of the financial statements.
Eaton Vance
Floating-Rate Fund
April 30, 2024
Notes to Financial Statements (Unaudited) — continued
2 Distributions to Shareholders and Income Tax Information
The Fund declares dividends daily to shareholders of record at the time of declaration. Distributions are generally paid monthly. Distributions of realized capital gains are made at least annually. Distributions are declared separately for each class of shares. Shareholders may reinvest income and capital gain distributions in additional shares of the same class of the Fund at the net asset value as of the reinvestment date or, at the election of the shareholder, receive distributions in cash. Distributions to shareholders are determined in accordance with income tax regulations, which may differ from U.S. GAAP. As required by U.S. GAAP, only distributions in excess of tax basis earnings and profits are reported in the financial statements as a return of capital. Permanent differences between book and tax accounting relating to distributions are reclassified to paid-in capital. For tax purposes, distributions from short-term capital gains are considered to be from ordinary income.
At October 31, 2023, the Fund, for federal income tax purposes, had deferred capital losses of $737,114,128 which would reduce its taxable income arising from future net realized gains on investment transactions, if any, to the extent permitted by the Internal Revenue Code, and thus would reduce the amount of distributions to shareholders, which would otherwise be necessary to relieve the Fund of any liability for federal income or excise tax. The deferred capital losses are treated as arising on the first day of the Fund’s next taxable year and retain the same short-term or long-term character as when originally deferred. Of the deferred capital losses at October 31, 2023, $74,968,901 are short-term and $662,145,227 are long-term.
3 Investment Adviser Fee and Other Transactions with Affiliates
The investment adviser fee is earned by Eaton Vance Management (EVM), an indirect, wholly-owned subsidiary of Morgan Stanley, as compensation for investment advisory services rendered to the Fund. The fee is computed at an annual rate as a percentage of the Fund’s average daily net assets that are not invested in other investment companies for which EVM or its affiliates serve as investment adviser and receive an advisory fee as follows and is payable monthly:
| Average Daily Net Assets | Annual Fee Rate |
| Up to $1 billion | 0.5750% |
| $1 billion but less than $2 billion | 0.5250% |
| $2 billion but less than $5 billion | 0.4900% |
| $5 billion but less than $10 billion | 0.4600% |
| $10 billion but less than $15 billion | 0.4350% |
| $15 billion but less than $20 billion | 0.4150% |
| $20 billion but less than $25 billion | 0.4000% |
| $25 billion and over | 0.3900% |
For the six months ended April 30, 2024, the Fund incurred no investment adviser fee on such assets. To the extent that the Fund’s assets are invested in the Portfolio, the Fund is allocated its share of the Portfolio’s investment adviser fee. The Portfolio has engaged Boston Management and Research (BMR) to render investment advisory services. See Note 2 of the Portfolio’s Notes to Financial Statements which are included elsewhere in this report. The administration fee is earned by EVM as compensation for administrative services rendered to the Fund. The fee is computed at an annual rate of 0.15% of the Fund’s average daily net assets. For six months ended April 30, 2024, the administration fee amounted to $3,547,270. EVM provides sub-transfer agency and related services to the Fund pursuant to a Sub-Transfer Agency Support Services Agreement. For the six months ended April 30, 2024, EVM earned $74,098 from the Fund pursuant to such agreement, which is included in transfer and dividend disbursing agent fees on the Statement of Operations. The Fund was informed that Eaton Vance Distributors, Inc. (EVD), an affiliate of EVM and the Fund's principal underwriter, received $15,706 as its portion of the sales charge on sales of Class A shares for the six months ended April 30, 2024. The Fund was informed that Morgan Stanley affiliated broker-dealers, which may be deemed to be affiliates of EVM, BMR and EVD, also received a portion of the sales charge on sales of Class A shares for the six months ended April 30, 2024 in the amount of $5,650. EVD also received distribution and service fees from Advisers Class, Class A and Class C shares (see Note 4) and contingent deferred sales charges (see Note 5).
Trustees and officers of the Fund who are members of EVM’s or BMR's organizations receive remuneration for their services to the Fund out of the investment adviser fee. Certain officers and Trustees of the Fund and the Portfolio are officers of the above organizations.
4 Distribution Plans
The Fund has in effect distribution plans for Advisers Class shares and Class A shares (Advisers/Class A Plan) pursuant to Rule 12b-1 under the 1940 Act. Pursuant to the Advisers/Class A Plan, the Fund pays EVD a distribution and service fee of 0.25% per annum of its average daily net assets attributable to Advisers Class and Class A shares for distribution services and facilities provided to the Fund by EVD, as well as for personal services and/or the maintenance of shareholder accounts. Distribution and service fees paid or accrued to EVD for the six months ended April 30, 2024 amounted to $153,386 for Advisers Class shares and $725,245 for Class A shares.
Eaton Vance
Floating-Rate Fund
April 30, 2024
Notes to Financial Statements (Unaudited) — continued
The Fund also has in effect a distribution plan for Class C shares (Class C Plan) pursuant to Rule 12b-1 under the 1940 Act. Pursuant to the Class C Plan, the Fund pays EVD amounts equal to 0.75% per annum of its average daily net assets attributable to Class C shares for providing ongoing distribution services and facilities to the Fund. For the six months ended April 30, 2024, the Fund paid or accrued to EVD $323,210 for Class C shares.
Pursuant to the Class C Plan, the Fund also makes payments of service fees to EVD, financial intermediaries and other persons in amounts equal to 0.25% per annum of its average daily net assets attributable to Class C shares. Service fees paid or accrued are for personal services and/or the maintenance of shareholder accounts. They are separate and distinct from the sales commissions and distribution fees payable to EVD. Service fees paid or accrued for the six months ended April 30, 2024 amounted to $107,737 for Class C shares.
Distribution and service fees are subject to the limitations contained in the Financial Industry Regulatory Authority Rule 2341(d).
5 Contingent Deferred Sales Charges
A contingent deferred sales charge (CDSC) of 1% generally is imposed on redemptions of Class C shares made within 12 months of purchase. Class A shares may be subject to a 0.75% CDSC if redeemed within 12 months of purchase (depending on the circumstances of purchase). Generally, the CDSC is based upon the lower of the net asset value at date of redemption or date of purchase. No charge is levied on shares acquired by reinvestment of dividends or capital gain distributions. For the six months ended April 30, 2024, the Fund was informed that EVD received $627 and $1,318 of CDSCs paid by Class A and Class C shareholders, respectively.
6 Investment Transactions
For the six months ended April 30, 2024, increases and decreases in the Fund's investment in the Portfolio aggregated $104,210,042 and $568,251,349, respectively.
7 Shares of Beneficial Interest
The Fund’s Declaration of Trust permits the Trustees to issue an unlimited number of full and fractional shares of beneficial interest (without par value). Such shares may be issued in a number of different series (such as the Fund) and classes. Transactions in Fund shares, including direct exchanges pursuant to share class conversions, were as follows:
| | Six Months Ended
April 30, 2024
(Unaudited) | | Year Ended
October 31, 2023 |
| | Shares | Amount | | Shares | Amount |
| Advisers Class | | | | | |
| Sales | 1,056,889 | $ 8,877,878 | | 8,641,662 | $ 72,212,163 |
| Issued to shareholders electing to receive payments of distributions in Fund shares | 661,486 | 5,559,723 | | 791,416 | 6,582,749 |
| Redemptions | (1,970,753) | (16,556,385) | | (3,989,668) | (33,036,645) |
| Net increase (decrease) | (252,378) | $ (2,118,784) | | 5,443,410 | $ 45,758,267 |
| Class A | | | | | |
| Sales | 4,019,505 | $ 34,931,664 | | 12,432,666 | $ 106,676,323 |
| Issued to shareholders electing to receive payments of distributions in Fund shares | 2,588,797 | 22,508,445 | | 5,050,433 | 43,391,112 |
| Redemptions | (11,519,370) | (99,975,673) | | (30,796,059) | (263,745,582) |
| Net decrease | (4,911,068) | $ (42,535,564) | | (13,312,960) | $ (113,678,147) |
Eaton Vance
Floating-Rate Fund
April 30, 2024
Notes to Financial Statements (Unaudited) — continued
| | Six Months Ended
April 30, 2024
(Unaudited) | | Year Ended
October 31, 2023 |
| | Shares | Amount | | Shares | Amount |
| Class C | | | | | |
| Sales | 961,844 | $ 8,064,631 | | 1,292,224 | $ 10,703,034 |
| Issued to shareholders electing to receive payments of distributions in Fund shares | 379,799 | 3,188,334 | | 747,519 | 6,198,897 |
| Redemptions | (2,067,981) | (17,348,261) | | (5,784,216) | (47,902,830) |
| Net decrease | (726,338) | $ (6,095,296) | | (3,744,473) | $ (31,000,899) |
| Class I | | | | | |
| Sales | 47,222,373 | $ 396,948,528 | | 126,577,358 | $ 1,049,625,183 |
| Issued to shareholders electing to receive payments of distributions in Fund shares | 15,503,674 | 130,388,977 | | 32,389,436 | 269,072,260 |
| Redemptions | (84,807,078) | (711,859,790) | | (402,538,193) | (3,332,873,611) |
| Net decrease | (22,081,031) | $(184,522,285) | | (243,571,399) | $(2,014,176,168) |
| Class R6 | | | | | |
| Sales | 13,332,971 | $ 112,300,595 | | 51,948,178 | $ 431,460,935 |
| Issued to shareholders electing to receive payments of distributions in Fund shares | 2,327,362 | 19,598,042 | | 3,650,917 | 30,368,362 |
| Redemptions | (15,006,689) | (125,913,878) | | (39,367,783) | (326,468,120) |
| Net increase | 653,644 | $ 5,984,759 | | 16,231,312 | $ 135,361,177 |
Eaton Vance
Floating Rate Portfolio
April 30, 2024
Portfolio of Investments (Unaudited)
| Asset-Backed Securities — 4.5% |
| Security | Principal
Amount
(000's omitted) | Value |
| Alinea CLO Ltd.: | | | |
| Series 2018-1A, Class D, 8.686%, (3 mo. SOFR + 3.362%), 7/20/31(1)(2) | $ | 2,500 | $ 2,504,680 |
| Series 2018-1A, Class E, 11.586%, (3 mo. SOFR + 6.262%), 7/20/31(1)(2) | | 3,000 | 2,966,955 |
| AMMC CLO XII Ltd., Series 2013-12A, Class ER, 11.743%, (3 mo. SOFR + 6.442%), 11/10/30(1)(2) | | 3,525 | 3,441,641 |
| AMMC CLO XV Ltd., Series 2014-15A, Class ERR, 12.50%, (3 mo. SOFR + 7.172%), 1/15/32(1)(2) | | 4,000 | 3,848,440 |
| Apidos CLO XX Ltd., Series 2015-20A, Class DR, 11.289%, (3 mo. SOFR + 5.962%), 7/16/31(1)(2) | | 2,375 | 2,381,847 |
| ARES Loan Funding II Ltd., Series 2022-ALF2A, Class ER, 13.565%, (3 mo. SOFR + 8.24%), 10/20/36(1)(2) | | 1,325 | 1,351,079 |
| ARES LVIII CLO Ltd., Series 2020-58A, Class ER, 12.029%, (3 mo. SOFR + 6.70%), 1/15/35(1)(2) | | 3,000 | 2,997,270 |
| ARES XLIX CLO Ltd., Series 2018-49A, Class D, 8.586%, (3 mo. SOFR + 3.262%), 7/22/30(1)(2) | | 2,500 | 2,501,970 |
| ARES XXXIIR CLO Ltd., Series 2014-32RA, Class C, 8.469%, (3 mo. SOFR + 3.162%), 5/15/30(1)(2) | | 5,000 | 5,000,845 |
| ARES XXXVR CLO Ltd., Series 2015-35RA, Class E, 11.29%, (3 mo. SOFR + 5.962%), 7/15/30(1)(2) | | 4,000 | 3,955,192 |
| Bain Capital Credit CLO Ltd.: | | | |
| Series 2018-1A, Class D, 8.288%, (3 mo. SOFR + 2.962%), 4/23/31(1)(2) | | 5,000 | 4,919,455 |
| Series 2018-1A, Class E, 10.938%, (3 mo. SOFR + 5.612%), 4/23/31(1)(2) | | 3,000 | 2,800,335 |
| Barings CLO Ltd.: | | | |
| Series 2015-1A, Class DR, 8.186%, (3 mo. SOFR + 2.862%), 1/20/31(1)(2) | | 2,500 | 2,499,900 |
| Series 2018-1A, Class C, 8.19%, (3 mo. SOFR + 2.862%), 4/15/31(1)(2) | | 3,500 | 3,443,625 |
| Battalion CLO XXII Ltd., Series 2021-22A, Class E, 12.536%, (3 mo. SOFR + 7.212%), 1/20/35(1)(2) | | 1,750 | 1,620,600 |
| Battalion CLO XXIII Ltd., Series 2022-23A, Class D, 9.279%, (3 mo. SOFR + 3.95%), 5/19/36(1)(2) | | 3,500 | 3,471,205 |
| Benefit Street Partners CLO VIII Ltd., Series 2015-8A, Class DR, 11.186%, (3 mo. SOFR + 5.862%), 1/20/31(1)(2) | | 5,401 | 5,345,445 |
| Benefit Street Partners CLO XIV Ltd., Series 2018-14A, Class D, 8.186%, (3 mo. SOFR + 2.862%), 4/20/31(1)(2) | | 1,500 | 1,502,513 |
| Benefit Street Partners CLO XVI Ltd., Series 2018-16A, Class E, 12.279%, (3 mo. SOFR + 6.962%), 1/17/32(1)(2) | | 1,250 | 1,255,481 |
| Security | Principal
Amount
(000's omitted) | Value |
| Benefit Street Partners CLO XVII Ltd., Series 2019-17A, Class ER, 11.94%, (3 mo. SOFR + 6.612%), 7/15/32(1)(2) | $ | 1,750 | $ 1,757,921 |
| Benefit Street Partners CLO XXII Ltd., Series 2020-22A, Class ER, 12.255%, (3 mo. SOFR + 6.93%), 4/20/35(1)(2) | | 1,000 | 1,003,100 |
| Benefit Street Partners CLO XXV Ltd., Series 2021-25A, Class E, 12.44%, (3 mo. SOFR + 7.112%), 1/15/35(1)(2) | | 3,000 | 3,008,664 |
| Betony CLO 2 Ltd.: | | | |
| Series 2018-1A, Class C, 8.491%, (3 mo. SOFR + 3.162%), 4/30/31(1)(2) | | 2,500 | 2,501,532 |
| Series 2018-1A, Class D, 11.241%, (3 mo. SOFR + 5.912%), 4/30/31(1)(2) | | 2,475 | 2,449,782 |
| BlueMountain CLO Ltd.: | | | |
| Series 2016-3A, Class DR, 8.669%, (3 mo. SOFR + 3.362%), 11/15/30(1)(2) | | 1,500 | 1,483,461 |
| Series 2016-3A, Class ER, 11.519%, (3 mo. SOFR + 6.212%), 11/15/30(1)(2) | | 1,500 | 1,441,254 |
| Series 2018-1A, Class D, 8.641%, (3 mo. SOFR + 3.312%), 7/30/30(1)(2) | | 2,500 | 2,442,440 |
| Series 2018-1A, Class E, 11.541%, (3 mo. SOFR + 6.212%), 7/30/30(1)(2) | | 2,000 | 1,829,416 |
| BlueMountain CLO XXIV Ltd., Series 2019-24A, Class ER, 12.426%, (3 mo. SOFR + 7.102%), 4/20/34(1)(2) | | 1,000 | 980,969 |
| BlueMountain CLO XXVI Ltd., Series 2019-26A, Class ER, 12.716%, (3 mo. SOFR + 7.392%), 10/20/34(1)(2) | | 3,000 | 2,946,033 |
| BlueMountain CLO XXX Ltd., Series 2020-30A, Class ER, 12.029%, (3 mo. SOFR + 6.70%), 4/15/35(1)(2) | | 2,000 | 1,955,000 |
| BlueMountain CLO XXXIII Ltd., Series 2021-33A, Class E, 12.411%, (3 mo. SOFR + 7.092%), 11/20/34(1)(2) | | 2,500 | 2,485,743 |
| BlueMountain CLO XXXV Ltd., Series 2022-35A, Class E, 13.075%, (3 mo. SOFR + 7.75%), 7/22/35(1)(2) | | 2,000 | 1,978,702 |
| Bryant Park Funding Ltd.: | | | |
| Series 2023-20A, Class D, 11.419%, (3 mo. SOFR + 6.09%), 7/15/36(1)(2) | | 3,500 | 3,573,220 |
| Series 2023-21A, Class D, 10.777%, (3 mo. SOFR + 5.45%), 10/18/36(1)(2) | | 3,525 | 3,575,823 |
| Canyon Capital CLO Ltd.: | | | |
| Series 2012-1RA, Class E, 11.29%, (3 mo. SOFR + 5.962%), 7/15/30(1)(2) | | 4,875 | 4,777,636 |
| Series 2016-1A, Class ER, 11.34%, (3 mo. SOFR + 6.012%), 7/15/31(1)(2) | | 4,000 | 3,923,540 |
| Series 2016-2A, Class ER, 11.59%, (3 mo. SOFR + 6.262%), 10/15/31(1)(2) | | 4,500 | 4,444,677 |
| Series 2017-1A, Class E, 11.84%, (3 mo. SOFR + 6.512%), 7/15/30(1)(2) | | 3,250 | 3,204,350 |
19
See Notes to Financial Statements.
Eaton Vance
Floating Rate Portfolio
April 30, 2024
Portfolio of Investments (Unaudited) — continued
| Security | Principal
Amount
(000's omitted) | Value |
| Canyon Capital CLO Ltd.: (continued) | | | |
| Series 2018-1A, Class D, 8.49%, (3 mo. SOFR + 3.162%), 7/15/31(1)(2) | $ | 3,000 | $ 2,964,834 |
| Series 2018-1A, Class E, 11.34%, (3 mo. SOFR + 6.012%), 7/15/31(1)(2) | | 2,750 | 2,701,875 |
| Series 2019-2A, Class ER, 12.34%, (3 mo. SOFR + 7.012%), 10/15/34(1)(2) | | 1,500 | 1,468,268 |
| Carlyle C17 CLO Ltd.: | | | |
| Series C17A, Class CR, 8.379%, (3 mo. SOFR + 3.062%), 4/30/31(1)(2) | | 5,000 | 4,968,750 |
| Series C17A, Class DR, 11.579%, (3 mo. SOFR + 6.262%), 4/30/31(1)(2) | | 3,500 | 3,407,106 |
| Carlyle Global Market Strategies CLO Ltd.: | | | |
| Series 2012-3A, Class CR2, 9.09%, (3 mo. SOFR + 3.762%), 1/14/32(1)(2) | | 2,500 | 2,504,097 |
| Series 2012-3A, Class DR2, 12.09%, (3 mo. SOFR + 6.762%), 1/14/32(1)(2) | | 1,500 | 1,479,825 |
| Series 2014-3RA, Class C, 8.537%, (3 mo. SOFR + 3.212%), 7/27/31(1)(2) | | 1,000 | 984,560 |
| Series 2014-3RA, Class D, 10.987%, (3 mo. SOFR + 5.662%), 7/27/31(1)(2) | | 2,150 | 2,104,841 |
| Series 2014-4RA, Class C, 8.49%, (3 mo. SOFR + 3.162%), 7/15/30(1)(2) | | 2,000 | 1,970,388 |
| Series 2014-4RA, Class D, 11.24%, (3 mo. SOFR + 5.912%), 7/15/30(1)(2) | | 1,500 | 1,451,039 |
| Carlyle U.S. CLO Ltd.: | | | |
| Series 2019-4A, Class DR, 11.929%, (3 mo. SOFR + 6.60%), 4/15/35(1)(2) | | 3,000 | 2,969,790 |
| Series 2022-6A, Class DR, 10.074%, (3 mo. SOFR + 4.75%), 10/25/36(1)(2) | | 2,200 | 2,235,961 |
| CarVal CLO IV Ltd., Series 2021-1A, Class E, 12.186%, (3 mo. SOFR + 6.862%), 7/20/34(1)(2) | | 1,000 | 1,003,442 |
| CIFC Funding Ltd., Series 2022-4A, Class D, 8.878%, (3 mo. SOFR + 3.55%), 7/16/35(1)(2) | | 1,750 | 1,754,998 |
| Dryden CLO Ltd.: | | | |
| Series 2018-55A, Class D, 8.44%, (3 mo. SOFR + 3.112%), 4/15/31(1)(2) | | 1,500 | 1,468,382 |
| Series 2018-55A, Class E, 10.99%, (3 mo. SOFR + 5.662%), 4/15/31(1)(2) | | 2,000 | 1,871,134 |
| Dryden Senior Loan Fund: | | | |
| Series 2015-41A, Class DR, 8.19%, (3 mo. SOFR + 2.862%), 4/15/31(1)(2) | | 5,000 | 4,880,890 |
| Series 2015-41A, Class ER, 10.89%, (3 mo. SOFR + 5.562%), 4/15/31(1)(2) | | 1,268 | 1,164,014 |
| Series 2016-42A, Class DR, 8.52%, (3 mo. SOFR + 3.192%), 7/15/30(1)(2) | | 2,500 | 2,487,423 |
| Series 2016-42A, Class ER, 11.14%, (3 mo. SOFR + 5.812%), 7/15/30(1)(2) | | 3,500 | 3,311,444 |
| Elmwood CLO 17 Ltd., Series 2022-4A, Class E, 12.467%, (3 mo. SOFR + 7.15%), 7/17/35(1)(2) | | 2,250 | 2,267,053 |
| Golub Capital Partners CLO 53B Ltd., Series 2021-53A, Class E, 12.286%, (3 mo. SOFR + 6.962%), 7/20/34(1)(2) | | 1,250 | 1,253,823 |
| Security | Principal
Amount
(000's omitted) | Value |
| Golub Capital Partners CLO 58B Ltd., Series 2021-58A, Class E, 12.395%, (3 mo. SOFR + 7.072%), 1/25/35(1)(2) | $ | 2,500 | $ 2,507,357 |
| HalseyPoint CLO 5 Ltd., Series 2021-5A, Class E, 12.531%, (3 mo. SOFR + 7.202%), 1/30/35(1)(2) | | 2,000 | 1,960,532 |
| Harriman Park CLO Ltd., Series 2020-1A, Class ER, 11.986%, (3 mo. SOFR + 6.662%), 4/20/34(1)(2) | | 1,000 | 1,004,415 |
| ICG U.S. CLO Ltd.: | | | |
| Series 2018-2A, Class D, 8.686%, (3 mo. SOFR + 3.362%), 7/22/31(1)(2) | | 2,000 | 1,992,268 |
| Series 2018-2A, Class E, 11.336%, (3 mo. SOFR + 6.012%), 7/22/31(1)(2) | | 3,000 | 2,727,978 |
| Madison Park Funding LIX Ltd., Series 2021-59A, Class E, 12.189%, (3 mo. SOFR + 6.862%), 1/18/34(1)(2) | | 1,450 | 1,454,598 |
| Madison Park Funding XXXVI Ltd., Series 2019-36A, Class ER, 12.379%, (3 mo. SOFR + 7.05%), 4/15/35(1)(2) | | 2,500 | 2,508,510 |
| Marble Point CLO XXIV Ltd., Series 2022-1A, Class D1, 9.565%, (3 mo. SOFR + 4.24%), 4/20/35(1)(2) | | 2,000 | 1,951,146 |
| Neuberger Berman CLO XXII Ltd.: | | | |
| Series 2016-22A, Class DR, 8.679%, (3 mo. SOFR + 3.362%), 10/17/30(1)(2) | | 2,500 | 2,504,072 |
| Series 2016-22A, Class ER, 11.639%, (3 mo. SOFR + 6.322%), 10/17/30(1)(2) | | 3,000 | 3,008,283 |
| Neuberger Berman Loan Advisers CLO 28 Ltd., Series 2018-28A, Class E, 11.186%, (3 mo. SOFR + 5.862%), 4/20/30(1)(2) | | 1,950 | 1,955,552 |
| Neuberger Berman Loan Advisers CLO 30 Ltd., Series 2018-30A, Class ER, 11.786%, (3 mo. SOFR + 6.462%), 1/20/31(1)(2) | | 1,000 | 1,003,245 |
| Neuberger Berman Loan Advisers CLO Ltd., Series 2022-48A, Class E, 11.824%, (3 mo. SOFR + 6.50%), 4/25/36(1)(2) | | 3,200 | 3,208,822 |
| OCP CLO Ltd.: | | | |
| Series 2022-24A, Class D, 9.125%, (3 mo. SOFR + 3.80%), 7/20/35(1)(2) | | 500 | 500,819 |
| Series 2022-24A, Class E, 12.745%, (3 mo. SOFR + 7.42%), 7/20/35(1)(2) | | 1,000 | 1,002,958 |
| Palmer Square CLO Ltd.: | | | |
| Series 2013-2A, Class DRR, 11.429%, (3 mo. SOFR + 6.112%), 10/17/31(1)(2) | | 1,325 | 1,328,521 |
| Series 2015-1A, Class DR4, 12.076%, (3 mo. SOFR + 6.762%), 5/21/34(1)(2) | | 2,000 | 2,005,212 |
| Series 2021-2A, Class E, 11.94%, (3 mo. SOFR + 6.612%), 7/15/34(1)(2) | | 1,000 | 1,002,878 |
| RAD CLO 5 Ltd., Series 2019-5A, Class E, 12.285%, (3 mo. SOFR + 6.962%), 7/24/32(1)(2) | | 1,250 | 1,241,879 |
| RAD CLO 14 Ltd., Series 2021-14A, Class E, 12.09%, (3 mo. SOFR + 6.762%), 1/15/35(1)(2) | | 950 | 952,731 |
20
See Notes to Financial Statements.
Eaton Vance
Floating Rate Portfolio
April 30, 2024
Portfolio of Investments (Unaudited) — continued
| Security | Principal
Amount
(000's omitted) | Value |
| Regatta XIII Funding Ltd.: | | | |
| Series 2018-2A, Class C, 8.69%, (3 mo. SOFR + 3.362%), 7/15/31(1)(2) | $ | 2,500 | $ 2,504,845 |
| Series 2018-2A, Class D, 11.54%, (3 mo. SOFR + 6.212%), 7/15/31(1)(2) | | 5,000 | 4,695,815 |
| Regatta XIV Funding Ltd.: | | | |
| Series 2018-3A, Class D, 8.785%, (3 mo. SOFR + 3.462%), 10/25/31(1)(2) | | 2,500 | 2,505,320 |
| Series 2018-3A, Class E, 11.535%, (3 mo. SOFR + 6.212%), 10/25/31(1)(2) | | 2,000 | 1,972,744 |
| Regatta XV Funding Ltd., Series 2018-4A, Class D, 12.085%, (3 mo. SOFR + 6.762%), 10/25/31(1)(2) | | 2,875 | 2,852,443 |
| Upland CLO Ltd.: | | | |
| Series 2016-1A, Class CR, 8.486%, (3 mo. SOFR + 3.162%), 4/20/31(1)(2) | | 4,500 | 4,505,679 |
| Series 2016-1A, Class DR, 11.486%, (3 mo. SOFR + 6.162%), 4/20/31(1)(2) | | 2,125 | 2,099,173 |
| Vibrant CLO IX, Ltd.: | | | |
| Series 2018-9A, Class C, 8.786%, (3 mo. SOFR + 3.462%), 7/20/31(1)(2) | | 2,500 | 2,493,255 |
| Series 2018-9A, Class D, 11.836%, (3 mo. SOFR + 6.512%), 7/20/31(1)(2) | | 3,500 | 3,295,351 |
| Voya CLO Ltd.: | | | |
| Series 2015-3A, Class CR, 8.736%, (3 mo. SOFR + 3.412%), 10/20/31(1)(2) | | 2,500 | 2,433,613 |
| Series 2015-3A, Class DR, 11.786%, (3 mo. SOFR + 6.462%), 10/20/31(1)(2) | | 5,500 | 4,921,092 |
| Series 2016-3A, Class CR, 8.839%, (3 mo. SOFR + 3.512%), 10/18/31(1)(2) | | 2,000 | 1,969,078 |
| Series 2016-3A, Class DR, 11.669%, (3 mo. SOFR + 6.342%), 10/18/31(1)(2) | | 2,375 | 2,322,622 |
| Series 2018-2A, Class E, 10.84%, (3 mo. SOFR + 5.512%), 7/15/31(1)(2) | | 2,500 | 2,297,605 |
| Webster Park CLO Ltd.: | | | |
| Series 2015-1A, Class CR, 8.486%, (3 mo. SOFR + 3.162%), 7/20/30(1)(2) | | 2,000 | 2,002,116 |
| Series 2015-1A, Class DR, 11.086%, (3 mo. SOFR + 5.762%), 7/20/30(1)(2) | | 2,500 | 2,469,478 |
| Wellfleet CLO Ltd.: | | | |
| Series 2021-1A, Class D, 9.086%, (3 mo. SOFR + 3.762%), 4/20/34(1)(2) | | 1,200 | 1,171,381 |
| Series 2021-3A, Class E, 12.69%, (3 mo. SOFR + 7.362%), 1/15/35(1)(2) | | 950 | 898,904 |
| Series 2022-1A, Class D, 9.469%, (3 mo. SOFR + 4.14%), 4/15/34(1)(2) | | 1,000 | 996,488 |
| Series 2022-1A, Class E, 13.189%, (3 mo. SOFR + 7.86%), 4/15/34(1)(2) | | 2,000 | 1,997,284 |
Total Asset-Backed Securities
(identified cost $252,088,878) | | | $ 248,471,740 |
| Security | Shares | Value |
| Aerospace and Defense — 0.0% |
| IAP Worldwide Services LLC(3)(4)(5)(6) | | 950 | $ 0 |
| IAP Worldwide Services LLC(3)(4)(5) | | 1,627 | 0 |
| | | | $ 0 |
| Chemicals — 0.0% |
| Flint Campfire Topco Ltd., Class A(4)(5)(6) | | 3,812,783 | $ 0 |
| | | | $ 0 |
| Commercial Services & Supplies — 0.1% |
| Monitronics International, Inc.(5)(6) | | 223,950 | $ 4,702,950 |
| Phoenix Services International LLC(5)(6) | | 168,954 | 865,889 |
| Phoenix Services International LLC(5)(6) | | 15,415 | 79,002 |
| | | | $ 5,647,841 |
| Containers and Glass Products — 0.0%(7) |
| LG Parent Holding Co.(5)(6) | | 250,979 | $ 1,419,587 |
| | | | $ 1,419,587 |
| Electronics/Electrical — 0.0%(7) |
| Skillsoft Corp.(5)(6) | | 44,676 | $ 321,220 |
| | | | $ 321,220 |
| Entertainment — 0.0%(7) |
| New Cineworld Ltd.(5)(6) | | 80,602 | $ 1,546,551 |
| | | | $ 1,546,551 |
| Health Care — 0.1% |
| Akorn Holding Co. LLC(4)(5)(6) | | 705,631 | $ 0 |
| Envision Parent, Inc.(5)(6) | | 778,264 | 5,496,490 |
| | | | $ 5,496,490 |
| Household Durables — 0.2% |
| Serta Simmons Bedding, Inc.(5)(6) | | 1,348,933 | $ 9,554,897 |
| Serta SSB Equipment Co.(4)(5)(6) | | 1,348,933 | 0 |
| | | | $ 9,554,897 |
| Investment Companies — 0.0%(7) |
| Aegletes BV(5)(6) | | 116,244 | $ 241,788 |
| | | | $ 241,788 |
21
See Notes to Financial Statements.
Eaton Vance
Floating Rate Portfolio
April 30, 2024
Portfolio of Investments (Unaudited) — continued
| Security | Shares | Value |
| Nonferrous Metals/Minerals — 0.2% |
| ACNR Holdings, Inc., Class A(5)(6) | | 141,193 | $ 11,736,668 |
| | | | $ 11,736,668 |
| Oil and Gas — 0.0%(7) |
| AFG Holdings, Inc.(4)(5)(6) | | 498,342 | $ 1,021,601 |
| McDermott International Ltd.(5)(6) | | 1,013,850 | 255,186 |
| | | | $ 1,276,787 |
| Pharmaceuticals — 0.3% |
| Covis Midco 1 SARL, Class A(5)(6) | | 8,008 | $ 4,084 |
| Covis Midco 1 SARL, Class B(5)(6) | | 8,008 | 4,084 |
| Covis Midco 1 SARL, Class C(5)(6) | | 8,008 | 4,084 |
| Covis Midco 1 SARL, Class D(5)(6) | | 8,008 | 4,084 |
| Covis Midco 1 SARL, Class E(5)(6) | | 8,008 | 4,084 |
| Mallinckrodt International Finance SA(5)(6) | | 250,308 | 13,203,747 |
| | | | $ 13,224,167 |
| Retail — 0.0% |
| Jubilee Enterprise PCL, Class A1(4)(5)(6) | | 2,897 | $ 0 |
| Jubilee Enterprise PCL, Class A2(4)(5)(6) | | 2,314,594 | 0 |
| | | | $ 0 |
| Retailers (Except Food and Drug) — 0.0%(7) |
| Phillips Feed Service, Inc.(4)(5)(6) | | 2,590 | $ 3,704 |
| | | | $ 3,704 |
| Telecommunications — 0.0% |
| GEE Acquisition Holdings Corp.(4)(5)(6) | | 364,650 | $ 0 |
| | | | $ 0 |
| Utilities — 0.0%(7) |
| Longview Intermediate Holdings LLC, Class A(6) | | 149,459 | $ 411,012 |
| | | | $ 411,012 |
Total Common Stocks
(identified cost $97,591,740) | | | $ 50,880,712 |
| Security | Principal
Amount*
(000's omitted) | Value |
| Aerospace and Defense — 0.4% |
| TransDigm, Inc.: | | | |
| 6.75%, 8/15/28(1) | | 3,175 | $ 3,192,460 |
| Security | Principal
Amount*
(000's omitted) | Value |
| Aerospace and Defense (continued) |
| TransDigm, Inc.: (continued) | | | |
| 6.875%, 12/15/30(1) | | 17,000 | $ 17,131,740 |
| | | | $ 20,324,200 |
| Air Transport — 0.5% |
| American Airlines, Inc./AAdvantage Loyalty IP Ltd.: | | | |
| 5.50%, 4/20/26(1) | | 8,117 | $ 8,029,975 |
| 5.75%, 4/20/29(1) | | 12,875 | 12,444,495 |
| United Airlines, Inc.: | | | |
| 4.375%, 4/15/26(1) | | 4,625 | 4,452,970 |
| 4.625%, 4/15/29(1) | | 4,625 | 4,267,207 |
| | | | $ 29,194,647 |
| Automotive — 0.1% |
| Adient Global Holdings Ltd., 7.00%, 4/15/28(1) | | 2,175 | $ 2,199,569 |
| Clarios Global LP, 6.75%, 5/15/25(1) | | 1,890 | 1,892,433 |
| Clarios Global LP/Clarios U.S. Finance Co., 6.25%, 5/15/26(1) | | 3,893 | 3,891,883 |
| | | | $ 7,983,885 |
| Building and Development — 0.1% |
| Miter Brands Acquisition Holdco, Inc./MIWD Borrower LLC, 6.75%, 4/1/32(1) | | 4,075 | $ 4,049,538 |
| Winnebago Industries, Inc., 6.25%, 7/15/28(1) | | 900 | 881,841 |
| | | | $ 4,931,379 |
| Business Equipment and Services — 0.3% |
| Allied Universal Holdco LLC/Allied Universal Finance Corp., 6.625%, 7/15/26(1) | | 853 | $ 851,611 |
| Allied Universal Holdco LLC/Allied Universal Finance Corp./Atlas Luxco 4 SARL: | | | |
| 4.625%, 6/1/28(1) | | 4,475 | 4,019,032 |
| 4.625%, 6/1/28(1) | | 15,725 | 14,142,112 |
| | | | $ 19,012,755 |
| Chemicals — 0.5% |
| INEOS Finance PLC: | | | |
| 3.375%, 3/31/26(1) | EUR | 1,250 | $ 1,310,231 |
| 7.50%, 4/15/29(1) | | 7,425 | 7,468,815 |
| Olympus Water U.S. Holding Corp.: | | | |
| 4.25%, 10/1/28(1) | | 9,350 | 8,434,824 |
| 7.125%, 10/1/27(1) | | 925 | 937,732 |
| 9.75%, 11/15/28(1) | | 8,600 | 9,136,370 |
| | | | $ 27,287,972 |
22
See Notes to Financial Statements.
Eaton Vance
Floating Rate Portfolio
April 30, 2024
Portfolio of Investments (Unaudited) — continued
| Security | Principal
Amount*
(000's omitted) | Value |
| Commercial Services — 0.4% |
| Neptune Bidco U.S., Inc., 9.29%, 4/15/29(1) | | 15,300 | $ 14,455,834 |
| Wand NewCo 3, Inc., 7.625%, 1/30/32(1) | | 5,250 | 5,341,589 |
| | | | $ 19,797,423 |
| Containers & Packaging — 0.2% |
| Pactiv Evergreen Group Issuer, Inc./Pactiv Evergreen Group Issuer LLC: | | | |
| 4.00%, 10/15/27(1) | | 5,150 | $ 4,783,246 |
| 4.375%, 10/15/28(1) | | 6,625 | 6,103,805 |
| | | | $ 10,887,051 |
| Diversified Financial Services — 0.3% |
| AG Issuer LLC, 6.25%, 3/1/28(1) | | 8,075 | $ 7,824,889 |
| AG TTMT Escrow Issuer LLC, 8.625%, 9/30/27(1) | | 2,925 | 3,015,909 |
| Aretec Group, Inc., 10.00%, 8/15/30(1) | | 4,225 | 4,594,511 |
| | | | $ 15,435,309 |
| Diversified Telecommunication Services — 0.7% |
| Altice France SA: | | | |
| 5.125%, 1/15/29(1) | | 1,300 | $ 850,656 |
| 5.125%, 7/15/29(1) | | 28,050 | 18,311,475 |
| 5.50%, 10/15/29(1) | | 6,455 | 4,232,994 |
| Level 3 Financing, Inc., 10.75%, 12/15/30(1) | | 11,225 | 11,302,940 |
| Virgin Media Secured Finance PLC, 4.50%, 8/15/30(1) | | 6,500 | 5,490,415 |
| | | | $ 40,188,480 |
| Drugs — 0.2% |
| Jazz Securities DAC, 4.375%, 1/15/29(1) | | 9,150 | $ 8,333,751 |
| | | | $ 8,333,751 |
| Ecological Services and Equipment — 0.1% |
| GFL Environmental, Inc., 4.25%, 6/1/25(1) | | 5,300 | $ 5,228,801 |
| | | | $ 5,228,801 |
| Electronics/Electrical — 0.3% |
| Imola Merger Corp., 4.75%, 5/15/29(1) | | 18,175 | $ 16,750,458 |
| | | | $ 16,750,458 |
| Engineering & Construction — 0.0%(7) |
| Artera Services LLC, 8.50%, 2/15/31(1) | | 1,175 | $ 1,203,240 |
| | | | $ 1,203,240 |
| Security | Principal
Amount*
(000's omitted) | Value |
| Entertainment — 0.1% |
| Caesars Entertainment, Inc., 6.50%, 2/15/32(1) | | 3,925 | $ 3,869,768 |
| Live Nation Entertainment, Inc., 3.75%, 1/15/28(1) | | 2,075 | 1,885,935 |
| Six Flags Theme Parks, Inc., 7.00%, 7/1/25(1) | | 1,070 | 1,073,132 |
| | | | $ 6,828,835 |
| Health Care — 0.5% |
| Medline Borrower LP, 3.875%, 4/1/29(1) | | 22,800 | $ 20,448,090 |
| Tenet Healthcare Corp., 4.25%, 6/1/29 | | 7,950 | 7,289,005 |
| | | | $ 27,737,095 |
| Hotels, Restaurants & Leisure — 0.6% |
| Carnival Corp., 4.00%, 8/1/28(1) | | 34,575 | $ 31,635,971 |
| SeaWorld Parks & Entertainment, Inc., 8.75%, 5/1/25(1) | | 2,125 | 2,125,000 |
| | | | $ 33,760,971 |
| Household Products — 0.2% |
| Kronos Acquisition Holdings, Inc./KIK Custom Products, Inc., 5.00%, 12/31/26(1) | | 14,212 | $ 13,745,513 |
| | | | $ 13,745,513 |
| Insurance — 0.6% |
| Alliant Holdings Intermediate LLC/Alliant Holdings Co-Issuer, 4.25%, 10/15/27(1) | | 700 | $ 653,525 |
| AmWINS Group, Inc., 6.375%, 2/15/29(1) | | 5,850 | 5,782,826 |
| Panther Escrow Issuer LLC, 7.125%, 6/1/31(1) | | 27,325 | 27,484,200 |
| | | | $ 33,920,551 |
| Internet Software & Services — 0.3% |
| Central Parent, Inc./CDK Global, Inc., 7.25%, 6/15/29(1) | | 13,700 | $ 13,859,331 |
| | | | $ 13,859,331 |
| Leisure Goods/Activities/Movies — 0.4% |
| Lindblad Expeditions LLC, 6.75%, 2/15/27(1) | | 3,300 | $ 3,271,843 |
| NCL Corp. Ltd., 5.875%, 2/15/27(1) | | 22,000 | 21,507,078 |
| | | | $ 24,778,921 |
| Machinery — 0.3% |
| Madison IAQ LLC, 4.125%, 6/30/28(1) | | 13,400 | $ 12,442,437 |
| TK Elevator U.S. Newco, Inc., 5.25%, 7/15/27(1) | | 7,150 | 6,847,043 |
| | | | $ 19,289,480 |
23
See Notes to Financial Statements.
Eaton Vance
Floating Rate Portfolio
April 30, 2024
Portfolio of Investments (Unaudited) — continued
| Security | Principal
Amount*
(000's omitted) | Value |
| Media — 0.3% |
| iHeartCommunications, Inc.: | | | |
| 4.75%, 1/15/28(1) | | 2,550 | $ 1,823,150 |
| 5.25%, 8/15/27(1) | | 2,125 | 1,560,950 |
| 6.375%, 5/1/26 | | 2,896 | 2,449,792 |
| Univision Communications, Inc., 4.50%, 5/1/29(1) | | 9,125 | 7,946,110 |
| | | | $ 13,780,002 |
| Oil, Gas & Consumable Fuels — 0.2% |
| CITGO Petroleum Corp., 7.00%, 6/15/25(1) | | 10,525 | $ 10,522,051 |
| | | | $ 10,522,051 |
| Professional Services — 0.1% |
| CoreLogic, Inc., 4.50%, 5/1/28(1) | | 5,525 | $ 4,785,296 |
| | | | $ 4,785,296 |
| Real Estate Investment Trusts (REITs) — 0.2% |
| Cushman & Wakefield U.S. Borrower LLC, 6.75%, 5/15/28(1) | | 6,393 | $ 6,308,352 |
| Park Intermediate Holdings LLC/PK Domestic Property LLC/PK Finance Co-Issuer, 5.875%, 10/1/28(1) | | 6,425 | 6,245,003 |
| | | | $ 12,553,355 |
| Retail — 0.3% |
| Fertitta Entertainment LLC/Fertitta Entertainment Finance Co., Inc., 4.625%, 1/15/29(1) | | 15,580 | $ 14,106,789 |
| | | | $ 14,106,789 |
| Retailers (Except Food and Drug) — 0.0%(7) |
| PetSmart, Inc./PetSmart Finance Corp., 4.75%, 2/15/28(1) | | 1,300 | $ 1,201,062 |
| | | | $ 1,201,062 |
| Software — 0.7% |
| Boxer Parent Co., Inc., 7.125%, 10/2/25(1) | | 4,225 | $ 4,232,739 |
| Cloud Software Group, Inc., 9.00%, 9/30/29(1) | | 13,600 | 13,096,667 |
| GoTo Group, Inc.: | | | |
| 5.50%, 5/1/28(1) | | 4,842 | 4,143,300 |
| 5.50%, 5/1/28(1) | | 4,842 | 3,250,498 |
| UKG, Inc., 6.875%, 2/1/31(1) | | 7,850 | 7,869,905 |
| Veritas U.S., Inc./Veritas Bermuda Ltd., 7.50%, 9/1/25(1) | | 4,900 | 4,462,153 |
| | | | $ 37,055,262 |
| Security | Principal
Amount*
(000's omitted) | Value |
| Technology — 0.2% |
| Clarivate Science Holdings Corp., 3.875%, 7/1/28(1) | | 11,400 | $ 10,391,095 |
| | | | $ 10,391,095 |
| Telecommunications — 0.2% |
| LCPR Senior Secured Financing DAC, 5.125%, 7/15/29(1) | | 6,075 | $ 5,079,799 |
| VMED O2 U.K. Financing I PLC, 4.25%, 1/31/31(1) | | 5,550 | 4,538,788 |
| | | | $ 9,618,587 |
| Wireless Telecommunication Services — 0.1% |
| Digicel Intermediate Holdings Ltd./Digicel International Finance Ltd./DIFL U.S., 10.50%, (9.00% cash, 1.50% PIK), 5/25/27 | | 6,327 | $ 6,141,837 |
| | | | $ 6,141,837 |
Total Corporate Bonds
(identified cost $553,255,645) | | | $ 520,635,384 |
| Exchange-Traded Funds — 0.3% |
| Security | Shares | Value |
| SPDR Blackstone Senior Loan ETF | | 426,000 | $ 17,883,480 |
Total Exchange-Traded Funds
(identified cost $19,593,026) | | | $ 17,883,480 |
| Senior Floating-Rate Loans — 81.8%(8) |
| Borrower/Description | Principal
Amount*
(000's omitted) | Value |
| Aerospace and Defense — 1.5% |
| Aernnova Aerospace SAU: | | | |
| Term Loan, 6.902%, (6 mo. EURIBOR + 3.00%), 2/26/27 | EUR | 1,194 | $ 1,268,798 |
| Term Loan, 6.952%, (3 mo. EURIBOR + 3.00%), 2/26/27 | EUR | 4,656 | 4,948,311 |
| Dynasty Acquisition Co., Inc.: | | | |
| Term Loan, 8.816%, (SOFR + 3.50%), 8/24/28 | | 24,068 | 24,207,950 |
| Term Loan, 8.816%, (SOFR + 3.50%), 8/24/28 | | 9,280 | 9,333,963 |
| IAP Worldwide Services, Inc., Term Loan - Second Lien, 12.152%, (3 mo. USD LIBOR + 6.50%), 7/18/23(4) | | 6,709 | 5,330,664 |
| TransDigm, Inc.: | | | |
| Term Loan, 8.059%, (SOFR + 2.75%), 8/24/28 | | 9,252 | 9,310,475 |
| Term Loan, 8.059%, (SOFR + 2.75%), 2/22/30 | | 27,474 | 27,627,260 |
| | | | $ 82,027,421 |
24
See Notes to Financial Statements.
Eaton Vance
Floating Rate Portfolio
April 30, 2024
Portfolio of Investments (Unaudited) — continued
| Borrower/Description | Principal
Amount*
(000's omitted) | Value |
| Airlines — 0.4% |
| American Airlines, Inc., Term Loan, 10.336%, (SOFR + 4.75%), 4/20/28 | | 22,100 | $ 23,015,382 |
| | | | $ 23,015,382 |
| Apparel & Luxury Goods — 0.5% |
| Gloves Buyer, Inc., Term Loan, 9.43%, (SOFR + 4.00%), 12/29/27 | | 12,060 | $ 12,089,787 |
| Hanesbrands, Inc., Term Loan, 9.066%, (SOFR + 3.75%), 3/8/30 | | 4,529 | 4,540,573 |
| Touchdown Acquirer, Inc.: | | | |
| Term Loan, 0.00%, 2/21/31(9) | | 1,600 | 1,609,000 |
| Term Loan, 7.929%, (3 mo. EURIBOR + 4.00%), 2/21/31 | EUR | 3,825 | 4,085,443 |
| Term Loan, 9.314%, (SOFR + 4.00%), 2/21/31 | | 7,425 | 7,466,766 |
| | | | $ 29,791,569 |
| Auto Components — 1.8% |
| Adient U.S. LLC, Term Loan, 8.066%, (SOFR + 2.75%), 1/31/31 | | 6,473 | $ 6,509,229 |
| Autokiniton U.S. Holdings, Inc., Term Loan, 9.43%, (SOFR + 4.00%), 4/6/28 | | 20,474 | 20,598,327 |
| Clarios Global LP, Term Loan, 7.098%, (1 mo. EURIBOR + 3.25%), 4/30/26 | EUR | 16,490 | 17,647,090 |
| DexKo Global, Inc.: | | | |
| Term Loan, 7.902%, (3 mo. EURIBOR + 4.00%), 10/4/28 | EUR | 3,272 | 3,454,765 |
| Term Loan, 7.902%, (3 mo. EURIBOR + 4.00%), 10/4/28 | EUR | 7,303 | 7,712,382 |
| Term Loan, 9.321%, (SOFR + 3.75%), 10/4/28 | | 9,319 | 9,264,739 |
| Garrett Motion, Inc., Term Loan, 9.83%, (SOFR + 4.50%), 4/30/28 | | 6,714 | 6,747,857 |
| LSF12 Badger Bidco LLC, Term Loan, 11.316%, (SOFR + 6.00%), 8/30/30 | | 3,092 | 3,111,577 |
| LTI Holdings, Inc., Term Loan, 10.18%, (SOFR + 4.75%), 7/24/26 | | 7,007 | 6,941,132 |
| RealTruck Group, Inc.: | | | |
| Term Loan, 8.93%, (SOFR + 3.50%), 1/31/28 | | 11,450 | 11,383,465 |
| Term Loan, 10.43%, (SOFR + 5.00%), 1/31/28 | | 7,125 | 7,104,216 |
| | | | $ 100,474,779 |
| Automobiles — 0.6% |
| Bombardier Recreational Products, Inc., Term Loan, 8.066%, (SOFR + 2.75%), 1/22/31 | | 17,028 | $ 17,054,857 |
| MajorDrive Holdings IV LLC: | | | |
| Term Loan, 9.571%, (SOFR + 4.00%), 6/1/28 | | 14,817 | 14,900,278 |
| Term Loan, 10.959%, (SOFR + 5.50%), 6/1/29 | | 2,130 | 2,146,838 |
| | | | $ 34,101,973 |
| Borrower/Description | Principal
Amount*
(000's omitted) | Value |
| Beverages — 0.7% |
| City Brewing Co. LLC: | | | |
| Term Loan, 9.09%, (SOFR + 3.50%), 4/5/28 | | 6,994 | $ 6,434,269 |
| Term Loan, 11.574%, (SOFR + 6.25%), 4/5/28 | | 4,781 | 4,768,985 |
| Term Loan - Second Lien, 10.59%, (SOFR + 5.00%), 9.09% cash, 1.50% PIK, 4/5/28 | | 7,744 | 5,652,953 |
| Triton Water Holdings, Inc., Term Loan, 8.814%, (SOFR + 3.25%), 3/31/28 | | 21,049 | 20,982,922 |
| | | | $ 37,839,129 |
| Biotechnology — 0.5% |
| Alkermes, Inc., Term Loan, 7.93%, (SOFR + 2.50%), 3/12/26 | | 18,084 | $ 18,174,703 |
| Alltech, Inc., Term Loan, 9.43%, (SOFR + 4.00%), 10/13/28 | | 4,712 | 4,688,596 |
| Grifols Worldwide Operations USA, Inc., Term Loan, 7.459%, (SOFR + 2.00%), 11/15/27 | | 4,417 | 4,327,220 |
| | | | $ 27,190,519 |
| Building Products — 0.6% |
| Cornerstone Building Brands, Inc., Term Loan, 8.671%, (SOFR + 3.25%), 4/12/28 | | 6,025 | $ 5,917,178 |
| CPG International, Inc., Term Loan, 7.916%, (SOFR + 2.50%), 4/28/29 | | 5,589 | 5,604,695 |
| LHS Borrower LLC, Term Loan, 10.166%, (SOFR + 4.75%), 2/16/29 | | 5,797 | 5,605,684 |
| MI Windows and Doors LLC, Term Loan, 8.816%, (SOFR + 3.50%), 3/28/31 | | 12,400 | 12,471,300 |
| Oscar AcquisitionCo LLC, Term Loan, 9.902%, (SOFR + 4.50%), 4/29/29 | | 1,590 | 1,598,245 |
| Standard Industries, Inc., Term Loan, 7.68%, (SOFR + 2.25%), 9/22/28 | | 3,788 | 3,802,109 |
| | | | $ 34,999,211 |
| Capital Markets — 4.1% |
| Advisor Group, Inc., Term Loan, 9.816%, (SOFR + 4.50%), 8/17/28 | | 22,170 | $ 22,317,739 |
| AllSpring Buyer LLC, Term Loan, 8.677%, (SOFR + 3.25%), 11/1/28 | | 6,188 | 6,177,910 |
| Aretec Group, Inc., Term Loan, 9.916%, (SOFR + 4.50%), 8/9/30 | | 26,992 | 27,157,280 |
| CeramTec AcquiCo GmbH, Term Loan, 7.452%, (3 mo. EURIBOR + 3.50%), 3/16/29 | EUR | 12,779 | 13,620,729 |
| Citco Funding LLC, Term Loan, 8.422%, (SOFR + 3.25%), 4/27/28 | | 8,134 | 8,173,104 |
| Edelman Financial Center LLC: | | | |
| Term Loan, 8.93%, (SOFR + 3.50%), 4/7/28 | | 18,804 | 18,834,104 |
| Term Loan - Second Lien, 7/20/26(10) | | 3,300 | 3,319,153 |
25
See Notes to Financial Statements.
Eaton Vance
Floating Rate Portfolio
April 30, 2024
Portfolio of Investments (Unaudited) — continued
| Borrower/Description | Principal
Amount*
(000's omitted) | Value |
| Capital Markets (continued) |
| EIG Management Co. LLC, Term Loan, 9.166%, (SOFR + 3.75%), 2/22/25 | | 2,844 | $ 2,841,723 |
| FinCo I LLC, Term Loan, 8.33%, (SOFR + 3.00%), 6/27/29 | | 12,754 | 12,805,430 |
| Focus Financial Partners LLC: | | | |
| Term Loan, 7.816%, (SOFR + 2.50%), 6/30/28 | | 9,827 | 9,827,544 |
| Term Loan, 8.066%, (SOFR + 2.75%), 6/30/28 | | 28,395 | 28,424,855 |
| Franklin Square Holdings LP, Term Loan, 7.568%, (SOFR + 2.25%), 4/25/31 | | 9,825 | 9,831,141 |
| Guggenheim Partners LLC, Term Loan, 8.552%, (SOFR + 3.25%), 12/12/29 | | 19,133 | 19,255,000 |
| HighTower Holdings LLC, Term Loan, 9.586%, (SOFR + 4.00%), 4/21/28 | | 2,661 | 2,677,986 |
| Kestra Advisor Services Holdings A, Inc., Term Loan, 9.316%, (SOFR + 4.00%), 3/22/31 | | 6,275 | 6,313,240 |
| LPL Holdings, Inc., Term Loan, 7.179%, (SOFR + 1.75%), 11/12/26 | | 10,729 | 10,746,859 |
| Mariner Wealth Advisors LLC, Term Loan, 8.68%, (SOFR + 3.25%), 8/18/28 | | 13,383 | 13,399,736 |
| Press Ganey Holdings, Inc., Term Loan, 4/24/31(10) | | 6,200 | 6,188,375 |
| Victory Capital Holdings, Inc., Term Loan, 7.652%, (SOFR + 2.25%), 12/29/28 | | 6,839 | 6,843,198 |
| | | | $ 228,755,106 |
| Chemicals — 4.4% |
| Axalta Coating Systems U.S. Holdings, Inc., Term Loan, 7.33%, (SOFR + 2.00%), 12/20/29 | | 16,873 | $ 16,937,107 |
| CPC Acquisition Corp., Term Loan, 9.321%, (SOFR + 3.75%), 12/29/27 | | 14,714 | 12,488,403 |
| ECO Services Operations Corp., Term Loan, 7.93%, (SOFR + 2.50%), 6/9/28 | | 8,623 | 8,629,362 |
| Flint Group Midco Ltd., Term Loan, 10.588%, (SOFR + 5.26%), 9.838% cash, 0.75% PIK, 12/31/26 | | 5,001 | 4,790,576 |
| Flint Group Packaging INKS North America Holdings LLC: | | | |
| Term Loan, 8.892%, (3 mo. EURIBOR + 5.00%), 8.142% cash, 0.75% PIK, 12/31/26 | EUR | 1,552 | 1,586,565 |
| Term Loan, 10.892%, (3 mo. EURIBOR + 7.00%), 3.992% cash, 6.90% PIK, 12/30/27 | EUR | 792 | 699,802 |
| Term Loan - Second Lien, 10.892%, (3 mo. EURIBOR + 7.00%), 3.992% cash, 6.90% PIK, 12/30/27 | EUR | 1,055 | 175,651 |
| Flint Group Topco Ltd.: | | | |
| Term Loan, 12.588%, (SOFR + 7.262%), 5.688% cash, 6.90% PIK, 12/31/27 | | 2,586 | 2,140,290 |
| Term Loan - Second Lien, 12.588%, (SOFR + 7.262%), 5.688% cash, 6.90% PIK, 12/31/27 | | 3,391 | 528,973 |
| Borrower/Description | Principal
Amount*
(000's omitted) | Value |
| Chemicals (continued) |
| Gemini HDPE LLC, Term Loan, 8.591%, (SOFR + 3.00%), 12/31/27 | | 4,571 | $ 4,579,945 |
| GEON Performance Solutions LLC, Term Loan, 10.314%, (SOFR + 4.75%), 8/18/28 | | 5,631 | 5,655,980 |
| Groupe Solmax, Inc., Term Loan, 10.252%, (SOFR + 4.75%), 5/29/28(11) | | 9,344 | 9,221,051 |
| INEOS Enterprises Holdings II Ltd., Term Loan, 7.952%, (3 mo. EURIBOR + 4.00%), 7/7/30 | EUR | 1,975 | 2,115,625 |
| INEOS Enterprises Holdings U.S. Finco LLC, Term Loan, 9.193%, (SOFR + 3.75%), 7/8/30 | | 10,898 | 10,938,554 |
| INEOS Finance PLC: | | | |
| Term Loan, 6.598%, (1 mo. EURIBOR + 2.75%), 11/8/28 | EUR | 8,900 | 9,460,093 |
| Term Loan, 7.848%, (1 mo. EURIBOR + 4.00%), 11/8/27 | EUR | 6,200 | 6,639,287 |
| INEOS Quattro Holdings U.K. Ltd.: | | | |
| Term Loan, 6.598%, (1 mo. EURIBOR + 2.75%), 1/29/26 | EUR | 1,290 | 1,378,295 |
| Term Loan, 7.848%, (1 mo. EURIBOR + 4.00%), 3/14/30 | EUR | 3,300 | 3,496,606 |
| Term Loan, 9.18%, (SOFR + 3.75%), 3/14/30 | | 4,963 | 4,959,399 |
| INEOS U.S. Finance LLC: | | | |
| Term Loan, 8.916%, (SOFR + 3.50%), 2/18/30 | | 20,549 | 20,613,285 |
| Term Loan, 9.066%, (SOFR + 3.75%), 2/7/31 | | 5,275 | 5,298,078 |
| Term Loan, 9.166%, (SOFR + 3.75%), 11/8/27 | | 2,624 | 2,631,229 |
| Kraton Corp., Term Loan, 8.841%, (SOFR + 3.25%), 3/15/29 | | 5,586 | 5,374,782 |
| Kraton Polymers Holdings BV, Term Loan, 7.188%, (3 mo. EURIBOR + 3.25%), 3/15/29 | EUR | 4,250 | 4,395,280 |
| Lonza Group AG: | | | |
| Term Loan, 7.827%, (3 mo. EURIBOR + 3.93%), 7/3/28 | EUR | 4,600 | 4,595,287 |
| Term Loan, 9.334%, (SOFR + 3.93%), 7/3/28 | | 10,712 | 10,293,543 |
| Momentive Performance Materials, Inc., Term Loan, 9.817%, (SOFR + 4.50%), 3/29/28 | | 21,477 | 21,382,923 |
| Olympus Water U.S. Holding Corp.: | | | |
| Term Loan, 9.321%, (SOFR + 3.75%), 11/9/28 | | 3,927 | 3,940,057 |
| Term Loan, 9.576%, (SOFR + 4.25%), 11/9/28 | | 5,317 | 5,341,896 |
| Orion Engineered Carbons GmbH, Term Loan, 6.302%, (3 mo. EURIBOR + 2.40%), 9/24/28 | EUR | 1,250 | 1,318,159 |
| Rohm Holding GmbH: | | | |
| Term Loan, 8.366%, (6 mo. EURIBOR + 4.50%), 7/31/26 | EUR | 1,000 | 1,011,840 |
| Term Loan, 8.366%, (6 mo. EURIBOR + 4.50%), 7/31/26 | EUR | 10,800 | 10,927,867 |
| Term Loan, 10.581%, (SOFR + 5.00%), 7/31/26 | | 13,712 | 12,957,530 |
| SCUR-Alpha 1503 GmbH, Term Loan, 10.83%, (SOFR + 5.50%), 3/29/30 | | 8,437 | 7,825,626 |
26
See Notes to Financial Statements.
Eaton Vance
Floating Rate Portfolio
April 30, 2024
Portfolio of Investments (Unaudited) — continued
| Borrower/Description | Principal
Amount*
(000's omitted) | Value |
| Chemicals (continued) |
| Tronox Finance LLC: | | | |
| Term Loan, 8.041%, (SOFR + 2.50%), 3/10/28(11) | | 11,570 | $ 11,583,144 |
| Term Loan, 8.552%, (SOFR + 3.25%), 4/4/29 | | 3,602 | 3,612,193 |
| Term Loan, 8.816%, (SOFR + 3.50%), 8/16/28 | | 5,062 | 5,079,185 |
| | | | $ 244,603,468 |
| Commercial Services & Supplies — 1.6% |
| Albion Financing 3 SARL: | | | |
| Term Loan, 10.575%, (SOFR + 5.25%), 8/17/26 | | 3,444 | $ 3,467,885 |
| Term Loan, 10.824%, (SOFR + 5.50%), 8/17/26 | | 3,490 | 3,511,561 |
| Belfor Holdings, Inc., Term Loan, 9.066%, (SOFR + 3.75%), 11/1/30 | | 6,176 | 6,202,344 |
| EnergySolutions LLC, Term Loan, 9.316%, (SOFR + 4.00%), 9/20/30 | | 16,227 | 16,313,222 |
| Foundever Group, Term Loan, 7.60%, (1 mo. EURIBOR + 3.75%), 8/28/28 | EUR | 3,925 | 3,436,092 |
| Foundever Worldwide Corp., Term Loan, 9.18%, (SOFR + 3.75%), 8/28/28 | | 16,373 | 12,738,702 |
| GFL Environmental, Inc., Term Loan, 7.826%, (SOFR + 2.50%), 5/31/27 | | 4,259 | 4,282,451 |
| Harsco Corp., Term Loan, 7.68%, (SOFR + 2.25%), 3/10/28 | | 881 | 880,020 |
| Heritage-Crystal Clean, Inc., Term Loan, 9.816%, (SOFR + 4.50%), 10/17/30 | | 7,307 | 7,335,227 |
| Monitronics International, Inc., Term Loan, 13.091%, (SOFR + 7.50%), 6/30/28 | | 12,281 | 12,265,368 |
| Phoenix Services International LLC, Term Loan, 11.418%, (SOFR + 6.10%), 6/30/28 | | 2,063 | 1,928,567 |
| Tempo Acquisition LLC, Term Loan, 8.066%, (SOFR + 2.75%), 8/31/28 | | 2,450 | 2,460,001 |
| TMF Group Holding BV, Term Loan, 9.306%, (SOFR + 4.00%), 5/3/28 | | 4,638 | 4,661,567 |
| TruGreen LP, Term Loan, 9.416%, (SOFR + 4.00%), 11/2/27 | | 8,356 | 8,048,859 |
| | | | $ 87,531,866 |
| Construction Materials — 0.5% |
| Quikrete Holdings, Inc.: | | | |
| Term Loan, 7.569%, (SOFR + 2.25%), 3/19/29 | | 20,517 | $ 20,547,124 |
| Term Loan, 7.819%, (SOFR + 2.50%), 4/14/31 | | 5,394 | 5,404,882 |
| U.S. Silica Co., Term Loan, 9.316%, (SOFR + 4.00%), 3/25/30 | | 3,242 | 3,247,887 |
| | | | $ 29,199,893 |
| Borrower/Description | Principal
Amount*
(000's omitted) | Value |
| Consumer Staples Distribution & Retail — 0.4% |
| Cardenas Markets, Inc., Term Loan, 12.159%, (SOFR + 6.75%), 8/1/29 | | 4,133 | $ 4,161,087 |
| Peer Holding III BV: | | | |
| Term Loan, 7.652%, (3 mo. EURIBOR + 3.75%), 9/29/28 | EUR | 5,725 | 6,141,799 |
| Term Loan, 8.559%, (SOFR + 3.25%), 10/28/30 | | 11,475 | 11,529,988 |
| | | | $ 21,832,874 |
| Containers & Packaging — 1.1% |
| Berlin Packaging LLC, Term Loan, 9.197%, (SOFR + 3.75%), 3/11/28(11) | | 2,887 | $ 2,891,980 |
| Clydesdale Acquisition Holdings, Inc., Term Loan, 9.091%, (SOFR + 3.68%), 4/13/29 | | 12,892 | 12,960,111 |
| Kouti BV, Term Loan, 7.127%, (3 mo. EURIBOR + 3.18%), 8/31/28 | EUR | 24,250 | 25,636,992 |
| Pretium Packaging LLC, Term Loan - Second Lien, 11.309%, (SOFR + 6.00%), 9.906% cash, 1.403% PIK, 10/2/28 | | 2,480 | 2,196,061 |
| Pretium PKG Holdings, Inc., Term Loan - Second Lien, 12.334%, (SOFR + 6.75%), 10/1/29 | | 6,675 | 4,113,469 |
| Proampac PG Borrower LLC, Term Loan, 9.326%, (SOFR + 4.00%), 9/15/28(11) | | 11,795 | 11,851,961 |
| | | | $ 59,650,574 |
| Distributors — 0.5% |
| CD&R Hydra Buyer, Inc., Term Loan, 9.42%, (SOFR + 4.00%), 3/25/31 | | 8,350 | $ 8,426,979 |
| Parts Europe SA, Term Loan, 7.647%, (3 mo. EURIBOR + 3.75%), 2/3/31 | EUR | 14,275 | 15,294,646 |
| Phillips Feed Service, Inc., Term Loan, 12.416%, (SOFR + 7.00%), 11/13/24(4) | | 468 | 327,738 |
| Rubix Group Midco 3 Ltd., Term Loan, 8.149%, (6 mo. EURIBOR + 4.25%), 9/30/26 | EUR | 1,500 | 1,607,090 |
| Winterfell Financing SARL, Term Loan, 8.898%, (3 mo. EURIBOR + 5.00%), 5/4/28 | EUR | 2,000 | 2,103,275 |
| | | | $ 27,759,728 |
| Diversified Consumer Services — 1.1% |
| Ascend Learning LLC: | | | |
| Term Loan, 8.916%, (SOFR + 3.50%), 12/11/28 | | 6,735 | $ 6,720,691 |
| Term Loan - Second Lien, 12/10/29(10) | | 3,500 | 3,449,250 |
| Belron Finance U.S. LLC, Term Loan, 7.578%, (SOFR + 2.00%), 4/13/28 | | 7,590 | 7,612,391 |
| FrontDoor, Inc., Term Loan, 7.68%, (SOFR + 2.25%), 6/17/28 | | 851 | 850,538 |
| KUEHG Corp., Term Loan, 9.823%, (SOFR + 4.50%), 6/12/30 | | 16,250 | 16,314,176 |
27
See Notes to Financial Statements.
Eaton Vance
Floating Rate Portfolio
April 30, 2024
Portfolio of Investments (Unaudited) — continued
| Borrower/Description | Principal
Amount*
(000's omitted) | Value |
| Diversified Consumer Services (continued) |
| Sotheby's, Term Loan, 10.09%, (SOFR + 4.50%), 1/15/27 | | 10,737 | $ 10,511,450 |
| Spring Education Group, Inc., Term Loan, 9.809%, (SOFR + 4.50%), 10/4/30 | | 3,716 | 3,735,659 |
| Wand NewCo 3, Inc., Term Loan, 9.066%, (SOFR + 3.75%), 1/30/31 | | 12,150 | 12,241,125 |
| | | | $ 61,435,280 |
| Diversified Financial Services — 0.2% |
| Concorde Midco Ltd., Term Loan, 7.851%, (6 mo. EURIBOR + 4.00%), 3/1/28 | EUR | 8,730 | $ 9,336,067 |
| | | | $ 9,336,067 |
| Diversified Telecommunication Services — 0.7% |
| GEE Holdings 2 LLC: | | | |
| Term Loan, 13.413%, (SOFR + 8.00%), 3/24/25 | | 9,639 | $ 8,771,597 |
| Term Loan - Second Lien, 13.662%, (SOFR + 8.25%), 5.412% cash, 8.25% PIK, 3/23/26 | | 7,560 | 4,536,264 |
| Level 3 Financing, Inc.: | | | |
| Term Loan, 11.875%, (SOFR + 6.56%), 4/15/29 | | 6,175 | 6,086,533 |
| Term Loan, 11.875%, (SOFR + 6.56%), 4/15/30 | | 6,175 | 6,060,801 |
| Lumen Technologies, Inc.: | | | |
| Term Loan, 7.78%, (SOFR + 2.35%), 4/15/29 | | 9,635 | 6,953,971 |
| Term Loan, 7.78%, (SOFR + 2.35%), 4/15/30 | | 9,635 | 6,744,412 |
| Virgin Media Bristol LLC, Term Loan, 7.936%, (SOFR + 2.50%), 1/31/28 | | 2,563 | 2,518,456 |
| | | | $ 41,672,034 |
| Electrical Equipment — 0.6% |
| WEC U.S. Holdings Ltd., Term Loan, 8.066%, (SOFR + 2.75%), 1/27/31 | | 31,492 | $ 31,550,182 |
| | | | $ 31,550,182 |
| Electronic Equipment, Instruments & Components — 1.4% |
| Chamberlain Group, Inc., Term Loan, 9.066%, (SOFR + 3.75%), 11/3/28 | | 11,200 | $ 11,233,600 |
| Creation Technologies, Inc., Term Loan, 11.068%, (SOFR + 5.50%), 10/5/28 | | 12,751 | 12,081,675 |
| II-VI, Inc., Term Loan, 7.829%, (SOFR + 2.50%), 7/2/29 | | 381 | 382,112 |
| Minimax Viking GmbH, Term Loan, 7.098%, (1 mo. EURIBOR + 3.25%), 7/31/28 | EUR | 3,469 | 3,727,421 |
| Mirion Technologies, Inc., Term Loan, 8.314%, (SOFR + 2.75%), 10/20/28 | | 1,722 | 1,727,165 |
| Robertshaw U.S. Holding Corp.: | | | |
| DIP Loan, 6.309%, (SOFR + 1.00%), 9/27/24 | | 5,698 | 5,555,647 |
| Borrower/Description | Principal
Amount*
(000's omitted) | Value |
| Electronic Equipment, Instruments & Components (continued) |
| Robertshaw U.S. Holding Corp.: (continued) | | | |
| Term Loan, 0.00%, 2/28/27(12) | | 3 | $ 3,223 |
| Term Loan, 0.00%, 2/28/27(12) | | 18,216 | 17,760,174 |
| Term Loan - Second Lien, 0.00%, 2/28/27(12) | | 16,894 | 9,291,684 |
| TTM Technologies, Inc., Term Loan, 8.077%, (SOFR + 2.75%), 5/30/30 | | 5,186 | 5,195,536 |
| Verifone Systems, Inc., Term Loan, 9.585%, (SOFR + 4.00%), 8/20/25 | | 14,540 | 13,202,383 |
| | | | $ 80,160,620 |
| Energy Equipment & Services — 0.8% |
| Ameriforge Group, Inc.: | | | |
| Term Loan, 12.088%, (SOFR + 8.00%), 12/29/23(4)(9) | | 3,251 | $ 2,633,237 |
| Term Loan, 20.50%, (U.S. (Fed) Prime Rate + 12.00%), 12/29/23(4) | | 25,469 | 20,632,228 |
| GIP Pilot Acquisition Partners LP, Term Loan, 8.308%, (SOFR + 3.00%), 10/4/30 | | 4,863 | 4,893,205 |
| Lealand Finance Co. BV: | | | |
| Term Loan, 3.63%, 6/28/24(9) | | 9,039 | 6,011,181 |
| Term Loan, 9.444%, (SOFR + 4.00%), 6.444% cash, 3.00% PIK, 6/30/25 | | 2,557 | 929,951 |
| PG Investment Co. 59 SARL, Term Loan, 8.813%, (SOFR + 3.50%), 3/26/31 | | 10,350 | 10,399,597 |
| | | | $ 45,499,399 |
| Engineering & Construction — 0.8% |
| Aegion Corp., Term Loan, 9.566%, (SOFR + 4.25%), 5/17/28 | | 15,687 | $ 15,792,575 |
| American Residential Services LLC, Term Loan, 9.071%, (SOFR + 3.50%), 10/15/27 | | 495 | 495,456 |
| APi Group DE, Inc., Term Loan, 7.93%, (SOFR + 2.50%), 1/3/29 | | 10,603 | 10,637,943 |
| Artera Services LLC, Term Loan, 9.809%, (SOFR + 4.50%), 2/15/31 | | 4,150 | 4,190,462 |
| Northstar Group Services, Inc.: | | | |
| Term Loan, 10.93%, (SOFR + 5.50%), 11/12/26 | | 10,598 | 10,635,173 |
| Term Loan, 10.93%, (SOFR + 5.50%), 11/12/26 | | 1,925 | 1,922,594 |
| | | | $ 43,674,203 |
| Entertainment — 0.9% |
| City Football Group Ltd., Term Loan, 8.439%, (SOFR + 3.00%), 7/21/28 | | 8,186 | $ 8,182,730 |
| Crown Finance U.S., Inc., Term Loan, 13.93%, (SOFR + 8.50%), 6.93% cash, 7.00% PIK, 7/31/28 | | 1,842 | 1,875,585 |
28
See Notes to Financial Statements.
Eaton Vance
Floating Rate Portfolio
April 30, 2024
Portfolio of Investments (Unaudited) — continued
| Borrower/Description | Principal
Amount*
(000's omitted) | Value |
| Entertainment (continued) |
| Delta 2 (LUX) SARL, Term Loan, 7.559%, (SOFR + 2.25%), 1/15/30 | | 2,500 | $ 2,505,730 |
| Live Nation Entertainment, Inc., Term Loan, 7.165%, (SOFR + 1.75%), 10/19/26 | | 5,542 | 5,544,153 |
| Playtika Holding Corp., Term Loan, 8.18%, (SOFR + 2.75%), 3/13/28 | | 13,458 | 13,466,007 |
| Renaissance Holding Corp., Term Loan, 9.566%, (SOFR + 4.25%), 4/5/30 | | 10,970 | 10,997,369 |
| UFC Holdings LLC, Term Loan, 8.336%, (SOFR + 2.75%), 4/29/26 | | 7,161 | 7,183,516 |
| Vue Entertainment International Ltd., Term Loan, 12.428%, (6 mo. EURIBOR + 8.50%), 4.028% cash, 8.40% PIK, 12/31/27 | EUR | 1,592 | 998,184 |
| Vue International Bidco PLC, Term Loan, 11.844%, (6 mo. EURIBOR + 8.00%), 6/30/27 | EUR | 435 | 463,846 |
| | | | $ 51,217,120 |
| Equity Real Estate Investment Trusts (REITs) — 0.2% |
| Iron Mountain, Inc.: | | | |
| Term Loan, 7.18%, (1 mo. USD LIBOR + 1.75%), 1/2/26 | | 3,615 | $ 3,613,180 |
| Term Loan, 7.566%, (SOFR + 2.25%), 1/31/31 | | 10,199 | 10,190,941 |
| | | | $ 13,804,121 |
| Financial Services — 1.2% |
| Ditech Holding Corp., Term Loan, 0.00%, 6/30/24(12) | | 18,244 | $ 2,006,820 |
| GTCR W Merger Sub LLC, Term Loan, 8.309%, (SOFR + 3.00%), 1/31/31 | | 30,700 | 30,858,289 |
| NCR Atleos LLC, Term Loan, 10.18%, (SOFR + 4.75%), 3/27/29(11) | | 13,652 | 13,765,103 |
| Nuvei Technologies Corp., Term Loan, 8.416%, (SOFR + 3.00%), 12/19/30 | | 8,279 | 8,303,053 |
| Walker & Dunlop, Inc., Term Loan, 7.666%, (SOFR + 2.25%), 12/16/28 | | 12,756 | 12,804,211 |
| WEX, Inc., Term Loan, 7.316%, (SOFR + 2.00%), 3/31/28 | | 1,261 | 1,264,766 |
| | | | $ 69,002,242 |
| Food Products — 0.9% |
| 8th Avenue Food & Provisions, Inc., Term Loan, 10.18%, (SOFR + 4.75%), 10/1/25 | | 6,508 | $ 6,296,611 |
| Badger Buyer Corp., Term Loan, 8.93%, (SOFR + 3.50%), 9/30/24 | | 4,750 | 4,603,372 |
| Del Monte Foods, Inc., Term Loan, 9.668%, (SOFR + 4.25%), 5/16/29 | | 6,230 | 5,326,757 |
| Borrower/Description | Principal
Amount*
(000's omitted) | Value |
| Food Products (continued) |
| Froneri International Ltd.: | | | |
| Term Loan, 5.991%, (6 mo. EURIBOR + 2.13%), 1/29/27 | EUR | 1,500 | $ 1,596,999 |
| Term Loan, 7.666%, (SOFR + 2.25%), 1/29/27 | | 4,667 | 4,677,408 |
| Nomad Foods U.S. LLC, Term Loan, 8.272%, (SOFR + 3.00%), 11/13/29 | | 7,953 | 7,979,620 |
| United Petfood Group BV, Term Loan, 6.583%, (6 mo. EURIBOR + 2.75%), 4/24/28 | EUR | 8,400 | 8,933,665 |
| Valeo F1 Co. Ltd. (Ireland): | | | |
| Term Loan, 7.858%, (6 mo. EURIBOR + 4.00%), 9/29/28 | EUR | 5,050 | 5,285,908 |
| Term Loan, 10.191%, (SONIA + 5.00%), 6/28/28 | GBP | 2,500 | 3,026,254 |
| | | | $ 47,726,594 |
| Gas Utilities — 0.4% |
| CQP Holdco LP, Term Loan, 8.302%, (SOFR + 3.00%), 12/31/30 | | 20,020 | $ 20,098,689 |
| | | | $ 20,098,689 |
| Health Care Equipment & Supplies — 0.7% |
| Bayou Intermediate II LLC, Term Loan, 10.091%, (SOFR + 4.50%), 8/2/28 | | 8,977 | $ 8,943,588 |
| Journey Personal Care Corp., Term Loan, 9.68%, (SOFR + 4.25%), 3/1/28 | | 21,148 | 21,052,255 |
| Medline Borrower LP, Term Loan, 8.068%, (SOFR + 2.75%), 10/23/28 | | 7,806 | 7,835,288 |
| | | | $ 37,831,131 |
| Health Care Providers & Services — 4.2% |
| AEA International Holdings (Lux) SARL, Term Loan, 8.809%, (SOFR + 3.50%), 9/7/28 | | 13,612 | $ 13,680,137 |
| BW NHHC Holdco, Inc., Term Loan - Second Lien, 13.302%, (SOFR + 8.00%), 1/15/26 | | 17,497 | 15,135,107 |
| Cano Health LLC: | | | |
| DIP Loan, 16.322%, (SOFR + 11.00%), 10/7/24 | | 534 | 550,319 |
| DIP Loan, 16.322%, (SOFR + 11.00%), 10/7/24 | | 819 | 843,554 |
| Term Loan, 0.00%, 11/23/27(12) | | 7,208 | 1,946,242 |
| CCRR Parent, Inc., Term Loan, 9.18%, (SOFR + 3.75%), 3/6/28 | | 4,685 | 4,348,042 |
| Cerba Healthcare SAS: | | | |
| Term Loan, 7.548%, (1 mo. EURIBOR + 3.70%), 6/30/28 | EUR | 18,925 | 17,432,337 |
| Term Loan, 7.848%, (1 mo. EURIBOR + 4.00%), 2/16/29 | EUR | 8,225 | 7,628,940 |
| CHG Healthcare Services, Inc., Term Loan, 9.091%, (SOFR + 3.75%), 9/29/28(11) | | 4,190 | 4,213,590 |
| Covis Finco SARL, Term Loan, 0.00%, 2/18/27(12) | | 9,853 | 4,113,653 |
29
See Notes to Financial Statements.
Eaton Vance
Floating Rate Portfolio
April 30, 2024
Portfolio of Investments (Unaudited) — continued
| Borrower/Description | Principal
Amount*
(000's omitted) | Value |
| Health Care Providers & Services (continued) |
| Elsan SAS, Term Loan, 7.186%, (1 mo. EURIBOR + 3.35%), 6/16/28 | EUR | 4,100 | $ 4,348,447 |
| Ensemble RCM LLC, Term Loan, 8.33%, (SOFR + 3.00%), 8/1/29 | | 4,031 | 4,048,066 |
| IVC Acquisition Ltd.: | | | |
| Term Loan, 9.071%, (3 mo. EURIBOR + 5.00%), 12/12/28 | EUR | 4,100 | 4,350,227 |
| Term Loan, 10.809%, (SOFR + 5.50%), 12/12/28 | | 10,574 | 10,616,450 |
| Medical Solutions Holdings, Inc.: | | | |
| Term Loan, 8.666%, (SOFR + 3.25%), 11/1/28 | | 13,675 | 12,156,617 |
| Term Loan - Second Lien, 12.416%, (SOFR + 7.00%), 11/1/29 | | 9,500 | 7,671,250 |
| Mehilainen Yhtiot OYJ, Term Loan, 7.88%, (3 mo. EURIBOR + 4.00%), 8/8/25 | EUR | 6,025 | 6,466,778 |
| Midwest Physician Administrative Services LLC, Term Loan, 8.821%, (SOFR + 3.25%), 3/12/28 | | 1,402 | 1,100,517 |
| National Mentor Holdings, Inc.: | | | |
| Term Loan, 9.159%, (SOFR + 3.75%), 3/2/28 | | 334 | 305,145 |
| Term Loan, 9.165%, (SOFR + 3.75%), 3/2/28(11) | | 12,189 | 11,145,026 |
| Term Loan - Second Lien, 12.659%, (SOFR + 7.25%), 3/2/29 | | 5,525 | 4,901,134 |
| Pacific Dental Services LLC, Term Loan, 8.571%, (SOFR + 3.25%), 3/15/31 | | 8,300 | 8,329,830 |
| Phoenix Guarantor, Inc., Term Loan, 8.566%, (SOFR + 3.25%), 2/21/31 | | 16,690 | 16,585,687 |
| R1 RCM, Inc., Term Loan, 8.327%, (SOFR + 3.00%), 6/21/29 | | 2,294 | 2,306,222 |
| Radnet Management, Inc., Term Loan, 7.823%, (SOFR + 2.50%), 4/18/31 | | 7,025 | 7,033,781 |
| Ramsay Generale de Sante SA, Term Loan, 6.847%, (3 mo. EURIBOR + 2.95%), 4/22/27 | EUR | 6,600 | 7,051,229 |
| Select Medical Corp., Term Loan, 8.316%, (SOFR + 3.00%), 3/6/27 | | 35,546 | 35,664,163 |
| Sound Inpatient Physicians: | | | |
| Term Loan, 8.591%, (SOFR + 3.00%), 6/27/25 | | 197 | 114,675 |
| Term Loan, 8.591%, (SOFR + 3.00%), 6/27/25 | | 2,310 | 1,345,393 |
| Synlab Bondco PLC: | | | |
| Term Loan, 6.361%, (6 mo. EURIBOR + 2.50%), 7/1/27 | EUR | 2,125 | 2,257,029 |
| Term Loan, 12/23/30(10) | EUR | 5,250 | 5,623,847 |
| TTF Holdings LLC, Term Loan, 9.43%, (SOFR + 4.00%), 3/31/28 | | 5,083 | 5,097,419 |
| U.S. Anesthesia Partners, Inc., Term Loan, 9.692%, (SOFR + 4.25%), 10/1/28 | | 4,992 | 4,842,379 |
| | | | $ 233,253,232 |
| Borrower/Description | Principal
Amount*
(000's omitted) | Value |
| Health Care Technology — 1.2% |
| Certara LP, Term Loan, 9.105%, (SOFR + 3.50%), 8/15/26 | | 1,799 | $ 1,805,310 |
| Cotiviti Corp., Term Loan, 2/21/31(10) | | 9,600 | 9,628,003 |
| Imprivata, Inc., Term Loan, 9.091%, (SOFR + 3.50%), 12/1/27 | | 14,389 | 14,476,664 |
| MedAssets Software Intermediate Holdings, Inc.: | | | |
| Term Loan, 9.424%, (SOFR + 4.00%), 12/18/28 | | 7,597 | 6,433,969 |
| Term Loan - Second Lien, 12.18%, (SOFR + 6.75%), 12/17/29 | | 8,775 | 6,087,656 |
| Project Ruby Ultimate Parent Corp., Term Loan, 8.93%, (SOFR + 3.50%), 3/10/28 | | 3,475 | 3,484,410 |
| Symplr Software, Inc., Term Loan, 9.93%, (SOFR + 4.50%), 12/22/27 | | 12,861 | 12,244,519 |
| Verscend Holding Corp., Term Loan, 11.50%, (U.S. (Fed) Prime Rate + 3.00%), 8/27/25 | | 9,898 | 9,905,949 |
| Waystar Technologies, Inc., Term Loan, 9.316%, (SOFR + 4.00%), 10/22/29 | | 3,275 | 3,297,516 |
| | | | $ 67,363,996 |
| Hotels, Restaurants & Leisure — 4.6% |
| 1011778 BC Unlimited Liability Co., Term Loan, 7.566%, (SOFR + 2.25%), 9/20/30 | | 32,485 | $ 32,545,436 |
| Caesars Entertainment, Inc., Term Loan, 8.066%, (SOFR + 2.75%), 2/6/31 | | 22,475 | 22,538,200 |
| Carnival Corp., Term Loan, 8.067%, (SOFR + 2.75%), 10/18/28 | | 26,623 | 26,739,282 |
| ClubCorp Holdings, Inc., Term Loan, 10.564%, (SOFR + 5.00%), 9/18/26 | | 20,104 | 20,170,932 |
| Fertitta Entertainment LLC, Term Loan, 9.069%, (SOFR + 3.75%), 1/27/29 | | 19,750 | 19,822,455 |
| Flutter Financing BV, Term Loan, 7.559%, (SOFR + 2.25%), 11/25/30 | | 31,671 | 31,769,596 |
| GVC Holdings (Gibraltar) Ltd., Term Loan, 7.652%, (3 mo. EURIBOR + 3.75%), 6/30/28 | EUR | 21,225 | 22,738,630 |
| Light & Wonder International, Inc., Term Loan, 8.071%, (SOFR + 2.75%), 4/14/29 | | 7,388 | 7,409,663 |
| Ontario Gaming GTA LP, Term Loan, 9.559%, (SOFR + 4.25%), 8/1/30 | | 14,888 | 14,986,318 |
| Oravel Stays Singapore Pte. Ltd., Term Loan, 13.84%, (SOFR + 8.25%), 6/23/26 | | 3,457 | 3,459,414 |
| Playa Resorts Holding BV, Term Loan, 8.565%, (SOFR + 3.25%), 1/5/29 | | 26,835 | 26,978,877 |
| SeaWorld Parks & Entertainment, Inc., Term Loan, 7.816%, (SOFR + 2.50%), 8/25/28 | | 19,348 | 19,367,566 |
| Station Casinos LLC, Term Loan, 7.566%, (SOFR + 2.25%), 3/14/31 | | 4,400 | 4,405,196 |
| | | | $ 252,931,565 |
30
See Notes to Financial Statements.
Eaton Vance
Floating Rate Portfolio
April 30, 2024
Portfolio of Investments (Unaudited) — continued
| Borrower/Description | Principal
Amount*
(000's omitted) | Value |
| Household Durables — 1.1% |
| ACProducts, Inc., Term Loan, 9.814%, (SOFR + 4.25%), 5/17/28 | | 18,477 | $ 16,067,719 |
| Libbey Glass, Inc., Term Loan, 11.975%, (SOFR + 6.50%), 11/22/27 | | 14,169 | 13,663,820 |
| Serta Simmons Bedding LLC: | | | |
| Term Loan, 12.924%, (SOFR + 7.50%), 6/29/28 | | 19,908 | 17,538,512 |
| Term Loan, 6/29/28(10) | | 2,161 | 2,123,407 |
| Solis IV BV, Term Loan, 8.824%, (SOFR + 3.50%), 2/26/29 | | 13,648 | 13,582,579 |
| | | | $ 62,976,037 |
| Household Products — 0.3% |
| Energizer Holdings, Inc., Term Loan, 7.68%, (SOFR + 2.25%), 12/22/27 | | 5,385 | $ 5,389,234 |
| Kronos Acquisition Holdings, Inc.: | | | |
| Term Loan, 9.314%, (SOFR + 3.75%), 12/22/26 | | 7,945 | 7,960,531 |
| Term Loan, 11.493%, (SOFR + 6.00%), 12/22/26 | | 5,034 | 5,059,296 |
| | | | $ 18,409,061 |
| Independent Power and Renewable Electricity Producers — 0.1% |
| Calpine Corp.: | | | |
| Term Loan, 7.316%, (SOFR + 2.00%), 1/31/31 | | 2,625 | $ 2,625,546 |
| Term Loan, 7.317%, (SOFR + 2.00%), 1/31/31 | | 2,295 | 2,295,180 |
| | | | $ 4,920,726 |
| Industrial Conglomerates — 0.8% |
| Ammeraal Beltech Holding BV, Term Loan, 8.902%, (3 mo. EURIBOR + 5.00%), 12/30/28 | EUR | 8,225 | $ 8,838,677 |
| Kohler Energy Co. LLC, Term Loan, 1/30/31(10) | | 22,475 | 22,552,269 |
| Rain Carbon GmbH, Term Loan, 8.915%, (3 mo. EURIBOR + 5.00%), 10/31/28 | EUR | 13,729 | 14,523,177 |
| | | | $ 45,914,123 |
| Insurance — 1.2% |
| Alliant Holdings Intermediate LLC, Term Loan, 8.819%, (SOFR + 3.50%), 11/6/30 | | 13,833 | $ 13,903,079 |
| AmWINS Group, Inc., Term Loan, 8.18%, (SOFR + 2.75%), 2/19/28 | | 4,962 | 4,979,759 |
| AssuredPartners, Inc., Term Loan, 2/14/31(10) | | 14,575 | 14,646,053 |
| Financiere CEP SAS, Term Loan, 7.885%, (6 mo. EURIBOR + 4.00%), 6/18/27 | EUR | 5,125 | 5,485,067 |
| HUB International Ltd., Term Loan, 8.575%, (SOFR + 3.25%), 6/20/30 | | 19,660 | 19,778,940 |
| Borrower/Description | Principal
Amount*
(000's omitted) | Value |
| Insurance (continued) |
| Truist Insurance Holdings LLC, Term Loan - Second Lien, 3/8/32(10) | | 2,500 | $ 2,522,812 |
| USI, Inc., Term Loan, 8.552%, (SOFR + 3.25%), 9/27/30 | | 4,478 | 4,495,688 |
| | | | $ 65,811,398 |
| Interactive Media & Services — 0.7% |
| Adevinta ASA: | | | |
| Term Loan, 6.348%, (1 mo. EURIBOR + 2.50%), 6/26/28 | EUR | 4,800 | $ 5,134,237 |
| Term Loan, 8.332%, (SOFR + 2.75%), 6/26/28 | | 893 | 895,715 |
| Buzz Finco LLC: | | | |
| Term Loan, 8.166%, (SOFR + 2.75%), 1/29/27 | | 1,951 | 1,957,925 |
| Term Loan, 8.666%, (SOFR + 3.25%), 1/29/27 | | 435 | 437,232 |
| Foundational Education Group, Inc., Term Loan, 9.341%, (SOFR + 3.75%), 8/31/28 | | 5,110 | 5,077,896 |
| Getty Images, Inc.: | | | |
| Term Loan, 8.875%, (1 mo. EURIBOR + 5.00%), 2/19/26 | EUR | 2,224 | 2,383,571 |
| Term Loan, 9.909%, (SOFR + 4.50%), 2/19/26 | | 13,835 | 13,869,602 |
| Match Group, Inc., Term Loan, 7.233%, (SOFR + 1.75%), 2/13/27 | | 6,450 | 6,444,627 |
| | | | $ 36,200,805 |
| IT Services — 3.7% |
| Asurion LLC: | | | |
| Term Loan, 9.416%, (SOFR + 4.00%), 8/19/28 | | 9,013 | $ 8,777,741 |
| Term Loan, 9.666%, (SOFR + 4.25%), 8/19/28 | | 7,064 | 6,908,336 |
| Term Loan - Second Lien, 10.68%, (SOFR + 5.25%), 1/31/28 | | 15,790 | 14,439,387 |
| Term Loan - Second Lien, 10.68%, (SOFR + 5.25%), 1/20/29 | | 2,375 | 2,147,705 |
| Endure Digital, Inc., Term Loan, 8.939%, (SOFR + 3.50%), 2/10/28 | | 29,622 | 28,765,310 |
| Gainwell Acquisition Corp., Term Loan, 9.409%, (SOFR + 4.00%), 10/1/27 | | 3,567 | 3,412,183 |
| Go Daddy Operating Co. LLC, Term Loan, 7.316%, (SOFR + 2.00%), 11/9/29 | | 46,225 | 46,280,942 |
| Informatica LLC, Term Loan, 8.18%, (SOFR + 2.75%), 10/27/28 | | 31,434 | 31,527,800 |
| NAB Holdings LLC, Term Loan, 8.209%, (SOFR + 2.75%), 11/23/28 | | 14,279 | 14,285,107 |
| Rackspace Technology Global, Inc.: | | | |
| Term Loan, 11.552%, (SOFR + 6.25%), 5/15/28 | | 9,976 | 10,075,383 |
| Term Loan - Second Lien, 8.186%, (SOFR + 2.75%), 5/15/28 | | 25,942 | 12,452,022 |
| Sedgwick Claims Management Services, Inc., Term Loan, 9.066%, (SOFR + 3.75%), 2/24/28 | | 12,853 | 12,916,895 |
31
See Notes to Financial Statements.
Eaton Vance
Floating Rate Portfolio
April 30, 2024
Portfolio of Investments (Unaudited) — continued
| Borrower/Description | Principal
Amount*
(000's omitted) | Value |
| IT Services (continued) |
| team.blue Finco SARL: | | | |
| Term Loan, 7.062%, (1 mo. EURIBOR + 3.20%), 3/30/28 | EUR | 11,150 | $ 11,798,880 |
| Term Loan, 3/30/28(10) | EUR | 1,500 | 1,587,293 |
| | | | $ 205,374,984 |
| Leisure Products — 0.3% |
| Fender Musical Instruments Corp., Term Loan, 9.418%, (SOFR + 4.00%), 12/1/28 | | 2,251 | $ 2,234,515 |
| Hayward Industries, Inc., Term Loan, 8.18%, (SOFR + 2.75%), 5/30/28 | | 9,008 | 9,020,683 |
| Recess Holdings, Inc., Term Loan, 9.843%, (SOFR + 4.50%), 2/20/30 | | 7,525 | 7,553,219 |
| | | | $ 18,808,417 |
| Life Sciences Tools & Services — 1.6% |
| Avantor Funding, Inc., Term Loan, 6.348%, (1 mo. EURIBOR + 2.50%), 6/12/28 | EUR | 10,855 | $ 11,623,789 |
| Cambrex Corp., Term Loan, 8.916%, (SOFR + 3.50%), 12/4/26 | | 324 | 313,020 |
| Catalent Pharma Solutions, Inc.: | | | |
| Term Loan, 7.43%, (SOFR + 2.00%), 2/22/28 | | 1,019 | 1,018,818 |
| Term Loan, 8.315%, (SOFR + 3.00%), 2/22/28 | | 2,650 | 2,664,906 |
| Curia Global, Inc., Term Loan, 9.18%, (SOFR + 3.75%), 8/30/26(11) | | 17,179 | 16,361,297 |
| ICON Luxembourg SARL, Term Loan, 7.309%, (SOFR + 2.00%), 7/3/28 | | 24,178 | 24,289,536 |
| LGC Group Holdings Ltd., Term Loan, 7.098%, (1 mo. EURIBOR + 3.25%), 4/21/27 | EUR | 5,775 | 6,101,970 |
| Loire Finco Luxembourg SARL, Term Loan, 8.916%, (SOFR + 3.50%), 4/21/27 | | 1,117 | 1,098,179 |
| Packaging Coordinators Midco, Inc., Term Loan, 9.071%, (SOFR + 3.50%), 11/30/27 | | 3,416 | 3,431,408 |
| PRA Health Sciences, Inc., Term Loan, 7.309%, (SOFR + 2.00%), 7/3/28 | | 6,024 | 6,051,882 |
| Sotera Health Holdings LLC, Term Loan, 8.18%, (SOFR + 2.75%), 12/11/26 | | 14,828 | 14,823,514 |
| | | | $ 87,778,319 |
| Machinery — 4.8% |
| AI Aqua Merger Sub, Inc., Term Loan, 9.324%, (SOFR + 4.00%), 7/31/28 | | 21,873 | $ 21,965,530 |
| Ali Group North America Corp., Term Loan, 7.43%, (SOFR + 2.00%), 7/30/29 | | 11,951 | 12,006,198 |
| American Trailer World Corp., Term Loan, 9.166%, (SOFR + 3.75%), 3/3/28 | | 13,302 | 13,061,302 |
| Borrower/Description | Principal
Amount*
(000's omitted) | Value |
| Machinery (continued) |
| Apex Tool Group LLC: | | | |
| Term Loan, 15.315%, (SOFR + 10.00%), 2/8/30 | | 11,409 | $ 11,066,370 |
| Term Loan - Second Lien, 12.566%, (SOFR + 7.25%), 8.566% cash, 4.00% PIK, 2/8/29 | | 4,889 | 4,840,518 |
| Barnes Group, Inc., Term Loan, 7.816%, (SOFR + 2.50%), 9/3/30 | | 17,288 | 17,345,746 |
| Clark Equipment Co., Term Loan, 7.902%, (SOFR + 2.50%), 4/20/29 | | 10,003 | 10,047,059 |
| Conair Holdings LLC, Term Loan, 9.18%, (SOFR + 3.75%), 5/17/28 | | 24,083 | 23,929,841 |
| CPM Holdings, Inc., Term Loan, 9.827%, (SOFR + 4.50%), 9/28/28 | | 3,990 | 4,005,318 |
| Delachaux Group SA, Term Loan, 8.115%, (3 mo. EURIBOR + 4.25%), 4/16/29 | EUR | 6,257 | 6,732,717 |
| EMRLD Borrower LP, Term Loan, 7.816%, (SOFR + 2.50%), 5/31/30 | | 7,511 | 7,533,255 |
| Engineered Machinery Holdings, Inc.: | | | |
| Term Loan, 7.652%, (3 mo. EURIBOR + 3.75%), 5/21/28 | EUR | 10,603 | 11,329,805 |
| Term Loan, 9.321%, (SOFR + 3.75%), 5/19/28 | | 12,941 | 12,960,346 |
| Term Loan - Second Lien, 11.571%, (SOFR + 6.00%), 5/21/29 | | 2,000 | 1,997,500 |
| Filtration Group Corp., Term Loan, 9.68%, (SOFR + 4.25%), 10/21/28 | | 8,927 | 8,981,654 |
| Icebox Holdco III, Inc., Term Loan, 9.321%, (SOFR + 3.75%), 12/22/28 | | 4,127 | 4,124,206 |
| INNIO Group Holding GmbH, Term Loan, 8.173%, (3 mo. EURIBOR + 4.25%), 11/2/28 | EUR | 4,722 | 5,074,804 |
| Madison IAQ LLC, Term Loan, 8.68%, (SOFR + 3.25%), 6/21/28 | | 11,522 | 11,537,009 |
| Pro Mach Group, Inc., Term Loan, 9.066%, (SOFR + 3.75%), 8/31/28 | | 2,791 | 2,806,095 |
| Roper Industrial Products Investment Co. LLC: | | | |
| Term Loan, 8.402%, (3 mo. EURIBOR + 4.50%), 11/22/29 | EUR | 990 | 1,064,920 |
| Term Loan, 9.302%, (SOFR + 4.00%), 11/22/29 | | 6,399 | 6,451,565 |
| SPX Flow, Inc., Term Loan, 9.916%, (SOFR + 4.50%), 4/5/29 | | 12,331 | 12,414,319 |
| Titan Acquisition Ltd., Term Loan, 10.317%, (SOFR + 5.00%), 2/1/29 | | 8,275 | 8,326,719 |
| TK Elevator Midco GmbH, Term Loan, 7.926%, (3 mo. EURIBOR + 4.00%), 4/30/30 | EUR | 8,550 | 9,166,766 |
| TK Elevator Topco GmbH, Term Loan, 7.491%, (6 mo. EURIBOR + 3.63%), 7/30/27 | EUR | 9,725 | 10,387,897 |
| TK Elevator U.S. Newco, Inc., Term Loan, 8.791%, (SOFR + 3.50%), 4/30/30 | | 12,980 | 13,039,487 |
| Zephyr German BidCo GmbH, Term Loan, 7.446%, (6 mo. EURIBOR + 3.60%), 3/10/28 | EUR | 11,775 | 12,433,637 |
| | | | $ 264,630,583 |
32
See Notes to Financial Statements.
Eaton Vance
Floating Rate Portfolio
April 30, 2024
Portfolio of Investments (Unaudited) — continued
| Borrower/Description | Principal
Amount*
(000's omitted) | Value |
| Media — 0.7% |
| Aragorn Parent Corp., Term Loan, 9.569%, (SOFR + 4.25%), 12/15/28 | | 5,660 | $ 5,702,342 |
| Gray Television, Inc., Term Loan, 8.442%, (SOFR + 3.00%), 12/1/28 | | 1,019 | 960,573 |
| Hubbard Radio LLC, Term Loan, 9.816%, (SOFR + 4.50%), 3/28/25 | | 5,146 | 4,258,459 |
| iHeartCommunications, Inc., Term Loan, 8.43%, (SOFR + 3.00%), 5/1/26 | | 2,365 | 2,073,380 |
| Sinclair Television Group, Inc., Term Loan, 8.091%, (SOFR + 2.50%), 9/30/26 | | 6,134 | 5,728,691 |
| Univision Communications, Inc., Term Loan, 8.68%, (SOFR + 3.25%), 3/15/26 | | 18,095 | 18,127,197 |
| | | | $ 36,850,642 |
| Metals/Mining — 1.1% |
| Arsenal AIC Parent LLC, Term Loan, 9.066%, (SOFR + 3.75%), 8/18/30 | | 17,761 | $ 17,916,269 |
| Dynacast International LLC: | | | |
| Term Loan, 9.943%, (SOFR + 4.50%), 7/22/25 | | 15,104 | 14,493,104 |
| Term Loan, 14.443%, (SOFR + 9.00%), 10/22/25 | | 3,018 | 2,248,592 |
| PMHC II, Inc., Term Loan, 9.706%, (SOFR + 4.25%), 4/23/29 | | 16,232 | 16,022,459 |
| WireCo WorldGroup, Inc., Term Loan, 9.075%, (SOFR + 3.75%), 11/13/28 | | 5,785 | 5,814,283 |
| Zekelman Industries, Inc., Term Loan, 7.568%, (SOFR + 2.25%), 1/24/31 | | 5,317 | 5,332,328 |
| | | | $ 61,827,035 |
| Oil, Gas & Consumable Fuels — 1.1% |
| Freeport LNG Investments LLP, Term Loan, 12/21/28(10) | | 11,500 | $ 11,451,125 |
| GIP II Blue Holding LP, Term Loan, 9.066%, (SOFR + 3.75%), 9/29/28 | | 7,736 | 7,786,597 |
| ITT Holdings LLC, Term Loan, 8.421%, (SOFR + 3.00%), 10/11/30 | | 8,532 | 8,549,897 |
| Matador Bidco SARL, Term Loan, 9.916%, (SOFR + 4.50%), 10/15/26 | | 29,032 | 29,125,798 |
| Oxbow Carbon LLC, Term Loan, 9.413%, (SOFR + 4.00%), 5/10/30(11) | | 5,632 | 5,660,600 |
| | | | $ 62,574,017 |
| Pharmaceuticals — 1.4% |
| Aenova Holding GmbH, Term Loan, 8.328%, (1 mo. EURIBOR + 4.50%), 3/6/26 | EUR | 925 | $ 990,760 |
| AI Sirona (Luxembourg) Acquisition SARL, Term Loan, 7.848%, (3 mo. EURIBOR + 4.00%), 9/30/28 | EUR | 13,000 | 13,906,557 |
| Borrower/Description | Principal
Amount*
(000's omitted) | Value |
| Pharmaceuticals (continued) |
| Bausch Health Cos., Inc., Term Loan, 10.668%, (SOFR + 5.25%), 2/1/27 | | 12,231 | $ 10,309,188 |
| Ceva Sante Animale: | | | |
| Term Loan, 8.152%, (3 mo. EURIBOR + 4.25%), 11/8/30 | EUR | 10,300 | 11,066,154 |
| Term Loan, 9.564%, (SOFR + 4.25%), 11/1/30 | | 4,175 | 4,207,615 |
| Jazz Financing Lux SARL, Term Loan, 8.43%, (SOFR + 3.00%), 5/5/28 | | 6,956 | 7,004,478 |
| Mallinckrodt International Finance SA: | | | |
| Term Loan, 12.819%, (SOFR + 7.50%), 11/14/28 | | 3,434 | 3,846,213 |
| Term Loan - Second Lien, 14.819%, (SOFR + 9.50%), 11/14/28 | | 19,462 | 21,294,455 |
| PharmaZell GmbH, Term Loan, 7.902%, (3 mo. EURIBOR + 4.00%), 5/12/27 | EUR | 1,800 | 1,907,355 |
| Recipharm AB, Term Loan, 6.865%, (3 mo. EURIBOR + 2.95%), 2/17/28 | EUR | 2,725 | 2,856,842 |
| | | | $ 77,389,617 |
| Professional Services — 3.2% |
| APFS Staffing Holdings, Inc., Term Loan, 9.316%, (SOFR + 4.00%), 12/29/28 | | 3,590 | $ 3,578,971 |
| Apleona Holding GmbH, Term Loan, 6.564%, (3 mo. EURIBOR + 2.70%), 4/28/28 | EUR | 7,525 | 7,951,815 |
| CoreLogic, Inc.: | | | |
| Term Loan, 8.93%, (SOFR + 3.50%), 6/2/28 | | 14,027 | 13,583,067 |
| Term Loan - Second Lien, 11.93%, (SOFR + 6.50%), 6/4/29 | | 1,200 | 1,090,500 |
| Corporation Service Co., Term Loan, 8.066%, (SOFR + 2.75%), 11/2/29 | | 3,970 | 3,984,557 |
| Crisis Prevention Institute, Inc., Term Loan, 10.043%, (SOFR + 4.75%), 4/9/31 | | 3,025 | 3,042,016 |
| EAB Global, Inc., Term Loan, 8.93%, (SOFR + 3.50%), 8/16/28 | | 14,320 | 14,370,239 |
| Employbridge Holding Co., Term Loan, 10.314%, (SOFR + 4.75%), 7/19/28 | | 20,495 | 16,671,907 |
| First Advantage Holdings LLC, Term Loan, 8.18%, (SOFR + 2.75%), 1/31/27 | | 5,857 | 5,865,952 |
| Fleet Midco I Ltd., Term Loan, 8.566%, (SOFR + 3.25%), 2/21/31 | | 7,225 | 7,261,125 |
| Genuine Financial Holdings LLC, Term Loan, 9.316%, (SOFR + 4.00%), 9/27/30 | | 4,080 | 4,073,764 |
| Neptune Bidco U.S., Inc., Term Loan, 10.406%, (SOFR + 5.00%), 4/11/29 | | 7,970 | 7,505,444 |
| Rockwood Service Corp., Term Loan, 9.68%, (SOFR + 4.25%), 1/23/27 | | 9,205 | 9,275,720 |
| Techem Verwaltungsgesellschaft 675 mbH, Term Loan, 7/15/29(10) | EUR | 15,075 | 16,110,169 |
33
See Notes to Financial Statements.
Eaton Vance
Floating Rate Portfolio
April 30, 2024
Portfolio of Investments (Unaudited) — continued
| Borrower/Description | Principal
Amount*
(000's omitted) | Value |
| Professional Services (continued) |
| Teneo Holdings LLC, Term Loan, 10.066%, (SOFR + 4.75%), 3/13/31 | | 10,250 | $ 10,341,819 |
| Trans Union LLC, Term Loan, 7.316%, (SOFR + 2.00%), 12/1/28 | | 31,546 | 31,626,528 |
| Vaco Holdings LLC, Term Loan, 10.434%, (SOFR + 5.00%), 1/21/29 | | 9,089 | 9,040,736 |
| Wood Mackenzie Ltd., Term Loan, 8.814%, (SOFR + 3.50%), 2/7/31 | | 11,675 | 11,741,396 |
| | | | $ 177,115,725 |
| Real Estate Management & Development — 0.8% |
| Cushman & Wakefield U.S. Borrower LLC: | | | |
| Term Loan, 8.18%, (SOFR + 2.75%), 8/21/25 | | 543 | $ 543,643 |
| Term Loan, 8.666%, (SOFR + 3.25%), 1/31/30 | | 6,628 | 6,644,218 |
| Term Loan, 9.066%, (SOFR + 3.75%), 1/31/30 | | 6,360 | 6,383,611 |
| Greystar Real Estate Partners LLC, Term Loan, 8.576%, (SOFR + 3.25%), 8/21/30 | | 7,964 | 7,994,155 |
| Homeserve USA Holding Corp., Term Loan, 8.319%, (SOFR + 3.00%), 10/21/30 | | 9,500 | 9,541,562 |
| RE/MAX International, Inc., Term Loan, 7.93%, (SOFR + 2.50%), 7/21/28 | | 16,168 | 15,304,856 |
| | | | $ 46,412,045 |
| Road & Rail — 1.9% |
| Avis Budget Car Rental LLC: | | | |
| Term Loan, 7.18%, (SOFR + 1.75%), 8/6/27 | | 30,084 | $ 29,896,424 |
| Term Loan, 8.416%, (SOFR + 3.00%), 3/16/29 | | 2,986 | 2,979,975 |
| Hertz Corp.: | | | |
| Term Loan, 8.68%, (SOFR + 3.25%), 6/30/28 | | 17,019 | 15,737,905 |
| Term Loan, 8.68%, (SOFR + 3.25%), 6/30/28 | | 3,298 | 3,054,808 |
| Term Loan, 9.065%, (SOFR + 3.75%), 6/30/28 | | 7,531 | 6,950,603 |
| Uber Technologies, Inc., Term Loan, 8.079%, (SOFR + 2.75%), 3/3/30 | | 46,208 | 46,549,519 |
| | | | $ 105,169,234 |
| Semiconductors & Semiconductor Equipment — 0.7% |
| Altar Bidco, Inc.: | | | |
| Term Loan, 7.947%, (SOFR + 3.10%), 2/1/29 | | 6,315 | $ 6,320,334 |
| Term Loan - Second Lien, 10.914%, (SOFR + 5.60%), 2/1/30 | | 6,650 | 6,594,586 |
| Bright Bidco BV, Term Loan, 14.33%, (SOFR + 9.00%), 6.33% cash, 8.00% PIK, 10/31/27 | | 3,814 | 1,153,602 |
| MaxLinear, Inc., Term Loan, 7.68%, (SOFR + 2.25%), 6/23/28 | | 2,955 | 2,940,580 |
| Borrower/Description | Principal
Amount*
(000's omitted) | Value |
| Semiconductors & Semiconductor Equipment (continued) |
| MKS Instruments, Inc., Term Loan, 7.823%, (SOFR + 2.50%), 8/17/29 | | 19,965 | $ 20,023,010 |
| Synaptics, Inc., Term Loan, 7.835%, (SOFR + 2.25%), 12/2/28 | | 2,742 | 2,742,982 |
| | | | $ 39,775,094 |
| Software — 11.3% |
| Applied Systems, Inc., Term Loan, 8.809%, (SOFR + 3.50%), 2/24/31 | | 43,551 | $ 43,918,033 |
| Astra Acquisition Corp.: | | | |
| Term Loan, 10.578%, (SOFR + 5.25%), 10/25/28 | | 10,323 | 5,264,552 |
| Term Loan, 12.078%, (SOFR + 6.75%), 2/25/28 | | 2,343 | 2,307,632 |
| Term Loan, 2/25/28(10) | | 4,972 | 4,872,623 |
| Term Loan - Second Lien, 14.439%, (SOFR + 8.88%), 10/25/29 | | 20,170 | 5,714,869 |
| Banff Merger Sub, Inc.: | | | |
| Term Loan, 8.348%, (1 mo. EURIBOR + 4.50%), 12/29/28 | EUR | 1,907 | 2,049,449 |
| Term Loan, 9.566%, (SOFR + 4.25%), 12/29/28 | | 3,544 | 3,570,559 |
| Cegid Group SAS, Term Loan, 7.641%, (3 mo. EURIBOR + 3.75%), 7/10/28 | EUR | 6,150 | 6,585,881 |
| Central Parent, Inc., Term Loan, 9.309%, (SOFR + 4.00%), 7/6/29 | | 19,825 | 19,923,362 |
| Cloud Software Group, Inc.: | | | |
| Term Loan, 9.909%, (SOFR + 4.50%), 9/29/28(11) | | 9,427 | 9,436,672 |
| Term Loan, 9.909%, (SOFR + 4.50%), 3/30/29(11) | | 4,466 | 4,470,728 |
| Cloudera, Inc.: | | | |
| Term Loan, 9.166%, (SOFR + 3.75%), 10/8/28 | | 23,836 | 23,746,517 |
| Term Loan - Second Lien, 11.416%, (SOFR + 6.00%), 10/8/29 | | 2,950 | 2,846,750 |
| Constant Contact, Inc., Term Loan, 9.561%, (SOFR + 4.00%), 2/10/28 | | 5,016 | 4,898,106 |
| Cornerstone OnDemand, Inc., Term Loan, 9.18%, (SOFR + 3.75%), 10/16/28 | | 15,386 | 14,760,944 |
| Delta TopCo, Inc., Term Loan, 9.121%, (SOFR + 3.75%), 12/1/27 | | 10,860 | 10,887,494 |
| E2open LLC, Term Loan, 8.93%, (SOFR + 3.50%), 2/4/28 | | 16,092 | 16,174,945 |
| ECI Macola Max Holding LLC, Term Loan, 9.052%, (SOFR + 3.75%), 5/31/30 | | 15,683 | 15,771,716 |
| Epicor Software Corp.: | | | |
| Term Loan, 8.68%, (SOFR + 3.25%), 7/30/27 | | 34,420 | 34,603,915 |
| Term Loan, 9.066%, (SOFR + 3.75%), 7/30/27 | | 6,135 | 6,176,801 |
| Fiserv Investment Solutions, Inc., Term Loan, 9.319%, (SOFR + 4.00%), 2/18/27 | | 12,377 | 11,899,549 |
34
See Notes to Financial Statements.
Eaton Vance
Floating Rate Portfolio
April 30, 2024
Portfolio of Investments (Unaudited) — continued
| Borrower/Description | Principal
Amount*
(000's omitted) | Value |
| Software (continued) |
| Gen Digital, Inc., Term Loan, 7.416%, (SOFR + 2.00%), 9/12/29 | | 1,176 | $ 1,178,424 |
| GoTo Group, Inc.: | | | |
| Term Loan, 10.173%, (SOFR + 4.75%), 4/30/28 | | 12,930 | 12,364,256 |
| Term Loan - Second Lien, 10.173%, (SOFR + 4.75%), 4/30/28 | | 10,844 | 8,259,388 |
| IGT Holding IV AB: | | | |
| Term Loan, 7.052%, (3 mo. EURIBOR + 3.15%), 3/31/28 | EUR | 6,205 | 6,627,040 |
| Term Loan, 8.972%, (SOFR + 3.40%), 3/31/28 | | 3,994 | 4,011,973 |
| iSolved, Inc., Term Loan, 8.819%, (SOFR + 3.50%), 10/15/30 | | 5,162 | 5,178,194 |
| Ivanti Software, Inc., Term Loan, 9.814%, (SOFR + 4.25%), 12/1/27 | | 3,870 | 3,599,330 |
| Magenta Buyer LLC, Term Loan, 10.591%, (SOFR + 5.00%), 7/27/28 | | 14,659 | 7,448,490 |
| Marcel LUX IV SARL: | | | |
| Term Loan, 8.335%, (3 mo. EURIBOR + 4.50%), 11/7/30 | EUR | 8,650 | 9,277,441 |
| Term Loan, 9.81%, (SOFR + 4.50%), 11/11/30 | | 28,251 | 28,410,300 |
| Maverick Bidco, Inc., Term Loan, 9.23%, (SOFR + 3.75%), 5/18/28 | | 5,175 | 5,165,323 |
| McAfee LLC, Term Loan, 9.177%, (SOFR + 3.75%), 3/1/29 | | 29,628 | 29,731,047 |
| Mosel Bidco SE: | | | |
| Term Loan, 8.652%, (3 mo. EURIBOR + 4.75%), 9/16/30 | EUR | 1,825 | 1,957,395 |
| Term Loan, 10.059%, (SOFR + 4.75%), 9/16/30 | | 2,575 | 2,589,484 |
| N-Able International Holdings II LLC, Term Loan, 8.355%, (SOFR + 2.75%), 7/19/28 | | 1,258 | 1,259,942 |
| Open Text Corp., Term Loan, 8.166%, (SOFR + 2.75%), 1/31/30 | | 23,174 | 23,271,336 |
| Polaris Newco LLC: | | | |
| Term Loan, 7.902%, (3 mo. EURIBOR + 4.00%), 6/2/28 | EUR | 8,434 | 8,621,734 |
| Term Loan, 9.591%, (SOFR + 4.00%), 6/2/28 | | 2,927 | 2,910,134 |
| Proofpoint, Inc., Term Loan, 8.68%, (SOFR + 3.25%), 8/31/28 | | 21,629 | 21,734,689 |
| Quest Software U.S. Holdings, Inc., Term Loan, 9.73%, (SOFR + 4.25%), 2/1/29 | | 16,495 | 11,670,512 |
| RealPage, Inc., Term Loan, 8.43%, (SOFR + 3.00%), 4/24/28 | | 10,663 | 10,294,911 |
| Redstone Holdco 2 LP, Term Loan, 10.18%, (SOFR + 4.75%), 4/27/28 | | 11,692 | 9,217,047 |
| Sabre GLBL, Inc.: | | | |
| Term Loan, 8.93%, (SOFR + 3.50%), 12/17/27 | | 5,850 | 5,127,833 |
| Term Loan, 8.93%, (SOFR + 3.50%), 12/17/27 | | 3,734 | 3,273,117 |
| Term Loan, 9.666%, (SOFR + 4.25%), 6/30/28 | | 3,513 | 3,093,339 |
| Borrower/Description | Principal
Amount*
(000's omitted) | Value |
| Software (continued) |
| Sabre GLBL, Inc.: (continued) | | | |
| Term Loan, 10.416%, (SOFR + 5.00%), 6/30/28 | | 1,000 | $ 885,000 |
| Skillsoft Corp., Term Loan, 10.68%, (SOFR + 5.25%), 7/14/28 | | 10,283 | 8,286,739 |
| SolarWinds Holdings, Inc., Term Loan, 8.566%, (SOFR + 3.25%), 2/5/27 | | 18,345 | 18,399,483 |
| Sophia LP, Term Loan, 8.916%, (SOFR + 3.50%), 10/9/29 | | 22,993 | 23,098,632 |
| Turing Midco LLC, Term Loan, 7.93%, (SOFR + 2.50%), 3/24/28 | | 461 | 457,813 |
| UKG, Inc., Term Loan, 8.814%, (SOFR + 3.50%), 2/10/31 | | 35,095 | 35,297,491 |
| Veritas U.S., Inc., Term Loan, 10.43%, (SOFR + 5.00%), 9/1/25 | | 30,069 | 27,701,285 |
| Vision Solutions, Inc.: | | | |
| Term Loan, 11.75%, (U.S. (Fed) Prime Rate + 3.25%), 4/24/28 | | 33,149 | 33,081,664 |
| Term Loan - Second Lien, 12.841%, (SOFR + 7.25%), 4/23/29 | | 1,500 | 1,411,875 |
| | | | $ 624,773,758 |
| Specialty Retail — 2.1% |
| Belron Luxembourg SARL, Term Loan, 6.347%, (3 mo. EURIBOR + 2.43%), 4/13/28 | EUR | 3,575 | $ 3,836,172 |
| Boels Topholding BV, Term Loan, 7.139%, (EURIBOR + 3.25%), 2/6/27(11) | EUR | 6,681 | 7,146,531 |
| Etraveli Holding AB, Term Loan, 8.902%, (3 mo. EURIBOR + 5.00%), 11/2/28 | EUR | 7,844 | 8,418,245 |
| Great Outdoors Group LLC, Term Loan, 9.18%, (SOFR + 3.75%), 3/6/28 | | 27,181 | 27,221,626 |
| Harbor Freight Tools USA, Inc., Term Loan, 8.18%, (SOFR + 2.75%), 10/19/27 | | 17,787 | 17,822,560 |
| Hoya Midco LLC, Term Loan, 8.58%, (SOFR + 3.25%), 2/3/29 | | 2,626 | 2,634,444 |
| Les Schwab Tire Centers, Term Loan, 8.317%, (SOFR + 3.00%), 4/23/31 | | 18,044 | 18,078,218 |
| LIDS Holdings, Inc., Term Loan, 10.98%, (SOFR + 5.50%), 12/14/26 | | 4,104 | 4,093,709 |
| Mattress Firm, Inc., Term Loan, 9.814%, (SOFR + 4.25%), 9/25/28 | | 15,783 | 15,842,131 |
| PetSmart, Inc., Term Loan, 9.166%, (SOFR + 3.75%), 2/11/28 | | 12,164 | 12,000,159 |
| | | | $ 117,093,795 |
| Technology Hardware, Storage & Peripherals — 0.2% |
| Poseidon Bidco SASU, Term Loan, 8.902%, (3 mo. EURIBOR + 5.00%), 3/13/30 | EUR | 8,200 | $ 8,632,704 |
| | | | $ 8,632,704 |
35
See Notes to Financial Statements.
Eaton Vance
Floating Rate Portfolio
April 30, 2024
Portfolio of Investments (Unaudited) — continued
| Borrower/Description | Principal
Amount*
(000's omitted) | Value |
| Trading Companies & Distributors — 2.9% |
| American Builders & Contractors Supply Co., Inc., Term Loan, 7.316%, (SOFR + 2.00%), 1/31/31 | | 8,460 | $ 8,492,599 |
| Avolon TLB Borrower 1 (U.S.) LLC, Term Loan, 7.315%, (SOFR + 2.00%), 6/22/28 | | 40,726 | 40,840,846 |
| Beacon Roofing Supply, Inc., Term Loan, 7.316%, (SOFR + 2.00%), 5/19/28 | | 5,337 | 5,356,968 |
| Core & Main LP, Term Loan, 7.568%, (SOFR + 2.25%), 2/9/31 | | 3,691 | 3,709,204 |
| DXP Enterprises, Inc., Term Loan, 10.164%, (SOFR + 4.75%), 10/11/30 | | 7,189 | 7,236,049 |
| Foundation Building Materials Holding Co. LLC, Term Loan, 9.33%, (SOFR + 4.00%), 1/29/31(11) | | 12,400 | 12,508,500 |
| Patagonia Bidco Ltd., Term Loan, 10.473%, (SONIA + 5.25%), 11/1/28 | GBP | 20,400 | 22,518,415 |
| PEARLS (Netherlands) Bidco BV, Term Loan, 7.865%, (3 mo. EURIBOR + 4.00%), 2/26/29 | EUR | 6,000 | 6,401,423 |
| Spin Holdco, Inc., Term Loan, 9.585%, (SOFR + 4.00%), 3/4/28 | | 38,309 | 34,003,670 |
| SRS Distribution, Inc.: | | | |
| Term Loan, 8.666%, (SOFR + 3.25%), 6/2/28 | | 4,961 | 4,998,639 |
| Term Loan, 8.93%, (SOFR + 3.50%), 6/2/28 | | 4,234 | 4,269,640 |
| Windsor Holdings III LLC, Term Loan, 9.319%, (SOFR + 4.00%), 8/1/30 | | 11,769 | 11,885,470 |
| | | | $ 162,221,423 |
| Wireless Telecommunication Services — 0.7% |
| CCI Buyer, Inc., Term Loan, 9.302%, (SOFR + 4.00%), 12/17/27 | | 14,832 | $ 14,835,796 |
| Digicel International Finance Ltd., Term Loan, 12.075%, (SOFR + 6.75%), 5/25/27 | | 14,799 | 14,151,285 |
| SBA Senior Finance II LLC, Term Loan, 7.32%, (SOFR + 2.00%), 1/25/31 | | 7,275 | 7,307,737 |
| | | | $ 36,294,818 |
Total Senior Floating-Rate Loans
(identified cost $4,686,718,635) | | | $4,542,284,327 |
| Short-Term Investments — 2.4% |
| Security | Shares | Value |
| Morgan Stanley Institutional Liquidity Funds - Government Portfolio, Institutional Class, 5.22%(13) | | 132,996,037 | $ 132,996,037 |
Total Short-Term Investments
(identified cost $132,996,037) | | | $ 132,996,037 |
Total Investments — 99.3%
(identified cost $5,742,243,961) | | | $5,513,151,680 |
| Less Unfunded Loan Commitments — (0.2)% | | | $ (10,940,092) |
Net Investments — 99.1%
(identified cost $5,731,303,869) | | | $5,502,211,588 |
| Other Assets, Less Liabilities — 0.9% | | | $ 49,627,359 |
| Net Assets — 100.0% | | | $5,551,838,947 |
| The percentage shown for each investment category in the Portfolio of Investments is based on net assets. |
| * | In U.S. dollars unless otherwise indicated. |
| (1) | Security exempt from registration under Rule 144A of the Securities Act of 1933, as amended. These securities may be sold in certain transactions in reliance on an exemption from registration (normally to qualified institutional buyers). At April 30, 2024, the aggregate value of these securities is $753,226,490 or 13.6% of the Portfolio's net assets. |
| (2) | Variable rate security. The stated interest rate represents the rate in effect at April 30, 2024. |
| (3) | Affiliated company (see Note 7). |
| (4) | For fair value measurement disclosure purposes, security is categorized as Level 3 (see Note 8). |
| (5) | Non-income producing security. |
| (6) | Security was acquired in connection with a restructuring of a Senior Loan and may be subject to restrictions on resale. |
| (7) | Amount is less than 0.05%. |
| (8) | Senior floating-rate loans (Senior Loans) often require prepayments from excess cash flows or permit the borrowers to repay at their election. The degree to which borrowers repay, whether as a contractual requirement or at their election, cannot be predicted with accuracy. As a result, the actual remaining maturity may be substantially less than the stated maturities shown. However, Senior Loans will typically have an expected average life of approximately two to four years. Senior Loans typically have rates of interest which are redetermined periodically by reference to a base lending rate, plus a spread. These base lending rates are primarily the Secured Overnight Financing Rate (“SOFR”) and secondarily, the prime rate offered by one or more major United States banks (the “Prime Rate”). Base lending rates may be subject to a floor, or minimum rate. Rates for SOFR are generally 1 or 3-month tenors and may also be subject to a credit spread adjustment. Senior Loans are generally subject to contractual restrictions that must be satisfied before they can be bought or sold. |
36
See Notes to Financial Statements.
Eaton Vance
Floating Rate Portfolio
April 30, 2024
Portfolio of Investments (Unaudited) — continued
| (9) | Unfunded or partially unfunded loan commitments. The stated interest rate reflects the weighted average of the reference rate and spread for the funded portion, if any, and the commitment fees on the portion of the loan that is unfunded. At April 30, 2024, the total value of unfunded loan commitments is $7,863,793. See Note 1F for description. |
| (10) | This Senior Loan will settle after April 30, 2024, at which time the interest rate will be determined. |
| (11) | The stated interest rate represents the weighted average interest rate at April 30, 2024 of contracts within the senior loan facility. Interest rates on contracts are primarily redetermined either monthly or quarterly by reference to the indicated base lending rate and spread and the reset period. |
| (12) | Issuer is in default with respect to interest and/or principal payments or has declared bankruptcy. For a variable rate security, interest rate has been adjusted to reflect non-accrual status. |
| (13) | May be deemed to be an affiliated investment company. The rate shown is the annualized seven-day yield as of April 30, 2024. |
| Forward Foreign Currency Exchange Contracts (OTC) |
| Currency Purchased | Currency Sold | Counterparty | Settlement
Date | Unrealized
Appreciation | Unrealized
(Depreciation) |
| USD | 292,775,639 | EUR | 270,766,698 | Standard Chartered Bank | 5/3/24 | $ 3,813,269 | $ — |
| GBP | 787,159 | USD | 994,480 | Citibank, N.A. | 5/31/24 | — | (10,741) |
| USD | 30,673,878 | EUR | 28,150,000 | Bank of America, N.A. | 5/31/24 | 598,723 | — |
| USD | 30,685,639 | EUR | 28,166,992 | Bank of America, N.A. | 5/31/24 | 592,330 | — |
| USD | 28,164,855 | EUR | 25,855,000 | Bank of America, N.A. | 5/31/24 | 541,652 | — |
| USD | 26,150,837 | EUR | 24,000,000 | Bank of America, N.A. | 5/31/24 | 509,496 | — |
| USD | 31,187,938 | EUR | 28,620,000 | State Street Bank and Trust Company | 5/31/24 | 610,639 | — |
| USD | 30,683,615 | EUR | 28,166,000 | State Street Bank and Trust Company | 5/31/24 | 591,365 | — |
| USD | 30,694,668 | EUR | 28,180,000 | State Street Bank and Trust Company | 5/31/24 | 587,460 | — |
| USD | 14,078,340 | GBP | 11,092,000 | HSBC Bank USA, N.A. | 5/31/24 | 216,295 | — |
| USD | 14,081,586 | GBP | 11,091,179 | State Street Bank and Trust Company | 5/31/24 | 220,566 | — |
| USD | 289,883,480 | EUR | 270,766,698 | Standard Chartered Bank | 6/4/24 | 551,657 | — |
| USD | 71,085,979 | EUR | 65,476,069 | State Street Bank and Trust Company | 6/28/24 | 1,045,861 | — |
| | | | | | | $9,879,313 | $(10,741) |
| Abbreviations: |
| DIP | – Debtor In Possession |
| EURIBOR | – Euro Interbank Offered Rate |
| LIBOR | – London Interbank Offered Rate |
| OTC | – Over-the-counter |
| PCL | – Public Company Limited |
| PIK | – Payment In Kind |
| SOFR | – Secured Overnight Financing Rate |
| SONIA | – Sterling Overnight Interbank Average |
| Currency Abbreviations: |
| EUR | – Euro |
| GBP | – British Pound Sterling |
| USD | – United States Dollar |
37
See Notes to Financial Statements.
Eaton Vance
Floating Rate Portfolio
April 30, 2024
Statement of Assets and Liabilities (Unaudited)
| | April 30, 2024 |
| Assets | |
| Unaffiliated investments, at value (identified cost $5,595,962,424) | $ 5,369,215,551 |
| Affiliated investments, at value (identified cost $135,341,445) | 132,996,037 |
| Cash | 23,796,905 |
| Deposits for derivatives collateral — forward foreign currency exchange contracts | 6,810,000 |
| Foreign currency, at value (identified cost $45,417,258) | 44,981,760 |
| Interest receivable | 34,633,007 |
| Dividends receivable from affiliated investments | 547,807 |
| Receivable for investments sold | 55,663,106 |
| Receivable for open forward foreign currency exchange contracts | 9,879,313 |
| Prepaid upfront fees on notes payable | 843,353 |
| Trustees' deferred compensation plan | 290,876 |
| Other receivables | 2,084,589 |
| Prepaid expenses | 116,527 |
| Total assets | $5,681,858,831 |
| Liabilities | |
| Cash collateral due to brokers | $ 6,810,000 |
| Payable for investments purchased | 118,776,132 |
| Payable for open forward foreign currency exchange contracts | 10,741 |
| Payable to affiliates: | |
| Investment adviser fee | 2,299,994 |
| Trustees' fees | 9,042 |
| Trustees' deferred compensation plan | 290,876 |
| Accrued expenses | 1,823,099 |
| Total liabilities | $ 130,019,884 |
| Net Assets applicable to investors' interest in Portfolio | $5,551,838,947 |
38
See Notes to Financial Statements.
Eaton Vance
Floating Rate Portfolio
April 30, 2024
Statement of Operations (Unaudited)
| | Six Months Ended |
| | April 30, 2024 |
| Investment Income | |
| Dividend income | $ 1,089,319 |
| Dividend income from affiliated investments | 3,281,446 |
| Interest income | 253,949,016 |
| Other income | 4,183,700 |
| Total investment income | $ 262,503,481 |
| Expenses | |
| Investment adviser fee | $ 14,065,972 |
| Trustees’ fees and expenses | 54,250 |
| Custodian fee | 602,440 |
| Legal and accounting services | 334,888 |
| Interest expense and fees | 811,010 |
| Miscellaneous | 211,764 |
| Total expenses | $ 16,080,324 |
| Deduct: | |
| Waiver and/or reimbursement of expenses by affiliates | $ 95,440 |
| Total expense reductions | $ 95,440 |
| Net expenses | $ 15,984,884 |
| Net investment income | $ 246,518,597 |
| Realized and Unrealized Gain (Loss) | |
| Net realized gain (loss): | |
| Investment transactions | $ (109,391,603) |
| Foreign currency transactions | (92,455) |
| Forward foreign currency exchange contracts | (1,377,053) |
| Net realized loss | $(110,861,111) |
| Change in unrealized appreciation (depreciation): | |
| Investments | $ 202,576,036 |
| Foreign currency | (1,337,836) |
| Forward foreign currency exchange contracts | 1,793,443 |
| Net change in unrealized appreciation (depreciation) | $ 203,031,643 |
| Net realized and unrealized gain | $ 92,170,532 |
| Net increase in net assets from operations | $ 338,689,129 |
39
See Notes to Financial Statements.
Eaton Vance
Floating Rate Portfolio
April 30, 2024
Statements of Changes in Net Assets
| | Six Months Ended
April 30, 2024
(Unaudited) | Year Ended
October 31, 2023 |
| Increase (Decrease) in Net Assets | | |
| From operations: | | |
| Net investment income | $ 246,518,597 | $ 537,269,640 |
| Net realized loss | (110,861,111) | (335,324,412) |
| Net change in unrealized appreciation (depreciation) | 203,031,643 | 471,089,099 |
| Net increase in net assets from operations | $ 338,689,129 | $ 673,034,327 |
| Capital transactions: | | |
| Contributions | $ 133,712,330 | $ 308,512,496 |
| Withdrawals | (682,336,605) | (3,320,903,248) |
| Net decrease in net assets from capital transactions | $ (548,624,275) | $(3,012,390,752) |
| Net decrease in net assets | $ (209,935,146) | $(2,339,356,425) |
| Net Assets | | |
| At beginning of period | $ 5,761,774,093 | $ 8,101,130,518 |
| At end of period | $5,551,838,947 | $ 5,761,774,093 |
40
See Notes to Financial Statements.
Eaton Vance
Floating Rate Portfolio
April 30, 2024
| | Six Months Ended
April 30, 2024
(Unaudited) | Year Ended October 31, |
| Ratios/Supplemental Data | 2023 | 2022 | 2021 | 2020 | 2019 |
| Ratios (as a percentage of average daily net assets): | | | | | | |
| Expenses | 0.58% (1)(2) | 0.58% (2) | 0.54% (2) | 0.56% | 0.59% | 0.55% |
| Net investment income | 8.91% (1) | 8.21% | 4.39% | 3.51% | 4.17% | 5.09% |
| Portfolio Turnover | 15% (3) | 19% | 27% | 26% | 28% | 16% |
| Total Return | 6.25% (3) | 10.63% | (3.32)% | 7.80% | 1.18% | 1.64% |
| Net assets, end of period (000’s omitted) | $5,551,839 | $5,761,774 | $8,101,131 | $8,986,782 | $5,649,501 | $7,966,641 |
| (1) | Annualized. |
| (2) | Includes a reduction by the investment adviser of a portion of its adviser fee due to the Portfolio's investment in the Liquidity Fund (equal to less than 0.005% of average daily net assets for the six months ended April 30, 2024 and the years ended October 31, 2023 and 2022). |
| (3) | Not annualized. |
41
See Notes to Financial Statements.
Eaton Vance
Floating Rate Portfolio
April 30, 2024
Notes to Financial Statements (Unaudited)
1 Significant Accounting Policies
Eaton Vance Floating Rate Portfolio (the Portfolio) is a Massachusetts business trust registered under the Investment Company Act of 1940, as amended (the 1940 Act), as a diversified, open-end management investment company. The Portfolio’s investment objective is to provide a high level of current income. The Declaration of Trust permits the Trustees to issue interests in the Portfolio. At April 30, 2024, Eaton Vance Floating-Rate Fund and Eaton Vance Floating-Rate & High Income Fund held an interest of 86.1% and 13.9%, respectively, in the Portfolio.
The following is a summary of significant accounting policies of the Portfolio. The policies are in conformity with accounting principles generally accepted in the United States of America (U.S. GAAP). The Portfolio is an investment company and follows accounting and reporting guidance in the Financial Accounting Standards Board (FASB) Accounting Standards Codification Topic 946.
A Investment Valuation—The following methodologies are used to determine the market value or fair value of investments.
Senior Floating-Rate Loans. Interests in senior floating-rate loans (Senior Loans) are valued generally at the average mean of bid and ask quotations obtained from a third party pricing service. Senior Loans, for which a valuation is not available or deemed unreliable, are fair valued by the investment adviser utilizing one or more of the valuation techniques described below to assess the likelihood that the borrower will make a full repayment of the loan underlying such Senior Loan. If the investment adviser believes that there is a reasonable likelihood of full repayment, the investment adviser will determine fair value using a matrix pricing approach that considers the yield on the Senior Loan relative to yields on other Senior Loans issued by companies of comparable credit quality. If the investment adviser believes there is not a reasonable likelihood of full repayment, the investment adviser will determine fair value using analyses that include, but are not limited to: (i) a comparison of the value of the borrower’s outstanding equity and debt to that of comparable public companies; (ii) a discounted cash flow analysis; or (iii) when the investment adviser believes it is likely that a borrower will be liquidated or sold, an analysis of the terms of such liquidation or sale. In certain cases, the investment adviser will use a combination of analytical methods to determine fair value, such as when only a portion of a borrower’s assets are likely to be sold. In conducting its assessment and analyses for purposes of determining fair value of a Senior Loan, the investment adviser will use its discretion and judgment in considering and appraising relevant factors. Junior Loans (i.e., subordinated loans and second lien loans) are valued in the same manner as Senior Loans.
Debt Obligations. Debt obligations are generally valued on the basis of valuations provided by third party pricing services, as derived from such services’ pricing models. Inputs to the models may include, but are not limited to, reported trades, executable bid and ask prices, broker/dealer quotations, prices or yields of securities with similar characteristics, interest rates, anticipated prepayments, benchmark curves or information pertaining to the issuer, as well as industry and economic events. The pricing services may use a matrix approach, which considers information regarding securities with similar characteristics to determine the valuation for a security. Short-term debt obligations purchased with a remaining maturity of sixty days or less for which a valuation from a third party pricing service is not readily available may be valued at amortized cost, which approximates fair value.
Equity Securities. Equity securities listed on a U.S. securities exchange generally are valued at the last sale or closing price on the day of valuation or, if no sales took place on such date, at the mean between the closing bid and ask prices on the exchange where such securities are principally traded. Equity securities listed on the NASDAQ National Market System are valued at the NASDAQ official closing price. Unlisted or listed securities for which closing sales prices or closing quotations are not available are valued at the mean between the latest available bid and ask prices or, in the case of preferred equity securities that are not listed or traded in the over-the-counter market, by a third party pricing service that uses various techniques that consider factors including, but not limited to, prices or yields of securities with similar characteristics, benchmark yields, broker/dealer quotes, quotes of underlying common stock, issuer spreads, as well as industry and economic events.
Derivatives. Forward foreign currency exchange contracts are generally valued at the mean of the average bid and average asked prices that are reported by currency dealers to a third party pricing service at the valuation time. Such third party pricing service valuations are supplied for specific settlement periods and the Portfolio’s forward foreign currency exchange contracts are valued at an interpolated rate between the closest preceding and subsequent settlement period reported by the third party pricing service.
Foreign Securities and Currencies. Foreign securities and currencies are valued in U.S. dollars, based on foreign currency exchange rate quotations supplied by a third party pricing service. The pricing service uses a proprietary model to determine the exchange rate. Inputs to the model include reported trades and implied bid/ask spreads.
Other. Investments in management investment companies (including money market funds) that do not trade on an exchange are valued at the net asset value as of the close of each business day.
Fair Valuation. In connection with Rule 2a-5 of the 1940 Act, the Trustees have designated the Portfolio’s investment adviser as its valuation designee. Investments for which valuations or market quotations are not readily available or are deemed unreliable are valued by the investment adviser, as valuation designee, at fair value using methods that most fairly reflect the security’s “fair value”, which is the amount that the Portfolio might reasonably expect to receive for the security upon its current sale in the ordinary course. Each such determination is based on a consideration of relevant factors, which are likely to vary from one pricing context to another. These factors may include, but are not limited to, the type of security, the existence of any contractual restrictions on the security’s disposition, the price and extent of public trading in similar securities of the issuer or of comparable companies or entities, quotations or relevant information obtained from broker/dealers or other market participants, information obtained from the issuer, analysts, and/or the appropriate stock exchange (for exchange-traded securities), an analysis of the company’s or entity’s financial statements, and an evaluation of the forces that influence the issuer and the market(s) in which the security is purchased and sold.
Eaton Vance
Floating Rate Portfolio
April 30, 2024
Notes to Financial Statements (Unaudited) — continued
B Investment Transactions—Investment transactions for financial statement purposes are accounted for on a trade date basis. Realized gains and losses on investments sold are determined on the basis of identified cost.
C Income—Interest income is recorded on the basis of interest accrued, adjusted for amortization of premium or accretion of discount. Fees associated with loan amendments are recognized immediately. Dividend income is recorded on the ex-dividend date for dividends received in cash and/or securities. Distributions from investment companies are recorded as dividend income, capital gains or return of capital based on the nature of the distribution.
D Federal Taxes—The Portfolio has elected to be treated as a partnership for federal tax purposes. No provision is made by the Portfolio for federal or state taxes on any taxable income of the Portfolio because each investor in the Portfolio is ultimately responsible for the payment of any taxes on its share of taxable income. Since at least one of the Portfolio's investors is a regulated investment company that invests all or substantially all of its assets in the Portfolio, the Portfolio normally must satisfy the applicable source of income and diversification requirements (under the Internal Revenue Code) in order for its investors to satisfy them. The Portfolio will allocate, at least annually among its investors, each investor's distributive share of the Portfolio's net investment income, net realized capital gains and losses and any other items of income, gain, loss, deduction or credit.
As of April 30, 2024, the Portfolio had no uncertain tax positions that would require financial statement recognition, de-recognition, or disclosure. The Portfolio files a U.S. federal income tax return annually after its fiscal year-end, which is subject to examination by the Internal Revenue Service for a period of three years from the date of filing.
E Foreign Currency Translation—Investment valuations, other assets, and liabilities initially expressed in foreign currencies are translated each business day into U.S. dollars based upon current exchange rates. Purchases and sales of foreign investment securities and income and expenses denominated in foreign currencies are translated into U.S. dollars based upon currency exchange rates in effect on the respective dates of such transactions. Recognized gains or losses on investment transactions attributable to changes in foreign currency exchange rates are recorded for financial statement purposes as net realized gains and losses on investments. That portion of unrealized gains and losses on investments that results from fluctuations in foreign currency exchange rates is not separately disclosed.
F Unfunded Loan Commitments—The Portfolio may enter into certain loan agreements all or a portion of which may be unfunded. The Portfolio is obligated to fund these commitments at the borrower's discretion. These commitments are disclosed in the accompanying Portfolio of Investments. At April 30, 2024, the Portfolio had sufficient cash and/or securities to cover these commitments.
G Use of Estimates—The preparation of the financial statements in conformity with U.S. GAAP requires management to make estimates and assumptions that affect the reported amounts of assets and liabilities at the date of the financial statements and the reported amounts of income and expense during the reporting period. Actual results could differ from those estimates.
H Indemnifications—Under the Portfolio’s organizational documents, its officers and Trustees may be indemnified against certain liabilities and expenses arising out of the performance of their duties to the Portfolio. Under Massachusetts law, if certain conditions prevail, interestholders in the Portfolio could be deemed to have personal liability for the obligations of the Portfolio. However, the Portfolio’s Declaration of Trust contains an express disclaimer of liability on the part of Portfolio interestholders. Additionally, in the normal course of business, the Portfolio enters into agreements with service providers that may contain indemnification clauses. The Portfolio’s maximum exposure under these arrangements is unknown as this would involve future claims that may be made against the Portfolio that have not yet occurred.
I Forward Foreign Currency Exchange Contracts—The Portfolio may enter into forward foreign currency exchange contracts for the purchase or sale of a specific foreign currency at a fixed price on a future date. The forward foreign currency exchange contracts are adjusted by the daily exchange rate of the underlying currency and any gains or losses are recorded as unrealized until such time as the contracts have been closed. Risks may arise upon entering these contracts from the potential inability of counterparties to meet the terms of their contracts and from movements in the value of a foreign currency relative to the U.S. dollar.
J When-Issued Securities and Delayed Delivery Transactions—The Portfolio may purchase securities on a delayed delivery or when-issued basis. Payment and delivery may take place after the customary settlement period for that security. At the time the transaction is negotiated, the price of the security that will be delivered is fixed. The Portfolio maintains cash and/or security positions for these commitments such that sufficient liquid assets will be available to make payments upon settlement. Securities purchased on a delayed delivery or when-issued basis are marked-to-market daily and begin earning interest on settlement date. Such security purchases are subject to the risk that when delivered they will be worth less than the agreed upon payment price. Losses may also arise if the counterparty does not perform under the contract.
K Interim Financial Statements—The interim financial statements relating to April 30, 2024 and for the six months then ended have not been audited by an independent registered public accounting firm, but in the opinion of the Portfolio’s management, reflect all adjustments, consisting only of normal recurring adjustments, necessary for the fair presentation of the financial statements.
Eaton Vance
Floating Rate Portfolio
April 30, 2024
Notes to Financial Statements (Unaudited) — continued
2 Investment Adviser Fee and Other Transactions with Affiliates
The investment adviser fee is earned by Boston Management and Research (BMR), an indirect, wholly-owned subsidiary of Morgan Stanley, as compensation for investment advisory services rendered to the Portfolio. The investment adviser fee is computed at an annual rate as a percentage of the Portfolio's average daily net assets as follows and is payable monthly:
| Average Daily Net Assets | Annual Fee Rate |
| Up to $1 billion | 0.5750% |
| $1 billion but less than $2 billion | 0.5250% |
| $2 billion but less than $5 billion | 0.4900% |
| $5 billion but less than $10 billion | 0.4600% |
| $10 billion but less than $15 billion | 0.4350% |
| $15 billion but less than $20 billion | 0.4150% |
| $20 billion but less than $25 billion | 0.4000% |
| $25 billion and over | 0.3900% |
For the six months ended April 30, 2024, the Portfolio’s investment adviser fee amounted to $14,065,972 or 0.51% (annualized) of the Portfolio's average daily net assets. The Portfolio may invest in a money market fund, the Institutional Class of the Morgan Stanley Institutional Liquidity Funds - Government Portfolio (the “Liquidity Fund”), an open-end management investment company managed by Morgan Stanley Investment Management Inc., a wholly-owned subsidiary of Morgan Stanley. The investment adviser fee paid by the Portfolio is reduced by an amount equal to its pro rata share of the advisory and administration fees paid by the Portfolio due to its investment in the Liquidity Fund. For the six months ended April 30, 2024, the investment adviser fee paid was reduced by $95,440 relating to the Portfolio's investment in the Liquidity Fund.
Trustees and officers of the Portfolio who are members of BMR’s organization receive remuneration for their services to the Portfolio out of the investment adviser fee. Trustees of the Portfolio who are not affiliated with the investment adviser may elect to defer receipt of all or a percentage of their annual fees in accordance with the terms of the Trustees Deferred Compensation Plan. Certain officers and Trustees of the Portfolio are officers of the above organization.
During the six months ended April 30, 2024, EVM reimbursed the Portfolio $6,584 for a net realized loss due to a trading error. The amount of the reimbursement had no significant impact on total return.
3 Purchases and Sales of Investments
Purchases and sales of investments, other than short-term obligations and including maturities, and principal repayments on Senior Loans, aggregated $824,833,836 and $1,095,608,641, respectively, for the six months ended April 30, 2024.
4 Federal Income Tax Basis of Investments
The cost and unrealized appreciation (depreciation) of investments, including open derivative contracts, of the Portfolio at April 30, 2024, as determined on a federal income tax basis, were as follows:
| Aggregate cost | $5,735,738,397 |
| Gross unrealized appreciation | $ 64,280,088 |
| Gross unrealized depreciation | (287,938,325) |
| Net unrealized depreciation | $ (223,658,237) |
5 Financial Instruments
The Portfolio may trade in financial instruments with off-balance sheet risk in the normal course of its investing activities. These financial instruments may include forward foreign currency exchange contracts and may involve, to a varying degree, elements of risk in excess of the amounts recognized for
Eaton Vance
Floating Rate Portfolio
April 30, 2024
Notes to Financial Statements (Unaudited) — continued
financial statement purposes. The notional or contractual amounts of these instruments represent the investment the Portfolio has in particular classes of financial instruments and do not necessarily represent the amounts potentially subject to risk. The measurement of the risks associated with these instruments is meaningful only when all related and offsetting transactions are considered. A summary of obligations under these financial instruments at April 30, 2024 is included in the Portfolio of Investments. At April 30, 2024, the Portfolio had sufficient cash and/or securities to cover commitments under these contracts.
The Portfolio is subject to foreign exchange risk in the normal course of pursuing its investment objective. Because the Portfolio holds foreign currency denominated investments, the value of these investments and related receivables and payables may change due to future changes in foreign currency exchange rates. To hedge against this risk, the Portfolio enters into forward foreign currency exchange contracts.
The Portfolio enters into forward foreign currency exchange contracts that may contain provisions whereby the counterparty may terminate the contract under certain conditions, including but not limited to a decline in the Portfolio's net assets below a certain level over a certain period of time, which would trigger a payment by the Portfolio for those derivatives in a liability position. At April 30, 2024, the fair value of derivatives with credit related contingent features in a net liability position was $10,741. At April 30, 2024, there were no assets pledged by the Portfolio for such liability.
The over-the-counter (OTC) derivatives in which the Portfolio invests are subject to the risk that the counterparty to the contract fails to perform its obligations under the contract. To mitigate this risk, the Portfolio has entered into an International Swaps and Derivatives Association, Inc. Master Agreement (“ISDA Master Agreement”) or similar agreement with substantially all its derivative counterparties. An ISDA Master Agreement is a bilateral agreement between the Portfolio and a counterparty that governs certain OTC derivatives and typically contains, among other things, set-off provisions in the event of a default and/or termination event as defined under the relevant ISDA Master Agreement. Under an ISDA Master Agreement, the Portfolio may, under certain circumstances, offset with the counterparty certain derivative financial instruments’ payables and/or receivables with collateral held and/or posted and create one single net payment. The provisions of the ISDA Master Agreement typically permit a single net payment in the event of default including the bankruptcy or insolvency of the counterparty. However, bankruptcy or insolvency laws of a particular jurisdiction may impose restrictions on or prohibitions against the right of offset in bankruptcy or insolvency. Certain ISDA Master Agreements allow counterparties to OTC derivatives to terminate derivative contracts prior to maturity in the event the Portfolio’s net assets decline by a stated percentage or the Portfolio fails to meet the terms of its ISDA Master Agreements, which would cause the counterparty to accelerate payment by the Portfolio of any net liability owed to it.
The collateral requirements for derivatives traded under an ISDA Master Agreement are governed by a Credit Support Annex to the ISDA Master Agreement. Collateral requirements are determined at the close of business each day and are typically based on changes in market values for each transaction under an ISDA Master Agreement and netted into one amount for such agreement. Generally, the amount of collateral due from or to a counterparty is subject to a minimum transfer threshold amount before a transfer is required, which may vary by counterparty. Collateral pledged for the benefit of the Portfolio and/or counterparty is held in segregated accounts by the Portfolio’s custodian and cannot be sold, re-pledged, assigned or otherwise used while pledged. The portion of such collateral representing cash, if any, is reflected as deposits for derivatives collateral and, in the case of cash pledged by a counterparty for the benefit of the Portfolio, a corresponding liability on the Statement of Assets and Liabilities. Securities pledged by the Portfolio as collateral, if any, are identified as such in the Portfolio of Investments.
The fair value of open derivative instruments (not considered to be hedging instruments for accounting disclosure purposes) and whose primary underlying risk exposure is foreign exchange risk at April 30, 2024 was as follows:
| | Fair Value |
| Derivative | Asset Derivative(1) | Liability Derivative(2) |
| Forward foreign currency exchange contracts | $9,879,313 | $(10,741) |
| (1) | Statement of Assets and Liabilities location: Receivable for open forward foreign currency exchange contracts. |
| (2) | Statement of Assets and Liabilities location: Payable for open forward foreign currency exchange contracts. |
Eaton Vance
Floating Rate Portfolio
April 30, 2024
Notes to Financial Statements (Unaudited) — continued
The Portfolio's derivative assets and liabilities at fair value by risk, which are reported gross in the Statement of Assets and Liabilities, are presented in the table above. The following tables present the Portfolio's derivative assets and liabilities by counterparty, net of amounts available for offset under a master netting agreement and net of the related collateral received by the Portfolio for such assets and pledged by the Portfolio for such liabilities as of April 30, 2024.
| Counterparty | Derivative
Assets Subject to
Master Netting
Agreement | Derivatives
Available
for Offset | Non-cash
Collateral
Received(a) | Cash
Collateral
Received(a) | Net Amount
of Derivative
Assets(b) |
| Bank of America, N.A. | $ 2,242,201 | $ — | $ — | $ (1,700,000) | $ 542,201 |
| HSBC Bank USA, N.A. | 216,295 | — | (154,596) | — | 61,699 |
| Standard Chartered Bank | 4,364,926 | — | — | (2,530,000) | 1,834,926 |
| State Street Bank and Trust Company | 3,055,891 | — | — | (2,580,000) | 475,891 |
| | $9,879,313 | $ — | $(154,596) | $(6,810,000) | $2,914,717 |
| Counterparty | Derivative
Liabilities Subject to
Master Netting
Agreement | Derivatives
Available
for Offset | Non-cash
Collateral
Pledged(a) | Cash
Collateral
Pledged(a) | Net Amount
of Derivative
Liabilities(c) |
| Citibank, N.A. | $(10,741) | $ — | $ — | $ — | $(10,741) |
| (a) | In some instances, the total collateral received and/or pledged may be more than the amount shown due to overcollateralization. |
| (b) | Net amount represents the net amount due from the counterparty in the event of default. |
| (c) | Net amount represents the net amount payable to the counterparty in the event of default. |
The effect of derivative instruments (not considered to be hedging instruments for accounting disclosure purposes) on the Statement of Operations and whose primary underlying risk exposure is foreign exchange risk for the six months ended April 30, 2024 was as follows:
| Derivative | Realized Gain (Loss)
on Derivatives Recognized
in Income(1) | Change in Unrealized
Appreciation (Depreciation) on
Derivatives Recognized in Income(2) |
| Forward foreign currency exchange contracts | $(1,377,053) | $1,793,443 |
| (1) | Statement of Operations location: Net realized gain (loss): Forward foreign currency exchange contracts. |
| (2) | Statement of Operations location: Change in unrealized appreciation (depreciation): Forward foreign currency exchange contracts. |
The average notional amount of forward foreign currency exchange contracts (based on the absolute value of notional amounts of currency purchased and currency sold) outstanding during the six months ended April 30, 2024, which is indicative of the volume of this derivative type, was approximately $904,348,000.
Eaton Vance
Floating Rate Portfolio
April 30, 2024
Notes to Financial Statements (Unaudited) — continued
6 Credit Facility
The Portfolio participates with another portfolio and fund managed by BMR and its affiliates in a $500 million ($600 million prior to March 4, 2024) unsecured credit facility agreement (Agreement) with a group of banks, which is in effect through March 3, 2025. Borrowings are made by the Portfolio solely to facilitate the handling of unusual and/or unanticipated short-term cash requirements. At the Portfolio’s option, any loan under the Credit Facility that is made to it will bear interest at a rate equal to (i) the Benchmark Rate (defined below) plus a margin or, (ii) the Base Rate, or (iii) the Overnight Rate plus a margin. Base Rate is the highest of (a) administrative agent’s prime rate, (b) 50 basis points above the Federal Funds rate, (c) the Benchmark Rate plus a margin and (d) 1.00%, in each case as in effect from time to time. The “Overnight Rate” is the greatest of the Benchmark Rate, the Federal Funds rate and 0.00%. “Benchmark Rate” means Term SOFR (defined as the forward-looking Secured Overnight Financing Rate term rate published two U.S. government securities business days prior to the commencement of the applicable interest period plus the Term SOFR Adjustment) for an interest period of one-month’s duration. To the extent that, at any time, the Benchmark Rate is less than 0.00%, the Benchmark Rate shall be deemed to be 0.00% for purposes of the Credit Facility. “Term SOFR Adjustment” means 0.10%. In addition, a fee computed at an annual rate of 0.15% on the daily unused portion of each lender’s commitment amount is allocated among the participating portfolios and fund at the end of each quarter. Also included in interest expense and fees on the Statement of Operations is approximately $573,000 of amortization of upfront fees paid by the Portfolio in connection with the annual renewal of the Agreement. The unamortized balance of upfront fees at April 30, 2024 is $843,353 and is included in prepaid upfront fees on notes payable in the Statement of Assets and Liabilities. Because the credit facility is not available exclusively to the Portfolio and the maximum amount is capped, it may be unable to borrow some or all of a requested amount at any particular time. The Portfolio did not have any significant borrowings during the six months ended April 30, 2024.
7 Affiliated Investments
An affiliated company is a company in which a fund has a direct or indirect ownership of, control of, or voting power of 5 percent or more of the outstanding voting shares, or a company that is under common ownership or control with a fund. At April 30, 2024, the value of the Portfolio's investment in affiliated companies and in funds that may be deemed to be affiliated was $132,996,037, which represents 2.4% of the Portfolio's net assets. Transactions in such investments by the Portfolio for the six months ended April 30, 2024 were as follows:
| Name | Value,
beginning
of period | Purchases | Sales
proceeds | Net realized
gain (loss) | Change in
unrealized
appreciation
(depreciation) | Value, end
of period | Dividend
income | Shares,
end of period |
| Common Stocks* |
| IAP Worldwide Services LLC(1)(2)(3) | $ 0 | $ — | $ — | $ — | $ — | $ 0 | $ — | 2,577 |
| Short-Term Investments |
| Liquidity Fund | 143,913,942 | 792,643,826 | (803,561,731) | — | — | 132,996,037 | 3,281,446 | 132,996,037 |
| Total | | | | $ — | $ — | $132,996,037 | $3,281,446 | |
| * | The related industry is the same as the presentation in the Portfolio of Investments. |
| (1) | For fair value measurement disclosure purposes, security is categorized as Level 3 (see Note 8). |
| (2) | Non-income producing security. |
| (3) | A portion of the shares were acquired in connection with a restructuring of a Senior Loan and may be subject to restrictions on resale. |
8 Fair Value Measurements
Under generally accepted accounting principles for fair value measurements, a three-tier hierarchy to prioritize the assumptions, referred to as inputs, is used in valuation techniques to measure fair value. The three-tier hierarchy of inputs is summarized in the three broad levels listed below.
| • | Level 1 – quoted prices in active markets for identical investments |
| • | Level 2 – other significant observable inputs (including quoted prices for similar investments, interest rates, prepayment speeds, credit risk, etc.) |
| • | Level 3 – significant unobservable inputs (including a fund's own assumptions in determining the fair value of investments) |
In cases where the inputs used to measure fair value fall in different levels of the fair value hierarchy, the level disclosed is determined based on the lowest level input that is significant to the fair value measurement in its entirety. The inputs or methodology used for valuing securities are not necessarily an indication of the risk associated with investing in those securities.
Eaton Vance
Floating Rate Portfolio
April 30, 2024
Notes to Financial Statements (Unaudited) — continued
At April 30, 2024, the hierarchy of inputs used in valuing the Portfolio’s investments and open derivative instruments, which are carried at fair value, were as follows:
| Asset Description | Level 1 | Level 2 | Level 3* | Total |
| Asset-Backed Securities | $ — | $ 248,471,740 | $ — | $ 248,471,740 |
| Common Stocks | 321,220 | 49,534,187 | 1,025,305 | 50,880,712 |
| Corporate Bonds | — | 520,635,384 | — | 520,635,384 |
| Exchange-Traded Funds | 17,883,480 | — | — | 17,883,480 |
| Senior Floating-Rate Loans (Less Unfunded Loan Commitments) | — | 4,502,420,368 | 28,923,867 | 4,531,344,235 |
| Short-Term Investments | 132,996,037 | — | — | 132,996,037 |
| Total Investments | $ 151,200,737 | $ 5,321,061,679 | $ 29,949,172 | $ 5,502,211,588 |
| Forward Foreign Currency Exchange Contracts | $ — | $ 9,879,313 | $ — | $ 9,879,313 |
| Total | $ 151,200,737 | $ 5,330,940,992 | $ 29,949,172 | $ 5,512,090,901 |
| Liability Description | | | | |
| Forward Foreign Currency Exchange Contracts | $ — | $ (10,741) | $ — | $ (10,741) |
| Total | $ — | $ (10,741) | $ — | $ (10,741) |
| * | None of the unobservable inputs for Level 3 assets, individually or collectively, had a material impact on the Portfolio. |
Level 3 investments at the beginning and/or end of the period in relation to net assets were not significant and accordingly, a reconciliation of Level 3 assets for the six months ended April 30, 2024 is not presented.
9 Risks and Uncertainties
Risks Associated with Foreign Investments
Foreign investments can be adversely affected by political, economic and market developments abroad, including the imposition of economic and other sanctions by the United States or another country. There may be less publicly available information about foreign issuers because they may not be subject to reporting practices, requirements or regulations comparable to those to which United States companies are subject. Foreign markets may be smaller, less liquid and more volatile than the major markets in the United States. Trading in foreign markets typically involves higher expense than trading in the United States. The Portfolio may have difficulties enforcing its legal or contractual rights in a foreign country. Securities that trade or are denominated in currencies other than the U.S. dollar may be adversely affected by fluctuations in currency exchange rates.
Credit Risk
The Portfolio invests primarily in below investment grade floating-rate loans, which are considered speculative because of the credit risk of their issuers. Changes in economic conditions or other circumstances are more likely to reduce the capacity of issuers of these securities to make principal and interest payments. Such companies are more likely to default on their payments of interest and principal owed than issuers of investment grade bonds. An economic downturn generally leads to a higher non-payment rate, and a loan or other debt obligation may lose significant value before a default occurs. Lower rated investments also may be subject to greater price volatility than higher rated investments. Moreover, the specific collateral used to secure a loan may decline in value or become illiquid, which would adversely affect the loan’s value.
Eaton Vance
Floating-Rate Fund
April 30, 2024
| Officers of Eaton Vance Floating-Rate Fund and Eaton Vance Floating Rate Portfolio |
Kenneth A. Topping
President | Nicholas S. Di Lorenzo
Secretary |
Deidre E. Walsh
Vice President and Chief Legal Officer | Laura T. Donovan
Chief Compliance Officer |
James F. Kirchner
Treasurer | |
| Trustees of Eaton Vance Floating-Rate Fund and Eaton Vance Floating Rate Portfolio | |
George J. Gorman
Chairperson | |
| Alan C. Bowser | |
| Mark R. Fetting | |
| Cynthia E. Frost | |
| Valerie A. Mosley | |
| Anchal Pachnanda* | |
| Keith Quinton | |
| Marcus L. Smith | |
| Susan J. Sutherland | |
| Scott E. Wennerholm | |
| Nancy A. Wiser | |
| U.S. Customer Privacy Notice | March 2024 |
| FACTS | WHAT DOES EATON VANCE DO WITH YOUR PERSONAL INFORMATION? |
| Why? | Financial companies choose how they share your personal information. Federal law gives consumers the right to limit some but not all sharing. Federal law also requires us to tell you how we collect, share, and protect your personal information. Please read this notice carefully to understand what we do. |
| |
| What? | The types of personal information we collect and share depend on the product or service you have with us. This information can include:■ Social Security number and income
■ investment experience and risk tolerance
■ checking account information and wire transfer instructions |
| |
| How? | All financial companies need to share customers’ personal information to run their everyday business. In the section below, we list the reasons financial companies can share their customers’ personal information; the reasons Eaton Vance chooses to share; and whether you can limit this sharing. |
| Reasons we can share your personal information | Does Eaton Vance
share? | Can you limit
this sharing? |
| For our everyday business purposes — such as to process your transactions, maintain your account(s), respond to court orders and legal investigations, or report to credit bureaus | Yes | No |
| For our marketing purposes — to offer our products and services to you | Yes | No |
| For joint marketing with other financial companies | No | We don’t share |
| For our affiliates’ everyday business purposes — information about your transactions and experiences | Yes | No* |
| For our affiliates’ everyday business purposes — information about your creditworthiness | Yes | Yes* |
| For our affiliates to market to you | Yes | Yes* |
| For nonaffiliates to market to you | No | We don’t share |
To limit our
sharing | Call toll-free 1-800-262-1122 or email: EVPrivacy@eatonvance.comPlease note:If you are a new customer, we can begin sharing your information 30 days from the date we sent this notice. When you are no longer our customer, we continue to share your information as described in this notice. However, you can contact us at any time to limit our sharing. |
| Questions? | Call toll-free 1-800-262-1122 or email: EVPrivacy@eatonvance.com |
| U.S. Customer Privacy Notice — continued | March 2024 |
| Who we are |
| Who is providing this notice? | Eaton Vance Management and our investment management affiliates (“Eaton Vance”) (see Affiliates definition below.) |
| What we do |
How does Eaton Vance
protect my personal
information? | To protect your personal information from unauthorized access and use, we use security measures that comply with federal law. These measures include computer safeguards and secured files and buildings. We have policies governing the proper handling of customer information by personnel and requiring third parties that provide support to adhere to appropriate security standards with respect to such information. |
How does Eaton Vance
collect my personal
information? | We collect your personal information, for example, when you■ open an account or make deposits or withdrawals from your account
■ buy securities from us or make a wire transfer
■ give us your contact informationWe also collect your personal information from others, such as credit bureaus, affiliates, or other companies. |
| Why can’t I limit all sharing? | Federal law gives you the right to limit only■ sharing for affiliates’ everyday business purposes — information about your creditworthiness
■ affiliates from using your information to market to you
■ sharing for nonaffiliates to market to youState laws and individual companies may give you additional rights to limit sharing. (See below for more on your rights under state law.) |
What happens when I limit
sharing for an account I hold
jointly with someone else? | Your choices will apply to everyone on your account. |
| Definitions |
| Affiliates | Companies related by common ownership or control. They can be financial and nonfinancial companies.■ Our affiliates include registered investment advisers such as Eaton Vance Management, Eaton Vance Advisers International Ltd., Boston Management and Research, Calvert Research and Management, Parametric Portfolio Associates LLC, Atlanta Capital Management Company LLC, Morgan Stanley Investment Management Inc., Morgan Stanley Investment Management Co.; registered broker-dealers such as Morgan Stanley Distributors Inc. and Eaton Vance Distributors, Inc. (together, the “Investment Management Affiliates”); and companies with a Morgan Stanley name and financial companies such as Morgan Stanley Smith Barney LLC and Morgan Stanley & Co. (the “Morgan Stanley Affiliates”). |
| Nonaffiliates | Companies not related by common ownership or control. They can be financial and nonfinancial companies.■ Eaton Vance does not share with nonaffiliates so they can market to you. |
| Joint marketing | A formal agreement between nonaffiliated financial companies that together market financial products or services to you.■ Eaton Vance does not jointly market. |
| U.S. Customer Privacy Notice — continued | March 2024 |
| Other important information |
| *PLEASE NOTE: Eaton Vance does not share your creditworthiness information or your transactions and experiences information with the Morgan Stanley Affiliates, nor does Eaton Vance enable the Morgan Stanley Affiliates to market to you. Your opt outs will prevent Eaton Vance from sharing your creditworthiness information with the Investment Management Affiliates and will prevent the Investment Management Affiliates from marketing their products to you.Vermont: Except as permitted by law, we will not share personal information we collect about Vermont residents with Nonaffiliates unless you provide us with your written consent to share such information.California: Except as permitted by law, we will not share personal information we collect about California residents with Nonaffiliates and we will limit sharing such personal information with our Affiliates to comply with California privacy laws that apply to us. |
Delivery of Shareholder Documents. The Securities and Exchange Commission (SEC) permits funds to deliver only one copy of shareholder documents, including prospectuses, proxy statements and shareholder reports, to fund investors with multiple accounts at the same residential or post office box address. This practice is often called “householding” and it helps eliminate duplicate mailings to shareholders. Eaton Vance, or your financial intermediary, may household the mailing of your documents indefinitely unless you instruct Eaton Vance, or your financial intermediary, otherwise. If you would prefer that your Eaton Vance documents not be householded, please contact Eaton Vance at 1-800-262-1122, or contact your financial intermediary. Your instructions that householding not apply to delivery of your Eaton Vance documents will typically be effective within 30 days of receipt by Eaton Vance or your financial intermediary.
Portfolio Holdings. Each Eaton Vance Fund and its underlying Portfolio(s) (if applicable) files a schedule of portfolio holdings on Part F to Form N-PORT with the SEC. Certain information filed on Form N-PORT may be viewed on the Eaton Vance website at www.eatonvance.com, by calling Eaton Vance at 1-800-262-1122 or in the EDGAR database on the SEC’s website at www.sec.gov.
Proxy Voting. From time to time, funds are required to vote proxies related to the securities held by the funds. The Eaton Vance Funds or their underlying Portfolios (if applicable) vote proxies according to a set of policies and procedures approved by the Funds’ and Portfolios’ Boards. You may obtain a description of these policies and procedures and information on how the Funds or Portfolios voted proxies relating to portfolio securities during the most recent 12-month period ended June 30, without charge, upon request, by calling 1-800-262-1122 and by accessing the SEC’s website at www.sec.gov.
Tailored Shareholder Reports. Effective January 24, 2023, the SEC adopted rule and form amendments to require open-end mutual funds and ETFs to transmit concise and visually engaging streamlined annual and semi-annual reports to shareholders that highlight key information. Other information, including financial statements, will no longer appear in a streamlined shareholder report but must be available online, delivered free of charge upon request, and filed on a semi-annual basis on Form N-CSR. The rule and form amendments have a compliance date of July 24, 2024. At this time, management is evaluating the impact of these amendments on the shareholder reports for the Eaton Vance Funds.
This Page Intentionally Left Blank
This Page Intentionally Left Blank
This Page Intentionally Left Blank
Investment Adviser of Eaton Vance Floating Rate Portfolio
Boston Management and Research
One Post Office Square
Boston, MA 02109
Investment Adviser and Administrator of
Eaton Vance Floating-Rate Fund
Eaton Vance Management
One Post Office Square
Boston, MA 02109
Principal Underwriter*
Eaton Vance Distributors, Inc.
One Post Office Square
Boston, MA 02109
(617) 482-8260
Custodian
State Street Bank and Trust Company
One Congress Street, Suite 1
Boston, MA 02114-2016
Transfer Agent
BNY Mellon Investment Servicing (US) Inc.
Attn: Eaton Vance Funds
P.O. Box 534439
Pittsburgh, PA 15253-4439
(800) 262-1122
Fund Offices
One Post Office Square
Boston, MA 02109
* FINRA BrokerCheck. Investors may check the background of their Investment Professional by contacting the Financial Industry Regulatory Authority (FINRA). FINRA BrokerCheck is a free tool to help investors check the professional background of current and former FINRA-registered securities firms and brokers. FINRA BrokerCheck is available by calling 1-800-289-9999 and at www.FINRA.org. The FINRA BrokerCheck brochure describing this program is available to investors at www.FINRA.org.
Eaton Vance
Floating-Rate & High Income Fund
Semi-Annual Report
April 30, 2024
Commodity Futures Trading Commission Registration. The Commodity Futures Trading Commission (“CFTC”) has adopted regulations that subject registered investment companies and advisers to regulation by the CFTC if a fund invests more than a prescribed level of its assets in certain CFTC-regulated instruments (including futures, certain options and swap agreements) or markets itself as providing investment exposure to such instruments. The investment adviser has claimed an exclusion from the definition of “commodity pool operator” under the Commodity Exchange Act with respect to its management of the Fund. Accordingly, neither the Fund nor the adviser with respect to the operation of the Fund is subject to CFTC regulation. Because of its management of other strategies, the Fund's adviser is registered with the CFTC as a commodity pool operator. The adviser is also registered as a commodity trading advisor.
Fund shares are not insured by the FDIC and are not deposits or other obligations of, or guaranteed by, any depository institution. Shares are subject to investment risks, including possible loss of principal invested.
This report must be preceded or accompanied by a current summary prospectus or prospectus. Before investing, investors should consider carefully the investment objective, risks, and charges and expenses of a mutual fund. This and other important information is contained in the summary prospectus and prospectus, which can be obtained from a financial intermediary. Prospective investors should read the prospectus carefully before investing. For further information, please call 1-800-262-1122.
Semi-Annual Report April 30, 2024
Eaton Vance
Floating-Rate & High Income Fund
Eaton Vance
Floating-Rate & High Income Fund
April 30, 2024
Performance
Portfolio Manager(s) Kelley Gerrity, Stephen C. Concannon, CFA, Andrew N. Sveen, CFA, Jeffrey D. Mueller, Ralph Hinckley, CFA and Jake Lemle, CFA
| % Average Annual Total Returns1,2 | Class
Inception Date | Performance
Inception Date | Six Months | One Year | Five Years | Ten Years |
| Advisers Class at NAV | 09/07/2000 | 09/07/2000 | 6.39% | 9.96% | 3.95% | 3.82% |
| Class A at NAV | 05/07/2003 | 09/07/2000 | 6.37 | 9.98 | 3.95 | 3.83 |
| Class A with 3.25% Maximum Sales Charge | — | — | 2.91 | 6.42 | 3.27 | 3.49 |
| Class C at NAV | 09/05/2000 | 09/05/2000 | 5.87 | 9.14 | 3.17 | 3.20 |
| Class C with 1% Maximum Deferred Sales Charge | — | — | 4.87 | 8.14 | 3.17 | 3.20 |
| Class I at NAV | 09/15/2000 | 09/15/2000 | 6.51 | 10.36 | 4.21 | 4.08 |
| Class R6 at NAV | 06/27/2016 | 09/15/2000 | 6.55 | 10.44 | 4.27 | 4.13 |
|
| Morningstar® LSTA® US Leveraged Loan IndexSM | — | — | 6.05% | 11.97% | 5.26% | 4.59% |
| % Total Annual Operating Expense Ratios3 | Advisers Class | Class A | Class C | Class I | Class R6 |
| | 1.08% | 1.08% | 1.83% | 0.83% | 0.77% |
See Endnotes and Additional Disclosures in this report.
Past performance is no guarantee of future results. Returns are historical and are calculated by determining the percentage change in net asset value (NAV) or offering price (as applicable) with all distributions reinvested. Furthermore, returns do not reflect the deduction of taxes that shareholders may have to pay on Fund distributions or upon the redemption of Fund shares. Investment return and principal value will fluctuate so that shares, when redeemed, may be worth more or less than their original cost. Performance for periods less than or equal to one year is cumulative. Performance is for the stated time period only; due to market volatility, current Fund performance may be lower or higher than the quoted return. For performance as of the most recent month-end, please refer to eatonvance.com.
Eaton Vance
Floating-Rate & High Income Fund
April 30, 2024
| Asset Allocation (% of net assets)1,2 |
| Credit Quality (% of bonds, loans and asset-backed securities)3 |
Fund invests in one or more affiliated investment companies (Portfolios). Unless otherwise noted, references to investments are to the aggregate holdings of the Fund, including its pro rata share of each Portfolio or Fund in which it invests.
Footnotes:
| 1 | Net of unfunded loan commitments. |
| 2 | Other Net Assets represents other assets less liabilities and includes any investment type that represents less than 1% of net assets. |
| 3 | For Eaton Vance Floating Rate Portfolio’s investments, credit ratings are categorized using S&P Global Ratings (“S&P”). For High Income Opportunities Portfolio’s investments, ratings are based on Moody’s Investors Service, Inc. (“Moody’s”), S&P Global Ratings (“S&P”) or Fitch Ratings (“Fitch”), as applicable and this breakdown assigns a numeric equivalent to the ratings from the aforementioned agencies and the mean is rounded to the nearest integer and converted to an equivalent S& P major rating category. Ratings, which are subject to change, apply to the creditworthiness of the issuers of the underlying securities and not to the Fund or its shares. Credit ratings measure the quality of a bond based on the issuer’s creditworthiness, with ratings ranging from AAA, being the highest, to D, being the lowest based on S&P’s measures. Ratings of BBB or higher by S&P or Fitch (Baa or higher by Moody’s) are considered to be investment-grade quality. Credit ratings are based largely on the ratings agency’s analysis at the time of rating. The rating assigned to any particular security is not necessarily a reflection of the issuer’s current financial condition and does not necessarily reflect its assessment of the volatility of a security’s market value or of the liquidity of an investment in the security. Holdings designated as “Not Rated” (if any) are not rated by the national ratings agencies stated above. |
Eaton Vance
Floating-Rate & High Income Fund
April 30, 2024
Endnotes and Additional Disclosures
| 1 | Morningstar® LSTA® US Leveraged Loan IndexSM is an unmanaged index of the institutional leveraged loan market. Morningstar® LSTA® Leveraged Loan indices are a product of Morningstar, Inc. (“Morningstar”) and have been licensed for use. Morningstar® is a registered trademark of Morningstar licensed for certain use. Loan Syndications and Trading Association® and LSTA® are trademarks of the LSTA licensed for certain use by Morningstar, and further sublicensed by Morningstar for certain use. Neither Morningstar nor LSTA guarantees the accuracy and/or completeness of the Morningstar® LSTA® US Leveraged Loan IndexSM or any data included therein, and shall have no liability for any errors, omissions, or interruptions therein. Unless otherwise stated, index returns do not reflect the effect of any applicable sales charges, commissions, expenses, taxes or leverage, as applicable. It is not possible to invest directly in an index. |
| 2 | Total Returns at NAV do not include applicable sales charges. If sales charges were deducted, the returns would be lower. Total Returns shown with maximum sales charge reflect the stated maximum sales charge. Unless otherwise stated, performance does not reflect the deduction of taxes on Fund distributions or redemptions of Fund shares.Performance prior to the inception date of a class may be linked to the performance of an older class of the Fund. This linked performance is adjusted for any applicable sales charge, but is not adjusted for class expense differences. If adjusted for such differences, the performance would be different. The performance of Class R6 is linked to Class I. Performance presented in the Financial Highlights included in the financial statements is not linked.Effective November 5, 2020, Class C shares automatically convert to Class A shares eight years after purchase. The average annual total returns listed for Class C reflect conversion to Class A shares after eight years. Prior to November 5, 2020, Class C shares automatically converted to Class A shares ten years after purchase. |
| 3 | Source: Fund prospectus. The expense ratios for the current reporting period can be found in the Financial Highlights section of this report. Performance reflects expenses waived and/or reimbursed, if applicable. Without such waivers and/or reimbursements, performance would have been lower. |
| | Fund profile subject to change due to active management. |
Eaton Vance
Floating-Rate & High Income Fund
April 30, 2024
Example
As a Fund shareholder, you incur two types of costs: (1) transaction costs, including sales charges (loads) on purchases; and (2) ongoing costs, including management fees; distribution and/or service fees; and other Fund expenses. This Example is intended to help you understand your ongoing costs (in dollars) of Fund investing and to compare these costs with the ongoing costs of investing in other mutual funds. The Example is based on an investment of $1,000 invested at the beginning of the period and held for the entire period (November 1, 2023 to April 30, 2024).
Actual Expenses
The first section of the table below provides information about actual account values and actual expenses. You may use the information in this section, together with the amount you invested, to estimate the expenses that you paid over the period. Simply divide your account value by $1,000 (for example, an $8,600 account value divided by $1,000 = 8.6), then multiply the result by the number in the first section under the heading entitled “Expenses Paid During Period” to estimate the expenses you paid on your account during this period.
Hypothetical Example for Comparison Purposes
The second section of the table below provides information about hypothetical account values and hypothetical expenses based on the actual Fund expense ratio and an assumed rate of return of 5% per year (before expenses), which is not the actual Fund return. The hypothetical account values and expenses may not be used to estimate the actual ending account balance or expenses you paid for the period. You may use this information to compare the ongoing costs of investing in your Fund and other funds. To do so, compare this 5% hypothetical example with the 5% hypothetical examples that appear in the shareholder reports of the other funds.
Please note that the expenses shown in the table are meant to highlight your ongoing costs only and do not reflect any transactional costs, such as sales charges (loads). Therefore, the second section of the table is useful in comparing ongoing costs only, and will not help you determine the relative total costs of owning different funds. In addition, if these transactional costs were included, your costs would be higher.
| | Beginning
Account Value
(11/1/23) | Ending
Account Value
(4/30/24) | Expenses Paid
During Period*
(11/1/23 – 4/30/24) | Annualized
Expense
Ratio |
| Actual | | | | |
| Advisers Class | $1,000.00 | $1,063.90 | $5.59** | 1.09% |
| Class A | $1,000.00 | $1,063.70 | $5.59** | 1.09% |
| Class C | $1,000.00 | $1,058.70 | $9.42** | 1.84% |
| Class I | $1,000.00 | $1,065.10 | $4.31** | 0.84% |
| Class R6 | $1,000.00 | $1,065.50 | $3.95** | 0.77% |
| |
| Hypothetical | | | | |
| (5% return per year before expenses) | | | | |
| Advisers Class | $1,000.00 | $1,019.44 | $5.47** | 1.09% |
| Class A | $1,000.00 | $1,019.44 | $5.47** | 1.09% |
| Class C | $1,000.00 | $1,015.71 | $9.22** | 1.84% |
| Class I | $1,000.00 | $1,020.69 | $4.22** | 0.84% |
| Class R6 | $1,000.00 | $1,021.03 | $3.87** | 0.77% |
| * | Expenses are equal to the Fund's annualized expense ratio for the indicated Class, multiplied by the average account value over the period, multiplied by 182/366 (to reflect the one-half year period). The Example assumes that the $1,000 was invested at the net asset value per share determined at the close of business on October 31, 2023. The Example reflects the expenses of both the Fund and the Portfolios. |
| ** | Absent an allocation of certain expenses to affiliate(s), expenses would be higher. |
Eaton Vance
Floating-Rate & High Income Fund
April 30, 2024
Statement of Assets and Liabilities (Unaudited)
| | April 30, 2024 |
| Assets | |
Investment in Eaton Vance Floating Rate Portfolio, at value
(identified cost $833,577,332) | $ 769,827,397 |
Investment in High Income Opportunities Portfolio, at value
(identified cost $154,807,496) | 119,643,618 |
| Receivable for Fund shares sold | 1,243,300 |
| Receivable from affiliates | 5,400 |
| Total assets | $ 890,719,715 |
| Liabilities | |
| Payable for Fund shares redeemed | $ 3,277,932 |
| Distributions payable | 442,152 |
| Payable to affiliates: | |
| Administration fee | 109,880 |
| Distribution and service fees | 44,349 |
| Trustees' fees | 42 |
| Accrued expenses | 284,240 |
| Total liabilities | $ 4,158,595 |
| Net Assets | $ 886,561,120 |
| Sources of Net Assets | |
| Paid-in capital | $1,147,770,040 |
| Accumulated loss | (261,208,920) |
| Net Assets | $ 886,561,120 |
| Advisers Class Shares | |
| Net Assets | $ 37,366,989 |
| Shares Outstanding | 4,505,845 |
Net Asset Value, Offering Price and Redemption Price Per Share
(net assets ÷ shares of beneficial interest outstanding) | $ 8.29 |
| Class A Shares | |
| Net Assets | $ 112,939,784 |
| Shares Outstanding | 12,802,882 |
Net Asset Value and Redemption Price Per Share
(net assets ÷ shares of beneficial interest outstanding) | $ 8.82 |
Maximum Offering Price Per Share
(100 ÷ 96.75 of net asset value per share) | $ 9.12 |
| Class C Shares | |
| Net Assets | $ 16,068,029 |
| Shares Outstanding | 1,941,229 |
Net Asset Value and Offering Price Per Share*
(net assets ÷ shares of beneficial interest outstanding) | $ 8.28 |
| Class I Shares | |
| Net Assets | $ 689,361,821 |
| Shares Outstanding | 83,074,914 |
Net Asset Value, Offering Price and Redemption Price Per Share
(net assets ÷ shares of beneficial interest outstanding) | $ 8.30 |
6
See Notes to Financial Statements.
Eaton Vance
Floating-Rate & High Income Fund
April 30, 2024
Statement of Assets and Liabilities (Unaudited) — continued
| | April 30, 2024 |
| Class R6 Shares | |
| Net Assets | $30,824,497 |
| Shares Outstanding | 3,714,487 |
Net Asset Value, Offering Price and Redemption Price Per Share
(net assets ÷ shares of beneficial interest outstanding) | $ 8.30 |
| | On sales of $100,000 or more, the offering price of Class A shares is reduced. |
| * | Redemption price per share is equal to the net asset value less any applicable contingent deferred sales charge. |
7
See Notes to Financial Statements.
Eaton Vance
Floating-Rate & High Income Fund
April 30, 2024
Statement of Operations (Unaudited)
| | Six Months Ended |
| | April 30, 2024 |
| Investment Income | |
| Dividend income allocated from Portfolios (net of foreign taxes withheld of $75) | $ 841,607 |
| Interest income allocated from Portfolios (net of foreign taxes withheld of $170) | 40,581,055 |
| Other income allocated from Portfolios | 594,145 |
| Expenses, excluding interest and fees, allocated from Portfolios | (2,509,772) |
| Interest and fees allocated from Portfolios | (114,676) |
| Total investment income from Portfolios | $ 39,392,359 |
| Expenses | |
| Administration fee | $ 690,083 |
| Distribution and service fees: | |
| Advisers Class | 49,060 |
| Class A | 144,344 |
| Class C | 80,520 |
| Trustees’ fees and expenses | 250 |
| Custodian fee | 28,935 |
| Transfer and dividend disbursing agent fees | 367,972 |
| Legal and accounting services | 49,781 |
| Printing and postage | 40,279 |
| Registration fees | 47,432 |
| Miscellaneous | 11,890 |
| Total expenses | $ 1,510,546 |
| Deduct: | |
| Waiver and/or reimbursement of expenses by affiliates | $ 28,020 |
| Total expense reductions | $ 28,020 |
| Net expenses | $ 1,482,526 |
| Net investment income | $ 37,909,833 |
| Realized and Unrealized Gain (Loss) from Portfolios | |
| Net realized gain (loss): | |
| Investment transactions | $ (16,915,439) |
| Foreign currency transactions | (13,517) |
| Forward foreign currency exchange contracts | (216,388) |
| Net realized loss | $(17,145,344) |
| Change in unrealized appreciation (depreciation): | |
| Investments | $ 38,302,461 |
| Foreign currency | (265,667) |
| Forward foreign currency exchange contracts | 364,719 |
| Net change in unrealized appreciation (depreciation) | $ 38,401,513 |
| Net realized and unrealized gain | $ 21,256,169 |
| Net increase in net assets from operations | $ 59,166,002 |
8
See Notes to Financial Statements.
Eaton Vance
Floating-Rate & High Income Fund
April 30, 2024
Statements of Changes in Net Assets
| | Six Months Ended
April 30, 2024
(Unaudited) | Year Ended
October 31, 2023 |
| Increase (Decrease) in Net Assets | | |
| From operations: | | |
| Net investment income | $ 37,909,833 | $ 88,233,939 |
| Net realized loss | (17,145,344) | (46,162,605) |
| Net change in unrealized appreciation (depreciation) | 38,401,513 | 70,040,912 |
| Net increase in net assets from operations | $ 59,166,002 | $ 112,112,246 |
| Distributions to shareholders: | | |
| Advisers Class | $ (1,584,309) | $ (3,095,059) |
| Class A | (4,664,169) | (11,350,770) |
| Class C | (589,287) | (1,264,508) |
| Class I | (29,908,569) | (70,780,649) |
| Class R6 | (1,307,207) | (2,375,670) |
| Total distributions to shareholders | $ (38,053,541) | $ (88,866,656) |
| Transactions in shares of beneficial interest: | | |
| Advisers Class | $ (3,231,780) | $ (4,445,412) |
| Class A | (6,143,544) | (58,644,353) |
| Class C | (648,296) | (5,709,390) |
| Class I | (69,314,816) | (504,295,092) |
| Class R6 | (364,508) | (12,187,963) |
| Net decrease in net assets from Fund share transactions | $ (79,702,944) | $ (585,282,210) |
| Net decrease in net assets | $ (58,590,483) | $ (562,036,620) |
| Net Assets | | |
| At beginning of period | $ 945,151,603 | $1,507,188,223 |
| At end of period | $886,561,120 | $ 945,151,603 |
9
See Notes to Financial Statements.
Eaton Vance
Floating-Rate & High Income Fund
April 30, 2024
| | Advisers Class |
| | Six Months Ended
April 30, 2024
(Unaudited) | Year Ended October 31, |
| | 2023 | 2022 | 2021 | 2020 | 2019 |
| Net asset value — Beginning of period | $ 8.110 | $ 7.990 | $ 8.720 | $ 8.330 | $ 8.620 | $ 8.850 |
| Income (Loss) From Operations | | | | | | |
| Net investment income(1) | $ 0.331 | $ 0.604 | $ 0.336 | $ 0.282 | $ 0.324 | $ 0.408 |
| Net realized and unrealized gain (loss) | 0.181 | 0.125 | (0.727) | 0.395 | (0.277) | (0.228) |
| Total income (loss) from operations | $ 0.512 | $ 0.729 | $ (0.391) | $ 0.677 | $ 0.047 | $ 0.180 |
| Less Distributions | | | | | | |
| From net investment income | $ (0.332) | $ (0.609) | $ (0.339) | $ (0.287) | $ (0.337) | $ (0.410) |
| Total distributions | $ (0.332) | $ (0.609) | $ (0.339) | $ (0.287) | $ (0.337) | $ (0.410) |
| Net asset value — End of period | $ 8.290 | $ 8.110 | $ 7.990 | $ 8.720 | $ 8.330 | $ 8.620 |
| Total Return(2) | 6.39% (3)(4) | 9.35% | (4.56)% | 8.20% | 0.75% | 1.98% |
| Ratios/Supplemental Data | | | | | | |
| Net assets, end of period (000’s omitted) | $37,367 | $39,715 | $43,533 | $47,953 | $42,806 | $84,179 |
| Ratios (as a percentage of average daily net assets):(5) | | | | | | |
| Expenses | 1.09% (4)(6)(7)(8) | 1.08% (7) | 1.02% (7) | 1.04% | 1.08% | 1.04% |
| Net investment income | 8.05% (6) | 7.42% | 4.01% | 3.25% | 3.89% | 4.68% |
| Portfolio Turnover of the Fund(9) | 3% (3) | 3% | 24% | 9% | 8% | 5% |
| (1) | Computed using average shares outstanding. |
| (2) | Returns are historical and are calculated by determining the percentage change in net asset value with all distributions reinvested. |
| (3) | Not annualized. |
| (4) | The investment adviser reimbursed certain operating expenses (equal to less than 0.01% of average daily net assets for the six months ended April 30, 2024). Absent this reimbursement, total return would be lower. |
| (5) | Includes the Fund’s share of the Portfolios’ allocated expenses. |
| (6) | Annualized. |
| (7) | Includes a reduction by the investment adviser of a portion of the Portfolios' adviser fees due to the Portfolios' investment in the Liquidity Fund (equal to less than 0.005% of average daily net assets for the six months ended April 30, 2024 and the years ended October 31, 2023 and 2022). |
| (8) | Includes interest expense allocated from the Portfolios of 0.02% of average daily net assets for the six months ended April 30, 2024. |
| (9) | Percentage is based on the Fund’s contributions to and withdrawals from the Portfolios and excludes the investment activity of the Portfolios. |
10
See Notes to Financial Statements.
Eaton Vance
Floating-Rate & High Income Fund
April 30, 2024
Financial Highlights — continued
| | Class A |
| | Six Months Ended
April 30, 2024
(Unaudited) | Year Ended October 31, |
| | 2023 | 2022 | 2021 | 2020 | 2019 |
| Net asset value — Beginning of period | $ 8.630 | $ 8.500 | $ 9.280 | $ 8.870 | $ 9.160 | $ 9.410 |
| Income (Loss) From Operations | | | | | | |
| Net investment income(1) | $ 0.352 | $ 0.641 | $ 0.357 | $ 0.300 | $ 0.340 | $ 0.434 |
| Net realized and unrealized gain (loss) | 0.191 | 0.137 | (0.777) | 0.415 | (0.272) | (0.248) |
| Total income (loss) from operations | $ 0.543 | $ 0.778 | $ (0.420) | $ 0.715 | $ 0.068 | $ 0.186 |
| Less Distributions | | | | | | |
| From net investment income | $ (0.353) | $ (0.648) | $ (0.360) | $ (0.305) | $ (0.358) | $ (0.436) |
| Total distributions | $ (0.353) | $ (0.648) | $ (0.360) | $ (0.305) | $ (0.358) | $ (0.436) |
| Net asset value — End of period | $ 8.820 | $ 8.630 | $ 8.500 | $ 9.280 | $ 8.870 | $ 9.160 |
| Total Return(2) | 6.37% (3)(4) | 9.38% | (4.60)% | 8.14% | 0.83% | 2.04% |
| Ratios/Supplemental Data | | | | | | |
| Net assets, end of period (000’s omitted) | $112,940 | $116,469 | $172,307 | $187,279 | $181,561 | $195,385 |
| Ratios (as a percentage of average daily net assets):(5) | | | | | | |
| Expenses | 1.09% (4)(6)(7)(8) | 1.08% (7) | 1.02% (7) | 1.04% | 1.08% | 1.04% |
| Net investment income | 8.05% (6) | 7.40% | 4.01% | 3.25% | 3.84% | 4.69% |
| Portfolio Turnover of the Fund(9) | 3% (3) | 3% | 24% | 9% | 8% | 5% |
| (1) | Computed using average shares outstanding. |
| (2) | Returns are historical and are calculated by determining the percentage change in net asset value with all distributions reinvested and do not reflect the effect of sales charges. |
| (3) | Not annualized. |
| (4) | The investment adviser reimbursed certain operating expenses (equal to less than 0.01% of average daily net assets for the six months ended April 30, 2024). Absent this reimbursement, total return would be lower. |
| (5) | Includes the Fund’s share of the Portfolios’ allocated expenses. |
| (6) | Annualized. |
| (7) | Includes a reduction by the investment adviser of a portion of the Portfolios' adviser fees due to the Portfolios' investment in the Liquidity Fund (equal to less than 0.005% of average daily net assets for the six months ended April 30, 2024 and the years ended October 31, 2023 and 2022). |
| (8) | Includes interest expense allocated from the Portfolios of 0.02% of average daily net assets for the six months ended April 30, 2024. |
| (9) | Percentage is based on the Fund’s contributions to and withdrawals from the Portfolios and excludes the investment activity of the Portfolios. |
11
See Notes to Financial Statements.
Eaton Vance
Floating-Rate & High Income Fund
April 30, 2024
Financial Highlights — continued
| | Class C |
| | Six Months Ended
April 30, 2024
(Unaudited) | Year Ended October 31, |
| | 2023 | 2022 | 2021 | 2020 | 2019 |
| Net asset value — Beginning of period | $ 8.100 | $ 7.980 | $ 8.710 | $ 8.320 | $ 8.600 | $ 8.830 |
| Income (Loss) From Operations | | | | | | |
| Net investment income(1) | $ 0.299 | $ 0.540 | $ 0.271 | $ 0.218 | $ 0.259 | $ 0.341 |
| Net realized and unrealized gain (loss) | 0.182 | 0.127 | (0.726) | 0.394 | (0.264) | (0.227) |
| Total income (loss) from operations | $ 0.481 | $ 0.667 | $ (0.455) | $ 0.612 | $ (0.005) | $ 0.114 |
| Less Distributions | | | | | | |
| From net investment income | $ (0.301) | $ (0.547) | $ (0.275) | $ (0.222) | $ (0.275) | $ (0.344) |
| Total distributions | $ (0.301) | $ (0.547) | $ (0.275) | $ (0.222) | $ (0.275) | $ (0.344) |
| Net asset value — End of period | $ 8.280 | $ 8.100 | $ 7.980 | $ 8.710 | $ 8.320 | $ 8.600 |
| Total Return(2) | 5.87% (3)(4) | 8.68% | (5.40)% | 7.40% | (0.00)% (5) | 1.33% |
| Ratios/Supplemental Data | | | | | | |
| Net assets, end of period (000’s omitted) | $16,068 | $16,355 | $21,726 | $25,764 | $37,683 | $59,716 |
| Ratios (as a percentage of average daily net assets):(6) | | | | | | |
| Expenses | 1.84% (4)(7)(8)(9) | 1.83% (8) | 1.77% (8) | 1.79% | 1.83% | 1.79% |
| Net investment income | 7.29% (7) | 6.64% | 3.23% | 2.52% | 3.12% | 3.93% |
| Portfolio Turnover of the Fund(10) | 3% (3) | 3% | 24% | 9% | 8% | 5% |
| (1) | Computed using average shares outstanding. |
| (2) | Returns are historical and are calculated by determining the percentage change in net asset value with all distributions reinvested and do not reflect the effect of sales charges. |
| (3) | Not annualized. |
| (4) | The investment adviser reimbursed certain operating expenses (equal to less than 0.01% of average daily net assets for the six months ended April 30, 2024). Absent this reimbursement, total return would be lower. |
| (5) | Amount is less than (0.005)%. |
| (6) | Includes the Fund’s share of the Portfolios’ allocated expenses. |
| (7) | Annualized. |
| (8) | Includes a reduction by the investment adviser of a portion of the Portfolios' adviser fees due to the Portfolios' investment in the Liquidity Fund (equal to less than 0.005% of average daily net assets for the six months ended April 30, 2024 and the years ended October 31, 2023 and 2022). |
| (9) | Includes interest expense allocated from the Portfolios of 0.02% of average daily net assets for the six months ended April 30, 2024. |
| (10) | Percentage is based on the Fund’s contributions to and withdrawals from the Portfolios and excludes the investment activity of the Portfolios. |
12
See Notes to Financial Statements.
Eaton Vance
Floating-Rate & High Income Fund
April 30, 2024
Financial Highlights — continued
| | Class I |
| | Six Months Ended
April 30, 2024
(Unaudited) | Year Ended October 31, |
| | 2023 | 2022 | 2021 | 2020 | 2019 |
| Net asset value — Beginning of period | $ 8.120 | $ 8.000 | $ 8.730 | $ 8.340 | $ 8.620 | $ 8.850 |
| Income (Loss) From Operations | | | | | | |
| Net investment income(1) | $ 0.342 | $ 0.621 | $ 0.358 | $ 0.301 | $ 0.344 | $ 0.430 |
| Net realized and unrealized gain (loss) | 0.181 | 0.129 | (0.728) | 0.398 | (0.265) | (0.228) |
| Total income (loss) from operations | $ 0.523 | $ 0.750 | $ (0.370) | $ 0.699 | $ 0.079 | $ 0.202 |
| Less Distributions | | | | | | |
| From net investment income | $ (0.343) | $ (0.630) | $ (0.360) | $ (0.309) | $ (0.359) | $ (0.432) |
| Total distributions | $ (0.343) | $ (0.630) | $ (0.360) | $ (0.309) | $ (0.359) | $ (0.432) |
| Net asset value — End of period | $ 8.300 | $ 8.120 | $ 8.000 | $ 8.730 | $ 8.340 | $ 8.620 |
| Total Return(2) | 6.51% (3)(4) | 9.76% | (4.43)% | 8.47% | 1.01% | 2.35% |
| Ratios/Supplemental Data | | | | | | |
| Net assets, end of period (000’s omitted) | $689,362 | $742,105 | $1,227,499 | $1,187,123 | $546,479 | $808,175 |
| Ratios (as a percentage of average daily net assets):(5) | | | | | | |
| Expenses | 0.84% (4)(6)(7)(8) | 0.83% (7) | 0.77% (7) | 0.78% | 0.83% | 0.79% |
| Net investment income | 8.30% (6) | 7.63% | 4.27% | 3.47% | 4.12% | 4.94% |
| Portfolio Turnover of the Fund(9) | 3% (3) | 3% | 24% | 9% | 8% | 5% |
| (1) | Computed using average shares outstanding. |
| (2) | Returns are historical and are calculated by determining the percentage change in net asset value with all distributions reinvested. |
| (3) | Not annualized. |
| (4) | The investment adviser reimbursed certain operating expenses (equal to less than 0.01% of average daily net assets for the six months ended April 30, 2024). Absent this reimbursement, total return would be lower. |
| (5) | Includes the Fund’s share of the Portfolios’ allocated expenses. |
| (6) | Annualized. |
| (7) | Includes a reduction by the investment adviser of a portion of the Portfolios' adviser fees due to the Portfolios' investment in the Liquidity Fund (equal to less than 0.005% of average daily net assets for the six months ended April 30, 2024 and the years ended October 31, 2023 and 2022). |
| (8) | Includes interest expense allocated from the Portfolios of 0.02% of average daily net assets for the six months ended April 30, 2024. |
| (9) | Percentage is based on the Fund’s contributions to and withdrawals from the Portfolios and excludes the investment activity of the Portfolios. |
13
See Notes to Financial Statements.
Eaton Vance
Floating-Rate & High Income Fund
April 30, 2024
Financial Highlights — continued
| | Class R6 |
| | Six Months Ended
April 30, 2024
(Unaudited) | Year Ended October 31, |
| | 2023 | 2022 | 2021 | 2020 | 2019 |
| Net asset value — Beginning of period | $ 8.120 | $ 8.000 | $ 8.730 | $ 8.340 | $ 8.620 | $ 8.850 |
| Income (Loss) From Operations | | | | | | |
| Net investment income(1) | $ 0.344 | $ 0.630 | $ 0.364 | $ 0.312 | $ 0.349 | $ 0.435 |
| Net realized and unrealized gain (loss) | 0.182 | 0.125 | (0.730) | 0.393 | (0.267) | (0.228) |
| Total income (loss) from operations | $ 0.526 | $ 0.755 | $ (0.366) | $ 0.705 | $ 0.082 | $ 0.207 |
| Less Distributions | | | | | | |
| From net investment income | $ (0.346) | $ (0.635) | $ (0.364) | $ (0.315) | $ (0.362) | $ (0.437) |
| Total distributions | $ (0.346) | $ (0.635) | $ (0.364) | $ (0.315) | $ (0.362) | $ (0.437) |
| Net asset value — End of period | $ 8.300 | $ 8.120 | $ 8.000 | $ 8.730 | $ 8.340 | $ 8.620 |
| Total Return(2) | 6.55% (3)(4) | 9.83% | (4.38)% | 8.54% | 1.05% | 2.41% |
| Ratios/Supplemental Data | | | | | | |
| Net assets, end of period (000’s omitted) | $30,824 | $30,507 | $42,124 | $37,646 | $77,338 | $130,492 |
| Ratios (as a percentage of average daily net assets):(5) | | | | | | |
| Expenses | 0.77% (4)(6)(7)(8) | 0.77% (7) | 0.71% (7) | 0.74% | 0.79% | 0.73% |
| Net investment income | 8.36% (6) | 7.72% | 4.35% | 3.61% | 4.19% | 4.99% |
| Portfolio Turnover of the Fund(9) | 3% (3) | 3% | 24% | 9% | 8% | 5% |
| (1) | Computed using average shares outstanding. |
| (2) | Returns are historical and are calculated by determining the percentage change in net asset value with all distributions reinvested. |
| (3) | Not annualized. |
| (4) | The investment adviser reimbursed certain operating expenses (equal to less than 0.01% of average daily net assets for the six months ended April 30, 2024). Absent this reimbursement, total return would be lower. |
| (5) | Includes the Fund’s share of the Portfolios’ allocated expenses. |
| (6) | Annualized. |
| (7) | Includes a reduction by the investment adviser of a portion of the Portfolios' adviser fees due to the Portfolios' investment in the Liquidity Fund (equal to less than 0.005% of average daily net assets for the six months ended April 30, 2024 and the years ended October 31, 2023 and 2022). |
| (8) | Includes interest expense allocated from the Portfolios of 0.02% of average daily net assets for the six months ended April 30, 2024. |
| (9) | Percentage is based on the Fund’s contributions to and withdrawals from the Portfolios and excludes the investment activity of the Portfolios. |
14
See Notes to Financial Statements.
Eaton Vance
Floating-Rate & High Income Fund
April 30, 2024
Notes to Financial Statements (Unaudited)
1 Significant Accounting Policies
Eaton Vance Floating-Rate & High Income Fund (the Fund) is a diversified series of Eaton Vance Mutual Funds Trust (the Trust). The Trust is a Massachusetts business trust registered under the Investment Company Act of 1940, as amended (the 1940 Act), as an open-end management investment company. The Fund offers five classes of shares. Class A shares are generally sold subject to a sales charge imposed at time of purchase. Class C shares are sold at net asset value and are generally subject to a contingent deferred sales charge (see Note 5). Effective November 5, 2020, Class C shares automatically convert to Class A shares eight years after their purchase as described in the Fund’s prospectus. Advisers Class, Class I and Class R6 shares are sold at net asset value and are not subject to a sales charge. Each class represents a pro rata interest in the Fund, but votes separately on class-specific matters and (as noted below) is subject to different expenses. Realized and unrealized gains and losses are allocated daily to each class of shares based on the relative net assets of each class to the total net assets of the Fund. Net investment income, other than class-specific expenses, is allocated daily to each class of shares based upon the ratio of the value of each class’s paid shares to the total value of all paid shares. Sub-accounting, recordkeeping and similar administrative fees payable to financial intermediaries, which are a component of transfer and dividend disbursing agent fees on the Statement of Operations, are not allocated to Class R6 shares. Each class of shares differs in its distribution plan and certain other class-specific expenses. The Fund’s investment objective is to provide a high level of current income. The Fund currently pursues its objective by investing all of its investable assets in interests in two portfolios managed by Eaton Vance Management (EVM) or its affiliates (the Portfolios), which are Massachusetts business trusts. The value of the Fund’s investments in the Portfolios reflects the Fund’s proportionate interest in their net assets. The Portfolios and the Fund’s proportionate interest in each of their net assets at April 30, 2024 were as follows: Eaton Vance Floating Rate Portfolio (13.9%) and High Income Opportunities Portfolio (8.9%). The performance of the Fund is directly affected by the performance of the Portfolios. The financial statements of Eaton Vance Floating Rate Portfolio, including the portfolio of investments, are included elsewhere in this report and should be read in conjunction with the Fund’s financial statements. A copy of High Income Opportunities Portfolio’s financial statements is available by calling Eaton Vance at 1-800-262-1122 or in the EDGAR database on the Securities and Exchange Commission’s website at www.sec.gov.
The following is a summary of significant accounting policies of the Fund. The policies are in conformity with accounting principles generally accepted in the United States of America (U.S. GAAP). The Fund is an investment company and follows accounting and reporting guidance in the Financial Accounting Standards Board (FASB) Accounting Standards Codification Topic 946.
A Investment Valuation— Valuation of securities by Eaton Vance Floating Rate Portfolio is discussed in Note 1A of the Portfolio's Notes to Financial Statements, which are included elsewhere in this report. Such policies are consistent with those of High Income Opportunities Portfolio.
B Income—The Fund's net investment income or loss consists of the Fund's pro rata share of the net investment income or loss of the Portfolios, less all actual and accrued expenses of the Fund.
C Federal Taxes—The Fund's policy is to comply with the provisions of the Internal Revenue Code applicable to regulated investment companies and to distribute to shareholders each year substantially all of its net investment income, and all or substantially all of its net realized capital gains. Accordingly, no provision for federal income or excise tax is necessary.
As of April 30, 2024, the Fund had no uncertain tax positions that would require financial statement recognition, de-recognition, or disclosure. The Fund files a U.S. federal income tax return annually after its fiscal year-end, which is subject to examination by the Internal Revenue Service for a period of three years from the date of filing.
D Expenses—The majority of expenses of the Trust are directly identifiable to an individual fund. Expenses which are not readily identifiable to a specific fund are allocated taking into consideration, among other things, the nature and type of expense and the relative size of the funds.
E Use of Estimates—The preparation of the financial statements in conformity with U.S. GAAP requires management to make estimates and assumptions that affect the reported amounts of assets and liabilities at the date of the financial statements and the reported amounts of income and expense during the reporting period. Actual results could differ from those estimates.
F Indemnifications—Under the Trust’s organizational documents, its officers and Trustees may be indemnified against certain liabilities and expenses arising out of the performance of their duties to the Fund. Under Massachusetts law, if certain conditions prevail, shareholders of a Massachusetts business trust (such as the Trust) could be deemed to have personal liability for the obligations of the Trust. However, the Trust’s Declaration of Trust contains an express disclaimer of liability on the part of Fund shareholders and the By-laws provide that the Trust shall assume, upon request by the shareholder, the defense on behalf of any Fund shareholders. Moreover, the By-laws also provide for indemnification out of Fund property of any shareholder held personally liable solely by reason of being or having been a shareholder for all loss or expense arising from such liability. Additionally, in the normal course of business, the Fund enters into agreements with service providers that may contain indemnification clauses. The Fund’s maximum exposure under these arrangements is unknown as this would involve future claims that may be made against the Fund that have not yet occurred.
G Other—Investment transactions are accounted for on a trade date basis.
H Interim Financial Statements—The interim financial statements relating to April 30, 2024 and for the six months then ended have not been audited by an independent registered public accounting firm, but in the opinion of the Fund’s management, reflect all adjustments, consisting only of normal recurring adjustments, necessary for the fair presentation of the financial statements.
Eaton Vance
Floating-Rate & High Income Fund
April 30, 2024
Notes to Financial Statements (Unaudited) — continued
2 Distributions to Shareholders and Income Tax Information
The Fund declares dividends daily to shareholders of record at the time of declaration. Distributions are generally paid monthly. Distributions of realized capital gains are made at least annually. Distributions are declared separately for each class of shares. Shareholders may reinvest income and capital gain distributions in additional shares of the same class of the Fund at the net asset value as of the reinvestment date or, at the election of the shareholder, receive distributions in cash. Distributions to shareholders are determined in accordance with income tax regulations, which may differ from U.S. GAAP. As required by U.S. GAAP, only distributions in excess of tax basis earnings and profits are reported in the financial statements as a return of capital. Permanent differences between book and tax accounting relating to distributions are reclassified to paid-in capital. For tax purposes, distributions from short-term capital gains are considered to be from ordinary income.
At October 31, 2023, the Fund, for federal income tax purposes, had deferred capital losses of $190,111,294 which would reduce its taxable income arising from future net realized gains on investment transactions, if any, to the extent permitted by the Internal Revenue Code, and thus would reduce the amount of distributions to shareholders, which would otherwise be necessary to relieve the Fund of any liability for federal income or excise tax. The deferred capital losses are treated as arising on the first day of the Fund’s next taxable year and retain the same short-term or long-term character as when originally deferred. Of the deferred capital losses at October 31, 2023, $19,196,107 are short-term and $170,915,187 are long-term.
3 Investment Adviser Fee and Other Transactions with Affiliates
The investment adviser fee is earned by EVM, an indirect, wholly-owned subsidiary of Morgan Stanley, as compensation for investment advisory services rendered to the Fund. For bank loans and bank loan related assets, the investment adviser fee is computed based on the Fund’s daily net assets that are not invested in other investment companies for which EVM or its affiliates serve as investment adviser and receive an advisory fee at the following annual rates and is payable monthly:
| Average Daily Net Assets | Annual Fee Rate |
| Up to $1 billion | 0.5750% |
| $1 billion but less than $2 billion | 0.5250% |
| $2 billion but less than $5 billion | 0.4900% |
| $5 billion but less than $10 billion | 0.4600% |
| $10 billion but less than $15 billion | 0.4350% |
| $15 billion but less than $20 billion | 0.4150% |
| $20 billion but less than $25 billion | 0.4000% |
| $25 billion and over | 0.3900% |
For high yield bonds and other instruments that are not bank loan related, the fee is an aggregate of a daily asset-based fee and a daily income-based fee at the following rates:
| Total Daily Net Assets | Annual Asset
Rate | Daily Income
Rate |
| Up to $500 million | 0.3000% | 3.0000% |
| $500 million but less than $1 billion | 0.2750% | 2.7500% |
| $1 billion but less than $1.5 billion | 0.2500% | 2.5000% |
| $1.5 billion but less than $2 billion | 0.2250% | 2.2500% |
| $2 billion but less than $3 billion | 0.2000% | 2.0000% |
| $3 billion and over | 0.1750% | 1.7500% |
For the six months ended April 30, 2024, the Fund incurred no investment adviser fee on such assets. To the extent the Fund’s assets are invested in the Portfolios, the Fund is allocated its share of the Portfolios’ investment adviser fees. The Portfolios have engaged Boston Management and Research (BMR), an affiliate of EVM, to render investment advisory services. See Note 2 of the Portfolios’ Notes to Financial Statements. For the six months ended April 30, 2024, the Fund’s allocated portion of investment adviser fees paid by the Portfolios amounted to $2,327,224 or 0.51% (annualized) of the Fund’s average daily net assets. The administration fee is earned by EVM as compensation for administrative services rendered to the Fund. The fee is computed at an annual rate of 0.15% of the Fund’s average daily net assets. For the six months ended April 30, 2024, the administration fee amounted to $690,083.
The Portfolios may invest in a money market fund, the Institutional Class of the Morgan Stanley Institutional Liquidity Funds - Government Portfolio (the "Liquidity Fund"), an open-end management investment company managed by Morgan Stanley Investment Management Inc., a wholly-owned subsidiary of
Eaton Vance
Floating-Rate & High Income Fund
April 30, 2024
Notes to Financial Statements (Unaudited) — continued
Morgan Stanley. The investment adviser fee paid by the Portfolios is reduced by an amount equal to their pro rata share of the advisory and administration fees paid by the Portfolios due to their investments in the Liquidity Fund. For the six months ended April 30, 2024, the Fund’s allocated share of the reduction of the investment adviser fee paid by the Portfolios was $17,967 relating to the Portfolios’ investments in the Liquidity Fund.
Effective March 13, 2024, EVM has agreed to reimburse the Fund’s expenses to the extent that total annual operating expenses (relating to ordinary operating expenses only and excluding such expenses as brokerage commissions, acquired fund fees and expenses of unaffiliated funds, borrowing costs, taxes or litigation expenses) exceed 1.05%, 1.05%, 1.80%, 0.80% and 0.75% of the Fund’s average daily net assets for Advisers Class, Class A, Class C, Class I and Class R6, respectively. This agreement may be changed or terminated after March 1, 2025. Pursuant to this agreement, EVM was allocated $28,020 of the Fund’s operating expenses for the six months ended April 30, 2024.
EVM provides sub-transfer agency and related services to the Fund pursuant to a Sub-Transfer Agency Support Services Agreement. For the six months ended April 30, 2024, EVM earned $43,850 from the Fund pursuant to such agreement, which is included in transfer and dividend disbursing agent fees on the Statement of Operations. The Fund was informed that Eaton Vance Distributors, Inc. (EVD), an affiliate of EVM and the Fund's principal underwriter, received $2,789 as its portion of the sales charge on sales of Class A shares for the six months ended April 30, 2024. The Fund was informed that Morgan Stanley affiliated broker-dealers, which may be deemed to be affiliates of EVM, BMR and EVD, also received a portion of the sales charge on sales of Class A shares for the six months ended April 30, 2024 in the amount of $162. EVD also received distribution and service fees from Class A and Class C shares (see Note 4) and contingent deferred sales charges (see Note 5).
Trustees and officers of the Fund who are members of EVM’s or BMR's organizations receive remuneration for their services to the Fund out of the investment adviser fee. Certain officers and Trustees of the Fund and the Portfolios are officers of the above organizations.
4 Distribution Plans
The Fund has in effect distribution plans for the Advisers Class shares and Class A shares (Advisers/Class A Plan) pursuant to Rule 12b-1 under the 1940 Act. Pursuant to the Advisers/Class A Plan, the Fund pays EVD a distribution and service fee of 0.25% per annum of its average daily net assets attributable to Advisers Class shares and Class A shares for distribution services and facilities provided to the Fund by EVD, as well as for personal services and/or the maintenance of shareholder accounts. Distribution and service fees paid or accrued to EVD for the six months ended April 30, 2024 amounted to $49,060 for Advisers Class shares and $144,344 for Class A shares. The Fund also has in effect a distribution plan for Class C shares (Class C Plan) pursuant to Rule 12b-1 under the 1940 Act. Pursuant to the Class C Plan, the Fund pays EVD amounts equal to 0.75% per annum of its average daily net assets attributable to Class C shares for providing ongoing distribution services and facilities to the Fund. For the six months ended April 30, 2024, the Fund paid or accrued to EVD $60,390 for Class C shares.
Pursuant to the Class C Plan, the Fund also makes payments of service fees to EVD, financial intermediaries and other persons in amounts equal to 0.25% per annum of its average daily net assets attributable to Class C shares. Service fees paid or accrued are for personal services and/or the maintenance of shareholder accounts. They are separate and distinct from the sales commissions and distribution fees payable to EVD. Service fees paid or accrued for the six months ended April 30, 2024 amounted to $20,130 for Class C shares.
Distribution and service fees are subject to the limitations contained in the Financial Industry Regulatory Authority Rule 2341(d).
5 Contingent Deferred Sales Charges
A contingent deferred sales charge (CDSC) of 1% generally is imposed on redemptions of Class C shares made within 12 months of purchase. Class A shares may be subject to a 0.75% CDSC if redeemed within 12 months of purchase (depending on the circumstances of purchase). Generally, the CDSC is based upon the lower of the net asset value at date of redemption or date of purchase. No charge is levied on shares acquired by reinvestment of dividends or capital gain distributions. For the six months ended April 30, 2024, the Fund was informed that EVD received $2,266 of CDSCs paid by Class C shareholders and no CDSCs paid by Class A shareholders.
6 Investment Transactions
For the six months ended April 30, 2024, increases and decreases in the Fund's investments in the Portfolios were as follows:
| Portfolio | Contributions | Withdrawals |
| Eaton Vance Floating Rate Portfolio | $29,502,288 | $114,085,257 |
| High Income Opportunities Portfolio | 1,010,715 | 45,554,677 |
Eaton Vance
Floating-Rate & High Income Fund
April 30, 2024
Notes to Financial Statements (Unaudited) — continued
7 Shares of Beneficial Interest
The Fund’s Declaration of Trust permits the Trustees to issue an unlimited number of full and fractional shares of beneficial interest (without par value). Such shares may be issued in a number of different series (such as the Fund) and classes. Transactions in Fund shares, including direct exchanges pursuant to share class conversions, were as follows:
| | Six Months Ended
April 30, 2024
(Unaudited) | | Year Ended
October 31, 2023 |
| | Shares | Amount | | Shares | Amount |
| Advisers Class | | | | | |
| Sales | 258,263 | $ 2,136,764 | | 781,101 | $ 6,371,241 |
| Issued to shareholders electing to receive payments of distributions in Fund shares | 190,373 | 1,578,376 | | 377,850 | 3,081,066 |
| Redemptions | (839,494) | (6,946,920) | | (1,710,463) | (13,897,719) |
| Net decrease | (390,858) | $ (3,231,780) | | (551,512) | $ (4,445,412) |
| Class A | | | | | |
| Sales | 530,407 | $ 4,663,075 | | 2,841,220 | $ 24,588,771 |
| Issued to shareholders electing to receive payments of distributions in Fund shares | 461,632 | 4,072,007 | | 1,178,505 | 10,220,124 |
| Redemptions | (1,689,041) | (14,878,626) | | (10,791,599) | (93,453,248) |
| Net decrease | (697,002) | $ (6,143,544) | | (6,771,874) | $ (58,644,353) |
| Class C | | | | | |
| Sales | 312,855 | $ 2,592,280 | | 295,896 | $ 2,411,871 |
| Issued to shareholders electing to receive payments of distributions in Fund shares | 67,946 | 562,326 | | 145,386 | 1,182,941 |
| Redemptions | (459,956) | (3,802,902) | | (1,144,960) | (9,304,202) |
| Net decrease | (79,155) | $ (648,296) | | (703,678) | $ (5,709,390) |
| Class I | | | | | |
| Sales | 8,333,992 | $ 68,982,694 | | 25,825,099 | $ 210,646,813 |
| Issued to shareholders electing to receive payments of distributions in Fund shares | 3,342,524 | 27,734,561 | | 8,135,594 | 66,333,136 |
| Redemptions | (20,044,280) | (166,032,071) | | (96,043,686) | (781,275,041) |
| Net decrease | (8,367,764) | $ (69,314,816) | | (62,082,993) | $(504,295,092) |
| Class R6 | | | | | |
| Sales | 493,228 | $ 4,087,310 | | 948,220 | $ 7,745,894 |
| Issued to shareholders electing to receive payments of distributions in Fund shares | 156,524 | 1,298,881 | | 289,289 | 2,359,388 |
| Redemptions | (694,156) | (5,750,699) | | (2,746,908) | (22,293,245) |
| Net decrease | (44,404) | $ (364,508) | | (1,509,399) | $ (12,187,963) |
Eaton Vance
Floating-Rate & High Income Fund
April 30, 2024
Notes to Financial Statements (Unaudited) — continued
8 Fair Value Measurements
Under generally accepted accounting principles for fair value measurements, a three-tier hierarchy to prioritize the assumptions, referred to as inputs, is used in valuation techniques to measure fair value. The three-tier hierarchy of inputs is summarized in the three broad levels listed below.
| • | Level 1 – quoted prices in active markets for identical investments |
| • | Level 2 – other significant observable inputs (including quoted prices for similar investments, interest rates, prepayment speeds, credit risk, etc.) |
| • | Level 3 – significant unobservable inputs (including a fund's own assumptions in determining the fair value of investments) |
In cases where the inputs used to measure fair value fall in different levels of the fair value hierarchy, the level disclosed is determined based on the lowest level input that is significant to the fair value measurement in its entirety. The inputs or methodology used for valuing securities are not necessarily an indication of the risk associated with investing in those securities.
At April 30, 2024 and October 31, 2023, the Fund's investment in High Income Opportunities Portfolio, whose financial statements are not included but are available elsewhere as discussed in Note 1, and in Eaton Vance Floating Rate Portfolio were valued based on Level 1 inputs.
Eaton Vance
Floating Rate Portfolio
April 30, 2024
Portfolio of Investments (Unaudited)
| Asset-Backed Securities — 4.5% |
| Security | Principal
Amount
(000's omitted) | Value |
| Alinea CLO Ltd.: | | | |
| Series 2018-1A, Class D, 8.686%, (3 mo. SOFR + 3.362%), 7/20/31(1)(2) | $ | 2,500 | $ 2,504,680 |
| Series 2018-1A, Class E, 11.586%, (3 mo. SOFR + 6.262%), 7/20/31(1)(2) | | 3,000 | 2,966,955 |
| AMMC CLO XII Ltd., Series 2013-12A, Class ER, 11.743%, (3 mo. SOFR + 6.442%), 11/10/30(1)(2) | | 3,525 | 3,441,641 |
| AMMC CLO XV Ltd., Series 2014-15A, Class ERR, 12.50%, (3 mo. SOFR + 7.172%), 1/15/32(1)(2) | | 4,000 | 3,848,440 |
| Apidos CLO XX Ltd., Series 2015-20A, Class DR, 11.289%, (3 mo. SOFR + 5.962%), 7/16/31(1)(2) | | 2,375 | 2,381,847 |
| ARES Loan Funding II Ltd., Series 2022-ALF2A, Class ER, 13.565%, (3 mo. SOFR + 8.24%), 10/20/36(1)(2) | | 1,325 | 1,351,079 |
| ARES LVIII CLO Ltd., Series 2020-58A, Class ER, 12.029%, (3 mo. SOFR + 6.70%), 1/15/35(1)(2) | | 3,000 | 2,997,270 |
| ARES XLIX CLO Ltd., Series 2018-49A, Class D, 8.586%, (3 mo. SOFR + 3.262%), 7/22/30(1)(2) | | 2,500 | 2,501,970 |
| ARES XXXIIR CLO Ltd., Series 2014-32RA, Class C, 8.469%, (3 mo. SOFR + 3.162%), 5/15/30(1)(2) | | 5,000 | 5,000,845 |
| ARES XXXVR CLO Ltd., Series 2015-35RA, Class E, 11.29%, (3 mo. SOFR + 5.962%), 7/15/30(1)(2) | | 4,000 | 3,955,192 |
| Bain Capital Credit CLO Ltd.: | | | |
| Series 2018-1A, Class D, 8.288%, (3 mo. SOFR + 2.962%), 4/23/31(1)(2) | | 5,000 | 4,919,455 |
| Series 2018-1A, Class E, 10.938%, (3 mo. SOFR + 5.612%), 4/23/31(1)(2) | | 3,000 | 2,800,335 |
| Barings CLO Ltd.: | | | |
| Series 2015-1A, Class DR, 8.186%, (3 mo. SOFR + 2.862%), 1/20/31(1)(2) | | 2,500 | 2,499,900 |
| Series 2018-1A, Class C, 8.19%, (3 mo. SOFR + 2.862%), 4/15/31(1)(2) | | 3,500 | 3,443,625 |
| Battalion CLO XXII Ltd., Series 2021-22A, Class E, 12.536%, (3 mo. SOFR + 7.212%), 1/20/35(1)(2) | | 1,750 | 1,620,600 |
| Battalion CLO XXIII Ltd., Series 2022-23A, Class D, 9.279%, (3 mo. SOFR + 3.95%), 5/19/36(1)(2) | | 3,500 | 3,471,205 |
| Benefit Street Partners CLO VIII Ltd., Series 2015-8A, Class DR, 11.186%, (3 mo. SOFR + 5.862%), 1/20/31(1)(2) | | 5,401 | 5,345,445 |
| Benefit Street Partners CLO XIV Ltd., Series 2018-14A, Class D, 8.186%, (3 mo. SOFR + 2.862%), 4/20/31(1)(2) | | 1,500 | 1,502,513 |
| Benefit Street Partners CLO XVI Ltd., Series 2018-16A, Class E, 12.279%, (3 mo. SOFR + 6.962%), 1/17/32(1)(2) | | 1,250 | 1,255,481 |
| Security | Principal
Amount
(000's omitted) | Value |
| Benefit Street Partners CLO XVII Ltd., Series 2019-17A, Class ER, 11.94%, (3 mo. SOFR + 6.612%), 7/15/32(1)(2) | $ | 1,750 | $ 1,757,921 |
| Benefit Street Partners CLO XXII Ltd., Series 2020-22A, Class ER, 12.255%, (3 mo. SOFR + 6.93%), 4/20/35(1)(2) | | 1,000 | 1,003,100 |
| Benefit Street Partners CLO XXV Ltd., Series 2021-25A, Class E, 12.44%, (3 mo. SOFR + 7.112%), 1/15/35(1)(2) | | 3,000 | 3,008,664 |
| Betony CLO 2 Ltd.: | | | |
| Series 2018-1A, Class C, 8.491%, (3 mo. SOFR + 3.162%), 4/30/31(1)(2) | | 2,500 | 2,501,532 |
| Series 2018-1A, Class D, 11.241%, (3 mo. SOFR + 5.912%), 4/30/31(1)(2) | | 2,475 | 2,449,782 |
| BlueMountain CLO Ltd.: | | | |
| Series 2016-3A, Class DR, 8.669%, (3 mo. SOFR + 3.362%), 11/15/30(1)(2) | | 1,500 | 1,483,461 |
| Series 2016-3A, Class ER, 11.519%, (3 mo. SOFR + 6.212%), 11/15/30(1)(2) | | 1,500 | 1,441,254 |
| Series 2018-1A, Class D, 8.641%, (3 mo. SOFR + 3.312%), 7/30/30(1)(2) | | 2,500 | 2,442,440 |
| Series 2018-1A, Class E, 11.541%, (3 mo. SOFR + 6.212%), 7/30/30(1)(2) | | 2,000 | 1,829,416 |
| BlueMountain CLO XXIV Ltd., Series 2019-24A, Class ER, 12.426%, (3 mo. SOFR + 7.102%), 4/20/34(1)(2) | | 1,000 | 980,969 |
| BlueMountain CLO XXVI Ltd., Series 2019-26A, Class ER, 12.716%, (3 mo. SOFR + 7.392%), 10/20/34(1)(2) | | 3,000 | 2,946,033 |
| BlueMountain CLO XXX Ltd., Series 2020-30A, Class ER, 12.029%, (3 mo. SOFR + 6.70%), 4/15/35(1)(2) | | 2,000 | 1,955,000 |
| BlueMountain CLO XXXIII Ltd., Series 2021-33A, Class E, 12.411%, (3 mo. SOFR + 7.092%), 11/20/34(1)(2) | | 2,500 | 2,485,743 |
| BlueMountain CLO XXXV Ltd., Series 2022-35A, Class E, 13.075%, (3 mo. SOFR + 7.75%), 7/22/35(1)(2) | | 2,000 | 1,978,702 |
| Bryant Park Funding Ltd.: | | | |
| Series 2023-20A, Class D, 11.419%, (3 mo. SOFR + 6.09%), 7/15/36(1)(2) | | 3,500 | 3,573,220 |
| Series 2023-21A, Class D, 10.777%, (3 mo. SOFR + 5.45%), 10/18/36(1)(2) | | 3,525 | 3,575,823 |
| Canyon Capital CLO Ltd.: | | | |
| Series 2012-1RA, Class E, 11.29%, (3 mo. SOFR + 5.962%), 7/15/30(1)(2) | | 4,875 | 4,777,636 |
| Series 2016-1A, Class ER, 11.34%, (3 mo. SOFR + 6.012%), 7/15/31(1)(2) | | 4,000 | 3,923,540 |
| Series 2016-2A, Class ER, 11.59%, (3 mo. SOFR + 6.262%), 10/15/31(1)(2) | | 4,500 | 4,444,677 |
| Series 2017-1A, Class E, 11.84%, (3 mo. SOFR + 6.512%), 7/15/30(1)(2) | | 3,250 | 3,204,350 |
20
See Notes to Financial Statements.
Eaton Vance
Floating Rate Portfolio
April 30, 2024
Portfolio of Investments (Unaudited) — continued
| Security | Principal
Amount
(000's omitted) | Value |
| Canyon Capital CLO Ltd.: (continued) | | | |
| Series 2018-1A, Class D, 8.49%, (3 mo. SOFR + 3.162%), 7/15/31(1)(2) | $ | 3,000 | $ 2,964,834 |
| Series 2018-1A, Class E, 11.34%, (3 mo. SOFR + 6.012%), 7/15/31(1)(2) | | 2,750 | 2,701,875 |
| Series 2019-2A, Class ER, 12.34%, (3 mo. SOFR + 7.012%), 10/15/34(1)(2) | | 1,500 | 1,468,268 |
| Carlyle C17 CLO Ltd.: | | | |
| Series C17A, Class CR, 8.379%, (3 mo. SOFR + 3.062%), 4/30/31(1)(2) | | 5,000 | 4,968,750 |
| Series C17A, Class DR, 11.579%, (3 mo. SOFR + 6.262%), 4/30/31(1)(2) | | 3,500 | 3,407,106 |
| Carlyle Global Market Strategies CLO Ltd.: | | | |
| Series 2012-3A, Class CR2, 9.09%, (3 mo. SOFR + 3.762%), 1/14/32(1)(2) | | 2,500 | 2,504,097 |
| Series 2012-3A, Class DR2, 12.09%, (3 mo. SOFR + 6.762%), 1/14/32(1)(2) | | 1,500 | 1,479,825 |
| Series 2014-3RA, Class C, 8.537%, (3 mo. SOFR + 3.212%), 7/27/31(1)(2) | | 1,000 | 984,560 |
| Series 2014-3RA, Class D, 10.987%, (3 mo. SOFR + 5.662%), 7/27/31(1)(2) | | 2,150 | 2,104,841 |
| Series 2014-4RA, Class C, 8.49%, (3 mo. SOFR + 3.162%), 7/15/30(1)(2) | | 2,000 | 1,970,388 |
| Series 2014-4RA, Class D, 11.24%, (3 mo. SOFR + 5.912%), 7/15/30(1)(2) | | 1,500 | 1,451,039 |
| Carlyle U.S. CLO Ltd.: | | | |
| Series 2019-4A, Class DR, 11.929%, (3 mo. SOFR + 6.60%), 4/15/35(1)(2) | | 3,000 | 2,969,790 |
| Series 2022-6A, Class DR, 10.074%, (3 mo. SOFR + 4.75%), 10/25/36(1)(2) | | 2,200 | 2,235,961 |
| CarVal CLO IV Ltd., Series 2021-1A, Class E, 12.186%, (3 mo. SOFR + 6.862%), 7/20/34(1)(2) | | 1,000 | 1,003,442 |
| CIFC Funding Ltd., Series 2022-4A, Class D, 8.878%, (3 mo. SOFR + 3.55%), 7/16/35(1)(2) | | 1,750 | 1,754,998 |
| Dryden CLO Ltd.: | | | |
| Series 2018-55A, Class D, 8.44%, (3 mo. SOFR + 3.112%), 4/15/31(1)(2) | | 1,500 | 1,468,382 |
| Series 2018-55A, Class E, 10.99%, (3 mo. SOFR + 5.662%), 4/15/31(1)(2) | | 2,000 | 1,871,134 |
| Dryden Senior Loan Fund: | | | |
| Series 2015-41A, Class DR, 8.19%, (3 mo. SOFR + 2.862%), 4/15/31(1)(2) | | 5,000 | 4,880,890 |
| Series 2015-41A, Class ER, 10.89%, (3 mo. SOFR + 5.562%), 4/15/31(1)(2) | | 1,268 | 1,164,014 |
| Series 2016-42A, Class DR, 8.52%, (3 mo. SOFR + 3.192%), 7/15/30(1)(2) | | 2,500 | 2,487,423 |
| Series 2016-42A, Class ER, 11.14%, (3 mo. SOFR + 5.812%), 7/15/30(1)(2) | | 3,500 | 3,311,444 |
| Elmwood CLO 17 Ltd., Series 2022-4A, Class E, 12.467%, (3 mo. SOFR + 7.15%), 7/17/35(1)(2) | | 2,250 | 2,267,053 |
| Golub Capital Partners CLO 53B Ltd., Series 2021-53A, Class E, 12.286%, (3 mo. SOFR + 6.962%), 7/20/34(1)(2) | | 1,250 | 1,253,823 |
| Security | Principal
Amount
(000's omitted) | Value |
| Golub Capital Partners CLO 58B Ltd., Series 2021-58A, Class E, 12.395%, (3 mo. SOFR + 7.072%), 1/25/35(1)(2) | $ | 2,500 | $ 2,507,357 |
| HalseyPoint CLO 5 Ltd., Series 2021-5A, Class E, 12.531%, (3 mo. SOFR + 7.202%), 1/30/35(1)(2) | | 2,000 | 1,960,532 |
| Harriman Park CLO Ltd., Series 2020-1A, Class ER, 11.986%, (3 mo. SOFR + 6.662%), 4/20/34(1)(2) | | 1,000 | 1,004,415 |
| ICG U.S. CLO Ltd.: | | | |
| Series 2018-2A, Class D, 8.686%, (3 mo. SOFR + 3.362%), 7/22/31(1)(2) | | 2,000 | 1,992,268 |
| Series 2018-2A, Class E, 11.336%, (3 mo. SOFR + 6.012%), 7/22/31(1)(2) | | 3,000 | 2,727,978 |
| Madison Park Funding LIX Ltd., Series 2021-59A, Class E, 12.189%, (3 mo. SOFR + 6.862%), 1/18/34(1)(2) | | 1,450 | 1,454,598 |
| Madison Park Funding XXXVI Ltd., Series 2019-36A, Class ER, 12.379%, (3 mo. SOFR + 7.05%), 4/15/35(1)(2) | | 2,500 | 2,508,510 |
| Marble Point CLO XXIV Ltd., Series 2022-1A, Class D1, 9.565%, (3 mo. SOFR + 4.24%), 4/20/35(1)(2) | | 2,000 | 1,951,146 |
| Neuberger Berman CLO XXII Ltd.: | | | |
| Series 2016-22A, Class DR, 8.679%, (3 mo. SOFR + 3.362%), 10/17/30(1)(2) | | 2,500 | 2,504,072 |
| Series 2016-22A, Class ER, 11.639%, (3 mo. SOFR + 6.322%), 10/17/30(1)(2) | | 3,000 | 3,008,283 |
| Neuberger Berman Loan Advisers CLO 28 Ltd., Series 2018-28A, Class E, 11.186%, (3 mo. SOFR + 5.862%), 4/20/30(1)(2) | | 1,950 | 1,955,552 |
| Neuberger Berman Loan Advisers CLO 30 Ltd., Series 2018-30A, Class ER, 11.786%, (3 mo. SOFR + 6.462%), 1/20/31(1)(2) | | 1,000 | 1,003,245 |
| Neuberger Berman Loan Advisers CLO Ltd., Series 2022-48A, Class E, 11.824%, (3 mo. SOFR + 6.50%), 4/25/36(1)(2) | | 3,200 | 3,208,822 |
| OCP CLO Ltd.: | | | |
| Series 2022-24A, Class D, 9.125%, (3 mo. SOFR + 3.80%), 7/20/35(1)(2) | | 500 | 500,819 |
| Series 2022-24A, Class E, 12.745%, (3 mo. SOFR + 7.42%), 7/20/35(1)(2) | | 1,000 | 1,002,958 |
| Palmer Square CLO Ltd.: | | | |
| Series 2013-2A, Class DRR, 11.429%, (3 mo. SOFR + 6.112%), 10/17/31(1)(2) | | 1,325 | 1,328,521 |
| Series 2015-1A, Class DR4, 12.076%, (3 mo. SOFR + 6.762%), 5/21/34(1)(2) | | 2,000 | 2,005,212 |
| Series 2021-2A, Class E, 11.94%, (3 mo. SOFR + 6.612%), 7/15/34(1)(2) | | 1,000 | 1,002,878 |
| RAD CLO 5 Ltd., Series 2019-5A, Class E, 12.285%, (3 mo. SOFR + 6.962%), 7/24/32(1)(2) | | 1,250 | 1,241,879 |
| RAD CLO 14 Ltd., Series 2021-14A, Class E, 12.09%, (3 mo. SOFR + 6.762%), 1/15/35(1)(2) | | 950 | 952,731 |
21
See Notes to Financial Statements.
Eaton Vance
Floating Rate Portfolio
April 30, 2024
Portfolio of Investments (Unaudited) — continued
| Security | Principal
Amount
(000's omitted) | Value |
| Regatta XIII Funding Ltd.: | | | |
| Series 2018-2A, Class C, 8.69%, (3 mo. SOFR + 3.362%), 7/15/31(1)(2) | $ | 2,500 | $ 2,504,845 |
| Series 2018-2A, Class D, 11.54%, (3 mo. SOFR + 6.212%), 7/15/31(1)(2) | | 5,000 | 4,695,815 |
| Regatta XIV Funding Ltd.: | | | |
| Series 2018-3A, Class D, 8.785%, (3 mo. SOFR + 3.462%), 10/25/31(1)(2) | | 2,500 | 2,505,320 |
| Series 2018-3A, Class E, 11.535%, (3 mo. SOFR + 6.212%), 10/25/31(1)(2) | | 2,000 | 1,972,744 |
| Regatta XV Funding Ltd., Series 2018-4A, Class D, 12.085%, (3 mo. SOFR + 6.762%), 10/25/31(1)(2) | | 2,875 | 2,852,443 |
| Upland CLO Ltd.: | | | |
| Series 2016-1A, Class CR, 8.486%, (3 mo. SOFR + 3.162%), 4/20/31(1)(2) | | 4,500 | 4,505,679 |
| Series 2016-1A, Class DR, 11.486%, (3 mo. SOFR + 6.162%), 4/20/31(1)(2) | | 2,125 | 2,099,173 |
| Vibrant CLO IX, Ltd.: | | | |
| Series 2018-9A, Class C, 8.786%, (3 mo. SOFR + 3.462%), 7/20/31(1)(2) | | 2,500 | 2,493,255 |
| Series 2018-9A, Class D, 11.836%, (3 mo. SOFR + 6.512%), 7/20/31(1)(2) | | 3,500 | 3,295,351 |
| Voya CLO Ltd.: | | | |
| Series 2015-3A, Class CR, 8.736%, (3 mo. SOFR + 3.412%), 10/20/31(1)(2) | | 2,500 | 2,433,613 |
| Series 2015-3A, Class DR, 11.786%, (3 mo. SOFR + 6.462%), 10/20/31(1)(2) | | 5,500 | 4,921,092 |
| Series 2016-3A, Class CR, 8.839%, (3 mo. SOFR + 3.512%), 10/18/31(1)(2) | | 2,000 | 1,969,078 |
| Series 2016-3A, Class DR, 11.669%, (3 mo. SOFR + 6.342%), 10/18/31(1)(2) | | 2,375 | 2,322,622 |
| Series 2018-2A, Class E, 10.84%, (3 mo. SOFR + 5.512%), 7/15/31(1)(2) | | 2,500 | 2,297,605 |
| Webster Park CLO Ltd.: | | | |
| Series 2015-1A, Class CR, 8.486%, (3 mo. SOFR + 3.162%), 7/20/30(1)(2) | | 2,000 | 2,002,116 |
| Series 2015-1A, Class DR, 11.086%, (3 mo. SOFR + 5.762%), 7/20/30(1)(2) | | 2,500 | 2,469,478 |
| Wellfleet CLO Ltd.: | | | |
| Series 2021-1A, Class D, 9.086%, (3 mo. SOFR + 3.762%), 4/20/34(1)(2) | | 1,200 | 1,171,381 |
| Series 2021-3A, Class E, 12.69%, (3 mo. SOFR + 7.362%), 1/15/35(1)(2) | | 950 | 898,904 |
| Series 2022-1A, Class D, 9.469%, (3 mo. SOFR + 4.14%), 4/15/34(1)(2) | | 1,000 | 996,488 |
| Series 2022-1A, Class E, 13.189%, (3 mo. SOFR + 7.86%), 4/15/34(1)(2) | | 2,000 | 1,997,284 |
Total Asset-Backed Securities
(identified cost $252,088,878) | | | $ 248,471,740 |
| Security | Shares | Value |
| Aerospace and Defense — 0.0% |
| IAP Worldwide Services LLC(3)(4)(5)(6) | | 950 | $ 0 |
| IAP Worldwide Services LLC(3)(4)(5) | | 1,627 | 0 |
| | | | $ 0 |
| Chemicals — 0.0% |
| Flint Campfire Topco Ltd., Class A(4)(5)(6) | | 3,812,783 | $ 0 |
| | | | $ 0 |
| Commercial Services & Supplies — 0.1% |
| Monitronics International, Inc.(5)(6) | | 223,950 | $ 4,702,950 |
| Phoenix Services International LLC(5)(6) | | 168,954 | 865,889 |
| Phoenix Services International LLC(5)(6) | | 15,415 | 79,002 |
| | | | $ 5,647,841 |
| Containers and Glass Products — 0.0%(7) |
| LG Parent Holding Co.(5)(6) | | 250,979 | $ 1,419,587 |
| | | | $ 1,419,587 |
| Electronics/Electrical — 0.0%(7) |
| Skillsoft Corp.(5)(6) | | 44,676 | $ 321,220 |
| | | | $ 321,220 |
| Entertainment — 0.0%(7) |
| New Cineworld Ltd.(5)(6) | | 80,602 | $ 1,546,551 |
| | | | $ 1,546,551 |
| Health Care — 0.1% |
| Akorn Holding Co. LLC(4)(5)(6) | | 705,631 | $ 0 |
| Envision Parent, Inc.(5)(6) | | 778,264 | 5,496,490 |
| | | | $ 5,496,490 |
| Household Durables — 0.2% |
| Serta Simmons Bedding, Inc.(5)(6) | | 1,348,933 | $ 9,554,897 |
| Serta SSB Equipment Co.(4)(5)(6) | | 1,348,933 | 0 |
| | | | $ 9,554,897 |
| Investment Companies — 0.0%(7) |
| Aegletes BV(5)(6) | | 116,244 | $ 241,788 |
| | | | $ 241,788 |
22
See Notes to Financial Statements.
Eaton Vance
Floating Rate Portfolio
April 30, 2024
Portfolio of Investments (Unaudited) — continued
| Security | Shares | Value |
| Nonferrous Metals/Minerals — 0.2% |
| ACNR Holdings, Inc., Class A(5)(6) | | 141,193 | $ 11,736,668 |
| | | | $ 11,736,668 |
| Oil and Gas — 0.0%(7) |
| AFG Holdings, Inc.(4)(5)(6) | | 498,342 | $ 1,021,601 |
| McDermott International Ltd.(5)(6) | | 1,013,850 | 255,186 |
| | | | $ 1,276,787 |
| Pharmaceuticals — 0.3% |
| Covis Midco 1 SARL, Class A(5)(6) | | 8,008 | $ 4,084 |
| Covis Midco 1 SARL, Class B(5)(6) | | 8,008 | 4,084 |
| Covis Midco 1 SARL, Class C(5)(6) | | 8,008 | 4,084 |
| Covis Midco 1 SARL, Class D(5)(6) | | 8,008 | 4,084 |
| Covis Midco 1 SARL, Class E(5)(6) | | 8,008 | 4,084 |
| Mallinckrodt International Finance SA(5)(6) | | 250,308 | 13,203,747 |
| | | | $ 13,224,167 |
| Retail — 0.0% |
| Jubilee Enterprise PCL, Class A1(4)(5)(6) | | 2,897 | $ 0 |
| Jubilee Enterprise PCL, Class A2(4)(5)(6) | | 2,314,594 | 0 |
| | | | $ 0 |
| Retailers (Except Food and Drug) — 0.0%(7) |
| Phillips Feed Service, Inc.(4)(5)(6) | | 2,590 | $ 3,704 |
| | | | $ 3,704 |
| Telecommunications — 0.0% |
| GEE Acquisition Holdings Corp.(4)(5)(6) | | 364,650 | $ 0 |
| | | | $ 0 |
| Utilities — 0.0%(7) |
| Longview Intermediate Holdings LLC, Class A(6) | | 149,459 | $ 411,012 |
| | | | $ 411,012 |
Total Common Stocks
(identified cost $97,591,740) | | | $ 50,880,712 |
| Security | Principal
Amount*
(000's omitted) | Value |
| Aerospace and Defense — 0.4% |
| TransDigm, Inc.: | | | |
| 6.75%, 8/15/28(1) | | 3,175 | $ 3,192,460 |
| Security | Principal
Amount*
(000's omitted) | Value |
| Aerospace and Defense (continued) |
| TransDigm, Inc.: (continued) | | | |
| 6.875%, 12/15/30(1) | | 17,000 | $ 17,131,740 |
| | | | $ 20,324,200 |
| Air Transport — 0.5% |
| American Airlines, Inc./AAdvantage Loyalty IP Ltd.: | | | |
| 5.50%, 4/20/26(1) | | 8,117 | $ 8,029,975 |
| 5.75%, 4/20/29(1) | | 12,875 | 12,444,495 |
| United Airlines, Inc.: | | | |
| 4.375%, 4/15/26(1) | | 4,625 | 4,452,970 |
| 4.625%, 4/15/29(1) | | 4,625 | 4,267,207 |
| | | | $ 29,194,647 |
| Automotive — 0.1% |
| Adient Global Holdings Ltd., 7.00%, 4/15/28(1) | | 2,175 | $ 2,199,569 |
| Clarios Global LP, 6.75%, 5/15/25(1) | | 1,890 | 1,892,433 |
| Clarios Global LP/Clarios U.S. Finance Co., 6.25%, 5/15/26(1) | | 3,893 | 3,891,883 |
| | | | $ 7,983,885 |
| Building and Development — 0.1% |
| Miter Brands Acquisition Holdco, Inc./MIWD Borrower LLC, 6.75%, 4/1/32(1) | | 4,075 | $ 4,049,538 |
| Winnebago Industries, Inc., 6.25%, 7/15/28(1) | | 900 | 881,841 |
| | | | $ 4,931,379 |
| Business Equipment and Services — 0.3% |
| Allied Universal Holdco LLC/Allied Universal Finance Corp., 6.625%, 7/15/26(1) | | 853 | $ 851,611 |
| Allied Universal Holdco LLC/Allied Universal Finance Corp./Atlas Luxco 4 SARL: | | | |
| 4.625%, 6/1/28(1) | | 4,475 | 4,019,032 |
| 4.625%, 6/1/28(1) | | 15,725 | 14,142,112 |
| | | | $ 19,012,755 |
| Chemicals — 0.5% |
| INEOS Finance PLC: | | | |
| 3.375%, 3/31/26(1) | EUR | 1,250 | $ 1,310,231 |
| 7.50%, 4/15/29(1) | | 7,425 | 7,468,815 |
| Olympus Water U.S. Holding Corp.: | | | |
| 4.25%, 10/1/28(1) | | 9,350 | 8,434,824 |
| 7.125%, 10/1/27(1) | | 925 | 937,732 |
| 9.75%, 11/15/28(1) | | 8,600 | 9,136,370 |
| | | | $ 27,287,972 |
23
See Notes to Financial Statements.
Eaton Vance
Floating Rate Portfolio
April 30, 2024
Portfolio of Investments (Unaudited) — continued
| Security | Principal
Amount*
(000's omitted) | Value |
| Commercial Services — 0.4% |
| Neptune Bidco U.S., Inc., 9.29%, 4/15/29(1) | | 15,300 | $ 14,455,834 |
| Wand NewCo 3, Inc., 7.625%, 1/30/32(1) | | 5,250 | 5,341,589 |
| | | | $ 19,797,423 |
| Containers & Packaging — 0.2% |
| Pactiv Evergreen Group Issuer, Inc./Pactiv Evergreen Group Issuer LLC: | | | |
| 4.00%, 10/15/27(1) | | 5,150 | $ 4,783,246 |
| 4.375%, 10/15/28(1) | | 6,625 | 6,103,805 |
| | | | $ 10,887,051 |
| Diversified Financial Services — 0.3% |
| AG Issuer LLC, 6.25%, 3/1/28(1) | | 8,075 | $ 7,824,889 |
| AG TTMT Escrow Issuer LLC, 8.625%, 9/30/27(1) | | 2,925 | 3,015,909 |
| Aretec Group, Inc., 10.00%, 8/15/30(1) | | 4,225 | 4,594,511 |
| | | | $ 15,435,309 |
| Diversified Telecommunication Services — 0.7% |
| Altice France SA: | | | |
| 5.125%, 1/15/29(1) | | 1,300 | $ 850,656 |
| 5.125%, 7/15/29(1) | | 28,050 | 18,311,475 |
| 5.50%, 10/15/29(1) | | 6,455 | 4,232,994 |
| Level 3 Financing, Inc., 10.75%, 12/15/30(1) | | 11,225 | 11,302,940 |
| Virgin Media Secured Finance PLC, 4.50%, 8/15/30(1) | | 6,500 | 5,490,415 |
| | | | $ 40,188,480 |
| Drugs — 0.2% |
| Jazz Securities DAC, 4.375%, 1/15/29(1) | | 9,150 | $ 8,333,751 |
| | | | $ 8,333,751 |
| Ecological Services and Equipment — 0.1% |
| GFL Environmental, Inc., 4.25%, 6/1/25(1) | | 5,300 | $ 5,228,801 |
| | | | $ 5,228,801 |
| Electronics/Electrical — 0.3% |
| Imola Merger Corp., 4.75%, 5/15/29(1) | | 18,175 | $ 16,750,458 |
| | | | $ 16,750,458 |
| Engineering & Construction — 0.0%(7) |
| Artera Services LLC, 8.50%, 2/15/31(1) | | 1,175 | $ 1,203,240 |
| | | | $ 1,203,240 |
| Security | Principal
Amount*
(000's omitted) | Value |
| Entertainment — 0.1% |
| Caesars Entertainment, Inc., 6.50%, 2/15/32(1) | | 3,925 | $ 3,869,768 |
| Live Nation Entertainment, Inc., 3.75%, 1/15/28(1) | | 2,075 | 1,885,935 |
| Six Flags Theme Parks, Inc., 7.00%, 7/1/25(1) | | 1,070 | 1,073,132 |
| | | | $ 6,828,835 |
| Health Care — 0.5% |
| Medline Borrower LP, 3.875%, 4/1/29(1) | | 22,800 | $ 20,448,090 |
| Tenet Healthcare Corp., 4.25%, 6/1/29 | | 7,950 | 7,289,005 |
| | | | $ 27,737,095 |
| Hotels, Restaurants & Leisure — 0.6% |
| Carnival Corp., 4.00%, 8/1/28(1) | | 34,575 | $ 31,635,971 |
| SeaWorld Parks & Entertainment, Inc., 8.75%, 5/1/25(1) | | 2,125 | 2,125,000 |
| | | | $ 33,760,971 |
| Household Products — 0.2% |
| Kronos Acquisition Holdings, Inc./KIK Custom Products, Inc., 5.00%, 12/31/26(1) | | 14,212 | $ 13,745,513 |
| | | | $ 13,745,513 |
| Insurance — 0.6% |
| Alliant Holdings Intermediate LLC/Alliant Holdings Co-Issuer, 4.25%, 10/15/27(1) | | 700 | $ 653,525 |
| AmWINS Group, Inc., 6.375%, 2/15/29(1) | | 5,850 | 5,782,826 |
| Panther Escrow Issuer LLC, 7.125%, 6/1/31(1) | | 27,325 | 27,484,200 |
| | | | $ 33,920,551 |
| Internet Software & Services — 0.3% |
| Central Parent, Inc./CDK Global, Inc., 7.25%, 6/15/29(1) | | 13,700 | $ 13,859,331 |
| | | | $ 13,859,331 |
| Leisure Goods/Activities/Movies — 0.4% |
| Lindblad Expeditions LLC, 6.75%, 2/15/27(1) | | 3,300 | $ 3,271,843 |
| NCL Corp. Ltd., 5.875%, 2/15/27(1) | | 22,000 | 21,507,078 |
| | | | $ 24,778,921 |
| Machinery — 0.3% |
| Madison IAQ LLC, 4.125%, 6/30/28(1) | | 13,400 | $ 12,442,437 |
| TK Elevator U.S. Newco, Inc., 5.25%, 7/15/27(1) | | 7,150 | 6,847,043 |
| | | | $ 19,289,480 |
24
See Notes to Financial Statements.
Eaton Vance
Floating Rate Portfolio
April 30, 2024
Portfolio of Investments (Unaudited) — continued
| Security | Principal
Amount*
(000's omitted) | Value |
| Media — 0.3% |
| iHeartCommunications, Inc.: | | | |
| 4.75%, 1/15/28(1) | | 2,550 | $ 1,823,150 |
| 5.25%, 8/15/27(1) | | 2,125 | 1,560,950 |
| 6.375%, 5/1/26 | | 2,896 | 2,449,792 |
| Univision Communications, Inc., 4.50%, 5/1/29(1) | | 9,125 | 7,946,110 |
| | | | $ 13,780,002 |
| Oil, Gas & Consumable Fuels — 0.2% |
| CITGO Petroleum Corp., 7.00%, 6/15/25(1) | | 10,525 | $ 10,522,051 |
| | | | $ 10,522,051 |
| Professional Services — 0.1% |
| CoreLogic, Inc., 4.50%, 5/1/28(1) | | 5,525 | $ 4,785,296 |
| | | | $ 4,785,296 |
| Real Estate Investment Trusts (REITs) — 0.2% |
| Cushman & Wakefield U.S. Borrower LLC, 6.75%, 5/15/28(1) | | 6,393 | $ 6,308,352 |
| Park Intermediate Holdings LLC/PK Domestic Property LLC/PK Finance Co-Issuer, 5.875%, 10/1/28(1) | | 6,425 | 6,245,003 |
| | | | $ 12,553,355 |
| Retail — 0.3% |
| Fertitta Entertainment LLC/Fertitta Entertainment Finance Co., Inc., 4.625%, 1/15/29(1) | | 15,580 | $ 14,106,789 |
| | | | $ 14,106,789 |
| Retailers (Except Food and Drug) — 0.0%(7) |
| PetSmart, Inc./PetSmart Finance Corp., 4.75%, 2/15/28(1) | | 1,300 | $ 1,201,062 |
| | | | $ 1,201,062 |
| Software — 0.7% |
| Boxer Parent Co., Inc., 7.125%, 10/2/25(1) | | 4,225 | $ 4,232,739 |
| Cloud Software Group, Inc., 9.00%, 9/30/29(1) | | 13,600 | 13,096,667 |
| GoTo Group, Inc.: | | | |
| 5.50%, 5/1/28(1) | | 4,842 | 4,143,300 |
| 5.50%, 5/1/28(1) | | 4,842 | 3,250,498 |
| UKG, Inc., 6.875%, 2/1/31(1) | | 7,850 | 7,869,905 |
| Veritas U.S., Inc./Veritas Bermuda Ltd., 7.50%, 9/1/25(1) | | 4,900 | 4,462,153 |
| | | | $ 37,055,262 |
| Security | Principal
Amount*
(000's omitted) | Value |
| Technology — 0.2% |
| Clarivate Science Holdings Corp., 3.875%, 7/1/28(1) | | 11,400 | $ 10,391,095 |
| | | | $ 10,391,095 |
| Telecommunications — 0.2% |
| LCPR Senior Secured Financing DAC, 5.125%, 7/15/29(1) | | 6,075 | $ 5,079,799 |
| VMED O2 U.K. Financing I PLC, 4.25%, 1/31/31(1) | | 5,550 | 4,538,788 |
| | | | $ 9,618,587 |
| Wireless Telecommunication Services — 0.1% |
| Digicel Intermediate Holdings Ltd./Digicel International Finance Ltd./DIFL U.S., 10.50%, (9.00% cash, 1.50% PIK), 5/25/27 | | 6,327 | $ 6,141,837 |
| | | | $ 6,141,837 |
Total Corporate Bonds
(identified cost $553,255,645) | | | $ 520,635,384 |
| Exchange-Traded Funds — 0.3% |
| Security | Shares | Value |
| SPDR Blackstone Senior Loan ETF | | 426,000 | $ 17,883,480 |
Total Exchange-Traded Funds
(identified cost $19,593,026) | | | $ 17,883,480 |
| Senior Floating-Rate Loans — 81.8%(8) |
| Borrower/Description | Principal
Amount*
(000's omitted) | Value |
| Aerospace and Defense — 1.5% |
| Aernnova Aerospace SAU: | | | |
| Term Loan, 6.902%, (6 mo. EURIBOR + 3.00%), 2/26/27 | EUR | 1,194 | $ 1,268,798 |
| Term Loan, 6.952%, (3 mo. EURIBOR + 3.00%), 2/26/27 | EUR | 4,656 | 4,948,311 |
| Dynasty Acquisition Co., Inc.: | | | |
| Term Loan, 8.816%, (SOFR + 3.50%), 8/24/28 | | 24,068 | 24,207,950 |
| Term Loan, 8.816%, (SOFR + 3.50%), 8/24/28 | | 9,280 | 9,333,963 |
| IAP Worldwide Services, Inc., Term Loan - Second Lien, 12.152%, (3 mo. USD LIBOR + 6.50%), 7/18/23(4) | | 6,709 | 5,330,664 |
| TransDigm, Inc.: | | | |
| Term Loan, 8.059%, (SOFR + 2.75%), 8/24/28 | | 9,252 | 9,310,475 |
| Term Loan, 8.059%, (SOFR + 2.75%), 2/22/30 | | 27,474 | 27,627,260 |
| | | | $ 82,027,421 |
25
See Notes to Financial Statements.
Eaton Vance
Floating Rate Portfolio
April 30, 2024
Portfolio of Investments (Unaudited) — continued
| Borrower/Description | Principal
Amount*
(000's omitted) | Value |
| Airlines — 0.4% |
| American Airlines, Inc., Term Loan, 10.336%, (SOFR + 4.75%), 4/20/28 | | 22,100 | $ 23,015,382 |
| | | | $ 23,015,382 |
| Apparel & Luxury Goods — 0.5% |
| Gloves Buyer, Inc., Term Loan, 9.43%, (SOFR + 4.00%), 12/29/27 | | 12,060 | $ 12,089,787 |
| Hanesbrands, Inc., Term Loan, 9.066%, (SOFR + 3.75%), 3/8/30 | | 4,529 | 4,540,573 |
| Touchdown Acquirer, Inc.: | | | |
| Term Loan, 0.00%, 2/21/31(9) | | 1,600 | 1,609,000 |
| Term Loan, 7.929%, (3 mo. EURIBOR + 4.00%), 2/21/31 | EUR | 3,825 | 4,085,443 |
| Term Loan, 9.314%, (SOFR + 4.00%), 2/21/31 | | 7,425 | 7,466,766 |
| | | | $ 29,791,569 |
| Auto Components — 1.8% |
| Adient U.S. LLC, Term Loan, 8.066%, (SOFR + 2.75%), 1/31/31 | | 6,473 | $ 6,509,229 |
| Autokiniton U.S. Holdings, Inc., Term Loan, 9.43%, (SOFR + 4.00%), 4/6/28 | | 20,474 | 20,598,327 |
| Clarios Global LP, Term Loan, 7.098%, (1 mo. EURIBOR + 3.25%), 4/30/26 | EUR | 16,490 | 17,647,090 |
| DexKo Global, Inc.: | | | |
| Term Loan, 7.902%, (3 mo. EURIBOR + 4.00%), 10/4/28 | EUR | 3,272 | 3,454,765 |
| Term Loan, 7.902%, (3 mo. EURIBOR + 4.00%), 10/4/28 | EUR | 7,303 | 7,712,382 |
| Term Loan, 9.321%, (SOFR + 3.75%), 10/4/28 | | 9,319 | 9,264,739 |
| Garrett Motion, Inc., Term Loan, 9.83%, (SOFR + 4.50%), 4/30/28 | | 6,714 | 6,747,857 |
| LSF12 Badger Bidco LLC, Term Loan, 11.316%, (SOFR + 6.00%), 8/30/30 | | 3,092 | 3,111,577 |
| LTI Holdings, Inc., Term Loan, 10.18%, (SOFR + 4.75%), 7/24/26 | | 7,007 | 6,941,132 |
| RealTruck Group, Inc.: | | | |
| Term Loan, 8.93%, (SOFR + 3.50%), 1/31/28 | | 11,450 | 11,383,465 |
| Term Loan, 10.43%, (SOFR + 5.00%), 1/31/28 | | 7,125 | 7,104,216 |
| | | | $ 100,474,779 |
| Automobiles — 0.6% |
| Bombardier Recreational Products, Inc., Term Loan, 8.066%, (SOFR + 2.75%), 1/22/31 | | 17,028 | $ 17,054,857 |
| MajorDrive Holdings IV LLC: | | | |
| Term Loan, 9.571%, (SOFR + 4.00%), 6/1/28 | | 14,817 | 14,900,278 |
| Term Loan, 10.959%, (SOFR + 5.50%), 6/1/29 | | 2,130 | 2,146,838 |
| | | | $ 34,101,973 |
| Borrower/Description | Principal
Amount*
(000's omitted) | Value |
| Beverages — 0.7% |
| City Brewing Co. LLC: | | | |
| Term Loan, 9.09%, (SOFR + 3.50%), 4/5/28 | | 6,994 | $ 6,434,269 |
| Term Loan, 11.574%, (SOFR + 6.25%), 4/5/28 | | 4,781 | 4,768,985 |
| Term Loan - Second Lien, 10.59%, (SOFR + 5.00%), 9.09% cash, 1.50% PIK, 4/5/28 | | 7,744 | 5,652,953 |
| Triton Water Holdings, Inc., Term Loan, 8.814%, (SOFR + 3.25%), 3/31/28 | | 21,049 | 20,982,922 |
| | | | $ 37,839,129 |
| Biotechnology — 0.5% |
| Alkermes, Inc., Term Loan, 7.93%, (SOFR + 2.50%), 3/12/26 | | 18,084 | $ 18,174,703 |
| Alltech, Inc., Term Loan, 9.43%, (SOFR + 4.00%), 10/13/28 | | 4,712 | 4,688,596 |
| Grifols Worldwide Operations USA, Inc., Term Loan, 7.459%, (SOFR + 2.00%), 11/15/27 | | 4,417 | 4,327,220 |
| | | | $ 27,190,519 |
| Building Products — 0.6% |
| Cornerstone Building Brands, Inc., Term Loan, 8.671%, (SOFR + 3.25%), 4/12/28 | | 6,025 | $ 5,917,178 |
| CPG International, Inc., Term Loan, 7.916%, (SOFR + 2.50%), 4/28/29 | | 5,589 | 5,604,695 |
| LHS Borrower LLC, Term Loan, 10.166%, (SOFR + 4.75%), 2/16/29 | | 5,797 | 5,605,684 |
| MI Windows and Doors LLC, Term Loan, 8.816%, (SOFR + 3.50%), 3/28/31 | | 12,400 | 12,471,300 |
| Oscar AcquisitionCo LLC, Term Loan, 9.902%, (SOFR + 4.50%), 4/29/29 | | 1,590 | 1,598,245 |
| Standard Industries, Inc., Term Loan, 7.68%, (SOFR + 2.25%), 9/22/28 | | 3,788 | 3,802,109 |
| | | | $ 34,999,211 |
| Capital Markets — 4.1% |
| Advisor Group, Inc., Term Loan, 9.816%, (SOFR + 4.50%), 8/17/28 | | 22,170 | $ 22,317,739 |
| AllSpring Buyer LLC, Term Loan, 8.677%, (SOFR + 3.25%), 11/1/28 | | 6,188 | 6,177,910 |
| Aretec Group, Inc., Term Loan, 9.916%, (SOFR + 4.50%), 8/9/30 | | 26,992 | 27,157,280 |
| CeramTec AcquiCo GmbH, Term Loan, 7.452%, (3 mo. EURIBOR + 3.50%), 3/16/29 | EUR | 12,779 | 13,620,729 |
| Citco Funding LLC, Term Loan, 8.422%, (SOFR + 3.25%), 4/27/28 | | 8,134 | 8,173,104 |
| Edelman Financial Center LLC: | | | |
| Term Loan, 8.93%, (SOFR + 3.50%), 4/7/28 | | 18,804 | 18,834,104 |
| Term Loan - Second Lien, 7/20/26(10) | | 3,300 | 3,319,153 |
26
See Notes to Financial Statements.
Eaton Vance
Floating Rate Portfolio
April 30, 2024
Portfolio of Investments (Unaudited) — continued
| Borrower/Description | Principal
Amount*
(000's omitted) | Value |
| Capital Markets (continued) |
| EIG Management Co. LLC, Term Loan, 9.166%, (SOFR + 3.75%), 2/22/25 | | 2,844 | $ 2,841,723 |
| FinCo I LLC, Term Loan, 8.33%, (SOFR + 3.00%), 6/27/29 | | 12,754 | 12,805,430 |
| Focus Financial Partners LLC: | | | |
| Term Loan, 7.816%, (SOFR + 2.50%), 6/30/28 | | 9,827 | 9,827,544 |
| Term Loan, 8.066%, (SOFR + 2.75%), 6/30/28 | | 28,395 | 28,424,855 |
| Franklin Square Holdings LP, Term Loan, 7.568%, (SOFR + 2.25%), 4/25/31 | | 9,825 | 9,831,141 |
| Guggenheim Partners LLC, Term Loan, 8.552%, (SOFR + 3.25%), 12/12/29 | | 19,133 | 19,255,000 |
| HighTower Holdings LLC, Term Loan, 9.586%, (SOFR + 4.00%), 4/21/28 | | 2,661 | 2,677,986 |
| Kestra Advisor Services Holdings A, Inc., Term Loan, 9.316%, (SOFR + 4.00%), 3/22/31 | | 6,275 | 6,313,240 |
| LPL Holdings, Inc., Term Loan, 7.179%, (SOFR + 1.75%), 11/12/26 | | 10,729 | 10,746,859 |
| Mariner Wealth Advisors LLC, Term Loan, 8.68%, (SOFR + 3.25%), 8/18/28 | | 13,383 | 13,399,736 |
| Press Ganey Holdings, Inc., Term Loan, 4/24/31(10) | | 6,200 | 6,188,375 |
| Victory Capital Holdings, Inc., Term Loan, 7.652%, (SOFR + 2.25%), 12/29/28 | | 6,839 | 6,843,198 |
| | | | $ 228,755,106 |
| Chemicals — 4.4% |
| Axalta Coating Systems U.S. Holdings, Inc., Term Loan, 7.33%, (SOFR + 2.00%), 12/20/29 | | 16,873 | $ 16,937,107 |
| CPC Acquisition Corp., Term Loan, 9.321%, (SOFR + 3.75%), 12/29/27 | | 14,714 | 12,488,403 |
| ECO Services Operations Corp., Term Loan, 7.93%, (SOFR + 2.50%), 6/9/28 | | 8,623 | 8,629,362 |
| Flint Group Midco Ltd., Term Loan, 10.588%, (SOFR + 5.26%), 9.838% cash, 0.75% PIK, 12/31/26 | | 5,001 | 4,790,576 |
| Flint Group Packaging INKS North America Holdings LLC: | | | |
| Term Loan, 8.892%, (3 mo. EURIBOR + 5.00%), 8.142% cash, 0.75% PIK, 12/31/26 | EUR | 1,552 | 1,586,565 |
| Term Loan, 10.892%, (3 mo. EURIBOR + 7.00%), 3.992% cash, 6.90% PIK, 12/30/27 | EUR | 792 | 699,802 |
| Term Loan - Second Lien, 10.892%, (3 mo. EURIBOR + 7.00%), 3.992% cash, 6.90% PIK, 12/30/27 | EUR | 1,055 | 175,651 |
| Flint Group Topco Ltd.: | | | |
| Term Loan, 12.588%, (SOFR + 7.262%), 5.688% cash, 6.90% PIK, 12/31/27 | | 2,586 | 2,140,290 |
| Term Loan - Second Lien, 12.588%, (SOFR + 7.262%), 5.688% cash, 6.90% PIK, 12/31/27 | | 3,391 | 528,973 |
| Borrower/Description | Principal
Amount*
(000's omitted) | Value |
| Chemicals (continued) |
| Gemini HDPE LLC, Term Loan, 8.591%, (SOFR + 3.00%), 12/31/27 | | 4,571 | $ 4,579,945 |
| GEON Performance Solutions LLC, Term Loan, 10.314%, (SOFR + 4.75%), 8/18/28 | | 5,631 | 5,655,980 |
| Groupe Solmax, Inc., Term Loan, 10.252%, (SOFR + 4.75%), 5/29/28(11) | | 9,344 | 9,221,051 |
| INEOS Enterprises Holdings II Ltd., Term Loan, 7.952%, (3 mo. EURIBOR + 4.00%), 7/7/30 | EUR | 1,975 | 2,115,625 |
| INEOS Enterprises Holdings U.S. Finco LLC, Term Loan, 9.193%, (SOFR + 3.75%), 7/8/30 | | 10,898 | 10,938,554 |
| INEOS Finance PLC: | | | |
| Term Loan, 6.598%, (1 mo. EURIBOR + 2.75%), 11/8/28 | EUR | 8,900 | 9,460,093 |
| Term Loan, 7.848%, (1 mo. EURIBOR + 4.00%), 11/8/27 | EUR | 6,200 | 6,639,287 |
| INEOS Quattro Holdings U.K. Ltd.: | | | |
| Term Loan, 6.598%, (1 mo. EURIBOR + 2.75%), 1/29/26 | EUR | 1,290 | 1,378,295 |
| Term Loan, 7.848%, (1 mo. EURIBOR + 4.00%), 3/14/30 | EUR | 3,300 | 3,496,606 |
| Term Loan, 9.18%, (SOFR + 3.75%), 3/14/30 | | 4,963 | 4,959,399 |
| INEOS U.S. Finance LLC: | | | |
| Term Loan, 8.916%, (SOFR + 3.50%), 2/18/30 | | 20,549 | 20,613,285 |
| Term Loan, 9.066%, (SOFR + 3.75%), 2/7/31 | | 5,275 | 5,298,078 |
| Term Loan, 9.166%, (SOFR + 3.75%), 11/8/27 | | 2,624 | 2,631,229 |
| Kraton Corp., Term Loan, 8.841%, (SOFR + 3.25%), 3/15/29 | | 5,586 | 5,374,782 |
| Kraton Polymers Holdings BV, Term Loan, 7.188%, (3 mo. EURIBOR + 3.25%), 3/15/29 | EUR | 4,250 | 4,395,280 |
| Lonza Group AG: | | | |
| Term Loan, 7.827%, (3 mo. EURIBOR + 3.93%), 7/3/28 | EUR | 4,600 | 4,595,287 |
| Term Loan, 9.334%, (SOFR + 3.93%), 7/3/28 | | 10,712 | 10,293,543 |
| Momentive Performance Materials, Inc., Term Loan, 9.817%, (SOFR + 4.50%), 3/29/28 | | 21,477 | 21,382,923 |
| Olympus Water U.S. Holding Corp.: | | | |
| Term Loan, 9.321%, (SOFR + 3.75%), 11/9/28 | | 3,927 | 3,940,057 |
| Term Loan, 9.576%, (SOFR + 4.25%), 11/9/28 | | 5,317 | 5,341,896 |
| Orion Engineered Carbons GmbH, Term Loan, 6.302%, (3 mo. EURIBOR + 2.40%), 9/24/28 | EUR | 1,250 | 1,318,159 |
| Rohm Holding GmbH: | | | |
| Term Loan, 8.366%, (6 mo. EURIBOR + 4.50%), 7/31/26 | EUR | 1,000 | 1,011,840 |
| Term Loan, 8.366%, (6 mo. EURIBOR + 4.50%), 7/31/26 | EUR | 10,800 | 10,927,867 |
| Term Loan, 10.581%, (SOFR + 5.00%), 7/31/26 | | 13,712 | 12,957,530 |
| SCUR-Alpha 1503 GmbH, Term Loan, 10.83%, (SOFR + 5.50%), 3/29/30 | | 8,437 | 7,825,626 |
27
See Notes to Financial Statements.
Eaton Vance
Floating Rate Portfolio
April 30, 2024
Portfolio of Investments (Unaudited) — continued
| Borrower/Description | Principal
Amount*
(000's omitted) | Value |
| Chemicals (continued) |
| Tronox Finance LLC: | | | |
| Term Loan, 8.041%, (SOFR + 2.50%), 3/10/28(11) | | 11,570 | $ 11,583,144 |
| Term Loan, 8.552%, (SOFR + 3.25%), 4/4/29 | | 3,602 | 3,612,193 |
| Term Loan, 8.816%, (SOFR + 3.50%), 8/16/28 | | 5,062 | 5,079,185 |
| | | | $ 244,603,468 |
| Commercial Services & Supplies — 1.6% |
| Albion Financing 3 SARL: | | | |
| Term Loan, 10.575%, (SOFR + 5.25%), 8/17/26 | | 3,444 | $ 3,467,885 |
| Term Loan, 10.824%, (SOFR + 5.50%), 8/17/26 | | 3,490 | 3,511,561 |
| Belfor Holdings, Inc., Term Loan, 9.066%, (SOFR + 3.75%), 11/1/30 | | 6,176 | 6,202,344 |
| EnergySolutions LLC, Term Loan, 9.316%, (SOFR + 4.00%), 9/20/30 | | 16,227 | 16,313,222 |
| Foundever Group, Term Loan, 7.60%, (1 mo. EURIBOR + 3.75%), 8/28/28 | EUR | 3,925 | 3,436,092 |
| Foundever Worldwide Corp., Term Loan, 9.18%, (SOFR + 3.75%), 8/28/28 | | 16,373 | 12,738,702 |
| GFL Environmental, Inc., Term Loan, 7.826%, (SOFR + 2.50%), 5/31/27 | | 4,259 | 4,282,451 |
| Harsco Corp., Term Loan, 7.68%, (SOFR + 2.25%), 3/10/28 | | 881 | 880,020 |
| Heritage-Crystal Clean, Inc., Term Loan, 9.816%, (SOFR + 4.50%), 10/17/30 | | 7,307 | 7,335,227 |
| Monitronics International, Inc., Term Loan, 13.091%, (SOFR + 7.50%), 6/30/28 | | 12,281 | 12,265,368 |
| Phoenix Services International LLC, Term Loan, 11.418%, (SOFR + 6.10%), 6/30/28 | | 2,063 | 1,928,567 |
| Tempo Acquisition LLC, Term Loan, 8.066%, (SOFR + 2.75%), 8/31/28 | | 2,450 | 2,460,001 |
| TMF Group Holding BV, Term Loan, 9.306%, (SOFR + 4.00%), 5/3/28 | | 4,638 | 4,661,567 |
| TruGreen LP, Term Loan, 9.416%, (SOFR + 4.00%), 11/2/27 | | 8,356 | 8,048,859 |
| | | | $ 87,531,866 |
| Construction Materials — 0.5% |
| Quikrete Holdings, Inc.: | | | |
| Term Loan, 7.569%, (SOFR + 2.25%), 3/19/29 | | 20,517 | $ 20,547,124 |
| Term Loan, 7.819%, (SOFR + 2.50%), 4/14/31 | | 5,394 | 5,404,882 |
| U.S. Silica Co., Term Loan, 9.316%, (SOFR + 4.00%), 3/25/30 | | 3,242 | 3,247,887 |
| | | | $ 29,199,893 |
| Borrower/Description | Principal
Amount*
(000's omitted) | Value |
| Consumer Staples Distribution & Retail — 0.4% |
| Cardenas Markets, Inc., Term Loan, 12.159%, (SOFR + 6.75%), 8/1/29 | | 4,133 | $ 4,161,087 |
| Peer Holding III BV: | | | |
| Term Loan, 7.652%, (3 mo. EURIBOR + 3.75%), 9/29/28 | EUR | 5,725 | 6,141,799 |
| Term Loan, 8.559%, (SOFR + 3.25%), 10/28/30 | | 11,475 | 11,529,988 |
| | | | $ 21,832,874 |
| Containers & Packaging — 1.1% |
| Berlin Packaging LLC, Term Loan, 9.197%, (SOFR + 3.75%), 3/11/28(11) | | 2,887 | $ 2,891,980 |
| Clydesdale Acquisition Holdings, Inc., Term Loan, 9.091%, (SOFR + 3.68%), 4/13/29 | | 12,892 | 12,960,111 |
| Kouti BV, Term Loan, 7.127%, (3 mo. EURIBOR + 3.18%), 8/31/28 | EUR | 24,250 | 25,636,992 |
| Pretium Packaging LLC, Term Loan - Second Lien, 11.309%, (SOFR + 6.00%), 9.906% cash, 1.403% PIK, 10/2/28 | | 2,480 | 2,196,061 |
| Pretium PKG Holdings, Inc., Term Loan - Second Lien, 12.334%, (SOFR + 6.75%), 10/1/29 | | 6,675 | 4,113,469 |
| Proampac PG Borrower LLC, Term Loan, 9.326%, (SOFR + 4.00%), 9/15/28(11) | | 11,795 | 11,851,961 |
| | | | $ 59,650,574 |
| Distributors — 0.5% |
| CD&R Hydra Buyer, Inc., Term Loan, 9.42%, (SOFR + 4.00%), 3/25/31 | | 8,350 | $ 8,426,979 |
| Parts Europe SA, Term Loan, 7.647%, (3 mo. EURIBOR + 3.75%), 2/3/31 | EUR | 14,275 | 15,294,646 |
| Phillips Feed Service, Inc., Term Loan, 12.416%, (SOFR + 7.00%), 11/13/24(4) | | 468 | 327,738 |
| Rubix Group Midco 3 Ltd., Term Loan, 8.149%, (6 mo. EURIBOR + 4.25%), 9/30/26 | EUR | 1,500 | 1,607,090 |
| Winterfell Financing SARL, Term Loan, 8.898%, (3 mo. EURIBOR + 5.00%), 5/4/28 | EUR | 2,000 | 2,103,275 |
| | | | $ 27,759,728 |
| Diversified Consumer Services — 1.1% |
| Ascend Learning LLC: | | | |
| Term Loan, 8.916%, (SOFR + 3.50%), 12/11/28 | | 6,735 | $ 6,720,691 |
| Term Loan - Second Lien, 12/10/29(10) | | 3,500 | 3,449,250 |
| Belron Finance U.S. LLC, Term Loan, 7.578%, (SOFR + 2.00%), 4/13/28 | | 7,590 | 7,612,391 |
| FrontDoor, Inc., Term Loan, 7.68%, (SOFR + 2.25%), 6/17/28 | | 851 | 850,538 |
| KUEHG Corp., Term Loan, 9.823%, (SOFR + 4.50%), 6/12/30 | | 16,250 | 16,314,176 |
28
See Notes to Financial Statements.
Eaton Vance
Floating Rate Portfolio
April 30, 2024
Portfolio of Investments (Unaudited) — continued
| Borrower/Description | Principal
Amount*
(000's omitted) | Value |
| Diversified Consumer Services (continued) |
| Sotheby's, Term Loan, 10.09%, (SOFR + 4.50%), 1/15/27 | | 10,737 | $ 10,511,450 |
| Spring Education Group, Inc., Term Loan, 9.809%, (SOFR + 4.50%), 10/4/30 | | 3,716 | 3,735,659 |
| Wand NewCo 3, Inc., Term Loan, 9.066%, (SOFR + 3.75%), 1/30/31 | | 12,150 | 12,241,125 |
| | | | $ 61,435,280 |
| Diversified Financial Services — 0.2% |
| Concorde Midco Ltd., Term Loan, 7.851%, (6 mo. EURIBOR + 4.00%), 3/1/28 | EUR | 8,730 | $ 9,336,067 |
| | | | $ 9,336,067 |
| Diversified Telecommunication Services — 0.7% |
| GEE Holdings 2 LLC: | | | |
| Term Loan, 13.413%, (SOFR + 8.00%), 3/24/25 | | 9,639 | $ 8,771,597 |
| Term Loan - Second Lien, 13.662%, (SOFR + 8.25%), 5.412% cash, 8.25% PIK, 3/23/26 | | 7,560 | 4,536,264 |
| Level 3 Financing, Inc.: | | | |
| Term Loan, 11.875%, (SOFR + 6.56%), 4/15/29 | | 6,175 | 6,086,533 |
| Term Loan, 11.875%, (SOFR + 6.56%), 4/15/30 | | 6,175 | 6,060,801 |
| Lumen Technologies, Inc.: | | | |
| Term Loan, 7.78%, (SOFR + 2.35%), 4/15/29 | | 9,635 | 6,953,971 |
| Term Loan, 7.78%, (SOFR + 2.35%), 4/15/30 | | 9,635 | 6,744,412 |
| Virgin Media Bristol LLC, Term Loan, 7.936%, (SOFR + 2.50%), 1/31/28 | | 2,563 | 2,518,456 |
| | | | $ 41,672,034 |
| Electrical Equipment — 0.6% |
| WEC U.S. Holdings Ltd., Term Loan, 8.066%, (SOFR + 2.75%), 1/27/31 | | 31,492 | $ 31,550,182 |
| | | | $ 31,550,182 |
| Electronic Equipment, Instruments & Components — 1.4% |
| Chamberlain Group, Inc., Term Loan, 9.066%, (SOFR + 3.75%), 11/3/28 | | 11,200 | $ 11,233,600 |
| Creation Technologies, Inc., Term Loan, 11.068%, (SOFR + 5.50%), 10/5/28 | | 12,751 | 12,081,675 |
| II-VI, Inc., Term Loan, 7.829%, (SOFR + 2.50%), 7/2/29 | | 381 | 382,112 |
| Minimax Viking GmbH, Term Loan, 7.098%, (1 mo. EURIBOR + 3.25%), 7/31/28 | EUR | 3,469 | 3,727,421 |
| Mirion Technologies, Inc., Term Loan, 8.314%, (SOFR + 2.75%), 10/20/28 | | 1,722 | 1,727,165 |
| Robertshaw U.S. Holding Corp.: | | | |
| DIP Loan, 6.309%, (SOFR + 1.00%), 9/27/24 | | 5,698 | 5,555,647 |
| Borrower/Description | Principal
Amount*
(000's omitted) | Value |
| Electronic Equipment, Instruments & Components (continued) |
| Robertshaw U.S. Holding Corp.: (continued) | | | |
| Term Loan, 0.00%, 2/28/27(12) | | 3 | $ 3,223 |
| Term Loan, 0.00%, 2/28/27(12) | | 18,216 | 17,760,174 |
| Term Loan - Second Lien, 0.00%, 2/28/27(12) | | 16,894 | 9,291,684 |
| TTM Technologies, Inc., Term Loan, 8.077%, (SOFR + 2.75%), 5/30/30 | | 5,186 | 5,195,536 |
| Verifone Systems, Inc., Term Loan, 9.585%, (SOFR + 4.00%), 8/20/25 | | 14,540 | 13,202,383 |
| | | | $ 80,160,620 |
| Energy Equipment & Services — 0.8% |
| Ameriforge Group, Inc.: | | | |
| Term Loan, 12.088%, (SOFR + 8.00%), 12/29/23(4)(9) | | 3,251 | $ 2,633,237 |
| Term Loan, 20.50%, (U.S. (Fed) Prime Rate + 12.00%), 12/29/23(4) | | 25,469 | 20,632,228 |
| GIP Pilot Acquisition Partners LP, Term Loan, 8.308%, (SOFR + 3.00%), 10/4/30 | | 4,863 | 4,893,205 |
| Lealand Finance Co. BV: | | | |
| Term Loan, 3.63%, 6/28/24(9) | | 9,039 | 6,011,181 |
| Term Loan, 9.444%, (SOFR + 4.00%), 6.444% cash, 3.00% PIK, 6/30/25 | | 2,557 | 929,951 |
| PG Investment Co. 59 SARL, Term Loan, 8.813%, (SOFR + 3.50%), 3/26/31 | | 10,350 | 10,399,597 |
| | | | $ 45,499,399 |
| Engineering & Construction — 0.8% |
| Aegion Corp., Term Loan, 9.566%, (SOFR + 4.25%), 5/17/28 | | 15,687 | $ 15,792,575 |
| American Residential Services LLC, Term Loan, 9.071%, (SOFR + 3.50%), 10/15/27 | | 495 | 495,456 |
| APi Group DE, Inc., Term Loan, 7.93%, (SOFR + 2.50%), 1/3/29 | | 10,603 | 10,637,943 |
| Artera Services LLC, Term Loan, 9.809%, (SOFR + 4.50%), 2/15/31 | | 4,150 | 4,190,462 |
| Northstar Group Services, Inc.: | | | |
| Term Loan, 10.93%, (SOFR + 5.50%), 11/12/26 | | 10,598 | 10,635,173 |
| Term Loan, 10.93%, (SOFR + 5.50%), 11/12/26 | | 1,925 | 1,922,594 |
| | | | $ 43,674,203 |
| Entertainment — 0.9% |
| City Football Group Ltd., Term Loan, 8.439%, (SOFR + 3.00%), 7/21/28 | | 8,186 | $ 8,182,730 |
| Crown Finance U.S., Inc., Term Loan, 13.93%, (SOFR + 8.50%), 6.93% cash, 7.00% PIK, 7/31/28 | | 1,842 | 1,875,585 |
29
See Notes to Financial Statements.
Eaton Vance
Floating Rate Portfolio
April 30, 2024
Portfolio of Investments (Unaudited) — continued
| Borrower/Description | Principal
Amount*
(000's omitted) | Value |
| Entertainment (continued) |
| Delta 2 (LUX) SARL, Term Loan, 7.559%, (SOFR + 2.25%), 1/15/30 | | 2,500 | $ 2,505,730 |
| Live Nation Entertainment, Inc., Term Loan, 7.165%, (SOFR + 1.75%), 10/19/26 | | 5,542 | 5,544,153 |
| Playtika Holding Corp., Term Loan, 8.18%, (SOFR + 2.75%), 3/13/28 | | 13,458 | 13,466,007 |
| Renaissance Holding Corp., Term Loan, 9.566%, (SOFR + 4.25%), 4/5/30 | | 10,970 | 10,997,369 |
| UFC Holdings LLC, Term Loan, 8.336%, (SOFR + 2.75%), 4/29/26 | | 7,161 | 7,183,516 |
| Vue Entertainment International Ltd., Term Loan, 12.428%, (6 mo. EURIBOR + 8.50%), 4.028% cash, 8.40% PIK, 12/31/27 | EUR | 1,592 | 998,184 |
| Vue International Bidco PLC, Term Loan, 11.844%, (6 mo. EURIBOR + 8.00%), 6/30/27 | EUR | 435 | 463,846 |
| | | | $ 51,217,120 |
| Equity Real Estate Investment Trusts (REITs) — 0.2% |
| Iron Mountain, Inc.: | | | |
| Term Loan, 7.18%, (1 mo. USD LIBOR + 1.75%), 1/2/26 | | 3,615 | $ 3,613,180 |
| Term Loan, 7.566%, (SOFR + 2.25%), 1/31/31 | | 10,199 | 10,190,941 |
| | | | $ 13,804,121 |
| Financial Services — 1.2% |
| Ditech Holding Corp., Term Loan, 0.00%, 6/30/24(12) | | 18,244 | $ 2,006,820 |
| GTCR W Merger Sub LLC, Term Loan, 8.309%, (SOFR + 3.00%), 1/31/31 | | 30,700 | 30,858,289 |
| NCR Atleos LLC, Term Loan, 10.18%, (SOFR + 4.75%), 3/27/29(11) | | 13,652 | 13,765,103 |
| Nuvei Technologies Corp., Term Loan, 8.416%, (SOFR + 3.00%), 12/19/30 | | 8,279 | 8,303,053 |
| Walker & Dunlop, Inc., Term Loan, 7.666%, (SOFR + 2.25%), 12/16/28 | | 12,756 | 12,804,211 |
| WEX, Inc., Term Loan, 7.316%, (SOFR + 2.00%), 3/31/28 | | 1,261 | 1,264,766 |
| | | | $ 69,002,242 |
| Food Products — 0.9% |
| 8th Avenue Food & Provisions, Inc., Term Loan, 10.18%, (SOFR + 4.75%), 10/1/25 | | 6,508 | $ 6,296,611 |
| Badger Buyer Corp., Term Loan, 8.93%, (SOFR + 3.50%), 9/30/24 | | 4,750 | 4,603,372 |
| Del Monte Foods, Inc., Term Loan, 9.668%, (SOFR + 4.25%), 5/16/29 | | 6,230 | 5,326,757 |
| Borrower/Description | Principal
Amount*
(000's omitted) | Value |
| Food Products (continued) |
| Froneri International Ltd.: | | | |
| Term Loan, 5.991%, (6 mo. EURIBOR + 2.13%), 1/29/27 | EUR | 1,500 | $ 1,596,999 |
| Term Loan, 7.666%, (SOFR + 2.25%), 1/29/27 | | 4,667 | 4,677,408 |
| Nomad Foods U.S. LLC, Term Loan, 8.272%, (SOFR + 3.00%), 11/13/29 | | 7,953 | 7,979,620 |
| United Petfood Group BV, Term Loan, 6.583%, (6 mo. EURIBOR + 2.75%), 4/24/28 | EUR | 8,400 | 8,933,665 |
| Valeo F1 Co. Ltd. (Ireland): | | | |
| Term Loan, 7.858%, (6 mo. EURIBOR + 4.00%), 9/29/28 | EUR | 5,050 | 5,285,908 |
| Term Loan, 10.191%, (SONIA + 5.00%), 6/28/28 | GBP | 2,500 | 3,026,254 |
| | | | $ 47,726,594 |
| Gas Utilities — 0.4% |
| CQP Holdco LP, Term Loan, 8.302%, (SOFR + 3.00%), 12/31/30 | | 20,020 | $ 20,098,689 |
| | | | $ 20,098,689 |
| Health Care Equipment & Supplies — 0.7% |
| Bayou Intermediate II LLC, Term Loan, 10.091%, (SOFR + 4.50%), 8/2/28 | | 8,977 | $ 8,943,588 |
| Journey Personal Care Corp., Term Loan, 9.68%, (SOFR + 4.25%), 3/1/28 | | 21,148 | 21,052,255 |
| Medline Borrower LP, Term Loan, 8.068%, (SOFR + 2.75%), 10/23/28 | | 7,806 | 7,835,288 |
| | | | $ 37,831,131 |
| Health Care Providers & Services — 4.2% |
| AEA International Holdings (Lux) SARL, Term Loan, 8.809%, (SOFR + 3.50%), 9/7/28 | | 13,612 | $ 13,680,137 |
| BW NHHC Holdco, Inc., Term Loan - Second Lien, 13.302%, (SOFR + 8.00%), 1/15/26 | | 17,497 | 15,135,107 |
| Cano Health LLC: | | | |
| DIP Loan, 16.322%, (SOFR + 11.00%), 10/7/24 | | 534 | 550,319 |
| DIP Loan, 16.322%, (SOFR + 11.00%), 10/7/24 | | 819 | 843,554 |
| Term Loan, 0.00%, 11/23/27(12) | | 7,208 | 1,946,242 |
| CCRR Parent, Inc., Term Loan, 9.18%, (SOFR + 3.75%), 3/6/28 | | 4,685 | 4,348,042 |
| Cerba Healthcare SAS: | | | |
| Term Loan, 7.548%, (1 mo. EURIBOR + 3.70%), 6/30/28 | EUR | 18,925 | 17,432,337 |
| Term Loan, 7.848%, (1 mo. EURIBOR + 4.00%), 2/16/29 | EUR | 8,225 | 7,628,940 |
| CHG Healthcare Services, Inc., Term Loan, 9.091%, (SOFR + 3.75%), 9/29/28(11) | | 4,190 | 4,213,590 |
| Covis Finco SARL, Term Loan, 0.00%, 2/18/27(12) | | 9,853 | 4,113,653 |
30
See Notes to Financial Statements.
Eaton Vance
Floating Rate Portfolio
April 30, 2024
Portfolio of Investments (Unaudited) — continued
| Borrower/Description | Principal
Amount*
(000's omitted) | Value |
| Health Care Providers & Services (continued) |
| Elsan SAS, Term Loan, 7.186%, (1 mo. EURIBOR + 3.35%), 6/16/28 | EUR | 4,100 | $ 4,348,447 |
| Ensemble RCM LLC, Term Loan, 8.33%, (SOFR + 3.00%), 8/1/29 | | 4,031 | 4,048,066 |
| IVC Acquisition Ltd.: | | | |
| Term Loan, 9.071%, (3 mo. EURIBOR + 5.00%), 12/12/28 | EUR | 4,100 | 4,350,227 |
| Term Loan, 10.809%, (SOFR + 5.50%), 12/12/28 | | 10,574 | 10,616,450 |
| Medical Solutions Holdings, Inc.: | | | |
| Term Loan, 8.666%, (SOFR + 3.25%), 11/1/28 | | 13,675 | 12,156,617 |
| Term Loan - Second Lien, 12.416%, (SOFR + 7.00%), 11/1/29 | | 9,500 | 7,671,250 |
| Mehilainen Yhtiot OYJ, Term Loan, 7.88%, (3 mo. EURIBOR + 4.00%), 8/8/25 | EUR | 6,025 | 6,466,778 |
| Midwest Physician Administrative Services LLC, Term Loan, 8.821%, (SOFR + 3.25%), 3/12/28 | | 1,402 | 1,100,517 |
| National Mentor Holdings, Inc.: | | | |
| Term Loan, 9.159%, (SOFR + 3.75%), 3/2/28 | | 334 | 305,145 |
| Term Loan, 9.165%, (SOFR + 3.75%), 3/2/28(11) | | 12,189 | 11,145,026 |
| Term Loan - Second Lien, 12.659%, (SOFR + 7.25%), 3/2/29 | | 5,525 | 4,901,134 |
| Pacific Dental Services LLC, Term Loan, 8.571%, (SOFR + 3.25%), 3/15/31 | | 8,300 | 8,329,830 |
| Phoenix Guarantor, Inc., Term Loan, 8.566%, (SOFR + 3.25%), 2/21/31 | | 16,690 | 16,585,687 |
| R1 RCM, Inc., Term Loan, 8.327%, (SOFR + 3.00%), 6/21/29 | | 2,294 | 2,306,222 |
| Radnet Management, Inc., Term Loan, 7.823%, (SOFR + 2.50%), 4/18/31 | | 7,025 | 7,033,781 |
| Ramsay Generale de Sante SA, Term Loan, 6.847%, (3 mo. EURIBOR + 2.95%), 4/22/27 | EUR | 6,600 | 7,051,229 |
| Select Medical Corp., Term Loan, 8.316%, (SOFR + 3.00%), 3/6/27 | | 35,546 | 35,664,163 |
| Sound Inpatient Physicians: | | | |
| Term Loan, 8.591%, (SOFR + 3.00%), 6/27/25 | | 197 | 114,675 |
| Term Loan, 8.591%, (SOFR + 3.00%), 6/27/25 | | 2,310 | 1,345,393 |
| Synlab Bondco PLC: | | | |
| Term Loan, 6.361%, (6 mo. EURIBOR + 2.50%), 7/1/27 | EUR | 2,125 | 2,257,029 |
| Term Loan, 12/23/30(10) | EUR | 5,250 | 5,623,847 |
| TTF Holdings LLC, Term Loan, 9.43%, (SOFR + 4.00%), 3/31/28 | | 5,083 | 5,097,419 |
| U.S. Anesthesia Partners, Inc., Term Loan, 9.692%, (SOFR + 4.25%), 10/1/28 | | 4,992 | 4,842,379 |
| | | | $ 233,253,232 |
| Borrower/Description | Principal
Amount*
(000's omitted) | Value |
| Health Care Technology — 1.2% |
| Certara LP, Term Loan, 9.105%, (SOFR + 3.50%), 8/15/26 | | 1,799 | $ 1,805,310 |
| Cotiviti Corp., Term Loan, 2/21/31(10) | | 9,600 | 9,628,003 |
| Imprivata, Inc., Term Loan, 9.091%, (SOFR + 3.50%), 12/1/27 | | 14,389 | 14,476,664 |
| MedAssets Software Intermediate Holdings, Inc.: | | | |
| Term Loan, 9.424%, (SOFR + 4.00%), 12/18/28 | | 7,597 | 6,433,969 |
| Term Loan - Second Lien, 12.18%, (SOFR + 6.75%), 12/17/29 | | 8,775 | 6,087,656 |
| Project Ruby Ultimate Parent Corp., Term Loan, 8.93%, (SOFR + 3.50%), 3/10/28 | | 3,475 | 3,484,410 |
| Symplr Software, Inc., Term Loan, 9.93%, (SOFR + 4.50%), 12/22/27 | | 12,861 | 12,244,519 |
| Verscend Holding Corp., Term Loan, 11.50%, (U.S. (Fed) Prime Rate + 3.00%), 8/27/25 | | 9,898 | 9,905,949 |
| Waystar Technologies, Inc., Term Loan, 9.316%, (SOFR + 4.00%), 10/22/29 | | 3,275 | 3,297,516 |
| | | | $ 67,363,996 |
| Hotels, Restaurants & Leisure — 4.6% |
| 1011778 BC Unlimited Liability Co., Term Loan, 7.566%, (SOFR + 2.25%), 9/20/30 | | 32,485 | $ 32,545,436 |
| Caesars Entertainment, Inc., Term Loan, 8.066%, (SOFR + 2.75%), 2/6/31 | | 22,475 | 22,538,200 |
| Carnival Corp., Term Loan, 8.067%, (SOFR + 2.75%), 10/18/28 | | 26,623 | 26,739,282 |
| ClubCorp Holdings, Inc., Term Loan, 10.564%, (SOFR + 5.00%), 9/18/26 | | 20,104 | 20,170,932 |
| Fertitta Entertainment LLC, Term Loan, 9.069%, (SOFR + 3.75%), 1/27/29 | | 19,750 | 19,822,455 |
| Flutter Financing BV, Term Loan, 7.559%, (SOFR + 2.25%), 11/25/30 | | 31,671 | 31,769,596 |
| GVC Holdings (Gibraltar) Ltd., Term Loan, 7.652%, (3 mo. EURIBOR + 3.75%), 6/30/28 | EUR | 21,225 | 22,738,630 |
| Light & Wonder International, Inc., Term Loan, 8.071%, (SOFR + 2.75%), 4/14/29 | | 7,388 | 7,409,663 |
| Ontario Gaming GTA LP, Term Loan, 9.559%, (SOFR + 4.25%), 8/1/30 | | 14,888 | 14,986,318 |
| Oravel Stays Singapore Pte. Ltd., Term Loan, 13.84%, (SOFR + 8.25%), 6/23/26 | | 3,457 | 3,459,414 |
| Playa Resorts Holding BV, Term Loan, 8.565%, (SOFR + 3.25%), 1/5/29 | | 26,835 | 26,978,877 |
| SeaWorld Parks & Entertainment, Inc., Term Loan, 7.816%, (SOFR + 2.50%), 8/25/28 | | 19,348 | 19,367,566 |
| Station Casinos LLC, Term Loan, 7.566%, (SOFR + 2.25%), 3/14/31 | | 4,400 | 4,405,196 |
| | | | $ 252,931,565 |
31
See Notes to Financial Statements.
Eaton Vance
Floating Rate Portfolio
April 30, 2024
Portfolio of Investments (Unaudited) — continued
| Borrower/Description | Principal
Amount*
(000's omitted) | Value |
| Household Durables — 1.1% |
| ACProducts, Inc., Term Loan, 9.814%, (SOFR + 4.25%), 5/17/28 | | 18,477 | $ 16,067,719 |
| Libbey Glass, Inc., Term Loan, 11.975%, (SOFR + 6.50%), 11/22/27 | | 14,169 | 13,663,820 |
| Serta Simmons Bedding LLC: | | | |
| Term Loan, 12.924%, (SOFR + 7.50%), 6/29/28 | | 19,908 | 17,538,512 |
| Term Loan, 6/29/28(10) | | 2,161 | 2,123,407 |
| Solis IV BV, Term Loan, 8.824%, (SOFR + 3.50%), 2/26/29 | | 13,648 | 13,582,579 |
| | | | $ 62,976,037 |
| Household Products — 0.3% |
| Energizer Holdings, Inc., Term Loan, 7.68%, (SOFR + 2.25%), 12/22/27 | | 5,385 | $ 5,389,234 |
| Kronos Acquisition Holdings, Inc.: | | | |
| Term Loan, 9.314%, (SOFR + 3.75%), 12/22/26 | | 7,945 | 7,960,531 |
| Term Loan, 11.493%, (SOFR + 6.00%), 12/22/26 | | 5,034 | 5,059,296 |
| | | | $ 18,409,061 |
| Independent Power and Renewable Electricity Producers — 0.1% |
| Calpine Corp.: | | | |
| Term Loan, 7.316%, (SOFR + 2.00%), 1/31/31 | | 2,625 | $ 2,625,546 |
| Term Loan, 7.317%, (SOFR + 2.00%), 1/31/31 | | 2,295 | 2,295,180 |
| | | | $ 4,920,726 |
| Industrial Conglomerates — 0.8% |
| Ammeraal Beltech Holding BV, Term Loan, 8.902%, (3 mo. EURIBOR + 5.00%), 12/30/28 | EUR | 8,225 | $ 8,838,677 |
| Kohler Energy Co. LLC, Term Loan, 1/30/31(10) | | 22,475 | 22,552,269 |
| Rain Carbon GmbH, Term Loan, 8.915%, (3 mo. EURIBOR + 5.00%), 10/31/28 | EUR | 13,729 | 14,523,177 |
| | | | $ 45,914,123 |
| Insurance — 1.2% |
| Alliant Holdings Intermediate LLC, Term Loan, 8.819%, (SOFR + 3.50%), 11/6/30 | | 13,833 | $ 13,903,079 |
| AmWINS Group, Inc., Term Loan, 8.18%, (SOFR + 2.75%), 2/19/28 | | 4,962 | 4,979,759 |
| AssuredPartners, Inc., Term Loan, 2/14/31(10) | | 14,575 | 14,646,053 |
| Financiere CEP SAS, Term Loan, 7.885%, (6 mo. EURIBOR + 4.00%), 6/18/27 | EUR | 5,125 | 5,485,067 |
| HUB International Ltd., Term Loan, 8.575%, (SOFR + 3.25%), 6/20/30 | | 19,660 | 19,778,940 |
| Borrower/Description | Principal
Amount*
(000's omitted) | Value |
| Insurance (continued) |
| Truist Insurance Holdings LLC, Term Loan - Second Lien, 3/8/32(10) | | 2,500 | $ 2,522,812 |
| USI, Inc., Term Loan, 8.552%, (SOFR + 3.25%), 9/27/30 | | 4,478 | 4,495,688 |
| | | | $ 65,811,398 |
| Interactive Media & Services — 0.7% |
| Adevinta ASA: | | | |
| Term Loan, 6.348%, (1 mo. EURIBOR + 2.50%), 6/26/28 | EUR | 4,800 | $ 5,134,237 |
| Term Loan, 8.332%, (SOFR + 2.75%), 6/26/28 | | 893 | 895,715 |
| Buzz Finco LLC: | | | |
| Term Loan, 8.166%, (SOFR + 2.75%), 1/29/27 | | 1,951 | 1,957,925 |
| Term Loan, 8.666%, (SOFR + 3.25%), 1/29/27 | | 435 | 437,232 |
| Foundational Education Group, Inc., Term Loan, 9.341%, (SOFR + 3.75%), 8/31/28 | | 5,110 | 5,077,896 |
| Getty Images, Inc.: | | | |
| Term Loan, 8.875%, (1 mo. EURIBOR + 5.00%), 2/19/26 | EUR | 2,224 | 2,383,571 |
| Term Loan, 9.909%, (SOFR + 4.50%), 2/19/26 | | 13,835 | 13,869,602 |
| Match Group, Inc., Term Loan, 7.233%, (SOFR + 1.75%), 2/13/27 | | 6,450 | 6,444,627 |
| | | | $ 36,200,805 |
| IT Services — 3.7% |
| Asurion LLC: | | | |
| Term Loan, 9.416%, (SOFR + 4.00%), 8/19/28 | | 9,013 | $ 8,777,741 |
| Term Loan, 9.666%, (SOFR + 4.25%), 8/19/28 | | 7,064 | 6,908,336 |
| Term Loan - Second Lien, 10.68%, (SOFR + 5.25%), 1/31/28 | | 15,790 | 14,439,387 |
| Term Loan - Second Lien, 10.68%, (SOFR + 5.25%), 1/20/29 | | 2,375 | 2,147,705 |
| Endure Digital, Inc., Term Loan, 8.939%, (SOFR + 3.50%), 2/10/28 | | 29,622 | 28,765,310 |
| Gainwell Acquisition Corp., Term Loan, 9.409%, (SOFR + 4.00%), 10/1/27 | | 3,567 | 3,412,183 |
| Go Daddy Operating Co. LLC, Term Loan, 7.316%, (SOFR + 2.00%), 11/9/29 | | 46,225 | 46,280,942 |
| Informatica LLC, Term Loan, 8.18%, (SOFR + 2.75%), 10/27/28 | | 31,434 | 31,527,800 |
| NAB Holdings LLC, Term Loan, 8.209%, (SOFR + 2.75%), 11/23/28 | | 14,279 | 14,285,107 |
| Rackspace Technology Global, Inc.: | | | |
| Term Loan, 11.552%, (SOFR + 6.25%), 5/15/28 | | 9,976 | 10,075,383 |
| Term Loan - Second Lien, 8.186%, (SOFR + 2.75%), 5/15/28 | | 25,942 | 12,452,022 |
| Sedgwick Claims Management Services, Inc., Term Loan, 9.066%, (SOFR + 3.75%), 2/24/28 | | 12,853 | 12,916,895 |
32
See Notes to Financial Statements.
Eaton Vance
Floating Rate Portfolio
April 30, 2024
Portfolio of Investments (Unaudited) — continued
| Borrower/Description | Principal
Amount*
(000's omitted) | Value |
| IT Services (continued) |
| team.blue Finco SARL: | | | |
| Term Loan, 7.062%, (1 mo. EURIBOR + 3.20%), 3/30/28 | EUR | 11,150 | $ 11,798,880 |
| Term Loan, 3/30/28(10) | EUR | 1,500 | 1,587,293 |
| | | | $ 205,374,984 |
| Leisure Products — 0.3% |
| Fender Musical Instruments Corp., Term Loan, 9.418%, (SOFR + 4.00%), 12/1/28 | | 2,251 | $ 2,234,515 |
| Hayward Industries, Inc., Term Loan, 8.18%, (SOFR + 2.75%), 5/30/28 | | 9,008 | 9,020,683 |
| Recess Holdings, Inc., Term Loan, 9.843%, (SOFR + 4.50%), 2/20/30 | | 7,525 | 7,553,219 |
| | | | $ 18,808,417 |
| Life Sciences Tools & Services — 1.6% |
| Avantor Funding, Inc., Term Loan, 6.348%, (1 mo. EURIBOR + 2.50%), 6/12/28 | EUR | 10,855 | $ 11,623,789 |
| Cambrex Corp., Term Loan, 8.916%, (SOFR + 3.50%), 12/4/26 | | 324 | 313,020 |
| Catalent Pharma Solutions, Inc.: | | | |
| Term Loan, 7.43%, (SOFR + 2.00%), 2/22/28 | | 1,019 | 1,018,818 |
| Term Loan, 8.315%, (SOFR + 3.00%), 2/22/28 | | 2,650 | 2,664,906 |
| Curia Global, Inc., Term Loan, 9.18%, (SOFR + 3.75%), 8/30/26(11) | | 17,179 | 16,361,297 |
| ICON Luxembourg SARL, Term Loan, 7.309%, (SOFR + 2.00%), 7/3/28 | | 24,178 | 24,289,536 |
| LGC Group Holdings Ltd., Term Loan, 7.098%, (1 mo. EURIBOR + 3.25%), 4/21/27 | EUR | 5,775 | 6,101,970 |
| Loire Finco Luxembourg SARL, Term Loan, 8.916%, (SOFR + 3.50%), 4/21/27 | | 1,117 | 1,098,179 |
| Packaging Coordinators Midco, Inc., Term Loan, 9.071%, (SOFR + 3.50%), 11/30/27 | | 3,416 | 3,431,408 |
| PRA Health Sciences, Inc., Term Loan, 7.309%, (SOFR + 2.00%), 7/3/28 | | 6,024 | 6,051,882 |
| Sotera Health Holdings LLC, Term Loan, 8.18%, (SOFR + 2.75%), 12/11/26 | | 14,828 | 14,823,514 |
| | | | $ 87,778,319 |
| Machinery — 4.8% |
| AI Aqua Merger Sub, Inc., Term Loan, 9.324%, (SOFR + 4.00%), 7/31/28 | | 21,873 | $ 21,965,530 |
| Ali Group North America Corp., Term Loan, 7.43%, (SOFR + 2.00%), 7/30/29 | | 11,951 | 12,006,198 |
| American Trailer World Corp., Term Loan, 9.166%, (SOFR + 3.75%), 3/3/28 | | 13,302 | 13,061,302 |
| Borrower/Description | Principal
Amount*
(000's omitted) | Value |
| Machinery (continued) |
| Apex Tool Group LLC: | | | |
| Term Loan, 15.315%, (SOFR + 10.00%), 2/8/30 | | 11,409 | $ 11,066,370 |
| Term Loan - Second Lien, 12.566%, (SOFR + 7.25%), 8.566% cash, 4.00% PIK, 2/8/29 | | 4,889 | 4,840,518 |
| Barnes Group, Inc., Term Loan, 7.816%, (SOFR + 2.50%), 9/3/30 | | 17,288 | 17,345,746 |
| Clark Equipment Co., Term Loan, 7.902%, (SOFR + 2.50%), 4/20/29 | | 10,003 | 10,047,059 |
| Conair Holdings LLC, Term Loan, 9.18%, (SOFR + 3.75%), 5/17/28 | | 24,083 | 23,929,841 |
| CPM Holdings, Inc., Term Loan, 9.827%, (SOFR + 4.50%), 9/28/28 | | 3,990 | 4,005,318 |
| Delachaux Group SA, Term Loan, 8.115%, (3 mo. EURIBOR + 4.25%), 4/16/29 | EUR | 6,257 | 6,732,717 |
| EMRLD Borrower LP, Term Loan, 7.816%, (SOFR + 2.50%), 5/31/30 | | 7,511 | 7,533,255 |
| Engineered Machinery Holdings, Inc.: | | | |
| Term Loan, 7.652%, (3 mo. EURIBOR + 3.75%), 5/21/28 | EUR | 10,603 | 11,329,805 |
| Term Loan, 9.321%, (SOFR + 3.75%), 5/19/28 | | 12,941 | 12,960,346 |
| Term Loan - Second Lien, 11.571%, (SOFR + 6.00%), 5/21/29 | | 2,000 | 1,997,500 |
| Filtration Group Corp., Term Loan, 9.68%, (SOFR + 4.25%), 10/21/28 | | 8,927 | 8,981,654 |
| Icebox Holdco III, Inc., Term Loan, 9.321%, (SOFR + 3.75%), 12/22/28 | | 4,127 | 4,124,206 |
| INNIO Group Holding GmbH, Term Loan, 8.173%, (3 mo. EURIBOR + 4.25%), 11/2/28 | EUR | 4,722 | 5,074,804 |
| Madison IAQ LLC, Term Loan, 8.68%, (SOFR + 3.25%), 6/21/28 | | 11,522 | 11,537,009 |
| Pro Mach Group, Inc., Term Loan, 9.066%, (SOFR + 3.75%), 8/31/28 | | 2,791 | 2,806,095 |
| Roper Industrial Products Investment Co. LLC: | | | |
| Term Loan, 8.402%, (3 mo. EURIBOR + 4.50%), 11/22/29 | EUR | 990 | 1,064,920 |
| Term Loan, 9.302%, (SOFR + 4.00%), 11/22/29 | | 6,399 | 6,451,565 |
| SPX Flow, Inc., Term Loan, 9.916%, (SOFR + 4.50%), 4/5/29 | | 12,331 | 12,414,319 |
| Titan Acquisition Ltd., Term Loan, 10.317%, (SOFR + 5.00%), 2/1/29 | | 8,275 | 8,326,719 |
| TK Elevator Midco GmbH, Term Loan, 7.926%, (3 mo. EURIBOR + 4.00%), 4/30/30 | EUR | 8,550 | 9,166,766 |
| TK Elevator Topco GmbH, Term Loan, 7.491%, (6 mo. EURIBOR + 3.63%), 7/30/27 | EUR | 9,725 | 10,387,897 |
| TK Elevator U.S. Newco, Inc., Term Loan, 8.791%, (SOFR + 3.50%), 4/30/30 | | 12,980 | 13,039,487 |
| Zephyr German BidCo GmbH, Term Loan, 7.446%, (6 mo. EURIBOR + 3.60%), 3/10/28 | EUR | 11,775 | 12,433,637 |
| | | | $ 264,630,583 |
33
See Notes to Financial Statements.
Eaton Vance
Floating Rate Portfolio
April 30, 2024
Portfolio of Investments (Unaudited) — continued
| Borrower/Description | Principal
Amount*
(000's omitted) | Value |
| Media — 0.7% |
| Aragorn Parent Corp., Term Loan, 9.569%, (SOFR + 4.25%), 12/15/28 | | 5,660 | $ 5,702,342 |
| Gray Television, Inc., Term Loan, 8.442%, (SOFR + 3.00%), 12/1/28 | | 1,019 | 960,573 |
| Hubbard Radio LLC, Term Loan, 9.816%, (SOFR + 4.50%), 3/28/25 | | 5,146 | 4,258,459 |
| iHeartCommunications, Inc., Term Loan, 8.43%, (SOFR + 3.00%), 5/1/26 | | 2,365 | 2,073,380 |
| Sinclair Television Group, Inc., Term Loan, 8.091%, (SOFR + 2.50%), 9/30/26 | | 6,134 | 5,728,691 |
| Univision Communications, Inc., Term Loan, 8.68%, (SOFR + 3.25%), 3/15/26 | | 18,095 | 18,127,197 |
| | | | $ 36,850,642 |
| Metals/Mining — 1.1% |
| Arsenal AIC Parent LLC, Term Loan, 9.066%, (SOFR + 3.75%), 8/18/30 | | 17,761 | $ 17,916,269 |
| Dynacast International LLC: | | | |
| Term Loan, 9.943%, (SOFR + 4.50%), 7/22/25 | | 15,104 | 14,493,104 |
| Term Loan, 14.443%, (SOFR + 9.00%), 10/22/25 | | 3,018 | 2,248,592 |
| PMHC II, Inc., Term Loan, 9.706%, (SOFR + 4.25%), 4/23/29 | | 16,232 | 16,022,459 |
| WireCo WorldGroup, Inc., Term Loan, 9.075%, (SOFR + 3.75%), 11/13/28 | | 5,785 | 5,814,283 |
| Zekelman Industries, Inc., Term Loan, 7.568%, (SOFR + 2.25%), 1/24/31 | | 5,317 | 5,332,328 |
| | | | $ 61,827,035 |
| Oil, Gas & Consumable Fuels — 1.1% |
| Freeport LNG Investments LLP, Term Loan, 12/21/28(10) | | 11,500 | $ 11,451,125 |
| GIP II Blue Holding LP, Term Loan, 9.066%, (SOFR + 3.75%), 9/29/28 | | 7,736 | 7,786,597 |
| ITT Holdings LLC, Term Loan, 8.421%, (SOFR + 3.00%), 10/11/30 | | 8,532 | 8,549,897 |
| Matador Bidco SARL, Term Loan, 9.916%, (SOFR + 4.50%), 10/15/26 | | 29,032 | 29,125,798 |
| Oxbow Carbon LLC, Term Loan, 9.413%, (SOFR + 4.00%), 5/10/30(11) | | 5,632 | 5,660,600 |
| | | | $ 62,574,017 |
| Pharmaceuticals — 1.4% |
| Aenova Holding GmbH, Term Loan, 8.328%, (1 mo. EURIBOR + 4.50%), 3/6/26 | EUR | 925 | $ 990,760 |
| AI Sirona (Luxembourg) Acquisition SARL, Term Loan, 7.848%, (3 mo. EURIBOR + 4.00%), 9/30/28 | EUR | 13,000 | 13,906,557 |
| Borrower/Description | Principal
Amount*
(000's omitted) | Value |
| Pharmaceuticals (continued) |
| Bausch Health Cos., Inc., Term Loan, 10.668%, (SOFR + 5.25%), 2/1/27 | | 12,231 | $ 10,309,188 |
| Ceva Sante Animale: | | | |
| Term Loan, 8.152%, (3 mo. EURIBOR + 4.25%), 11/8/30 | EUR | 10,300 | 11,066,154 |
| Term Loan, 9.564%, (SOFR + 4.25%), 11/1/30 | | 4,175 | 4,207,615 |
| Jazz Financing Lux SARL, Term Loan, 8.43%, (SOFR + 3.00%), 5/5/28 | | 6,956 | 7,004,478 |
| Mallinckrodt International Finance SA: | | | |
| Term Loan, 12.819%, (SOFR + 7.50%), 11/14/28 | | 3,434 | 3,846,213 |
| Term Loan - Second Lien, 14.819%, (SOFR + 9.50%), 11/14/28 | | 19,462 | 21,294,455 |
| PharmaZell GmbH, Term Loan, 7.902%, (3 mo. EURIBOR + 4.00%), 5/12/27 | EUR | 1,800 | 1,907,355 |
| Recipharm AB, Term Loan, 6.865%, (3 mo. EURIBOR + 2.95%), 2/17/28 | EUR | 2,725 | 2,856,842 |
| | | | $ 77,389,617 |
| Professional Services — 3.2% |
| APFS Staffing Holdings, Inc., Term Loan, 9.316%, (SOFR + 4.00%), 12/29/28 | | 3,590 | $ 3,578,971 |
| Apleona Holding GmbH, Term Loan, 6.564%, (3 mo. EURIBOR + 2.70%), 4/28/28 | EUR | 7,525 | 7,951,815 |
| CoreLogic, Inc.: | | | |
| Term Loan, 8.93%, (SOFR + 3.50%), 6/2/28 | | 14,027 | 13,583,067 |
| Term Loan - Second Lien, 11.93%, (SOFR + 6.50%), 6/4/29 | | 1,200 | 1,090,500 |
| Corporation Service Co., Term Loan, 8.066%, (SOFR + 2.75%), 11/2/29 | | 3,970 | 3,984,557 |
| Crisis Prevention Institute, Inc., Term Loan, 10.043%, (SOFR + 4.75%), 4/9/31 | | 3,025 | 3,042,016 |
| EAB Global, Inc., Term Loan, 8.93%, (SOFR + 3.50%), 8/16/28 | | 14,320 | 14,370,239 |
| Employbridge Holding Co., Term Loan, 10.314%, (SOFR + 4.75%), 7/19/28 | | 20,495 | 16,671,907 |
| First Advantage Holdings LLC, Term Loan, 8.18%, (SOFR + 2.75%), 1/31/27 | | 5,857 | 5,865,952 |
| Fleet Midco I Ltd., Term Loan, 8.566%, (SOFR + 3.25%), 2/21/31 | | 7,225 | 7,261,125 |
| Genuine Financial Holdings LLC, Term Loan, 9.316%, (SOFR + 4.00%), 9/27/30 | | 4,080 | 4,073,764 |
| Neptune Bidco U.S., Inc., Term Loan, 10.406%, (SOFR + 5.00%), 4/11/29 | | 7,970 | 7,505,444 |
| Rockwood Service Corp., Term Loan, 9.68%, (SOFR + 4.25%), 1/23/27 | | 9,205 | 9,275,720 |
| Techem Verwaltungsgesellschaft 675 mbH, Term Loan, 7/15/29(10) | EUR | 15,075 | 16,110,169 |
34
See Notes to Financial Statements.
Eaton Vance
Floating Rate Portfolio
April 30, 2024
Portfolio of Investments (Unaudited) — continued
| Borrower/Description | Principal
Amount*
(000's omitted) | Value |
| Professional Services (continued) |
| Teneo Holdings LLC, Term Loan, 10.066%, (SOFR + 4.75%), 3/13/31 | | 10,250 | $ 10,341,819 |
| Trans Union LLC, Term Loan, 7.316%, (SOFR + 2.00%), 12/1/28 | | 31,546 | 31,626,528 |
| Vaco Holdings LLC, Term Loan, 10.434%, (SOFR + 5.00%), 1/21/29 | | 9,089 | 9,040,736 |
| Wood Mackenzie Ltd., Term Loan, 8.814%, (SOFR + 3.50%), 2/7/31 | | 11,675 | 11,741,396 |
| | | | $ 177,115,725 |
| Real Estate Management & Development — 0.8% |
| Cushman & Wakefield U.S. Borrower LLC: | | | |
| Term Loan, 8.18%, (SOFR + 2.75%), 8/21/25 | | 543 | $ 543,643 |
| Term Loan, 8.666%, (SOFR + 3.25%), 1/31/30 | | 6,628 | 6,644,218 |
| Term Loan, 9.066%, (SOFR + 3.75%), 1/31/30 | | 6,360 | 6,383,611 |
| Greystar Real Estate Partners LLC, Term Loan, 8.576%, (SOFR + 3.25%), 8/21/30 | | 7,964 | 7,994,155 |
| Homeserve USA Holding Corp., Term Loan, 8.319%, (SOFR + 3.00%), 10/21/30 | | 9,500 | 9,541,562 |
| RE/MAX International, Inc., Term Loan, 7.93%, (SOFR + 2.50%), 7/21/28 | | 16,168 | 15,304,856 |
| | | | $ 46,412,045 |
| Road & Rail — 1.9% |
| Avis Budget Car Rental LLC: | | | |
| Term Loan, 7.18%, (SOFR + 1.75%), 8/6/27 | | 30,084 | $ 29,896,424 |
| Term Loan, 8.416%, (SOFR + 3.00%), 3/16/29 | | 2,986 | 2,979,975 |
| Hertz Corp.: | | | |
| Term Loan, 8.68%, (SOFR + 3.25%), 6/30/28 | | 17,019 | 15,737,905 |
| Term Loan, 8.68%, (SOFR + 3.25%), 6/30/28 | | 3,298 | 3,054,808 |
| Term Loan, 9.065%, (SOFR + 3.75%), 6/30/28 | | 7,531 | 6,950,603 |
| Uber Technologies, Inc., Term Loan, 8.079%, (SOFR + 2.75%), 3/3/30 | | 46,208 | 46,549,519 |
| | | | $ 105,169,234 |
| Semiconductors & Semiconductor Equipment — 0.7% |
| Altar Bidco, Inc.: | | | |
| Term Loan, 7.947%, (SOFR + 3.10%), 2/1/29 | | 6,315 | $ 6,320,334 |
| Term Loan - Second Lien, 10.914%, (SOFR + 5.60%), 2/1/30 | | 6,650 | 6,594,586 |
| Bright Bidco BV, Term Loan, 14.33%, (SOFR + 9.00%), 6.33% cash, 8.00% PIK, 10/31/27 | | 3,814 | 1,153,602 |
| MaxLinear, Inc., Term Loan, 7.68%, (SOFR + 2.25%), 6/23/28 | | 2,955 | 2,940,580 |
| Borrower/Description | Principal
Amount*
(000's omitted) | Value |
| Semiconductors & Semiconductor Equipment (continued) |
| MKS Instruments, Inc., Term Loan, 7.823%, (SOFR + 2.50%), 8/17/29 | | 19,965 | $ 20,023,010 |
| Synaptics, Inc., Term Loan, 7.835%, (SOFR + 2.25%), 12/2/28 | | 2,742 | 2,742,982 |
| | | | $ 39,775,094 |
| Software — 11.3% |
| Applied Systems, Inc., Term Loan, 8.809%, (SOFR + 3.50%), 2/24/31 | | 43,551 | $ 43,918,033 |
| Astra Acquisition Corp.: | | | |
| Term Loan, 10.578%, (SOFR + 5.25%), 10/25/28 | | 10,323 | 5,264,552 |
| Term Loan, 12.078%, (SOFR + 6.75%), 2/25/28 | | 2,343 | 2,307,632 |
| Term Loan, 2/25/28(10) | | 4,972 | 4,872,623 |
| Term Loan - Second Lien, 14.439%, (SOFR + 8.88%), 10/25/29 | | 20,170 | 5,714,869 |
| Banff Merger Sub, Inc.: | | | |
| Term Loan, 8.348%, (1 mo. EURIBOR + 4.50%), 12/29/28 | EUR | 1,907 | 2,049,449 |
| Term Loan, 9.566%, (SOFR + 4.25%), 12/29/28 | | 3,544 | 3,570,559 |
| Cegid Group SAS, Term Loan, 7.641%, (3 mo. EURIBOR + 3.75%), 7/10/28 | EUR | 6,150 | 6,585,881 |
| Central Parent, Inc., Term Loan, 9.309%, (SOFR + 4.00%), 7/6/29 | | 19,825 | 19,923,362 |
| Cloud Software Group, Inc.: | | | |
| Term Loan, 9.909%, (SOFR + 4.50%), 9/29/28(11) | | 9,427 | 9,436,672 |
| Term Loan, 9.909%, (SOFR + 4.50%), 3/30/29(11) | | 4,466 | 4,470,728 |
| Cloudera, Inc.: | | | |
| Term Loan, 9.166%, (SOFR + 3.75%), 10/8/28 | | 23,836 | 23,746,517 |
| Term Loan - Second Lien, 11.416%, (SOFR + 6.00%), 10/8/29 | | 2,950 | 2,846,750 |
| Constant Contact, Inc., Term Loan, 9.561%, (SOFR + 4.00%), 2/10/28 | | 5,016 | 4,898,106 |
| Cornerstone OnDemand, Inc., Term Loan, 9.18%, (SOFR + 3.75%), 10/16/28 | | 15,386 | 14,760,944 |
| Delta TopCo, Inc., Term Loan, 9.121%, (SOFR + 3.75%), 12/1/27 | | 10,860 | 10,887,494 |
| E2open LLC, Term Loan, 8.93%, (SOFR + 3.50%), 2/4/28 | | 16,092 | 16,174,945 |
| ECI Macola Max Holding LLC, Term Loan, 9.052%, (SOFR + 3.75%), 5/31/30 | | 15,683 | 15,771,716 |
| Epicor Software Corp.: | | | |
| Term Loan, 8.68%, (SOFR + 3.25%), 7/30/27 | | 34,420 | 34,603,915 |
| Term Loan, 9.066%, (SOFR + 3.75%), 7/30/27 | | 6,135 | 6,176,801 |
| Fiserv Investment Solutions, Inc., Term Loan, 9.319%, (SOFR + 4.00%), 2/18/27 | | 12,377 | 11,899,549 |
35
See Notes to Financial Statements.
Eaton Vance
Floating Rate Portfolio
April 30, 2024
Portfolio of Investments (Unaudited) — continued
| Borrower/Description | Principal
Amount*
(000's omitted) | Value |
| Software (continued) |
| Gen Digital, Inc., Term Loan, 7.416%, (SOFR + 2.00%), 9/12/29 | | 1,176 | $ 1,178,424 |
| GoTo Group, Inc.: | | | |
| Term Loan, 10.173%, (SOFR + 4.75%), 4/30/28 | | 12,930 | 12,364,256 |
| Term Loan - Second Lien, 10.173%, (SOFR + 4.75%), 4/30/28 | | 10,844 | 8,259,388 |
| IGT Holding IV AB: | | | |
| Term Loan, 7.052%, (3 mo. EURIBOR + 3.15%), 3/31/28 | EUR | 6,205 | 6,627,040 |
| Term Loan, 8.972%, (SOFR + 3.40%), 3/31/28 | | 3,994 | 4,011,973 |
| iSolved, Inc., Term Loan, 8.819%, (SOFR + 3.50%), 10/15/30 | | 5,162 | 5,178,194 |
| Ivanti Software, Inc., Term Loan, 9.814%, (SOFR + 4.25%), 12/1/27 | | 3,870 | 3,599,330 |
| Magenta Buyer LLC, Term Loan, 10.591%, (SOFR + 5.00%), 7/27/28 | | 14,659 | 7,448,490 |
| Marcel LUX IV SARL: | | | |
| Term Loan, 8.335%, (3 mo. EURIBOR + 4.50%), 11/7/30 | EUR | 8,650 | 9,277,441 |
| Term Loan, 9.81%, (SOFR + 4.50%), 11/11/30 | | 28,251 | 28,410,300 |
| Maverick Bidco, Inc., Term Loan, 9.23%, (SOFR + 3.75%), 5/18/28 | | 5,175 | 5,165,323 |
| McAfee LLC, Term Loan, 9.177%, (SOFR + 3.75%), 3/1/29 | | 29,628 | 29,731,047 |
| Mosel Bidco SE: | | | |
| Term Loan, 8.652%, (3 mo. EURIBOR + 4.75%), 9/16/30 | EUR | 1,825 | 1,957,395 |
| Term Loan, 10.059%, (SOFR + 4.75%), 9/16/30 | | 2,575 | 2,589,484 |
| N-Able International Holdings II LLC, Term Loan, 8.355%, (SOFR + 2.75%), 7/19/28 | | 1,258 | 1,259,942 |
| Open Text Corp., Term Loan, 8.166%, (SOFR + 2.75%), 1/31/30 | | 23,174 | 23,271,336 |
| Polaris Newco LLC: | | | |
| Term Loan, 7.902%, (3 mo. EURIBOR + 4.00%), 6/2/28 | EUR | 8,434 | 8,621,734 |
| Term Loan, 9.591%, (SOFR + 4.00%), 6/2/28 | | 2,927 | 2,910,134 |
| Proofpoint, Inc., Term Loan, 8.68%, (SOFR + 3.25%), 8/31/28 | | 21,629 | 21,734,689 |
| Quest Software U.S. Holdings, Inc., Term Loan, 9.73%, (SOFR + 4.25%), 2/1/29 | | 16,495 | 11,670,512 |
| RealPage, Inc., Term Loan, 8.43%, (SOFR + 3.00%), 4/24/28 | | 10,663 | 10,294,911 |
| Redstone Holdco 2 LP, Term Loan, 10.18%, (SOFR + 4.75%), 4/27/28 | | 11,692 | 9,217,047 |
| Sabre GLBL, Inc.: | | | |
| Term Loan, 8.93%, (SOFR + 3.50%), 12/17/27 | | 5,850 | 5,127,833 |
| Term Loan, 8.93%, (SOFR + 3.50%), 12/17/27 | | 3,734 | 3,273,117 |
| Term Loan, 9.666%, (SOFR + 4.25%), 6/30/28 | | 3,513 | 3,093,339 |
| Borrower/Description | Principal
Amount*
(000's omitted) | Value |
| Software (continued) |
| Sabre GLBL, Inc.: (continued) | | | |
| Term Loan, 10.416%, (SOFR + 5.00%), 6/30/28 | | 1,000 | $ 885,000 |
| Skillsoft Corp., Term Loan, 10.68%, (SOFR + 5.25%), 7/14/28 | | 10,283 | 8,286,739 |
| SolarWinds Holdings, Inc., Term Loan, 8.566%, (SOFR + 3.25%), 2/5/27 | | 18,345 | 18,399,483 |
| Sophia LP, Term Loan, 8.916%, (SOFR + 3.50%), 10/9/29 | | 22,993 | 23,098,632 |
| Turing Midco LLC, Term Loan, 7.93%, (SOFR + 2.50%), 3/24/28 | | 461 | 457,813 |
| UKG, Inc., Term Loan, 8.814%, (SOFR + 3.50%), 2/10/31 | | 35,095 | 35,297,491 |
| Veritas U.S., Inc., Term Loan, 10.43%, (SOFR + 5.00%), 9/1/25 | | 30,069 | 27,701,285 |
| Vision Solutions, Inc.: | | | |
| Term Loan, 11.75%, (U.S. (Fed) Prime Rate + 3.25%), 4/24/28 | | 33,149 | 33,081,664 |
| Term Loan - Second Lien, 12.841%, (SOFR + 7.25%), 4/23/29 | | 1,500 | 1,411,875 |
| | | | $ 624,773,758 |
| Specialty Retail — 2.1% |
| Belron Luxembourg SARL, Term Loan, 6.347%, (3 mo. EURIBOR + 2.43%), 4/13/28 | EUR | 3,575 | $ 3,836,172 |
| Boels Topholding BV, Term Loan, 7.139%, (EURIBOR + 3.25%), 2/6/27(11) | EUR | 6,681 | 7,146,531 |
| Etraveli Holding AB, Term Loan, 8.902%, (3 mo. EURIBOR + 5.00%), 11/2/28 | EUR | 7,844 | 8,418,245 |
| Great Outdoors Group LLC, Term Loan, 9.18%, (SOFR + 3.75%), 3/6/28 | | 27,181 | 27,221,626 |
| Harbor Freight Tools USA, Inc., Term Loan, 8.18%, (SOFR + 2.75%), 10/19/27 | | 17,787 | 17,822,560 |
| Hoya Midco LLC, Term Loan, 8.58%, (SOFR + 3.25%), 2/3/29 | | 2,626 | 2,634,444 |
| Les Schwab Tire Centers, Term Loan, 8.317%, (SOFR + 3.00%), 4/23/31 | | 18,044 | 18,078,218 |
| LIDS Holdings, Inc., Term Loan, 10.98%, (SOFR + 5.50%), 12/14/26 | | 4,104 | 4,093,709 |
| Mattress Firm, Inc., Term Loan, 9.814%, (SOFR + 4.25%), 9/25/28 | | 15,783 | 15,842,131 |
| PetSmart, Inc., Term Loan, 9.166%, (SOFR + 3.75%), 2/11/28 | | 12,164 | 12,000,159 |
| | | | $ 117,093,795 |
| Technology Hardware, Storage & Peripherals — 0.2% |
| Poseidon Bidco SASU, Term Loan, 8.902%, (3 mo. EURIBOR + 5.00%), 3/13/30 | EUR | 8,200 | $ 8,632,704 |
| | | | $ 8,632,704 |
36
See Notes to Financial Statements.
Eaton Vance
Floating Rate Portfolio
April 30, 2024
Portfolio of Investments (Unaudited) — continued
| Borrower/Description | Principal
Amount*
(000's omitted) | Value |
| Trading Companies & Distributors — 2.9% |
| American Builders & Contractors Supply Co., Inc., Term Loan, 7.316%, (SOFR + 2.00%), 1/31/31 | | 8,460 | $ 8,492,599 |
| Avolon TLB Borrower 1 (U.S.) LLC, Term Loan, 7.315%, (SOFR + 2.00%), 6/22/28 | | 40,726 | 40,840,846 |
| Beacon Roofing Supply, Inc., Term Loan, 7.316%, (SOFR + 2.00%), 5/19/28 | | 5,337 | 5,356,968 |
| Core & Main LP, Term Loan, 7.568%, (SOFR + 2.25%), 2/9/31 | | 3,691 | 3,709,204 |
| DXP Enterprises, Inc., Term Loan, 10.164%, (SOFR + 4.75%), 10/11/30 | | 7,189 | 7,236,049 |
| Foundation Building Materials Holding Co. LLC, Term Loan, 9.33%, (SOFR + 4.00%), 1/29/31(11) | | 12,400 | 12,508,500 |
| Patagonia Bidco Ltd., Term Loan, 10.473%, (SONIA + 5.25%), 11/1/28 | GBP | 20,400 | 22,518,415 |
| PEARLS (Netherlands) Bidco BV, Term Loan, 7.865%, (3 mo. EURIBOR + 4.00%), 2/26/29 | EUR | 6,000 | 6,401,423 |
| Spin Holdco, Inc., Term Loan, 9.585%, (SOFR + 4.00%), 3/4/28 | | 38,309 | 34,003,670 |
| SRS Distribution, Inc.: | | | |
| Term Loan, 8.666%, (SOFR + 3.25%), 6/2/28 | | 4,961 | 4,998,639 |
| Term Loan, 8.93%, (SOFR + 3.50%), 6/2/28 | | 4,234 | 4,269,640 |
| Windsor Holdings III LLC, Term Loan, 9.319%, (SOFR + 4.00%), 8/1/30 | | 11,769 | 11,885,470 |
| | | | $ 162,221,423 |
| Wireless Telecommunication Services — 0.7% |
| CCI Buyer, Inc., Term Loan, 9.302%, (SOFR + 4.00%), 12/17/27 | | 14,832 | $ 14,835,796 |
| Digicel International Finance Ltd., Term Loan, 12.075%, (SOFR + 6.75%), 5/25/27 | | 14,799 | 14,151,285 |
| SBA Senior Finance II LLC, Term Loan, 7.32%, (SOFR + 2.00%), 1/25/31 | | 7,275 | 7,307,737 |
| | | | $ 36,294,818 |
Total Senior Floating-Rate Loans
(identified cost $4,686,718,635) | | | $4,542,284,327 |
| Short-Term Investments — 2.4% |
| Security | Shares | Value |
| Morgan Stanley Institutional Liquidity Funds - Government Portfolio, Institutional Class, 5.22%(13) | | 132,996,037 | $ 132,996,037 |
Total Short-Term Investments
(identified cost $132,996,037) | | | $ 132,996,037 |
Total Investments — 99.3%
(identified cost $5,742,243,961) | | | $5,513,151,680 |
| Less Unfunded Loan Commitments — (0.2)% | | | $ (10,940,092) |
Net Investments — 99.1%
(identified cost $5,731,303,869) | | | $5,502,211,588 |
| Other Assets, Less Liabilities — 0.9% | | | $ 49,627,359 |
| Net Assets — 100.0% | | | $5,551,838,947 |
| The percentage shown for each investment category in the Portfolio of Investments is based on net assets. |
| * | In U.S. dollars unless otherwise indicated. |
| (1) | Security exempt from registration under Rule 144A of the Securities Act of 1933, as amended. These securities may be sold in certain transactions in reliance on an exemption from registration (normally to qualified institutional buyers). At April 30, 2024, the aggregate value of these securities is $753,226,490 or 13.6% of the Portfolio's net assets. |
| (2) | Variable rate security. The stated interest rate represents the rate in effect at April 30, 2024. |
| (3) | Affiliated company (see Note 7). |
| (4) | For fair value measurement disclosure purposes, security is categorized as Level 3 (see Note 8). |
| (5) | Non-income producing security. |
| (6) | Security was acquired in connection with a restructuring of a Senior Loan and may be subject to restrictions on resale. |
| (7) | Amount is less than 0.05%. |
| (8) | Senior floating-rate loans (Senior Loans) often require prepayments from excess cash flows or permit the borrowers to repay at their election. The degree to which borrowers repay, whether as a contractual requirement or at their election, cannot be predicted with accuracy. As a result, the actual remaining maturity may be substantially less than the stated maturities shown. However, Senior Loans will typically have an expected average life of approximately two to four years. Senior Loans typically have rates of interest which are redetermined periodically by reference to a base lending rate, plus a spread. These base lending rates are primarily the Secured Overnight Financing Rate (“SOFR”) and secondarily, the prime rate offered by one or more major United States banks (the “Prime Rate”). Base lending rates may be subject to a floor, or minimum rate. Rates for SOFR are generally 1 or 3-month tenors and may also be subject to a credit spread adjustment. Senior Loans are generally subject to contractual restrictions that must be satisfied before they can be bought or sold. |
37
See Notes to Financial Statements.
Eaton Vance
Floating Rate Portfolio
April 30, 2024
Portfolio of Investments (Unaudited) — continued
| (9) | Unfunded or partially unfunded loan commitments. The stated interest rate reflects the weighted average of the reference rate and spread for the funded portion, if any, and the commitment fees on the portion of the loan that is unfunded. At April 30, 2024, the total value of unfunded loan commitments is $7,863,793. See Note 1F for description. |
| (10) | This Senior Loan will settle after April 30, 2024, at which time the interest rate will be determined. |
| (11) | The stated interest rate represents the weighted average interest rate at April 30, 2024 of contracts within the senior loan facility. Interest rates on contracts are primarily redetermined either monthly or quarterly by reference to the indicated base lending rate and spread and the reset period. |
| (12) | Issuer is in default with respect to interest and/or principal payments or has declared bankruptcy. For a variable rate security, interest rate has been adjusted to reflect non-accrual status. |
| (13) | May be deemed to be an affiliated investment company. The rate shown is the annualized seven-day yield as of April 30, 2024. |
| Forward Foreign Currency Exchange Contracts (OTC) |
| Currency Purchased | Currency Sold | Counterparty | Settlement
Date | Unrealized
Appreciation | Unrealized
(Depreciation) |
| USD | 292,775,639 | EUR | 270,766,698 | Standard Chartered Bank | 5/3/24 | $ 3,813,269 | $ — |
| GBP | 787,159 | USD | 994,480 | Citibank, N.A. | 5/31/24 | — | (10,741) |
| USD | 30,673,878 | EUR | 28,150,000 | Bank of America, N.A. | 5/31/24 | 598,723 | — |
| USD | 30,685,639 | EUR | 28,166,992 | Bank of America, N.A. | 5/31/24 | 592,330 | — |
| USD | 28,164,855 | EUR | 25,855,000 | Bank of America, N.A. | 5/31/24 | 541,652 | — |
| USD | 26,150,837 | EUR | 24,000,000 | Bank of America, N.A. | 5/31/24 | 509,496 | — |
| USD | 31,187,938 | EUR | 28,620,000 | State Street Bank and Trust Company | 5/31/24 | 610,639 | — |
| USD | 30,683,615 | EUR | 28,166,000 | State Street Bank and Trust Company | 5/31/24 | 591,365 | — |
| USD | 30,694,668 | EUR | 28,180,000 | State Street Bank and Trust Company | 5/31/24 | 587,460 | — |
| USD | 14,078,340 | GBP | 11,092,000 | HSBC Bank USA, N.A. | 5/31/24 | 216,295 | — |
| USD | 14,081,586 | GBP | 11,091,179 | State Street Bank and Trust Company | 5/31/24 | 220,566 | — |
| USD | 289,883,480 | EUR | 270,766,698 | Standard Chartered Bank | 6/4/24 | 551,657 | — |
| USD | 71,085,979 | EUR | 65,476,069 | State Street Bank and Trust Company | 6/28/24 | 1,045,861 | — |
| | | | | | | $9,879,313 | $(10,741) |
| Abbreviations: |
| DIP | – Debtor In Possession |
| EURIBOR | – Euro Interbank Offered Rate |
| LIBOR | – London Interbank Offered Rate |
| OTC | – Over-the-counter |
| PCL | – Public Company Limited |
| PIK | – Payment In Kind |
| SOFR | – Secured Overnight Financing Rate |
| SONIA | – Sterling Overnight Interbank Average |
| Currency Abbreviations: |
| EUR | – Euro |
| GBP | – British Pound Sterling |
| USD | – United States Dollar |
38
See Notes to Financial Statements.
Eaton Vance
Floating Rate Portfolio
April 30, 2024
Statement of Assets and Liabilities (Unaudited)
| | April 30, 2024 |
| Assets | |
| Unaffiliated investments, at value (identified cost $5,595,962,424) | $ 5,369,215,551 |
| Affiliated investments, at value (identified cost $135,341,445) | 132,996,037 |
| Cash | 23,796,905 |
| Deposits for derivatives collateral — forward foreign currency exchange contracts | 6,810,000 |
| Foreign currency, at value (identified cost $45,417,258) | 44,981,760 |
| Interest receivable | 34,633,007 |
| Dividends receivable from affiliated investments | 547,807 |
| Receivable for investments sold | 55,663,106 |
| Receivable for open forward foreign currency exchange contracts | 9,879,313 |
| Prepaid upfront fees on notes payable | 843,353 |
| Trustees' deferred compensation plan | 290,876 |
| Other receivables | 2,084,589 |
| Prepaid expenses | 116,527 |
| Total assets | $5,681,858,831 |
| Liabilities | |
| Cash collateral due to brokers | $ 6,810,000 |
| Payable for investments purchased | 118,776,132 |
| Payable for open forward foreign currency exchange contracts | 10,741 |
| Payable to affiliates: | |
| Investment adviser fee | 2,299,994 |
| Trustees' fees | 9,042 |
| Trustees' deferred compensation plan | 290,876 |
| Accrued expenses | 1,823,099 |
| Total liabilities | $ 130,019,884 |
| Net Assets applicable to investors' interest in Portfolio | $5,551,838,947 |
39
See Notes to Financial Statements.
Eaton Vance
Floating Rate Portfolio
April 30, 2024
Statement of Operations (Unaudited)
| | Six Months Ended |
| | April 30, 2024 |
| Investment Income | |
| Dividend income | $ 1,089,319 |
| Dividend income from affiliated investments | 3,281,446 |
| Interest income | 253,949,016 |
| Other income | 4,183,700 |
| Total investment income | $ 262,503,481 |
| Expenses | |
| Investment adviser fee | $ 14,065,972 |
| Trustees’ fees and expenses | 54,250 |
| Custodian fee | 602,440 |
| Legal and accounting services | 334,888 |
| Interest expense and fees | 811,010 |
| Miscellaneous | 211,764 |
| Total expenses | $ 16,080,324 |
| Deduct: | |
| Waiver and/or reimbursement of expenses by affiliates | $ 95,440 |
| Total expense reductions | $ 95,440 |
| Net expenses | $ 15,984,884 |
| Net investment income | $ 246,518,597 |
| Realized and Unrealized Gain (Loss) | |
| Net realized gain (loss): | |
| Investment transactions | $ (109,391,603) |
| Foreign currency transactions | (92,455) |
| Forward foreign currency exchange contracts | (1,377,053) |
| Net realized loss | $(110,861,111) |
| Change in unrealized appreciation (depreciation): | |
| Investments | $ 202,576,036 |
| Foreign currency | (1,337,836) |
| Forward foreign currency exchange contracts | 1,793,443 |
| Net change in unrealized appreciation (depreciation) | $ 203,031,643 |
| Net realized and unrealized gain | $ 92,170,532 |
| Net increase in net assets from operations | $ 338,689,129 |
40
See Notes to Financial Statements.
Eaton Vance
Floating Rate Portfolio
April 30, 2024
Statements of Changes in Net Assets
| | Six Months Ended
April 30, 2024
(Unaudited) | Year Ended
October 31, 2023 |
| Increase (Decrease) in Net Assets | | |
| From operations: | | |
| Net investment income | $ 246,518,597 | $ 537,269,640 |
| Net realized loss | (110,861,111) | (335,324,412) |
| Net change in unrealized appreciation (depreciation) | 203,031,643 | 471,089,099 |
| Net increase in net assets from operations | $ 338,689,129 | $ 673,034,327 |
| Capital transactions: | | |
| Contributions | $ 133,712,330 | $ 308,512,496 |
| Withdrawals | (682,336,605) | (3,320,903,248) |
| Net decrease in net assets from capital transactions | $ (548,624,275) | $(3,012,390,752) |
| Net decrease in net assets | $ (209,935,146) | $(2,339,356,425) |
| Net Assets | | |
| At beginning of period | $ 5,761,774,093 | $ 8,101,130,518 |
| At end of period | $5,551,838,947 | $ 5,761,774,093 |
41
See Notes to Financial Statements.
Eaton Vance
Floating Rate Portfolio
April 30, 2024
| | Six Months Ended
April 30, 2024
(Unaudited) | Year Ended October 31, |
| Ratios/Supplemental Data | 2023 | 2022 | 2021 | 2020 | 2019 |
| Ratios (as a percentage of average daily net assets): | | | | | | |
| Expenses | 0.58% (1)(2) | 0.58% (2) | 0.54% (2) | 0.56% | 0.59% | 0.55% |
| Net investment income | 8.91% (1) | 8.21% | 4.39% | 3.51% | 4.17% | 5.09% |
| Portfolio Turnover | 15% (3) | 19% | 27% | 26% | 28% | 16% |
| Total Return | 6.25% (3) | 10.63% | (3.32)% | 7.80% | 1.18% | 1.64% |
| Net assets, end of period (000’s omitted) | $5,551,839 | $5,761,774 | $8,101,131 | $8,986,782 | $5,649,501 | $7,966,641 |
| (1) | Annualized. |
| (2) | Includes a reduction by the investment adviser of a portion of its adviser fee due to the Portfolio's investment in the Liquidity Fund (equal to less than 0.005% of average daily net assets for the six months ended April 30, 2024 and the years ended October 31, 2023 and 2022). |
| (3) | Not annualized. |
42
See Notes to Financial Statements.
Eaton Vance
Floating Rate Portfolio
April 30, 2024
Notes to Financial Statements (Unaudited)
1 Significant Accounting Policies
Eaton Vance Floating Rate Portfolio (the Portfolio) is a Massachusetts business trust registered under the Investment Company Act of 1940, as amended (the 1940 Act), as a diversified, open-end management investment company. The Portfolio’s investment objective is to provide a high level of current income. The Declaration of Trust permits the Trustees to issue interests in the Portfolio. At April 30, 2024, Eaton Vance Floating-Rate Fund and Eaton Vance Floating-Rate & High Income Fund held an interest of 86.1% and 13.9%, respectively, in the Portfolio.
The following is a summary of significant accounting policies of the Portfolio. The policies are in conformity with accounting principles generally accepted in the United States of America (U.S. GAAP). The Portfolio is an investment company and follows accounting and reporting guidance in the Financial Accounting Standards Board (FASB) Accounting Standards Codification Topic 946.
A Investment Valuation—The following methodologies are used to determine the market value or fair value of investments.
Senior Floating-Rate Loans. Interests in senior floating-rate loans (Senior Loans) are valued generally at the average mean of bid and ask quotations obtained from a third party pricing service. Senior Loans, for which a valuation is not available or deemed unreliable, are fair valued by the investment adviser utilizing one or more of the valuation techniques described below to assess the likelihood that the borrower will make a full repayment of the loan underlying such Senior Loan. If the investment adviser believes that there is a reasonable likelihood of full repayment, the investment adviser will determine fair value using a matrix pricing approach that considers the yield on the Senior Loan relative to yields on other Senior Loans issued by companies of comparable credit quality. If the investment adviser believes there is not a reasonable likelihood of full repayment, the investment adviser will determine fair value using analyses that include, but are not limited to: (i) a comparison of the value of the borrower’s outstanding equity and debt to that of comparable public companies; (ii) a discounted cash flow analysis; or (iii) when the investment adviser believes it is likely that a borrower will be liquidated or sold, an analysis of the terms of such liquidation or sale. In certain cases, the investment adviser will use a combination of analytical methods to determine fair value, such as when only a portion of a borrower’s assets are likely to be sold. In conducting its assessment and analyses for purposes of determining fair value of a Senior Loan, the investment adviser will use its discretion and judgment in considering and appraising relevant factors. Junior Loans (i.e., subordinated loans and second lien loans) are valued in the same manner as Senior Loans.
Debt Obligations. Debt obligations are generally valued on the basis of valuations provided by third party pricing services, as derived from such services’ pricing models. Inputs to the models may include, but are not limited to, reported trades, executable bid and ask prices, broker/dealer quotations, prices or yields of securities with similar characteristics, interest rates, anticipated prepayments, benchmark curves or information pertaining to the issuer, as well as industry and economic events. The pricing services may use a matrix approach, which considers information regarding securities with similar characteristics to determine the valuation for a security. Short-term debt obligations purchased with a remaining maturity of sixty days or less for which a valuation from a third party pricing service is not readily available may be valued at amortized cost, which approximates fair value.
Equity Securities. Equity securities listed on a U.S. securities exchange generally are valued at the last sale or closing price on the day of valuation or, if no sales took place on such date, at the mean between the closing bid and ask prices on the exchange where such securities are principally traded. Equity securities listed on the NASDAQ National Market System are valued at the NASDAQ official closing price. Unlisted or listed securities for which closing sales prices or closing quotations are not available are valued at the mean between the latest available bid and ask prices or, in the case of preferred equity securities that are not listed or traded in the over-the-counter market, by a third party pricing service that uses various techniques that consider factors including, but not limited to, prices or yields of securities with similar characteristics, benchmark yields, broker/dealer quotes, quotes of underlying common stock, issuer spreads, as well as industry and economic events.
Derivatives. Forward foreign currency exchange contracts are generally valued at the mean of the average bid and average asked prices that are reported by currency dealers to a third party pricing service at the valuation time. Such third party pricing service valuations are supplied for specific settlement periods and the Portfolio’s forward foreign currency exchange contracts are valued at an interpolated rate between the closest preceding and subsequent settlement period reported by the third party pricing service.
Foreign Securities and Currencies. Foreign securities and currencies are valued in U.S. dollars, based on foreign currency exchange rate quotations supplied by a third party pricing service. The pricing service uses a proprietary model to determine the exchange rate. Inputs to the model include reported trades and implied bid/ask spreads.
Other. Investments in management investment companies (including money market funds) that do not trade on an exchange are valued at the net asset value as of the close of each business day.
Fair Valuation. In connection with Rule 2a-5 of the 1940 Act, the Trustees have designated the Portfolio’s investment adviser as its valuation designee. Investments for which valuations or market quotations are not readily available or are deemed unreliable are valued by the investment adviser, as valuation designee, at fair value using methods that most fairly reflect the security’s “fair value”, which is the amount that the Portfolio might reasonably expect to receive for the security upon its current sale in the ordinary course. Each such determination is based on a consideration of relevant factors, which are likely to vary from one pricing context to another. These factors may include, but are not limited to, the type of security, the existence of any contractual restrictions on the security’s disposition, the price and extent of public trading in similar securities of the issuer or of comparable companies or entities, quotations or relevant information obtained from broker/dealers or other market participants, information obtained from the issuer, analysts, and/or the appropriate stock exchange (for exchange-traded securities), an analysis of the company’s or entity’s financial statements, and an evaluation of the forces that influence the issuer and the market(s) in which the security is purchased and sold.
Eaton Vance
Floating Rate Portfolio
April 30, 2024
Notes to Financial Statements (Unaudited) — continued
B Investment Transactions—Investment transactions for financial statement purposes are accounted for on a trade date basis. Realized gains and losses on investments sold are determined on the basis of identified cost.
C Income—Interest income is recorded on the basis of interest accrued, adjusted for amortization of premium or accretion of discount. Fees associated with loan amendments are recognized immediately. Dividend income is recorded on the ex-dividend date for dividends received in cash and/or securities. Distributions from investment companies are recorded as dividend income, capital gains or return of capital based on the nature of the distribution.
D Federal Taxes—The Portfolio has elected to be treated as a partnership for federal tax purposes. No provision is made by the Portfolio for federal or state taxes on any taxable income of the Portfolio because each investor in the Portfolio is ultimately responsible for the payment of any taxes on its share of taxable income. Since at least one of the Portfolio's investors is a regulated investment company that invests all or substantially all of its assets in the Portfolio, the Portfolio normally must satisfy the applicable source of income and diversification requirements (under the Internal Revenue Code) in order for its investors to satisfy them. The Portfolio will allocate, at least annually among its investors, each investor's distributive share of the Portfolio's net investment income, net realized capital gains and losses and any other items of income, gain, loss, deduction or credit.
As of April 30, 2024, the Portfolio had no uncertain tax positions that would require financial statement recognition, de-recognition, or disclosure. The Portfolio files a U.S. federal income tax return annually after its fiscal year-end, which is subject to examination by the Internal Revenue Service for a period of three years from the date of filing.
E Foreign Currency Translation—Investment valuations, other assets, and liabilities initially expressed in foreign currencies are translated each business day into U.S. dollars based upon current exchange rates. Purchases and sales of foreign investment securities and income and expenses denominated in foreign currencies are translated into U.S. dollars based upon currency exchange rates in effect on the respective dates of such transactions. Recognized gains or losses on investment transactions attributable to changes in foreign currency exchange rates are recorded for financial statement purposes as net realized gains and losses on investments. That portion of unrealized gains and losses on investments that results from fluctuations in foreign currency exchange rates is not separately disclosed.
F Unfunded Loan Commitments—The Portfolio may enter into certain loan agreements all or a portion of which may be unfunded. The Portfolio is obligated to fund these commitments at the borrower's discretion. These commitments are disclosed in the accompanying Portfolio of Investments. At April 30, 2024, the Portfolio had sufficient cash and/or securities to cover these commitments.
G Use of Estimates—The preparation of the financial statements in conformity with U.S. GAAP requires management to make estimates and assumptions that affect the reported amounts of assets and liabilities at the date of the financial statements and the reported amounts of income and expense during the reporting period. Actual results could differ from those estimates.
H Indemnifications—Under the Portfolio’s organizational documents, its officers and Trustees may be indemnified against certain liabilities and expenses arising out of the performance of their duties to the Portfolio. Under Massachusetts law, if certain conditions prevail, interestholders in the Portfolio could be deemed to have personal liability for the obligations of the Portfolio. However, the Portfolio’s Declaration of Trust contains an express disclaimer of liability on the part of Portfolio interestholders. Additionally, in the normal course of business, the Portfolio enters into agreements with service providers that may contain indemnification clauses. The Portfolio’s maximum exposure under these arrangements is unknown as this would involve future claims that may be made against the Portfolio that have not yet occurred.
I Forward Foreign Currency Exchange Contracts—The Portfolio may enter into forward foreign currency exchange contracts for the purchase or sale of a specific foreign currency at a fixed price on a future date. The forward foreign currency exchange contracts are adjusted by the daily exchange rate of the underlying currency and any gains or losses are recorded as unrealized until such time as the contracts have been closed. Risks may arise upon entering these contracts from the potential inability of counterparties to meet the terms of their contracts and from movements in the value of a foreign currency relative to the U.S. dollar.
J When-Issued Securities and Delayed Delivery Transactions—The Portfolio may purchase securities on a delayed delivery or when-issued basis. Payment and delivery may take place after the customary settlement period for that security. At the time the transaction is negotiated, the price of the security that will be delivered is fixed. The Portfolio maintains cash and/or security positions for these commitments such that sufficient liquid assets will be available to make payments upon settlement. Securities purchased on a delayed delivery or when-issued basis are marked-to-market daily and begin earning interest on settlement date. Such security purchases are subject to the risk that when delivered they will be worth less than the agreed upon payment price. Losses may also arise if the counterparty does not perform under the contract.
K Interim Financial Statements—The interim financial statements relating to April 30, 2024 and for the six months then ended have not been audited by an independent registered public accounting firm, but in the opinion of the Portfolio’s management, reflect all adjustments, consisting only of normal recurring adjustments, necessary for the fair presentation of the financial statements.
Eaton Vance
Floating Rate Portfolio
April 30, 2024
Notes to Financial Statements (Unaudited) — continued
2 Investment Adviser Fee and Other Transactions with Affiliates
The investment adviser fee is earned by Boston Management and Research (BMR), an indirect, wholly-owned subsidiary of Morgan Stanley, as compensation for investment advisory services rendered to the Portfolio. The investment adviser fee is computed at an annual rate as a percentage of the Portfolio's average daily net assets as follows and is payable monthly:
| Average Daily Net Assets | Annual Fee Rate |
| Up to $1 billion | 0.5750% |
| $1 billion but less than $2 billion | 0.5250% |
| $2 billion but less than $5 billion | 0.4900% |
| $5 billion but less than $10 billion | 0.4600% |
| $10 billion but less than $15 billion | 0.4350% |
| $15 billion but less than $20 billion | 0.4150% |
| $20 billion but less than $25 billion | 0.4000% |
| $25 billion and over | 0.3900% |
For the six months ended April 30, 2024, the Portfolio’s investment adviser fee amounted to $14,065,972 or 0.51% (annualized) of the Portfolio's average daily net assets. The Portfolio may invest in a money market fund, the Institutional Class of the Morgan Stanley Institutional Liquidity Funds - Government Portfolio (the “Liquidity Fund”), an open-end management investment company managed by Morgan Stanley Investment Management Inc., a wholly-owned subsidiary of Morgan Stanley. The investment adviser fee paid by the Portfolio is reduced by an amount equal to its pro rata share of the advisory and administration fees paid by the Portfolio due to its investment in the Liquidity Fund. For the six months ended April 30, 2024, the investment adviser fee paid was reduced by $95,440 relating to the Portfolio's investment in the Liquidity Fund.
Trustees and officers of the Portfolio who are members of BMR’s organization receive remuneration for their services to the Portfolio out of the investment adviser fee. Trustees of the Portfolio who are not affiliated with the investment adviser may elect to defer receipt of all or a percentage of their annual fees in accordance with the terms of the Trustees Deferred Compensation Plan. Certain officers and Trustees of the Portfolio are officers of the above organization.
During the six months ended April 30, 2024, EVM reimbursed the Portfolio $6,584 for a net realized loss due to a trading error. The amount of the reimbursement had no significant impact on total return.
3 Purchases and Sales of Investments
Purchases and sales of investments, other than short-term obligations and including maturities, and principal repayments on Senior Loans, aggregated $824,833,836 and $1,095,608,641, respectively, for the six months ended April 30, 2024.
4 Federal Income Tax Basis of Investments
The cost and unrealized appreciation (depreciation) of investments, including open derivative contracts, of the Portfolio at April 30, 2024, as determined on a federal income tax basis, were as follows:
| Aggregate cost | $5,735,738,397 |
| Gross unrealized appreciation | $ 64,280,088 |
| Gross unrealized depreciation | (287,938,325) |
| Net unrealized depreciation | $ (223,658,237) |
5 Financial Instruments
The Portfolio may trade in financial instruments with off-balance sheet risk in the normal course of its investing activities. These financial instruments may include forward foreign currency exchange contracts and may involve, to a varying degree, elements of risk in excess of the amounts recognized for
Eaton Vance
Floating Rate Portfolio
April 30, 2024
Notes to Financial Statements (Unaudited) — continued
financial statement purposes. The notional or contractual amounts of these instruments represent the investment the Portfolio has in particular classes of financial instruments and do not necessarily represent the amounts potentially subject to risk. The measurement of the risks associated with these instruments is meaningful only when all related and offsetting transactions are considered. A summary of obligations under these financial instruments at April 30, 2024 is included in the Portfolio of Investments. At April 30, 2024, the Portfolio had sufficient cash and/or securities to cover commitments under these contracts.
The Portfolio is subject to foreign exchange risk in the normal course of pursuing its investment objective. Because the Portfolio holds foreign currency denominated investments, the value of these investments and related receivables and payables may change due to future changes in foreign currency exchange rates. To hedge against this risk, the Portfolio enters into forward foreign currency exchange contracts.
The Portfolio enters into forward foreign currency exchange contracts that may contain provisions whereby the counterparty may terminate the contract under certain conditions, including but not limited to a decline in the Portfolio's net assets below a certain level over a certain period of time, which would trigger a payment by the Portfolio for those derivatives in a liability position. At April 30, 2024, the fair value of derivatives with credit related contingent features in a net liability position was $10,741. At April 30, 2024, there were no assets pledged by the Portfolio for such liability.
The over-the-counter (OTC) derivatives in which the Portfolio invests are subject to the risk that the counterparty to the contract fails to perform its obligations under the contract. To mitigate this risk, the Portfolio has entered into an International Swaps and Derivatives Association, Inc. Master Agreement (“ISDA Master Agreement”) or similar agreement with substantially all its derivative counterparties. An ISDA Master Agreement is a bilateral agreement between the Portfolio and a counterparty that governs certain OTC derivatives and typically contains, among other things, set-off provisions in the event of a default and/or termination event as defined under the relevant ISDA Master Agreement. Under an ISDA Master Agreement, the Portfolio may, under certain circumstances, offset with the counterparty certain derivative financial instruments’ payables and/or receivables with collateral held and/or posted and create one single net payment. The provisions of the ISDA Master Agreement typically permit a single net payment in the event of default including the bankruptcy or insolvency of the counterparty. However, bankruptcy or insolvency laws of a particular jurisdiction may impose restrictions on or prohibitions against the right of offset in bankruptcy or insolvency. Certain ISDA Master Agreements allow counterparties to OTC derivatives to terminate derivative contracts prior to maturity in the event the Portfolio’s net assets decline by a stated percentage or the Portfolio fails to meet the terms of its ISDA Master Agreements, which would cause the counterparty to accelerate payment by the Portfolio of any net liability owed to it.
The collateral requirements for derivatives traded under an ISDA Master Agreement are governed by a Credit Support Annex to the ISDA Master Agreement. Collateral requirements are determined at the close of business each day and are typically based on changes in market values for each transaction under an ISDA Master Agreement and netted into one amount for such agreement. Generally, the amount of collateral due from or to a counterparty is subject to a minimum transfer threshold amount before a transfer is required, which may vary by counterparty. Collateral pledged for the benefit of the Portfolio and/or counterparty is held in segregated accounts by the Portfolio’s custodian and cannot be sold, re-pledged, assigned or otherwise used while pledged. The portion of such collateral representing cash, if any, is reflected as deposits for derivatives collateral and, in the case of cash pledged by a counterparty for the benefit of the Portfolio, a corresponding liability on the Statement of Assets and Liabilities. Securities pledged by the Portfolio as collateral, if any, are identified as such in the Portfolio of Investments.
The fair value of open derivative instruments (not considered to be hedging instruments for accounting disclosure purposes) and whose primary underlying risk exposure is foreign exchange risk at April 30, 2024 was as follows:
| | Fair Value |
| Derivative | Asset Derivative(1) | Liability Derivative(2) |
| Forward foreign currency exchange contracts | $9,879,313 | $(10,741) |
| (1) | Statement of Assets and Liabilities location: Receivable for open forward foreign currency exchange contracts. |
| (2) | Statement of Assets and Liabilities location: Payable for open forward foreign currency exchange contracts. |
Eaton Vance
Floating Rate Portfolio
April 30, 2024
Notes to Financial Statements (Unaudited) — continued
The Portfolio's derivative assets and liabilities at fair value by risk, which are reported gross in the Statement of Assets and Liabilities, are presented in the table above. The following tables present the Portfolio's derivative assets and liabilities by counterparty, net of amounts available for offset under a master netting agreement and net of the related collateral received by the Portfolio for such assets and pledged by the Portfolio for such liabilities as of April 30, 2024.
| Counterparty | Derivative
Assets Subject to
Master Netting
Agreement | Derivatives
Available
for Offset | Non-cash
Collateral
Received(a) | Cash
Collateral
Received(a) | Net Amount
of Derivative
Assets(b) |
| Bank of America, N.A. | $ 2,242,201 | $ — | $ — | $ (1,700,000) | $ 542,201 |
| HSBC Bank USA, N.A. | 216,295 | — | (154,596) | — | 61,699 |
| Standard Chartered Bank | 4,364,926 | — | — | (2,530,000) | 1,834,926 |
| State Street Bank and Trust Company | 3,055,891 | — | — | (2,580,000) | 475,891 |
| | $9,879,313 | $ — | $(154,596) | $(6,810,000) | $2,914,717 |
| Counterparty | Derivative
Liabilities Subject to
Master Netting
Agreement | Derivatives
Available
for Offset | Non-cash
Collateral
Pledged(a) | Cash
Collateral
Pledged(a) | Net Amount
of Derivative
Liabilities(c) |
| Citibank, N.A. | $(10,741) | $ — | $ — | $ — | $(10,741) |
| (a) | In some instances, the total collateral received and/or pledged may be more than the amount shown due to overcollateralization. |
| (b) | Net amount represents the net amount due from the counterparty in the event of default. |
| (c) | Net amount represents the net amount payable to the counterparty in the event of default. |
The effect of derivative instruments (not considered to be hedging instruments for accounting disclosure purposes) on the Statement of Operations and whose primary underlying risk exposure is foreign exchange risk for the six months ended April 30, 2024 was as follows:
| Derivative | Realized Gain (Loss)
on Derivatives Recognized
in Income(1) | Change in Unrealized
Appreciation (Depreciation) on
Derivatives Recognized in Income(2) |
| Forward foreign currency exchange contracts | $(1,377,053) | $1,793,443 |
| (1) | Statement of Operations location: Net realized gain (loss): Forward foreign currency exchange contracts. |
| (2) | Statement of Operations location: Change in unrealized appreciation (depreciation): Forward foreign currency exchange contracts. |
The average notional amount of forward foreign currency exchange contracts (based on the absolute value of notional amounts of currency purchased and currency sold) outstanding during the six months ended April 30, 2024, which is indicative of the volume of this derivative type, was approximately $904,348,000.
Eaton Vance
Floating Rate Portfolio
April 30, 2024
Notes to Financial Statements (Unaudited) — continued
6 Credit Facility
The Portfolio participates with another portfolio and fund managed by BMR and its affiliates in a $500 million ($600 million prior to March 4, 2024) unsecured credit facility agreement (Agreement) with a group of banks, which is in effect through March 3, 2025. Borrowings are made by the Portfolio solely to facilitate the handling of unusual and/or unanticipated short-term cash requirements. At the Portfolio’s option, any loan under the Credit Facility that is made to it will bear interest at a rate equal to (i) the Benchmark Rate (defined below) plus a margin or, (ii) the Base Rate, or (iii) the Overnight Rate plus a margin. Base Rate is the highest of (a) administrative agent’s prime rate, (b) 50 basis points above the Federal Funds rate, (c) the Benchmark Rate plus a margin and (d) 1.00%, in each case as in effect from time to time. The “Overnight Rate” is the greatest of the Benchmark Rate, the Federal Funds rate and 0.00%. “Benchmark Rate” means Term SOFR (defined as the forward-looking Secured Overnight Financing Rate term rate published two U.S. government securities business days prior to the commencement of the applicable interest period plus the Term SOFR Adjustment) for an interest period of one-month’s duration. To the extent that, at any time, the Benchmark Rate is less than 0.00%, the Benchmark Rate shall be deemed to be 0.00% for purposes of the Credit Facility. “Term SOFR Adjustment” means 0.10%. In addition, a fee computed at an annual rate of 0.15% on the daily unused portion of each lender’s commitment amount is allocated among the participating portfolios and fund at the end of each quarter. Also included in interest expense and fees on the Statement of Operations is approximately $573,000 of amortization of upfront fees paid by the Portfolio in connection with the annual renewal of the Agreement. The unamortized balance of upfront fees at April 30, 2024 is $843,353 and is included in prepaid upfront fees on notes payable in the Statement of Assets and Liabilities. Because the credit facility is not available exclusively to the Portfolio and the maximum amount is capped, it may be unable to borrow some or all of a requested amount at any particular time. The Portfolio did not have any significant borrowings during the six months ended April 30, 2024.
7 Affiliated Investments
An affiliated company is a company in which a fund has a direct or indirect ownership of, control of, or voting power of 5 percent or more of the outstanding voting shares, or a company that is under common ownership or control with a fund. At April 30, 2024, the value of the Portfolio's investment in affiliated companies and in funds that may be deemed to be affiliated was $132,996,037, which represents 2.4% of the Portfolio's net assets. Transactions in such investments by the Portfolio for the six months ended April 30, 2024 were as follows:
| Name | Value,
beginning
of period | Purchases | Sales
proceeds | Net realized
gain (loss) | Change in
unrealized
appreciation
(depreciation) | Value, end
of period | Dividend
income | Shares,
end of period |
| Common Stocks* |
| IAP Worldwide Services LLC(1)(2)(3) | $ 0 | $ — | $ — | $ — | $ — | $ 0 | $ — | 2,577 |
| Short-Term Investments |
| Liquidity Fund | 143,913,942 | 792,643,826 | (803,561,731) | — | — | 132,996,037 | 3,281,446 | 132,996,037 |
| Total | | | | $ — | $ — | $132,996,037 | $3,281,446 | |
| * | The related industry is the same as the presentation in the Portfolio of Investments. |
| (1) | For fair value measurement disclosure purposes, security is categorized as Level 3 (see Note 8). |
| (2) | Non-income producing security. |
| (3) | A portion of the shares were acquired in connection with a restructuring of a Senior Loan and may be subject to restrictions on resale. |
8 Fair Value Measurements
Under generally accepted accounting principles for fair value measurements, a three-tier hierarchy to prioritize the assumptions, referred to as inputs, is used in valuation techniques to measure fair value. The three-tier hierarchy of inputs is summarized in the three broad levels listed below.
| • | Level 1 – quoted prices in active markets for identical investments |
| • | Level 2 – other significant observable inputs (including quoted prices for similar investments, interest rates, prepayment speeds, credit risk, etc.) |
| • | Level 3 – significant unobservable inputs (including a fund's own assumptions in determining the fair value of investments) |
In cases where the inputs used to measure fair value fall in different levels of the fair value hierarchy, the level disclosed is determined based on the lowest level input that is significant to the fair value measurement in its entirety. The inputs or methodology used for valuing securities are not necessarily an indication of the risk associated with investing in those securities.
Eaton Vance
Floating Rate Portfolio
April 30, 2024
Notes to Financial Statements (Unaudited) — continued
At April 30, 2024, the hierarchy of inputs used in valuing the Portfolio’s investments and open derivative instruments, which are carried at fair value, were as follows:
| Asset Description | Level 1 | Level 2 | Level 3* | Total |
| Asset-Backed Securities | $ — | $ 248,471,740 | $ — | $ 248,471,740 |
| Common Stocks | 321,220 | 49,534,187 | 1,025,305 | 50,880,712 |
| Corporate Bonds | — | 520,635,384 | — | 520,635,384 |
| Exchange-Traded Funds | 17,883,480 | — | — | 17,883,480 |
| Senior Floating-Rate Loans (Less Unfunded Loan Commitments) | — | 4,502,420,368 | 28,923,867 | 4,531,344,235 |
| Short-Term Investments | 132,996,037 | — | — | 132,996,037 |
| Total Investments | $ 151,200,737 | $ 5,321,061,679 | $ 29,949,172 | $ 5,502,211,588 |
| Forward Foreign Currency Exchange Contracts | $ — | $ 9,879,313 | $ — | $ 9,879,313 |
| Total | $ 151,200,737 | $ 5,330,940,992 | $ 29,949,172 | $ 5,512,090,901 |
| Liability Description | | | | |
| Forward Foreign Currency Exchange Contracts | $ — | $ (10,741) | $ — | $ (10,741) |
| Total | $ — | $ (10,741) | $ — | $ (10,741) |
| * | None of the unobservable inputs for Level 3 assets, individually or collectively, had a material impact on the Portfolio. |
Level 3 investments at the beginning and/or end of the period in relation to net assets were not significant and accordingly, a reconciliation of Level 3 assets for the six months ended April 30, 2024 is not presented.
9 Risks and Uncertainties
Risks Associated with Foreign Investments
Foreign investments can be adversely affected by political, economic and market developments abroad, including the imposition of economic and other sanctions by the United States or another country. There may be less publicly available information about foreign issuers because they may not be subject to reporting practices, requirements or regulations comparable to those to which United States companies are subject. Foreign markets may be smaller, less liquid and more volatile than the major markets in the United States. Trading in foreign markets typically involves higher expense than trading in the United States. The Portfolio may have difficulties enforcing its legal or contractual rights in a foreign country. Securities that trade or are denominated in currencies other than the U.S. dollar may be adversely affected by fluctuations in currency exchange rates.
Credit Risk
The Portfolio invests primarily in below investment grade floating-rate loans, which are considered speculative because of the credit risk of their issuers. Changes in economic conditions or other circumstances are more likely to reduce the capacity of issuers of these securities to make principal and interest payments. Such companies are more likely to default on their payments of interest and principal owed than issuers of investment grade bonds. An economic downturn generally leads to a higher non-payment rate, and a loan or other debt obligation may lose significant value before a default occurs. Lower rated investments also may be subject to greater price volatility than higher rated investments. Moreover, the specific collateral used to secure a loan may decline in value or become illiquid, which would adversely affect the loan’s value.
Eaton Vance
Floating-Rate & High Income Fund
April 30, 2024
| Officers of Eaton Vance Floating-Rate & High Income Fund |
Kenneth A. Topping
President | Nicholas S. Di Lorenzo
Secretary |
Deidre E. Walsh
Vice President and Chief Legal Officer | Laura T. Donovan
Chief Compliance Officer |
James F. Kirchner
Treasurer | |
| Officers of Eaton Vance Floating Rate Portfolio |
Kenneth A. Topping
President | Nicholas S. Di Lorenzo
Secretary |
Deidre E. Walsh
Vice President and Chief Legal Officer | Laura T. Donovan
Chief Compliance Officer |
James F. Kirchner
Treasurer | |
| Trustees of Eaton Vance Floating-Rate & High Income Fund and Eaton Vance Floating Rate Portfolio | |
George J. Gorman
Chairperson | |
| Alan C. Bowser | |
| Mark R. Fetting | |
| Cynthia E. Frost | |
| Valerie A. Mosley | |
| Anchal Pachnanda* | |
| Keith Quinton | |
| Marcus L. Smith | |
| Susan J. Sutherland | |
| Scott E. Wennerholm | |
| Nancy A. Wiser | |
| U.S. Customer Privacy Notice | March 2024 |
| FACTS | WHAT DOES EATON VANCE DO WITH YOUR PERSONAL INFORMATION? |
| Why? | Financial companies choose how they share your personal information. Federal law gives consumers the right to limit some but not all sharing. Federal law also requires us to tell you how we collect, share, and protect your personal information. Please read this notice carefully to understand what we do. |
| |
| What? | The types of personal information we collect and share depend on the product or service you have with us. This information can include:■ Social Security number and income
■ investment experience and risk tolerance
■ checking account information and wire transfer instructions |
| |
| How? | All financial companies need to share customers’ personal information to run their everyday business. In the section below, we list the reasons financial companies can share their customers’ personal information; the reasons Eaton Vance chooses to share; and whether you can limit this sharing. |
| Reasons we can share your personal information | Does Eaton Vance
share? | Can you limit
this sharing? |
| For our everyday business purposes — such as to process your transactions, maintain your account(s), respond to court orders and legal investigations, or report to credit bureaus | Yes | No |
| For our marketing purposes — to offer our products and services to you | Yes | No |
| For joint marketing with other financial companies | No | We don’t share |
| For our affiliates’ everyday business purposes — information about your transactions and experiences | Yes | No* |
| For our affiliates’ everyday business purposes — information about your creditworthiness | Yes | Yes* |
| For our affiliates to market to you | Yes | Yes* |
| For nonaffiliates to market to you | No | We don’t share |
To limit our
sharing | Call toll-free 1-800-262-1122 or email: EVPrivacy@eatonvance.comPlease note:If you are a new customer, we can begin sharing your information 30 days from the date we sent this notice. When you are no longer our customer, we continue to share your information as described in this notice. However, you can contact us at any time to limit our sharing. |
| Questions? | Call toll-free 1-800-262-1122 or email: EVPrivacy@eatonvance.com |
| U.S. Customer Privacy Notice — continued | March 2024 |
| Who we are |
| Who is providing this notice? | Eaton Vance Management and our investment management affiliates (“Eaton Vance”) (see Affiliates definition below.) |
| What we do |
How does Eaton Vance
protect my personal
information? | To protect your personal information from unauthorized access and use, we use security measures that comply with federal law. These measures include computer safeguards and secured files and buildings. We have policies governing the proper handling of customer information by personnel and requiring third parties that provide support to adhere to appropriate security standards with respect to such information. |
How does Eaton Vance
collect my personal
information? | We collect your personal information, for example, when you■ open an account or make deposits or withdrawals from your account
■ buy securities from us or make a wire transfer
■ give us your contact informationWe also collect your personal information from others, such as credit bureaus, affiliates, or other companies. |
| Why can’t I limit all sharing? | Federal law gives you the right to limit only■ sharing for affiliates’ everyday business purposes — information about your creditworthiness
■ affiliates from using your information to market to you
■ sharing for nonaffiliates to market to youState laws and individual companies may give you additional rights to limit sharing. (See below for more on your rights under state law.) |
What happens when I limit
sharing for an account I hold
jointly with someone else? | Your choices will apply to everyone on your account. |
| Definitions |
| Affiliates | Companies related by common ownership or control. They can be financial and nonfinancial companies.■ Our affiliates include registered investment advisers such as Eaton Vance Management, Eaton Vance Advisers International Ltd., Boston Management and Research, Calvert Research and Management, Parametric Portfolio Associates LLC, Atlanta Capital Management Company LLC, Morgan Stanley Investment Management Inc., Morgan Stanley Investment Management Co.; registered broker-dealers such as Morgan Stanley Distributors Inc. and Eaton Vance Distributors, Inc. (together, the “Investment Management Affiliates”); and companies with a Morgan Stanley name and financial companies such as Morgan Stanley Smith Barney LLC and Morgan Stanley & Co. (the “Morgan Stanley Affiliates”). |
| Nonaffiliates | Companies not related by common ownership or control. They can be financial and nonfinancial companies.■ Eaton Vance does not share with nonaffiliates so they can market to you. |
| Joint marketing | A formal agreement between nonaffiliated financial companies that together market financial products or services to you.■ Eaton Vance does not jointly market. |
| U.S. Customer Privacy Notice — continued | March 2024 |
| Other important information |
| *PLEASE NOTE: Eaton Vance does not share your creditworthiness information or your transactions and experiences information with the Morgan Stanley Affiliates, nor does Eaton Vance enable the Morgan Stanley Affiliates to market to you. Your opt outs will prevent Eaton Vance from sharing your creditworthiness information with the Investment Management Affiliates and will prevent the Investment Management Affiliates from marketing their products to you.Vermont: Except as permitted by law, we will not share personal information we collect about Vermont residents with Nonaffiliates unless you provide us with your written consent to share such information.California: Except as permitted by law, we will not share personal information we collect about California residents with Nonaffiliates and we will limit sharing such personal information with our Affiliates to comply with California privacy laws that apply to us. |
Delivery of Shareholder Documents. The Securities and Exchange Commission (SEC) permits funds to deliver only one copy of shareholder documents, including prospectuses, proxy statements and shareholder reports, to fund investors with multiple accounts at the same residential or post office box address. This practice is often called “householding” and it helps eliminate duplicate mailings to shareholders. Eaton Vance, or your financial intermediary, may household the mailing of your documents indefinitely unless you instruct Eaton Vance, or your financial intermediary, otherwise. If you would prefer that your Eaton Vance documents not be householded, please contact Eaton Vance at 1-800-262-1122, or contact your financial intermediary. Your instructions that householding not apply to delivery of your Eaton Vance documents will typically be effective within 30 days of receipt by Eaton Vance or your financial intermediary.
Portfolio Holdings. Each Eaton Vance Fund and its underlying Portfolio(s) (if applicable) files a schedule of portfolio holdings on Part F to Form N-PORT with the SEC. Certain information filed on Form N-PORT may be viewed on the Eaton Vance website at www.eatonvance.com, by calling Eaton Vance at 1-800-262-1122 or in the EDGAR database on the SEC’s website at www.sec.gov.
Proxy Voting. From time to time, funds are required to vote proxies related to the securities held by the funds. The Eaton Vance Funds or their underlying Portfolios (if applicable) vote proxies according to a set of policies and procedures approved by the Funds’ and Portfolios’ Boards. You may obtain a description of these policies and procedures and information on how the Funds or Portfolios voted proxies relating to portfolio securities during the most recent 12-month period ended June 30, without charge, upon request, by calling 1-800-262-1122 and by accessing the SEC’s website at www.sec.gov.
Tailored Shareholder Reports. Effective January 24, 2023, the SEC adopted rule and form amendments to require open-end mutual funds and ETFs to transmit concise and visually engaging streamlined annual and semi-annual reports to shareholders that highlight key information. Other information, including financial statements, will no longer appear in a streamlined shareholder report but must be available online, delivered free of charge upon request, and filed on a semi-annual basis on Form N-CSR. The rule and form amendments have a compliance date of July 24, 2024. At this time, management is evaluating the impact of these amendments on the shareholder reports for the Eaton Vance Funds.
This Page Intentionally Left Blank
This Page Intentionally Left Blank
Investment Adviser of Eaton Vance Floating Rate Portfolio
Boston Management and Research
One Post Office Square
Boston, MA 02109
Investment Adviser and Administrator of Eaton Vance
Floating-Rate & High Income Fund
Eaton Vance Management
One Post Office Square
Boston, MA 02109
Principal Underwriter*
Eaton Vance Distributors, Inc.
One Post Office Square
Boston, MA 02109
(617) 482-8260
Custodian
State Street Bank and Trust Company
One Congress Street, Suite 1
Boston, MA 02114-2016
Transfer Agent
BNY Mellon Investment Servicing (US) Inc.
Attn: Eaton Vance Funds
P.O. Box 534439
Pittsburgh, PA 15253-4439
(800) 262-1122
Fund Offices
One Post Office Square
Boston, MA 02109
* FINRA BrokerCheck. Investors may check the background of their Investment Professional by contacting the Financial Industry Regulatory Authority (FINRA). FINRA BrokerCheck is a free tool to help investors check the professional background of current and former FINRA-registered securities firms and brokers. FINRA BrokerCheck is available by calling 1-800-289-9999 and at www.FINRA.org. The FINRA BrokerCheck brochure describing this program is available to investors at www.FINRA.org.
Eaton Vance
Government Opportunities Fund
Semi-Annual Report
April 30, 2024
Commodity Futures Trading Commission Registration. The Commodity Futures Trading Commission (“CFTC”) has adopted regulations that subject registered investment companies and advisers to regulation by the CFTC if a fund invests more than a prescribed level of its assets in certain CFTC-regulated instruments (including futures, certain options and swap agreements) or markets itself as providing investment exposure to such instruments. The investment adviser has claimed an exclusion from the definition of “commodity pool operator” under the Commodity Exchange Act with respect to its management of the Fund. Accordingly, neither the Fund nor the adviser with respect to the operation of the Fund is subject to CFTC regulation. Because of its management of other strategies, the Fund's adviser is registered with the CFTC as a commodity pool operator. The adviser is also registered as a commodity trading advisor.
Fund shares are not insured by the FDIC and are not deposits or other obligations of, or guaranteed by, any depository institution. Shares are subject to investment risks, including possible loss of principal invested.
This report must be preceded or accompanied by a current summary prospectus or prospectus. Before investing, investors should consider carefully the investment objective, risks, and charges and expenses of a mutual fund. This and other important information is contained in the summary prospectus and prospectus, which can be obtained from a financial intermediary. Prospective investors should read the prospectus carefully before investing. For further information, please call 1-800-262-1122.
Semi-Annual Report April 30, 2024
Eaton Vance
Government Opportunities Fund
Eaton Vance
Government Opportunities Fund
April 30, 2024
Performance
Portfolio Manager(s) Andrew Szczurowski, CFA and Alexander Payne, CFA
| % Average Annual Total Returns1,2 | Class
Inception Date | Performance
Inception Date | Six Months | One Year | Five Years | Ten Years |
| Class A at NAV | 08/24/1984 | 08/24/1984 | 1.84% | (1.58)% | (0.52)% | 0.30% |
| Class A with 3.25% Maximum Sales Charge | — | — | (1.44) | (4.72) | (1.19) | (0.03) |
| Class C at NAV | 11/01/1993 | 08/24/1984 | 1.45 | (2.34) | (1.27) | (0.30) |
| Class C with 1% Maximum Deferred Sales Charge | — | — | 0.46 | (3.27) | (1.27) | (0.30) |
| Class I at NAV | 04/03/2009 | 08/24/1984 | 1.77 | (1.51) | (0.30) | 0.53 |
| Class R at NAV | 08/12/2005 | 08/24/1984 | 1.70 | (1.86) | (0.78) | 0.05 |
|
| ICE BofA U.S. Mortgage-Backed Securities Index | — | — | 5.19% | (2.15)% | (0.97)% | 0.72% |
| ICE BofA 1-3 Year U.S. Treasury Index | — | — | 2.12 | 2.37 | 1.05 | 1.02 |
| % Total Annual Operating Expense Ratios3 | Class A | Class C | Class I | Class R |
| Gross | 1.43% | 2.19% | 1.20% | 1.68% |
| Net | 1.38 | 2.14 | 1.15 | 1.63 |
See Endnotes and Additional Disclosures in this report.
Past performance is no guarantee of future results. Returns are historical and are calculated by determining the percentage change in net asset value (NAV) or offering price (as applicable) with all distributions reinvested. Furthermore, returns do not reflect the deduction of taxes that shareholders may have to pay on Fund distributions or upon the redemption of Fund shares. Investment return and principal value will fluctuate so that shares, when redeemed, may be worth more or less than their original cost. Performance for periods less than or equal to one year is cumulative. Performance is for the stated time period only; due to market volatility, current Fund performance may be lower or higher than the quoted return. For performance as of the most recent month-end, please refer to eatonvance.com.
Eaton Vance
Government Opportunities Fund
April 30, 2024
| Asset Allocation (% of total investments) |
Eaton Vance
Government Opportunities Fund
April 30, 2024
Endnotes and Additional Disclosures
| 1 | The ICE BofA U.S. Mortgage Backed Securities Index tracks the performance of U.S. dollar denominated fixed rate and hybrid residential mortgage pass-through securities publicly issued by U.S. agencies in the U.S. domestic market. ICE BofA 1-3 Year U.S. Treasury Index is an unmanaged index of short-term U.S. Treasury securities. ICE® BofA® indices are not for redistribution or other uses; provided “as is”, without warranties, and with no liability. Eaton Vance has prepared this report and ICE Data Indices, LLC does not endorse it, or guarantee, review, or endorse Eaton Vance’s products. BofA® is a licensed registered trademark of Bank of America Corporation in the United States and other countries. Bloomberg U.S. Intermediate Government Bond Index is an unmanaged index of U.S. government bonds with maturities from one year up to (but not including) 10 years. Unless otherwise stated, index returns do not reflect the effect of any applicable sales charges, commissions, expenses, taxes or leverage, as applicable. It is not possible to invest directly in an index. |
| 2 | Total Returns at NAV do not include applicable sales charges. If sales charges were deducted, the returns would be lower. Total Returns shown with maximum sales charge reflect the stated maximum sales charge. Unless otherwise stated, performance does not reflect the deduction of taxes on Fund distributions or redemptions of Fund shares.Effective November 5, 2020, Class C shares automatically convert to Class A shares eight years after purchase. The average annual total returns listed for Class C reflect conversion to Class A shares after eight years. Prior to November 5, 2020, Class C shares automatically converted to Class A shares ten years after purchase. |
| 3 | Source: Fund prospectus. Net expense ratios reflect a contractual expense reimbursement that continues through 3/1/25. The expense ratios for the current reporting period can be found in the Financial Highlights section of this report. Performance reflects expenses waived and/or reimbursed, if applicable. Without such waivers and/or reimbursements, performance would have been lower. |
| | Fund profile subject to change due to active management. |
| | Important Notice to Shareholders |
| | Effective December 31, 2023, the Fund changed its primary benchmark from the ICE BofA 1-3 Year U.S.Treasury Index to the ICE BofA U.S. Mortgage Backed Securities Index because the investment adviser believes it is a more appropriate benchmark for the Fund. |
Eaton Vance
Government Opportunities Fund
April 30, 2024
Example
As a Fund shareholder, you incur two types of costs: (1) transaction costs, including sales charges (loads) on purchases; and (2) ongoing costs, including management fees; distribution and/or service fees; and other Fund expenses. This Example is intended to help you understand your ongoing costs (in dollars) of Fund investing and to compare these costs with the ongoing costs of investing in other mutual funds. The Example is based on an investment of $1,000 invested at the beginning of the period and held for the entire period (November 1, 2023 to April 30, 2024).
Actual Expenses
The first section of the table below provides information about actual account values and actual expenses. You may use the information in this section, together with the amount you invested, to estimate the expenses that you paid over the period. Simply divide your account value by $1,000 (for example, an $8,600 account value divided by $1,000 = 8.6), then multiply the result by the number in the first section under the heading entitled “Expenses Paid During Period” to estimate the expenses you paid on your account during this period.
Hypothetical Example for Comparison Purposes
The second section of the table below provides information about hypothetical account values and hypothetical expenses based on the actual Fund expense ratio and an assumed rate of return of 5% per year (before expenses), which is not the actual Fund return. The hypothetical account values and expenses may not be used to estimate the actual ending account balance or expenses you paid for the period. You may use this information to compare the ongoing costs of investing in your Fund and other funds. To do so, compare this 5% hypothetical example with the 5% hypothetical examples that appear in the shareholder reports of the other funds.
Please note that the expenses shown in the table are meant to highlight your ongoing costs only and do not reflect any transactional costs, such as sales charges (loads). Therefore, the second section of the table is useful in comparing ongoing costs only, and will not help you determine the relative total costs of owning different funds. In addition, if these transactional costs were included, your costs would be higher.
| | Beginning
Account Value
(11/1/23) | Ending
Account Value
(4/30/24) | Expenses Paid
During Period*
(11/1/23 – 4/30/24) | Annualized
Expense
Ratio |
| Actual | | | | |
| Class A | $1,000.00 | $1,018.40 | $13.30** | 2.65% |
| Class C | $1,000.00 | $1,014.50 | $17.08** | 3.41% |
| Class I | $1,000.00 | $1,017.70 | $11.89** | 2.37% |
| Class R | $1,000.00 | $1,017.00 | $14.54** | 2.90% |
| |
| Hypothetical | | | | |
| (5% return per year before expenses) | | | | |
| Class A | $1,000.00 | $1,011.69 | $13.25** | 2.65% |
| Class C | $1,000.00 | $1,007.91 | $17.02** | 3.41% |
| Class I | $1,000.00 | $1,013.08 | $11.86** | 2.37% |
| Class R | $1,000.00 | $1,010.44 | $14.50** | 2.90% |
| * | Expenses are equal to the Fund's annualized expense ratio for the indicated Class, multiplied by the average account value over the period, multiplied by 182/366 (to reflect the one-half year period). The Example assumes that the $1,000 was invested at the net asset value per share determined at the close of business on October 31, 2023. |
| ** | Absent an allocation of certain expenses to affiliate(s), expenses would be higher. |
Eaton Vance
Government Opportunities Fund
April 30, 2024
Portfolio of Investments (Unaudited)
| Asset-Backed Securities — 3.2% |
| Security | Principal
Amount
(000's omitted) | Value |
| CFMT LLC, Series 2023-HB12, Class M4, 4.25%, 4/25/33(1)(2) | $ | 3,490 | $ 2,848,082 |
| KKR SFR Warehouse Participation, 8.815%, (30-day SOFR Average + 3.50%), 12/13/24(3) | | 3,369 | 3,369,706 |
| Loandepot GMSR Master Trust, Series 2018-GT1, Class A, 8.984%, (1 mo. SOFR + 3.664%), 10/16/25(1)(3) | | 1,000 | 972,202 |
| NRZ Excess Spread-Collateralized Notes: | | | |
| Series 2021-FNT1, Class A, 2.981%, 3/25/26(1) | | 200 | 187,742 |
| Series 2021-GNT1, Class A, 3.474%, 11/25/26(1) | | 1,169 | 1,080,536 |
| Pagaya AI Technology in Housing Trust, Series 2023-1, Class F, 3.60%, 10/25/40(1) | | 1,000 | 742,525 |
| STAR Trust, Series 2021-SFR1, Class H, 9.886%, (1 mo. SOFR + 4.564%), 4/17/38(1)(3) | | 500 | 467,652 |
| VINE Trust, Series 2023-SFR1, Class E1, 4.75%, 12/17/40(1) | | 2,000 | 1,750,203 |
Total Asset-Backed Securities
(identified cost $11,156,603) | | | $ 11,418,648 |
| Collateralized Mortgage Obligations — 64.1% |
| Security | Principal
Amount
(000's omitted) | Value |
| Angel Oak Mortgage Trust I LLC, Series 2019-1, Class B1, 5.40%, 11/25/48(1)(2) | $ | 1,000 | $ 978,902 |
| Brean Asset-Backed Securities Trust, Series 2023-RM6, Class A1, 5.25% to 1/25/28, 1/25/63(1)(4) | | 3,836 | 3,576,100 |
| Cascade MH Asset Trust, Series 2022-MH1, Class A, 4.25% to 7/25/27, 8/25/54(1)(4) | | 1,371 | 1,235,412 |
| CFMT LLC, Series 2023-HB11, Class M2, 4.00%, 2/25/37(1)(2) | | 2,000 | 1,742,914 |
| CHNGE Mortgage Trust: | | | |
| Series 2023-1, Class A1, 7.065% to 2/25/26, 3/25/58(1)(2) | | 733 | 734,851 |
| Series 2023-2, Class A3, 7.436% to 5/25/26, 6/25/58(1)(4) | | 2,494 | 2,499,921 |
| Deephaven Residential Mortgage Trust, Series 2020-2, Class B2, 5.798%, 5/25/65(1)(2) | | 500 | 486,656 |
| Ellington Financial Mortgage Trust, Series 2022-4, Class A3, 5.90% to 12/25/25, 9/25/67(1)(4) | | 604 | 604,224 |
| FARM Mortgage Trust, Series 2023-1, Class B, 3.034%, 3/25/52(1)(2) | | 3,104 | 2,178,035 |
| Federal Home Loan Mortgage Corp.: | | | |
| Series 1822, Class Z, 6.90%, 3/15/26 | | 31 | 31,532 |
| Series 1829, Class ZB, 6.50%, 3/15/26 | | 0 (5) | 429 |
| Series 1896, Class Z, 6.00%, 9/15/26 | | 9 | 8,614 |
| Series 2075, Class PH, 6.50%, 8/15/28 | | 16 | 15,946 |
| Security | Principal
Amount
(000's omitted) | Value |
| Federal Home Loan Mortgage Corp.: (continued) | | | |
| Series 2091, Class ZC, 6.00%, 11/15/28 | $ | 46 | $ 46,203 |
| Series 2102, Class Z, 6.00%, 12/15/28 | | 12 | 11,939 |
| Series 2115, Class K, 6.00%, 1/15/29 | | 75 | 74,694 |
| Series 2142, Class Z, 6.50%, 4/15/29 | | 29 | 29,237 |
| Series 4107, Class SA, 0.00%, (2.506% - 30-day SOFR Average x 0.571, Floor 0.00%), 9/15/42(6) | | 419 | 264,386 |
| Series 4107, Class SB, 0.00%, (2.506% - 30-day SOFR Average x 0.571, Floor 0.00%), 9/15/42(6) | | 208 | 131,434 |
| Series 4107, Class SC, 0.00%, (2.506% - 30-day SOFR Average x 0.571, Floor 0.00%), 9/15/42(6) | | 500 | 315,178 |
| Series 4107, Class SD, 0.00%, (2.506% - 30-day SOFR Average x 0.571, Floor 0.00%), 9/15/42(6) | | 373 | 183,202 |
| Series 4204, Class AF, 5.00%, (30-day SOFR Average + 1.114%, Cap 5.00%), 5/15/43(3) | | 540 | 471,179 |
| Series 4212, Class NS, 0.00%, (5.263% - 30-day SOFR Average x 1.20, Floor 0.00%), 6/15/43(6) | | 287 | 133,486 |
| Series 4259, Class UE, 2.50%, 5/15/43 | | 249 | 220,790 |
| Series 4623, Class SK, 0.00%, (3.49% - 30-day SOFR Average x 0.714, Floor 0.00%), 10/15/46(6) | | 259 | 134,037 |
| Series 4938, Class KZ, 2.50%, 12/25/49 | | 659 | 355,556 |
| Series 5009, Class ZN, 3.50%, 7/25/50 | | 879 | 651,601 |
| Series 5028, Class AZ, 2.00%, 10/25/50 | | 221 | 84,398 |
| Series 5028, Class TZ, 2.00%, 10/25/50 | | 1,096 | 538,054 |
| Series 5031, Class Z, 2.50%, 10/25/50 | | 1 | 309 |
| Series 5035, Class AZ, 2.00%, 11/25/50 | | 1,117 | 492,820 |
| Series 5035, Class ZK, 2.50%, 11/25/50 | | 1,247 | 685,379 |
| Series 5035, Class ZT, 2.00%, 10/25/50 | | 780 | 334,744 |
| Series 5039, Class ZJ, 2.00%, 11/25/50 | | 101 | 38,877 |
| Series 5040, Class TZ, 2.50%, 11/25/50 | | 185 | 90,154 |
| Series 5042, Class PZ, 2.00%, 11/25/50 | | 2,094 | 866,491 |
| Series 5058, Class ZH, 3.00%, 5/25/50 | | 157 | 86,267 |
| Series 5071, Class CS, 0.00%, (3.30% - 30-day SOFR Average, Floor 0.00%), 2/25/51(6) | | 1,266 | 608,221 |
| Series 5072, Class ZU, 2.50%, 2/25/51 | | 343 | 169,302 |
| Series 5083, Class ZW, 2.50%, 3/25/51 | | 503 | 246,381 |
| Series 5090, Class PZ, 2.50%, 3/25/51 | | 245 | 113,841 |
| Series 5093, Class Z, 3.00%, 1/25/51 | | 0 (5) | 35 |
| Series 5101, Class EZ, 2.00%, 3/25/51 | | 553 | 269,790 |
| Series 5104, Class WZ, 3.00%, 4/25/51 | | 131 | 78,242 |
| Series 5114, Class ZH, 3.00%, 5/25/51 | | 58 | 34,910 |
| Series 5123, Class JZ, 2.00%, 7/25/51 | | 111 | 47,792 |
| Series 5129, Class HZ, 1.25%, 4/25/50 | | 168 | 61,855 |
| Series 5129, Class TZ, 2.50%, 8/25/51 | | 452 | 207,683 |
| Series 5131, Class QZ, 3.00%, 7/25/51 | | 277 | 160,217 |
| Series 5132, Class LZ, 2.50%, 8/25/51 | | 1,015 | 520,643 |
| Series 5135, Class MZ, 2.50%, 8/25/51 | | 1,966 | 1,071,445 |
| Series 5136, Class ZJ, 2.50%, 8/25/51 | | 2,108 | 1,118,305 |
| Series 5139, Class DZ, 2.50%, 9/25/51 | | 1,385 | 734,255 |
6
See Notes to Financial Statements.
Eaton Vance
Government Opportunities Fund
April 30, 2024
Portfolio of Investments (Unaudited) — continued
| Security | Principal
Amount
(000's omitted) | Value |
| Federal Home Loan Mortgage Corp.: (continued) | | | |
| Series 5141, Class ZJ, 2.50%, 9/25/51 | $ | 1,814 | $ 963,059 |
| Series 5150, Class ZJ, 2.50%, 10/25/51 | | 1,723 | 952,056 |
| Series 5150, Class ZN, 2.50%, 10/25/51 | | 190 | 94,619 |
| Series 5159, Class ZP, 3.00%, 11/25/51 | | 437 | 252,595 |
| Series 5159, Class ZT, 3.00%, 11/25/51 | | 775 | 474,670 |
| Series 5163, Class Z, 3.00%, 11/25/51 | | 548 | 301,628 |
| Series 5168, Class MZ, 3.00%, 10/25/51 | | 1,042 | 624,839 |
| Series 5300, Class EY, 6.00%, 12/25/52 | | 2,000 | 1,949,251 |
| Series 5324, Class MZ, 6.00%, 7/25/53 | | 3,495 | 3,362,324 |
| Series 5327, Class B, 6.00%, 8/25/53 | | 2,350 | 2,286,711 |
| Interest Only:(7) | | | |
| Series 362, Class C12, 4.00%, 12/15/47 | | 2,038 | 412,609 |
| Series 4749, Class IL, 4.00%, 12/15/47 | | 730 | 153,602 |
| Series 4756, Class KI, 4.00%, 1/15/48 | | 805 | 166,405 |
| Series 4768, Class IO, 4.00%, 3/15/48 | | 576 | 121,707 |
| Series 4772, Class PI, 4.00%, 1/15/48 | | 854 | 180,435 |
| Series 4791, Class JI, 4.00%, 5/15/48 | | 1,169 | 259,047 |
| Series 4966, Class SY, 0.606%, (5.936% - 30-day SOFR Average), 4/25/50(6) | | 2,071 | 213,042 |
| Series 5008, Class IE, 2.00%, 9/25/50 | | 4,347 | 552,271 |
| Series 5010, Class I, 2.00%, 9/25/50 | | 3,262 | 416,151 |
| Series 5010, Class IN, 2.00%, 9/25/50 | | 2,368 | 301,521 |
| Series 5010, Class NI, 2.00%, 9/25/50 | | 2,738 | 348,093 |
| Series 5016, Class UI, 2.00%, 9/25/50 | | 2,646 | 336,136 |
| Series 5017, Class DI, 2.00%, 9/25/50 | | 4,631 | 588,238 |
| Series 5024, Class CI, 2.00%, 10/25/50 | | 5,088 | 629,425 |
| Series 5025, Class GI, 2.00%, 10/25/50 | | 1,113 | 142,894 |
| Series 5028, Class TI, 2.00%, 10/25/50 | | 1,418 | 141,144 |
| Series 5038, Class DI, 2.00%, 11/25/50 | | 7,154 | 910,332 |
| Series 5051, Class S, 0.00%, (3.60% - 30-day SOFR Average, Floor 0.00%), 12/25/50(6) | | 4,213 | 85,329 |
| Series 5070, Class CI, 2.00%, 2/25/51 | | 7,906 | 1,034,312 |
| Principal Only:(8) | | | |
| Series 246, Class PO, 0.00%, 5/15/37 | | 1,164 | 908,511 |
| Series 3435, Class PO, 0.00%, 4/15/38 | | 1,104 | 856,872 |
| Series 4239, Class OU, 0.00%, 7/15/43 | | 319 | 162,947 |
| Federal Home Loan Mortgage Corp. STACR REMICS Trust, Series 2019-HQA3, Class B2, 12.945%, (30-day SOFR Average + 7.614%), 9/25/49(1)(3) | | 1,000 | 1,139,380 |
| Federal National Mortgage Association: | | | |
| Series 1994-82, Class Z, 8.00%, 5/25/24 | | 1 | 672 |
| Series 2000-49, Class A, 8.00%, 3/18/27 | | 18 | 17,914 |
| Series 2001-81, Class HE, 6.50%, 1/25/32 | | 153 | 155,562 |
| Series 2012-133, Class WS, 0.00%, (3.696% - 30-day SOFR Average x 0.833, Floor 0.00%), 12/25/42(6) | | 305 | 172,321 |
| Series 2012-134, Class ZT, 2.00%, 12/25/42 | | 1,323 | 968,146 |
| Security | Principal
Amount
(000's omitted) | Value |
| Federal National Mortgage Association: (continued) | | | |
| Series 2013-6, Class TY, 1.50%, 2/25/43 | $ | 795 | $ 484,375 |
| Series 2013-58, Class SC, 0.00%, (5.828% - 30-day SOFR Average x 1.50, Floor 0.00%), 6/25/43(6) | | 323 | 216,614 |
| Series 2020-45, Class MA, 0.00%, (3.108% - 30-day SOFR Average x 0.80, Floor 0.00%), 6/25/43(6) | | 199 | 95,683 |
| Series 2020-63, Class ZN, 3.00%, 9/25/50 | | 96 | 50,798 |
| Series 2021-3, Class ZH, 2.50%, 2/25/51 | | 192 | 90,128 |
| Series 2021-14, Class GZ, 2.50%, 3/25/51 | | 135 | 61,029 |
| Series 2021-42, Class ZD, 3.00%, 11/25/50 | | 706 | 417,471 |
| Series 2021-52, Class JZ, 2.50%, 8/25/51 | | 1,650 | 899,966 |
| Series 2021-56, Class LZ, 2.50%, 9/25/51 | | 3,184 | 1,833,538 |
| Series 2021-66, Class JZ, 2.50%, 10/25/51 | | 1,393 | 757,554 |
| Series 2021-77, Class WZ, 3.00%, 8/25/50 | | 39 | 20,635 |
| Series 2021-95, Class ZC, 3.00%, 8/25/51 | | 541 | 324,503 |
| Series 2023-12, Class LW, 6.00%, 4/25/53 | | 2,000 | 1,947,356 |
| Series 2023-13, Class LY, 6.00%, 4/25/53 | | 2,000 | 1,977,494 |
| Series 2023-14, Class EL, 6.00%, 4/25/53 | | 7,000 | 6,914,062 |
| Interest Only:(7) | | | |
| Series 2017-66, Class TI, 0.05%, (5.936% - 30-day SOFR Average), 10/25/42(6) | | 11,460 | 34,331 |
| Series 2018-21, Class IO, 3.00%, 4/25/48 | | 2,338 | 407,121 |
| Series 2019-1, Class SA, 0.00%, (5.286% - 30-day SOFR Average, Floor 0.00%), 2/25/49(6) | | 1,229 | 41,397 |
| Series 2020-23, Class SP, 0.606%, (5.936% - 30-day SOFR Average), 2/25/50(6) | | 2,048 | 212,531 |
| Series 2020-45, Class HI, 2.50%, 7/25/50 | | 3,158 | 475,466 |
| Series 2020-45, Class IJ, 2.50%, 7/25/50 | | 4,982 | 709,452 |
| Series 2020-73, Class NI, 2.00%, 10/25/50 | | 702 | 90,170 |
| Series 2021-3, Class KI, 2.50%, 2/25/51 | | 6,576 | 964,067 |
| Series 2021-3, Class LI, 2.50%, 2/25/51 | | 6,482 | 926,713 |
| Series 2021-4, Class AI, 2.00%, 12/25/49 | | 9,075 | 1,053,890 |
| Series 2021-10, Class EI, 2.00%, 3/25/51 | | 3,669 | 490,522 |
| Principal Only:(8) | | | |
| Series 379, Class 1, 0.00%, 5/25/37 | | 736 | 569,688 |
| Series 2014-9, Class DO, 0.00%, 2/25/43 | | 472 | 339,634 |
| Series 2014-17, Class PO, 0.00%, 4/25/44 | | 1,029 | 710,119 |
| Series 2023-55, Class OE, 0.00%, 11/25/53 | | 6,014 | 4,590,467 |
| Finance of America HECM Buyout, Series 2022-HB2, Class M5, 6.00%, 8/1/32(1)(2) | | 1,000 | 654,262 |
| Government National Mortgage Association: | | | |
| Series 2016-168, Class JS, 0.00%, (4.336% - 1 mo. SOFR x 1.16, Floor 0.00%), 11/20/46(6) | | 32 | 17,875 |
| Series 2017-137, Class AF, 5.00%, (1 mo. SOFR + 0.614%, Cap 5.00%), 9/20/47(3) | | 880 | 831,051 |
| Series 2020-84, Class BZ, 2.50%, 6/20/50 | | 690 | 335,601 |
| Series 2021-1, Class ZD, 3.00%, 1/20/51 | | 137 | 93,352 |
| Series 2021-24, Class EZ, 2.50%, 1/20/51 | | 396 | 196,303 |
7
See Notes to Financial Statements.
Eaton Vance
Government Opportunities Fund
April 30, 2024
Portfolio of Investments (Unaudited) — continued
| Security | Principal
Amount
(000's omitted) | Value |
Government National Mortgage Association:
(continued) | | | |
| Series 2021-24, Class KZ, 2.50%, 2/20/51 | $ | 399 | $ 223,849 |
| Series 2021-25, Class JZ, 2.50%, 2/20/51 | | 225 | 99,590 |
| Series 2021-49, Class VZ, 2.50%, 3/20/51 | | 2 | 945 |
| Series 2021-77, Class ZG, 3.00%, 7/20/50 | | 48 | 24,861 |
| Series 2021-97, Class MZ, 3.00%, 8/20/50 | | 282 | 163,365 |
| Series 2021-97, Class ZC, 3.00%, 8/20/50 | | 603 | 354,668 |
| Series 2021-105, Class MZ, 3.00%, 6/20/51 | | 470 | 269,247 |
| Series 2021-114, Class JZ, 3.00%, 6/20/51 | | 186 | 102,772 |
| Series 2021-118, Class EZ, 2.50%, 7/20/51 | | 1,182 | 664,170 |
| Series 2021-121, Class ZE, 2.50%, 7/20/51 | | 37 | 17,621 |
| Series 2021-122, Class ZL, 2.50%, 7/20/51 | | 1,422 | 766,025 |
| Series 2021-131, Class ZN, 3.00%, 7/20/51 | | 306 | 185,444 |
| Series 2021-136, Class WZ, 3.00%, 8/20/51 | | 779 | 445,794 |
| Series 2021-136, Class Z, 2.50%, 8/20/51 | | 1,938 | 1,057,375 |
| Series 2021-137, Class GZ, 2.50%, 8/20/51 | | 2,108 | 1,175,757 |
| Series 2021-138, Class Z, 2.50%, 8/20/51 | | 1,254 | 722,434 |
| Series 2021-139, Class ZJ, 2.50%, 8/20/51 | | 1,727 | 954,545 |
| Series 2021-154, Class ZC, 2.50%, 9/20/51 | | 898 | 493,533 |
| Series 2021-154, Class ZL, 3.00%, 9/20/51 | | 483 | 254,522 |
| Series 2021-156, Class GZ, 3.00%, 9/20/51 | | 1,699 | 1,130,697 |
| Series 2021-159, Class ZJ, 2.50%, 9/20/51 | | 1,317 | 741,989 |
| Series 2021-159, Class ZP, 2.00%, 9/20/51 | | 1,172 | 624,410 |
| Series 2021-160, Class NZ, 3.00%, 9/20/51 | | 616 | 326,695 |
| Series 2021-177, Class JZ, 3.00%, 10/20/51 | | 504 | 312,025 |
| Series 2021-214, Class LZ, 3.00%, 12/20/51 | | 1,072 | 700,394 |
| Series 2022-173, Class S, 3.189%, (22.733% - 30-day SOFR Average x 3.667), 10/20/52(6) | | 1,513 | 1,471,594 |
| Series 2022-189, Class US, 3.189%, (22.733% - 30-day SOFR Average x 3.667), 11/20/52(6) | | 1,774 | 1,724,504 |
| Series 2022-195, Class AS, 3.403%, (23.125% - 30-day SOFR Average x 3.70), 11/20/52(6) | | 949 | 950,380 |
| Series 2022-197, Class SW, 3.527%, (16.32% - 30-day SOFR Average x 2.40), 11/20/52(6) | | 1,607 | 1,490,549 |
| Series 2023-53, Class AL, 5.50%, 4/20/53 | | 4,000 | 3,822,060 |
| Series 2023-53, Class SE, 3.005%, (22.55% - 30-day SOFR Average x 3.667), 4/20/53(6) | | 2,601 | 2,487,528 |
| Series 2023-63, Class LB, 6.00%, 5/20/53 | | 3,000 | 2,932,481 |
| Series 2023-63, Class S, 3.005%, (22.55% - 30-day SOFR Average x 3.667), 5/20/53(6) | | 1,769 | 1,691,150 |
| Series 2023-64, Class LB, 6.00%, 5/20/53 | | 1,224 | 1,196,383 |
| Series 2023-65, Class G, 3.005%, (22.55% - 30-day SOFR Average x 3.667), 5/20/53(6) | | 1,900 | 1,830,780 |
| Series 2023-65, Class SB, 3.005%, (22.55% - 30-day SOFR Average x 3.667), 5/20/53(6) | | 1,826 | 1,750,594 |
| Series 2023-66, Class S, 3.005%, (22.55% - 30-day SOFR Average x 3.667), 5/20/53(6) | | 888 | 848,726 |
| Series 2023-82, Class AL, 6.00%, 6/20/53 | | 6,000 | 5,878,056 |
| Series 2023-84, Class MW, 6.00%, 6/20/53 | | 3,500 | 3,420,509 |
| Security | Principal
Amount
(000's omitted) | Value |
Government National Mortgage Association:
(continued) | | | |
| Series 2023-84, Class SN, 2.825%, (22.387% - 30-day SOFR Average x 3.67), 6/20/53(6) | $ | 1,780 | $ 1,690,492 |
| Series 2023-96, Class BL, 6.00%, 7/20/53 | | 2,500 | 2,446,443 |
| Series 2023-96, Class DB, 6.00%, 7/20/53 | | 2,500 | 2,443,405 |
| Series 2023-97, Class CB, 6.00%, 7/20/53 | | 3,000 | 2,959,422 |
| Series 2023-98, Class BW, 6.00%, 7/20/53 | | 1,500 | 1,466,918 |
| Series 2023-98, Class JB, 6.00%, 7/20/53 | | 3,000 | 2,934,179 |
| Series 2023-99, Class AL, 6.00%, 7/20/53 | | 4,000 | 3,910,103 |
| Series 2023-117, Class JB, 6.00%, 8/20/53 | | 2,000 | 1,961,800 |
| Series 2023-150, Class AS, 7.006%, (27.528% - 30-day SOFR Average x 3.85), 10/20/53(6) | | 2,930 | 2,987,379 |
| Series 2023-164, Class EL, 6.00%, 11/20/53 | | 5,000 | 4,964,560 |
| Series 2023-164, Class LD, 6.50%, 11/20/53 | | 4,778 | 4,839,834 |
| Series 2023-165, Class DY, 6.00%, 11/20/53 | | 10,000 | 9,889,121 |
| Series 2023-165, Class EY, 6.50%, 11/20/53 | | 19,000 | 19,301,762 |
| Series 2023-173, Class AX, 6.00%, 11/20/53 | | 5,000 | 4,958,330 |
| Series 2023-182, Class EL, 6.00%, 12/20/53 | | 2,500 | 2,426,301 |
| Interest Only:(7) | | | |
| Series 2013-66, Class IE, 0.05%, (6.636% - 1 mo. SOFR x 1.00, Cap 0.05%), 7/20/42(6) | | 6,226 | 14,089 |
| Series 2014-94, Class IC, 0.10%, (6.286% - 1 mo. SOFR x 1.00, Cap 0.10%), 9/20/35(6) | | 8,902 | 34,445 |
| Series 2014-100, Class VI, 0.15%, (6.486% - 1 mo. SOFR x 1.00, Cap 0.15%), 5/20/40(6) | | 3,707 | 17,069 |
| Series 2014-139, Class BI, 0.25%, (6.536% - 1 mo. SOFR x 1.00, Cap 0.25%), 11/20/37(6) | | 3,577 | 23,548 |
| Series 2018-127, Class SG, 0.82%, (6.136% - 1 mo. SOFR), 9/20/48(6) | | 2,821 | 199,018 |
| Series 2019-27, Class SA, 0.62%, (5.936% - 1 mo. SOFR), 2/20/49(6) | | 1,979 | 160,045 |
| Series 2019-38, Class SQ, 0.62%, (5.936% - 1 mo. SOFR), 3/20/49(6) | | 2,477 | 188,605 |
| Series 2019-43, Class BS, 0.62%, (5.936% - 1 mo. SOFR), 4/20/49(6) | | 3,252 | 266,162 |
| Series 2020-32, Class KI, 3.50%, 3/20/50 | | 3,450 | 575,722 |
| Series 2020-65, Class MI, 2.50%, 12/20/49 | | 2,720 | 323,762 |
| Series 2020-97, Class MI, 2.50%, 3/20/50 | | 1,752 | 220,824 |
| Series 2020-146, Class IQ, 2.00%, 10/20/50 | | 10,077 | 1,169,142 |
| Series 2020-146, Class QI, 2.00%, 10/20/50 | | 5,332 | 609,940 |
| Series 2020-149, Class NI, 2.50%, 10/20/50 | | 10,590 | 1,402,593 |
| Series 2020-165, Class UI, 2.00%, 11/20/50 | | 4,373 | 492,742 |
| Series 2020-167, Class KI, 2.00%, 11/20/50 | | 6,859 | 793,951 |
| Series 2020-167, Class YI, 2.00%, 11/20/50 | | 5,553 | 645,957 |
| Series 2020-173, Class DI, 2.00%, 11/20/50 | | 8,263 | 978,157 |
| Series 2020-181, Class TI, 2.00%, 12/20/50 | | 14,143 | 1,599,592 |
| Series 2021-23, Class TI, 2.50%, 2/20/51 | | 6,730 | 861,344 |
| Series 2021-56, Class SD, 0.00%, (2.30% - 30-day SOFR Average, Floor 0.00%), 9/20/50(6) | | 4,262 | 38,144 |
8
See Notes to Financial Statements.
Eaton Vance
Government Opportunities Fund
April 30, 2024
Portfolio of Investments (Unaudited) — continued
| Security | Principal
Amount
(000's omitted) | Value |
| Interest Only: (continued) | | | |
| Series 2021-114, Class MI, 3.00%, 6/20/51 | $ | 4,752 | $ 768,592 |
| Series 2021-122, Class NI, 3.00%, 7/20/51 | | 3,267 | 530,854 |
| Series 2021-125, Class SA, 0.00%, (3.636% - 1 mo. SOFR, Floor 0.00%), 7/20/51(6) | | 3,906 | 77,978 |
| Series 2021-131, Class QI, 3.00%, 7/20/51 | | 6,233 | 822,545 |
| Series 2021-140, Class YS, 0.00%, (1.586% - 1 mo. SOFR, Floor 0.00%), 8/20/51(6) | | 3,280 | 16,801 |
| Series 2021-175, Class AS, 0.00%, (1.686% - 1 mo. SOFR, Floor 0.00%), 10/20/51(6) | | 16,787 | 90,487 |
| Series 2021-175, Class SB, 0.00%, (1.686% - 1 mo. SOFR, Floor 0.00%), 10/20/51(6) | | 8,489 | 45,509 |
| Series 2021-193, Class IU, 3.00%, 11/20/49 | | 13,330 | 1,853,486 |
| Series 2021-193, Class YS, 0.00%, (2.45% - 30-day SOFR Average, Floor 0.00%), 11/20/51(6) | | 8,111 | 50,611 |
| Series 2021-196, Class GI, 3.00%, 11/20/51 | | 6,175 | 981,607 |
| Series 2022-119, Class CS, 0.00%, (3.00% - 30-day SOFR Average, Floor 0.00%), 7/20/52(6) | | 44,336 | 252,674 |
| Series 2022-126, Class AS, 0.00%, (3.69% - 30-day SOFR Average, Floor 0.00%), 7/20/52(6) | | 13,221 | 142,573 |
| Series 2022-135, Class SA, 0.00%, (3.00% - 30-day SOFR Average, Floor 0.00%), 6/20/52(6) | | 17,918 | 111,903 |
| Series 2023-13, Class SA, 0.07%, (5.40% - 30-day SOFR Average), 1/20/53(6) | | 5,667 | 135,847 |
| Series 2023-19, Class SD, 0.97%, (6.30% - 30-day SOFR Average), 2/20/53(6) | | 4,214 | 200,522 |
| Series 2023-20, Class HS, 0.97%, (6.30% - 30-day SOFR Average), 2/20/53(6) | | 4,466 | 210,011 |
| Series 2023-22, Class ES, 0.97%, (6.30% - 30-day SOFR Average), 2/20/53(6) | | 6,749 | 317,350 |
| Series 2023-22, Class SA, 0.37%, (5.70% - 30-day SOFR Average), 2/20/53(6) | | 3,549 | 106,882 |
| Series 2023-24, Class SB, 0.00%, (5.15% - 30-day SOFR Average, Floor 0.00%), 2/20/53(6) | | 13,498 | 288,157 |
| Series 2023-24, Class SG, 0.97%, (6.30% - 30-day SOFR Average), 2/20/53(6) | | 6,749 | 317,350 |
| Series 2023-32, Class SA, 0.97%, (6.30% - 30-day SOFR Average), 2/20/53(6) | | 12,655 | 595,031 |
| Series 2023-38, Class LS, 0.97%, (6.30% - 30-day SOFR Average), 3/20/53(6) | | 4,250 | 199,058 |
| Series 2023-47, Class HS, 0.97%, (6.30% - 30-day SOFR Average), 3/20/53(6) | | 1,402 | 65,689 |
| Series 2023-47, Class SC, 0.92%, (6.25% - 30-day SOFR Average), 3/20/53(6) | | 2,121 | 97,025 |
| Series 2023-89, Class SE, 0.72%, (6.05% - 30-day SOFR Average), 6/20/53(6) | | 29,623 | 1,459,308 |
| Series 2024-64, Class EI, 6.50%, 4/20/64 | | 8,000 | 1,191,816 |
| LHOME Mortgage Trust, Series 2023-RTL2, Class A1, 8.00% to 1/25/26, 6/25/28(1)(4) | | 1,050 | 1,067,758 |
| MFRA Trust, Series 2023-NQM1, Class A2, 5.75% to 1/25/26, 11/25/67(1)(4) | | 533 | 528,697 |
| NYMT Loan Trust, Series 2024-BPL1, Class A1, 7.154% to 7/25/26, 2/25/29(1)(4) | | 2,000 | 1,988,353 |
| Security | Principal
Amount
(000's omitted) | Value |
| PNMAC GMSR Issuer Trust: | | | |
| 2024 Participation, 11.068%, (30-day SOFR Average + 5.75%), 12/24/24 | $ | 2,511 | $ 2,530,757 |
| Series 2022-GT1, Class A, 9.58%, (30-day SOFR Average + 4.25%), 5/25/27(1)(3) | | 500 | 507,657 |
| Radnor RE Ltd., Series 2022-1, Class M1A, 9.08%, (30-day SOFR Average + 3.75%), 9/25/32(1)(3) | | 2,180 | 2,211,885 |
| Unison Trust, Series 2021-1, Class A, 4.50%, 4/25/50(1)(2) | | 8,739 | 7,802,276 |
Total Collateralized Mortgage Obligations
(identified cost $268,269,686) | | | $ 228,918,826 |
| Commercial Mortgage-Backed Securities — 0.4% |
| Security | Principal
Amount
(000's omitted) | Value |
| CSMC Trust, Series 2022-NWPT, Class A, 8.464%, (1 mo. SOFR + 3.143%), 9/9/24(1)(3) | | $ 1,520 | $ 1,527,555 |
Total Commercial Mortgage-Backed Securities
(identified cost $1,519,308) | | | $ 1,527,555 |
| U.S. Department of Agriculture Loans — 6.5% |
| Security | Principal
Amount
(000's omitted) | Value |
| USDA Guaranteed Loans: | | | |
| 8.00%, (U.S. (Fed) Prime Rate - 0.50%), 2/16/43(3) | $ | 9,371 | $ 9,374,651 |
| 8.00%, (U.S. (Fed) Prime Rate - 0.50%), 2/16/43(3) | | 2,709 | 2,710,145 |
| 8.00%, (U.S. (Fed) Prime Rate - 0.50%), 2/16/43(3) | | 11,199 | 11,203,423 |
Total U.S. Department of Agriculture Loans
(identified cost $23,279,222) | | | $ 23,288,219 |
| U.S. Government Agency Commercial Mortgage-Backed Securities — 0.7% |
| Security | Principal
Amount
(000's omitted) | Value |
| FRESB Mortgage Trust: | | | |
Interest Only:(7)
Series 2021-SB91, Class X1, 0.681%, 8/25/41(2) | $ | 4,719 | $ 124,982 |
| Government National Mortgage Association: | | | |
| Interest Only:(7) | | | |
| Series 2021-101, Class IO, 0.677%, 4/16/63(2) | | 8,843 | 458,117 |
| Series 2021-132, Class IO, 0.726%, 4/16/63(2) | | 8,656 | 469,487 |
| Series 2021-144, Class IO, 0.825%, 4/16/63(2) | | 8,509 | 511,887 |
| Series 2021-186, Class IO, 0.764%, 5/16/63(2) | | 9,426 | 528,955 |
9
See Notes to Financial Statements.
Eaton Vance
Government Opportunities Fund
April 30, 2024
Portfolio of Investments (Unaudited) — continued
| Security | Principal
Amount
(000's omitted) | Value |
| Interest Only: (continued) | | | |
| Series 2022-3, Class IO, 0.64%, 2/16/61(2) | $ | 9,582 | $ 466,090 |
Total U.S. Government Agency Commercial Mortgage-Backed Securities
(identified cost $3,269,146) | | | $ 2,559,518 |
| U.S. Government Agency Mortgage-Backed Securities — 77.7% |
| Security | Principal
Amount
(000's omitted) | Value |
| Federal Home Loan Mortgage Corp.: | | | |
| 4.401%, (COF + 1.254%), with maturity at 2034(9) | $ | 72 | $ 69,637 |
| 4.462%, (COF + 1.254%), with maturity at 2035(9) | | 258 | 251,976 |
| 4.50%, with maturity at 2035 | | 544 | 520,630 |
| 5.00%, with maturity at 2052(10) | | 4,882 | 4,589,127 |
| 5.50%, with various maturities to 2052 | | 1,714 | 1,669,710 |
| 5.50%, with maturity at 2053(10) | | 1,798 | 1,756,697 |
| 5.991%, (1 yr. CMT + 2.238%), with maturity at 2036(9) | | 367 | 370,758 |
| 6.00%, with various maturities to 2053 | | 4,788 | 4,769,845 |
| 6.21%, (1 yr. CMT + 2.249%), with maturity at 2038(9) | | 326 | 328,617 |
| 6.50%, with various maturities to 2053 | | 1,211 | 1,236,106 |
| 7.00%, with various maturities to 2025 | | 4 | 3,931 |
| 7.50%, with maturity at 2024 | | 0 (5) | 2 |
| 8.50%, with maturity at 2025 | | 0 (5) | 402 |
| 9.00%, with various maturities to 2027 | | 0 (5) | 417 |
| 9.50%, with maturity at 2025 | | 0 (5) | 3 |
| Federal National Mortgage Association: | | | |
| 4.397%, (COF + 1.25%), with maturity at 2025(9) | | 7 | 7,072 |
| 4.398%, (COF + 1.272%), with maturity at 2033(9) | | 168 | 162,631 |
| 4.401%, (COF + 1.254%), with maturity at 2034(9) | | 20 | 19,389 |
| 4.41%, (COF + 1.25%), with maturity at 2026(9) | | 55 | 54,090 |
| 4.414%, (COF + 1.254%), with maturity at 2034(9) | | 138 | 133,554 |
| 4.424%, (COF + 1.298%), with maturity at 2033(9) | | 94 | 90,645 |
| 4.428%, (COF + 1.298%), with maturity at 2035(9) | | 88 | 85,516 |
| 4.437%, (COF + 1.254%), with maturity at 2035(9) | | 74 | 72,697 |
| 4.50%, with various maturities to 2052 | | 769 | 714,256 |
| 4.581%, (COF + 1.26%), with maturity at 2036(9) | | 89 | 86,390 |
| 4.698%, (COF + 1.315%), with maturity at 2036(9) | | 144 | 139,594 |
| 4.705%, (COF + 1.258%), with maturity at 2036(9) | | 23 | 22,524 |
| 5.00%, with maturity at 2027 | | 19 | 18,845 |
| 5.05%, (COF + 1.738%), with maturity at 2035(9) | | 359 | 351,924 |
| 5.173%, (COF + 1.853%), with maturity at 2034(9) | | 136 | 133,823 |
| 5.382%, (COF + 1.811%), with maturity at 2036(9) | | 1,662 | 1,625,576 |
| 5.50%, with various maturities to 2052 | | 4,264 | 4,152,497 |
| 5.50%, with maturity at 2052(10) | | 9,181 | 8,933,665 |
| Security | Principal
Amount
(000's omitted) | Value |
| Federal National Mortgage Association: (continued) | | | |
| 5.505%, (COF + 2.381%), with maturity at 2027(9) | $ | 38 | $ 37,478 |
| 6.00%, with various maturities to 2053 | | 4,156 | 4,147,903 |
| 6.00%, with maturity at 2053(10) | | 3,233 | 3,223,628 |
| 6.234%, (1 yr. CMT + 2.091%), with maturity at 2040(9) | | 164 | 165,055 |
| 6.255%, (1yr. MTA + 1.167%), with maturity at 2044(9) | | 151 | 149,981 |
| 6.50%, with various maturities to 2053 | | 6,141 | 6,215,753 |
| 6.842%, with maturity at 2025 | | 1 | 995 |
| 8.068%, with maturity at 2030 | | 0 (5) | 441 |
| 8.50%, with maturity at 2037 | | 41 | 42,649 |
| 9.00%, with maturity at 2025 | | 5 | 5,260 |
| 9.50%, with various maturities to 2030 | | 2 | 1,572 |
| Government National Mortgage Association: | | | |
| 3.50%, with maturity at 2050 | | 448 | 394,579 |
| 3.75%, (1 yr. CMT + 1.50%), with maturity at 2027(9) | | 31 | 30,001 |
| 4.00%, with various maturities to 2049 | | 1,144 | 1,043,420 |
| 4.00%, (1 yr. CMT + 1.50%), with maturity at 2026(9) | | 23 | 22,797 |
| 4.50%, with various maturities to 2049 | | 427 | 399,710 |
| 5.00%, with various maturities to 2052(10) | | 10,081 | 9,676,497 |
| 5.50%, with various maturities to 2063 | | 34,939 | 34,443,757 |
| 5.50%, with various maturities to 2062(10) | | 5,719 | 5,613,832 |
| 6.00%, with various maturities to 2063 | | 45,744 | 46,228,284 |
| 6.00%, with various maturities to 2053(10) | | 6,784 | 6,870,041 |
| 6.50%, with various maturities to 2063(10) | | 37,083 | 37,781,608 |
| 7.00%, with various maturities to 2063 | | 12,458 | 12,866,928 |
| 7.00%, with various maturities to 2053(10) | | 4,610 | 4,809,450 |
| 7.50%, with various maturities to 2054 | | 3,583 | 3,626,097 |
| 9.50%, with maturity at 2025 | | 1 | 869 |
| Uniform Mortgage-Backed Security: | | | |
| 5.50%, 30-Year, TBA(11) | | 19,500 | 18,940,136 |
| 6.00%, 30-Year, TBA(11) | | 40,000 | 39,657,814 |
| 7.00%, 30-Year, TBA(11) | | 8,250 | 8,423,822 |
Total U.S. Government Agency Mortgage-Backed Securities
(identified cost $281,972,675) | | | $ 277,192,903 |
10
See Notes to Financial Statements.
Eaton Vance
Government Opportunities Fund
April 30, 2024
Portfolio of Investments (Unaudited) — continued
| U.S. Government Guaranteed Small Business Administration Loans — 0.2% |
| Security | Principal
Amount
(000's omitted) | Value |
| SBA IO Trust: | | | |
| Interest Only:(12)(13) | | | |
| Series 2018-4, Class A, 1.627%, 2/25/44(1) | $ | 14,518 | $ 531,829 |
Total U.S. Government Guaranteed Small Business Administration Loans
(identified cost $4,188,802) | | | $ 531,829 |
| Short-Term Investments — 1.8% |
| Security | Shares | Value |
| Morgan Stanley Institutional Liquidity Funds - Government Portfolio, Institutional Class, 5.22%(14) | | 6,226,794 | $ 6,226,794 |
Total Short-Term Investments
(identified cost $6,226,794) | | | $ 6,226,794 |
Total Investments — 154.6%
(identified cost $599,882,236) | | | $ 551,664,292 |
| TBA Sale Commitments — (21.3)% |
| U.S. Government Agency Mortgage-Backed Securities — (21.3)% |
| Security | Principal
Amount
(000's omitted) | Value |
| Uniform Mortgage-Backed Security: | | | |
| 5.50%, 30-Year, TBA(11) | | $ (13,200) | $ (12,821,016) |
| 6.50%, 30-Year, TBA(11) | | (54,370) | (54,777,772) |
| 7.00%, 30-Year, TBA(11) | | (8,250) | (8,423,822) |
Total U.S. Government Agency Mortgage-Backed Securities
(proceeds $76,262,532) | | | $ (76,022,610) |
Total TBA Sale Commitments
(proceeds $76,262,532) | | | $ (76,022,610) |
| Other Assets, Less Liabilities — (33.3)% | | | $ (118,712,524) |
| Net Assets — 100.0% | | | $ 356,929,158 |
| The percentage shown for each investment category in the Portfolio of Investments is based on net assets. |
| (1) | Security exempt from registration under Rule 144A of the Securities Act of 1933, as amended. These securities may be sold in certain transactions in reliance on an exemption from registration (normally to qualified institutional buyers). At April 30, 2024, the aggregate value of these securities is $40,045,609 or 11.2% of the Fund's net assets. |
| (2) | Weighted average fixed-rate coupon that changes/updates monthly. Rate shown is the rate at April 30, 2024. |
| (3) | Variable rate security. The stated interest rate represents the rate in effect at April 30, 2024. |
| (4) | Step coupon security. Interest rate represents the rate in effect at April 30, 2024. |
| (5) | Principal amount is less than $500. |
| (6) | Inverse floating-rate security whose coupon varies inversely with changes in the interest rate index. The stated interest rate represents the coupon rate in effect at April 30, 2024. |
| (7) | Interest only security that entitles the holder to receive only interest payments on the underlying mortgages. Principal amount shown is the notional amount of the underlying mortgages on which coupon interest is calculated. |
| (8) | Principal only security that entitles the holder to receive only principal payments on the underlying mortgages. |
| (9) | Adjustable rate mortgage security whose interest rate generally adjusts monthly based on a weighted average of interest rates on the underlying mortgages. The coupon rate may not reflect the applicable index value as interest rates on the underlying mortgages may adjust on various dates and at various intervals and may be subject to lifetime ceilings and lifetime floors and lookback periods. Rate shown is the coupon rate at April 30, 2024. |
| (10) | Security (or a portion thereof) has been pledged for the benefit of the counterparty for reverse repurchase agreements. |
| (11) | TBA (To Be Announced) securities are purchased or sold on a forward commitment basis with an approximate principal amount and maturity date. The actual principal amount, which is not expected to differ significantly from the commitment amount, and maturity date are determined upon settlement. |
| (12) | Interest only security that entitles the holder to receive only a portion of the interest payments on the underlying loans. Principal amount shown is the notional amount of the underlying loans on which coupon interest is calculated. |
| (13) | The stated interest rate represents the weighted average fixed interest rate at April 30, 2024 of all interest only securities comprising the trust. |
| (14) | May be deemed to be an affiliated investment company. The rate shown is the annualized seven-day yield as of April 30, 2024. |
11
See Notes to Financial Statements.
Eaton Vance
Government Opportunities Fund
April 30, 2024
Portfolio of Investments (Unaudited) — continued
| Futures Contracts |
| Description | Number of
Contracts | Position | Expiration
Date | Notional
Amount | Value/Unrealized
Appreciation
(Depreciation) |
| Interest Rate Futures | | | | | |
| U.S. 5-Year Treasury Note | 3,919 | Long | 6/28/24 | $410,484,635 | $ (7,715,962) |
| U.S. Long Treasury Bond | (477) | Short | 6/18/24 | (54,288,563) | 2,313,125 |
| U.S. Ultra-Long Treasury Bond | (87) | Short | 6/18/24 | (10,401,937) | 644,839 |
| | | | | | $ (4,757,998) |
| Interest Rate Swaps (Centrally Cleared) |
Notional Amount
(000's omitted) | Fund
Pays/
Receives
Floating
Rate | Floating Rate | Annual
Fixed Rate | Termination
Date | Value | Unamortized
Upfront
Receipts
(Payments) | Unrealized
Appreciation
(Depreciation) |
| USD | 50,000 | Receives | SOFR
(pays annually) | 3.07%
(pays annually) | 10/14/32 | $ 5,084,513 | $ — | $ 5,084,513 |
| USD | 25,000 | Receives | SOFR
(pays annually) | 1.92%
(pays annually) | 4/8/52 | 8,971,777 | — | 8,971,777 |
| Total | | | | | | $14,056,290 | $ — | $14,056,290 |
| Abbreviations: |
| CMT | – Constant Maturity Treasury |
| COF | – Cost of Funds 11th District |
| MTA | – Monthly Treasury Average |
| SOFR | – Secured Overnight Financing Rate |
| STACR | – Structured Agency Credit Risk |
| TBA | – To Be Announced |
| Currency Abbreviations: |
| USD | – United States Dollar |
12
See Notes to Financial Statements.
Eaton Vance
Government Opportunities Fund
April 30, 2024
Statement of Assets and Liabilities (Unaudited)
| | April 30, 2024 |
| Assets | |
| Unaffiliated investments, at value (identified cost $593,655,442) | $ 545,437,498 |
| Affiliated investments, at value (identified cost $6,226,794) | 6,226,794 |
| Cash | 302,599 |
| Deposits for reverse repurchase agreements | 6,620,000 |
| Deposits for forward commitment securities | 47,000 |
| Deposits for derivatives collateral: | |
| Futures contracts | 3,940,933 |
| Centrally cleared swap contracts | 3,526,884 |
| Interest receivable | 2,872,031 |
| Dividends receivable from affiliated investments | 15,570 |
| Receivable for investments sold | 231,567,445 |
| Receivable for TBA sale commitments | 76,262,532 |
| Receivable for Fund shares sold | 469,072 |
| Receivable for variation margin on open centrally cleared swap contracts | 550,141 |
| Receivable from affiliates | 32,828 |
| Trustees' deferred compensation plan | 152,973 |
| Total assets | $ 878,024,300 |
| Liabilities | |
| Cash collateral due to broker | $ 47,000 |
| Payable for reverse repurchase agreements, including accrued interest of $2,173,859 | 142,409,962 |
| Payable for forward commitment securities | 299,753,571 |
| TBA sale commitments, at value (proceeds receivable $76,262,532) | 76,022,610 |
| Payable for Fund shares redeemed | 1,230,656 |
| Payable for variation margin on open futures contracts | 915,352 |
| Distributions payable | 80,225 |
| Payable to affiliates: | |
| Investment adviser fee | 192,632 |
| Distribution and service fees | 38,981 |
| Trustees' fees | 2,361 |
| Trustees' deferred compensation plan | 152,973 |
| Accrued expenses | 248,819 |
| Total liabilities | $ 521,095,142 |
| Net Assets | $ 356,929,158 |
| Sources of Net Assets | |
| Paid-in capital | $ 494,927,966 |
| Accumulated loss | (137,998,808) |
| Net Assets | $ 356,929,158 |
| Class A Shares | |
| Net Assets | $ 102,411,657 |
| Shares Outstanding | 20,215,852 |
Net Asset Value and Redemption Price Per Share
(net assets ÷ shares of beneficial interest outstanding) | $ 5.07 |
Maximum Offering Price Per Share
(100 ÷ 96.75 of net asset value per share) | $ 5.24 |
| Class C Shares | |
| Net Assets | $ 5,783,691 |
| Shares Outstanding | 1,143,330 |
Net Asset Value and Offering Price Per Share*
(net assets ÷ shares of beneficial interest outstanding) | $ 5.06 |
13
See Notes to Financial Statements.
Eaton Vance
Government Opportunities Fund
April 30, 2024
Statement of Assets and Liabilities (Unaudited) — continued
| | April 30, 2024 |
| Class I Shares | |
| Net Assets | $218,364,610 |
| Shares Outstanding | 43,120,905 |
Net Asset Value, Offering Price and Redemption Price Per Share
(net assets ÷ shares of beneficial interest outstanding) | $ 5.06 |
| Class R Shares | |
| Net Assets | $ 30,369,200 |
| Shares Outstanding | 6,017,303 |
Net Asset Value, Offering Price and Redemption Price Per Share
(net assets ÷ shares of beneficial interest outstanding) | $ 5.05 |
| | On sales of $100,000 or more, the offering price of Class A shares is reduced. |
| * | Redemption price per share is equal to the net asset value less any applicable contingent deferred sales charge. |
14
See Notes to Financial Statements.
Eaton Vance
Government Opportunities Fund
April 30, 2024
Statement of Operations (Unaudited)
| | Six Months Ended |
| | April 30, 2024 |
| Investment Income | |
| Dividend income from affiliated investments | $ 107,917 |
| Interest income | 13,743,579 |
| Total investment income | $13,851,496 |
| Expenses | |
| Investment adviser fee | $ 1,286,282 |
| Distribution and service fees: | |
| Class A | 135,570 |
| Class C | 30,035 |
| Class R | 82,332 |
| Trustees’ fees and expenses | 13,872 |
| Custodian fee | 76,900 |
| Transfer and dividend disbursing agent fees | 176,814 |
| Legal and accounting services | 71,932 |
| Printing and postage | 52,758 |
| Registration fees | 33,141 |
| Interest expense and fees | 3,123,980 |
| Miscellaneous | 13,122 |
| Total expenses | $ 5,096,738 |
| Deduct: | |
| Waiver and/or reimbursement of expenses by affiliates | $ 144,743 |
| Total expense reductions | $ 144,743 |
| Net expenses | $ 4,951,995 |
| Net investment income | $ 8,899,501 |
| Realized and Unrealized Gain (Loss) | |
| Net realized gain (loss): | |
| Investment transactions | $ (4,353,998) |
| Written swaptions | 361,169 |
| Futures contracts | (2,811,958) |
| Swap contracts | 4,321,783 |
| Net realized loss | $ (2,483,004) |
| Change in unrealized appreciation (depreciation): | |
| Investments | $ 14,404,589 |
| Written swaptions | (340,677) |
| TBA sale commitments | 298,943 |
| Futures contracts | (4,074,766) |
| Swap contracts | (6,563,293) |
| Net change in unrealized appreciation (depreciation) | $ 3,724,796 |
| Net realized and unrealized gain | $ 1,241,792 |
| Net increase in net assets from operations | $10,141,293 |
15
See Notes to Financial Statements.
Eaton Vance
Government Opportunities Fund
April 30, 2024
Statements of Changes in Net Assets
| | Six Months Ended
April 30, 2024
(Unaudited) | Year Ended
October 31, 2023 |
| Increase (Decrease) in Net Assets | | |
| From operations: | | |
| Net investment income | $ 8,899,501 | $ 18,235,802 |
| Net realized loss | (2,483,004) | (12,341,093) |
| Net change in unrealized appreciation (depreciation) | 3,724,796 | (14,494,901) |
| Net increase (decrease) in net assets from operations | $ 10,141,293 | $ (8,600,192) |
| Distributions to shareholders: | | |
| Class A | $ (3,066,785) | $ (6,458,487) |
| Class C | (146,713) | (285,558) |
| Class I | (7,350,331) | (13,382,177) |
| Class R | (886,639) | (1,930,264) |
| Total distributions to shareholders | $ (11,450,468) | $ (22,056,486) |
| Tax return of capital to shareholders: | | |
| Class A | $ — | $ (421,962) |
| Class C | — | (18,768) |
| Class I | — | (898,156) |
| Class R | — | (124,804) |
| Total tax return of capital to shareholders | $ — | $ (1,463,690) |
| Transactions in shares of beneficial interest: | | |
| Class A | $ (4,176,310) | $ (19,573,857) |
| Class C | (88,946) | (570,960) |
| Class I | (44,616,514) | 50,888,858 |
| Class R | (1,869,925) | (11,035,743) |
| Net increase (decrease) in net assets from Fund share transactions | $ (50,751,695) | $ 19,708,298 |
| Net decrease in net assets | $ (52,060,870) | $ (12,412,070) |
| Net Assets | | |
| At beginning of period | $ 408,990,028 | $ 421,402,098 |
| At end of period | $356,929,158 | $408,990,028 |
16
See Notes to Financial Statements.
Eaton Vance
Government Opportunities Fund
April 30, 2024
| | Class A |
| | Six Months Ended
April 30, 2024
(Unaudited) | Year Ended October 31, |
| | 2023 | 2022 | 2021 | 2020 | 2019 |
| Net asset value — Beginning of period | $ 5.120 | $ 5.510 | $ 6.030 | $ 6.180 | $ 6.070 | $ 6.100 |
| Income (Loss) From Operations | | | | | | |
| Net investment income(1) | $ 0.115 | $ 0.226 | $ 0.121 | $ 0.118 | $ 0.073 | $ 0.134 |
| Net realized and unrealized gain (loss) | (0.016) (2) | (0.323) | (0.516) | (0.158) | 0.191 | 0.029 |
| Total income (loss) from operations | $ 0.099 | $ (0.097) | $ (0.395) | $ (0.040) | $ 0.264 | $ 0.163 |
| Less Distributions | | | | | | |
| From net investment income | $ (0.149) | $ (0.276) | $ (0.119) | $ (0.110) | $ (0.154) | $ (0.193) |
| Tax return of capital | — | (0.017) | (0.006) | — | — | — |
| Total distributions | $ (0.149) | $ (0.293) | $ (0.125) | $ (0.110) | $ (0.154) | $ (0.193) |
| Net asset value — End of period | $ 5.070 | $ 5.120 | $ 5.510 | $ 6.030 | $ 6.180 | $ 6.070 |
| Total Return(3) | 1.84% (4)(5) | (1.89)% (5) | (6.63)% (5) | (0.66)% (5) | 4.40% (5) | 2.71% |
| Ratios/Supplemental Data | | | | | | |
| Net assets, end of period (000’s omitted) | $102,412 | $107,556 | $136,321 | $163,208 | $158,552 | $138,956 |
| Ratios (as a percentage of average daily net assets): | | | | | | |
| Expenses | 2.65% (5)(6)(7)(8) | 1.38% (5)(7)(8) | 1.05% (5)(7) | 1.05% (5) | 1.11% (5)(8) | 1.26% (8) |
| Net investment income | 4.38% (6) | 4.18% | 2.06% | 1.91% | 1.20% | 2.21% |
| Portfolio Turnover | 329% (4)(9) | 604% (9) | 796% (9) | 335% (9) | 180% (9) | 90% |
| (1) | Computed using average shares outstanding. |
| (2) | The per share amount is not in accord with the net realized and unrealized gain (loss) for the period because of the timing of Fund share transactions and the amount of the per share realized and unrealized gains and losses at such time. |
| (3) | Returns are historical and are calculated by determining the percentage change in net asset value with all distributions reinvested and do not reflect the effect of sales charges. |
| (4) | Not annualized. |
| (5) | The investment adviser reimbursed certain operating expenses (equal to 0.07%, 0.05%, 0.05%, 0.02% and 0.03% of average daily net assets for the six months ended April 30, 2024 and the years ended October 31, 2023, 2022, 2021 and 2020, respectively). Absent this reimbursement, total return would be lower. |
| (6) | Annualized. |
| (7) | Includes a reduction by the investment adviser of a portion of its adviser fee due to the Fund’s investment in the Liquidity Fund (equal to less than 0.005%, less than 0.01% and less than 0.005% of average daily net assets for the six months ended April 30, 2024 and the years ended October 31, 2023 and 2022, respectively). |
| (8) | Includes interest expense, including on reverse repurchase agreements, of 1.60%, 0.33%, 0.03% and 0.07% of average daily net assets for the six months ended April 30, 2024 and the years ended October 31, 2023, 2020 and 2019, respectively. |
| (9) | Includes the effect of To Be Announced (TBA) transactions. |
17
See Notes to Financial Statements.
Eaton Vance
Government Opportunities Fund
April 30, 2024
Financial Highlights — continued
| | Class C |
| | Six Months Ended
April 30, 2024
(Unaudited) | Year Ended October 31, |
| | 2023 | 2022 | 2021 | 2020 | 2019 |
| Net asset value — Beginning of period | $ 5.110 | $ 5.500 | $ 6.020 | $ 6.170 | $ 6.060 | $ 6.090 |
| Income (Loss) From Operations | | | | | | |
| Net investment income(1) | $ 0.095 | $ 0.185 | $ 0.073 | $ 0.072 | $ 0.030 | $ 0.090 |
| Net realized and unrealized gain (loss) | (0.017) (2) | (0.323) | (0.512) | (0.158) | 0.188 | 0.027 |
| Total income (loss) from operations | $ 0.078 | $(0.138) | $(0.439) | $ (0.086) | $ 0.218 | $ 0.117 |
| Less Distributions | | | | | | |
| From net investment income | $ (0.128) | $ (0.236) | $ (0.077) | $ (0.064) | $ (0.108) | $ (0.147) |
| Tax return of capital | — | (0.016) | (0.004) | — | — | — |
| Total distributions | $(0.128) | $(0.252) | $(0.081) | $ (0.064) | $ (0.108) | $ (0.147) |
| Net asset value — End of period | $ 5.060 | $ 5.110 | $ 5.500 | $ 6.020 | $ 6.170 | $ 6.060 |
| Total Return(3) | 1.45% (4)(5) | (2.64)% (5) | (7.34)% (5) | (1.41)% (5) | 3.63% (5) | 1.95% |
| Ratios/Supplemental Data | | | | | | |
| Net assets, end of period (000’s omitted) | $ 5,784 | $ 5,942 | $ 6,980 | $11,756 | $24,969 | $29,940 |
| Ratios (as a percentage of average daily net assets): | | | | | | |
| Expenses | 3.41% (5)(6)(7)(8) | 2.14% (5)(7)(8) | 1.80% (5)(7) | 1.80% (5) | 1.86% (5)(8) | 1.99% (8) |
| Net investment income | 3.63% (6) | 3.43% | 1.25% | 1.17% | 0.49% | 1.47% |
| Portfolio Turnover | 329% (4)(9) | 604% (9) | 796% (9) | 335% (9) | 180% (9) | 90% |
| (1) | Computed using average shares outstanding. |
| (2) | The per share amount is not in accord with the net realized and unrealized gain (loss) for the period because of the timing of Fund share transactions and the amount of the per share realized and unrealized gains and losses at such time. |
| (3) | Returns are historical and are calculated by determining the percentage change in net asset value with all distributions reinvested and do not reflect the effect of sales charges. |
| (4) | Not annualized. |
| (5) | The investment adviser reimbursed certain operating expenses (equal to 0.07%, 0.05%, 0.05%, 0.02% and 0.03% of average daily net assets for the six months ended April 30, 2024 and the years ended October 31, 2023, 2022, 2021 and 2020, respectively). Absent this reimbursement, total return would be lower. |
| (6) | Annualized. |
| (7) | Includes a reduction by the investment adviser of a portion of its adviser fee due to the Fund’s investment in the Liquidity Fund (equal to less than 0.005%, less than 0.01% and less than 0.005% of average daily net assets for the six months ended April 30, 2024 and the years ended October 31, 2023 and 2022, respectively). |
| (8) | Includes interest expense, including on reverse repurchase agreements, of 1.62%, 0.33%, 0.03% and 0.07% of average daily net assets for the six months ended April 30, 2024 and the years ended October 31, 2023, 2020 and 2019, respectively. |
| (9) | Includes the effect of To Be Announced (TBA) transactions. |
18
See Notes to Financial Statements.
Eaton Vance
Government Opportunities Fund
April 30, 2024
Financial Highlights — continued
| | Class I |
| | Six Months Ended
April 30, 2024
(Unaudited) | Year Ended October 31, |
| | 2023 | 2022 | 2021 | 2020 | 2019 |
| Net asset value — Beginning of period | $ 5.120 | $ 5.510 | $ 6.030 | $ 6.170 | $ 6.060 | $ 6.100 |
| Income (Loss) From Operations | | | | | | |
| Net investment income(1) | $ 0.122 | $ 0.240 | $ 0.133 | $ 0.133 | $ 0.085 | $ 0.149 |
| Net realized and unrealized gain (loss) | (0.026) (2) | (0.323) | (0.514) | (0.148) | 0.194 | 0.019 |
| Total income (loss) from operations | $ 0.096 | $ (0.083) | $ (0.381) | $ (0.015) | $ 0.279 | $ 0.168 |
| Less Distributions | | | | | | |
| From net investment income | $ (0.156) | $ (0.288) | $ (0.132) | $ (0.125) | $ (0.169) | $ (0.208) |
| Tax return of capital | — | (0.019) | (0.007) | — | — | — |
| Total distributions | $ (0.156) | $ (0.307) | $ (0.139) | $ (0.125) | $ (0.169) | $ (0.208) |
| Net asset value — End of period | $ 5.060 | $ 5.120 | $ 5.510 | $ 6.030 | $ 6.170 | $ 6.060 |
| Total Return(3) | 1.77% (4)(5) | (1.63)% (5) | (6.40)% (5) | (0.25)% (5) | 4.66% (5) | 2.80% |
| Ratios/Supplemental Data | | | | | | |
| Net assets, end of period (000’s omitted) | $218,365 | $263,008 | $231,855 | $222,307 | $213,869 | $118,479 |
| Ratios (as a percentage of average daily net assets): | | | | | | |
| Expenses | 2.37% (5)(6)(7)(8) | 1.15% (5)(7)(8) | 0.80% (5)(7) | 0.80% (5) | 0.85% (5)(8) | 1.01% (8) |
| Net investment income | 4.63% (6) | 4.45% | 2.28% | 2.17% | 1.39% | 2.44% |
| Portfolio Turnover | 329% (4)(9) | 604% (9) | 796% (9) | 335% (9) | 180% (9) | 90% |
| (1) | Computed using average shares outstanding. |
| (2) | The per share amount is not in accord with the net realized and unrealized gain (loss) for the period because of the timing of Fund share transactions and the amount of the per share realized and unrealized gains and losses at such time. |
| (3) | Returns are historical and are calculated by determining the percentage change in net asset value with all distributions reinvested. |
| (4) | Not annualized. |
| (5) | The investment adviser reimbursed certain operating expenses (equal to 0.07%, 0.05%, 0.05%, 0.02% and 0.03% of average daily net assets for the six months ended April 30, 2024 and the years ended October 31, 2023, 2022, 2021 and 2020, respectively). Absent this reimbursement, total return would be lower. |
| (6) | Annualized. |
| (7) | Includes a reduction by the investment adviser of a portion of its adviser fee due to the Fund’s investment in the Liquidity Fund (equal to less than 0.005%, less than 0.01% and less than 0.005% of average daily net assets for the six months ended April 30, 2024 and the years ended October 31, 2023 and 2022, respectively). |
| (8) | Includes interest expense, including on reverse repurchase agreements, of 1.57%, 0.33%, 0.03% and 0.07% of average daily net assets for the six months ended April 30, 2024 and the years ended October 31, 2023, 2020 and 2019, respectively. |
| (9) | Includes the effect of To Be Announced (TBA) transactions. |
19
See Notes to Financial Statements.
Eaton Vance
Government Opportunities Fund
April 30, 2024
Financial Highlights — continued
| | Class R |
| | Six Months Ended
April 30, 2024
(Unaudited) | Year Ended October 31, |
| | 2023 | 2022 | 2021 | 2020 | 2019 |
| Net asset value — Beginning of period | $ 5.100 | $ 5.490 | $ 6.010 | $ 6.150 | $ 6.040 | $ 6.080 |
| Income (Loss) From Operations | | | | | | |
| Net investment income(1) | $ 0.108 | $ 0.211 | $ 0.107 | $ 0.102 | $ 0.052 | $ 0.118 |
| Net realized and unrealized gain (loss) | (0.017) (2) | (0.323) | (0.517) | (0.148) | 0.196 | 0.019 |
| Total income (loss) from operations | $ 0.091 | $ (0.112) | $ (0.410) | $ (0.046) | $ 0.248 | $ 0.137 |
| Less Distributions | | | | | | |
| From net investment income | $ (0.141) | $ (0.261) | $ (0.105) | $ (0.094) | $ (0.138) | $ (0.177) |
| Tax return of capital | — | (0.017) | (0.005) | — | — | — |
| Total distributions | $ (0.141) | $ (0.278) | $ (0.110) | $ (0.094) | $ (0.138) | $ (0.177) |
| Net asset value — End of period | $ 5.050 | $ 5.100 | $ 5.490 | $ 6.010 | $ 6.150 | $ 6.040 |
| Total Return(3) | 1.70% (4)(5) | (2.17)% (5) | (6.90)% (5) | (0.75)% (5) | 4.15% (5) | 2.46% |
| Ratios/Supplemental Data | | | | | | |
| Net assets, end of period (000’s omitted) | $30,369 | $32,485 | $46,245 | $52,503 | $55,623 | $28,673 |
| Ratios (as a percentage of average daily net assets): | | | | | | |
| Expenses | 2.90% (5)(6)(7)(8) | 1.63% (5)(7)(8) | 1.30% (5)(7) | 1.30% (5) | 1.34% (5)(8) | 1.51% (8) |
| Net investment income | 4.12% (6) | 3.91% | 1.83% | 1.66% | 0.85% | 1.95% |
| Portfolio Turnover | 329% (4)(9) | 604% (9) | 796% (9) | 335% (9) | 180% (9) | 90% |
| (1) | Computed using average shares outstanding. |
| (2) | The per share amount is not in accord with the net realized and unrealized gain (loss) for the period because of the timing of Fund share transactions and the amount of the per share realized and unrealized gains and losses at such time. |
| (3) | Returns are historical and are calculated by determining the percentage change in net asset value with all distributions reinvested. |
| (4) | Not annualized. |
| (5) | The investment adviser reimbursed certain operating expenses (equal to 0.07%, 0.05%, 0.05%, 0.02% and 0.03% of average daily net assets for the six months ended April 30, 2024 and the years ended October 31, 2023, 2022, 2021 and 2020, respectively). Absent this reimbursement, total return would be lower. |
| (6) | Annualized. |
| (7) | Includes a reduction by the investment adviser of a portion of its adviser fee due to the Fund’s investment in the Liquidity Fund (equal to less than 0.005%, less than 0.01% and less than 0.005% of average daily net assets for the six months ended April 30, 2024 and the years ended October 31, 2023 and 2022, respectively). |
| (8) | Includes interest expense, including on reverse repurchase agreements, of 1.60%, 0.33%, 0.03% and 0.07% of average daily net assets for the six months ended April 30, 2024 and the years ended October 31, 2023, 2020 and 2019, respectively. |
| (9) | Includes the effect of To Be Announced (TBA) transactions. |
20
See Notes to Financial Statements.
Eaton Vance
Government Opportunities Fund
April 30, 2024
Notes to Financial Statements (Unaudited)
1 Significant Accounting Policies
Eaton Vance Government Opportunities Fund (the Fund) is a diversified series of Eaton Vance Mutual Funds Trust (the Trust). The Trust is a Massachusetts business trust registered under the Investment Company Act of 1940, as amended (the 1940 Act), as an open-end management investment company. The Fund’s investment objective is to provide a high current return. The Fund offers four classes of shares. Class A shares are generally sold subject to a sales charge imposed at time of purchase. Class C shares are sold at net asset value and are generally subject to a contingent deferred sales charge (see Note 5). Effective November 5, 2020, Class C shares automatically convert to Class A shares eight years after their purchase as described in the Fund’s prospectus. Class I and Class R shares are sold at net asset value and are not subject to a sales charge. Each class represents a pro rata interest in the Fund, but votes separately on class-specific matters and (as noted below) is subject to different expenses. Realized and unrealized gains and losses are allocated daily to each class of shares based on the relative net assets of each class to the total net assets of the Fund. Net investment income, other than class-specific expenses, is allocated daily to each class of shares based upon the ratio of the value of each class’s paid shares to the total value of all paid shares. Each class of shares differs in its distribution plan and certain other class-specific expenses.
The following is a summary of significant accounting policies of the Fund. The policies are in conformity with accounting principles generally accepted in the United States of America (U.S. GAAP). The Fund is an investment company and follows accounting and reporting guidance in the Financial Accounting Standards Board (FASB) Accounting Standards Codification Topic 946.
A Investment Valuation—The following methodologies are used to determine the market value or fair value of investments.
Debt Obligations. Debt obligations are generally valued on the basis of valuations provided by third party pricing services, as derived from such services’ pricing models. Inputs to the models may include, but are not limited to, reported trades, executable bid and ask prices, broker/dealer quotations, prices or yields of securities with similar characteristics, interest rates, anticipated prepayments, benchmark curves or information pertaining to the issuer, as well as industry and economic events. The pricing services may use a matrix approach, which considers information regarding securities with similar characteristics to determine the valuation for a security. Short-term debt obligations purchased with a remaining maturity of sixty days or less for which a valuation from a third party pricing service is not readily available may be valued at amortized cost, which approximates fair value.
Derivatives. Futures contracts are valued at the closing settlement price established by the board of trade or exchange on which they are traded. Swaps are normally valued using valuations provided by a third party pricing service. Such pricing service valuations are based on the present value of fixed and projected floating rate cash flows over the term of the swap contract. Future cash flows on swaps are discounted to their present value using swap rates provided by electronic data services or by broker/dealers.
Other. Investments in management investment companies (including money market funds) that do not trade on an exchange are valued at the net asset value as of the close of each business day.
Fair Valuation. In connection with Rule 2a-5 of the 1940 Act, the Trustees have designated the Fund’s investment adviser as its valuation designee. Investments for which valuations or market quotations are not readily available or are deemed unreliable are valued by the investment adviser, as valuation designee, at fair value using methods that most fairly reflect the security’s “fair value”, which is the amount that the Fund might reasonably expect to receive for the security upon its current sale in the ordinary course. Each such determination is based on a consideration of relevant factors, which are likely to vary from one pricing context to another. These factors may include, but are not limited to, the type of security, the existence of any contractual restrictions on the security’s disposition, the price and extent of public trading in similar securities of the issuer or of comparable companies or entities, quotations or relevant information obtained from broker/dealers or other market participants, information obtained from the issuer, analysts, and/or the appropriate stock exchange (for exchange-traded securities), an analysis of the company’s or entity’s financial statements, and an evaluation of the forces that influence the issuer and the market(s) in which the security is purchased and sold.
B Investment Transactions—Investment transactions for financial statement purposes are accounted for on a trade date basis. Realized gains and losses on investments sold are determined on the basis of identified cost.
C Income—Interest income is recorded on the basis of interest accrued, adjusted for amortization of premium or accretion of discount. Dividend income is recorded on the ex-dividend date for dividends received in cash and/or securities.
D Federal Taxes—The Fund's policy is to comply with the provisions of the Internal Revenue Code applicable to regulated investment companies and to distribute to shareholders each year substantially all of its net investment income, and all or substantially all of its net realized capital gains. Accordingly, no provision for federal income or excise tax is necessary.
As of April 30, 2024, the Fund had no uncertain tax positions that would require financial statement recognition, de-recognition, or disclosure. The Fund files a U.S. federal income tax return annually after its fiscal year-end, which is subject to examination by the Internal Revenue Service for a period of three years from the date of filing.
E Expenses—The majority of expenses of the Trust are directly identifiable to an individual fund. Expenses which are not readily identifiable to a specific fund are allocated taking into consideration, among other things, the nature and type of expense and the relative size of the funds.
Eaton Vance
Government Opportunities Fund
April 30, 2024
Notes to Financial Statements (Unaudited) — continued
F Use of Estimates—The preparation of the financial statements in conformity with U.S. GAAP requires management to make estimates and assumptions that affect the reported amounts of assets and liabilities at the date of the financial statements and the reported amounts of income and expense during the reporting period. Actual results could differ from those estimates.
G Indemnifications—Under the Trust’s organizational documents, its officers and Trustees may be indemnified against certain liabilities and expenses arising out of the performance of their duties to the Fund. Under Massachusetts law, if certain conditions prevail, shareholders of a Massachusetts business trust (such as the Trust) could be deemed to have personal liability for the obligations of the Trust. However, the Trust’s Declaration of Trust contains an express disclaimer of liability on the part of Fund shareholders and the By-laws provide that the Trust shall assume, upon request by the shareholder, the defense on behalf of any Fund shareholders. Moreover, the By-laws also provide for indemnification out of Fund property of any shareholder held personally liable solely by reason of being or having been a shareholder for all loss or expense arising from such liability. Additionally, in the normal course of business, the Fund enters into agreements with service providers that may contain indemnification clauses. The Fund’s maximum exposure under these arrangements is unknown as this would involve future claims that may be made against the Fund that have not yet occurred.
H Futures Contracts—Upon entering into a futures contract, the Fund is required to deposit with the broker, either in cash or securities, an amount equal to a certain percentage of the contract amount (initial margin). Subsequent payments, known as variation margin, are made or received by the Fund each business day, depending on the daily fluctuations in the value of the underlying security, and are recorded as unrealized gains or losses by the Fund. Gains (losses) are realized upon the expiration or closing of the futures contracts. Should market conditions change unexpectedly, the Fund may not achieve the anticipated benefits of the futures contracts and may realize a loss. Futures contracts have minimal counterparty risk as they are exchange traded and the clearinghouse for the exchange is substituted as the counterparty, guaranteeing counterparty performance.
I Interest Rate Swaps—Swap contracts are privately negotiated agreements between the Fund and a counterparty. Certain swap contracts may be centrally cleared (“centrally cleared swaps”), whereby all payments made or received by the Fund pursuant to the contract are with a central clearing party (CCP) rather than the original counterparty. The CCP guarantees the performance of the original parties to the contract. Upon entering into centrally cleared swaps, the Fund is required to deposit with the CCP, either in cash or securities, an amount of initial margin determined by the CCP, which is subject to adjustment. Pursuant to interest rate swap agreements, the Fund either makes floating-rate payments to the counterparty (or CCP in the case of centrally cleared swaps) based on a benchmark interest rate in exchange for fixed-rate payments or the Fund makes fixed-rate payments to the counterparty
(or CCP in the case of a centrally cleared swap) in exchange for payments on a floating benchmark interest rate. Payments received or made, including amortization of upfront payments/receipts, if any (which are amortized over the life of the swap contract), are recorded as realized gains or losses. During the term of the outstanding swap agreement, changes in the underlying value of the swap are recorded as unrealized gains or losses. For centrally cleared swaps, the daily change in valuation is recorded as a receivable or payable for variation margin and settled in cash with the CCP daily. The value of the swap is determined by changes in the relationship between two rates of interest. The Fund is exposed to credit loss in the event of non-performance by the swap counterparty. In the case of centrally cleared swaps, counterparty risk is minimal due to protections provided by the CCP. Risk may also arise from movements in interest rates.
J Swaptions—A purchased swaption contract grants the Fund, in return for payment of the purchase price, the right, but not the obligation, to enter into a new swap agreement or to shorten, extend, cancel or otherwise modify an existing swap agreement, at some designated future time on specified terms. When the Fund purchases a swaption, the premium paid to the writer is recorded as an investment and subsequently marked-to-market to reflect the current value of the swaption. A written swaption gives the Fund the obligation, if exercised by the purchaser, to enter into a swap contract according to the terms of the underlying agreement. When the Fund writes a swaption, the premium received by the Fund is recorded as a liability and subsequently marked-to-market to reflect the current value of the swaption. When a swaption is exercised, the cost of the swap is adjusted by the amount of the premium paid or received. When a swaption expires or an unexercised swaption is closed, a gain or loss is recognized in the amount of the premium paid or received, plus the cost to close. The Fund’s risk for purchased swaptions is limited to the premium paid. The writer of a swaption bears the risk of unfavorable changes in the preset terms of the underlying swap contract. Purchased swaptions traded over-the-counter involve risk that the issuer or counterparty will fail to perform its contractual obligations.
K When-Issued Securities and Delayed Delivery Transactions—The Fund may purchase securities on a delayed delivery, when-issued or forward commitment basis, including TBA (To Be Announced) securities. Payment and delivery may take place after the customary settlement period for that security. At the time the transaction is negotiated, the price of the security that will be delivered is fixed. Securities purchased on a delayed delivery, when-issued or forward commitment basis are marked-to-market daily and begin earning interest on settlement date. Such security purchases are subject to the risk that when delivered they will be worth less than the agreed upon payment price. Losses may also arise if the counterparty does not perform under the contract. A forward purchase commitment may also be closed by entering into an offsetting commitment. If an offsetting commitment is entered into, the Fund will realize a gain or loss on investments based on the price established when the Fund entered into the commitment.
L Forward Sale Commitments—The Fund may enter into forward sale commitments to sell generic U.S. government agency mortgage-backed securities to hedge its portfolio positions and/or to enhance return. The proceeds to be received from the forward sale commitment are recorded as an asset and a corresponding liability, which is subsequently valued at approximately the current market value of the underlying security in accordance with the Fund's policies on investment valuations discussed above. The Fund records an unrealized gain or loss on investments to the extent of the difference between the proceeds to be received and the value of the open forward sale commitment on the day of determination. If the forward sale commitment is closed through the acquisition of an offsetting purchase commitment or the delivery of securities, the Fund realizes a gain or loss on investments based on the price
Eaton Vance
Government Opportunities Fund
April 30, 2024
Notes to Financial Statements (Unaudited) — continued
established when the Fund entered into the commitment. If the Fund enters into a forward sale commitment for the delivery of a security that it does not own or has the right to obtain, it is subject to the risk of loss if the purchase price to settle the commitment is higher than the price at which it was sold.
M Reverse Repurchase Agreements—Under a reverse repurchase agreement, the Fund temporarily transfers possession of a portfolio security to another party, such as a bank or broker/dealer, in return for cash. At the same time, the Fund agrees to repurchase the security at an agreed upon time and price, which reflects an interest payment. In periods of increased demand for a security, the Fund may receive a payment from the counterparty for the use of the security, which is recorded as interest income. Because the Fund retains effective control over the transferred security, the transaction is accounted for as a secured borrowing. The Fund may enter into such agreements when it believes it is able to invest the cash acquired at a rate higher than the cost of the agreement, which would increase earned income. When the Fund enters into a reverse repurchase agreement, any fluctuations in the market value of either the securities transferred to another party or the securities in which the proceeds may be invested would affect the market value of the Fund’s assets. Because reverse repurchase agreements may be considered to be the practical equivalent of borrowing funds (and the counterparty making a loan), they constitute a form of leverage. The Fund segregates cash or liquid assets equal to its obligation to repurchase the security. During the term of the agreement, the Fund may also be obligated to pledge additional cash and/or securities in the event of a decline in the fair value of the transferred security. In the event the counterparty to a reverse repurchase agreement becomes insolvent, recovery of the security transferred by the Fund may be delayed or the Fund may incur a loss equal to the amount by which the value of the security transferred by the Fund exceeds the repurchase price payable by the Fund.
N Stripped Mortgage-Backed Securities—The Fund may invest in Interest Only (IO) and Principal Only (PO) securities, a form of stripped mortgage-
backed securities, whereby the IO security receives all the interest and the PO security receives all the principal on a pool of mortgage assets. The yield to maturity on an IO security is extremely sensitive to the rate of principal payments (including prepayments) on the related underlying mortgage assets, and a rapid rate of principal payments may have a material adverse effect on the yield to maturity from these securities. If the underlying mortgages experience greater than anticipated prepayments of principal, the Fund may fail to recoup its initial investment in an IO security. The market value of IO and PO securities can be unusually volatile due to changes in interest rates.
O Interim Financial Statements—The interim financial statements relating to April 30, 2024 and for the six months then ended have not been audited by an independent registered public accounting firm, but in the opinion of the Fund’s management, reflect all adjustments, consisting only of normal recurring adjustments, necessary for the fair presentation of the financial statements.
2 Distributions to Shareholders and Income Tax Information
The Fund declares dividends daily to shareholders of record at the time of declaration. Distributions are generally paid monthly. Distributions of realized capital gains are made at least annually. Distributions are declared separately for each class of shares. Shareholders may reinvest income and capital gain distributions in additional shares of the same class of the Fund at the net asset value as of the reinvestment date or, at the election of the shareholder, receive distributions in cash. Distributions to shareholders are determined in accordance with income tax regulations, which may differ from U.S. GAAP. As required by U.S. GAAP, only distributions in excess of tax basis earnings and profits are reported in the financial statements as a return of capital. Permanent differences between book and tax accounting relating to distributions are reclassified to paid-in capital. For tax purposes, distributions from short-term capital gains are considered to be from ordinary income. For the six months ended April 30, 2024, management estimates that a portion of distributions for the period will be a tax return of capital. The final determination of tax characteristics of the Fund’s distributions will occur at the end of the year and will be reported to the shareholders.
At October 31, 2023, the Fund, for federal income tax purposes, had deferred capital losses of $93,280,751 which would reduce its taxable income arising from future net realized gains on investment transactions, if any, to the extent permitted by the Internal Revenue Code, and thus would reduce the amount of distributions to shareholders, which would otherwise be necessary to relieve the Fund of any liability for federal income or excise tax. The deferred capital losses are treated as arising on the first day of the Fund’s next taxable year and retain the same short-term or long-term character as when originally deferred. Of the deferred capital losses at October 31, 2023, $26,576,054 are short-term and $66,704,697 are long-term.
The cost and unrealized appreciation (depreciation) of investments, including open derivative contracts and TBA sale commitments, of the Fund at April 30, 2024, as determined on a federal income tax basis, were as follows:
| Aggregate cost | $ 383,800,063 |
| Gross unrealized appreciation | $ 22,568,817 |
| Gross unrealized depreciation | (61,665,008) |
| Net unrealized depreciation | $ (39,096,191) |
Eaton Vance
Government Opportunities Fund
April 30, 2024
Notes to Financial Statements (Unaudited) — continued
3 Investment Adviser Fee and Other Transactions with Affiliates
The investment adviser fee is earned by Boston Management and Research (BMR), an indirect, wholly-owned subsidiary of Morgan Stanley, as compensation for investment advisory services rendered to the Fund. The investment adviser fee is computed at an annual rate as a percentage of the Fund’s average daily net assets as follows and is payable monthly:
| Average Daily Net Assets | Annual Fee Rate |
| Up to $500 million | 0.6500% |
| $500 million but less than $1 billion | 0.6250% |
| $1 billion but less than $1.5 billion | 0.6000% |
| $1.5 billion but less than $2 billion | 0.5625% |
| $2 billion but less than $2.5 billion | 0.5000% |
| $2.5 billion and over | 0.4375% |
For the six months ended April 30, 2024, the Fund’s investment adviser fee amounted to $1,286,282 or 0.65% (annualized) of the Fund’s average daily net assets. The Fund may invest in a money market fund, the Institutional Class of the Morgan Stanley Institutional Liquidity Funds - Government Portfolio (the “Liquidity Fund”), an open-end management investment company managed by Morgan Stanley Investment Management Inc., a wholly-owned subsidiary of Morgan Stanley. The investment adviser fee paid by the Fund is reduced by an amount equal to its pro rata share of the advisory and administration fees paid by the Fund due to its investment in the Liquidity Fund. For the six months ended April 30, 2024, the investment adviser fee paid was reduced by $3,048 relating to the Fund’s investment in the Liquidity Fund.
Eaton Vance Management (EVM) has agreed to reimburse the Fund’s expenses to the extent that total annual operating expenses (relating to ordinary operating expenses only and excluding such expenses as brokerage commissions, acquired fund fees and expenses of unaffiliated funds, borrowing costs, taxes or litigation expenses) exceed 1.05%, 1.80%, 0.80% and 1.30% of the Fund’s average daily net assets for Class A, Class C, Class I and Class R, respectively. This agreement may be changed or terminated after March 1, 2025. Pursuant to this agreement, EVM was allocated $141,695 of the Fund’s operating expenses for the six months ended April 30, 2024.
EVM, an affiliate of BMR, serves as administrator of the Fund, but receives no compensation. EVM provides sub-transfer agency and related services to the Fund pursuant to a Sub-Transfer Agency Support Services Agreement. For the six months ended April 30, 2024, EVM earned $18,740 from the Fund pursuant to such agreement, which is included in transfer and dividend disbursing agent fees on the Statement of Operations. The Fund was informed that Eaton Vance Distributors, Inc. (EVD), an affiliate of EVM and the Fund’s principal underwriter, received $1,593 as its portion of the sales charge on sales of Class A shares for the six months ended April 30, 2024. EVD also received distribution and service fees from Class A and Class C shares (see Note 4) and contingent deferred sales charges (see Note 5).
Trustees and officers of the Fund who are members of EVM’s or BMR's organizations receive remuneration for their services to the Fund out of the investment adviser fee. Trustees of the Fund who are not affiliated with the investment adviser may elect to defer receipt of all or a percentage of their annual fees in accordance with the terms of the Trustees Deferred Compensation Plan. Certain officers and Trustees of the Fund are officers of the above organizations.
4 Distribution Plans
The Fund has in effect a distribution plan for Class A shares (Class A Plan) pursuant to Rule 12b-1 under the 1940 Act. Pursuant to the Class A Plan, the Fund pays EVD a distribution and service fee of 0.25% per annum of its average daily net assets attributable to Class A shares for distribution services and facilities provided to the Fund by EVD, as well as for personal services and/or the maintenance of shareholder accounts. Distribution and service fees paid or accrued to EVD for the six months ended April 30, 2024 amounted to $135,570 for Class A shares.
The Fund also has in effect distribution plans for Class C shares (Class C Plan) and Class R shares (Class R Plan) pursuant to Rule 12b-1 under the 1940 Act. Pursuant to the Class C Plan, the Fund pays EVD amounts equal to 0.75% per annum of its average daily net assets attributable to Class C shares for providing ongoing distribution services and facilities to the Fund. For the six months ended April 30, 2024, the Fund paid or accrued to EVD $22,526 for Class C shares. The Class R Plan requires the Fund to pay EVD an amount up to 0.50% per annum of its average daily net assets attributable to Class R shares for providing ongoing distribution services and facilities to the Fund. The Trustees of the Trust have currently limited Class R distribution payments to 0.25% per annum of the average daily net assets attributable to Class R shares. For the six months ended April 30, 2024, the Fund paid or accrued to EVD $41,166 for Class R shares.
Pursuant to the Class C and Class R Plans, the Fund also makes payments of service fees to EVD, financial intermediaries and other persons in amounts equal to 0.25% per annum of its average daily net assets attributable to that class. Service fees paid or accrued are for personal services and/or the maintenance of shareholder accounts. They are separate and distinct from the sales commissions and distribution fees payable to EVD. Service fees paid or accrued for the six months ended April 30, 2024 amounted to $7,509 and $41,166 for Class C and Class R shares, respectively.
Eaton Vance
Government Opportunities Fund
April 30, 2024
Notes to Financial Statements (Unaudited) — continued
Distribution and service fees are subject to the limitations contained in the Financial Industry Regulatory Authority Rule 2341(d).
5 Contingent Deferred Sales Charges
A contingent deferred sales charge (CDSC) of 1% generally is imposed on redemptions of Class C shares made within 12 months of purchase. Class A shares may be subject to a 0.75% CDSC if redeemed within 12 months of purchase (depending on the circumstances of purchase). Generally, the CDSC is based upon the lower of the net asset value at date of redemption or date of purchase. No charge is levied on shares acquired by reinvestment of dividends or capital gain distributions. For the six months ended April 30, 2024, the Fund was informed that EVD received $835 of CDSCs paid by Class C shareholders and no CDSCs paid by Class A shareholders.
6 Purchases and Sales of Investments
Purchases and sales of investments, other than short-term obligations, and including maturities, paydowns and TBA transactions, for the six months ended April 30, 2024 were as follows:
| | Purchases | Sales |
| Investments (non-U.S. Government) | $ 21,058,476 | $ 30,554,390 |
| U.S. Government and Agency Securities | 1,608,976,348 | 1,599,584,218 |
| | $1,630,034,824 | $1,630,138,608 |
7 Shares of Beneficial Interest
The Fund’s Declaration of Trust permits the Trustees to issue an unlimited number of full and fractional shares of beneficial interest (without par value). Such shares may be issued in a number of different series (such as the Fund) and classes. Transactions in Fund shares, including direct exchanges pursuant to share class conversions, were as follows:
| | Six Months Ended
April 30, 2024
(Unaudited) | | Year Ended
October 31, 2023 |
| | Shares | Amount | | Shares | Amount |
| Class A | | | | | |
| Sales | 1,007,914 | $ 5,325,671 | | 2,707,482 | $ 14,657,019 |
| Issued to shareholders electing to receive payments of distributions in Fund shares | 532,482 | 2,817,099 | | 1,176,684 | 6,325,743 |
| Redemptions | (2,344,987) | (12,319,080) | | (7,595,272) | (40,556,619) |
| Net decrease | (804,591) | $ (4,176,310) | | (3,711,106) | $ (19,573,857) |
| Class C | | | | | |
| Sales | 259,448 | $ 1,364,360 | | 469,207 | $ 2,541,072 |
| Issued to shareholders electing to receive payments of distributions in Fund shares | 27,494 | 145,074 | | 55,781 | 299,324 |
| Redemptions | (306,580) | (1,598,380) | | (630,489) | (3,411,356) |
| Net decrease | (19,638) | $ (88,946) | | (105,501) | $ (570,960) |
Eaton Vance
Government Opportunities Fund
April 30, 2024
Notes to Financial Statements (Unaudited) — continued
| | Six Months Ended
April 30, 2024
(Unaudited) | | Year Ended
October 31, 2023 |
| | Shares | Amount | | Shares | Amount |
| Class I | | | | | |
| Sales | 8,491,160 | $ 44,900,369 | | 23,828,866 | $ 129,362,534 |
| Issued to shareholders electing to receive payments of distributions in Fund shares | 1,341,074 | 7,100,872 | | 2,555,562 | 13,701,978 |
| Redemptions | (18,126,156) | (96,617,755) | | (17,043,620) | (92,175,654) |
| Net increase (decrease) | (8,293,922) | $(44,616,514) | | 9,340,808 | $ 50,888,858 |
| Class R | | | | | |
| Sales | 555,117 | $ 2,932,853 | | 1,495,399 | $ 8,011,009 |
| Issued to shareholders electing to receive payments of distributions in Fund shares | 168,125 | 886,575 | | 382,788 | 2,052,268 |
| Redemptions | (1,078,865) | (5,689,353) | | (3,928,294) | (21,099,020) |
| Net decrease | (355,623) | $ (1,869,925) | | (2,050,107) | $ (11,035,743) |
8 Financial Instruments
The Fund may trade in financial instruments with off-balance sheet risk in the normal course of its investing activities. These financial instruments may include futures contracts, written swaptions and swap contracts and may involve, to a varying degree, elements of risk in excess of the amounts recognized for financial statement purposes. The notional or contractual amounts of these instruments represent the investment the Fund has in particular classes of financial instruments and do not necessarily represent the amounts potentially subject to risk. The measurement of the risks associated with these instruments is meaningful only when all related and offsetting transactions are considered. A summary of obligations under these financial instruments at April 30, 2024 is included in the Portfolio of Investments. At April 30, 2024, the Fund had sufficient cash and/or securities to cover commitments under these contracts.
The Fund is subject to interest rate risk in the normal course of pursuing its investment objective. Because the Fund holds fixed-rate bonds, the value of these bonds may decrease if interest rates rise. The Fund utilizes futures contracts and interest rate swaps and swaptions to enhance total return, to change the overall duration of the Fund and/or to hedge against fluctuations in securities prices due to changes in interest rates.
The fair value of open derivative instruments (not considered to be hedging instruments for accounting disclosure purposes) and whose primary underlying risk exposure is interest rate risk at April 30, 2024 was as follows:
| | Fair Value |
| Derivative | Asset Derivative(1) | Liability Derivative(1) |
| Futures contracts | $ 2,957,964 | $ (7,715,962) |
| Swap contracts (centrally cleared) | 14,056,290 | — |
| Total | $17,014,254 | $(7,715,962) |
| (1) | Only the current day’s variation margin on open futures contracts and centrally cleared swap contracts is reported within the Statement of Assets and Liabilities as Receivable or Payable for variation margin on open futures contracts and centrally cleared swap contracts, as applicable. |
Eaton Vance
Government Opportunities Fund
April 30, 2024
Notes to Financial Statements (Unaudited) — continued
The effect of derivative instruments (not considered to be hedging instruments for accounting disclosure purposes) on the Statement of Operations and whose primary underlying risk exposure is interest rate risk for the six months ended April 30, 2024 was as follows:
| Derivative | Realized Gain (Loss)
on Derivatives Recognized
in Income | Change in Unrealized
Appreciation (Depreciation) on
Derivatives Recognized in Income |
| Purchased swaptions | $ 108,924(1) | $ (1,085,221)(2) |
| Written swaptions | 361,169 (3) | (340,677) (4) |
| Futures contracts | (2,811,958) (5) | (4,074,766) (6) |
| Swap contracts | 4,321,783 (7) | (6,563,293) (8) |
| Total | $ 1,979,918 | $(12,063,957) |
| (1) | Statement of Operations location: Net realized gain (loss): Investment transactions. |
| (2) | Statement of Operations location: Change in unrealized appreciation (depreciation): Investments. |
| (3) | Statement of Operations location: Net realized gain (loss): Written swaptions. |
| (4) | Statement of Operations location: Change in unrealized appreciation (depreciation): Written swaptions. |
| (5) | Statement of Operations location: Net realized gain (loss): Futures contracts. |
| (6) | Statement of Operations location: Change in unrealized appreciation (depreciation): Futures contracts. |
| (7) | Statement of Operations location: Net realized gain (loss): Swap contracts. |
| (8) | Statement of Operations location: Change in unrealized appreciation (depreciation): Swap contracts. |
The average notional cost of futures contracts and average notional amounts of other derivative contracts outstanding during the six months ended April 30, 2024, which are indicative of the volume of these derivative types, were approximately as follows:
Futures
Contracts — Long | Futures
Contracts — Short | Purchased
Swaptions | Written
Swaptions | Swap
Contracts |
| $440,399,000 | $69,225,000 | $27,719,000 | $41,579,000 | $83,000,000 |
9 Line of Credit
The Fund participates with other portfolios and funds managed by BMR and its affiliates in a $650 million unsecured revolving line of credit agreement with a group of banks, which is in effect through October 22, 2024. Borrowings are made by the Fund solely for temporary purposes related to redemptions and other short-term cash needs. Interest is charged to the Fund based on its borrowings at an amount above either the Secured Overnight Financing Rate (SOFR) or Federal Funds rate. In addition, a fee computed at an annual rate of 0.15% on the daily unused portion of the line of credit is allocated among the participating portfolios and funds at the end of each quarter. In connection with the renewal of the agreement in October 2023, an arrangement fee of $150,000 was incurred that was allocated to the participating portfolios and funds. Because the line of credit is not available exclusively to the Fund, it may be unable to borrow some or all of its requested amounts at any particular time. The Fund did not have any significant borrowings or allocated fees during the six months ended April 30, 2024.
Eaton Vance
Government Opportunities Fund
April 30, 2024
Notes to Financial Statements (Unaudited) — continued
10 Reverse Repurchase Agreements
Reverse repurchase agreements outstanding as of April 30, 2024 were as follows:
| Counterparty | Trade
Date | Maturity
Date | Interest
Rate Paid
(Received) | Principal
Amount | Value
Including
Accrued
Interest |
| BMO Capital Markets Corp. | 1/3/24 | On Demand(1) | 5.48% | $ 1,694,946 | $ 1,705,524 |
| BMO Capital Markets Corp. | 3/20/24 | On Demand(1) | 5.48 | 8,704,304 | 8,758,629 |
| BMO Capital Markets Corp. | 3/20/24 | On Demand(1) | 5.53 | 6,700,157 | 6,742,355 |
| MUFG Securities Americas, Inc. | 1/22/24 | On Demand(1) | 5.55 | 9,647,250 | 9,795,978 |
| MUFG Securities Americas, Inc. | 1/22/24 | On Demand(1) | 5.55 | 4,851,175 | 4,925,964 |
| MUFG Securities Americas, Inc. | 2/2/24 | On Demand(1) | 5.55 | 4,930,500 | 4,998,151 |
| MUFG Securities Americas, Inc. | 2/7/24 | On Demand(1) | 5.55 | 3,707,660 | 3,755,674 |
| MUFG Securities Americas, Inc. | 2/7/24 | On Demand(1) | 5.55 | 3,383,323 | 3,427,138 |
| MUFG Securities Americas, Inc. | 2/7/24 | On Demand(1) | 5.55 | 2,942,625 | 2,980,732 |
| MUFG Securities Americas, Inc. | 2/7/24 | On Demand(1) | 5.55 | 2,922,675 | 2,960,524 |
| MUFG Securities Americas, Inc. | 3/18/24 | On Demand(1) | 5.55 | 2,425,469 | 2,441,922 |
| MUFG Securities Americas, Inc. | 3/18/24 | On Demand(1) | 5.55 | 2,419,531 | 2,435,943 |
| MUFG Securities Americas, Inc. | 4/30/24 | On Demand(1) | 5.55 | 5,586,630 | 5,587,491 |
| MUFG Securities Americas, Inc. | 4/30/24 | On Demand(1) | 5.55 | 3,700,611 | 3,701,182 |
| MUFG Securities Americas, Inc. | 4/30/24 | On Demand(1) | 5.55 | 3,236,852 | 3,237,351 |
| TD Securities (USA) LLC | 12/7/23 | On Demand(1) | 5.53 | 8,156,407 | 8,339,333 |
| TD Securities (USA) LLC | 12/7/23 | On Demand(1) | 5.53 | 4,952,790 | 5,063,867 |
| TD Securities (USA) LLC | 12/7/23 | On Demand(1) | 5.53 | 4,675,583 | 4,780,443 |
| TD Securities (USA) LLC | 12/7/23 | On Demand(1) | 5.53 | 4,567,934 | 4,670,380 |
| TD Securities (USA) LLC | 12/7/23 | On Demand(1) | 5.53 | 3,302,513 | 3,376,579 |
| TD Securities (USA) LLC | 12/7/23 | On Demand(1) | 5.53 | 3,236,658 | 3,309,247 |
| TD Securities (USA) LLC | 12/7/23 | On Demand(1) | 5.53 | 3,126,200 | 3,196,312 |
| TD Securities (USA) LLC | 12/7/23 | On Demand(1) | 5.53 | 2,898,417 | 2,963,420 |
| TD Securities (USA) LLC | 12/7/23 | On Demand(1) | 5.53 | 2,866,644 | 2,930,935 |
| TD Securities (USA) LLC | 12/7/23 | On Demand(1) | 5.53 | 2,673,468 | 2,733,426 |
| TD Securities (USA) LLC | 12/7/23 | On Demand(1) | 5.53 | 2,654,999 | 2,714,543 |
| TD Securities (USA) LLC | 12/7/23 | On Demand(1) | 5.53 | 2,454,967 | 2,510,025 |
| TD Securities (USA) LLC | 12/7/23 | On Demand(1) | 5.53 | 2,364,071 | 2,417,091 |
| TD Securities (USA) LLC | 12/7/23 | On Demand(1) | 5.53 | 2,314,818 | 2,366,733 |
| TD Securities (USA) LLC | 12/7/23 | On Demand(1) | 5.53 | 2,295,172 | 2,346,646 |
| TD Securities (USA) LLC | 12/7/23 | On Demand(1) | 5.53 | 1,974,462 | 2,018,744 |
| TD Securities (USA) LLC | 12/7/23 | On Demand(1) | 5.53 | 1,967,955 | 2,012,091 |
| TD Securities (USA) LLC | 12/7/23 | On Demand(1) | 5.53 | 1,576,187 | 1,611,536 |
| TD Securities (USA) LLC | 12/7/23 | On Demand(1) | 5.53 | 1,262,257 | 1,290,566 |
| TD Securities (USA) LLC | 12/11/23 | On Demand(1) | 5.63 | 7,107,279 | 7,265,112 |
| TD Securities (USA) LLC | 12/19/23 | On Demand(1) | 5.63 | 2,081,196 | 2,124,810 |
| TD Securities (USA) LLC | 3/8/24 | On Demand(1) | 5.63 | 4,872,417 | 4,913,565 |
| Total | | | | $140,236,102 | $142,409,962 |
| (1) | Open reverse repurchase agreement with no specific maturity date. Either party may terminate the agreement upon demand. |
At April 30, 2024, the type of securities pledged as collateral for all open reverse repurchase agreements was U.S. Government Agency Mortgage-Backed Securities.
Eaton Vance
Government Opportunities Fund
April 30, 2024
Notes to Financial Statements (Unaudited) — continued
The Fund also pledged cash of $570,000 to BMO Capital Markets Corp., $1,130,000 to MUFG Securities America, Inc. and $4,920,000 to TD Securities (USA) LLC as additional collateral for its reverse repurchase obligations.
For the six months ended April 30, 2024, the average borrowings under settled reverse repurchase agreements and the average interest rate paid were approximately $112,260,000 and 5.55%, respectively. Based on the short-term nature of the borrowings under the reverse repurchase agreements, the carrying value of the payable for reverse repurchase agreements approximated its fair value at April 30, 2024. If measured at fair value, borrowings under the reverse repurchase agreements would have been considered as Level 2 in the fair value hierarchy (see Note 12) at April 30, 2024.
Reverse repurchase agreements entered into by the Fund are subject to Master Repurchase Agreements (MRA), which permit the Fund, under certain circumstances, including an event of default (such as bankruptcy or insolvency), to offset payables and/or receivables under the MRA with collateral held and/or posted to the counterparty and create one single net payment due to or from the Fund.
The following table presents the Fund’s reverse repurchase agreements net of amounts available for offset under an MRA and net of the related collateral pledged by the Fund as of April 30, 2024.
| Counterparty | Reverse
Repurchase
Agreements* | Assets
Available for
Offset | Securities
Collateral
Pledged(a) | Net
Amount(b) |
| MUFG Securities Americas, Inc. | $ (50,248,050) | $ — | $ 50,248,050 | $ — |
| BMO Capital Markets Corp. | (17,206,508) | — | 17,206,508 | — |
| TD Securities (USA) LLC | (74,955,404) | — | 74,955,404 | — |
| | $(142,409,962) | $ — | $142,409,962 | $ — |
| * | Including accrued interest |
| (a) | In some instances, the total collateral pledged may be more than the amount shown due to overcollateralization. |
| (b) | Net amount represents the net amount payable to the counterparty in the event of default. |
11 Affiliated Investments
At April 30, 2024, the value of the Fund's investment in funds that may be deemed to be affiliated was $6,226,794, which represents 1.8% of the Fund's net assets. Transactions in such investments by the Fund for the six months ended April 30, 2024 were as follows:
| Name | Value,
beginning
of period | Purchases | Sales
proceeds | Net realized
gain (loss) | Change in
unrealized
appreciation
(depreciation) | Value, end
of period | Dividend
income | Shares,
end of period |
| Short-Term Investments |
| Liquidity Fund | $4,120,946 | $124,580,613 | $(122,474,765) | $ — | $ — | $6,226,794 | $107,917 | 6,226,794 |
12 Fair Value Measurements
Under generally accepted accounting principles for fair value measurements, a three-tier hierarchy to prioritize the assumptions, referred to as inputs, is used in valuation techniques to measure fair value. The three-tier hierarchy of inputs is summarized in the three broad levels listed below.
| • | Level 1 – quoted prices in active markets for identical investments |
| • | Level 2 – other significant observable inputs (including quoted prices for similar investments, interest rates, prepayment speeds, credit risk, etc.) |
| • | Level 3 – significant unobservable inputs (including a fund's own assumptions in determining the fair value of investments) |
In cases where the inputs used to measure fair value fall in different levels of the fair value hierarchy, the level disclosed is determined based on the lowest level input that is significant to the fair value measurement in its entirety. The inputs or methodology used for valuing securities are not necessarily an indication of the risk associated with investing in those securities.
Eaton Vance
Government Opportunities Fund
April 30, 2024
Notes to Financial Statements (Unaudited) — continued
At April 30, 2024, the hierarchy of inputs used in valuing the Fund’s investments and open derivative instruments, which are carried at fair value, were as follows:
| Asset Description | Level 1 | Level 2 | Level 3 | Total |
| Asset-Backed Securities | $ — | $ 11,418,648 | $ — | $ 11,418,648 |
| Collateralized Mortgage Obligations | — | 228,918,826 | — | 228,918,826 |
| Commercial Mortgage-Backed Securities | — | 1,527,555 | — | 1,527,555 |
| U.S. Department of Agriculture Loans | — | 23,288,219 | — | 23,288,219 |
| U.S. Government Agency Commercial Mortgage-Backed Securities | — | 2,559,518 | — | 2,559,518 |
| U.S. Government Agency Mortgage-Backed Securities | — | 277,192,903 | — | 277,192,903 |
| U.S. Government Guaranteed Small Business Administration Loans | — | 531,829 | — | 531,829 |
| Short-Term Investments | 6,226,794 | — | — | 6,226,794 |
| Total Investments | $ 6,226,794 | $ 545,437,498 | $ — | $ 551,664,292 |
| Futures Contracts | $ 2,957,964 | $ — | $ — | $ 2,957,964 |
| Swap Contracts | — | 14,056,290 | — | 14,056,290 |
| Total | $ 9,184,758 | $ 559,493,788 | $ — | $ 568,678,546 |
| Liability Description | | | | |
| TBA Sale Commitments | $ — | $ (76,022,610) | $ — | $ (76,022,610) |
| Futures Contracts | (7,715,962) | — | — | (7,715,962) |
| Total | $ (7,715,962) | $ (76,022,610) | $ — | $ (83,738,572) |
Eaton Vance
Government Opportunities Fund
April 30, 2024
| Officers |
Kenneth A. Topping
President | Nicholas S. Di Lorenzo
Secretary |
Deidre E. Walsh
Vice President and Chief Legal Officer | Laura T. Donovan
Chief Compliance Officer |
James F. Kirchner
Treasurer | |
George J. Gorman
Chairperson | |
| Alan C. Bowser | |
| Mark R. Fetting | |
| Cynthia E. Frost | |
| Valerie A. Mosley | |
| Anchal Pachnanda* | |
| Keith Quinton | |
| Marcus L. Smith | |
| Susan J. Sutherland | |
| Scott E. Wennerholm | |
| Nancy A. Wiser | |
| U.S. Customer Privacy Notice | March 2024 |
| FACTS | WHAT DOES EATON VANCE DO WITH YOUR PERSONAL INFORMATION? |
| Why? | Financial companies choose how they share your personal information. Federal law gives consumers the right to limit some but not all sharing. Federal law also requires us to tell you how we collect, share, and protect your personal information. Please read this notice carefully to understand what we do. |
| |
| What? | The types of personal information we collect and share depend on the product or service you have with us. This information can include:■ Social Security number and income
■ investment experience and risk tolerance
■ checking account information and wire transfer instructions |
| |
| How? | All financial companies need to share customers’ personal information to run their everyday business. In the section below, we list the reasons financial companies can share their customers’ personal information; the reasons Eaton Vance chooses to share; and whether you can limit this sharing. |
| Reasons we can share your personal information | Does Eaton Vance
share? | Can you limit
this sharing? |
| For our everyday business purposes — such as to process your transactions, maintain your account(s), respond to court orders and legal investigations, or report to credit bureaus | Yes | No |
| For our marketing purposes — to offer our products and services to you | Yes | No |
| For joint marketing with other financial companies | No | We don’t share |
| For our affiliates’ everyday business purposes — information about your transactions and experiences | Yes | No* |
| For our affiliates’ everyday business purposes — information about your creditworthiness | Yes | Yes* |
| For our affiliates to market to you | Yes | Yes* |
| For nonaffiliates to market to you | No | We don’t share |
To limit our
sharing | Call toll-free 1-800-262-1122 or email: EVPrivacy@eatonvance.comPlease note:If you are a new customer, we can begin sharing your information 30 days from the date we sent this notice. When you are no longer our customer, we continue to share your information as described in this notice. However, you can contact us at any time to limit our sharing. |
| Questions? | Call toll-free 1-800-262-1122 or email: EVPrivacy@eatonvance.com |
| U.S. Customer Privacy Notice — continued | March 2024 |
| Who we are |
| Who is providing this notice? | Eaton Vance Management and our investment management affiliates (“Eaton Vance”) (see Affiliates definition below.) |
| What we do |
How does Eaton Vance
protect my personal
information? | To protect your personal information from unauthorized access and use, we use security measures that comply with federal law. These measures include computer safeguards and secured files and buildings. We have policies governing the proper handling of customer information by personnel and requiring third parties that provide support to adhere to appropriate security standards with respect to such information. |
How does Eaton Vance
collect my personal
information? | We collect your personal information, for example, when you■ open an account or make deposits or withdrawals from your account
■ buy securities from us or make a wire transfer
■ give us your contact informationWe also collect your personal information from others, such as credit bureaus, affiliates, or other companies. |
| Why can’t I limit all sharing? | Federal law gives you the right to limit only■ sharing for affiliates’ everyday business purposes — information about your creditworthiness
■ affiliates from using your information to market to you
■ sharing for nonaffiliates to market to youState laws and individual companies may give you additional rights to limit sharing. (See below for more on your rights under state law.) |
What happens when I limit
sharing for an account I hold
jointly with someone else? | Your choices will apply to everyone on your account. |
| Definitions |
| Affiliates | Companies related by common ownership or control. They can be financial and nonfinancial companies.■ Our affiliates include registered investment advisers such as Eaton Vance Management, Eaton Vance Advisers International Ltd., Boston Management and Research, Calvert Research and Management, Parametric Portfolio Associates LLC, Atlanta Capital Management Company LLC, Morgan Stanley Investment Management Inc., Morgan Stanley Investment Management Co.; registered broker-dealers such as Morgan Stanley Distributors Inc. and Eaton Vance Distributors, Inc. (together, the “Investment Management Affiliates”); and companies with a Morgan Stanley name and financial companies such as Morgan Stanley Smith Barney LLC and Morgan Stanley & Co. (the “Morgan Stanley Affiliates”). |
| Nonaffiliates | Companies not related by common ownership or control. They can be financial and nonfinancial companies.■ Eaton Vance does not share with nonaffiliates so they can market to you. |
| Joint marketing | A formal agreement between nonaffiliated financial companies that together market financial products or services to you.■ Eaton Vance does not jointly market. |
| U.S. Customer Privacy Notice — continued | March 2024 |
| Other important information |
| *PLEASE NOTE: Eaton Vance does not share your creditworthiness information or your transactions and experiences information with the Morgan Stanley Affiliates, nor does Eaton Vance enable the Morgan Stanley Affiliates to market to you. Your opt outs will prevent Eaton Vance from sharing your creditworthiness information with the Investment Management Affiliates and will prevent the Investment Management Affiliates from marketing their products to you.Vermont: Except as permitted by law, we will not share personal information we collect about Vermont residents with Nonaffiliates unless you provide us with your written consent to share such information.California: Except as permitted by law, we will not share personal information we collect about California residents with Nonaffiliates and we will limit sharing such personal information with our Affiliates to comply with California privacy laws that apply to us. |
Delivery of Shareholder Documents. The Securities and Exchange Commission (SEC) permits funds to deliver only one copy of shareholder documents, including prospectuses, proxy statements and shareholder reports, to fund investors with multiple accounts at the same residential or post office box address. This practice is often called “householding” and it helps eliminate duplicate mailings to shareholders. Eaton Vance, or your financial intermediary, may household the mailing of your documents indefinitely unless you instruct Eaton Vance, or your financial intermediary, otherwise. If you would prefer that your Eaton Vance documents not be householded, please contact Eaton Vance at 1-800-262-1122, or contact your financial intermediary. Your instructions that householding not apply to delivery of your Eaton Vance documents will typically be effective within 30 days of receipt by Eaton Vance or your financial intermediary.
Portfolio Holdings. Each Eaton Vance Fund and its underlying Portfolio(s) (if applicable) files a schedule of portfolio holdings on Part F to Form N-PORT with the SEC. Certain information filed on Form N-PORT may be viewed on the Eaton Vance website at www.eatonvance.com, by calling Eaton Vance at 1-800-262-1122 or in the EDGAR database on the SEC’s website at www.sec.gov.
Proxy Voting. From time to time, funds are required to vote proxies related to the securities held by the funds. The Eaton Vance Funds or their underlying Portfolios (if applicable) vote proxies according to a set of policies and procedures approved by the Funds’ and Portfolios’ Boards. You may obtain a description of these policies and procedures and information on how the Funds or Portfolios voted proxies relating to portfolio securities during the most recent 12-month period ended June 30, without charge, upon request, by calling 1-800-262-1122 and by accessing the SEC’s website at www.sec.gov.
Tailored Shareholder Reports. Effective January 24, 2023, the SEC adopted rule and form amendments to require open-end mutual funds and ETFs to transmit concise and visually engaging streamlined annual and semi-annual reports to shareholders that highlight key information. Other information, including financial statements, will no longer appear in a streamlined shareholder report but must be available online, delivered free of charge upon request, and filed on a semi-annual basis on Form N-CSR. The rule and form amendments have a compliance date of July 24, 2024. At this time, management is evaluating the impact of these amendments on the shareholder reports for the Eaton Vance Funds.
This Page Intentionally Left Blank
Investment Adviser
Boston Management and Research
One Post Office Square
Boston, MA 02109
Administrator
Eaton Vance Management
One Post Office Square
Boston, MA 02109
Principal Underwriter*
Eaton Vance Distributors, Inc.
One Post Office Square
Boston, MA 02109
(617) 482-8260
Custodian
State Street Bank and Trust Company
One Congress Street, Suite 1
Boston, MA 02114-2016
Transfer Agent
BNY Mellon Investment Servicing (US) Inc.
Attn: Eaton Vance Funds
P.O. Box 534439
Pittsburgh, PA 15253-4439
(800) 262-1122
Fund Offices
One Post Office Square
Boston, MA 02109
* FINRA BrokerCheck. Investors may check the background of their Investment Professional by contacting the Financial Industry Regulatory Authority (FINRA). FINRA BrokerCheck is a free tool to help investors check the professional background of current and former FINRA-registered securities firms and brokers. FINRA BrokerCheck is available by calling 1-800-289-9999 and at www.FINRA.org. The FINRA BrokerCheck brochure describing this program is available to investors at www.FINRA.org.
Eaton Vance
High Income Opportunities Fund
Semi-Annual Report
April 30, 2024
Commodity Futures Trading Commission Registration. The Commodity Futures Trading Commission (“CFTC”) has adopted regulations that subject registered investment companies and advisers to regulation by the CFTC if a fund invests more than a prescribed level of its assets in certain CFTC-regulated instruments (including futures, certain options and swap agreements) or markets itself as providing investment exposure to such instruments. The investment adviser has claimed an exclusion from the definition of “commodity pool operator” under the Commodity Exchange Act with respect to its management of the Fund. Accordingly, neither the Fund nor the adviser with respect to the operation of the Fund is subject to CFTC regulation. Because of its management of other strategies, the Fund's adviser is registered with the CFTC as a commodity pool operator. The adviser is also registered as a commodity trading advisor.
Fund shares are not insured by the FDIC and are not deposits or other obligations of, or guaranteed by, any depository institution. Shares are subject to investment risks, including possible loss of principal invested.
This report must be preceded or accompanied by a current summary prospectus or prospectus. Before investing, investors should consider carefully the investment objective, risks, and charges and expenses of a mutual fund. This and other important information is contained in the summary prospectus and prospectus, which can be obtained from a financial intermediary. Prospective investors should read the prospectus carefully before investing. For further information, please call 1-800-262-1122.
Semi-Annual Report April 30, 2024
Eaton Vance
High Income Opportunities Fund
Eaton Vance
High Income Opportunities Fund
April 30, 2024
Performance
Portfolio Manager(s) Kelley Gerrity, Stephen C. Concannon, CFA and Jeffrey D. Mueller
| % Average Annual Total Returns1,2 | Class
Inception Date | Performance
Inception Date | Six Months | One Year | Five Years | Ten Years |
| Class A at NAV | 03/11/2004 | 08/19/1986 | 8.65% | 7.90% | 4.33% | 4.36% |
| Class A with 3.25% Maximum Sales Charge | — | — | 5.16 | 4.32 | 3.63 | 4.01 |
| Class C at NAV | 06/08/1994 | 08/19/1986 | 7.97 | 7.10 | 3.53 | 3.73 |
| Class C with 1% Maximum Deferred Sales Charge | — | — | 6.97 | 6.10 | 3.53 | 3.73 |
| Class I at NAV | 10/01/2009 | 08/19/1986 | 8.50 | 8.17 | 4.54 | 4.60 |
| Class R6 at NAV | 06/30/2023 | 08/19/1986 | 8.82 | 8.52 | 4.61 | 4.63 |
|
| ICE BofA U.S. High Yield Index | — | — | 8.94% | 8.88% | 3.53% | 4.18% |
| ICE BofA U.S. High Yield Constrained Index | — | — | 8.96 | 8.89 | 3.51 | 4.18 |
| % Total Annual Operating Expense Ratios3 | Class A | Class C | Class I | Class R6 |
| | 0.95% | 1.70% | 0.70% | 0.60% |
See Endnotes and Additional Disclosures in this report.
Past performance is no guarantee of future results. Returns are historical and are calculated by determining the percentage change in net asset value (NAV) or offering price (as applicable) with all distributions reinvested. Furthermore, returns do not reflect the deduction of taxes that shareholders may have to pay on Fund distributions or upon the redemption of Fund shares. Investment return and principal value will fluctuate so that shares, when redeemed, may be worth more or less than their original cost. Performance for periods less than or equal to one year is cumulative. Performance is for the stated time period only; due to market volatility, current Fund performance may be lower or higher than the quoted return. For performance as of the most recent month-end, please refer to eatonvance.com.
Eaton Vance
High Income Opportunities Fund
April 30, 2024
| Credit Quality (% of total investments)1 |
Fund invests in an affiliated investment company (Portfolio) with the same objective(s) and policies as the Fund. References to investments are to the Portfolio’s holdings.
Footnotes:
| 1 | Ratings are based on Moody’s Investors Service, Inc. (“Moody’s”), S&P Global Ratings (“S&P”) or Fitch Ratings (“Fitch”), as applicable. This breakdown assigns a numeric equivalent to the ratings from the aforementioned agencies and the mean is rounded to the nearest integer and converted to an equivalent S&P major rating category. Ratings, which are subject to change, apply to the creditworthiness of the issuers of the underlying securities and not to the Fund or its shares. Credit ratings measure the quality of a bond based on the issuer’s creditworthiness, with ratings ranging from AAA, being the highest, to D, being the lowest based on S&P’s measures. Ratings of BBB or higher by S&P or Fitch (Baa or higher by Moody’s) are considered to be investment-grade quality. Credit ratings are based largely on the ratings agency’s analysis at the time of rating. The rating assigned to any particular security is not necessarily a reflection of the issuer’s current financial condition and does not necessarily reflect its assessment of the volatility of a security’s market value or of the liquidity of an investment in the security. Holdings designated as “Not Rated” (if any) are not rated by the national ratings agencies stated above. |
Eaton Vance
High Income Opportunities Fund
April 30, 2024
Endnotes and Additional Disclosures
| 1 | ICE BofA U.S. High Yield Index is an unmanaged index of below-investment grade U.S. corporate bonds. ICE BofA U.S. High Yield Constrained Index is an unmanaged index of below-investment grade U.S. corporate bonds, with issuer exposure capped at 2%. ICE® BofA® indices are not for redistribution or other uses; provided “as is”, without warranties, and with no liability. Eaton Vance has prepared this report and ICE Data Indices, LLC does not endorse it, or guarantee, review, or endorse Eaton Vance’s products. BofA® is a licensed registered trademark of Bank of America Corporation in the United States and other countries. Unless otherwise stated, index returns do not reflect the effect of any applicable sales charges, commissions, expenses, taxes or leverage, as applicable. It is not possible to invest directly in an index. |
| 2 | Total Returns at NAV do not include applicable sales charges. If sales charges were deducted, the returns would be lower. Total Returns shown with maximum sales charge reflect the stated maximum sales charge. Unless otherwise stated, performance does not reflect the deduction of taxes on Fund distributions or redemptions of Fund shares.Performance prior to the inception date of a class may be linked to the performance of an older class of the Fund. This linked performance is adjusted for any applicable sales charge, but is not adjusted for class expense differences. If adjusted for such differences, the performance would be different. The performance of Class R6 is linked to Class I. Performance since inception for an index, if presented, is the performance since the Fund’s or oldest share class’ inception, as applicable. Performance presented in the Financial Highlights included in the financial statements is not linked.Effective November 5, 2020, Class C shares automatically convert to Class A shares eight years after purchase. The average annual total returns listed for Class C reflect conversion to Class A shares after eight years. Prior to November 5, 2020, Class C shares automatically converted to Class A shares ten years after purchase. |
| 3 | Source: Fund prospectus. The expense ratios for the current reporting period can be found in the Financial Highlights section of this report. Performance reflects expenses waived and/or reimbursed, if applicable. Without such waivers and/or reimbursements, performance would have been lower. |
| | Fund profile subject to change due to active management. |
Eaton Vance
High Income Opportunities Fund
April 30, 2024
Example
As a Fund shareholder, you incur two types of costs: (1) transaction costs, including sales charges (loads) on purchases; and (2) ongoing costs, including management fees; distribution and/or service fees; and other Fund expenses. This Example is intended to help you understand your ongoing costs (in dollars) of Fund investing and to compare these costs with the ongoing costs of investing in other mutual funds. The Example is based on an investment of $1,000 invested at the beginning of the period and held for the entire period (November 1, 2023 to April 30, 2024).
Actual Expenses
The first section of the table below provides information about actual account values and actual expenses. You may use the information in this section, together with the amount you invested, to estimate the expenses that you paid over the period. Simply divide your account value by $1,000 (for example, an $8,600 account value divided by $1,000 = 8.6), then multiply the result by the number in the first section under the heading entitled “Expenses Paid During Period” to estimate the expenses you paid on your account during this period.
Hypothetical Example for Comparison Purposes
The second section of the table below provides information about hypothetical account values and hypothetical expenses based on the actual Fund expense ratio and an assumed rate of return of 5% per year (before expenses), which is not the actual Fund return. The hypothetical account values and expenses may not be used to estimate the actual ending account balance or expenses you paid for the period. You may use this information to compare the ongoing costs of investing in your Fund and other funds. To do so, compare this 5% hypothetical example with the 5% hypothetical examples that appear in the shareholder reports of the other funds.
Please note that the expenses shown in the table are meant to highlight your ongoing costs only and do not reflect any transactional costs, such as sales charges (loads). Therefore, the second section of the table is useful in comparing ongoing costs only, and will not help you determine the relative total costs of owning different funds. In addition, if these transactional costs were included, your costs would be higher.
| | Beginning
Account Value
(11/1/23) | Ending
Account Value
(4/30/24) | Expenses Paid
During Period*
(11/1/23 – 4/30/24) | Annualized
Expense
Ratio |
| Actual | | | | |
| Class A | $1,000.00 | $1,086.50 | $4.77** | 0.92% |
| Class C | $1,000.00 | $1,079.70 | $8.64** | 1.67% |
| Class I | $1,000.00 | $1,085.00 | $3.42** | 0.66% |
| Class R6 | $1,000.00 | $1,088.20 | $2.91** | 0.56% |
| |
| Hypothetical | | | | |
| (5% return per year before expenses) | | | | |
| Class A | $1,000.00 | $1,020.29 | $4.62** | 0.92% |
| Class C | $1,000.00 | $1,016.56 | $8.37** | 1.67% |
| Class I | $1,000.00 | $1,021.58 | $3.32** | 0.66% |
| Class R6 | $1,000.00 | $1,022.08 | $2.82** | 0.56% |
| * | Expenses are equal to the Fund's annualized expense ratio for the indicated Class, multiplied by the average account value over the period, multiplied by 182/366 (to reflect the one-half year period). The Example assumes that the $1,000 was invested at the net asset value per share determined at the close of business on October 31, 2023. The Example reflects the expenses of both the Fund and the Portfolio. |
| ** | Absent an allocation of certain expenses to affiliate(s), expenses would be higher. |
Eaton Vance
High Income Opportunities Fund
April 30, 2024
Statement of Assets and Liabilities (Unaudited)
| | April 30, 2024 |
| Assets | |
| Investment in High Income Opportunities Portfolio, at value (identified cost $982,985,585) | $ 991,805,562 |
| Receivable for Fund shares sold | 2,000,447 |
| Prepaid expenses | 2,434 |
| Total assets | $ 993,808,443 |
| Liabilities | |
| Payable for Fund shares redeemed | $ 2,792,275 |
| Distributions payable | 390,249 |
| Payable to affiliates: | |
| Distribution and service fees | 62,924 |
| Trustees' fees | 43 |
| Accrued expenses | 332,352 |
| Total liabilities | $ 3,577,843 |
| Net Assets | $ 990,230,600 |
| Sources of Net Assets | |
| Paid-in capital | $1,013,306,273 |
| Accumulated loss | (23,075,673) |
| Net Assets | $ 990,230,600 |
| Class A Shares | |
| Net Assets | $ 229,562,902 |
| Shares Outstanding | 55,607,738 |
Net Asset Value and Redemption Price Per Share
(net assets ÷ shares of beneficial interest outstanding) | $ 4.13 |
Maximum Offering Price Per Share
(100 ÷ 96.75 of net asset value per share) | $ 4.27 |
| Class C Shares | |
| Net Assets | $ 18,714,854 |
| Shares Outstanding | 4,526,721 |
Net Asset Value and Offering Price Per Share*
(net assets ÷ shares of beneficial interest outstanding) | $ 4.13 |
| Class I Shares | |
| Net Assets | $ 741,069,142 |
| Shares Outstanding | 179,273,479 |
Net Asset Value, Offering Price and Redemption Price Per Share
(net assets ÷ shares of beneficial interest outstanding) | $ 4.13 |
| Class R6 Shares | |
| Net Assets | $ 883,702 |
| Shares Outstanding | 213,712 |
Net Asset Value, Offering Price and Redemption Price Per Share
(net assets ÷ shares of beneficial interest outstanding) | $ 4.14 |
| On sales of $100,000 or more, the offering price of Class A shares is reduced. |
| * | Redemption price per share is equal to the net asset value less any applicable contingent deferred sales charge. |
6
See Notes to Financial Statements.
Eaton Vance
High Income Opportunities Fund
April 30, 2024
Statement of Operations (Unaudited)
| | Six Months Ended |
| | April 30, 2024 |
| Investment Income | |
| Dividend income allocated from Portfolio (net of foreign taxes withheld of $521) | $ 1,422,595 |
| Interest income allocated from Portfolio | 29,984,956 |
| Other income allocated from Portfolio | 18,538 |
| Expenses allocated from Portfolio | (2,350,109) |
| Total investment income from Portfolio | $ 29,075,980 |
| Expenses | |
| Distribution and service fees: | |
| Class A | $ 287,634 |
| Class C | 99,459 |
| Trustees’ fees and expenses | 250 |
| Custodian fee | 28,671 |
| Transfer and dividend disbursing agent fees | 493,038 |
| Legal and accounting services | 64,319 |
| Printing and postage | 2,220 |
| Registration fees | 70,810 |
| Miscellaneous | 12,932 |
| Total expenses | $ 1,059,333 |
| Net investment income | $ 28,016,647 |
| Realized and Unrealized Gain (Loss) from Portfolio | |
| Net realized gain (loss): | |
| Investment transactions | $ (10,159,627) |
| Foreign currency transactions | 4,565 |
| Forward foreign currency exchange contracts | 51,851 |
| Net realized loss | $(10,103,211) |
| Change in unrealized appreciation (depreciation): | |
| Investments | $ 54,707,961 |
| Foreign currency | 685 |
| Forward foreign currency exchange contracts | 25,632 |
| Net change in unrealized appreciation (depreciation) | $ 54,734,278 |
| Net realized and unrealized gain | $ 44,631,067 |
| Net increase in net assets from operations | $ 72,647,714 |
7
See Notes to Financial Statements.
Eaton Vance
High Income Opportunities Fund
April 30, 2024
Statements of Changes in Net Assets
| | Six Months Ended
April 30, 2024
(Unaudited) | Year Ended
October 31, 2023 |
| Increase (Decrease) in Net Assets | | |
| From operations: | | |
| Net investment income | $ 28,016,647 | $ 45,622,282 |
| Net realized gain (loss) | (10,103,211) | 5,386,491 |
| Net change in unrealized appreciation (depreciation) | 54,734,278 | (8,067,317) |
| Net increase in net assets from operations | $ 72,647,714 | $ 42,941,456 |
| Distributions to shareholders: | | |
| Class A | $ (7,163,876) | $ (11,836,657) |
| Class C | (544,443) | (1,164,176) |
| Class I | (21,340,787) | (33,777,614) |
| Class R6 | (22,200) | (1,093) (1) |
| Total distributions to shareholders | $ (29,071,306) | $ (46,779,540) |
| Transactions in shares of beneficial interest: | | |
| Class A | $ 5,925,315 | $ 24,012,527 |
| Class C | (2,016,779) | (4,149,680) |
| Class I | 96,770,910 | 145,523,571 |
| Class R6 | 815,667 | 58,314 (1) |
| Net increase in net assets from Fund share transactions | $101,495,113 | $165,444,732 |
| Net increase in net assets | $145,071,521 | $161,606,648 |
| Net Assets | | |
| At beginning of period | $ 845,159,079 | $ 683,552,431 |
| At end of period | $990,230,600 | $845,159,079 |
| (1) | For the period from the commencement of operations, June 30, 2023, to October 31, 2023. |
8
See Notes to Financial Statements.
Eaton Vance
High Income Opportunities Fund
April 30, 2024
| | Class A |
| | Six Months Ended
April 30, 2024
(Unaudited) | Year Ended October 31, |
| | 2023 | 2022 | 2021 | 2020 | 2019 |
| Net asset value — Beginning of period | $ 3.920 | $ 3.920 | $ 4.520 | $ 4.210 | $ 4.400 | $ 4.330 |
| Income (Loss) From Operations | | | | | | |
| Net investment income(1) | $ 0.123 | $ 0.228 | $ 0.185 | $ 0.196 | $ 0.206 | $ 0.227 |
| Net realized and unrealized gain (loss) | 0.215 | 0.005 (2) | (0.565) | 0.340 | (0.157) | 0.081 |
| Total income (loss) from operations | $ 0.338 | $ 0.233 | $ (0.380) | $ 0.536 | $ 0.049 | $ 0.308 |
| Less Distributions | | | | | | |
| From net investment income | $ (0.128) | $ (0.233) | $ (0.213) | $ (0.179) | $ (0.207) | $ (0.238) |
| Tax return of capital | — | — | (0.007) | (0.047) | (0.032) | — |
| Total distributions | $ (0.128) | $ (0.233) | $ (0.220) | $ (0.226) | $ (0.239) | $ (0.238) |
| Net asset value — End of period | $ 4.130 | $ 3.920 | $ 3.920 | $ 4.520 | $ 4.210 | $ 4.400 |
| Total Return(3) | 8.65% (4) | 5.94% | (8.59)% | 12.93% | 1.26% | 7.31% |
| Ratios/Supplemental Data | | | | | | |
| Net assets, end of period (000’s omitted) | $229,563 | $212,170 | $188,765 | $233,330 | $226,927 | $269,795 |
| Ratios (as a percentage of average daily net assets):(5) | | | | | | |
| Expenses | 0.92% (6)(7) | 0.95% (6) | 0.91% (6) | 0.90% | 0.93% | 0.91% |
| Net investment income | 5.99% (7) | 5.66% | 4.39% | 4.39% | 4.87% | 5.22% |
| Portfolio Turnover of the Portfolio | 22% (4) | 29% | 19% | 64% | 67% | 32% |
| (1) | Computed using average shares outstanding. |
| (2) | The per share amount is not in accord with the net realized and unrealized gain (loss) for the period because of the timing of Fund share transactions and the amount of the per share realized and unrealized gains and losses at such time. |
| (3) | Returns are historical and are calculated by determining the percentage change in net asset value with all distributions reinvested and do not reflect the effect of sales charges. |
| (4) | Not annualized. |
| (5) | Includes the Fund’s share of the Portfolio’s allocated expenses. |
| (6) | Includes a reduction by the investment adviser of a portion of the Portfolio's adviser fee due to the Portfolio's investment in the Liquidity Fund (equal to less than 0.01%, less than 0.01% and less than 0.005% of average daily net assets for the six months ended April 30, 2024 and the years ended October 31, 2023 and 2022, respectively). |
| (7) | Annualized. |
9
See Notes to Financial Statements.
Eaton Vance
High Income Opportunities Fund
April 30, 2024
Financial Highlights — continued
| | Class C |
| | Six Months Ended
April 30, 2024
(Unaudited) | Year Ended October 31, |
| | 2023 | 2022 | 2021 | 2020 | 2019 |
| Net asset value — Beginning of period | $ 3.930 | $ 3.920 | $ 4.520 | $ 4.210 | $ 4.400 | $ 4.330 |
| Income (Loss) From Operations | | | | | | |
| Net investment income(1) | $ 0.108 | $ 0.197 | $ 0.153 | $ 0.162 | $ 0.174 | $ 0.195 |
| Net realized and unrealized gain (loss) | 0.204 | 0.015 (2) | (0.566) | 0.341 | (0.159) | 0.080 |
| Total income (loss) from operations | $ 0.312 | $ 0.212 | $ (0.413) | $ 0.503 | $ 0.015 | $ 0.275 |
| Less Distributions | | | | | | |
| From net investment income | $ (0.112) | $ (0.202) | $ (0.181) | $ (0.153) | $ (0.178) | $ (0.205) |
| Tax return of capital | — | — | (0.006) | (0.040) | (0.027) | — |
| Total distributions | $ (0.112) | $ (0.202) | $ (0.187) | $ (0.193) | $ (0.205) | $ (0.205) |
| Net asset value — End of period | $ 4.130 | $ 3.930 | $ 3.920 | $ 4.520 | $ 4.210 | $ 4.400 |
| Total Return(3) | 7.97% (4) | 5.38% | (9.31)% | 12.09% | 0.45% | 6.49% |
| Ratios/Supplemental Data | | | | | | |
| Net assets, end of period (000’s omitted) | $18,715 | $19,686 | $23,724 | $32,926 | $37,680 | $55,246 |
| Ratios (as a percentage of average daily net assets):(5) | | | | | | |
| Expenses | 1.67% (6)(7) | 1.70% (6) | 1.66% (6) | 1.65% | 1.68% | 1.67% |
| Net investment income | 5.24% (7) | 4.89% | 3.62% | 3.64% | 4.12% | 4.50% |
| Portfolio Turnover of the Portfolio | 22% (4) | 29% | 19% | 64% | 67% | 32% |
| (1) | Computed using average shares outstanding. |
| (2) | The per share amount is not in accord with the net realized and unrealized gain (loss) for the period because of the timing of Fund share transactions and the amount of the per share realized and unrealized gains and losses at such time. |
| (3) | Returns are historical and are calculated by determining the percentage change in net asset value with all distributions reinvested and do not reflect the effect of sales charges. |
| (4) | Not annualized. |
| (5) | Includes the Fund’s share of the Portfolio’s allocated expenses. |
| (6) | Includes a reduction by the investment adviser of a portion of the Portfolio's adviser fee due to the Portfolio's investment in the Liquidity Fund (equal to less than 0.01%, less than 0.01% and less than 0.005% of average daily net assets for the six months ended April 30, 2024 and the years ended October 31, 2023 and 2022, respectively). |
| (7) | Annualized. |
10
See Notes to Financial Statements.
Eaton Vance
High Income Opportunities Fund
April 30, 2024
Financial Highlights — continued
| | Class I |
| | Six Months Ended
April 30, 2024
(Unaudited) | Year Ended October 31, |
| | 2023 | 2022 | 2021 | 2020 | 2019 |
| Net asset value — Beginning of period | $ 3.930 | $ 3.920 | $ 4.520 | $ 4.220 | $ 4.410 | $ 4.340 |
| Income (Loss) From Operations | | | | | | |
| Net investment income(1) | $ 0.128 | $ 0.238 | $ 0.196 | $ 0.208 | $ 0.216 | $ 0.238 |
| Net realized and unrealized gain (loss) | 0.205 | 0.015 (2) | (0.565) | 0.329 | (0.156) | 0.081 |
| Total income (loss) from operations | $ 0.333 | $ 0.253 | $ (0.369) | $ 0.537 | $ 0.060 | $ 0.319 |
| Less Distributions | | | | | | |
| From net investment income | $ (0.133) | $ (0.243) | $ (0.224) | $ (0.188) | $ (0.217) | $ (0.249) |
| Tax return of capital | — | — | (0.007) | (0.049) | (0.033) | — |
| Total distributions | $ (0.133) | $ (0.243) | $ (0.231) | $ (0.237) | $ (0.250) | $ (0.249) |
| Net asset value — End of period | $ 4.130 | $ 3.930 | $ 3.920 | $ 4.520 | $ 4.220 | $ 4.410 |
| Total Return(3) | 8.50% (4) | 6.48% | (8.36)% | 12.93% | 1.52% | 7.57% |
| Ratios/Supplemental Data | | | | | | |
| Net assets, end of period (000’s omitted) | $741,069 | $613,247 | $471,064 | $476,949 | $534,500 | $549,842 |
| Ratios (as a percentage of average daily net assets):(5) | | | | | | |
| Expenses | 0.66% (6)(7) | 0.70% (6) | 0.66% (6) | 0.65% | 0.68% | 0.66% |
| Net investment income | 6.24% (7) | 5.91% | 4.65% | 4.65% | 5.10% | 5.47% |
| Portfolio Turnover of the Portfolio | 22% (4) | 29% | 19% | 64% | 67% | 32% |
| (1) | Computed using average shares outstanding. |
| (2) | The per share amount is not in accord with the net realized and unrealized gain (loss) for the period because of the timing of Fund share transactions and the amount of the per share realized and unrealized gains and losses at such time. |
| (3) | Returns are historical and are calculated by determining the percentage change in net asset value with all distributions reinvested. |
| (4) | Not annualized. |
| (5) | Includes the Fund’s share of the Portfolio’s allocated expenses. |
| (6) | Includes a reduction by the investment adviser of a portion of the Portfolio's adviser fee due to the Portfolio's investment in the Liquidity Fund (equal to less than 0.01%, less than 0.01% and less than 0.005% of average daily net assets for the six months ended April 30, 2024 and the years ended October 31, 2023 and 2022, respectively). |
| (7) | Annualized. |
11
See Notes to Financial Statements.
Eaton Vance
High Income Opportunities Fund
April 30, 2024
Financial Highlights — continued
| | Class R6 |
| | Six Months Ended
April 30, 2024
(Unaudited) | Period Ended
October 31, 2023(1) |
| Net asset value — Beginning of period | $ 3.930 | $ 4.050 |
| Income (Loss) From Operations | | |
| Net investment income(2) | $ 0.131 | $ 0.084 |
| Net realized and unrealized gain (loss) | 0.214 | (0.116) |
| Total income (loss) from operations | $ 0.345 | $(0.032) |
| Less Distributions | | |
| From net investment income | $ (0.135) | $ (0.088) |
| Total distributions | $(0.135) | $(0.088) |
| Net asset value — End of period | $ 4.140 | $ 3.930 |
| Total Return(3) | 8.82% (4) | (0.83)% (4) |
| Ratios/Supplemental Data | | |
| Net assets, end of period (000’s omitted) | $ 884 | $ 57 |
| Ratios (as a percentage of average daily net assets):(5) | | |
| Expenses | 0.56% (6)(7) | 0.60% (6)(7) |
| Net investment income | 6.34% (6) | 6.18% (6) |
| Portfolio Turnover of the Portfolio | 22% (4) | 29% (8) |
| (1) | For the period from the commencement of operations, June 30, 2023, to October 31, 2023. |
| (2) | Computed using average shares outstanding. |
| (3) | Returns are historical and are calculated by determining the percentage change in net asset value with all distributions reinvested. |
| (4) | Not annualized. |
| (5) | Includes the Fund’s share of the Portfolio’s allocated expenses. |
| (6) | Annualized. |
| (7) | Includes a reduction by the investment adviser of a portion of the Portfolio’s adviser fee due to the Portfolio’s investment in the Liquidity Fund (equal to less than 0.01% of average daily net assets for the six months ended April 30, 2024 and the period ended October 31, 2023). |
| (8) | For the year ended October 31, 2023. |
12
See Notes to Financial Statements.
Eaton Vance
High Income Opportunities Fund
April 30, 2024
Notes to Financial Statements (Unaudited)
1 Significant Accounting Policies
Eaton Vance High Income Opportunities Fund (the Fund) is a diversified series of Eaton Vance Mutual Funds Trust (the Trust). The Trust is a Massachusetts business trust registered under the Investment Company Act of 1940, as amended (the 1940 Act), as an open-end management investment company. The Fund offers four classes of shares. Class A shares are generally sold subject to a sales charge imposed at time of purchase. Class C shares are sold at net asset value and are generally subject to a contingent deferred sales charge (see Note 5). Effective November 5, 2020, Class C shares automatically convert to Class A shares eight years after their purchase as described in the Fund’s prospectus. Class I and Class R6 shares are sold at net asset value and are not subject to a sales charge. Each class represents a pro rata interest in the Fund, but votes separately on class-specific matters and (as noted below) is subject to different expenses. Realized and unrealized gains and losses are allocated daily to each class of shares based on the relative net assets of each class to the total net assets of the Fund. Net investment income, other than class-specific expenses, is allocated daily to each class of shares based upon the ratio of the value of each class’s paid shares to the total value of all paid shares. Sub-accounting, recordkeeping and similar administrative fees payable to financial intermediaries, which are a component of transfer and dividend disbursing agent fees on the Statement of Operations, are not allocated to Class R6 shares. Each class of shares differs in its distribution plan and certain other class-specific expenses. The Fund invests all of its investable assets in interests in High Income Opportunities Portfolio (the Portfolio), a Massachusetts business trust, having the same investment objectives and policies as the Fund. The value of the Fund’s investment in the Portfolio reflects the Fund’s proportionate interest in the net assets of the Portfolio (73.6% at April 30, 2024). The performance of the Fund is directly affected by the performance of the Portfolio. The financial statements of the Portfolio, including the portfolio of investments, are included elsewhere in this report and should be read in conjunction with the Fund’s financial statements.
The following is a summary of significant accounting policies of the Fund. The policies are in conformity with accounting principles generally accepted in the United States of America (U.S. GAAP). The Fund is an investment company and follows accounting and reporting guidance in the Financial Accounting Standards Board (FASB) Accounting Standards Codification Topic 946.
A Investment Valuation—Valuation of securities by the Portfolio is discussed in Note 1A of the Portfolio's Notes to Financial Statements, which are included elsewhere in this report.
B Income—The Fund's net investment income or loss consists of the Fund's pro rata share of the net investment income or loss of the Portfolio, less all actual and accrued expenses of the Fund.
C Federal Taxes—The Fund's policy is to comply with the provisions of the Internal Revenue Code applicable to regulated investment companies and to distribute to shareholders each year substantially all of its net investment income, and all or substantially all of its net realized capital gains. Accordingly, no provision for federal income or excise tax is necessary.
As of April 30, 2024, the Fund had no uncertain tax positions that would require financial statement recognition, de-recognition, or disclosure. The Fund files a U.S. federal income tax return annually after its fiscal year-end, which is subject to examination by the Internal Revenue Service for a period of three years from the date of filing.
D Expenses—The majority of expenses of the Trust are directly identifiable to an individual fund. Expenses which are not readily identifiable to a specific fund are allocated taking into consideration, among other things, the nature and type of expense and the relative size of the funds.
E Use of Estimates—The preparation of the financial statements in conformity with U.S. GAAP requires management to make estimates and assumptions that affect the reported amounts of assets and liabilities at the date of the financial statements and the reported amounts of income and expense during the reporting period. Actual results could differ from those estimates.
F Indemnifications—Under the Trust’s organizational documents, its officers and Trustees may be indemnified against certain liabilities and expenses arising out of the performance of their duties to the Fund. Under Massachusetts law, if certain conditions prevail, shareholders of a Massachusetts business trust (such as the Trust) could be deemed to have personal liability for the obligations of the Trust. However, the Trust’s Declaration of Trust contains an express disclaimer of liability on the part of Fund shareholders and the By-laws provide that the Trust shall assume, upon request by the shareholder, the defense on behalf of any Fund shareholders. Moreover, the By-laws also provide for indemnification out of Fund property of any shareholder held personally liable solely by reason of being or having been a shareholder for all loss or expense arising from such liability. Additionally, in the normal course of business, the Fund enters into agreements with service providers that may contain indemnification clauses. The Fund’s maximum exposure under these arrangements is unknown as this would involve future claims that may be made against the Fund that have not yet occurred.
G Other—Investment transactions are accounted for on a trade date basis.
H Interim Financial Statements—The interim financial statements relating to April 30, 2024 and for the six months then ended have not been audited by an independent registered public accounting firm, but in the opinion of the Fund’s management, reflect all adjustments, consisting only of normal recurring adjustments, necessary for the fair presentation of the financial statements.
Eaton Vance
High Income Opportunities Fund
April 30, 2024
Notes to Financial Statements (Unaudited) — continued
2 Distributions to Shareholders and Income Tax Information
The Fund declares dividends daily to shareholders of record at the time of declaration. Distributions are generally paid monthly. Distributions of realized capital gains are made at least annually. Distributions are declared separately for each class of shares. Shareholders may reinvest income and capital gain distributions in additional shares of the same class of the Fund at the net asset value as of the reinvestment date or, at the election of the shareholder, receive distributions in cash. Distributions to shareholders are determined in accordance with income tax regulations, which may differ from U.S. GAAP. As required by U.S. GAAP, only distributions in excess of tax basis earnings and profits are reported in the financial statements as a return of capital. Permanent differences between book and tax accounting relating to distributions are reclassified to paid-in capital. For tax purposes, distributions from short-term capital gains are considered to be from ordinary income.
At October 31, 2023, the Fund, for federal income tax purposes, had deferred capital losses of $8,332,712 which would reduce its taxable income arising from future net realized gains on investment transactions, if any, to the extent permitted by the Internal Revenue Code, and thus would reduce the amount of distributions to shareholders, which would otherwise be necessary to relieve the Fund of any liability for federal income or excise tax. The deferred capital losses are treated as arising on the first day of the Fund’s next taxable year and retain the same short-term or long-term character as when originally deferred. Of the deferred capital losses at October 31, 2023, $326,900 are short-term and $8,005,812 are long-term.
3 Investment Adviser Fee and Other Transactions with Affiliates
Pursuant to an investment advisory agreement with Eaton Vance Management (EVM), an indirect, wholly-owned subsidiary of Morgan Stanley, the Fund pays an investment adviser fee on its daily net assets that are not invested in other investment companies, and on its daily gross income that is not derived from other investment companies, for which EVM or its affiliates serve as investment adviser and receive an advisory fee at a per annum rate as follows and is payable monthly:
| Total Daily Net Assets | Annual Asset
Rate | Daily Income
Rate |
| Up to $500 million | 0.300% | 3.000% |
| $500 million but less than $1 billion | 0.275% | 2.750% |
| $1 billion but less than $1.5 billion | 0.250% | 2.500% |
| $1.5 billion but less than $2 billion | 0.225% | 2.250% |
| $2 billion but less than $3 billion | 0.200% | 2.000% |
| $3 billion and over | 0.175% | 1.750% |
For the six months ended April 30, 2024, the Fund incurred no investment adviser fee on such assets. Pursuant to an investment sub-advisory agreement, EVM has delegated a portion of the investment management of the Fund to Eaton Vance Advisers International Ltd. (EVAIL), an affiliate of EVM. EVM pays EVAIL a portion of its investment adviser fee for sub-advisory services provided to the Fund. To the extent that the Fund’s assets are invested in the Portfolio, the Fund is allocated its share of the Portfolio’s investment adviser fee. The Portfolio has engaged Boston Management and Research (BMR) to render investment advisory services. See Note 2 of the Portfolio’s Notes to Financial Statements which are included elsewhere in this report. EVM also serves as the administrator of the Fund, but receives no compensation.
Effective March 13, 2024, EVM and BMR have agreed to reimburse the Fund’s expenses to the extent that total annual operating expenses (relating to ordinary operating expenses only and excluding such expenses as brokerage commissions, acquired fund fees and expenses of unaffiliated funds, borrowing costs, taxes or litigation expenses) exceed 0.95%, 1.70%, 0.70% and 0.62% of the Fund’s average daily net assets for Class A, Class C, Class I and Class R6, respectively. This agreement may be changed or terminated after March 1, 2025. For the six months ended April 30, 2024, no expenses were waived or reimbursed by EVM or BMR.
EVM provides sub-transfer agency and related services to the Fund pursuant to a Sub-Transfer Agency Support Services Agreement. For the six months ended April 30, 2024, EVM earned $28,240 from the Fund pursuant to such agreement, which is included in transfer and dividend disbursing agent fees on the Statement of Operations. The Fund was informed that Eaton Vance Distributors, Inc. (EVD), an affiliate of EVM and the Fund's principal underwriter, received $3,998 as its portion of the sales charge on sales of Class A shares for the six months ended April 30, 2024. The Fund was informed that Morgan Stanley affiliated broker-dealers, which may be deemed to be affiliates of EVM, BMR and EVD, also received a portion of the sales charge on sales of Class A shares for the six months ended April 30, 2024 in the amount of less than $100. EVD also received distribution and service fees from Class A and Class C shares (see Note 4) and contingent deferred sales charges (see Note 5).
Trustees and officers of the Fund who are members of EVM’s or BMR's organizations receive remuneration for their services to the Fund out of the investment adviser fee. Certain officers and Trustees of the Fund and the Portfolio are officers of the above organizations.
Eaton Vance
High Income Opportunities Fund
April 30, 2024
Notes to Financial Statements (Unaudited) — continued
4 Distribution Plans
The Fund has in effect a distribution plan for Class A shares (Class A Plan) pursuant to Rule 12b-1 under the 1940 Act. Pursuant to the Class A Plan, the Fund pays EVD a distribution and service fee of 0.25% per annum of its average daily net assets attributable to Class A shares for distribution services and facilities provided to the Fund by EVD, as well as for personal services and/or the maintenance of shareholder accounts. Distribution and service fees paid or accrued to EVD for the six months ended April 30, 2024 amounted to $287,634 for Class A shares.
The Fund also has in effect a distribution plan for Class C shares (Class C Plan) pursuant to Rule 12b-1 under the 1940 Act. Pursuant to the Class C Plan, the Fund pays EVD amounts equal to 0.75% per annum of its average daily net assets attributable to Class C shares for providing ongoing distribution services and facilities to the Fund. For the six months ended April 30, 2024, the Fund paid or accrued to EVD $74,594 for Class C shares.
Pursuant to the Class C Plan, the Fund also makes payments of service fees to EVD, financial intermediaries and other persons in amounts equal to 0.25% per annum of its average daily net assets attributable to that class. Service fees paid or accrued are for personal services and/or the maintenance of shareholder accounts. They are separate and distinct from the sales commissions and distribution fees payable to EVD. Service fees paid or accrued for the six months ended April 30, 2024 amounted to $24,865 for Class C shares.
Distribution and service fees are subject to the limitations contained in the Financial Industry Regulatory Authority Rule 2341(d).
5 Contingent Deferred Sales Charges
A contingent deferred sales charge (CDSC) of 1% generally is imposed on redemptions of Class C shares made within 12 months of purchase. Class A shares may be subject to a 0.75% CDSC if redeemed within 12 months of purchase (depending on the circumstances of purchase). Generally, the CDSC is based upon the lower of the net asset value at date of redemption or date of purchase. No charge is levied on shares acquired by reinvestment of dividends or capital gain distributions. For the six months ended April 30, 2024, the Fund was informed that EVD received less than $100 and $3,169 of CDSCs paid by Class A and Class C shareholders, respectively.
6 Investment Transactions
For the six months ended April 30, 2024, increases and decreases in the Fund's investment in the Portfolio aggregated $153,330,428 and $77,424,282, respectively.
7 Shares of Beneficial Interest
The Fund’s Declaration of Trust permits the Trustees to issue an unlimited number of full and fractional shares of beneficial interest (without par value). Such shares may be issued in a number of different series (such as the Fund) and classes. Transactions in Fund shares, including direct exchanges pursuant to share class conversions, were as follows:
| | Six Months Ended
April 30, 2024
(Unaudited) | | Year Ended
October 31, 2023(1) |
| | Shares | Amount | | Shares | Amount |
| Class A | | | | | |
| Sales | 11,921,758 | $ 48,860,365 | | 25,909,705 | $ 104,607,632 |
| Issued to shareholders electing to receive payments of distributions in Fund shares | 1,484,606 | 6,149,202 | | 2,452,890 | 9,865,718 |
| Redemptions | (11,902,257) | (49,084,252) | | (22,445,803) | (90,460,823) |
| Net increase | 1,504,107 | $ 5,925,315 | | 5,916,792 | $ 24,012,527 |
| Class C | | | | | |
| Sales | 654,833 | $ 2,700,059 | | 1,473,897 | $ 5,930,345 |
| Issued to shareholders electing to receive payments of distributions in Fund shares | 125,311 | 519,570 | | 273,882 | 1,104,020 |
| Redemptions | (1,266,508) | (5,236,408) | | (2,784,572) | (11,184,045) |
| Net decrease | (486,364) | $ (2,016,779) | | (1,036,793) | $ (4,149,680) |
Eaton Vance
High Income Opportunities Fund
April 30, 2024
Notes to Financial Statements (Unaudited) — continued
| | Six Months Ended
April 30, 2024
(Unaudited) | | Year Ended
October 31, 2023(1) |
| | Shares | Amount | | Shares | Amount |
| Class I | | | | | |
| Sales | 48,474,378 | $ 201,046,381 | | 96,969,296 | $ 390,540,736 |
| Issued to shareholders electing to receive payments of distributions in Fund shares | 4,832,932 | 20,040,450 | | 7,887,486 | 31,778,945 |
| Redemptions | (30,234,538) | (124,315,921) | | (68,760,238) | (276,796,110) |
| Net increase | 23,072,772 | $ 96,770,910 | | 36,096,544 | $ 145,523,571 |
| Class R6 | | | | | |
| Sales | 236,135 | $ 967,934 | | 14,194 | $ 57,225 |
| Issued to shareholders electing to receive payments of distributions in Fund shares | 5,338 | 22,200 | | 272 | 1,092 |
| Redemptions | (42,226) | (174,467) | | (1) | (3) |
| Net increase | 199,247 | $ 815,667 | | 14,465 | $ 58,314 |
| (1) | For Class R6, for the period from the commencement of operations, June 30, 2023, to October 31, 2023. |
High Income Opportunities Portfolio
April 30, 2024
Portfolio of Investments (Unaudited)
| Asset-Backed Securities — 1.9% |
| Security | Principal
Amount
(000's omitted) | Value |
| ARES LVIII CLO Ltd., Series 2020-58A, Class ER, 12.029%, (3 mo. SOFR + 6.70%), 1/15/35(1)(2) | $ | 2,000 | $ 1,998,180 |
| Atlas Senior Loan Fund XX Ltd., Series 2022-20A, Class B1, 8.477%, (3 mo. SOFR + 3.15%), 10/19/35(1)(2) | | 2,500 | 2,520,490 |
| Benefit Street Partners CLO XVII Ltd., Series 2019-17A, Class ER, 11.94%, (3 mo. SOFR + 6.612%), 7/15/32(1)(2) | | 1,000 | 1,004,526 |
| Benefit Street Partners CLO XXV Ltd., Series 2021-25A, Class E, 12.44%, (3 mo. SOFR + 7.112%), 1/15/35(1)(2) | | 2,000 | 2,005,776 |
| Brookhaven Park CLO Ltd., Series 2024-1A, Class D, 8.894%, (3 mo. SOFR + 3.60%), 4/19/37(1)(2) | | 1,000 | 1,001,648 |
| Canyon Capital CLO Ltd., Series 2022-1A, Class E, 11.728%, (3 mo. SOFR + 6.40%), 4/15/35(1)(2) | | 2,000 | 1,952,754 |
| Carlyle U.S. CLO Ltd., Series 2019-4A, Class DR, 11.929%, (3 mo. SOFR + 6.60%), 4/15/35(1)(2) | | 2,000 | 1,979,860 |
| Golub Capital Partners CLO 50B-R Ltd., Series 2020-50A, Class ER, 12.425%, (3 mo. SOFR + 7.10%), 4/20/35(1)(2) | | 2,000 | 2,005,836 |
| Golub Capital Partners CLO 72 B Ltd., Series 2024-72A, Class D, 9.296%, (3 mo. SOFR + 4.00%), 4/25/37(1)(2) | | 1,000 | 1,001,379 |
| Madison Park Funding LIX Ltd., Series 2021-59A, Class E, 12.189%, (3 mo. SOFR + 6.862%), 1/18/34(1)(2) | | 2,000 | 2,006,342 |
| Madison Park Funding XXXVII Ltd., Series 2019-37A, Class ER2, 11.922%, (3 mo. SOFR + 6.60%), 4/15/37(1)(2) | | 1,000 | 1,005,528 |
| OCP CLO Ltd., Series 2024-32A, Class D1, 9.076%, (3 mo. SOFR + 3.75%), 4/23/37(1)(2) | | 1,500 | 1,502,348 |
| Palmer Square CLO Ltd., Series 2018-1A, Class CR, 9.224%, (3 mo. SOFR + 3.90%), 4/18/37(1)(2) | | 1,500 | 1,503,208 |
| Wellfleet CLO Ltd.: | | | |
| Series 2021-2A, Class E, 12.55%, (3 mo. SOFR + 7.222%), 7/15/34(1)(2) | | 2,000 | 1,842,712 |
| Series 2021-3A, Class E, 12.69%, (3 mo. SOFR + 7.362%), 1/15/35(1)(2) | | 2,000 | 1,892,430 |
Total Asset-Backed Securities
(identified cost $25,418,919) | | | $ 25,223,017 |
| Security | Shares | Value |
| Energy — 0.1% |
| Ascent CNR Corp., Class A(3)(4) | | 6,273,462 | $ 1,380,162 |
| | | | $ 1,380,162 |
| Security | Shares | Value |
| Entertainment & Film — 0.1% |
| United Parks & Resorts, Inc.(5) | | 27,500 | $ 1,397,550 |
| | | | $ 1,397,550 |
| Environmental — 0.2% |
| GFL Environmental, Inc. | | 105,500 | $ 3,365,450 |
| | | | $ 3,365,450 |
| Gaming — 0.0% |
| New Cotai Participation Corp., Class B(3)(4)(5) | | 7 | $ 0 |
| | | | $ 0 |
| Healthcare — 0.1% |
| Endo, Inc.(4)(5) | | 572 | $ 16,373 |
| Endo, Inc.(5) | | 38,022 | 1,088,376 |
| | | | $ 1,104,749 |
| Leisure — 0.0% |
| iFIT Health and Fitness, Inc.(3)(4)(5) | | 514,080 | $ 0 |
| | | | $ 0 |
Total Common Stocks
(identified cost $6,497,546) | | | $ 7,247,911 |
| Security | Principal
Amount
(000's omitted) | Value |
| Containers — 0.3% |
| CryoPort, Inc., 0.75%, 12/1/26(1) | $ | 4,643 | $ 4,026,410 |
| | | | $ 4,026,410 |
| Gaming — 0.2% |
| DraftKings Holdings, Inc., 0.00%, 3/15/28 | $ | 3,900 | $ 3,246,750 |
| | | | $ 3,246,750 |
| Leisure — 0.2% |
| Peloton Interactive, Inc., 0.00%, 2/15/26 | $ | 2,611 | $ 2,144,307 |
| | | | $ 2,144,307 |
High Income Opportunities Portfolio
April 30, 2024
Portfolio of Investments (Unaudited) — continued
| Security | Principal
Amount
(000's omitted) | Value |
| Utility — 0.3% |
| NextEra Energy Partners LP, 2.50%, 6/15/26(1) | $ | 4,996 | $ 4,507,466 |
| | | | $ 4,507,466 |
Total Convertible Bonds
(identified cost $14,294,754) | | | $ 13,924,933 |
| Security | Principal
Amount*
(000's omitted) | Value |
| Aerospace — 2.5% |
| Bombardier, Inc.: | | | |
| 7.25%, 7/1/31(1) | | 1,980 | $ 1,987,348 |
| 7.875%, 4/15/27(1) | | 1,123 | 1,116,703 |
| 8.75%, 11/15/30(1) | | 2,575 | 2,742,730 |
| BWX Technologies, Inc.: | | | |
| 4.125%, 6/30/28(1) | | 1,501 | 1,372,776 |
| 4.125%, 4/15/29(1) | | 1,266 | 1,154,689 |
| Moog, Inc., 4.25%, 12/15/27(1) | | 2,796 | 2,612,877 |
| Rolls-Royce PLC, 5.75%, 10/15/27(1) | | 5,391 | 5,337,041 |
| Science Applications International Corp., 4.875%, 4/1/28(1) | | 4,042 | 3,819,345 |
| Spirit AeroSystems, Inc.: | | | |
| 4.60%, 6/15/28 | | 1,081 | 997,226 |
| 9.375%, 11/30/29(1) | | 403 | 436,357 |
| TransDigm, Inc.: | | | |
| 4.625%, 1/15/29 | | 1,677 | 1,537,901 |
| 5.50%, 11/15/27 | | 4,164 | 4,050,155 |
| 6.375%, 3/1/29(1) | | 1,490 | 1,480,484 |
| 6.625%, 3/1/32(1) | | 1,500 | 1,499,325 |
| 6.75%, 8/15/28(1) | | 3,504 | 3,523,269 |
| | | | $ 33,668,226 |
| Air Transportation — 0.5% |
| American Airlines, Inc./AAdvantage Loyalty IP Ltd., 5.50%, 4/20/26(1) | | 1,853 | $ 1,833,538 |
| United Airlines, Inc., 4.375%, 4/15/26(1) | | 1,156 | 1,113,002 |
| VistaJet Malta Finance PLC/Vista Management Holding, Inc., 6.375%, 2/1/30(1) | | 5,300 | 4,108,737 |
| | | | $ 7,055,277 |
| Automotive & Auto Parts — 2.6% |
| Dana Financing Luxembourg SARL, 8.50%, 7/15/31(6) | EUR | 2,500 | $ 2,915,779 |
| Security | Principal
Amount*
(000's omitted) | Value |
| Automotive & Auto Parts (continued) |
| Ford Motor Co.: | | | |
| 4.75%, 1/15/43 | | 2,651 | $ 2,088,494 |
| 7.45%, 7/16/31 | | 794 | 841,747 |
| 9.625%, 4/22/30 | | 350 | 402,251 |
| Ford Motor Credit Co. LLC: | | | |
| 2.90%, 2/16/28 | | 568 | 505,497 |
| 3.625%, 6/17/31 | | 2,065 | 1,744,741 |
| 3.815%, 11/2/27 | | 4,294 | 3,979,805 |
| 4.00%, 11/13/30 | | 1,461 | 1,273,875 |
| 4.125%, 8/17/27 | | 6,184 | 5,809,976 |
| 4.271%, 1/9/27 | | 752 | 717,181 |
| Goodyear Tire & Rubber Co., 5.00%, 7/15/29 | | 3,271 | 2,969,972 |
| Real Hero Merger Sub 2, Inc., 6.25%, 2/1/29(1) | | 4,535 | 3,890,224 |
| Wand NewCo 3, Inc., 7.625%, 1/30/32(1) | | 6,491 | 6,604,238 |
| Wheel Pros, Inc., 6.50%, 5/15/29(1) | | 2,705 | 841,931 |
| | | | $ 34,585,711 |
| Banking & Thrifts — 0.2% |
| JPMorgan Chase & Co., Series HH, 4.60% to 2/1/25(7)(8) | | 2,385 | $ 2,351,974 |
| | | | $ 2,351,974 |
| Broadcasting — 0.7% |
| Playtika Holding Corp., 4.25%, 3/15/29(1) | | 3,549 | $ 3,057,030 |
| Townsquare Media, Inc., 6.875%, 2/1/26(1) | | 2,659 | 2,582,942 |
| Univision Communications, Inc.: | | | |
| 4.50%, 5/1/29(1) | | 1,183 | 1,030,164 |
| 7.375%, 6/30/30(1) | | 1,089 | 1,043,628 |
| 8.00%, 8/15/28(1) | | 1,066 | 1,065,724 |
| | | | $ 8,779,488 |
| Building Materials — 2.6% |
| AmeriTex HoldCo Intermediate LLC, 10.25%, 10/15/28(1) | | 3,920 | $ 4,134,154 |
| Builders FirstSource, Inc.: | | | |
| 4.25%, 2/1/32(1) | | 4,805 | 4,189,156 |
| 5.00%, 3/1/30(1) | | 2,685 | 2,516,400 |
| CP Atlas Buyer, Inc., 7.00%, 12/1/28(1) | | 4,887 | 4,408,394 |
| MIWD Holdco II LLC/MIWD Finance Corp., 5.50%, 2/1/30(1) | | 1,774 | 1,608,444 |
| Smyrna Ready Mix Concrete LLC, 6.00%, 11/1/28(1) | | 6,410 | 6,206,769 |
| Standard Industries, Inc.: | | | |
| 2.25%, 11/21/26(6) | EUR | 2,443 | 2,474,012 |
| 3.375%, 1/15/31(1) | | 2,618 | 2,146,898 |
| 4.375%, 7/15/30(1) | | 2,932 | 2,599,122 |
High Income Opportunities Portfolio
April 30, 2024
Portfolio of Investments (Unaudited) — continued
| Security | Principal
Amount*
(000's omitted) | Value |
| Building Materials (continued) |
| Summit Materials LLC/Summit Materials Finance Corp., 7.25%, 1/15/31(1) | | 4,473 | $ 4,598,508 |
| | | | $ 34,881,857 |
| Cable & Satellite TV — 1.7% |
| CCO Holdings LLC/CCO Holdings Capital Corp.: | | | |
| 4.25%, 2/1/31(1) | | 500 | $ 391,694 |
| 4.50%, 8/15/30(1) | | 8,031 | 6,532,346 |
| 4.50%, 5/1/32 | | 995 | 764,883 |
| 4.75%, 3/1/30(1) | | 4,255 | 3,539,098 |
| 5.00%, 2/1/28(1) | | 1,895 | 1,727,406 |
| 5.375%, 6/1/29(1) | | 868 | 765,158 |
| 6.375%, 9/1/29(1) | | 3,715 | 3,408,053 |
| CSC Holdings LLC, 11.75%, 1/31/29(1) | | 4,339 | 3,857,588 |
| DISH Network Corp., 11.75%, 11/15/27(1) | | 2,454 | 2,475,833 |
| | | | $ 23,462,059 |
| Capital Goods — 2.4% |
| Calderys Financing LLC, 11.25%, 6/1/28(1) | | 5,117 | $ 5,439,514 |
| Chart Industries, Inc., 9.50%, 1/1/31(1) | | 4,318 | 4,639,881 |
| Dornoch Debt Merger Sub, Inc., 6.625%, 10/15/29(1) | | 3,505 | 2,899,087 |
| EMRLD Borrower LP/Emerald Co-Issuer, Inc., 6.625%, 12/15/30(1) | | 4,336 | 4,302,567 |
| ESAB Corp., 6.25%, 4/15/29(1) | | 2,598 | 2,591,499 |
| Husky Injection Molding Systems Ltd./Titan Co-Borrower LLC, 9.00%, 2/15/29(1) | | 1,290 | 1,329,465 |
| Madison IAQ LLC, 5.875%, 6/30/29(1) | | 6,151 | 5,711,630 |
| Patrick Industries, Inc.: | | | |
| 4.75%, 5/1/29(1) | | 5,212 | 4,743,556 |
| 7.50%, 10/15/27(1) | | 415 | 420,362 |
| | | | $ 32,077,561 |
| Chemicals — 2.5% |
| Avient Corp., 7.125%, 8/1/30(1) | | 3,831 | $ 3,879,533 |
| Compass Minerals International, Inc., 6.75%, 12/1/27(1) | | 4,248 | 3,988,611 |
| Herens Holdco SARL, 4.75%, 5/15/28(1) | | 2,171 | 1,876,484 |
| Herens Midco SARL, 5.25%, 5/15/29(6) | EUR | 4,145 | 3,176,726 |
| NOVA Chemicals Corp., 4.25%, 5/15/29(1) | | 144 | 120,672 |
| Nufarm Australia Ltd./Nufarm Americas, Inc., 5.00%, 1/27/30(1) | | 3,643 | 3,343,424 |
| Olympus Water U.S. Holding Corp., 9.75%, 11/15/28(1) | | 7,592 | 8,065,502 |
| SNF Group SACA: | | | |
| 2.625%, 2/1/29(6) | EUR | 2,960 | 2,949,775 |
| Security | Principal
Amount*
(000's omitted) | Value |
| Chemicals (continued) |
| SNF Group SACA: (continued) | | | |
| 2.625%, 2/1/29(1) | EUR | 250 | $ 249,136 |
| Valvoline, Inc., 3.625%, 6/15/31(1) | | 3,976 | 3,348,162 |
| WR Grace Holdings LLC: | | | |
| 4.875%, 6/15/27(1) | | 979 | 930,418 |
| 7.375%, 3/1/31(1) | | 2,211 | 2,243,258 |
| | | | $ 34,171,701 |
| Consumer Products — 1.7% |
| Acushnet Co., 7.375%, 10/15/28(1) | | 6,279 | $ 6,452,269 |
| Edgewell Personal Care Co., 4.125%, 4/1/29(1) | | 2,936 | 2,656,981 |
| Energizer Gamma Acquisition BV, 3.50%, 6/30/29(6) | EUR | 1,221 | 1,166,788 |
| Kronos Acquisition Holdings, Inc./KIK Custom Products, Inc., 7.00%, 12/31/27(1) | | 5,015 | 4,856,049 |
| Spectrum Brands, Inc., 3.875%, 3/15/31(1) | | 2,321 | 2,174,046 |
| Tempur Sealy International, Inc.: | | | |
| 3.875%, 10/15/31(1) | | 6,209 | 5,117,955 |
| 4.00%, 4/15/29(1) | | 805 | 716,516 |
| | | | $ 23,140,604 |
| Containers — 1.8% |
| Ardagh Metal Packaging Finance USA LLC/Ardagh Metal Packaging Finance PLC: | | | |
| 3.00%, 9/1/29(6) | EUR | 1,150 | $ 989,865 |
| 4.00%, 9/1/29(1) | | 230 | 189,805 |
| Ball Corp.: | | | |
| 3.125%, 9/15/31 | | 3,800 | 3,160,481 |
| 6.875%, 3/15/28 | | 1,239 | 1,259,739 |
| Berry Global, Inc., 5.625%, 7/15/27(1) | | 2,026 | 1,978,007 |
| Canpack SA/Canpack U.S. LLC, 3.875%, 11/15/29(1) | | 3,826 | 3,356,687 |
| Crown Americas LLC/Crown Americas Capital Corp. V, 4.25%, 9/30/26 | | 2,415 | 2,316,042 |
| Crown Americas LLC/Crown Americas Capital Corp. VI, 4.75%, 2/1/26 | | 2,500 | 2,448,815 |
| Owens-Brockway Glass Container, Inc., 7.25%, 5/15/31(1) | | 4,163 | 4,174,573 |
| Trivium Packaging Finance BV: | | | |
| 5.50%, 8/15/26(1) | | 2,613 | 2,570,529 |
| 8.50%, 8/15/27(1) | | 1,500 | 1,486,999 |
| | | | $ 23,931,542 |
| Diversified Financial Services — 3.1% |
| AG TTMT Escrow Issuer LLC, 8.625%, 9/30/27(1) | | 3,037 | $ 3,131,390 |
| Ally Financial, Inc., Series B, 4.70% to 5/15/26(7)(8) | | 3,182 | 2,711,210 |
| Boost Newco Borrower LLC, 7.50%, 1/15/31(1) | | 4,384 | 4,527,848 |
High Income Opportunities Portfolio
April 30, 2024
Portfolio of Investments (Unaudited) — continued
| Security | Principal
Amount*
(000's omitted) | Value |
| Diversified Financial Services (continued) |
| Cargo Aircraft Management, Inc., 4.75%, 2/1/28(1) | | 3,714 | $ 3,357,964 |
| Compass Group Diversified Holdings LLC, 5.25%, 4/15/29(1) | | 5,221 | 4,885,761 |
| Jane Street Group/JSG Finance, Inc., 4.50%, 11/15/29(1) | | 3,591 | 3,269,100 |
| Jefferson Capital Holdings LLC, 6.00%, 8/15/26(1) | | 3,065 | 3,015,839 |
| Macquarie Airfinance Holdings Ltd.: | | | |
| 6.40%, 3/26/29(1) | | 1,095 | 1,092,934 |
| 6.50%, 3/26/31(1) | | 1,325 | 1,327,222 |
| 8.125%, 3/30/29(1) | | 3,609 | 3,777,825 |
| MSCI, Inc.: | | | |
| 3.625%, 9/1/30(1) | | 867 | 755,496 |
| 3.875%, 2/15/31(1) | | 2,176 | 1,906,358 |
| PRA Group, Inc., 7.375%, 9/1/25(1) | | 645 | 642,588 |
| Rocket Mortgage LLC/Rocket Mortgage Co-Issuer, Inc.: | | | |
| 2.875%, 10/15/26(1) | | 2,036 | 1,871,038 |
| 3.625%, 3/1/29(1) | | 5,288 | 4,663,705 |
| 4.00%, 10/15/33(1) | | 425 | 347,359 |
| | | | $ 41,283,637 |
| Diversified Media — 1.4% |
| Arches Buyer, Inc.: | | | |
| 4.25%, 6/1/28(1) | | 1,901 | $ 1,631,908 |
| 6.125%, 12/1/28(1) | | 4,809 | 3,915,823 |
| Cars.com, Inc., 6.375%, 11/1/28(1) | | 3,521 | 3,368,965 |
| Clear Channel Outdoor Holdings, Inc.: | | | |
| 7.75%, 4/15/28(1) | | 4,167 | 3,536,738 |
| 7.875%, 4/1/30(1) | | 2,891 | 2,836,648 |
| Stagwell Global LLC, 5.625%, 8/15/29(1) | | 3,410 | 3,056,303 |
| | | | $ 18,346,385 |
| Energy — 8.0% |
| Aethon United BR LP/Aethon United Finance Corp., 8.25%, 2/15/26(1) | | 3,619 | $ 3,645,734 |
| Antero Midstream Partners LP/Antero Midstream Finance Corp.: | | | |
| 5.75%, 3/1/27(1) | | 3,242 | 3,185,695 |
| 7.875%, 5/15/26(1) | | 1,283 | 1,307,422 |
| Cheniere Energy Partners LP: | | | |
| 4.00%, 3/1/31 | | 2,552 | 2,278,994 |
| 4.50%, 10/1/29 | | 1,896 | 1,775,446 |
| Civitas Resources, Inc.: | | | |
| 8.625%, 11/1/30(1) | | 5,643 | 6,008,985 |
| 8.75%, 7/1/31(1) | | 738 | 783,750 |
| DT Midstream, Inc., 4.125%, 6/15/29(1) | | 4,231 | 3,838,210 |
| Security | Principal
Amount*
(000's omitted) | Value |
| Energy (continued) |
| Energy Transfer LP, 5.00%, 5/15/50 | | 2,087 | $ 1,731,072 |
| EQM Midstream Partners LP: | | | |
| 4.50%, 1/15/29(1) | | 2,111 | 1,955,015 |
| 4.75%, 1/15/31(1) | | 2,377 | 2,173,845 |
| 6.00%, 7/1/25(1) | | 410 | 409,662 |
| 6.50%, 7/1/27(1) | | 1,121 | 1,123,460 |
| 7.50%, 6/1/30(1) | | 3,031 | 3,180,628 |
| Global Partners LP/GLP Finance Corp., 8.25%, 1/15/32(1) | | 3,778 | 3,873,180 |
| Kinetik Holdings LP, 5.875%, 6/15/30(1) | | 5,259 | 5,088,841 |
| Matador Resources Co., 6.50%, 4/15/32(1) | | 3,355 | 3,327,437 |
| Nabors Industries Ltd., 7.50%, 1/15/28(1) | | 1,118 | 1,061,102 |
| Occidental Petroleum Corp., 8.50%, 7/15/27 | | 3,859 | 4,127,529 |
| Parkland Corp.: | | | |
| 4.50%, 10/1/29(1) | | 2,371 | 2,150,756 |
| 4.625%, 5/1/30(1) | | 2,389 | 2,160,881 |
| Permian Resources Operating LLC: | | | |
| 5.875%, 7/1/29(1) | | 4,933 | 4,797,954 |
| 7.00%, 1/15/32(1) | | 2,551 | 2,602,210 |
| 7.75%, 2/15/26(1) | | 1,675 | 1,691,539 |
| Plains All American Pipeline LP, Series B, 9.679%, (3 mo. SOFR + 4.372%)(2)(7) | | 4,380 | 4,352,394 |
| Precision Drilling Corp.: | | | |
| 6.875%, 1/15/29(1) | | 1,307 | 1,294,590 |
| 7.125%, 1/15/26(1) | | 1,000 | 1,000,778 |
| Southwestern Energy Co.: | | | |
| 4.75%, 2/1/32 | | 3,253 | 2,931,833 |
| 5.375%, 2/1/29(6) | | 2,500 | 1,962,734 |
| Sunoco LP, 7.25%, 5/1/32(1) | | 2,835 | 2,881,699 |
| Sunoco LP/Sunoco Finance Corp., 4.50%, 4/30/30 | | 2,670 | 2,404,688 |
| Superior Plus LP/Superior General Partner, Inc., 4.50%, 3/15/29(1) | | 2,921 | 2,644,769 |
| Transocean Poseidon Ltd., 6.875%, 2/1/27(1) | | 1,046 | 1,043,064 |
| Transocean, Inc., 8.75%, 2/15/30(1) | | 1,208 | 1,260,211 |
| Venture Global LNG, Inc.: | | | |
| 8.125%, 6/1/28(1) | | 2,233 | 2,285,080 |
| 8.375%, 6/1/31(1) | | 3,572 | 3,667,988 |
| 9.50%, 2/1/29(1) | | 4,583 | 4,928,957 |
| 9.875%, 2/1/32(1) | | 3,217 | 3,434,894 |
| Vital Energy, Inc.: | | | |
| 7.875%, 4/15/32(1) | | 1,956 | 1,986,063 |
| 9.75%, 10/15/30 | | 2,151 | 2,345,485 |
| Weatherford International Ltd., 8.625%, 4/30/30(1) | | 2,338 | 2,429,499 |
| | | | $ 107,134,073 |
High Income Opportunities Portfolio
April 30, 2024
Portfolio of Investments (Unaudited) — continued
| Security | Principal
Amount*
(000's omitted) | Value |
| Entertainment & Film — 0.3% |
| Cinemark USA, Inc.: | | | |
| 5.25%, 7/15/28(1) | | 4,366 | $ 4,058,766 |
| 5.875%, 3/15/26(1) | | 588 | 582,493 |
| | | | $ 4,641,259 |
| Environmental — 1.6% |
| Clean Harbors, Inc.: | | | |
| 4.875%, 7/15/27(1) | | 1,029 | $ 992,090 |
| 5.125%, 7/15/29(1) | | 1,117 | 1,065,424 |
| 6.375%, 2/1/31(1) | | 585 | 580,111 |
| Covanta Holding Corp.: | | | |
| 4.875%, 12/1/29(1) | | 5,939 | 5,212,218 |
| 5.00%, 9/1/30 | | 804 | 695,510 |
| GFL Environmental, Inc.: | | | |
| 3.50%, 9/1/28(1) | | 5,074 | 4,566,536 |
| 3.75%, 8/1/25(1) | | 669 | 651,270 |
| 4.75%, 6/15/29(1) | | 8,593 | 7,936,709 |
| | | | $ 21,699,868 |
| Food & Drug Retail — 0.5% |
| Albertsons Cos., Inc./Safeway, Inc./New Albertsons LP/Albertsons LLC: | | | |
| 4.875%, 2/15/30(1) | | 1,808 | $ 1,687,722 |
| 5.875%, 2/15/28(1) | | 1,807 | 1,772,329 |
| Ingles Markets, Inc., 4.00%, 6/15/31(1) | | 4,305 | 3,709,716 |
| | | | $ 7,169,767 |
| Food, Beverage & Tobacco — 2.7% |
| BellRing Brands, Inc., 7.00%, 3/15/30(1) | | 3,553 | $ 3,598,701 |
| Chobani LLC/Chobani Finance Corp., Inc.: | | | |
| 4.625%, 11/15/28(1) | | 1,650 | 1,529,012 |
| 7.625%, 7/1/29(1) | | 3,835 | 3,880,353 |
| Darling Ingredients, Inc., 6.00%, 6/15/30(1) | | 3,685 | 3,582,066 |
| Fiesta Purchaser, Inc., 7.875%, 3/1/31(1) | | 3,692 | 3,764,969 |
| Performance Food Group, Inc.: | | | |
| 4.25%, 8/1/29(1) | | 5,135 | 4,606,293 |
| 5.50%, 10/15/27(1) | | 1,504 | 1,457,232 |
| Pilgrim's Pride Corp.: | | | |
| 3.50%, 3/1/32 | | 3,553 | 2,928,388 |
| 6.875%, 5/15/34 | | 1,755 | 1,821,390 |
| Post Holdings, Inc., 6.25%, 2/15/32(1) | | 2,626 | 2,594,219 |
| Triton Water Holdings, Inc., 6.25%, 4/1/29(1) | | 3,778 | 3,391,620 |
| U.S. Foods, Inc., 4.75%, 2/15/29(1) | | 3,511 | 3,274,834 |
| | | | $ 36,429,077 |
| Security | Principal
Amount*
(000's omitted) | Value |
| Gaming — 2.4% |
| Allwyn Entertainment Financing U.K. PLC, 7.875%, 4/30/29(1) | | 5,839 | $ 5,977,618 |
| Caesars Entertainment, Inc.: | | | |
| 4.625%, 10/15/29(1) | | 784 | 700,082 |
| 6.50%, 2/15/32(1) | | 2,354 | 2,320,875 |
| 7.00%, 2/15/30(1) | | 2,735 | 2,755,918 |
| 8.125%, 7/1/27(1) | | 2,617 | 2,654,195 |
| Churchill Downs, Inc., 5.75%, 4/1/30(1) | | 4,102 | 3,906,135 |
| International Game Technology PLC: | | | |
| 4.125%, 4/15/26(1) | | 1,237 | 1,192,096 |
| 5.25%, 1/15/29(1) | | 750 | 708,977 |
| 6.25%, 1/15/27(1) | | 1,848 | 1,846,571 |
| 6.50%, 2/15/25(1) | | 1,009 | 1,009,791 |
| Jacobs Entertainment, Inc., 6.75%, 2/15/29(1) | | 3,759 | 3,571,665 |
| Light & Wonder International, Inc., 7.00%, 5/15/28(1) | | 2,834 | 2,845,908 |
| Raptor Acquisition Corp./Raptor Co.-Issuer LLC, 4.875%, 11/1/26(1) | | 3,500 | 3,330,350 |
| | | | $ 32,820,181 |
| Healthcare — 8.9% |
| AHP Health Partners, Inc., 5.75%, 7/15/29(1) | | 3,547 | $ 3,253,355 |
| AMN Healthcare, Inc.: | | | |
| 4.00%, 4/15/29(1) | | 2,663 | 2,362,145 |
| 4.625%, 10/1/27(1) | | 323 | 303,745 |
| athenahealth Group, Inc., 6.50%, 2/15/30(1) | | 5,761 | 5,191,681 |
| Avantor Funding, Inc., 3.875%, 7/15/28(6) | EUR | 4,400 | 4,577,070 |
| Bausch & Lomb Corp., 8.375%, 10/1/28(1) | | 2,780 | 2,874,520 |
| Encompass Health Corp.: | | | |
| 4.625%, 4/1/31 | | 2,543 | 2,285,873 |
| 4.75%, 2/1/30 | | 1,044 | 958,519 |
| Endo Finance Holdings, Inc., 8.50%, 4/15/31(1) | | 2,250 | 2,288,964 |
| Fortrea Holdings, Inc., 7.50%, 7/1/30(1) | | 5,112 | 5,162,984 |
| Grifols SA, 4.75%, 10/15/28(1) | | 1,050 | 849,234 |
| HealthEquity, Inc., 4.50%, 10/1/29(1) | | 5,380 | 4,906,960 |
| Heartland Dental LLC/Heartland Dental Finance Corp.: | | | |
| 8.50%, 5/1/26(1) | | 750 | 748,043 |
| 10.50%, 4/30/28(1) | | 7,200 | 7,587,803 |
| IQVIA, Inc.: | | | |
| 2.25%, 3/15/29(6) | EUR | 1,816 | 1,760,260 |
| 5.00%, 5/15/27(1) | | 1,329 | 1,284,300 |
| 6.50%, 5/15/30(1) | | 1,662 | 1,671,618 |
| Jazz Securities DAC, 4.375%, 1/15/29(1) | | 1,910 | 1,739,614 |
| Legacy LifePoint Health LLC, 4.375%, 2/15/27(1) | | 2,687 | 2,519,040 |
High Income Opportunities Portfolio
April 30, 2024
Portfolio of Investments (Unaudited) — continued
| Security | Principal
Amount*
(000's omitted) | Value |
| Healthcare (continued) |
| LifePoint Health, Inc.: | | | |
| 5.375%, 1/15/29(1) | | 4,397 | $ 3,520,017 |
| 9.875%, 8/15/30(1) | | 1,665 | 1,735,843 |
| Medline Borrower LP, 5.25%, 10/1/29(1) | | 12,177 | 11,346,941 |
| ModivCare Escrow Issuer, Inc., 5.00%, 10/1/29(1) | | 1,664 | 1,157,616 |
| ModivCare, Inc., 5.875%, 11/15/25(1) | | 2,104 | 2,054,254 |
| Molina Healthcare, Inc.: | | | |
| 3.875%, 11/15/30(1) | | 2,889 | 2,508,453 |
| 3.875%, 5/15/32(1) | | 2,207 | 1,848,576 |
| Option Care Health, Inc., 4.375%, 10/31/29(1) | | 4,735 | 4,244,832 |
| P&L Development LLC/PLD Finance Corp., 7.75%, 11/15/25(1) | | 2,307 | 1,956,117 |
| Perrigo Finance Unlimited Co.: | | | |
| 4.65%, 6/15/30 | | 4,350 | 3,989,896 |
| 4.90%, 12/15/44 | | 1,242 | 979,684 |
| Prestige Brands, Inc., 3.75%, 4/1/31(1) | | 1,395 | 1,188,071 |
| RegionalCare Hospital Partners Holdings, Inc./LifePoint Health, Inc., 9.75%, 12/1/26(1) | | 1,328 | 1,323,591 |
| Surgery Center Holdings, Inc., 7.25%, 4/15/32(1) | | 4,004 | 4,003,538 |
| Team Health Holdings, Inc., 6.375%, 2/1/25(1) | | 5,462 | 5,084,794 |
| Tenet Healthcare Corp.: | | | |
| 4.375%, 1/15/30 | | 272 | 247,230 |
| 5.125%, 11/1/27 | | 2,855 | 2,764,610 |
| 6.125%, 10/1/28 | | 4,735 | 4,679,994 |
| 6.875%, 11/15/31 | | 2,033 | 2,097,206 |
| U.S. Acute Care Solutions LLC: | | | |
| 6.375%, 3/1/26(1) | | 4,919 | 4,985,480 |
| 9.75%, 5/15/29(1)(9) | | 3,025 | 2,970,200 |
| Varex Imaging Corp., 7.875%, 10/15/27(1) | | 2,511 | 2,561,987 |
| | | | $ 119,574,658 |
| Homebuilders & Real Estate — 4.7% |
| Artera Services LLC, 8.50%, 2/15/31(1) | | 3,065 | $ 3,138,664 |
| Ashton Woods USA LLC/Ashton Woods Finance Co.: | | | |
| 4.625%, 8/1/29(1) | | 1,516 | 1,372,658 |
| 4.625%, 4/1/30(1) | | 1,620 | 1,449,315 |
| Brundage-Bone Concrete Pumping Holdings, Inc., 6.00%, 2/1/26(1) | | 1,227 | 1,208,885 |
| CTR Partnership LP/CareTrust Capital Corp., 3.875%, 6/30/28(1) | | 3,770 | 3,416,325 |
| Cushman & Wakefield U.S. Borrower LLC: | | | |
| 6.75%, 5/15/28(1) | | 1,049 | 1,035,191 |
| 8.875%, 9/1/31(1) | | 1,873 | 1,944,891 |
| Dycom Industries, Inc., 4.50%, 4/15/29(1) | | 1,923 | 1,776,233 |
| GEO Group, Inc., 10.25%, 4/15/31(1) | | 6,000 | 6,189,752 |
| Security | Principal
Amount*
(000's omitted) | Value |
| Homebuilders & Real Estate (continued) |
| Greystar Real Estate Partners LLC, 7.75%, 9/1/30(1) | | 5,638 | $ 5,812,818 |
| HAT Holdings I LLC/HAT Holdings II LLC: | | | |
| 3.375%, 6/15/26(1) | | 2,442 | 2,272,350 |
| 3.75%, 9/15/30(1) | | 3,492 | 2,901,055 |
| M/I Homes, Inc., 4.95%, 2/1/28 | | 1,537 | 1,457,369 |
| Meritage Homes Corp., 3.875%, 4/15/29(1) | | 2,282 | 2,070,936 |
| National Health Investors, Inc., 3.00%, 2/1/31 | | 3,117 | 2,498,463 |
| New Home Co., Inc., 9.25%, 10/1/29(1) | | 9,125 | 9,162,230 |
| Outfront Media Capital LLC/Outfront Media Capital Corp.: | | | |
| 4.25%, 1/15/29(1) | | 1,850 | 1,648,522 |
| 4.625%, 3/15/30(1) | | 1,687 | 1,490,730 |
| 7.375%, 2/15/31(1) | | 4,404 | 4,523,287 |
| TopBuild Corp., 4.125%, 2/15/32(1) | | 2,753 | 2,385,988 |
| VICI Properties LP/VICI Note Co., Inc.: | | | |
| 3.75%, 2/15/27(1) | | 543 | 509,688 |
| 4.125%, 8/15/30(1) | | 1,859 | 1,658,158 |
| 4.625%, 12/1/29(1) | | 4,004 | 3,717,257 |
| | | | $ 63,640,765 |
| Hotels — 0.2% |
| Resorts World Las Vegas LLC/RWLV Capital, Inc.: | | | |
| 4.625%, 4/16/29(6) | | 500 | $ 444,140 |
| 4.625%, 4/6/31(6) | | 1,000 | 849,145 |
| 8.45%, 7/27/30(1) | | 1,900 | 1,991,873 |
| | | | $ 3,285,158 |
| Insurance — 1.8% |
| Alliant Holdings Intermediate LLC/Alliant Holdings Co-Issuer: | | | |
| 6.75%, 10/15/27(1) | | 5,518 | $ 5,415,604 |
| 7.00%, 1/15/31(1) | | 1,797 | 1,803,886 |
| AmWINS Group, Inc., 4.875%, 6/30/29(1) | | 2,866 | 2,607,977 |
| BroadStreet Partners, Inc., 5.875%, 4/15/29(1) | | 2,175 | 1,984,179 |
| Howden U.K. Refinance PLC/Howden U.K. Refinance 2 PLC/Howden U.S. Refinance LLC: | | | |
| 7.25%, 2/15/31(1) | | 2,375 | 2,346,461 |
| 8.125%, 2/15/32(1) | | 2,231 | 2,197,522 |
| Jones Deslauriers Insurance Management, Inc., 10.50%, 12/15/30(1) | | 4,557 | 4,827,950 |
| Panther Escrow Issuer LLC, 7.125%, 6/1/31(1) | | 2,605 | 2,620,177 |
| | | | $ 23,803,756 |
| Leisure — 3.1% |
| Boyne USA, Inc., 4.75%, 5/15/29(1) | | 3,280 | $ 2,986,735 |
High Income Opportunities Portfolio
April 30, 2024
Portfolio of Investments (Unaudited) — continued
| Security | Principal
Amount*
(000's omitted) | Value |
| Leisure (continued) |
| Carnival Corp.: | | | |
| 5.75%, 3/1/27(1) | | 4,215 | $ 4,116,543 |
| 6.00%, 5/1/29(1) | | 1,820 | 1,764,796 |
| Life Time, Inc.: | | | |
| 5.75%, 1/15/26(1) | | 1,452 | 1,437,285 |
| 8.00%, 4/15/26(1) | | 5,820 | 5,834,864 |
| Lindblad Expeditions Holdings, Inc., 9.00%, 5/15/28(1) | | 1,430 | 1,497,088 |
| Lindblad Expeditions LLC, 6.75%, 2/15/27(1) | | 764 | 757,481 |
| NCL Corp. Ltd.: | | | |
| 5.875%, 3/15/26(1) | | 3,134 | 3,072,983 |
| 5.875%, 2/15/27(1) | | 946 | 924,804 |
| 7.75%, 2/15/29(1) | | 1,792 | 1,831,797 |
| NCL Finance Ltd., 6.125%, 3/15/28(1) | | 3,432 | 3,351,498 |
| Royal Caribbean Cruises Ltd.: | | | |
| 3.70%, 3/15/28 | | 1,390 | 1,278,282 |
| 6.25%, 3/15/32(1) | | 2,668 | 2,631,895 |
| Speedway Motorsports LLC/Speedway Funding II, Inc., 4.875%, 11/1/27(1) | | 2,674 | 2,519,620 |
| Viking Cruises Ltd.: | | | |
| 5.875%, 9/15/27(1) | | 5,004 | 4,855,636 |
| 6.25%, 5/15/25(1) | | 1,820 | 1,815,520 |
| 7.00%, 2/15/29(1) | | 753 | 750,761 |
| Viking Ocean Cruises Ship VII Ltd., 5.625%, 2/15/29(1) | | 521 | 498,983 |
| | | | $ 41,926,571 |
| Metals & Mining — 2.4% |
| Arsenal AIC Parent LLC, 11.50%, 10/1/31(1) | | 7,180 | $ 8,003,826 |
| Eldorado Gold Corp., 6.25%, 9/1/29(1) | | 2,968 | 2,798,529 |
| First Quantum Minerals Ltd., 9.375%, 3/1/29(1) | | 2,395 | 2,477,448 |
| Freeport-McMoRan, Inc., 5.45%, 3/15/43 | | 2,400 | 2,202,294 |
| Hudbay Minerals, Inc.: | | | |
| 4.50%, 4/1/26(1) | | 3,109 | 3,010,258 |
| 6.125%, 4/1/29(1) | | 2,069 | 2,027,606 |
| New Gold, Inc., 7.50%, 7/15/27(1) | | 3,006 | 2,990,346 |
| Novelis Corp.: | | | |
| 3.25%, 11/15/26(1) | | 1,755 | 1,642,756 |
| 4.75%, 1/30/30(1) | | 3,948 | 3,616,253 |
| Roller Bearing Co. of America, Inc., 4.375%, 10/15/29(1) | | 3,847 | 3,481,590 |
| | | | $ 32,250,906 |
| Security | Principal
Amount*
(000's omitted) | Value |
| Paper — 0.1% |
| Enviva Partners LP/Enviva Partners Finance Corp., 6.50%, 1/15/26(1)(10) | | 4,583 | $ 1,999,609 |
| | | | $ 1,999,609 |
| Publishing & Printing — 0.5% |
| McGraw-Hill Education, Inc.: | | | |
| 5.75%, 8/1/28(1) | | 2,844 | $ 2,640,577 |
| 8.00%, 8/1/29(1) | | 4,116 | 3,784,366 |
| | | | $ 6,424,943 |
| Railroad — 0.3% |
| Watco Cos. LLC/Watco Finance Corp., 6.50%, 6/15/27(1) | | 4,400 | $ 4,349,303 |
| | | | $ 4,349,303 |
| Restaurant — 1.8% |
| 1011778 BC ULC/New Red Finance, Inc.: | | | |
| 3.875%, 1/15/28(1) | | 1,761 | $ 1,626,087 |
| 4.00%, 10/15/30(1) | | 5,316 | 4,587,941 |
| 5.75%, 4/15/25(1) | | 581 | 578,857 |
| Dave & Buster's, Inc., 7.625%, 11/1/25(1) | | 5,483 | 5,523,597 |
| IRB Holding Corp., 7.00%, 6/15/25(1) | | 2,978 | 2,974,196 |
| Raising Cane's Restaurants LLC, 9.375%, 5/1/29(1) | | 6,406 | 6,878,501 |
| Yum! Brands, Inc., 3.625%, 3/15/31 | | 3,102 | 2,682,895 |
| | | | $ 24,852,074 |
| Services — 6.6% |
| Adtalem Global Education, Inc., 5.50%, 3/1/28(1) | | 3,652 | $ 3,463,925 |
| Allied Universal Holdco LLC/Allied Universal Finance Corp.: | | | |
| 6.625%, 7/15/26(1) | | 718 | 716,831 |
| 9.75%, 7/15/27(1) | | 3,222 | 3,213,279 |
| Allied Universal Holdco LLC/Allied Universal Finance Corp./Atlas Luxco 4 SARL: | | | |
| 4.625%, 6/1/28(1) | | 1,961 | 1,761,189 |
| 4.625%, 6/1/28(1) | | 2,687 | 2,416,525 |
| APi Group DE, Inc., 4.75%, 10/15/29(1) | | 4,707 | 4,298,771 |
| BCPE Empire Holdings, Inc., 7.625%, 5/1/27(1) | | 5,163 | 5,029,878 |
| Clarivate Science Holdings Corp., 4.875%, 7/1/29(1) | | 3,878 | 3,535,736 |
| EquipmentShare.com, Inc., 8.625%, 5/15/32(1) | | 3,350 | 3,412,542 |
| Gartner, Inc.: | | | |
| 3.625%, 6/15/29(1) | | 605 | 541,910 |
| 3.75%, 10/1/30(1) | | 2,100 | 1,829,619 |
| 4.50%, 7/1/28(1) | | 1,449 | 1,363,926 |
High Income Opportunities Portfolio
April 30, 2024
Portfolio of Investments (Unaudited) — continued
| Security | Principal
Amount*
(000's omitted) | Value |
| Services (continued) |
| GEMS MENASA Cayman Ltd./GEMS Education Delaware LLC, 7.125%, 7/31/26(1) | | 5,546 | $ 5,516,096 |
| Hertz Corp.: | | | |
| 4.625%, 12/1/26(1) | | 372 | 288,521 |
| 5.00%, 12/1/29(1) | | 1,933 | 1,329,230 |
| Imola Merger Corp., 4.75%, 5/15/29(1) | | 7,106 | 6,549,037 |
| Korn Ferry, 4.625%, 12/15/27(1) | | 4,099 | 3,890,498 |
| Neptune Bidco U.S., Inc., 9.29%, 4/15/29(1) | | 2,666 | 2,518,905 |
| NESCO Holdings II, Inc., 5.50%, 4/15/29(1) | | 2,776 | 2,587,061 |
| Ritchie Bros Holdings, Inc.: | | | |
| 6.75%, 3/15/28(1) | | 2,405 | 2,430,741 |
| 7.75%, 3/15/31(1) | | 972 | 1,009,299 |
| SRS Distribution, Inc., 6.00%, 12/1/29(1) | | 1,481 | 1,502,640 |
| Summer BC Bidco B LLC, 5.50%, 10/31/26(1) | | 3,354 | 3,205,598 |
| VT Topco, Inc., 8.50%, 8/15/30(1) | | 5,167 | 5,352,201 |
| WASH Multifamily Acquisition, Inc., 5.75%, 4/15/26(1) | | 5,051 | 4,902,102 |
| WESCO Distribution, Inc.: | | | |
| 6.375%, 3/15/29(1) | | 2,007 | 1,996,261 |
| 6.625%, 3/15/32(1) | | 3,343 | 3,331,535 |
| 7.25%, 6/15/28(1) | | 1,743 | 1,772,237 |
| White Cap Buyer LLC, 6.875%, 10/15/28(1) | | 3,243 | 3,136,949 |
| White Cap Parent LLC, 8.25%, (8.25% cash or 9.00% PIK), 3/15/26(1)(11) | | 1,481 | 1,482,859 |
| Windsor Holdings III LLC, 8.50%, 6/15/30(1) | | 4,082 | 4,256,606 |
| | | | $ 88,642,507 |
| Steel — 0.5% |
| Allegheny Ludlum LLC, 6.95%, 12/15/25 | | 2,155 | $ 2,186,170 |
| ATI, Inc., 5.875%, 12/1/27 | | 1,420 | 1,392,421 |
| Big River Steel LLC/BRS Finance Corp., 6.625%, 1/31/29(1) | | 1,292 | 1,288,666 |
| TMS International Corp., 6.25%, 4/15/29(1) | | 2,504 | 2,310,174 |
| | | | $ 7,177,431 |
| Super Retail — 3.1% |
| Asbury Automotive Group, Inc.: | | | |
| 4.625%, 11/15/29(1) | | 839 | $ 759,496 |
| 4.75%, 3/1/30 | | 743 | 674,266 |
| 5.00%, 2/15/32(1) | | 2,334 | 2,076,771 |
| Bath & Body Works, Inc.: | | | |
| 6.75%, 7/1/36 | | 694 | 677,912 |
| 6.875%, 11/1/35 | | 2,146 | 2,133,873 |
| 6.95%, 3/1/33 | | 1,621 | 1,567,937 |
| 9.375%, 7/1/25(1) | | 289 | 299,369 |
| Security | Principal
Amount*
(000's omitted) | Value |
| Super Retail (continued) |
| Evergreen AcqCo 1 LP/TVI, Inc., 9.75%, 4/26/28(1) | | 4,147 | $ 4,397,039 |
| Group 1 Automotive, Inc., 4.00%, 8/15/28(1) | | 1,497 | 1,362,952 |
| Ken Garff Automotive LLC, 4.875%, 9/15/28(1) | | 2,048 | 1,902,111 |
| LCM Investments Holdings II LLC: | | | |
| 4.875%, 5/1/29(1) | | 2,840 | 2,596,551 |
| 8.25%, 8/1/31(1) | | 529 | 550,041 |
| Lithia Motors, Inc.: | | | |
| 3.875%, 6/1/29(1) | | 905 | 800,213 |
| 4.375%, 1/15/31(1) | | 3,144 | 2,755,575 |
| Mavis Tire Express Services Topco Corp., 6.50%, 5/15/29(1) | | 6,882 | 6,382,376 |
| NMG Holding Co., Inc./Neiman Marcus Group LLC, 7.125%, 4/1/26(1) | | 3,600 | 3,586,686 |
| PetSmart, Inc./PetSmart Finance Corp.: | | | |
| 4.75%, 2/15/28(1) | | 2,825 | 2,609,999 |
| 7.75%, 2/15/29(1) | | 1,337 | 1,272,188 |
| Sonic Automotive, Inc.: | | | |
| 4.625%, 11/15/29(1) | | 1,961 | 1,757,237 |
| 4.875%, 11/15/31(1) | | 1,634 | 1,427,347 |
| William Carter Co., 5.625%, 3/15/27(1) | | 1,510 | 1,471,237 |
| | | | $ 41,061,176 |
| Technology — 5.2% |
| Booz Allen Hamilton, Inc., 3.875%, 9/1/28(1) | | 2,659 | $ 2,461,975 |
| Central Parent LLC/CDK Global II LLC/CDK Financing Co., Inc., 8.00%, 6/15/29(1) | | 2,168 | 2,232,207 |
| Ciena Corp., 4.00%, 1/31/30(1) | | 3,592 | 3,154,060 |
| Clarios Global LP, 6.75%, 5/15/25(1) | | 653 | 653,841 |
| Clarios Global LP/Clarios U.S. Finance Co.: | | | |
| 4.375%, 5/15/26(6) | EUR | 2,958 | 3,131,667 |
| 8.50%, 5/15/27(1) | | 4,819 | 4,834,386 |
| Cloud Software Group, Inc.: | | | |
| 6.50%, 3/31/29(1) | | 3,276 | 3,109,623 |
| 9.00%, 9/30/29(1) | | 7,346 | 7,074,126 |
| Coherent Corp., 5.00%, 12/15/29(1) | | 2,385 | 2,203,188 |
| Fair Isaac Corp., 4.00%, 6/15/28(1) | | 2,227 | 2,053,209 |
| McAfee Corp., 7.375%, 2/15/30(1) | | 3,642 | 3,376,919 |
| NCR Voyix Corp.: | | | |
| 5.125%, 4/15/29(1) | | 1,782 | 1,639,310 |
| 5.25%, 10/1/30(1) | | 1,566 | 1,396,469 |
| ON Semiconductor Corp., 3.875%, 9/1/28(1) | | 3,132 | 2,844,973 |
| Open Text Corp., 3.875%, 2/15/28(1) | | 1,596 | 1,458,274 |
| Open Text Holdings, Inc., 4.125%, 2/15/30(1) | | 1,481 | 1,302,596 |
| Presidio Holdings, Inc.: | | | |
| 4.875%, 2/1/27(1) | | 723 | 724,411 |
High Income Opportunities Portfolio
April 30, 2024
Portfolio of Investments (Unaudited) — continued
| Security | Principal
Amount*
(000's omitted) | Value |
| Technology (continued) |
| Presidio Holdings, Inc.: (continued) | | | |
| 8.25%, 2/1/28(1) | | 6,515 | $ 6,593,851 |
| Rocket Software, Inc., 9.00%, 11/28/28(1)(9) | | 1,330 | 1,336,258 |
| Seagate HDD Cayman: | | | |
| 4.091%, 6/1/29 | | 803 | 731,397 |
| 9.625%, 12/1/32 | | 3,932 | 4,413,825 |
| Sensata Technologies BV, 5.00%, 10/1/25(1) | | 842 | 831,920 |
| Sensata Technologies, Inc., 3.75%, 2/15/31(1) | | 3,219 | 2,723,393 |
| SS&C Technologies, Inc., 5.50%, 9/30/27(1) | | 3,481 | 3,386,432 |
| Viavi Solutions, Inc., 3.75%, 10/1/29(1) | | 1,876 | 1,578,153 |
| VM Consolidated, Inc., 5.50%, 4/15/29(1) | | 4,657 | 4,387,325 |
| | | | $ 69,633,788 |
| Telecommunications — 2.3% |
| Altice Financing SA: | | | |
| 5.00%, 1/15/28(1) | | 1,945 | $ 1,537,147 |
| 5.75%, 8/15/29(1) | | 1,253 | 932,551 |
| Connect Finco SARL/Connect U.S. Finco LLC, 6.75%, 10/1/26(1) | | 5,756 | 5,579,652 |
| Iliad Holding SASU: | | | |
| 6.50%, 10/15/26(1) | | 3,437 | 3,423,730 |
| 7.00%, 10/15/28(1) | | 1,592 | 1,558,215 |
| LCPR Senior Secured Financing DAC: | | | |
| 5.125%, 7/15/29(1) | | 1,082 | 904,748 |
| 6.75%, 10/15/27(1) | | 425 | 394,294 |
| Sprint Capital Corp., 6.875%, 11/15/28 | | 1,985 | 2,080,349 |
| Sprint LLC, 7.625%, 2/15/25 | | 1,145 | 1,154,468 |
| Viasat, Inc., 5.625%, 4/15/27(1) | | 888 | 813,511 |
| Virgin Media Finance PLC, 5.00%, 7/15/30(1) | | 2,529 | 2,073,072 |
| Virgin Media Vendor Financing Notes III DAC, 4.875%, 7/15/28(6) | GBP | 1,106 | 1,237,100 |
| Virgin Media Vendor Financing Notes IV DAC, 5.00%, 7/15/28(1) | | 2,420 | 2,156,708 |
| Vmed O2 U.K. Financing I PLC: | | | |
| 4.75%, 7/15/31(1) | | 2,232 | 1,864,878 |
| 7.75%, 4/15/32(1) | | 1,550 | 1,527,382 |
| Ziggo Bond Co. BV, 5.125%, 2/28/30(1) | | 984 | 817,479 |
| Ziggo BV, 4.875%, 1/15/30(1) | | 2,756 | 2,414,008 |
| | | | $ 30,469,292 |
| Transport Excluding Air & Rail — 0.3% |
| Seaspan Corp., 5.50%, 8/1/29(1) | | 4,486 | $ 3,864,396 |
| | | | $ 3,864,396 |
| Security | Principal
Amount*
(000's omitted) | Value |
| Utility — 3.4% |
| Calpine Corp.: | | | |
| 4.50%, 2/15/28(1) | | 1,810 | $ 1,691,821 |
| 4.625%, 2/1/29(1) | | 2,060 | 1,894,278 |
| 5.00%, 2/1/31(1) | | 420 | 381,038 |
| 5.125%, 3/15/28(1) | | 4,304 | 4,086,475 |
| Ferrellgas LP/Ferrellgas Finance Corp., 5.875%, 4/1/29(1) | | 5,178 | 4,911,035 |
| Leeward Renewable Energy Operations LLC, 4.25%, 7/1/29(1) | | 2,400 | 1,988,915 |
| NextEra Energy Operating Partners LP, 4.50%, 9/15/27(1) | | 3,066 | 2,859,813 |
| NRG Energy, Inc.: | | | |
| 3.875%, 2/15/32(1) | | 3,164 | 2,668,725 |
| 10.25% to 3/15/28(1)(7)(8) | | 3,467 | 3,740,626 |
| Pattern Energy Operations LP/Pattern Energy Operations, Inc., 4.50%, 8/15/28(1) | | 2,196 | 1,965,945 |
| Suburban Propane Partners LP/Suburban Energy Finance Corp., 5.00%, 6/1/31(1) | | 3,568 | 3,172,645 |
| TerraForm Power Operating LLC, 5.00%, 1/31/28(1) | | 3,331 | 3,111,538 |
| TransAlta Corp., 7.75%, 11/15/29 | | 3,684 | 3,774,432 |
| Vistra Operations Co. LLC: | | | |
| 4.375%, 5/1/29(1) | | 2,094 | 1,908,515 |
| 5.00%, 7/31/27(1) | | 4,708 | 4,484,828 |
| 6.875%, 4/15/32(1) | | 3,490 | 3,477,827 |
| | | | $ 46,118,456 |
Total Corporate Bonds
(identified cost $1,167,719,362) | | | $1,136,705,036 |
| Exchange-Traded Funds — 0.8% |
| Security | Shares | Value |
| Fixed Income Funds — 0.8% |
| iShares Broad USD High Yield Corporate Bond ETF | | 285,470 | $ 10,259,792 |
Total Exchange-Traded Funds
(identified cost $10,282,629) | | | $ 10,259,792 |
High Income Opportunities Portfolio
April 30, 2024
Portfolio of Investments (Unaudited) — continued
| Security | Shares | Value |
| Services — 0.3% |
| WESCO International, Inc., Series A, 10.625% to 6/22/25(8) | | 147,488 | $ 3,892,208 |
Total Preferred Stocks
(identified cost $4,129,729) | | | $ 3,892,208 |
| Senior Floating-Rate Loans — 6.8%(12) |
| Borrower/Description | Principal
Amount
(000's omitted) | Value |
| Aerospace — 0.1% |
| TransDigm, Inc., Term Loan, 8.059%, (SOFR + 2.75%), 8/24/28 | $ | 1,691 | $ 1,702,140 |
| | | | $ 1,702,140 |
| Air Transportation — 0.4% |
| American Airlines, Inc., Term Loan, 10.336%, (SOFR + 4.75%), 4/20/28 | $ | 2,930 | $ 3,051,821 |
| Mileage Plus Holdings LLC, Term Loan, 10.733%, (SOFR + 5.25%), 6/21/27 | | 2,823 | 2,900,720 |
| | | | $ 5,952,541 |
| Broadcasting — 0.2% |
| ABG Intermediate Holdings 2 LLC, Term Loan, 8.918%, (SOFR + 3.50%), 12/21/28 | $ | 3,223 | $ 3,239,020 |
| | | | $ 3,239,020 |
| Capital Goods — 0.4% |
| DexKo Global, Inc., Term Loan, 9.559%, (SOFR + 4.25%), 10/4/28 | $ | 1,497 | $ 1,497,481 |
| EMRLD Borrower LP, Term Loan, 7.816%, (SOFR + 2.50%), 5/31/30 | | 3,167 | 3,175,926 |
| | | | $ 4,673,407 |
| Energy — 0.3% |
| Epic Y-Grade Services LP, Term Loan, 6/29/29(13) | $ | 3,603 | $ 3,566,286 |
| | | | $ 3,566,286 |
| Food, Beverage & Tobacco — 0.2% |
| Triton Water Holdings, Inc., Term Loan, 3/31/28(13) | $ | 2,580 | $ 2,571,937 |
| | | | $ 2,571,937 |
| Borrower/Description | Principal
Amount
(000's omitted) | Value |
| Gaming — 0.5% |
| Peninsula Pacific Entertainment LLC, Term Loan, 13.00%, 12/24/29(3)(14) | $ | 2,506 | $ 2,506,014 |
| Spectacle Gary Holdings LLC, Term Loan, 9.702%, (SOFR + 4.25%), 12/11/28 | | 4,062 | 4,004,159 |
| | | | $ 6,510,173 |
| Healthcare — 1.4% |
| athenahealth Group, Inc., Term Loan, 8.566%, (SOFR + 3.25%), 2/15/29 | $ | 1,763 | $ 1,759,381 |
| Bausch & Lomb Corp., Term Loan, 8.669%, (SOFR + 3.25%), 5/10/27 | | 2,206 | 2,194,910 |
| Jazz Financing Lux SARL, Term Loan, 8.43%, (SOFR + 3.00%), 5/5/28 | | 2,584 | 2,602,252 |
| Pluto Acquisition I, Inc.: | | | |
| Term Loan, 10.687%, (SOFR + 5.50%), 6/20/28 | | 967 | 979,585 |
| Term Loan - Second Lien, 9.316%, (SOFR + 4.00%), 9/20/28 | | 3,550 | 3,159,440 |
| Team Health Holdings, Inc., Term Loan, 10.58%, (SOFR + 5.25%), 3/2/27(15) | | 3,206 | 2,823,537 |
| Verscend Holding Corp., Term Loan, 11.50%, (U.S. (Fed) Prime Rate + 3.00%), 8/27/25 | | 5,082 | 5,085,880 |
| | | | $ 18,604,985 |
| Insurance — 0.6% |
| Truist Insurance Holdings LLC, Term Loan - Second Lien, 3/8/32(13) | $ | 8,615 | $ 8,693,612 |
| | | | $ 8,693,612 |
| Leisure — 0.2% |
| Peloton Interactive, Inc., Term Loan, 12.477%, (SOFR + 7.00%), 5/25/27 | $ | 2,050 | $ 2,049,196 |
| | | | $ 2,049,196 |
| Paper — 0.1% |
| Enviva Partners LP/Enviva Partners Finance Corp.: | | | |
| Term Loan, 4.00%, 12/13/24(16) | $ | 801 | $ 815,088 |
| Term Loan, 4.00%, 12/13/24(16) | | 320 | 374,900 |
| Term Loan, 13.297%, (SOFR + 8.00%), 12/13/24 | | 481 | 562,350 |
| | | | $ 1,752,338 |
| Restaurant — 0.6% |
| IRB Holding Corp., Term Loan, 8.166%, (SOFR + 2.75%), 12/15/27 | $ | 7,946 | $ 7,965,062 |
| | | | $ 7,965,062 |
High Income Opportunities Portfolio
April 30, 2024
Portfolio of Investments (Unaudited) — continued
| Borrower/Description | Principal
Amount
(000's omitted) | Value |
| Services — 0.5% |
| AlixPartners LLP, Term Loan, 7.93%, (SOFR + 2.50%), 2/4/28 | $ | 7,099 | $ 7,126,352 |
| | | | $ 7,126,352 |
| Super Retail — 0.6% |
| Hanesbrands, Inc., Term Loan, 7.916%, (SOFR + 2.50%), 11/19/26 | $ | 3,286 | $ 3,240,423 |
| Mavis Tire Express Services Corp., Term Loan, 9.066%, (SOFR + 3.75%), 5/4/28 | | 2,353 | 2,362,272 |
| PetSmart, Inc., Term Loan, 9.166%, (SOFR + 3.75%), 2/11/28 | | 2,311 | 2,279,657 |
| | | | $ 7,882,352 |
| Technology — 0.7% |
| Central Parent, Inc., Term Loan, 7/6/29(13) | $ | 2,384 | $ 2,395,806 |
| Clarios Global LP, Term Loan, 8.316%, (SOFR + 3.00%), 5/6/30 | | 3,328 | 3,342,144 |
| Cloud Software Group, Inc., Term Loan, 3/30/29(13) | | 1,207 | 1,208,141 |
| Riverbed Technology, Inc., Term Loan, 9.809%, (SOFR + 4.50%), 7.809% cash, 2.00% PIK, 7/1/28 | | 505 | 310,665 |
| Travelport Finance (Luxembourg) SARL, Term Loan, 13.564%, (SOFR + 8.00%), 9/30/28 | | 2,478 | 2,292,475 |
| | | | $ 9,549,231 |
Total Senior Floating-Rate Loans
(identified cost $92,014,560) | | | $ 91,838,632 |
| Security | Principal
Amount/
Shares | Value |
| Cable & Satellite TV — 0.0% |
| ACC Claims Holdings LLC(3)(5) | | 8,415,190 | $ 0 |
| | | | $ 0 |
| Diversified Media — 0.0% |
| National CineMedia, Inc., Escrow Certificates(3)(5) | $ | 1,660,000 | $ 0 |
| | | | $ 0 |
| Gaming — 0.3% |
| PGP Investors, LLC, Membership Interests(3)(4)(5) | | 15,849 | $ 4,285,356 |
| | | | $ 4,285,356 |
| Security | Principal
Amount/
Shares | Value |
| Healthcare — 0.0% |
| Endo Design LLC, Escrow Certificates(3)(5) | $ | 1,153,000 | $ 0 |
| Endo Luxembourg Finance SARL, Escrow Certificates(3)(5) | | 2,774,000 | 0 |
| | | | $ 0 |
| Services — 0.0%(17) |
| Hertz Corp., Escrow Certificates(1)(5) | $ | 502,000 | $ 50,199 |
| | | | $ 50,199 |
Total Miscellaneous
(identified cost $65,010) | | | $ 4,335,555 |
| Short-Term Investments — 4.6% |
| Security | Shares | Value |
| Morgan Stanley Institutional Liquidity Funds - Government Portfolio, Institutional Class, 5.22%(18) | | 61,224,349 | $ 61,224,349 |
Total Short-Term Investments
(identified cost $61,224,349) | | | $ 61,224,349 |
Total Investments — 100.6%
(identified cost $1,381,646,858) | | | $1,354,651,433 |
| Less Unfunded Loan Commitments — (0.1)% | | | $ (1,121,496) |
Net Investments — 100.5%
(identified cost $1,380,525,362) | | | $1,353,529,937 |
| Other Assets, Less Liabilities — (0.5)% | | | $ (6,848,306) |
| Net Assets — 100.0% | | | $1,346,681,631 |
| The percentage shown for each investment category in the Portfolio of Investments is based on net assets. |
| * | In U.S. dollars unless otherwise indicated. |
| (1) | Security exempt from registration under Rule 144A of the Securities Act of 1933, as amended. These securities may be sold in certain transactions in reliance on an exemption from registration (normally to qualified institutional buyers). At April 30, 2024, the aggregate value of these securities is $1,024,643,008 or 76.1% of the Portfolio's net assets. |
| (2) | Variable rate security. The stated interest rate represents the rate in effect at April 30, 2024. |
| (3) | For fair value measurement disclosure purposes, security is categorized as Level 3 (see Note 9). |
| (4) | Restricted security (see Note 5). |
| (5) | Non-income producing security. |
High Income Opportunities Portfolio
April 30, 2024
Portfolio of Investments (Unaudited) — continued
| (6) | Security exempt from registration under Regulation S of the Securities Act of 1933, as amended, which exempts from registration securities offered and sold outside the United States. Security may not be offered or sold in the United States except pursuant to an exemption from, or in a transaction not subject to, the registration requirements of the Securities Act of 1933, as amended. At April 30, 2024, the aggregate value of these securities is $27,635,061 or 2.1% of the Portfolio's net assets. |
| (7) | Perpetual security with no stated maturity date but may be subject to calls by the issuer. |
| (8) | Security converts to variable rate after the indicated fixed-rate coupon period. |
| (9) | When-issued security. |
| (10) | Issuer is in default with respect to interest and/or principal payments or has declared bankruptcy. |
| (11) | Represents a payment-in-kind security which may pay interest in additional principal at the issuer’s discretion. |
| (12) | Senior floating-rate loans (Senior Loans) often require prepayments from excess cash flows or permit the borrowers to repay at their election. The degree to which borrowers repay, whether as a contractual requirement or at their election, cannot be predicted with accuracy. As a result, the actual remaining maturity may be substantially less than the stated maturities shown. However, Senior Loans will typically have an expected average life of approximately two to four years. Senior Loans typically have rates of interest which are redetermined periodically by reference to a base lending rate, plus a spread. These base lending rates are primarily the Secured Overnight Financing Rate (“SOFR”) and secondarily, the prime rate offered by one or more major United States banks (the “Prime Rate”). Base lending rates may be subject to a floor, or minimum rate. Rates for SOFR are generally 1 or 3-month tenors and may also be subject to a credit spread adjustment. Senior Loans are generally subject to contractual restrictions that must be satisfied before they can be bought or sold. |
| (13) | This Senior Loan will settle after April 30, 2024, at which time the interest rate will be determined. |
| (14) | Fixed-rate loan. |
| (15) | The stated interest rate represents the weighted average interest rate at April 30, 2024 of contracts within the senior loan facility. Interest rates on contracts are primarily redetermined either monthly or quarterly by reference to the indicated base lending rate and spread and the reset period. |
| (16) | Unfunded or partially unfunded loan commitments. The stated interest rate reflects the weighted average of the reference rate and spread for the funded portion, if any, and the commitment fees on the portion of the loan that is unfunded. At April 30, 2024, the total value of unfunded loan commitments is $1,189,988. See Note 1F for description. |
| (17) | Amount is less than 0.05%. |
| (18) | May be deemed to be an affiliated investment company. The rate shown is the annualized seven-day yield as of April 30, 2024. |
| Forward Foreign Currency Exchange Contracts (OTC) |
| Currency Purchased | Currency Sold | Counterparty | Settlement
Date | Unrealized
Appreciation | Unrealized
(Depreciation) |
| USD | 6,009,167 | EUR | 5,595,477 | Goldman Sachs International | 7/31/24 | $ 14,577 | $ — |
| USD | 10,990,644 | EUR | 10,242,000 | State Street Bank and Trust Company | 7/31/24 | 18,103 | — |
| USD | 6,868,595 | EUR | 6,400,796 | State Street Bank and Trust Company | 7/31/24 | 11,243 | — |
| USD | 7,456 | GBP | 5,967 | HSBC Bank USA, N.A. | 7/31/24 | — | (3) |
| USD | 1,250,060 | GBP | 1,002,744 | State Street Bank and Trust Company | 7/31/24 | — | (3,554) |
| | | | | | | $43,923 | $(3,557) |
| Abbreviations: |
| OTC | – Over-the-counter |
| PIK | – Payment In Kind |
| SOFR | – Secured Overnight Financing Rate |
| Currency Abbreviations: |
| EUR | – Euro |
| GBP | – British Pound Sterling |
| USD | – United States Dollar |
High Income Opportunities Portfolio
April 30, 2024
Statement of Assets and Liabilities (Unaudited)
| | April 30, 2024 |
| Assets | |
| Unaffiliated investments, at value (identified cost $1,319,301,013) | $ 1,292,305,588 |
| Affiliated investments, at value (identified cost $61,224,349) | 61,224,349 |
| Cash | 3,223,283 |
| Deposits for derivatives collateral — forward foreign currency exchange contracts | 220,000 |
| Foreign currency, at value (identified cost $1,660) | 1,657 |
| Interest receivable | 19,361,943 |
| Dividends receivable from affiliated investments | 348,140 |
| Receivable for investments sold | 2,800,690 |
| Receivable for open forward foreign currency exchange contracts | 43,923 |
| Trustees' deferred compensation plan | 202,809 |
| Total assets | $1,379,732,382 |
| Liabilities | |
| Cash collateral due to broker | $ 220,000 |
| Payable for investments purchased | 27,546,725 |
| Payable for when-issued securities | 4,296,648 |
| Payable for open forward foreign currency exchange contracts | 3,557 |
| Payable to affiliates: | |
| Investment adviser fee | 513,363 |
| Trustees' fees | 6,814 |
| Trustees' deferred compensation plan | 202,809 |
| Accrued expenses | 260,835 |
| Total liabilities | $ 33,050,751 |
| Net Assets applicable to investors' interest in Portfolio | $1,346,681,631 |
29
See Notes to Financial Statements.
High Income Opportunities Portfolio
April 30, 2024
Statement of Operations (Unaudited)
| | Six Months Ended |
| | April 30, 2024 |
| Investment Income | |
| Dividend income (net of foreign taxes withheld of $712) | $ 571,425 |
| Dividend income from affiliated investments | 1,386,038 |
| Interest income | 41,141,552 |
| Other income | 25,449 |
| Total investment income | $ 43,124,464 |
| Expenses | |
| Investment adviser fee | $ 2,992,743 |
| Trustees’ fees and expenses | 41,183 |
| Custodian fee | 159,116 |
| Legal and accounting services | 69,187 |
| Miscellaneous | 1,543 |
| Total expenses | $ 3,263,772 |
| Deduct: | |
| Waiver and/or reimbursement of expenses by affiliates | $ 40,246 |
| Total expense reductions | $ 40,246 |
| Net expenses | $ 3,223,526 |
| Net investment income | $ 39,900,938 |
| Realized and Unrealized Gain (Loss) | |
| Net realized gain (loss): | |
| Investment transactions | $ (13,859,031) |
| Foreign currency transactions | 6,183 |
| Forward foreign currency exchange contracts | 65,786 |
| Net realized loss | $ (13,787,062) |
| Change in unrealized appreciation (depreciation): | |
| Investments | $ 74,547,697 |
| Foreign currency | 916 |
| Forward foreign currency exchange contracts | 38,618 |
| Net change in unrealized appreciation (depreciation) | $ 74,587,231 |
| Net realized and unrealized gain | $ 60,800,169 |
| Net increase in net assets from operations | $100,701,107 |
30
See Notes to Financial Statements.
High Income Opportunities Portfolio
April 30, 2024
Statements of Changes in Net Assets
| | Six Months Ended
April 30, 2024
(Unaudited) | Year Ended
October 31, 2023 |
| Increase (Decrease) in Net Assets | | |
| From operations: | | |
| Net investment income | $ 39,900,938 | $ 65,174,311 |
| Net realized gain (loss) | (13,787,062) | 10,565,317 |
| Net change in unrealized appreciation (depreciation) | 74,587,231 | (10,425,382) |
| Net increase in net assets from operations | $ 100,701,107 | $ 65,314,246 |
| Capital transactions: | | |
| Contributions | $ 279,707,179 | $ 295,215,386 |
| Withdrawals | (124,552,332) | (289,977,325) |
| Net increase in net assets from capital transactions | $ 155,154,847 | $ 5,238,061 |
| Net increase in net assets | $ 255,855,954 | $ 70,552,307 |
| Net Assets | | |
| At beginning of period | $ 1,090,825,677 | $ 1,020,273,370 |
| At end of period | $1,346,681,631 | $1,090,825,677 |
31
See Notes to Financial Statements.
High Income Opportunities Portfolio
April 30, 2024
| | Six Months Ended
April 30, 2024
(Unaudited) | Year Ended October 31, |
| Ratios/Supplemental Data | 2023 | 2022 | 2021 | 2020 | 2019 |
| Ratios (as a percentage of average daily net assets): | | | | | | |
| Expenses | 0.51% (1)(2) | 0.53% (1) | 0.49% (1) | 0.49% | 0.51% | 0.50% |
| Net investment income | 6.37% (2) | 6.07% | 4.82% | 4.78% | 5.26% | 5.61% |
| Portfolio Turnover | 22% (3) | 29% | 19% | 64% | 67% | 32% |
| Total Return | 8.58% (3) | 6.66% | (8.20)% | 13.11% | 1.69% | 7.74% |
| Net assets, end of period (000’s omitted) | $1,346,682 | $1,090,826 | $1,020,273 | $1,000,095 | $949,751 | $1,088,999 |
| (1) | Includes a reduction by the investment adviser of a portion of its adviser fee due to the Fund's investment in the Liquidity Fund (equal to less than 0.01%, less than 0.01% and less than 0.005% of average daily net assets for the six months ended April 30, 2024 and the years ended October 31, 2023 and 2022, respectively). |
| (2) | Annualized. |
| (3) | Not annualized. |
32
See Notes to Financial Statements.
High Income Opportunities Portfolio
April 30, 2024
Notes to Financial Statements (Unaudited)
1 Significant Accounting Policies
High Income Opportunities Portfolio (the Portfolio) is a Massachusetts business trust registered under the Investment Company Act of 1940, as amended (the 1940 Act), as a diversified, open-end management investment company. The Portfolio’s investment objective is to provide a high level of current income. The Portfolio also seeks growth of capital as a secondary investment objective. The Declaration of Trust permits the Trustees to issue interests in the Portfolio. At April 30, 2024, Eaton Vance High Income Opportunities Fund, Eaton Vance Strategic Income Fund (formerly, Eaton Vance Short Duration Strategic Income Fund), Eaton Vance Floating-Rate & High Income Fund and Eaton Vance International (Cayman Islands) Strategic Income Fund (formerly, Eaton Vance International (Cayman Islands) Short Duration Strategic Income Fund) held an interest of 73.6%, 17.1%, 8.9% and 0.3%, respectively, in the Portfolio.
The following is a summary of significant accounting policies of the Portfolio. The policies are in conformity with accounting principles generally accepted in the United States of America (U.S. GAAP). The Portfolio is an investment company and follows accounting and reporting guidance in the Financial Accounting Standards Board (FASB) Accounting Standards Codification Topic 946.
A Investment Valuation—The following methodologies are used to determine the market value or fair value of investments.
Debt Obligations. Debt obligations are generally valued on the basis of valuations provided by third party pricing services, as derived from such services’ pricing models. Inputs to the models may include, but are not limited to, reported trades, executable bid and ask prices, broker/dealer quotations, prices or yields of securities with similar characteristics, interest rates, anticipated prepayments, benchmark curves or information pertaining to the issuer, as well as industry and economic events. The pricing services may use a matrix approach, which considers information regarding securities with similar characteristics to determine the valuation for a security. Short-term debt obligations purchased with a remaining maturity of sixty days or less for which a valuation from a third party pricing service is not readily available may be valued at amortized cost, which approximates fair value.
Senior Floating-Rate Loans. Interests in senior floating-rate loans (Senior Loans) are valued generally at the average mean of bid and ask quotations obtained from a third party pricing service. Senior Loans, for which a valuation is not available or deemed unreliable, are fair valued by the investment adviser utilizing one or more of the valuation techniques described below to assess the likelihood that the borrower will make a full repayment of the loan underlying such Senior Loan. If the investment adviser believes that there is a reasonable likelihood of full repayment, the investment adviser will determine fair value using a matrix pricing approach that considers the yield on the Senior Loan relative to yields on other Senior Loans issued by companies of comparable credit quality. If the investment adviser believes there is not a reasonable likelihood of full repayment, the investment adviser will determine fair value using analyses that include, but are not limited to: (i) a comparison of the value of the borrower's outstanding equity and debt to that of comparable public companies; (ii) a discounted cash flow analysis; or (iii) when the investment adviser believes it is likely that a borrower will be liquidated or sold, an analysis of the terms of such liquidation or sale. In certain cases, the investment adviser will use a combination of analytical methods to determine fair value, such as when only a portion of a borrower's assets are likely to be sold. In conducting its assessment and analyses for purposes of determining fair value of a Senior Loan, the investment adviser will use its discretion and judgment in considering and appraising relevant factors. Junior Loans (i.e., subordinated loans and second lien loans) are valued in the same manner as Senior Loans.
Equity Securities. Equity securities listed on a U.S. securities exchange generally are valued at the last sale or closing price on the day of valuation or, if no sales took place on such date, at the mean between the closing bid and ask prices on the exchange where such securities are principally traded. Equity securities listed on the NASDAQ National Market System are valued at the NASDAQ official closing price. Unlisted or listed securities for which closing sales prices or closing quotations are not available are valued at the mean between the latest available bid and ask prices or, in the case of preferred equity securities that are not listed or traded in the over-the-counter market, by a third party pricing service that uses various techniques that consider factors including, but not limited to, prices or yields of securities with similar characteristics, benchmark yields, broker/dealer quotes, quotes of underlying common stock, issuer spreads, as well as industry and economic events.
Derivatives. Forward foreign currency exchange contracts are generally valued at the mean of the average bid and average ask prices that are reported by currency dealers to a third party pricing service at the valuation time. Such third party pricing service valuations are supplied for specific settlement periods and the Portfolio’s forward foreign currency exchange contracts are valued at an interpolated rate between the closest preceding and subsequent settlement period reported by the third party pricing service.
Foreign Securities and Currencies. Foreign securities and currencies are valued in U.S. dollars, based on foreign currency exchange rate quotations supplied by a third party pricing service. The pricing service uses a proprietary model to determine the exchange rate. Inputs to the model include reported trades and implied bid/ask spreads.
Other. Investments in management investment companies (including money market funds) that do not trade on an exchange are valued at the net asset value as of the close of each business day.
Fair Valuation. In connection with Rule 2a-5 of the 1940 Act, the Trustees have designated the Portfolio’s investment adviser as its valuation designee. Investments for which valuations or market quotations are not readily available or are deemed unreliable are valued by the investment adviser, as valuation designee, at fair value using methods that most fairly reflect the security’s “fair value”, which is the amount that the Portfolio might reasonably expect to receive for the security upon its current sale in the ordinary course. Each such determination is based on a consideration of relevant factors, which are likely to vary from one pricing context to another. These factors may include, but are not limited to, the type of security, the existence of any contractual restrictions on the security’s disposition, the price and extent of public trading in similar securities of the issuer or of comparable companies or entities,
High Income Opportunities Portfolio
April 30, 2024
Notes to Financial Statements (Unaudited) — continued
quotations or relevant information obtained from broker/dealers or other market participants, information obtained from the issuer, analysts, and/or the appropriate stock exchange (for exchange-traded securities), an analysis of the company’s or entity’s financial statements, and an evaluation of the forces that influence the issuer and the market(s) in which the security is purchased and sold.
B Investment Transactions—Investment transactions for financial statement purposes are accounted for on a trade date basis. Realized gains and losses on investments sold are determined on the basis of identified cost.
C Income—Interest income is recorded on the basis of interest accrued, adjusted for amortization of premium or accretion of discount. Fees associated with loan amendments are recognized immediately. Dividend income is recorded on the ex-dividend date for dividends received in cash and/or securities. Withholding taxes on foreign dividends have been provided for in accordance with the Portfolio’s understanding of the applicable countries’ tax rules and rates. Distributions from investment companies are recorded as dividend income, capital gains or return of capital based on the nature of the distribution.
D Federal Taxes—The Portfolio has elected to be treated as a partnership for federal tax purposes. No provision is made by the Portfolio for federal or state taxes on any taxable income of the Portfolio because each investor in the Portfolio is ultimately responsible for the payment of any taxes on its share of taxable income. Since at least one of the Portfolio's investors is a regulated investment company that invests all or substantially all of its assets in the Portfolio, the Portfolio normally must satisfy the applicable source of income and diversification requirements (under the Internal Revenue Code) in order for its investors to satisfy them. The Portfolio will allocate, at least annually among its investors, each investor's distributive share of the Portfolio's net investment income, net realized capital gains and losses and any other items of income, gain, loss, deduction or credit.
As of April 30, 2024, the Portfolio had no uncertain tax positions that would require financial statement recognition, de-recognition, or disclosure. The Portfolio files a U.S. federal income tax return annually after its fiscal year-end, which is subject to examination by the Internal Revenue Service for a period of three years from the date of filing.
E Foreign Currency Translation—Investment valuations, other assets, and liabilities initially expressed in foreign currencies are translated each business day into U.S. dollars based upon current exchange rates. Purchases and sales of foreign investment securities and income and expenses denominated in foreign currencies are translated into U.S. dollars based upon currency exchange rates in effect on the respective dates of such transactions. Recognized gains or losses on investment transactions attributable to changes in foreign currency exchange rates are recorded for financial statement purposes as net realized gains and losses on investments. That portion of unrealized gains and losses on investments that results from fluctuations in foreign currency exchange rates is not separately disclosed.
F Unfunded Loan Commitments—The Portfolio may enter into certain loan agreements all or a portion of which may be unfunded. The Portfolio is obligated to fund these commitments at the borrower's discretion. These commitments are disclosed in the accompanying Portfolio of Investments. At April 30, 2024, the Portfolio had sufficient cash and/or securities to cover these commitments.
G Use of Estimates—The preparation of the financial statements in conformity with U.S. GAAP requires management to make estimates and assumptions that affect the reported amounts of assets and liabilities at the date of the financial statements and the reported amounts of income and expense during the reporting period. Actual results could differ from those estimates.
H Indemnifications—Under the Portfolio’s organizational documents, its officers and Trustees may be indemnified against certain liabilities and expenses arising out of the performance of their duties to the Portfolio. Under Massachusetts law, if certain conditions prevail, interestholders in the Portfolio could be deemed to have personal liability for the obligations of the Portfolio. However, the Portfolio’s Declaration of Trust contains an express disclaimer of liability on the part of Portfolio interestholders. Additionally, in the normal course of business, the Portfolio enters into agreements with service providers that may contain indemnification clauses. The Portfolio’s maximum exposure under these arrangements is unknown as this would involve future claims that may be made against the Portfolio that have not yet occurred.
I Forward Foreign Currency Exchange Contracts—The Portfolio may enter into forward foreign currency exchange contracts for the purchase or sale of a specific foreign currency at a fixed price on a future date. The forward foreign currency exchange contracts are adjusted by the daily exchange rate of the underlying currency and any gains or losses are recorded as unrealized until such time as the contracts have been closed. Risks may arise upon entering these contracts from the potential inability of counterparties to meet the terms of their contracts and from movements in the value of a foreign currency relative to the U.S. dollar.
J Interim Financial Statements—The interim financial statements relating to April 30, 2024 and for the six months then ended have not been audited by an independent registered public accounting firm, but in the opinion of the Portfolio’s management, reflect all adjustments, consisting only of normal recurring adjustments, necessary for the fair presentation of the financial statements.
High Income Opportunities Portfolio
April 30, 2024
Notes to Financial Statements (Unaudited) — continued
2 Investment Adviser Fee and Other Transactions with Affiliates
The investment adviser fee is earned by Boston Management and Research (BMR), an indirect, wholly-owned subsidiary of Morgan Stanley, as compensation for investment advisory services rendered to the Portfolio. The investment adviser fee is based upon a percentage of total daily net assets plus a percentage of total daily gross income as follows and is payable monthly:
| Total Daily Net Assets | Annual Asset
Rate | Daily Income
Rate |
| Up to $500 million | 0.300% | 3.000% |
| $500 million but less than $1 billion | 0.275% | 2.750% |
| $1 billion but less than $1.5 billion | 0.250% | 2.500% |
| $1.5 billion but less than $2 billion | 0.225% | 2.250% |
| $2 billion but less than $3 billion | 0.200% | 2.000% |
| $3 billion and over | 0.175% | 1.750% |
For the six months ended April 30, 2024, the Portfolio’s investment adviser fee amounted to $2,992,743 or 0.48% (annualized) of the Portfolio's average daily net assets. Pursuant to an investment sub-advisory agreement, BMR has delegated a portion of the investment management of the Portfolio to Eaton Vance Advisers International Ltd. (EVAIL), an affiliate of BMR. BMR pays EVAIL a portion of its investment adviser fee for sub-advisory services provided to the Portfolio. The Portfolio may invest in a money market fund, the Institutional Class of the Morgan Stanley Institutional Liquidity Funds - Government Portfolio (the “Liquidity Fund”), an open-end management investment company managed by Morgan Stanley Investment Management Inc., a wholly-owned subsidiary of Morgan Stanley. The investment adviser fee paid by the Portfolio is reduced by an amount equal to its pro rata share of the advisory and administration fees paid by the Portfolio due to its investment in the Liquidity Fund. For the six months ended April 30, 2024, the investment adviser fee paid was reduced by $40,246 relating to the Portfolio’s investment in the Liquidity Fund.
Trustees and officers of the Portfolio who are members of BMR’s organization receive remuneration for their services to the Portfolio out of the investment adviser fee. Trustees of the Portfolio who are not affiliated with the investment adviser may elect to defer receipt of all or a percentage of their annual fees in accordance with the terms of the Trustees Deferred Compensation Plan. Certain officers and Trustees of the Portfolio are officers of the above organization.
3 Purchases and Sales of Investments
Purchases and sales of investments, other than short-term obligations and including maturities, paydowns and principal repayments on Senior Loans, aggregated $460,730,735 and $267,064,311, respectively, for the six months ended April 30, 2024.
4 Federal Income Tax Basis of Investments
The cost and unrealized appreciation (depreciation) of investments, including open derivative contracts, of the Portfolio at April 30, 2024, as determined on a federal income tax basis, were as follows:
| Aggregate cost | $1,391,072,125 |
| Gross unrealized appreciation | $ 19,885,384 |
| Gross unrealized depreciation | (57,387,206) |
| Net unrealized depreciation | $ (37,501,822) |
High Income Opportunities Portfolio
April 30, 2024
Notes to Financial Statements (Unaudited) — continued
5 Restricted Securities
At April 30, 2024, the Portfolio owned the following securities (representing 0.4% of net assets) which were restricted as to public resale and not registered under the Securities Act of 1933 (excluding Rule 144A securities). The Portfolio has various registration rights (exercisable under a variety of circumstances) with respect to these securities. The value of these securities is determined based on valuations provided by brokers when available, or if not available, they are valued at fair value using methods determined in good faith by or at the direction of the Trustees’ valuation designee.
| Description | Date(s) of
Acquisition | Shares | Cost | Value |
| Common Stocks | | | | |
| Ascent CNR Corp., Class A | 4/25/16, 11/16/16 | 6,273,462 | $ 0 | $ 1,380,162 |
| Endo, Inc. | 4/23/24 | 572 | 7,304 | 16,373 |
| iFIT Health and Fitness, Inc. | 10/6/22 | 514,080 | 1,799,280 | 0 |
| New Cotai Participation Corp., Class B | 4/12/13 | 7 | 216,125 | 0 |
| Total Common Stocks | | | $2,022,709 | $1,396,535 |
| Miscellaneous | | | | |
| PGP Investors, LLC, Membership Interests | 2/18/15, 4/23/18, 12/17/21 | 15,849 | $ 0 | $ 4,285,356 |
| Total Miscellaneous | | | $ 0 | $4,285,356 |
| Total Restricted Securities | | | $2,022,709 | $5,681,891 |
6 Financial Instruments
The Portfolio may trade in financial instruments with off-balance sheet risk in the normal course of its investing activities. These financial instruments may include forward foreign currency exchange contracts and may involve, to a varying degree, elements of risk in excess of the amounts recognized for financial statement purposes. The notional or contractual amounts of these instruments represent the investment the Portfolio has in particular classes of financial instruments and do not necessarily represent the amounts potentially subject to risk. The measurement of the risks associated with these instruments is meaningful only when all related and offsetting transactions are considered. A summary of obligations under these financial instruments at April 30, 2024 is included in the Portfolio of Investments. At April 30, 2024, the Portfolio had sufficient cash and/or securities to cover commitments under these contracts.
The Portfolio is subject to foreign exchange risk in the normal course of pursuing its investment objectives. Because the Portfolio holds foreign currency denominated investments, the value of these investments and related receivables and payables may change due to future changes in foreign currency exchange rates. To hedge against this risk, the Portfolio enters into forward foreign currency exchange contracts.
The Portfolio enters into forward foreign currency exchange contracts that may contain provisions whereby the counterparty may terminate the contract under certain conditions, including but not limited to a decline in the Portfolio’s net assets below a certain level over a certain period of time, which would trigger a payment by the Portfolio for those derivatives in a liability position. At April 30, 2024, the fair value of derivatives with credit-related contingent features in a net liability position was $3,557. At April 30, 2024, there were no assets pledged by the Portfolio for such liability.
The over-the-counter (OTC) derivatives in which the Portfolio invests are subject to the risk that the counterparty to the contract fails to perform its obligations under the contract. To mitigate this risk, the Portfolio has entered into an International Swaps and Derivatives Association, Inc. Master Agreement (“ISDA Master Agreement”) or similar agreement with substantially all its derivative counterparties. An ISDA Master Agreement is a bilateral agreement between the Portfolio and a counterparty that governs certain OTC derivatives and typically contains, among other things, set-off provisions in the event of a default and/or termination event as defined under the relevant ISDA Master Agreement. Under an ISDA Master Agreement, the Portfolio may, under certain circumstances, offset with the counterparty certain derivative financial instruments’ payables and/or receivables with collateral held and/or posted and create one single net payment. The provisions of the ISDA Master Agreement typically permit a single net payment in the event of default including the bankruptcy or insolvency of the counterparty. However, bankruptcy or insolvency laws of a particular jurisdiction may impose restrictions on or prohibitions against the right of offset in bankruptcy or insolvency. Certain ISDA Master Agreements allow counterparties to OTC derivatives to terminate derivative contracts prior to maturity in the event the Portfolio’s net assets decline by a stated percentage or the Portfolio fails to meet the terms of its ISDA Master Agreements, which would cause the counterparty to accelerate payment by the Portfolio of any net liability owed to it.
The collateral requirements for derivatives traded under an ISDA Master Agreement are governed by a Credit Support Annex to the ISDA Master Agreement. Collateral requirements are determined at the close of business each day and are typically based on changes in market values for each transaction under an
High Income Opportunities Portfolio
April 30, 2024
Notes to Financial Statements (Unaudited) — continued
ISDA Master Agreement and netted into one amount for such agreement. Generally, the amount of collateral due from or to a counterparty is subject to a minimum transfer threshold amount before a transfer is required, which may vary by counterparty. Collateral pledged for the benefit of the Portfolio and/or counterparty is held in segregated accounts by the Portfolio’s custodian and cannot be sold, re-pledged, assigned or otherwise used while pledged. The portion of such collateral representing cash, if any, is reflected as deposits for derivatives collateral and, in the case of cash pledged by a counterparty for the benefit of the Portfolio, a corresponding liability on the Statement of Assets and Liabilities. Securities pledged by the Portfolio as collateral, if any, are identified as such in the Portfolio of Investments.
The fair value of open derivative instruments (not considered to be hedging instruments for accounting disclosure purposes) and whose primary underlying risk exposure is foreign exchange risk at April 30, 2024 was as follows:
| | Fair Value |
| Derivative | Asset Derivative | Liability Derivative |
| Forward foreign currency exchange contracts | $43,923 (1) | $(3,557) (2) |
| (1) | Statement of Assets and Liabilities location: Receivable for open forward foreign currency exchange contracts. |
| (2) | Statement of Assets and Liabilities location: Payable for open forward foreign currency exchange contracts. |
The Portfolio's derivative assets and liabilities at fair value by type, which are reported gross in the Statement of Assets and Liabilities, are presented in the table above. The following tables present the Portfolio's derivative assets and liabilities by counterparty, net of amounts available for offset under a master netting agreement and net of the related collateral received by the Portfolio for such assets and pledged by the Portfolio for such liabilities as of April 30, 2024.
| Counterparty | Derivative
Assets Subject to
Master Netting
Agreement | Derivatives
Available
for Offset | Non-cash
Collateral
Received(a) | Cash
Collateral
Received(a) | Net Amount
of Derivative
Assets(b) |
| Goldman Sachs International | $ 14,577 | $ — | $ — | $ (14,577) | $ — |
| State Street Bank and Trust Company | 29,346 | (3,554) | — | — | 25,792 |
| | $43,923 | $(3,554) | $ — | $(14,577) | $25,792 |
| Counterparty | Derivative
Liabilities Subject to
Master Netting
Agreement | Derivatives
Available
for Offset | Non-cash
Collateral
Pledged(a) | Cash
Collateral
Pledged(a) | Net Amount
of Derivative
Liabilities(c) |
| HSBC Bank USA, N.A. | $ (3) | $ — | $ — | $ — | $ (3) |
| State Street Bank and Trust Company | (3,554) | 3,554 | — | — | — |
| | $(3,557) | $3,554 | $ — | $ — | $ (3) |
| (a) | In some instances, the total collateral received and/or pledged may be more than the amount shown due to overcollateralization. |
| (b) | Net amount represents the net amount due from the counterparty in the event of default. |
| (c) | Net amount represents the net amount payable to the counterparty in the event of default. |
High Income Opportunities Portfolio
April 30, 2024
Notes to Financial Statements (Unaudited) — continued
The effect of derivative instruments (not considered to be hedging instruments for accounting disclosure purposes) on the Statement of Operations and whose primary underlying risk exposure is foreign exchange risk for the six months ended April 30, 2024 was as follows:
| Derivative | Realized Gain (Loss)
on Derivatives Recognized
in Income(1) | Change in Unrealized
Appreciation (Depreciation) on
Derivatives Recognized in Income(2) |
| Forward foreign currency exchange contracts | $65,786 | $38,618 |
| (1) | Statement of Operations location: Net realized gain (loss): Forward foreign currency exchange contracts. |
| (2) | Statement of Operations location: Change in unrealized appreciation (depreciation): Forward foreign currency exchange contracts. |
The average notional amount of forward foreign currency exchange contracts (based on the absolute value of notional amounts of currency purchased and currency sold) outstanding during the six months ended April 30, 2024, which is indicative of the volume of this derivative type, was approximately $24,519,000.
7 Line of Credit
The Portfolio participates with other portfolios and funds managed by BMR and its affiliates in a $650 million unsecured revolving line of credit agreement with a group of banks, which is in effect through October 22, 2024. Borrowings are made by the Portfolio solely for temporary purposes related to redemptions and other short-term cash needs. Interest is charged to the Portfolio based on its borrowings at an amount above either the Secured Overnight Financing Rate (SOFR) or Federal Funds rate. In addition, a fee computed at an annual rate of 0.15% on the daily unused portion of the line of credit is allocated among the participating portfolios and funds at the end of each quarter. In connection with the renewal of the agreement in October 2023, an arrangement fee of $150,000 was incurred that was allocated to the participating portfolios and funds. Because the line of credit is not available exclusively to the Portfolio, it may be unable to borrow some or all of its requested amounts at any particular time. The Portfolio did not have any significant borrowings or allocated fees during the six months ended April 30, 2024.
8 Affiliated Investments
At April 30, 2024, the value of the Portfolio's investment in funds that may be deemed to be affiliated was $61,224,349, which represents 4.6% of the Portfolio's net assets. Transactions in such investments by the Portfolio for the six months ended April 30, 2024 were as follows:
| Name | Value,
beginning
of period | Purchases | Sales
proceeds | Net realized
gain (loss) | Change in
unrealized
appreciation
(depreciation) | Value, end
of period | Dividend
income | Shares,
end of period |
| Short-Term Investments |
| Liquidity Fund | $37,843,239 | $374,247,117 | $(350,866,007) | $ — | $ — | $61,224,349 | $1,386,038 | 61,224,349 |
9 Fair Value Measurements
Under generally accepted accounting principles for fair value measurements, a three-tier hierarchy to prioritize the assumptions, referred to as inputs, is used in valuation techniques to measure fair value. The three-tier hierarchy of inputs is summarized in the three broad levels listed below.
| • | Level 1 – quoted prices in active markets for identical investments |
| • | Level 2 – other significant observable inputs (including quoted prices for similar investments, interest rates, prepayment speeds, credit risk, etc.) |
| • | Level 3 – significant unobservable inputs (including a fund's own assumptions in determining the fair value of investments) |
In cases where the inputs used to measure fair value fall in different levels of the fair value hierarchy, the level disclosed is determined based on the lowest level input that is significant to the fair value measurement in its entirety. The inputs or methodology used for valuing securities are not necessarily an indication of the risk associated with investing in those securities.
High Income Opportunities Portfolio
April 30, 2024
Notes to Financial Statements (Unaudited) — continued
At April 30, 2024, the hierarchy of inputs used in valuing the Portfolio’s investments and open derivative instruments, which are carried at fair value, were as follows:
| Asset Description | Level 1 | Level 2 | Level 3* | Total |
| Asset-Backed Securities | $ — | $ 25,223,017 | $ — | $ 25,223,017 |
| Common Stocks | 4,763,000 | 1,104,749 | 1,380,162 | 7,247,911 |
| Convertible Bonds | — | 13,924,933 | — | 13,924,933 |
| Corporate Bonds | — | 1,136,705,036 | — | 1,136,705,036 |
| Exchange-Traded Funds | 10,259,792 | — | — | 10,259,792 |
| Preferred Stocks | 3,892,208 | — | — | 3,892,208 |
| Senior Floating-Rate Loans (Less Unfunded Loan Commitments) | — | 88,211,122 | 2,506,014 | 90,717,136 |
| Miscellaneous | — | 50,199 | 4,285,356 | 4,335,555 |
| Short-Term Investments | 61,224,349 | — | — | 61,224,349 |
| Total Investments | $ 80,139,349 | $ 1,265,219,056 | $ 8,171,532 | $ 1,353,529,937 |
| Forward Foreign Currency Exchange Contracts | $ — | $ 43,923 | $ — | $ 43,923 |
| Total | $ 80,139,349 | $ 1,265,262,979 | $ 8,171,532 | $ 1,353,573,860 |
| Liability Description | | | | |
| Forward Foreign Currency Exchange Contracts | $ — | $ (3,557) | $ — | $ (3,557) |
| Total | $ — | $ (3,557) | $ — | $ (3,557) |
| * | None of the unobservable inputs for Level 3 assets, individually or collectively, had a material impact on the Portfolio. |
Level 3 investments at the beginning and/or end of the period in relation to net assets were not significant and accordingly, a reconciliation of Level 3 assets for the six months ended April 30, 2024 is not presented.
10 Risks and Uncertainties
Credit Risk
The Portfolio primarily invests in lower rated and comparable quality unrated high yield securities. These investments have different risks than investments in debt securities rated investment grade. Risk of loss upon default by the borrower is significantly greater with respect to such debt than with other debt securities because these securities are generally unsecured and are more sensitive to adverse economic conditions, such as recession or increasing interest rates, than are investment grade issuers.
Eaton Vance
High Income Opportunities Fund
April 30, 2024
| Officers of Eaton Vance High Income Opportunities Fund and High Income Opportunities Portfolio |
Kenneth A. Topping
President | Nicholas S. Di Lorenzo
Secretary |
Deidre E. Walsh
Vice President and Chief Legal Officer | Laura T. Donovan
Chief Compliance Officer |
James F. Kirchner
Treasurer | |
| Trustees of Eaton Vance High Income Opportunities Fund and High Income Opportunities Portfolio | |
George J. Gorman
Chairperson | |
| Alan C. Bowser | |
| Mark R. Fetting | |
| Cynthia E. Frost | |
| Valerie A. Mosley | |
| Anchal Pachnanda* | |
| Keith Quinton | |
| Marcus L. Smith | |
| Susan J. Sutherland | |
| Scott E. Wennerholm | |
| Nancy A. Wiser | |
| U.S. Customer Privacy Notice | March 2024 |
| FACTS | WHAT DOES EATON VANCE DO WITH YOUR PERSONAL INFORMATION? |
| Why? | Financial companies choose how they share your personal information. Federal law gives consumers the right to limit some but not all sharing. Federal law also requires us to tell you how we collect, share, and protect your personal information. Please read this notice carefully to understand what we do. |
| |
| What? | The types of personal information we collect and share depend on the product or service you have with us. This information can include:■ Social Security number and income
■ investment experience and risk tolerance
■ checking account information and wire transfer instructions |
| |
| How? | All financial companies need to share customers’ personal information to run their everyday business. In the section below, we list the reasons financial companies can share their customers’ personal information; the reasons Eaton Vance chooses to share; and whether you can limit this sharing. |
| Reasons we can share your personal information | Does Eaton Vance
share? | Can you limit
this sharing? |
| For our everyday business purposes — such as to process your transactions, maintain your account(s), respond to court orders and legal investigations, or report to credit bureaus | Yes | No |
| For our marketing purposes — to offer our products and services to you | Yes | No |
| For joint marketing with other financial companies | No | We don’t share |
| For our affiliates’ everyday business purposes — information about your transactions and experiences | Yes | No* |
| For our affiliates’ everyday business purposes — information about your creditworthiness | Yes | Yes* |
| For our affiliates to market to you | Yes | Yes* |
| For nonaffiliates to market to you | No | We don’t share |
To limit our
sharing | Call toll-free 1-800-262-1122 or email: EVPrivacy@eatonvance.comPlease note:If you are a new customer, we can begin sharing your information 30 days from the date we sent this notice. When you are no longer our customer, we continue to share your information as described in this notice. However, you can contact us at any time to limit our sharing. |
| Questions? | Call toll-free 1-800-262-1122 or email: EVPrivacy@eatonvance.com |
| U.S. Customer Privacy Notice — continued | March 2024 |
| Who we are |
| Who is providing this notice? | Eaton Vance Management and our investment management affiliates (“Eaton Vance”) (see Affiliates definition below.) |
| What we do |
How does Eaton Vance
protect my personal
information? | To protect your personal information from unauthorized access and use, we use security measures that comply with federal law. These measures include computer safeguards and secured files and buildings. We have policies governing the proper handling of customer information by personnel and requiring third parties that provide support to adhere to appropriate security standards with respect to such information. |
How does Eaton Vance
collect my personal
information? | We collect your personal information, for example, when you■ open an account or make deposits or withdrawals from your account
■ buy securities from us or make a wire transfer
■ give us your contact informationWe also collect your personal information from others, such as credit bureaus, affiliates, or other companies. |
| Why can’t I limit all sharing? | Federal law gives you the right to limit only■ sharing for affiliates’ everyday business purposes — information about your creditworthiness
■ affiliates from using your information to market to you
■ sharing for nonaffiliates to market to youState laws and individual companies may give you additional rights to limit sharing. (See below for more on your rights under state law.) |
What happens when I limit
sharing for an account I hold
jointly with someone else? | Your choices will apply to everyone on your account. |
| Definitions |
| Affiliates | Companies related by common ownership or control. They can be financial and nonfinancial companies.■ Our affiliates include registered investment advisers such as Eaton Vance Management, Eaton Vance Advisers International Ltd., Boston Management and Research, Calvert Research and Management, Parametric Portfolio Associates LLC, Atlanta Capital Management Company LLC, Morgan Stanley Investment Management Inc., Morgan Stanley Investment Management Co.; registered broker-dealers such as Morgan Stanley Distributors Inc. and Eaton Vance Distributors, Inc. (together, the “Investment Management Affiliates”); and companies with a Morgan Stanley name and financial companies such as Morgan Stanley Smith Barney LLC and Morgan Stanley & Co. (the “Morgan Stanley Affiliates”). |
| Nonaffiliates | Companies not related by common ownership or control. They can be financial and nonfinancial companies.■ Eaton Vance does not share with nonaffiliates so they can market to you. |
| Joint marketing | A formal agreement between nonaffiliated financial companies that together market financial products or services to you.■ Eaton Vance does not jointly market. |
| U.S. Customer Privacy Notice — continued | March 2024 |
| Other important information |
| *PLEASE NOTE: Eaton Vance does not share your creditworthiness information or your transactions and experiences information with the Morgan Stanley Affiliates, nor does Eaton Vance enable the Morgan Stanley Affiliates to market to you. Your opt outs will prevent Eaton Vance from sharing your creditworthiness information with the Investment Management Affiliates and will prevent the Investment Management Affiliates from marketing their products to you.Vermont: Except as permitted by law, we will not share personal information we collect about Vermont residents with Nonaffiliates unless you provide us with your written consent to share such information.California: Except as permitted by law, we will not share personal information we collect about California residents with Nonaffiliates and we will limit sharing such personal information with our Affiliates to comply with California privacy laws that apply to us. |
Delivery of Shareholder Documents. The Securities and Exchange Commission (SEC) permits funds to deliver only one copy of shareholder documents, including prospectuses, proxy statements and shareholder reports, to fund investors with multiple accounts at the same residential or post office box address. This practice is often called “householding” and it helps eliminate duplicate mailings to shareholders. Eaton Vance, or your financial intermediary, may household the mailing of your documents indefinitely unless you instruct Eaton Vance, or your financial intermediary, otherwise. If you would prefer that your Eaton Vance documents not be householded, please contact Eaton Vance at 1-800-262-1122, or contact your financial intermediary. Your instructions that householding not apply to delivery of your Eaton Vance documents will typically be effective within 30 days of receipt by Eaton Vance or your financial intermediary.
Portfolio Holdings. Each Eaton Vance Fund and its underlying Portfolio(s) (if applicable) files a schedule of portfolio holdings on Part F to Form N-PORT with the SEC. Certain information filed on Form N-PORT may be viewed on the Eaton Vance website at www.eatonvance.com, by calling Eaton Vance at 1-800-262-1122 or in the EDGAR database on the SEC’s website at www.sec.gov.
Proxy Voting. From time to time, funds are required to vote proxies related to the securities held by the funds. The Eaton Vance Funds or their underlying Portfolios (if applicable) vote proxies according to a set of policies and procedures approved by the Funds’ and Portfolios’ Boards. You may obtain a description of these policies and procedures and information on how the Funds or Portfolios voted proxies relating to portfolio securities during the most recent 12-month period ended June 30, without charge, upon request, by calling 1-800-262-1122 and by accessing the SEC’s website at www.sec.gov.
Tailored Shareholder Reports. Effective January 24, 2023, the SEC adopted rule and form amendments to require open-end mutual funds and ETFs to transmit concise and visually engaging streamlined annual and semi-annual reports to shareholders that highlight key information. Other information, including financial statements, will no longer appear in a streamlined shareholder report but must be available online, delivered free of charge upon request, and filed on a semi-annual basis on Form N-CSR. The rule and form amendments have a compliance date of July 24, 2024. At this time, management is evaluating the impact of these amendments on the shareholder reports for the Eaton Vance Funds.
Investment Adviser of High Income Opportunities Portfolio
Boston Management and Research
One Post Office Square
Boston, MA 02109
Investment Sub-Adviser of High Income Opportunities Portfolio
and Eaton Vance High Income Opportunities Fund
Eaton Vance Advisers International Ltd.
125 Old Broad Street
London, EC2N 1AR
United Kingdom
Investment Adviser and Administrator of Eaton Vance High
Income Opportunities Fund
Eaton Vance Management
One Post Office Square
Boston, MA 02109
Principal Underwriter*
Eaton Vance Distributors, Inc.
One Post Office Square
Boston, MA 02109
(617) 482-8260
Custodian
State Street Bank and Trust Company
One Congress Street, Suite 1
Boston, MA 02114-2016
Transfer Agent
BNY Mellon Investment Servicing (US) Inc.
Attn: Eaton Vance Funds
P.O. Box 534439
Pittsburgh, PA 15253-4439
(800) 262-1122
Fund Offices
One Post Office Square
Boston, MA 02109
* FINRA BrokerCheck. Investors may check the background of their Investment Professional by contacting the Financial Industry Regulatory Authority (FINRA). FINRA BrokerCheck is a free tool to help investors check the professional background of current and former FINRA-registered securities firms and brokers. FINRA BrokerCheck is available by calling 1-800-289-9999 and at www.FINRA.org. The FINRA BrokerCheck brochure describing this program is available to investors at www.FINRA.org.
Eaton Vance
Global Sovereign Opportunities Fund
Semi-Annual Report
April 30, 2024
Commodity Futures Trading Commission Registration. The Commodity Futures Trading Commission (“CFTC”) has adopted regulations that subject registered investment companies and advisers to regulation by the CFTC if a fund invests more than a prescribed level of its assets in certain CFTC-regulated instruments (including futures, certain options and swap agreements) or markets itself as providing investment exposure to such instruments. The investment adviser has claimed an exclusion from the definition of “commodity pool operator” under the Commodity Exchange Act with respect to its management of the Fund. Accordingly, neither the Fund nor the adviser with respect to the operation of the Fund is subject to CFTC regulation. Because of its management of other strategies, the Fund's adviser is registered with the CFTC as a commodity pool operator. The adviser is also registered as a commodity trading advisor.
Fund shares are not insured by the FDIC and are not deposits or other obligations of, or guaranteed by, any depository institution. Shares are subject to investment risks, including possible loss of principal invested.
This report must be preceded or accompanied by a current summary prospectus or prospectus. Before investing, investors should consider carefully the investment objective, risks, and charges and expenses of a mutual fund. This and other important information is contained in the summary prospectus and prospectus, which can be obtained from a financial intermediary. Prospective investors should read the prospectus carefully before investing. For further information, please call 1-800-262-1122.
Semi-Annual Report April 30, 2024
Eaton Vance
Global Sovereign Opportunities Fund
Eaton Vance
Global Sovereign Opportunities Fund
April 30, 2024
Performance
Portfolio Manager(s) Kyle Lee, CFA, Patrick Campbell, CFA and Brian Shaw, CFA
| % Average Annual Total Returns1,2 | Class
Inception Date | Performance
Inception Date | Six Months | One Year | Five Years | Ten Years |
| Class A at NAV | 06/27/2007 | 06/27/2007 | 3.31% | (2.48)% | (0.72)% | 0.25% |
| Class A with 3.25% Maximum Sales Charge | — | — | (0.03) | (5.66) | (1.38) | (0.08) |
| Class C at NAV | 03/01/2011 | 06/27/2007 | 2.92 | (3.20) | (1.42) | (0.31) |
| Class C with 1% Maximum Deferred Sales Charge | — | — | 1.92 | (4.13) | (1.42) | (0.31) |
| Class I at NAV | 03/01/2011 | 06/27/2007 | 3.28 | (2.40) | (0.45) | 0.53 |
|
| FTSE World Government Bond Index (WGBI) | — | — | 3.87% | (3.81)% | (2.62)% | (1.18)% |
| Blended Index | — | — | 3.91 | (2.70) | (2.09) | (1.01) |
| % Total Annual Operating Expense Ratios3 | Class A | Class C | Class I |
| Gross | 2.03% | 2.75% | 1.75% |
| Net | 1.00 | 1.72 | 0.72 |
See Endnotes and Additional Disclosures in this report.
Past performance is no guarantee of future results. Returns are historical and are calculated by determining the percentage change in net asset value (NAV) or offering price (as applicable) with all distributions reinvested. Furthermore, returns do not reflect the deduction of taxes that shareholders may have to pay on Fund distributions or upon the redemption of Fund shares. Investment return and principal value will fluctuate so that shares, when redeemed, may be worth more or less than their original cost. Performance for periods less than or equal to one year is cumulative. Performance is for the stated time period only; due to market volatility, current Fund performance may be lower or higher than the quoted return. For performance as of the most recent month-end, please refer to eatonvance.com.
Eaton Vance
Global Sovereign Opportunities Fund
April 30, 2024
| Asset Allocation (% of net assets)1 |
| Foreign Currency Exposures (% of net assets)2 |
| Japan | 13.7% |
| Serbia | 9.1 |
| Turkey | 8.6 |
| Egypt | 8.6 |
| Iceland | 8.5 |
| India | 8.2 |
| Poland | 7.4 |
| Hungary | 6.0 |
| Singapore | 5.7 |
| Dominican Republic | 5.4 |
| Taiwan | 5.2 |
| Mexico | 5.0 |
| United Kingdom | 4.8 |
| South Korea | 4.6 |
| Australia | 4.6 |
| Canada | 4.5 |
| Uruguay | 3.3 |
| Indonesia | 2.8 |
| Brazil | 2.5 |
| Paraguay | 2.5 |
| Czech Republic | 1.1 |
| Peru | 1.1 |
| Other | 1.0 4 |
| Thailand | -2.9 |
| Hong Kong | -3.4 |
| Philippines | -4.5 |
| New Zealand | -5.2 |
| Euro | -6.2 |
| South Africa | -12.3 |
| China | -13.8 |
| Total Long | 124.2% |
| Total Short | -48.3% |
| Total Net | 75.9% |
Fund invests in an affiliated investment company (Portfolio) with the same objective(s) and policies as the Fund. References to investments are to the Portfolio’s holdings.
Footnotes:
1 Other Net Assets represents other assets less liabilities and includes any investment type that represents less than 1% of net assets.
2 Currency exposures include all foreign exchange denominated assets and currency derivatives. Total exposures may exceed 100% due to implicit leverage created by derivatives.
3 Net of securities sold short.
4 Includes amounts each less than 1.0% or –1.0%, as applicable.
Eaton Vance
Global Sovereign Opportunities Fund
April 30, 2024
Endnotes and Additional Disclosures
| 1 | FTSE World Government Bond Index (WGBI) measures the performance of fixed-rate, local currency, investment-grade sovereign bonds. The Blended Index consists of 80% FTSE World Government Bond Index and 20% J.P. Morgan Government Bond Index: Emerging Market Global Diversified (JPM GBI-EM GD), rebalanced monthly. J.P. Morgan Government Bond Index: Emerging Market Global Diversified (JPM GBI-EM GD) is an unmanaged index of local currency bonds with maturities of more than one year issued by emerging markets governments. Information has been obtained from sources believed to be reliable but J.P. Morgan does not warrant its completeness or accuracy. The indexes are used with permission. The indexes may not be copied, used, or distributed without J.P. Morgan’s prior written approval. Copyright 2021, J.P. Morgan Chase & Co. All rights reserved. Unless otherwise stated, index returns do not reflect the effect of any applicable sales charges, commissions, expenses, taxes or leverage, as applicable. It is not possible to invest directly in an index. |
| 2 | Total Returns at NAV do not include applicable sales charges. If sales charges were deducted, the returns would be lower. Total Returns shown with maximum sales charge reflect the stated maximum sales charge. Unless otherwise stated, performance does not reflect the deduction of taxes on Fund distributions or redemptions of Fund shares.Effective November 5, 2020, Class C shares automatically convert to Class A shares eight years after purchase. The average annual total returns listed for Class C reflect conversion to Class A shares after eight years. Prior to November 5, 2020, Class C shares automatically converted to Class A shares ten years after purchase. |
| 3 | Source: Fund prospectus. Net expense ratios reflect a contractual expense reimbursement that continues through 3/1/25. The expense ratios for the current reporting period can be found in the Financial Highlights section of this report. Performance reflects expenses waived and/or reimbursed, if applicable. Without such waivers and/or reimbursements, performance would have been lower. |
| | Fund profile subject to change due to active management. |
Eaton Vance
Global Sovereign Opportunities Fund
April 30, 2024
Example
As a Fund shareholder, you incur two types of costs: (1) transaction costs, including sales charges (loads) on purchases; and (2) ongoing costs, including management fees; distribution and/or service fees; and other Fund expenses. This Example is intended to help you understand your ongoing costs (in dollars) of Fund investing and to compare these costs with the ongoing costs of investing in other mutual funds. The Example is based on an investment of $1,000 invested at the beginning of the period and held for the entire period (November 1, 2023 to April 30, 2024).
Actual Expenses
The first section of the table below provides information about actual account values and actual expenses. You may use the information in this section, together with the amount you invested, to estimate the expenses that you paid over the period. Simply divide your account value by $1,000 (for example, an $8,600 account value divided by $1,000 = 8.6), then multiply the result by the number in the first section under the heading entitled “Expenses Paid During Period” to estimate the expenses you paid on your account during this period.
Hypothetical Example for Comparison Purposes
The second section of the table below provides information about hypothetical account values and hypothetical expenses based on the actual Fund expense ratio and an assumed rate of return of 5% per year (before expenses), which is not the actual Fund return. The hypothetical account values and expenses may not be used to estimate the actual ending account balance or expenses you paid for the period. You may use this information to compare the ongoing costs of investing in your Fund and other funds. To do so, compare this 5% hypothetical example with the 5% hypothetical examples that appear in the shareholder reports of the other funds.
Please note that the expenses shown in the table are meant to highlight your ongoing costs only and do not reflect any transactional costs, such as sales charges (loads). Therefore, the second section of the table is useful in comparing ongoing costs only, and will not help you determine the relative total costs of owning different funds. In addition, if these transactional costs were included, your costs would be higher.
| | Beginning
Account Value
(11/1/23) | Ending
Account Value
(4/30/24) | Expenses Paid
During Period*
(11/1/23 – 4/30/24) | Annualized
Expense
Ratio |
| Actual | | | | |
| Class A | $1,000.00 | $1,033.10 | $ 6.72** | 1.33% |
| Class C | $1,000.00 | $1,029.20 | $10.49** | 2.08% |
| Class I | $1,000.00 | $1,032.80 | $ 5.46** | 1.08% |
| |
| Hypothetical | | | | |
| (5% return per year before expenses) | | | | |
| Class A | $1,000.00 | $1,018.25 | $ 6.67** | 1.33% |
| Class C | $1,000.00 | $1,014.52 | $10.42** | 2.08% |
| Class I | $1,000.00 | $1,019.49 | $ 5.42** | 1.08% |
| * | Expenses are equal to the Fund’s annualized expense ratio for the indicated Class, multiplied by the average account value over the period, multiplied by 182/366 (to reflect the one-half year period). The Example assumes that the $1,000 was invested at the net asset value per share determined at the close of business on October 31, 2023. The Example reflects the expenses of both the Fund and the Portfolio. |
| ** | Absent an allocation of certain expenses to affiliate(s), expenses would be higher. |
Eaton Vance
Global Sovereign Opportunities Fund
April 30, 2024
Statement of Assets and Liabilities (Unaudited)
| | April 30, 2024 |
| Assets | |
| Investment in International Income Portfolio, at value (identified cost $33,457,668) | $ 32,074,637 |
| Receivable for Fund shares sold | 17,300 |
| Receivable from affiliates | 21,631 |
| Total assets | $ 32,113,568 |
| Liabilities | |
| Payable for Fund shares redeemed | $ 1,725 |
| Payable to affiliates: | |
| Distribution and service fees | 2,790 |
| Trustees' fees | 42 |
| Payable for custodian fee | 11,629 |
| Payable for transfer and dividend disbursing agent fees | 8,671 |
| Payable for legal and accounting services | 17,803 |
| Accrued expenses | 4,017 |
| Total liabilities | $ 46,677 |
| Net Assets | $ 32,066,891 |
| Sources of Net Assets | |
| Paid-in capital | $ 70,108,647 |
| Accumulated loss | (38,041,756) |
| Net Assets | $ 32,066,891 |
| Class A Shares | |
| Net Assets | $ 10,254,810 |
| Shares Outstanding | 1,615,456 |
Net Asset Value and Redemption Price Per Share
(net assets ÷ shares of beneficial interest outstanding) | $ 6.35 |
Maximum Offering Price Per Share
(100 ÷ 96.75 of net asset value per share) | $ 6.56 |
| Class C Shares | |
| Net Assets | $ 762,401 |
| Shares Outstanding | 120,104 |
Net Asset Value and Offering Price Per Share*
(net assets ÷ shares of beneficial interest outstanding) | $ 6.35 |
| Class I Shares | |
| Net Assets | $ 21,049,680 |
| Shares Outstanding | 3,328,528 |
Net Asset Value, Offering Price and Redemption Price Per Share
(net assets ÷ shares of beneficial interest outstanding) | $ 6.32 |
| On sales of $100,000 or more, the offering price of Class A shares is reduced. |
| * | Redemption price per share is equal to the net asset value less any applicable contingent deferred sales charge. |
6
See Notes to Financial Statements.
Eaton Vance
Global Sovereign Opportunities Fund
April 30, 2024
Statement of Operations (Unaudited)
| | Six Months Ended |
| | April 30, 2024 |
| Investment Income | |
| Dividend income allocated from Portfolio | $ 41,492 |
| Interest income allocated from Portfolio (net of foreign taxes withheld of $5,733) | 1,105,446 |
| Expenses, excluding interest expense, allocated from Portfolio | (122,642) |
| Interest expense allocated from Portfolio | (68,424) |
| Total investment income from Portfolio | $ 955,872 |
| Expenses | |
| Distribution and service fees: | |
| Class A | $ 13,835 |
| Class C | 4,513 |
| Trustees’ fees and expenses | 250 |
| Custodian fee | 9,910 |
| Transfer and dividend disbursing agent fees | 21,704 |
| Legal and accounting services | 23,272 |
| Printing and postage | 8,024 |
| Registration fees | 26,188 |
| Miscellaneous | 7,057 |
| Total expenses | $ 114,753 |
| Deduct: | |
| Waiver and/or reimbursement of expenses by affiliates | $ 96,536 |
| Total expense reductions | $ 96,536 |
| Net expenses | $ 18,217 |
| Net investment income | $ 937,655 |
| Realized and Unrealized Gain (Loss) from Portfolio | |
| Net realized gain (loss): | |
| Investment transactions (net of foreign capital gains taxes of $9,008) | $ (793,827) |
| Written options and swaptions | 7,930 |
| Securities sold short | (53,616) |
| Futures contracts | (161,663) |
| Swap contracts | (244,070) |
| Foreign currency transactions | (14,660) |
| Forward foreign currency exchange contracts | (334,788) |
| Net realized loss | $(1,594,694) |
| Change in unrealized appreciation (depreciation): | |
| Investments (including net increase in accrued foreign capital gains taxes of $10) | $ 1,563,926 |
| Written options and swaptions | 40,415 |
| Securities sold short | 58,499 |
| Futures contracts | 37,448 |
| Swap contracts | 430,339 |
| Foreign currency | 11,552 |
| Forward foreign currency exchange contracts | 4,227 |
| Net change in unrealized appreciation (depreciation) | $ 2,146,406 |
| Net realized and unrealized gain | $ 551,712 |
| Net increase in net assets from operations | $ 1,489,367 |
7
See Notes to Financial Statements.
Eaton Vance
Global Sovereign Opportunities Fund
April 30, 2024
Statements of Changes in Net Assets
| | Six Months Ended
April 30, 2024
(Unaudited) | Year Ended
October 31, 2023 |
| Increase (Decrease) in Net Assets | | |
| From operations: | | |
| Net investment income | $ 937,655 | $ 1,735,231 |
| Net realized loss | (1,594,694) | (3,196,103) |
| Net change in unrealized appreciation (depreciation) | 2,146,406 | 3,004,069 |
| Net increase in net assets from operations | $ 1,489,367 | $ 1,543,197 |
| Distributions to shareholders: | | |
| Class A | $ (256,147) | $ — |
| Class C | (17,061) | — |
| Class I | (570,115) | — |
| Total distributions to shareholders | $ (843,323) | $ — |
| Tax return of capital to shareholders: | | |
| Class A | $ — | $ (549,647) |
| Class C | — | (46,885) |
| Class I | — | (1,223,106) |
| Total tax return of capital to shareholders | $ — | $ (1,819,638) |
| Transactions in shares of beneficial interest: | | |
| Class A | $ (780,718) | $ (788,165) |
| Class C | (228,016) | (302,582) |
| Class I | (3,596,823) | 8,983,730 |
| Net increase (decrease) in net assets from Fund share transactions | $ (4,605,557) | $ 7,892,983 |
| Net increase (decrease) in net assets | $ (3,959,513) | $ 7,616,542 |
| Net Assets | | |
| At beginning of period | $ 36,026,404 | $ 28,409,862 |
| At end of period | $32,066,891 | $36,026,404 |
8
See Notes to Financial Statements.
Eaton Vance
Global Sovereign Opportunities Fund
April 30, 2024
| | Class A |
| | Six Months Ended
April 30, 2024
(Unaudited) | Year Ended October 31, |
| | 2023 | 2022 | 2021 | 2020 | 2019 |
| Net asset value — Beginning of period | $ 6.290 | $ 6.190 | $ 7.960 | $ 8.440 | $ 8.510 | $ 8.500 |
| Income (Loss) From Operations | | | | | | |
| Net investment income(1) | $ 0.171 | $ 0.292 | $ 0.207 | $ 0.132 | $ 0.176 | $ 0.295 |
| Net realized and unrealized gain (loss) | 0.043 | 0.113 (2) | (1.675) | (0.150) | 0.292 | 0.174 |
| Total income (loss) from operations | $ 0.214 | $ 0.405 | $ (1.468) | $ (0.018) | $ 0.468 | $ 0.469 |
| Less Distributions | | | | | | |
| From net investment income | $ (0.154) | $ — | $ — | $ (0.146) | $ (0.378) | $ (0.459) |
| Tax return of capital | — | (0.305) | (0.302) | (0.316) | (0.160) | — |
| Total distributions | $ (0.154) | $ (0.305) | $ (0.302) | $ (0.462) | $ (0.538) | $ (0.459) |
| Net asset value — End of period | $ 6.350 | $ 6.290 | $ 6.190 | $ 7.960 | $ 8.440 | $ 8.510 |
| Total Return(3)(4) | 3.31% (5) | 6.55% | (18.94)% | (0.38)% | 5.72% | 5.62% |
| Ratios/Supplemental Data | | | | | | |
| Net assets, end of period (000’s omitted) | $10,255 | $10,889 | $11,466 | $20,539 | $18,354 | $18,677 |
| Ratios (as a percentage of average daily net assets):(6) | | | | | | |
| Expenses (4) | 1.33% (7)(8)(9) | 1.00% (7)(9) | 1.02% (7)(9) | 1.01% (7) | 1.01% (7) | 1.11% (7) |
| Net investment income | 5.17% (8) | 4.37% | 2.89% | 1.57% | 2.09% | 3.43% |
| Portfolio Turnover of the Portfolio | 119% (5)(10) | 230% (10) | 159% (10) | 102% (10) | 88% (10) | 92% |
| (1) | Computed using average shares outstanding. |
| (2) | The per share amount is not in accord with the net realized and unrealized gain (loss) for the period because of the timing of sales of Fund shares and the amount of the per share realized and unrealized gains and losses at such time. |
| (3) | Returns are historical and are calculated by determining the percentage change in net asset value with all distributions reinvested and do not reflect the effect of sales charges. |
| (4) | The investment adviser and administrator of the Fund and the investment adviser of the Portfolio reimbursed certain operating expenses (equal to 1.06%, 1.03%, 0.86%, 0.49%, 0.49% and 0.40% of average daily net assets for the six months ended April 30, 2024 and the years ended October 31, 2023, 2022, 2021, 2020 and 2019, respectively). Absent this reimbursement, total return would be lower. |
| (5) | Not annualized. |
| (6) | Includes the Fund’s share of the Portfolio's allocated expenses. |
| (7) | Includes interest expense, including on securities sold short and/or reverse repurchase agreements if applicable, of 0.38%, 0.03% and 0.02% of average daily net assets for the six months ended April 30, 2024 and the years ended October 31, 2023 and 2022, respectively, and 0.01% of average daily net assets for each of the years ended October 31, 2021, 2020 and 2019. |
| (8) | Annualized. |
| (9) | Includes a reduction by the investment adviser of a portion of the Portfolio’s adviser fee due to the Portfolio’s investment in the Liquidity Fund (equal to less than 0.01%, 0.01% and less than 0.005% of average daily net assets for the six months ended April 30, 2024 and the years ended October 31,
2023 and 2022, respectively). |
| (10) | Includes the effect of To Be Announced (TBA) transactions. |
9
See Notes to Financial Statements.
Eaton Vance
Global Sovereign Opportunities Fund
April 30, 2024
Financial Highlights — continued
| | Class C |
| | Six Months Ended
April 30, 2024
(Unaudited) | Year Ended October 31, |
| | 2023 | 2022 | 2021 | 2020 | 2019 |
| Net asset value — Beginning of period | $ 6.290 | $ 6.190 | $ 7.960 | $ 8.440 | $ 8.510 | $ 8.500 |
| Income (Loss) From Operations | | | | | | |
| Net investment income(1) | $ 0.147 | $ 0.244 | $ 0.157 | $ 0.068 | $ 0.123 | $ 0.237 |
| Net realized and unrealized gain (loss) | 0.042 | 0.113 (2) | (1.674) | (0.146) | 0.286 | 0.171 |
| Total income (loss) from operations | $ 0.189 | $ 0.357 | $(1.517) | $(0.078) | $ 0.409 | $ 0.408 |
| Less Distributions | | | | | | |
| From net investment income | $ (0.129) | $ — | $ — | $ (0.127) | $ (0.336) | $ (0.398) |
| Tax return of capital | — | (0.257) | (0.253) | (0.275) | (0.143) | — |
| Total distributions | $(0.129) | $(0.257) | $(0.253) | $(0.402) | $(0.479) | $(0.398) |
| Net asset value — End of period | $ 6.350 | $ 6.290 | $ 6.190 | $ 7.960 | $ 8.440 | $ 8.510 |
| Total Return(3)(4) | 2.92% (5) | 5.79% | (19.50)% | (1.09)% | 4.98% | 4.88% |
| Ratios/Supplemental Data | | | | | | |
| Net assets, end of period (000’s omitted) | $ 762 | $ 970 | $ 1,238 | $ 2,115 | $ 5,173 | $ 9,517 |
| Ratios (as a percentage of average daily net assets):(6) | | | | | | |
| Expenses (4) | 2.08% (7)(8)(9) | 1.72% (7)(9) | 1.72% (7)(9) | 1.71% (7) | 1.71% (7) | 1.81% (7) |
| Net investment income | 4.44% (8) | 3.66% | 2.20% | 0.80% | 1.47% | 2.76% |
| Portfolio Turnover of the Portfolio | 119% (5)(10) | 230% (10) | 159% (10) | 102% (10) | 88% (10) | 92% |
| (1) | Computed using average shares outstanding. |
| (2) | The per share amount is not in accord with the net realized and unrealized gain (loss) for the period because of the timing of sales of Fund shares and the amount of the per share realized and unrealized gains and losses at such time. |
| (3) | Returns are historical and are calculated by determining the percentage change in net asset value with all distributions reinvested and do not reflect the effect of sales charges. |
| (4) | The investment adviser and administrator of the Fund and the investment adviser of the Portfolio reimbursed certain operating expenses (equal to 1.06%, 1.03%, 0.86%, 0.49%, 0.49% and 0.40% of average daily net assets for the six months ended April 30, 2024 and the years ended October 31, 2023, 2022, 2021, 2020 and 2019, respectively). Absent this reimbursement, total return would be lower. |
| (5) | Not annualized. |
| (6) | Includes the Fund’s share of the Portfolio's allocated expenses. |
| (7) | Includes interest expense, including on securities sold short and/or reverse repurchase agreements if applicable, of 0.38%, 0.03% and 0.02% of average daily net assets for the six months ended April 30, 2024 and the years ended October 31, 2023 and 2022, respectively, and 0.01% of average daily net assets for each of the years ended October 31, 2021, 2020 and 2019. |
| (8) | Annualized. |
| (9) | Includes a reduction by the investment adviser of a portion of the Portfolio’s adviser fee due to the Portfolio’s investment in the Liquidity Fund (equal to less than 0.01%, 0.01% and less than 0.005% of average daily net assets for the six months ended April 30, 2024 and the years ended October 31,
2023 and 2022, respectively). |
| (10) | Includes the effect of To Be Announced (TBA) transactions. |
10
See Notes to Financial Statements.
Eaton Vance
Global Sovereign Opportunities Fund
April 30, 2024
Financial Highlights — continued
| | Class I |
| | Six Months Ended
April 30, 2024
(Unaudited) | Year Ended October 31, |
| | 2023 | 2022 | 2021 | 2020 | 2019 |
| Net asset value — Beginning of period | $ 6.270 | $ 6.160 | $ 7.930 | $ 8.410 | $ 8.480 | $ 8.480 |
| Income (Loss) From Operations | | | | | | |
| Net investment income(1) | $ 0.179 | $ 0.311 | $ 0.224 | $ 0.156 | $ 0.213 | $ 0.319 |
| Net realized and unrealized gain (loss) | 0.032 | 0.122 (2) | (1.671) | (0.151) | 0.279 | 0.164 |
| Total income (loss) from operations | $ 0.211 | $ 0.433 | $ (1.447) | $ 0.005 | $ 0.492 | $ 0.483 |
| Less Distributions | | | | | | |
| From net investment income | $ (0.161) | $ — | $ — | $ (0.152) | $ (0.395) | $ (0.483) |
| Tax return of capital | — | (0.323) | (0.323) | (0.333) | (0.167) | — |
| Total distributions | $ (0.161) | $ (0.323) | $ (0.323) | $ (0.485) | $ (0.562) | $ (0.483) |
| Net asset value — End of period | $ 6.320 | $ 6.270 | $ 6.160 | $ 7.930 | $ 8.410 | $ 8.480 |
| Total Return(3)(4) | 3.28% (5) | 6.86% | (18.65)% | (0.11)% | 6.04% | 5.82% |
| Ratios/Supplemental Data | | | | | | |
| Net assets, end of period (000’s omitted) | $21,050 | $24,167 | $15,706 | $35,316 | $33,597 | $56,451 |
| Ratios (as a percentage of average daily net assets):(6) | | | | | | |
| Expenses (4) | 1.08% (7)(8)(9) | 0.72% (7)(9) | 0.72% (7)(9) | 0.71% (7) | 0.71% (7) | 0.81% (7) |
| Net investment income | 5.42% (8) | 4.67% | 3.11% | 1.86% | 2.54% | 3.73% |
| Portfolio Turnover of the Portfolio | 119% (5)(10) | 230% (10) | 159% (10) | 102% (10) | 88% (10) | 92% |
| (1) | Computed using average shares outstanding. |
| (2) | The per share amount is not in accord with the net realized and unrealized gain (loss) for the period because of the timing of sales of Fund shares and the amount of the per share realized and unrealized gains and losses at such time. |
| (3) | Returns are historical and are calculated by determining the percentage change in net asset value with all distributions reinvested. |
| (4) | The investment adviser and administrator of the Fund and the investment adviser of the Portfolio reimbursed certain operating expenses (equal to 1.06%, 1.03%, 0.86%, 0.49%, 0.49% and 0.40% of average daily net assets for the six months ended April 30, 2024 and the years ended October 31, 2023, 2022, 2021, 2020 and 2019, respectively). Absent this reimbursement, total return would be lower. |
| (5) | Not annualized. |
| (6) | Includes the Fund’s share of the Portfolio's allocated expenses. |
| (7) | Includes interest expense, including on securities sold short and/or reverse repurchase agreements if applicable, of 0.38%, 0.03% and 0.02% of average daily net assets for the six months ended April 30, 2024 and the years ended October 31, 2023 and 2022, respectively, and 0.01% of average daily net assets for each of the years ended October 31, 2021, 2020 and 2019. |
| (8) | Annualized. |
| (9) | Includes a reduction by the investment adviser of a portion of the Portfolio’s adviser fee due to the Portfolio’s investment in the Liquidity Fund (equal to less than 0.01%, 0.01% and less than 0.005% of average daily net assets for the six months ended April 30, 2024 and the years ended October 31,
2023 and 2022, respectively). |
| (10) | Includes the effect of To Be Announced (TBA) transactions. |
11
See Notes to Financial Statements.
Eaton Vance
Global Sovereign Opportunities Fund
April 30, 2024
Notes to Financial Statements (Unaudited)
1 Significant Accounting Policies
Eaton Vance Global Sovereign Opportunities Fund (the Fund) is a diversified series of Eaton Vance Mutual Funds Trust (the Trust). The Trust is a Massachusetts business trust registered under the Investment Company Act of 1940, as amended (the 1940 Act), as an open-end management investment company. The Fund offers three classes of shares. Class A shares are generally sold subject to a sales charge imposed at time of purchase. Class C shares are sold at net asset value and are generally subject to a contingent deferred sales charge (see Note 5). Effective November 5, 2020, Class C shares automatically convert to Class A shares eight years after their purchase as described in the Fund’s prospectus. Class I shares are sold at net asset value and are not subject to a sales charge. Each class represents a pro rata interest in the Fund, but votes separately on class-specific matters and (as noted below) is subject to different expenses. Realized and unrealized gains and losses and net investment income and losses, other than class-specific expenses, are allocated daily to each class of shares based on the relative net assets of each class to the total net assets of the Fund. Each class of shares differs in its distribution plan and certain other class-specific expenses. The Fund invests its assets in interests in International Income Portfolio (the Portfolio), a Massachusetts business trust, having the same investment objective and policies as the Fund. The value of the Fund’s investment in the Portfolio reflects the Fund’s proportionate interest in the net assets of the Portfolio (approximately 100% at April 30, 2024). The performance of the Fund is directly affected by the performance of the Portfolio. The financial statements of the Portfolio, including the portfolio of investments, are included elsewhere in this report and should be read in conjunction with the Fund’s financial statements.
The following is a summary of significant accounting policies of the Fund. The policies are in conformity with accounting principles generally accepted in the United States of America (U.S. GAAP). The Fund is an investment company and follows accounting and reporting guidance in the Financial Accounting Standards Board (FASB) Accounting Standards Codification Topic 946.
A Investment Valuation—Valuation of securities by the Portfolio is discussed in Note 1A of the Portfolio's Notes to Financial Statements, which are included elsewhere in this report.
B Income—The Fund's net investment income or loss consists of the Fund's pro rata share of the net investment income or loss of the Portfolio, less all actual and accrued expenses of the Fund.
C Federal and Other Taxes —The Fund's policy is to comply with the provisions of the Internal Revenue Code applicable to regulated investment companies and to distribute to shareholders each year substantially all of its net investment income, and all or substantially all of its net realized capital gains. Accordingly, no provision for federal income or excise tax is necessary.
As of April 30, 2024, the Fund had no uncertain tax positions that would require financial statement recognition, de-recognition, or disclosure. The Fund files a U.S. federal income tax return annually after its fiscal year-end, which is subject to examination by the Internal Revenue Service for a period of three years from the date of filing.
D Expenses—The majority of expenses of the Trust are directly identifiable to an individual fund. Expenses which are not readily identifiable to a specific fund are allocated taking into consideration, among other things, the nature and type of expense and the relative size of the funds.
E Use of Estimates—The preparation of the financial statements in conformity with U.S. GAAP requires management to make estimates and assumptions that affect the reported amounts of assets and liabilities at the date of the financial statements and the reported amounts of income and expense during the reporting period. Actual results could differ from those estimates.
F Indemnifications—Under the Trust’s organizational documents, its officers and Trustees may be indemnified against certain liabilities and expenses arising out of the performance of their duties to the Fund. Under Massachusetts law, if certain conditions prevail, shareholders of a Massachusetts business trust (such as the Trust) could be deemed to have personal liability for the obligations of the Trust. However, the Trust’s Declaration of Trust contains an express disclaimer of liability on the part of Fund shareholders and the By-laws provide that the Trust shall assume, upon request by the shareholder, the defense on behalf of any Fund shareholders. Moreover, the By-laws also provide for indemnification out of Fund property of any shareholder held personally liable solely by reason of being or having been a shareholder for all loss or expense arising from such liability. Additionally, in the normal course of business, the Fund enters into agreements with service providers that may contain indemnification clauses. The Fund’s maximum exposure under these arrangements is unknown as this would involve future claims that may be made against the Fund that have not yet occurred.
G Other—Investment transactions are accounted for on a trade date basis.
H Interim Financial Statements—The interim financial statements relating to April 30, 2024 and for the six months then ended have not been audited by an independent registered public accounting firm, but in the opinion of the Fund’s management, reflect all adjustments, consisting only of normal recurring adjustments, necessary for the fair presentation of the financial statements.
Eaton Vance
Global Sovereign Opportunities Fund
April 30, 2024
Notes to Financial Statements (Unaudited) — continued
2 Distributions to Shareholders and Income Tax Information
The Fund expects to pay any required income distributions monthly and intends to distribute annually all or substantially all of its net realized capital gains. The Fund may include in its distributions amounts attributable to the imputed interest on foreign currency exposures and certain other derivative positions which, in certain circumstances, may result in a return of capital for federal income tax purposes. Distributions to shareholders are recorded on the ex-dividend date. Distributions are declared separately for each class of shares. Shareholders may reinvest income and capital gain distributions in additional shares of the same class of the Fund at the net asset value as of the ex-dividend date or, at the election of the shareholder, receive distributions in cash. Distributions to shareholders are determined in accordance with income tax regulations, which may differ from U.S. GAAP. As required by U.S. GAAP, only distributions in excess of tax basis earnings and profits are reported in the financial statements as a return of capital. Permanent differences between book and tax accounting relating to distributions are reclassified to paid-in capital. For tax purposes, distributions from short-term capital gains are considered to be from ordinary income. For the six months ended April 30, 2024, management estimates that a portion of distributions for the period will be a tax return of capital. The final determination of tax characteristics of the Fund’s distributions will occur at the end of the year and will be reported to the shareholders.
At October 31, 2023, the Fund, for federal income tax purposes, had deferred capital losses of $34,797,571 which would reduce its taxable income arising from future net realized gains on investment transactions, if any, to the extent permitted by the Internal Revenue Code, and thus would reduce the amount of distributions to shareholders, which would otherwise be necessary to relieve the Fund of any liability for federal income or excise tax. The deferred capital losses are treated as arising on the first day of the Fund’s next taxable year and retain the same short-term or long-term character as when originally deferred. Of the deferred capital losses at October 31, 2023, $8,240,612 are short-term and $26,556,959 are long-term.
3 Investment Adviser Fee and Other Transactions with Affiliates
The investment adviser fee is earned by Eaton Vance Management (EVM), an indirect, wholly-owned subsidiary of Morgan Stanley, as compensation for investment advisory services rendered to the Fund. The investment adviser fee is computed at an annual rate as a percentage of the Fund’s average daily net assets that are not invested in other investment companies for which EVM or its affiliates serve as investment adviser and receive an advisory fee as follows and is payable monthly:
| Average Daily Net Assets | Annual Fee Rate |
| Up to $1 billion | 0.500% |
| $1 billion but less than $2.5 billion | 0.475% |
| $2.5 billion but less than $5 billion | 0.455% |
| $5 billion and over | 0.440% |
For the six months ended April 30, 2024, the Fund incurred no investment adviser fee on such assets. To the extent the Fund’s assets are invested in the Portfolio, the Fund is allocated its share of the Portfolio’s investment adviser fee. The Portfolio has engaged Boston Management and Research (BMR), a subsidiary of EVM, to render investment advisory services. See Note 2 of the Portfolio’s Notes to Financial Statements which are included elsewhere in this report. EVM also serves as the administrator of the Fund, but receives no compensation. EVM has agreed to reimburse the Fund’s expenses to the extent that total annual operating expenses (relating to ordinary operating expenses only and excluding such expenses as brokerage commissions, acquired fund fees and expenses of unaffiliated funds, borrowing costs, taxes or litigation expenses) exceed 0.95%, 1.70% and 0.70% of the Fund’s average daily net assets for Class A, Class C and Class I, respectively. This agreement may be changed or terminated after March 1, 2025. Pursuant to this agreement, EVM was allocated $96,536 of the Fund’s operating expenses for the six months ended April 30, 2024.
EVM provides sub-transfer agency and related services to the Fund pursuant to a Sub-Transfer Agency Support Services Agreement. For the six months ended April 30, 2024, EVM earned $1,698 from the Fund pursuant to such agreement, which is included in transfer and dividend disbursing agent fees on the Statement of Operations. The Fund was informed that Eaton Vance Distributors, Inc. (EVD), an affiliate of EVM and the Fund’s principal underwriter, received less than $100 as its portion of the sales charge on sales of Class A shares for the six months ended April 30, 2024. EVD also received distribution and service fees from Class A and Class C shares (see Note 4).
Trustees and officers of the Fund who are members of EVM’s or BMR’s organizations receive remuneration for their services to the Fund out of the investment adviser fee. Certain officers and Trustees of the Fund and the Portfolio are officers of the above organizations.
4 Distribution Plans
The Fund has in effect a distribution plan for Class A shares (Class A Plan) pursuant to Rule 12b-1 under the 1940 Act. Pursuant to the Class A Plan, the Fund pays EVD a distribution and service fee of 0.25% per annum of its average daily net assets attributable to Class A shares for distribution services and facilities provided to the Fund by EVD, as well as for personal services and/or the maintenance of shareholder accounts. Distribution and service fees paid or accrued to EVD for the six months ended April 30, 2024 amounted to $13,835 for Class A shares.
Eaton Vance
Global Sovereign Opportunities Fund
April 30, 2024
Notes to Financial Statements (Unaudited) — continued
The Fund also has in effect a distribution plan for Class C shares (Class C Plan) pursuant to Rule 12b-1 under the 1940 Act. Pursuant to the Class C Plan, the Fund pays EVD amounts equal to 0.75% per annum of its average daily net assets attributable to Class C shares for providing ongoing distribution services and facilities to the Fund. For the six months ended April 30, 2024, the Fund paid or accrued to EVD $3,385 for Class C shares.
Pursuant to the Class C Plan, the Fund also makes payments of service fees to EVD, financial intermediaries and other persons in amounts equal to 0.25% per annum of its average daily net assets attributable to that class. Service fees paid or accrued are for personal services and/or the maintenance of shareholder accounts. They are separate and distinct from the sales commissions and distribution fees payable to EVD. Service fees paid or accrued for the six months ended April 30, 2024 amounted to $1,128 for Class C shares.
Distribution and service fees are subject to the limitations contained in the Financial Industry Regulatory Authority Rule 2341(d).
5 Contingent Deferred Sales Charges
A contingent deferred sales charge (CDSC) of 1% generally is imposed on redemptions of Class C shares made within 12 months of purchase. Class A shares may be subject to a 0.75% CDSC if redeemed within 12 months of purchase (depending on the circumstances of purchase). Generally, the CDSC is based upon the lower of the net asset value at date of redemption or date of purchase. No charge is levied on shares acquired by reinvestment of dividends or capital gain distributions. For the six months ended April 30, 2024, the Fund was informed that EVD received no CDSCs paid by Class A and Class C shareholders.
6 Investment Transactions
For the six months ended April 30, 2024, increases and decreases in the Fund's investment in the Portfolio aggregated $2,223,868 and $7,677,594, respectively.
7 Shares of Beneficial Interest
The Fund’s Declaration of Trust permits the Trustees to issue an unlimited number of full and fractional shares of beneficial interest (without par value). Such shares may be issued in a number of different series (such as the Fund) and classes. Transactions in Fund shares, including direct exchanges pursuant to share class conversions, were as follows:
| | Six Months Ended
April 30, 2024
(Unaudited) | | Year Ended
October 31, 2023 |
| | Shares | Amount | | Shares | Amount |
| Class A | | | | | |
| Sales | 54,025 | $ 353,230 | | 148,841 | $ 999,091 |
| Issued to shareholders electing to receive payments of distributions in Fund shares | 36,046 | 239,963 | | 76,521 | 508,596 |
| Redemptions | (206,068) | (1,373,911) | | (347,415) | (2,295,852) |
| Net decrease | (115,997) | $ (780,718) | | (122,053) | $ (788,165) |
| Class C | | | | | |
| Sales | — | $ — | | 15,324 | $ 104,355 |
| Issued to shareholders electing to receive payments of distributions in Fund shares | 2,273 | 15,147 | | 6,461 | 42,995 |
| Redemptions | (36,433) | (243,163) | | (67,683) | (449,932) |
| Net decrease | (34,160) | $ (228,016) | | (45,898) | $ (302,582) |
Eaton Vance
Global Sovereign Opportunities Fund
April 30, 2024
Notes to Financial Statements (Unaudited) — continued
| | Six Months Ended
April 30, 2024
(Unaudited) | | Year Ended
October 31, 2023 |
| | Shares | Amount | | Shares | Amount |
| Class I | | | | | |
| Sales | 452,700 | $ 3,006,730 | | 3,242,457 | $ 21,765,548 |
| Issued to shareholders electing to receive payments of distributions in Fund shares | 85,514 | 567,387 | | 183,921 | 1,218,207 |
| Redemptions | (1,066,306) | (7,170,940) | | (2,117,925) | (14,000,025) |
| Net increase (decrease) | (528,092) | $(3,596,823) | | 1,308,453 | $ 8,983,730 |
International Income Portfolio
April 30, 2024
Portfolio of Investments (Unaudited)
| Collateralized Mortgage Obligations — 8.8% |
| Security | Principal
Amount
(000's omitted) | Value |
| Federal Home Loan Mortgage Corp. STACR REMICS Trust, Series 2022-DNA1, Class M2, 7.83%, (30-day SOFR Average + 2.50%), 1/25/42(1)(2) | $ | 1,800 | $ 1,833,364 |
| Government National Mortgage Association, Series 2023-115, Class AL, 6.00%, 8/20/53 | | 1,000 | 982,606 |
Total Collateralized Mortgage Obligations
(identified cost $2,699,742) | | | $ 2,815,970 |
| Foreign Corporate Bonds — 0.9% |
| Security | Principal
Amount
(000's omitted) | Value |
| Paraguay — 0.9% |
| Itau BBA International PLC, 9.03%, 2/19/30 | PYG | 1,906,340 | $ 275,472 |
Total Foreign Corporate Bonds
(identified cost $280,990) | | | $ 275,472 |
| Sovereign Government Bonds — 53.1% |
| Security | Principal
Amount
(000's omitted) | Value |
| China — 2.5% |
| China Government Bonds: | | | |
| 2.67%, 11/25/33 | CNY | 3,000 | $ 425,155 |
| 3.00%, 10/15/53 | CNY | 2,500 | 378,390 |
| | | | $ 803,545 |
| Colombia — 1.8% |
| Titulos De Tesoreria B: | | | |
| 6.25%, 7/9/36 | COP | 804,400 | $ 142,773 |
| 9.25%, 5/28/42 | COP | 2,040,500 | 445,138 |
| | | | $ 587,911 |
| Czech Republic — 5.1% |
| Czech Republic Government Bonds: | | | |
| 4.50%, 11/11/32 | CZK | 12,330 | $ 530,464 |
| 4.90%, 4/14/34 | CZK | 24,620 | 1,092,635 |
| | | | $ 1,623,099 |
| Security | Principal
Amount
(000's omitted) | Value |
| Dominican Republic — 5.2% |
| Dominican Republic Bonds: | | | |
| 8.00%, 1/15/27(3) | DOP | 3,970 | $ 63,288 |
| 8.00%, 2/12/27(3) | DOP | 20,150 | 321,434 |
| 11.25%, 9/15/35(1) | DOP | 8,000 | 144,494 |
| 12.00%, 8/8/25(1) | DOP | 10,500 | 182,752 |
| 13.00%, 6/10/34(3) | DOP | 25,400 | 519,938 |
| 13.625%, 2/3/33(1) | DOP | 8,000 | 163,415 |
| Dominican Republic Central Bank Notes: | | | |
| 8.00%, 3/12/27(3) | DOP | 900 | 14,488 |
| 13.00%, 12/5/25(1) | DOP | 8,440 | 148,327 |
| 13.00%, 1/30/26(1) | DOP | 6,240 | 110,086 |
| | | | $ 1,668,222 |
| Germany — 4.7% |
| Bundesrepublik Deutschland Bundesanleihe, 1.70%, 8/15/32(3) | EUR | 1,500 | $ 1,501,987 |
| | | | $ 1,501,987 |
| Greece — 0.1% |
| Hellenic Republic Government Bonds, 0.00%, GDP-Linked, 10/15/42 | EUR | 8,072 | $ 24,120 |
| | | | $ 24,120 |
| Hungary — 1.4% |
| Hungary Government Bonds: | | | |
| 4.00%, 4/28/51 | HUF | 37,210 | $ 65,261 |
| 4.75%, 11/24/32 | HUF | 167,540 | 388,577 |
| | | | $ 453,838 |
| Iceland — 7.5% |
| Republic of Iceland: | | | |
| 4.50%, 2/17/42 | ISK | 184,453 | $ 1,048,310 |
| 5.00%, 11/15/28 | ISK | 3,916 | 25,041 |
| 7.00%, 9/17/35 | ISK | 15,871 | 113,339 |
| 8.00%, 6/12/25 | ISK | 172,866 | 1,217,506 |
| | | | $ 2,404,196 |
| Indonesia — 5.9% |
| Indonesia Treasury Bonds: | | | |
| 6.125%, 5/15/28 | IDR | 1,053,000 | $ 62,368 |
| 7.125%, 6/15/42 | IDR | 1,472,000 | 89,538 |
| 7.125%, 6/15/43 | IDR | 27,958,000 | 1,714,078 |
| 7.375%, 5/15/48 | IDR | 529,000 | 33,300 |
| | | | $ 1,899,284 |
16
See Notes to Financial Statements.
International Income Portfolio
April 30, 2024
Portfolio of Investments (Unaudited) — continued
| Security | Principal
Amount
(000's omitted) | Value |
| Paraguay — 1.6% |
| Paraguay Government Bonds, 7.90%, 2/9/31(1) | PYG | 3,731,000 | $ 515,341 |
| | | | $ 515,341 |
| Peru — 1.9% |
| Peru Government Bonds: | | | |
| 5.40%, 8/12/34 | PEN | 119 | $ 27,338 |
| 6.714%, 2/12/55 | PEN | 1,820 | 440,394 |
| 7.30%, 8/12/33(1)(3) | PEN | 554 | 148,320 |
| | | | $ 616,052 |
| Philippines — 1.7% |
| Philippines Government International Bonds, 6.25%, 1/14/36 | PHP | 34,000 | $ 553,481 |
| | | | $ 553,481 |
| Serbia — 9.0% |
| Serbia Treasury Bonds: | | | |
| 5.875%, 2/8/28 | RSD | 161,760 | $ 1,521,194 |
| 7.00%, 10/26/31 | RSD | 138,300 | 1,347,899 |
| | | | $ 2,869,093 |
| South Korea — 1.6% |
| Korea Treasury Bonds, 4.00%, 12/10/31 | KRW | 692,140 | $ 515,290 |
| | | | $ 515,290 |
| Ukraine — 0.1% |
| Ukraine Government Bonds: | | | |
| 15.84%, 2/26/25 | UAH | 110 | $ 2,197 |
| 19.19%, 9/30/26 | UAH | 682 | 13,376 |
| | | | $ 15,573 |
| Uruguay — 3.0% |
| Uruguay Government Bonds: | | | |
| 3.875%, 7/2/40(4) | UYU | 10,132 | $ 285,711 |
| 8.25%, 5/21/31 | UYU | 433 | 10,781 |
| 9.75%, 7/20/33 | UYU | 24,908 | 677,558 |
| | | | $ 974,050 |
Total Sovereign Government Bonds
(identified cost $18,039,930) | | | $17,025,082 |
| U.S. Government Agency Mortgage-Backed Securities — 11.1% |
| Security | Principal
Amount
(000's omitted) | Value |
| Federal National Mortgage Association: | | | |
| 5.00%, with maturity at 2052 | $ | 913 | $ 867,671 |
| 5.224%, (COF + 1.791%), with maturity at 2035(5) | | 88 | 86,203 |
| Uniform Mortgage-Backed Security, 5.50%, 30-Year, TBA(6) | | 2,700 | 2,622,480 |
Total U.S. Government Agency Mortgage-Backed Securities
(identified cost $3,444,068) | | | $ 3,576,354 |
| U.S. Treasury Obligations — 0.9% |
| Security | Principal
Amount
(000's omitted) | Value |
| U.S. Treasury Inflation-Protected Bonds, 0.625%, 7/15/32(7) | $ | 347 | $ 305,971 |
Total U.S. Treasury Obligations
(identified cost $332,444) | | | $ 305,971 |
| Short-Term Investments — 36.9% |
| Security | Shares | Value |
| Morgan Stanley Institutional Liquidity Funds - Government Portfolio, Institutional Class, 5.22%(8) | | 3,109,163 | $ 3,109,163 |
Total Affiliated Fund
(identified cost $3,109,163) | | | $ 3,109,163 |
| Repurchase Agreements — 3.6% |
| Description | Principal
Amount
(000's omitted) | Value |
| JPMorgan Chase Bank, N.A.: | | | |
| Dated 1/8/24 with an interest rate of 10.70%, collateralized by MXN 22,000,000 Mexican Bonos, 8.00%, due 7/31/53 and a market value, including accrued interest, of $1,057,533(9) | MXN | 19,834 | $ 1,157,803 |
Total Repurchase Agreements
(identified cost $1,178,564) | | | $ 1,157,803 |
| U.S. Treasury Obligations — 23.6% |
| Security | Principal
Amount
(000's omitted) | Value |
| U.S. Treasury Bills: | | | |
| 0.00%, 5/9/24(10) | $ | 1,481 | $ 1,479,263 |
17
See Notes to Financial Statements.
International Income Portfolio
April 30, 2024
Portfolio of Investments (Unaudited) — continued
| Security | Principal
Amount
(000's omitted) | Value |
| U.S. Treasury Bills: (continued) | | | |
| 0.00%, 5/30/24(10) | $ | 1,000 | $ 995,755 |
| 0.00%, 6/13/24 | | 1,300 | 1,291,833 |
| 0.00%, 6/20/24(10) | | 1,250 | 1,240,851 |
| 0.00%, 7/11/24(10) | | 1,836 | 2,573,054 |
Total U.S. Treasury Obligations
(identified cost $7,581,067) | | | $ 7,580,756 |
Total Short-Term Investments
(identified cost $11,868,794) | | | $11,847,722 |
| | | |
Total Purchased Options — 0.1%
(identified cost $106,031) | | | $ 36,321 |
Total Investments — 111.8%
(identified cost $36,771,999) | | | $35,882,892 |
Total Written Options and Swaptions — (0.2)%
(premiums received $42,055) | | | $ (62,129) |
| Securities Sold Short — (3.2)% |
| Sovereign Government Bonds — (3.2)% |
| Security | Principal
Amount
(000's omitted) | Value |
| Mexico — (3.2)% |
| Mexican Bonos, 8.00%, 7/31/53 | MXN | (22,000) | $ (1,042,123) |
Total Sovereign Government Bonds
(proceeds $1,115,274) | | | $(1,042,123) |
Total Securities Sold Short
(proceeds $1,115,274) | | | $(1,042,123) |
| | | |
| Other Assets, Less Liabilities — (8.4)% | | | $ (2,696,242) |
| Net Assets — 100.0% | | | $32,082,398 |
| The percentage shown for each investment category in the Portfolio of Investments is based on net assets. |
| (1) | Security exempt from registration under Rule 144A of the Securities Act of 1933, as amended. These securities may be sold in certain transactions in reliance on an exemption from registration (normally to qualified institutional buyers). At April 30, 2024, the aggregate value of these securities is $3,246,099 or 10.1% of the Portfolio's net assets. |
| (2) | Variable rate security. The stated interest rate represents the rate in effect at April 30, 2024. |
| (3) | Security exempt from registration under Regulation S of the Securities Act of 1933, as amended, which exempts from registration securities offered and sold outside the United States. Security may not be offered or sold in the United States except pursuant to an exemption from, or in a transaction not subject to, the registration requirements of the Securities Act of 1933, as amended. At April 30, 2024, the aggregate value of these securities is $2,569,455 or 8.0% of the Portfolio's net assets. |
| (4) | Inflation-linked security whose principal is adjusted for inflation based on changes in a designated inflation index or inflation rate for the applicable country. Interest is calculated based on the inflation-adjusted principal. |
| (5) | Adjustable rate mortgage security whose interest rate generally adjusts monthly based on a weighted average of interest rates on the underlying mortgages. The coupon rate may not reflect the applicable index value as interest rates on the underlying mortgages may adjust on various dates and at various intervals and may be subject to lifetime ceilings and lifetime floors and lookback periods. Rate shown is the coupon rate at April 30, 2024. |
| (6) | TBA (To Be Announced) securities are purchased on a forward commitment basis with an approximate principal amount and maturity date. The actual principal amount, which is not expected to differ significantly from the commitment amount, and maturity date are determined upon settlement. |
| (7) | Inflation-linked security whose principal is adjusted for inflation based on changes in the U.S. Consumer Price Index. Interest is calculated based on the inflation-adjusted principal. |
| (8) | May be deemed to be an affiliated investment company. The rate shown is the annualized seven-day yield as of April 30, 2024. |
| (9) | Open repurchase agreement with no specific maturity date. Either party may terminate the agreement upon demand. |
| (10) | Security (or a portion thereof) has been pledged to cover collateral requirements on open derivative contracts. |
| Purchased Currency Options (OTC) — 0.1% |
| Description | Counterparty | Notional Amount | Exercise
Price | Expiration
Date | Value |
| Put USD vs. Call BRL | Goldman Sachs International | USD | 1,120,000 | BRL | 5.01 | 6/11/24 | $ 2,394 |
| Put USD vs. Call BRL | JPMorgan Chase Bank, N.A. | USD | 950,000 | BRL | 5.01 | 6/11/24 | 2,045 |
| Put USD vs. Call INR | JPMorgan Chase Bank, N.A. | USD | 1,100,000 | INR | 85.50 | 1/25/29 | 8,922 |
| Put USD vs. Call INR | JPMorgan Chase Bank, N.A. | USD | 600,000 | INR | 85.50 | 1/25/29 | 4,867 |
| Put USD vs. Call INR | JPMorgan Chase Bank, N.A. | USD | 510,000 | INR | 85.50 | 1/30/29 | 4,144 |
18
See Notes to Financial Statements.
International Income Portfolio
April 30, 2024
Portfolio of Investments (Unaudited) — continued
| Purchased Currency Options (OTC) (continued) |
| Description | Counterparty | Notional Amount | Exercise
Price | Expiration
Date | Value |
| Put USD vs. Call MXN | Citibank, N.A. | USD | 700,000 | MXN | 17.02 | 5/17/24 | $ 4,252 |
| Put USD vs. Call MXN | Standard Chartered Bank | USD | 1,050,000 | MXN | 16.74 | 6/20/24 | 4,395 |
| Put USD vs. Call MXN | Standard Chartered Bank | USD | 350,000 | MXN | 16.82 | 7/2/24 | 2,102 |
| Put USD vs. Call MXN | Standard Chartered Bank | USD | 700,000 | MXN | 16.71 | 7/5/24 | 3,200 |
| Total | | | | | | | $36,321 |
| Written Currency Options (OTC) — (0.0)%(1) |
| Description | Counterparty | Notional Amount | Exercise
Price | Expiration
Date | Value |
| Put USD vs. Call MXN | Standard Chartered Bank | USD | 700,000 | MXN | 17.02 | 5/17/24 | $(4,252) |
| Total | | | | | | | $(4,252) |
| (1) | Amount is less than (0.05)%. |
| Written Interest Rate Swaptions (OTC) — (0.2)% |
| Description | Counterparty | Notional
Amount | Expiration
Date | Value |
| Option to enter into interest rate swap expiring 5/9/34 to pay SOFR and receive 3.93% | JPMorgan Chase Bank, N.A. | USD | (950,000) | 5/7/24 | $ (30,293) |
| Option to enter into interest rate swap expiring 8/9/34 to pay SOFR and receive 4.14% | Citibank, N.A. | USD | (1,150,000) | 8/7/24 | (27,584) |
| Total | | | | | $(57,877) |
| Forward Foreign Currency Exchange Contracts (Centrally Cleared) |
| Currency Purchased | Currency Sold | Settlement
Date | Value/Unrealized
Appreciation
(Depreciation) |
| TWD | 2,720,000 | USD | 83,528 | 5/29/24 | $ (193) |
| COP | 506,940,000 | USD | 127,242 | 6/20/24 | 1,035 |
| COP | 120,000,000 | USD | 30,246 | 6/20/24 | 119 |
| EUR | 67,274 | USD | 73,526 | 6/20/24 | (1,588) |
| EUR | 2,014,724 | USD | 2,186,415 | 6/20/24 | (32,020) |
| EUR | 8,940,651 | USD | 9,771,556 | 6/20/24 | (211,093) |
| IDR | 10,107,886,775 | USD | 641,343 | 6/20/24 | (20,584) |
| IDR | 17,549,829,911 | USD | 1,123,549 | 6/20/24 | (45,754) |
| INR | 33,157,083 | USD | 399,015 | 6/20/24 | (2,536) |
| INR | 66,378,900 | USD | 798,687 | 6/20/24 | (4,955) |
| INR | 92,100,000 | USD | 1,108,170 | 6/20/24 | (6,875) |
| KRW | 445,500,000 | USD | 320,716 | 6/20/24 | 1,470 |
19
See Notes to Financial Statements.
International Income Portfolio
April 30, 2024
Portfolio of Investments (Unaudited) — continued
| Forward Foreign Currency Exchange Contracts (Centrally Cleared) (continued) |
| Currency Purchased | Currency Sold | Settlement
Date | Value/Unrealized
Appreciation
(Depreciation) |
| KRW | 1,260,757,211 | USD | 965,617 | 6/20/24 | $ (53,836) |
| PEN | 165,000 | USD | 44,151 | 6/20/24 | (347) |
| PEN | 200,000 | USD | 53,555 | 6/20/24 | (459) |
| PEN | 148,000 | USD | 39,753 | 6/20/24 | (462) |
| PEN | 185,000 | USD | 49,902 | 6/20/24 | (789) |
| PEN | 332,000 | USD | 89,175 | 6/20/24 | (1,037) |
| PEN | 800,000 | USD | 214,483 | 6/20/24 | (2,100) |
| PEN | 721,042 | USD | 194,555 | 6/20/24 | (3,134) |
| PEN | 1,190,000 | USD | 321,724 | 6/20/24 | (5,805) |
| TWD | 5,000,000 | USD | 156,242 | 6/20/24 | (2,917) |
| TWD | 11,000,000 | USD | 342,146 | 6/20/24 | (4,832) |
| USD | 215,402 | COP | 851,000,000 | 6/20/24 | 62 |
| USD | 124,570 | COP | 493,017,000 | 6/20/24 | (185) |
| USD | 282,721 | COP | 1,120,693,000 | 6/20/24 | (862) |
| USD | 2,480,354 | EUR | 2,269,442 | 6/20/24 | 53,583 |
| USD | 2,238,004 | EUR | 2,047,700 | 6/20/24 | 48,347 |
| USD | 2,201,964 | EUR | 2,014,725 | 6/20/24 | 47,569 |
| USD | 1,272,720 | EUR | 1,164,497 | 6/20/24 | 27,494 |
| USD | 1,766,775 | EUR | 1,628,037 | 6/20/24 | 25,874 |
| USD | 847,834 | EUR | 775,740 | 6/20/24 | 18,316 |
| USD | 842,539 | EUR | 770,895 | 6/20/24 | 18,201 |
| USD | 593,509 | EUR | 543,041 | 6/20/24 | 12,821 |
| USD | 241,839 | EUR | 221,274 | 6/20/24 | 5,224 |
| USD | 172,769 | EUR | 158,078 | 6/20/24 | 3,732 |
| USD | 14,469 | EUR | 13,239 | 6/20/24 | 313 |
| USD | 6,952 | EUR | 6,406 | 6/20/24 | 102 |
| USD | 1,002,391 | IDR | 15,655,338,716 | 6/20/24 | 40,944 |
| USD | 746,465 | IDR | 11,659,784,263 | 6/20/24 | 30,398 |
| USD | 646,883 | IDR | 10,103,275,267 | 6/20/24 | 26,407 |
| USD | 181,995 | IDR | 2,842,772,640 | 6/20/24 | 7,410 |
| USD | 149,692 | IDR | 2,338,029,536 | 6/20/24 | 6,106 |
| USD | 128,782 | IDR | 2,090,400,000 | 6/20/24 | 404 |
| USD | 295 | IDR | 4,611,508 | 6/20/24 | 12 |
| USD | 331,135 | PEN | 1,220,000 | 6/20/24 | 7,251 |
| USD | 220,666 | PEN | 813,000 | 6/20/24 | 4,832 |
| USD | 239,833 | PEN | 887,099 | 6/20/24 | 4,327 |
| USD | 36,099 | PEN | 133,000 | 6/20/24 | 791 |
| USD | 24,157 | PEN | 89,000 | 6/20/24 | 529 |
| USD | 26,041 | PEN | 96,322 | 6/20/24 | 470 |
| USD | 288,129 | PEN | 1,084,000 | 6/20/24 | 351 |
| USD | 31,365 | PEN | 118,000 | 6/20/24 | 38 |
| USD | 53,371 | PEN | 201,637 | 6/20/24 | (159) |
| USD | 46,820 | PEN | 177,000 | 6/20/24 | (169) |
| USD | 489,598 | PEN | 1,849,702 | 6/20/24 | (1,457) |
20
See Notes to Financial Statements.
International Income Portfolio
April 30, 2024
Portfolio of Investments (Unaudited) — continued
| Forward Foreign Currency Exchange Contracts (Centrally Cleared) (continued) |
| Currency Purchased | Currency Sold | Settlement
Date | Value/Unrealized
Appreciation
(Depreciation) |
| USD | 430,113 | PEN | 1,626,000 | 6/20/24 | $ (1,554) |
| USD | 638,811 | PHP | 35,500,000 | 6/20/24 | 24,812 |
| CLP | 157,600,000 | USD | 165,767 | 6/21/24 | (1,686) |
| USD | 165,767 | CLP | 157,600,000 | 6/21/24 | 1,686 |
| BRL | 260,560 | USD | 51,657 | 7/2/24 | (1,776) |
| BRL | 274,000 | USD | 54,341 | 7/2/24 | (1,887) |
| BRL | 411,000 | USD | 81,477 | 7/2/24 | (2,794) |
| BRL | 411,000 | USD | 81,486 | 7/2/24 | (2,804) |
| BRL | 443,440 | USD | 87,977 | 7/2/24 | (3,085) |
| BRL | 700,000 | USD | 138,939 | 7/2/24 | (4,930) |
| BRL | 699,000 | USD | 139,010 | 7/2/24 | (5,193) |
| | | | | | $ (8,827) |
| Forward Foreign Currency Exchange Contracts (OTC) |
| Currency Purchased | Currency Sold | Counterparty | Settlement
Date | Unrealized
Appreciation | Unrealized
(Depreciation) |
| HUF | 47,693,372 | EUR | 120,438 | BNP Paribas | 5/2/24 | $ 1,502 | $ — |
| HUF | 48,452,002 | EUR | 122,148 | UBS AG | 5/2/24 | 1,745 | — |
| CZK | 4,848,176 | EUR | 191,149 | Goldman Sachs International | 5/6/24 | 1,678 | — |
| CZK | 4,801,824 | EUR | 189,316 | HSBC Bank USA, N.A. | 5/6/24 | 1,667 | — |
| EUR | 383,177 | CZK | 9,650,000 | Societe Generale | 5/6/24 | — | (450) |
| HUF | 47,972,008 | EUR | 121,632 | HSBC Bank USA, N.A. | 5/13/24 | 860 | — |
| HUF | 89,820,102 | EUR | 229,221 | JPMorgan Chase Bank, N.A. | 5/13/24 | 26 | — |
| HUF | 45,930,699 | EUR | 116,341 | UBS AG | 5/13/24 | 947 | — |
| ILS | 1,949,897 | USD | 519,834 | Bank of America, N.A. | 5/13/24 | 1,541 | — |
| ILS | 1,800,103 | USD | 480,258 | BNP Paribas | 5/13/24 | 1,064 | — |
| ISK | 30,000,000 | EUR | 199,071 | Citibank, N.A. | 5/13/24 | 852 | — |
| TRY | 5,228,409 | USD | 155,766 | Standard Chartered Bank | 5/13/24 | 4,200 | — |
| TRY | 4,703,042 | USD | 140,139 | Standard Chartered Bank | 5/13/24 | 3,753 | — |
| USD | 1,016,508 | ILS | 3,750,000 | JPMorgan Chase Bank, N.A. | 5/13/24 | 13,811 | — |
| USD | 169,989 | TRY | 5,900,000 | Standard Chartered Bank | 5/13/24 | — | (10,526) |
| HUF | 41,771,424 | EUR | 106,788 | UBS AG | 5/15/24 | — | (209) |
| EUR | 402,147 | HUF | 158,435,825 | JPMorgan Chase Bank, N.A. | 5/17/24 | — | (2,214) |
| HUF | 169,404,238 | EUR | 429,987 | JPMorgan Chase Bank, N.A. | 5/17/24 | 2,367 | — |
| USD | 292,474 | KRW | 407,465,193 | Standard Chartered Bank | 5/20/24 | — | (2,120) |
| MXN | 2,609,000 | USD | 153,428 | Bank of America, N.A. | 5/21/24 | — | (1,564) |
| MXN | 563,447 | USD | 33,179 | Goldman Sachs International | 5/21/24 | — | (382) |
| MXN | 569,110 | USD | 33,511 | Goldman Sachs International | 5/21/24 | — | (384) |
| MXN | 1,981,000 | USD | 116,408 | Goldman Sachs International | 5/21/24 | — | (1,098) |
| MXN | 2,197,443 | USD | 129,304 | Goldman Sachs International | 5/21/24 | — | (1,396) |
| MXN | 2,435,000 | USD | 143,142 | Goldman Sachs International | 5/21/24 | — | (1,406) |
21
See Notes to Financial Statements.
International Income Portfolio
April 30, 2024
Portfolio of Investments (Unaudited) — continued
| Forward Foreign Currency Exchange Contracts (OTC) (continued) |
| Currency Purchased | Currency Sold | Counterparty | Settlement
Date | Unrealized
Appreciation | Unrealized
(Depreciation) |
| USD | 412,687 | MXN | 7,025,000 | Citibank, N.A. | 5/21/24 | $ 3,778 | $ — |
| USD | 195,767 | MXN | 3,330,000 | JPMorgan Chase Bank, N.A. | 5/21/24 | 1,936 | — |
| TRY | 3,818,477 | USD | 112,091 | Standard Chartered Bank | 5/22/24 | 3,597 | — |
| USD | 471,093 | PHP | 27,142,000 | Societe Generale | 5/23/24 | 1,374 | — |
| USD | 932,639 | PHP | 53,658,000 | Standard Chartered Bank | 5/23/24 | 4,068 | — |
| HUF | 98,971,039 | EUR | 250,388 | Bank of America, N.A. | 5/29/24 | 1,961 | — |
| HUF | 98,965,216 | EUR | 250,286 | BNP Paribas | 5/29/24 | 2,055 | — |
| TWD | 16,480,000 | USD | 505,884 | Standard Chartered Bank | 5/29/24 | — | (736) |
| HUF | 50,109,092 | EUR | 127,468 | BNP Paribas | 6/3/24 | 185 | — |
| HUF | 46,036,282 | EUR | 117,051 | Citibank, N.A. | 6/3/24 | 231 | — |
| PLN | 1,520,000 | EUR | 350,941 | Barclays Bank PLC | 6/5/24 | — | (433) |
| CZK | 9,650,000 | EUR | 382,717 | Societe Generale | 6/6/24 | 467 | — |
| BRL | 3,124,000 | USD | 623,553 | Goldman Sachs International | 6/13/24 | — | (24,192) |
| USD | 623,180 | BRL | 3,124,000 | Goldman Sachs International | 6/13/24 | 23,819 | — |
| AUD | 1,310,000 | USD | 858,436 | BNP Paribas | 6/20/24 | — | (8,583) |
| AUD | 1,000,000 | USD | 663,679 | BNP Paribas | 6/20/24 | — | (14,936) |
| AUD | 1,000,000 | USD | 663,399 | Citibank, N.A. | 6/20/24 | — | (14,656) |
| AUD | 4,932 | USD | 3,249 | UBS AG | 6/20/24 | — | (49) |
| AUD | 1,000,000 | USD | 657,965 | UBS AG | 6/20/24 | — | (9,222) |
| CAD | 82,800 | USD | 61,439 | Bank of America, N.A. | 6/20/24 | — | (1,244) |
| CAD | 309,900 | USD | 229,949 | Bank of America, N.A. | 6/20/24 | — | (4,657) |
| CAD | 97,000 | USD | 71,959 | Goldman Sachs International | 6/20/24 | — | (1,442) |
| CAD | 364,000 | USD | 270,033 | Goldman Sachs International | 6/20/24 | — | (5,411) |
| CAD | 121,000 | USD | 89,805 | HSBC Bank USA, N.A. | 6/20/24 | — | (1,840) |
| CAD | 455,000 | USD | 337,695 | HSBC Bank USA, N.A. | 6/20/24 | — | (6,917) |
| CAD | 61,000 | USD | 45,376 | Standard Chartered Bank | 6/20/24 | — | (1,030) |
| CAD | 227,000 | USD | 168,857 | Standard Chartered Bank | 6/20/24 | — | (3,831) |
| CAD | 97,200 | USD | 72,436 | UBS AG | 6/20/24 | — | (1,773) |
| CAD | 364,100 | USD | 271,337 | UBS AG | 6/20/24 | — | (6,642) |
| CNH | 1,430,000 | USD | 196,904 | Standard Chartered Bank | 6/20/24 | 655 | — |
| CZK | 800,000 | EUR | 31,396 | JPMorgan Chase Bank, N.A. | 6/20/24 | 377 | — |
| CZK | 4,771,861 | EUR | 188,163 | UBS AG | 6/20/24 | 1,296 | — |
| EUR | 1,809,417 | CZK | 46,087,667 | HSBC Bank USA, N.A. | 6/20/24 | — | (20,976) |
| GBP | 1,240,000 | USD | 1,581,862 | State Street Bank and Trust Company | 6/20/24 | — | (32,025) |
| JPY | 38,670,000 | USD | 262,073 | Citibank, N.A. | 6/20/24 | — | (15,059) |
| JPY | 640,849,895 | USD | 4,343,139 | Citibank, N.A. | 6/20/24 | — | (249,554) |
| MXN | 943,000 | USD | 55,048 | Bank of America, N.A. | 6/20/24 | — | (419) |
| MXN | 15,364 | USD | 905 | Goldman Sachs International | 6/20/24 | — | (15) |
| MXN | 1,054,000 | USD | 61,796 | Goldman Sachs International | 6/20/24 | — | (738) |
| MXN | 847,300 | USD | 49,898 | Goldman Sachs International | 6/20/24 | — | (814) |
| MXN | 5,821,000 | USD | 342,805 | Goldman Sachs International | 6/20/24 | — | (5,594) |
| MXN | 427,000 | USD | 25,185 | Societe Generale | 6/20/24 | — | (448) |
| MXN | 6,900 | USD | 404 | Standard Chartered Bank | 6/20/24 | — | (4) |
| MXN | 647,700 | USD | 37,912 | Standard Chartered Bank | 6/20/24 | — | (390) |
22
See Notes to Financial Statements.
International Income Portfolio
April 30, 2024
Portfolio of Investments (Unaudited) — continued
| Forward Foreign Currency Exchange Contracts (OTC) (continued) |
| Currency Purchased | Currency Sold | Counterparty | Settlement
Date | Unrealized
Appreciation | Unrealized
(Depreciation) |
| MXN | 600,000 | USD | 35,323 | Standard Chartered Bank | 6/20/24 | $ — | $ (565) |
| MXN | 4,753,000 | USD | 278,205 | Standard Chartered Bank | 6/20/24 | — | (2,863) |
| MXN | 4,800,000 | USD | 282,581 | Standard Chartered Bank | 6/20/24 | — | (4,517) |
| MXN | 10,000 | USD | 583 | State Street Bank and Trust Company | 6/20/24 | — | (3) |
| MXN | 96,771 | USD | 5,668 | State Street Bank and Trust Company | 6/20/24 | — | (62) |
| MXN | 116,943 | USD | 6,849 | State Street Bank and Trust Company | 6/20/24 | — | (75) |
| MXN | 923,000 | USD | 53,565 | State Street Bank and Trust Company | 6/20/24 | — | (95) |
| MXN | 985,000 | USD | 57,405 | State Street Bank and Trust Company | 6/20/24 | — | (344) |
| MXN | 978,000 | USD | 57,511 | State Street Bank and Trust Company | 6/20/24 | — | (856) |
| MXN | 7,226,000 | USD | 421,128 | State Street Bank and Trust Company | 6/20/24 | — | (2,524) |
| NZD | 123,149 | USD | 76,137 | BNP Paribas | 6/20/24 | — | (3,572) |
| NZD | 630,000 | USD | 377,639 | BNP Paribas | 6/20/24 | — | (6,413) |
| NZD | 870,000 | USD | 519,905 | BNP Paribas | 6/20/24 | — | (7,260) |
| NZD | 670,000 | USD | 401,904 | JPMorgan Chase Bank, N.A. | 6/20/24 | — | (7,108) |
| PLN | 1,954,954 | EUR | 446,377 | Barclays Bank PLC | 6/20/24 | 4,368 | — |
| PLN | 151,618 | EUR | 35,220 | Citibank, N.A. | 6/20/24 | — | (304) |
| PLN | 151,580 | EUR | 35,224 | Goldman Sachs International | 6/20/24 | — | (318) |
| SEK | 3,887,000 | EUR | 346,890 | UBS AG | 6/20/24 | — | (17,461) |
| SGD | 505,000 | USD | 380,500 | Goldman Sachs International | 6/20/24 | — | (9,717) |
| SGD | 1,000,000 | USD | 750,262 | Goldman Sachs International | 6/20/24 | — | (16,038) |
| SGD | 1,000,000 | USD | 750,599 | Goldman Sachs International | 6/20/24 | — | (16,374) |
| TRY | 6,998,660 | USD | 196,593 | Standard Chartered Bank | 6/20/24 | 9,027 | — |
| TRY | 10,212,000 | USD | 300,161 | Standard Chartered Bank | 6/20/24 | — | (134) |
| TWD | 7,000,000 | USD | 218,723 | Standard Chartered Bank | 6/20/24 | — | (4,068) |
| TWD | 9,000,000 | USD | 281,286 | Standard Chartered Bank | 6/20/24 | — | (5,301) |
| USD | 412,307 | AUD | 627,000 | BNP Paribas | 6/20/24 | 5,545 | — |
| USD | 508,899 | AUD | 780,000 | HSBC Bank USA, N.A. | 6/20/24 | 2,880 | — |
| USD | 416,462 | AUD | 633,000 | Standard Chartered Bank | 6/20/24 | 5,808 | — |
| USD | 279,359 | CNH | 2,000,000 | BNP Paribas | 6/20/24 | 3,053 | — |
| USD | 139,679 | CNH | 1,000,000 | BNP Paribas | 6/20/24 | 1,527 | — |
| USD | 840,342 | CNH | 6,000,000 | Citibank, N.A. | 6/20/24 | 11,426 | — |
| USD | 809,571 | CNH | 5,780,000 | Goldman Sachs International | 6/20/24 | 11,049 | — |
| USD | 514,563 | CNH | 3,672,700 | Goldman Sachs International | 6/20/24 | 7,169 | — |
| USD | 279,330 | CNH | 2,000,000 | HSBC Bank USA, N.A. | 6/20/24 | 3,025 | — |
| USD | 139,665 | CNH | 1,000,000 | HSBC Bank USA, N.A. | 6/20/24 | 1,513 | — |
| USD | 139,665 | CNH | 1,000,000 | HSBC Bank USA, N.A. | 6/20/24 | 1,513 | — |
| USD | 558,943 | CNH | 4,000,000 | JPMorgan Chase Bank, N.A. | 6/20/24 | 6,332 | — |
| USD | 139,736 | CNH | 1,000,000 | JPMorgan Chase Bank, N.A. | 6/20/24 | 1,583 | — |
| USD | 1,331,633 | CNH | 9,529,100 | UBS AG | 6/20/24 | 15,162 | — |
| USD | 370,771 | CNH | 2,653,216 | UBS AG | 6/20/24 | 4,222 | — |
| USD | 51,845 | CNH | 371,000 | UBS AG | 6/20/24 | 590 | — |
| USD | 123,853 | MXN | 2,060,000 | Goldman Sachs International | 6/20/24 | 4,517 | — |
| USD | 248,640 | MXN | 4,222,039 | Goldman Sachs International | 6/20/24 | 4,057 | — |
| USD | 240,145 | MXN | 4,000,000 | Standard Chartered Bank | 6/20/24 | 8,424 | — |
23
See Notes to Financial Statements.
International Income Portfolio
April 30, 2024
Portfolio of Investments (Unaudited) — continued
| Forward Foreign Currency Exchange Contracts (OTC) (continued) |
| Currency Purchased | Currency Sold | Counterparty | Settlement
Date | Unrealized
Appreciation | Unrealized
(Depreciation) |
| USD | 339,158 | MYR | 1,580,000 | Barclays Bank PLC | 6/20/24 | $ 8,592 | $ — |
| USD | 852,667 | NZD | 1,379,162 | BNP Paribas | 6/20/24 | 39,999 | — |
| USD | 197,840 | NZD | 320,000 | BNP Paribas | 6/20/24 | 9,281 | — |
| USD | 428,991 | NZD | 714,687 | Citibank, N.A. | 6/20/24 | 7,863 | — |
| USD | 369,311 | NZD | 615,313 | Citibank, N.A. | 6/20/24 | 6,739 | — |
| USD | 1,232,932 | NZD | 2,000,000 | HSBC Bank USA, N.A. | 6/20/24 | 54,435 | — |
| USD | 57,569 | NZD | 96,000 | Standard Chartered Bank | 6/20/24 | 1,001 | — |
| USD | 993,606 | THB | 35,040,000 | Standard Chartered Bank | 6/20/24 | 44,543 | — |
| USD | 729,312 | ZAR | 13,885,340 | Barclays Bank PLC | 6/20/24 | — | (5,583) |
| USD | 347,820 | ZAR | 6,618,194 | BNP Paribas | 6/20/24 | — | (2,454) |
| USD | 345,377 | ZAR | 6,571,132 | HSBC Bank USA, N.A. | 6/20/24 | — | (2,407) |
| USD | 1,890,664 | ZAR | 35,500,000 | JPMorgan Chase Bank, N.A. | 6/20/24 | 11,792 | — |
| USD | 35,467 | ZAR | 666,552 | UBS AG | 6/20/24 | 189 | — |
| USD | 680,406 | ZAR | 12,925,334 | UBS AG | 6/20/24 | — | (3,680) |
| TRY | 1,020,467 | USD | 30,191 | Standard Chartered Bank | 6/21/24 | — | (241) |
| USD | 29,065 | TRY | 1,020,467 | Standard Chartered Bank | 6/21/24 | — | (885) |
| ILS | 3,750,000 | USD | 1,004,527 | Barclays Bank PLC | 7/10/24 | 821 | — |
| USD | 1,022,839 | ILS | 3,750,000 | Citibank, N.A. | 7/10/24 | 17,491 | — |
| PLN | 2,507,308 | EUR | 574,382 | Citibank, N.A. | 7/19/24 | 2,566 | — |
| PLN | 1,662,856 | EUR | 379,986 | UBS AG | 7/19/24 | 2,715 | — |
| TRY | 1,633,974 | USD | 44,916 | Standard Chartered Bank | 9/20/24 | — | (1,558) |
| TRY | 1,633,974 | USD | 44,931 | Standard Chartered Bank | 9/20/24 | — | (1,574) |
| TRY | 4,078,000 | USD | 111,209 | Standard Chartered Bank | 9/20/24 | — | (3,000) |
| TRY | 5,059,000 | USD | 138,127 | Standard Chartered Bank | 9/20/24 | — | (3,887) |
| USD | 131,770 | TRY | 5,059,000 | Standard Chartered Bank | 9/20/24 | — | (2,470) |
| TRY | 7,751,584 | USD | 196,591 | Standard Chartered Bank | 9/23/24 | 8,401 | — |
| TRY | 7,256,976 | USD | 185,318 | Standard Chartered Bank | 9/23/24 | 6,595 | — |
| TRY | 1,375,000 | USD | 37,027 | Standard Chartered Bank | 9/23/24 | — | (665) |
| USD | 35,860 | TRY | 1,375,000 | Standard Chartered Bank | 9/23/24 | — | (502) |
| TRY | 7,598,673 | USD | 188,267 | Standard Chartered Bank | 10/17/24 | 7,396 | — |
| TRY | 7,593,543 | USD | 188,240 | Standard Chartered Bank | 10/17/24 | 7,291 | — |
| PLN | 1,774,882 | EUR | 403,933 | Bank of America, N.A. | 10/21/24 | 2,166 | — |
| USD | 296,058 | HKD | 2,300,000 | BNP Paribas | 12/9/24 | 507 | — |
| USD | 823,903 | HKD | 6,400,000 | Deutsche Bank AG | 12/9/24 | 1,500 | — |
| TRY | 17,570,092 | USD | 451,387 | Standard Chartered Bank | 12/16/24 | — | (26,221) |
| USD | 174,010 | TRY | 7,700,000 | Standard Chartered Bank | 12/16/24 | — | (12,317) |
| TRY | 8,197,382 | USD | 193,908 | Standard Chartered Bank | 1/6/25 | 402 | — |
| TRY | 7,050,000 | USD | 164,146 | Standard Chartered Bank | 1/15/25 | 1,516 | — |
| TRY | 10,356,125 | USD | 236,017 | Standard Chartered Bank | 1/29/25 | 4,091 | — |
| TRY | 6,375,000 | USD | 146,786 | Standard Chartered Bank | 1/29/25 | 1,020 | — |
| TRY | 5,436,380 | USD | 125,611 | Standard Chartered Bank | 2/10/25 | — | (894) |
| EGP | 80,175,000 | USD | 1,500,000 | Bank of America, N.A. | 4/3/25 | 3,082 | — |
24
See Notes to Financial Statements.
International Income Portfolio
April 30, 2024
Portfolio of Investments (Unaudited) — continued
| Forward Foreign Currency Exchange Contracts (OTC) (continued) |
| Currency Purchased | Currency Sold | Counterparty | Settlement
Date | Unrealized
Appreciation | Unrealized
(Depreciation) |
| EGP | 74,325,000 | USD | 1,384,078 | ICBC Standard Bank plc | 4/15/25 | $ 3,035 | $ — |
| | | | | | | $449,631 | $(629,689) |
| Futures Contracts |
| Description | Number of
Contracts | Position | Expiration
Date | Notional
Amount | Value/Unrealized
Appreciation
(Depreciation) |
| Interest Rate Futures | | | | | |
| U.S. 5-Year Treasury Note | 87 | Long | 6/28/24 | $ 9,112,570 | $ (171,240) |
| Euro-Bobl | (1) | Short | 6/6/24 | (124,254) | 1,654 |
| Euro-BTP | (10) | Short | 6/6/24 | (1,248,518) | 27,321 |
| Euro-Bund | (4) | Short | 6/6/24 | (555,286) | 5,293 |
| Japan 10-Year Bond | (1) | Short | 6/13/24 | (916,210) | 6,594 |
| U.S. 10-Year Treasury Note | (6) | Short | 6/18/24 | (644,625) | 1,594 |
| U.S. Ultra-Long Treasury Bond | (1) | Short | 6/18/24 | (119,563) | 7,383 |
| | | | | | $ (121,401) |
| Inflation Swaps (Centrally Cleared) |
Notional Amount
(000's omitted) | Portfolio
Pays/Receives
Return on
Reference Index | Reference Index | Portfolio
Pays/Receives
Rate | Annual
Rate | Termination
Date | Value/Unrealized
Appreciation
(Depreciation) |
| EUR | 300 | Receives | Eurostat Eurozone HICP ex Tobacco NSA
(pays upon termination) | Pays | 2.20%
(pays upon termination) | 10/15/36 | $ 37,759 |
| EUR | 300 | Receives | Eurostat Eurozone HICP ex Tobacco NSA
(pays upon termination) | Pays | 2.20%
(pays upon termination) | 10/15/36 | 37,759 |
| EUR | 200 | Receives | Eurostat Eurozone HICP ex Tobacco NSA
(pays upon termination) | Pays | 2.20%
(pays upon termination) | 10/15/36 | 25,147 |
| EUR | 280 | Receives | Eurostat Eurozone HICP ex Tobacco NSA
(pays upon termination) | Pays | 2.08%
(pays upon termination) | 1/15/37 | 37,638 |
| EUR | 200 | Pays | Eurostat Eurozone HICP ex Tobacco NSA
(pays upon termination) | Receives | 2.29%
(pays upon termination) | 10/15/46 | (30,343) |
| EUR | 300 | Pays | Eurostat Eurozone HICP ex Tobacco NSA
(pays upon termination) | Receives | 2.29%
(pays upon termination) | 10/15/46 | (45,515) |
| EUR | 300 | Pays | Eurostat Eurozone HICP ex Tobacco NSA
(pays upon termination) | Receives | 2.29%
(pays upon termination) | 10/15/46 | (45,628) |
25
See Notes to Financial Statements.
International Income Portfolio
April 30, 2024
Portfolio of Investments (Unaudited) — continued
| Inflation Swaps (Centrally Cleared) (continued) |
Notional Amount
(000's omitted) | Portfolio
Pays/Receives
Return on
Reference Index | Reference Index | Portfolio
Pays/Receives
Rate | Annual
Rate | Termination
Date | Value/Unrealized
Appreciation
(Depreciation) |
| EUR | 280 | Pays | Eurostat Eurozone HICP ex Tobacco NSA
(pays upon termination) | Receives | 2.18%
(pays upon termination) | 1/15/47 | $ (47,838) |
| EUR | 110 | Pays | Eurostat Eurozone HICP ex Tobacco NSA
(pays upon termination) | Receives | 2.64%
(pays upon termination) | 3/13/53 | 1,926 |
| USD | 150 | Receives | Return on CPI-U (NSA)
(pays upon termination) | Pays | 2.44%
(pays upon termination) | 1/13/33 | 2,744 |
| USD | 1,300 | Pays | Return on CPI-U (NSA)
(pays upon termination) | Receives | 2.75%
(pays upon termination) | 10/29/36 | (54,572) |
| USD | 450 | Pays | Return on CPI-U (NSA)
(pays upon termination) | Receives | 2.67%
(pays upon termination) | 1/7/37 | (19,164) |
| USD | 800 | Receives | Return on CPI-U (NSA)
(pays upon termination) | Pays | 2.62%
(pays upon termination) | 10/29/46 | 32,168 |
| USD | 400 | Receives | Return on CPI-U (NSA)
(pays upon termination) | Pays | 2.62%
(pays upon termination) | 10/29/46 | 15,936 |
| USD | 490 | Receives | Return on CPI-U (NSA)
(pays upon termination) | Pays | 2.54%
(pays upon termination) | 1/7/47 | 23,246 |
| USD | 150 | Receives | Return on CPI-U (NSA)
(pays upon termination) | Pays | 2.40%
(pays upon termination) | 3/13/53 | 5,601 |
| | | | | | | | $ (23,136) |
| Interest Rate Swaps (Centrally Cleared) |
Notional Amount
(000's omitted) | Portfolio
Pays/
Receives
Floating
Rate | Floating Rate | Annual
Fixed Rate | Termination
Date | Value | Unamortized
Upfront
Receipts
(Payments) | Unrealized
Appreciation
(Depreciation) |
| AUD | 500 | Pays | 6-month AUD Bank Bill
(pays semi-annually) | 4.48%
(pays semi-annually) | 6/21/25 | $ (515) | $ — | $ (515) |
| BRL | 4,000 | Pays | Brazil CETIP Interbank Deposit Rate
(pays upon termination) | 10.34%
(pays upon termination) | 7/1/25 | (948) | — | (948) |
| BRL | 5,900 | Pays | Brazil CETIP Interbank Deposit Rate
(pays upon termination) | 10.43%
(pays upon termination) | 7/1/25 | (248) | — | (248) |
| BRL | 8,300 | Pays | Brazil CETIP Interbank Deposit Rate
(pays upon termination) | 10.52%
(pays upon termination) | 7/1/25 | 1,253 | — | 1,253 |
| BRL | 2,800 | Pays | Brazil CETIP Interbank Deposit Rate
(pays upon termination) | 10.56%
(pays upon termination) | 7/1/25 | 683 | — | 683 |
| BRL | 1,400 | Pays | Brazil CETIP Interbank Deposit Rate
(pays upon termination) | 10.60%
(pays upon termination) | 7/1/25 | 453 | — | 453 |
| BRL | 15,720 | Pays | Brazil CETIP Interbank Deposit Rate
(pays upon termination) | 9.96%
(pays upon termination) | 1/2/26 | (32,535) | — | (32,535) |
26
See Notes to Financial Statements.
International Income Portfolio
April 30, 2024
Portfolio of Investments (Unaudited) — continued
| Interest Rate Swaps (Centrally Cleared) (continued) |
Notional Amount
(000's omitted) | Portfolio
Pays/
Receives
Floating
Rate | Floating Rate | Annual
Fixed Rate | Termination
Date | Value | Unamortized
Upfront
Receipts
(Payments) | Unrealized
Appreciation
(Depreciation) |
| BRL | 17,574 | Pays | Brazil CETIP Interbank Deposit Rate
(pays upon termination) | 9.98%
(pays upon termination) | 1/2/26 | $ (34,870) | $ — | $ (34,870) |
| CLP | 444,000 | Receives | 6-month Sinacofi Chile Interbank Rate
(pays semi-annually) | 4.53%
(pays semi-annually) | 3/20/29 | 16,087 | — | 16,087 |
| CLP | 756,080 | Receives | 6-month Sinacofi Chile Interbank Rate
(pays semi-annually) | 4.77%
(pays semi-annually) | 6/6/33 | 16,406 | 226 | 16,632 |
| CLP | 253,920 | Receives | 6-month Sinacofi Chile Interbank Rate
(pays semi-annually) | 4.65%
(pays semi-annually) | 6/14/33 | 6,692 | — | 6,692 |
| CLP | 284,000 | Receives | 6-month Sinacofi Chile Interbank Rate
(pays semi-annually) | 4.94%
(pays semi-annually) | 6/21/34 | 9,354 | — | 9,354 |
| CLP | 194,000 | Receives | 6-month Sinacofi Chile Interbank Rate
(pays semi-annually) | 4.94%
(pays semi-annually) | 6/21/34 | 6,312 | — | 6,312 |
| CLP | 94,000 | Receives | 6-month Sinacofi Chile Interbank Rate
(pays semi-annually) | 5.06%
(pays semi-annually) | 6/21/34 | 2,188 | — | 2,188 |
| CLP | 232,000 | Receives | 6-month Sinacofi Chile Interbank Rate
(pays semi-annually) | 5.07%
(pays semi-annually) | 6/21/34 | 5,121 | — | 5,121 |
| CLP | 126,628 | Receives | 6-month Sinacofi Chile Interbank Rate
(pays semi-annually) | 5.08%
(pays semi-annually) | 6/21/34 | 2,693 | — | 2,693 |
| CLP | 233,000 | Receives | 6-month Sinacofi Chile Interbank Rate
(pays semi-annually) | 5.09%
(pays semi-annually) | 6/21/34 | 4,768 | — | 4,768 |
| CLP | 116,372 | Receives | 6-month Sinacofi Chile Interbank Rate
(pays semi-annually) | 5.12%
(pays semi-annually) | 6/21/34 | 2,101 | — | 2,101 |
| CNY | 4,000 | Pays | 7-day China Fixing Repo Rates
(pays quarterly) | 2.28%
(pays quarterly) | 9/20/28 | 4,360 | — | 4,360 |
| CNY | 8,000 | Pays | 7-day China Fixing Repo Rates
(pays quarterly) | 2.29%
(pays quarterly) | 9/20/28 | 8,885 | — | 8,885 |
| CNY | 4,000 | Pays | 7-day China Fixing Repo Rates
(pays quarterly) | 2.29%
(pays quarterly) | 9/20/28 | 4,478 | — | 4,478 |
| CNY | 2,300 | Pays | 7-day China Fixing Repo Rates
(pays quarterly) | 2.29%
(pays quarterly) | 9/20/28 | 2,683 | — | 2,683 |
| CNY | 4,000 | Pays | 7-day China Fixing Repo Rates
(pays quarterly) | 2.43%
(pays quarterly) | 12/20/28 | 7,993 | — | 7,993 |
| CNY | 6,700 | Receives | 7-day China Fixing Repo Rates
(pays quarterly) | 2.20%
(pays quarterly) | 6/19/29 | (2,257) | — | (2,257) |
| COP | 1,317,000 | Receives | Colombia Overnight Interbank Reference Rate
(pays quarterly) | 8.35%
(pays quarterly) | 6/20/29 | (1,663) | — | (1,663) |
27
See Notes to Financial Statements.
International Income Portfolio
April 30, 2024
Portfolio of Investments (Unaudited) — continued
| Interest Rate Swaps (Centrally Cleared) (continued) |
Notional Amount
(000's omitted) | Portfolio
Pays/
Receives
Floating
Rate | Floating Rate | Annual
Fixed Rate | Termination
Date | Value | Unamortized
Upfront
Receipts
(Payments) | Unrealized
Appreciation
(Depreciation) |
| CZK | 15,300 | Receives | 6-month CZK PRIBOR
(pays semi-annually) | 3.53%
(pays annually) | 3/20/29 | $ 21,112 | $ — | $ 21,112 |
| CZK | 3,829 | Pays | 6-month CZK PRIBOR
(pays semi-annually) | 3.94%
(pays annually) | 9/20/33 | (422) | — | (422) |
| CZK | 7,658 | Pays | 6-month CZK PRIBOR
(pays semi-annually) | 3.96%
(pays annually) | 9/20/33 | (459) | — | (459) |
| CZK | 11,513 | Pays | 6-month CZK PRIBOR
(pays semi-annually) | 3.96%
(pays annually) | 9/20/33 | (389) | — | (389) |
| CZK | 11,170 | Pays | 6-month CZK PRIBOR
(pays semi-annually) | 4.12%
(pays annually) | 12/20/33 | (8,504) | — | (8,504) |
| CZK | 9,530 | Pays | 6-month CZK PRIBOR
(pays semi-annually) | 4.15%
(pays annually) | 12/20/33 | (5,988) | — | (5,988) |
| CZK | 4,500 | Pays | 6-month CZK PRIBOR
(pays semi-annually) | 3.37%
(pays annually) | 3/20/34 | (13,568) | — | (13,568) |
| CZK | 16,500 | Pays | 6-month CZK PRIBOR
(pays semi-annually) | 4.08%
(pays annually) | 6/19/34 | (5,240) | — | (5,240) |
| CZK | 11,550 | Pays | 6-month CZK PRIBOR
(pays semi-annually) | 4.20%
(pays annually) | 6/19/34 | 1,060 | — | 1,060 |
| CZK | 4,950 | Pays | 6-month CZK PRIBOR
(pays semi-annually) | 4.27%
(pays annually) | 6/19/34 | 1,700 | — | 1,700 |
| EUR | 4,100 | Pays | 6-month EURIBOR
(pays semi-annually) | 3.60%
(pays annually) | 6/21/25 | 70,640 | — | 70,640 |
| EUR | 1,695 | Pays | 6-month EURIBOR
(pays semi-annually) | 3.14%
(pays annually) | 9/20/28 | 34,511 | — | 34,511 |
| EUR | 2,065 | Pays | 6-month EURIBOR
(pays semi-annually) | 3.20%
(pays annually) | 9/20/28 | 48,564 | — | 48,564 |
| EUR | 500 | Pays | 6-month EURIBOR
(pays semi-annually) | 2.96%
(pays annually) | 9/20/43 | 20,075 | — | 20,075 |
| EUR | 625 | Pays | 6-month EURIBOR
(pays semi-annually) | 3.00%
(pays annually) | 9/20/43 | 29,459 | — | 29,459 |
| GBP | 101 | Pays | 1-day Sterling Overnight Index Average
(pays annually) | 4.56%
(pays annually) | 10/2/28 | 742 | — | 742 |
| GBP | 540 | Pays | 1-day Sterling Overnight Index Average
(pays annually) | 4.27%
(pays annually) | 12/20/28 | (2,862) | — | (2,862) |
| GBP | 540 | Pays | 1-day Sterling Overnight Index Average
(pays annually) | 4.28%
(pays annually) | 12/20/28 | (2,557) | — | (2,557) |
| GBP | 199 | Pays | 1-day Sterling Overnight Index Average
(pays annually) | 4.39%
(pays annually) | 12/20/28 | 283 | — | 283 |
| GBP | 100 | Pays | 1-day Sterling Overnight Index Average
(pays annually) | 4.59%
(pays annually) | 12/20/28 | 1,239 | — | 1,239 |
| GBP | 1,853 | Pays | 1-day Sterling Overnight Index Average
(pays annually) | 3.83%
(pays annually) | 3/20/29 | (46,880) | — | (46,880) |
| GBP | 850 | Pays | 1-day Sterling Overnight Index Average
(pays annually) | 4.20%
(pays annually) | 6/21/33 | 361 | — | 361 |
| HUF | 87,361 | Pays | 6-month HUF BUBOR
(pays semi-annually) | 6.92%
(pays annually) | 6/19/29 | 294 | — | 294 |
28
See Notes to Financial Statements.
International Income Portfolio
April 30, 2024
Portfolio of Investments (Unaudited) — continued
| Interest Rate Swaps (Centrally Cleared) (continued) |
Notional Amount
(000's omitted) | Portfolio
Pays/
Receives
Floating
Rate | Floating Rate | Annual
Fixed Rate | Termination
Date | Value | Unamortized
Upfront
Receipts
(Payments) | Unrealized
Appreciation
(Depreciation) |
| HUF | 55,937 | Pays | 6-month HUF BUBOR
(pays semi-annually) | 6.94%
(pays annually) | 6/19/29 | $ 282 | $ — | $ 282 |
| HUF | 84,219 | Pays | 6-month HUF BUBOR
(pays semi-annually) | 6.94%
(pays annually) | 6/19/29 | 471 | — | 471 |
| HUF | 139,370 | Pays | 6-month HUF BUBOR
(pays semi-annually) | 6.74%
(pays annually) | 6/19/34 | (7,084) | — | (7,084) |
| HUF | 27,680 | Pays | 6-month HUF BUBOR
(pays semi-annually) | 6.76%
(pays annually) | 6/19/34 | (1,309) | — | (1,309) |
| HUF | 373,950 | Pays | 6-month HUF BUBOR
(pays semi-annually) | 6.78%
(pays annually) | 6/19/34 | (16,234) | — | (16,234) |
| HUF | 119,229 | Pays | 6-month HUF BUBOR
(pays semi-annually) | 6.99%
(pays annually) | 6/19/34 | (478) | — | (478) |
| HUF | 246,254 | Pays | 6-month HUF BUBOR
(pays semi-annually) | 7.03%
(pays annually) | 6/19/34 | 1,119 | — | 1,119 |
| ILS | 2,700 | Receives | 3-month ILS TELBOR
(pays quarterly) | 4.09%
(pays annually) | 6/19/29 | 9,758 | — | 9,758 |
| INR | 83,400 | Pays | 1-day INR FBIL MIBOR
(pays semi-annually) | 6.53%
(pays semi-annually) | 9/18/26 | (1,250) | — | (1,250) |
| INR | 83,000 | Pays | 1-day INR FBIL MIBOR
(pays semi-annually) | 6.55%
(pays semi-annually) | 9/18/26 | (907) | — | (907) |
| INR | 41,800 | Pays | 1-day INR FBIL MIBOR
(pays semi-annually) | 6.57%
(pays semi-annually) | 9/18/26 | (313) | — | (313) |
| INR | 42,000 | Pays | 1-day INR FBIL MIBOR
(pays semi-annually) | 6.59%
(pays semi-annually) | 9/18/26 | (121) | — | (121) |
| INR | 42,000 | Pays | 1-day INR FBIL MIBOR
(pays semi-annually) | 6.61%
(pays semi-annually) | 9/18/26 | 36 | — | 36 |
| INR | 42,000 | Pays | 1-day INR FBIL MIBOR
(pays semi-annually) | 6.61%
(pays semi-annually) | 9/18/26 | 81 | — | 81 |
| INR | 30,500 | Pays | 1-day INR FBIL MIBOR
(pays semi-annually) | 6.62%
(pays semi-annually) | 9/18/26 | 91 | — | 91 |
| INR | 41,700 | Pays | 1-day INR FBIL MIBOR
(pays semi-annually) | 6.64%
(pays semi-annually) | 9/18/26 | 366 | — | 366 |
| INR | 41,800 | Pays | 1-day INR FBIL MIBOR
(pays semi-annually) | 6.66%
(pays semi-annually) | 9/18/26 | 528 | — | 528 |
| INR | 34,000 | Pays | 1-day INR FBIL MIBOR
(pays semi-annually) | 6.14%
(pays semi-annually) | 3/20/29 | (7,933) | — | (7,933) |
| INR | 191,000 | Pays | 1-day INR FBIL MIBOR
(pays semi-annually) | 6.23%
(pays semi-annually) | 3/20/29 | (35,839) | — | (35,839) |
| INR | 61,900 | Receives | 1-day INR FBIL MIBOR
(pays semi-annually) | 6.54%
(pays semi-annually) | 6/19/29 | 1,665 | — | 1,665 |
| JPY | 129,000 | Receives | 1-day Overnight Tokyo Average Rate
(pays annually) | 0.41%
(pays annually) | 9/20/28 | 2,292 | — | 2,292 |
| JPY | 89,000 | Receives | 1-day Overnight Tokyo Average Rate
(pays annually) | 0.57%
(pays annually) | 6/19/29 | 1,041 | — | 1,041 |
| JPY | 80,000 | Receives | 1-day Overnight Tokyo Average Rate
(pays annually) | 0.43%
(pays annually) | 6/15/32 | 13,675 | — | 13,675 |
| JPY | 90,000 | Receives | 1-day Overnight Tokyo Average Rate
(pays annually) | 0.43%
(pays annually) | 6/15/32 | 15,384 | — | 15,384 |
29
See Notes to Financial Statements.
International Income Portfolio
April 30, 2024
Portfolio of Investments (Unaudited) — continued
| Interest Rate Swaps (Centrally Cleared) (continued) |
Notional Amount
(000's omitted) | Portfolio
Pays/
Receives
Floating
Rate | Floating Rate | Annual
Fixed Rate | Termination
Date | Value | Unamortized
Upfront
Receipts
(Payments) | Unrealized
Appreciation
(Depreciation) |
| JPY | 21,000 | Receives | 1-day Overnight Tokyo Average Rate
(pays annually) | 0.90%
(pays annually) | 2/2/33 | $ (680) | $ — | $ (680) |
| JPY | 1,000 | Receives | 1-day Overnight Tokyo Average Rate
(pays annually) | 0.80%
(pays annually) | 9/20/33 | 30 | — | 30 |
| JPY | 1,000 | Receives | 1-day Overnight Tokyo Average Rate
(pays annually) | 0.80%
(pays annually) | 9/20/33 | 29 | — | 29 |
| JPY | 1,000 | Receives | 1-day Overnight Tokyo Average Rate
(pays annually) | 0.81%
(pays annually) | 9/20/33 | 26 | — | 26 |
| JPY | 87,200 | Receives | 1-day Overnight Tokyo Average Rate
(pays annually) | 0.82%
(pays annually) | 9/20/33 | 1,628 | — | 1,628 |
| JPY | 42,000 | Receives | 1-day Overnight Tokyo Average Rate
(pays annually) | 0.91%
(pays annually) | 6/19/34 | 1,649 | — | 1,649 |
| JPY | 34,000 | Receives | 1-day Overnight Tokyo Average Rate
(pays annually) | 1.55%
(pays annually) | 6/19/54 | 6,047 | — | 6,047 |
| KRW | 446,000 | Receives | 3-month KRW Certificate of Deposit Rate
(pays quarterly) | 3.41%
(pays quarterly) | 6/19/29 | 1,697 | — | 1,697 |
| KRW | 554,000 | Receives | 3-month KRW Certificate of Deposit Rate
(pays quarterly) | 3.42%
(pays quarterly) | 6/19/29 | 1,923 | — | 1,923 |
| MXN | 51,430 | Pays | Mexico Interbank TIIE 28 Day
(pays monthly) | 10.88%
(pays monthly) | 1/6/25 | (3,979) | — | (3,979) |
| MXN | 141,200 | Pays | Mexico Interbank TIIE 28 Day
(pays monthly) | 10.82%
(pays monthly) | 1/7/25 | (14,096) | — | (14,096) |
| MXN | 124,570 | Pays | Mexico Interbank TIIE 28 Day
(pays monthly) | 10.80%
(pays monthly) | 1/8/25 | (16,053) | — | (16,053) |
| MXN | 9,470 | Receives | Mexico Interbank TIIE 28 Day
(pays monthly) | 9.02%
(pays monthly) | 3/28/29 | 16,842 | — | 16,842 |
| MXN | 9,770 | Pays | Mexico Interbank TIIE 28 Day
(pays monthly) | 8.71%
(pays monthly) | 12/1/33 | (32,100) | — | (32,100) |
| MXN | 9,400 | Pays | Mexico Interbank TIIE 28 Day
(pays monthly) | 8.77%
(pays monthly) | 12/1/33 | (28,766) | — | (28,766) |
| MXN | 5,820 | Pays | Mexico Interbank TIIE 28 Day
(pays monthly) | 8.43%
(pays monthly) | 12/2/33 | (25,222) | — | (25,222) |
| MXN | 6,010 | Pays | Mexico Interbank TIIE 28 Day
(pays monthly) | 8.49%
(pays monthly) | 12/2/33 | (24,804) | — | (24,804) |
| PLN | 2,000 | Receives | 6-month PLN WIBOR
(pays semi-annually) | 4.79%
(pays annually) | 3/20/29 | 10,705 | — | 10,705 |
30
See Notes to Financial Statements.
International Income Portfolio
April 30, 2024
Portfolio of Investments (Unaudited) — continued
| Interest Rate Swaps (Centrally Cleared) (continued) |
Notional Amount
(000's omitted) | Portfolio
Pays/
Receives
Floating
Rate | Floating Rate | Annual
Fixed Rate | Termination
Date | Value | Unamortized
Upfront
Receipts
(Payments) | Unrealized
Appreciation
(Depreciation) |
| THB | 14,000 | Receives | Thai Overnight Repurchase Rate
(pays semi-annually) | 2.59%
(pays semi-annually) | 6/19/29 | $ 826 | $ — | $ 826 |
| THB | 7,260 | Receives | Thai Overnight Repurchase Rate
(pays semi-annually) | 2.61%
(pays semi-annually) | 6/19/29 | 244 | — | 244 |
| THB | 9,000 | Receives | Thai Overnight Repurchase Rate
(pays semi-annually) | 2.61%
(pays semi-annually) | 6/19/29 | 268 | — | 268 |
| TWD | 7,400 | Receives | 3-month TWD TAIBOR
(pays quarterly) | 1.26%
(pays quarterly) | 3/20/29 | 6,652 | — | 6,652 |
| TWD | 9,900 | Receives | 3-month TWD TAIBOR
(pays quarterly) | 1.27%
(pays quarterly) | 3/20/29 | 8,679 | — | 8,679 |
| TWD | 10,100 | Receives | 3-month TWD TAIBOR
(pays quarterly) | 1.32%
(pays quarterly) | 3/20/29 | 8,109 | — | 8,109 |
| TWD | 23,800 | Receives | 3-month TWD TAIBOR
(pays quarterly) | 1.33%
(pays quarterly) | 3/20/29 | 18,669 | — | 18,669 |
| TWD | 8,000 | Receives | 3-month TWD TAIBOR
(pays quarterly) | 1.35%
(pays quarterly) | 3/20/29 | 6,068 | — | 6,068 |
| TWD | 32,700 | Receives | 3-month TWD TAIBOR
(pays quarterly) | 1.36%
(pays quarterly) | 3/20/29 | 24,322 | — | 24,322 |
| TWD | 9,900 | Receives | 3-month TWD TAIBOR
(pays quarterly) | 1.37%
(pays quarterly) | 3/20/29 | 7,217 | — | 7,217 |
| TWD | 9,900 | Receives | 3-month TWD TAIBOR
(pays quarterly) | 1.38%
(pays quarterly) | 3/20/29 | 7,144 | — | 7,144 |
| TWD | 24,100 | Receives | 3-month TWD TAIBOR
(pays quarterly) | 1.64%
(pays quarterly) | 6/19/29 | 9,020 | — | 9,020 |
| TWD | 5,800 | Receives | 3-month TWD TAIBOR
(pays quarterly) | 1.95%
(pays quarterly) | 6/19/29 | (538) | — | (538) |
| USD | 850 | Pays | SOFR
(pays annually) | 4.01%
(pays annually) | 8/4/28 | (26,364) | — | (26,364) |
| USD | 1,050 | Pays | SOFR
(pays annually) | 4.01%
(pays annually) | 8/4/28 | (32,519) | — | (32,519) |
| USD | 1,000 | Pays | SOFR
(pays annually) | 3.06%
(pays annually) | 11/7/32 | (101,421) | — | (101,421) |
| USD | 160 | Pays | SOFR
(pays annually) | 3.23%
(pays semi-annually) | 1/13/33 | (13,296) | — | (13,296) |
| USD | 220 | Pays | SOFR
(pays annually) | 3.22%
(pays annually) | 6/6/33 | (7,146) | — | (7,146) |
| USD | 310 | Pays | SOFR
(pays annually) | 3.25%
(pays annually) | 6/6/33 | (9,815) | — | (9,815) |
| USD | 300 | Pays | SOFR
(pays annually) | 3.26%
(pays annually) | 6/7/33 | (9,363) | — | (9,363) |
| USD | 270 | Pays | SOFR
(pays annually) | 3.26%
(pays annually) | 6/14/33 | (8,368) | — | (8,368) |
| USD | 1,265 | Pays | SOFR
(pays annually) | 3.80%
(pays annually) | 11/28/33 | (65,583) | — | (65,583) |
| Total | | | | | | $(134,353) | $ 226 | $ (134,127) |
31
See Notes to Financial Statements.
International Income Portfolio
April 30, 2024
Portfolio of Investments (Unaudited) — continued
| Interest Rate Swaps (OTC) |
| Counterparty | Notional Amount
(000's omitted) | Portfolio
Pays/Receives
Floating Rate | Floating Rate | Annual
Fixed Rate | Termination
Date | Value/Unrealized
Appreciation
(Depreciation) |
| Citibank, N.A. | MYR | 4,000 | Receives | 3-month MYR KLIBOR
(pays quarterly) | 3.62%
(pays quarterly) | 3/20/29 | $ 6,785 |
| Goldman Sachs International | MYR | 4,700 | Receives | 3-month MYR KLIBOR
(pays quarterly) | 3.73%
(pays quarterly) | 6/19/29 | 4,353 |
| JPMorgan Chase Bank, N.A. | MYR | 2,200 | Receives | 3-month MYR KLIBOR
(pays quarterly) | 3.63%
(pays quarterly) | 3/20/29 | 3,497 |
| JPMorgan Chase Bank, N.A. | MYR | 2,000 | Receives | 3-month MYR KLIBOR
(pays quarterly) | 3.63%
(pays quarterly) | 3/20/29 | 3,198 |
| Nomura International PLC | MYR | 4,000 | Receives | 3-month MYR KLIBOR
(pays quarterly) | 3.60%
(pays quarterly) | 3/20/29 | 7,561 |
| Standard Chartered Bank | MYR | 2,000 | Receives | 3-month MYR KLIBOR
(pays quarterly) | 3.62%
(pays quarterly) | 3/20/29 | 3,392 |
| Total | | | | | | | $28,786 |
| Credit Default Swaps - Sell Protection (OTC) |
| Reference Entity | Counterparty | Notional
Amount*
(000's omitted) | Contract Annual
Fixed Rate** | Current
Market
Annual
Fixed Rate*** | Termination
Date | Value | Unamortized
Upfront
Receipts
(Payments) | Unrealized
Appreciation
(Depreciation) |
| Vietnam | Goldman Sachs International | $ 300 | 1.00%
(pays quarterly)(1) | 0.49% | 6/20/24 | $ 564 | $ (123) | $ 441 |
| Total | | $300 | | | | $564 | $(123) | $441 |
| * | If the Portfolio is the seller of credit protection, the notional amount is the maximum potential amount of future payments the Portfolio could be required to make if a credit event, as defined in the credit default swap agreement, were to occur. At April 30, 2024, such maximum potential amount for all open credit default swaps in which the Portfolio is the seller was $300,000. |
| ** | The contract annual fixed rate represents the fixed rate of interest received by the Portfolio (as a seller of protection) or paid by the Portfolio (as a buyer of protection) on the notional amount of the credit default swap contract. |
| *** | Current market annual fixed rates, utilized in determining the net unrealized appreciation or depreciation as of period end, serve as an indicator of the market’s perception of the current status of the payment/performance risk associated with the credit derivative. The current market annual fixed rate of a particular reference entity reflects the cost, as quoted by the pricing vendor, of selling protection against default of that entity as of period end and may include upfront payments required to be made to enter into the agreement. The higher the fixed rate, the greater the market perceived risk of a credit event involving the reference entity. A rate identified as “Defaulted” indicates a credit event has occurred for the reference entity. |
| (1) | Upfront payment is exchanged with the counterparty as a result of the standardized trading coupon. |
| Total Return Swaps (OTC) |
| Counterparty | Notional Amount
(000's omitted) | Portfolio Receives | Portfolio Pays | Termination
Date | Value/Unrealized
Appreciation
(Depreciation) |
| Barclays Bank PLC | USD | 911 | 5.35% on PEN 3,351,456 (pays upon termination) | SOFR + 1.10% on Notional Amount (pays upon termination) | 6/10/24 | $ (58,688) |
| | | | | | | $(58,688) |
32
See Notes to Financial Statements.
International Income Portfolio
April 30, 2024
Portfolio of Investments (Unaudited) — continued
| Cross-Currency Swaps (OTC) | | |
| Counterparty | Portfolio Receives | Portfolio Pays | Termination
Date | Value/Unrealized
Appreciation
(Depreciation) |
| Barclays Bank PLC | 1-day Indice Camara Promedio Rate on CLP 140,904,680 (pays semi-annually)* | 1.41% on CLP equivalent of CLF 172,000 (pays semi-annually)* | 1/13/33 | $ 5,918 |
| Goldman Sachs International | 1-day Indice Camara Promedio Rate on CLP 63,504,540 (pays semi-annually)* | 2.10% on CLP equivalent of CLF 2,000 (pays semi-annually)* | 4/8/32 | (9,883) |
| Goldman Sachs International | 1-day Indice Camara Promedio Rate on CLP 158,776,700 (pays semi-annually)* | 2.25% on CLP equivalent of CLF 5,000 (pays semi-annually)* | 4/11/32 | (26,885) |
| Goldman Sachs International | 1-day Indice Camara Promedio Rate on CLP 28,777,725 (pays semi-annually)* | 1.85% on CLP equivalent of CLF 900 (pays semi-annually)* | 4/20/32 | (3,638) |
| | | | | $(34,488) |
| * | At the termination date, the Portfolio will either pay or receive the USD equivalent of the difference between the initial CLP notional amount and the CLP equivalent of the CLF notional amount on such date. |
| Abbreviations: |
| BUBOR | – Budapest Interbank Offered Rate |
| COF | – Cost of Funds 11th District |
| CPI-U (NSA) | – Consumer Price Index All Urban Non-Seasonally Adjusted |
| EURIBOR | – Euro Interbank Offered Rate |
| FBIL | – Financial Benchmarks India Ltd. |
| GDP | – Gross Domestic Product |
| HICP | – Harmonised Indices of Consumer Prices |
| KLIBOR | – Kuala Lumpur Interbank Offered Rate |
| MIBOR | – Mumbai Interbank Offered Rate |
| |
| OTC | – Over-the-counter |
| PRIBOR | – Prague Interbank Offered Rate |
| SOFR | – Secured Overnight Financing Rate |
| STACR | – Structured Agency Credit Risk |
| TAIBOR | – Taipei Interbank Offered Rate |
| TBA | – To Be Announced |
| TELBOR | – Tel Aviv Interbank Offered Rate |
| WIBOR | – Warsaw Interbank Offered Rate |
| Currency Abbreviations: |
| AUD | – Australian Dollar |
| BRL | – Brazilian Real |
| CAD | – Canadian Dollar |
| CLF | – Chilean Unidad de Fomento |
| CLP | – Chilean Peso |
| CNH | – Yuan Renminbi Offshore |
| CNY | – Yuan Renminbi |
| COP | – Colombian Peso |
| CZK | – Czech Koruna |
| DOP | – Dominican Peso |
| EGP | – Egyptian Pound |
| EUR | – Euro |
| GBP | – British Pound Sterling |
| HKD | – Hong Kong Dollar |
| HUF | – Hungarian Forint |
| IDR | – Indonesian Rupiah |
| ILS | – Israeli Shekel |
| |
| INR | – Indian Rupee |
| ISK | – Icelandic Krona |
| JPY | – Japanese Yen |
| KRW | – South Korean Won |
| MXN | – Mexican Peso |
| MYR | – Malaysian Ringgit |
| NZD | – New Zealand Dollar |
| PEN | – Peruvian Sol |
| PHP | – Philippine Peso |
| PLN | – Polish Zloty |
| PYG | – Paraguayan Guarani |
| RSD | – Serbian Dinar |
| SEK | – Swedish Krona |
| SGD | – Singapore Dollar |
| THB | – Thai Baht |
| TRY | – Turkish Lira |
| TWD | – New Taiwan Dollar |
33
See Notes to Financial Statements.
International Income Portfolio
April 30, 2024
Portfolio of Investments (Unaudited) — continued
| |
| UAH | – Ukrainian Hryvnia |
| USD | – United States Dollar |
| |
| UYU | – Uruguayan Peso |
| ZAR | – South African Rand |
34
See Notes to Financial Statements.
International Income Portfolio
April 30, 2024
Statement of Assets and Liabilities (Unaudited)
| | April 30, 2024 |
| Assets | |
| Unaffiliated investments, at value (identified cost $33,662,836) | $ 32,773,729 |
| Affiliated investments, at value (identified cost $3,109,163) | 3,109,163 |
| Deposits for derivatives collateral: | |
| Centrally cleared derivatives | 1,179,750 |
| Foreign currency, at value (identified cost $455,638) | 462,480 |
| Interest and dividends receivable | 520,484 |
| Dividends receivable from affiliated investments | 12,428 |
| Receivable for investments sold | 10,267 |
| Receivable for open forward foreign currency exchange contracts | 449,631 |
| Receivable for open swap contracts | 35,145 |
| Upfront payments on open non-centrally cleared swap contracts | 123 |
| Receivable for closed swap contracts | 5,493 |
| Receivable from affiliates | 17,943 |
| Trustees' deferred compensation plan | 41,554 |
| Total assets | $38,618,190 |
| Liabilities | |
| Written options and swaptions outstanding, at value (premiums received $42,055) | $ 62,129 |
| Payable for when-issued securities/forward purchase commitments | 2,675,524 |
| Payable for securities sold short, at value (proceeds $1,115,274) | 1,042,123 |
| Payable for variation margin on open futures contracts | 21,200 |
| Payable for variation margin on open centrally cleared derivatives | 1,274,257 |
| Payable for open forward foreign currency exchange contracts | 629,689 |
| Payable for open swap contracts | 99,094 |
| Payable for closed swap contracts | 9,002 |
| Due to custodian | 469,762 |
| Payable to affiliates: | |
| Investment adviser fee | 13,053 |
| Trustees' fees | 246 |
| Trustees' deferred compensation plan | 41,554 |
| Interest payable on securities sold short | 75,795 |
| Accrued foreign capital gains taxes | 166 |
| Accrued expenses | 122,198 |
| Total liabilities | $ 6,535,792 |
| Net Assets applicable to investors' interest in Portfolio | $32,082,398 |
35
See Notes to Financial Statements.
International Income Portfolio
April 30, 2024
Statement of Operations (Unaudited)
| | Six Months Ended |
| | April 30, 2024 |
| Investment Income | |
| Dividend income from affiliated investments | $ 41,501 |
| Interest income (net of foreign taxes withheld of $5,734) | 1,105,695 |
| Total investment income | $ 1,147,196 |
| Expenses | |
| Investment adviser fee | $ 88,432 |
| Trustees’ fees and expenses | 1,431 |
| Custodian fee | 77,248 |
| Legal and accounting services | 45,306 |
| Interest expense and fees | 21,776 |
| Interest expense on securities sold short | 46,664 |
| Miscellaneous | 1,235 |
| Total expenses | $ 282,092 |
| Deduct: | |
| Waiver and/or reimbursement of expenses by affiliates | $ 90,982 |
| Total expense reductions | $ 90,982 |
| Net expenses | $ 191,110 |
| Net investment income | $ 956,086 |
| Realized and Unrealized Gain (Loss) | |
| Net realized gain (loss): | |
| Investment transactions (net of foreign capital gains taxes of $9,009) | $ (794,001) |
| Written options and swaptions | 7,933 |
| Securities sold short | (53,627) |
| Futures contracts | (161,701) |
| Swap contracts | (244,082) |
| Foreign currency transactions | (14,664) |
| Forward foreign currency exchange contracts | (334,868) |
| Net realized loss | $(1,595,010) |
| Change in unrealized appreciation (depreciation): | |
| Investments (including net increase in accrued foreign capital gains taxes of $10) | $ 1,564,226 |
| Written options and swaptions | 40,422 |
| Securities sold short | 58,514 |
| Futures contracts | 37,447 |
| Swap contracts | 430,373 |
| Foreign currency | 11,554 |
| Forward foreign currency exchange contracts | 4,227 |
| Net change in unrealized appreciation (depreciation) | $ 2,146,763 |
| Net realized and unrealized gain | $ 551,753 |
| Net increase in net assets from operations | $ 1,507,839 |
36
See Notes to Financial Statements.
International Income Portfolio
April 30, 2024
Statements of Changes in Net Assets
| | Six Months Ended
April 30, 2024
(Unaudited) | Year Ended
October 31, 2023 |
| Increase (Decrease) in Net Assets | | |
| From operations: | | |
| Net investment income | $ 956,086 | $ 1,782,189 |
| Net realized loss | (1,595,010) | (3,196,761) |
| Net change in unrealized appreciation (depreciation) | 2,146,763 | 3,004,838 |
| Net increase in net assets from operations | $ 1,507,839 | $ 1,590,266 |
| Capital transactions: | | |
| Contributions | $ 2,223,868 | $ 17,066,116 |
| Withdrawals | (7,677,594) | (11,182,963) |
| Net increase (decrease) in net assets from capital transactions | $ (5,453,726) | $ 5,883,153 |
| Net increase (decrease) in net assets | $ (3,945,887) | $ 7,473,419 |
| Net Assets | | |
| At beginning of period | $ 36,028,285 | $ 28,554,866 |
| At end of period | $32,082,398 | $ 36,028,285 |
37
See Notes to Financial Statements.
International Income Portfolio
April 30, 2024
| | Six Months Ended
April 30, 2024
(Unaudited) | Year Ended October 31, |
| Ratios/Supplemental Data | 2023 | 2022 | 2021 | 2020 | 2019 |
| Ratios (as a percentage of average daily net assets): | | | | | | |
| Expenses | 1.08% (1)(2)(3)(4) | 0.72% (2)(3)(4) | 0.72% (2)(3)(4) | 0.71% (3)(4) | 0.71% (3)(4) | 0.81% (3)(4) |
| Net investment income | 5.42% (1) | 4.66% | 3.13% | 1.86% | 2.48% | 3.73% |
| Portfolio Turnover | 119% (5)(6) | 230% (6) | 159% (6) | 102% (6) | 88% (6) | 92% |
| Total Return | 3.44% (4)(5) | 6.86% (4) | (18.54)% (4) | (0.08)% (4) | 6.04% (4) | 5.92% (4) |
| Net assets, end of period (000’s omitted) | $32,082 | $36,028 | $28,555 | $58,102 | $57,167 | $84,644 |
| (1) | Annualized. |
| (2) | Includes a reduction by the investment adviser of a portion of its adviser fee due to the Portfolio’s investment in the Liquidity Fund (equal to less than 0.01%, 0.01% and less than 0.005% of average daily net assets for the six months ended April 30, 2024 and the years ended October 31, 2023 and 2022, respectively). |
| (3) | Includes interest expense, including on securities sold short and/or reverse repurchase agreements if applicable, of 0.38%, 0.03% and 0.02% of average daily net assets for the six months ended April 30, 2024 and the years ended October 31, 2023 and 2022, respectively, and 0.01% of average daily net assets for each of the years ended October 31, 2021, 2020 and 2019. |
| (4) | The investment adviser reimbursed certain operating expenses (equal to 0.52%, 0.56%, 0.40%, 0.19%, 0.16% and 0.09% of average daily net assets for the six months ended April 30, 2024 and the years ended October 31, 2023, 2022, 2021, 2020 and 2019, respectively). Absent this reimbursement, total return would be lower. |
| (5) | Not annualized. |
| (6) | Includes the effect of To Be Announced (TBA) transactions. |
38
See Notes to Financial Statements.
International Income Portfolio
April 30, 2024
Notes to Financial Statements (Unaudited)
1 Significant Accounting Policies
International Income Portfolio (the Portfolio) is a Massachusetts business trust registered under the Investment Company Act of 1940, as amended (the 1940 Act), as a diversified, open-end management investment company. The Portfolio’s investment objective is total return. The Declaration of Trust permits the Trustees to issue interests in the Portfolio. At April 30, 2024, Eaton Vance Global Sovereign Opportunities Fund held an interest of approximately 100% in the Portfolio.
The following is a summary of significant accounting policies of the Portfolio. The policies are in conformity with accounting principles generally accepted in the United States of America (U.S. GAAP). The Portfolio is an investment company and follows accounting and reporting guidance in the Financial Accounting Standards Board (FASB) Accounting Standards Codification Topic 946.
A Investment Valuation—The following methodologies are used to determine the market value or fair value of investments.
Debt Obligations. Debt obligations are generally valued on the basis of valuations provided by third party pricing services, as derived from such services’ pricing models. Inputs to the models may include, but are not limited to, reported trades, executable bid and ask prices, broker/dealer quotations, prices or yields of securities with similar characteristics, interest rates, anticipated prepayments, benchmark curves or information pertaining to the issuer, as well as industry and economic events. The pricing services may use a matrix approach, which considers information regarding securities with similar characteristics to determine the valuation for a security. Short-term debt obligations purchased with a remaining maturity of sixty days or less for which a valuation from a third party pricing service is not readily available may be valued at amortized cost, which approximates fair value.
Derivatives. U.S. exchange-traded options are valued at the mean between the bid and ask prices at valuation time as reported by the Options Price Reporting Authority. Non-U.S. exchange-traded options and over-the-counter options (including options on securities, indices and foreign currencies) are valued by a third party pricing service using techniques that consider factors including the value of the underlying instrument, the volatility of the underlying instrument and the period of time until option expiration. Futures contracts are valued at the closing settlement price established by the board of trade or exchange on which they are traded. Forward foreign currency exchange contracts are generally valued at the mean of the average bid and average ask prices that are reported by currency dealers to a third party pricing service at the valuation time. Such third party pricing service valuations are supplied for specific settlement periods and the Portfolio’s forward foreign currency exchange contracts are valued at an interpolated rate between the closest preceding and subsequent settlement period reported by the third party pricing service. Swaps and options on interest rate swaps (“swaptions”) are normally valued using valuations provided by a third party pricing service. Such pricing service valuations are based on the present value of fixed and projected floating rate cash flows over the term of the swap contract, and in the case of credit default swaps, based on credit spread quotations obtained from broker/dealers and expected default recovery rates determined by the pricing service using proprietary models. In the case of total return swaps, pricing service valuations are based on the value of the underlying index or instrument and reference interest rate. Future cash flows on swaps are discounted to their present value using swap rates provided by electronic data services or by broker/dealers. Alternatively, swaptions may be valued at the valuation provided by a broker/dealer (usually the counterparty to the option), so determined using similar techniques as those employed by the pricing service.
Foreign Securities and Currencies. Foreign securities and currencies are valued in U.S. dollars, based on foreign currency exchange rate quotations supplied by a third party pricing service. The pricing service uses a proprietary model to determine the exchange rate. Inputs to the model include reported trades and implied bid/ask spreads.
Other. Investments in management investment companies (including money market funds) that do not trade on an exchange are valued at the net asset value as of the close of each business day.
Fair Valuation. In connection with Rule 2a-5 of the 1940 Act, the Trustees have designated the Portfolio’s investment adviser as its valuation designee. Investments for which valuations or market quotations are not readily available or are deemed unreliable are valued by the investment adviser, as valuation designee, at fair value using methods that most fairly reflect the security’s “fair value”, which is the amount that the Portfolio might reasonably expect to receive for the security upon its current sale in the ordinary course. Each such determination is based on a consideration of relevant factors, which are likely to vary from one pricing context to another. These factors may include, but are not limited to, the type of security, the existence of any contractual restrictions on the security’s disposition, the price and extent of public trading in similar securities of the issuer or of comparable companies or entities, quotations or relevant information obtained from broker/dealers or other market participants, information obtained from the issuer, analysts, and/or the appropriate stock exchange (for exchange-traded securities), an analysis of the company’s or entity’s financial statements, and an evaluation of the forces that influence the issuer and the market(s) in which the security is purchased and sold.
B Investment Transactions—Investment transactions for financial statement purposes are accounted for on a trade date basis. Realized gains and losses on investments sold are determined on the basis of identified cost.
C Income—Interest income is recorded on the basis of interest accrued, adjusted for amortization of premium or accretion of discount. Withholding taxes on foreign interest have been provided for in accordance with the Portfolio’s understanding of the applicable countries’ tax rules and rates. Inflation adjustments to the principal amount of inflation-adjusted bonds and notes are reflected as interest income. Deflation adjustments to the principal amount of an inflation-adjusted bond or note are reflected as reductions to interest income to the extent of interest income previously recorded on such bond or note. Dividend income is recorded on the ex-dividend date for dividends received in cash and/or securities.
International Income Portfolio
April 30, 2024
Notes to Financial Statements (Unaudited) — continued
D Federal and Other Taxes—The Portfolio has elected to be treated as a partnership for federal tax purposes. No provision is made by the Portfolio for federal or state taxes on any taxable income of the Portfolio because each investor in the Portfolio is ultimately responsible for the payment of any taxes on its share of taxable income. Since at least one of the Portfolio’s investors is a regulated investment company that invests all or substantially all of its assets in the Portfolio, the Portfolio normally must satisfy the applicable source of income and diversification requirements (under the Internal Revenue Code) in order for its investors to satisfy them. The Portfolio will allocate, at least annually among its investors, each investor’s distributive share of the Portfolio’s net investment income, net realized capital gains and losses and any other items of income, gain, loss, deduction or credit.
In addition to the requirements of the Internal Revenue Code, the Portfolio may also be subject to local taxes on the recognition of capital gains in certain countries. In determining the daily net asset value, the Portfolio estimates the accrual for such taxes, if any, based on the unrealized appreciation on certain portfolio securities and the related tax rates. Taxes attributable to unrealized appreciation are included in the change in unrealized appreciation (depreciation) on investments. Capital gains taxes on securities sold are included in net realized gain (loss) on investments.
As of April 30, 2024, the Portfolio had no uncertain tax positions that would require financial statement recognition, de-recognition, or disclosure. The Portfolio files a U.S. federal income tax return annually after its fiscal year-end, which is subject to examination by the Internal Revenue Service for a period of three years from the date of filing.
E Foreign Currency Translation—Investment valuations, other assets, and liabilities initially expressed in foreign currencies are translated each business day into U.S. dollars based upon current exchange rates. Purchases and sales of foreign investment securities and income and expenses denominated in foreign currencies are translated into U.S. dollars based upon currency exchange rates in effect on the respective dates of such transactions. Recognized gains or losses on investment transactions attributable to changes in foreign currency exchange rates are recorded for financial statement purposes as net realized gains and losses on investments. That portion of unrealized gains and losses on investments that results from fluctuations in foreign currency exchange rates is not separately disclosed.
F Use of Estimates—The preparation of the financial statements in conformity with U.S. GAAP requires management to make estimates and assumptions that affect the reported amounts of assets and liabilities at the date of the financial statements and the reported amounts of income and expense during the reporting period. Actual results could differ from those estimates.
G Indemnifications—Under the Portfolio’s organizational documents, its officers and Trustees may be indemnified against certain liabilities and expenses arising out of the performance of their duties to the Portfolio. Under Massachusetts law, if certain conditions prevail, interestholders in the Portfolio could be deemed to have personal liability for the obligations of the Portfolio. However, the Portfolio’s Declaration of Trust contains an express disclaimer of liability on the part of Portfolio interestholders. Additionally, in the normal course of business, the Portfolio enters into agreements with service providers that may contain indemnification clauses. The Portfolio’s maximum exposure under these arrangements is unknown as this would involve future claims that may be made against the Portfolio that have not yet occurred.
H Futures Contracts—Upon entering into a futures contract, the Portfolio is required to deposit with the broker, either in cash or securities, an amount equal to a certain percentage of the contract amount (initial margin). Subsequent payments, known as variation margin, are made or received by the Portfolio each business day, depending on the daily fluctuations in the value of the underlying security or index, and are recorded as unrealized gains or losses by the Portfolio. Gains (losses) are realized upon the expiration or closing of the futures contracts. Should market conditions change unexpectedly, the Portfolio may not achieve the anticipated benefits of the futures contracts and may realize a loss. Futures contracts have minimal counterparty risk as they are exchange traded and the clearinghouse for the exchange is substituted as the counterparty, guaranteeing counterparty performance.
I Forward Foreign Currency Exchange Contracts—The Portfolio may enter into forward foreign currency exchange contracts for the purchase or sale of a specific foreign currency at a fixed price on a future date. The forward foreign currency exchange contracts are adjusted by the daily exchange rate of the underlying currency and any gains or losses are recorded as unrealized until such time as the contracts have been closed. While forward foreign currency exchange contracts are privately negotiated agreements between the Portfolio and a counterparty, certain contracts may be “centrally cleared”, whereby all payments made or received by the Portfolio pursuant to the contract are with a central clearing party (CCP) rather than the original counterparty. The CCP guarantees the performance of the original parties to the contract. Upon entering into centrally cleared contracts, the Portfolio is required to deposit with the CCP, either in cash or securities, an amount of initial margin determined by the CCP, which is subject to adjustment. For centrally cleared contracts, the daily change in valuation is recorded as a receivable or payable for variation margin and settled in cash with the CCP daily. Risks may arise upon entering these contracts from the potential inability of counterparties to meet the terms of their contracts and, in the case of forward foreign currency exchange contracts, from movements in the value of a foreign currency relative to the U.S. dollar. In the case of centrally cleared contracts, counterparty risk is minimal due to protections provided by the CCP.
J Purchased Options—Upon the purchase of a call or put option, the premium paid by the Portfolio is included in the Statement of Assets and Liabilities as an investment. The amount of the investment is subsequently marked-to-market to reflect the current market value of the option purchased, in accordance with the Portfolio’s policies on investment valuations discussed above. Premiums paid for purchasing options that expire are treated as realized losses. Premiums paid for purchasing options that are exercised or closed are added to the amounts paid or offset against the proceeds on the underlying investment transaction to determine the realized gain or loss. The risk associated with purchasing options is limited to the premium originally paid. Purchased options traded over-the-counter involve risk that the issuer or counterparty will fail to perform its contractual obligations.
International Income Portfolio
April 30, 2024
Notes to Financial Statements (Unaudited) — continued
K Written Options—Upon the writing of a call or a put option, the premium received by the Portfolio is included in the Statement of Assets and Liabilities as a liability. The amount of the liability is subsequently marked-to-market to reflect the current market value of the option written, in accordance with the Portfolio’s policies on investment valuations discussed above. Premiums received from writing options that expire are treated as realized gains. Premiums received from writing options that are exercised or are closed are added to or offset against the proceeds or amount paid on the transaction to determine the realized gain or loss. The Portfolio, as a writer of an option, may have no control over whether the underlying instrument may be sold (call) or purchased (put) and, as a result, bears the market risk of an unfavorable change in the price of the instrument underlying the written option. The Portfolio may also bear the risk of not being able to enter into a closing transaction if a liquid secondary market does not exist.
L Interest Rate Swaps—Swap contracts are privately negotiated agreements between the Portfolio and a counterparty. Certain swap contracts may be centrally cleared. Pursuant to interest rate swap agreements, the Portfolio either makes floating-rate payments to the counterparty (or CCP in the case of centrally cleared swaps) based on a benchmark interest rate in exchange for fixed-rate payments or the Portfolio makes fixed-rate payments to the counterparty (or CCP in the case of a centrally cleared swap) in exchange for payments on a floating benchmark interest rate. Payments received or made, including amortization of upfront payments/receipts, if any (which are amortized over the life of the swap contract), are recorded as realized gains or losses. During the term of the outstanding swap agreement, changes in the underlying value of the swap are recorded as unrealized gains or losses. For centrally cleared swaps, the daily change in valuation is recorded as a receivable or payable for variation margin and settled in cash with the CCP daily. The value of the swap is determined by changes in the relationship between two rates of interest. The Portfolio is exposed to credit loss in the event of non-performance by the swap counterparty. In the case of centrally cleared swaps, counterparty risk is minimal due to protections provided by the CCP. Risk may also arise from movements in interest rates.
M Inflation Swaps—Pursuant to inflation swap agreements, the Portfolio either makes floating-rate payments to the counterparty (or CCP in the case of centrally cleared swaps) based on a benchmark index in exchange for fixed-rate payments or the Portfolio makes fixed-rate payments to the counterparty (or CCP in the case of centrally cleared swaps) in exchange for floating-rate payments based on the return of a benchmark index. By design, the benchmark index is an inflation index, such as the Consumer Price Index. The accounting policy for payments received or made and changes in the underlying value of the inflation swap are the same as for interest rate swaps as described above. The value of the swap is determined by changes in the relationship between the rate of interest and the benchmark index. The Portfolio is exposed to credit loss in the event of nonperformance by the swap counterparty. In the case of centrally cleared swaps, counterparty risk is minimal due to protections provided by the CCP. Risk may also arise from the unanticipated movements in value of interest rates or the index.
N Cross-Currency Swaps —Cross-currency swaps are interest rate swaps in which interest cash flows are exchanged between two parties based on the notional amounts of two different currencies. The notional amounts are typically determined based on the spot exchange rates at the inception of the trade. Cross-currency swaps also involve the exchange of the notional amounts at the start of the contract at the current spot rate with an agreement to re-exchange such amounts at a later date at either the same exchange rate, a specified rate or the then current spot rate. The entire principal value of a cross-currency swap is subject to the risk that the counterparty to the swap will default on its contractual delivery obligations.
O Credit Default Swaps—When the Portfolio is the buyer of a credit default swap contract, the Portfolio is entitled to receive the par (or other agreed-upon) value of a referenced debt obligation (or basket of debt obligations) from the counterparty (or CCP in the case of a centrally cleared swap) to the contract if a credit event by a third party, such as a U.S. or foreign corporate issuer or sovereign issuer, on the debt obligation occurs. In return, the Portfolio pays the counterparty a periodic stream of payments over the term of the contract provided that no credit event has occurred. If no credit event occurs, the Portfolio would have spent the stream of payments and received no proceeds from the contract. When the Portfolio is the seller of a credit default swap contract, it receives the stream of payments, but is obligated to pay to the buyer of the protection an amount up to the notional amount of the swap and in certain instances take delivery of securities of the reference entity upon the occurrence of a credit event, as defined under the terms of that particular swap agreement. Credit events are contract specific but may include bankruptcy, failure to pay, restructuring, obligation acceleration and repudiation/moratorium. If the Portfolio is a seller of protection and a credit event occurs, the maximum potential amount of future payments that the Portfolio could be required to make would be an amount equal to the notional amount of the agreement. This potential amount would be partially offset by any recovery value of the respective referenced obligation, or net amount received from the settlement of a buy protection credit default swap agreement entered into by the Portfolio for the same referenced obligation. As the seller, the Portfolio may create economic leverage to its portfolio because, in addition to its total net assets, the Portfolio is subject to investment exposure on the notional amount of the swap. The interest fee paid or received on the swap contract, which is based on a specified interest rate on a fixed notional amount, is accrued daily as a component of unrealized appreciation (depreciation) and is recorded as realized gain upon receipt or realized loss upon payment. The Portfolio also records an increase or decrease to unrealized appreciation (depreciation) in an amount equal to the daily valuation. For centrally cleared swaps, the daily change in valuation is recorded as a receivable or payable for variation margin and settled in cash with the CCP daily. All upfront payments and receipts, if any, are amortized over the life of the swap contract as realized gains or losses. Those upfront payments or receipts for non-centrally cleared swaps are recorded as other assets or other liabilities, respectively, net of amortization. For financial reporting purposes, unamortized upfront payments or receipts, if any, are netted with unrealized appreciation or depreciation on swap contracts to determine the market value of swaps as presented in Notes 5 and 9. These transactions involve certain risks, including the risk that the seller may be unable to fulfill the transaction. In the case of centrally cleared swaps, counterparty risk is minimal due to protections provided by the CCP.
P Total Return Swaps—In a total return swap, the buyer receives a periodic return equal to the total return of a specified security, securities or index for a specified period of time. In return, the buyer pays the counterparty a fixed or variable stream of payments, typically based upon short-term interest rates,
International Income Portfolio
April 30, 2024
Notes to Financial Statements (Unaudited) — continued
possibly plus or minus an agreed upon spread. During the term of the outstanding swap agreement, changes in the underlying value of the swap are recorded as unrealized gains and losses. Periodic payments received or made are recorded as realized gains or losses. The Portfolio is exposed to credit loss in the event of nonperformance by the swap counterparty. Risk may also arise from the unanticipated movements in value of exchange rates, interest rates, securities, or the index.
Q Swaptions—A written swaption gives the Portfolio the obligation, if exercised by the purchaser, to enter into a swap contract according to the terms of the underlying agreement. When the Portfolio writes a swaption, the premium received by the Portfolio is recorded as a liability and subsequently marked-to-market to reflect the current value of the swaption. When a swaption is exercised, the cost of the swap is adjusted by the amount of the premium paid or received. When a swaption expires or an unexercised swaption is closed, a gain or loss is recognized in the amount of the premium paid or received, plus the cost to close. The writer of a swaption bears the risk of unfavorable changes in the preset terms of the underlying swap contract.
R When-Issued Securities and Delayed Delivery Transactions—The Portfolio may purchase securities on a delayed delivery, when-issued or forward commitment basis, including TBA (To Be Announced) securities. Payment and delivery may take place after the customary settlement period for that security. At the time the transaction is negotiated, the price of the security that will be delivered is fixed. Securities purchased on a delayed delivery, when-issued or forward commitment basis are marked-to-market daily and begin earning interest on settlement date. Such security purchases are subject to the risk that when delivered they will be worth less than the agreed upon payment price. Losses may also arise if the counterparty does not perform under the contract. A forward purchase commitment may also be closed by entering into an offsetting commitment. If an offsetting commitment is entered into, the Portfolio will realize a gain or loss on investments based on the price established when the Portfolio entered into the commitment.
S Repurchase Agreements—A repurchase agreement is the purchase by the Portfolio of securities from a counterparty in exchange for cash that is coupled with an agreement to resell those securities to the counterparty at a specified date and price. When a repurchase agreement is entered, the Portfolio typically receives securities with a value that equals or exceeds the repurchase price, including any accrued interest earned on the agreement. The value of such securities will be marked-to-market daily, and cash or additional securities will be exchanged between the parties as needed. Except in the case of a repurchase agreement entered to settle a short sale, the value of the securities delivered to the Portfolio will be at least equal to 90% of the repurchase price during the term of the repurchase agreement. The terms of a repurchase agreement entered to settle a short sale may provide that the cash purchase price paid by the Portfolio is more than the value of purchased securities that effectively collateralize the repurchase price payable by the counterparty. In the event of insolvency of the counterparty to a repurchase agreement, recovery of the repurchase price owed to the Portfolio may be delayed. Such an insolvency also may result in a loss to the extent that the value of the purchased securities decreases during the delay or that value has otherwise not been maintained at an amount at least equal to the repurchase price.
T Reverse Repurchase Agreements—Under a reverse repurchase agreement, the Portfolio temporarily transfers possession of a portfolio security to another party, such as a bank or broker/dealer, in return for cash. At the same time, the Portfolio agrees to repurchase the security at an agreed upon time and price, which reflects an interest payment. In periods of increased demand for a security, the Portfolio may receive a payment from the counterparty for the use of the security, which is recorded as interest income. Because the Portfolio retains effective control over the transferred security, the transaction is accounted for as a secured borrowing. The Portfolio may enter into such agreements when it believes it is able to invest the cash acquired at a rate higher than the cost of the agreement, which would increase earned income. When the Portfolio enters into a reverse repurchase agreement, any fluctuations in the market value of either the securities transferred to another party or the securities in which the proceeds may be invested would affect the market value of the Portfolio’s assets. Because reverse repurchase agreements may be considered to be the practical equivalent of borrowing funds (and the counterparty making a loan), they constitute a form of leverage. The Portfolio segregates cash or liquid assets equal to its obligation to repurchase the security. During the term of the agreement, the Portfolio may also be obligated to pledge additional cash and/or securities in the event of a decline in the fair value of the transferred security. In the event the counterparty to a reverse repurchase agreement becomes insolvent, recovery of the security transferred by the Portfolio may be delayed or the Portfolio may incur a loss equal to the amount by which the value of the security transferred by the Portfolio exceeds the repurchase price payable by the Portfolio.
U Securities Sold Short—A short sale is a transaction in which the Portfolio sells a security it does not own in anticipation of a decline in the market value of that security. To complete such a transaction, the Portfolio must borrow the security to make delivery to the buyer with an obligation to replace such borrowed security at a later date. Until the security is replaced, the Portfolio is required to repay the lender any dividends or interest, which accrue during the period of the loan. The proceeds received from a short sale are recorded as a liability and the Portfolio records an unrealized gain or loss to the extent of the difference between the proceeds received and the value of the open short position on the day of determination. A gain, limited to the price at which the Portfolio sold the security short, or a loss, potentially unlimited as there is no upward limit on the price of a security, is recorded when the short position is terminated. Interest and dividends payable on securities sold short are recorded as an expense.
V Interim Financial Statements—The interim financial statements relating to April 30, 2024 and for the six months then ended have not been audited by an independent registered public accounting firm, but in the opinion of the Portfolio’s management, reflect all adjustments, consisting only of normal recurring adjustments, necessary for the fair presentation of the financial statements.
International Income Portfolio
April 30, 2024
Notes to Financial Statements (Unaudited) — continued
2 Investment Adviser Fee and Other Transactions with Affiliates
The investment adviser fee is earned by Boston Management and Research (BMR), an indirect, wholly-owned subsidiary of Morgan Stanley, as compensation for investment advisory services rendered to the Portfolio. The fee is computed at an annual rate as a percentage of the Portfolio’s average daily net assets as follows and is payable monthly:
| Average Daily Net Assets | Annual Fee Rate |
| Up to $1 billion | 0.500% |
| $1 billion but less than $2.5 billion | 0.475% |
| $2.5 billion but less than $5 billion | 0.455% |
| $5 billion and over | 0.440% |
For the six months ended April 30, 2024, the Portfolio’s investment adviser fee amounted to $88,432 or 0.50% (annualized) of the Portfolio’s average daily net assets. Pursuant to a voluntary expense reimbursement, BMR was allocated $89,760 of the Portfolio’s operating expenses for the six months ended April 30, 2024.
The Portfolio may invest in a money market fund, the Institutional Class of the Morgan Stanley Institutional Liquidity Funds - Government Portfolio (the “Liquidity Fund”), an open-end management investment company managed by Morgan Stanley Investment Management Inc., a wholly-owned subsidiary of Morgan Stanley. The investment adviser fee paid by the Portfolio is reduced by an amount equal to its pro rata share of the advisory and administration fees paid by the Portfolio due to its investment in the Liquidity Fund. For the six months ended April 30, 2024, the investment adviser fee paid was reduced by $1,222 relating to the Portfolio’s investment in the Liquidity Fund.
Trustees and officers of the Portfolio who are members of BMR’s organization receive remuneration for their services to the Portfolio out of the investment adviser fee. Trustees of the Portfolio who are not affiliated with the investment adviser may elect to defer receipt of all or a percentage of their annual fees in accordance with the terms of the Trustees Deferred Compensation Plan. Certain officers and Trustees of the Portfolio are officers of the above organization.
3 Purchases and Sales of Investments
Purchases and sales of investments, other than short-term obligations and including maturities, paydowns, TBA transactions and securities sold short, for the six months ended April 30, 2024 were as follows:
| | Purchases | Sales |
| Investments (non-U.S. Government) | $ 14,259,825 | $ 15,740,443 |
| U.S. Government and Agency Securities | 16,049,496 | 16,086,046 |
| | $30,309,321 | $31,826,489 |
4 Federal Income Tax Basis of Investments
The cost and unrealized appreciation (depreciation) of investments, including open derivative contracts, of the Portfolio at April 30, 2024, as determined on a federal income tax basis, were as follows:
| Aggregate cost | $34,567,250 |
| Gross unrealized appreciation | $ 380,496 |
| Gross unrealized depreciation | (700,604) |
| Net unrealized depreciation | $ (320,108) |
International Income Portfolio
April 30, 2024
Notes to Financial Statements (Unaudited) — continued
5 Financial Instruments
The Portfolio may trade in financial instruments with off-balance sheet risk in the normal course of its investing activities. These financial instruments may include written options and swaptions, forward foreign currency exchange contracts, futures contracts and swap contracts and may involve, to a varying degree, elements of risk in excess of the amounts recognized for financial statement purposes. The notional or contractual amounts of these instruments represent the investment the Portfolio has in particular classes of financial instruments and do not necessarily represent the amounts potentially subject to risk. The measurement of the risks associated with these instruments is meaningful only when all related and offsetting transactions are considered. A summary of obligations under these financial instruments at April 30, 2024 is included in the Portfolio of Investments. At April 30, 2024, the Portfolio had sufficient cash and/or securities to cover commitments under these contracts.
In the normal course of pursuing its investment objective, the Portfolio is subject to the following risks:
Credit Risk: The Portfolio enters into credit default swaps to enhance total return and/or as a substitute for the purchase or sale of securities.
Foreign Exchange Risk: The Portfolio engages in forward foreign currency exchange contracts, currency options and cross-currency swaps to enhance total return, to seek to hedge against fluctuations in currency exchange rates and/or as a substitute for the purchase or sale of securities or currencies.
Interest Rate Risk: The Portfolio utilizes various interest rate derivatives including interest rate futures contracts, interest rate swaps and swaptions, inflation swaps, total return swaps and cross-currency swaps to enhance total return, to seek to hedge against fluctuations in interest rates and/or to change the effective duration of its portfolio.
The Portfolio enters into over-the-counter (OTC) derivatives that may contain provisions whereby the counterparty may terminate the contract under certain conditions, including but not limited to a decline in the Portfolio’s net assets below a certain level over a certain period of time, which would trigger a payment by the Portfolio for those derivatives in a liability position. At April 30, 2024, the fair value of derivatives with credit-related contingent features in a net liability position was $790,912. The aggregate fair value of assets pledged as collateral by the Portfolio for such liability was $1,130,452 at April 30, 2024.
The OTC derivatives in which the Portfolio invests (except for written options and swaptions as the Portfolio, not the counterparty, is obligated to perform) are subject to the risk that the counterparty to the contract fails to perform its obligations under the contract. To mitigate this risk, the Portfolio has entered into an International Swaps and Derivatives Association, Inc. Master Agreement (“ISDA Master Agreement”) or similar agreement with substantially all its derivative counterparties. An ISDA Master Agreement is a bilateral agreement between the Portfolio and a counterparty that governs certain OTC derivatives and typically contains, among other things, set-off provisions in the event of a default and/ or termination event as defined under the relevant ISDA Master Agreement. Under an ISDA Master Agreement, the Portfolio may, under certain circumstances, offset with the counterparty certain derivative financial instruments’ payables and/or receivables with collateral held and/or posted and create one single net payment. The provisions of the ISDA Master Agreement typically permit a single net payment in the event of default including the bankruptcy or insolvency of the counterparty. However, bankruptcy or insolvency laws of a particular jurisdiction may impose restrictions on or prohibitions against the right of offset in bankruptcy or insolvency. Certain ISDA Master Agreements allow counterparties to OTC derivatives to terminate derivative contracts prior to maturity in the event the Portfolio’s net assets decline by a stated percentage or the Portfolio fails to meet the terms of its ISDA Master Agreements, which would cause the counterparty to accelerate payment by the Portfolio of any net liability owed to it.
The collateral requirements for derivatives traded under an ISDA Master Agreement are governed by a Credit Support Annex to the ISDA Master Agreement. Collateral requirements are determined at the close of business each day and are typically based on changes in market values for each transaction under an ISDA Master Agreement and netted into one amount for such agreement. Generally, the amount of collateral due from or to a counterparty is subject to a minimum transfer threshold amount before a transfer is required, which may vary by counterparty. Collateral pledged for the benefit of the Portfolio and/ or counterparty is held in segregated accounts by the Portfolio’s custodian and cannot be sold, re-pledged, assigned or otherwise used while pledged. The portion of such collateral representing cash, if any, is reflected as deposits for derivatives collateral and, in the case of cash pledged by a counterparty for the benefit of the Portfolio, a corresponding liability on the Statement of Assets and Liabilities. Securities pledged by the Portfolio as collateral, if any, are identified as such in the Portfolio of Investments.
International Income Portfolio
April 30, 2024
Notes to Financial Statements (Unaudited) — continued
The fair value of open derivative instruments (not considered to be hedging instruments for accounting disclosure purposes) by risk exposure at April 30, 2024 was as follows:
| | Fair Value |
| Statement of Assets and Liabilities Caption | Credit | Foreign
Exchange | Interest
Rate | Total |
| Unaffiliated investments, at value | $ — | $ 36,321 | $ — | $ 36,321 |
| Not applicable | — | 421,030* | 786,896* | 1,207,926 |
| Receivable for open forward foreign currency exchange contracts | — | 449,631 | — | 449,631 |
| Receivable for open swap contracts; Upfront payments on open non-centrally cleared swap contracts | 564 | — | 34,704 | 35,268 |
| Total Asset Derivatives | $ 564 | $ 906,982 | $ 821,600 | $ 1,729,146 |
| Derivatives not subject to master netting or similar agreements | $ — | $ 421,030 | $ 786,896 | $ 1,207,926 |
| Total Asset Derivatives subject to master netting or similar agreements | $ 564 | $ 485,952 | $ 34,704 | $ 521,220 |
| Written options and swaptions outstanding, at value | $ — | $ (4,252) | $ (57,877) | $ (62,129) |
| Not applicable | — | (429,857)* | (1,065,786)* | (1,495,643) |
| Payable for open forward foreign currency exchange contracts | — | (629,689) | — | (629,689) |
| Payable for open swap contracts | — | — | (99,094) | (99,094) |
| Total Liability Derivatives | $ — | $(1,063,798) | $(1,222,757) | $(2,286,555) |
| Derivatives not subject to master netting or similar agreements | $ — | $ (429,857) | $(1,065,786) | $(1,495,643) |
| Total Liability Derivatives subject to master netting or similar agreements | $ — | $ (633,941) | $ (156,971) | $ (790,912) |
| * | Only the current day’s variation margin on open futures contracts and centrally cleared derivatives is reported within the Statement of Assets and Liabilities as Receivable or Payable for variation margin on open futures contracts and centrally cleared derivatives, as applicable. |
The Portfolio's derivative assets and liabilities at fair value by risk, which are reported gross in the Statement of Assets and Liabilities, are presented in the table above. The following tables present the Portfolio's derivative assets and liabilities by counterparty, net of amounts available for offset under a master netting agreement and net of the related collateral received by the Portfolio for such assets and pledged by the Portfolio for such liabilities as of April 30, 2024.
| Counterparty | Derivative
Assets Subject to
Master Netting
Agreement | Derivatives
Available
for Offset | Non-cash
Collateral
Received(a) | Cash
Collateral
Received(a) | Net Amount
of Derivative
Assets(b) |
| Bank of America, N.A. | $ 8,750 | $ (7,884) | $ — | $ — | $ 866 |
| Barclays Bank PLC | 19,699 | (19,699) | — | — | — |
| BNP Paribas | 64,718 | (43,218) | — | — | 21,500 |
| Citibank, N.A. | 61,983 | (61,983) | — | — | — |
| Deutsche Bank AG | 1,500 | — | — | — | 1,500 |
| Goldman Sachs International | 59,600 | (59,600) | — | — | — |
| HSBC Bank USA, N.A. | 65,893 | (32,140) | — | — | 33,753 |
| ICBC Standard Bank plc | 3,035 | — | — | — | 3,035 |
| JPMorgan Chase Bank, N.A. | 64,897 | (39,615) | (25,282) | — | — |
| Nomura International PLC | 7,561 | — | — | — | 7,561 |
| Societe Generale | 1,841 | (898) | — | — | 943 |
International Income Portfolio
April 30, 2024
Notes to Financial Statements (Unaudited) — continued
| Counterparty | Derivative
Assets Subject to
Master Netting
Agreement | Derivatives
Available
for Offset | Non-cash
Collateral
Received(a) | Cash
Collateral
Received(a) | Net Amount
of Derivative
Assets(b) |
| Standard Chartered Bank | $ 134,877 | $ (94,551) | $ — | $ — | $ 40,326 |
| UBS AG | 26,866 | (26,866) | — | — | — |
| | $521,220 | $(386,454) | $(25,282) | $ — | $109,484 |
| Counterparty | Derivative
Liabilities Subject to
Master Netting
Agreement | Derivatives
Available
for Offset | Non-cash
Collateral
Pledged(a) | Cash
Collateral
Pledged(a) | Net Amount
of Derivative
Liabilities(c) |
| Bank of America, N.A. | $ (7,884) | $ 7,884 | $ — | $ — | $ — |
| Barclays Bank PLC | (64,704) | 19,699 | 45,005 | — | — |
| BNP Paribas | (43,218) | 43,218 | — | — | — |
| Citibank, N.A. | (307,157) | 61,983 | 245,174 | — | — |
| Goldman Sachs International | (125,725) | 59,600 | — | — | (66,125) |
| HSBC Bank USA, N.A. | (32,140) | 32,140 | — | — | — |
| JPMorgan Chase Bank, N.A. | (39,615) | 39,615 | — | — | — |
| Societe Generale | (898) | 898 | — | — | — |
| Standard Chartered Bank | (94,551) | 94,551 | — | — | — |
| State Street Bank and Trust Company | (35,984) | — | — | — | (35,984) |
| UBS AG | (39,036) | 26,866 | — | — | (12,170) |
| | $(790,912) | $386,454 | $290,179 | $ — | $(114,279) |
| (a) | In some instances, the total collateral received and/or pledged may be more than the amount shown due to overcollateralization. |
| (b) | Net amount represents the net amount due from the counterparty in the event of default. |
| (c) | Net amount represents the net amount payable to the counterparty in the event of default. |
International Income Portfolio
April 30, 2024
Notes to Financial Statements (Unaudited) — continued
The effect of derivative instruments (not considered to be hedging instruments for accounting disclosure purposes) on the Statement of Operations by risk exposure for the six months ended April 30, 2024 was as follows:
| Statement of Operations Caption | Credit | Foreign
Exchange | Interest
Rate | Total |
| Net realized gain (loss): | | | | |
| Investment transactions | $ — | $ (5,884) | $ — | $ (5,884) |
| Written options and swaptions | — | — | 7,933 | 7,933 |
| Futures contracts | — | — | (161,701) | (161,701) |
| Swap contracts | 1,070 | — | (245,152) | (244,082) |
| Forward foreign currency exchange contracts | — | (334,868) | — | (334,868) |
| Total | $1,070 | $(340,752) | $(398,920) | $(738,602) |
| Change in unrealized appreciation (depreciation): | | | | |
| Investments | $ — | $ (69,710) | $ — | $ (69,710) |
| Written options and swaptions | — | 17,133 | 23,289 | 40,422 |
| Futures contracts | — | — | 37,447 | 37,447 |
| Swap contracts | 56 | — | 430,317 | 430,373 |
| Forward foreign currency exchange contracts | — | 4,227 | — | 4,227 |
| Total | $ 56 | $ (48,350) | $ 491,053 | $ 442,759 |
The average notional cost of futures contracts and average notional amounts of other derivative contracts outstanding during the six months ended April 30, 2024, which are indicative of the volume of these derivative types, were approximately as follows:
Futures
Contracts — Long | Futures
Contracts — Short | Forward
Foreign Currency
Exchange Contracts* | Written Options
and Swaptions | Swap
Contracts |
| $9,054,000 | $10,008,000 | $75,356,000 | $1,155,000 | $82,588,000 |
| * | The average notional amount for forward foreign currency exchange contracts is based on the absolute value of notional amounts of currency purchased and currency sold. |
The average principal amount of purchased and written currency options contracts outstanding during the six months ended April 30, 2024, which are indicative of the volume of these derivative types, were approximately $2,554,000 and $100,000, respectively.
6 Line of Credit
The Portfolio participates with other portfolios and funds managed by EVM and its affiliates in a $650 million unsecured revolving line of credit agreement with a group of banks, which is in effect through October 22, 2024. Borrowings are made by the Portfolio solely for temporary purposes related to redemptions and other short-term cash needs. Interest is charged to the Portfolio based on its borrowings at an amount above either the Secured Overnight Financing Rate (SOFR) or Federal Funds rate. In addition, a fee computed at an annual rate of 0.15% on the daily unused portion of the line of credit is allocated among the participating portfolios and funds at the end of each quarter. In connection with the renewal of the agreement in October 2023, an arrangement fee of $150,000 was incurred that was allocated to the participating portfolios and funds. Because the line of credit is not available exclusively to the Portfolio, it may be unable to borrow some or all of its requested amounts at any particular time. The Portfolio did not have any significant borrowings or allocated fees during the six months ended April 30, 2024.
7 Reverse Repurchase Agreements
There were no reverse repurchase agreements outstanding as of April 30, 2024. For the six months ended April 30, 2024, the average borrowings under settled reverse repurchase agreements and the average annual interest rate paid were approximately $576,000 and 5.65%, respectively.
International Income Portfolio
April 30, 2024
Notes to Financial Statements (Unaudited) — continued
8 Overdraft Advances
Pursuant to the custodian agreement, State Street Bank and Trust Company (SSBT) may, in its discretion, advance funds to the Portfolio to make properly authorized payments. When such payments result in an overdraft, the Portfolio is obligated to repay SSBT at the current rate of interest charged by SSBT for secured loans (currently, the Federal Funds rate plus 2%). This obligation is payable on demand to SSBT. SSBT has a lien on the Portfolio's assets to the extent of any overdraft. At April 30, 2024, the Portfolio had a payment due to SSBT pursuant to the foregoing arrangement of $469,762. Based on the short-term nature of these payments and the variable interest rate, the carrying value of the overdraft advances approximated its fair value at April 30, 2024. If measured at fair value, overdraft advances would have been considered as Level 2 in the fair value hierarchy (see Note 10) at April 30, 2024. The Portfolio’s average overdraft advances during the six months ended April 30, 2024 were not significant.
9 Affiliated Investments
At April 30, 2024, the value of the Portfolio's investment in funds that may be deemed to be affiliated was $3,109,163, which represents 9.7% of the Portfolio's net assets. Transactions in such investments by the Portfolio for the six months ended April 30, 2024 were as follows:
| Name | Value,
beginning
of period | Purchases | Sales
proceeds | Net realized
gain (loss) | Change in
unrealized
appreciation
(depreciation) | Value, end
of period | Dividend
income | Shares,
end of period |
| Short-Term Investments |
| Liquidity Fund | $803,076 | $23,078,322 | $(20,772,235) | $ — | $ — | $3,109,163 | $41,501 | 3,109,163 |
10 Fair Value Measurements
Under generally accepted accounting principles for fair value measurements, a three-tier hierarchy to prioritize the assumptions, referred to as inputs, is used in valuation techniques to measure fair value. The three-tier hierarchy of inputs is summarized in the three broad levels listed below.
| • | Level 1 – quoted prices in active markets for identical investments |
| • | Level 2 – other significant observable inputs (including quoted prices for similar investments, interest rates, prepayment speeds, credit risk, etc.) |
| • | Level 3 – significant unobservable inputs (including a fund's own assumptions in determining the fair value of investments) |
In cases where the inputs used to measure fair value fall in different levels of the fair value hierarchy, the level disclosed is determined based on the lowest level input that is significant to the fair value measurement in its entirety. The inputs or methodology used for valuing securities are not necessarily an indication of the risk associated with investing in those securities.
At April 30, 2024, the hierarchy of inputs used in valuing the Portfolio's investments and open derivative instruments, which are carried at fair value, were as follows:
| Asset Description | Level 1 | Level 2 | Level 3 | Total |
| Collateralized Mortgage Obligations | $ — | $ 2,815,970 | $ — | $ 2,815,970 |
| Foreign Corporate Bonds | — | 275,472 | — | 275,472 |
| Sovereign Government Bonds | — | 17,025,082 | — | 17,025,082 |
| U.S. Government Agency Mortgage-Backed Securities | — | 3,576,354 | — | 3,576,354 |
| U.S. Treasury Obligations | — | 305,971 | — | 305,971 |
| Short-Term Investments: | | | | |
| Affiliated Fund | 3,109,163 | — | — | 3,109,163 |
| Repurchase Agreements | — | 1,157,803 | — | 1,157,803 |
| U.S. Treasury Obligations | — | 7,580,756 | — | 7,580,756 |
| Purchased Currency Options | — | 36,321 | — | 36,321 |
| Total Investments | $ 3,109,163 | $ 32,773,729 | $ — | $ 35,882,892 |
International Income Portfolio
April 30, 2024
Notes to Financial Statements (Unaudited) — continued
| Asset Description (continued) | Level 1 | Level 2 | Level 3 | Total |
| Forward Foreign Currency Exchange Contracts | $ — | $ 870,661 | $ — | $ 870,661 |
| Futures Contracts | 49,839 | — | — | 49,839 |
| Swap Contracts | — | 772,325 | — | 772,325 |
| Total | $ 3,159,002 | $ 34,416,715 | $ — | $ 37,575,717 |
| Liability Description | | | | |
| Securities Sold Short | $ — | $ (1,042,123) | $ — | $ (1,042,123) |
| Written Currency Options | — | (4,252) | — | (4,252) |
| Written Interest Rate Swaptions | — | (57,877) | — | (57,877) |
| Forward Foreign Currency Exchange Contracts | — | (1,059,546) | — | (1,059,546) |
| Futures Contracts | (171,240) | — | — | (171,240) |
| Swap Contracts | — | (993,640) | — | (993,640) |
| Total | $ (171,240) | $ (3,157,438) | $ — | $ (3,328,678) |
11 Risks and Uncertainties
Risks Associated with Foreign Investments
Foreign investments can be adversely affected by political, economic and market developments abroad, including the imposition of economic and other sanctions by the United States or another country, and by acts of terrorism and war. There may be less publicly available information about foreign issuers because they may not be subject to reporting practices, requirements or regulations comparable to those to which United States companies are subject. Foreign markets may be smaller, less liquid and more volatile than the major markets in the United States. Trading in foreign markets typically involves higher expense than trading in the United States. The Portfolio may have difficulties enforcing its legal or contractual rights in a foreign country. Securities that trade or are denominated in currencies other than the U.S. dollar may be adversely affected by fluctuations in currency exchange rates.
Emerging market securities often involve greater risks than developed market securities. Investment markets within emerging market countries are typically smaller, less liquid, less developed and more volatile than those in more developed markets like the United States, and may be focused in certain economic sectors. The information available about an emerging market issuer may be less reliable than for comparable issuers in more developed capital markets. Governmental actions can have a significant effect on the economic conditions in emerging market countries. It may be more difficult to make a claim or obtain a judgment in the courts of these countries than it is in the United States. The possibility of fraud, negligence, undue influence being exerted by an issuer or refusal to recognize ownership exists in some emerging markets. Disruptions due to work stoppages and trading improprieties in foreign securities markets have caused such markets to close. Emerging market securities are also subject to speculative trading, which contributes to their volatility.
Economic data as reported by sovereign entities may be delayed, inaccurate or fraudulent. In the event of a default by a sovereign entity, there are typically no assets to be seized or cash flows to be attached. Furthermore, the willingness or ability of a sovereign entity to restructure defaulted debt may be limited. Therefore, losses on sovereign defaults may far exceed the losses from the default of a similarly rated U.S. debt issuer.
Eaton Vance
Global Sovereign Opportunities Fund
April 30, 2024
| Officers of Eaton Vance Global Sovereign Opportunities Fund and International Income Portfolio |
Kenneth A. Topping
President | Nicholas S. Di Lorenzo
Secretary |
Deidre E. Walsh
Vice President and Chief Legal Officer | Laura T. Donovan
Chief Compliance Officer |
James F. Kirchner
Treasurer | |
| Trustees of Eaton Vance Global Sovereign Opportunities Fund and International Income Portfolio | |
George J. Gorman
Chairperson | |
| Alan C. Bowser | |
| Mark R. Fetting | |
| Cynthia E. Frost | |
| Valerie A. Mosley | |
| Anchal Pachnanda* | |
| Keith Quinton | |
| Marcus L. Smith | |
| Susan J. Sutherland | |
| Scott E. Wennerholm | |
| Nancy A. Wiser | |
| U.S. Customer Privacy Notice | March 2024 |
| FACTS | WHAT DOES EATON VANCE DO WITH YOUR PERSONAL INFORMATION? |
| Why? | Financial companies choose how they share your personal information. Federal law gives consumers the right to limit some but not all sharing. Federal law also requires us to tell you how we collect, share, and protect your personal information. Please read this notice carefully to understand what we do. |
| |
| What? | The types of personal information we collect and share depend on the product or service you have with us. This information can include:■ Social Security number and income
■ investment experience and risk tolerance
■ checking account information and wire transfer instructions |
| |
| How? | All financial companies need to share customers’ personal information to run their everyday business. In the section below, we list the reasons financial companies can share their customers’ personal information; the reasons Eaton Vance chooses to share; and whether you can limit this sharing. |
| Reasons we can share your personal information | Does Eaton Vance
share? | Can you limit
this sharing? |
| For our everyday business purposes — such as to process your transactions, maintain your account(s), respond to court orders and legal investigations, or report to credit bureaus | Yes | No |
| For our marketing purposes — to offer our products and services to you | Yes | No |
| For joint marketing with other financial companies | No | We don’t share |
| For our affiliates’ everyday business purposes — information about your transactions and experiences | Yes | No* |
| For our affiliates’ everyday business purposes — information about your creditworthiness | Yes | Yes* |
| For our affiliates to market to you | Yes | Yes* |
| For nonaffiliates to market to you | No | We don’t share |
To limit our
sharing | Call toll-free 1-800-262-1122 or email: EVPrivacy@eatonvance.comPlease note:If you are a new customer, we can begin sharing your information 30 days from the date we sent this notice. When you are no longer our customer, we continue to share your information as described in this notice. However, you can contact us at any time to limit our sharing. |
| Questions? | Call toll-free 1-800-262-1122 or email: EVPrivacy@eatonvance.com |
| U.S. Customer Privacy Notice — continued | March 2024 |
| Who we are |
| Who is providing this notice? | Eaton Vance Management and our investment management affiliates (“Eaton Vance”) (see Affiliates definition below.) |
| What we do |
How does Eaton Vance
protect my personal
information? | To protect your personal information from unauthorized access and use, we use security measures that comply with federal law. These measures include computer safeguards and secured files and buildings. We have policies governing the proper handling of customer information by personnel and requiring third parties that provide support to adhere to appropriate security standards with respect to such information. |
How does Eaton Vance
collect my personal
information? | We collect your personal information, for example, when you■ open an account or make deposits or withdrawals from your account
■ buy securities from us or make a wire transfer
■ give us your contact informationWe also collect your personal information from others, such as credit bureaus, affiliates, or other companies. |
| Why can’t I limit all sharing? | Federal law gives you the right to limit only■ sharing for affiliates’ everyday business purposes — information about your creditworthiness
■ affiliates from using your information to market to you
■ sharing for nonaffiliates to market to youState laws and individual companies may give you additional rights to limit sharing. (See below for more on your rights under state law.) |
What happens when I limit
sharing for an account I hold
jointly with someone else? | Your choices will apply to everyone on your account. |
| Definitions |
| Affiliates | Companies related by common ownership or control. They can be financial and nonfinancial companies.■ Our affiliates include registered investment advisers such as Eaton Vance Management, Eaton Vance Advisers International Ltd., Boston Management and Research, Calvert Research and Management, Parametric Portfolio Associates LLC, Atlanta Capital Management Company LLC, Morgan Stanley Investment Management Inc., Morgan Stanley Investment Management Co.; registered broker-dealers such as Morgan Stanley Distributors Inc. and Eaton Vance Distributors, Inc. (together, the “Investment Management Affiliates”); and companies with a Morgan Stanley name and financial companies such as Morgan Stanley Smith Barney LLC and Morgan Stanley & Co. (the “Morgan Stanley Affiliates”). |
| Nonaffiliates | Companies not related by common ownership or control. They can be financial and nonfinancial companies.■ Eaton Vance does not share with nonaffiliates so they can market to you. |
| Joint marketing | A formal agreement between nonaffiliated financial companies that together market financial products or services to you.■ Eaton Vance does not jointly market. |
| U.S. Customer Privacy Notice — continued | March 2024 |
| Other important information |
| *PLEASE NOTE: Eaton Vance does not share your creditworthiness information or your transactions and experiences information with the Morgan Stanley Affiliates, nor does Eaton Vance enable the Morgan Stanley Affiliates to market to you. Your opt outs will prevent Eaton Vance from sharing your creditworthiness information with the Investment Management Affiliates and will prevent the Investment Management Affiliates from marketing their products to you.Vermont: Except as permitted by law, we will not share personal information we collect about Vermont residents with Nonaffiliates unless you provide us with your written consent to share such information.California: Except as permitted by law, we will not share personal information we collect about California residents with Nonaffiliates and we will limit sharing such personal information with our Affiliates to comply with California privacy laws that apply to us. |
Delivery of Shareholder Documents. The Securities and Exchange Commission (SEC) permits funds to deliver only one copy of shareholder documents, including prospectuses, proxy statements and shareholder reports, to fund investors with multiple accounts at the same residential or post office box address. This practice is often called “householding” and it helps eliminate duplicate mailings to shareholders. Eaton Vance, or your financial intermediary, may household the mailing of your documents indefinitely unless you instruct Eaton Vance, or your financial intermediary, otherwise. If you would prefer that your Eaton Vance documents not be householded, please contact Eaton Vance at 1-800-262-1122, or contact your financial intermediary. Your instructions that householding not apply to delivery of your Eaton Vance documents will typically be effective within 30 days of receipt by Eaton Vance or your financial intermediary.
Portfolio Holdings. Each Eaton Vance Fund and its underlying Portfolio(s) (if applicable) files a schedule of portfolio holdings on Part F to Form N-PORT with the SEC. Certain information filed on Form N-PORT may be viewed on the Eaton Vance website at www.eatonvance.com, by calling Eaton Vance at 1-800-262-1122 or in the EDGAR database on the SEC’s website at www.sec.gov.
Proxy Voting. From time to time, funds are required to vote proxies related to the securities held by the funds. The Eaton Vance Funds or their underlying Portfolios (if applicable) vote proxies according to a set of policies and procedures approved by the Funds’ and Portfolios’ Boards. You may obtain a description of these policies and procedures and information on how the Funds or Portfolios voted proxies relating to portfolio securities during the most recent 12-month period ended June 30, without charge, upon request, by calling 1-800-262-1122 and by accessing the SEC’s website at www.sec.gov.
Tailored Shareholder Reports. Effective January 24, 2023, the SEC adopted rule and form amendments to require open-end mutual funds and ETFs to transmit concise and visually engaging streamlined annual and semi-annual reports to shareholders that highlight key information. Other information, including financial statements, will no longer appear in a streamlined shareholder report but must be available online, delivered free of charge upon request, and filed on a semi-annual basis on Form N-CSR. The rule and form amendments have a compliance date of July 24, 2024. At this time, management is evaluating the impact of these amendments on the shareholder reports for the Eaton Vance Funds.
This Page Intentionally Left Blank
This Page Intentionally Left Blank
Investment Adviser of International Income Portfolio
Boston Management and Research
One Post Office Square
Boston, MA 02109
Investment Adviser and Administrator of Eaton Vance
Global Sovereign Opportunities Fund
Eaton Vance Management
One Post Office Square
Boston, MA 02109
Principal Underwriter*
Eaton Vance Distributors, Inc.
One Post Office Square
Boston, MA 02109
(617) 482-8260
Custodian
State Street Bank and Trust Company
One Congress Street, Suite 1
Boston, MA 02114-2016
Transfer Agent
BNY Mellon Investment Servicing (US) Inc.
Attn: Eaton Vance Funds
P.O. Box 534439
Pittsburgh, PA 15253-4439
(800) 262-1122
Fund Offices
One Post Office Square
Boston, MA 02109
* FINRA BrokerCheck. Investors may check the background of their Investment Professional by contacting the Financial Industry Regulatory Authority (FINRA). FINRA BrokerCheck is a free tool to help investors check the professional background of current and former FINRA-registered securities firms and brokers. FINRA BrokerCheck is available by calling 1-800-289-9999 and at www.FINRA.org. The FINRA BrokerCheck brochure describing this program is available to investors at www.FINRA.org.
Eaton Vance
Short Duration Government Income Fund
Semi-Annual Report
April 30, 2024
Commodity Futures Trading Commission Registration. The Commodity Futures Trading Commission (“CFTC”) has adopted regulations that subject registered investment companies and advisers to regulation by the CFTC if a fund invests more than a prescribed level of its assets in certain CFTC-regulated instruments (including futures, certain options and swap agreements) or markets itself as providing investment exposure to such instruments. The investment adviser has claimed an exclusion from the definition of “commodity pool operator” under the Commodity Exchange Act with respect to its management of the Fund. Accordingly, neither the Fund nor the adviser with respect to the operation of the Fund is subject to CFTC regulation. Because of its management of other strategies, the Fund's adviser is registered with the CFTC as a commodity pool operator. The adviser is also registered as a commodity trading advisor.
Fund shares are not insured by the FDIC and are not deposits or other obligations of, or guaranteed by, any depository institution. Shares are subject to investment risks, including possible loss of principal invested.
This report must be preceded or accompanied by a current summary prospectus or prospectus. Before investing, investors should consider carefully the investment objective, risks, and charges and expenses of a mutual fund. This and other important information is contained in the summary prospectus and prospectus, which can be obtained from a financial intermediary. Prospective investors should read the prospectus carefully before investing. For further information, please call 1-800-262-1122.
Semi-Annual Report April 30, 2024
Eaton Vance
Short Duration Government Income Fund
Eaton Vance
Short Duration Government Income Fund
April 30, 2024
Performance
Portfolio Manager(s) Andrew Szczurowski, CFA and Alexander Payne, CFA
| % Average Annual Total Returns1,2 | Class
Inception Date | Performance
Inception Date | Six Months | One Year | Five Years | Ten Years |
| Advisers Class at NAV | 05/17/2021 | 09/30/2002 | 2.61% | 1.43% | 0.32% | 0.99% |
| Class A at NAV | 09/30/2002 | 09/30/2002 | 2.63 | 1.31 | 0.33 | 0.99 |
| Class A with 2.25% Maximum Sales Charge | — | — | 0.25 | (0.95) | (0.13) | 0.76 |
| Class C at NAV | 09/30/2002 | 09/30/2002 | 2.31 | 0.70 | (0.27) | 0.51 |
| Class C with 1% Maximum Deferred Sales Charge | — | — | 1.32 | (0.26) | (0.27) | 0.51 |
| Class I at NAV | 05/04/2009 | 09/30/2002 | 2.75 | 1.55 | 0.57 | 1.24 |
|
| ICE BofA 1-3 Year U.S. Treasury Index | — | — | 2.12% | 2.37% | 1.05% | 1.02% |
| ICE BofA 0-1 Year U.S. Treasury Index | — | — | 2.60 | 5.09 | 2.00 | 1.44 |
| % Total Annual Operating Expense Ratios3 | Advisers Class | Class A | Class C | Class I |
| | 1.02% | 1.02% | 1.62% | 0.77% |
See Endnotes and Additional Disclosures in this report.
Past performance is no guarantee of future results. Returns are historical and are calculated by determining the percentage change in net asset value (NAV) or offering price (as applicable) with all distributions reinvested. Furthermore, returns do not reflect the deduction of taxes that shareholders may have to pay on Fund distributions or upon the redemption of Fund shares. Investment return and principal value will fluctuate so that shares, when redeemed, may be worth more or less than their original cost. Performance for periods less than or equal to one year is cumulative. Performance is for the stated time period only; due to market volatility, current Fund performance may be lower or higher than the quoted return. For performance as of the most recent month-end, please refer to eatonvance.com.
Eaton Vance
Short Duration Government Income Fund
April 30, 2024
| Asset Allocation (% of total investments) |
Eaton Vance
Short Duration Government Income Fund
April 30, 2024
Endnotes and Additional Disclosures
| 1 | ICE BofA 1-3 Year U.S. Treasury Index is an unmanaged index of short-term U.S. Treasury securities. ICE BofA 0-1 Year U.S. Treasury Index is an unmanaged index of short-term U.S. Treasury securities having a maturity of less than one year. ICE® BofA® indices are not for redistribution or other uses; provided “as is”, without warranties, and with no liability. Eaton Vance has prepared this report and ICE Data Indices, LLC does not endorse it, or guarantee, review, or endorse Eaton Vance’s products. BofA® is a licensed registered trademark of Bank of America Corporation in the United States and other countries. Unless otherwise stated, index returns do not reflect the effect of any applicable sales charges, commissions, expenses, taxes or leverage, as applicable. It is not possible to invest directly in an index. |
| 2 | Total Returns at NAV do not include applicable sales charges. If sales charges were deducted, the returns would be lower. Total Returns shown with maximum sales charge reflect the stated maximum sales charge. Unless otherwise stated, performance does not reflect the deduction of taxes on Fund distributions or redemptions of Fund shares.Performance prior to the inception date of a class may be linked to the performance of an older class of the Fund. This linked performance is adjusted for any applicable sales charge, but is not adjusted for class expense differences. If adjusted for such differences, the performance would be different. The performance of Advisers Class is linked to Class A. Performance presented in the Financial Highlights included in the financial statements is not linked.Effective November 5, 2020, Class C shares automatically convert to Class A shares eight years after purchase. The average annual total returns listed for Class C reflect conversion to Class A shares after eight years. Prior to November 5, 2020, Class C shares automatically converted to Class A shares ten years after purchase. |
| 3 | Source: Fund prospectus. The expense ratios for the current reporting period can be found in the Financial Highlights section of this report. Performance reflects expenses waived and/or reimbursed, if applicable. Without such waivers and/or reimbursements, performance would have been lower. |
| | Fund profile subject to change due to active management. |
| | Important Notice to Shareholders |
| | Effective December 31, 2023, the Fund changed its primary benchmark from the ICE BofA 0-1 Year Treasury Index to the ICE BofA 1-3 Year Treasury Index because the investment adviser believes it is a more appropriate benchmark for the Fund. |
Eaton Vance
Short Duration Government Income Fund
April 30, 2024
Example
As a Fund shareholder, you incur two types of costs: (1) transaction costs, including sales charges (loads) on purchases; and (2) ongoing costs, including management fees; distribution and/or service fees; and other Fund expenses. This Example is intended to help you understand your ongoing costs (in dollars) of Fund investing and to compare these costs with the ongoing costs of investing in other mutual funds. The Example is based on an investment of $1,000 invested at the beginning of the period and held for the entire period (November 1, 2023 to April 30, 2024).
Actual Expenses
The first section of the table below provides information about actual account values and actual expenses. You may use the information in this section, together with the amount you invested, to estimate the expenses that you paid over the period. Simply divide your account value by $1,000 (for example, an $8,600 account value divided by $1,000 = 8.6), then multiply the result by the number in the first section under the heading entitled “Expenses Paid During Period” to estimate the expenses you paid on your account during this period.
Hypothetical Example for Comparison Purposes
The second section of the table below provides information about hypothetical account values and hypothetical expenses based on the actual Fund expense ratio and an assumed rate of return of 5% per year (before expenses), which is not the actual Fund return. The hypothetical account values and expenses may not be used to estimate the actual ending account balance or expenses you paid for the period. You may use this information to compare the ongoing costs of investing in your Fund and other funds. To do so, compare this 5% hypothetical example with the 5% hypothetical examples that appear in the shareholder reports of the other funds.
Please note that the expenses shown in the table are meant to highlight your ongoing costs only and do not reflect any transactional costs, such as sales charges (loads). Therefore, the second section of the table is useful in comparing ongoing costs only, and will not help you determine the relative total costs of owning different funds. In addition, if these transactional costs were included, your costs would be higher.
| | Beginning
Account Value
(11/1/23) | Ending
Account Value
(4/30/24) | Expenses Paid
During Period*
(11/1/23 – 4/30/24) | Annualized
Expense
Ratio |
| Actual | | | | |
| Advisers Class | $1,000.00 | $1,026.10 | $ 8.06** | 1.60% |
| Class A | $1,000.00 | $1,026.30 | $ 8.06** | 1.60% |
| Class C | $1,000.00 | $1,023.10 | $11.07** | 2.20% |
| Class I | $1,000.00 | $1,027.50 | $ 6.81** | 1.35% |
| |
| Hypothetical | | | | |
| (5% return per year before expenses) | | | | |
| Advisers Class | $1,000.00 | $1,016.91 | $ 8.02** | 1.60% |
| Class A | $1,000.00 | $1,016.91 | $ 8.02** | 1.60% |
| Class C | $1,000.00 | $1,013.92 | $11.02** | 2.20% |
| Class I | $1,000.00 | $1,018.15 | $ 6.77** | 1.35% |
| * | Expenses are equal to the Fund's annualized expense ratio for the indicated Class, multiplied by the average account value over the period, multiplied by 182/366 (to reflect the one-half year period). The Example assumes that the $1,000 was invested at the net asset value per share determined at the close of business on October 31, 2023. |
| ** | Absent an allocation of certain expenses to affiliate(s), expenses would be higher. |
Eaton Vance
Short Duration Government Income Fund
April 30, 2024
Portfolio of Investments (Unaudited)
| Collateralized Mortgage Obligations — 51.9% |
| Security | Principal
Amount
(000's omitted) | Value |
| Federal Home Loan Mortgage Corp.: | | | |
| Series 2135, Class JZ, 6.00%, 3/15/29 | $ | 192 | $ 192,794 |
| Series 3866, Class DF, 6.00%, (30-day SOFR Average + 1.564%, Cap 6.00%), 5/15/41(1) | | 1,044 | 987,657 |
| Series 4102, Class DF, 5.50%, (30-day SOFR Average + 1.264%, Cap 5.50%), 9/15/42(1) | | 271 | 246,560 |
| Series 4159, Class FP, 5.00%, (30-day SOFR Average + 1.014%, Cap 5.00%), 11/15/42(1) | | 611 | 553,837 |
| Series 4180, Class KF, 5.00%, (30-day SOFR Average + 1.114%, Cap 5.00%), 1/15/43(1) | | 3,145 | 2,807,655 |
| Series 4204, Class AF, 5.00%, (30-day SOFR Average + 1.114%, Cap 5.00%), 5/15/43(1) | | 540 | 471,179 |
| Series 4212, Class NS, 0.00%, (5.263% - 30-day SOFR Average x 1.20, Floor 0.00%), 6/15/43(2) | | 1,693 | 787,104 |
| Series 4223, Class NF, 6.00%, (30-day SOFR Average + 1.064%, Cap 6.00%), 7/15/43(1) | | 1,931 | 1,777,241 |
| Series 4249, Class CF, 6.237%, (30-day SOFR Average + 0.914%), 9/15/43(1) | | 7,082 | 6,871,561 |
| Series 4299, Class JG, 2.50%, 7/15/43 | | 519 | 461,775 |
| Series 4389, Class CA, 3.00%, 9/15/44 | | 1,236 | 1,048,705 |
| Series 4619, Class KF, 5.00%, (30-day SOFR Average + 0.864%, Cap 5.00%), 6/15/39(1) | | 710 | 659,737 |
| Series 4678, Class PC, 3.00%, 1/15/46 | | 1,205 | 1,090,265 |
| Series 4876, Class FA, 6.145%, (30-day SOFR Average + 0.814%), 5/15/49(1) | | 6,066 | 5,940,283 |
| Series 4995, Class ZN, 2.50%, 7/25/50 | | 1,055 | 529,268 |
| Series 5009, Class ZN, 3.50%, 7/25/50 | | 5,252 | 3,893,228 |
| Series 5028, Class AZ, 2.00%, 10/25/50 | | 1,020 | 389,049 |
| Series 5028, Class TZ, 2.00%, 10/25/50 | | 2,740 | 1,345,135 |
| Series 5028, Class ZA, 2.00%, 10/25/50 | | 1,173 | 581,322 |
| Series 5031, Class Z, 2.50%, 10/25/50 | | 8 | 4,487 |
| Series 5035, Class AZ, 2.00%, 11/25/50 | | 1,490 | 657,417 |
| Series 5035, Class ZK, 2.50%, 11/25/50 | | 17,512 | 9,628,209 |
| Series 5035, Class ZT, 2.00%, 10/25/50 | | 1,666 | 714,790 |
| Series 5037, Class ZQ, 2.00%, 11/25/50 | | 787 | 332,534 |
| Series 5038, Class Z, 2.50%, 10/25/50 | | 4 | 1,595 |
| Series 5038, Class ZN, 2.00%, 11/25/50 | | 1,838 | 704,689 |
| Series 5039, Class PZ, 2.00%, 11/25/50 | | 1,189 | 479,924 |
| Series 5039, Class ZJ, 2.00%, 11/25/50 | | 361 | 138,475 |
| Series 5040, Class TZ, 2.50%, 11/25/50 | | 4,400 | 2,145,433 |
| Series 5048, Class CZ, 2.00%, 12/25/50 | | 1,917 | 774,315 |
| Series 5058, Class Z, 2.00%, 1/25/51 | | 721 | 288,627 |
| Series 5058, Class ZA, 2.00%, 1/25/51 | | 1,047 | 432,569 |
| Series 5058, Class ZH, 3.00%, 5/25/50 | | 2,986 | 1,635,805 |
| Series 5068, Class UZ, 2.50%, 1/25/51 | | 9,698 | 5,358,396 |
| Series 5071, Class CS, 0.00%, (3.30% - 30-day SOFR Average, Floor 0.00%), 2/25/51(2) | | 6,990 | 3,357,377 |
| Security | Principal
Amount
(000's omitted) | Value |
| Federal Home Loan Mortgage Corp.: (continued) | | | |
| Series 5071, Class SP, 0.00%, (3.30% - 30-day SOFR Average, Floor 0.00%), 2/25/51(2) | $ | 9,615 | $ 3,537,784 |
| Series 5072, Class ZU, 2.50%, 2/25/51 | | 3,089 | 1,523,716 |
| Series 5083, Class SK, 0.00%, (3.867% - 30-day SOFR Average x 1.333, Floor 0.00%), 3/25/51(2) | | 8,471 | 4,489,990 |
| Series 5083, Class ZW, 2.50%, 3/25/51 | | 5,180 | 2,535,258 |
| Series 5090, Class PZ, 2.50%, 3/25/51 | | 541 | 250,819 |
| Series 5093, Class Z, 3.00%, 1/25/51 | | 1 | 516 |
| Series 5093, Class ZM, 3.00%, 3/25/51 | | 2 | 1,179 |
| Series 5101, Class EZ, 2.00%, 3/25/51 | | 2,064 | 1,007,196 |
| Series 5104, Class WZ, 3.00%, 4/25/51 | | 922 | 552,503 |
| Series 5114, Class ZH, 3.00%, 5/25/51 | | 450 | 270,807 |
| Series 5123, Class JZ, 2.00%, 7/25/51 | | 788 | 340,088 |
| Series 5129, Class HZ, 1.25%, 4/25/50 | | 1,648 | 606,171 |
| Series 5129, Class TZ, 2.50%, 8/25/51 | | 3,267 | 1,500,918 |
| Series 5129, Class WZ, 3.00%, 8/25/50 | | 1 | 524 |
| Series 5129, Class ZE, 3.00%, 9/25/50 | | 211 | 107,026 |
| Series 5129, Class ZH, 3.00%, 7/25/50 | | 1 | 552 |
| Series 5129, Class ZW, 3.00%, 8/25/50 | | 1 | 368 |
| Series 5131, Class QZ, 3.00%, 7/25/51 | | 3,041 | 1,759,398 |
| Series 5132, Class LZ, 2.50%, 8/25/51 | | 8,604 | 4,411,881 |
| Series 5135, Class MZ, 2.50%, 8/25/51 | | 13,137 | 7,158,158 |
| Series 5136, Class ZJ, 2.50%, 8/25/51 | | 17,602 | 9,337,527 |
| Series 5139, Class DZ, 2.50%, 9/25/51 | | 10,586 | 5,612,978 |
| Series 5139, Class EZ, 2.50%, 9/25/51 | | 12,278 | 6,342,305 |
| Series 5140, Class WZ, 2.50%, 9/25/51 | | 6,926 | 3,838,075 |
| Series 5141, Class ZJ, 2.50%, 9/25/51 | | 12,773 | 6,780,205 |
| Series 5141, Class ZP, 3.00%, 4/25/50 | | 12,674 | 8,131,731 |
| Series 5150, Class QZ, 2.50%, 10/25/51 | | 4,873 | 2,688,042 |
| Series 5150, Class ZJ, 2.50%, 10/25/51 | | 13,996 | 7,731,648 |
| Series 5150, Class ZN, 2.50%, 10/25/51 | | 1,231 | 614,107 |
| Series 5159, Class KZ, 3.00%, 11/25/51 | | 6,783 | 4,209,873 |
| Series 5159, Class MZ, 3.00%, 11/25/51 | | 1,028 | 583,614 |
| Series 5159, Class ZP, 3.00%, 11/25/51 | | 4,638 | 2,682,917 |
| Series 5159, Class ZT, 3.00%, 11/25/51 | | 8,283 | 5,073,459 |
| Series 5160, Class ZW, 3.00%, 8/25/50 | | 2,746 | 1,861,325 |
| Series 5163, Class Z, 3.00%, 11/25/51 | | 5,824 | 3,206,809 |
| Series 5168, Class MZ, 3.00%, 10/25/51 | | 6,645 | 3,984,139 |
| Series 5169, Class JZ, 3.00%, 1/25/49 | | 389 | 233,328 |
| Series 5300, Class EY, 6.00%, 12/25/52 | | 5,000 | 4,873,127 |
| Series 5327, Class B, 6.00%, 8/25/53 | | 20,000 | 19,461,372 |
| Interest Only:(3) | | | |
| Series 354, Class C11, 3.50%, 7/15/46 | | 8,006 | 1,376,458 |
| Series 354, Class C15, 3.50%, 11/15/46 | | 7,570 | 1,557,595 |
| Series 362, Class C7, 3.50%, 9/15/47 | | 13,091 | 2,348,982 |
6
See Notes to Financial Statements.
Eaton Vance
Short Duration Government Income Fund
April 30, 2024
Portfolio of Investments (Unaudited) — continued
| Security | Principal
Amount
(000's omitted) | Value |
| Interest Only: (continued) | | | |
| Series 362, Class C11, 4.00%, 12/15/47 | $ | 3,889 | $ 807,862 |
| Series 362, Class C12, 4.00%, 12/15/47 | | 7,822 | 1,583,770 |
| Series 380, Class C5, 3.50%, 1/25/50 | | 9,178 | 1,795,880 |
| Series 3030, Class SL, 0.656%, (5.986% - 30-day SOFR Average), 9/15/35(2) | | 799 | 40,932 |
| Series 3114, Class TS, 1.206%, (6.536% - 30-day SOFR Average), 9/15/30(2) | | 1,128 | 30,827 |
| Series 3339, Class JI, 1.146%, (6.476% - 30-day SOFR Average), 7/15/37(2) | | 713 | 53,011 |
| Series 4094, Class CS, 0.556%, (5.886% - 30-day SOFR Average), 8/15/42(2) | | 598 | 46,543 |
| Series 4109, Class SA, 0.756%, (6.086% - 30-day SOFR Average), 9/15/32(2) | | 865 | 37,188 |
| Series 4497, Class CS, 0.756%, (6.086% - 30-day SOFR Average), 9/15/44(2) | | 160 | 2,086 |
| Series 4507, Class EI, 4.00%, 8/15/44 | | 2,278 | 279,046 |
| Series 4507, Class MI, 3.50%, 8/15/44 | | 182 | 6,608 |
| Series 4549, Class DS, 0.456%, (5.786% - 30-day SOFR Average), 8/15/45(2) | | 698 | 30,546 |
| Series 4601, Class IN, 3.50%, 7/15/46 | | 12,642 | 2,224,327 |
| Series 4625, Class BI, 3.50%, 6/15/46 | | 2,483 | 414,966 |
| Series 4637, Class IP, 3.50%, 4/15/44 | | 105 | 3,270 |
| Series 4749, Class IL, 4.00%, 12/15/47 | | 876 | 184,323 |
| Series 4768, Class IO, 4.00%, 3/15/48 | | 1,008 | 212,987 |
| Series 4768, Class KI, 4.00%, 11/15/47 | | 1,768 | 363,209 |
| Series 4772, Class PI, 4.00%, 1/15/48 | | 1,095 | 231,401 |
| Series 4791, Class JI, 4.00%, 5/15/48 | | 1,594 | 353,246 |
| Series 4791, Class SA, 0.756%, (6.086% - 30-day SOFR Average), 5/15/48(2) | | 4,386 | 414,327 |
| Series 4796, Class AS, 0.756%, (6.086% - 30-day SOFR Average), 5/15/48(2) | | 2,778 | 262,572 |
| Series 4808, Class IB, 4.00%, 5/15/48 | | 4,257 | 938,636 |
| Series 4966, Class SY, 0.606%, (5.936% - 30-day SOFR Average), 4/25/50(2) | | 4,141 | 426,084 |
| Series 5008, Class IE, 2.00%, 9/25/50 | | 33,269 | 4,226,319 |
| Series 5010, Class I, 2.00%, 9/25/50 | | 29,360 | 3,745,358 |
| Series 5010, Class IB, 2.00%, 9/25/50 | | 43,412 | 5,514,728 |
| Series 5010, Class IN, 2.00%, 9/25/50 | | 50,924 | 6,483,389 |
| Series 5010, Class NI, 2.00%, 9/25/50 | | 14,693 | 1,867,735 |
| Series 5016, Class UI, 2.00%, 9/25/50 | | 13,892 | 1,764,713 |
| Series 5017, Class DI, 2.00%, 9/25/50 | | 28,776 | 3,655,477 |
| Series 5019, Class CI, 2.00%, 10/25/50 | | 23,544 | 3,016,218 |
| Series 5020, Class CI, 2.00%, 9/25/50 | | 5,803 | 717,987 |
| Series 5024, Class CI, 2.00%, 10/25/50 | | 59,957 | 7,417,078 |
| Series 5025, Class GI, 2.00%, 10/25/50 | | 10,190 | 1,308,371 |
| Series 5028, Class TI, 2.00%, 10/25/50 | | 12,766 | 1,270,298 |
| Series 5038, Class DI, 2.00%, 11/25/50 | | 73,333 | 9,330,900 |
| Series 5051, Class S, 0.00%, (3.60% - 30-day SOFR Average, Floor 0.00%), 12/25/50(2) | | 29,329 | 594,014 |
| Security | Principal
Amount
(000's omitted) | Value |
| Interest Only: (continued) | | | |
| Series 5156, Class IP, 3.00%, 12/25/49 | $ | 22,842 | $ 3,611,416 |
| Series 5191, Class IB, 2.50%, 2/25/51 | | 48,579 | 7,659,319 |
| Principal Only:(4) | | | |
| Series 213, Class PO, 0.00%, 6/1/31 | | 782 | 677,215 |
| Series 239, Class PO, 0.00%, 8/15/36 | | 458 | 343,860 |
| Series 246, Class PO, 0.00%, 5/15/37 | | 1,099 | 857,696 |
| Series 3072, Class WO, 0.00%, 11/15/35 | | 387 | 308,413 |
| Series 3342, Class KO, 0.00%, 7/15/37 | | 154 | 122,808 |
| Series 3476, Class PO, 0.00%, 7/15/38 | | 200 | 149,082 |
| Series 3862, Class PO, 0.00%, 5/15/41 | | 405 | 303,833 |
| Series 4239, Class OU, 0.00%, 7/15/43 | | 2,826 | 1,442,333 |
| Federal National Mortgage Association: | | | |
| Series G97-4, Class FA, 6.245%, (30-day SOFR Average + 0.914%), 6/17/27(1) | | 41 | 40,564 |
| Series 2001-4, Class GA, 9.00%, 4/17/25(5) | | 0 (6) | 8 |
| Series 2009-48, Class WA, 5.798%, 7/25/39(5) | | 185 | 184,639 |
| Series 2009-62, Class WA, 5.579%, 8/25/39(5) | | 265 | 263,626 |
| Series 2010-112, Class DZ, 4.00%, 10/25/40 | | 306 | 278,166 |
| Series 2011-49, Class NT, 6.00%, (64.855% - 30-day SOFR Average x 10.00, Cap 6.00%), 6/25/41(2) | | 119 | 110,685 |
| Series 2012-51, Class FD, 6.025%, (30-day SOFR Average + 0.694%), 5/25/42(1) | | 15,010 | 14,692,677 |
| Series 2012-103, Class ZP, 3.00%, 9/25/42 | | 820 | 583,256 |
| Series 2012-115, Class MX, 0.00%, (3.329% - 30-day SOFR Average x 1.154, Floor 0.00%), 10/25/42(2) | | 628 | 209,363 |
| Series 2012-128, Class SH, 0.00%, (3.886% - 30-day SOFR Average, Floor 0.00%), 11/25/42(2) | | 3,753 | 2,088,443 |
| Series 2012-128, Class WS, 0.00%, (3.886% - 30-day SOFR Average, Floor 0.00%), 11/25/42(2) | | 547 | 301,683 |
| Series 2012-134, Class ZT, 2.00%, 12/25/42 | | 992 | 726,110 |
| Series 2013-52, Class GA, 1.00%, 6/25/43 | | 555 | 444,448 |
| Series 2013-58, Class SC, 0.00%, (5.828% - 30-day SOFR Average x 1.50, Floor 0.00%), 6/25/43(2) | | 2,651 | 1,778,858 |
| Series 2013-67, Class NF, 5.00%, (30-day SOFR Average + 1.114%, Cap 5.00%), 7/25/43(1) | | 631 | 566,949 |
| Series 2014-1, Class HF, 5.00%, (30-day SOFR Average + 1.614%, Cap 5.00%), 6/25/43(1) | | 730 | 643,564 |
| Series 2014-5, Class LB, 2.50%, 7/25/43 | | 0 (6) | 174 |
| Series 2015-74, Class SL, 0.00%, (2.282% - 30-day SOFR Average x 0.587, Floor 0.00%), 10/25/45(2) | | 1,883 | 995,449 |
| Series 2016-26, Class KS, 0.00%, (5.05% - 30-day SOFR Average x 1.75, Floor 0.00%), 11/25/42(2) | | 1,603 | 1,137,502 |
| Series 2017-15, Class LE, 3.00%, 6/25/46 | | 101 | 97,286 |
| Series 2017-56, Class KF, 6.00%, (30-day SOFR Average + 1.114%, Cap 6.00%), 7/25/47(1) | | 561 | 516,566 |
7
See Notes to Financial Statements.
Eaton Vance
Short Duration Government Income Fund
April 30, 2024
Portfolio of Investments (Unaudited) — continued
| Security | Principal
Amount
(000's omitted) | Value |
| Federal National Mortgage Association: (continued) | | | |
| Series 2017-56, Class KS, 0.00%, (4.886% - 30-day SOFR Average, Floor 0.00%), 7/25/47(2) | $ | 314 | $ 141,407 |
| Series 2019-1, Class FA, 6.00%, (30-day SOFR Average + 0.714%, Cap 6.00%), 2/25/49(1) | | 5,965 | 5,859,403 |
| Series 2019-8, Class FD, 6.145%, (30-day SOFR Average + 0.814%), 3/25/49(1) | | 18,998 | 18,602,048 |
| Series 2019-9, Class LF, 5.995%, (30-day SOFR Average + 0.664%), 3/25/49(1) | | 7,784 | 7,583,502 |
| Series 2019-16, Class AF, 5.995%, (30-day SOFR Average + 0.664%), 4/25/49(1) | | 6,626 | 6,423,533 |
| Series 2020-45, Class MA, 0.00%, (3.108% - 30-day SOFR Average x 0.80, Floor 0.00%), 6/25/43(2) | | 1,126 | 542,204 |
| Series 2020-63, Class ZN, 3.00%, 9/25/50 | | 314 | 166,318 |
| Series 2020-86, Class ZP, 2.50%, 12/25/50 | | 1,410 | 636,764 |
| Series 2020-95, Class BZ, 2.50%, 1/25/51 | | 323 | 139,417 |
| Series 2020-96, Class DZ, 2.50%, 1/25/51 | | 8,421 | 4,380,914 |
| Series 2020-96, Class EZ, 2.50%, 1/25/51 | | 665 | 295,075 |
| Series 2020-96, Class KZ, 2.50%, 1/25/51 | | 316 | 138,784 |
| Series 2021-3, Class ZH, 2.50%, 2/25/51 | | 1,725 | 811,153 |
| Series 2021-8, Class NZ, 2.50%, 3/25/51 | | 1,074 | 506,288 |
| Series 2021-11, Class KZ, 3.00%, 6/25/50 | | 559 | 323,470 |
| Series 2021-14, Class GZ, 2.50%, 3/25/51 | | 694 | 314,522 |
| Series 2021-22, Class MZ, 3.00%, 4/25/51 | | 2,299 | 1,297,299 |
| Series 2021-42, Class ZA, 3.00%, 2/25/51 | | 4,871 | 2,855,918 |
| Series 2021-42, Class ZD, 3.00%, 11/25/50 | | 6,030 | 3,564,266 |
| Series 2021-45, Class DZ, 3.00%, 7/25/51 | | 385 | 197,458 |
| Series 2021-51, Class EZ, 2.50%, 8/25/51 | | 1,244 | 601,721 |
| Series 2021-52, Class JZ, 2.50%, 8/25/51 | | 15,247 | 8,314,852 |
| Series 2021-55, Class ZN, 2.50%, 8/25/51 | | 359 | 169,909 |
| Series 2021-56, Class LZ, 2.50%, 9/25/51 | | 14,489 | 8,344,677 |
| Series 2021-57, Class ZW, 2.50%, 7/25/51 | | 19,268 | 10,154,297 |
| Series 2021-59, Class EZ, 2.50%, 9/25/51 | | 1,481 | 733,597 |
| Series 2021-61, Class Z, 2.50%, 9/25/51 | | 13,163 | 7,336,464 |
| Series 2021-63, Class QZ, 2.50%, 6/25/51 | | 9,848 | 5,079,810 |
| Series 2021-66, Class JZ, 2.50%, 10/25/51 | | 13,251 | 7,205,362 |
| Series 2021-69, Class JZ, 2.50%, 10/25/51 | | 13,892 | 7,748,213 |
| Series 2021-77, Class WZ, 3.00%, 8/25/50 | | 1,889 | 1,008,417 |
| Series 2021-95, Class ZC, 3.00%, 8/25/51 | | 4,571 | 2,742,090 |
| Series 2022-2, Class ZN, 3.00%, 2/25/52 | | 11,869 | 7,122,458 |
| Series 2023-12, Class LW, 6.00%, 4/25/53 | | 15,000 | 14,605,167 |
| Series 2023-13, Class LY, 6.00%, 4/25/53 | | 9,120 | 9,017,340 |
| Series 2023-14, Class EL, 6.00%, 4/25/53 | | 23,200 | 22,915,177 |
| Interest Only:(3) | | | |
| Series 424, Class C8, 3.50%, 2/25/48 | | 3,567 | 643,710 |
| Series 2004-60, Class SW, 1.606%, (6.936% - 30-day SOFR Average), 4/25/34(2) | | 457 | 8,757 |
| Security | Principal
Amount
(000's omitted) | Value |
| Interest Only: (continued) | | | |
| Series 2005-68, Class XI, 6.00%, 8/25/35 | $ | 996 | $ 176,010 |
| Series 2006-65, Class PS, 1.776%, (7.106% - 30-day SOFR Average), 7/25/36(2) | | 622 | 60,305 |
| Series 2007-99, Class SD, 0.956%, (6.286% - 30-day SOFR Average), 10/25/37(2) | | 932 | 65,483 |
| Series 2007-102, Class ST, 0.996%, (6.326% - 30-day SOFR Average), 11/25/37(2) | | 471 | 28,751 |
| Series 2011-59, Class IW, 6.00%, 7/25/41 | | 673 | 119,273 |
| Series 2011-101, Class IC, 3.50%, 10/25/26 | | 477 | 10,543 |
| Series 2012-147, Class SA, 0.656%, (5.986% - 30-day SOFR Average), 1/25/43(2) | | 699 | 53,341 |
| Series 2014-41, Class SA, 0.606%, (5.936% - 30-day SOFR Average), 7/25/44(2) | | 676 | 76,653 |
| Series 2014-55, Class IL, 3.50%, 9/25/44 | | 595 | 114,244 |
| Series 2014-55, Class IN, 3.50%, 7/25/44 | | 537 | 100,460 |
| Series 2014-89, Class IO, 3.50%, 1/25/45 | | 907 | 172,202 |
| Series 2015-22, Class GI, 3.50%, 4/25/45 | | 287 | 47,577 |
| Series 2015-31, Class SG, 0.656%, (5.986% - 30-day SOFR Average), 5/25/45(2) | | 756 | 106,035 |
| Series 2015-36, Class IL, 3.00%, 6/25/45 | | 777 | 110,050 |
| Series 2016-61, Class DI, 3.00%, 4/25/46 | | 642 | 64,144 |
| Series 2018-21, Class IO, 3.00%, 4/25/48 | | 3,890 | 677,381 |
| Series 2018-42, Class IA, 3.50%, 6/25/47 | | 886 | 147,104 |
| Series 2019-1, Class SA, 0.00%, (5.286% - 30-day SOFR Average, Floor 0.00%), 2/25/49(2) | | 4,170 | 140,445 |
| Series 2020-23, Class SP, 0.606%, (5.936% - 30-day SOFR Average), 2/25/50(2) | | 11,652 | 1,209,232 |
| Series 2020-45, Class HI, 2.50%, 7/25/50 | | 6,316 | 950,931 |
| Series 2020-73, Class NI, 2.00%, 10/25/50 | | 6,322 | 811,529 |
| Series 2020-89, Class PI, 2.50%, 12/25/50 | | 12,797 | 2,033,736 |
| Series 2020-94, Class DI, 2.00%, 1/25/51 | | 14,728 | 1,915,305 |
| Series 2021-3, Class KI, 2.50%, 2/25/51 | | 27,064 | 3,968,021 |
| Series 2021-3, Class LI, 2.50%, 2/25/51 | | 25,410 | 3,632,803 |
| Series 2021-10, Class EI, 2.00%, 3/25/51 | | 11,652 | 1,557,786 |
| Series 2021-34, Class QI, 3.00%, 6/25/51 | | 38,262 | 6,801,806 |
| Series 2021-73, Class AI, 2.50%, 6/25/49 | | 7,765 | 1,076,278 |
| Series 2021-94, Class CI, 3.00%, 1/25/52 | | 10,483 | 1,741,013 |
| Series 2022-6, Class IO, 2.50%, 7/25/51 | | 30,196 | 4,764,682 |
| Principal Only:(4) | | | |
| Series 379, Class 1, 0.00%, 5/25/37 | | 954 | 738,484 |
| Series 380, Class 1, 0.00%, 7/25/37 | | 231 | 181,148 |
| Series 2007-17, Class PO, 0.00%, 3/25/37 | | 168 | 125,097 |
| Series 2009-82, Class PO, 0.00%, 10/25/39 | | 449 | 339,268 |
| Series 2012-5, Class PO, 0.00%, 12/25/39 | | 308 | 241,257 |
| Series 2014-9, Class DO, 0.00%, 2/25/43 | | 7,379 | 5,304,351 |
| Series 2014-17, Class PO, 0.00%, 4/25/44 | | 992 | 683,997 |
8
See Notes to Financial Statements.
Eaton Vance
Short Duration Government Income Fund
April 30, 2024
Portfolio of Investments (Unaudited) — continued
| Security | Principal
Amount
(000's omitted) | Value |
| Government National Mortgage Association: | | | |
| Series 2012-77, Class MT, 5.824%, (1 mo. SOFR + 0.504%), 5/16/41(1) | $ | 330 | $ 316,466 |
| Series 2014-H20, Class MF, 6.087%, (1 mo. SOFR + 0.764%), 10/20/64(1) | | 4,195 | 4,194,901 |
| Series 2015-144, Class KB, 3.00%, 8/20/44 | | 503 | 412,937 |
| Series 2015-H03, Class FD, 6.077%, (1 mo. SOFR + 0.754%), 1/20/65(1) | | 15,190 | 15,193,899 |
| Series 2015-H05, Class FB, 6.077%, (1 mo. SOFR + 0.754%), 2/20/65(1) | | 15,927 | 15,933,546 |
| Series 2016-168, Class JF, 6.00%, (1 mo. SOFR + 1.114%, Cap 6.00%), 11/20/46(1) | | 128 | 121,373 |
| Series 2017-121, Class DF, 5.00%, (1 mo. SOFR + 0.614%, Cap 5.00%), 8/20/47(1) | | 2,942 | 2,781,088 |
| Series 2017-137, Class AF, 5.00%, (1 mo. SOFR + 0.614%, Cap 5.00%), 9/20/47(1) | | 1,320 | 1,246,576 |
| Series 2018-H18, Class FG, 6.037%, (1 mo. SOFR + 0.714%), 10/20/68(1) | | 29,966 | 29,568,186 |
| Series 2018-H20, Class FA, 6.037%, (1 mo. SOFR + 0.714%), 12/20/68(1) | | 46,262 | 45,713,699 |
| Series 2020-76, Class ZL, 2.75%, 5/20/50 | | 316 | 159,941 |
| Series 2021-1, Class ZD, 3.00%, 1/20/51 | | 1,611 | 1,097,605 |
| Series 2021-8, Class ZG, 2.50%, 1/20/51 | | 3,281 | 1,603,313 |
| Series 2021-24, Class EZ, 2.50%, 1/20/51 | | 3,561 | 1,766,724 |
| Series 2021-24, Class KZ, 2.50%, 2/20/51 | | 3,642 | 2,043,539 |
| Series 2021-25, Class JZ, 2.50%, 2/20/51 | | 2,028 | 896,315 |
| Series 2021-49, Class VZ, 2.50%, 3/20/51 | | 21 | 8,529 |
| Series 2021-77, Class ZG, 3.00%, 7/20/50 | | 360 | 185,954 |
| Series 2021-86, Class ZJ, 1.50%, 5/20/51 | | 287 | 108,242 |
| Series 2021-97, Class MZ, 3.00%, 8/20/50 | | 5,876 | 3,400,342 |
| Series 2021-97, Class ZC, 3.00%, 8/20/50 | | 7,531 | 4,431,042 |
| Series 2021-105, Class MZ, 3.00%, 6/20/51 | | 4,805 | 2,754,194 |
| Series 2021-105, Class ZH, 1.50%, 6/20/51 | | 1,498 | 670,366 |
| Series 2021-107, Class GZ, 3.00%, 6/20/51 | | 2,447 | 1,448,789 |
| Series 2021-114, Class JZ, 3.00%, 6/20/51 | | 2,098 | 1,159,596 |
| Series 2021-118, Class EZ, 2.50%, 7/20/51 | | 7,173 | 4,030,756 |
| Series 2021-121, Class ZE, 2.50%, 7/20/51 | | 128 | 61,155 |
| Series 2021-122, Class ZL, 2.50%, 7/20/51 | | 11,624 | 6,260,668 |
| Series 2021-131, Class ZN, 3.00%, 7/20/51 | | 2,644 | 1,601,847 |
| Series 2021-136, Class WZ, 3.00%, 8/20/51 | | 6,191 | 3,542,503 |
| Series 2021-136, Class Z, 2.50%, 8/20/51 | | 10,931 | 5,963,597 |
| Series 2021-137, Class GZ, 2.50%, 8/20/51 | | 1,260 | 702,773 |
| Series 2021-138, Class Z, 2.50%, 8/20/51 | | 11,642 | 6,705,579 |
| Series 2021-154, Class ZC, 2.50%, 9/20/51 | | 6,283 | 3,454,731 |
| Series 2021-154, Class ZL, 3.00%, 9/20/51 | | 8,376 | 4,411,152 |
| Series 2021-156, Class ZQ, 2.50%, 9/20/51 | | 4,987 | 2,826,515 |
| Series 2021-159, Class ZJ, 2.50%, 9/20/51 | | 8,342 | 4,699,266 |
| Series 2021-159, Class ZP, 2.00%, 9/20/51 | | 7,706 | 4,105,831 |
| Series 2021-160, Class NZ, 3.00%, 9/20/51 | | 2,613 | 1,384,806 |
| Security | Principal
Amount
(000's omitted) | Value |
Government National Mortgage Association:
(continued) | | | |
| Series 2021-172, Class ZA, 3.00%, 9/20/51 | $ | 1,624 | $ 927,819 |
| Series 2021-177, Class JZ, 3.00%, 10/20/51 | | 4,946 | 3,062,626 |
| Series 2021-182, Class KZ, 3.00%, 10/20/51 | | 1,351 | 714,747 |
| Series 2021-194, Class HZ, 3.00%, 11/20/51 | | 9,458 | 6,280,307 |
| Series 2021-199, Class ZM, 3.00%, 11/20/51 | | 3,876 | 2,195,774 |
| Series 2021-213, Class NZ, 3.00%, 12/20/51 | | 7,764 | 4,938,752 |
| Series 2021-214, Class LZ, 3.00%, 12/20/51 | | 10,570 | 6,903,141 |
| Series 2022-31, Class ZD, 3.00%, 2/20/52 | | 806 | 295,024 |
| Series 2022-189, Class US, 3.189%, (22.733% - 30-day SOFR Average x 3.667), 11/20/52(2) | | 11,529 | 11,209,274 |
| Series 2022-195, Class AS, 3.403%, (23.125% - 30-day SOFR Average x 3.70), 11/20/52(2) | | 3,560 | 3,563,926 |
| Series 2022-197, Class SW, 3.527%, (16.32% - 30-day SOFR Average x 2.40), 11/20/52(2) | | 6,228 | 5,775,877 |
| Series 2022-208, Class YF, 6.33%, (30-day SOFR Average + 1.00%), 12/20/52(1) | | 34,706 | 34,399,494 |
| Series 2022-211, Class HF, 6.33%, (30-day SOFR Average + 1.00%), 12/20/52(1) | | 138,823 | 136,751,259 |
| Series 2023-53, Class AL, 5.50%, 4/20/53 | | 26,000 | 24,843,387 |
| Series 2023-53, Class SE, 3.005%, (22.55% - 30-day SOFR Average x 3.667), 4/20/53(2) | | 14,738 | 14,095,992 |
| Series 2023-63, Class LB, 6.00%, 5/20/53 | | 10,000 | 9,774,938 |
| Series 2023-63, Class S, 3.005%, (22.55% - 30-day SOFR Average x 3.667), 5/20/53(2) | | 7,077 | 6,764,601 |
| Series 2023-64, Class LB, 6.00%, 5/20/53 | | 4,079 | 3,987,945 |
| Series 2023-65, Class G, 3.005%, (22.55% - 30-day SOFR Average x 3.667), 5/20/53(2) | | 11,266 | 10,853,909 |
| Series 2023-65, Class SB, 3.005%, (22.55% - 30-day SOFR Average x 3.667), 5/20/53(2) | | 3,748 | 3,593,174 |
| Series 2023-65, Class SD, 3.005%, (22.55% - 30-day SOFR Average x 3.667), 5/20/53(2) | | 2,842 | 2,755,014 |
| Series 2023-66, Class S, 3.005%, (22.55% - 30-day SOFR Average x 3.667), 5/20/53(2) | | 4,442 | 4,243,629 |
| Series 2023-66, Class SD, 3.005%, (22.55% - 30-day SOFR Average x 3.667), 5/20/53(2) | | 1,777 | 1,697,527 |
| Series 2023-82, Class AL, 6.00%, 6/20/53 | | 18,360 | 17,986,973 |
| Series 2023-83, Class GS, 3.08%, (27.60% - 30-day SOFR Average x 4.60), 6/20/53(2) | | 7,458 | 6,741,411 |
| Series 2023-83, Class S, 2.72%, (22.868% - 30-day SOFR Average x 3.78), 6/20/53(2) | | 4,017 | 3,819,790 |
| Series 2023-84, Class MW, 6.00%, 6/20/53 | | 4,600 | 4,495,527 |
| Series 2023-84, Class SN, 2.825%, (22.387% - 30-day SOFR Average x 3.67), 6/20/53(2) | | 5,341 | 5,071,475 |
| Series 2023-89, Class SD, 2.639%, (22.183% - 30-day SOFR Average x 3.667), 6/20/53(2) | | 4,804 | 4,542,810 |
| Series 2023-96, Class BL, 6.00%, 7/20/53 | | 5,000 | 4,892,886 |
| Series 2023-96, Class DB, 6.00%, 7/20/53 | | 12,250 | 11,972,686 |
| Series 2023-97, Class CB, 6.00%, 7/20/53 | | 14,000 | 13,810,636 |
| Series 2023-98, Class BW, 6.00%, 7/20/53 | | 3,250 | 3,178,323 |
| Series 2023-98, Class JB, 6.00%, 7/20/53 | | 12,714 | 12,435,051 |
9
See Notes to Financial Statements.
Eaton Vance
Short Duration Government Income Fund
April 30, 2024
Portfolio of Investments (Unaudited) — continued
| Security | Principal
Amount
(000's omitted) | Value |
Government National Mortgage Association:
(continued) | | | |
| Series 2023-99, Class AL, 6.00%, 7/20/53 | $ | 17,468 | $ 17,074,970 |
| Series 2023-117, Class JB, 6.00%, 8/20/53 | | 9,602 | 9,418,869 |
| Series 2023-165, Class DY, 6.00%, 11/20/53 | | 20,000 | 19,778,242 |
| Series 2023-165, Class EY, 6.50%, 11/20/53 | | 22,000 | 22,349,408 |
| Series 2023-182, Class EL, 6.00%, 12/20/53 | | 7,000 | 6,793,644 |
| Interest Only:(3) | | | |
| Series 2014-98, Class IM, 0.00%, 1/20/43(5) | | 4,656 | 73,210 |
| Series 2015-151, Class KI, 0.00%, 11/20/42(5) | | 5,535 | 90,988 |
| Series 2017-104, Class SD, 0.77%, (6.086% - 1 mo. SOFR), 7/20/47(2) | | 2,163 | 199,043 |
| Series 2017-121, Class DS, 0.00%, (4.386% - 1 mo. SOFR, Floor 0.00%), 8/20/47(2) | | 2,393 | 67,080 |
| Series 2018-127, Class SG, 0.82%, (6.136% - 1 mo. SOFR), 9/20/48(2) | | 5,768 | 406,906 |
| Series 2019-27, Class SA, 0.62%, (5.936% - 1 mo. SOFR), 2/20/49(2) | | 1,979 | 160,045 |
| Series 2019-38, Class SQ, 0.62%, (5.936% - 1 mo. SOFR), 3/20/49(2) | | 6,014 | 457,924 |
| Series 2019-43, Class BS, 0.62%, (5.936% - 1 mo. SOFR), 4/20/49(2) | | 3,233 | 264,610 |
| Series 2020-97, Class MI, 2.50%, 3/20/50 | | 5,259 | 662,620 |
| Series 2020-116, Class MI, 2.00%, 8/20/50 | | 485 | 62,093 |
| Series 2020-134, Class IM, 2.50%, 9/20/50 | | 14,013 | 1,854,554 |
| Series 2020-146, Class IQ, 2.00%, 10/20/50 | | 131,501 | 15,257,298 |
| Series 2020-146, Class QI, 2.00%, 10/20/50 | | 39,100 | 4,472,891 |
| Series 2020-151, Class AI, 2.00%, 10/20/50 | | 82,610 | 9,807,803 |
| Series 2020-162, Class BI, 2.00%, 10/20/50 | | 18,791 | 2,238,944 |
| Series 2020-167, Class KI, 2.00%, 11/20/50 | | 81,816 | 9,469,911 |
| Series 2020-167, Class YI, 2.00%, 11/20/50 | | 99,687 | 11,595,761 |
| Series 2020-173, Class DI, 2.00%, 11/20/50 | | 81,942 | 9,700,058 |
| Series 2020-176, Class AI, 2.00%, 11/20/50 | | 27,696 | 3,096,815 |
| Series 2020-176, Class HI, 2.50%, 11/20/50 | | 19,066 | 2,526,905 |
| Series 2020-181, Class TI, 2.00%, 12/20/50 | | 80,334 | 9,085,682 |
| Series 2020-185, Class BI, 2.00%, 12/20/50 | | 16,090 | 1,958,551 |
| Series 2021-9, Class GI, 2.00%, 1/20/51 | | 39,444 | 4,505,012 |
| Series 2021-15, Class AI, 2.00%, 1/20/51 | | 21,521 | 2,559,366 |
| Series 2021-23, Class TI, 2.50%, 2/20/51 | | 10,936 | 1,399,684 |
| Series 2021-30, Class AI, 2.00%, 2/20/51 | | 9,173 | 1,077,735 |
| Series 2021-46, Class IM, 2.50%, 3/20/51 | | 4,474 | 580,943 |
| Series 2021-56, Class SD, 0.00%, (2.30% - 30-day SOFR Average, Floor 0.00%), 9/20/50(2) | | 14,135 | 126,499 |
| Series 2021-56, Class SE, 0.00%, (2.30% - 30-day SOFR Average, Floor 0.00%), 10/20/50(2) | | 5,199 | 47,094 |
| Series 2021-77, Class SB, 0.00%, (3.636% - 1 mo. SOFR, Floor 0.00%), 5/20/51(2) | | 15,682 | 280,801 |
| Series 2021-77, Class SE, 0.00%, (3.636% - 1 mo. SOFR, Floor 0.00%), 5/20/51(2) | | 9,581 | 166,900 |
| Security | Principal
Amount
(000's omitted) | Value |
| Interest Only: (continued) | | | |
| Series 2021-97, Class IG, 2.50%, 8/20/49 | $ | 71,505 | $ 8,146,402 |
| Series 2021-97, Class QI, 3.00%, 6/20/51 | | 15,759 | 2,560,733 |
| Series 2021-98, Class EI, 3.00%, 6/20/51 | | 30,964 | 4,723,478 |
| Series 2021-114, Class MI, 3.00%, 6/20/51 | | 11,514 | 1,862,231 |
| Series 2021-122, Class NI, 3.00%, 7/20/51 | | 7,897 | 1,283,115 |
| Series 2021-125, Class SA, 0.00%, (3.636% - 1 mo. SOFR, Floor 0.00%), 7/20/51(2) | | 18,747 | 374,293 |
| Series 2021-131, Class QI, 3.00%, 7/20/51 | | 29,714 | 3,921,134 |
| Series 2021-140, Class YS, 0.00%, (1.586% - 1 mo. SOFR, Floor 0.00%), 8/20/51(2) | | 20,990 | 107,527 |
| Series 2021-160, Class DI, 3.00%, 9/20/51 | | 28,167 | 4,332,413 |
| Series 2021-160, Class IT, 2.50%, 9/20/51 | | 40,149 | 4,264,779 |
| Series 2021-175, Class AS, 0.00%, (1.686% - 1 mo. SOFR, Floor 0.00%), 10/20/51(2) | | 41,967 | 226,217 |
| Series 2021-175, Class SB, 0.00%, (1.686% - 1 mo. SOFR, Floor 0.00%), 10/20/51(2) | | 21,223 | 113,773 |
| Series 2021-193, Class IU, 3.00%, 11/20/49 | | 62,354 | 8,670,033 |
| Series 2021-193, Class YS, 0.00%, (2.45% - 30-day SOFR Average, Floor 0.00%), 11/20/51(2) | | 48,664 | 303,664 |
| Series 2021-196, Class GI, 3.00%, 11/20/51 | | 30,040 | 4,775,108 |
| Series 2021-201, Class PI, 3.00%, 11/20/51 | | 25,462 | 2,949,168 |
| Series 2021-209, Class IW, 3.00%, 11/20/51 | | 16,296 | 2,159,789 |
| Series 2022-104, Class IO, 2.50%, 6/20/51 | | 25,053 | 3,428,838 |
| Series 2022-119, Class CS, 0.00%, (3.00% - 30-day SOFR Average, Floor 0.00%), 7/20/52(2) | | 199,511 | 1,137,031 |
| Series 2022-119, Class SC, 0.00%, (3.00% - 30-day SOFR Average, Floor 0.00%), 7/20/52(2) | | 22,168 | 126,337 |
| Series 2022-126, Class AS, 0.00%, (3.69% - 30-day SOFR Average, Floor 0.00%), 7/20/52(2) | | 59,494 | 641,578 |
| Series 2022-126, Class SC, 0.00%, (3.73% - 30-day SOFR Average, Floor 0.00%), 7/20/52(2) | | 44,336 | 496,870 |
| Series 2022-135, Class SA, 0.00%, (3.00% - 30-day SOFR Average, Floor 0.00%), 6/20/52(2) | | 124,863 | 779,809 |
| Series 2023-13, Class SA, 0.07%, (5.40% - 30-day SOFR Average), 1/20/53(2) | | 14,168 | 339,616 |
| Series 2023-19, Class SD, 0.97%, (6.30% - 30-day SOFR Average), 2/20/53(2) | | 18,121 | 862,243 |
| Series 2023-20, Class HS, 0.97%, (6.30% - 30-day SOFR Average), 2/20/53(2) | | 12,655 | 595,031 |
| Series 2023-22, Class ES, 0.97%, (6.30% - 30-day SOFR Average), 2/20/53(2) | | 16,873 | 793,375 |
| Series 2023-22, Class SA, 0.37%, (5.70% - 30-day SOFR Average), 2/20/53(2) | | 24,843 | 748,177 |
| Series 2023-24, Class SB, 0.00%, (5.15% - 30-day SOFR Average, Floor 0.00%), 2/20/53(2) | | 33,746 | 720,393 |
10
See Notes to Financial Statements.
Eaton Vance
Short Duration Government Income Fund
April 30, 2024
Portfolio of Investments (Unaudited) — continued
| Security | Principal
Amount
(000's omitted) | Value |
| Interest Only: (continued) | | | |
| Series 2023-24, Class SG, 0.97%, (6.30% - 30-day SOFR Average), 2/20/53(2) | $ | 16,873 | $ 793,375 |
| Series 2023-32, Class SA, 0.97%, (6.30% - 30-day SOFR Average), 2/20/53(2) | | 56,946 | 2,677,641 |
| Series 2023-38, Class LS, 0.97%, (6.30% - 30-day SOFR Average), 3/20/53(2) | | 25,498 | 1,194,348 |
| Series 2023-47, Class HS, 0.97%, (6.30% - 30-day SOFR Average), 3/20/53(2) | | 8,499 | 398,116 |
| Series 2023-47, Class SC, 0.92%, (6.25% - 30-day SOFR Average), 3/20/53(2) | | 12,728 | 582,149 |
| Series 2023-53, Class SK, 0.87%, (6.20% - 30-day SOFR Average), 4/20/53(2) | | 32,693 | 1,628,635 |
| Series 2023-65, Class BS, 0.82%, (6.15% - 30-day SOFR Average), 5/20/53(2) | | 30,271 | 1,577,887 |
| Series 2024-64, Class EI, 6.50%, 4/20/64 | | 13,000 | 1,936,701 |
| Principal Only:(4) | | | |
| Series 2009-117, Class PO, 0.00%, 12/16/39 | | 703 | 524,654 |
| Series 2010-88, Class OA, 0.00%, 7/20/40 | | 470 | 339,929 |
| Series 2015-24, Class KO, 0.00%, 6/20/35 | | 501 | 437,199 |
Total Collateralized Mortgage Obligations
(identified cost $1,648,064,164) | | | $1,320,290,867 |
| U.S. Department of Agriculture Loans — 0.4% |
| Security | Principal
Amount
(000's omitted) | Value |
| USDA Guaranteed Loans, 8.00%, (U.S. (Fed) Prime Rate - 0.50%), 7/1/27(1) | $ | 10,498 | $ 10,501,518 |
Total U.S. Department of Agriculture Loans
(identified cost $10,498,044) | | | $ 10,501,518 |
| U.S. Government Agency Commercial Mortgage-Backed Securities — 0.6% |
| Security | Principal
Amount
(000's omitted) | Value |
| FRESB Mortgage Trust: | | | |
| Interest Only:(3) | | | |
| Series 2021-SB91, Class X1, 0.681%, 8/25/41(5) | $ | 45,305 | $ 1,199,832 |
| Series 2021-SB92, Class X1, 0.682%, 8/25/41(5) | | 23,362 | 495,215 |
| Government National Mortgage Association: | | | |
| Interest Only:(3) | | | |
| Series 2021-101, Class IO, 0.677%, 4/16/63(5) | | 53,055 | 2,748,703 |
| Series 2021-132, Class IO, 0.726%, 4/16/63(5) | | 57,283 | 3,107,088 |
| Series 2021-144, Class IO, 0.825%, 4/16/63(5) | | 51,052 | 3,071,319 |
| Series 2021-186, Class IO, 0.764%, 5/16/63(5) | | 47,132 | 2,644,777 |
| Security | Principal
Amount
(000's omitted) | Value |
| Interest Only: (continued) | | | |
| Series 2022-3, Class IO, 0.64%, 2/16/61(5) | $ | 67,077 | $ 3,262,632 |
Total U.S. Government Agency Commercial Mortgage-Backed Securities
(identified cost $21,478,242) | | | $ 16,529,566 |
| U.S. Government Agency Mortgage-Backed Securities — 84.5% |
| Security | Principal
Amount
(000's omitted) | Value |
| Federal Home Loan Mortgage Corp.: | | | |
| 4.173%, (5 yr. CMT + 2.515%), with maturity at 2032(7) | $ | 96 | $ 94,824 |
| 4.397%, (COF + 1.25%), with maturity at 2025(7) | | 13 | 13,139 |
| 4.401%, (COF + 1.254%), with maturity at 2029(7) | | 5 | 4,443 |
| 4.42%, (COF + 1.295%), with maturity at 2034(7) | | 3 | 3,176 |
| 4.462%, (COF + 1.254%), with maturity at 2035(7) | | 113 | 110,109 |
| 4.50%, with maturity at 2035 | | 253 | 241,738 |
| 4.652%, (COF + 1.252%), with maturity at 2032(7) | | 72 | 70,376 |
| 4.745%, (COF + 1.251%), with maturity at 2030(7) | | 99 | 96,415 |
| 5.00%, with maturity at 2052 | | 5,009 | 4,709,326 |
| 5.207%, (COF + 2.275%), with maturity at 2025(7) | | 25 | 24,969 |
| 5.439%, (COF + 2.292%), with maturity at 2037(7) | | 304 | 301,189 |
| 5.50%, with various maturities to 2053 | | 134,522 | 130,970,060 |
| 5.553%, (1 yr. CMT + 1.975%), with maturity at 2034(7) | | 457 | 459,502 |
| 5.604%, (30-day SOFR Average + 2.37%), with maturity at 2052(7) | | 671 | 659,690 |
| 5.991%, (1 yr. CMT + 2.238%), with maturity at 2036(7) | | 367 | 370,758 |
| 6.00%, with various maturities to 2053 | | 10,569 | 10,535,061 |
| 6.02%, (1 yr. CMT + 2.253%), with maturity at 2035(7) | | 1,046 | 1,054,910 |
| 6.21%, (1 yr. CMT + 2.249%), with maturity at 2038(7) | | 326 | 328,617 |
| 6.297%, (1 yr. CMT + 2.308%), with maturity at 2036(7) | | 414 | 417,734 |
| 7.00%, with maturity at 2033 | | 37 | 37,239 |
| Federal National Mortgage Association: | | | |
| 3.00%, with various maturities to 2050 | | 16,212 | 13,623,406 |
| 4.397%, (COF + 1.254%), with maturity at 2033(7) | | 130 | 127,721 |
| 4.401%, (COF + 1.254%), with various maturities to 2034(7) | | 98 | 94,831 |
11
See Notes to Financial Statements.
Eaton Vance
Short Duration Government Income Fund
April 30, 2024
Portfolio of Investments (Unaudited) — continued
| Security | Principal
Amount
(000's omitted) | Value |
| Federal National Mortgage Association: (continued) | | | |
| 4.41%, (COF + 1.25%), with various maturities to 2027(7) | $ | 54 | $ 53,134 |
| 4.414%, (COF + 1.254%), with maturity at 2034(7) | | 138 | 133,554 |
| 4.428%, (COF + 1.254%), with maturity at 2034(7) | | 63 | 61,448 |
| 4.437%, (COF + 1.254%), with maturity at 2035(7) | | 26 | 25,212 |
| 4.50%, with maturity at 2052 | | 919 | 848,592 |
| 4.581%, (COF + 1.26%), with maturity at 2036(7) | | 89 | 86,390 |
| 4.678%, (COF + 1.497%), with maturity at 2029(7) | | 137 | 136,525 |
| 4.698%, (COF + 1.315%), with maturity at 2036(7) | | 48 | 46,531 |
| 4.705%, (COF + 1.258%), with maturity at 2036(7) | | 22 | 21,582 |
| 4.855%, (COF + 1.695%), with maturity at 2029(7) | | 0 (6) | 313 |
| 4.96%, (COF + 1.80%), with maturity at 2034(7) | | 133 | 129,845 |
| 5.00%, with various maturities to 2048 | | 1,042 | 985,275 |
| 5.05%, (COF + 1.738%), with maturity at 2035(7) | | 163 | 159,530 |
| 5.06%, (COF + 1.249%), with maturity at 2037(7) | | 40 | 39,478 |
| 5.171%, (COF + 1.268%), with maturity at 2038(7) | | 5 | 4,791 |
| 5.173%, (COF + 1.853%), with maturity at 2034(7) | | 26 | 25,530 |
| 5.224%, (COF + 1.791%), with maturity at 2035(7) | | 123 | 120,177 |
| 5.30%, (COF + 2.321%), with maturity at 2026(7) | | 19 | 18,739 |
| 5.382%, (COF + 1.811%), with maturity at 2036(7) | | 266 | 260,215 |
| 5.50%, with various maturities to 2052 | | 70,751 | 68,840,442 |
| 5.713%, (COF + 1.741%), with maturity at 2034(7) | | 39 | 39,092 |
| 6.00%, with various maturities to 2053 | | 15,502 | 15,522,364 |
| 6.056%, (1 yr. CMT + 2.056%), with maturity at 2033(7) | | 153 | 154,430 |
| 6.09%, (1 yr. CMT + 2.156%), with maturity at 2036(7) | | 124 | 125,370 |
| 6.215%, (1 yr. CMT + 2.12%), with maturity at 2037(7) | | 339 | 343,257 |
| 6.225%, (1 yr. RFUCCT + 1.75%), with maturity at 2035(7) | | 303 | 308,106 |
| 6.234%, (1 yr. CMT + 2.091%), with maturity at 2040(7) | | 155 | 156,248 |
| 6.265%, (1 yr. CMT + 2.247%), with maturity at 2033(7) | | 869 | 879,944 |
| 6.307%, (1 yr. CMT + 2.213%), with maturity at 2031(7) | | 30 | 30,010 |
| Security | Principal
Amount
(000's omitted) | Value |
| Federal National Mortgage Association: (continued) | | | |
| 6.339%, (1 yr. CMT + 2.206%), with maturity at 2039(7) | $ | 713 | $ 721,524 |
| 6.35%, (COF + 2.004%), with maturity at 2032(7) | | 21 | 21,778 |
| 6.50%, with various maturities to 2053 | | 6,457 | 6,551,342 |
| 6.678%, (1 yr. CMT + 2.556%), with maturity at 2038(7) | | 337 | 342,689 |
| 7.175%, (1 yr. RFUCCT + 1.80%), with maturity at 2034(7) | | 105 | 106,749 |
| Government National Mortgage Association: | | | |
| 2.50%, with maturity at 2051 | | 2,037 | 1,650,557 |
| 3.75%, (1 yr. CMT + 1.50%), with maturity at 2027(7) | | 31 | 30,001 |
| 4.00%, (1 yr. CMT + 1.50%), with maturity at 2026(7) | | 23 | 22,797 |
| 4.00%, with various maturities to 2052 | | 9,523 | 8,621,726 |
| 4.50%, 30-Year, TBA(8) | | 37,100 | 34,574,299 |
| 4.50%, with various maturities to 2052 | | 238,270 | 219,677,283 |
| 5.00%, with various maturities to 2052 | | 88,447 | 84,949,572 |
| 5.50%, with various maturities to 2062 | | 110,998 | 109,736,665 |
| 5.50%, 30-Year, TBA(8) | | 242,575 | 237,532,290 |
| 6.00%, with various maturities to 2063 | | 109,947 | 111,468,562 |
| 6.00%, 30-Year, TBA(8) | | 243,475 | 243,020,274 |
| 6.50%, with various maturities to 2063 | | 72,259 | 73,572,503 |
| 6.50%, 30-Year, TBA(8) | | 151,400 | 152,918,459 |
| 7.00%, with various maturities to 2062 | | 19,352 | 19,870,848 |
| 7.50%, with maturity at 2054 | | 2,200 | 2,218,294 |
| Uniform Mortgage-Backed Security: | | | |
| 4.50%, 30-Year, TBA(8) | | 282,400 | 260,381,639 |
| 5.50%, 30-Year, TBA(8) | | 133,400 | 129,569,959 |
| 6.00%, 30-Year, TBA(8) | | 200,000 | 198,289,070 |
Total U.S. Government Agency Mortgage-Backed Securities
(identified cost $2,194,161,110) | | | $2,149,754,237 |
| U.S. Government Guaranteed Small Business Administration Pools & Loans — 3.4% |
| Security | Principal
Amount
(000's omitted) | Value |
| 6.25%, (U.S. (Fed) Prime Rate - 2.25%), 1/25/44 to 2/25/44(1) | $ | 30,321 | $ 30,746,572 |
| 6.30%, (U.S. (Fed) Prime Rate - 2.20%), 4/25/44(1) | | 14,958 | 15,204,150 |
| 7.50%, (U.S. (Fed) Prime Rate - 1.00%), 4/25/44(1) | | 14,080 | 14,655,905 |
| 7.825%, (U.S. (Fed) Prime Rate - 0.675%), 2/25/44(1) | | 14,043 | 14,721,228 |
12
See Notes to Financial Statements.
Eaton Vance
Short Duration Government Income Fund
April 30, 2024
Portfolio of Investments (Unaudited) — continued
| Security | Principal
Amount
(000's omitted) | Value |
| SBA IO Trust: | | | |
| Interest Only:(9)(10)(11) | | | |
| Series 2018-5, Class A, 2.071%, 6/27/44 | $ | 63,702 | $ 2,548,365 |
| Series 2019-1, Class A, 2.454%, 9/25/45 | | 185,486 | 9,774,315 |
Total U.S. Government Guaranteed Small Business Administration Pools & Loans
(identified cost $115,172,926) | | | $ 87,650,535 |
| Short-Term Investments — 5.3% |
| Security | Shares | Value |
| Morgan Stanley Institutional Liquidity Funds - Government Portfolio, Institutional Class, 5.22%(12) | | 135,251,894 | $ 135,251,894 |
Total Short-Term Investments
(identified cost $135,251,894) | | | $ 135,251,894 |
Total Investments — 146.1%
(identified cost $4,124,626,380) | | | $3,719,978,617 |
| TBA Sale Commitments — (21.4)% |
| U.S. Government Agency Mortgage-Backed Securities — (21.4)% |
| Security | Principal
Amount
(000's omitted) | Value |
| Government National Mortgage Association, 4.00%, 30-Year, TBA(8) | | $ (9,550) | $ (8,657,613) |
| Uniform Mortgage-Backed Security: | | | |
| 3.00%, 30-Year, TBA(8) | | (17,150) | (14,173,537) |
| 4.50%, 30-Year, TBA(8) | | (282,400) | (260,381,639) |
| 4.50%, 30-Year, TBA(8) | | (282,400) | (260,458,847) |
Total U.S. Government Agency Mortgage-Backed Securities
(proceeds $550,976,477) | | | $ (543,671,636) |
Total TBA Sale Commitments
(proceeds $550,976,477) | | | $ (543,671,636) |
| Other Assets, Less Liabilities — (24.7)% | | | $ (630,940,116) |
| Net Assets — 100.0% | | | $2,545,366,865 |
| The percentage shown for each investment category in the Portfolio of Investments is based on net assets. |
| (1) | Variable rate security. The stated interest rate represents the rate in effect at April 30, 2024. |
| (2) | Inverse floating-rate security whose coupon varies inversely with changes in the interest rate index. The stated interest rate represents the coupon rate in effect at April 30, 2024. |
| (3) | Interest only security that entitles the holder to receive only interest payments on the underlying mortgages. Principal amount shown is the notional amount of the underlying mortgages on which coupon interest is calculated. |
| (4) | Principal only security that entitles the holder to receive only principal payments on the underlying mortgages. |
| (5) | Weighted average fixed-rate coupon that changes/updates monthly. Rate shown is the rate at April 30, 2024. |
| (6) | Principal amount is less than $500. |
| (7) | Adjustable rate mortgage security whose interest rate generally adjusts monthly based on a weighted average of interest rates on the underlying mortgages. The coupon rate may not reflect the applicable index value as interest rates on the underlying mortgages may adjust on various dates and at various intervals and may be subject to lifetime ceilings and lifetime floors and lookback periods. Rate shown is the coupon rate at April 30, 2024. |
| (8) | TBA (To Be Announced) securities are purchased or sold on a forward commitment basis with an approximate principal amount and maturity date. The actual principal amount, which is not expected to differ significantly from the commitment amount, and maturity date are determined upon settlement. |
| (9) | Interest only security that entitles the holder to receive only a portion of the interest payments on the underlying loans. Principal amount shown is the notional amount of the underlying loans on which coupon interest is calculated. |
| (10) | Security exempt from registration under Rule 144A of the Securities Act of 1933, as amended. These securities may be sold in certain transactions in reliance on an exemption from registration (normally to qualified institutional buyers). At April 30, 2024, the aggregate value of these securities is $12,322,680 or 0.5% of the Fund's net assets. |
| (11) | The stated interest rate represents the weighted average fixed interest rate at April 30, 2024 of all interest only securities comprising the trust. |
| (12) | May be deemed to be an affiliated investment company. The rate shown is the annualized seven-day yield as of April 30, 2024. |
13
See Notes to Financial Statements.
Eaton Vance
Short Duration Government Income Fund
April 30, 2024
Portfolio of Investments (Unaudited) — continued
| Futures Contracts |
| Description | Number of
Contracts | Position | Expiration
Date | Notional
Amount | Value/Unrealized
Appreciation
(Depreciation) |
| Interest Rate Futures | | | | | |
| U.S. 5-Year Treasury Note | 8,197 | Long | 6/28/24 | $858,571,715 | $ (16,138,745) |
| U.S. Ultra-Long Treasury Bond | (358) | Short | 6/18/24 | (42,803,375) | 2,653,475 |
| | | | | | $ (13,485,270) |
| Interest Rate Swaps (Centrally Cleared) |
Notional Amount
(000's omitted) | Fund
Pays/
Receives
Floating
Rate | Floating Rate | Annual
Fixed Rate | Termination
Date | Value | Unamortized
Upfront
Receipts
(Payments) | Unrealized
Appreciation
(Depreciation) |
| USD | 450,000 | Receives | SOFR
(pays annually) | 3.07%
(pays annually) | 10/14/32 | $ 45,760,615 | $ — | $ 45,760,615 |
| USD | 125,000 | Receives | SOFR
(pays annually) | 2.47%
(pays annually) | 3/28/33 | 17,359,186 | (2,425,951) | 14,933,235 |
| USD | 245,000 | Receives | SOFR
(pays quarterly) | 2.01%
(pays semi-annually) | 2/16/52 | 95,412,669 | — | 95,412,669 |
| USD | 300,000 | Receives | SOFR
(pays annually) | 1.92%
(pays annually) | 4/8/52 | 107,661,327 | — | 107,661,327 |
| Total | | | | | | $266,193,797 | $(2,425,951) | $263,767,846 |
| Abbreviations: |
| CMT | – Constant Maturity Treasury |
| COF | – Cost of Funds 11th District |
| RFUCCT | – FTSE USD IBOR Consumer Cash Fallbacks Term |
| SOFR | – Secured Overnight Financing Rate |
| TBA | – To Be Announced |
| Currency Abbreviations: |
| USD | – United States Dollar |
14
See Notes to Financial Statements.
Eaton Vance
Short Duration Government Income Fund
April 30, 2024
Statement of Assets and Liabilities (Unaudited)
| | April 30, 2024 |
| Assets | |
| Unaffiliated investments, at value (identified cost $3,989,374,486) | $ 3,584,726,723 |
| Affiliated investments, at value (identified cost $135,251,894) | 135,251,894 |
| Cash | 1,799,938 |
| Deposits for forward commitment securities | 6,002,000 |
| Deposits for derivatives collateral: | |
| Futures contracts | 10,091,235 |
| Centrally cleared swap contracts | 57,893,442 |
| Interest receivable | 18,344,933 |
| Dividends receivable from affiliated investments | 298,363 |
| Receivable for investments sold | 2,331,339,864 |
| Receivable for TBA sale commitments | 550,976,477 |
| Receivable for Fund shares sold | 5,891,989 |
| Receivable for variation margin on open centrally cleared swap contracts | 8,243,299 |
| Trustees' deferred compensation plan | 104,399 |
| Total assets | $6,710,964,556 |
| Liabilities | |
| Payable for forward commitment securities | $ 3,603,288,202 |
| TBA sale commitments, at value (proceeds receivable $550,976,477) | 543,671,636 |
| Payable for closed written swaptions | 4,559 |
| Payable for Fund shares redeemed | 12,201,787 |
| Payable for variation margin on open futures contracts | 2,512,485 |
| Distributions payable | 1,302,073 |
| Payable to affiliates: | |
| Investment adviser fee | 1,014,443 |
| Distribution and service fees | 122,559 |
| Trustees' fees | 9,223 |
| Trustees' deferred compensation plan | 104,399 |
| Other | 20,573 |
| Accrued expenses | 1,345,752 |
| Total liabilities | $4,165,597,691 |
| Net Assets | $2,545,366,865 |
| Sources of Net Assets | |
| Paid-in capital | $ 3,367,263,077 |
| Accumulated loss | (821,896,212) |
| Net Assets | $2,545,366,865 |
| Advisers Class Shares | |
| Net Assets | $ 51,902,179 |
| Shares Outstanding | 7,295,417 |
Net Asset Value, Offering Price and Redemption Price Per Share
(net assets ÷ shares of beneficial interest outstanding) | $ 7.11 |
| Class A Shares | |
| Net Assets | $ 410,636,712 |
| Shares Outstanding | 57,680,364 |
Net Asset Value and Redemption Price Per Share
(net assets ÷ shares of beneficial interest outstanding) | $ 7.12 |
Maximum Offering Price Per Share
(100 ÷ 97.75 of net asset value per share) | $ 7.28 |
15
See Notes to Financial Statements.
Eaton Vance
Short Duration Government Income Fund
April 30, 2024
Statement of Assets and Liabilities (Unaudited) — continued
| | April 30, 2024 |
| Class C Shares | |
| Net Assets | $ 37,983,865 |
| Shares Outstanding | 5,327,714 |
Net Asset Value and Offering Price Per Share*
(net assets ÷ shares of beneficial interest outstanding) | $ 7.13 |
| Class I Shares | |
| Net Assets | $2,044,844,109 |
| Shares Outstanding | 287,558,881 |
Net Asset Value, Offering Price and Redemption Price Per Share
(net assets ÷ shares of beneficial interest outstanding) | $ 7.11 |
| | On sales of $100,000 or more, the offering price of Class A shares is reduced. |
| * | Redemption price per share is equal to the net asset value less any applicable contingent deferred sales charge. |
16
See Notes to Financial Statements.
Eaton Vance
Short Duration Government Income Fund
April 30, 2024
Statement of Operations (Unaudited)
| | Six Months Ended |
| | April 30, 2024 |
| Investment Income | |
| Dividend income from affiliated investments | $ 1,057,456 |
| Interest income | 74,643,094 |
| Total investment income | $ 75,700,550 |
| Expenses | |
| Investment adviser fee | $ 6,540,118 |
| Distribution and service fees: | |
| Advisers Class | 72,895 |
| Class A | 539,334 |
| Class C | 177,276 |
| Trustees’ fees and expenses | 54,250 |
| Custodian fee | 303,739 |
| Transfer and dividend disbursing agent fees | 752,808 |
| Legal and accounting services | 221,625 |
| Printing and postage | 243,902 |
| Registration fees | 84,462 |
| Interest expense and fees | 10,039,520 |
| Miscellaneous | 94,595 |
| Total expenses | $ 19,124,524 |
| Deduct: | |
| Waiver and/or reimbursement of expenses by affiliates | $ 35,847 |
| Total expense reductions | $ 35,847 |
| Net expenses | $ 19,088,677 |
| Net investment income | $ 56,611,873 |
| Realized and Unrealized Gain (Loss) | |
| Net realized gain (loss): | |
| Investment transactions | $ (56,075,196) |
| Written swaptions | 3,733,831 |
| Futures contracts | (15,727,671) |
| Swap contracts | 73,266,064 |
| Net realized gain | $ 5,197,028 |
| Change in unrealized appreciation (depreciation): | |
| Investments | $ 140,816,696 |
| Written swaptions | (3,521,981) |
| TBA sale commitments | 3,539,852 |
| Futures contracts | (12,685,754) |
| Swap contracts | (109,760,365) |
| Net change in unrealized appreciation (depreciation) | $ 18,388,448 |
| Net realized and unrealized gain | $ 23,585,476 |
| Net increase in net assets from operations | $ 80,197,349 |
17
See Notes to Financial Statements.
Eaton Vance
Short Duration Government Income Fund
April 30, 2024
Statements of Changes in Net Assets
| | Six Months Ended
April 30, 2024
(Unaudited) | Year Ended
October 31, 2023 |
| Increase (Decrease) in Net Assets | | |
| From operations: | | |
| Net investment income | $ 56,611,873 | $ 192,384,401 |
| Net realized gain (loss) | 5,197,028 | (190,223,674) |
| Net change in unrealized appreciation (depreciation) | 18,388,448 | (16,863,523) |
| Net increase (decrease) in net assets from operations | $ 80,197,349 | $ (14,702,796) |
| Distributions to shareholders: | | |
| Advisers Class | $ (1,946,688) | $ (6,572,022) |
| Class A | (14,344,716) | (33,037,453) |
| Class C | (1,260,125) | (2,536,047) |
| Class I | (75,143,836) | (190,816,660) |
| Total distributions to shareholders | $ (92,695,365) | $ (232,962,182) |
| Transactions in shares of beneficial interest: | | |
| Advisers Class | $ (20,304,015) | $ (121,675,168) |
| Class A | (52,873,477) | (377,404,758) |
| Class C | (8,047,798) | (22,733,550) |
| Class I | (410,104,881) | (2,072,888,856) |
| Net decrease in net assets from Fund share transactions | $ (491,330,171) | $(2,594,702,332) |
| Net decrease in net assets | $ (503,828,187) | $(2,842,367,310) |
| Net Assets | | |
| At beginning of period | $ 3,049,195,052 | $ 5,891,562,362 |
| At end of period | $2,545,366,865 | $ 3,049,195,052 |
18
See Notes to Financial Statements.
Eaton Vance
Short Duration Government Income Fund
April 30, 2024
| | Advisers Class |
| | Six Months Ended
April 30, 2024
(Unaudited) | Year Ended October 31, | Period Ended
October 31, |
| | 2023 | 2022 | 2021 (1) |
| Net asset value — Beginning of period | $ 7.170 | $ 7.610 | $ 7.990 | $ 8.100 |
| Income (Loss) From Operations | | | | |
| Net investment income(2) | $ 0.144 | $ 0.304 | $ 0.133 | $ 0.033 |
| Net realized and unrealized gain (loss) | 0.035 | (0.371) | (0.349) | (0.089) |
| Total income (loss) from operations | $ 0.179 | $ (0.067) | $ (0.216) | $ (0.056) |
| Less Distributions | | | | |
| From net investment income | $ (0.239) | $ (0.373) | $ (0.147) | $ (0.051) |
| Tax return of capital | — | — | (0.017) | (0.003) |
| Total distributions | $ (0.239) | $ (0.373) | $ (0.164) | $ (0.054) |
| Net asset value — End of period | $ 7.110 | $ 7.170 | $ 7.610 | $ 7.990 |
| Total Return(3) | 2.61% (4)(5) | (0.92)% | (2.73)% | (0.70)% (4) |
| Ratios/Supplemental Data | | | | |
| Net assets, end of period (000’s omitted) | $51,902 | $72,272 | $201,056 | $276,067 |
| Ratios (as a percentage of average daily net assets): | | | | |
| Expenses | 1.60% (5)(6)(7)(8) | 1.02% (7)(8) | 0.79% (7)(8) | 0.75% (6) |
| Net investment income | 3.99% (6) | 4.08% | 1.69% | 0.90% (6) |
| Portfolio Turnover | 385% (4)(9) | 711% (9) | 798% (9) | 310% (9)(10) |
| (1) | For the period from the commencement of operations, May 17, 2021, to October 31, 2021. |
| (2) | Computed using average shares outstanding. |
| (3) | Returns are historical and are calculated by determining the percentage change in net asset value with all distributions reinvested. |
| (4) | Not annualized. |
| (5) | The investment adviser reimbursed certain operating expenses (equal to less than 0.005% of average daily net assets for the six months ended April 30, 2024). Absent this reimbursement, total return would be lower. |
| (6) | Annualized. |
| (7) | Includes a reduction by the investment adviser of a portion of its adviser fee due to the Fund’s investment in the Liquidity Fund (equal to less than 0.005%, less than 0.005% and less than 0.01% of average daily net assets for the six months ended April 30, 2024 and the years ended October 31, 2023 and 2022, respectively). |
| (8) | Includes interest expense, including on reverse repurchase agreements, of 0.74%, 0.20% and 0.01% of average daily net assets for the six months ended April 30, 2024 and the years ended October 31, 2023 and 2022, respectively. |
| (9) | Includes the effect of To Be Announced (TBA) transactions. |
| (10) | For the year ended October 31, 2021. |
19
See Notes to Financial Statements.
Eaton Vance
Short Duration Government Income Fund
April 30, 2024
Financial Highlights — continued
| | Class A |
| | Six Months Ended
April 30, 2024
(Unaudited) | Year Ended October 31, |
| | 2023 | 2022 | 2021 | 2020 | 2019 |
| Net asset value — Beginning of period | $ 7.170 | $ 7.610 | $ 8.000 | $ 8.120 | $ 8.100 | $ 8.200 |
| Income (Loss) From Operations | | | | | | |
| Net investment income(1) | $ 0.144 | $ 0.304 | $ 0.127 | $ 0.072 | $ 0.097 | $ 0.202 |
| Net realized and unrealized gain (loss) | 0.046 | (0.370) | (0.353) | (0.072) | 0.104 | (0.057) |
| Total income (loss) from operations | $ 0.190 | $ (0.066) | $ (0.226) | $ 0.00 | $ 0.201 | $ 0.145 |
| Less Distributions | | | | | | |
| From net investment income | $ (0.240) | $ (0.374) | $ (0.147) | $ (0.114) | $ (0.166) | $ (0.245) |
| From net realized gain | — | — | — | — | (0.015) | — |
| Tax return of capital | — | — | (0.017) | (0.006) | — | — |
| Total distributions | $ (0.240) | $ (0.374) | $ (0.164) | $ (0.120) | $ (0.181) | $ (0.245) |
| Net asset value — End of period | $ 7.120 | $ 7.170 | $ 7.610 | $ 8.000 | $ 8.120 | $ 8.100 |
| Total Return(2) | 2.63% (3)(4) | (0.92)% | (2.85)% | (0.01)% | 2.51% | 1.78% |
| Ratios/Supplemental Data | | | | | | |
| Net assets, end of period (000’s omitted) | $410,637 | $465,670 | $879,760 | $2,018,166 | $1,764,637 | $795,015 |
| Ratios (as a percentage of average daily net assets): | | | | | | |
| Expenses | 1.60% (4)(5)(6)(7) | 1.02% (6)(7) | 0.79% (6)(7) | 0.77% | 0.82% (7) | 0.85% (7) |
| Net investment income | 3.99% (5) | 4.07% | 1.61% | 0.89% | 1.19% | 2.47% |
| Portfolio Turnover | 385% (3)(8) | 711% (8) | 798% (8) | 310% (8) | 152% (8) | 59% |
| (1) | Computed using average shares outstanding. |
| (2) | Returns are historical and are calculated by determining the percentage change in net asset value with all distributions reinvested and do not reflect the effect of sales charges. |
| (3) | Not annualized. |
| (4) | The investment adviser reimbursed certain operating expenses (equal to less than 0.005% of average daily net assets for the six months ended April 30, 2024). Absent this reimbursement, total return would be lower. |
| (5) | Annualized. |
| (6) | Includes a reduction by the investment adviser of a portion of its adviser fee due to the Fund’s investment in the Liquidity Fund (equal to less than 0.005%, less than 0.005% and less than 0.01% of average daily net assets for the six months ended April 30, 2024 and the years ended October 31, 2023 and 2022, respectively). |
| (7) | Includes interest expense, including on reverse repurchase agreements, of 0.74%, 0.20%, 0.01%, 0.02% and 0.02% of average daily net assets for the six months ended April 30, 2024 and the years ended October 31, 2023, 2022, 2020 and 2019, respectively. |
| (8) | Includes the effect of To Be Announced (TBA) transactions. |
20
See Notes to Financial Statements.
Eaton Vance
Short Duration Government Income Fund
April 30, 2024
Financial Highlights — continued
| | Class C |
| | Six Months Ended
April 30, 2024
(Unaudited) | Year Ended October 31, |
| | 2023 | 2022 | 2021 | 2020 | 2019 |
| Net asset value — Beginning of period | $ 7.180 | $ 7.620 | $ 8.010 | $ 8.130 | $ 8.110 | $ 8.210 |
| Income (Loss) From Operations | | | | | | |
| Net investment income(1) | $ 0.123 | $ 0.259 | $ 0.088 | $ 0.024 | $ 0.054 | $ 0.154 |
| Net realized and unrealized gain (loss) | 0.045 | (0.370) | (0.361) | (0.073) | 0.098 | (0.058) |
| Total income (loss) from operations | $ 0.168 | $ (0.111) | $ (0.273) | $ (0.049) | $ 0.152 | $ 0.096 |
| Less Distributions | | | | | | |
| From net investment income | $ (0.218) | $ (0.329) | $ (0.104) | $ (0.067) | $ (0.117) | $ (0.196) |
| From net realized gain | — | — | — | — | (0.015) | — |
| Tax return of capital | — | — | (0.013) | (0.004) | — | — |
| Total distributions | $ (0.218) | $ (0.329) | $ (0.117) | $ (0.071) | $ (0.132) | $ (0.196) |
| Net asset value — End of period | $ 7.130 | $ 7.180 | $ 7.620 | $ 8.010 | $ 8.130 | $ 8.110 |
| Total Return(2) | 2.31% (3)(4) | (1.51)% | (3.43)% | (0.60)% | 1.89% | 1.18% |
| Ratios/Supplemental Data | | | | | | |
| Net assets, end of period (000’s omitted) | $37,984 | $46,203 | $72,212 | $103,518 | $144,742 | $112,868 |
| Ratios (as a percentage of average daily net assets): | | | | | | |
| Expenses | 2.20% (4)(5)(6)(7) | 1.62% (6)(7) | 1.39% (6)(7) | 1.37% | 1.42% (7) | 1.45% (7) |
| Net investment income | 3.39% (5) | 3.47% | 1.11% | 0.30% | 0.67% | 1.88% |
| Portfolio Turnover | 385% (3)(8) | 711% (8) | 798% (8) | 310% (8) | 152% (8) | 59% |
| (1) | Computed using average shares outstanding. |
| (2) | Returns are historical and are calculated by determining the percentage change in net asset value with all distributions reinvested and do not reflect the effect of sales charges. |
| (3) | Not annualized. |
| (4) | The investment adviser reimbursed certain operating expenses (equal to less than 0.005% of average daily net assets for the six months ended April 30, 2024). Absent this reimbursement, total return would be lower. |
| (5) | Annualized. |
| (6) | Includes a reduction by the investment adviser of a portion of its adviser fee due to the Fund’s investment in the Liquidity Fund (equal to less than 0.005%, less than 0.005% and less than 0.01% of average daily net assets for the six months ended April 30, 2024 and the years ended October 31, 2023 and 2022, respectively). |
| (7) | Includes interest expense, including on reverse repurchase agreements, of 0.74%, 0.20%, 0.01%, 0.02% and 0.02% of average daily net assets for the six months ended April 30, 2024 and the years ended October 31, 2023, 2022, 2020 and 2019, respectively. |
| (8) | Includes the effect of To Be Announced (TBA) transactions. |
21
See Notes to Financial Statements.
Eaton Vance
Short Duration Government Income Fund
April 30, 2024
Financial Highlights — continued
| | Class I |
| | Six Months Ended
April 30, 2024
(Unaudited) | Year Ended October 31, |
| | 2023 | 2022 | 2021 | 2020 | 2019 |
| Net asset value — Beginning of period | $ 7.160 | $ 7.600 | $ 7.990 | $ 8.110 | $ 8.090 | $ 8.190 |
| Income (Loss) From Operations | | | | | | |
| Net investment income(1) | $ 0.153 | $ 0.322 | $ 0.153 | $ 0.093 | $ 0.118 | $ 0.223 |
| Net realized and unrealized gain (loss) | 0.045 | (0.370) | (0.359) | (0.073) | 0.103 | (0.058) |
| Total income (loss) from operations | $ 0.198 | $ (0.048) | $ (0.206) | $ 0.020 | $ 0.221 | $ 0.165 |
| Less Distributions | | | | | | |
| From net investment income | $ (0.248) | $ (0.392) | $ (0.165) | $ (0.133) | $ (0.186) | $ (0.265) |
| From net realized gain | — | — | — | — | (0.015) | — |
| Tax return of capital | — | — | (0.019) | (0.007) | — | — |
| Total distributions | $ (0.248) | $ (0.392) | $ (0.184) | $ (0.140) | $ (0.201) | $ (0.265) |
| Net asset value — End of period | $ 7.110 | $ 7.160 | $ 7.600 | $ 7.990 | $ 8.110 | $ 8.090 |
| Total Return(2) | 2.75% (3)(4) | (0.81)% | (2.49)% | 0.24% | 2.76% | 2.04% |
| Ratios/Supplemental Data | | | | | | |
| Net assets, end of period (000’s omitted) | $2,044,844 | $2,465,050 | $4,738,534 | $7,682,437 | $6,765,473 | $3,605,659 |
| Ratios (as a percentage of average daily net assets): | | | | | | |
| Expenses | 1.35% (4)(5)(6)(7) | 0.77% (6)(7) | 0.54% (6)(7) | 0.52% | 0.57% (7) | 0.60% (7) |
| Net investment income | 4.24% (5) | 4.32% | 1.94% | 1.15% | 1.46% | 2.73% |
| Portfolio Turnover | 385% (3)(8) | 711% (8) | 798% (8) | 310% (8) | 152% (8) | 59% |
| (1) | Computed using average shares outstanding. |
| (2) | Returns are historical and are calculated by determining the percentage change in net asset value with all distributions reinvested. |
| (3) | Not annualized. |
| (4) | The investment adviser reimbursed certain operating expenses (equal to less than 0.005% of average daily net assets for the six months ended April 30, 2024). Absent this reimbursement, total return would be lower. |
| (5) | Annualized. |
| (6) | Includes a reduction by the investment adviser of a portion of its adviser fee due to the Fund’s investment in the Liquidity Fund (equal to less than 0.005%, less than 0.005% and less than 0.01% of average daily net assets for the six months ended April 30, 2024 and the years ended October 31, 2023 and 2022, respectively). |
| (7) | Includes interest expense, including on reverse repurchase agreements, of 0.74%, 0.20%, 0.01%, 0.02% and 0.02% of average daily net assets for the six months ended April 30, 2024 and the years ended October 31, 2023, 2022, 2020 and 2019, respectively. |
| (8) | Includes the effect of To Be Announced (TBA) transactions. |
22
See Notes to Financial Statements.
Eaton Vance
Short Duration Government Income Fund
April 30, 2024
Notes to Financial Statements (Unaudited)
1 Significant Accounting Policies
Eaton Vance Short Duration Government Income Fund (the Fund) is a diversified series of Eaton Vance Mutual Funds Trust (the Trust). The Trust is a Massachusetts business trust registered under the Investment Company Act of 1940, as amended (the 1940 Act), as an open-end management investment company. The Fund’s investment objective is to seek total return. The Fund offers four classes of shares. Class A shares are generally sold subject to a sales charge imposed at time of purchase. Class C shares are sold at net asset value and are generally subject to a contingent deferred sales charge (see Note 5). Effective November 5, 2020, Class C shares automatically convert to Class A shares eight years after their purchase as described in the Fund’s prospectus. Advisers Class and Class I shares are sold at net asset value and are not subject to a sales charge. Each class represents a pro rata interest in the Fund, but votes separately on class-specific matters and (as noted below) is subject to different expenses. Realized and unrealized gains and losses are allocated daily to each class of shares based on the relative net assets of each class to the total net assets of the Fund. Net investment income, other than class-specific expenses, is allocated daily to each class of shares based upon the ratio of the value of each class’s paid shares to the total value of all paid shares. Each class of shares differs in its distribution plan and certain other class-specific expenses.
The following is a summary of significant accounting policies of the Fund. The policies are in conformity with accounting principles generally accepted in the United States of America (U.S. GAAP). The Fund is an investment company and follows accounting and reporting guidance in the Financial Accounting Standards Board (FASB) Accounting Standards Codification Topic 946.
A Investment Valuation—The following methodologies are used to determine the market value or fair value of investments.
Debt Obligations. Debt obligations are generally valued on the basis of valuations provided by third party pricing services, as derived from such services’ pricing models. Inputs to the models may include, but are not limited to, reported trades, executable bid and ask prices, broker/dealer quotations, prices or yields of securities with similar characteristics, interest rates, anticipated prepayments, benchmark curves or information pertaining to the issuer, as well as industry and economic events. The pricing services may use a matrix approach, which considers information regarding securities with similar characteristics to determine the valuation for a security. Short-term debt obligations purchased with a remaining maturity of sixty days or less for which a valuation from a third party pricing service is not readily available may be valued at amortized cost, which approximates fair value.
Derivatives. Futures contracts are valued at the closing settlement price established by the board of trade or exchange on which they are traded. Swaps are normally valued using valuations provided by a third party pricing service. Such pricing service valuations are based on the present value of fixed and projected floating rate cash flows over the term of the swap contract. Future cash flows on swaps are discounted to their present value using swap rates provided by electronic data services or by broker/dealers.
Other. Investments in management investment companies (including money market funds) that do not trade on an exchange are valued at the net asset value as of the close of each business day.
Fair Valuation. In connection with Rule 2a-5 of the 1940 Act, the Trustees have designated the Fund’s investment adviser as its valuation designee. Investments for which valuations or market quotations are not readily available or are deemed unreliable are valued by the investment adviser, as valuation designee, at fair value using methods that most fairly reflect the security’s “fair value”, which is the amount that the Fund might reasonably expect to receive for the security upon its current sale in the ordinary course. Each such determination is based on a consideration of relevant factors, which are likely to vary from one pricing context to another. These factors may include, but are not limited to, the type of security, the existence of any contractual restrictions on the security’s disposition, the price and extent of public trading in similar securities of the issuer or of comparable companies or entities, quotations or relevant information obtained from broker/dealers or other market participants, information obtained from the issuer, analysts, and/or the appropriate stock exchange (for exchange-traded securities), an analysis of the company’s or entity’s financial statements, and an evaluation of the forces that influence the issuer and the market(s) in which the security is purchased and sold.
B Investment Transactions—Investment transactions for financial statement purposes are accounted for on a trade date basis. Realized gains and losses on investments sold are determined on the basis of identified cost.
C Income—Interest income is recorded on the basis of interest accrued, adjusted for amortization of premium or accretion of discount. Dividend income is recorded on the ex-dividend date for dividends received in cash and/or securities.
D Federal Taxes—The Fund's policy is to comply with the provisions of the Internal Revenue Code applicable to regulated investment companies and to distribute to shareholders each year substantially all of its net investment income, and all or substantially all of its net realized capital gains. Accordingly, no provision for federal income or excise tax is necessary.
As of April 30, 2024, the Fund had no uncertain tax positions that would require financial statement recognition, de-recognition, or disclosure. The Fund files a U.S. federal income tax return annually after its fiscal year-end, which is subject to examination by the Internal Revenue Service for a period of three years from the date of filing.
E Expenses—The majority of expenses of the Trust are directly identifiable to an individual fund. Expenses which are not readily identifiable to a specific fund are allocated taking into consideration, among other things, the nature and type of expense and the relative size of the funds.
Eaton Vance
Short Duration Government Income Fund
April 30, 2024
Notes to Financial Statements (Unaudited) — continued
F Use of Estimates—The preparation of the financial statements in conformity with U.S. GAAP requires management to make estimates and assumptions that affect the reported amounts of assets and liabilities at the date of the financial statements and the reported amounts of income and expense during the reporting period. Actual results could differ from those estimates.
G Indemnifications—Under the Trust’s organizational documents, its officers and Trustees may be indemnified against certain liabilities and expenses arising out of the performance of their duties to the Fund. Under Massachusetts law, if certain conditions prevail, shareholders of a Massachusetts business trust (such as the Trust) could be deemed to have personal liability for the obligations of the Trust. However, the Trust’s Declaration of Trust contains an express disclaimer of liability on the part of Fund shareholders and the By-laws provide that the Trust shall assume, upon request by the shareholder, the defense on behalf of any Fund shareholders. Moreover, the By-laws also provide for indemnification out of Fund property of any shareholder held personally liable solely by reason of being or having been a shareholder for all loss or expense arising from such liability. Additionally, in the normal course of business, the Fund enters into agreements with service providers that may contain indemnification clauses. The Fund's maximum exposure under these arrangements is unknown as this would involve future claims that may be made against the Fund that have not yet occurred.
H Futures Contracts —Upon entering into a futures contract, the Fund is required to deposit with the broker, either in cash or securities, an amount equal to a certain percentage of the contract amount (initial margin). Subsequent payments, known as variation margin, are made or received by the Fund each business day, depending on the daily fluctuations in the value of the underlying security, and are recorded as unrealized gains or losses by the Fund. Gains (losses) are realized upon the expiration or closing of the futures contracts. Should market conditions change unexpectedly, the Fund may not achieve the anticipated benefits of the futures contracts and may realize a loss. Futures contracts have minimal counterparty risk as they are exchange traded and the clearinghouse for the exchange is substituted as the counterparty, guaranteeing counterparty performance.
I Interest Rate Swaps—Swap contracts are privately negotiated agreements between the Fund and a counterparty. Certain swap contracts may be centrally cleared (“centrally cleared swaps”), whereby all payments made or received by the Fund pursuant to the contract are with a central clearing party (CCP) rather than the original counterparty. The CCP guarantees the performance of the original parties to the contract. Upon entering into centrally cleared swaps, the Fund is required to deposit with the CCP, either in cash or securities, an amount of initial margin determined by the CCP, which is subject to adjustment. Pursuant to interest rate swap agreements, the Fund either makes floating-rate payments to the counterparty (or CCP in the case of centrally cleared swaps) based on a benchmark interest rate in exchange for fixed-rate payments or the Fund makes fixed-rate payments to the counterparty (or CCP in the case of a centrally cleared swap) in exchange for payments on a floating benchmark interest rate. Payments received or made, including amortization of upfront payments/receipts, if any (which are amortized over the life of the swap contract), are recorded as realized gains or losses. During the term of the outstanding swap agreement, changes in the underlying value of the swap are recorded as unrealized gains or losses. For centrally cleared swaps, the daily change in valuation is recorded as a receivable or payable for variation margin and settled in cash with the CCP daily. The value of the swap is determined by changes in the relationship between two rates of interest. The Fund is exposed to credit loss in the event of non-performance by the swap counterparty. In the case of centrally cleared swaps, counterparty risk is minimal due to protections provided by the CCP. Risk may also arise from movements in interest rates.
J Swaptions—A purchased swaption contract grants the Fund, in return for payment of the purchase price, the right, but not the obligation, to enter into a new swap agreement or to shorten, extend, cancel or otherwise modify an existing swap agreement, at some designated future time on specified terms. When the Fund purchases a swaption, the premium paid to the writer is recorded as an investment and subsequently marked-to-market to reflect the current value of the swaption. A written swaption gives the Fund the obligation, if exercised by the purchaser, to enter into a swap contract according to the terms of the underlying agreement. When the Fund writes a swaption, the premium received by the Fund is recorded as a liability and subsequently marked-to-market to reflect the current value of the swaption. When a swaption is exercised, the cost of the swap is adjusted by the amount of the premium paid or received. When a swaption expires or an unexercised swaption is closed, a gain or loss is recognized in the amount of the premium paid or received, plus the cost to close. The Fund’s risk for purchased swaptions is limited to the premium paid. The writer of a swaption bears the risk of unfavorable changes in the preset terms of the underlying swap contract. Purchased swaptions traded over-the-counter involve risk that the issuer or counterparty will fail to perform its contractual obligations.
K When-Issued Securities and Delayed Delivery Transactions—The Fund may purchase securities on a delayed delivery, when-issued or forward commitment basis, including TBA (To Be Announced) securities. Payment and delivery may take place after the customary settlement period for that security. At the time the transaction is negotiated, the price of the security that will be delivered is fixed. Securities purchased on a delayed delivery, when-issued or forward commitment basis are marked-to-market daily and begin earning interest on settlement date. Such security purchases are subject to the risk that when delivered they will be worth less than the agreed upon payment price. Losses may also arise if the counterparty does not perform under the contract. A forward purchase commitment may also be closed by entering into an offsetting commitment. If an offsetting commitment is entered into, the Fund will realize a gain or loss on investments based on the price established when the Fund entered into the commitment.
L Forward Sale Commitments—The Fund may enter into forward sale commitments to sell generic U.S. government agency mortgage-backed securities to hedge its portfolio positions and/or to enhance return. The proceeds to be received from the forward sale commitment are recorded as an asset and a corresponding liability, which is subsequently valued at approximately the current market value of the underlying security in accordance with the Fund's policies on investment valuations discussed above. The Fund records an unrealized gain or loss on investments to the extent of the difference between the proceeds to be received and the value of the open forward sale commitment on the day of determination. If the forward sale commitment is closed through the acquisition of an offsetting purchase commitment or the delivery of securities, the Fund realizes a gain or loss on investments based on the price
Eaton Vance
Short Duration Government Income Fund
April 30, 2024
Notes to Financial Statements (Unaudited) — continued
established when the Fund entered into the commitment. If the Fund enters into a forward sale commitment for the delivery of a security that it does not own or has the right to obtain, it is subject to the risk of loss if the purchase price to settle the commitment is higher than the price at which it was sold.
M Reverse Repurchase Agreements—Under a reverse repurchase agreement, the Fund temporarily transfers possession of a portfolio security to another party, such as a bank or broker/dealer, in return for cash. At the same time, the Fund agrees to repurchase the security at an agreed upon time and price, which reflects an interest payment. In periods of increased demand for a security, the Fund may receive a payment from the counterparty for the use of the security, which is recorded as interest income. Because the Fund retains effective control over the transferred security, the transaction is accounted for as a secured borrowing. The Fund may enter into such agreements when it believes it is able to invest the cash acquired at a rate higher than the cost of the agreement, which would increase earned income. When the Fund enters into a reverse repurchase agreement, any fluctuations in the market value of either the securities transferred to another party or the securities in which the proceeds may be invested would affect the market value of the Fund’s assets. Because reverse repurchase agreements may be considered to be the practical equivalent of borrowing funds (and the counterparty making a loan), they constitute a form of leverage. The Fund segregates cash or liquid assets equal to its obligation to repurchase the security. During the term of the agreement, the Fund may also be obligated to pledge additional cash and/or securities in the event of a decline in the fair value of the transferred security. In the event the counterparty to a reverse repurchase agreement becomes insolvent, recovery of the security transferred by the Fund may be delayed or the Fund may incur a loss equal to the amount by which the value of the security transferred by the Fund exceeds the repurchase price payable by the Fund.
N Stripped Mortgage-Backed Securities—The Fund may invest in Interest Only (IO) and Principal Only (PO) securities, a form of stripped mortgage-
backed securities, whereby the IO security receives all the interest and the PO security receives all the principal on a pool of mortgage assets. The yield to maturity on an IO security is extremely sensitive to the rate of principal payments (including prepayments) on the related underlying mortgage assets, and a rapid rate of principal payments may have a material adverse effect on the yield to maturity from these securities. If the underlying mortgages experience greater than anticipated prepayments of principal, the Fund may fail to recoup its initial investment in an IO security. The market value of IO and PO securities can be unusually volatile due to changes in interest rates.
O Interim Financial Statements—The interim financial statements relating to April 30, 2024 and for the six months then ended have not been audited by an independent registered public accounting firm, but in the opinion of the Fund’s management, reflect all adjustments, consisting only of normal recurring adjustments, necessary for the fair presentation of the financial statements.
2 Distributions to Shareholders and Income Tax Information
The Fund declares dividends daily to shareholders of record at the time of declaration. Distributions are generally paid monthly. Distributions of realized capital gains are made at least annually. Distributions are declared separately for each class of shares. Shareholders may reinvest income and capital gain distributions in additional shares of the same class of the Fund at the net asset value as of the reinvestment date or, at the election of the shareholder, receive distributions in cash. Distributions to shareholders are determined in accordance with income tax regulations, which may differ from U.S. GAAP. As required by U.S. GAAP, only distributions in excess of tax basis earnings and profits are reported in the financial statements as a return of capital. Permanent differences between book and tax accounting relating to distributions are reclassified to paid-in capital. For tax purposes, distributions from short-term capital gains are considered to be from ordinary income. For the six months ended April 30, 2024, management estimates that a portion of distributions for the period will be a tax return of capital. The final determination of tax characteristics of the Fund’s distributions will occur at the end of the year and will be reported to the shareholders.
At October 31, 2023, the Fund, for federal income tax purposes, had deferred capital losses of $639,105,694 which would reduce its taxable income arising from future net realized gains on investment transactions, if any, to the extent permitted by the Internal Revenue Code, and thus would reduce the amount of distributions to shareholders, which would otherwise be necessary to relieve the Fund of any liability for federal income or excise tax. The deferred capital losses are treated as arising on the first day of the Fund’s next taxable year and retain the same short-term or long-term character as when originally deferred. Of the deferred capital losses at October 31, 2023, $475,193,344 are short-term and $163,912,350 are long-term.
The cost and unrealized appreciation (depreciation) of investments, including open derivative contracts and TBA sale commitments, of the Fund at April 30, 2024, as determined on a federal income tax basis, were as follows:
| Aggregate cost | $3,575,439,076 |
| Gross unrealized appreciation | $ 331,990,606 |
| Gross unrealized depreciation | (480,840,125) |
| Net unrealized depreciation | $ (148,849,519) |
Eaton Vance
Short Duration Government Income Fund
April 30, 2024
Notes to Financial Statements (Unaudited) — continued
3 Investment Adviser Fee and Other Transactions with Affiliates
The investment adviser fee is earned by Boston Management and Research (BMR), an indirect, wholly-owned subsidiary of Morgan Stanley, as compensation for investment advisory services rendered to the Fund. The investment adviser fee is computed at an annual rate as a percentage of the Fund’s average daily net assets as follows and is payable monthly:
| Average Daily Net Assets | Annual Fee Rate |
| Up to $1 billion | 0.5000% |
| $1 billion but less than $2.5 billion | 0.4750% |
| $2.5 billion but less than $5 billion | 0.4550% |
| $5 billion but less than $10 billion | 0.4400% |
| $10 billion but less than $15 billion | 0.4300% |
| $15 billion but less than $20 billion | 0.4225% |
| $20 billion and over | 0.4175% |
Pursuant to an amendment to the investment advisory agreement dated April 29, 2022, BMR contractually agreed to reduce its investment advisory fee rate on average daily net assets of $10 billion and over from 0.4400% to the rates as stated above. This contractual reduction cannot be terminated or reduced without Trustee and shareholder approval. For the six months ended April 30, 2024, the Fund’s investment adviser fee amounted to $6,540,118 or 0.48% (annualized) of the Fund’s average daily net assets. The Fund may invest in a money market fund, the Institutional Class of the Morgan Stanley Institutional Liquidity Funds - Government Portfolio (the “Liquidity Fund”), an open-end management investment company managed by Morgan Stanley Investment Management Inc., a wholly-owned subsidiary of Morgan Stanley. The investment adviser fee paid by the Fund is reduced by an amount equal to its pro rata share of the advisory and administration fees paid by the Fund due to its investment in the Liquidity Fund. For the six months ended April 30, 2024, the investment adviser fee paid was reduced by $30,469 relating to the Fund's investment in the Liquidity Fund.
Effective March 13, 2024, BMR has agreed to reimburse the Fund’s expenses to the extent that total annual operating expenses (relating to ordinary operating expenses only and excluding such expenses as brokerage commissions, acquired fund fees and expenses of unaffiliated funds, borrowing costs, taxes or litigation expenses) exceed 0.85%, 0.85%, 1.45% and 0.60% of the Fund’s average daily net assets for Advisers Class, Class A, Class C and Class I, respectively. This agreement may be changed or terminated after March 1, 2025. Pursuant to this agreement, BMR was allocated $5,378 of the Fund’s operating expenses for the six months ended April 30, 2024.
Eaton Vance Management (EVM), an affiliate of BMR, serves as the administrator of the Fund, but receives no compensation. EVM provides sub-transfer agency and related services to the Fund pursuant to a Sub-Transfer Agency Support Services Agreement. For the six months ended April 30, 2024, EVM earned $18,348 from the Fund pursuant to such agreement, which is included in transfer and dividend disbursing agent fees on the Statement of Operations. The Fund was informed that Eaton Vance Distributors, Inc. (EVD), an affiliate of EVM and the Fund’s principal underwriter, received $1,492 as its portion of the sales charge on sales of Class A shares for the six months ended April 30, 2024. EVD also received distribution and service fees from Class A and Class C shares (see Note 4) and contingent deferred sales charges (see Note 5).
Trustees and officers of the Fund who are members of EVM’s or BMR’s organizations receive remuneration for their services to the Fund out of the investment adviser fee. Trustees of the Fund who are not affiliated with the investment adviser may elect to defer receipt of all or a percentage of their annual fees in accordance with the terms of the Trustees Deferred Compensation Plan. Certain officers and Trustees of the Fund are officers of the above organizations.
4 Distribution Plans
The Fund has in effect distribution plans for the Advisers Class shares and Class A shares (Advisers/Class A Plan) pursuant to Rule 12b-1 under the 1940 Act. Pursuant to the Advisers/Class A Plan, the Fund pays EVD a distribution and service fee of 0.25% per annum of its average daily net assets attributable to Advisers Class shares and Class A shares for distribution services and facilities provided to the Fund by EVD, as well as for personal services and/or the maintenance of shareholder accounts. Distribution and service fees paid or accrued to EVD for the six months ended April 30, 2024 amounted to $72,895 for Advisers Class shares and $539,334 for Class A shares. The Fund also has in effect a distribution plan for Class C shares (Class C Plan) pursuant to Rule 12b-1 under the 1940 Act. Pursuant to the Class C Plan, the Fund pays EVD amounts equal to 0.60% per annum of its average daily net assets attributable to Class C shares for providing ongoing distribution services and facilities to the Fund. For the six months ended April 30, 2024, the Fund paid or accrued to EVD $125,136 for Class C shares.
Eaton Vance
Short Duration Government Income Fund
April 30, 2024
Notes to Financial Statements (Unaudited) — continued
Pursuant to the Class C Plan, the Fund also makes payments of service fees to EVD, financial intermediaries and other persons in amounts equal to 0.25% per annum of its average daily net assets attributable to Class C shares. Service fees paid or accrued are for personal services and/or the maintenance of shareholder accounts. They are separate and distinct from the sales commissions and distribution fees payable to EVD. Service fees paid or accrued for the six months ended April 30, 2024 amounted to $52,140 for Class C shares.
Distribution and service fees are subject to the limitations contained in the Financial Industry Regulatory Authority Rule 2341(d).
5 Contingent Deferred Sales Charges
A contingent deferred sales charge (CDSC) of 1% generally is imposed on redemptions of Class C shares made within 12 months of purchase. Class A shares may be subject to a 0.25% CDSC if redeemed within 12 months of purchase (depending on the circumstances of purchase). Generally, the CDSC is based upon the lower of the net asset value at date of redemption or date of purchase. No charge is levied on shares acquired by reinvestment of dividends or capital gain distributions. For the six months ended April 30, 2024, the Fund was informed that EVD received $1,191 and $890 of CDSCs paid by Class A and Class C shareholders, respectively.
6 Purchases and Sales of Investments
Purchases and sales of investments (all U.S. Government and Agency Securities), other than short-term obligations and including maturities, paydowns and TBA transactions, aggregated $13,272,152,167 and $13,847,819,848, respectively, for the six months ended April 30, 2024.
7 Shares of Beneficial Interest
The Fund’s Declaration of Trust permits the Trustees to issue an unlimited number of full and fractional shares of beneficial interest (without par value). Such shares may be issued in a number of different series (such as the Fund) and classes. Transactions in Fund shares, including direct exchanges pursuant to share class conversions, were as follows:
| | Six Months Ended
April 30, 2024
(Unaudited) | | Year Ended
October 31, 2023 |
| | Shares | Amount | | Shares | Amount |
| Advisers Class | | | | | |
| Sales | 1,166,000 | $ 8,449,608 | | 751,922 | $ 5,607,351 |
| Issued to shareholders electing to receive payments of distributions in Fund shares | 267,842 | 1,946,059 | | 883,097 | 6,569,182 |
| Redemptions | (4,222,885) | (30,699,682) | | (17,977,151) | (133,851,701) |
| Net decrease | (2,789,043) | $ (20,304,015) | | (16,342,132) | $ (121,675,168) |
| Class A | | | | | |
| Sales | 4,305,649 | $ 31,252,335 | | 9,417,867 | $ 70,367,415 |
| Issued to shareholders electing to receive payments of distributions in Fund shares | 1,883,948 | 13,689,564 | | 4,222,390 | 31,383,669 |
| Redemptions | (13,439,757) | (97,815,376) | | (64,269,169) | (479,155,842) |
| Net decrease | (7,250,160) | $ (52,873,477) | | (50,628,912) | $ (377,404,758) |
| Class C | | | | | |
| Sales | 226,967 | $ 1,653,973 | | 1,046,897 | $ 7,842,288 |
| Issued to shareholders electing to receive payments of distributions in Fund shares | 170,502 | 1,240,997 | | 335,044 | 2,491,954 |
| Redemptions | (1,503,298) | (10,942,768) | | (4,420,691) | (33,067,792) |
| Net decrease | (1,105,829) | $ (8,047,798) | | (3,038,750) | $ (22,733,550) |
Eaton Vance
Short Duration Government Income Fund
April 30, 2024
Notes to Financial Statements (Unaudited) — continued
| | Six Months Ended
April 30, 2024
(Unaudited) | | Year Ended
October 31, 2023 |
| | Shares | Amount | | Shares | Amount |
| Class I | | | | | |
| Sales | 71,916,240 | $ 521,972,806 | | 213,618,713 | $ 1,600,523,672 |
| Issued to shareholders electing to receive payments of distributions in Fund shares | 9,356,059 | 67,928,193 | | 22,907,274 | 170,137,449 |
| Redemptions | (137,835,102) | (1,000,005,880) | | (515,577,977) | (3,843,549,977) |
| Net decrease | (56,562,803) | $ (410,104,881) | | (279,051,990) | $(2,072,888,856) |
8 Financial Instruments
The Fund may trade in financial instruments with off-balance sheet risk in the normal course of its investing activities. These financial instruments may include futures contracts, written swaptions and swap contracts and may involve, to a varying degree, elements of risk in excess of the amounts recognized for financial statement purposes. The notional or contractual amounts of these instruments represent the investment the Fund has in particular classes of financial instruments and do not necessarily represent the amounts potentially subject to risk. The measurement of the risks associated with these instruments is meaningful only when all related and offsetting transactions are considered. A summary of obligations under these financial instruments at April 30, 2024 is included in the Portfolio of Investments. At April 30, 2024, the Fund had sufficient cash and/or securities to cover commitments under these contracts.
The Fund is subject to interest rate risk in the normal course of pursuing its investment objective. Because the Fund holds fixed-rate bonds, the value of these bonds may decrease if interest rates rise. The Fund utilizes futures contracts and interest rate swaps and swaptions to enhance total return, to change the overall duration of the Fund and/or to hedge against fluctuations in securities prices due to changes in interest rates.
The fair value of open derivative instruments (not considered to be hedging instruments for accounting disclosure purposes) and whose primary underlying risk exposure is interest rate risk at April 30, 2024 was as follows:
| | Fair Value |
| Derivative | Asset Derivative | Liability Derivative |
| Futures contracts | $ 2,653,475(1) | $ (16,138,745)(1) |
| Swap contracts (centrally cleared) | 266,193,797 (1) | — |
| Total | $268,847,272 | $(16,138,745) |
| (1) | Only the current day’s variation margin on open futures contracts and centrally cleared swap contracts is reported within the Statement of Assets and Liabilities as Receivable or Payable for variation margin on open futures contracts and centrally cleared swap contracts, as applicable. |
Eaton Vance
Short Duration Government Income Fund
April 30, 2024
Notes to Financial Statements (Unaudited) — continued
The effect of derivative instruments (not considered to be hedging instruments for accounting disclosure purposes) on the Statement of Operations and whose primary underlying risk exposure is interest rate risk for the six months ended April 30, 2024 was as follows:
| Derivative | Realized Gain (Loss)
on Derivatives Recognized
in Income | Change in Unrealized
Appreciation (Depreciation) on
Derivatives Recognized in Income |
| Written swaptions | $ 3,733,831(1) | $ (3,521,981)(2) |
| Futures contracts | (15,727,671) (3) | (12,685,754) (4) |
| Swap contracts | 73,266,064 (5) | (109,760,365) (6) |
| Total | $ 61,272,224 | $(125,968,100) |
| (1) | Statement of Operations location: Net realized gain (loss): Written swaptions. |
| (2) | Statement of Operations location: Change in unrealized appreciation (depreciation): Written swaptions. |
| (3) | Statement of Operations location: Net realized gain (loss): Futures contracts. |
| (4) | Statement of Operations location: Change in unrealized appreciation (depreciation): Futures contracts. |
| (5) | Statement of Operations location: Net realized gain (loss): Swap contracts. |
| (6) | Statement of Operations location: Change in unrealized appreciation (depreciation): Swap contracts. |
The average notional cost of futures contracts and average notional amounts of other derivative contracts outstanding during the six months ended April 30, 2024, which are indicative of the volume of these derivative types, were approximately as follows:
Futures
Contracts — Long | Futures
Contracts — Short | Written
Swaptions | Swap
Contracts |
| $1,026,340,000 | $88,552,000 | $429,850,000 | $1,244,857,000 |
9 Line of Credit
The Fund participates with other portfolios and funds managed by BMR and its affiliates in a $650 million unsecured revolving line of credit agreement with a group of banks, which is in effect through October 22, 2024. Borrowings are made by the Fund solely for temporary purposes related to redemptions and other short-term cash needs. Interest is charged to the Fund based on its borrowings at an amount above either the Secured Overnight Financing Rate (SOFR) or Federal Funds rate. In addition, a fee computed at an annual rate of 0.15% on the daily unused portion of the line of credit is allocated among the participating portfolios and funds at the end of each quarter. In connection with the renewal of the agreement in October 2023, an arrangement fee of $150,000 was incurred that was allocated to the participating portfolios and funds. Because the line of credit is not available exclusively to the Fund, it may be unable to borrow some or all of its requested amounts at any particular time. The Fund did not have any significant borrowings or allocated fees during the six months ended April 30, 2024.
10 Reverse Repurchase Agreements
There were no reverse repurchase agreements outstanding as of April 30, 2024. For the six months ended April 30, 2024, the average borrowings under settled reverse repurchase agreements and the average annual interest rate paid were approximately $364,695,000 and 5.51%, respectively.
Eaton Vance
Short Duration Government Income Fund
April 30, 2024
Notes to Financial Statements (Unaudited) — continued
11 Affiliated Investments
At April 30, 2024, the value of the Fund's investment in funds that may be deemed to be affiliated was $135,251,894, which represents 5.3% of the Fund's net assets. Transactions in such investments by the Fund for the six months ended April 30, 2024 were as follows:
| Name | Value,
beginning
of period | Purchases | Sales
proceeds | Net realized
gain (loss) | Change in
unrealized
appreciation
(depreciation) | Value, end
of period | Dividend
income | Shares,
end of period |
| Short-Term Investments |
| Liquidity Fund | $5,892,398 | $978,388,023 | $(849,028,527) | $ — | $ — | $135,251,894 | $1,057,456 | 135,251,894 |
12 Fair Value Measurements
Under generally accepted accounting principles for fair value measurements, a three-tier hierarchy to prioritize the assumptions, referred to as inputs, is used in valuation techniques to measure fair value. The three-tier hierarchy of inputs is summarized in the three broad levels listed below.
| • | Level 1 – quoted prices in active markets for identical investments |
| • | Level 2 – other significant observable inputs (including quoted prices for similar investments, interest rates, prepayment speeds, credit risk, etc.) |
| • | Level 3 – significant unobservable inputs (including a fund's own assumptions in determining the fair value of investments) |
In cases where the inputs used to measure fair value fall in different levels of the fair value hierarchy, the level disclosed is determined based on the lowest level input that is significant to the fair value measurement in its entirety. The inputs or methodology used for valuing securities are not necessarily an indication of the risk associated with investing in those securities.
At April 30, 2024, the hierarchy of inputs used in valuing the Fund’s investments and open derivative instruments, which are carried at fair value, were as follows:
| Asset Description | Level 1 | Level 2 | Level 3 | Total |
| Collateralized Mortgage Obligations | $ — | $ 1,320,290,867 | $ — | $ 1,320,290,867 |
| U.S. Department of Agriculture Loans | — | 10,501,518 | — | 10,501,518 |
| U.S. Government Agency Commercial Mortgage-Backed Securities | — | 16,529,566 | — | 16,529,566 |
| U.S. Government Agency Mortgage-Backed Securities | — | 2,149,754,237 | — | 2,149,754,237 |
| U.S. Government Guaranteed Small Business Administration Pools & Loans | — | 87,650,535 | — | 87,650,535 |
| Short-Term Investments | 135,251,894 | — | — | 135,251,894 |
| Total Investments | $ 135,251,894 | $ 3,584,726,723 | $ — | $ 3,719,978,617 |
| Futures Contracts | $ 2,653,475 | $ — | $ — | $ 2,653,475 |
| Swap Contracts | — | 266,193,797 | — | 266,193,797 |
| Total | $ 137,905,369 | $ 3,850,920,520 | $ — | $ 3,988,825,889 |
| Liability Description | | | | |
| TBA Sale Commitments | $ — | $ (543,671,636) | $ — | $ (543,671,636) |
| Futures Contracts | (16,138,745) | — | — | (16,138,745) |
| Total | $ (16,138,745) | $ (543,671,636) | $ — | $ (559,810,381) |
Eaton Vance
Short Duration Government Income Fund
April 30, 2024
| Officers |
Kenneth A. Topping
President | Nicholas S. Di Lorenzo
Secretary |
Deidre E. Walsh
Vice President and Chief Legal Officer | Laura T. Donovan
Chief Compliance Officer |
James F. Kirchner
Treasurer | |
George J. Gorman
Chairperson | |
| Alan C. Bowser | |
| Mark R. Fetting | |
| Cynthia E. Frost | |
| Valerie A. Mosley | |
| Anchal Pachnanda* | |
| Keith Quinton | |
| Marcus L. Smith | |
| Susan J. Sutherland | |
| Scott E. Wennerholm | |
| Nancy A. Wiser | |
| U.S. Customer Privacy Notice | March 2024 |
| FACTS | WHAT DOES EATON VANCE DO WITH YOUR PERSONAL INFORMATION? |
| Why? | Financial companies choose how they share your personal information. Federal law gives consumers the right to limit some but not all sharing. Federal law also requires us to tell you how we collect, share, and protect your personal information. Please read this notice carefully to understand what we do. |
| |
| What? | The types of personal information we collect and share depend on the product or service you have with us. This information can include:■ Social Security number and income
■ investment experience and risk tolerance
■ checking account information and wire transfer instructions |
| |
| How? | All financial companies need to share customers’ personal information to run their everyday business. In the section below, we list the reasons financial companies can share their customers’ personal information; the reasons Eaton Vance chooses to share; and whether you can limit this sharing. |
| Reasons we can share your personal information | Does Eaton Vance
share? | Can you limit
this sharing? |
| For our everyday business purposes — such as to process your transactions, maintain your account(s), respond to court orders and legal investigations, or report to credit bureaus | Yes | No |
| For our marketing purposes — to offer our products and services to you | Yes | No |
| For joint marketing with other financial companies | No | We don’t share |
| For our affiliates’ everyday business purposes — information about your transactions and experiences | Yes | No* |
| For our affiliates’ everyday business purposes — information about your creditworthiness | Yes | Yes* |
| For our affiliates to market to you | Yes | Yes* |
| For nonaffiliates to market to you | No | We don’t share |
To limit our
sharing | Call toll-free 1-800-262-1122 or email: EVPrivacy@eatonvance.comPlease note:If you are a new customer, we can begin sharing your information 30 days from the date we sent this notice. When you are no longer our customer, we continue to share your information as described in this notice. However, you can contact us at any time to limit our sharing. |
| Questions? | Call toll-free 1-800-262-1122 or email: EVPrivacy@eatonvance.com |
| U.S. Customer Privacy Notice — continued | March 2024 |
| Who we are |
| Who is providing this notice? | Eaton Vance Management and our investment management affiliates (“Eaton Vance”) (see Affiliates definition below.) |
| What we do |
How does Eaton Vance
protect my personal
information? | To protect your personal information from unauthorized access and use, we use security measures that comply with federal law. These measures include computer safeguards and secured files and buildings. We have policies governing the proper handling of customer information by personnel and requiring third parties that provide support to adhere to appropriate security standards with respect to such information. |
How does Eaton Vance
collect my personal
information? | We collect your personal information, for example, when you■ open an account or make deposits or withdrawals from your account
■ buy securities from us or make a wire transfer
■ give us your contact informationWe also collect your personal information from others, such as credit bureaus, affiliates, or other companies. |
| Why can’t I limit all sharing? | Federal law gives you the right to limit only■ sharing for affiliates’ everyday business purposes — information about your creditworthiness
■ affiliates from using your information to market to you
■ sharing for nonaffiliates to market to youState laws and individual companies may give you additional rights to limit sharing. (See below for more on your rights under state law.) |
What happens when I limit
sharing for an account I hold
jointly with someone else? | Your choices will apply to everyone on your account. |
| Definitions |
| Affiliates | Companies related by common ownership or control. They can be financial and nonfinancial companies.■ Our affiliates include registered investment advisers such as Eaton Vance Management, Eaton Vance Advisers International Ltd., Boston Management and Research, Calvert Research and Management, Parametric Portfolio Associates LLC, Atlanta Capital Management Company LLC, Morgan Stanley Investment Management Inc., Morgan Stanley Investment Management Co.; registered broker-dealers such as Morgan Stanley Distributors Inc. and Eaton Vance Distributors, Inc. (together, the “Investment Management Affiliates”); and companies with a Morgan Stanley name and financial companies such as Morgan Stanley Smith Barney LLC and Morgan Stanley & Co. (the “Morgan Stanley Affiliates”). |
| Nonaffiliates | Companies not related by common ownership or control. They can be financial and nonfinancial companies.■ Eaton Vance does not share with nonaffiliates so they can market to you. |
| Joint marketing | A formal agreement between nonaffiliated financial companies that together market financial products or services to you.■ Eaton Vance does not jointly market. |
| U.S. Customer Privacy Notice — continued | March 2024 |
| Other important information |
| *PLEASE NOTE: Eaton Vance does not share your creditworthiness information or your transactions and experiences information with the Morgan Stanley Affiliates, nor does Eaton Vance enable the Morgan Stanley Affiliates to market to you. Your opt outs will prevent Eaton Vance from sharing your creditworthiness information with the Investment Management Affiliates and will prevent the Investment Management Affiliates from marketing their products to you.Vermont: Except as permitted by law, we will not share personal information we collect about Vermont residents with Nonaffiliates unless you provide us with your written consent to share such information.California: Except as permitted by law, we will not share personal information we collect about California residents with Nonaffiliates and we will limit sharing such personal information with our Affiliates to comply with California privacy laws that apply to us. |
Delivery of Shareholder Documents. The Securities and Exchange Commission (SEC) permits funds to deliver only one copy of shareholder documents, including prospectuses, proxy statements and shareholder reports, to fund investors with multiple accounts at the same residential or post office box address. This practice is often called “householding” and it helps eliminate duplicate mailings to shareholders. Eaton Vance, or your financial intermediary, may household the mailing of your documents indefinitely unless you instruct Eaton Vance, or your financial intermediary, otherwise. If you would prefer that your Eaton Vance documents not be householded, please contact Eaton Vance at 1-800-262-1122, or contact your financial intermediary. Your instructions that householding not apply to delivery of your Eaton Vance documents will typically be effective within 30 days of receipt by Eaton Vance or your financial intermediary.
Portfolio Holdings. Each Eaton Vance Fund and its underlying Portfolio(s) (if applicable) files a schedule of portfolio holdings on Part F to Form N-PORT with the SEC. Certain information filed on Form N-PORT may be viewed on the Eaton Vance website at www.eatonvance.com, by calling Eaton Vance at 1-800-262-1122 or in the EDGAR database on the SEC’s website at www.sec.gov.
Proxy Voting. From time to time, funds are required to vote proxies related to the securities held by the funds. The Eaton Vance Funds or their underlying Portfolios (if applicable) vote proxies according to a set of policies and procedures approved by the Funds’ and Portfolios’ Boards. You may obtain a description of these policies and procedures and information on how the Funds or Portfolios voted proxies relating to portfolio securities during the most recent 12-month period ended June 30, without charge, upon request, by calling 1-800-262-1122 and by accessing the SEC’s website at www.sec.gov.
Tailored Shareholder Reports. Effective January 24, 2023, the SEC adopted rule and form amendments to require open-end mutual funds and ETFs to transmit concise and visually engaging streamlined annual and semi-annual reports to shareholders that highlight key information. Other information, including financial statements, will no longer appear in a streamlined shareholder report but must be available online, delivered free of charge upon request, and filed on a semi-annual basis on Form N-CSR. The rule and form amendments have a compliance date of July 24, 2024. At this time, management is evaluating the impact of these amendments on the shareholder reports for the Eaton Vance Funds.
This Page Intentionally Left Blank
Investment Adviser
Boston Management and Research
One Post Office Square
Boston, MA 02109
Administrator
Eaton Vance Management
One Post Office Square
Boston, MA 02109
Principal Underwriter*
Eaton Vance Distributors, Inc.
One Post Office Square
Boston, MA 02109
(617) 482-8260
Custodian
State Street Bank and Trust Company
One Congress Street, Suite 1
Boston, MA 02114-2016
Transfer Agent
BNY Mellon Investment Servicing (US) Inc.
Attn: Eaton Vance Funds
P.O. Box 534439
Pittsburgh, PA 15253-4439
(800) 262-1122
Fund Offices
One Post Office Square
Boston, MA 02109
* FINRA BrokerCheck. Investors may check the background of their Investment Professional by contacting the Financial Industry Regulatory Authority (FINRA). FINRA BrokerCheck is a free tool to help investors check the professional background of current and former FINRA-registered securities firms and brokers. FINRA BrokerCheck is available by calling 1-800-289-9999 and at www.FINRA.org. The FINRA BrokerCheck brochure describing this program is available to investors at www.FINRA.org.
Eaton Vance
Global Macro Absolute Return Advantage Fund
Semi-Annual Report
April 30, 2024
Commodity Futures Trading Commission Registration. The Commodity Futures Trading Commission (“CFTC”) has adopted regulations that subject registered investment companies and advisers to regulation by the CFTC if a fund invests more than a prescribed level of its assets in certain CFTC-regulated instruments (including futures, certain options and swap agreements) or markets itself as providing investment exposure to such instruments. The adviser is registered with the CFTC as a commodity pool operator with respect to its management of the Fund. As the commodity pool operator of the Fund, the adviser has claimed relief under the Commodity Exchange Act from certain reporting and recordkeeping requirements. The adviser is also registered as a commodity trading advisor.
Fund shares are not insured by the FDIC and are not deposits or other obligations of, or guaranteed by, any depository institution. Shares are subject to investment risks, including possible loss of principal invested.
This report must be preceded or accompanied by a current summary prospectus or prospectus. Before investing, investors should consider carefully the investment objective, risks, and charges and expenses of a mutual fund. This and other important information is contained in the summary prospectus and prospectus, which can be obtained from a financial intermediary. Prospective investors should read the prospectus carefully before investing. For further information, please call 1-800-262-1122.
Semi-Annual Report April 30, 2024
Eaton Vance
Global Macro Absolute Return Advantage Fund
Eaton Vance
Global Macro Absolute Return Advantage Fund
April 30, 2024
Performance
Portfolio Manager(s) Patrick Campbell, CFA, Kyle Lee, CFA, Federico Sequeda, CFA each of Eaton Vance Management and Hussein Khattab, CFA of Eaton Vance Advisers International Ltd.
| % Average Annual Total Returns1,2 | Class
Inception Date | Performance
Inception Date | Six Months | One Year | Five Years | Ten Years |
| Class A at NAV | 08/31/2010 | 08/31/2010 | 7.34% | 10.01% | 5.85% | 4.24% |
| Class A with 3.25% Maximum Sales Charge | — | — | 3.88 | 6.48 | 5.16 | 3.89 |
| Class C at NAV | 08/31/2010 | 08/31/2010 | 6.93 | 9.19 | 5.09 | 3.66 |
| Class C with 1% Maximum Deferred Sales Charge | — | — | 5.93 | 8.19 | 5.09 | 3.66 |
| Class I at NAV | 08/31/2010 | 08/31/2010 | 7.51 | 10.25 | 6.15 | 4.55 |
| Class R at NAV | 12/01/2010 | 08/31/2010 | 7.19 | 9.66 | 5.62 | 4.02 |
| Class R6 at NAV | 05/31/2017 | 08/31/2010 | 7.40 | 10.24 | 6.18 | 4.60 |
|
| ICE BofA 3-Month U.S. Treasury Bill Index | — | — | 2.66% | 5.36% | 2.07% | 1.42% |
| % Total Annual Operating Expense Ratios3 | Class A | Class C | Class I | Class R | Class R6 |
| Gross | 2.01% | 2.78% | 1.78% | 2.28% | 1.75% |
| Net | 1.94 | 2.71 | 1.71 | 2.21 | 1.68 |
See Endnotes and Additional Disclosures in this report.
Past performance is no guarantee of future results. Returns are historical and are calculated by determining the percentage change in net asset value (NAV) or offering price (as applicable) with all distributions reinvested. Furthermore, returns do not reflect the deduction of taxes that shareholders may have to pay on Fund distributions or upon the redemption of Fund shares. Investment return and principal value will fluctuate so that shares, when redeemed, may be worth more or less than their original cost. Performance for periods less than or equal to one year is cumulative. Performance is for the stated time period only; due to market volatility, current Fund performance may be lower or higher than the quoted return. For performance as of the most recent month-end, please refer to eatonvance.com.
Eaton Vance
Global Macro Absolute Return Advantage Fund
April 30, 2024
| Asset Allocation (% of net assets)1 |
| Foreign Currency Exposures (% of net assets)2 |
| Egypt | 16.1% |
| Poland | 7.3 |
| Uzbekistan | 7.2 |
| Turkey | 7.1 |
| India | 5.9 |
| Iceland | 5.5 |
| Serbia | 4.8 |
| Hungary | 3.9 |
| Dominican Republic | 3.6 |
| Canada | 3.5 |
| Singapore | 3.5 |
| Mexico | 3.2 |
| Taiwan | 3.2 |
| Australia | 3.0 |
| South Korea | 2.9 |
| Nigeria | 2.9 |
| Armenia | 2.0 |
| Indonesia | 1.9 |
| Uruguay | 1.8 |
| Brazil | 1.7 |
| United Kingdom | 1.7 |
| Japan | 1.5 |
| China | 1.4 |
| Paraguay | 1.3 |
| Kenya | 1.3 |
| Chile | 1.1 |
| Other | 3.2 4 |
| Bahrain | -1.4 |
| Thailand | -1.8 |
| Hong Kong | -1.9 |
| Oman | -2.2 |
| Philippines | -3.0 |
| New Zealand | -3.4 |
| South Africa | -8.0 |
| China | -10.5 |
| Euro | -23.6 |
| Total Long | 104.8% |
| Total Short | -58.1% |
| Total Net | 46.7% |
Fund invests in an affiliated investment company (Portfolio) with the same objective(s) and policies as the Fund. References to investments are to the Portfolio’s holdings.
Footnotes:
1 Other Net Assets represents other assets less liabilities and includes any investment type that represents less than 1% of net assets.
2 Currency exposures include all foreign exchange denominated assets, currency derivatives and commodities (including commodity derivatives). Total exposures may exceed 100% due to implicit leverage created by derivatives.
3 Net of securities sold short.
4 Includes amounts each less than 1.0% or –1.0%, as applicable.
Eaton Vance
Global Macro Absolute Return Advantage Fund
April 30, 2024
Endnotes and Additional Disclosures
| 1 | ICE BofA 3-Month U.S. Treasury Bill Index is an unmanaged index of U.S. Treasury securities maturing in 90 days. ICE® BofA® indices are not for redistribution or other uses; provided “as is”, without warranties, and with no liability. Eaton Vance has prepared this report and ICE Data Indices, LLC does not endorse it, or guarantee, review, or endorse Eaton Vance’s products. BofA® is a licensed registered trademark of Bank of America Corporation in the United States and other countries. Unless otherwise stated, index returns do not reflect the effect of any applicable sales charges, commissions, expenses, taxes or leverage, as applicable. It is not possible to invest directly in an index. |
| 2 | Total Returns at NAV do not include applicable sales charges. If sales charges were deducted, the returns would be lower. Total Returns shown with maximum sales charge reflect the stated maximum sales charge. Unless otherwise stated, performance does not reflect the deduction of taxes on Fund distributions or redemptions of Fund shares.Performance prior to the inception date of a class may be linked to the performance of an older class of the Fund. This linked performance is adjusted for any applicable sales charge, but is not adjusted for class expense differences. If adjusted for such differences, the performance would be different. The performance of Class R6 is linked to Class I. Performance presented in the Financial Highlights included in the financial statements is not linked.Effective November 5, 2020, Class C shares automatically convert to Class A shares eight years after purchase. The average annual total returns listed for Class C reflect conversion to Class A shares after eight years. Prior to November 5, 2020, Class C shares automatically converted to Class A shares ten years after purchase. |
| 3 | Source: Fund prospectus. Net expense ratios reflect a contractual expense reimbursement that continues through 3/1/25. The expense ratios for the current reporting period can be found in the Financial Highlights section of this report. Performance reflects expenses waived and/or reimbursed, if applicable. Without such waivers and/or reimbursements, performance would have been lower. |
| | Fund profile subject to change due to active management. |
Eaton Vance
Global Macro Absolute Return Advantage Fund
April 30, 2024
Example
As a Fund shareholder, you incur two types of costs: (1) transaction costs, including sales charges (loads) on purchases; and (2) ongoing costs, including management fees; distribution and/or service fees; and other Fund expenses. This Example is intended to help you understand your ongoing costs (in dollars) of Fund investing and to compare these costs with the ongoing costs of investing in other mutual funds. The Example is based on an investment of $1,000 invested at the beginning of the period and held for the entire period (November 1, 2023 to April 30, 2024).
Actual Expenses
The first section of the table below provides information about actual account values and actual expenses. You may use the information in this section, together with the amount you invested, to estimate the expenses that you paid over the period. Simply divide your account value by $1,000 (for example, an $8,600 account value divided by $1,000 = 8.6), then multiply the result by the number in the first section under the heading entitled “Expenses Paid During Period” to estimate the expenses you paid on your account during this period.
Hypothetical Example for Comparison Purposes
The second section of the table below provides information about hypothetical account values and hypothetical expenses based on the actual Fund expense ratio and an assumed rate of return of 5% per year (before expenses), which is not the actual Fund return. The hypothetical account values and expenses may not be used to estimate the actual ending account balance or expenses you paid for the period. You may use this information to compare the ongoing costs of investing in your Fund and other funds. To do so, compare this 5% hypothetical example with the 5% hypothetical examples that appear in the shareholder reports of the other funds.
Please note that the expenses shown in the table are meant to highlight your ongoing costs only and do not reflect any transactional costs, such as sales charges (loads). Therefore, the second section of the table is useful in comparing ongoing costs only, and will not help you determine the relative total costs of owning different funds. In addition, if these transactional costs were included, your costs would be higher.
| | Beginning
Account Value
(11/1/23) | Ending
Account Value
(4/30/24) | Expenses Paid
During Period*
(11/1/23 – 4/30/24) | Annualized
Expense
Ratio |
| Actual | | | | |
| Class A | $1,000.00 | $1,073.40 | $11.50** | 2.23% |
| Class C | $1,000.00 | $1,069.30 | $15.33** | 2.98% |
| Class I | $1,000.00 | $1,075.10 | $10.22** | 1.98% |
| Class R | $1,000.00 | $1,071.90 | $12.78** | 2.48% |
| Class R6 | $1,000.00 | $1,074.00 | $10.06** | 1.95% |
| |
| Hypothetical | | | | |
| (5% return per year before expenses) | | | | |
| Class A | $1,000.00 | $1,013.77 | $11.17** | 2.23% |
| Class C | $1,000.00 | $1,010.05 | $14.89** | 2.98% |
| Class I | $1,000.00 | $1,015.02 | $ 9.92** | 1.98% |
| Class R | $1,000.00 | $1,012.53 | $12.41** | 2.48% |
| Class R6 | $1,000.00 | $1,015.17 | $ 9.77** | 1.95% |
| * | Expenses are equal to the Fund's annualized expense ratio for the indicated Class, multiplied by the average account value over the period, multiplied by 182/366 (to reflect the one-half year period). The Example assumes that the $1,000 was invested at the net asset value per share determined at the close of business on October 31, 2023. The Example reflects the expenses of both the Fund and the Portfolio. |
| ** | Absent an allocation of certain expenses to affiliate(s), the expenses would be higher. |
Eaton Vance
Global Macro Absolute Return Advantage Fund
April 30, 2024
Statement of Assets and Liabilities (Unaudited)
| | April 30, 2024 |
| Assets | |
| Investment in Global Macro Absolute Return Advantage Portfolio, at value (identified cost $1,921,287,453) | $ 1,914,130,199 |
| Receivable for Fund shares sold | 2,954,707 |
| Receivable from affiliates | 186,174 |
| Total assets | $1,917,271,080 |
| Liabilities | |
| Payable for Fund shares redeemed | $ 2,713,966 |
| Payable to affiliates: | |
| Distribution and service fees | 68,284 |
| Trustees' fees | 42 |
| Payable for transfer and dividend disbursing agent fees | 191,512 |
| Accrued expenses | 160,725 |
| Total liabilities | $ 3,134,529 |
| Net Assets | $1,914,136,551 |
| Sources of Net Assets | |
| Paid-in capital | $ 2,174,027,643 |
| Accumulated loss | (259,891,092) |
| Net Assets | $1,914,136,551 |
| Class A Shares | |
| Net Assets | $ 299,431,280 |
| Shares Outstanding | 29,079,426 |
Net Asset Value and Redemption Price Per Share
(net assets ÷ shares of beneficial interest outstanding) | $ 10.30 |
Maximum Offering Price Per Share
(100 ÷ 96.75 of net asset value per share) | $ 10.65 |
| Class C Shares | |
| Net Assets | $ 8,015,534 |
| Shares Outstanding | 795,627 |
Net Asset Value and Offering Price Per Share*
(net assets ÷ shares of beneficial interest outstanding) | $ 10.07 |
| Class I Shares | |
| Net Assets | $ 926,769,036 |
| Shares Outstanding | 88,671,640 |
Net Asset Value, Offering Price and Redemption Price Per Share
(net assets ÷ shares of beneficial interest outstanding) | $ 10.45 |
| Class R Shares | |
| Net Assets | $ 1,306,040 |
| Shares Outstanding | 128,628 |
Net Asset Value, Offering Price and Redemption Price Per Share
(net assets ÷ shares of beneficial interest outstanding) | $ 10.15 |
6
See Notes to Financial Statements.
Eaton Vance
Global Macro Absolute Return Advantage Fund
April 30, 2024
Statement of Assets and Liabilities (Unaudited) — continued
| | April 30, 2024 |
| Class R6 Shares | |
| Net Assets | $678,614,661 |
| Shares Outstanding | 65,032,400 |
Net Asset Value, Offering Price and Redemption Price Per Share
(net assets ÷ shares of beneficial interest outstanding) | $ 10.44 |
| On sales of $100,000 or more, the offering price of Class A shares is reduced. |
| * | Redemption price per share is equal to the net asset value less any applicable contingent deferred sales charge. |
7
See Notes to Financial Statements.
Eaton Vance
Global Macro Absolute Return Advantage Fund
April 30, 2024
Statement of Operations (Unaudited)
| | Six Months Ended |
| | April 30, 2024 |
| Investment Income | |
| Dividend income allocated from Portfolio (net of foreign taxes withheld of $208,406) | $ 5,531,679 |
| Interest income allocated from Portfolio (net of foreign taxes withheld of $685,451) | 71,134,637 |
| Other income allocated from Portfolio | 181,164 |
| Expenses, excluding interest and dividend expense, allocated from Portfolio | (9,324,131) |
| Interest and dividend expense allocated from Portfolio | (8,764,826) |
| Total investment income from Portfolio | $ 58,758,523 |
| Expenses | |
| Distribution and service fees: | |
| Class A | $ 338,114 |
| Class C | 39,916 |
| Class R | 3,436 |
| Trustees’ fees and expenses | 250 |
| Custodian fee | 30,927 |
| Transfer and dividend disbursing agent fees | 635,740 |
| Legal and accounting services | 65,408 |
| Printing and postage | 88,394 |
| Registration fees | 98,666 |
| Miscellaneous | 15,042 |
| Total expenses | $ 1,315,893 |
| Deduct: | |
| Waiver and/or reimbursement of expenses by affiliates | $ 679,760 |
| Total expense reductions | $ 679,760 |
| Net expenses | $ 636,133 |
| Net investment income | $ 58,122,390 |
| Realized and Unrealized Gain (Loss) from Portfolio | |
| Net realized gain (loss): | |
| Investment transactions | $ 1,504,816 |
| Written options | 465,253 |
| Securities sold short | (8,636,583) |
| Futures contracts | (10,434,289) |
| Swap contracts | (25,274,774) |
| Foreign currency transactions | 9,599,904 |
| Forward foreign currency exchange contracts | (12,553,102) |
| Non-deliverable bond forward contracts | 2,086,084 |
| Net realized loss | $ (43,242,691) |
| Change in unrealized appreciation (depreciation): | |
| Investments (including net increase in accrued foreign capital gains taxes of $5,253) | $ 120,422,153 |
| Written options | 499,578 |
| Securities sold short | (6,095,040) |
| Futures contracts | 3,302,328 |
| Swap contracts | (13,299,605) |
| Foreign currency | 868,146 |
| Forward foreign currency exchange contracts | 11,097,163 |
| Net change in unrealized appreciation (depreciation) | $116,794,723 |
| Net realized and unrealized gain | $ 73,552,032 |
| Net increase in net assets from operations | $131,674,422 |
8
See Notes to Financial Statements.
Eaton Vance
Global Macro Absolute Return Advantage Fund
April 30, 2024
Statements of Changes in Net Assets
| | Six Months Ended
April 30, 2024
(Unaudited) | Year Ended
October 31, 2023 |
| Increase (Decrease) in Net Assets | | |
| From operations: | | |
| Net investment income | $ 58,122,390 | $ 99,810,647 |
| Net realized loss | (43,242,691) | (147,804,197) |
| Net change in unrealized appreciation (depreciation) | 116,794,723 | 191,096,394 |
| Net increase in net assets from operations | $ 131,674,422 | $ 143,102,844 |
| Distributions to shareholders: | | |
| Class A | $ (8,221,994) | $ (10,176,611) |
| Class C | (175,661) | (392,475) |
| Class I | (29,881,618) | (37,085,496) |
| Class R | (40,321) | (58,629) |
| Class R6 | (23,171,574) | (26,464,279) |
| Total distributions to shareholders | $ (61,491,168) | $ (74,177,490) |
| Transactions in shares of beneficial interest: | | |
| Class A | $ 30,409,511 | $ 97,209,145 |
| Class C | (614,943) | (3,108,752) |
| Class I | 21,312,197 | 33,594,093 |
| Class R | (191,238) | 43,276 |
| Class R6 | (13,290,133) | 88,926,661 |
| Net increase in net assets from Fund share transactions | $ 37,625,394 | $ 216,664,423 |
| Net increase in net assets | $ 107,808,648 | $ 285,589,777 |
| Net Assets | | |
| At beginning of period | $ 1,806,327,903 | $ 1,520,738,126 |
| At end of period | $1,914,136,551 | $1,806,327,903 |
9
See Notes to Financial Statements.
Eaton Vance
Global Macro Absolute Return Advantage Fund
April 30, 2024
| | Class A |
| | Six Months Ended
April 30, 2024
(Unaudited) | Year Ended October 31, |
| | 2023 | 2022 | 2021 | 2020 | 2019 |
| Net asset value — Beginning of period | $ 9.910 | $ 9.480 | $ 10.450 | $ 10.450 | $ 10.250 | $ 9.510 |
| Income (Loss) From Operations | | | | | | |
| Net investment income(1) | $ 0.305 | $ 0.559 | $ 0.531 | $ 0.524 | $ 0.549 | $ 0.564 |
| Net realized and unrealized gain (loss) | 0.399 | 0.298 | (1.038) | 0.049 | 0.066 | 0.176 |
| Total income (loss) from operations | $ 0.704 | $ 0.857 | $ (0.507) | $ 0.573 | $ 0.615 | $ 0.740 |
| Less Distributions | | | | | | |
| From net investment income | $ (0.314) | $ (0.427) | $ (0.463) | $ (0.573) | $ (0.415) | $ — |
| Total distributions | $ (0.314) | $ (0.427) | $ (0.463) | $ (0.573) | $ (0.415) | $ — |
| Net asset value — End of period | $ 10.300 | $ 9.910 | $ 9.480 | $ 10.450 | $ 10.450 | $ 10.250 |
| Total Return(2)(3) | 7.34% (4) | 9.16% | (5.02)% | 5.52% | 6.15% | 7.78% |
| Ratios/Supplemental Data | | | | | | |
| Net assets, end of period (000’s omitted) | $299,431 | $258,776 | $151,818 | $676,641 | $758,795 | $789,497 |
| Ratios (as a percentage of average daily net assets):(5) | | | | | | |
| Expenses (3)(6) | 2.23% (7)(8) | 1.99% (8) | 1.51% (8) | 1.46% | 1.44% | 1.57% |
| Net investment income | 6.06% (7) | 5.69% | 5.31% | 5.03% | 5.35% | 5.70% |
| Portfolio Turnover of the Portfolio | 100% (4) | 56% | 94% | 82% | 80% | 71% |
| (1) | Computed using average shares outstanding. |
| (2) | Returns are historical and are calculated by determining the percentage change in net asset value with all distributions reinvested and do not reflect the effect of sales charges. |
| (3) | The investment adviser and administrator of the Fund and/or the investment adviser of the Portfolio reimbursed certain operating expenses (equal to 0.08%, 0.07%, 0.11%, 0.11%, 0.15% and 0.18% of average daily net assets for the six months ended April 30, 2024 and the years ended October 31, 2023, 2022, 2021, 2020 and 2019, respectively). Absent this reimbursement, total return would be lower. |
| (4) | Not annualized. |
| (5) | Includes the Fund’s share of the Portfolio’s allocated expenses. |
| (6) | Includes interest and/or dividend expense, including on securities sold short and/or reverse repurchase agreements if applicable, of 0.94%, 0.67%, 0.16%, 0.11%, 0.09% and 0.22% of average daily net assets for the six months ended April 30, 2024 and the years ended October 31, 2023, 2022, 2021, 2020 and 2019, respectively. |
| (7) | Annualized. |
| (8) | Includes a reduction by the investment adviser of a portion of the Portfolio’s adviser fee due to the Portfolio’s investment in the Liquidity Fund (equal to 0.01%, 0.01% and less than 0.005% of average daily net assets for the six months ended April 30, 2024 and the years ended October 31, 2023 and 2022, respectively). |
10
See Notes to Financial Statements.
Eaton Vance
Global Macro Absolute Return Advantage Fund
April 30, 2024
Financial Highlights — continued
| | Class C |
| | Six Months Ended
April 30, 2024
(Unaudited) | Year Ended October 31, |
| | 2023 | 2022 | 2021 | 2020 | 2019 |
| Net asset value — Beginning of period | $ 9.640 | $ 9.230 | $10.180 | $ 10.150 | $ 9.930 | $ 9.270 |
| Income (Loss) From Operations | | | | | | |
| Net investment income(1) | $ 0.261 | $ 0.482 | $ 0.495 | $ 0.441 | $ 0.468 | $ 0.453 |
| Net realized and unrealized gain (loss) | 0.388 | 0.281 | (1.059) | 0.043 | 0.056 | 0.207 |
| Total income (loss) from operations | $ 0.649 | $ 0.763 | $ (0.564) | $ 0.484 | $ 0.524 | $ 0.660 |
| Less Distributions | | | | | | |
| From net investment income | $ (0.219) | $ (0.353) | $ (0.386) | $ (0.454) | $ (0.304) | $ — |
| Total distributions | $ (0.219) | $(0.353) | $ (0.386) | $ (0.454) | $ (0.304) | $ — |
| Net asset value — End of period | $10.070 | $ 9.640 | $ 9.230 | $10.180 | $10.150 | $ 9.930 |
| Total Return(2)(3) | 6.93% (4) | 8.31% | (5.69)% | 4.85% | 5.29% | 7.12% |
| Ratios/Supplemental Data | | | | | | |
| Net assets, end of period (000’s omitted) | $ 8,016 | $ 8,278 | $10,906 | $ 14,020 | $ 20,894 | $30,108 |
| Ratios (as a percentage of average daily net assets):(5) | | | | | | |
| Expenses (3)(6) | 2.98% (7)(8) | 2.71% (8) | 2.21% (8) | 2.16% | 2.14% | 2.29% |
| Net investment income | 5.31% (7) | 5.05% | 5.16% | 4.33% | 4.69% | 4.80% |
| Portfolio Turnover of the Portfolio | 100% (4) | 56% | 94% | 82% | 80% | 71% |
| (1) | Computed using average shares outstanding. |
| (2) | Returns are historical and are calculated by determining the percentage change in net asset value with all distributions reinvested and do not reflect the effect of sales charges. |
| (3) | The investment adviser and administrator of the Fund and/or the investment adviser of the Portfolio reimbursed certain operating expenses (equal to 0.08%, 0.07%, 0.11%, 0.11%, 0.15% and 0.18% of average daily net assets for the six months ended April 30, 2024 and the years ended October 31, 2023, 2022, 2021, 2020 and 2019, respectively). Absent this reimbursement, total return would be lower. |
| (4) | Not annualized. |
| (5) | Includes the Fund’s share of the Portfolio’s allocated expenses. |
| (6) | Includes interest and/or dividend expense, including on securities sold short and/or reverse repurchase agreements if applicable, of 0.94%, 0.67%, 0.16%, 0.11%, 0.09% and 0.24% of average daily net assets for the six months ended April 30, 2024 and the years ended October 31, 2023, 2022, 2021, 2020 and 2019, respectively. |
| (7) | Annualized. |
| (8) | Includes a reduction by the investment adviser of a portion of the Portfolio’s adviser fee due to the Portfolio’s investment in the Liquidity Fund (equal to 0.01%, 0.01% and less than 0.005% of average daily net assets for the six months ended April 30, 2024 and the years ended October 31, 2023 and 2022, respectively). |
11
See Notes to Financial Statements.
Eaton Vance
Global Macro Absolute Return Advantage Fund
April 30, 2024
Financial Highlights — continued
| | Class I |
| | Six Months Ended
April 30, 2024
(Unaudited) | Year Ended October 31, |
| | 2023 | 2022 | 2021 | 2020 | 2019 |
| Net asset value — Beginning of period | $ 10.060 | $ 9.640 | $ 10.620 | $ 10.610 | $ 10.390 | $ 9.610 |
| Income (Loss) From Operations | | | | | | |
| Net investment income(1) | $ 0.321 | $ 0.593 | $ 0.619 | $ 0.565 | $ 0.592 | $ 0.570 |
| Net realized and unrealized gain (loss) | 0.410 | 0.288 | (1.099) | 0.047 | 0.062 | 0.216 |
| Total income (loss) from operations | $ 0.731 | $ 0.881 | $ (0.480) | $ 0.612 | $ 0.654 | $ 0.786 |
| Less Distributions | | | | | | |
| From net investment income | $ (0.341) | $ (0.461) | $ (0.500) | $ (0.602) | $ (0.434) | $ (0.006) |
| Total distributions | $ (0.341) | $ (0.461) | $ (0.500) | $ (0.602) | $ (0.434) | $ (0.006) |
| Net asset value — End of period | $ 10.450 | $ 10.060 | $ 9.640 | $ 10.620 | $ 10.610 | $ 10.390 |
| Total Return(2)(3) | 7.51% (4) | 9.39% | (4.79)% | 5.93% | 6.36% | 8.18% |
| Ratios/Supplemental Data | | | | | | |
| Net assets, end of period (000’s omitted) | $926,769 | $870,694 | $803,281 | $836,706 | $1,293,211 | $2,075,104 |
| Ratios (as a percentage of average daily net assets):(5) | | | | | | |
| Expenses (3)(6) | 1.98% (7)(8) | 1.71% (8) | 1.21% (8) | 1.16% | 1.14% | 1.29% |
| Net investment income | 6.30% (7) | 5.96% | 6.22% | 5.35% | 5.70% | 5.81% |
| Portfolio Turnover of the Portfolio | 100% (4) | 56% | 94% | 82% | 80% | 71% |
| (1) | Computed using average shares outstanding. |
| (2) | Returns are historical and are calculated by determining the percentage change in net asset value with all distributions reinvested. |
| (3) | The investment adviser and administrator of the Fund and/or the investment adviser of the Portfolio reimbursed certain operating expenses (equal to 0.08%, 0.07%, 0.11%, 0.11%, 0.15% and 0.18% of average daily net assets for the six months ended April 30, 2024 and the years ended October 31, 2023, 2022, 2021, 2020 and 2019, respectively). Absent this reimbursement, total return would be lower. |
| (4) | Not annualized. |
| (5) | Includes the Fund’s share of the Portfolio’s allocated expenses. |
| (6) | Includes interest and/or dividend expense, including on securities sold short and/or reverse repurchase agreements if applicable, of 0.94%, 0.67%, 0.16%, 0.11%, 0.09% and 0.24% of average daily net assets for the six months ended April 30, 2024 and the years ended October 31, 2023, 2022, 2021, 2020 and 2019, respectively. |
| (7) | Annualized. |
| (8) | Includes a reduction by the investment adviser of a portion of the Portfolio’s adviser fee due to the Portfolio’s investment in the Liquidity Fund (equal to 0.01%, 0.01% and less than 0.005% of average daily net assets for the six months ended April 30, 2024 and the years ended October 31, 2023 and 2022, respectively). |
12
See Notes to Financial Statements.
Eaton Vance
Global Macro Absolute Return Advantage Fund
April 30, 2024
Financial Highlights — continued
| | Class R |
| | Six Months Ended
April 30, 2024
(Unaudited) | Year Ended October 31, |
| | 2023 | 2022 | 2021 | 2020 | 2019 |
| Net asset value — Beginning of period | $ 9.760 | $ 9.360 | $10.330 | $ 10.330 | $ 10.120 | $ 9.410 |
| Income (Loss) From Operations | | | | | | |
| Net investment income(1) | $ 0.287 | $ 0.530 | $ 0.554 | $ 0.497 | $ 0.526 | $ 0.515 |
| Net realized and unrealized gain (loss) | 0.393 | 0.284 | (1.073) | 0.055 | 0.064 | 0.195 |
| Total income (loss) from operations | $ 0.680 | $ 0.814 | $ (0.519) | $ 0.552 | $ 0.590 | $ 0.710 |
| Less Distributions | | | | | | |
| From net investment income | $ (0.290) | $ (0.414) | $ (0.451) | $ (0.552) | $ (0.380) | $ — |
| Total distributions | $ (0.290) | $(0.414) | $ (0.451) | $ (0.552) | $ (0.380) | $ — |
| Net asset value — End of period | $10.150 | $ 9.760 | $ 9.360 | $10.330 | $10.330 | $10.120 |
| Total Return(2)(3) | 7.19% (4) | 8.91% | (5.29)% | 5.36% | 5.97% | 7.55% |
| Ratios/Supplemental Data | | | | | | |
| Net assets, end of period (000’s omitted) | $ 1,306 | $ 1,441 | $ 1,340 | $ 1,398 | $ 1,506 | $ 1,566 |
| Ratios (as a percentage of average daily net assets):(5) | | | | | | |
| Expenses (3)(6) | 2.48% (7)(8) | 2.21% (8) | 1.71% (8) | 1.66% | 1.64% | 1.79% |
| Net investment income | 5.81% (7) | 5.48% | 5.71% | 4.82% | 5.18% | 5.35% |
| Portfolio Turnover of the Portfolio | 100% (4) | 56% | 94% | 82% | 80% | 71% |
| (1) | Computed using average shares outstanding. |
| (2) | Returns are historical and are calculated by determining the percentage change in net asset value with all distributions reinvested. |
| (3) | The investment adviser and administrator of the Fund and/or the investment adviser of the Portfolio reimbursed certain operating expenses (equal to 0.08%, 0.07%, 0.11%, 0.11%, 0.15% and 0.18% of average daily net assets for the six months ended April 30, 2024 and the years ended October 31, 2023, 2022, 2021, 2020 and 2019, respectively). Absent this reimbursement, total return would be lower. |
| (4) | Not annualized. |
| (5) | Includes the Fund’s share of the Portfolio’s allocated expenses. |
| (6) | Includes interest and/or dividend expense, including on securities sold short and/or reverse repurchase agreements if applicable, of 0.94%, 0.67%, 0.16%, 0.11%, 0.09% and 0.24% of average daily net assets for the six months ended April 30, 2024 and the years ended October 31, 2023, 2022, 2021, 2020 and 2019, respectively. |
| (7) | Annualized. |
| (8) | Includes a reduction by the investment adviser of a portion of the Portfolio’s adviser fee due to the Portfolio’s investment in the Liquidity Fund (equal to 0.01%, 0.01% and less than 0.005% of average daily net assets for the six months ended April 30, 2024 and the years ended October 31, 2023 and 2022, respectively). |
13
See Notes to Financial Statements.
Eaton Vance
Global Macro Absolute Return Advantage Fund
April 30, 2024
Financial Highlights — continued
| | Class R6 |
| | Six Months Ended
April 30, 2024
(Unaudited) | Year Ended October 31, |
| | 2023 | 2022 | 2021 | 2020 | 2019 |
| Net asset value — Beginning of period | $ 10.050 | $ 9.630 | $ 10.630 | $ 10.620 | $ 10.410 | $ 9.640 |
| Income (Loss) From Operations | | | | | | |
| Net investment income(1) | $ 0.322 | $ 0.595 | $ 0.619 | $ 0.567 | $ 0.576 | $ 0.579 |
| Net realized and unrealized gain (loss) | 0.417 | 0.295 | (1.104) | 0.057 | 0.079 | 0.207 |
| Total income (loss) from operations | $ 0.739 | $ 0.890 | $ (0.485) | $ 0.624 | $ 0.655 | $ 0.786 |
| Less Distributions | | | | | | |
| From net investment income | $ (0.349) | $ (0.470) | $ (0.515) | $ (0.614) | $ (0.445) | $ (0.016) |
| Total distributions | $ (0.349) | $ (0.470) | $ (0.515) | $ (0.614) | $ (0.445) | $ (0.016) |
| Net asset value — End of period | $ 10.440 | $ 10.050 | $ 9.630 | $ 10.630 | $ 10.620 | $ 10.410 |
| Total Return(2)(3) | 7.40% (4) | 9.60% | (4.84)% | 5.94% | 6.56% | 8.07% |
| Ratios/Supplemental Data | | | | | | |
| Net assets, end of period (000’s omitted) | $678,615 | $667,138 | $553,393 | $637,812 | $699,477 | $140,294 |
| Ratios (as a percentage of average daily net assets):(5) | | | | | | |
| Expenses (3)(6) | 1.95% (7)(8) | 1.68% (8) | 1.18% (8) | 1.13% | 1.11% | 1.26% |
| Net investment income | 6.33% (7) | 5.97% | 6.20% | 5.36% | 5.53% | 5.86% |
| Portfolio Turnover of the Portfolio | 100% (4) | 56% | 94% | 82% | 80% | 71% |
| (1) | Computed using average shares outstanding. |
| (2) | Returns are historical and are calculated by determining the percentage change in net asset value with all distributions reinvested. |
| (3) | The investment adviser and administrator of the Fund and/or the investment adviser of the Portfolio reimbursed certain operating expenses (equal to 0.08%, 0.07%, 0.11%, 0.11%, 0.15% and 0.18% of average daily net assets for the six months ended April 30, 2024 and the years ended October 31, 2023, 2022, 2021, 2020 and 2019, respectively). Absent this reimbursement, total return would be lower. |
| (4) | Not annualized. |
| (5) | Includes the Fund’s share of the Portfolio’s allocated expenses. |
| (6) | Includes interest and/or dividend expense, including on securities sold short and/or reverse repurchase agreements if applicable, of 0.94%, 0.67%, 0.16%, 0.11%, 0.09% and 0.24% of average daily net assets for the six months ended April 30, 2024 and the years ended October 31, 2023, 2022, 2021, 2020 and 2019, respectively. |
| (7) | Annualized. |
| (8) | Includes a reduction by the investment adviser of a portion of the Portfolio’s adviser fee due to the Portfolio’s investment in the Liquidity Fund (equal to 0.01%, 0.01% and less than 0.005% of average daily net assets for the six months ended April 30, 2024 and the years ended October 31, 2023 and 2022, respectively). |
14
See Notes to Financial Statements.
Eaton Vance
Global Macro Absolute Return Advantage Fund
April 30, 2024
Notes to Financial Statements (Unaudited)
1 Significant Accounting Policies
Eaton Vance Global Macro Absolute Return Advantage Fund (the Fund) is a non-diversified series of Eaton Vance Mutual Funds Trust (the Trust). The Trust is a Massachusetts business trust registered under the Investment Company Act of 1940, as amended (the 1940 Act), as an open-end management investment company. The Fund offers five classes of shares. Class A shares are generally sold subject to a sales charge imposed at time of purchase. Class C shares are sold at net asset value and are generally subject to a contingent deferred sales charge (see Note 5). Effective November 5, 2020, Class C shares automatically convert to Class A shares eight years after their purchase as described in the Fund’s prospectus. Class I, Class R and Class R6 shares are sold at net asset value and are not subject to a sales charge. Each class represents a pro rata interest in the Fund, but votes separately on class-specific matters and (as noted below) is subject to different expenses. Realized and unrealized gains and losses and net investment income and losses, other than class-specific expenses, are allocated daily to each class of shares based on the relative net assets of each class to the total net assets of the Fund. Sub-accounting, recordkeeping and similar administrative fees payable to financial intermediaries, which are a component of transfer and dividend disbursing agent fees on the Statement of Operations, are not allocated to Class R6 shares. Each class of shares differs in its distribution plan and certain other class-specific expenses. The Fund invests its assets in interests in Global Macro Absolute Return Advantage Portfolio (the Portfolio), a Massachusetts business trust, having the same investment objective and policies as the Fund. The value of the Fund’s investment in the Portfolio reflects the Fund’s proportionate interest in the net assets of the Portfolio (68.0% at April 30, 2024). The performance of the Fund is directly affected by the performance of the Portfolio. The consolidated financial statements of the Portfolio, including the consolidated portfolio of investments, are included elsewhere in this report and should be read in conjunction with the Fund’s financial statements.
The following is a summary of significant accounting policies of the Fund. The policies are in conformity with accounting principles generally accepted in the United States of America (U.S. GAAP). The Fund is an investment company and follows accounting and reporting guidance in the Financial Accounting Standards Board (FASB) Accounting Standards Codification Topic 946.
A Investment Valuation—Valuation of securities by the Portfolio is discussed in Note 1A of the Portfolio's Notes to Consolidated Financial Statements, which are included elsewhere in this report.
B Income—The Fund's net investment income or loss consists of the Fund's pro rata share of the net investment income or loss of the Portfolio, less all actual and accrued expenses of the Fund.
C Federal and Other Taxes—The Fund’s policy is to comply with the provisions of the Internal Revenue Code applicable to regulated investment companies and to distribute to shareholders each year substantially all of its net investment income, and all or substantially all of its net realized capital gains. Accordingly, no provision for federal income or excise tax is necessary.
In addition to the requirements of the Internal Revenue Code, the Fund may also be required to recognize its pro rata share of the capital gains taxes incurred by the Portfolio. In doing so, the daily net asset value would reflect the Fund’s pro rata share of the estimated reserve for such taxes incurred by the Portfolio.
As of April 30, 2024, the Fund had no uncertain tax positions that would require financial statement recognition, de-recognition, or disclosure. The Fund files a U.S. federal income tax return annually after its fiscal year-end, which is subject to examination by the Internal Revenue Service for a period of three years from the date of filing.
D Expenses—The majority of expenses of the Trust are directly identifiable to an individual fund. Expenses which are not readily identifiable to a specific fund are allocated taking into consideration, among other things, the nature and type of expense and the relative size of the funds.
E Use of Estimates—The preparation of the financial statements in conformity with U.S. GAAP requires management to make estimates and assumptions that affect the reported amounts of assets and liabilities at the date of the financial statements and the reported amounts of income and expense during the reporting period. Actual results could differ from those estimates.
F Indemnifications— Under the Trust’s organizational documents, its officers and Trustees may be indemnified against certain liabilities and expenses arising out of the performance of their duties to the Fund. Under Massachusetts law, if certain conditions prevail, shareholders of a Massachusetts business trust (such as the Trust) could be deemed to have personal liability for the obligations of the Trust. However, the Trust’s Declaration of Trust contains an express disclaimer of liability on the part of Fund shareholders and the By-laws provide that the Trust shall assume, upon request by the shareholder, the defense on behalf of any Fund shareholders. Moreover, the By-laws also provide for indemnification out of Fund property of any shareholder held personally liable solely by reason of being or having been a shareholder for all loss or expense arising from such liability. Additionally, in the normal course of business, the Fund enters into agreements with service providers that may contain indemnification clauses. The Fund’s maximum exposure under these arrangements is unknown as this would involve future claims that may be made against the Fund that have not yet occurred.
G Other—Investment transactions are accounted for on a trade date basis.
H Interim Financial Statements—The interim financial statements relating to April 30, 2024 and for the six months then ended have not been audited by an independent registered public accounting firm, but in the opinion of the Fund’s management, reflect all adjustments, consisting only of normal recurring adjustments, necessary for the fair presentation of the financial statements.
Eaton Vance
Global Macro Absolute Return Advantage Fund
April 30, 2024
Notes to Financial Statements (Unaudited) — continued
2 Distributions to Shareholders and Income Tax Information
It is the present policy of the Fund to make at least one distribution annually (normally in December) of all or substantially all of its net investment income and to distribute annually all or substantially all of its net realized capital gains. Distributions to shareholders are recorded on the ex-dividend date. Distributions are declared separately for each class of shares. Shareholders may reinvest income and capital gain distributions in additional shares of the same class of the Fund at the net asset value as of the ex-dividend date or, at the election of the shareholder, receive distributions in cash. Distributions to shareholders are determined in accordance with income tax regulations, which may differ from U.S. GAAP. As required by U.S. GAAP, only distributions in excess of tax basis earnings and profits are reported in the financial statements as a return of capital. Permanent differences between book and tax accounting relating to distributions are reclassified to paid-in capital. For tax purposes, distributions from short-term capital gains are considered to be from ordinary income.
At October 31, 2023, the Fund, for federal income tax purposes, had deferred capital losses of $166,060,960 which would reduce its taxable income arising from future net realized gains on investment transactions, if any, to the extent permitted by the Internal Revenue Code, and thus would reduce the amount of distributions to shareholders, which would otherwise be necessary to relieve the Fund of any liability for federal income or excise tax. The deferred capital losses are treated as arising on the first day of the Fund’s next taxable year and retain the same short-term or long-term character as when originally deferred. Of the deferred capital losses at October 31, 2023, $35,614,689 are short-term and $130,446,271 are long-term.
3 Investment Adviser and Administration Fee and Other Transactions with Affiliates
The investment adviser and administration fee is earned by Eaton Vance Management (EVM), an indirect, wholly-owned subsidiary of Morgan Stanley, as compensation for investment advisory and administrative services rendered to the Fund. The investment adviser and administration fee is computed at an annual rate as a percentage of the Fund’s average daily net assets that are not invested in other investment companies for which EVM or its affiliates serve as investment adviser and receive an advisory fee as follows and is payable monthly:
| Average Daily Net Assets | Annual Fee Rate |
| Up to $500 million | 1.000% |
| $500 million but less than $1 billion | 0.950% |
| $1 billion but less than $2.5 billion | 0.925% |
| $2.5 billion but less than $5 billion | 0.900% |
| $5 billion and over | 0.880% |
For the six months ended April 30, 2024, the Fund incurred no investment adviser and administration fee on such assets. Pursuant to an investment sub-advisory agreement, EVM has delegated a portion of the investment management of the Fund to Eaton Vance Advisers International Ltd. (EVAIL), an affiliate of EVM and an indirect, wholly-owned subsidiary of Morgan Stanley. EVM pays EVAIL a portion of its investment adviser and administration fee for sub-advisory services provided to the Fund. To the extent the Fund’s assets are invested in the Portfolio, the Fund is allocated its share of the Portfolio’s investment adviser fee. The Portfolio has engaged Boston Management and Research (BMR) to render investment advisory services. See Note 2 of the Portfolio’s Notes to Consolidated Financial Statements which are included elsewhere in this report.
EVM has agreed to reimburse the Fund’s expenses to the extent that total annual operating expenses (relating to ordinary operating expenses only and excluding such expenses as brokerage commissions, acquired fund fees and expenses of unaffiliated funds, borrowing costs, taxes or litigation expenses) exceed 1.30%, 2.05%, 1.05%, 1.55% and 1.02% of the Fund’s average daily net assets for Class A, Class C, Class I, Class R and Class R6, respectively. This agreement may be changed or terminated after March 1, 2025. Pursuant to this agreement, EVM was allocated $679,760 of the Fund’s operating expenses for the six months ended April 30, 2024.
EVM provides sub-transfer agency and related services to the Fund pursuant to a Sub-Transfer Agency Support Services Agreement. For the six months ended April 30, 2024, EVM earned $17,644 from the Fund pursuant to such agreement, which is included in transfer and dividend disbursing agent fees on the Statement of Operations. The Fund was informed that Eaton Vance Distributors, Inc. (EVD), an affiliate of EVM and the Fund's principal underwriter, received $557 as its portion of the sales charge on sales of Class A shares for the six months ended April 30, 2024. The Fund was informed that Morgan Stanley affiliated broker-dealers, which may be deemed to be affiliates of EVM, BMR and EVD, also received a portion of the sales charge on sales of Class A shares for the six months ended April 30, 2024 in the amount of $880. EVD also received distribution and service fees from Class A, Class C and Class R shares (see Note 4) and contingent deferred sales charges (see Note 5).
Trustees and officers of the Fund who are members of EVM’s or BMR's organizations receive remuneration for their services to the Fund out of the investment adviser fee. Certain officers and Trustees of the Fund and the Portfolio are officers of the above organizations.
Eaton Vance
Global Macro Absolute Return Advantage Fund
April 30, 2024
Notes to Financial Statements (Unaudited) — continued
4 Distribution Plans
The Fund has in effect a distribution plan for Class A shares (Class A Plan) pursuant to Rule 12b-1 under the 1940 Act. Pursuant to the Class A Plan, the Fund pays EVD a distribution and service fee of 0.25% per annum of its average daily net assets attributable to Class A shares for distribution services and facilities provided to the Fund by EVD, as well as for personal services and/or the maintenance of shareholder accounts. Distribution and service fees paid or accrued to EVD for the six months ended April 30, 2024 amounted to $338,114 for Class A shares.
The Fund also has in effect distribution plans for Class C shares (Class C Plan) and Class R shares (Class R Plan) pursuant to Rule 12b-1 under the 1940 Act. Pursuant to the Class C Plan, the Fund pays EVD amounts equal to 0.75% per annum of its average daily net assets attributable to Class C shares for providing ongoing distribution services and facilities to the Fund. For the six months ended April 30, 2024, the Fund paid or accrued to EVD $29,937 for Class C shares. The Class R Plan requires the Fund to pay EVD an amount up to 0.50% per annum of its average daily net assets attributable to Class R shares for providing ongoing distribution services and facilities to the Fund. The Trustees of the Trust have currently limited Class R distribution payments to 0.25% per annum of the average daily net assets attributable to Class R shares. For the six months ended April 30, 2024, the Fund paid or accrued to EVD $1,718 for Class R shares.
Pursuant to the Class C and Class R Plans, the Fund also makes payments of service fees to EVD, financial intermediaries and other persons in amounts equal to 0.25% per annum of its average daily net assets attributable to that class. Service fees paid or accrued are for personal services and/or the maintenance of shareholder accounts. They are separate and distinct from the sales commissions and distribution fees payable to EVD. Service fees paid or accrued for the six months ended April 30, 2024 amounted to $9,979 and $1,718 for Class C and Class R shares, respectively.
Distribution and service fees are subject to the limitations contained in the Financial Industry Regulatory Authority Rule 2341(d).
5 Contingent Deferred Sales Charges
A contingent deferred sales charge (CDSC) of 1% generally is imposed on redemptions of Class C shares made within 12 months of purchase. Class A shares may be subject to a 0.75% CDSC if redeemed within 12 months of purchase (depending on the circumstances of purchase). Generally, the CDSC is based upon the lower of the net asset value at date of redemption or date of purchase. No charge is levied on shares acquired by reinvestment of dividends or capital gain distributions. For the six months ended April 30, 2024, the Fund was informed that EVD received no CDSCs paid by Class A and Class C shareholders.
6 Investment Transactions
For the six months ended April 30, 2024, increases and decreases in the Fund's investment in the Portfolio aggregated $107,328,985 and $129,956,418, respectively.
7 Shares of Beneficial Interest
The Fund’s Declaration of Trust permits the Trustees to issue an unlimited number of full and fractional shares of beneficial interest (without par value). Such shares may be issued in a number of different series (such as the Fund) and classes. Transactions in Fund shares, including direct exchanges pursuant to share class conversions, were as follows:
| | Six Months Ended
April 30, 2024
(Unaudited) | | Year Ended
October 31, 2023 |
| | Shares | Amount | | Shares | Amount |
| Class A | | | | | |
| Sales | 4,438,851 | $ 45,870,211 | | 11,588,829 | $ 111,848,668 |
| Issued to shareholders electing to receive payments of distributions in Fund shares | 822,420 | 8,133,738 | | 1,066,399 | 10,056,139 |
| Redemptions | (2,306,224) | (23,594,438) | | (2,537,454) | (24,695,662) |
| Net increase | 2,955,047 | $ 30,409,511 | | 10,117,774 | $ 97,209,145 |
Eaton Vance
Global Macro Absolute Return Advantage Fund
April 30, 2024
Notes to Financial Statements (Unaudited) — continued
| | Six Months Ended
April 30, 2024
(Unaudited) | | Year Ended
October 31, 2023 |
| | Shares | Amount | | Shares | Amount |
| Class C | | | | | |
| Sales | 112,567 | $ 1,115,924 | | 104,536 | $ 989,341 |
| Issued to shareholders electing to receive payments of distributions in Fund shares | 18,093 | 175,497 | | 42,411 | 391,875 |
| Redemptions | (193,688) | (1,906,364) | | (469,383) | (4,489,968) |
| Net decrease | (63,028) | $ (614,943) | | (322,436) | $ (3,108,752) |
| Class I | | | | | |
| Sales | 15,586,253 | $ 159,150,815 | | 36,991,589 | $ 369,797,271 |
| Issued to shareholders electing to receive payments of distributions in Fund shares | 2,596,195 | 26,039,831 | | 3,259,856 | 31,164,219 |
| Redemptions | (16,036,349) | (163,878,449) | | (37,089,500) | (367,367,397) |
| Net increase | 2,146,099 | $ 21,312,197 | | 3,161,945 | $ 33,594,093 |
| Class R | | | | | |
| Sales | 9,995 | $ 98,511 | | 19,772 | $ 191,706 |
| Issued to shareholders electing to receive payments of distributions in Fund shares | 4,131 | 40,321 | | 6,297 | 58,629 |
| Redemptions | (33,198) | (330,070) | | (21,522) | (207,059) |
| Net increase (decrease) | (19,072) | $ (191,238) | | 4,547 | $ 43,276 |
| Class R6 | | | | | |
| Sales | 7,619,735 | $ 78,116,320 | | 23,604,243 | $ 235,246,715 |
| Issued to shareholders electing to receive payments of distributions in Fund shares | 793,518 | 7,943,119 | | 1,216,876 | 11,621,165 |
| Redemptions | (9,736,951) | (99,349,572) | | (15,910,031) | (157,941,219) |
| Net increase (decrease) | (1,323,698) | $ (13,290,133) | | 8,911,088 | $ 88,926,661 |
Global Macro Absolute Return Advantage Portfolio
April 30, 2024
Consolidated Portfolio of Investments (Unaudited)
| Collateralized Mortgage Obligations — 5.2% |
| Security | Principal
Amount
(000's omitted) | Value |
| Federal Home Loan Mortgage Corp.: | | | |
| Interest Only:(1) | | | |
| Series 2770, Class SH, 1.656%, (6.986% - 30-day SOFR Average), 3/15/34(2) | $ | 564 | $ 50,400 |
| Series 4791, Class JI, 4.00%, 5/15/48 | | 6,979 | 1,547,168 |
| Federal National Mortgage Association: | | | |
| Series 2023-54, Class C, 6.50%, 11/25/53(3) | | 7,070 | 7,204,805 |
| Interest Only:(1) | | | |
| Series 424, Class C8, 3.50%, 2/25/48 | | 8,871 | 1,601,086 |
| Series 2010-109, Class PS, 1.156%, (6.486% - 30-day SOFR Average), 10/25/40(2) | | 1,227 | 74,360 |
| Series 2018-21, Class IO, 3.00%, 4/25/48 | | 7,857 | 1,368,191 |
| Series 2018-58, Class BI, 4.00%, 8/25/48 | | 1,293 | 270,945 |
| Government National Mortgage Association: | | | |
| Series 2023-148, Class HL, 6.50%, 10/20/53(3) | | 7,070 | 7,174,437 |
| Sereis 2023-151, Class GL, 6.50%, 10/20/53(3) | | 5,096 | 5,171,340 |
| Series 2023-155, Class CH, 6.50%, 10/20/53(3) | | 19,303 | 19,598,919 |
| Series 2023-165, Class EY, 6.50%, 11/20/53(3) | | 35,330 | 35,891,118 |
| Series 2023-169, Class JW, 6.50%, 11/20/53(3) | | 3,600 | 3,661,321 |
| Series 2024-1, Class GL, 6.00%, 1/20/54(3) | | 3,616 | 3,550,751 |
| Series 2024-3, Class CY, 6.00%, 1/20/54(3) | | 1,516 | 1,488,716 |
| Series 2024-6, Class CB, 6.00%, 1/20/54(3) | | 6,573 | 6,453,310 |
| Series 2024-6, Class LB, 6.00%, 1/20/54(3) | | 1,288 | 1,264,258 |
| Series 2024-25, Class GL, 6.00%, 2/20/54 | | 2,208 | 2,159,703 |
| PNMAC GMSR Issuer Trust, 2024 Participation, 11.068%, (30-day SOFR Average + 5.75%), 12/24/24(4) | | 6,442 | 6,492,847 |
| Unison Trust, Series 2021-1, Class A, 4.50%, 4/25/50(5)(6) | | 45,442 | 40,571,833 |
Total Collateralized Mortgage Obligations
(identified cost $173,319,804) | | | $ 145,595,508 |
| Security | Shares | Value |
| Bulgaria — 0.3% |
| Eurohold Bulgaria AD(7) | | 10,954,272 | $ 7,844,031 |
| | | | $ 7,844,031 |
| Cyprus — 0.8% |
| Bank of Cyprus Holdings PLC | | 5,391,218 | $ 21,526,972 |
| Galaxy Cosmos Mezz PLC | | 48,440 | 40,544 |
| Sunrisemezz PLC | | 272,828 | 99,435 |
| | | | $ 21,666,951 |
| Security | Shares | Value |
| Georgia — 1.0% |
| Bank of Georgia Group PLC | | 137,373 | $ 9,198,365 |
| Georgia Capital PLC(7) | | 579,892 | 9,852,457 |
| TBC Bank Group PLC | | 217,683 | 9,391,732 |
| | | | $ 28,442,554 |
| Greece — 2.2% |
| Alpha Services and Holdings SA(7) | | 1,820,600 | $ 3,074,297 |
| Athens International Airport SA(7) | | 45,135 | 400,277 |
| Cenergy Holdings SA | | 226,100 | 1,908,721 |
| Eurobank Ergasias Services and Holdings SA, Class A(7) | | 3,074,700 | 6,577,540 |
| Hellenic Telecommunications Organization SA | | 325,212 | 4,940,506 |
| Ideal Holdings SA | | 45,400 | 302,426 |
| JUMBO SA | | 203,438 | 6,331,520 |
| Motor Oil (Hellas) Corinth Refineries SA | | 109,300 | 3,171,231 |
| Mytilineos SA | | 145,257 | 5,893,093 |
| National Bank of Greece SA(7) | | 837,127 | 6,736,963 |
| OPAP SA | | 233,095 | 3,877,907 |
| Optima bank SA(7) | | 186,213 | 2,112,823 |
| Piraeus Financial Holdings SA(7) | | 3,371,096 | 13,504,448 |
| Public Power Corp. SA(7) | | 186,100 | 2,221,371 |
| Titan Cement International SA | | 7,468 | 236,387 |
| | | | $ 61,289,510 |
| Iceland — 0.2% |
| Arion Banki Hf.(5) | | 1,970,378 | $ 2,000,916 |
| Eik fasteignafelag Hf. | | 6,056,328 | 417,606 |
| Eimskipafelag Islands Hf. | | 483,446 | 1,115,798 |
| Hagar Hf. | | 1,926,423 | 1,020,598 |
| Islandsbanki Hf. | | 1,104,783 | 813,167 |
| Reginn Hf.(7) | | 2,864,793 | 456,331 |
| Reitir fasteignafelag Hf. | | 1,754,792 | 937,141 |
| Siminn Hf. | | 3,351,976 | 237,572 |
| | | | $ 6,999,129 |
| Poland — 2.3% |
| Alior Bank SA(7) | | 66,107 | $ 1,684,094 |
| Allegro.eu SA(5)(7) | | 417,704 | 3,482,025 |
| AmRest Holdings SE(7) | | 56,376 | 365,292 |
| Asseco Poland SA | | 40,317 | 792,350 |
| Bank Millennium SA(7) | | 450,948 | 1,026,756 |
| Bank Polska Kasa Opieki SA | | 140,796 | 5,828,996 |
| Budimex SA | | 10,034 | 1,697,382 |
| CCC SA(7) | | 38,148 | 884,267 |
| CD Projekt SA | | 50,560 | 1,470,908 |
| Cyfrowy Polsat SA(7) | | 196,985 | 485,455 |
| Dino Polska SA(5)(7) | | 37,998 | 3,640,304 |
19
See Notes to Consolidated Financial Statements.
Global Macro Absolute Return Advantage Portfolio
April 30, 2024
Consolidated Portfolio of Investments (Unaudited) — continued
| Security | Shares | Value |
| Poland (continued) |
| Enea SA(7) | | 202,252 | $ 421,942 |
| Eurocash SA | | 61,718 | 207,492 |
| Grupa Azoty SA(7) | | 34,078 | 184,065 |
| Grupa Kety SA | | 7,490 | 1,552,037 |
| Jastrzebska Spolka Weglowa SA(7) | | 41,170 | 309,944 |
| KGHM Polska Miedz SA | | 102,976 | 3,540,278 |
| KRUK SA | | 12,056 | 1,370,415 |
| LPP SA | | 820 | 3,159,616 |
| mBank SA(7) | | 11,202 | 1,881,249 |
| Orange Polska SA | | 473,873 | 916,016 |
| ORLEN SA | | 415,272 | 6,770,754 |
| Pepco Group NV(7)(8) | | 125,339 | 590,943 |
| PGE Polska Grupa Energetyczna SA(7) | | 704,333 | 1,049,804 |
| Powszechna Kasa Oszczednosci Bank Polski SA | | 654,320 | 9,714,770 |
| Powszechny Zaklad Ubezpieczen SA | | 487,100 | 6,130,586 |
| Santander Bank Polska SA | | 26,855 | 3,680,020 |
| Tauron Polska Energia SA(7) | | 791,900 | 568,361 |
| Text SA | | 13,085 | 289,734 |
| Warsaw Stock Exchange | | 20,509 | 227,140 |
| XTB SA(5) | | 38,845 | 607,070 |
| | | | $ 64,530,065 |
| United Kingdom — 0.0%(9) |
| Tesnik Cuatro Ltd.(10) | | 584,285 | $ 367,399 |
| | | | $ 367,399 |
| Vietnam — 0.8% |
| Bank for Foreign Trade of Vietnam JSC(7) | | 488,725 | $ 1,755,786 |
| Duc Giang Chemicals JSC | | 238,600 | 1,113,603 |
| FPT Corp. | | 1,500,675 | 7,801,532 |
| FPT Digital Retail JSC | | 85,200 | 539,628 |
| Gemadept Corp. | | 193,900 | 641,760 |
| Hoa Phat Group JSC(7) | | 1,781,421 | 1,994,361 |
| KIDO Group Corp. | | 42,590 | 104,848 |
| Masan Group Corp.(7) | | 167,040 | 441,156 |
| Mobile World Investment Corp. | | 1,186,200 | 2,558,630 |
| Phu Nhuan Jewelry JSC | | 525,166 | 2,024,400 |
| Refrigeration Electrical Engineering Corp. | | 642,424 | 1,668,098 |
| SSI Securities Corp. | | 280,688 | 388,594 |
| Vietnam Dairy Products JSC | | 389,696 | 998,049 |
| Vingroup JSC(7) | | 513,852 | 898,687 |
| | | | $ 22,929,132 |
Total Common Stocks
(identified cost $175,412,499) | | | $ 214,068,771 |
| Security | Principal
Amount
(000's omitted) | Value |
| China — 0.0%(9) |
| Sunac China Holdings Ltd., 1.00%, 9/30/32(8)(11) | USD | 900 | $ 49,498 |
| | | | $ 49,498 |
| India — 0.2% |
| Indiabulls Housing Finance Ltd., 4.50%, 9/28/26(8) | USD | 4,605 | $ 4,514,558 |
| | | | $ 4,514,558 |
Total Convertible Bonds
(identified cost $5,400,052) | | | $ 4,564,056 |
| Foreign Corporate Bonds — 5.4% |
| Security | Principal
Amount
(000's omitted) | Value |
| Brazil — 0.0%(9) |
| Coruripe Netherlands BV: | | | |
| 10.00%, 2/10/27(5) | USD | 357 | $ 319,258 |
| 10.00%, 2/10/27(8) | USD | 882 | 788,754 |
| | | | $ 1,108,012 |
| China — 0.1% |
| KWG Group Holdings Ltd., 7.875%, 8/30/24(12) | USD | 2,385 | $ 119,250 |
| Shimao Group Holdings Ltd., 5.60%, 7/15/26(8)(12) | USD | 7,800 | 273,000 |
| Sunac China Holdings Ltd.: | | | |
| 6.00%, (5.00% cash or 6.00% PIK), 9/30/26(8)(11) | USD | 746 | 78,346 |
| 6.25%, (5.25% cash or 6.25% PIK), 9/30/27(8)(11) | USD | 747 | 72,965 |
| 6.50%, (5.50% cash or 6.50% PIK), 9/30/27(8)(11) | USD | 1,496 | 119,675 |
| 6.75%, (5.75% cash or 6.75% PIK), 9/30/28(8)(11) | USD | 2,247 | 167,530 |
| 7.00%, (6.00% cash or 7.00% PIK), 9/30/29(8)(11) | USD | 2,249 | 149,019 |
| 7.25%, (6.25% cash or 7.25% PIK), 9/30/30(8)(11) | USD | 1,058 | 58,183 |
| Times China Holdings Ltd.: | | | |
| 5.55%, 6/4/24(8)(12) | USD | 6,284 | 162,756 |
| 6.75%, 7/16/23(8)(12) | USD | 4,471 | 100,598 |
| | | | $ 1,301,322 |
20
See Notes to Consolidated Financial Statements.
Global Macro Absolute Return Advantage Portfolio
April 30, 2024
Consolidated Portfolio of Investments (Unaudited) — continued
| Security | Principal
Amount
(000's omitted) | Value |
| Georgia — 1.1% |
| Bank of Georgia JSC: | | | |
| 9.50% to 7/16/29(5)(13)(14) | USD | 480 | $ 476,558 |
| 9.50% to 7/16/29(8)(13)(14) | USD | 20,790 | 20,640,936 |
| TBC Bank JSC, 10.25% to 7/30/29(8)(13)(14) | USD | 11,120 | 11,110,878 |
| | | | $ 32,228,372 |
| Hungary — 0.1% |
| MBH Bank Nyrt, 8.625% to 10/19/26, 10/19/27(8)(14) | EUR | 3,382 | $ 3,809,821 |
| | | | $ 3,809,821 |
| Iceland — 0.0% |
| Wow Air Hf.: | | | |
| 0.00% (10)(12)(13) | EUR | 121 | $ 0 |
| 0.00%, (3 mo. EURIBOR + 9.00%)(10)(12)(13) | EUR | 5,500 | 0 |
| | | | $ 0 |
| India — 0.0%(9) |
| Vedanta Resources Finance II PLC, 13.875%, 1/21/27(8) | USD | 1,041 | $ 976,129 |
| | | | $ 976,129 |
| Kazakhstan — 0.8% |
| Development Bank of Kazakhstan JSC, 13.00%, 4/15/27(5) | KZT | 10,204,000 | $ 22,820,155 |
| | | | $ 22,820,155 |
| Mexico — 0.1% |
| Alpha Holding SA de CV: | | | |
| 9.00%, 2/10/25(8)(12) | USD | 5,542 | $ 83,135 |
| 10.00%, 12/19/22(8)(12) | USD | 2,697 | 40,453 |
| Grupo Kaltex SA de CV, 14.50%, (13.00% cash and 1.50% PIK), 9/30/25(5) | USD | 2,068 | 1,706,100 |
| | | | $ 1,829,688 |
| Moldova — 0.1% |
| Aragvi Finance International DAC, 8.45%, 4/29/26(8) | USD | 2,262 | $ 1,853,935 |
| | | | $ 1,853,935 |
| Paraguay — 0.5% |
| Itau BBA International PLC, 9.03%, 2/19/30 | PYG | 86,780,460 | $ 12,540,037 |
| | | | $ 12,540,037 |
| Security | Principal
Amount
(000's omitted) | Value |
| Saint Lucia — 0.0%(9) |
| Digicel Intermediate Holdings Ltd./Digicel International Finance Ltd./DIFL U.S., 10.50%, (9.00% cash and 1.50% PIK), 5/25/27 | USD | 1 | $ 532 |
| | | | $ 532 |
| Supranational — 0.4% |
| European Bank for Reconstruction & Development: | | | |
| 17.20%, 4/9/26(8) | USD | 8,700 | $ 8,700,687 |
| 17.35%, 3/1/27(8) | USD | 3,200 | 3,149,165 |
| | | | $ 11,849,852 |
| Tunisia — 0.0%(9) |
| Tunisian Republic, 3.28%, 8/9/27 | JPY | 100,000 | $ 431,945 |
| | | | $ 431,945 |
| United Arab Emirates — 1.3% |
| Abu Dhabi Developmental Holding Co. PJSC, 5.50%, 5/8/34(5) | USD | 36,338 | $ 36,158,854 |
| | | | $ 36,158,854 |
| Uzbekistan — 0.7% |
| International Finance Corp., 16.00%, 2/21/25 | UZS | 25,000,000 | $ 1,960,361 |
| Ipoteka-Bank ATIB, 20.50%, 4/25/27(8) | UZS | 228,330,000 | 18,106,814 |
| | | | $ 20,067,175 |
| Venezuela — 0.2% |
| Petroleos de Venezuela SA: | | | |
| 5.375%, 4/12/27(8)(12) | USD | 8,079 | $ 1,009,907 |
| 6.00%, 5/16/24(8)(12) | USD | 3,960 | 495,000 |
| 6.00%, 11/15/26(8)(12) | USD | 3,960 | 495,990 |
| 8.50%, 10/27/20(8)(12) | USD | 2,736 | 2,158,899 |
| 9.00%, 11/17/21(8)(12) | USD | 3,960 | 529,988 |
| 9.75%, 5/17/35(8)(12) | USD | 3,960 | 601,920 |
| 12.75%, 2/17/22(8)(12) | USD | 3,940 | 608,792 |
| | | | $ 5,900,496 |
Total Foreign Corporate Bonds
(identified cost $184,490,686) | | | $ 152,876,325 |
21
See Notes to Consolidated Financial Statements.
Global Macro Absolute Return Advantage Portfolio
April 30, 2024
Consolidated Portfolio of Investments (Unaudited) — continued
| Loan Participation Notes — 1.9% |
| Security | Principal
Amount
(000's omitted) | Value |
| Uzbekistan — 1.9% |
| Daryo Finance BV (borrower - Uzbek Industrial and Construction Bank ATB), 18.75%, 6/15/25(8)(10)(15) | UZS | 316,179,530 | $ 26,935,425 |
| Europe Asia Investment Finance BV (borrower - Joint Stock Commercial Bank “Asaka”), 18.70%, 7/21/26(8)(10)(15) | UZS | 331,541,810 | 27,203,861 |
Total Loan Participation Notes
(identified cost $56,417,884) | | | $ 54,139,286 |
| Reinsurance Side Cars — 1.5% |
| Security | Shares | Value |
| Eden Re II Ltd.: | | | |
| Series 2021A, 0.00%, 3/21/25(5)(10)(16)(17) | | 326,007 | $ 93,564 |
| Series 2022A, 0.00%, 3/20/26(5)(10)(16)(17) | | 230,974 | 133,411 |
| Series 2022B, 0.00%, 3/20/26(5)(10)(16)(17) | | 463,327 | 263,123 |
| Series 2024A, 0.00%, 3/17/28(5)(10)(16)(17) | | 13,000,000 | 13,417,300 |
| Mt. Logan Re Ltd., Series A-1(7)(10)(17)(18) | | 8,600 | 11,815,016 |
| PartnerRe ILS Fund SAC Ltd.(10)(17)(18) | | 13,000,000 | 13,449,800 |
| Sussex Capital Ltd.: | | | |
| Designated Investment Series 14(7)(10)(17)(18) | | 1,114 | 24,047 |
| Designated Investment Series 14(7)(10)(17)(18) | | 1,081 | 305,880 |
| Series 14, Preference Shares(10)(17)(18) | | 1,466 | 1,864,819 |
Total Reinsurance Side Cars
(identified cost $38,845,800) | | | $ 41,366,960 |
| Senior Floating-Rate Loans — 0.6%(19) |
| Borrower/Description | Principal
Amount
(000's omitted) | Value |
| Argentina — 0.0%(9) |
| Desa LLC, Term Loan, 2.50%, 6/30/24(10)(20) | $ | 426 | $ 407,885 |
| | | | $ 407,885 |
| Tanzania — 0.6% |
| Tanzania, Term Loan, 10.696%, (SOFR + 5.45%), 2/27/31 | $ | 16,200 | $ 16,159,500 |
| | | | $ 16,159,500 |
Total Senior Floating-Rate Loans
(identified cost $16,621,974) | | | $ 16,567,385 |
| Sovereign Government Bonds — 51.5% |
| Security | Principal
Amount
(000's omitted) | Value |
| Albania — 2.1% |
| Albania Government International Bonds: | | | |
| 3.50%, 6/16/27(8) | EUR | 304 | $ 314,978 |
| 3.50%, 11/23/31(8) | EUR | 9,744 | 9,372,649 |
| 5.90%, 6/9/28(8) | EUR | 39,296 | 43,234,654 |
| Albanian Government Bonds, 5.25%, 1/26/29 | ALL | 506,700 | 5,452,717 |
| | | | $ 58,374,998 |
| Angola — 1.7% |
| Angola Government International Bonds: | | | |
| 8.75%, 4/14/32(8) | USD | 17,010 | $ 15,433,853 |
| 9.125%, 11/26/49(8) | USD | 18,421 | 15,373,614 |
| 9.375%, 5/8/48(8) | USD | 20,954 | 17,871,038 |
| | | | $ 48,678,505 |
| Argentina — 0.3% |
| Bonos Para La Reconstruccion De Una Argentina Libre: | | | |
| 0.00%, 6/30/25 | USD | 5,449 | $ 5,030,271 |
| 3.00%, 5/31/26 | USD | 5,535 | 4,360,425 |
| | | | $ 9,390,696 |
| Armenia — 2.0% |
| Republic of Armenia Treasury Bonds: | | | |
| 9.00%, 4/29/26 | AMD | 592,250 | $ 1,512,674 |
| 9.25%, 4/29/28 | AMD | 5,316,340 | 13,531,966 |
| 9.60%, 10/29/33 | AMD | 12,278,380 | 31,673,475 |
| 9.75%, 10/29/50 | AMD | 1,586,875 | 4,132,307 |
| 9.75%, 10/29/52 | AMD | 1,720,950 | 4,474,681 |
| | | | $ 55,325,103 |
| Bahamas — 0.5% |
| Bahamas Government International Bonds: | | | |
| 6.00%, 11/21/28(8) | USD | 8,125 | $ 7,266,685 |
| 8.95%, 10/15/32(8) | USD | 6,418 | 6,191,606 |
| | | | $ 13,458,291 |
| Barbados — 0.2% |
| Barbados Government International Bonds, 6.50%, 10/1/29(8) | USD | 7,111 | $ 6,734,117 |
| | | | $ 6,734,117 |
22
See Notes to Consolidated Financial Statements.
Global Macro Absolute Return Advantage Portfolio
April 30, 2024
Consolidated Portfolio of Investments (Unaudited) — continued
| Security | Principal
Amount
(000's omitted) | Value |
| Benin — 2.7% |
| Benin Government International Bonds: | | | |
| 4.875%, 1/19/32(8) | EUR | 19,208 | $ 17,420,383 |
| 4.95%, 1/22/35(8) | EUR | 24,515 | 21,198,887 |
| 6.875%, 1/19/52(8) | EUR | 37,044 | 32,262,596 |
| 7.96%, 2/13/38(8) | USD | 4,920 | 4,651,122 |
| | | | $ 75,532,988 |
| Cameroon — 0.5% |
| Republic of Cameroon International Bonds, 5.95%, 7/7/32(8) | EUR | 15,891 | $ 13,325,358 |
| | | | $ 13,325,358 |
| China — 1.4% |
| China Government Bonds: | | | |
| 2.67%, 11/25/33 | CNY | 141,300 | $ 20,024,801 |
| 3.00%, 10/15/53 | CNY | 120,500 | 18,238,412 |
| | | | $ 38,263,213 |
| Colombia — 1.2% |
| Titulos De Tesoreria B: | | | |
| 6.25%, 7/9/36 | COP | 46,839,800 | $ 8,313,580 |
| 9.25%, 5/28/42 | COP | 118,815,500 | 25,919,769 |
| | | | $ 34,233,349 |
| Dominican Republic — 3.4% |
| Dominican Republic Bonds: | | | |
| 8.00%, 1/15/27(8) | DOP | 128,350 | $ 2,046,111 |
| 8.00%, 2/12/27(8) | DOP | 621,240 | 9,910,058 |
| 11.25%, 9/15/35(5) | DOP | 289,800 | 5,234,277 |
| 11.25%, 9/15/35(8) | DOP | 116,200 | 2,098,768 |
| 12.00%, 8/8/25(5) | DOP | 535,040 | 9,312,346 |
| 12.75%, 9/23/29(5) | DOP | 1,010,500 | 19,578,961 |
| 13.00%, 6/10/34(8) | DOP | 402,900 | 8,247,365 |
| 13.625%, 2/3/33(8) | DOP | 45,000 | 919,211 |
| 13.625%, 2/3/33(5) | DOP | 827,650 | 16,906,335 |
| Dominican Republic Central Bank Notes: | | | |
| 8.00%, 3/12/27(8) | DOP | 46,050 | 741,295 |
| 12.00%, 10/3/25(5) | DOP | 379,500 | 6,619,342 |
| 13.00%, 12/5/25(5) | DOP | 497,230 | 8,738,471 |
| 13.00%, 1/30/26(5) | DOP | 342,670 | 6,045,362 |
| | | | $ 96,397,902 |
| Security | Principal
Amount
(000's omitted) | Value |
| Ecuador — 2.2% |
| Ecuador Government International Bonds: | | | |
| 0.00%, 7/31/30(8) | USD | 57,236 | $ 31,327,514 |
| 2.50% to 7/31/24, 7/31/40(8)(21) | USD | 296 | 123,504 |
| 2.50% to 7/31/24, 7/31/40(8)(21) | USD | 2,242 | 934,830 |
| 2.50% to 7/31/24, 7/31/40(8)(21) | USD | 3,486 | 1,453,546 |
| 2.50% to 7/31/24, 7/31/40(8)(21) | USD | 5,975 | 3,070,960 |
| 3.50% to 7/31/24, 7/31/35(8)(21) | USD | 26,353 | 14,539,236 |
| 6.00% to 7/31/24, 7/31/30(8)(21) | USD | 14,347 | 10,127,069 |
| | | | $ 61,576,659 |
| El Salvador — 0.9% |
| El Salvador Government International Bonds: | | | |
| 6.375%, 1/18/27(8) | USD | 6,520 | $ 5,804,530 |
| 7.625%, 2/1/41(8) | USD | 7,942 | 5,491,401 |
| 7.65%, 6/15/35(8) | USD | 534 | 387,002 |
| 8.25%, 4/10/32(8) | USD | 17,250 | 13,881,353 |
| | | | $ 25,564,286 |
| Ethiopia — 1.6% |
| Ethiopia International Bonds, 6.625%, 12/11/24(8)(12) | USD | 65,040 | $ 46,065,230 |
| | | | $ 46,065,230 |
| Ghana — 2.0% |
| Ghana Government International Bonds: | | | |
| 6.375%, 2/11/27(8)(12) | USD | 7,300 | $ 3,534,470 |
| 7.625%, 5/16/29(8)(12) | USD | 20,259 | 9,870,185 |
| 7.75%, 4/7/29(8)(12) | USD | 10,826 | 5,281,572 |
| 7.875%, 3/26/27(8)(12) | USD | 2,904 | 1,419,275 |
| 7.875%, 2/11/35(8)(12) | USD | 7,615 | 3,712,313 |
| 8.125%, 1/18/26(8)(12) | USD | 5,386 | 2,706,040 |
| 8.125%, 3/26/32(8)(12) | USD | 12,023 | 5,858,387 |
| 8.625%, 4/7/34(8)(12) | USD | 13,204 | 6,456,756 |
| 8.627%, 6/16/49(8)(12) | USD | 8,126 | 3,865,985 |
| 8.75%, 3/11/61(8)(12) | USD | 13,017 | 6,334,398 |
| 8.875%, 5/7/42(8)(12) | USD | 6,584 | 3,196,598 |
| 8.95%, 3/26/51(8)(12) | USD | 9,370 | 4,552,667 |
| | | | $ 56,788,646 |
| Greece — 0.1% |
| Hellenic Republic Government Bonds, 0.00%, GDP-Linked, 10/15/42 | EUR | 579,743 | $ 1,732,364 |
| | | | $ 1,732,364 |
23
See Notes to Consolidated Financial Statements.
Global Macro Absolute Return Advantage Portfolio
April 30, 2024
Consolidated Portfolio of Investments (Unaudited) — continued
| Security | Principal
Amount
(000's omitted) | Value |
| Iceland — 1.9% |
| Republic of Iceland: | | | |
| 4.50%, 2/17/42 | ISK | 5,322,180 | $ 30,247,752 |
| 6.50%, 1/24/31 | ISK | 1,273,622 | 8,684,797 |
| 7.00%, 9/17/35 | ISK | 2,076,207 | 14,826,879 |
| | | | $ 53,759,428 |
| Indonesia — 1.3% |
| Indonesia Treasury Bonds: | | | |
| 7.125%, 6/15/42 | IDR | 101,384,000 | $ 6,166,948 |
| 7.125%, 6/15/43 | IDR | 464,841,000 | 28,498,956 |
| 7.375%, 5/15/48 | IDR | 36,392,000 | 2,290,838 |
| | | | $ 36,956,742 |
| Ivory Coast — 1.2% |
| Ivory Coast Government International Bonds: | | | |
| 6.625%, 3/22/48(8) | EUR | 21,739 | $ 18,198,212 |
| 6.875%, 10/17/40(8) | EUR | 6,307 | 5,652,622 |
| 8.25%, 1/30/37(8) | USD | 10,877 | 10,425,604 |
| | | | $ 34,276,438 |
| Jordan — 0.1% |
| Jordan Government International Bonds, 7.50%, 1/13/29(8) | USD | 4,016 | $ 3,966,141 |
| | | | $ 3,966,141 |
| Kenya — 3.9% |
| Republic of Kenya Government International Bonds: | | | |
| 8.25%, 2/28/48(8) | USD | 3,677 | $ 3,105,815 |
| 9.75%, 2/16/31(8) | USD | 53,560 | 53,760,850 |
| Republic of Kenya Infrastructure Bonds, 18.461%, 8/9/32 | KES | 6,838,750 | 52,783,905 |
| | | | $ 109,650,570 |
| Montenegro — 0.7% |
| Montenegro Government International Bonds: | | | |
| 2.875%, 12/16/27(8) | EUR | 4,040 | $ 3,947,027 |
| 7.25%, 3/12/31(8) | USD | 14,446 | 14,467,582 |
| | | | $ 18,414,609 |
| Nigeria — 0.0%(9) |
| Nigeria Government International Bonds, 8.25%, 9/28/51(8) | USD | 1,404 | $ 1,104,864 |
| | | | $ 1,104,864 |
| Security | Principal
Amount
(000's omitted) | Value |
| North Macedonia — 1.7% |
| North Macedonia Government International Bonds: | | | |
| 1.625%, 3/10/28(8) | EUR | 24,292 | $ 22,699,719 |
| 3.675%, 6/3/26(8) | EUR | 2,343 | 2,437,248 |
| 6.96%, 3/13/27(8) | EUR | 20,719 | 23,158,669 |
| | | | $ 48,295,636 |
| Panama — 1.0% |
| Panama Government International Bonds: | | | |
| 2.252%, 9/29/32 | USD | 6,997 | $ 4,856,279 |
| 3.16%, 1/23/30 | USD | 14,293 | 11,678,450 |
| 7.50%, 3/1/31 | USD | 12,073 | 12,239,620 |
| | | | $ 28,774,349 |
| Paraguay — 0.8% |
| Paraguay Government Bonds, 7.90%, 2/9/31(5) | PYG | 166,288,000 | $ 22,968,354 |
| | | | $ 22,968,354 |
| Peru — 0.9% |
| Peru Government Bonds: | | | |
| 5.40%, 8/12/34 | PEN | 11,066 | $ 2,542,245 |
| 6.15%, 8/12/32 | PEN | 5,374 | 1,348,672 |
| 6.35%, 8/12/28 | PEN | 28,346 | 7,673,733 |
| 7.30%, 8/12/33(5)(8) | PEN | 49,689 | 13,303,013 |
| | | | $ 24,867,663 |
| Serbia — 5.4% |
| Serbia International Bonds: | | | |
| 1.50%, 6/26/29(8) | EUR | 15,362 | $ 13,760,667 |
| 1.65%, 3/3/33(8) | EUR | 9,131 | 7,218,143 |
| Serbia Treasury Bonds: | | | |
| 4.50%, 8/20/32 | RSD | 4,306,760 | 35,867,199 |
| 7.00%, 10/26/31 | RSD | 9,588,280 | 93,449,241 |
| | | | $ 150,295,250 |
| Sri Lanka — 2.0% |
| Sri Lanka Government International Bonds: | | | |
| 5.75%, 4/18/23(8)(12) | USD | 9,753 | $ 5,569,323 |
| 6.20%, 5/11/27(8)(12) | USD | 14,900 | 8,495,492 |
| 6.35%, 6/28/24(8)(12) | USD | 8,675 | 4,924,263 |
| 6.75%, 4/18/28(8)(12) | USD | 1,800 | 1,026,637 |
| 6.825%, 7/18/26(8)(12) | USD | 38,017 | 21,775,658 |
| 6.85%, 3/14/24(8)(12) | USD | 4,733 | 2,702,718 |
| 6.85%, 11/3/25(8)(12) | USD | 20,479 | 11,738,743 |
| | | | $ 56,232,834 |
24
See Notes to Consolidated Financial Statements.
Global Macro Absolute Return Advantage Portfolio
April 30, 2024
Consolidated Portfolio of Investments (Unaudited) — continued
| Security | Principal
Amount
(000's omitted) | Value |
| Suriname — 2.6% |
| Suriname Government International Bonds: | | | |
| 0.00%, Oil-Linked, 12/31/50(5) | USD | 33,349 | $ 25,128,471 |
| 7.95%, (4.95% cash and 3.00% PIK), 7/15/33(5) | USD | 50,231 | 46,639,858 |
| | | | $ 71,768,329 |
| Tajikistan — 0.0%(9) |
| Republic of Tajikistan International Bonds, 7.125%, 9/14/27(8) | USD | 841 | $ 777,925 |
| | | | $ 777,925 |
| Tunisia — 0.7% |
| Tunisian Republic: | | | |
| 3.50%, 2/3/33 | JPY | 800,000 | $ 3,025,598 |
| 4.20%, 3/17/31 | JPY | 60,000 | 234,537 |
| 5.75%, 1/30/25(8) | USD | 5,665 | 5,343,228 |
| 6.375%, 7/15/26(8) | EUR | 12,019 | 10,775,389 |
| | | | $ 19,378,752 |
| Ukraine — 0.5% |
| Ukraine Government Bonds: | | | |
| 15.84%, 2/26/25 | UAH | 59,167 | $ 1,181,700 |
| 19.19%, 9/30/26 | UAH | 77,738 | 1,524,718 |
| Ukraine Government International Bonds: | | | |
| 4.375%, 1/27/32(8)(12) | EUR | 759 | 198,613 |
| 6.876%, 5/21/31(8)(12) | USD | 357 | 90,366 |
| 7.253%, 3/15/35(8)(12) | USD | 21,719 | 5,436,961 |
| 7.375%, 9/25/34(8)(12) | USD | 4,200 | 1,055,250 |
| 7.75%, 9/1/25(8)(12) | USD | 178 | 56,695 |
| 7.75%, 9/1/26(8)(12) | USD | 717 | 211,090 |
| 7.75%, 9/1/29(8)(12) | USD | 4,322 | 1,233,110 |
| 9.75%, 11/1/30(8)(12) | USD | 12,666 | 3,903,028 |
| | | | $ 14,891,531 |
| Uruguay — 1.7% |
| Uruguay Government Bonds: | | | |
| 3.875%, 7/2/40(22) | UYU | 623,178 | $ 17,572,788 |
| 8.25%, 5/21/31 | UYU | 10,704 | 266,296 |
| 9.75%, 7/20/33 | UYU | 1,130,374 | 30,749,327 |
| | | | $ 48,588,411 |
| Uzbekistan — 1.1% |
| Republic of Uzbekistan Bonds: | | | |
| 14.00%, 7/19/24(8) | UZS | 4,180,000 | $ 328,453 |
| Security | Principal
Amount
(000's omitted) | Value |
| Uzbekistan (continued) |
| Republic of Uzbekistan Bonds: (continued) | | | |
| 16.25%, 10/12/26(8) | UZS | 367,300,000 | $ 29,250,374 |
| | | | $ 29,578,827 |
| Venezuela — 0.5% |
| Venezuela Government International Bonds: | | | |
| 6.00%, 12/9/20(8)(12) | USD | 6,031 | $ 980,210 |
| 7.00%, 3/31/38(8)(12) | USD | 4,698 | 808,713 |
| 7.65%, 4/21/25(8)(12) | USD | 11,631 | 2,125,744 |
| 7.75%, 10/13/19(8)(12) | USD | 1,608 | 277,246 |
| 8.25%, 10/13/24(8)(12) | USD | 13,055 | 2,405,016 |
| 9.00%, 5/7/23(8)(12) | USD | 3,806 | 750,897 |
| 9.25%, 9/15/27(12) | USD | 14,820 | 3,183,336 |
| 9.25%, 5/7/28(8)(12) | USD | 11,235 | 2,226,730 |
| 9.375%, 1/13/34(12) | USD | 1,557 | 323,086 |
| 11.75%, 10/21/26(8)(12) | USD | 1,997 | 433,844 |
| 11.95%, 8/5/31(8)(12) | USD | 3,851 | 834,900 |
| 12.75%, 8/23/22(8)(12) | USD | 1,882 | 404,801 |
| | | | $ 14,754,523 |
| Zambia — 0.7% |
| Zambia Government International Bonds: | | | |
| 5.375%, 9/20/22(8)(12) | USD | 5,132 | $ 3,398,257 |
| 8.50%, 4/14/24(8)(12) | USD | 14,633 | 10,784,009 |
| 8.97%, 7/30/27(8)(12) | USD | 5,424 | 3,988,050 |
| | | | $ 18,170,316 |
Total Sovereign Government Bonds
(identified cost $1,395,098,107) | | | $1,448,913,197 |
| Borrower/Description | Principal
Amount
(000's omitted) | Value |
| Ivory Coast — 0.2% |
| Republic of Ivory Coast, Term Loan, 9.623%, (6 mo. EURIBOR + 5.75%), 1/6/28(4) | EUR | 4,524 | $ 5,383,266 |
| | | | $ 5,383,266 |
| Kenya — 0.1% |
| Government of Kenya, Term Loan, 12.062%, (6 mo. SOFR + 6.45%), 6/29/25(4) | USD | 3,947 | $ 3,968,241 |
| | | | $ 3,968,241 |
25
See Notes to Consolidated Financial Statements.
Global Macro Absolute Return Advantage Portfolio
April 30, 2024
Consolidated Portfolio of Investments (Unaudited) — continued
| Borrower/Description | Principal
Amount
(000's omitted) | Value |
| Tanzania — 2.8% |
| Government of the United Republic of Tanzania, Term Loan, 12.022%, (6 mo. SOFR + 6.30%), 4/28/31(4) | USD | 76,489 | $ 78,213,866 |
| | | | $ 78,213,866 |
Total Sovereign Loans
(identified cost $85,735,387) | | | $ 87,565,373 |
| U.S. Government Guaranteed Small Business Administration Loans — 0.2% |
| Security | Principal
Amount
(000's omitted) | Value |
SBA IO Trust:
Interest Only:(23)(24)
Series 2018-3, Class A, 2.876%, 5/24/44(5)(6) | $ | 100,454 | $ 5,733,898 |
Total U.S. Government Guaranteed Small Business Administration Loans
(identified cost $21,126,688) | | | $ 5,733,898 |
| Security | Shares | Value |
| Financial Intermediaries — 0.0% |
| Alpha Holding SA, Escrow Certificates(7)(10) | | 5,728,000 | $ 0 |
| Alpha Holding SA, Escrow Certificates(7)(10) | | 11,758,000 | 0 |
Total Miscellaneous
(identified cost $0) | | | $ 0 |
| Short-Term Investments — 18.5% |
| Security | Shares | Value |
| Morgan Stanley Institutional Liquidity Funds - Government Portfolio, Institutional Class, 5.22%(25) | | 36,275,308 | $ 36,275,308 |
Total Affiliated Fund
(identified cost $36,275,308) | | | $ 36,275,308 |
| Repurchase Agreements — 3.2% |
| Description | Principal
Amount
(000's omitted) | Value |
| Bank of America: | | | |
| Dated 4/10/24 with an interest rate of 2.00%, collateralized by USD 2,000,000 Pakistan Government International Bonds, 6.875%, due 12/5/27 and a market value, including accrued interest, of $2,055,764(26) | USD | 1,788 | $ 1,787,500 |
| Barclays Bank PLC: | | | |
| Dated 12/15/23 with an interest rate of 4.95%, collateralized by USD 3,649,000 Republic of Armenia International Bonds, 3.60%, due 2/2/31 and a market value, including accrued interest, of $2,931,249(26) | USD | 3,152 | 3,151,824 |
| Dated 1/3/24 with an interest rate of 2.60%, collateralized by EUR 3,000,000 Republic of Poland Government International Bonds, 2.75%, due 5/25/32 and a market value, including accrued interest, of $3,112,540(26) | EUR | 3,086 | 3,293,648 |
| Dated 1/3/24 with an interest rate of 2.75%, collateralized by EUR 1,800,000 Republic of Poland Government International Bonds, 1.00%, due 3/7/29 and a market value, including accrued interest, of $1,745,110(26) | EUR | 1,751 | 1,868,134 |
| Dated 1/3/24 with an interest rate of 3.10%, collateralized by EUR 6,000,000 Republic of Poland Government International Bonds, 1.00%, due 3/7/29 and a market value, including accrued interest, of $5,817,034(26) | EUR | 5,835 | 6,227,115 |
| JPMorgan Chase Bank, N.A.: | | | |
| Dated 1/8/24 with an interest rate of 10.70%, collateralized by MXN 1,017,700,000 Mexican Bonos, 8.00%, due 7/31/53 and a market value, including accrued interest, of $48,920,533(26) | MXN | 917,505 | 53,558,961 |
| Nomura International PLC: | | | |
| Dated 12/18/23 with an interest rate of 4.75%, collateralized by USD 4,379,000 Republic of Armenia International Bonds, 3.60%, due 2/2/31 and a market value, including accrued interest, of $3,517,659(26) | USD | 3,787 | 3,786,918 |
| Dated 12/18/23 with an interest rate of 4.85%, collateralized by USD 8,762,000 Republic of Azerbaijan International Bonds, 3.50%, due 9/1/32 and a market value, including accrued interest, of $7,305,575(26) | USD | 8,030 | 8,030,031 |
| Dated 12/19/23 with an interest rate of 3.40%, collateralized by EUR 3,044,000 Republic of Poland Government International Bonds, 1.00%, due 3/7/29 and a market value, including accrued interest, of $2,951,175(26) | USD | 3,240 | 3,239,738 |
| Dated 12/19/23 with an interest rate of 4.85%, collateralized by USD 5,066,000 Republic of Azerbaijan International Bonds, 3.50%, due 9/1/32 and a market value, including accrued interest, of $4,223,926(26) | USD | 4,646 | 4,646,234 |
Total Repurchase Agreements
(identified cost $90,816,691) | | | $ 89,590,103 |
26
See Notes to Consolidated Financial Statements.
Global Macro Absolute Return Advantage Portfolio
April 30, 2024
Consolidated Portfolio of Investments (Unaudited) — continued
| Sovereign Government Securities — 10.3% |
| Security | Principal
Amount
(000's omitted) | Value |
| Egypt — 8.0% |
| Egypt Treasury Bills: | | | |
| 0.00%, 5/7/24 | EGP | 331,700 | $ 6,928,838 |
| 0.00%, 5/14/24 | EGP | 1,028,375 | 21,371,541 |
| 0.00%, 5/21/24 | EGP | 1,326,200 | 27,421,479 |
| 0.00%, 5/28/24 | EGP | 113,825 | 2,341,773 |
| 0.00%, 12/10/24 | EGP | 1,453,775 | 26,334,611 |
| 0.00%, 12/17/24 | EGP | 4,526,650 | 81,645,610 |
| 0.00%, 3/11/25 | EGP | 3,115,400 | 53,442,018 |
| 0.00%, 3/18/25 | EGP | 319,350 | 5,456,082 |
| | | | $ 224,941,952 |
| Nigeria — 2.3% |
| Nigeria OMO Bills: | | | |
| 0.00%, 6/4/24 | NGN | 7,299,524 | $ 5,264,524 |
| 0.00%, 7/9/24 | NGN | 605,722 | 428,946 |
| 0.00%, 1/28/25 | NGN | 2,429,768 | 1,523,550 |
| 0.00%, 2/25/25 | NGN | 4,055,290 | 2,497,017 |
| 0.00%, 4/1/25 | NGN | 4,945,369 | 3,018,611 |
| Nigeria Treasury Bills: | | | |
| 0.00%, 2/6/25 | NGN | 5,006,921 | 3,121,203 |
| 0.00%, 2/20/25 | NGN | 21,273,936 | 13,141,949 |
| 0.00%, 3/6/25 | NGN | 9,930,998 | 6,079,094 |
| 0.00%, 3/27/25 | NGN | 29,959,479 | 18,087,643 |
| 0.00%, 4/10/25 | NGN | 19,248,446 | 11,513,711 |
| | | | $ 64,676,248 |
Total Sovereign Government Securities
(identified cost $284,352,497) | | | $ 289,618,200 |
| U.S. Treasury Obligations — 3.7% |
| Security | Principal
Amount
(000's omitted) | Value |
| U.S. Treasury Bills: | | | |
| 0.00%, 5/9/24(27) | $ | 23,546 | $ 23,518,391 |
| 0.00%, 6/13/24(27) | | 18,427 | 18,311,235 |
| 0.00%, 6/20/24(27) | | 18,027 | 17,895,052 |
| Security | Principal
Amount
(000's omitted) | Value |
| U.S. Treasury Bills: (continued) | | | |
| 0.00%, 7/11/24(27) | $ | 47,000 | $ 46,512,891 |
Total U.S. Treasury Obligations
(identified cost $106,241,718) | | | $ 106,237,569 |
Total Short-Term Investments
(identified cost $517,686,214) | | | $ 521,721,180 |
| | | |
Total Purchased Options — 0.1%
(identified cost $5,477,105) | | | $ 1,809,347 |
Total Investments — 95.8%
(identified cost $2,675,632,200) | | | $2,694,921,286 |
Total Written Options — (0.0)%(9)
(premiums received $1,081,464) | | | $ (213,958) |
| Securities Sold Short — (6.0)% |
| Common Stocks — (1.5)% |
| Security | Shares | Value |
| New Zealand — (1.5)% |
| a2 Milk Co. Ltd.(7) | | (685,400) | $ (2,699,806) |
| Air New Zealand Ltd. | | (1,590,400) | (515,159) |
| Auckland International Airport Ltd. | | (1,008,167) | (4,660,824) |
| Chorus Ltd. | | (314,835) | (1,333,998) |
| Contact Energy Ltd. | | (650,450) | (3,320,806) |
| EBOS Group Ltd. | | (39,953) | (823,311) |
| Fisher & Paykel Healthcare Corp. Ltd. | | (394,070) | (6,599,783) |
| Fletcher Building Ltd. | | (766,350) | (1,715,256) |
| Freightways Group Ltd. | | (62,218) | (307,652) |
| Goodman Property Trust | | (767,200) | (1,028,948) |
| Infratil Ltd. | | (645,000) | (4,141,378) |
| Kiwi Property Group Ltd. | | (869,785) | (414,135) |
| Mainfreight Ltd. | | (68,660) | (2,744,152) |
| Mercury NZ Ltd. | | (572,315) | (2,147,821) |
| Meridian Energy Ltd. | | (1,040,140) | (3,668,448) |
| Precinct Properties New Zealand Ltd. | | (1,353,345) | (931,453) |
| Ryman Healthcare Ltd.(7) | | (449,340) | (1,072,547) |
| SKYCITY Entertainment Group Ltd. | | (489,400) | (512,883) |
| Spark New Zealand Ltd. | | (1,609,900) | (4,524,066) |
Total Common Stocks
(proceeds $45,264,280) | | | $ (43,162,426) |
| Exchange-Traded Funds — (1.7)% |
27
See Notes to Consolidated Financial Statements.
Global Macro Absolute Return Advantage Portfolio
April 30, 2024
Consolidated Portfolio of Investments (Unaudited) — continued
| Security | Shares | Value |
| United States — (1.7)% |
| iShares JPMorgan USD Emerging Markets Bond ETF | | (541,669) | $ (47,206,453) |
Total Exchange-Traded Funds
(proceeds $48,480,651) | | | $ (47,206,453) |
| Sovereign Government Bonds — (2.8)% |
| Security | Principal
Amount
(000's omitted) | Value |
| Armenia — (0.2)% |
| Republic of Armenia International Bonds, 3.60%, 2/2/31(8) | USD | (8,028) | $ (6,377,459) |
| | | | $ (6,377,459) |
| Azerbaijan — (0.4)% |
| Republic of Azerbaijan International Bonds, 3.50%, 9/1/32(8) | USD | (13,828) | $ (11,448,837) |
| | | | $ (11,448,837) |
| Mexico — (1.7)% |
| Mexican Bonos, 8.00%, 7/31/53 | MXN | (1,017,700) | $ (48,207,640) |
| | | | $ (48,207,640) |
| Poland — (0.5)% |
| Republic of Poland Government International Bonds: | | | |
| 1.00%, 3/7/29(8) | EUR | (10,844) | $ (10,495,881) |
| 2.75%, 5/25/32(8) | EUR | (3,000) | (3,030,044) |
| | | | $ (13,525,925) |
Total Sovereign Government Bonds
(proceeds $81,457,132) | | | $ (79,559,861) |
Total Securities Sold Short
(proceeds $175,202,063) | | | $ (169,928,740) |
| | | |
| Other Assets, Less Liabilities — 10.2% | | | $ 288,199,187 |
| Net Assets — 100.0% | | | $2,812,977,775 |
| The percentage shown for each investment category in the Consolidated Portfolio of Investments is based on net assets. |
| (1) | Interest only security that entitles the holder to receive only interest payments on the underlying mortgages. Principal amount shown is the notional amount of the underlying mortgages on which coupon interest is calculated. |
| (2) | Inverse floating-rate security whose coupon varies inversely with changes in the interest rate index. The stated interest rate represents the coupon rate in effect at April 30, 2024. |
| (3) | Security (or a portion thereof) has been pledged for the benefit of the counterparty for reverse repurchase agreements. |
| (4) | Variable rate security. The stated interest rate represents the rate in effect at April 30, 2024. |
| (5) | Security exempt from registration under Rule 144A of the Securities Act of 1933, as amended. These securities may be sold in certain transactions in reliance on an exemption from registration (normally to qualified institutional buyers). At April 30, 2024, the aggregate value of these securities is $311,899,159 or 11.1% of the Portfolio's net assets. |
| (6) | Weighted average fixed-rate coupon that changes/updates monthly. Rate shown is the rate at April 30, 2024. |
| (7) | Non-income producing security. |
| (8) | Security exempt from registration under Regulation S of the Securities Act of 1933, as amended, which exempts from registration securities offered and sold outside the United States. Security may not be offered or sold in the United States except pursuant to an exemption from, or in a transaction not subject to, the registration requirements of the Securities Act of 1933, as amended. At April 30, 2024, the aggregate value of these securities is $870,412,417 or 30.9% of the Portfolio's net assets. |
| (9) | Amount is less than 0.05% or (0.05)%, as applicable. |
| (10) | For fair value measurement disclosure purposes, security is categorized as Level 3 (see Note 10). |
| (11) | Represents a payment-in-kind security which may pay interest in additional principal at the issuer’s discretion. |
| (12) | Issuer is in default with respect to interest and/or principal payments or has declared bankruptcy. For a variable rate security, interest rate has been adjusted to reflect non-accrual status. |
| (13) | Perpetual security with no stated maturity date but may be subject to calls by the issuer. |
| (14) | Security converts to variable rate after the indicated fixed-rate coupon period. |
| (15) | Limited recourse note whose payments by the issuer are limited to amounts received by the issuer from the borrower pursuant to a loan agreement with the borrower. |
| (16) | Quantity held represents principal in USD. |
| (17) | Security is subject to risk of loss depending on the occurrence, frequency and severity of the loss events that are covered by underlying reinsurance contracts and that may occur during a specified risk period. |
| (18) | Restricted security (see Note 5). |
28
See Notes to Consolidated Financial Statements.
Global Macro Absolute Return Advantage Portfolio
April 30, 2024
Consolidated Portfolio of Investments (Unaudited) — continued
| (19) | Senior floating-rate loans (Senior Loans) often require prepayments from excess cash flows or permit the borrowers to repay at their election. The degree to which borrowers repay, whether as a contractual requirement or at their election, cannot be predicted with accuracy. As a result, the actual remaining maturity may be substantially less than the stated maturities shown. However, Senior Loans will typically have an expected average life of approximately two to four years. Senior Loans typically have rates of interest which are redetermined periodically by reference to a base lending rate, plus a spread. These base lending rates are primarily the Secured Overnight Financing Rate (“SOFR”) and secondarily, the prime rate offered by one or more major United States banks (the “Prime Rate”). Base lending rates may be subject to a floor, or minimum rate. Rates for SOFR are generally 1 or 3-month tenors and may also be subject to a credit spread adjustment. Senior Loans are generally subject to contractual restrictions that must be satisfied before they can be bought or sold. |
| (20) | Fixed-rate loan. |
| (21) | Step coupon security. Interest rate represents the rate in effect at April 30, 2024. |
| (22) | Inflation-linked security whose principal is adjusted for inflation based on changes in a designated inflation index or inflation rate for the applicable country. Interest is calculated based on the inflation-adjusted principal. |
| (23) | Interest only security that entitles the holder to receive only a portion of the interest payments on the underlying loans. Principal amount shown is the notional amount of the underlying loans on which coupon interest is calculated. |
| (24) | The stated interest rate represents the weighted average fixed interest rate at April 30, 2024 of all interest only securities comprising the trust. |
| (25) | May be deemed to be an affiliated investment company. The rate shown is the annualized seven-day yield as of April 30, 2024. |
| (26) | Open repurchase agreement with no specific maturity date. Either party may terminate the agreement upon demand. |
| (27) | Security (or a portion thereof) has been pledged to cover collateral requirements on open derivative contracts. |
| Purchased Currency Options (OTC) — 0.1% |
| Description | Counterparty | Notional Amount | Exercise
Price | Expiration
Date | Value |
| Put USD vs. Call BRL | Goldman Sachs International | USD | 59,025,000 | BRL | 5.01 | 6/11/24 | $ 126,314 |
| Put USD vs. Call BRL | JPMorgan Chase Bank, N.A. | USD | 50,105,000 | BRL | 5.01 | 6/11/24 | 107,976 |
| Put USD vs. Call INR | JPMorgan Chase Bank, N.A. | USD | 50,900,000 | INR | 85.50 | 1/25/29 | 412,850 |
| Put USD vs. Call INR | JPMorgan Chase Bank, N.A. | USD | 27,200,000 | INR | 85.50 | 1/25/29 | 220,619 |
| Put USD vs. Call INR | JPMorgan Chase Bank, N.A. | USD | 26,300,000 | INR | 85.50 | 1/30/29 | 213,714 |
| Put USD vs. Call MXN | Citibank, N.A. | USD | 35,400,000 | MXN | 17.02 | 5/17/24 | 213,958 |
| Put USD vs. Call MXN | Standard Chartered Bank | USD | 55,500,000 | MXN | 16.74 | 6/20/24 | 230,991 |
| Put USD vs. Call MXN | Standard Chartered Bank | USD | 20,300,000 | MXN | 16.82 | 7/2/24 | 121,820 |
| Put USD vs. Call MXN | Standard Chartered Bank | USD | 35,400,000 | MXN | 16.71 | 7/5/24 | 161,105 |
| Total | | | | | | | $1,809,347 |
| Written Currency Options (OTC) — (0.0)%(1) |
| Description | Counterparty | Notional Amount | Exercise
Price | Expiration
Date | Value |
| Put USD vs. Call MXN | Standard Chartered Bank | USD | 35,400,000 | MXN | 17.02 | 5/17/24 | $(213,958) |
| Total | | | | | | | $(213,958) |
| (1) | Amount is less than (0.05)%. |
29
See Notes to Consolidated Financial Statements.
Global Macro Absolute Return Advantage Portfolio
April 30, 2024
Consolidated Portfolio of Investments (Unaudited) — continued
| Forward Foreign Currency Exchange Contracts (Centrally Cleared) |
| Currency Purchased | Currency Sold | Settlement
Date | Value/Unrealized
Appreciation
(Depreciation) |
| USD | 7,252,470 | PHP | 414,000,000 | 5/17/24 | $ 87,025 |
| TWD | 157,165,000 | USD | 4,826,357 | 5/29/24 | (11,124) |
| COP | 35,265,160,000 | USD | 8,851,586 | 6/20/24 | 72,021 |
| COP | 8,312,000,000 | USD | 2,095,043 | 6/20/24 | 8,251 |
| EUR | 2,140,000 | USD | 2,338,882 | 6/20/24 | (50,526) |
| EUR | 3,087,961 | USD | 3,374,943 | 6/20/24 | (72,908) |
| EUR | 5,860,367 | USD | 6,359,776 | 6/20/24 | (93,138) |
| EUR | 7,384,197 | USD | 8,013,463 | 6/20/24 | (117,356) |
| EUR | 8,398,820 | USD | 9,114,550 | 6/20/24 | (133,481) |
| EUR | 9,881,442 | USD | 10,723,518 | 6/20/24 | (157,044) |
| EUR | 9,919,625 | USD | 10,764,956 | 6/20/24 | (157,651) |
| EUR | 19,603,034 | USD | 21,273,565 | 6/20/24 | (311,548) |
| EUR | 30,797,832 | USD | 33,422,362 | 6/20/24 | (489,465) |
| EUR | 36,935,319 | USD | 40,082,873 | 6/20/24 | (587,007) |
| EUR | 69,800,000 | USD | 76,286,907 | 6/20/24 | (1,648,011) |
| IDR | 72,622,650,000 | USD | 4,474,028 | 6/20/24 | (14,027) |
| IDR | 199,633,874,289 | USD | 12,780,658 | 6/20/24 | (520,469) |
| INR | 13,023,901,264 | USD | 156,730,834 | 6/20/24 | (996,253) |
| KRW | 24,072,000,000 | USD | 17,329,456 | 6/20/24 | 79,432 |
| KRW | 4,891,790,000 | USD | 3,645,366 | 6/20/24 | (107,620) |
| KRW | 103,931,200,000 | USD | 79,601,118 | 6/20/24 | (4,438,000) |
| PEN | 1,100,000 | USD | 295,906 | 6/20/24 | (3,880) |
| PEN | 4,191,000 | USD | 1,125,705 | 6/20/24 | (13,086) |
| PEN | 9,359,000 | USD | 2,513,833 | 6/20/24 | (29,222) |
| PEN | 39,835,000 | USD | 10,659,050 | 6/20/24 | (83,723) |
| PEN | 44,838,000 | USD | 12,094,679 | 6/20/24 | (191,165) |
| PEN | 82,600,000 | USD | 22,331,428 | 6/20/24 | (402,923) |
| TWD | 271,000,000 | USD | 8,468,327 | 6/20/24 | (158,120) |
| TWD | 584,000,000 | USD | 18,164,852 | 6/20/24 | (256,510) |
| USD | 12,541,087 | COP | 49,546,700,000 | 6/20/24 | 3,634 |
| USD | 7,253,657 | COP | 28,708,160,000 | 6/20/24 | (10,746) |
| USD | 16,462,758 | COP | 65,257,550,000 | 6/20/24 | (50,218) |
| USD | 175,109,859 | EUR | 160,219,737 | 6/20/24 | 3,782,865 |
| USD | 76,286,907 | EUR | 69,800,000 | 6/20/24 | 1,648,011 |
| USD | 68,213,599 | EUR | 62,413,190 | 6/20/24 | 1,473,605 |
| USD | 65,166,449 | EUR | 59,625,149 | 6/20/24 | 1,407,778 |
| USD | 62,686,856 | EUR | 57,356,402 | 6/20/24 | 1,354,212 |
| USD | 59,587,953 | EUR | 54,521,009 | 6/20/24 | 1,287,267 |
| USD | 57,323,967 | EUR | 52,449,536 | 6/20/24 | 1,238,359 |
| USD | 50,952,659 | EUR | 46,620,000 | 6/20/24 | 1,100,720 |
| USD | 46,492,250 | EUR | 42,538,873 | 6/20/24 | 1,004,363 |
| USD | 36,319,157 | EUR | 33,230,829 | 6/20/24 | 784,596 |
| USD | 30,543,374 | EUR | 27,946,178 | 6/20/24 | 659,823 |
| USD | 21,424,855 | EUR | 19,603,034 | 6/20/24 | 462,837 |
30
See Notes to Consolidated Financial Statements.
Global Macro Absolute Return Advantage Portfolio
April 30, 2024
Consolidated Portfolio of Investments (Unaudited) — continued
| Forward Foreign Currency Exchange Contracts (Centrally Cleared) (continued) |
| Currency Purchased | Currency Sold | Settlement
Date | Value/Unrealized
Appreciation
(Depreciation) |
| USD | 16,387,440 | EUR | 14,993,967 | 6/20/24 | $ 354,015 |
| USD | 15,547,699 | EUR | 14,225,631 | 6/20/24 | 335,874 |
| USD | 10,799,779 | EUR | 9,881,441 | 6/20/24 | 233,306 |
| USD | 8,561,194 | EUR | 7,833,210 | 6/20/24 | 184,946 |
| USD | 7,034,744 | EUR | 6,436,558 | 6/20/24 | 151,970 |
| USD | 3,696,308 | EUR | 3,382,000 | 6/20/24 | 79,851 |
| USD | 2,918,914 | EUR | 2,670,710 | 6/20/24 | 63,057 |
| USD | 2,875,867 | EUR | 2,631,323 | 6/20/24 | 62,127 |
| USD | 2,608,833 | EUR | 2,386,996 | 6/20/24 | 56,358 |
| USD | 2,196,610 | EUR | 2,009,826 | 6/20/24 | 47,453 |
| USD | 2,115,701 | EUR | 1,949,563 | 6/20/24 | 30,984 |
| USD | 1,302,262 | EUR | 1,200,000 | 6/20/24 | 19,071 |
| USD | 762,799 | EUR | 697,936 | 6/20/24 | 16,479 |
| USD | 868,273 | EUR | 800,091 | 6/20/24 | 12,716 |
| USD | 631,129 | EUR | 581,569 | 6/20/24 | 9,243 |
| USD | 380,893 | EUR | 348,505 | 6/20/24 | 8,228 |
| USD | 363,019 | EUR | 332,150 | 6/20/24 | 7,842 |
| USD | 209,277 | EUR | 191,481 | 6/20/24 | 4,521 |
| USD | 209,256 | EUR | 192,824 | 6/20/24 | 3,064 |
| USD | 67,765 | EUR | 62,443 | 6/20/24 | 992 |
| USD | 485,693 | IDR | 7,586,523,636 | 6/20/24 | 19,779 |
| USD | 32,338,843 | PEN | 119,146,000 | 6/20/24 | 708,169 |
| USD | 21,558,776 | PEN | 79,429,000 | 6/20/24 | 472,103 |
| USD | 23,444,232 | PEN | 86,716,065 | 6/20/24 | 423,001 |
| USD | 28,150,550 | PEN | 105,908,000 | 6/20/24 | 34,278 |
| USD | 47,833,298 | PEN | 180,714,199 | 6/20/24 | (142,395) |
| USD | 42,021,744 | PEN | 158,859,000 | 6/20/24 | (151,868) |
| USD | 11,143,442 | PHP | 636,870,000 | 6/20/24 | 128,297 |
| BRL | 15,092,039 | USD | 2,992,072 | 7/2/24 | (102,843) |
| BRL | 15,829,000 | USD | 3,139,304 | 7/2/24 | (108,992) |
| BRL | 23,744,000 | USD | 4,707,002 | 7/2/24 | (161,437) |
| BRL | 23,791,000 | USD | 4,716,880 | 7/2/24 | (162,318) |
| BRL | 25,643,961 | USD | 5,087,694 | 7/2/24 | (178,399) |
| BRL | 42,500,000 | USD | 8,435,552 | 7/2/24 | (299,328) |
| BRL | 48,563,000 | USD | 9,657,744 | 7/2/24 | (360,816) |
| | | | | | $ 7,148,906 |
31
See Notes to Consolidated Financial Statements.
Global Macro Absolute Return Advantage Portfolio
April 30, 2024
Consolidated Portfolio of Investments (Unaudited) — continued
| Forward Foreign Currency Exchange Contracts (OTC) |
| Currency Purchased | Currency Sold | Counterparty | Settlement
Date | Unrealized
Appreciation | Unrealized
(Depreciation) |
| HUF | 3,269,062,468 | EUR | 8,255,237 | BNP Paribas | 5/2/24 | $ 102,936 | $ — |
| HUF | 3,321,061,473 | EUR | 8,372,459 | UBS AG | 5/2/24 | 119,609 | — |
| CZK | 340,176,151 | EUR | 13,412,088 | Goldman Sachs International | 5/6/24 | 117,744 | — |
| CZK | 336,923,849 | EUR | 13,283,530 | HSBC Bank USA, N.A. | 5/6/24 | 116,971 | — |
| EUR | 26,885,931 | CZK | 677,100,000 | Societe Generale | 5/6/24 | — | (31,589) |
| USD | 1,554,834 | KES | 215,111,315 | Citibank, N.A. | 5/6/24 | — | (37,871) |
| EUR | 5,714,237 | USD | 6,131,051 | Barclays Bank PLC | 5/10/24 | — | (31,151) |
| EUR | 641,457 | USD | 683,818 | Citibank, N.A. | 5/10/24 | 931 | — |
| EUR | 1,339,697 | USD | 1,456,324 | UBS AG | 5/10/24 | — | (26,209) |
| USD | 7,432,577 | EUR | 6,842,258 | Bank of America, N.A. | 5/10/24 | 128,525 | — |
| USD | 93,520 | EUR | 86,278 | BNP Paribas | 5/10/24 | 1,419 | — |
| USD | 2,686,725 | EUR | 2,520,616 | Citibank, N.A. | 5/10/24 | — | (4,011) |
| USD | 1,554,782 | EUR | 1,460,402 | Citibank, N.A. | 5/10/24 | — | (4,185) |
| USD | 5,327,082 | EUR | 5,004,325 | Citibank, N.A. | 5/10/24 | — | (14,992) |
| USD | 31,268 | EUR | 28,989 | JPMorgan Chase Bank, N.A. | 5/10/24 | 322 | — |
| USD | 14,634 | EUR | 13,571 | JPMorgan Chase Bank, N.A. | 5/10/24 | 147 | — |
| USD | 6,219,703 | EUR | 5,834,293 | JPMorgan Chase Bank, N.A. | 5/10/24 | — | (8,356) |
| USD | 1,898,069 | EUR | 1,772,569 | Standard Chartered Bank | 5/10/24 | 5,867 | — |
| USD | 5,975,747 | EUR | 5,576,185 | UBS AG | 5/10/24 | 23,216 | — |
| USD | 963,016 | EUR | 885,866 | UBS AG | 5/10/24 | 17,361 | — |
| USD | 1,735,216 | EUR | 1,626,914 | UBS AG | 5/10/24 | — | (1,501) |
| USD | 10,682,195 | EUR | 10,012,377 | UBS AG | 5/10/24 | — | (5,933) |
| HUF | 4,274,997,999 | EUR | 10,839,156 | HSBC Bank USA, N.A. | 5/13/24 | 76,640 | — |
| HUF | 8,004,266,938 | EUR | 20,426,865 | JPMorgan Chase Bank, N.A. | 5/13/24 | 2,321 | — |
| HUF | 4,093,087,887 | EUR | 10,367,628 | UBS AG | 5/13/24 | 84,375 | — |
| ILS | 111,378,125 | USD | 29,692,915 | Bank of America, N.A. | 5/13/24 | 88,019 | — |
| ILS | 102,821,875 | USD | 27,432,334 | BNP Paribas | 5/13/24 | 60,780 | — |
| ISK | 2,327,000,000 | EUR | 15,441,274 | Citibank, N.A. | 5/13/24 | 66,090 | — |
| TRY | 335,116,310 | USD | 9,983,882 | Standard Chartered Bank | 5/13/24 | 269,226 | — |
| TRY | 301,442,832 | USD | 8,982,278 | Standard Chartered Bank | 5/13/24 | 240,568 | — |
| TRY | 262,593,198 | USD | 7,811,291 | Standard Chartered Bank | 5/13/24 | 222,924 | — |
| USD | 58,062,942 | ILS | 214,200,000 | JPMorgan Chase Bank, N.A. | 5/13/24 | 788,893 | — |
| USD | 7,001,545 | UZS | 89,724,797,000 | ICBC Standard Bank plc | 5/14/24 | — | (75,605) |
| UZS | 37,765,034,000 | USD | 2,888,339 | ICBC Standard Bank plc | 5/14/24 | 90,423 | — |
| UZS | 26,151,403,000 | USD | 2,005,168 | ICBC Standard Bank plc | 5/14/24 | 57,555 | — |
| UZS | 25,808,360,000 | USD | 1,990,464 | ICBC Standard Bank plc | 5/14/24 | 45,201 | — |
| HUF | 4,744,006,690 | EUR | 12,128,000 | UBS AG | 5/15/24 | — | (23,787) |
| EGP | 292,565,127 | USD | 6,082,435 | Goldman Sachs International | 5/16/24 | 13,636 | — |
| EUR | 21,187 | HUF | 8,347,173 | JPMorgan Chase Bank, N.A. | 5/17/24 | — | (117) |
| USD | 38,267,216 | PHP | 2,183,980,000 | Standard Chartered Bank | 5/17/24 | 469,322 | — |
| EGP | 245,552,479 | USD | 4,970,698 | HSBC Bank USA, N.A. | 5/20/24 | 141,454 | — |
| USD | 12,682,390 | KRW | 17,668,670,544 | Standard Chartered Bank | 5/20/24 | — | (91,910) |
| MXN | 131,967,000 | USD | 7,760,596 | Bank of America, N.A. | 5/21/24 | — | (79,103) |
| MXN | 32,678,743 | USD | 1,924,303 | Goldman Sachs International | 5/21/24 | — | (22,149) |
32
See Notes to Consolidated Financial Statements.
Global Macro Absolute Return Advantage Portfolio
April 30, 2024
Consolidated Portfolio of Investments (Unaudited) — continued
| Forward Foreign Currency Exchange Contracts (OTC) (continued) |
| Currency Purchased | Currency Sold | Counterparty | Settlement
Date | Unrealized
Appreciation | Unrealized
(Depreciation) |
| MXN | 33,007,164 | USD | 1,943,549 | Goldman Sachs International | 5/21/24 | $ — | $ (22,278) |
| MXN | 100,174,000 | USD | 5,886,433 | Goldman Sachs International | 5/21/24 | — | (55,536) |
| MXN | 123,130,000 | USD | 7,238,212 | Goldman Sachs International | 5/21/24 | — | (71,100) |
| MXN | 127,447,093 | USD | 7,499,340 | Goldman Sachs International | 5/21/24 | — | (80,940) |
| USD | 20,870,549 | MXN | 355,271,000 | Citibank, N.A. | 5/21/24 | 191,047 | — |
| USD | 11,354,086 | MXN | 193,133,000 | JPMorgan Chase Bank, N.A. | 5/21/24 | 112,261 | — |
| TRY | 265,735,902 | USD | 7,800,659 | Standard Chartered Bank | 5/22/24 | 250,334 | — |
| USD | 9,328,439 | PHP | 537,458,000 | Societe Generale | 5/23/24 | 27,209 | — |
| USD | 18,468,220 | PHP | 1,062,542,000 | Standard Chartered Bank | 5/23/24 | 80,558 | — |
| HUF | 6,234,086,736 | EUR | 15,771,717 | Bank of America, N.A. | 5/29/24 | 123,529 | — |
| HUF | 6,233,720,009 | EUR | 15,765,246 | BNP Paribas | 5/29/24 | 129,444 | — |
| TWD | 954,235,000 | USD | 29,292,025 | Standard Chartered Bank | 5/29/24 | — | (42,604) |
| HUF | 3,434,643,973 | EUR | 8,737,107 | BNP Paribas | 6/3/24 | 12,697 | — |
| HUF | 3,155,479,968 | EUR | 8,023,087 | Citibank, N.A. | 6/3/24 | 15,809 | — |
| PLN | 106,000,000 | EUR | 24,473,530 | Barclays Bank PLC | 6/5/24 | — | (30,211) |
| CZK | 677,100,000 | EUR | 26,853,676 | Societe Generale | 6/6/24 | 32,794 | — |
| BRL | 164,647,000 | USD | 32,863,673 | Goldman Sachs International | 6/13/24 | — | (1,275,001) |
| EGP | 198,513,016 | USD | 4,315,500 | Citibank, N.A. | 6/13/24 | — | (208,826) |
| EGP | 198,843,585 | USD | 3,699,416 | Standard Chartered Bank | 6/13/24 | 414,097 | — |
| USD | 32,844,006 | BRL | 164,647,000 | Goldman Sachs International | 6/13/24 | 1,255,334 | — |
| USD | 10,353,220 | EGP | 397,356,601 | Citibank, N.A. | 6/13/24 | 2,133,034 | — |
| KZT | 2,500,499,000 | USD | 5,092,666 | JPMorgan Chase Bank, N.A. | 6/18/24 | 501,291 | — |
| USD | 4,951,483 | KZT | 2,500,499,000 | ICBC Standard Bank plc | 6/18/24 | — | (642,474) |
| AUD | 26,740,000 | USD | 17,522,588 | BNP Paribas | 6/20/24 | — | (175,205) |
| AUD | 61,500,000 | USD | 40,816,271 | BNP Paribas | 6/20/24 | — | (918,587) |
| AUD | 72,000,000 | USD | 47,764,728 | Citibank, N.A. | 6/20/24 | — | (1,055,245) |
| AUD | 29,975,670 | USD | 19,744,524 | UBS AG | 6/20/24 | — | (298,023) |
| AUD | 42,000,000 | USD | 27,634,530 | UBS AG | 6/20/24 | — | (387,332) |
| CAD | 5,738,800 | USD | 4,258,256 | Bank of America, N.A. | 6/20/24 | — | (86,239) |
| CAD | 19,147,100 | USD | 14,207,369 | Bank of America, N.A. | 6/20/24 | — | (287,731) |
| CAD | 6,746,000 | USD | 5,004,514 | Goldman Sachs International | 6/20/24 | — | (100,279) |
| CAD | 22,509,000 | USD | 16,698,282 | Goldman Sachs International | 6/20/24 | — | (334,597) |
| CAD | 8,433,000 | USD | 6,258,859 | HSBC Bank USA, N.A. | 6/20/24 | — | (128,202) |
| CAD | 28,136,000 | USD | 20,882,160 | HSBC Bank USA, N.A. | 6/20/24 | — | (427,735) |
| CAD | 4,216,000 | USD | 3,136,123 | Standard Chartered Bank | 6/20/24 | — | (71,158) |
| CAD | 14,069,000 | USD | 10,465,397 | Standard Chartered Bank | 6/20/24 | — | (237,458) |
| CAD | 6,746,200 | USD | 5,027,450 | UBS AG | 6/20/24 | — | (123,070) |
| CAD | 22,508,900 | USD | 16,774,240 | UBS AG | 6/20/24 | — | (410,628) |
| CZK | 144,760,000 | EUR | 5,724,212 | Bank of America, N.A. | 6/20/24 | 22,165 | — |
| EUR | 2,008,863 | CZK | 51,187,829 | JPMorgan Chase Bank, N.A. | 6/20/24 | — | (24,141) |
| EUR | 2,669,430 | CZK | 68,019,755 | JPMorgan Chase Bank, N.A. | 6/20/24 | — | (32,079) |
| EUR | 1,714,012 | PLN | 7,378,531 | Citibank, N.A. | 6/20/24 | 14,805 | — |
| EUR | 1,769,980 | PLN | 7,616,755 | Goldman Sachs International | 6/20/24 | 15,956 | — |
| EUR | 7,248,076 | USD | 7,786,997 | JPMorgan Chase Bank, N.A. | 6/20/24 | — | (36,447) |
33
See Notes to Consolidated Financial Statements.
Global Macro Absolute Return Advantage Portfolio
April 30, 2024
Consolidated Portfolio of Investments (Unaudited) — continued
| Forward Foreign Currency Exchange Contracts (OTC) (continued) |
| Currency Purchased | Currency Sold | Counterparty | Settlement
Date | Unrealized
Appreciation | Unrealized
(Depreciation) |
| EUR | 14,281,924 | USD | 15,342,965 | JPMorgan Chase Bank, N.A. | 6/20/24 | $ — | $ (70,945) |
| ISK | 1,073,125,968 | EUR | 7,118,580 | Bank of America, N.A. | 6/20/24 | — | (8,928) |
| ISK | 1,197,685,232 | EUR | 7,950,118 | Bank of America, N.A. | 6/20/24 | — | (15,603) |
| ISK | 1,940,746,312 | EUR | 12,905,615 | Bank of America, N.A. | 6/20/24 | — | (50,017) |
| ISK | 1,293,500,051 | EUR | 8,603,259 | JPMorgan Chase Bank, N.A. | 6/20/24 | — | (35,172) |
| JPY | 2,689,280,000 | USD | 18,225,666 | Citibank, N.A. | 6/20/24 | — | (1,047,235) |
| JPY | 4,083,457,667 | USD | 27,674,224 | Citibank, N.A. | 6/20/24 | — | (1,590,142) |
| MXN | 58,212,000 | USD | 3,398,124 | Bank of America, N.A. | 6/20/24 | — | (25,894) |
| MXN | 67,289,000 | USD | 3,945,168 | Goldman Sachs International | 6/20/24 | — | (47,107) |
| MXN | 55,522,300 | USD | 3,269,768 | Goldman Sachs International | 6/20/24 | — | (53,354) |
| MXN | 476,702,700 | USD | 28,073,537 | Goldman Sachs International | 6/20/24 | — | (458,084) |
| MXN | 27,397,000 | USD | 1,615,882 | Societe Generale | 6/20/24 | — | (28,770) |
| MXN | 44,939,700 | USD | 2,630,437 | Standard Chartered Bank | 6/20/24 | — | (27,074) |
| MXN | 44,900,000 | USD | 2,643,312 | Standard Chartered Bank | 6/20/24 | — | (42,249) |
| MXN | 386,110,300 | USD | 22,600,035 | Standard Chartered Bank | 6/20/24 | — | (232,612) |
| MXN | 386,100,000 | USD | 22,730,131 | Standard Chartered Bank | 6/20/24 | — | (363,304) |
| MXN | 8,311,538 | USD | 486,837 | State Street Bank and Trust Company | 6/20/24 | — | (5,349) |
| MXN | 58,788,000 | USD | 3,411,667 | State Street Bank and Trust Company | 6/20/24 | — | (6,070) |
| MXN | 10,044,046 | USD | 588,289 | State Street Bank and Trust Company | 6/20/24 | — | (6,436) |
| MXN | 68,328,000 | USD | 3,982,120 | State Street Bank and Trust Company | 6/20/24 | — | (23,869) |
| MXN | 65,617,000 | USD | 3,858,614 | State Street Bank and Trust Company | 6/20/24 | — | (57,412) |
| MXN | 587,057,000 | USD | 34,213,373 | State Street Bank and Trust Company | 6/20/24 | — | (205,079) |
| NGN | 495,390,017 | USD | 582,812 | JPMorgan Chase Bank, N.A. | 6/20/24 | — | (227,311) |
| NZD | 12,967,274 | USD | 8,006,112 | Australia and New Zealand Banking Group Limited | 6/20/24 | — | (365,172) |
| NZD | 45,180,000 | USD | 26,999,220 | BNP Paribas | 6/20/24 | — | (376,996) |
| NZD | 37,742,000 | USD | 22,623,593 | BNP Paribas | 6/20/24 | — | (384,195) |
| NZD | 60,483,200 | USD | 37,393,751 | BNP Paribas | 6/20/24 | — | (1,754,147) |
| NZD | 40,158,000 | USD | 24,089,061 | JPMorgan Chase Bank, N.A. | 6/20/24 | — | (426,041) |
| PLN | 112,694,442 | EUR | 25,731,675 | Barclays Bank PLC | 6/20/24 | 251,791 | — |
| SEK | 269,562,000 | EUR | 24,056,705 | UBS AG | 6/20/24 | — | (1,210,930) |
| SGD | 6,420,000 | USD | 4,780,788 | Citibank, N.A. | 6/20/24 | — | (67,068) |
| SGD | 19,000,000 | USD | 14,258,131 | Citibank, N.A. | 6/20/24 | — | (307,871) |
| SGD | 18,000,000 | USD | 13,506,112 | Goldman Sachs International | 6/20/24 | — | (290,076) |
| SGD | 19,000,000 | USD | 14,261,374 | Goldman Sachs International | 6/20/24 | — | (311,114) |
| SGD | 23,000,000 | USD | 17,256,035 | Goldman Sachs International | 6/20/24 | — | (368,879) |
| SGD | 50,599,700 | USD | 38,125,151 | Goldman Sachs International | 6/20/24 | — | (973,626) |
| TRY | 498,964,769 | USD | 14,015,937 | Standard Chartered Bank | 6/20/24 | 643,580 | — |
| TRY | 470,830,000 | USD | 13,839,097 | Standard Chartered Bank | 6/20/24 | — | (6,176) |
| TWD | 381,000,000 | USD | 11,904,783 | Standard Chartered Bank | 6/20/24 | — | (221,429) |
| TWD | 485,000,000 | USD | 15,158,171 | Standard Chartered Bank | 6/20/24 | — | (285,661) |
| USD | 21,459,033 | AUD | 32,633,000 | BNP Paribas | 6/20/24 | 288,609 | — |
| USD | 26,932,521 | AUD | 41,280,000 | HSBC Bank USA, N.A. | 6/20/24 | 152,417 | — |
| USD | 21,689,576 | AUD | 32,967,000 | Standard Chartered Bank | 6/20/24 | 302,472 | — |
34
See Notes to Consolidated Financial Statements.
Global Macro Absolute Return Advantage Portfolio
April 30, 2024
Consolidated Portfolio of Investments (Unaudited) — continued
| Forward Foreign Currency Exchange Contracts (OTC) (continued) |
| Currency Purchased | Currency Sold | Counterparty | Settlement
Date | Unrealized
Appreciation | Unrealized
(Depreciation) |
| USD | 21,370,954 | CNH | 153,000,000 | BNP Paribas | 6/20/24 | $ 233,592 | $ — |
| USD | 4,469,742 | CNH | 32,000,000 | BNP Paribas | 6/20/24 | 48,856 | — |
| USD | 27,451,173 | CNH | 196,000,000 | Citibank, N.A. | 6/20/24 | 373,245 | — |
| USD | 25,970,708 | CNH | 185,420,000 | Goldman Sachs International | 6/20/24 | 354,436 | — |
| USD | 16,536,841 | CNH | 118,032,000 | Goldman Sachs International | 6/20/24 | 230,402 | — |
| USD | 21,787,773 | CNH | 156,000,000 | HSBC Bank USA, N.A. | 6/20/24 | 235,953 | — |
| USD | 4,469,287 | CNH | 32,000,000 | HSBC Bank USA, N.A. | 6/20/24 | 48,401 | — |
| USD | 37,588,889 | CNH | 269,000,000 | JPMorgan Chase Bank, N.A. | 6/20/24 | 425,815 | — |
| USD | 7,825,196 | CNH | 56,000,000 | JPMorgan Chase Bank, N.A. | 6/20/24 | 88,645 | — |
| USD | 12,093,456 | CNH | 87,828,000 | Standard Chartered Bank | 6/20/24 | — | (40,219) |
| USD | 99,733,480 | CNH | 713,687,700 | UBS AG | 6/20/24 | 1,135,602 | — |
| USD | 20,850,931 | CNH | 149,208,196 | UBS AG | 6/20/24 | 237,416 | — |
| USD | 3,292,491 | JPY | 485,822,045 | Citibank, N.A. | 6/20/24 | 189,184 | — |
| USD | 256,741 | JPY | 37,378,931 | UBS AG | 6/20/24 | 17,974 | — |
| USD | 18,568,359 | MXN | 308,840,000 | Goldman Sachs International | 6/20/24 | 677,215 | — |
| USD | 16,172,206 | MXN | 274,612,143 | Goldman Sachs International | 6/20/24 | 263,886 | — |
| USD | 597,628 | MXN | 10,148,025 | Goldman Sachs International | 6/20/24 | 9,752 | — |
| USD | 35,091,125 | MXN | 584,500,000 | Standard Chartered Bank | 6/20/24 | 1,230,959 | — |
| USD | 23,517,795 | MYR | 109,560,000 | Barclays Bank PLC | 6/20/24 | 595,805 | — |
| USD | 39,295,888 | NZD | 63,559,847 | BNP Paribas | 6/20/24 | 1,843,376 | — |
| USD | 4,000,079 | NZD | 6,470,000 | BNP Paribas | 6/20/24 | 187,644 | — |
| USD | 12,282,678 | NZD | 20,462,604 | Citibank, N.A. | 6/20/24 | 225,130 | — |
| USD | 10,573,961 | NZD | 17,617,396 | Citibank, N.A. | 6/20/24 | 192,946 | — |
| USD | 96,785,178 | NZD | 157,000,000 | HSBC Bank USA, N.A. | 6/20/24 | 4,273,244 | — |
| USD | 9,863,458 | NZD | 16,000,000 | HSBC Bank USA, N.A. | 6/20/24 | 435,490 | — |
| USD | 717,367 | NZD | 1,197,100 | State Street Bank and Trust Company | 6/20/24 | 11,978 | — |
| USD | 50,460,249 | THB | 1,779,505,000 | Standard Chartered Bank | 6/20/24 | 2,262,093 | — |
| USD | 2,836,600 | THB | 104,190,000 | Standard Chartered Bank | 6/20/24 | 14,598 | — |
| USD | 16,164,004 | ZAR | 307,745,665 | Barclays Bank PLC | 6/20/24 | — | (123,728) |
| USD | 7,708,866 | ZAR | 146,681,372 | BNP Paribas | 6/20/24 | — | (54,385) |
| USD | 10,085,747 | ZAR | 188,790,451 | Goldman Sachs International | 6/20/24 | 93,833 | — |
| USD | 10,135,544 | ZAR | 189,822,321 | Goldman Sachs International | 6/20/24 | 89,017 | — |
| USD | 49,236,263 | ZAR | 928,034,630 | HSBC Bank USA, N.A. | 6/20/24 | 119,147 | — |
| USD | 7,654,704 | ZAR | 145,638,303 | HSBC Bank USA, N.A. | 6/20/24 | — | (53,342) |
| USD | 21,568,787 | ZAR | 406,015,152 | JPMorgan Chase Bank, N.A. | 6/20/24 | 80,048 | — |
| USD | 12,975,547 | ZAR | 244,668,723 | JPMorgan Chase Bank, N.A. | 6/20/24 | 26,222 | — |
| USD | 12,967,381 | ZAR | 244,668,723 | JPMorgan Chase Bank, N.A. | 6/20/24 | 18,057 | — |
| USD | 40,570,462 | ZAR | 762,465,000 | UBS AG | 6/20/24 | 216,277 | — |
| USD | 15,080,079 | ZAR | 286,468,716 | UBS AG | 6/20/24 | — | (81,551) |
| USD | 23,708,739 | ZAR | 453,175,944 | UBS AG | 6/20/24 | — | (276,029) |
| ZAR | 10,459,354 | USD | 556,538 | UBS AG | 6/20/24 | — | (2,967) |
| NGN | 2,601,891,623 | USD | 3,153,808 | Societe Generale | 6/21/24 | — | (1,287,315) |
| TRY | 131,342,227 | USD | 3,885,896 | Standard Chartered Bank | 6/21/24 | — | (31,081) |
| USD | 3,740,848 | TRY | 131,342,227 | Standard Chartered Bank | 6/21/24 | — | (113,967) |
35
See Notes to Consolidated Financial Statements.
Global Macro Absolute Return Advantage Portfolio
April 30, 2024
Consolidated Portfolio of Investments (Unaudited) — continued
| Forward Foreign Currency Exchange Contracts (OTC) (continued) |
| Currency Purchased | Currency Sold | Counterparty | Settlement
Date | Unrealized
Appreciation | Unrealized
(Depreciation) |
| NGN | 1,352,433,739 | USD | 1,591,111 | Standard Chartered Bank | 6/24/24 | $ — | $ (621,972) |
| KZT | 1,957,500,000 | USD | 3,828,851 | Societe Generale | 6/25/24 | 543,588 | — |
| KZT | 217,617,000 | USD | 442,311 | Societe Generale | 6/25/24 | 43,777 | — |
| USD | 4,244,131 | KZT | 2,175,117,000 | ICBC Standard Bank plc | 6/25/24 | — | (614,396) |
| NGN | 1,393,006,751 | USD | 1,591,111 | Standard Chartered Bank | 6/26/24 | — | (593,613) |
| ILS | 100,402,956 | USD | 26,831,362 | Barclays Bank PLC | 7/2/24 | 75,140 | — |
| ILS | 100,738,729 | USD | 26,946,296 | Goldman Sachs International | 7/2/24 | 50,187 | — |
| USD | 13,704,064 | ILS | 50,572,243 | Bank of America, N.A. | 7/2/24 | 151,453 | — |
| USD | 27,344,932 | ILS | 100,738,729 | Barclays Bank PLC | 7/2/24 | 348,448 | — |
| USD | 13,502,582 | ILS | 49,830,713 | Goldman Sachs International | 7/2/24 | 148,691 | — |
| NGN | 1,313,023,184 | USD | 1,475,319 | Standard Chartered Bank | 7/3/24 | — | (537,445) |
| NGN | 1,414,379,737 | USD | 1,571,533 | Societe Generale | 7/8/24 | — | (562,899) |
| EGP | 49,210,000 | USD | 994,141 | HSBC Bank USA, N.A. | 7/10/24 | 14,560 | — |
| ILS | 113,461,271 | USD | 30,393,312 | Barclays Bank PLC | 7/10/24 | 24,826 | — |
| USD | 30,947,356 | ILS | 113,461,271 | Citibank, N.A. | 7/10/24 | 529,219 | — |
| USD | 9,048,690 | SAR | 34,000,000 | Standard Chartered Bank | 7/15/24 | — | (11,730) |
| PLN | 144,535,181 | EUR | 33,110,591 | Citibank, N.A. | 7/19/24 | 147,927 | — |
| PLN | 95,856,308 | EUR | 21,904,506 | UBS AG | 7/19/24 | 156,536 | — |
| UZS | 75,753,887,244 | USD | 5,691,502 | ICBC Standard Bank plc | 7/22/24 | 157,766 | — |
| UZS | 82,952,605,575 | USD | 6,255,853 | ICBC Standard Bank plc | 7/22/24 | 149,258 | — |
| ISK | 2,592,013,830 | EUR | 17,063,949 | Bank of America, N.A. | 8/8/24 | — | (15,983) |
| ISK | 2,864,103,680 | EUR | 18,855,192 | Bank of America, N.A. | 8/8/24 | — | (17,661) |
| USD | 763,809 | ZMW | 20,852,000 | Citibank, N.A. | 8/26/24 | 27,394 | — |
| UZS | 21,633,982,210 | USD | 1,632,507 | ICBC Standard Bank plc | 8/26/24 | 3,724 | — |
| ZMW | 20,852,000 | USD | 820,952 | Standard Chartered Bank | 8/26/24 | — | (84,536) |
| USD | 36,365,894 | OMR | 14,010,800 | Standard Chartered Bank | 8/29/24 | — | (12,681) |
| USD | 26,650,006 | OMR | 10,530,750 | Standard Chartered Bank | 8/29/24 | — | (692,735) |
| UZS | 78,826,461,000 | USD | 5,832,517 | ICBC Standard Bank plc | 8/30/24 | 178,574 | — |
| UZS | 54,219,745,000 | USD | 4,010,336 | JPMorgan Chase Bank, N.A. | 8/30/24 | 124,314 | — |
| USD | 874,322 | AMD | 348,679,825 | Citibank, N.A. | 9/6/24 | — | (11,699) |
| EGP | 2,209,540 | USD | 37,757 | Citibank, N.A. | 9/11/24 | 6,637 | — |
| USD | 52,039 | EGP | 2,209,540 | Standard Chartered Bank | 9/11/24 | 7,645 | — |
| KZT | 3,688,854,849 | USD | 7,073,547 | Citibank, N.A. | 9/16/24 | 1,021,120 | — |
| KZT | 2,362,387,916 | USD | 4,527,816 | Citibank, N.A. | 9/16/24 | 656,108 | — |
| KZT | 1,846,195,811 | USD | 3,536,774 | Citibank, N.A. | 9/16/24 | 514,440 | — |
| KZT | 1,844,427,424 | USD | 3,536,774 | Citibank, N.A. | 9/16/24 | 510,560 | — |
| USD | 1,213,868 | AMD | 493,134,000 | Citibank, N.A. | 9/16/24 | — | (37,801) |
| USD | 3,536,773 | KZT | 1,808,175,000 | Citibank, N.A. | 9/16/24 | — | (431,010) |
| USD | 7,073,549 | KZT | 3,589,826,000 | Citibank, N.A. | 9/16/24 | — | (803,813) |
| USD | 8,488,256 | KZT | 4,343,865,000 | Citibank, N.A. | 9/16/24 | — | (1,043,737) |
| EGP | 322,370,319 | USD | 6,947,636 | HSBC Bank USA, N.A. | 9/17/24 | — | (482,172) |
| EGP | 184,573,681 | USD | 3,770,657 | ICBC Standard Bank plc | 9/17/24 | — | (68,845) |
| USD | 12,532,608 | EGP | 506,944,000 | Citibank, N.A. | 9/17/24 | 2,365,331 | — |
| KZT | 1,835,586,000 | USD | 3,649,276 | Citibank, N.A. | 9/19/24 | 375,887 | — |
36
See Notes to Consolidated Financial Statements.
Global Macro Absolute Return Advantage Portfolio
April 30, 2024
Consolidated Portfolio of Investments (Unaudited) — continued
| Forward Foreign Currency Exchange Contracts (OTC) (continued) |
| Currency Purchased | Currency Sold | Counterparty | Settlement
Date | Unrealized
Appreciation | Unrealized
(Depreciation) |
| USD | 3,536,775 | KZT | 1,835,586,000 | Citibank, N.A. | 9/19/24 | $ — | $ (488,388) |
| TRY | 75,337,746 | USD | 2,070,930 | Standard Chartered Bank | 9/20/24 | — | (71,857) |
| TRY | 75,337,748 | USD | 2,071,636 | Standard Chartered Bank | 9/20/24 | — | (72,564) |
| TRY | 188,013,000 | USD | 5,127,202 | Standard Chartered Bank | 9/20/24 | — | (138,314) |
| TRY | 651,103,833 | USD | 17,777,187 | Standard Chartered Bank | 9/20/24 | — | (500,276) |
| USD | 16,999,396 | TRY | 651,103,833 | Standard Chartered Bank | 9/20/24 | — | (277,515) |
| TRY | 552,643,974 | USD | 14,015,825 | Standard Chartered Bank | 9/23/24 | 598,957 | — |
| TRY | 517,381,190 | USD | 13,212,087 | Standard Chartered Bank | 9/23/24 | 470,163 | — |
| TRY | 176,998,064 | USD | 4,766,379 | Standard Chartered Bank | 9/23/24 | — | (85,629) |
| USD | 4,616,140 | TRY | 176,998,064 | Standard Chartered Bank | 9/23/24 | — | (64,610) |
| KZT | 1,877,496,000 | USD | 3,732,596 | Societe Generale | 9/30/24 | 374,117 | — |
| USD | 3,603,639 | KZT | 1,877,496,000 | Bank of America, N.A. | 9/30/24 | — | (503,074) |
| UZS | 37,010,823,256 | USD | 2,756,858 | JPMorgan Chase Bank, N.A. | 10/4/24 | 34,444 | — |
| TRY | 149,730,527 | USD | 3,709,768 | Standard Chartered Bank | 10/17/24 | 145,736 | — |
| TRY | 149,629,425 | USD | 3,709,237 | Standard Chartered Bank | 10/17/24 | 143,663 | — |
| PLN | 102,314,069 | EUR | 23,284,950 | Bank of America, N.A. | 10/21/24 | 124,871 | — |
| UZS | 20,105,998,239 | USD | 1,478,382 | JPMorgan Chase Bank, N.A. | 10/22/24 | 30,397 | — |
| UZS | 20,179,917,352 | USD | 1,478,382 | JPMorgan Chase Bank, N.A. | 10/24/24 | 34,998 | — |
| UZS | 66,799,282,000 | USD | 4,916,411 | ICBC Standard Bank plc | 11/15/24 | 58,955 | — |
| EGP | 75,991,538 | USD | 1,468,436 | HSBC Bank USA, N.A. | 11/27/24 | 22,371 | — |
| USD | 940,538 | ZMW | 26,241,000 | Citibank, N.A. | 11/29/24 | 40,146 | — |
| ZMW | 26,241,000 | USD | 1,017,101 | Standard Chartered Bank | 11/29/24 | — | (116,709) |
| USD | 13,644,426 | HKD | 106,000,000 | BNP Paribas | 12/9/24 | 23,360 | — |
| USD | 37,448,989 | HKD | 290,900,000 | Deutsche Bank AG | 12/9/24 | 68,158 | — |
| TRY | 810,105,292 | USD | 20,812,120 | Standard Chartered Bank | 12/16/24 | — | (1,208,994) |
| TRY | 222,407,816 | USD | 5,330,964 | Standard Chartered Bank | 12/18/24 | 40,247 | — |
| USD | 3,172,432 | KES | 466,347,541 | Standard Chartered Bank | 12/18/24 | — | (161,285) |
| EGP | 429,234,287 | USD | 8,215,010 | Goldman Sachs International | 12/26/24 | 123,649 | — |
| EGP | 992,980,000 | USD | 18,968,099 | Goldman Sachs International | 12/31/24 | 289,984 | — |
| EGP | 340,478,000 | USD | 6,630,536 | HSBC Bank USA, N.A. | 1/2/25 | — | (31,655) |
| TRY | 584,426,780 | USD | 13,824,517 | Standard Chartered Bank | 1/6/25 | 28,680 | — |
| TRY | 276,896,900 | USD | 6,550,337 | Standard Chartered Bank | 1/6/25 | 13,201 | — |
| TRY | 197,106,600 | USD | 4,659,096 | Standard Chartered Bank | 1/6/25 | 13,100 | — |
| TRY | 207,660,500 | USD | 4,912,716 | Standard Chartered Bank | 1/6/25 | 9,649 | — |
| UZS | 50,108,154,000 | USD | 3,579,154 | JPMorgan Chase Bank, N.A. | 1/6/25 | 92,669 | — |
| EGP | 172,186,615 | USD | 3,286,004 | Standard Chartered Bank | 1/15/25 | 36,698 | — |
| TRY | 274,200,000 | USD | 6,384,219 | Standard Chartered Bank | 1/15/25 | 58,981 | — |
| UZS | 54,430,517,000 | USD | 3,868,551 | ICBC Standard Bank plc | 1/23/25 | 207,215 | — |
| UZS | 45,422,117,948 | USD | 3,250,241 | ICBC Standard Bank plc | 1/23/25 | 150,975 | — |
| TRY | 204,065,622 | USD | 4,650,682 | Standard Chartered Bank | 1/29/25 | 80,611 | — |
| TRY | 275,637,775 | USD | 6,349,345 | Standard Chartered Bank | 1/29/25 | 41,358 | — |
| TRY | 205,726,000 | USD | 4,736,885 | Standard Chartered Bank | 1/29/25 | 32,904 | — |
| UZS | 11,980,321,831 | USD | 865,630 | JPMorgan Chase Bank, N.A. | 1/29/25 | 6,384 | — |
| TRY | 348,446,365 | USD | 8,051,043 | Standard Chartered Bank | 2/10/25 | — | (57,288) |
37
See Notes to Consolidated Financial Statements.
Global Macro Absolute Return Advantage Portfolio
April 30, 2024
Consolidated Portfolio of Investments (Unaudited) — continued
| Forward Foreign Currency Exchange Contracts (OTC) (continued) |
| Currency Purchased | Currency Sold | Counterparty | Settlement
Date | Unrealized
Appreciation | Unrealized
(Depreciation) |
| UZS | 54,159,721,000 | USD | 3,868,552 | ICBC Standard Bank plc | 2/10/25 | $ 59,861 | $ — |
| EGP | 523,539,906 | USD | 8,696,676 | Citibank, N.A. | 2/13/25 | 1,303,750 | — |
| UZS | 49,482,178,280 | USD | 3,521,863 | JPMorgan Chase Bank, N.A. | 2/13/25 | 64,147 | — |
| UZS | 63,552,436,124 | USD | 4,520,088 | JPMorgan Chase Bank, N.A. | 2/18/25 | 78,939 | — |
| EGP | 175,382,970 | USD | 2,898,892 | Citibank, N.A. | 2/20/25 | 442,182 | — |
| EGP | 107,664,850 | USD | 1,739,335 | Citibank, N.A. | 2/20/25 | 311,698 | — |
| EGP | 90,590,377 | USD | 1,449,446 | Citibank, N.A. | 2/20/25 | 276,315 | — |
| NGN | 5,359,349,909 | USD | 2,912,690 | Standard Chartered Bank | 2/24/25 | 577,868 | — |
| NGN | 2,716,083,583 | USD | 1,456,345 | Standard Chartered Bank | 2/24/25 | 312,647 | — |
| NGN | 4,159,580,543 | USD | 2,514,861 | JPMorgan Chase Bank, N.A. | 2/25/25 | 193,412 | — |
| EGP | 43,308,143 | USD | 801,261 | Goldman Sachs International | 2/26/25 | 21,868 | — |
| EGP | 94,648,825 | USD | 1,449,446 | Citibank, N.A. | 2/27/25 | 348,791 | — |
| EGP | 81,498,172 | USD | 1,468,436 | HSBC Bank USA, N.A. | 2/27/25 | 79,952 | — |
| UZS | 64,418,704,293 | USD | 4,576,817 | ICBC Standard Bank plc | 2/28/25 | 71,443 | — |
| UZS | 22,806,122,207 | USD | 1,632,507 | ICBC Standard Bank plc | 3/5/25 | 10,743 | — |
| UZS | 21,100,777,180 | USD | 1,495,979 | JPMorgan Chase Bank, N.A. | 3/17/25 | 19,156 | — |
| UZS | 19,658,896,895 | USD | 1,393,260 | JPMorgan Chase Bank, N.A. | 3/20/25 | 17,126 | — |
| USD | 3,172,432 | KES | 475,864,837 | Standard Chartered Bank | 3/21/25 | — | (167,394) |
| EGP | 2,859,077,953 | USD | 52,346,808 | Goldman Sachs International | 3/25/25 | 1,436,904 | — |
| EGP | 357,517,247 | USD | 6,572,008 | Goldman Sachs International | 3/26/25 | 150,897 | — |
| EGP | 1,034,713,000 | USD | 18,968,158 | Bank of America, N.A. | 3/27/25 | 481,642 | — |
| EGP | 53,780,069 | USD | 1,004,867 | Standard Chartered Bank | 4/3/25 | 3,376 | — |
| USD | 4,758,696 | KES | 693,580,000 | Standard Chartered Bank | 4/4/25 | — | (95,641) |
| UZS | 19,573,694,237 | USD | 1,378,429 | JPMorgan Chase Bank, N.A. | 4/4/25 | 9,513 | — |
| UZS | 9,422,051,685 | USD | 665,869 | JPMorgan Chase Bank, N.A. | 4/4/25 | 2,235 | — |
| EGP | 507,174,446 | USD | 9,444,589 | Goldman Sachs International | 4/8/25 | 45,724 | — |
| TRY | 261,370,000 | USD | 5,694,381 | Standard Chartered Bank | 4/8/25 | 30,562 | — |
| TRY | 234,960,000 | USD | 5,124,578 | Standard Chartered Bank | 4/8/25 | 21,891 | — |
| USD | 2,774,809 | KES | 405,122,112 | Standard Chartered Bank | 4/9/25 | — | (57,816) |
| UZS | 17,433,106,209 | USD | 1,217,396 | Standard Chartered Bank | 4/15/25 | 18,761 | — |
| USD | 2,774,809 | KES | 404,705,891 | Standard Chartered Bank | 4/16/25 | 133,777 | — |
| UZS | 100,794,050,000 | USD | 7,075,749 | ICBC Standard Bank plc | 4/17/25 | 97,862 | — |
| USD | 1,131,469 | KES | 174,812,031 | Standard Chartered Bank | 5/5/25 | — | (84,561) |
| USD | 1,131,469 | KES | 174,812,032 | Standard Chartered Bank | 5/5/25 | — | (84,561) |
| USD | 7,657,092 | BHD | 2,927,000 | Standard Chartered Bank | 6/13/25 | — | (75,317) |
| USD | 35,111,769 | BHD | 13,422,878 | Standard Chartered Bank | 6/18/25 | — | (346,511) |
| USD | 11,380,379 | SAR | 42,945,000 | Standard Chartered Bank | 6/18/25 | — | (39,469) |
| UZS | 53,922,250,000 | USD | 3,359,642 | Standard Chartered Bank | 3/25/26 | 65,185 | — |
| | | | | | | $45,227,924 | $(33,437,732) |
38
See Notes to Consolidated Financial Statements.
Global Macro Absolute Return Advantage Portfolio
April 30, 2024
Consolidated Portfolio of Investments (Unaudited) — continued
| Futures Contracts |
| Description | Number of
Contracts | Position | Expiration
Date | Notional
Amount | Value/Unrealized
Appreciation
(Depreciation) |
| Equity Futures | | | | | |
| Nikkei 225 Index | 174 | Long | 6/13/24 | $ 33,225,300 | $ (1,209,534) |
| Euro Stoxx 50 Index | (891) | Short | 6/21/24 | (46,373,562) | (30,891) |
| IFSC Nifty 50 Index | (468) | Short | 5/30/24 | (21,243,454) | (146,632) |
| S&P/TSX 60 Index | (146) | Short | 6/20/24 | (27,690,844) | 326,387 |
| Interest Rate Futures | | | | | |
| U.S. 5-Year Treasury Note | 398 | Long | 6/28/24 | 41,687,391 | (632,229) |
| Euro-Bobl | (567) | Short | 6/6/24 | (70,452,109) | 937,474 |
| Euro-BTP | (544) | Short | 6/6/24 | (67,919,375) | 1,522,991 |
| Euro-Bund | (1,534) | Short | 6/6/24 | (212,952,101) | 4,319,831 |
| Euro-Buxl | (68) | Short | 6/6/24 | (9,355,678) | 311,664 |
| Euro-Schatz | (163) | Short | 6/6/24 | (18,284,272) | 97,817 |
| Japan 10-Year Bond | (133) | Short | 6/13/24 | (121,855,879) | 880,342 |
| U.S. 2-Year Treasury Note | (7) | Short | 6/28/24 | (1,418,594) | 13,607 |
| U.S. 10-Year Treasury Note | (799) | Short | 6/18/24 | (85,842,563) | 263,739 |
| U.S. Long Treasury Bond | (271) | Short | 6/18/24 | (30,843,188) | 178,093 |
| U.S. Ultra 10-Year Treasury Note | (148) | Short | 6/18/24 | (16,312,375) | 432,754 |
| U.S. Ultra-Long Treasury Bond | (530) | Short | 6/18/24 | (63,368,125) | 3,206,709 |
| | | | | | $10,472,122 |
| Inflation Swaps (Centrally Cleared) |
Notional Amount
(000's omitted) | Portfolio
Pays/Receives
Return on
Reference Index | Reference Index | Portfolio
Pays/Receives
Rate | Annual
Rate | Termination
Date | Value/Unrealized
Appreciation
(Depreciation) |
| EUR | 11,000 | Receives | Eurostat Eurozone HICP ex Tobacco NSA
(pays upon termination) | Pays | 2.20%
(pays upon termination) | 10/15/36 | $ 1,383,078 |
| EUR | 10,900 | Receives | Eurostat Eurozone HICP ex Tobacco NSA
(pays upon termination) | Pays | 2.20%
(pays upon termination) | 10/15/36 | 1,371,909 |
| EUR | 10,900 | Receives | Eurostat Eurozone HICP ex Tobacco NSA
(pays upon termination) | Pays | 2.20%
(pays upon termination) | 10/15/36 | 1,371,909 |
| EUR | 11,410 | Receives | Eurostat Eurozone HICP ex Tobacco NSA
(pays upon termination) | Pays | 2.08%
(pays upon termination) | 1/15/37 | 1,533,736 |
| EUR | 10,900 | Pays | Eurostat Eurozone HICP ex Tobacco NSA
(pays upon termination) | Receives | 2.29%
(pays upon termination) | 10/15/46 | (1,653,717) |
| EUR | 10,900 | Pays | Eurostat Eurozone HICP ex Tobacco NSA
(pays upon termination) | Receives | 2.29%
(pays upon termination) | 10/15/46 | (1,657,832) |
| EUR | 11,000 | Pays | Eurostat Eurozone HICP ex Tobacco NSA
(pays upon termination) | Receives | 2.29%
(pays upon termination) | 10/15/46 | (1,668,888) |
39
See Notes to Consolidated Financial Statements.
Global Macro Absolute Return Advantage Portfolio
April 30, 2024
Consolidated Portfolio of Investments (Unaudited) — continued
| Inflation Swaps (Centrally Cleared) (continued) |
Notional Amount
(000's omitted) | Portfolio
Pays/Receives
Return on
Reference Index | Reference Index | Portfolio
Pays/Receives
Rate | Annual
Rate | Termination
Date | Value/Unrealized
Appreciation
(Depreciation) |
| EUR | 11,410 | Pays | Eurostat Eurozone HICP ex Tobacco NSA
(pays upon termination) | Receives | 2.18%
(pays upon termination) | 1/15/47 | $ (1,949,385) |
| EUR | 4,350 | Pays | Eurostat Eurozone HICP ex Tobacco NSA
(pays upon termination) | Receives | 1.10%
(pays upon termination) | 3/12/50 | (2,075,317) |
| EUR | 7,900 | Pays | Eurostat Eurozone HICP ex Tobacco NSA
(pays upon termination) | Receives | 2.64%
(pays upon termination) | 3/13/53 | 138,350 |
| USD | 9,489 | Receives | Return on CPI-U (NSA)
(pays upon termination) | Pays | 2.44%
(pays upon termination) | 1/13/33 | 173,587 |
| USD | 4,900 | Receives | Return on CPI-U (NSA)
(pays upon termination) | Pays | 2.60%
(pays upon termination) | 4/3/33 | 35,530 |
| USD | 10,000 | Receives | Return on CPI-U (NSA)
(pays upon termination) | Pays | 2.61%
(pays upon termination) | 4/3/33 | 63,038 |
| USD | 6,000 | Receives | Return on CPI-U (NSA)
(pays upon termination) | Pays | 2.53%
(pays upon termination) | 11/21/33 | 46,511 |
| USD | 51,550 | Pays | Return on CPI-U (NSA)
(pays upon termination) | Receives | 2.75%
(pays upon termination) | 10/29/36 | (2,163,973) |
| USD | 18,160 | Pays | Return on CPI-U (NSA)
(pays upon termination) | Receives | 2.67%
(pays upon termination) | 1/7/37 | (773,369) |
| USD | 34,300 | Receives | Return on CPI-U (NSA)
(pays upon termination) | Pays | 2.62%
(pays upon termination) | 10/29/46 | 1,379,194 |
| USD | 17,300 | Receives | Return on CPI-U (NSA)
(pays upon termination) | Pays | 2.62%
(pays upon termination) | 10/29/46 | 689,231 |
| USD | 18,140 | Receives | Return on CPI-U (NSA)
(pays upon termination) | Pays | 2.54%
(pays upon termination) | 1/7/47 | 860,580 |
| USD | 5,824 | Receives | Return on CPI-U (NSA)
(pays upon termination) | Pays | 2.42%
(pays upon termination) | 6/8/48 | 525,616 |
| USD | 10,710 | Receives | Return on CPI-U (NSA)
(pays upon termination) | Pays | 2.40%
(pays upon termination) | 3/13/53 | 399,879 |
| | | | | | | | $ (1,970,333) |
| Interest Rate Swaps (Centrally Cleared) |
Notional Amount
(000's omitted) | Portfolio
Pays/
Receives
Floating
Rate | Floating Rate | Annual
Fixed Rate | Termination
Date | Value | Unamortized
Upfront
Receipts
(Payments) | Unrealized
Appreciation
(Depreciation) |
| BRL | 230,200 | Pays | Brazil CETIP Interbank Deposit Rate
(pays upon termination) | 10.34%
(pays upon termination) | 7/1/25 | $ (54,569) | $ — | $ (54,569) |
| BRL | 345,800 | Pays | Brazil CETIP Interbank Deposit Rate
(pays upon termination) | 10.43%
(pays upon termination) | 7/1/25 | (14,518) | — | (14,518) |
| BRL | 483,000 | Pays | Brazil CETIP Interbank Deposit Rate
(pays upon termination) | 10.52%
(pays upon termination) | 7/1/25 | 72,935 | — | 72,935 |
40
See Notes to Consolidated Financial Statements.
Global Macro Absolute Return Advantage Portfolio
April 30, 2024
Consolidated Portfolio of Investments (Unaudited) — continued
| Interest Rate Swaps (Centrally Cleared) (continued) |
Notional Amount
(000's omitted) | Portfolio
Pays/
Receives
Floating
Rate | Floating Rate | Annual
Fixed Rate | Termination
Date | Value | Unamortized
Upfront
Receipts
(Payments) | Unrealized
Appreciation
(Depreciation) |
| BRL | 163,800 | Pays | Brazil CETIP Interbank Deposit Rate
(pays upon termination) | 10.56%
(pays upon termination) | 7/1/25 | $ 39,974 | $ — | $ 39,974 |
| BRL | 79,100 | Pays | Brazil CETIP Interbank Deposit Rate
(pays upon termination) | 10.60%
(pays upon termination) | 7/1/25 | 25,606 | — | 25,606 |
| BRL | 901,620 | Pays | Brazil CETIP Interbank Deposit Rate
(pays upon termination) | 9.96%
(pays upon termination) | 1/2/26 | (1,866,061) | — | (1,866,061) |
| BRL | 1,007,688 | Pays | Brazil CETIP Interbank Deposit Rate
(pays upon termination) | 9.98%
(pays upon termination) | 1/2/26 | (1,999,443) | — | (1,999,443) |
| CLP | 40,832,380 | Receives | 6-month Sinacofi Chile Interbank Rate
(pays semi-annually) | 4.77%
(pays semi-annually) | 6/6/33 | 886,029 | 12,225 | 898,254 |
| CLP | 13,713,620 | Receives | 6-month Sinacofi Chile Interbank Rate
(pays semi-annually) | 4.65%
(pays semi-annually) | 6/14/33 | 361,414 | — | 361,414 |
| CLP | 11,010,000 | Receives | 6-month Sinacofi Chile Interbank Rate
(pays semi-annually) | 5.00%
(pays semi-annually) | 6/22/33 | 375,472 | — | 375,472 |
| CLP | 12,557,000 | Receives | 6-month Sinacofi Chile Interbank Rate
(pays semi-annually) | 5.20%
(pays semi-annually) | 6/22/33 | 223,740 | — | 223,740 |
| CLP | 6,085,000 | Receives | 6-month Sinacofi Chile Interbank Rate
(pays semi-annually) | 5.22%
(pays semi-annually) | 12/20/33 | 114,026 | — | 114,026 |
| CLP | 15,037,000 | Receives | 6-month Sinacofi Chile Interbank Rate
(pays semi-annually) | 4.94%
(pays semi-annually) | 6/21/34 | 495,279 | — | 495,279 |
| CLP | 10,270,000 | Receives | 6-month Sinacofi Chile Interbank Rate
(pays semi-annually) | 4.94%
(pays semi-annually) | 6/21/34 | 334,134 | — | 334,134 |
| CLP | 4,971,000 | Receives | 6-month Sinacofi Chile Interbank Rate
(pays semi-annually) | 5.06%
(pays semi-annually) | 6/21/34 | 115,731 | — | 115,731 |
| CLP | 12,325,000 | Receives | 6-month Sinacofi Chile Interbank Rate
(pays semi-annually) | 5.07%
(pays semi-annually) | 6/21/34 | 272,064 | — | 272,064 |
| CLP | 6,705,037 | Receives | 6-month Sinacofi Chile Interbank Rate
(pays semi-annually) | 5.08%
(pays semi-annually) | 6/21/34 | 142,613 | — | 142,613 |
| CLP | 12,326,000 | Receives | 6-month Sinacofi Chile Interbank Rate
(pays semi-annually) | 5.09%
(pays semi-annually) | 6/21/34 | 252,250 | — | 252,250 |
| CLP | 6,161,963 | Receives | 6-month Sinacofi Chile Interbank Rate
(pays semi-annually) | 5.12%
(pays semi-annually) | 6/21/34 | 111,229 | — | 111,229 |
| COP | 86,746,200 | Receives | Colombia Overnight Interbank Reference Rate
(pays quarterly) | 3.84%
(pays quarterly) | 5/5/25 | 1,658,935 | — | 1,658,935 |
| COP | 40,662,300 | Pays | Colombia Overnight Interbank Reference Rate
(pays quarterly) | 3.19%
(pays quarterly) | 6/4/25 | (825,119) | — | (825,119) |
41
See Notes to Consolidated Financial Statements.
Global Macro Absolute Return Advantage Portfolio
April 30, 2024
Consolidated Portfolio of Investments (Unaudited) — continued
| Interest Rate Swaps (Centrally Cleared) (continued) |
Notional Amount
(000's omitted) | Portfolio
Pays/
Receives
Floating
Rate | Floating Rate | Annual
Fixed Rate | Termination
Date | Value | Unamortized
Upfront
Receipts
(Payments) | Unrealized
Appreciation
(Depreciation) |
| COP | 61,940,900 | Pays | Colombia Overnight Interbank Reference Rate
(pays quarterly) | 3.26%
(pays quarterly) | 6/5/25 | $ (1,242,865) | $ — | $ (1,242,865) |
| COP | 85,106,600 | Pays | Colombia Overnight Interbank Reference Rate
(pays quarterly) | 3.34%
(pays quarterly) | 6/8/25 | (1,678,188) | — | (1,678,188) |
| COP | 41,729,700 | Pays | Colombia Overnight Interbank Reference Rate
(pays quarterly) | 3.44%
(pays quarterly) | 6/9/25 | (803,480) | — | (803,480) |
| COP | 6,351,000 | Receives | Colombia Overnight Interbank Reference Rate
(pays quarterly) | 4.02%
(pays quarterly) | 11/26/25 | 141,665 | — | 141,665 |
| COP | 29,320,000 | Receives | Colombia Overnight Interbank Reference Rate
(pays quarterly) | 4.07%
(pays quarterly) | 11/26/25 | 647,307 | — | 647,307 |
| COP | 20,326,400 | Receives | Colombia Overnight Interbank Reference Rate
(pays quarterly) | 4.11%
(pays quarterly) | 11/26/25 | 445,795 | — | 445,795 |
| COP | 6,192,100 | Receives | Colombia Overnight Interbank Reference Rate
(pays quarterly) | 4.21%
(pays quarterly) | 11/26/25 | 133,230 | — | 133,230 |
| COP | 15,771,100 | Receives | Colombia Overnight Interbank Reference Rate
(pays quarterly) | 4.34%
(pays quarterly) | 11/26/25 | 330,235 | — | 330,235 |
| COP | 27,035,200 | Pays | Colombia Overnight Interbank Reference Rate
(pays quarterly) | 5.68%
(pays quarterly) | 11/26/25 | (415,944) | — | (415,944) |
| COP | 35,344,000 | Receives | Colombia Overnight Interbank Reference Rate
(pays quarterly) | 6.06%
(pays quarterly) | 11/26/25 | 397,318 | — | 397,318 |
| COP | 7,565,000 | Receives | Colombia Overnight Interbank Reference Rate
(pays quarterly) | 10.17%
(pays quarterly) | 11/26/25 | (24,796) | (64) | (24,860) |
| COP | 14,525,000 | Receives | Colombia Overnight Interbank Reference Rate
(pays quarterly) | 10.28%
(pays quarterly) | 11/26/25 | (54,249) | — | (54,249) |
| CZK | 569,000 | Pays | 6-month CZK PRIBOR
(pays semi-annually) | 4.18%
(pays annually) | 9/20/28 | 442,212 | — | 442,212 |
| CZK | 155,489 | Pays | 6-month CZK PRIBOR
(pays semi-annually) | 3.94%
(pays annually) | 9/20/33 | (17,120) | — | (17,120) |
| CZK | 310,979 | Pays | 6-month CZK PRIBOR
(pays semi-annually) | 3.96%
(pays annually) | 9/20/33 | (18,649) | — | (18,649) |
| CZK | 467,532 | Pays | 6-month CZK PRIBOR
(pays semi-annually) | 3.96%
(pays annually) | 9/20/33 | (15,813) | — | (15,813) |
| CZK | 753,484 | Pays | 6-month CZK PRIBOR
(pays semi-annually) | 4.12%
(pays annually) | 12/20/33 | (573,605) | — | (573,605) |
| CZK | 642,816 | Pays | 6-month CZK PRIBOR
(pays semi-annually) | 4.15%
(pays annually) | 12/20/33 | (403,938) | — | (403,938) |
| CZK | 225,000 | Pays | 6-month CZK PRIBOR
(pays semi-annually) | 4.31%
(pays annually) | 12/20/33 | (19,799) | — | (19,799) |
| CZK | 340,000 | Pays | 6-month CZK PRIBOR
(pays semi-annually) | 3.41%
(pays annually) | 3/20/34 | (976,809) | — | (976,809) |
| CZK | 680,000 | Pays | 6-month CZK PRIBOR
(pays semi-annually) | 3.43%
(pays annually) | 3/20/34 | (1,916,679) | — | (1,916,679) |
42
See Notes to Consolidated Financial Statements.
Global Macro Absolute Return Advantage Portfolio
April 30, 2024
Consolidated Portfolio of Investments (Unaudited) — continued
| Interest Rate Swaps (Centrally Cleared) (continued) |
Notional Amount
(000's omitted) | Portfolio
Pays/
Receives
Floating
Rate | Floating Rate | Annual
Fixed Rate | Termination
Date | Value | Unamortized
Upfront
Receipts
(Payments) | Unrealized
Appreciation
(Depreciation) |
| CZK | 340,000 | Pays | 6-month CZK PRIBOR
(pays semi-annually) | 3.45%
(pays annually) | 3/20/34 | $ (924,368) | $ — | $ (924,368) |
| CZK | 340,000 | Pays | 6-month CZK PRIBOR
(pays semi-annually) | 3.47%
(pays annually) | 3/20/34 | (910,136) | — | (910,136) |
| CZK | 824,000 | Pays | 6-month CZK PRIBOR
(pays semi-annually) | 4.08%
(pays annually) | 6/19/34 | (261,693) | — | (261,693) |
| CZK | 311,610 | Pays | 6-month CZK PRIBOR
(pays semi-annually) | 4.11%
(pays annually) | 6/19/34 | (68,693) | — | (68,693) |
| CZK | 311,610 | Pays | 6-month CZK PRIBOR
(pays semi-annually) | 4.12%
(pays annually) | 6/19/34 | (57,882) | — | (57,882) |
| CZK | 576,800 | Pays | 6-month CZK PRIBOR
(pays semi-annually) | 4.20%
(pays annually) | 6/19/34 | 52,951 | — | 52,951 |
| CZK | 357,180 | Pays | 6-month CZK PRIBOR
(pays semi-annually) | 4.27%
(pays annually) | 6/19/34 | 122,632 | — | 122,632 |
| EUR | 2,800 | Receives | 1-day Euro Short-Term Rate
(pays annually) | 2.60%
(pays annually) | 1/24/28 | 40,855 | (45) | 40,810 |
| EUR | 5,444 | Pays | 6-month EURIBOR
(pays semi-annually) | 3.03%
(pays annually) | 10/10/29 | 108,125 | — | 108,125 |
| EUR | 1,800 | Pays | 6-month EURIBOR
(pays semi-annually) | 3.17%
(pays annually) | 10/17/29 | 51,762 | — | 51,762 |
| EUR | 2,719 | Pays | 6-month EURIBOR
(pays semi-annually) | 3.01%
(pays annually) | 10/27/29 | 52,908 | — | 52,908 |
| EUR | 600 | Pays | 6-month EURIBOR
(pays semi-annually) | 3.26%
(pays annually) | 10/17/32 | 28,752 | — | 28,752 |
| EUR | 1,200 | Pays | 6-month EURIBOR
(pays semi-annually) | 3.31%
(pays annually) | 10/18/32 | 63,060 | — | 63,060 |
| EUR | 1,200 | Pays | 6-month EURIBOR
(pays semi-annually) | 3.20%
(pays annually) | 10/19/32 | 51,994 | — | 51,994 |
| EUR | 2,700 | Receives | 1-day Euro Short-Term Rate
(pays annually) | 0.83%
(pays annually) | 3/17/52 | 1,013,558 | (1,497) | 1,012,061 |
| EUR | 2,702 | Receives | 1-day Euro Short-Term Rate
(pays annually) | 0.86%
(pays annually) | 3/18/52 | 995,702 | 643 | 996,345 |
| EUR | 3,019 | Receives | 1-day Euro Short-Term Rate
(pays annually) | 0.87%
(pays annually) | 3/18/52 | 1,103,950 | (106) | 1,103,844 |
| EUR | 970 | Receives | 1-day Euro Short-Term Rate
(pays annually) | 1.29%
(pays annually) | 4/20/52 | 267,158 | 33 | 267,191 |
| GBP | 15,312 | Pays | 1-day Sterling Overnight Index Average
(pays annually) | 4.56%
(pays annually) | 10/2/28 | 112,369 | — | 112,369 |
| GBP | 12,044 | Pays | 1-day Sterling Overnight Index Average
(pays annually) | 3.61%
(pays annually) | 12/20/28 | (509,820) | — | (509,820) |
| GBP | 12,044 | Pays | 1-day Sterling Overnight Index Average
(pays annually) | 3.64%
(pays annually) | 12/20/28 | (489,693) | — | (489,693) |
| GBP | 12,044 | Pays | 1-day Sterling Overnight Index Average
(pays annually) | 3.69%
(pays annually) | 12/20/28 | (455,715) | — | (455,715) |
43
See Notes to Consolidated Financial Statements.
Global Macro Absolute Return Advantage Portfolio
April 30, 2024
Consolidated Portfolio of Investments (Unaudited) — continued
| Interest Rate Swaps (Centrally Cleared) (continued) |
Notional Amount
(000's omitted) | Portfolio
Pays/
Receives
Floating
Rate | Floating Rate | Annual
Fixed Rate | Termination
Date | Value | Unamortized
Upfront
Receipts
(Payments) | Unrealized
Appreciation
(Depreciation) |
| GBP | 12,269 | Pays | 1-day Sterling Overnight Index Average
(pays annually) | 3.72%
(pays annually) | 12/20/28 | $ (447,124) | $ — | $ (447,124) |
| GBP | 15,232 | Pays | 1-day Sterling Overnight Index Average
(pays annually) | 4.27%
(pays annually) | 12/20/28 | (80,679) | — | (80,679) |
| GBP | 15,218 | Pays | 1-day Sterling Overnight Index Average
(pays annually) | 4.28%
(pays annually) | 12/20/28 | (72,101) | — | (72,101) |
| GBP | 30,192 | Pays | 1-day Sterling Overnight Index Average
(pays annually) | 4.39%
(pays annually) | 12/20/28 | 42,999 | — | 42,999 |
| GBP | 15,096 | Pays | 1-day Sterling Overnight Index Average
(pays annually) | 4.59%
(pays annually) | 12/20/28 | 187,643 | — | 187,643 |
| GBP | 17,726 | Pays | 1-day Sterling Overnight Index Average
(pays annually) | 3.73%
(pays annually) | 3/20/29 | (543,945) | — | (543,945) |
| GBP | 17,726 | Pays | 1-day Sterling Overnight Index Average
(pays annually) | 3.76%
(pays annually) | 3/20/29 | (519,465) | — | (519,465) |
| GBP | 17,933 | Pays | 1-day Sterling Overnight Index Average
(pays annually) | 3.76%
(pays annually) | 3/20/29 | (524,051) | — | (524,051) |
| GBP | 17,726 | Pays | 1-day Sterling Overnight Index Average
(pays annually) | 3.77%
(pays annually) | 3/20/29 | (507,713) | — | (507,713) |
| GBP | 17,799 | Pays | 1-day Sterling Overnight Index Average
(pays annually) | 3.83%
(pays annually) | 3/20/29 | (450,342) | — | (450,342) |
| HUF | 4,990,512 | Pays | 6-month HUF BUBOR
(pays semi-annually) | 6.92%
(pays annually) | 6/19/29 | 16,823 | — | 16,823 |
| HUF | 3,342,301 | Pays | 6-month HUF BUBOR
(pays semi-annually) | 6.94%
(pays annually) | 6/19/29 | 16,826 | — | 16,826 |
| HUF | 5,032,188 | Pays | 6-month HUF BUBOR
(pays semi-annually) | 6.94%
(pays annually) | 6/19/29 | 28,122 | — | 28,122 |
| HUF | 3,776,964 | Pays | 6-month HUF BUBOR
(pays semi-annually) | 7.90%
(pays annually) | 4/27/33 | 605,673 | — | 605,673 |
| HUF | 5,920,391 | Pays | 6-month HUF BUBOR
(pays semi-annually) | 8.08%
(pays annually) | 5/25/33 | 1,618,265 | — | 1,618,265 |
| HUF | 1,888,482 | Pays | 6-month HUF BUBOR
(pays semi-annually) | 7.88%
(pays annually) | 6/5/33 | 438,614 | — | 438,614 |
| HUF | 7,257,534 | Pays | 6-month HUF BUBOR
(pays semi-annually) | 6.74%
(pays annually) | 6/19/34 | (368,879) | — | (368,879) |
| HUF | 1,441,968 | Pays | 6-month HUF BUBOR
(pays semi-annually) | 6.76%
(pays annually) | 6/19/34 | (68,165) | — | (68,165) |
| HUF | 19,475,497 | Pays | 6-month HUF BUBOR
(pays semi-annually) | 6.78%
(pays annually) | 6/19/34 | (845,468) | — | (845,468) |
| HUF | 2,254,000 | Pays | 6-month HUF BUBOR
(pays semi-annually) | 6.84%
(pays annually) | 6/19/34 | (72,363) | — | (72,363) |
| HUF | 6,810,948 | Pays | 6-month HUF BUBOR
(pays semi-annually) | 6.99%
(pays annually) | 6/19/34 | (27,286) | — | (27,286) |
44
See Notes to Consolidated Financial Statements.
Global Macro Absolute Return Advantage Portfolio
April 30, 2024
Consolidated Portfolio of Investments (Unaudited) — continued
| Interest Rate Swaps (Centrally Cleared) (continued) |
Notional Amount
(000's omitted) | Portfolio
Pays/
Receives
Floating
Rate | Floating Rate | Annual
Fixed Rate | Termination
Date | Value | Unamortized
Upfront
Receipts
(Payments) | Unrealized
Appreciation
(Depreciation) |
| HUF | 14,714,051 | Pays | 6-month HUF BUBOR
(pays semi-annually) | 7.03%
(pays annually) | 6/19/34 | $ 66,867 | $ — | $ 66,867 |
| INR | 4,859,300 | Pays | 1-day INR FBIL MIBOR
(pays semi-annually) | 6.53%
(pays semi-annually) | 9/18/26 | (72,852) | — | (72,852) |
| INR | 4,860,000 | Pays | 1-day INR FBIL MIBOR
(pays semi-annually) | 6.55%
(pays semi-annually) | 9/18/26 | (53,087) | — | (53,087) |
| INR | 2,429,400 | Pays | 1-day INR FBIL MIBOR
(pays semi-annually) | 6.57%
(pays semi-annually) | 9/18/26 | (18,213) | — | (18,213) |
| INR | 2,429,000 | Pays | 1-day INR FBIL MIBOR
(pays semi-annually) | 6.59%
(pays semi-annually) | 9/18/26 | (7,025) | — | (7,025) |
| INR | 2,430,000 | Pays | 1-day INR FBIL MIBOR
(pays semi-annually) | 6.61%
(pays semi-annually) | 9/18/26 | 2,079 | — | 2,079 |
| INR | 2,430,000 | Pays | 1-day INR FBIL MIBOR
(pays semi-annually) | 6.61%
(pays semi-annually) | 9/18/26 | 4,680 | — | 4,680 |
| INR | 1,804,100 | Pays | 1-day INR FBIL MIBOR
(pays semi-annually) | 6.62%
(pays semi-annually) | 9/18/26 | 5,408 | — | 5,408 |
| INR | 2,429,400 | Pays | 1-day INR FBIL MIBOR
(pays semi-annually) | 6.64%
(pays semi-annually) | 9/18/26 | 21,328 | — | 21,328 |
| INR | 2,429,400 | Pays | 1-day INR FBIL MIBOR
(pays semi-annually) | 6.66%
(pays semi-annually) | 9/18/26 | 30,695 | — | 30,695 |
| INR | 2,520,000 | Pays | 1-day INR FBIL MIBOR
(pays semi-annually) | 6.31%
(pays semi-annually) | 3/20/29 | (375,420) | — | (375,420) |
| INR | 7,000,000 | Pays | 1-day INR FBIL MIBOR
(pays semi-annually) | 6.31%
(pays semi-annually) | 3/20/29 | (1,042,480) | — | (1,042,480) |
| INR | 5,960,000 | Pays | 1-day INR FBIL MIBOR
(pays semi-annually) | 6.31%
(pays semi-annually) | 3/20/29 | (886,404) | — | (886,404) |
| INR | 1,134,200 | Pays | 1-day INR FBIL MIBOR
(pays semi-annually) | 6.57%
(pays semi-annually) | 6/19/29 | (13,443) | — | (13,443) |
| JPY | 6,104,000 | Receives | 1-day Overnight Tokyo Average Rate
(pays annually) | 0.31%
(pays annually) | 12/1/27 | 181,624 | — | 181,624 |
| JPY | 559,000 | Receives | 1-day Overnight Tokyo Average Rate
(pays annually) | 0.32%
(pays annually) | 12/1/27 | 15,726 | — | 15,726 |
| JPY | 5,588,000 | Receives | 1-day Overnight Tokyo Average Rate
(pays annually) | 0.32%
(pays annually) | 12/1/27 | 157,205 | — | 157,205 |
| JPY | 3,184,000 | Receives | 1-day Overnight Tokyo Average Rate
(pays annually) | 0.41%
(pays annually) | 9/20/28 | 56,581 | — | 56,581 |
| JPY | 6,296,000 | Receives | 1-day Overnight Tokyo Average Rate
(pays annually) | 0.57%
(pays annually) | 6/19/29 | 73,613 | — | 73,613 |
| JPY | 45,000 | Receives | 1-day Overnight Tokyo Average Rate
(pays annually) | 0.80%
(pays annually) | 9/20/33 | 1,357 | — | 1,357 |
| JPY | 57,000 | Receives | 1-day Overnight Tokyo Average Rate
(pays annually) | 0.80%
(pays annually) | 9/20/33 | 1,683 | — | 1,683 |
| JPY | 36,000 | Receives | 1-day Overnight Tokyo Average Rate
(pays annually) | 0.81%
(pays annually) | 9/20/33 | 949 | — | 949 |
45
See Notes to Consolidated Financial Statements.
Global Macro Absolute Return Advantage Portfolio
April 30, 2024
Consolidated Portfolio of Investments (Unaudited) — continued
| Interest Rate Swaps (Centrally Cleared) (continued) |
Notional Amount
(000's omitted) | Portfolio
Pays/
Receives
Floating
Rate | Floating Rate | Annual
Fixed Rate | Termination
Date | Value | Unamortized
Upfront
Receipts
(Payments) | Unrealized
Appreciation
(Depreciation) |
| JPY | 6,992,000 | Receives | 1-day Overnight Tokyo Average Rate
(pays annually) | 0.82%
(pays annually) | 9/20/33 | $ 130,666 | $ — | $ 130,666 |
| JPY | 2,841,000 | Receives | 1-day Overnight Tokyo Average Rate
(pays annually) | 0.86%
(pays annually) | 9/20/33 | (28,124) | — | (28,124) |
| JPY | 3,117,900 | Receives | 1-day Overnight Tokyo Average Rate
(pays annually) | 0.99%
(pays annually) | 12/20/33 | (197,522) | (123) | (197,645) |
| JPY | 2,031,000 | Receives | 1-day Overnight Tokyo Average Rate
(pays annually) | 1.07%
(pays annually) | 12/20/33 | (224,195) | — | (224,195) |
| JPY | 3,335,000 | Receives | 1-day Overnight Tokyo Average Rate
(pays annually) | 0.95%
(pays annually) | 3/21/34 | (24,274) | (15) | (24,289) |
| JPY | 2,826,000 | Receives | 1-day Overnight Tokyo Average Rate
(pays annually) | 1.55%
(pays annually) | 6/19/54 | 502,599 | — | 502,599 |
| KRW | 4,881,000 | Pays | 3-month KRW Certificate of Deposit Rate
(pays quarterly) | 3.29%
(pays quarterly) | 9/20/33 | (70,254) | — | (70,254) |
| KRW | 3,543,000 | Pays | 3-month KRW Certificate of Deposit Rate
(pays quarterly) | 3.31%
(pays quarterly) | 9/20/33 | (47,808) | — | (47,808) |
| KRW | 887,765 | Pays | 3-month KRW Certificate of Deposit Rate
(pays quarterly) | 3.31%
(pays quarterly) | 9/20/33 | (11,713) | — | (11,713) |
| KRW | 4,723,000 | Pays | 3-month KRW Certificate of Deposit Rate
(pays quarterly) | 3.33%
(pays quarterly) | 9/20/33 | (56,082) | — | (56,082) |
| KRW | 4,723,600 | Pays | 3-month KRW Certificate of Deposit Rate
(pays quarterly) | 3.34%
(pays quarterly) | 9/20/33 | (53,823) | — | (53,823) |
| KRW | 7,533,000 | Pays | 3-month KRW Certificate of Deposit Rate
(pays quarterly) | 3.40%
(pays quarterly) | 9/20/33 | (57,597) | — | (57,597) |
| KRW | 7,690,000 | Pays | 3-month KRW Certificate of Deposit Rate
(pays quarterly) | 3.52%
(pays quarterly) | 9/20/33 | (5,758) | — | (5,758) |
| KRW | 7,156,000 | Pays | 3-month KRW Certificate of Deposit Rate
(pays quarterly) | 3.56%
(pays quarterly) | 9/20/33 | 11,166 | — | 11,166 |
| KRW | 7,250,000 | Pays | 3-month KRW Certificate of Deposit Rate
(pays quarterly) | 3.59%
(pays quarterly) | 9/20/33 | 26,096 | — | 26,096 |
| MXN | 2,363,270 | Pays | Mexico Interbank TIIE 28 Day
(pays monthly) | 10.88%
(pays monthly) | 1/6/25 | (182,850) | — | (182,850) |
| MXN | 6,487,980 | Pays | Mexico Interbank TIIE 28 Day
(pays monthly) | 10.82%
(pays monthly) | 1/7/25 | (647,693) | — | (647,693) |
| MXN | 5,724,050 | Pays | Mexico Interbank TIIE 28 Day
(pays monthly) | 10.80%
(pays monthly) | 1/8/25 | (737,635) | — | (737,635) |
46
See Notes to Consolidated Financial Statements.
Global Macro Absolute Return Advantage Portfolio
April 30, 2024
Consolidated Portfolio of Investments (Unaudited) — continued
| Interest Rate Swaps (Centrally Cleared) (continued) |
Notional Amount
(000's omitted) | Portfolio
Pays/
Receives
Floating
Rate | Floating Rate | Annual
Fixed Rate | Termination
Date | Value | Unamortized
Upfront
Receipts
(Payments) | Unrealized
Appreciation
(Depreciation) |
| MXN | 449,560 | Pays | Mexico Interbank TIIE 28 Day
(pays monthly) | 8.71%
(pays monthly) | 12/1/33 | $ (1,477,075) | $ — | $ (1,477,075) |
| MXN | 432,300 | Pays | Mexico Interbank TIIE 28 Day
(pays monthly) | 8.77%
(pays monthly) | 12/1/33 | (1,322,928) | — | (1,322,928) |
| MXN | 267,690 | Pays | Mexico Interbank TIIE 28 Day
(pays monthly) | 8.43%
(pays monthly) | 12/2/33 | (1,160,089) | — | (1,160,089) |
| MXN | 276,650 | Pays | Mexico Interbank TIIE 28 Day
(pays monthly) | 8.49%
(pays monthly) | 12/2/33 | (1,141,775) | — | (1,141,775) |
| TWD | 339,300 | Receives | 3-month TWD TAIBOR
(pays quarterly) | 1.26%
(pays quarterly) | 3/20/29 | 304,980 | — | 304,980 |
| TWD | 451,200 | Receives | 3-month TWD TAIBOR
(pays quarterly) | 1.27%
(pays quarterly) | 3/20/29 | 395,567 | — | 395,567 |
| TWD | 458,400 | Receives | 3-month TWD TAIBOR
(pays quarterly) | 1.32%
(pays quarterly) | 3/20/29 | 368,029 | — | 368,029 |
| TWD | 1,079,800 | Receives | 3-month TWD TAIBOR
(pays quarterly) | 1.33%
(pays quarterly) | 3/20/29 | 846,989 | — | 846,989 |
| TWD | 372,000 | Receives | 3-month TWD TAIBOR
(pays quarterly) | 1.35%
(pays quarterly) | 3/20/29 | 282,181 | — | 282,181 |
| TWD | 1,486,900 | Receives | 3-month TWD TAIBOR
(pays quarterly) | 1.36%
(pays quarterly) | 3/20/29 | 1,105,928 | — | 1,105,928 |
| TWD | 451,200 | Receives | 3-month TWD TAIBOR
(pays quarterly) | 1.37%
(pays quarterly) | 3/20/29 | 328,931 | — | 328,931 |
| TWD | 451,200 | Receives | 3-month TWD TAIBOR
(pays quarterly) | 1.38%
(pays quarterly) | 3/20/29 | 325,599 | — | 325,599 |
| TWD | 2,187,400 | Receives | 3-month TWD TAIBOR
(pays quarterly) | 1.64%
(pays quarterly) | 6/19/29 | 818,693 | — | 818,693 |
| TWD | 829,000 | Receives | 3-month TWD TAIBOR
(pays quarterly) | 1.95%
(pays quarterly) | 6/19/29 | (76,935) | — | (76,935) |
| USD | 5,458 | Pays | SOFR
(pays annually) | 1.60%
(pays semi-annually) | 3/10/27 | (484,274) | (3,174) | (487,448) |
| USD | 5,970 | Receives | SOFR
(pays annually) | 1.60%
(pays semi-annually) | 3/10/27 | 529,702 | 3,681 | 533,383 |
| USD | 55,000 | Pays | SOFR
(pays annually) | 4.01%
(pays annually) | 8/4/28 | (1,705,897) | — | (1,705,897) |
| USD | 55,000 | Pays | SOFR
(pays annually) | 4.01%
(pays annually) | 8/4/28 | (1,703,376) | — | (1,703,376) |
| USD | 11,800 | Pays | SOFR
(pays annually) | 4.05%
(pays annually) | 9/20/28 | (322,984) | — | (322,984) |
| USD | 11,800 | Pays | SOFR
(pays annually) | 4.06%
(pays annually) | 9/20/28 | (321,642) | — | (321,642) |
| USD | 1,908 | Receives | SOFR
(pays annually) | 1.94%
(pays annually) | 3/17/32 | 312,208 | 87 | 312,295 |
| USD | 10,205 | Pays | SOFR
(pays annually) | 3.23%
(pays semi-annually) | 1/13/33 | (848,061) | — | (848,061) |
| USD | 4,900 | Pays | SOFR
(pays annually) | 3.27%
(pays annually) | 4/3/33 | (390,873) | — | (390,873) |
| USD | 10,000 | Pays | SOFR
(pays annually) | 3.28%
(pays annually) | 4/3/33 | (789,572) | — | (789,572) |
47
See Notes to Consolidated Financial Statements.
Global Macro Absolute Return Advantage Portfolio
April 30, 2024
Consolidated Portfolio of Investments (Unaudited) — continued
| Interest Rate Swaps (Centrally Cleared) (continued) |
Notional Amount
(000's omitted) | Portfolio
Pays/
Receives
Floating
Rate | Floating Rate | Annual
Fixed Rate | Termination
Date | Value | Unamortized
Upfront
Receipts
(Payments) | Unrealized
Appreciation
(Depreciation) |
| USD | 32,400 | Pays | SOFR
(pays annually) | 3.76%
(pays annually) | 9/20/33 | $ (404,300) | $ — | $ (404,300) |
| USD | 6,000 | Pays | SOFR
(pays annually) | 4.11%
(pays annually) | 11/21/33 | (132,142) | — | (132,142) |
| Total | | | | | | $(16,274,337) | $11,645 | $(16,262,692) |
| Interest Rate Swaps (OTC) |
| Counterparty | Notional Amount
(000's omitted) | Portfolio
Pays/Receives
Floating Rate | Floating Rate | Annual
Fixed Rate | Termination
Date | Value/Unrealized
Appreciation
(Depreciation) |
| BNP Paribas | MYR | 86,300 | Receives | 3-month MYR KLIBOR
(pays quarterly) | 3.63%
(pays quarterly) | 3/20/29 | $ 138,011 |
| JPMorgan Chase Bank, N.A. | MYR | 146,000 | Receives | 3-month MYR KLIBOR
(pays quarterly) | 3.65%
(pays quarterly) | 3/20/29 | 209,410 |
| Standard Chartered Bank | MYR | 195,000 | Receives | 3-month MYR KLIBOR
(pays quarterly) | 3.64%
(pays quarterly) | 3/20/29 | 285,365 |
| Total | | | | | | | $632,786 |
| Credit Default Swaps - Sell Protection (Centrally Cleared) |
| Reference Entity | Notional
Amount*
(000's omitted) | Contract Annual
Fixed Rate** | Current
Market Annual
Fixed Rate*** | Termination
Date | Value | Unamortized
Upfront
Receipts
(Payments) | Unrealized
Appreciation
(Depreciation) |
| Egypt | $ 8,778 | 1.00%
(pays quarterly)(1) | 6.31% | 12/20/28 | $ (1,637,671) | $ 2,476,055 | $ 838,384 |
| Panama | 34,641 | 1.00%
(pays quarterly)(1) | 1.80 | 6/20/29 | (1,332,295) | 1,319,866 | (12,429) |
| Total | $43,419 | | | | $(2,969,966) | $3,795,921 | $825,955 |
| Credit Default Swaps - Buy Protection (Centrally Cleared) | |
| Reference Entity | Notional
Amount
(000's omitted) | Contract
Annual
Fixed Rate** | Termination
Date | Value | Unamortized
Upfront
Receipts
(Payments) | Unrealized
Appreciation
(Depreciation) |
| Austria | | $12,213 | 1.00%
(pays quarterly)(1) | 6/20/29 | $ (482,617) | $ 471,932 | $ (10,685) |
| Finland | | 18,801 | 0.25%
(pays quarterly)(1) | 6/20/29 | (40,134) | 21,696 | (18,438) |
| France | | 60,573 | 0.25%
(pays quarterly)(1) | 6/20/29 | (25,057) | (13,962) | (39,019) |
48
See Notes to Consolidated Financial Statements.
Global Macro Absolute Return Advantage Portfolio
April 30, 2024
Consolidated Portfolio of Investments (Unaudited) — continued
| Credit Default Swaps - Buy Protection (Centrally Cleared) (continued) | |
| Reference Entity | Notional
Amount
(000's omitted) | Contract
Annual
Fixed Rate** | Termination
Date | Value | Unamortized
Upfront
Receipts
(Payments) | Unrealized
Appreciation
(Depreciation) |
| Germany | | $ 85,444 | 0.25%
(pays quarterly)(1) | 6/20/29 | $ (606,880) | $ 495,110 | $ (111,770) |
| Hungary | | 13,438 | 1.00%
(pays quarterly)(1) | 6/20/29 | 138,725 | (238,916) | (100,191) |
| Malaysia | | 383,450 | 1.00%
(pays quarterly)(1) | 6/20/29 | (9,588,682) | 10,044,203 | 455,521 |
| Markit CDX Emerging Markets Index (CDX.EM.31.V3) | | 860 | 1.00%
(pays quarterly)(1) | 6/20/24 | (1,946) | (3,614) | (5,560) |
| Markit CDX Emerging Markets Index (CDX.EM.IG.41.V1) | | 357,000 | 1.00%
(pays quarterly)(1) | 6/20/29 | (4,326,748) | 4,966,775 | 640,027 |
| Philippines | | 147,000 | 1.00%
(pays quarterly)(1) | 6/20/29 | (2,351,211) | 2,145,308 | (205,903) |
| Poland | | 61,949 | 1.00%
(pays quarterly)(1) | 6/20/29 | (831,782) | 771,505 | (60,277) |
| Qatar | | 20,242 | 1.00%
(pays quarterly)(1) | 6/20/29 | (541,062) | 558,360 | 17,298 |
| Romania | | 13,120 | 1.00%
(pays quarterly)(1) | 6/20/29 | 290,363 | (364,568) | (74,205) |
| Saudi Arabia | | 132,151 | 1.00%
(pays quarterly)(1) | 6/20/29 | (2,906,353) | 2,819,873 | (86,480) |
| South Africa | | 579,860 | 1.00%
(pays quarterly)(1) | 6/20/29 | 34,324,659 | (38,880,819) | (4,556,160) |
| South Africa | | 9,464 | 1.00%
(pays quarterly)(1) | 6/20/31 | 1,041,791 | (1,030,040) | 11,751 |
| Sweden | | 41,185 | 0.25%
(pays quarterly)(1) | 6/20/29 | (224,856) | 181,142 | (43,714) |
| Turkey | | 137,050 | 1.00%
(pays quarterly)(1) | 6/20/29 | 11,111,835 | (12,853,376) | (1,741,541) |
| United Kingdom | | 59,267 | 1.00%
(pays quarterly)(1) | 6/20/29 | (2,050,263) | 1,894,891 | (155,372) |
| Total | | | | | $22,929,782 | $ (29,014,500) | $ (6,084,718) |
| Credit Default Swaps - Sell Protection (OTC) |
| Reference Entity | Counterparty | Notional
Amount*
(000's omitted) | Contract Annual
Fixed Rate** | Current
Market
Annual
Fixed Rate*** | Termination
Date | Value | Unamortized
Upfront
Receipts
(Payments) | Unrealized
Appreciation
(Depreciation) |
| Benin | Barclays Bank PLC | $ 1,100 | 1.00%
(pays quarterly)(1) | 2.40% | 6/20/27 | $ (42,160) | $ 95,250 | $ 53,090 |
| Benin | Barclays Bank PLC | 1,100 | 1.00%
(pays quarterly)(1) | 2.40 | 6/20/27 | (42,160) | 93,135 | 50,975 |
| Indonesia | Barclays Bank PLC | 45,000 | 1.00%
(pays quarterly)(1) | 0.76 | 6/20/29 | 538,443 | (464,393) | 74,050 |
| Indonesia | BNP Paribas | 22,000 | 1.00%
(pays quarterly)(1) | 0.76 | 6/20/29 | 263,524 | (234,656) | 28,868 |
| Indonesia | Deutsche Bank AG | 23,000 | 1.00%
(pays quarterly)(1) | 0.76 | 6/20/29 | 275,502 | (226,559) | 48,943 |
49
See Notes to Consolidated Financial Statements.
Global Macro Absolute Return Advantage Portfolio
April 30, 2024
Consolidated Portfolio of Investments (Unaudited) — continued
| Credit Default Swaps - Sell Protection (OTC) (continued) |
| Reference Entity | Counterparty | Notional
Amount*
(000's omitted) | Contract Annual
Fixed Rate** | Current
Market
Annual
Fixed Rate*** | Termination
Date | Value | Unamortized
Upfront
Receipts
(Payments) | Unrealized
Appreciation
(Depreciation) |
| Indonesia | Goldman Sachs International | $ 19,000 | 1.00%
(pays quarterly)(1) | 0.76% | 6/20/29 | $ 227,589 | $ (187,157) | $ 40,432 |
| Indonesia | JPMorgan Chase Bank, N.A. | 18,000 | 1.00%
(pays quarterly)(1) | 0.76 | 6/20/29 | 180,224 | (181,374) | (1,150) |
| Ivory Coast | Barclays Bank PLC | 18,000 | 1.00%
(pays quarterly)(1) | 1.86 | 6/20/25 | (150,386) | 305,765 | 155,379 |
| Ivory Coast | Barclays Bank PLC | 6,486 | 1.00%
(pays quarterly)(1) | 3.03 | 6/20/27 | (358,971) | 527,747 | 168,776 |
| Ivory Coast | Deutsche Bank AG | 15,100 | 1.00%
(pays quarterly)(1) | 2.99 | 6/20/27 | (819,336) | 1,230,627 | 411,291 |
| Ivory Coast | Deutsche Bank AG | 16,821 | 1.00%
(pays quarterly)(1) | 2.99 | 6/20/27 | (912,721) | 1,369,260 | 456,539 |
| Panama | Bank of America, N.A. | 3,560 | 1.00%
(pays quarterly)(1) | 1.80 | 6/20/29 | (122,077) | 133,858 | 11,781 |
| Panama | Bank of America, N.A. | 3,660 | 1.00%
(pays quarterly)(1) | 1.80 | 6/20/29 | (125,506) | 116,021 | (9,485) |
| Panama | Barclays Bank PLC | 6,927 | 1.00%
(pays quarterly)(1) | 1.80 | 6/20/29 | (237,536) | 230,585 | (6,951) |
| Panama | Citibank, N.A. | 4,175 | 1.00%
(pays quarterly)(1) | 1.80 | 6/20/29 | (143,166) | 164,466 | 21,300 |
| Panama | Deutsche Bank AG | 4,345 | 1.00%
(pays quarterly)(1) | 1.80 | 6/20/29 | (148,996) | 148,857 | (139) |
| Panama | Deutsche Bank AG | 4,350 | 1.00%
(pays quarterly)(1) | 1.80 | 6/20/29 | (149,168) | 138,117 | (11,051) |
| Panama | Goldman Sachs International | 24,350 | 1.00%
(pays quarterly)(1) | 1.80 | 6/20/29 | (834,995) | 772,007 | (62,988) |
| Panama | JPMorgan Chase Bank, N.A. | 5,083 | 1.00%
(pays quarterly)(1) | 1.80 | 6/20/29 | (174,303) | 191,577 | 17,274 |
| Petroleos Mexicanos | Bank of America, N.A. | 63,175 | 1.00%
(pays quarterly)(1) | 1.89 | 3/20/25 | (412,116) | 932,646 | 520,530 |
| Petroleos Mexicanos | Barclays Bank PLC | 25,790 | 1.00%
(pays quarterly)(1) | 1.37 | 6/20/24 | 16,478 | 27,863 | 44,341 |
| Vietnam | Bank of America, N.A. | 5,000 | 1.00%
(pays quarterly)(1) | 1.18 | 6/20/29 | (34,494) | 41,987 | 7,493 |
| Vietnam | BNP Paribas | 7,000 | 1.00%
(pays quarterly)(1) | 1.18 | 6/20/29 | (48,292) | 64,983 | 16,691 |
| Vietnam | Goldman Sachs International | 19,880 | 1.00%
(pays quarterly)(1) | 0.49 | 6/20/24 | 37,405 | (8,133) | 29,272 |
| Vietnam | Goldman Sachs International | 9,500 | 1.00%
(pays quarterly)(1) | 1.18 | 6/20/29 | (65,593) | 84,168 | 18,575 |
| Vietnam | Goldman Sachs International | 7,500 | 1.00%
(pays quarterly)(1) | 1.30 | 6/20/29 | (75,755) | 66,337 | (9,418) |
| Total | | $379,902 | | | | $ (3,358,566) | $5,432,984 | $2,074,418 |
50
See Notes to Consolidated Financial Statements.
Global Macro Absolute Return Advantage Portfolio
April 30, 2024
Consolidated Portfolio of Investments (Unaudited) — continued
| Credit Default Swaps - Buy Protection (OTC) |
| Reference Entity | Counterparty | Notional
Amount
(000's omitted) | Contract
Annual
Fixed Rate** | Termination
Date | Value | Unamortized
Upfront
Receipts
(Payments) | Unrealized
Appreciation
(Depreciation) |
| Czech Republic | JPMorgan Chase Bank, N.A. | $19,840 | 1.00%
(pays quarterly)(1) | 6/20/29 | $ (642,021) | $ 650,030 | $ 8,009 |
| Dubai | Barclays Bank PLC | 6,348 | 1.00%
(pays quarterly)(1) | 12/20/24 | (38,732) | (13,460) | (52,192) |
| Dubai | Barclays Bank PLC | 9,572 | 1.00%
(pays quarterly)(1) | 12/20/24 | (58,403) | (20,314) | (78,717) |
| Saudi Arabia | Barclays Bank PLC | 25,486 | 1.00%
(pays quarterly)(1) | 6/20/31 | (547,311) | (335,105) | (882,416) |
| Saudi Arabia | Goldman Sachs International | 57,200 | 1.00%
(pays quarterly)(1) | 6/20/34 | (856,217) | 731,013 | (125,204) |
| Total | | | | | $(2,142,684) | $1,012,164 | $ (1,130,520) |
| * | If the Portfolio is the seller of credit protection, the notional amount is the maximum potential amount of future payments the Portfolio could be required to make if a credit event, as defined in the credit default swap agreement, were to occur. At April 30, 2024, such maximum potential amount for all open credit default swaps in which the Portfolio is the seller was $423,321,000. |
| ** | The contract annual fixed rate represents the fixed rate of interest received by the Portfolio (as a seller of protection) or paid by the Portfolio (as a buyer of protection) on the notional amount of the credit default swap contract. |
| *** | Current market annual fixed rates, utilized in determining the net unrealized appreciation or depreciation as of period end, serve as an indicator of the market’s perception of the current status of the payment/performance risk associated with the credit derivative. The current market annual fixed rate of a particular reference entity reflects the cost, as quoted by the pricing vendor, of selling protection against default of that entity as of period end and may include upfront payments required to be made to enter into the agreement. The higher the fixed rate, the greater the market perceived risk of a credit event involving the reference entity. A rate identified as “Defaulted” indicates a credit event has occurred for the reference entity. |
| (1) | Upfront payment is exchanged with the counterparty as a result of the standardized trading coupon. |
| Total Return Swaps (OTC) |
| Counterparty | Notional Amount
(000's omitted) | Portfolio Receives | Portfolio Pays | Termination
Date | Value/Unrealized
Appreciation
(Depreciation) |
| BNP Paribas | USD | 217,500 | Excess Return on Bloomberg Commodity 3 Month Forward Index (pays upon termination) | Excess Return on Bloomberg Commodity Index + 0.12% (pays upon termination) | 8/26/24 | $ 182,340 |
| Citibank, N.A. | USD | 32,381 | 5.35% on PEN 119,519,558 (pays upon termination) | SOFR + 1.10% on Notional Amount (pays upon termination) | 6/15/24 | (2,125,591) |
| Citibank, N.A. | USD | 54,140 | 5.94% on PEN 199,830,221 (pays upon termination) | SOFR + 1.10% on Notional Amount (pays upon termination) | 6/15/24 | (2,206,517) |
| Citibank, N.A. | USD | 82,400 | Excess Return on Bloomberg Commodity 3 Month Forward Index (pays upon termination) | Excess Return on Bloomberg Commodity Index + 0.12% (pays upon termination) | 6/18/24 | 341,065 |
| Citibank, N.A. | USD | 61,519 | Excess Return on EGP 3,545,975,000 Treasury Bill, 0.00%, 12/17/24 at 0.82 (pays upon termination) | SOFR + 0.70% on Notional Amount (pays upon termination) | 12/17/24 | 744,396 |
| Citibank, N.A. | KRW | 59,500 | Positive Return on KOSPI 200 Index Futures 6/2024 (pays upon termination) | Negative Return on KOSPI 200 Index Futures 6/2024 (pays upon termination) | 6/13/24 | 289,764 |
51
See Notes to Consolidated Financial Statements.
Global Macro Absolute Return Advantage Portfolio
April 30, 2024
Consolidated Portfolio of Investments (Unaudited) — continued
| Total Return Swaps (OTC) (continued) |
| Counterparty | Notional Amount
(000's omitted) | Portfolio Receives | Portfolio Pays | Termination
Date | Value/Unrealized
Appreciation
(Depreciation) |
| Goldman Sachs International | USD | 53,984 | 5.94% on PEN 198,770,371 (pays upon termination) | SOFR + 1.10% on Notional Amount (pays upon termination) | 6/6/24 | $ (2,387,015) |
| | | | | | | $(5,161,558) |
| Cross-Currency Swaps (OTC) | | |
| Counterparty | Portfolio Receives | Portfolio Pays | Termination
Date | Value/Unrealized
Appreciation
(Depreciation) |
| Barclays Bank PLC | 1-day Indice Camara Promedio Rate on CLP 7,890,662,080 (pays semi-annually)* | 1.41% on CLP equivalent of
CLF 224,000 (pays semi-annually)* | 1/13/33 | $ 331,396 |
| Goldman Sachs International | 1-day Indice Camara Promedio Rate on CLP 2,698,942,950 (pays semi-annually)* | 2.10% on CLP equivalent of CLF 85,000 (pays semi-annually)* | 4/8/32 | (420,038) |
| Goldman Sachs International | 1-day Indice Camara Promedio Rate on CLP 8,224,633,060 (pays semi-annually)* | 2.25% on CLP equivalent of
CLF 259,000 (pays semi-annually)* | 4/11/32 | (1,392,664) |
| Goldman Sachs International | 1-day Indice Camara Promedio Rate on CLP 1,531,614,475 (pays semi-annually)* | 1.85% on CLP equivalent of CLF 47,900 (pays semi-annually)* | 4/20/32 | (193,596) |
| Goldman Sachs International | 1-day Indice Camara Promedio Rate on CLP 6,500,579,580 (pays semi-annually)* | 2.34% on CLP equivalent of
CLF 178,000 (pays semi-annually)* | 11/21/33 | 62,083 |
| | | | | $(1,612,819) |
| * | At the termination date, the Portfolio will either pay or receive the USD equivalent of the difference between the initial CLP notional amount and the CLP equivalent of the CLF notional amount on such date. |
| Abbreviations: |
| BUBOR | – Budapest Interbank Offered Rate |
| CPI-U (NSA) | – Consumer Price Index All Urban Non-Seasonally Adjusted |
| EURIBOR | – Euro Interbank Offered Rate |
| FBIL | – Financial Benchmarks India Ltd. |
| GDP | – Gross Domestic Product |
| HICP | – Harmonised Indices of Consumer Prices |
| KLIBOR | – Kuala Lumpur Interbank Offered Rate |
| |
| MIBOR | – Mumbai Interbank Offered Rate |
| OTC | – Over-the-counter |
| PIK | – Payment In Kind |
| PRIBOR | – Prague Interbank Offered Rate |
| SOFR | – Secured Overnight Financing Rate |
| TAIBOR | – Taipei Interbank Offered Rate |
| Currency Abbreviations: |
| ALL | – Albanian Lek |
| AMD | – Armenian Dram |
| AUD | – Australian Dollar |
| BHD | – Bahraini Dinar |
| BRL | – Brazilian Real |
| CAD | – Canadian Dollar |
| |
| CLF | – Chilean Unidad de Fomento |
| CLP | – Chilean Peso |
| CNH | – Yuan Renminbi Offshore |
| CNY | – Yuan Renminbi |
| COP | – Colombian Peso |
| CZK | – Czech Koruna |
52
See Notes to Consolidated Financial Statements.
Global Macro Absolute Return Advantage Portfolio
April 30, 2024
Consolidated Portfolio of Investments (Unaudited) — continued
| |
| DOP | – Dominican Peso |
| EGP | – Egyptian Pound |
| EUR | – Euro |
| GBP | – British Pound Sterling |
| HKD | – Hong Kong Dollar |
| HUF | – Hungarian Forint |
| IDR | – Indonesian Rupiah |
| ILS | – Israeli Shekel |
| INR | – Indian Rupee |
| ISK | – Icelandic Krona |
| JPY | – Japanese Yen |
| KES | – Kenyan Shilling |
| KRW | – South Korean Won |
| KZT | – Kazakhstani Tenge |
| MXN | – Mexican Peso |
| MYR | – Malaysian Ringgit |
| NGN | – Nigerian Naira |
| NZD | – New Zealand Dollar |
| |
| OMR | – Omani Rial |
| PEN | – Peruvian Sol |
| PHP | – Philippine Peso |
| PLN | – Polish Zloty |
| PYG | – Paraguayan Guarani |
| RSD | – Serbian Dinar |
| SAR | – Saudi Riyal |
| SEK | – Swedish Krona |
| SGD | – Singapore Dollar |
| THB | – Thai Baht |
| TRY | – Turkish Lira |
| TWD | – New Taiwan Dollar |
| UAH | – Ukrainian Hryvnia |
| USD | – United States Dollar |
| UYU | – Uruguayan Peso |
| UZS | – Uzbekistani Som |
| ZAR | – South African Rand |
| ZMW | – Zambian Kwacha |
53
See Notes to Consolidated Financial Statements.
Global Macro Absolute Return Advantage Portfolio
April 30, 2024
Consolidated Statement of Assets and Liabilities (Unaudited)
| | April 30, 2024 |
| Assets | |
| Unaffiliated investments, at value (identified cost $2,639,356,892) | $ 2,658,645,978 |
| Affiliated investments, at value (identified cost $36,275,308) | 36,275,308 |
| Cash | 6,407,274 |
| Deposits for derivatives collateral: | |
| Centrally cleared derivatives | 175,526,488 |
| OTC derivatives | 21,884,300 |
| Cash collateral for securities sold short | 137,350,920 |
| Foreign currency, at value (identified cost $37,541,874) | 37,610,169 |
| Interest and dividends receivable | 51,060,240 |
| Dividends receivable from affiliated investments | 845,518 |
| Receivable for investments sold | 47,770,470 |
| Receivable for variation margin on open futures contracts | 3,508,644 |
| Receivable for open forward foreign currency exchange contracts | 45,227,924 |
| Receivable for open swap contracts | 4,767,439 |
| Upfront payments on open non-centrally cleared swap contracts | 1,671,151 |
| Receivable for closed swap contracts | 4,678,577 |
| Tax reclaims receivable | 359,595 |
| Receivable from affiliates | 80,694 |
| Trustees' deferred compensation plan | 158,640 |
| Total assets | $3,233,829,329 |
| Liabilities | |
| Cash collateral due to brokers | $ 4,279,000 |
| Payable for reverse repurchase agreements, including accrued interest of $420,386 | 88,246,507 |
| Written options outstanding, at value (premiums received $1,081,464) | 213,958 |
| Payable for investments purchased | 94,675,391 |
| Payable for securities sold short, at value (proceeds $175,202,063) | 169,928,740 |
| Payable for variation margin on open centrally cleared derivatives | 3,227,627 |
| Payable for open forward foreign currency exchange contracts | 33,437,732 |
| Payable for open swap contracts | 9,965,132 |
| Payable for closed swap contracts | 95,518 |
| Upfront receipts on open non-centrally cleared swap contracts | 8,116,299 |
| Payable to affiliates: | |
| Investment adviser fee | 2,144,988 |
| Trustees' fees | 9,222 |
| Trustees' deferred compensation plan | 158,640 |
| Interest and dividends payable on securities sold short | 5,107,899 |
| Accrued foreign capital gains taxes | 19,468 |
| Accrued expenses | 1,225,433 |
| Total liabilities | $ 420,851,554 |
| Net Assets applicable to investors' interest in Portfolio | $2,812,977,775 |
54
See Notes to Consolidated Financial Statements.
Global Macro Absolute Return Advantage Portfolio
April 30, 2024
Consolidated Statement of Operations (Unaudited)
| | Six Months Ended |
| | April 30, 2024 |
| Investment Income | |
| Dividend income (net of foreign taxes withheld of $299,619) | $ 3,430,202 |
| Dividend income from affiliated investments | 4,491,840 |
| Interest income (net of foreign taxes withheld of $973,836) | 101,172,135 |
| Other income | 260,699 |
| Total investment income | $109,354,876 |
| Expenses | |
| Investment adviser fee | $ 12,420,775 |
| Trustees’ fees and expenses | 54,250 |
| Custodian fee | 866,985 |
| Legal and accounting services | 97,659 |
| Interest expense and fees | 2,991,247 |
| Interest and dividend expense on securities sold short | 9,429,403 |
| Miscellaneous | 51,334 |
| Total expenses | $ 25,911,653 |
| Deduct: | |
| Waiver and/or reimbursement of expenses by affiliates | $ 214,149 |
| Total expense reductions | $ 214,149 |
| Net expenses | $ 25,697,504 |
| Net investment income | $ 83,657,372 |
| Realized and Unrealized Gain (Loss) | |
| Net realized gain (loss): | |
| Investment transactions | $ 2,081,074 |
| Written options | 626,309 |
| Securities sold short | (11,823,142) |
| Futures contracts | (14,285,981) |
| Swap contracts | (36,718,203) |
| Foreign currency transactions | 9,580,955 |
| Forward foreign currency exchange contracts | (12,528,324) |
| Non-deliverable bond forward contracts | 3,158,005 |
| Net realized loss | $ (59,909,307) |
| Change in unrealized appreciation (depreciation): | |
| Investments (including net decrease in accrued foreign capital gains taxes of $862) | $ 168,179,744 |
| Written options | 731,804 |
| Securities sold short | (7,997,827) |
| Futures contracts | 5,569,661 |
| Swap contracts | (20,226,243) |
| Foreign currency | 1,245,070 |
| Forward foreign currency exchange contracts | 16,404,097 |
| Net change in unrealized appreciation (depreciation) | $163,906,306 |
| Net realized and unrealized gain | $103,996,999 |
| Net increase in net assets from operations | $187,654,371 |
55
See Notes to Consolidated Financial Statements.
Global Macro Absolute Return Advantage Portfolio
April 30, 2024
Consolidated Statements of Changes in Net Assets
| | Six Months Ended
April 30, 2024
(Unaudited) | Year Ended
October 31, 2023 |
| Increase (Decrease) in Net Assets | | |
| From operations: | | |
| Net investment income | $ 83,657,372 | $ 135,016,357 |
| Net realized loss | (59,909,307) | (197,706,941) |
| Net change in unrealized appreciation (depreciation) | 163,906,306 | 252,495,787 |
| Net increase in net assets from operations | $ 187,654,371 | $ 189,805,203 |
| Capital transactions: | | |
| Contributions | $ 287,809,575 | $ 548,261,795 |
| Withdrawals | (135,503,954) | (209,820,317) |
| Net increase in net assets from capital transactions | $ 152,305,621 | $ 338,441,478 |
| Net increase in net assets | $ 339,959,992 | $ 528,246,681 |
| Net Assets | | |
| At beginning of period | $ 2,473,017,783 | $ 1,944,771,102 |
| At end of period | $2,812,977,775 | $2,473,017,783 |
56
See Notes to Consolidated Financial Statements.
Global Macro Absolute Return Advantage Portfolio
April 30, 2024
Consolidated Financial Highlights
| | Six Months Ended
April 30, 2024
(Unaudited) | Year Ended October 31, |
| Ratios/Supplemental Data | 2023 | 2022 | 2021 | 2020 | 2019 |
| Ratios (as a percentage of average daily net assets): | | | | | | |
| Expenses (1) | 1.95% (2)(3)(4) | 1.68% (3)(4) | 1.17% (3)(4) | 1.12% | 1.11% (3) | 1.26% (3) |
| Net investment income | 6.34% (2) | 5.97% | 6.13% | 5.37% | 5.69% | 5.86% |
| Portfolio Turnover | 100% (5) | 56% | 94% | 82% | 80% | 71% |
| Total Return | 7.40% (5) | 9.60% | (4.83)% (3) | 5.94% | 6.57% (3) | 8.22% (3) |
| Net assets, end of period (000’s omitted) | $2,812,978 | $2,473,018 | $1,944,771 | $2,632,155 | $3,045,720 | $3,331,278 |
| (1) | Includes interest and/or dividend expense, including on securities sold short and/or reverse repurchase agreements if applicable, of 0.94%, 0.68%, 0.16%, 0.11%, 0.09% and 0.24% of average daily net assets for the six months ended April 30, 2024 and the years ended October 31, 2023, 2022, 2021, 2020 and 2019, respectively. |
| (2) | Annualized. |
| (3) | The investment adviser reimbursed certain operating expenses (equal to 0.02%, 0.01%, 0.01%, 0.04% and 0.05% of average daily net assets for six months ended April 30, 2024 and the years ended October 31, 2023, 2022, 2020 and 2019, respectively). Absent this reimbursement, total return would be lower. |
| (4) | Includes a reduction by the investment adviser of a portion of its adviser fee due to the Portfolio’s investment in the Liquidity Fund (equal to 0.01%, 0.01% and less than 0.005% of average daily net assets for the six months ended April 30, 2024 and the years ended October 31, 2023 and 2022, respectively). |
| (5) | Not annualized. |
57
See Notes to Consolidated Financial Statements.
Global Macro Absolute Return Advantage Portfolio
April 30, 2024
Notes to Consolidated Financial Statements (Unaudited)
1 Significant Accounting Policies
Global Macro Absolute Return Advantage Portfolio (the Portfolio) is a Massachusetts business trust registered under the Investment Company Act of 1940, as amended (the 1940 Act), as a non-diversified, open-end management investment company. The Portfolio’s investment objective is total return. The Declaration of Trust permits the Trustees to issue interests in the Portfolio. At April 30, 2024, Eaton Vance Global Macro Absolute Return Advantage Fund, Eaton Vance Strategic Income Fund and Eaton Vance International (Cayman Islands) Short Duration Strategic Income Fund held an interest of 68.0%, 31.5% and 0.5%, respectively, in the Portfolio.
The Portfolio seeks to gain exposure to the commodity markets, in whole or in part, through investments in Eaton Vance GMAP Commodity Subsidiary, Ltd. (the Subsidiary), a wholly-owned subsidiary of the Portfolio organized under the laws of the Cayman Islands with the same objective and investment policies and restrictions as the Portfolio. The Portfolio may invest up to 25% of its total assets in the Subsidiary. The net assets of the Subsidiary at April 30, 2024 were $21,995,724 or 0.8% of the Portfolio’s consolidated net assets. The accompanying consolidated financial statements include the accounts of the Subsidiary. Intercompany balances and transactions have been eliminated in consolidation.
The following is a summary of significant accounting policies of the Portfolio. The policies are in conformity with accounting principles generally accepted in the United States of America (U.S. GAAP). The Portfolio is an investment company and follows accounting and reporting guidance in the Financial Accounting Standards Board (FASB) Accounting Standards Codification Topic 946.
A Investment Valuation—The following methodologies are used to determine the market value or fair value of investments.
Debt Obligations. Debt obligations are generally valued on the basis of valuations provided by third party pricing services, as derived from such services’ pricing models. Inputs to the models may include, but are not limited to, reported trades, executable bid and ask prices, broker/dealer quotations, prices or yields of securities with similar characteristics, interest rates, anticipated prepayments, benchmark curves or information pertaining to the issuer, as well as industry and economic events. The pricing services may use a matrix approach, which considers information regarding securities with similar characteristics to determine the valuation for a security. Short-term debt obligations purchased with a remaining maturity of sixty days or less for which a valuation from a third party pricing service is not readily available may be valued at amortized cost, which approximates fair value.
Senior Floating-Rate Loans. Interests in senior floating-rate loans (Senior Loans) are valued generally at the average mean of bid and ask quotations obtained from a third party pricing service.
Equity Securities. Equity securities listed on a U.S. securities exchange generally are valued at the last sale or closing price on the day of valuation or, if no sales took place on such date, at the mean between the closing bid and ask prices on the exchange where such securities are principally traded. Equity securities listed on the NASDAQ National Market System are valued at the NASDAQ official closing price. Unlisted or listed securities for which closing sales prices or closing quotations are not available are valued at the mean between the latest available bid and ask prices.
Derivatives. U.S. exchange-traded options are valued at the mean between the bid and ask prices at valuation time as reported by the Options Price Reporting Authority. Non-U.S. exchange-traded options and over-the-counter options (including options on securities, indices and foreign currencies) are valued by a third party pricing service using techniques that consider factors including the value of the underlying instrument, the volatility of the underlying instrument and the period of time until option expiration. Futures contracts are valued at the closing settlement price established by the board of trade or exchange on which they are traded, with adjustments for fair valuation for certain foreign futures contracts as described below. Forward foreign currency exchange contracts are generally valued at the mean of the average bid and average ask prices that are reported by currency dealers to a third party pricing service at the valuation time. Such third party pricing service valuations are supplied for specific settlement periods and the Portfolio’s forward foreign currency exchange contracts are valued at an interpolated rate between the closest preceding and subsequent settlement period reported by the third party pricing service. Swaps are normally valued using valuations provided by a third party pricing service. Such pricing service valuations are based on the present value of fixed and projected floating rate cash flows over the term of the swap contract, and in the case of credit default swaps, based on credit spread quotations obtained from broker/dealers and expected default recovery rates determined by the pricing service using proprietary models. In the case of total return swaps, pricing service valuations are based on the value of the underlying index or instrument and reference interest rate. Future cash flows on swaps are discounted to their present value using swap rates provided by electronic data services or by broker/dealers.
Foreign Securities, Futures Contracts and Currencies. Foreign securities, futures contracts and currencies are valued in U.S. dollars, based on foreign currency exchange rate quotations supplied by a third party pricing service. The pricing service uses a proprietary model to determine the exchange rate. Inputs to the model include reported trades and implied bid/ask spreads. The daily valuation of exchange-traded foreign securities and certain exchange-traded foreign futures contracts generally is determined as of the close of trading on the principal exchange on which such securities and contracts trade. Events occurring after the close of trading on foreign exchanges may result in adjustments to the valuation of foreign securities and certain foreign futures contracts to more accurately reflect their fair value as of the close of regular trading on the New York Stock Exchange. When valuing foreign equity securities and foreign futures contracts that meet certain criteria, the Portfolio’s Trustees have approved the use of a fair value service that values such securities and foreign futures contracts to reflect market trading that occurs after the close of the applicable foreign markets of comparable securities or other instruments that have a strong correlation to the fair-valued securities and foreign futures contracts.
Other. Investments in management investment companies (including money market funds) that do not trade on an exchange are valued at the net asset value as of the close of each business day.
Global Macro Absolute Return Advantage Portfolio
April 30, 2024
Notes to Consolidated Financial Statements (Unaudited) — continued
Fair Valuation. In connection with Rule 2a-5 of the 1940 Act, the Trustees have designated the Portfolio’s investment adviser as its valuation designee. Investments for which valuations or market quotations are not readily available or are deemed unreliable are valued by the investment adviser, as valuation designee, at fair value using methods that most fairly reflect the security’s “fair value”, which is the amount that the Portfolio might reasonably expect to receive for the security upon its current sale in the ordinary course. Each such determination is based on a consideration of relevant factors, which are likely to vary from one pricing context to another. These factors may include, but are not limited to, the type of security, the existence of any contractual restrictions on the security’s disposition, the price and extent of public trading in similar securities of the issuer or of comparable companies or entities, quotations or relevant information obtained from broker/dealers or other market participants, information obtained from the issuer, analysts, and/or the appropriate stock exchange (for exchange-traded securities), an analysis of the company’s or entity’s financial statements, and an evaluation of the forces that influence the issuer and the market(s) in which the security is purchased and sold.
B Investment Transactions—Investment transactions for financial statement purposes are accounted for on a trade date basis. Realized gains and losses on investments sold are determined on the basis of identified cost.
C Income—Interest income is recorded on the basis of interest accrued, adjusted for amortization of premium or accretion of discount. Inflation adjustments to the principal amount of inflation-adjusted bonds and notes are reflected as interest income. Deflation adjustments to the principal amount of an inflation-adjusted bond or note are reflected as reductions to interest income to the extent of interest income previously recorded on such bond or note. Dividend income is recorded on the ex-dividend date for dividends received in cash and/or securities. However, if the ex-dividend date has passed, certain dividends from foreign securities are recorded as the Portfolio is informed of the ex-dividend date. Withholding taxes on foreign dividends, interest and capital gains have been provided for in accordance with the Portfolio’s understanding of the applicable countries’ tax rules and rates.
D Federal and Other Taxes—The Portfolio has elected to be treated as a partnership for federal tax purposes. No provision is made by the Portfolio for federal or state taxes on any taxable income of the Portfolio because each investor in the Portfolio is ultimately responsible for the payment of any taxes on its share of taxable income. Since at least one of the Portfolio’s investors is a regulated investment company that invests all or substantially all of its assets in the Portfolio, the Portfolio normally must satisfy the applicable source of income and diversification requirements (under the Internal Revenue Code) in order for its investors to satisfy them. The Portfolio will allocate, at least annually among its investors, each investor’s distributive share of the Portfolio’s net investment income, net realized capital gains and losses and any other items of income, gain, loss, deduction or credit.
In addition to the requirements of the Internal Revenue Code, the Portfolio may also be subject to local taxes on the recognition of capital gains in certain countries. In determining the daily net asset value, the Portfolio estimates the accrual for such taxes, if any, based on the unrealized appreciation on certain portfolio securities and the related tax rates. Taxes attributable to unrealized appreciation are included in the change in unrealized appreciation (depreciation) on investments. Capital gains taxes on securities sold are included in net realized gain (loss) on investments.
The Subsidiary is treated as a controlled foreign corporation under the Internal Revenue Code and is not expected to be subject to U.S. federal income tax. The Portfolio is treated as a U.S. shareholder of the Subsidiary. As a result, the Portfolio is required to include in gross income for U.S. federal tax purposes all of the Subsidiary’s income, whether or not such income is distributed by the Subsidiary. If a net loss is realized by the Subsidiary, such loss is not generally available to offset the income earned by the Portfolio.
As of April 30, 2024, the Portfolio had no uncertain tax positions that would require financial statement recognition, de-recognition, or disclosure. The Portfolio files a U.S. federal income tax return annually after its fiscal year-end, which is subject to examination by the Internal Revenue Service for a period of three years from the date of filing.
E Foreign Currency Translation—Investment valuations, other assets, and liabilities initially expressed in foreign currencies are translated each business day into U.S. dollars based upon current exchange rates. Purchases and sales of foreign investment securities and income and expenses denominated in foreign currencies are translated into U.S. dollars based upon currency exchange rates in effect on the respective dates of such transactions. Recognized gains or losses on investment transactions attributable to changes in foreign currency exchange rates are recorded for financial statement purposes as net realized gains and losses on investments. That portion of unrealized gains and losses on investments that results from fluctuations in foreign currency exchange rates is not separately disclosed.
F Unfunded Loan Commitments—The Portfolio may enter into certain loan agreements all or a portion of which may be unfunded. The Portfolio is obligated to fund these commitments at the borrower's discretion. These commitments, if any, are disclosed in the accompanying Consolidated Portfolio of Investments.
G Use of Estimates—The preparation of the consolidated financial statements in conformity with U.S. GAAP requires management to make estimates and assumptions that affect the reported amounts of assets and liabilities at the date of the consolidated financial statements and the reported amounts of income and expense during the reporting period. Actual results could differ from those estimates.
H Indemnifications—Under the Portfolio’s organizational documents, its officers and Trustees may be indemnified against certain liabilities and expenses arising out of the performance of their duties to the Portfolio. Under Massachusetts law, if certain conditions prevail, interestholders in the Portfolio could be deemed to have personal liability for the obligations of the Portfolio. However, the Portfolio’s Declaration of Trust contains an express disclaimer of liability on the part of Portfolio interestholders. Additionally, in the normal course of business, the Portfolio enters into agreements with service providers
Global Macro Absolute Return Advantage Portfolio
April 30, 2024
Notes to Consolidated Financial Statements (Unaudited) — continued
that may contain indemnification clauses. The Portfolio’s maximum exposure under these arrangements is unknown as this would involve future claims that may be made against the Portfolio that have not yet occurred.
I Futures Contracts—Upon entering into a futures contract, the Portfolio is required to deposit with the broker, either in cash or securities, an amount equal to a certain percentage of the contract amount (initial margin). Subsequent payments, known as variation margin, are made or received by the Portfolio each business day, depending on the daily fluctuations in the value of the underlying security, index, or commodity, and are recorded as unrealized gains or losses by the Portfolio. Gains (losses) are realized upon the expiration or closing of the futures contracts. Should market conditions change unexpectedly, the Portfolio may not achieve the anticipated benefits of the futures contracts and may realize a loss. Futures contracts have minimal counterparty risk as they are exchange traded and the clearinghouse for the exchange is substituted as the counterparty, guaranteeing counterparty performance.
J Forward Foreign Currency Exchange and Non-Deliverable Bond Forward Contracts—The Portfolio may enter into forward foreign currency exchange contracts for the purchase or sale of a specific foreign currency at a fixed price on a future date. The forward foreign currency exchange contracts are adjusted by the daily exchange rate of the underlying currency and any gains or losses are recorded as unrealized until such time as the contracts have been closed. While forward foreign currency exchange contracts are privately negotiated agreements between the Portfolio and a counterparty, certain contracts may be “centrally cleared”, whereby all payments made or received by the Portfolio pursuant to the contract are with a central clearing party (CCP) rather than the original counterparty. The CCP guarantees the performance of the original parties to the contract. Upon entering into centrally cleared contracts, the Portfolio is required to deposit with the CCP, either in cash or securities, an amount of initial margin determined by the CCP, which is subject to adjustment. For centrally cleared contracts, the daily change in valuation is recorded as a receivable or payable for variation margin and settled in cash with the CCP daily. The Portfolio may also enter into non-deliverable bond forward contracts for the purchase or sale of a bond denominated in a non-deliverable foreign currency at a fixed price on a future date. For non-deliverable bond forward contracts, unrealized gains and losses, based on changes in the value of the contract, and realized gains and losses are accounted for as described above. Risks may arise upon entering these contracts from the potential inability of counterparties to meet the terms of their contracts and from movements in the value of a foreign currency relative to the U.S. dollar. In the case of centrally cleared contracts, counterparty risk is minimal due to protections provided by the CCP.
K Purchased Options—Upon the purchase of a call or put option, the premium paid by the Portfolio is included in the Consolidated Statement of Assets and Liabilities as an investment. The amount of the investment is subsequently marked-to-market to reflect the current market value of the option purchased, in accordance with the Portfolio’s policies on investment valuations discussed above. Premiums paid for purchasing options that expire are treated as realized losses. Premiums paid for purchasing options that are exercised or closed are added to the amounts paid or offset against the proceeds on the underlying investment transaction to determine the realized gain or loss. The risk associated with purchasing options is limited to the premium originally paid. Purchased options traded over-the-counter involve risk that the issuer or counterparty will fail to perform its contractual obligations.
L Written Options—Upon the writing of a call or a put option, the premium received by the Portfolio is included in the Consolidated Statement of Assets and Liabilities as a liability. The amount of the liability is subsequently marked-to-market to reflect the current market value of the option written, in accordance with the Portfolio’s policies on investment valuations discussed above. Premiums received from writing options that expire are treated as realized gains. Premiums received from writing options that are exercised or are closed are added to or offset against the proceeds or amount paid on the transaction to determine the realized gain or loss. The Portfolio, as a writer of an option, may have no control over whether the underlying instrument may be sold (call) or purchased (put) and, as a result, bears the market risk of an unfavorable change in the price of the instrument underlying the written option. The Portfolio may also bear the risk of not being able to enter into a closing transaction if a liquid secondary market does not exist.
M Interest Rate Swaps—Swap contracts are privately negotiated agreements between the Portfolio and a counterparty. Certain swap contracts may be centrally cleared. Pursuant to interest rate swap agreements, the Portfolio either makes floating-rate payments to the counterparty (or CCP in the case of centrally cleared swaps) based on a benchmark interest rate in exchange for fixed-rate payments or the Portfolio makes fixed-rate payments to the counterparty (or CCP in the case of a centrally cleared swap) in exchange for payments on a floating benchmark interest rate. Payments received or made, including amortization of upfront payments/receipts, if any (which are amortized over the life of the swap contract), are recorded as realized gains or losses. During the term of the outstanding swap agreement, changes in the underlying value of the swap are recorded as unrealized gains or losses. For centrally cleared swaps, the daily change in valuation is recorded as a receivable or payable for variation margin and settled in cash with the CCP daily. The value of the swap is determined by changes in the relationship between two rates of interest. The Portfolio is exposed to credit loss in the event of non-performance by the swap counterparty. In the case of centrally cleared swaps, counterparty risk is minimal due to protections provided by the CCP. Risk may also arise from movements in interest rates.
N Inflation Swaps—Pursuant to inflation swap agreements, the Portfolio either makes floating-rate payments to the counterparty (or CCP in the case of centrally cleared swaps) based on a benchmark index in exchange for fixed-rate payments or the Portfolio makes fixed-rate payments to the counterparty (or CCP in the case of centrally cleared swaps) in exchange for floating-rate payments based on the return of a benchmark index. By design, the benchmark index is an inflation index, such as the Consumer Price Index. The accounting policy for payments received or made and changes in the underlying value of the inflation swap are the same as for interest rate swaps as described above. The value of the swap is determined by changes in the relationship between the rate of interest and the benchmark index. The Portfolio is exposed to credit loss in the event of nonperformance by the swap counterparty. In the case of centrally cleared swaps, counterparty risk is minimal due to protections provided by the CCP. Risk may also arise from the unanticipated movements in value of interest rates or the index.
Global Macro Absolute Return Advantage Portfolio
April 30, 2024
Notes to Consolidated Financial Statements (Unaudited) — continued
O Cross-Currency Swaps—Cross-currency swaps are interest rate swaps in which interest cash flows are exchanged between two parties based on the notional amounts of two different currencies. The notional amounts are typically determined based on the spot exchange rates at the inception of the trade. Cross-currency swaps also involve the exchange of the notional amounts at the start of the contract at the current spot rate with an agreement to re-exchange such amounts at a later date at either the same exchange rate, a specified rate or the then current spot rate. The entire principal value of a cross-currency swap is subject to the risk that the counterparty to the swap will default on its contractual delivery obligations.
P Credit Default Swaps—When the Portfolio is the buyer of a credit default swap contract, the Portfolio is entitled to receive the par (or other agreed-upon) value of a referenced debt obligation (or basket of debt obligations) from the counterparty (or CCP in the case of a centrally cleared swap) to the contract if a credit event by a third party, such as a U.S. or foreign corporate issuer or sovereign issuer, on the debt obligation occurs. In return, the Portfolio pays the counterparty a periodic stream of payments over the term of the contract provided that no credit event has occurred. If no credit event occurs, the Portfolio would have spent the stream of payments and received no proceeds from the contract. When the Portfolio is the seller of a credit default swap contract, it receives the stream of payments, but is obligated to pay to the buyer of the protection an amount up to the notional amount of the swap and in certain instances take delivery of securities of the reference entity upon the occurrence of a credit event, as defined under the terms of that particular swap agreement. Credit events are contract specific but may include bankruptcy, failure to pay, restructuring, obligation acceleration and repudiation/moratorium. If the Portfolio is a seller of protection and a credit event occurs, the maximum potential amount of future payments that the Portfolio could be required to make would be an amount equal to the notional amount of the agreement. This potential amount would be partially offset by any recovery value of the respective referenced obligation, or net amount received from the settlement of a buy protection credit default swap agreement entered into by the Portfolio for the same referenced obligation. As the seller, the Portfolio may create economic leverage to its portfolio because, in addition to its total net assets, the Portfolio is subject to investment exposure on the notional amount of the swap. The interest fee paid or received on the swap contract, which is based on a specified interest rate on a fixed notional amount, is accrued daily as a component of unrealized appreciation (depreciation) and is recorded as realized gain upon receipt or realized loss upon payment. The Portfolio also records an increase or decrease to unrealized appreciation (depreciation) in an amount equal to the daily valuation. For centrally cleared swaps, the daily change in valuation is recorded as a receivable or payable for variation margin and settled in cash with the CCP daily. All upfront payments and receipts, if any, are amortized over the life of the swap contract as realized gains or losses. Those upfront payments or receipts for non-centrally cleared swaps are recorded as other assets or other liabilities, respectively, net of amortization. For financial reporting purposes, unamortized upfront payments or receipts, if any, are netted with unrealized appreciation or depreciation on swap contracts to determine the market value of swaps as presented in Notes 6 and 10. These transactions involve certain risks, including the risk that the seller may be unable to fulfill the transaction. In the case of centrally cleared swaps, counterparty risk is minimal due to protections provided by the CCP.
Q Total Return Swaps—In a total return swap, the buyer receives a periodic return equal to the total return of a specified security, securities or index for a specified period of time. In return, the buyer pays the counterparty a fixed or variable stream of payments, typically based upon short-term interest rates, possibly plus or minus an agreed upon spread. During the term of the outstanding swap agreement, changes in the underlying value of the swap are recorded as unrealized gains and losses. Periodic payments received or made are recorded as realized gains or losses. The Portfolio is exposed to credit loss in the event of nonperformance by the swap counterparty. Risk may also arise from the unanticipated movements in value of exchange rates, interest rates, securities, or the index.
R Repurchase Agreements—A repurchase agreement is the purchase by the Portfolio of securities from a counterparty in exchange for cash that is coupled with an agreement to resell those securities to the counterparty at a specified date and price. When a repurchase agreement is entered, the Portfolio typically receives securities with a value that equals or exceeds the repurchase price, including any accrued interest earned on the agreement. The value of such securities will be marked-to-market daily, and cash or additional securities will be exchanged between the parties as needed. Except in the case of a repurchase agreement entered to settle a short sale, the value of the securities delivered to the Portfolio will be at least equal to 90% of the repurchase price during the term of the repurchase agreement. The terms of a repurchase agreement entered to settle a short sale may provide that the cash purchase price paid by the Portfolio is more than the value of purchased securities that effectively collateralize the repurchase price payable by the counterparty. In the event of insolvency of the counterparty to a repurchase agreement, recovery of the repurchase price owed to the Portfolio may be delayed. Such an insolvency also may result in a loss to the extent that the value of the purchased securities decreases during the delay or that value has otherwise not been maintained at an amount at least equal to the repurchase price.
S Reverse Repurchase Agreements—Under a reverse repurchase agreement, the Portfolio temporarily transfers possession of a portfolio security to another party, such as a bank or broker/dealer, in return for cash. At the same time, the Portfolio agrees to repurchase the security at an agreed upon time and price, which reflects an interest payment. In periods of increased demand for a security, the Portfolio may receive a payment from the counterparty for the use of the security, which is recorded as interest income. Because the Portfolio retains effective control over the transferred security, the transaction is accounted for as a secured borrowing. The Portfolio may enter into such agreements when it believes it is able to invest the cash acquired at a rate higher than the cost of the agreement, which would increase earned income. When the Portfolio enters into a reverse repurchase agreement, any fluctuations in the market value of either the securities transferred to another party or the securities in which the proceeds may be invested would affect the market value of the Portfolio’s assets. Because reverse repurchase agreements may be considered to be the practical equivalent of borrowing funds (and the counterparty making a loan), they constitute a form of leverage. The Portfolio segregates cash or liquid assets equal to its obligation to repurchase the security. During the term of the agreement, the Portfolio may also be obligated to pledge additional cash and/or securities in the event of a decline in the fair value of the
Global Macro Absolute Return Advantage Portfolio
April 30, 2024
Notes to Consolidated Financial Statements (Unaudited) — continued
transferred security. In the event the counterparty to a reverse repurchase agreement becomes insolvent, recovery of the security transferred by the Portfolio may be delayed or the Portfolio may incur a loss equal to the amount by which the value of the security transferred by the Portfolio exceeds the repurchase price payable by the Portfolio.
T Securities Sold Short—A short sale is a transaction in which the Portfolio sells a security it does not own in anticipation of a decline in the market value of that security. To complete such a transaction, the Portfolio must borrow the security to make delivery to the buyer with an obligation to replace such borrowed security at a later date. Until the security is replaced, the Portfolio is required to repay the lender any dividends or interest, which accrue during the period of the loan. The proceeds received from a short sale are recorded as a liability and the Portfolio records an unrealized gain or loss to the extent of the difference between the proceeds received and the value of the open short position on the day of determination. A gain, limited to the price at which the Portfolio sold the security short, or a loss, potentially unlimited as there is no upward limit on the price of a security, is recorded when the short position is terminated. Interest and dividends payable on securities sold short are recorded as an expense.
U Stripped Mortgage-Backed Securities—The Portfolio may invest in Interest Only (IO) and Principal Only (PO) securities, forms of stripped mortgage-
backed securities, whereby the IO security receives all the interest and the PO security receives all the principal on a pool of mortgage assets. The yield to maturity on an IO security is extremely sensitive to the rate of principal payments (including prepayments) on the related underlying mortgage assets, and a rapid rate of principal payments may have a material adverse effect on the yield to maturity from these securities. If the underlying mortgages experience greater than anticipated prepayments of principal, the Portfolio may fail to recoup its initial investment in an IO security. The market value of IO and PO securities can be unusually volatile due to changes in interest rates.
V Interim Consolidated Financial Statements—The interim consolidated financial statements relating to April 30, 2024 and for the six months then ended have not been audited by an independent registered public accounting firm, but in the opinion of the Portfolio’s management, reflect all adjustments, consisting only of normal recurring adjustments, necessary for the fair presentation of the consolidated financial statements.
2 Investment Adviser Fee and Other Transactions with Affiliates
The investment adviser fee is earned by Boston Management and Research (BMR), an indirect, wholly-owned subsidiary of Morgan Stanley, as compensation for investment advisory services rendered to the Portfolio and the Subsidiary. The Portfolio and Subsidiary each pay BMR a fee computed at an annual rate as a percentage of its respective average daily net assets as follows and is payable monthly:
| Average Daily Net Assets | Annual Fee Rate |
| Up to $500 million | 1.000% |
| $500 million but less than $1 billion | 0.950% |
| $1 billion but less than $2.5 billion | 0.925% |
| $2.5 billion but less than $5 billion | 0.900% |
| $5 billion and over | 0.880% |
In determining the investment adviser fee for the Portfolio and Subsidiary, the applicable advisory fee rate is based on the average daily net assets of the Portfolio (inclusive of its interest in the Subsidiary). Such fee rate is then assessed separately on the Portfolio’s average daily net assets (exclusive of its interest in the Subsidiary) and the Subsidiary’s average daily net assets to determine the amount of the investment adviser fee. For the six months ended April 30, 2024, the Portfolio’s investment adviser fee amounted to $12,420,775 or 0.94% (annualized) of the Portfolio’s consolidated average daily net assets. The Portfolio may invest in a money market fund, the Institutional Class of the Morgan Stanley Institutional Liquidity Funds - Government Portfolio (the “Liquidity Fund”), an open-end management investment company managed by Morgan Stanley Investment Management Inc., a wholly-owned subsidiary of Morgan Stanley. The investment adviser fee paid by the Portfolio is reduced by an amount equal to its pro rata share of the advisory and administration fees paid by the Portfolio due to its investment in the Liquidity Fund. For the six months ended April 30, 2024, the investment adviser fee paid was reduced by $133,455 relating to the Portfolio’s investment in the Liquidity Fund. Pursuant to an expense reimbursement, BMR was allocated $80,694 of the Portfolio’s operating expenses for the six months ended April 30, 2024.
Pursuant to an investment sub-advisory agreement, BMR has delegated a portion of the investment management of the Portfolio to Eaton Vance Advisers International Ltd. (EVAIL), an affiliate of BMR and an indirect, wholly-owned subsidiary of Morgan Stanley. BMR pays EVAIL a portion of its investment adviser fee for sub-advisory services provided to the Portfolio.
Trustees and officers of the Portfolio who are members of BMR’s organization receive remuneration for their services to the Portfolio out of the investment adviser fee. Trustees of the Portfolio who are not affiliated with the investment adviser may elect to defer receipt of all or a percentage of their annual fees in accordance with the terms of the Trustees Deferred Compensation Plan. Certain officers and Trustees of the Portfolio are officers of the above organization.
Global Macro Absolute Return Advantage Portfolio
April 30, 2024
Notes to Consolidated Financial Statements (Unaudited) — continued
3 Purchases and Sales of Investments
Purchases and sales of investments, other than short-term obligations and including maturities, paydowns and securities sold short, for the six months ended April 30, 2024 were as follows:
| | Purchases | Sales |
| Investments (non-U.S. Government) | $ 2,023,396,069 | $ 1,800,387,250 |
| U.S. Government and Agency Securities | 55,381,415 | 18,702,712 |
| | $2,078,777,484 | $1,819,089,962 |
4 Federal Income Tax Basis of Investments
The cost and unrealized appreciation (depreciation) of investments of the Portfolio, including open derivative contracts and the Portfolio's investment in the Subsidiary at April 30, 2024, as determined on a federal income tax basis, were as follows:
| Aggregate cost | $2,591,655,539 |
| Gross unrealized appreciation | $ 178,891,952 |
| Gross unrealized depreciation | (242,643,218) |
| Net unrealized depreciation | $ (63,751,266) |
5 Restricted Securities
At April 30, 2024, the Portfolio owned the following securities (representing 1.0% of net assets) which were restricted as to public resale and not registered under the Securities Act of 1933 (excluding Rule 144A securities). The Portfolio has various registration rights (exercisable under a variety of circumstances) with respect to these securities. The value of these securities is determined based on valuations provided by brokers when available, or if not available, they are valued at fair value using methods determined in good faith by or at the direction of the Trustees’ valuation designee.
| Description | Date(s) of
Acquisition | Shares | Cost | Value |
| Reinsurance Side Cars | | | | |
| Mt. Logan Re Ltd., Series A-1 | 12/30/20 | 8,600 | $ 8,600,000 | $ 11,815,016 |
| PartnerRe ILS Fund SAC Ltd. | 1/2/24 | 13,000,000 | 13,000,000 | 13,449,800 |
| Sussex Capital Ltd., Designated Investment Series 14 | 1/24/22 | 1,114 | 1,107,140 | 24,047 |
| Sussex Capital Ltd., Designated Investment Series 14 | 11/30/22 | 1,081 | 1,080,115 | 305,880 |
| Sussex Capital Ltd., Series 14, Preference Shares | 6/1/21 | 1,466 | 1,038,237 | 1,864,819 |
| Total Restricted Securities | | | $24,825,492 | $27,459,562 |
6 Financial Instruments
The Portfolio may trade in financial instruments with off-balance sheet risk in the normal course of its investing activities. These financial instruments may include written options, forward foreign currency exchange contracts, non-deliverable bond forward contracts, futures contracts and swap contracts and may involve, to a varying degree, elements of risk in excess of the amounts recognized for financial statement purposes. The notional or contractual amounts of these instruments represent the investment the Portfolio has in particular classes of financial instruments and do not necessarily represent the amounts potentially subject to risk. The measurement of the risks associated with these instruments is meaningful only when all related and offsetting transactions are considered. A summary of obligations under these financial instruments at April 30, 2024 is included in the Consolidated Portfolio of Investments. At April 30, 2024, the Portfolio had sufficient cash and/or securities to cover commitments under these contracts.
Global Macro Absolute Return Advantage Portfolio
April 30, 2024
Notes to Consolidated Financial Statements (Unaudited) — continued
In the normal course of pursuing its investment objective, the Portfolio is subject to the following risks:
Commodity Risk: During the six months ended April 30, 2024, the Portfolio invested in commodities-linked derivative instruments, including commodity futures contracts and total return swap contracts based on commodity indices, that provide exposure to the investment returns of certain commodities. Commodities-linked derivative instruments are used to enhance total return and/or as a substitute for the purchase or sale of commodities and to manage certain investment risks.
Credit Risk: The Portfolio enters into credit default swap contracts to manage certain investment risks and/or to enhance total return or as a substitute for the purchase or sale of securities.
Equity Price Risk: The Portfolio enters into equity index futures contracts and total return swaps to enhance total return and/or to manage certain investment risks.
Foreign Exchange Risk: The Portfolio engages in forward foreign currency exchange contracts, currency options and cross-currency swaps to enhance total return, to seek to hedge against fluctuations in currency exchange rates and/or as a substitute for the purchase or sale of securities or currencies.
Interest Rate Risk: The Portfolio utilizes various interest rate derivatives including non-deliverable bond forward contracts, interest rate futures contracts, interest rate swaps, inflation swaps, total return swaps and cross-currency swaps contracts to enhance total return, to seek to hedge against fluctuations in interest rates and/or to change the effective duration of its portfolio.
The Portfolio enters into over-the-counter (OTC) derivatives that may contain provisions whereby the counterparty may terminate the contract under certain conditions, including but not limited to a decline in the Portfolio’s net assets below a certain level over a certain period of time, which would trigger a payment by the Portfolio for those derivatives in a liability position. At April 30, 2024, the fair value of derivatives with credit-related contingent features in a net liability position was $49,417,526. The aggregate fair value of assets pledged as collateral by the Portfolio for such liability was $86,068,030 at April 30, 2024.
The OTC derivatives in which the Portfolio invests (except for written options as the Portfolio, not the counterparty, is obligated to perform) are subject to the risk that the counterparty to the contract fails to perform its obligations under the contract. To mitigate this risk, the Portfolio (and Subsidiary) has entered into an International Swaps and Derivatives Association, Inc. Master Agreement (“ISDA Master Agreement”) or similar agreement with substantially all its derivative counterparties. An ISDA Master Agreement is a bilateral agreement between the Portfolio and a counterparty that governs certain OTC derivatives and typically contains, among other things, set-off provisions in the event of a default and/or termination event as defined under the relevant ISDA Master Agreement. Under an ISDA Master Agreement, the Portfolio (and Subsidiary) may, under certain circumstances, offset with the counterparty certain derivative financial instruments’ payables and/or receivables with collateral held and/or posted and create one single net payment. The provisions of the ISDA Master Agreement typically permit a single net payment in the event of default including the bankruptcy or insolvency of the counterparty. However, bankruptcy or insolvency laws of a particular jurisdiction may impose restrictions on or prohibitions against the right of offset in bankruptcy or insolvency. Certain ISDA Master Agreements allow counterparties to OTC derivatives to terminate derivative contracts prior to maturity in the event the Portfolio’s net assets decline by a stated percentage or the Portfolio fails to meet the terms of its ISDA Master Agreements, which would cause the counterparty to accelerate payment by the Portfolio of any net liability owed to it.
The collateral requirements for derivatives traded under an ISDA Master Agreement are governed by a Credit Support Annex to the ISDA Master Agreement. Collateral requirements are determined at the close of business each day and are typically based on changes in market values for each transaction under an ISDA Master Agreement and netted into one amount for such agreement. Generally, the amount of collateral due from or to a counterparty is subject to a minimum transfer threshold amount before a transfer is required, which may vary by counterparty. Collateral pledged for the benefit of the Portfolio (and Subsidiary) and/or counterparty is held in segregated accounts by the Portfolio’s custodian and cannot be sold, re-pledged, assigned or otherwise used while pledged. The portion of such collateral representing cash, if any, is reflected as deposits for derivatives collateral and, in the case of cash pledged by a counterparty for the benefit of the Portfolio, a corresponding liability on the Consolidated Statement of Assets and Liabilities. Securities pledged by the Portfolio as collateral, if any, are identified as such in the Consolidated Portfolio of Investments. The carrying amount of the liability for cash collateral due to brokers at April 30, 2024 approximated its fair value. If measured at fair value, such liability would have been considered as Level 2 in the fair value hierarchy (see Note 10) at April 30, 2024. Because the Subsidiary is not registered under the 1940 Act, it may not be able to negotiate terms with its counterparties that are equivalent to those a registered portfolio may negotiate. As a result, the Subsidiary may have greater exposure to those counterparties than a registered portfolio.
Global Macro Absolute Return Advantage Portfolio
April 30, 2024
Notes to Consolidated Financial Statements (Unaudited) — continued
The fair value of open derivative instruments (not considered to be hedging instruments for accounting disclosure purposes) by risk exposure at April 30, 2024 was as follows:
| | Fair Value |
| Consolidated Statement of Assets and Liabilities Caption | Commodity | Credit | Equity
Price | Foreign
Exchange | Interest
Rate | Total |
| Unaffiliated investments, at value | $ — | $ — | $ — | $ 1,809,347 | $ — | $ 1,809,347 |
| Not applicable | — | 46,907,373* | 326,387* | 19,922,523* | 44,086,232* | 111,242,515 |
| Receivable for open forward foreign currency exchange contracts | — | — | — | 45,227,924 | — | 45,227,924 |
| Receivable/Payable for open swap contracts; Upfront payments/receipts on open non-centrally cleared swap contracts | 523,405 | 1,539,165 | 289,764 | — | 1,770,661 | 4,122,995 |
| Total Asset Derivatives | $523,405 | $ 48,446,538 | $ 616,151 | $ 66,959,794 | $ 45,856,893 | $ 162,402,781 |
| Derivatives not subject to master netting or similar agreements | $ — | $ 46,907,373 | $ 326,387 | $ 19,922,523 | $ 44,086,232 | $ 111,242,515 |
| Total Asset Derivatives subject to master netting or similar agreements | $523,405 | $ 1,539,165 | $ 289,764 | $ 47,037,271 | $ 1,770,661 | $ 51,160,266 |
| Written options outstanding, at value | $ — | $ — | $ — | $ (213,958) | $ — | $ (213,958) |
| Not applicable | — | (26,947,557)* | (1,387,057)* | (12,773,617)* | (50,798,110)* | (91,906,341) |
| Payable for open forward foreign currency exchange contracts | — | — | — | (33,437,732) | — | (33,437,732) |
| Payable/Receivable for open swap contracts; Upfront payments/receipts on open non-centrally cleared swap contracts | — | (7,040,415) | — | — | (8,725,421) | (15,765,836) |
| Total Liability Derivatives | $ — | $(33,987,972) | $(1,387,057) | $(46,425,307) | $(59,523,531) | $(141,323,867) |
| Derivatives not subject to master netting or similar agreements | $ — | $(26,947,557) | $(1,387,057) | $(12,773,617) | $(50,798,110) | $ (91,906,341) |
| Total Liability Derivatives subject to master netting or similar agreements | $ — | $ (7,040,415) | $ — | $(33,651,690) | $ (8,725,421) | $ (49,417,526) |
| * | Only the current day’s variation margin on open futures contracts and centrally cleared derivatives is reported within the Consolidated Statement of Assets and Liabilities as Receivable or Payable for variation margin on open futures contracts and centrally cleared derivatives, as applicable. |
The Portfolio's derivative assets and liabilities at fair value by risk, which are reported gross in the Consolidated Statement of Assets and Liabilities, are presented in the table above. The following tables present the Portfolio's derivative assets and liabilities by counterparty, net of amounts available for offset under a master netting agreement and net of the related collateral received by the Portfolio (and Subsidiary) for such assets and pledged by the Portfolio (and Subsidiary) for such liabilities as of April 30, 2024.
| Counterparty | Derivative
Assets Subject to
Master Netting
Agreement | Derivatives
Available
for Offset | Non-cash
Collateral
Received(a) | Cash
Collateral
Received(a) | Net Amount
of Derivative
Assets(b) | Total Cash
Collateral
Received |
| Bank of America, N.A. | $ 1,120,204 | $ (1,120,204) | $ — | $ — | $ — | $ — |
| Barclays Bank PLC | 2,182,327 | (1,660,749) | (521,578) | — | — | — |
| BNP Paribas | 3,516,588 | (3,334,248) | (182,340) | — | — | 400,000 |
| Citibank, N.A. | 13,868,909 | (11,629,168) | (272,403) | — | 1,967,338 | — |
Global Macro Absolute Return Advantage Portfolio
April 30, 2024
Notes to Consolidated Financial Statements (Unaudited) — continued
| Counterparty | Derivative
Assets Subject to
Master Netting
Agreement | Derivatives
Available
for Offset | Non-cash
Collateral
Received(a) | Cash
Collateral
Received(a) | Net Amount
of Derivative
Assets(b) | Total Cash
Collateral
Received |
| Deutsche Bank AG | $ 343,660 | $ (343,660) | $ — | $ — | $ — | $ — |
| Goldman Sachs International | 5,842,506 | (5,842,506) | — | — | — | — |
| HSBC Bank USA, N.A. | 5,716,600 | (1,123,106) | (2,534,592) | — | 2,058,902 | — |
| ICBC Standard Bank plc | 1,339,555 | (1,339,555) | — | — | — | — |
| JPMorgan Chase Bank, N.A. | 4,096,549 | (1,676,933) | — | (2,419,616) | — | 3,879,000 |
| Societe Generale | 1,021,485 | (1,021,485) | — | — | — | — |
| Standard Chartered Bank | 10,091,539 | (8,281,883) | — | — | 1,809,656 | — |
| State Street Bank and Trust Company | 11,978 | (11,978) | — | — | — | — |
| UBS AG | 2,008,366 | (2,008,366) | — | — | — | — |
| | $51,160,266 | $(39,393,841) | $(3,510,913) | $(2,419,616) | $5,835,896 | $4,279,000 |
| Counterparty | Derivative
Liabilities Subject to
Master Netting
Agreement | Derivatives
Available
for Offset | Non-cash
Collateral
Pledged(a) | Cash
Collateral
Pledged(a) | Net Amount
of Derivative
Liabilities(c) | Total Cash
Collateral
Pledged |
| Australia and New Zealand Banking Group Limited | $ (365,172) | $ — | $ 280,692 | $ — | $ (84,480) | $ — |
| Bank of America, N.A. | (1,784,426) | 1,120,204 | 664,222 | — | — | — |
| Barclays Bank PLC | (1,660,749) | 1,660,749 | — | — | — | — |
| BNP Paribas | (3,711,807) | 3,334,248 | — | — | (377,559) | — |
| Citibank, N.A. | (11,629,168) | 11,629,168 | — | — | — | 7,762,300 |
| Deutsche Bank AG | (2,030,221) | 343,660 | 1,686,561 | — | — | — |
| Goldman Sachs International | (10,689,993) | 5,842,506 | 3,786,691 | — | (1,060,796) | — |
| HSBC Bank USA, N.A. | (1,123,106) | 1,123,106 | — | — | — | — |
| ICBC Standard Bank plc | (1,401,320) | 1,339,555 | 61,765 | — | — | — |
| JPMorgan Chase Bank, N.A. | (1,676,933) | 1,676,933 | — | — | — | — |
| Societe Generale | (1,910,573) | 1,021,485 | 889,088 | — | — | — |
| Standard Chartered Bank | (8,281,883) | 8,281,883 | — | — | — | 9,640,000 |
| State Street Bank and Trust Company | (304,215) | 11,978 | 69,905 | — | (222,332) | — |
| UBS AG | (2,847,960) | 2,008,366 | 649,847 | 189,747 | — | 203,000 |
| | $(49,417,526) | $39,393,841 | $8,088,771 | $189,747 | $(1,745,167) | $17,605,300 |
| Total — Deposits for derivatives collateral — OTC derivatives | | | | $21,884,300 |
| (a) | In some instances, the total collateral received and/or pledged may be more than the amount shown due to overcollateralization. |
| (b) | Net amount represents the net amount due from the counterparty in the event of default. |
| (c) | Net amount represents the net amount payable to the counterparty in the event of default. |
Information with respect to reverse repurchase agreements at April 30, 2024 is included at Note 8.
Global Macro Absolute Return Advantage Portfolio
April 30, 2024
Notes to Consolidated Financial Statements (Unaudited) — continued
The effect of derivative instruments (not considered to be hedging instruments for accounting disclosure purposes) on the Consolidated Statement of Operations by risk exposure for the six months ended April 30, 2024 was as follows:
| Consolidated Statement of Operations Caption | Commodity | Credit | Equity
Price | Foreign
Exchange | Interest
Rate | Total |
| Net realized gain (loss): | | | | | | |
| Investment transactions | $ — | $ — | $ — | $ (1,242,797) | $ — | $ (1,242,797) |
| Written options | — | — | — | 1,230,867 | (604,558) | 626,309 |
| Futures contracts | (2,112,470) | — | (6,625,974) | — | (5,547,537) | (14,285,981) |
| Swap contracts | (15,710) | (65,546,839) | 4,754,043 | — | 24,090,303 | (36,718,203) |
| Forward foreign currency exchange contracts | — | — | — | (12,528,324) | — | (12,528,324) |
| Non-deliverable bond forward contracts | — | — | — | — | 3,158,005 | 3,158,005 |
| Total | $(2,128,180) | $(65,546,839) | $(1,871,931) | $(12,540,254) | $ 21,096,213 | $(60,990,991) |
| Change in unrealized appreciation (depreciation): | | | | | | |
| Investments | $ — | $ — | $ — | $ (3,487,484) | $ — | $ (3,487,484) |
| Written options | — | — | — | 731,804 | — | 731,804 |
| Futures contracts | 729,379 | — | (3,261,758) | — | 8,102,040 | 5,569,661 |
| Swap contracts | 469,590 | (9,815,202) | 2,031,723 | — | (12,912,354) | (20,226,243) |
| Forward foreign currency exchange contracts | — | — | — | 16,404,097 | — | 16,404,097 |
| Total | $ 1,198,969 | $ (9,815,202) | $(1,230,035) | $ 13,648,417 | $ (4,810,314) | $ (1,008,165) |
The average notional cost of futures contracts and average notional amounts of other derivative contracts outstanding during the six months ended April 30, 2024, which are indicative of the volume of these derivative types, were approximately as follows:
Futures
Contracts — Long | Futures
Contracts — Short | Forward
Foreign Currency
Exchange Contracts* | Non-Deliverable
Bond Forward
Contracts | Swap
Contracts |
| $126,955,000 | $1,065,548,000 | $3,980,285,000 | $30,019,000 | $7,761,963,000 |
| * | The average notional amount for forward foreign currency exchange contracts is based on the absolute value of notional amounts of currency purchased and currency sold. |
The average principal amount of purchased and written currency options contracts outstanding during the six months ended April 30, 2024, which are indicative of the volume of these derivative types, were approximately $165,551,000 and $43,960,000, respectively.
7 Line of Credit
The Portfolio participates with other portfolios and funds managed by BMR and its affiliates in a $650 million unsecured revolving line of credit agreement with a group of banks, which is in effect through October 22, 2024. Borrowings are made by the Portfolio solely for temporary purposes related to redemptions and other short-term cash needs. Interest is charged to the Portfolio based on its borrowings at an amount above either the Secured Overnight Financing Rate (SOFR) or Federal Funds rate. In addition, a fee computed at an annual rate of 0.15% on the daily unused portion of the line of credit is allocated among the participating portfolios and funds at the end of each quarter. In connection with the renewal of the agreement in October 2023, an arrangement fee of $150,000 was incurred that was allocated to the participating portfolios and funds. Because the line of credit is not available exclusively to the Portfolio, it may be unable to borrow some or all of its requested amounts at any particular time. The Portfolio did not have any significant borrowings or allocated fees during the six months ended April 30, 2024.
Global Macro Absolute Return Advantage Portfolio
April 30, 2024
Notes to Consolidated Financial Statements (Unaudited) — continued
8 Reverse Repurchase Agreements
Reverse repurchase agreements outstanding as of April 30, 2024 were as follows:
| Counterparty | Trade
Date | Maturity
Date | Interest
Rate Paid
(Received) | Principal
Amount | Value
Including
Accrued
Interest |
| MUFG Securities Americas, Inc. | 2/13/24 | On Demand(1) | 5.55% | $ 16,084,121 | $ 16,275,053 |
| MUFG Securities Americas, Inc. | 4/3/24 | On Demand(1) | 5.55 | 13,916,000 | 13,976,071 |
| MUFG Securities Americas, Inc. | 4/12/24 | On Demand(1) | 5.55 | 57,826,000 | 57,995,383 |
| Total | | | | $87,826,121 | $88,246,507 |
| (1) | Open reverse repurchase agreement with no specific maturity date. Either party may terminate the agreement upon demand. |
At April 30, 2024, the type of securities pledged as collateral for all open reverse repurchase agreements was Sovereign Government Bonds.
For the six months ended April 30, 2024, the average borrowings under settled reverse repurchase agreements and the average annual interest rate paid were approximately $101,824,000 and 5.50%, respectively. Based on the short-term nature of the borrowings under the reverse repurchase agreements, the carrying value of the payable for reverse repurchase agreements approximated its fair value at April 30, 2024. If measured at fair value, borrowings under the reverse repurchase agreements would have been considered as Level 2 in the fair value hierarchy (see Note 10) at April 30, 2024.
Reverse repurchase agreements entered into by the Portfolio are subject to Master Repurchase Agreements (MRA), which permit the Portfolio, under certain circumstances, including an event of default (such as bankruptcy or insolvency), to offset payables and/or receivables under the MRA with collateral held and/or posted to the counterparty and create one single net payment due to or from the Portfolio.
The following tables present the Portfolio’s repurchase and reverse repurchase agreements net of amounts available for offset under an MRA and net of the related collateral pledged by the Portfolio as of April 30, 2024.
| Counterparty | Repurchase
Agreements | Liabilities
Available for
Offset | Securities
Collateral
Received(a) | Net
Amount(b) |
| Bank of America, N.A. | $ 1,787,500 | $ — | $ (1,787,500) | $ — |
| Barclays Bank PLC | 14,540,721 | — | (13,605,933) | 934,788 |
| JPMorgan Chase Bank, N.A. | 53,558,961 | — | (48,920,533) | 4,638,428 |
| Nomura International PLC | 19,702,921 | — | (17,998,335) | 1,704,586 |
| | $89,590,103 | $ — | $(82,312,301) | $7,277,802 |
| Counterparty | Reverse
Repurchase
Agreements* | Assets
Available for
Offset | Securities
Collateral
Pledged(a) | Net
Amount(c) |
| MUFG Securities Americas, Inc. | $(88,246,507) | $ — | $88,246,507 | $ — |
| * | Including accrued interest. |
| (a) | In some instances, the total collateral received and/or pledged may be more than the amount shown due to overcollateralization. |
| (b) | Net amount represents the net amount receivable from the counterparty in the event of default. |
| (c) | Net amount represents the net amount payable to the counterparty in the event of default. |
Global Macro Absolute Return Advantage Portfolio
April 30, 2024
Notes to Consolidated Financial Statements (Unaudited) — continued
9 Affiliated Investments
At April 30, 2024, the value of the Portfolio's investment in funds that may be deemed to be affiliated was $36,275,308, which represents 1.3% of the Portfolio's net assets. Transactions in such investments by the Portfolio for the six months ended April 30, 2024 were as follows:
| Name | Value,
beginning
of period | Purchases | Sales
proceeds | Net realized
gain (loss) | Change in
unrealized
appreciation
(depreciation) | Value, end
of period | Dividend
income | Shares,
end of period |
| Short-Term Investments |
| Liquidity Fund | $230,125,366 | $1,352,870,566 | $(1,546,720,624) | $ — | $ — | $36,275,308 | $4,491,840 | 36,275,308 |
10 Fair Value Measurements
Under generally accepted accounting principles for fair value measurements, a three-tier hierarchy to prioritize the assumptions, referred to as inputs, is used in valuation techniques to measure fair value. The three-tier hierarchy of inputs is summarized in the three broad levels listed below.
| • | Level 1 – quoted prices in active markets for identical investments |
| • | Level 2 – other significant observable inputs (including quoted prices for similar investments, interest rates, prepayment speeds, credit risk, etc.) |
| • | Level 3 – significant unobservable inputs (including a fund's own assumptions in determining the fair value of investments) |
In cases where the inputs used to measure fair value fall in different levels of the fair value hierarchy, the level disclosed is determined based on the lowest level input that is significant to the fair value measurement in its entirety. The inputs or methodology used for valuing securities are not necessarily an indication of the risk associated with investing in those securities.
At April 30, 2024, the hierarchy of inputs used in valuing the Portfolio’s investments and open derivative instruments, which are carried at fair value, were as follows:
| Asset Description | Level 1 | Level 2 | Level 3 | Total |
| Collateralized Mortgage Obligations | $ — | $ 145,595,508 | $ — | $ 145,595,508 |
| Common Stocks | 400,277 | 213,301,095* | 367,399 | 214,068,771 |
| Convertible Bonds | — | 4,564,056 | — | 4,564,056 |
| Foreign Corporate Bonds | — | 152,876,325 | 0 | 152,876,325 |
| Loan Participation Notes | — | — | 54,139,286 | 54,139,286 |
| Reinsurance Side Cars | — | — | 41,366,960 | 41,366,960 |
| Senior Floating-Rate Loans | — | 16,159,500 | 407,885 | 16,567,385 |
| Sovereign Government Bonds | — | 1,448,913,197 | — | 1,448,913,197 |
| Sovereign Loans | — | 87,565,373 | — | 87,565,373 |
| U.S. Government Guaranteed Small Business Administration Loans | — | 5,733,898 | — | 5,733,898 |
| Miscellaneous | — | — | 0 | 0 |
| Short-Term Investments: | | | | |
| Affiliated Fund | 36,275,308 | — | — | 36,275,308 |
| Repurchase Agreements | — | 89,590,103 | — | 89,590,103 |
| Sovereign Government Securities | — | 289,618,200 | — | 289,618,200 |
| U.S. Treasury Obligations | — | 106,237,569 | — | 106,237,569 |
| Purchased Currency Options | — | 1,809,347 | — | 1,809,347 |
| Total Investments | $ 36,675,585 | $ 2,561,964,171 | $ 96,281,530 | $ 2,694,921,286 |
| Forward Foreign Currency Exchange Contracts | $ — | $ 65,150,447 | $ — | $ 65,150,447 |
| Futures Contracts | 12,491,408 | — | — | 12,491,408 |
Global Macro Absolute Return Advantage Portfolio
April 30, 2024
Notes to Consolidated Financial Statements (Unaudited) — continued
| Asset Description (continued) | Level 1 | Level 2 | Level 3 | Total |
| Swap Contracts | $ — | $ 82,951,579 | $ — | $ 82,951,579 |
| Total | $ 49,166,993 | $ 2,710,066,197 | $ 96,281,530 | $ 2,855,514,720 |
| Liability Description | | | | |
| Securities Sold Short | $ (47,206,453) | $ (122,722,287) | $ — | $ (169,928,740) |
| Written Currency Options | — | (213,958) | — | (213,958) |
| Forward Foreign Currency Exchange Contracts | — | (46,211,349) | — | (46,211,349) |
| Futures Contracts | (1,841,763) | (177,523) | — | (2,019,286) |
| Swap Contracts | — | (92,879,274) | — | (92,879,274) |
| Total | $ (49,048,216) | $ (262,204,391) | $ — | $ (311,252,607) |
| * | Includes foreign equity securities whose values were adjusted to reflect market trading of comparable securities or other correlated instruments that occurred after the close of trading in their applicable foreign markets. |
The following is a reconciliation of Level 3 investments for which significant unobservable inputs were used to determine fair value:
| | Common
Stocks | Foreign
Corporate
Bonds | Loan
Participation
Notes | Reinsurance
Side Cars** | Senior
Floating-Rate
Loans | Miscellaneous | Total |
| Balance as of October 31, 2023 | $ 818,174 | $ 0 | $50,529,862 | $20,158,090 | $ 397,208 | $ 0 | $71,903,334 |
| Realized gains (losses) | — | — | — | 3,027,524 | 13,429 | 116,131 | 3,157,084 |
| Change in net unrealized appreciation (depreciation) | (450,775) | — | 3,147,767 | 182,993 | 670,469 | — | 3,550,454 |
| Cost of purchases | — | — | — | 26,000,000 | — | — | 26,000,000 |
| Proceeds from sales, including return of capital | — | — | — | (8,001,647) | (699,275) | (116,131) | (8,817,053) |
| Accrued discount (premium) | — | — | 461,657 | — | 26,054 | — | 487,711 |
| Transfers to Level 3 | — | — | — | — | — | — | — |
| Transfers from Level 3 | — | — | — | — | — | — | — |
| Balance as of April 30, 2024 | $ 367,399 | $ 0 | $54,139,286 | $41,366,960 | $ 407,885 | $ 0 | $96,281,530 |
| Change in net unrealized appreciation (depreciation) on investments still held as of April 30, 2024 | $(450,775) | $ — | $ 3,147,767 | $ 2,294,447 | $ 245,091 | $ — | $ 5,236,530 |
| * | The Portfolio’s investments in Reinsurance Side Cars were primarily valued on the basis of broker quotations. |
Global Macro Absolute Return Advantage Portfolio
April 30, 2024
Notes to Consolidated Financial Statements (Unaudited) — continued
The following is a summary of quantitative information about significant unobservable valuation inputs for Level 3 investments held as of April 30, 2024:
| Type of Investment | Fair Value as of
April 30, 2024 | Valuation Technique | Unobservable Input | Range of Unobservable Input | Impact to
Valuation from an
Increase to Input* |
| Common Stocks | $ 367,399 | Market Approach | Discount Rate | 30% | Decrease |
| Foreign Corporate Bonds | 0 | Estimated Recovery Value | Estimated Recovery Value Percentage | 0% | Increase |
| Loan Participation Notes | 54,139,286 | Matrix Pricing | Adjusted Credit Spread to the Central Bank of Uzbekistan Quoted Policy Rate | 4.38% - 6.67%** | Decrease |
| Miscellaneous | 0 | Estimated Value | Estimated Recovery Value Percentage | 0% | Increase |
| Senior Floating-Rate Loans | 407,885 | Market Approach | Discount Rate | 10% | Decrease |
| * | Represents the directional change in the fair value of the Level 3 investments that would result from an increase to the corresponding unobservable input. A decrease to the unobservable input would have the opposite effect. |
| ** | The weighted average of the unobservable input is 5.55% based on relative principal amounts. |
11 Risks and Uncertainties
Risks Associated with Foreign Investments
Foreign investments can be adversely affected by political, economic and market developments abroad, including the imposition of economic and other sanctions by the United States or another country, and by acts of terrorism and war. There may be less publicly available information about foreign issuers because they may not be subject to reporting practices, requirements or regulations comparable to those to which United States companies are subject. Foreign markets may be smaller, less liquid and more volatile than the major markets in the United States. Trading in foreign markets typically involves higher expense than trading in the United States. The Portfolio may have difficulties enforcing its legal or contractual rights in a foreign country. Securities that trade or are denominated in currencies other than the U.S. dollar may be adversely affected by fluctuations in currency exchange rates.
Emerging market securities often involve greater risks than developed market securities. Investment markets within emerging market countries are typically smaller, less liquid, less developed and more volatile than those in more developed markets like the United States, and may be focused in certain economic sectors. The information available about an emerging market issuer may be less reliable than for comparable issuers in more developed capital markets. Governmental actions can have a significant effect on the economic conditions in emerging market countries. It may be more difficult to make a claim or obtain a judgment in the courts of these countries than it is in the United States. The possibility of fraud, negligence, undue influence being exerted by an issuer or refusal to recognize ownership exists in some emerging markets. Disruptions due to work stoppages and trading improprieties in foreign securities markets have caused such markets to close. Emerging market securities are also subject to speculative trading, which contributes to their volatility.
Economic data as reported by sovereign entities may be delayed, inaccurate or fraudulent. In the event of a default by a sovereign entity, there are typically no assets to be seized or cash flows to be attached. Furthermore, the willingness or ability of a sovereign entity to restructure defaulted debt may be limited. Therefore, losses on sovereign defaults may far exceed the losses from the default of a similarly rated U.S. debt issuer.
Eaton Vance
Global Macro Absolute Return Advantage Fund
April 30, 2024
| Officers of Eaton Vance Global Macro Absolute Return Advantage Fund and Global Macro Absolute Return Advantage Portfolio |
Kenneth A. Topping
President | Nicholas S. Di Lorenzo
Secretary |
Deidre E. Walsh
Vice President and Chief Legal Officer | Laura T. Donovan
Chief Compliance Officer |
James F. Kirchner
Treasurer | |
| Trustees of Eaton Vance Global Macro Absolute Return Advantage Fund and Global Macro Absolute Return Advantage Portfolio | |
George J. Gorman
Chairperson | |
| Alan C. Bowser | |
| Mark R. Fetting | |
| Cynthia E. Frost | |
| Valerie A. Mosley | |
| Anchal Pachnanda* | |
| Keith Quinton | |
| Marcus L. Smith | |
| Susan J. Sutherland | |
| Scott E. Wennerholm | |
| Nancy A. Wiser | |
| U.S. Customer Privacy Notice | March 2024 |
| FACTS | WHAT DOES EATON VANCE DO WITH YOUR PERSONAL INFORMATION? |
| Why? | Financial companies choose how they share your personal information. Federal law gives consumers the right to limit some but not all sharing. Federal law also requires us to tell you how we collect, share, and protect your personal information. Please read this notice carefully to understand what we do. |
| |
| What? | The types of personal information we collect and share depend on the product or service you have with us. This information can include:■ Social Security number and income
■ investment experience and risk tolerance
■ checking account information and wire transfer instructions |
| |
| How? | All financial companies need to share customers’ personal information to run their everyday business. In the section below, we list the reasons financial companies can share their customers’ personal information; the reasons Eaton Vance chooses to share; and whether you can limit this sharing. |
| Reasons we can share your personal information | Does Eaton Vance
share? | Can you limit
this sharing? |
| For our everyday business purposes — such as to process your transactions, maintain your account(s), respond to court orders and legal investigations, or report to credit bureaus | Yes | No |
| For our marketing purposes — to offer our products and services to you | Yes | No |
| For joint marketing with other financial companies | No | We don’t share |
| For our affiliates’ everyday business purposes — information about your transactions and experiences | Yes | No* |
| For our affiliates’ everyday business purposes — information about your creditworthiness | Yes | Yes* |
| For our affiliates to market to you | Yes | Yes* |
| For nonaffiliates to market to you | No | We don’t share |
To limit our
sharing | Call toll-free 1-800-262-1122 or email: EVPrivacy@eatonvance.comPlease note:If you are a new customer, we can begin sharing your information 30 days from the date we sent this notice. When you are no longer our customer, we continue to share your information as described in this notice. However, you can contact us at any time to limit our sharing. |
| Questions? | Call toll-free 1-800-262-1122 or email: EVPrivacy@eatonvance.com |
| U.S. Customer Privacy Notice — continued | March 2024 |
| Who we are |
| Who is providing this notice? | Eaton Vance Management and our investment management affiliates (“Eaton Vance”) (see Affiliates definition below.) |
| What we do |
How does Eaton Vance
protect my personal
information? | To protect your personal information from unauthorized access and use, we use security measures that comply with federal law. These measures include computer safeguards and secured files and buildings. We have policies governing the proper handling of customer information by personnel and requiring third parties that provide support to adhere to appropriate security standards with respect to such information. |
How does Eaton Vance
collect my personal
information? | We collect your personal information, for example, when you■ open an account or make deposits or withdrawals from your account
■ buy securities from us or make a wire transfer
■ give us your contact informationWe also collect your personal information from others, such as credit bureaus, affiliates, or other companies. |
| Why can’t I limit all sharing? | Federal law gives you the right to limit only■ sharing for affiliates’ everyday business purposes — information about your creditworthiness
■ affiliates from using your information to market to you
■ sharing for nonaffiliates to market to youState laws and individual companies may give you additional rights to limit sharing. (See below for more on your rights under state law.) |
What happens when I limit
sharing for an account I hold
jointly with someone else? | Your choices will apply to everyone on your account. |
| Definitions |
| Affiliates | Companies related by common ownership or control. They can be financial and nonfinancial companies.■ Our affiliates include registered investment advisers such as Eaton Vance Management, Eaton Vance Advisers International Ltd., Boston Management and Research, Calvert Research and Management, Parametric Portfolio Associates LLC, Atlanta Capital Management Company LLC, Morgan Stanley Investment Management Inc., Morgan Stanley Investment Management Co.; registered broker-dealers such as Morgan Stanley Distributors Inc. and Eaton Vance Distributors, Inc. (together, the “Investment Management Affiliates”); and companies with a Morgan Stanley name and financial companies such as Morgan Stanley Smith Barney LLC and Morgan Stanley & Co. (the “Morgan Stanley Affiliates”). |
| Nonaffiliates | Companies not related by common ownership or control. They can be financial and nonfinancial companies.■ Eaton Vance does not share with nonaffiliates so they can market to you. |
| Joint marketing | A formal agreement between nonaffiliated financial companies that together market financial products or services to you.■ Eaton Vance does not jointly market. |
| U.S. Customer Privacy Notice — continued | March 2024 |
| Other important information |
| *PLEASE NOTE: Eaton Vance does not share your creditworthiness information or your transactions and experiences information with the Morgan Stanley Affiliates, nor does Eaton Vance enable the Morgan Stanley Affiliates to market to you. Your opt outs will prevent Eaton Vance from sharing your creditworthiness information with the Investment Management Affiliates and will prevent the Investment Management Affiliates from marketing their products to you.Vermont: Except as permitted by law, we will not share personal information we collect about Vermont residents with Nonaffiliates unless you provide us with your written consent to share such information.California: Except as permitted by law, we will not share personal information we collect about California residents with Nonaffiliates and we will limit sharing such personal information with our Affiliates to comply with California privacy laws that apply to us. |
Delivery of Shareholder Documents. The Securities and Exchange Commission (SEC) permits funds to deliver only one copy of shareholder documents, including prospectuses, proxy statements and shareholder reports, to fund investors with multiple accounts at the same residential or post office box address. This practice is often called “householding” and it helps eliminate duplicate mailings to shareholders. Eaton Vance, or your financial intermediary, may household the mailing of your documents indefinitely unless you instruct Eaton Vance, or your financial intermediary, otherwise. If you would prefer that your Eaton Vance documents not be householded, please contact Eaton Vance at 1-800-262-1122, or contact your financial intermediary. Your instructions that householding not apply to delivery of your Eaton Vance documents will typically be effective within 30 days of receipt by Eaton Vance or your financial intermediary.
Portfolio Holdings. Each Eaton Vance Fund and its underlying Portfolio(s) (if applicable) files a schedule of portfolio holdings on Part F to Form N-PORT with the SEC. Certain information filed on Form N-PORT may be viewed on the Eaton Vance website at www.eatonvance.com, by calling Eaton Vance at 1-800-262-1122 or in the EDGAR database on the SEC’s website at www.sec.gov.
Proxy Voting. From time to time, funds are required to vote proxies related to the securities held by the funds. The Eaton Vance Funds or their underlying Portfolios (if applicable) vote proxies according to a set of policies and procedures approved by the Funds’ and Portfolios’ Boards. You may obtain a description of these policies and procedures and information on how the Funds or Portfolios voted proxies relating to portfolio securities during the most recent 12-month period ended June 30, without charge, upon request, by calling 1-800-262-1122 and by accessing the SEC’s website at www.sec.gov.
Tailored Shareholder Reports. Effective January 24, 2023, the SEC adopted rule and form amendments to require open-end mutual funds and ETFs to transmit concise and visually engaging streamlined annual and semi-annual reports to shareholders that highlight key information. Other information, including financial statements, will no longer appear in a streamlined shareholder report but must be available online, delivered free of charge upon request, and filed on a semi-annual basis on Form N-CSR. The rule and form amendments have a compliance date of July 24, 2024. At this time, management is evaluating the impact of these amendments on the shareholder reports for the Eaton Vance Funds.
Investment Adviser of Global Macro Absolute Return Advantage Portfolio
Boston Management and Research
One Post Office Square
Boston, MA 02109
Investment Adviser and Administrator of Eaton Vance Global Macro Absolute Return Advantage Fund
Eaton Vance Management
One Post Office Square
Boston, MA 02109
Investment Sub-Adviser
Eaton Vance Advisers International Ltd.
125 Old Broad Street
London, EC2N 1AR
United Kingdom
Principal Underwriter*
Eaton Vance Distributors, Inc.
One Post Office Square
Boston, MA 02109
(617) 482-8260
Custodian
State Street Bank and Trust Company
One Congress Street, Suite 1
Boston, MA 02114-2016
Transfer Agent
BNY Mellon Investment Servicing (US) Inc.
Attn: Eaton Vance Funds
P.O. Box 534439
Pittsburgh, PA 15253-4439
(800) 262-1122
Fund Offices
One Post Office Square
Boston, MA 02109
* FINRA BrokerCheck. Investors may check the background of their Investment Professional by contacting the Financial Industry Regulatory Authority (FINRA). FINRA BrokerCheck is a free tool to help investors check the professional background of current and former FINRA-registered securities firms and brokers. FINRA BrokerCheck is available by calling 1-800-289-9999 and at www.FINRA.org. The FINRA BrokerCheck brochure describing this program is available to investors at www.FINRA.org.
Eaton Vance
Tax-Managed Global Dividend Income Fund
Semi-Annual Report
April 30, 2024
Commodity Futures Trading Commission Registration. The Commodity Futures Trading Commission (“CFTC”) has adopted regulations that subject registered investment companies and advisers to regulation by the CFTC if a fund invests more than a prescribed level of its assets in certain CFTC-regulated instruments (including futures, certain options and swap agreements) or markets itself as providing investment exposure to such instruments. The investment adviser has claimed an exclusion from the definition of “commodity pool operator” under the Commodity Exchange Act with respect to its management of the Fund. Accordingly, neither the Fund nor the adviser with respect to the operation of the Fund is subject to CFTC regulation. Because of its management of other strategies, the Fund's adviser is registered with the CFTC as a commodity pool operator. The adviser is also registered as a commodity trading advisor.
Fund shares are not insured by the FDIC and are not deposits or other obligations of, or guaranteed by, any depository institution. Shares are subject to investment risks, including possible loss of principal invested.
This report must be preceded or accompanied by a current summary prospectus or prospectus. Before investing, investors should consider carefully the investment objective, risks, and charges and expenses of a mutual fund. This and other important information is contained in the summary prospectus and prospectus, which can be obtained from a financial intermediary. Prospective investors should read the prospectus carefully before investing. For further information, please call 1-800-262-1122.
Semi-Annual Report April 30, 2024
Eaton Vance
Tax-Managed Global Dividend Income Fund
Eaton Vance
Tax-Managed Global Dividend Income Fund
April 30, 2024
Performance
Portfolio Manager(s) Christopher M. Dyer, CFA, of Eaton Vance Advisers International Ltd. and Derek J.V. DiGregorio of Eaton Vance Management
| % Average Annual Total Returns1,2 | Class
Inception Date | Performance
Inception Date | Six Months | One Year | Five Years | Ten Years |
| Class A at NAV | 05/30/2003 | 05/30/2003 | 19.73% | 19.23% | 10.45% | 8.00% |
| Class A with 5.25% Maximum Sales Charge | — | — | 13.42 | 12.96 | 9.27 | 7.42 |
| Class C at NAV | 05/30/2003 | 05/30/2003 | 19.34 | 18.40 | 9.62 | 7.35 |
| Class C with 1% Maximum Deferred Sales Charge | — | — | 18.34 | 17.40 | 9.62 | 7.35 |
| Class I at NAV | 08/27/2007 | 05/30/2003 | 19.94 | 19.59 | 10.73 | 8.27 |
|
| MSCI World Index | — | — | 20.29% | 18.39% | 10.44% | 8.86% |
| % After-Tax Returns with Maximum Sales Charge | Class
Inception Date | Performance
Inception Date | One Year | Five Years | Ten Years |
| Class A After Taxes on Distributions | 05/30/2003 | 05/30/2003 | 11.50% | 8.15% | 6.42% |
| Class A After Taxes on Distributions and Sale of Fund Shares | — | — | 8.14 | 7.23 | 5.81 |
| Class C After Taxes on Distributions | 05/30/2003 | 05/30/2003 | 16.12 | 8.69 | 6.49 |
| Class C After Taxes on Distributions and Sale of Fund Shares | — | — | 10.71 | 7.56 | 5.80 |
| Class I After Taxes on Distributions | 08/27/2007 | 05/30/2003 | 17.96 | 9.54 | 7.20 |
| Class I After Taxes on Distributions and Sale of Fund Shares | — | — | 12.11 | 8.42 | 6.51 |
| % Total Annual Operating Expense Ratios3 | Class A | Class C | Class I |
| | 1.20% | 1.95% | 0.95% |
See Endnotes and Additional Disclosures in this report.
Past performance is no guarantee of future results. Returns are historical and are calculated by determining the percentage change in net asset value (NAV) or offering price (as applicable) with all distributions reinvested. Furthermore, returns do not reflect the deduction of taxes that shareholders may have to pay on Fund distributions or upon the redemption of Fund shares. Investment return and principal value will fluctuate so that shares, when redeemed, may be worth more or less than their original cost. Performance for periods less than or equal to one year is cumulative. Performance is for the stated time period only; due to market volatility, current Fund performance may be lower or higher than the quoted return. For performance as of the most recent month-end, please refer to eatonvance.com.
Eaton Vance
Tax-Managed Global Dividend Income Fund
April 30, 2024
| Sector Allocation (% of total investments)1 |
| Country Allocation (% of total investments) |
| Top 10 Holdings (% of total investments)1 |
| Eli Lilly & Co. | 4.0% |
| Microsoft Corp. | 3.8 |
| Novo Nordisk AS, Class B | 3.4 |
| Apple, Inc. | 2.7 |
| Amazon.com, Inc. | 2.7 |
| ASML Holding NV | 2.6 |
| Alphabet, Inc., Class C | 2.5 |
| EOG Resources, Inc. | 2.5 |
| NVIDIA Corp. | 2.2 |
| Credit Agricole SA | 1.8 |
| Total | 28.2% |
Footnotes:
| 1 | Excludes cash and cash equivalents. |
Eaton Vance
Tax-Managed Global Dividend Income Fund
April 30, 2024
Endnotes and Additional Disclosures
| 1 | MSCI World Index is an unmanaged index of equity securities in the developed markets. MSCI indexes are net of foreign withholding taxes. Source: MSCI. MSCI data may not be reproduced or used for any other purpose. MSCI provides no warranties, has not prepared or approved this report, and has no liability hereunder. Unless otherwise stated, index returns do not reflect the effect of any applicable sales charges, commissions, expenses, taxes or leverage, as applicable. It is not possible to invest directly in an index. |
| 2 | Total Returns at NAV do not include applicable sales charges. If sales charges were deducted, the returns would be lower. Total Returns shown with maximum sales charge reflect the stated maximum sales charge. Unless otherwise stated, performance does not reflect the deduction of taxes on Fund distributions or redemptions of Fund shares. After-tax returns are calculated using certain assumptions, including using the highest historical individual federal income tax rates, and do not reflect the impact of state/local taxes. Actual after-tax returns depend on a shareholder’s tax situation and the actual characterization of distributions and may differ from those shown. After-tax returns are not relevant to shareholders who hold shares in tax-deferred accounts or shares held by nontaxable entities. Return After Taxes on Distributions may be the same as Return Before Taxes for the same period because no taxable distributions were made during that period. Return After Taxes on Distributions and Sale of Fund Shares may be greater than or equal to Return After Taxes on Distributions for the same period because of losses realized on the sale of Fund shares. The Fund’s after-tax returns also may reflect foreign tax credits passed by the Fund to its shareholders.Effective November 5, 2020, Class C shares automatically convert to Class A shares eight years after purchase. The average annual total returns listed for Class C reflect conversion to Class A shares after eight years. Prior to November 5, 2020, Class C shares automatically converted to Class A shares ten years after purchase. |
| 3 | Source: Fund prospectus. The expense ratios for the current reporting period can be found in the Financial Highlights section of this report. Performance reflects expenses waived and/or reimbursed, if applicable. Without such waivers and/or reimbursements, performance would have been lower. |
| | Fund profile subject to change due to active management. |
Eaton Vance
Tax-Managed Global Dividend Income Fund
April 30, 2024
Example
As a Fund shareholder, you incur two types of costs: (1) transaction costs, including sales charges (loads) on purchases; and (2) ongoing costs, including management fees; distribution and/or service fees; and other Fund expenses. This Example is intended to help you understand your ongoing costs (in dollars) of Fund investing and to compare these costs with the ongoing costs of investing in other mutual funds. The Example is based on an investment of $1,000 invested at the beginning of the period and held for the entire period (November 1, 2023 to April 30, 2024).
Actual Expenses
The first section of the table below provides information about actual account values and actual expenses. You may use the information in this section, together with the amount you invested, to estimate the expenses that you paid over the period. Simply divide your account value by $1,000 (for example, an $8,600 account value divided by $1,000 = 8.6), then multiply the result by the number in the first section under the heading entitled “Expenses Paid During Period” to estimate the expenses you paid on your account during this period.
Hypothetical Example for Comparison Purposes
The second section of the table below provides information about hypothetical account values and hypothetical expenses based on the actual Fund expense ratio and an assumed rate of return of 5% per year (before expenses), which is not the actual Fund return. The hypothetical account values and expenses may not be used to estimate the actual ending account balance or expenses you paid for the period. You may use this information to compare the ongoing costs of investing in your Fund and other funds. To do so, compare this 5% hypothetical example with the 5% hypothetical examples that appear in the shareholder reports of the other funds.
Please note that the expenses shown in the table are meant to highlight your ongoing costs only and do not reflect any transactional costs, such as sales charges (loads). Therefore, the second section of the table is useful in comparing ongoing costs only, and will not help you determine the relative total costs of owning different funds. In addition, if these transactional costs were included, your costs would be higher.
| | Beginning
Account Value
(11/1/23) | Ending
Account Value
(4/30/24) | Expenses Paid
During Period*
(11/1/23 – 4/30/24) | Annualized
Expense
Ratio |
| Actual | | | | |
| Class A | $1,000.00 | $1,197.30 | $ 6.45 | 1.18% |
| Class C | $1,000.00 | $1,193.40 | $10.53 | 1.93% |
| Class I | $1,000.00 | $1,199.40 | $ 5.09 | 0.93% |
| |
| Hypothetical | | | | |
| (5% return per year before expenses) | | | | |
| Class A | $1,000.00 | $1,019.00 | $ 5.92 | 1.18% |
| Class C | $1,000.00 | $1,015.27 | $ 9.67 | 1.93% |
| Class I | $1,000.00 | $1,020.24 | $ 4.67 | 0.93% |
| * | Expenses are equal to the Fund's annualized expense ratio for the indicated Class, multiplied by the average account value over the period, multiplied by 182/366 (to reflect the one-half year period). The Example assumes that the $1,000 was invested at the net asset value per share determined at the close of business on October 31, 2023. |
Eaton Vance
Tax-Managed Global Dividend Income Fund
April 30, 2024
Portfolio of Investments (Unaudited)
| Security | Shares | Value |
| Aerospace & Defense — 1.3% |
| Safran SA | | 36,910 | $ 8,003,272 |
| | | | $ 8,003,272 |
| Air Freight & Logistics — 0.2% |
| GXO Logistics, Inc.(1) | | 28,827 | $ 1,431,549 |
| | | | $ 1,431,549 |
| Automobiles — 3.7% |
| Bayerische Motoren Werke AG | | 68,083 | $ 7,417,594 |
| Mercedes-Benz Group AG | | 141,613 | 10,711,733 |
| Stellantis NV | | 186,707 | 4,131,172 |
| Tesla, Inc.(1) | | 2,814 | 515,750 |
| | | | $ 22,776,249 |
| Banks — 12.4% |
| Banco Bilbao Vizcaya Argentaria SA | | 122,641 | $ 1,326,236 |
| Banco Santander SA | | 681,963 | 3,318,181 |
| Barclays PLC | | 776,597 | 1,958,028 |
| BNP Paribas SA | | 114,723 | 8,255,681 |
| CaixaBank SA | | 685,871 | 3,616,980 |
| Citigroup, Inc. | | 54,469 | 3,340,584 |
| Credit Agricole SA | | 703,385 | 10,883,641 |
| DNB Bank ASA | | 347,351 | 6,054,031 |
| HDFC Bank Ltd. | | 62,644 | 1,134,171 |
| HSBC Holdings PLC | | 124,101 | 1,075,701 |
| ING Groep NV | | 472,429 | 7,469,228 |
| KBC Group NV | | 31,959 | 2,374,047 |
| Lloyds Banking Group PLC | | 4,208,483 | 2,716,082 |
| Nordea Bank Abp | | 103,993 | 1,218,617 |
| Societe Generale SA | | 52,679 | 1,419,438 |
| Svenska Handelsbanken AB, Class A | | 106,167 | 910,416 |
| Toronto-Dominion Bank | | 14,694 | 871,724 |
| Truist Financial Corp. | | 72,743 | 2,731,500 |
| UniCredit SpA | | 228,059 | 8,370,761 |
| Wells Fargo & Co.(2) | | 134,293 | 7,966,261 |
| | | | $ 77,011,308 |
| Beverages — 0.3% |
| Diageo PLC | | 25,056 | $ 865,927 |
| Pernod Ricard SA | | 5,458 | 825,480 |
| | | | $ 1,691,407 |
| Security | Shares | Value |
| Biotechnology — 0.2% |
| CSL Ltd. | | 7,939 | $ 1,410,570 |
| | | | $ 1,410,570 |
| Broadline Retail — 2.7% |
| Amazon.com, Inc.(1) | | 94,906 | $ 16,608,550 |
| | | | $ 16,608,550 |
| Capital Markets — 1.3% |
| Bank of New York Mellon Corp. | | 29,820 | $ 1,684,532 |
| Intercontinental Exchange, Inc. | | 24,326 | 3,132,215 |
| Julius Baer Group Ltd. | | 57,310 | 3,075,160 |
| | | | $ 7,891,907 |
| Chemicals — 0.2% |
| Sika AG | | 5,209 | $ 1,481,759 |
| | | | $ 1,481,759 |
| Commercial Services & Supplies — 0.4% |
| Waste Management, Inc. | | 12,781 | $ 2,658,704 |
| | | | $ 2,658,704 |
| Construction & Engineering — 1.2% |
| Bouygues SA | | 201,027 | $ 7,408,908 |
| | | | $ 7,408,908 |
| Construction Materials — 0.2% |
| CRH PLC | | 16,187 | $ 1,253,198 |
| | | | $ 1,253,198 |
| Consumer Finance — 1.1% |
| Capital One Financial Corp. | | 20,435 | $ 2,930,992 |
| Discover Financial Services | | 28,386 | 3,597,358 |
| | | | $ 6,528,350 |
| Consumer Staples Distribution & Retail — 1.5% |
| Carrefour SA | | 409,060 | $ 6,881,708 |
| Dollar Tree, Inc.(1) | | 21,179 | 2,504,417 |
| | | | $ 9,386,125 |
| Diversified Telecommunication Services — 0.5% |
| Deutsche Telekom AG | | 51,645 | $ 1,182,958 |
| Zegona Communications PLC(1) | | 754,249 | 2,158,960 |
| | | | $ 3,341,918 |
6
See Notes to Financial Statements.
Eaton Vance
Tax-Managed Global Dividend Income Fund
April 30, 2024
Portfolio of Investments (Unaudited) — continued
| Security | Shares | Value |
| Electric Utilities — 0.4% |
| Iberdrola SA | | 114,089 | $ 1,398,911 |
| NextEra Energy, Inc. | | 15,758 | 1,055,313 |
| | | | $ 2,454,224 |
| Electrical Equipment — 2.1% |
| AMETEK, Inc. | | 26,115 | $ 4,561,246 |
| Schneider Electric SE | | 37,208 | 8,483,922 |
| | | | $ 13,045,168 |
| Electronic Equipment, Instruments & Components — 1.6% |
| CDW Corp. | | 30,447 | $ 7,363,911 |
| Halma PLC | | 30,446 | 834,429 |
| Keyence Corp. | | 4,038 | 1,775,790 |
| | | | $ 9,974,130 |
| Entertainment — 1.1% |
| Walt Disney Co. | | 58,137 | $ 6,459,021 |
| | | | $ 6,459,021 |
| Financial Services — 2.1% |
| Berkshire Hathaway, Inc., Class B(1) | | 20,400 | $ 8,093,292 |
| Fidelity National Information Services, Inc. | | 29,780 | 2,022,658 |
| Visa, Inc., Class A | | 10,686 | 2,870,366 |
| | | | $ 12,986,316 |
| Food Products — 0.4% |
| Nestle SA | | 24,641 | $ 2,473,960 |
| | | | $ 2,473,960 |
| Ground Transportation — 0.4% |
| Union Pacific Corp. | | 10,772 | $ 2,554,687 |
| | | | $ 2,554,687 |
| Health Care Equipment & Supplies — 2.4% |
| Alcon, Inc. | | 11,505 | $ 882,166 |
| Boston Scientific Corp.(1) | | 108,534 | 7,800,339 |
| Intuitive Surgical, Inc.(1) | | 10,982 | 4,070,149 |
| Straumann Holding AG | | 17,947 | 2,385,830 |
| | | | $ 15,138,484 |
| Health Care Providers & Services — 1.5% |
| Elevance Health, Inc. | | 15,380 | $ 8,129,561 |
| UnitedHealth Group, Inc. | | 1,792 | 866,790 |
| | | | $ 8,996,351 |
| Security | Shares | Value |
| Health Care REITs — 0.1% |
| Healthpeak Properties, Inc. | | 41,402 | $ 770,491 |
| | | | $ 770,491 |
| Hotels, Restaurants & Leisure — 1.7% |
| Amadeus IT Group SA | | 22,958 | $ 1,457,234 |
| Compass Group PLC | | 135,838 | 3,778,159 |
| InterContinental Hotels Group PLC | | 52,967 | 5,166,080 |
| | | | $ 10,401,473 |
| Household Products — 0.2% |
| Reckitt Benckiser Group PLC | | 24,476 | $ 1,368,380 |
| | | | $ 1,368,380 |
| Industrial Conglomerates — 1.5% |
| Siemens AG | | 48,915 | $ 9,163,418 |
| | | | $ 9,163,418 |
| Insurance — 9.2% |
| AIA Group Ltd. | | 222,170 | $ 1,627,251 |
| Allianz SE | | 22,213 | 6,303,717 |
| Allstate Corp. | | 19,697 | 3,349,672 |
| Arch Capital Group Ltd.(1) | | 8,222 | 769,086 |
| Assicurazioni Generali SpA | | 234,503 | 5,717,755 |
| Assurant, Inc. | | 18,408 | 3,210,355 |
| AXA SA | | 86,307 | 2,982,043 |
| Baloise Holding AG | | 24,430 | 3,691,687 |
| NN Group NV | | 73,829 | 3,405,797 |
| RenaissanceRe Holdings Ltd. | | 12,358 | 2,709,491 |
| SCOR SE | | 101,473 | 3,310,835 |
| Swiss Life Holding AG | | 9,591 | 6,471,581 |
| Swiss Re AG | | 79,663 | 8,659,795 |
| Zurich Insurance Group AG | | 10,234 | 4,953,730 |
| | | | $ 57,162,795 |
| Interactive Media & Services — 3.8% |
| Alphabet, Inc., Class C(1) | | 94,730 | $ 15,596,347 |
| Meta Platforms, Inc., Class A(2) | | 18,723 | 8,054,073 |
| | | | $ 23,650,420 |
| IT Services — 0.6% |
| Accenture PLC, Class A | | 12,861 | $ 3,870,003 |
| | | | $ 3,870,003 |
| Life Sciences Tools & Services — 0.6% |
| Danaher Corp. | | 11,739 | $ 2,895,072 |
7
See Notes to Financial Statements.
Eaton Vance
Tax-Managed Global Dividend Income Fund
April 30, 2024
Portfolio of Investments (Unaudited) — continued
| Security | Shares | Value |
| Life Sciences Tools & Services (continued) |
| Sartorius AG, PFC Shares | | 3,049 | $ 911,517 |
| | | | $ 3,806,589 |
| Machinery — 1.4% |
| Ingersoll Rand, Inc. | | 90,452 | $ 8,440,981 |
| Sandvik AB | | 20,700 | 412,624 |
| | | | $ 8,853,605 |
| Metals & Mining — 2.4% |
| Anglo American PLC | | 23,636 | $ 772,364 |
| Rio Tinto Ltd. | | 52,508 | 4,369,943 |
| Rio Tinto PLC | | 58,155 | 3,934,810 |
| SSAB AB, Class B | | 1,040,833 | 5,824,041 |
| | | | $ 14,901,158 |
| Multi-Utilities — 2.6% |
| A2A SpA | | 2,567,966 | $ 5,064,420 |
| CMS Energy Corp. | | 7,943 | 481,425 |
| Engie SA(1) | | 593,328 | 10,300,536 |
| | | | $ 15,846,381 |
| Oil, Gas & Consumable Fuels — 3.9% |
| Chevron Corp. | | 37,727 | $ 6,084,234 |
| ConocoPhillips | | 20,542 | 2,580,486 |
| EOG Resources, Inc. | | 114,956 | 15,189,136 |
| | | | $ 23,853,856 |
| Pharmaceuticals — 8.5% |
| AstraZeneca PLC | | 16,755 | $ 2,534,175 |
| Eli Lilly & Co. | | 31,227 | 24,391,410 |
| Novo Nordisk AS, Class B | | 164,839 | 21,139,315 |
| Sanofi SA | | 30,085 | 2,972,189 |
| Zoetis, Inc. | | 12,418 | 1,977,442 |
| | | | $ 53,014,531 |
| Professional Services — 2.4% |
| Adecco Group AG | | 137,014 | $ 4,793,087 |
| Randstad NV | | 14,793 | 741,883 |
| Recruit Holdings Co. Ltd. | | 57,213 | 2,464,013 |
| RELX PLC | | 142,745 | 5,864,946 |
| Verisk Analytics, Inc. | | 4,260 | 928,509 |
| | | | $ 14,792,438 |
| Semiconductors & Semiconductor Equipment — 7.5% |
| ASML Holding NV | | 18,467 | $ 16,084,992 |
| Security | Shares | Value |
| Semiconductors & Semiconductor Equipment (continued) |
| Infineon Technologies AG | | 63,366 | $ 2,198,993 |
| Micron Technology, Inc. | | 65,353 | 7,382,275 |
| NVIDIA Corp. | | 15,948 | 13,779,391 |
| Taiwan Semiconductor Manufacturing Co. Ltd. ADR | | 52,860 | 7,259,792 |
| | | | $ 46,705,443 |
| Software — 5.9% |
| Adobe, Inc.(1) | | 6,702 | $ 3,101,887 |
| Dassault Systemes SE | | 62,630 | 2,458,348 |
| Intuit, Inc. | | 12,023 | 7,521,829 |
| Microsoft Corp.(2) | | 60,019 | 23,367,197 |
| | | | $ 36,449,261 |
| Specialty Retail — 2.0% |
| Lowe's Cos., Inc. | | 17,778 | $ 4,053,206 |
| TJX Cos., Inc. | | 90,804 | 8,543,749 |
| | | | $ 12,596,955 |
| Technology Hardware, Storage & Peripherals — 2.7% |
| Apple, Inc. | | 98,553 | $ 16,786,532 |
| | | | $ 16,786,532 |
| Textiles, Apparel & Luxury Goods — 0.8% |
| LVMH Moet Hennessy Louis Vuitton SE | | 6,332 | $ 5,201,333 |
| | | | $ 5,201,333 |
| Trading Companies & Distributors — 1.8% |
| Ashtead Group PLC | | 33,715 | $ 2,448,110 |
| IMCD NV(1) | | 23,115 | 3,487,466 |
| Rexel SA | | 206,247 | 5,345,890 |
| | | | $ 11,281,466 |
Total Common Stocks
(identified cost $390,386,251) | | | $613,442,643 |
8
See Notes to Financial Statements.
Eaton Vance
Tax-Managed Global Dividend Income Fund
April 30, 2024
Portfolio of Investments (Unaudited) — continued
| Short-Term Investments — 0.4% |
| Security | Shares | Value |
| Morgan Stanley Institutional Liquidity Funds - Government Portfolio, Institutional Class, 5.22%(3) | | 2,759,669 | $ 2,759,669 |
Total Short-Term Investments
(identified cost $2,759,669) | | | $ 2,759,669 |
Total Investments — 99.2%
(identified cost $393,145,920) | | | $616,202,312 |
| Other Assets, Less Liabilities — 0.8% | | | $ 4,986,219 |
| Net Assets — 100.0% | | | $621,188,531 |
| The percentage shown for each investment category in the Portfolio of Investments is based on net assets. |
| (1) | Non-income producing security. |
| (2) | Security (or a portion thereof) has been pledged to cover margin requirements on open futures contracts. |
| (3) | May be deemed to be an affiliated investment company. The rate shown is the annualized seven-day yield as of April 30, 2024. |
| Country Concentration of Portfolio |
| Country | Percentage of
Total Investments | Value |
| United States | 46.6% | $286,964,199 |
| France | 13.7 | 84,733,224 |
| Switzerland | 6.3 | 38,868,755 |
| Germany | 6.1 | 37,889,930 |
| United Kingdom | 5.8 | 35,476,151 |
| Netherlands | 5.1 | 31,189,366 |
| Italy | 3.8 | 23,284,108 |
| Denmark | 3.4 | 21,139,315 |
| Spain | 1.8 | 11,117,542 |
| Taiwan | 1.2 | 7,259,792 |
| Sweden | 1.2 | 7,147,081 |
| Norway | 1.0 | 6,054,031 |
| Australia | 0.9 | 5,780,513 |
| Ireland | 0.8 | 5,123,201 |
| Japan | 0.7 | 4,239,803 |
| Bermuda | 0.4 | 2,709,491 |
| Belgium | 0.4 | 2,374,047 |
| Hong Kong | 0.3 | 1,627,251 |
| Finland | 0.2 | 1,218,617 |
| India | 0.2 | 1,134,171 |
| Canada | 0.1 | 871,724 |
| Total Investments | 100.0% | $616,202,312 |
9
See Notes to Financial Statements.
Eaton Vance
Tax-Managed Global Dividend Income Fund
April 30, 2024
Portfolio of Investments (Unaudited) — continued
| Forward Foreign Currency Exchange Contracts (OTC) |
| Currency Purchased | Currency Sold | Counterparty | Settlement
Date | Unrealized
Appreciation | Unrealized
(Depreciation) |
| USD | 62,131,990 | EUR | 58,000,000 | State Street Bank and Trust Company | 5/31/24 | $ 165,416 | $ — |
| | | | | | | $165,416 | $ — |
| Futures Contracts |
| Description | Number of
Contracts | Position | Expiration
Date | Notional
Amount | Value/Unrealized
Appreciation
(Depreciation) |
| Equity Futures | | | | | |
| E-Mini S&P 500 Index | 311 | Long | 6/21/24 | $ 78,791,850 | $ (1,807,332) |
| STOXX 600 Banks Index | (2,841) | Short | 6/21/24 | (29,402,013) | (3,021,942) |
| STOXX 600 Insurance Index | (1,062) | Short | 6/21/24 | (20,394,939) | (101,671) |
| STOXX Europe 600 Index | (1,112) | Short | 6/21/24 | (29,852,118) | (163,905) |
| | | | | | $(5,094,850) |
| Abbreviations: |
| ADR | – American Depositary Receipt |
| OTC | – Over-the-counter |
| PFC Shares | – Preference Shares |
| REITs | – Real Estate Investment Trusts |
| Currency Abbreviations: |
| EUR | – Euro |
| USD | – United States Dollar |
10
See Notes to Financial Statements.
Eaton Vance
Tax-Managed Global Dividend Income Fund
April 30, 2024
Statement of Assets and Liabilities (Unaudited)
| | April 30, 2024 |
| Assets | |
| Unaffiliated investments, at value (identified cost $390,386,251) | $ 613,442,643 |
| Affiliated investments, at value (identified cost $2,759,669) | 2,759,669 |
| Foreign currency, at value (identified cost $10,779) | 10,706 |
| Dividends receivable | 2,714,123 |
| Dividends receivable from affiliated investments | 12,672 |
| Receivable for investments sold | 19,636,049 |
| Receivable for Fund shares sold | 378,052 |
| Receivable for open forward foreign currency exchange contracts | 165,416 |
| Tax reclaims receivable | 4,045,495 |
| Trustees' deferred compensation plan | 157,866 |
| Total assets | $643,322,691 |
| Liabilities | |
| Payable for investments purchased | $ 20,021,610 |
| Payable for Fund shares redeemed | 381,482 |
| Payable for variation margin on open futures contracts | 687,563 |
| Due to custodian | 79,455 |
| Payable to affiliates: | |
| Investment adviser fee | 333,880 |
| Administration fee | 77,754 |
| Distribution and service fees | 100,456 |
| Trustees' deferred compensation plan | 157,866 |
| Accrued expenses | 294,094 |
| Total liabilities | $ 22,134,160 |
| Net Assets | $621,188,531 |
| Sources of Net Assets | |
| Paid-in capital | $ 414,625,192 |
| Distributable earnings | 206,563,339 |
| Net Assets | $621,188,531 |
| Class A Shares | |
| Net Assets | $ 412,716,232 |
| Shares Outstanding | 25,117,857 |
Net Asset Value and Redemption Price Per Share
(net assets ÷ shares of beneficial interest outstanding) | $ 16.43 |
Maximum Offering Price Per Share
(100 ÷ 94.75 of net asset value per share) | $ 17.34 |
| Class C Shares | |
| Net Assets | $ 16,751,373 |
| Shares Outstanding | 1,022,078 |
Net Asset Value and Offering Price Per Share*
(net assets ÷ shares of beneficial interest outstanding) | $ 16.39 |
| Class I Shares | |
| Net Assets | $ 191,720,926 |
| Shares Outstanding | 11,655,325 |
Net Asset Value, Offering Price and Redemption Price Per Share
(net assets ÷ shares of beneficial interest outstanding) | $ 16.45 |
| On sales of $50,000 or more, the offering price of Class A shares is reduced. |
| * | Redemption price per share is equal to the net asset value less any applicable contingent deferred sales charge. |
11
See Notes to Financial Statements.
Eaton Vance
Tax-Managed Global Dividend Income Fund
April 30, 2024
Statement of Operations (Unaudited)
| | Six Months Ended |
| | April 30, 2024 |
| Investment Income | |
| Dividend income (net of foreign taxes withheld of $2,189,276) | $ 15,791,575 |
| Dividend income from affiliated investments | 37,207 |
| Interest income | 24,897 |
| Other income | 18,759 |
| Total investment income | $ 15,872,438 |
| Expenses | |
| Investment adviser fee | $ 1,956,072 |
| Administration fee | 454,539 |
| Distribution and service fees: | |
| Class A | 510,405 |
| Class C | 86,553 |
| Trustees’ fees and expenses | 19,473 |
| Custodian fee | 111,267 |
| Transfer and dividend disbursing agent fees | 129,909 |
| Legal and accounting services | 40,690 |
| Printing and postage | 26,936 |
| Registration fees | 25,831 |
| Miscellaneous | 71,020 |
| Total expenses | $ 3,432,695 |
| Deduct: | |
| Waiver and/or reimbursement of expenses by affiliates | $ 1,150 |
| Total expense reductions | $ 1,150 |
| Net expenses | $ 3,431,545 |
| Net investment income | $ 12,440,893 |
| Realized and Unrealized Gain (Loss) | |
| Net realized gain (loss): | |
| Investment transactions (net of foreign capital gains taxes of $60,973) | $ 16,711,990 |
| Payment by affiliate for realized loss on disposal of investment not meeting investment guidelines | 20,787 |
| Futures contracts | (2,301,416) |
| Foreign currency transactions | (148,797) |
| Forward foreign currency exchange contracts | 3,617,050 |
| Net realized gain | $ 17,899,614 |
| Change in unrealized appreciation (depreciation): | |
| Investments (including net decrease in accrued foreign capital gains taxes of $22,132) | $ 79,987,484 |
| Futures contracts | (5,094,850) |
| Foreign currency | 88,760 |
| Forward foreign currency exchange contracts | 165,416 |
| Net change in unrealized appreciation (depreciation) | $ 75,146,810 |
| Net realized and unrealized gain | $ 93,046,424 |
| Net increase in net assets from operations | $105,487,317 |
12
See Notes to Financial Statements.
Eaton Vance
Tax-Managed Global Dividend Income Fund
April 30, 2024
Statements of Changes in Net Assets
| | Six Months Ended
April 30, 2024
(Unaudited) | Year Ended
October 31, 2023 |
| Increase (Decrease) in Net Assets | | |
| From operations: | | |
| Net investment income | $ 12,440,893 | $ 21,433,172 |
| Net realized gain | 17,899,614 | 13,357,325 |
| Net change in unrealized appreciation (depreciation) | 75,146,810 | 32,279,641 |
| Net increase in net assets from operations | $105,487,317 | $ 67,070,138 |
| Distributions to shareholders: | | |
| Class A | $ (8,796,179) | $ (19,402,761) |
| Class C | (310,146) | (802,494) |
| Class I | (4,116,874) | (8,120,405) |
| Total distributions to shareholders | $ (13,223,199) | $ (28,325,660) |
| Transactions in shares of beneficial interest: | | |
| Class A | $ (22,521,795) | $ (11,380,258) |
| Class C | (1,931,337) | (5,611,408) |
| Class I | 10,487,447 | 2,668,008 |
| Net decrease in net assets from Fund share transactions | $ (13,965,685) | $ (14,323,658) |
| Net increase in net assets | $ 78,298,433 | $ 24,420,820 |
| Net Assets | | |
| At beginning of period | $ 542,890,098 | $ 518,469,278 |
| At end of period | $621,188,531 | $542,890,098 |
13
See Notes to Financial Statements.
Eaton Vance
Tax-Managed Global Dividend Income Fund
April 30, 2024
| | Class A |
| | Six Months Ended
April 30, 2024
(Unaudited) | Year Ended October 31, |
| | 2023 | 2022 | 2021 | 2020 | 2019 |
| Net asset value — Beginning of period | $ 14.020 | $ 13.040 | $ 17.640 | $ 12.690 | $ 12.730 | $ 11.830 |
| Income (Loss) From Operations | | | | | | |
| Net investment income(1) | $ 0.321 | $ 0.545 | $ 0.743 | $ 0.390 | $ 0.392 | $ 0.494 |
| Net realized and unrealized gain (loss) | 2.434 | 1.156 | (4.024) | 4.992 | — | 0.838 |
| Total income (loss) from operations | $ 2.755 | $ 1.701 | $ (3.281) | $ 5.382 | $ 0.392 | $ 1.332 |
| Less Distributions | | | | | | |
| From net investment income | $ (0.345) | $ (0.721) | $ (0.644) | $ (0.432) | $ (0.432) | $ (0.432) |
| From net realized gain | — | — | (0.675) | — | — | — |
| Total distributions | $ (0.345) | $ (0.721) | $ (1.319) | $ (0.432) | $ (0.432) | $ (0.432) |
| Net asset value — End of period | $ 16.430 | $ 14.020 | $ 13.040 | $ 17.640 | $ 12.690 | $ 12.730 |
| Total Return(2) | 19.73% (3) | 13.10% | (19.65)% | 42.80% | 3.20% | 11.52% |
| Ratios/Supplemental Data | | | | | | |
| Net assets, end of period (000’s omitted) | $412,716 | $372,352 | $356,746 | $494,280 | $357,048 | $383,956 |
| Ratios (as a percentage of average daily net assets): | | | | | | |
| Expenses | 1.18% (4)(5) | 1.20% (5) | 1.18% (5) | 1.16% | 1.20% | 1.22% |
| Net investment income | 4.01% (4) | 3.80% | 4.97% | 2.41% | 3.09% | 4.08% |
| Portfolio Turnover | 63% (3) | 107% | 99% | 56% | 173% | 128% |
| (1) | Computed using average shares outstanding. |
| (2) | Returns are historical and are calculated by determining the percentage change in net asset value with all distributions reinvested and do not reflect the effect of sales charges. |
| (3) | Not annualized. |
| (4) | Annualized. |
| (5) | Includes a reduction by the investment adviser of a portion of its adviser fee due to the Fund's investment in the Liquidity Fund (equal to less than 0.005% of average daily net assets for the six months ended April 30, 2024 and the years ended October 31, 2023 and 2022). |
14
See Notes to Financial Statements.
Eaton Vance
Tax-Managed Global Dividend Income Fund
April 30, 2024
Financial Highlights — continued
| | Class C |
| | Six Months Ended
April 30, 2024
(Unaudited) | Year Ended October 31, |
| | 2023 | 2022 | 2021 | 2020 | 2019 |
| Net asset value — Beginning of period | $ 13.980 | $ 13.010 | $ 17.590 | $ 12.650 | $ 12.700 | $ 11.800 |
| Income (Loss) From Operations | | | | | | |
| Net investment income(1) | $ 0.255 | $ 0.421 | $ 0.612 | $ 0.248 | $ 0.300 | $ 0.312 |
| Net realized and unrealized gain (loss) | 2.440 | 1.161 | (3.990) | 5.003 | (0.014) | 0.927 |
| Total income (loss) from operations | $ 2.695 | $ 1.582 | $ (3.378) | $ 5.251 | $ 0.286 | $ 1.239 |
| Less Distributions | | | | | | |
| From net investment income | $ (0.285) | $ (0.612) | $ (0.527) | $ (0.311) | $ (0.336) | $ (0.339) |
| From net realized gain | — | — | (0.675) | — | — | — |
| Total distributions | $ (0.285) | $ (0.612) | $ (1.202) | $ (0.311) | $ (0.336) | $ (0.339) |
| Net asset value — End of period | $16.390 | $13.980 | $13.010 | $17.590 | $12.650 | $12.700 |
| Total Return(2) | 19.34% (3) | 12.20% | (20.22)% | 41.79% | 2.34% | 10.70% |
| Ratios/Supplemental Data | | | | | | |
| Net assets, end of period (000’s omitted) | $ 16,751 | $ 15,979 | $ 20,044 | $ 31,961 | $ 42,936 | $ 72,014 |
| Ratios (as a percentage of average daily net assets): | | | | | | |
| Expenses | 1.93% (4)(5) | 1.95% (5) | 1.94% (5) | 1.92% | 1.96% | 1.97% |
| Net investment income | 3.20% (4) | 2.96% | 4.08% | 1.55% | 2.38% | 2.62% |
| Portfolio Turnover | 63% (3) | 107% | 99% | 56% | 173% | 128% |
| (1) | Computed using average shares outstanding. |
| (2) | Returns are historical and are calculated by determining the percentage change in net asset value with all distributions reinvested and do not reflect the effect of sales charges. |
| (3) | Not annualized. |
| (4) | Annualized. |
| (5) | Includes a reduction by the investment adviser of a portion of its adviser fee due to the Fund's investment in the Liquidity Fund (equal to less than 0.005% of average daily net assets for the six months ended April 30, 2024 and the years ended October 31, 2023 and 2022). |
15
See Notes to Financial Statements.
Eaton Vance
Tax-Managed Global Dividend Income Fund
April 30, 2024
Financial Highlights — continued
| | Class I |
| | Six Months Ended
April 30, 2024
(Unaudited) | Year Ended October 31, |
| | 2023 | 2022 | 2021 | 2020 | 2019 |
| Net asset value — Beginning of period | $ 14.030 | $ 13.050 | $ 17.650 | $ 12.700 | $ 12.750 | $ 11.850 |
| Income (Loss) From Operations | | | | | | |
| Net investment income(1) | $ 0.352 | $ 0.577 | $ 0.788 | $ 0.424 | $ 0.424 | $ 0.503 |
| Net realized and unrealized gain (loss) | 2.433 | 1.160 | (4.032) | 4.998 | (0.010) | 0.859 |
| Total income (loss) from operations | $ 2.785 | $ 1.737 | $ (3.244) | $ 5.422 | $ 0.414 | $ 1.362 |
| Less Distributions | | | | | | |
| From net investment income | $ (0.365) | $ (0.757) | $ (0.681) | $ (0.472) | $ (0.464) | $ (0.462) |
| From net realized gain | — | — | (0.675) | — | — | — |
| Total distributions | $ (0.365) | $ (0.757) | $ (1.356) | $ (0.472) | $ (0.464) | $ (0.462) |
| Net asset value — End of period | $ 16.450 | $ 14.030 | $ 13.050 | $ 17.650 | $ 12.700 | $ 12.750 |
| Total Return(2) | 19.94% (3) | 13.38% | (19.44)% | 43.12% | 3.38% | 11.78% |
| Ratios/Supplemental Data | | | | | | |
| Net assets, end of period (000’s omitted) | $191,721 | $154,559 | $141,680 | $188,245 | $151,266 | $177,646 |
| Ratios (as a percentage of average daily net assets): | | | | | | |
| Expenses | 0.93% (4)(5) | 0.95% (5) | 0.93% (5) | 0.91% | 0.95% | 0.97% |
| Net investment income | 4.39% (4) | 4.03% | 5.26% | 2.63% | 3.34% | 4.16% |
| Portfolio Turnover | 63% (3) | 107% | 99% | 56% | 173% | 128% |
| (1) | Computed using average shares outstanding. |
| (2) | Returns are historical and are calculated by determining the percentage change in net asset value with all distributions reinvested. |
| (3) | Not annualized. |
| (4) | Annualized. |
| (5) | Includes a reduction by the investment adviser of a portion of its adviser fee due to the Fund's investment in the Liquidity Fund (equal to less than 0.005% of average daily net assets for the six months ended April 30, 2024 and the years ended October 31, 2023 and 2022). |
16
See Notes to Financial Statements.
Eaton Vance
Tax-Managed Global Dividend Income Fund
April 30, 2024
Notes to Financial Statements (Unaudited)
1 Significant Accounting Policies
Eaton Vance Tax-Managed Global Dividend Income Fund (the Fund) is a diversified series of Eaton Vance Mutual Funds Trust (the Trust). The Trust is a Massachusetts business trust registered under the Investment Company Act of 1940, as amended (the 1940 Act), as an open-end management investment company. The Fund’s investment objective is to achieve after-tax total return for its shareholders. The Fund offers three classes of shares. Class A shares are generally sold subject to a sales charge imposed at time of purchase. Class C shares are sold at net asset value and are generally subject to a contingent deferred sales charge (see Note 5). Effective November 5, 2020, Class C shares automatically convert to Class A shares eight years after their purchase as described in the Fund’s prospectus. Class I shares are sold at net asset value and are not subject to a sales charge. Each class represents a pro rata interest in the Fund, but votes separately on class-specific matters and (as noted below) is subject to different expenses. Realized and unrealized gains and losses and net investment income and losses, other than class-specific expenses, are allocated daily to each class of shares based on the relative net assets of each class to the total net assets of the Fund. Each class of shares differs in its distribution plan and certain other class-specific expenses.
The following is a summary of significant accounting policies of the Fund. The policies are in conformity with accounting principles generally accepted in the United States of America (U.S. GAAP). The Fund is an investment company and follows accounting and reporting guidance in the Financial Accounting Standards Board (FASB) Accounting Standards Codification Topic 946.
A Investment Valuation—The following methodologies are used to determine the market value or fair value of investments.
Equity Securities. Equity securities listed on a U.S. securities exchange generally are valued at the last sale or closing price on the day of valuation or, if no sales took place on such date, at the mean between the closing bid and ask prices on the exchange where such securities are principally traded. Equity securities listed on the NASDAQ National Market System are valued at the NASDAQ official closing price. Unlisted or listed securities for which closing sales prices or closing quotations are not available are valued at the mean between the latest available bid and ask prices or, in the case of preferred equity securities that are not listed or traded in the over-the-counter market, by a third party pricing service that uses various techniques that consider factors including, but not limited to, prices or yields of securities with similar characteristics, benchmark yields, broker/dealer quotes, quotes of underlying common stock, issuer spreads, as well as industry and economic events.
Debt Obligations. Debt obligations are generally valued on the basis of valuations provided by third party pricing services, as derived from such services’ pricing models. Inputs to the models may include, but are not limited to, reported trades, executable bid and ask prices, broker/dealer quotations, prices or yields of securities with similar characteristics, interest rates, anticipated prepayments, benchmark curves or information pertaining to the issuer, as well as industry and economic events. The pricing services may use a matrix approach, which considers information regarding securities with similar characteristics to determine the valuation for a security. Short-term debt obligations purchased with a remaining maturity of sixty days or less for which a valuation from a third party pricing service is not readily available may be valued at amortized cost, which approximates fair value.
Derivatives. Futures contracts are valued at the closing settlement price established by the board of trade or exchange on which they are traded, with adjustments for fair valuation for certain foreign futures contracts as described below. Forward foreign currency exchange contracts are generally valued at the mean of the average bid and average ask prices that are reported by currency dealers to a third party pricing service at the valuation time. Such third party pricing service valuations are supplied for specific settlement periods and the Fund’s forward foreign currency exchange contracts are valued at an interpolated rate between the closest preceding and subsequent settlement period reported by the third party pricing service.
Foreign Securities, Futures Contracts and Currencies. Foreign securities, futures contracts and currencies are valued in U.S. dollars, based on foreign currency exchange rate quotations supplied by a third party pricing service. The pricing service uses a proprietary model to determine the exchange rate. Inputs to the model include reported trades and implied bid/ask spreads. The daily valuation of exchange-traded foreign securities and certain exchange-traded foreign futures contracts generally is determined as of the close of trading on the principal exchange on which such securities and contracts trade. Events occurring after the close of trading on foreign exchanges may result in adjustments to the valuation of foreign securities and certain foreign futures contracts to more accurately reflect their fair value as of the close of regular trading on the New York Stock Exchange. When valuing foreign equity securities and foreign futures contracts that meet certain criteria, the Fund’s Trustees have approved the use of a fair value service that values such securities and foreign futures contracts to reflect market trading that occurs after the close of the applicable foreign markets of comparable securities or other instruments that have a strong correlation to the fair-valued securities and foreign futures contracts.
Other. Investments in management investment companies (including money market funds) that do not trade on an exchange are valued at the net asset value as of the close of each business day.
Fair Valuation. In connection with Rule 2a-5 of the 1940 Act, the Trustees have designated the Fund’s investment adviser as its valuation designee. Investments for which valuations or market quotations are not readily available or are deemed unreliable are valued by the investment adviser, as valuation designee, at fair value using methods that most fairly reflect the security’s “fair value”, which is the amount that the Fund might reasonably expect to receive for the security upon its current sale in the ordinary course. Each such determination is based on a consideration of relevant factors, which are likely to vary from one pricing context to another. These factors may include, but are not limited to, the type of security, the existence of any contractual restrictions on the security’s disposition, the price and extent of public trading in similar securities of the issuer or of comparable companies or entities, quotations or relevant information obtained from broker/dealers or other market participants, information obtained from the issuer, analysts, and/or the appropriate stock exchange (for exchange-traded securities), an analysis of the company’s or entity’s financial statements, and an evaluation of the forces that influence the issuer and the market(s) in which the security is purchased and sold.
Eaton Vance
Tax-Managed Global Dividend Income Fund
April 30, 2024
Notes to Financial Statements (Unaudited) — continued
B Investment Transactions—Investment transactions for financial statement purposes are accounted for on a trade date basis. Realized gains and losses on investments sold are determined on the basis of identified cost.
C Income—Dividend income is recorded on the ex-dividend date for dividends received in cash and/or securities. However, if the ex-dividend date has passed, certain dividends from foreign securities are recorded as the Fund is informed of the ex-dividend date. Withholding taxes on foreign dividends and capital gains have been provided for in accordance with the Fund’s understanding of the applicable countries’ tax rules and rates. In consideration of recent decisions rendered by European courts, the Fund has filed additional tax reclaims for previously withheld taxes on dividends earned in certain European Union countries. These filings are subject to various administrative and judicial proceedings within these countries. During the six months ended April 30, 2024, the Fund recorded income of $17,459 for previously withheld foreign taxes from Sweden of which $6,586 was received and $10,873 is unpaid. Such amounts are included in Other income on the Statement of Operations. No other amounts for additional tax reclaims are reflected in the financial statements due to the uncertainty as to the ultimate resolution of proceedings, the likelihood of receipt of these reclaims, and the potential timing of payment. Interest income is recorded on the basis of interest accrued, adjusted for amortization of premium or accretion of discount. Distributions from investment companies are recorded as dividend income, capital gains or return of capital based on the nature of the distribution.
D Federal and Other Taxes—The Fund’s policy is to comply with the provisions of the Internal Revenue Code applicable to regulated investment companies and to distribute to shareholders each year substantially all of its net investment income, and all or substantially all of its net realized capital gains. Accordingly, no provision for federal income or excise tax is necessary.
In addition to the requirements of the Internal Revenue Code, the Fund may also be subject to local taxes on the recognition of capital gains in certain countries. In determining the daily net asset value, the Fund estimates the accrual for such taxes, if any, based on the unrealized appreciation on certain portfolio securities and the related tax rates. Taxes attributable to unrealized appreciation are included in the change in unrealized appreciation (depreciation) on investments. Capital gains taxes on securities sold are included in net realized gain (loss) on investments.
As of April 30, 2024, the Fund had no uncertain tax positions that would require financial statement recognition, de-recognition, or disclosure. The Fund files a U.S. federal income tax return annually after its fiscal year-end, which is subject to examination by the Internal Revenue Service for a period of three years from the date of filing.
E Expenses—The majority of expenses of the Trust are directly identifiable to an individual fund. Expenses which are not readily identifiable to a specific fund are allocated taking into consideration, among other things, the nature and type of expense and the relative size of the funds.
F Foreign Currency Translation—Investment valuations, other assets, and liabilities initially expressed in foreign currencies are translated each business day into U.S. dollars based upon current exchange rates. Purchases and sales of foreign investment securities and income and expenses denominated in foreign currencies are translated into U.S. dollars based upon currency exchange rates in effect on the respective dates of such transactions. Recognized gains or losses on investment transactions attributable to changes in foreign currency exchange rates are recorded for financial statement purposes as net realized gains and losses on investments. That portion of unrealized gains and losses on investments that results from fluctuations in foreign currency exchange rates is not separately disclosed.
G Use of Estimates—The preparation of the financial statements in conformity with U.S. GAAP requires management to make estimates and assumptions that affect the reported amounts of assets and liabilities at the date of the financial statements and the reported amounts of income and expense during the reporting period. Actual results could differ from those estimates.
H Indemnifications—Under the Trust’s organizational documents, its officers and Trustees may be indemnified against certain liabilities and expenses arising out of the performance of their duties to the Fund. Under Massachusetts law, if certain conditions prevail, shareholders of a Massachusetts business trust (such as the Trust) could be deemed to have personal liability for the obligations of the Trust. However, the Trust’s Declaration of Trust contains an express disclaimer of liability on the part of Fund shareholders and the By-laws provide that the Trust shall assume, upon request by the shareholder, the defense on behalf of any Fund shareholders. Moreover, the By-laws also provide for indemnification out of Fund property of any shareholder held personally liable solely by reason of being or having been a shareholder for all loss or expense arising from such liability. Additionally, in the normal course of business, the Fund enters into agreements with service providers that may contain indemnification clauses. The Fund’s maximum exposure under these arrangements is unknown as this would involve future claims that may be made against the Fund that have not yet occurred.
I Futures Contracts—Upon entering into a futures contract, the Fund is required to deposit with the broker, either in cash or securities, an amount equal to a certain percentage of the contract amount (initial margin). Subsequent payments, known as variation margin, are made or received by the Fund each business day, depending on the daily fluctuations in the value of the underlying security or index and are recorded as unrealized gains or losses by the Fund. Gains (losses) are realized upon the expiration or closing of the futures contracts. Should market conditions change unexpectedly, the Fund may not achieve the anticipated benefits of the futures contracts and may realize a loss. Futures contracts have minimal counterparty risk as they are exchange traded and the clearinghouse for the exchange is substituted as the counterparty, guaranteeing counterparty performance.
J Forward Foreign Currency Exchange Contracts—The Fund may enter into forward foreign currency exchange contracts for the purchase or sale of a specific foreign currency at a fixed price on a future date. The forward foreign currency exchange contracts are adjusted by the daily exchange rate of the underlying currency and any gains or losses are recorded as unrealized until such time as the contracts have been closed. Risks may arise upon entering
Eaton Vance
Tax-Managed Global Dividend Income Fund
April 30, 2024
Notes to Financial Statements (Unaudited) — continued
these contracts from the potential inability of counterparties to meet the terms of their contracts and from movements in the value of a foreign currency relative to the U.S. dollar.
K Interim Financial Statements—The interim financial statements relating to April 30, 2024 and for the six months then ended have not been audited by an independent registered public accounting firm, but in the opinion of the Fund’s management, reflect all adjustments, consisting only of normal recurring adjustments, necessary for the fair presentation of the financial statements.
2 Distributions to Shareholders and Income Tax Information
It is the present policy of the Fund to make monthly distributions of all or substantially all of its net investment income and to distribute annually all or substantially all of its net realized capital gains. Distributions to shareholders are recorded on the ex-dividend date. Distributions are declared separately for each class of shares. Shareholders may reinvest income and capital gain distributions in additional shares of the same class of the Fund at the net asset value as of the ex-dividend date or, at the election of the shareholder, receive distributions in cash. Distributions to shareholders are determined in accordance with income tax regulations, which may differ from U.S. GAAP. As required by U.S. GAAP, only distributions in excess of tax basis earnings and profits are reported in the financial statements as a return of capital. Permanent differences between book and tax accounting relating to distributions are reclassified to paid-in capital. For tax purposes, distributions from short-term capital gains are considered to be from ordinary income.
At October 31, 2023, the Fund, for federal income tax purposes, had deferred capital losses of $20,442,053 which would reduce its taxable income arising from future net realized gains on investment transactions, if any, to the extent permitted by the Internal Revenue Code, and thus would reduce the amount of distributions to shareholders, which would otherwise be necessary to relieve the Fund of any liability for federal income or excise tax. The deferred capital losses are treated as arising on the first day of the Fund’s next taxable year and retain the same short-term or long-term character as when originally deferred. Of the deferred capital losses at October 31, 2023, $20,442,053 are short-term.
The cost and unrealized appreciation (depreciation) of investments, including open derivative contracts, of the Fund at April 30, 2024, as determined on a federal income tax basis, were as follows:
| Aggregate cost | $ 402,245,993 |
| Gross unrealized appreciation | $ 223,335,279 |
| Gross unrealized depreciation | (14,308,394) |
| Net unrealized appreciation | $ 209,026,885 |
3 Investment Adviser Fee and Other Transactions with Affiliates
The investment adviser fee is earned by Eaton Vance Management (EVM), an indirect, wholly-owned subsidiary of Morgan Stanley, as compensation for investment advisory services rendered to the Fund. The fee is computed at an annual rate as a percentage of average daily net assets as follows and is payable monthly:
| Average Daily Net Assets | Annual Fee Rate |
| Up to $500 million | 0.650% |
| $500 million but less than $1 billion | 0.625% |
| $1 billion but less than $2.5 billion | 0.600% |
| $2.5 billion and over | 0.575% |
For the six months ended April 30, 2024, the Fund’s investment adviser fee amounted to $1,956,072 or 0.64% (annualized) of the Fund’s average daily net assets.
Pursuant to an investment sub-advisory agreement, EVM has delegated a portion of the investment management of the Fund to Eaton Vance Advisers International Ltd. (EVAIL), an affiliate of EVM and an indirect, wholly-owned subsidiary of Morgan Stanley. EVM pays EVAIL a portion of its investment adviser fee for sub-advisory services provided to the Fund. The Fund may invest in a money market fund, the Institutional Class of the Morgan Stanley Institutional Liquidity Funds - Government Portfolio (the “Liquidity Fund”), an open-end management investment company managed by Morgan Stanley Investment Management Inc., a wholly-owned subsidiary of Morgan Stanley. The investment adviser fee paid by the Fund is reduced by an amount equal to its pro rata share of the advisory and administration fees paid by the Fund due to its investment in the Liquidity Fund. For the six months ended April 30, 2024, the investment adviser fee paid was reduced by $1,150 relating to the Fund's investment in the Liquidity Fund.
Eaton Vance
Tax-Managed Global Dividend Income Fund
April 30, 2024
Notes to Financial Statements (Unaudited) — continued
The administration fee is earned by EVM for administering the business affairs of the Fund and is computed at an annual rate of 0.15% of the Fund’s average daily net assets. For the six months ended April 30, 2024, the administration fee amounted to $454,539.
EVM provides sub-transfer agency and related services to the Fund pursuant to a Sub-Transfer Agency Support Services Agreement. For the six months ended April 30, 2024, EVM earned $16,913 from the Fund pursuant to such agreement, which is included in transfer and dividend disbursing agent fees on the Statement of Operations. The Fund was informed that Eaton Vance Distributors, Inc. (EVD), an affiliate of EVM and the Fund’s principal underwriter, received $9,978 as its portion of the sales charge on sales of Class A shares for the six months ended April 30, 2024. EVD also received distribution and service fees from Class A and Class C shares (see Note 4) and contingent deferred sales charges (see Note 5).
During the six months ended April 30, 2024, EVM reimbursed the Fund $20,787 for a net realized loss on the sale of an investment security not meeting the Fund's investment guidelines. The reimbursement had no significant impact on total return for each class.
Trustees and officers of the Fund who are members of EVM’s organization receive remuneration for their services to the Fund out of the investment adviser fee. Trustees of the Fund who are not affiliated with EVM may elect to defer receipt of all or a percentage of their annual fees in accordance with the terms of the Trustees Deferred Compensation Plan. Certain officers and Trustees of the Fund are officers of EVM.
4 Distribution Plan
The Fund has in effect a distribution plan for Class A shares (Class A Plan) pursuant to Rule 12b-1 under the 1940 Act. Pursuant to the Class A Plan, the Fund pays EVD a distribution and service fee of 0.25% per annum of its average daily net assets attributable to Class A shares for distribution services and facilities provided to the Fund by EVD, as well as for personal services and/or the maintenance of shareholder accounts. Distribution and service fees paid or accrued to EVD for the six months ended April 30, 2024 amounted to $510,405 for Class A shares.
The Fund also has in effect a distribution plan for Class C shares (Class C Plan) pursuant to Rule 12b-1 under the 1940 Act. Pursuant to the Class C Plan, the Fund pays EVD amounts equal to 0.75% per annum of its average daily net assets attributable to Class C shares for providing ongoing distribution services and facilities to the Fund. For the six months ended April 30, 2024, the Fund paid or accrued to EVD $64,915 for Class C shares.
Pursuant to the Class C Plan, the Fund also makes payments of service fees to EVD, financial intermediaries and other persons in amounts equal to 0.25% per annum of its average daily net assets attributable to that class. Service fees paid or accrued are for personal services and/or the maintenance of shareholder accounts. They are separate and distinct from the sales commissions and distribution fees payable to EVD. Service fees paid or accrued for the six months ended April 30, 2024 amounted to $21,638 for Class C shares.
Distribution and service fees are subject to the limitations contained in the Financial Industry Regulatory Authority Rule 2341(d).
5 Contingent Deferred Sales Charges
A contingent deferred sales charge (CDSC) of 1% generally is imposed on redemptions of Class C shares made within 12 months of purchase. Class A shares may be subject to a 1% CDSC if redeemed within 12 months of purchase (depending on the circumstances of purchase). Generally, the CDSC is based upon the lower of the net asset value at date of redemption or date of purchase. No charge is levied on shares acquired by reinvestment of dividends or capital gain distributions. For the six months ended April 30, 2024, the Fund was informed that EVD received $299 of CDSCs paid by Class C shareholders and no CDSCs paid by Class A shareholders.
6 Purchases and Sales of Investments
Purchases and sales of investments, other than short-term obligations, aggregated $379,051,874 and $401,404,285, respectively, for the six months ended April 30, 2024.
Eaton Vance
Tax-Managed Global Dividend Income Fund
April 30, 2024
Notes to Financial Statements (Unaudited) — continued
7 Shares of Beneficial Interest
The Fund’s Declaration of Trust permits the Trustees to issue an unlimited number of full and fractional shares of beneficial interest (without par value). Such shares may be issued in a number of different series (such as the Fund) and classes. Transactions in Fund shares, including direct exchanges pursuant to share class conversions, were as follows:
| | Six Months Ended
April 30, 2024
(Unaudited) | | Year Ended
October 31, 2023 |
| | Shares | Amount | | Shares | Amount |
| Class A | | | | | |
| Sales | 524,144 | $ 8,287,312 | | 917,870 | $ 13,169,060 |
| Issued to shareholders electing to receive payments of distributions in Fund shares | 478,748 | 7,681,213 | | 1,149,976 | 16,316,413 |
| Redemptions | (2,449,475) | (38,490,320) | | (2,859,448) | (40,865,731) |
| Net decrease | (1,446,583) | $(22,521,795) | | (791,602) | $(11,380,258) |
| Class C | | | | | |
| Sales | 72,411 | $ 1,146,584 | | 82,510 | $ 1,190,290 |
| Issued to shareholders electing to receive payments of distributions in Fund shares | 18,537 | 296,642 | | 53,453 | 753,168 |
| Redemptions | (211,666) | (3,374,563) | | (533,903) | (7,554,866) |
| Net decrease | (120,718) | $ (1,931,337) | | (397,940) | $ (5,611,408) |
| Class I | | | | | |
| Sales | 1,078,130 | $ 17,510,226 | | 1,283,369 | $ 18,585,934 |
| Issued to shareholders electing to receive payments of distributions in Fund shares | 253,259 | 4,070,054 | | 563,960 | 8,014,130 |
| Redemptions | (690,686) | (11,092,833) | | (1,685,724) | (23,932,056) |
| Net increase | 640,703 | $ 10,487,447 | | 161,605 | $ 2,668,008 |
8 Financial Instruments
The Fund may trade in financial instruments with off-balance sheet risk in the normal course of its investing activities. These financial instruments may include forward foreign currency exchange contracts and futures contracts and may involve, to a varying degree, elements of risk in excess of the amounts recognized for financial statement purposes. The notional or contractual amounts of these instruments represent the investment the Fund has in particular classes of financial instruments and do not necessarily represent the amounts potentially subject to risk. The measurement of the risks associated with these instruments is meaningful only when all related and offsetting transactions are considered. A summary of obligations under these financial instruments at April 30, 2024 is included in the Portfolio of Investments. At April 30, 2024, the Fund had sufficient cash and/or securities to cover commitments under these contracts.
In the normal course of pursuing its investment objective, the Fund is subject to the following risks:
Equity Price Risk: The Fund enters into equity futures contracts on securities indices to gain or limit exposure to certain markets, particularly in connection with engaging in the dividend capture trading strategy.
Foreign Exchange Risk: Because the Fund holds foreign currency denominated investments, the value of these investments and related receivables and payables may change due to future changes in foreign currency exchange rates. To hedge against this risk, the Fund enters into forward foreign currency exchange contracts.
The Fund enters into forward foreign currency exchange contracts that may contain provisions whereby the counterparty may terminate the contract under certain conditions, including but not limited to a decline in the Fund’s net assets below a certain level over a certain period of time, which would trigger a payment by the Fund for those derivatives in a liability position. At April 30, 2024, the Fund had no open derivatives with credit-related contingent features in a net liability position.
Eaton Vance
Tax-Managed Global Dividend Income Fund
April 30, 2024
Notes to Financial Statements (Unaudited) — continued
The over-the-counter (OTC) derivatives in which the Fund invests are subject to the risk that the counterparty to the contract fails to perform its obligations under the contract. To mitigate this risk, the Fund has entered into an International Swaps and Derivatives Association, Inc. Master Agreement (“ISDA Master Agreement”) or similar agreement with substantially all its derivative counterparties. An ISDA Master Agreement is a bilateral agreement between the Fund and a counterparty that governs certain OTC derivatives and typically contains, among other things, set-off provisions in the event of a default and/or termination event as defined under the relevant ISDA Master Agreement. Under an ISDA Master Agreement, the Fund may, under certain circumstances, offset with the counterparty certain derivative financial instruments’ payables and/or receivables with collateral held and/or posted and create one single net payment. The provisions of the ISDA Master Agreement typically permit a single net payment in the event of default including the bankruptcy or insolvency of the counterparty. However, bankruptcy or insolvency laws of a particular jurisdiction may impose restrictions on or prohibitions against the right of offset in bankruptcy or insolvency. Certain ISDA Master Agreements allow counterparties to OTC derivatives to terminate derivative contracts prior to maturity in the event the Fund’s net assets decline by a stated percentage or the Fund fails to meet the terms of its ISDA Master Agreements, which would cause the counterparty to accelerate payment by the Fund of any net liability owed to it.
The collateral requirements for derivatives traded under an ISDA Master Agreement are governed by a Credit Support Annex to the ISDA Master Agreement. Collateral requirements are determined at the close of business each day and are typically based on changes in market values for each transaction under an ISDA Master Agreement and netted into one amount for such agreement. Generally, the amount of collateral due from or to a counterparty is subject to a minimum transfer threshold amount before a transfer is required, which may vary by counterparty. Collateral pledged for the benefit of the Fund and/or counterparty is held in segregated accounts by the Fund’s custodian and cannot be sold, re-pledged, assigned or otherwise used while pledged. The portion of such collateral representing cash, if any, is reflected as deposits for derivatives collateral and, in the case of cash pledged by a counterparty for the benefit of the Fund, a corresponding liability on the Statement of Assets and Liabilities. Securities pledged by the Fund as collateral, if any, are identified as such in the Portfolio of Investments.
The fair value of open derivative instruments (not considered to be hedging instruments for accounting disclosure purposes) by risk exposure at April 30, 2024 was as follows:
| | | Fair Value |
| Risk | Derivative | Asset Derivative | Liability Derivative |
| Equity Price | Futures contracts | $ — | $ (5,094,850)(1) |
| Foreign Exchange | Forward foreign currency exchange contracts | 165,416 (2) | — |
| Total | $165,416 | $(5,094,850) |
| Derivatives not subject to master netting or similar agreements | $ — | $(5,094,850) |
| Total Derivatives subject to master netting or similar agreements | $165,416 | $ — |
| (1) | Only the current day’s variation margin on open futures contracts is reported within the Statement of Assets and Liabilities as Receivable or Payable for variation margin on open futures contracts, as applicable. |
| (2) | Statement of Assets and Liabilities location: Receivable for open forward foreign currency exchange contracts. |
The Fund’s derivative assets and liabilities at fair value by risk, which are reported gross in the Statement of Assets and Liabilities, are presented in the table above. The following table presents the Fund’s derivative assets by counterparty, net of amounts available for offset under a master netting agreement and net of the related collateral received by the Fund for such assets as of April 30, 2024.
| Counterparty | Derivative
Assets Subject to
Master Netting
Agreement | Derivatives
Available
for Offset | Non-cash
Collateral
Received(a) | Cash
Collateral
Received(a) | Net Amount
of Derivative
Assets(b) |
| State Street Bank and Trust Company | $165,416 | $ — | $ — | $ — | $165,416 |
| (a) | In some instances, the total collateral received and/or pledged may be more than the amount shown due to overcollateralization. |
| (b) | Net amount represents the net amount due from the counterparty in the event of default. |
Eaton Vance
Tax-Managed Global Dividend Income Fund
April 30, 2024
Notes to Financial Statements (Unaudited) — continued
The effect of derivative instruments (not considered to be hedging instruments for accounting disclosure purposes) on the Statement of Operations by risk exposure for the six months ended April 30, 2024 was as follows:
| Risk | Derivative | Realized Gain (Loss)
on Derivatives Recognized
in Income(1) | Change in Unrealized
Appreciation (Depreciation) on
Derivatives Recognized in Income(2) |
| Equity Price | Futures contracts | $ — | $ (5,094,850) |
| Foreign Exchange | Forward foreign currency exchange contracts | 3,617,050 | 165,416 |
| Total | $3,617,050 | $(4,929,434) |
| (1) | Statement of Operations location: Net realized gain (loss): Forward foreign currency exchange contracts. |
| (2) | Statement of Operations location: Change in unrealized appreciation (depreciation): Futures contracts and Forward foreign currency exchange contracts, respectively. |
The average notional cost of futures contracts and average notional amounts of other derivative contracts outstanding during the six months ended April 30, 2024, which are indicative of the volume of these derivative types, were approximately as follows:
Futures
Contracts — Long | Futures
Contracts — Short | Forward
Foreign Currency
Exchange Contracts* |
| $43,791,000 | $42,901,000 | $17,192,000 |
| * | The average notional amount for forward foreign currency exchange contracts is based on the absolute value of notional amounts of currency purchased and currency sold. |
9 Line of Credit
The Fund participates with other portfolios and funds managed by EVM and its affiliates in a $650 million unsecured revolving line of credit agreement with a group of banks, which is in effect through October 22, 2024. Borrowings are made by the Fund solely for temporary purposes related to redemptions and other short-term cash needs. Interest is charged to the Fund based on its borrowings at an amount above either the Secured Overnight Financing Rate (SOFR) or Federal Funds rate. In addition, a fee computed at an annual rate of 0.15% on the daily unused portion of the line of credit is allocated among the participating portfolios and funds at the end of each quarter. In connection with the renewal of the agreement in October 2023, an arrangement fee of $150,000 was incurred that was allocated to the participating portfolios and funds. Because the line of credit is not available exclusively to the Fund, it may be unable to borrow some or all of its requested amounts at any particular time. The Fund did not have any significant borrowings or allocated fees during the six months ended April 30, 2024.
10 Affiliated Investments
At April 30, 2024, the value of the Fund's investment in funds that may be deemed to be affiliated was $2,759,669, which represents 0.4% of the Fund's net assets. Transactions in such investments by the Fund for the six months ended April 30, 2024 were as follows:
| Name | Value,
beginning
of period | Purchases | Sales
proceeds | Net realized
gain (loss) | Change in
unrealized
appreciation
(depreciation) | Value, end
of period | Dividend
income | Shares,
end of period |
| Short-Term Investments |
| Liquidity Fund | $3,545,621 | $52,821,864 | $(53,607,816) | $ — | $ — | $2,759,669 | $37,207 | 2,759,669 |
Eaton Vance
Tax-Managed Global Dividend Income Fund
April 30, 2024
Notes to Financial Statements (Unaudited) — continued
11 Fair Value Measurements
Under generally accepted accounting principles for fair value measurements, a three-tier hierarchy to prioritize the assumptions, referred to as inputs, is used in valuation techniques to measure fair value. The three-tier hierarchy of inputs is summarized in the three broad levels listed below.
| • | Level 1 – quoted prices in active markets for identical investments |
| • | Level 2 – other significant observable inputs (including quoted prices for similar investments, interest rates, prepayment speeds, credit risk, etc.) |
| • | Level 3 – significant unobservable inputs (including a fund's own assumptions in determining the fair value of investments) |
In cases where the inputs used to measure fair value fall in different levels of the fair value hierarchy, the level disclosed is determined based on the lowest level input that is significant to the fair value measurement in its entirety. The inputs or methodology used for valuing securities are not necessarily an indication of the risk associated with investing in those securities.
At April 30, 2024, the hierarchy of inputs used in valuing the Fund's investments and open derivative instruments, which are carried at fair value, were as follows:
| Asset Description | Level 1 | Level 2 | Level 3 | Total |
| Common Stocks: | | | | |
| Communication Services | $ 30,109,441 | $ 3,341,918 | $ — | $ 33,451,359 |
| Consumer Discretionary | 29,721,255 | 37,863,305 | — | 67,584,560 |
| Consumer Staples | 2,504,417 | 12,415,455 | — | 14,919,872 |
| Energy | 23,853,856 | — | — | 23,853,856 |
| Financials | 49,280,086 | 112,300,590 | — | 161,580,676 |
| Health Care | 50,130,763 | 32,235,762 | — | 82,366,525 |
| Industrials | 20,575,676 | 58,617,539 | — | 79,193,215 |
| Information Technology | 90,432,817 | 23,352,552 | — | 113,785,369 |
| Materials | 1,253,198 | 16,382,917 | — | 17,636,115 |
| Real Estate | 770,491 | — | — | 770,491 |
| Utilities | 1,536,738 | 16,763,867 | — | 18,300,605 |
| Total Common Stocks | $ 300,168,738 | $ 313,273,905* | $ — | $ 613,442,643 |
| Short-Term Investments | $ 2,759,669 | $ — | $ — | $ 2,759,669 |
| Total Investments | $ 302,928,407 | $ 313,273,905 | $ — | $ 616,202,312 |
| Forward Foreign Currency Exchange Contracts | $ — | $ 165,416 | $ — | $ 165,416 |
| Total | $ 302,928,407 | $ 313,439,321 | $ — | $ 616,367,728 |
| Liability Description | | | | |
| Futures Contracts | $ (5,094,850) | $ — | $ — | $ (5,094,850) |
| Total | $ (5,094,850) | $ — | $ — | $ (5,094,850) |
| * | Includes foreign equity securities whose values were adjusted to reflect market trading of comparable securities or other correlated instruments that occurred after the close of trading in their applicable foreign markets. |
Eaton Vance
Tax-Managed Global Dividend Income Fund
April 30, 2024
Notes to Financial Statements (Unaudited) — continued
12 Risks and Uncertainties
Risks Associated with Foreign Investments
Foreign investments can be adversely affected by political, economic and market developments abroad, including the imposition of economic and other sanctions by the United States or another country. There may be less publicly available information about foreign issuers because they may not be subject to reporting practices, requirements or regulations comparable to those to which United States companies are subject. Foreign markets may be smaller, less liquid and more volatile than the major markets in the United States. Trading in foreign markets typically involves higher expense than trading in the United States. The Fund may have difficulties enforcing its legal or contractual rights in a foreign country. Securities that trade or are denominated in currencies other than the U.S. dollar may be adversely affected by fluctuations in currency exchange rates.
Eaton Vance
Tax-Managed Global Dividend Income Fund
April 30, 2024
| Officers |
Kenneth A. Topping
President | Nicholas S. Di Lorenzo
Secretary |
Deidre E. Walsh
Vice President and Chief Legal Officer | Laura T. Donovan
Chief Compliance Officer |
James F. Kirchner
Treasurer | |
George J. Gorman
Chairperson | |
| Alan C. Bowser | |
| Mark R. Fetting | |
| Cynthia E. Frost | |
| Valerie A. Mosley | |
| Anchal Pachnanda* | |
| Keith Quinton | |
| Marcus L. Smith | |
| Susan J. Sutherland | |
| Scott E. Wennerholm | |
| Nancy A. Wiser | |
| U.S. Customer Privacy Notice | March 2024 |
| FACTS | WHAT DOES EATON VANCE DO WITH YOUR PERSONAL INFORMATION? |
| Why? | Financial companies choose how they share your personal information. Federal law gives consumers the right to limit some but not all sharing. Federal law also requires us to tell you how we collect, share, and protect your personal information. Please read this notice carefully to understand what we do. |
| |
| What? | The types of personal information we collect and share depend on the product or service you have with us. This information can include:■ Social Security number and income
■ investment experience and risk tolerance
■ checking account information and wire transfer instructions |
| |
| How? | All financial companies need to share customers’ personal information to run their everyday business. In the section below, we list the reasons financial companies can share their customers’ personal information; the reasons Eaton Vance chooses to share; and whether you can limit this sharing. |
| Reasons we can share your personal information | Does Eaton Vance
share? | Can you limit
this sharing? |
| For our everyday business purposes — such as to process your transactions, maintain your account(s), respond to court orders and legal investigations, or report to credit bureaus | Yes | No |
| For our marketing purposes — to offer our products and services to you | Yes | No |
| For joint marketing with other financial companies | No | We don’t share |
| For our affiliates’ everyday business purposes — information about your transactions and experiences | Yes | No* |
| For our affiliates’ everyday business purposes — information about your creditworthiness | Yes | Yes* |
| For our affiliates to market to you | Yes | Yes* |
| For nonaffiliates to market to you | No | We don’t share |
To limit our
sharing | Call toll-free 1-800-262-1122 or email: EVPrivacy@eatonvance.comPlease note:If you are a new customer, we can begin sharing your information 30 days from the date we sent this notice. When you are no longer our customer, we continue to share your information as described in this notice. However, you can contact us at any time to limit our sharing. |
| Questions? | Call toll-free 1-800-262-1122 or email: EVPrivacy@eatonvance.com |
| U.S. Customer Privacy Notice — continued | March 2024 |
| Who we are |
| Who is providing this notice? | Eaton Vance Management and our investment management affiliates (“Eaton Vance”) (see Affiliates definition below.) |
| What we do |
How does Eaton Vance
protect my personal
information? | To protect your personal information from unauthorized access and use, we use security measures that comply with federal law. These measures include computer safeguards and secured files and buildings. We have policies governing the proper handling of customer information by personnel and requiring third parties that provide support to adhere to appropriate security standards with respect to such information. |
How does Eaton Vance
collect my personal
information? | We collect your personal information, for example, when you■ open an account or make deposits or withdrawals from your account
■ buy securities from us or make a wire transfer
■ give us your contact informationWe also collect your personal information from others, such as credit bureaus, affiliates, or other companies. |
| Why can’t I limit all sharing? | Federal law gives you the right to limit only■ sharing for affiliates’ everyday business purposes — information about your creditworthiness
■ affiliates from using your information to market to you
■ sharing for nonaffiliates to market to youState laws and individual companies may give you additional rights to limit sharing. (See below for more on your rights under state law.) |
What happens when I limit
sharing for an account I hold
jointly with someone else? | Your choices will apply to everyone on your account. |
| Definitions |
| Affiliates | Companies related by common ownership or control. They can be financial and nonfinancial companies.■ Our affiliates include registered investment advisers such as Eaton Vance Management, Eaton Vance Advisers International Ltd., Boston Management and Research, Calvert Research and Management, Parametric Portfolio Associates LLC, Atlanta Capital Management Company LLC, Morgan Stanley Investment Management Inc., Morgan Stanley Investment Management Co.; registered broker-dealers such as Morgan Stanley Distributors Inc. and Eaton Vance Distributors, Inc. (together, the “Investment Management Affiliates”); and companies with a Morgan Stanley name and financial companies such as Morgan Stanley Smith Barney LLC and Morgan Stanley & Co. (the “Morgan Stanley Affiliates”). |
| Nonaffiliates | Companies not related by common ownership or control. They can be financial and nonfinancial companies.■ Eaton Vance does not share with nonaffiliates so they can market to you. |
| Joint marketing | A formal agreement between nonaffiliated financial companies that together market financial products or services to you.■ Eaton Vance does not jointly market. |
| U.S. Customer Privacy Notice — continued | March 2024 |
| Other important information |
| *PLEASE NOTE: Eaton Vance does not share your creditworthiness information or your transactions and experiences information with the Morgan Stanley Affiliates, nor does Eaton Vance enable the Morgan Stanley Affiliates to market to you. Your opt outs will prevent Eaton Vance from sharing your creditworthiness information with the Investment Management Affiliates and will prevent the Investment Management Affiliates from marketing their products to you.Vermont: Except as permitted by law, we will not share personal information we collect about Vermont residents with Nonaffiliates unless you provide us with your written consent to share such information.California: Except as permitted by law, we will not share personal information we collect about California residents with Nonaffiliates and we will limit sharing such personal information with our Affiliates to comply with California privacy laws that apply to us. |
Delivery of Shareholder Documents. The Securities and Exchange Commission (SEC) permits funds to deliver only one copy of shareholder documents, including prospectuses, proxy statements and shareholder reports, to fund investors with multiple accounts at the same residential or post office box address. This practice is often called “householding” and it helps eliminate duplicate mailings to shareholders. Eaton Vance, or your financial intermediary, may household the mailing of your documents indefinitely unless you instruct Eaton Vance, or your financial intermediary, otherwise. If you would prefer that your Eaton Vance documents not be householded, please contact Eaton Vance at 1-800-262-1122, or contact your financial intermediary. Your instructions that householding not apply to delivery of your Eaton Vance documents will typically be effective within 30 days of receipt by Eaton Vance or your financial intermediary.
Portfolio Holdings. Each Eaton Vance Fund and its underlying Portfolio(s) (if applicable) files a schedule of portfolio holdings on Part F to Form N-PORT with the SEC. Certain information filed on Form N-PORT may be viewed on the Eaton Vance website at www.eatonvance.com, by calling Eaton Vance at 1-800-262-1122 or in the EDGAR database on the SEC’s website at www.sec.gov.
Proxy Voting. From time to time, funds are required to vote proxies related to the securities held by the funds. The Eaton Vance Funds or their underlying Portfolios (if applicable) vote proxies according to a set of policies and procedures approved by the Funds’ and Portfolios’ Boards. You may obtain a description of these policies and procedures and information on how the Funds or Portfolios voted proxies relating to portfolio securities during the most recent 12-month period ended June 30, without charge, upon request, by calling 1-800-262-1122 and by accessing the SEC’s website at www.sec.gov.
Tailored Shareholder Reports. Effective January 24, 2023, the SEC adopted rule and form amendments to require open-end mutual funds and ETFs to transmit concise and visually engaging streamlined annual and semi-annual reports to shareholders that highlight key information. Other information, including financial statements, will no longer appear in a streamlined shareholder report but must be available online, delivered free of charge upon request, and filed on a semi-annual basis on Form N-CSR. The rule and form amendments have a compliance date of July 24, 2024. At this time, management is evaluating the impact of these amendments on the shareholder reports for the Eaton Vance Funds.
This Page Intentionally Left Blank
This Page Intentionally Left Blank
Investment Adviser and Administrator
Eaton Vance Management
One Post Office Square
Boston, MA 02109
Investment Sub-Adviser
Eaton Vance Advisers International Ltd.
125 Old Broad Street
London, EC2N 1AR
United Kingdom
Principal Underwriter*
Eaton Vance Distributors, Inc.
One Post Office Square
Boston, MA 02109
(617) 482-8260
Custodian
State Street Bank and Trust Company
One Congress Street, Suite 1
Boston, MA 02114-2016
Transfer Agent
BNY Mellon Investment Servicing (US) Inc.
Attn: Eaton Vance Funds
P.O. Box 534439
Pittsburgh, PA 15253-4439
(800) 262-1122
Fund Offices
One Post Office Square
Boston, MA 02109
* FINRA BrokerCheck. Investors may check the background of their Investment Professional by contacting the Financial Industry Regulatory Authority (FINRA). FINRA BrokerCheck is a free tool to help investors check the professional background of current and former FINRA-registered securities firms and brokers. FINRA BrokerCheck is available by calling 1-800-289-9999 and at www.FINRA.org. The FINRA BrokerCheck brochure describing this program is available to investors at www.FINRA.org.
Parametric
Tax-Managed International Equity Fund
Semi-Annual Report
April 30, 2024
Commodity Futures Trading Commission Registration. The Commodity Futures Trading Commission (“CFTC”) has adopted regulations that subject registered investment companies and advisers to regulation by the CFTC if a fund invests more than a prescribed level of its assets in certain CFTC-regulated instruments (including futures, certain options and swap agreements) or markets itself as providing investment exposure to such instruments. The investment adviser has claimed an exclusion from the definition of “commodity pool operator” under the Commodity Exchange Act with respect to its management of the Fund. Accordingly, neither the Fund nor the adviser with respect to the operation of the Fund is subject to CFTC regulation. Because of its management of other strategies, the Fund's adviser and Parametric Portfolio Associates LLC (Parametric), sub-adviser to the Fund, are registered with the CFTC as commodity pool operators. The adviser and Parametric are also registered as commodity trading advisors.
Fund shares are not insured by the FDIC and are not deposits or other obligations of, or guaranteed by, any depository institution. Shares are subject to investment risks, including possible loss of principal invested.
This report must be preceded or accompanied by a current summary prospectus or prospectus. Before investing, investors should consider carefully the investment objective, risks, and charges and expenses of a mutual fund. This and other important information is contained in the summary prospectus and prospectus, which can be obtained from a financial intermediary. Prospective investors should read the prospectus carefully before investing. For further information, please call 1-800-260-0761.
Semi-Annual Report April 30, 2024
Parametric
Tax-Managed International Equity Fund
Parametric
Tax-Managed International Equity Fund
April 30, 2024
Performance
Portfolio Manager(s) Thomas C. Seto, Paul W. Bouchey, CFA and Jennifer Sireklove, CFA, each of Parametric Portfolio Associates LLC
| % Average Annual Total Returns1,2 | Class
Inception Date | Performance
Inception Date | Six Months | One Year | Five Years | Ten Years |
| Class A at NAV | 04/22/1998 | 04/22/1998 | 13.74% | 3.53% | 4.06% | 3.59% |
| Class A with 5.25% Maximum Sales Charge | — | — | 7.74 | (1.93) | 2.94 | 3.04 |
| Class C at NAV | 04/22/1998 | 04/22/1998 | 13.36 | 2.78 | 3.30 | 2.97 |
| Class C with 1% Maximum Deferred Sales Charge | — | — | 12.36 | 1.78 | 3.30 | 2.97 |
| Class I at NAV | 09/02/2008 | 04/22/1998 | 13.86 | 3.79 | 4.33 | 3.86 |
|
| MSCI EAFE Index | — | — | 18.63% | 9.28% | 6.17% | 4.37% |
| % After-Tax Returns with Maximum Sales Charge2 | Class
Inception Date | Performance
Inception Date | One Year | Five Years | Ten Years |
| Class A After Taxes on Distributions | 04/22/1998 | 04/22/1998 | (2.22)% | 2.80% | 2.89% |
| Class A After Taxes on Distributions and Sale of Fund Shares | — | — | (0.45) | 2.58 | 2.64 |
| Class C After Taxes on Distributions | 04/22/1998 | 04/22/1998 | 1.68 | 3.37 | 2.93 |
| Class C After Taxes on Distributions and Sale of Fund Shares | — | — | 1.67 | 2.88 | 2.57 |
| Class I After Taxes on Distributions | 09/02/2008 | 04/22/1998 | 3.43 | 4.14 | 3.66 |
| Class I After Taxes on Distributions and Sale of Fund Shares | — | — | 3.03 | 3.69 | 3.31 |
| % Total Annual Operating Expense Ratios3 | Class A | Class C | Class I |
| Gross | 1.42% | 2.17% | 1.17% |
| Net | 1.05 | 1.80 | 0.80 |
See Endnotes and Additional Disclosures in this report.
Past performance is no guarantee of future results. Returns are historical and are calculated by determining the percentage change in net asset value (NAV) or offering price (as applicable) with all distributions reinvested. Furthermore, returns do not reflect the deduction of taxes that shareholders may have to pay on Fund distributions or upon the redemption of Fund shares. Investment return and principal value will fluctuate so that shares, when redeemed, may be worth more or less than their original cost. Performance for periods less than or equal to one year is cumulative. Performance is for the stated time period only; due to market volatility, current Fund performance may be lower or higher than the quoted return. For performance as of the most recent month-end, please refer to eatonvance.com.
Parametric
Tax-Managed International Equity Fund
April 30, 2024
| Sector Allocation (% of net assets)1 |
| Geographic Allocation (% of common stocks) |
| Top 10 Holdings (% of net assets)1 |
| Novo Nordisk AS, Class B | 1.2% |
| Cie Financiere Richemont SA, Class A | 1.1 |
| Nestle SA | 1.0 |
| SAP SE | 1.0 |
| Air Liquide SA | 0.9 |
| TotalEnergies SE | 0.9 |
| AstraZeneca PLC | 0.9 |
| E.ON SE | 0.9 |
| Engie SA | 0.8 |
| ASML Holding NV | 0.8 |
| Total | 9.5% |
Fund invests in an affiliated investment company (Portfolio) with the same objective(s) and policies as the Fund. References to investments are to the Portfolio’s holdings.
Footnotes:
| 1 | Excludes cash and cash equivalents. |
Parametric
Tax-Managed International Equity Fund
April 30, 2024
Endnotes and Additional Disclosures
| 1 | MSCI EAFE Index is an unmanaged index of equities in the developed markets, excluding the U.S. and Canada. MSCI indexes are net of foreign withholding taxes. Source: MSCI. MSCI data may not be reproduced or used for any other purpose. MSCI provides no warranties, has not prepared or approved this report, and has no liability hereunder. Unless otherwise stated, index returns do not reflect the effect of any applicable sales charges, commissions, expenses, taxes or leverage, as applicable. It is not possible to invest directly in an index. |
| 2 | Total Returns at NAV do not include applicable sales charges. If sales charges were deducted, the returns would be lower. Total Returns shown with maximum sales charge reflect the stated maximum sales charge. Unless otherwise stated, performance does not reflect the deduction of taxes on Fund distributions or redemptions of Fund shares. After-tax returns are calculated using certain assumptions, including using the highest historical individual federal income tax rates, and do not reflect the impact of state/local taxes. Actual after-tax returns depend on a shareholder’s tax situation and the actual characterization of distributions and may differ from those shown. After-tax returns are not relevant to shareholders who hold shares in tax-deferred accounts or shares held by nontaxable entities. Return After Taxes on Distributions may be the same as Return Before Taxes for the same period because no taxable distributions were made during that period. Return After Taxes on Distributions and Sale of Fund Shares may be greater than or equal to Return After Taxes on Distributions for the same period because of losses realized on the sale of Fund shares. The Fund’s after-tax returns also may reflect foreign tax credits passed by the Fund to its shareholders.Effective November 5, 2020, Class C shares automatically convert to Class A shares eight years after purchase. The average annual total returns listed for Class C reflect conversion to Class A shares after eight years. Prior to November 5, 2020, Class C shares automatically converted to Class A shares ten years after purchase. |
| 3 | Source: Fund prospectus. Net expense ratios reflect a contractual expense reimbursement that continues through 3/1/25. The expense ratios for the current reporting period can be found in the Financial Highlights section of this report. Performance reflects expenses waived and/or reimbursed, if applicable. Without such waivers and/or reimbursements, performance would have been lower. |
| | Fund profile subject to change due to active management. |
Parametric
Tax-Managed International Equity Fund
April 30, 2024
Example
As a Fund shareholder, you incur two types of costs: (1) transaction costs, including sales charges (loads) on purchases; and (2) ongoing costs, including management fees; distribution and/or service fees; and other Fund expenses. This Example is intended to help you understand your ongoing costs (in dollars) of Fund investing and to compare these costs with the ongoing costs of investing in other mutual funds. The Example is based on an investment of $1,000 invested at the beginning of the period and held for the entire period (November 1, 2023 to April 30, 2024).
Actual Expenses
The first section of the table below provides information about actual account values and actual expenses. You may use the information in this section, together with the amount you invested, to estimate the expenses that you paid over the period. Simply divide your account value by $1,000 (for example, an $8,600 account value divided by $1,000 = 8.6), then multiply the result by the number in the first section under the heading entitled “Expenses Paid During Period” to estimate the expenses you paid on your account during this period.
Hypothetical Example for Comparison Purposes
The second section of the table below provides information about hypothetical account values and hypothetical expenses based on the actual Fund expense ratio and an assumed rate of return of 5% per year (before expenses), which is not the actual Fund return. The hypothetical account values and expenses may not be used to estimate the actual ending account balance or expenses you paid for the period. You may use this information to compare the ongoing costs of investing in your Fund and other funds. To do so, compare this 5% hypothetical example with the 5% hypothetical examples that appear in the shareholder reports of the other funds.
Please note that the expenses shown in the table are meant to highlight your ongoing costs only and do not reflect any transactional costs, such as sales charges (loads). Therefore, the second section of the table is useful in comparing ongoing costs only, and will not help you determine the relative total costs of owning different funds. In addition, if these transactional costs were included, your costs would be higher.
| | Beginning
Account Value
(11/1/23) | Ending
Account Value
(4/30/24) | Expenses Paid
During Period*
(11/1/23 – 4/30/24) | Annualized
Expense
Ratio |
| Actual | | | | |
| Class A | $1,000.00 | $1,137.40 | $5.58** | 1.05% |
| Class C | $1,000.00 | $1,133.60 | $9.55** | 1.80% |
| Class I | $1,000.00 | $1,138.60 | $4.25** | 0.80% |
| |
| Hypothetical | | | | |
| (5% return per year before expenses) | | | | |
| Class A | $1,000.00 | $1,019.64 | $5.27** | 1.05% |
| Class C | $1,000.00 | $1,015.91 | $9.02** | 1.80% |
| Class I | $1,000.00 | $1,020.89 | $4.02** | 0.80% |
| * | Expenses are equal to the Fund's annualized expense ratio for the indicated Class, multiplied by the average account value over the period, multiplied by 182/366 (to reflect the one-half year period). The Example assumes that the $1,000 was invested at the net asset value per share determined at the close of business on October 31, 2023. The Example reflects the expenses of both the Fund and the Portfolio. |
| ** | Absent an allocation of certain expenses to affiliate(s), expenses would be higher. |
Parametric
Tax-Managed International Equity Fund
April 30, 2024
Statement of Assets and Liabilities (Unaudited)
| | April 30, 2024 |
| Assets | |
| Investment in Tax-Managed International Equity Portfolio, at value (identified cost $31,377,971) | $ 36,237,922 |
| Receivable for Fund shares sold | 69,814 |
| Receivable from affiliates | 29,069 |
| Total assets | $36,336,805 |
| Liabilities | |
| Payable for Fund shares redeemed | $ 75 |
| Payable to affiliates: | |
| Distribution and service fees | 3,834 |
| Trustees' fees | 42 |
| Payable for custodian fee | 13,403 |
| Payable for legal and accounting services | 14,474 |
| Payable for printing and postage | 3,646 |
| Accrued expenses | 2,764 |
| Total liabilities | $ 38,238 |
| Net Assets | $36,298,567 |
| Sources of Net Assets | |
| Paid-in capital | $ 33,446,977 |
| Distributable earnings | 2,851,590 |
| Net Assets | $36,298,567 |
| Class A Shares | |
| Net Assets | $ 17,564,347 |
| Shares Outstanding | 1,445,206 |
Net Asset Value and Redemption Price Per Share
(net assets ÷ shares of beneficial interest outstanding) | $ 12.15 |
Maximum Offering Price Per Share
(100 ÷ 94.75 of net asset value per share) | $ 12.82 |
| Class C Shares | |
| Net Assets | $ 157,755 |
| Shares Outstanding | 13,628 |
Net Asset Value and Offering Price Per Share*
(net assets ÷ shares of beneficial interest outstanding) | $ 11.58 |
| Class I Shares | |
| Net Assets | $ 18,576,465 |
| Shares Outstanding | 1,533,914 |
Net Asset Value, Offering Price and Redemption Price Per Share
(net assets ÷ shares of beneficial interest outstanding) | $ 12.11 |
| On sales of $50,000 or more, the offering price of Class A shares is reduced. |
| * | Redemption price per share is equal to the net asset value less any applicable contingent deferred sales charge. |
6
See Notes to Financial Statements.
Parametric
Tax-Managed International Equity Fund
April 30, 2024
Statement of Operations (Unaudited)
| | Six Months Ended |
| | April 30, 2024 |
| Investment Income | |
| Dividend income allocated from Portfolio (net of foreign taxes withheld of $77,515) | $ 555,020 |
| Securities lending income allocated from Portfolio, net | 17,006 |
| Expenses allocated from Portfolio | (133,622) |
| Total investment income from Portfolio | $ 438,404 |
| Expenses | |
| Distribution and service fees: | |
| Class A | $ 21,944 |
| Class C | 787 |
| Trustees’ fees and expenses | 250 |
| Custodian fee | 11,906 |
| Transfer and dividend disbursing agent fees | 27,882 |
| Legal and accounting services | 18,766 |
| Printing and postage | 5,382 |
| Registration fees | 25,034 |
| Miscellaneous | 5,480 |
| Total expenses | $ 117,431 |
| Deduct: | |
| Waiver and/or reimbursement of expenses by affiliates | $ 82,149 |
| Total expense reductions | $ 82,149 |
| Net expenses | $ 35,282 |
| Net investment income | $ 403,122 |
| Realized and Unrealized Gain (Loss) from Portfolio | |
| Net realized gain (loss): | |
| Investment transactions | $ (537,128) |
| Foreign currency transactions | 3,629 |
| Net realized loss | $ (533,499) |
| Change in unrealized appreciation (depreciation): | |
| Investments | $ 4,785,085 |
| Foreign currency | (2,718) |
| Net change in unrealized appreciation (depreciation) | $4,782,367 |
| Net realized and unrealized gain | $4,248,868 |
| Net increase in net assets from operations | $4,651,990 |
7
See Notes to Financial Statements.
Parametric
Tax-Managed International Equity Fund
April 30, 2024
Statements of Changes in Net Assets
| | Six Months Ended
April 30, 2024
(Unaudited) | Year Ended
October 31, 2023 |
| Increase (Decrease) in Net Assets | | |
| From operations: | | |
| Net investment income | $ 403,122 | $ 919,404 |
| Net realized gain (loss) | (533,499) | 87,590 |
| Net change in unrealized appreciation (depreciation) | 4,782,367 | 3,183,075 |
| Net increase in net assets from operations | $ 4,651,990 | $ 4,190,069 |
| Distributions to shareholders: | | |
| Class A | $ (442,659) | $ (296,735) |
| Class C | (2,731) | (2,201) |
| Class I | (533,187) | (362,220) |
| Total distributions to shareholders | $ (978,577) | $ (661,156) |
| Transactions in shares of beneficial interest: | | |
| Class A | $ (345,277) | $ (1,115,426) |
| Class C | (1,391) | (92,237) |
| Class I | (949,432) | (1,799,797) |
| Net decrease in net assets from Fund share transactions | $ (1,296,100) | $ (3,007,460) |
| Net increase in net assets | $ 2,377,313 | $ 521,453 |
| Net Assets | | |
| At beginning of period | $ 33,921,254 | $ 33,399,801 |
| At end of period | $36,298,567 | $33,921,254 |
8
See Notes to Financial Statements.
Parametric
Tax-Managed International Equity Fund
April 30, 2024
| | Class A |
| | Six Months Ended
April 30, 2024
(Unaudited) | Year Ended October 31, |
| | 2023 | 2022 | 2021 | 2020 | 2019 |
| Net asset value — Beginning of period | $ 10.950 | $ 9.900 | $13.550 | $ 10.480 | $ 11.330 | $ 10.370 |
| Income (Loss) From Operations | | | | | | |
| Net investment income(1) | $ 0.126 | $ 0.277 | $ 0.230 | $ 0.250 | $ 0.147 | $ 0.242 |
| Net realized and unrealized gain (loss) | 1.379 | 0.964 | (3.606) | 2.955 | (0.738) | 0.887 |
| Total income (loss) from operations | $ 1.505 | $ 1.241 | $ (3.376) | $ 3.205 | $ (0.591) | $ 1.129 |
| Less Distributions | | | | | | |
| From net investment income | $ (0.305) | $ (0.191) | $ (0.274) | $ (0.135) | $ (0.259) | $ (0.169) |
| Total distributions | $ (0.305) | $ (0.191) | $ (0.274) | $ (0.135) | $ (0.259) | $ (0.169) |
| Net asset value — End of period | $12.150 | $10.950 | $ 9.900 | $13.550 | $10.480 | $11.330 |
| Total Return(2)(3) | 13.74% (4) | 12.54% | (25.40)% | 30.73% | (5.41)% | 11.16% |
| Ratios/Supplemental Data | | | | | | |
| Net assets, end of period (000’s omitted) | $ 17,564 | $ 16,226 | $15,637 | $ 22,264 | $ 18,165 | $ 21,757 |
| Ratios (as a percentage of average daily net assets):(5) | | | | | | |
| Expenses (3) | 1.05% (6)(7) | 1.05% (6) | 1.05% (6) | 1.05% | 1.05% | 1.05% |
| Net investment income | 2.11% (7) | 2.41% | 1.97% | 1.93% | 1.37% | 2.26% |
| Portfolio Turnover of the Portfolio | 11% (4) | 36% | 22% | 23% | 10% | 37% |
| (1) | Computed using average shares outstanding. |
| (2) | Returns are historical and are calculated by determining the percentage change in net asset value with all distributions reinvested and do not reflect the effect of sales charges. |
| (3) | The administrator of the Fund and sub-adviser of the Portfolio reimbursed certain operating expenses (equal to 0.45%, 0.37%, 0.41%, 0.34%, 0.45% and 0.51% of average daily net assets for the six months ended April 30, 2024 and the years ended October 31, 2023, 2022, 2021, 2020 and 2019, respectively). Absent this reimbursement, total return would be lower. |
| (4) | Not annualized. |
| (5) | Includes the Fund’s share of the Portfolio's allocated expenses. |
| (6) | Includes a reduction by the investment adviser of a portion of the Portfolio's adviser fee due to the Portfolio's investment in the Liquidity Fund (equal to less than 0.005% of average daily net assets for the six months ended April 30, 2024 and the years ended October 31, 2023 and 2022). |
| (7) | Annualized. |
9
See Notes to Financial Statements.
Parametric
Tax-Managed International Equity Fund
April 30, 2024
Financial Highlights — continued
| | Class C |
| | Six Months Ended
April 30, 2024
(Unaudited) | Year Ended October 31, |
| | 2023 | 2022 | 2021 | 2020 | 2019 |
| Net asset value — Beginning of period | $ 10.390 | $ 9.390 | $12.840 | $ 9.900 | $10.690 | $ 9.770 |
| Income (Loss) From Operations | | | | | | |
| Net investment income(1) | $ 0.077 | $ 0.169 | $ 0.133 | $ 0.133 | $ 0.062 | $ 0.119 |
| Net realized and unrealized gain (loss) | 1.312 | 0.931 | (3.431) | 2.807 | (0.701) | 0.886 |
| Total income (loss) from operations | $ 1.389 | $ 1.100 | $ (3.298) | $ 2.940 | $ (0.639) | $ 1.005 |
| Less Distributions | | | | | | |
| From net investment income | $ (0.199) | $ (0.100) | $ (0.152) | $ — | $ (0.151) | $ (0.085) |
| Total distributions | $ (0.199) | $ (0.100) | $ (0.152) | $ — | $ (0.151) | $ (0.085) |
| Net asset value — End of period | $11.580 | $10.390 | $ 9.390 | $12.840 | $ 9.900 | $10.690 |
| Total Return(2)(3) | 13.36% (4) | 11.71% | (25.98)% | 29.70% | (6.11)% | 10.42% |
| Ratios/Supplemental Data | | | | | | |
| Net assets, end of period (000’s omitted) | $ 158 | $ 143 | $ 209 | $ 419 | $ 598 | $ 1,862 |
| Ratios (as a percentage of average daily net assets):(5) | | | | | | |
| Expenses (3) | 1.80% (6)(7) | 1.80% (6) | 1.80% (6) | 1.80% | 1.80% | 1.80% |
| Net investment income | 1.35% (7) | 1.55% | 1.19% | 1.09% | 0.62% | 1.20% |
| Portfolio Turnover of the Portfolio | 11% (4) | 36% | 22% | 23% | 10% | 37% |
| (1) | Computed using average shares outstanding. |
| (2) | Returns are historical and are calculated by determining the percentage change in net asset value with all distributions reinvested and do not reflect the effect of sales charges. |
| (3) | The administrator of the Fund and sub-adviser of the Portfolio reimbursed certain operating expenses (equal to 0.45%, 0.37%, 0.41%, 0.34%, 0.45% and 0.51% of average daily net assets for the six months ended April 30, 2024 and the years ended October 31, 2023, 2022, 2021, 2020 and 2019, respectively). Absent this reimbursement, total return would be lower. |
| (4) | Not annualized. |
| (5) | Includes the Fund’s share of the Portfolio's allocated expenses. |
| (6) | Includes a reduction by the investment adviser of a portion of the Portfolio's adviser fee due to the Portfolio's investment in the Liquidity Fund (equal to less than 0.005% of average daily net assets for the six months ended April 30, 2024 and the years ended October 31, 2023 and 2022). |
| (7) | Annualized. |
10
See Notes to Financial Statements.
Parametric
Tax-Managed International Equity Fund
April 30, 2024
Financial Highlights — continued
| | Class I |
| | Six Months Ended
April 30, 2024
(Unaudited) | Year Ended October 31, |
| | 2023 | 2022 | 2021 | 2020 | 2019 |
| Net asset value — Beginning of period | $ 10.930 | $ 9.880 | $13.520 | $ 10.460 | $ 11.310 | $ 10.350 |
| Income (Loss) From Operations | | | | | | |
| Net investment income(1) | $ 0.138 | $ 0.303 | $ 0.260 | $ 0.289 | $ 0.173 | $ 0.264 |
| Net realized and unrealized gain (loss) | 1.377 | 0.967 | (3.592) | 2.934 | (0.736) | 0.895 |
| Total income (loss) from operations | $ 1.515 | $ 1.270 | $ (3.332) | $ 3.223 | $ (0.563) | $ 1.159 |
| Less Distributions | | | | | | |
| From net investment income | $ (0.335) | $ (0.220) | $ (0.308) | $ (0.163) | $ (0.287) | $ (0.199) |
| Total distributions | $ (0.335) | $ (0.220) | $ (0.308) | $ (0.163) | $ (0.287) | $ (0.199) |
| Net asset value — End of period | $12.110 | $10.930 | $ 9.880 | $13.520 | $10.460 | $11.310 |
| Total Return(2)(3) | 13.86% (4) | 12.87% | (25.19)% | 30.99% | (5.19)% | 11.52% |
| Ratios/Supplemental Data | | | | | | |
| Net assets, end of period (000’s omitted) | $ 18,576 | $ 17,552 | $17,554 | $ 16,335 | $ 11,560 | $ 13,301 |
| Ratios (as a percentage of average daily net assets):(5) | | | | | | |
| Expenses (3) | 0.80% (6)(7) | 0.80% (6) | 0.80% (6) | 0.80% | 0.80% | 0.80% |
| Net investment income | 2.31% (7) | 2.64% | 2.27% | 2.23% | 1.62% | 2.48% |
| Portfolio Turnover of the Portfolio | 11% (4) | 36% | 22% | 23% | 10% | 37% |
| (1) | Computed using average shares outstanding. |
| (2) | Returns are historical and are calculated by determining the percentage change in net asset value with all distributions reinvested. |
| (3) | The administrator of the Fund and sub-adviser of the Portfolio reimbursed certain operating expenses (equal to 0.45%, 0.37%, 0.41%, 0.34%, 0.45% and 0.51% of average daily net assets for the six months ended April 30, 2024 and the years ended October 31, 2023, 2022, 2021, 2020 and 2019, respectively). Absent this reimbursement, total return would be lower. |
| (4) | Not annualized. |
| (5) | Includes the Fund’s share of the Portfolio's allocated expenses. |
| (6) | Includes a reduction by the investment adviser of a portion of the Portfolio's adviser fee due to the Portfolio's investment in the Liquidity Fund (equal to less than 0.005% of average daily net assets for the six months ended April 30, 2024 and the years ended October 31, 2023 and 2022). |
| (7) | Annualized. |
11
See Notes to Financial Statements.
Parametric
Tax-Managed International Equity Fund
April 30, 2024
Notes to Financial Statements (Unaudited)
1 Significant Accounting Policies
Parametric Tax-Managed International Equity Fund (the Fund) is a diversified series of Eaton Vance Mutual Funds Trust (the Trust). The Trust is a Massachusetts business trust registered under the Investment Company Act of 1940, as amended (the 1940 Act), as an open-end management investment company. The Fund offers three classes of shares. Class A shares are generally sold subject to a sales charge imposed at time of purchase. Class A shares are offered at net asset value to shareholders who owned Investor Class shares, which were redesignated as Class A shares on April 29, 2022, and only for such shareholders' accounts established prior to such date. Class C shares are sold at net asset value and are generally subject to a contingent deferred sales charge (see Note 5). Effective March 1, 2013, Class C shares of the Fund are no longer available for purchase, except by existing shareholders (including shares acquired through the reinvestment of dividends and distributions) or employer sponsored retirement plans. Effective November 5, 2020, Class C shares automatically convert to Class A shares eight years after their purchase as described in the Fund’s prospectus. Class I shares are sold at net asset value and are not subject to a sales charge. Each class represents a pro rata interest in the Fund, but votes separately on class-specific matters and (as noted below) is subject to different expenses. Realized and unrealized gains and losses and net investment income and losses, other than class-specific expenses, are allocated daily to each class of shares based on the relative net assets of each class to the total net assets of the Fund. Each class of shares differs in its distribution plan and certain other class-specific expenses. The Fund invests its assets in interests in Tax-Managed International Equity Portfolio (the Portfolio), a Massachusetts business trust, having the same investment objective and policies as the Fund. The value of the Fund’s investment in the Portfolio reflects the Fund’s proportionate interest in the net assets of the Portfolio (52.7% at April 30, 2024). The performance of the Fund is directly affected by the performance of the Portfolio. The financial statements of the Portfolio, including the portfolio of investments, are included elsewhere in this report and should be read in conjunction with the Fund’s financial statements.
The following is a summary of significant accounting policies of the Fund. The policies are in conformity with accounting principles generally accepted in the United States of America (U.S. GAAP). The Fund is an investment company and follows accounting and reporting guidance in the Financial Accounting Standards Board (FASB) Accounting Standards Codification Topic 946.
A Investment Valuation—Valuation of securities by the Portfolio is discussed in Note 1A of the Portfolio's Notes to Financial Statements, which are included elsewhere in this report.
B Income—The Fund's net investment income or loss consists of the Fund's pro rata share of the net investment income or loss of the Portfolio, less all actual and accrued expenses of the Fund.
C Federal Taxes—The Fund’s policy is to comply with the provisions of the Internal Revenue Code applicable to regulated investment companies and to distribute to shareholders each year substantially all of its net investment income, and all or substantially all of its net realized capital gains. Accordingly, no provision for federal income or excise tax is necessary.
As of April 30, 2024, the Fund had no uncertain tax positions that would require financial statement recognition, de-recognition, or disclosure. The Fund files a U.S. federal income tax return annually after its fiscal year-end, which is subject to examination by the Internal Revenue Service for a period of three years from the date of filing.
D Expenses—The majority of expenses of the Trust are directly identifiable to an individual fund. Expenses which are not readily identifiable to a specific fund are allocated taking into consideration, among other things, the nature and type of expense and the relative size of the funds.
E Use of Estimates—The preparation of the financial statements in conformity with U.S. GAAP requires management to make estimates and assumptions that affect the reported amounts of assets and liabilities at the date of the financial statements and the reported amounts of income and expense during the reporting period. Actual results could differ from those estimates.
F Indemnifications—Under the Trust’s organizational documents, its officers and Trustees may be indemnified against certain liabilities and expenses arising out of the performance of their duties to the Fund. Under Massachusetts law, if certain conditions prevail, shareholders of a Massachusetts business trust (such as the Trust) could be deemed to have personal liability for the obligations of the Trust. However, the Trust’s Declaration of Trust contains an express disclaimer of liability on the part of Fund shareholders and the By-laws provide that the Trust shall assume, upon request by the shareholder, the defense on behalf of any Fund shareholders. Moreover, the By-laws also provide for indemnification out of Fund property of any shareholder held personally liable solely by reason of being or having been a shareholder for all loss or expense arising from such liability. Additionally, in the normal course of business, the Fund enters into agreements with service providers that may contain indemnification clauses. The Fund's maximum exposure under these arrangements is unknown as this would involve future claims that may be made against the Fund that have not yet occurred.
G Other—Investment transactions are accounted for on a trade date basis.
H Interim Financial Statements—The interim financial statements relating to April 30, 2024 and for the six months then ended have not been audited by an independent registered public accounting firm, but in the opinion of the Fund’s management, reflect all adjustments, consisting only of normal recurring adjustments, necessary for the fair presentation of the financial statements.
Parametric
Tax-Managed International Equity Fund
April 30, 2024
Notes to Financial Statements (Unaudited) — continued
2 Distributions to Shareholders and Income Tax Information
It is the present policy of the Fund to make at least one distribution annually (normally in December) of all or substantially all of its net investment income and to distribute annually all or substantially all of its net realized capital gains. Distributions to shareholders are recorded on the ex-dividend date. Distributions are declared separately for each class of shares. Shareholders may reinvest income and capital gain distributions in additional shares of the same class of the Fund at the net asset value as of the ex-dividend date or, at the election of the shareholder, receive distributions in cash. Distributions to shareholders are determined in accordance with income tax regulations, which may differ from U.S. GAAP. As required by U.S. GAAP, only distributions in excess of tax basis earnings and profits are reported in the financial statements as a return of capital. Permanent differences between book and tax accounting relating to distributions are reclassified to paid-in capital. For tax purposes, distributions from short-term capital gains are considered to be from ordinary income.
At October 31, 2023, the Fund, for federal income tax purposes, had deferred capital losses of $1,465,203 which would reduce its taxable income arising from future net realized gains on investment transactions, if any, to the extent permitted by the Internal Revenue Code, and thus would reduce the amount of distributions to shareholders, which would otherwise be necessary to relieve the Fund of any liability for federal income or excise tax. The deferred capital losses are treated as arising on the first day of the Fund’s next taxable year and retain the same short-term or long-term character as when originally deferred. Of the deferred capital losses at October 31, 2023, $674,070 are short-term and $791,133 are long-term.
3 Investment Adviser Fee and Other Transactions with Affiliates
The investment adviser fee is earned by Eaton Vance Management (EVM), an indirect, wholly-owned subsidiary of Morgan Stanley, as compensation for investment advisory services rendered to the Fund. The fee is computed at an annual rate as a percentage of the Fund’s average daily net assets that are not invested in other investment companies for which EVM or its affiliates serve as investment adviser and receive an advisory fee as follows and is payable monthly:
| Average Daily Net Assets | Annual Fee Rate |
| Up to $1 billion | 0.500% |
| $1 billion but less than $2.5 billion | 0.475% |
| $2.5 billion but less than $5.0 billion | 0.455% |
| $5 billion and over | 0.440% |
For the six months ended April 30, 2024, the Fund incurred no investment adviser fee on such assets. Pursuant to an investment sub-advisory agreement, EVM has delegated the investment management of the Fund to Parametric Portfolio Associates LLC (Parametric), an affiliate of EVM and an indirect, wholly-owned subsidiary of Morgan Stanley. EVM pays Parametric a portion of its investment adviser fee for sub-advisory services provided to the Fund. To the extent that the Fund’s assets are invested in the Portfolio, the Fund is allocated its share of the Portfolio’s investment adviser fee. The Portfolio has engaged Boston Management and Research (BMR) to render investment advisory services. See Note 2 of the Portfolio’s Notes to Financial Statements which are included elsewhere in this report. EVM also serves as the administrator of the Fund, but receives no compensation.
EVM and Parametric have agreed to reimburse the Fund’s expenses to the extent that total annual operating expenses (relating to ordinary operating expenses only and excluding expenses such as brokerage commissions, acquired fund fees and expenses of unaffiliated funds, borrowing costs, taxes or litigation expenses) exceed 1.05%, 1.80% and 0.80% of the Fund’s average daily net assets for Class A, Class C and Class I, respectively. This agreement may be changed or terminated after March 1, 2025. Pursuant to this agreement, EVM and Parametric were allocated $82,149 in total of the Fund’s operating expenses for the six months ended April 30, 2024.
EVM provides sub-transfer agency and related services to the Fund pursuant to a Sub-Transfer Agency Support Services Agreement. For the six months ended April 30, 2024, EVM earned $7,844 from the Fund pursuant to such agreement, which is included in transfer and dividend disbursing agent fees on the Statement of Operations. The Fund was informed that Eaton Vance Distributors, Inc. (EVD), an affiliate of EVM and the Fund’s principal underwriter, received no sales charge on sales of Class A shares for the six months ended April 30, 2024. EVD received distribution and service fees from Class A and Class C shares (see Note 4).
Trustees and officers of the Fund who are members of EVM’s or BMR’s organizations receive remuneration for their services to the Fund out of the investment adviser fee. Certain officers and Trustees of the Fund and the Portfolio are officers of the above organizations.
4 Distribution Plans
The Fund has in effect a distribution plan for Class A shares (Class A Plan) pursuant to Rule 12b-1 under the 1940 Act. Pursuant to the Class A Plan, the Fund pays EVD a distribution and service fee of 0.25% per annum of its average daily net assets attributable to Class A shares for distribution services and facilities provided to the Fund by EVD, as well as for personal services and/or the maintenance of shareholder accounts. Distribution and service fees paid or accrued to EVD for the six months ended April 30, 2024 amounted to $21,944 for Class A shares.
Parametric
Tax-Managed International Equity Fund
April 30, 2024
Notes to Financial Statements (Unaudited) — continued
The Fund also has in effect a distribution plan for Class C shares (Class C Plan) pursuant to Rule 12b-1 under the 1940 Act. Pursuant to the Class C Plan, the Fund pays EVD amounts equal to 0.75% per annum of its average daily net assets attributable to Class C shares for providing ongoing distribution services and facilities to the Fund. For the six months ended April 30, 2024, the Fund paid or accrued to EVD $590 for Class C shares.
Pursuant to the Class C Plan, the Fund also makes payments of service fees to EVD, financial intermediaries and other persons in amounts equal to 0.25% per annum of its average daily net assets attributable to that class. Service fees paid or accrued are for personal services and/or the maintenance of shareholder accounts. They are separate and distinct from the sales commissions and distribution fees payable to EVD. Service fees paid or accrued for the six months ended April 30, 2024 amounted to $197 for Class C shares.
Distribution and service fees are subject to the limitations contained in the Financial Industry Regulatory Authority Rule 2341(d).
5 Contingent Deferred Sales Charges
A contingent deferred sales charge (CDSC) of 1% generally is imposed on redemptions of Class C shares made within 12 months of purchase. Class A shares may be subject to a 1% CDSC if redeemed within 12 months of purchase (depending on the circumstances of purchase). Redemptions of Class A shares by former Investor Class shareholders are not subject to a CDSC. Generally, the CDSC is based upon the lower of the net asset value at date of redemption or date of purchase. No charge is levied on shares acquired by reinvestment of dividends or capital gain distributions. For the six months ended April 30, 2024, the Fund was informed that EVD received no CDSCs paid by Class A and Class C shareolders.
6 Investment Transactions
For the six months ended April 30, 2024, increases and decreases in the Fund's investment in the Portfolio aggregated $560,295 and $2,983,498, respectively.
7 Shares of Beneficial Interest
The Fund’s Declaration of Trust permits the Trustees to issue an unlimited number of full and fractional shares of beneficial interest (without par value). Such shares may be issued in a number of different series (such as the Fund) and classes. Transactions in Fund shares, including direct exchanges pursuant to share class conversions, were as follows:
| | Six Months Ended
April 30, 2024
(Unaudited) | | Year Ended
October 31, 2023 |
| | Shares | Amount | | Shares | Amount |
| Class A | | | | | |
| Sales | 265,271 | $ 3,256,745 | | 8,655 | $ 99,080 |
| Issued to shareholders electing to receive payments of distributions in Fund shares | 33,690 | 409,670 | | 25,064 | 273,696 |
| Redemptions | (335,364) | (4,011,692) | | (132,188) | (1,488,202) |
| Net decrease | (36,403) | $ (345,277) | | (98,469) | $(1,115,426) |
| Class C | | | | | |
| Sales | 524 | $ 5,997 | | 1,317 | $ 14,422 |
| Issued to shareholders electing to receive payments of distributions in Fund shares | 227 | 2,635 | | 206 | 2,152 |
| Redemptions | (872) | (10,023) | | (9,997) | (108,811) |
| Net decrease | (121) | $ (1,391) | | (8,474) | $ (92,237) |
Parametric
Tax-Managed International Equity Fund
April 30, 2024
Notes to Financial Statements (Unaudited) — continued
| | Six Months Ended
April 30, 2024
(Unaudited) | | Year Ended
October 31, 2023 |
| | Shares | Amount | | Shares | Amount |
| Class I | | | | | |
| Sales | 364,639 | $ 4,360,258 | | 281,604 | $ 3,251,778 |
| Issued to shareholders electing to receive payments of distributions in Fund shares | 42,923 | 519,796 | | 32,490 | 353,494 |
| Redemptions | (479,766) | (5,829,486) | | (485,147) | (5,405,069) |
| Net decrease | (72,204) | $ (949,432) | | (171,053) | $(1,799,797) |
Tax-Managed International Equity Portfolio
April 30, 2024
Portfolio of Investments (Unaudited)
| Security | Shares | Value |
| Australia — 8.2% |
| AGL Energy Ltd. | | 19,216 | $ 117,036 |
| Altium Ltd.(1) | | 3,632 | 153,451 |
| Aristocrat Leisure Ltd. | | 1,761 | 44,941 |
| ASX Ltd.(1) | | 1,525 | 62,296 |
| Atlas Arteria Ltd.(1) | | 13,938 | 46,420 |
| Aurizon Holdings Ltd. | | 14,009 | 34,410 |
| Aussie Broadband Ltd.(1)(2) | | 16,900 | 40,310 |
| BHP Group Ltd.(1) | | 9,711 | 266,335 |
| Brambles Ltd. | | 17,422 | 163,900 |
| CAR Group Ltd. | | 8,634 | 187,215 |
| Centuria Industrial REIT(1) | | 14,596 | 29,803 |
| Charter Hall Long Wale REIT(1) | | 17,564 | 37,991 |
| Charter Hall Retail REIT(1) | | 18,162 | 38,753 |
| Codan Ltd. | | 4,717 | 33,244 |
| Coles Group Ltd. | | 13,689 | 142,766 |
| Commonwealth Bank of Australia | | 2,648 | 194,018 |
| Computershare Ltd. | | 7,415 | 130,269 |
| CSL Ltd. | | 2,969 | 527,520 |
| Data#3 Ltd. | | 7,498 | 36,879 |
| Dexus (1) | | 9,470 | 43,015 |
| Elders Ltd.(1) | | 5,348 | 29,057 |
| Endeavour Group Ltd.(1) | | 13,721 | 47,185 |
| GrainCorp Ltd., Class A(1) | | 5,357 | 29,435 |
| Hansen Technologies Ltd. | | 14,633 | 44,341 |
| HomeCo Daily Needs REIT(1)(3) | | 42,841 | 33,589 |
| Incitec Pivot Ltd. | | 22,926 | 41,166 |
| IRESS Ltd.(1)(2) | | 7,406 | 40,476 |
| Lottery Corp. Ltd. | | 39,582 | 123,476 |
| Medibank Pvt Ltd. | | 16,474 | 37,756 |
| Mirvac Group(1) | | 41,842 | 54,824 |
| National Australia Bank Ltd. | | 6,485 | 140,579 |
| National Storage REIT(1) | | 24,990 | 34,459 |
| New Hope Corp. Ltd.(1) | | 6,072 | 17,664 |
| NEXTDC Ltd.(1)(2) | | 11,247 | 119,392 |
| Northern Star Resources Ltd. | | 2,453 | 23,251 |
| Orica Ltd.(1) | | 4,147 | 48,017 |
| Origin Energy Ltd. | | 36,919 | 233,011 |
| QBE Insurance Group Ltd. | | 5,122 | 58,590 |
| Region RE Ltd.(1) | | 30,802 | 43,180 |
| Rio Tinto Ltd.(1) | | 1,729 | 143,895 |
| Santos Ltd. | | 29,201 | 143,300 |
| Scentre Group(1) | | 43,799 | 88,695 |
| Stockland (1) | | 21,890 | 62,017 |
| Suncorp Group Ltd. | | 5,349 | 57,130 |
| Security | Shares | Value |
| Australia (continued) |
| Tabcorp Holdings Ltd.(1) | | 88,897 | $ 41,712 |
| Technology One Ltd. | | 8,485 | 87,881 |
| Telstra Group Ltd. | | 81,013 | 191,402 |
| TPG Telecom Ltd.(1) | | 26,625 | 76,953 |
| Transurban Group(1) | | 22,607 | 181,499 |
| Vicinity Ltd. | | 39,555 | 48,438 |
| Viva Energy Group Ltd.(4) | | 12,311 | 26,955 |
| Weebit Nano Ltd.(1)(2) | | 7,492 | 15,065 |
| Wesfarmers Ltd. | | 8,581 | 367,603 |
| Whitehaven Coal Ltd. | | 7,762 | 38,395 |
| Woodside Energy Group Ltd. | | 14,983 | 268,450 |
| Woolworths Group Ltd. | | 13,266 | 272,180 |
| Yancoal Australia Ltd.(1) | | 6,032 | 21,534 |
| | | | $ 5,663,124 |
| Austria — 1.1% |
| ams-OSRAM AG(2) | | 11,066 | $ 13,291 |
| ANDRITZ AG(1) | | 1,285 | 70,140 |
| AT&S Austria Technologie & Systemtechnik AG(1) | | 1,360 | 30,200 |
| BAWAG Group AG(4) | | 407 | 24,302 |
| CA Immobilien Anlagen AG(1) | | 2,850 | 92,701 |
| Erste Group Bank AG | | 2,269 | 105,815 |
| Kontron AG | | 1,758 | 35,389 |
| Mayr Melnhof Karton AG(1) | | 268 | 32,072 |
| Oesterreichische Post AG | | 584 | 18,605 |
| OMV AG | | 1,834 | 87,026 |
| PIERER Mobility AG(1) | | 420 | 16,603 |
| RHI Magnesita NV | | 436 | 19,614 |
| Telekom Austria AG(1) | | 8,000 | 68,713 |
| Verbund AG(1) | | 1,207 | 92,204 |
| voestalpine AG(1) | | 1,326 | 35,411 |
| | | | $ 742,086 |
| Belgium — 2.1% |
| Ackermans & van Haaren NV | | 948 | $ 162,949 |
| Aedifica SA | | 737 | 47,093 |
| Ageas SA | | 1,164 | 53,429 |
| Anheuser-Busch InBev SA | | 2,419 | 144,593 |
| Argenx SE(2) | | 53 | 19,799 |
| Colruyt Group NV | | 478 | 22,113 |
| D'ieteren Group | | 715 | 154,242 |
| Elia Group SA(1) | | 1,018 | 98,015 |
| Groupe Bruxelles Lambert NV | | 210 | 15,588 |
| KBC Group NV | | 1,598 | 118,706 |
| Melexis NV(1) | | 896 | 74,875 |
| Montea NV | | 566 | 48,525 |
16
See Notes to Financial Statements.
Tax-Managed International Equity Portfolio
April 30, 2024
Portfolio of Investments (Unaudited) — continued
| Security | Shares | Value |
| Belgium (continued) |
| Proximus SADP | | 7,803 | $ 57,490 |
| Retail Estates NV | | 587 | 40,972 |
| Solvay SA(1) | | 1,865 | 60,246 |
| Syensqo SA(2) | | 1,127 | 104,463 |
| UCB SA(1) | | 1,600 | 212,176 |
| Xior Student Housing NV(3) | | 1,167 | 34,719 |
| | | | $ 1,469,993 |
| Bermuda — 0.1% |
| First Pacific Co. Ltd. | | 108,000 | $ 50,509 |
| | | | $ 50,509 |
| Denmark — 4.2% |
| Carlsberg AS, Class B | | 2,327 | $ 313,011 |
| D/S Norden AS | | 671 | 28,293 |
| Danske Bank AS(1) | | 9,592 | 276,125 |
| DSV AS | | 1,212 | 172,188 |
| FLSmidth & Co. AS(1) | | 866 | 43,216 |
| ISS AS(1) | | 2,025 | 37,915 |
| Matas AS | | 1,729 | 27,852 |
| Novo Nordisk AS, Class B(1) | | 6,511 | 834,985 |
| Novonesis (Novozymes) B, Class B | | 7,287 | 403,530 |
| Orsted AS(1)(2)(4) | | 2,785 | 153,059 |
| Pandora AS | | 2,118 | 322,359 |
| Scandinavian Tobacco Group AS(4) | | 5,079 | 82,047 |
| Topdanmark AS | | 1,587 | 66,208 |
| TORM PLC, Class A(1) | | 907 | 31,331 |
| Tryg AS(1) | | 6,518 | 129,006 |
| | | | $ 2,921,125 |
| Finland — 2.0% |
| Citycon OYJ | | 3,632 | $ 14,859 |
| Elisa OYJ | | 2,763 | 124,582 |
| Fortum OYJ | | 10,228 | 134,778 |
| Huhtamaki OYJ(1) | | 495 | 18,970 |
| Kesko OYJ, Class B | | 7,282 | 124,321 |
| Kojamo OYJ(1)(2) | | 3,939 | 43,513 |
| Kone OYJ, Class B | | 2,736 | 133,372 |
| Neste OYJ | | 4,627 | 104,890 |
| Nokia OYJ | | 31,287 | 113,739 |
| Nordea Bank Abp | | 13,924 | 161,856 |
| Orion OYJ, Class B(1) | | 3,362 | 128,375 |
| Puuilo OYJ | | 2,988 | 32,555 |
| TietoEVRY OYJ(1) | | 956 | 18,041 |
| Tokmanni Group Corp.(1) | | 4,468 | 67,805 |
| Security | Shares | Value |
| Finland (continued) |
| UPM-Kymmene OYJ | | 3,802 | $ 133,241 |
| YIT OYJ(1) | | 9,254 | 19,210 |
| | | | $ 1,374,107 |
| France — 8.7% |
| Air Liquide SA | | 3,247 | $ 635,044 |
| Airbus SE | | 780 | 128,355 |
| AXA SA(1) | | 6,703 | 231,599 |
| BNP Paribas SA | | 3,328 | 239,489 |
| Bollore SE | | 24,936 | 161,853 |
| Bouygues SA(1) | | 1,100 | 40,541 |
| Bureau Veritas SA | | 921 | 26,862 |
| Capgemini SE | | 1,229 | 258,312 |
| Carmila SA | | 1,759 | 29,552 |
| Carrefour SA | | 5,094 | 85,698 |
| Cie Generale des Etablissements Michelin SCA | | 2,492 | 95,739 |
| Credit Agricole SA | | 2,845 | 44,021 |
| Danone SA | | 2,980 | 186,510 |
| Dassault Systemes SE | | 5,415 | 212,549 |
| Edenred SE | | 1,068 | 50,679 |
| Eiffage SA | | 269 | 28,702 |
| Engie SA(1)(2) | | 33,313 | 578,334 |
| Getlink SE | | 2,197 | 37,401 |
| Klepierre SA | | 4,222 | 113,371 |
| L'Oreal SA | | 540 | 253,181 |
| LVMH Moet Hennessy Louis Vuitton SE | | 596 | 489,576 |
| Mercialys SA(1) | | 6,224 | 67,370 |
| Nexity SA | | 2,880 | 32,302 |
| Orange SA | | 30,552 | 340,052 |
| Quadient SA | | 948 | 18,141 |
| Safran SA | | 556 | 120,559 |
| Sanofi SA | | 5,574 | 550,672 |
| Sopra Steria Group | | 385 | 84,299 |
| Thales SA | | 600 | 100,840 |
| TotalEnergies SE | | 8,164 | 592,696 |
| Vinci SA | | 1,159 | 135,807 |
| | | | $ 5,970,106 |
| Germany — 8.6% |
| Allianz SE | | 1,068 | $ 303,082 |
| BASF SE | | 3,177 | 166,464 |
| Bayer AG | | 4,632 | 135,119 |
| Bayerische Motoren Werke AG | | 1,291 | 140,654 |
| Bayerische Motoren Werke AG, PFC Shares | | 792 | 81,379 |
| Brenntag SE | | 725 | 57,857 |
| Covestro AG(2)(4) | | 1,672 | 83,741 |
17
See Notes to Financial Statements.
Tax-Managed International Equity Portfolio
April 30, 2024
Portfolio of Investments (Unaudited) — continued
| Security | Shares | Value |
| Germany (continued) |
| Daimler Truck Holding AG | | 1,859 | $ 83,834 |
| Deutsche Boerse AG | | 659 | 127,050 |
| Deutsche Lufthansa AG(2) | | 5,121 | 36,649 |
| Deutsche Telekom AG | | 24,422 | 559,400 |
| Deutsche Wohnen SE | | 2,022 | 38,146 |
| E.ON SE | | 43,992 | 582,541 |
| Fresenius Medical Care AG | | 1,941 | 81,721 |
| Fresenius SE & Co. KGaA | | 3,336 | 99,547 |
| FUCHS SE, PFC Shares | | 495 | 23,116 |
| GEA Group AG(2) | | 1,075 | 43,387 |
| Grand City Properties SA(2) | | 3,999 | 44,660 |
| Hamborner REIT AG | | 9,515 | 64,921 |
| Hannover Rueck SE | | 220 | 54,570 |
| Heidelberg Materials AG | | 1,493 | 150,249 |
| Henkel AG & Co. KGaA | | 2,701 | 194,225 |
| Henkel AG & Co. KGaA, PFC Shares | | 3,830 | 304,262 |
| Knorr-Bremse AG | | 398 | 29,534 |
| LEG Immobilien SE(2) | | 1,939 | 164,598 |
| Mercedes-Benz Group AG | | 2,924 | 221,174 |
| MTU Aero Engines AG | | 190 | 45,774 |
| Muenchener Rueckversicherungs-Gesellschaft AG in Muenchen | | 361 | 158,771 |
| QIAGEN NV(2) | | 1,682 | 70,226 |
| Rheinmetall AG | | 216 | 119,026 |
| SAP SE | | 3,795 | 685,252 |
| Siemens AG | | 1,574 | 294,863 |
| Suedzucker AG | | 9,335 | 133,235 |
| Symrise AG | | 1,413 | 151,462 |
| Talanx AG | | 431 | 32,417 |
| Volkswagen AG, PFC Shares | | 790 | 96,779 |
| Vonovia SE | | 8,759 | 253,100 |
| | | | $ 5,912,785 |
| Hong Kong — 4.2% |
| AIA Group Ltd. | | 37,200 | $ 272,466 |
| ASMPT Ltd. | | 6,100 | 75,809 |
| Bank of East Asia Ltd. | | 52,200 | 65,725 |
| Beijing Tong Ren Tang Chinese Medicine Co. Ltd.(1) | | 21,000 | 25,559 |
| BOC Hong Kong Holdings Ltd. | | 11,500 | 35,249 |
| Budweiser Brewing Co. APAC Ltd.(4) | | 17,700 | 24,624 |
| Cathay Pacific Airways Ltd.(1) | | 81,000 | 87,200 |
| China Traditional Chinese Medicine Holdings Co. Ltd.(1) | | 128,000 | 69,699 |
| Chow Sang Sang Holdings International Ltd. | | 42,000 | 45,124 |
| Chow Tai Fook Jewellery Group Ltd. | | 59,000 | 80,278 |
| CK Asset Holdings Ltd. | | 13,500 | 57,585 |
| CK Hutchison Holdings Ltd. | | 22,500 | 109,277 |
| Security | Shares | Value |
| Hong Kong (continued) |
| CLP Holdings Ltd. | | 23,000 | $ 180,919 |
| C-Mer Eye Care Holdings Ltd.(2)(3) | | 44,000 | 16,581 |
| DFI Retail Group Holdings Ltd. | | 23,400 | 45,435 |
| Galaxy Entertainment Group Ltd. | | 20,000 | 89,738 |
| Giordano International Ltd. | | 154,000 | 39,301 |
| Hang Lung Group Ltd. | | 75,000 | 88,997 |
| Hang Seng Bank Ltd. | | 6,200 | 81,757 |
| HK Electric Investments & HK Electric Investments Ltd.(3) | | 154,000 | 92,127 |
| HKT Trust & HKT Ltd. | | 199,000 | 219,691 |
| Hong Kong Resources Holdings Co. Ltd.(2) | | 984 | 119 |
| Hongkong Land Holdings Ltd. | | 6,900 | 22,047 |
| Hutchison Telecommunications Hong Kong Holdings Ltd. | | 238,000 | 31,307 |
| Jardine Matheson Holdings Ltd. | | 2,900 | 110,981 |
| Luk Fook Holdings International Ltd. | | 24,000 | 57,537 |
| MTR Corp. Ltd. | | 7,500 | 24,648 |
| NWS Holdings Ltd. | | 96,000 | 81,153 |
| Orbusneich Medical Group Holdings Ltd.(2) | | 18,500 | 8,814 |
| PAX Global Technology Ltd. | | 75,000 | 62,751 |
| Power Assets Holdings Ltd. | | 30,000 | 172,085 |
| Sino Land Co. Ltd. | | 22,000 | 23,522 |
| Sun Hung Kai Properties Ltd. | | 14,500 | 133,762 |
| Swire Pacific Ltd., Class B | | 37,500 | 50,947 |
| Vitasoy International Holdings Ltd. | | 30,000 | 22,391 |
| VSTECS Holdings Ltd. | | 60,000 | 38,206 |
| VTech Holdings Ltd. | | 10,000 | 57,802 |
| Wharf Holdings Ltd.(1) | | 17,000 | 54,695 |
| Yue Yuen Industrial Holdings Ltd. | | 57,500 | 101,807 |
| | | | $ 2,857,715 |
| Ireland — 1.7% |
| Bank of Ireland Group PLC | | 24,074 | $ 256,856 |
| CRH PLC | | 3,349 | 259,349 |
| DCC PLC | | 2,298 | 156,932 |
| Fineos Corp. Ltd. CDI(2) | | 16,777 | 19,528 |
| ICON PLC(2) | | 816 | 243,070 |
| Irish Residential Properties REIT PLC | | 33,524 | 35,424 |
| Kerry Group PLC, Class A | | 2,357 | 202,840 |
| | | | $ 1,173,999 |
| Israel — 2.0% |
| Amot Investments Ltd. | | 5,499 | $ 23,064 |
| Azrieli Group Ltd. | | 509 | 32,749 |
| Bank Hapoalim BM | | 6,278 | 56,555 |
| Bank Leumi Le-Israel BM | | 7,076 | 55,137 |
| Bezeq The Israeli Telecommunication Corp. Ltd. | | 74,540 | 92,365 |
| Check Point Software Technologies Ltd.(2) | | 385 | 57,527 |
18
See Notes to Financial Statements.
Tax-Managed International Equity Portfolio
April 30, 2024
Portfolio of Investments (Unaudited) — continued
| Security | Shares | Value |
| Israel (continued) |
| Delek Automotive Systems Ltd. | | 5,228 | $ 29,449 |
| Delek Group Ltd. | | 592 | 69,538 |
| Elbit Systems Ltd. | | 375 | 76,334 |
| Enlight Renewable Energy Ltd.(2) | | 4,083 | 65,624 |
| Fattal Holdings 1998 Ltd.(2) | | 339 | 41,129 |
| Fox Wizel Ltd. | | 492 | 39,065 |
| Hilan Ltd. | | 404 | 22,681 |
| ICL Group Ltd. | | 25,308 | 118,795 |
| Maytronics Ltd. | | 2,874 | 24,569 |
| Melisron Ltd. | | 379 | 25,999 |
| Nice Ltd.(2) | | 248 | 55,455 |
| Nova Ltd.(2) | | 138 | 23,354 |
| Oil Refineries Ltd. | | 76,583 | 22,189 |
| OPC Energy Ltd.(2) | | 4,225 | 31,740 |
| OY Nofar Energy Ltd.(2) | | 1,707 | 42,576 |
| Partner Communications Co. Ltd.(2) | | 9,362 | 43,754 |
| Plus500 Ltd. | | 1,094 | 29,592 |
| Reit 1 Ltd. | | 4,966 | 19,959 |
| Shapir Engineering & Industry Ltd.(2) | | 3,467 | 18,914 |
| Shufersal Ltd. | | 11,960 | 78,745 |
| Strauss Group Ltd. | | 2,438 | 44,785 |
| Teva Pharmaceutical Industries Ltd. ADR(2) | | 10,532 | 147,975 |
| | | | $ 1,389,618 |
| Italy — 4.2% |
| Assicurazioni Generali SpA | | 4,184 | $ 102,016 |
| Banca Popolare di Sondrio SpA | | 2,091 | 17,470 |
| Banco BPM SpA(1) | | 5,911 | 38,809 |
| BPER Banca SpA | | 5,464 | 28,376 |
| Buzzi SpA | | 2,134 | 76,889 |
| Cementir Holding NV | | 1,427 | 15,110 |
| Davide Campari-Milano NV | | 14,115 | 141,556 |
| De’Longhi SpA | | 1,200 | 39,351 |
| Enav SpA(4) | | 5,309 | 21,834 |
| Enel SpA | | 40,123 | 263,706 |
| Eni SpA | | 21,987 | 353,148 |
| Ferrari NV | | 355 | 146,002 |
| Infrastrutture Wireless Italiane SpA(4) | | 17,191 | 184,235 |
| Italgas SpA | | 7,381 | 40,914 |
| Italmobiliare SpA | | 1,360 | 50,029 |
| Leonardo SpA | | 5,068 | 116,473 |
| Prysmian SpA | | 3,762 | 204,120 |
| RAI Way SpA(4) | | 4,122 | 23,409 |
| Recordati Industria Chimica e Farmaceutica SpA | | 4,029 | 214,397 |
| Stellantis NV(1) | | 6,033 | 133,489 |
| Stevanato Group SpA(1) | | 1,200 | 33,648 |
| Security | Shares | Value |
| Italy (continued) |
| STMicroelectronics NV | | 7,572 | $ 300,029 |
| Technogym SpA(4) | | 2,741 | 25,849 |
| Terna - Rete Elettrica Nazionale | | 8,968 | 71,851 |
| UniCredit SpA | | 5,306 | 194,753 |
| UnipolSai Assicurazioni SpA | | 10,716 | 30,683 |
| | | | $ 2,868,146 |
| Japan — 12.7% |
| Activia Properties, Inc. | | 16 | $ 39,711 |
| Advance Residence Investment Corp. | | 34 | 73,508 |
| Aeon Co. Ltd.(1) | | 4,300 | 89,906 |
| Air Water, Inc. | | 2,000 | 30,030 |
| Alfresa Holdings Corp. | | 3,600 | 53,350 |
| ANA Holdings, Inc. | | 1,100 | 20,891 |
| Asahi Kasei Corp. | | 8,100 | 56,474 |
| Astellas Pharma, Inc. | | 1,300 | 12,477 |
| Bandai Namco Holdings, Inc. | | 2,400 | 44,844 |
| Bridgestone Corp. | | 1,600 | 70,603 |
| Canon, Inc. | | 1,500 | 40,598 |
| Central Japan Railway Co. | | 1,500 | 34,302 |
| Chubu Electric Power Co., Inc. | | 8,600 | 110,389 |
| Concordia Financial Group Ltd. | | 10,800 | 58,192 |
| Daicel Corp. | | 3,900 | 36,224 |
| Daiichi Sankyo Co. Ltd. | | 6,400 | 215,409 |
| Daiwa House Industry Co. Ltd. | | 5,600 | 157,578 |
| East Japan Railway Co. | | 2,700 | 49,488 |
| Electric Power Development Co. Ltd. | | 2,500 | 42,467 |
| ENEOS Holdings, Inc. | | 31,200 | 144,151 |
| FUJIFILM Holdings Corp. | | 1,500 | 31,909 |
| Fujitsu Ltd. | | 3,000 | 46,344 |
| Fukuoka Financial Group, Inc. | | 1,600 | 42,500 |
| Hamamatsu Photonics KK | | 700 | 25,649 |
| Hirose Electric Co. Ltd. | | 315 | 33,436 |
| Honda Motor Co. Ltd. | | 5,700 | 64,852 |
| Inpex Corp. | | 5,000 | 74,899 |
| Invincible Investment Corp. | | 167 | 74,823 |
| ITOCHU Corp.(1) | | 1,900 | 85,718 |
| Iwatani Corp. | | 1,800 | 102,208 |
| Japan Hotel REIT Investment Corp. | | 145 | 76,197 |
| Japan Logistics Fund, Inc. | | 29 | 51,708 |
| Japan Metropolitan Fund Investment Corp. | | 93 | 56,147 |
| Japan Post Bank Co. Ltd. | | 6,000 | 60,902 |
| Japan Post Holdings Co. Ltd. | | 7,500 | 72,025 |
| Japan Prime Realty Investment Corp. | | 22 | 47,605 |
| Japan Real Estate Investment Corp. | | 4 | 13,565 |
| Japan Tobacco, Inc. | | 4,100 | 110,297 |
19
See Notes to Financial Statements.
Tax-Managed International Equity Portfolio
April 30, 2024
Portfolio of Investments (Unaudited) — continued
| Security | Shares | Value |
| Japan (continued) |
| JFE Holdings, Inc. | | 1,900 | $ 28,359 |
| Kansai Electric Power Co., Inc. | | 7,200 | 107,852 |
| Kansai Paint Co. Ltd. | | 3,300 | 42,960 |
| Kao Corp. | | 2,100 | 86,630 |
| KDDI Corp. | | 6,400 | 177,592 |
| KDX Realty Investment Corp.(1) | | 15 | 14,795 |
| Keyence Corp. | | 400 | 175,908 |
| Kintetsu Group Holdings Co. Ltd. | | 800 | 20,567 |
| Kirin Holdings Co. Ltd. | | 3,800 | 55,471 |
| Kobe Steel Ltd. | | 3,000 | 36,617 |
| Komatsu Ltd. | | 2,200 | 65,684 |
| Kuraray Co. Ltd. | | 2,300 | 25,482 |
| Kyocera Corp. | | 3,600 | 43,879 |
| Kyowa Kirin Co. Ltd. | | 3,500 | 58,778 |
| Lion Corp. | | 5,400 | 48,427 |
| Marubeni Corp. | | 3,400 | 60,576 |
| Maruichi Steel Tube Ltd. | | 1,200 | 30,898 |
| MatsukiyoCocokara & Co. | | 2,700 | 38,288 |
| Medipal Holdings Corp. | | 4,700 | 73,710 |
| MEIJI Holdings Co. Ltd. | | 1,600 | 35,799 |
| Mitsubishi Chemical Group Corp. | | 10,000 | 58,339 |
| Mitsubishi Corp. | | 4,200 | 96,052 |
| Mitsubishi Electric Corp. | | 3,200 | 55,776 |
| Mitsubishi HC Capital, Inc. | | 6,100 | 39,504 |
| Mitsubishi Heavy Industries Ltd. | | 6,000 | 53,647 |
| Mitsui & Co. Ltd. | | 1,800 | 86,896 |
| Mitsui Chemicals, Inc. | | 1,300 | 37,002 |
| Mitsui OSK Lines Ltd.(1) | | 1,100 | 34,914 |
| Mizuho Financial Group, Inc. | | 5,630 | 108,823 |
| MS&AD Insurance Group Holdings, Inc. | | 5,400 | 97,087 |
| Murata Manufacturing Co. Ltd. | | 4,500 | 82,225 |
| NEC Corp. | | 1,500 | 108,603 |
| NH Foods Ltd. | | 1,600 | 52,634 |
| Nihon Kohden Corp. | | 1,000 | 27,188 |
| Nintendo Co. Ltd. | | 6,000 | 292,614 |
| Nippon Accommodations Fund, Inc. | | 8 | 33,316 |
| Nippon Building Fund, Inc. | | 5 | 19,104 |
| Nippon Shokubai Co. Ltd. | | 2,400 | 22,812 |
| Nippon Steel Corp. | | 4,400 | 98,643 |
| Nippon Telegraph & Telephone Corp. | | 180,100 | 194,447 |
| Nippon Yusen KK | | 1,200 | 34,069 |
| Nisshin Seifun Group, Inc. | | 4,900 | 63,920 |
| Nissin Foods Holdings Co. Ltd. | | 2,100 | 56,040 |
| Nitori Holdings Co. Ltd. | | 300 | 40,150 |
| Nitto Denko Corp. | | 500 | 41,343 |
| Nomura Real Estate Master Fund, Inc. | | 63 | 60,223 |
| Security | Shares | Value |
| Japan (continued) |
| Nomura Research Institute Ltd. | | 2,000 | $ 48,396 |
| NTT Data Group Corp. | | 4,400 | 68,806 |
| Obic Co. Ltd. | | 300 | 38,540 |
| Oji Holdings Corp. | | 12,700 | 49,746 |
| Oriental Land Co. Ltd. | | 2,500 | 68,979 |
| Osaka Gas Co. Ltd. | | 5,500 | 122,297 |
| Otsuka Holdings Co. Ltd. | | 2,800 | 119,719 |
| Pan Pacific International Holdings Corp. | | 2,000 | 46,972 |
| Panasonic Holdings Corp. | | 5,400 | 47,134 |
| Resona Holdings, Inc. | | 6,700 | 42,369 |
| Rohm Co. Ltd. | | 800 | 11,500 |
| Rohto Pharmaceutical Co. Ltd. | | 1,600 | 31,217 |
| Santen Pharmaceutical Co. Ltd. | | 7,500 | 72,443 |
| Secom Co. Ltd. | | 600 | 41,677 |
| Sekisui House Ltd. | | 2,000 | 45,961 |
| Sekisui House Reit, Inc.(1) | | 97 | 49,703 |
| Shimadzu Corp. | | 1,200 | 32,602 |
| Shionogi & Co. Ltd. | | 2,100 | 98,072 |
| Shizuoka Financial Group, Inc. | | 5,800 | 54,136 |
| SoftBank Corp. | | 14,500 | 174,894 |
| Sompo Holdings, Inc. | | 3,600 | 71,244 |
| Subaru Corp. | | 2,400 | 53,590 |
| Sumitomo Chemical Co. Ltd. | | 10,900 | 23,287 |
| Sumitomo Corp. | | 2,400 | 63,113 |
| Sumitomo Electric Industries Ltd. | | 2,900 | 44,823 |
| Sumitomo Mitsui Financial Group, Inc. | | 2,700 | 153,370 |
| Sumitomo Mitsui Trust Holdings, Inc. | | 3,000 | 63,074 |
| Suntory Beverage & Food Ltd. | | 1,600 | 52,056 |
| Suzuki Motor Corp. | | 2,400 | 27,950 |
| Taiheiyo Cement Corp. | | 2,500 | 57,181 |
| Takeda Pharmaceutical Co. Ltd. | | 5,600 | 147,180 |
| TDK Corp. | | 600 | 26,767 |
| Teijin Ltd. | | 3,300 | 32,194 |
| Tohoku Electric Power Co., Inc. | | 9,800 | 75,657 |
| Tokio Marine Holdings, Inc. | | 3,400 | 107,462 |
| Tokyu Corp.(1) | | 3,200 | 37,880 |
| TOPPAN Holdings, Inc. | | 2,000 | 47,448 |
| Toray Industries, Inc. | | 6,900 | 31,538 |
| Tosoh Corp. | | 2,200 | 30,329 |
| Toyo Seikan Group Holdings Ltd. | | 2,900 | 44,826 |
| Toyo Suisan Kaisha Ltd. | | 1,000 | 62,534 |
| Toyota Motor Corp. | | 14,700 | 335,286 |
| Trend Micro, Inc. | | 600 | 29,567 |
| United Urban Investment Corp. | | 68 | 65,157 |
| West Japan Railway Co. | | 1,400 | 26,574 |
| Yakult Honsha Co. Ltd. | | 2,000 | 39,119 |
20
See Notes to Financial Statements.
Tax-Managed International Equity Portfolio
April 30, 2024
Portfolio of Investments (Unaudited) — continued
| Security | Shares | Value |
| Japan (continued) |
| Yamaha Motor Co. Ltd.(1) | | 2,300 | $ 21,453 |
| Yamato Holdings Co. Ltd. | | 2,000 | 26,413 |
| Yamato Kogyo Co. Ltd. | | 1,000 | 53,729 |
| Yamazaki Baking Co. Ltd. | | 1,300 | 31,464 |
| | | | $ 8,722,447 |
| Netherlands — 4.4% |
| ABN AMRO Bank NV(1)(4) | | 2,263 | $ 36,250 |
| Akzo Nobel NV | | 1,254 | 82,741 |
| ASML Holding NV | | 646 | 562,674 |
| ASR Nederland NV(1) | | 1,620 | 81,064 |
| DSM-Firmenich AG | | 1,849 | 207,374 |
| Eurocommercial Properties NV | | 825 | 18,764 |
| Euronext NV(4) | | 576 | 51,869 |
| EXOR NV | | 350 | 38,211 |
| Fugro NV | | 1,341 | 32,526 |
| Heineken NV | | 371 | 36,106 |
| Koninklijke Ahold Delhaize NV | | 9,251 | 280,807 |
| Koninklijke KPN NV | | 65,476 | 237,948 |
| Koninklijke Philips NV | | 11,510 | 305,662 |
| NN Group NV | | 1,992 | 91,893 |
| Pharming Group NV(2) | | 82,396 | 76,739 |
| Prosus NV(1) | | 11,033 | 369,164 |
| SBM Offshore NV(1) | | 4,496 | 66,422 |
| Universal Music Group NV(1) | | 7,168 | 210,848 |
| Wolters Kluwer NV | | 1,682 | 251,806 |
| | | | $ 3,038,868 |
| New Zealand — 1.1% |
| a2 Milk Co. Ltd.(1)(2) | | 23,344 | $ 91,953 |
| Argosy Property Ltd. | | 39,042 | 25,813 |
| Auckland International Airport Ltd.(1) | | 12,240 | 56,586 |
| Contact Energy Ltd. | | 9,580 | 48,910 |
| Fisher & Paykel Healthcare Corp. Ltd. | | 5,931 | 99,331 |
| Goodman Property Trust | | 27,739 | 37,203 |
| Heartland Group Holdings Ltd.(1) | | 19,544 | 12,195 |
| Infratil Ltd. | | 6,421 | 41,228 |
| Kiwi Property Group Ltd.(1) | | 57,056 | 27,166 |
| KMD Brands Ltd. | | 27,332 | 8,689 |
| Meridian Energy Ltd. | | 15,507 | 54,691 |
| SKYCITY Entertainment Group Ltd.(1) | | 29,814 | 31,245 |
| Spark New Zealand Ltd. | | 30,866 | 86,738 |
| Vulcan Steel Ltd. | | 3,600 | 17,551 |
| Xero Ltd.(2) | | 1,060 | 82,296 |
| | | | $ 721,595 |
| Security | Shares | Value |
| Norway — 2.1% |
| Atea ASA | | 2,752 | $ 35,134 |
| Austevoll Seafood ASA | | 3,899 | 31,134 |
| Borregaard ASA | | 3,526 | 60,397 |
| Crayon Group Holding ASA(2)(4) | | 5,673 | 41,746 |
| DNB Bank ASA | | 7,243 | 126,239 |
| Elkem ASA(4) | | 14,511 | 25,355 |
| Elmera Group ASA(4) | | 5,269 | 15,707 |
| Entra ASA(2)(4) | | 2,972 | 27,351 |
| Equinor ASA | | 6,266 | 166,728 |
| Europris ASA(2)(4) | | 6,059 | 38,134 |
| Frontline PLC | | 890 | 21,089 |
| Gjensidige Forsikring ASA | | 1,701 | 27,273 |
| Golden Ocean Group Ltd. | | 3,420 | 48,061 |
| Kitron ASA | | 9,412 | 24,200 |
| Kongsberg Gruppen ASA | | 1,873 | 132,221 |
| Mowi ASA | | 5,946 | 104,393 |
| Opera Ltd. ADR(1) | | 3,500 | 43,680 |
| Orkla ASA | | 8,207 | 55,827 |
| REC Silicon ASA(2) | | 16,371 | 15,815 |
| Scatec ASA(2)(4) | | 3,300 | 24,084 |
| Schibsted ASA, Class B | | 2,498 | 69,786 |
| SpareBank 1 Nord Norge | | 3,559 | 32,115 |
| Stolt-Nielsen Ltd. | | 879 | 37,430 |
| Telenor ASA | | 11,887 | 136,662 |
| Ultimovacs ASA(2) | | 1,725 | 1,074 |
| Wallenius Wilhelmsen ASA | | 2,828 | 28,485 |
| Yara International ASA | | 2,956 | 84,261 |
| | | | $ 1,454,381 |
| Portugal — 1.2% |
| Altri SGPS SA | | 6,651 | $ 36,650 |
| Banco Comercial Portugues SA, Class R(2) | | 449,035 | 156,780 |
| EDP - Energias de Portugal SA(1)(2) | | 23,649 | 88,806 |
| Galp Energia SGPS SA | | 8,111 | 174,234 |
| Jeronimo Martins SGPS SA | | 4,742 | 97,551 |
| Mota-Engil SGPS SA | | 12,306 | 53,258 |
| Navigator Co. SA | | 23,179 | 102,377 |
| NOS SGPS SA | | 11,659 | 40,270 |
| REN - Redes Energeticas Nacionais SGPS SA | | 11,590 | 27,984 |
| Sonae SGPS SA | | 15,693 | 15,713 |
| | | | $ 793,623 |
| Singapore — 4.2% |
| AEM Holdings Ltd.(1) | | 9,200 | $ 15,745 |
| BW LPG Ltd.(4) | | 3,082 | 44,506 |
| CapitaLand Ascendas REIT | | 17,300 | 32,770 |
21
See Notes to Financial Statements.
Tax-Managed International Equity Portfolio
April 30, 2024
Portfolio of Investments (Unaudited) — continued
| Security | Shares | Value |
| Singapore (continued) |
| CapitaLand Ascott Trust | | 27,455 | $ 18,235 |
| CapitaLand Integrated Commercial Trust | | 56,100 | 79,970 |
| City Developments Ltd. | | 7,700 | 34,511 |
| ComfortDelGro Corp. Ltd. | | 52,800 | 57,432 |
| DBS Group Holdings Ltd. | | 9,900 | 252,028 |
| First Resources Ltd. | | 32,600 | 33,585 |
| Flex Ltd.(2) | | 11,457 | 328,243 |
| Frasers Centrepoint Trust | | 12,700 | 20,117 |
| Genting Singapore Ltd. | | 244,700 | 163,305 |
| Golden Agri-Resources Ltd. | | 210,900 | 42,419 |
| Haw Par Corp. Ltd. | | 4,700 | 33,757 |
| Hutchison Port Holdings Trust | | 154,600 | 19,770 |
| Jardine Cycle & Carriage Ltd. | | 2,500 | 48,246 |
| Keppel Ltd. | | 19,800 | 99,038 |
| Keppel REIT | | 55,680 | 35,752 |
| Lendlease Global Commercial REIT(1) | | 77,600 | 30,864 |
| Mapletree Industrial Trust | | 27,660 | 45,800 |
| Nanofilm Technologies International Ltd.(1)(3) | | 113,000 | 53,373 |
| Netlink NBN Trust(3) | | 153,700 | 96,190 |
| Oversea-Chinese Banking Corp. Ltd. | | 18,900 | 196,212 |
| Parkway Life Real Estate Investment Trust | | 13,500 | 35,436 |
| Raffles Medical Group Ltd. | | 38,400 | 28,123 |
| SATS Ltd.(2) | | 26,000 | 47,749 |
| Sembcorp Industries Ltd. | | 51,100 | 199,702 |
| Sheng Siong Group Ltd. | | 41,900 | 47,497 |
| Singapore Exchange Ltd. | | 7,000 | 47,751 |
| Singapore Post Ltd. | | 55,300 | 18,207 |
| Singapore Technologies Engineering Ltd. | | 26,800 | 78,725 |
| Singapore Telecommunications Ltd. | | 141,700 | 245,747 |
| StarHub Ltd. | | 35,800 | 30,609 |
| Suntec Real Estate Investment Trust(1) | | 27,000 | 21,286 |
| Venture Corp. Ltd. | | 7,500 | 79,464 |
| Wilmar International Ltd. | | 103,000 | 242,109 |
| | | | $ 2,904,273 |
| Spain — 4.6% |
| ACS Actividades de Construccion y Servicios SA | | 2,126 | $ 85,147 |
| Almirall SA(1) | | 2,798 | 25,536 |
| Banco Bilbao Vizcaya Argentaria SA | | 20,066 | 216,993 |
| Banco de Sabadell SA | | 19,790 | 37,803 |
| Bankinter SA(1) | | 12,265 | 96,945 |
| CaixaBank SA | | 15,438 | 81,413 |
| Cia de Distribucion Integral Logista Holdings SA | | 2,665 | 72,486 |
| Ence Energia y Celulosa SA | | 9,147 | 32,578 |
| Ercros SA | | 8,525 | 32,004 |
| Ferrovial SE | | 5,370 | 193,134 |
| Security | Shares | Value |
| Spain (continued) |
| Grifols SA(2) | | 11,886 | $ 108,786 |
| Iberdrola SA(1) | | 25,708 | 315,221 |
| Indra Sistemas SA(1) | | 3,340 | 63,850 |
| Industria de Diseno Textil SA(1) | | 10,558 | 480,716 |
| Laboratorios Farmaceuticos Rovi SA | | 1,773 | 159,116 |
| Merlin Properties Socimi SA | | 15,993 | 179,908 |
| Metrovacesa SA(2)(4) | | 2,900 | 26,732 |
| Redeia Corp. SA | | 2,456 | 40,999 |
| Repsol SA | | 24,739 | 388,305 |
| Telefonica SA | | 88,860 | 398,057 |
| Vidrala SA | | 739 | 77,709 |
| Viscofan SA(1) | | 825 | 52,453 |
| | | | $ 3,165,891 |
| Sweden — 4.4% |
| Alfa Laval AB(1) | | 1,197 | $ 50,962 |
| Alleima AB | | 7,335 | 45,590 |
| Arjo AB, Class B | | 8,801 | 36,938 |
| Assa Abloy AB, Class B | | 1,494 | 39,474 |
| Atrium Ljungberg AB, Class B | | 2,504 | 44,258 |
| Betsson AB, Class B | | 1,812 | 20,029 |
| Bilia AB, Class A(1) | | 2,195 | 27,569 |
| BioArctic AB(2)(4) | | 1,352 | 23,791 |
| Boliden AB(1) | | 2,585 | 84,955 |
| BoneSupport Holding AB(2)(4) | | 2,221 | 45,133 |
| Camurus AB(2) | | 677 | 30,359 |
| Cibus Nordic Real Estate AB(1) | | 2,069 | 26,947 |
| Dios Fastigheter AB(1) | | 3,475 | 26,550 |
| Electrolux AB, Class B(1)(2) | | 1,813 | 15,765 |
| Elekta AB, Class B | | 7,161 | 50,992 |
| Epiroc AB, Class A | | 2,897 | 53,558 |
| Epiroc AB, Class B | | 1,712 | 28,378 |
| Essity AB, Class B | | 13,789 | 344,032 |
| Evolution AB(4) | | 1,309 | 144,625 |
| Fabege AB(1) | | 3,866 | 29,568 |
| H & M Hennes & Mauritz AB, Class B(1) | | 4,833 | 76,820 |
| Hemnet Group AB | | 1,721 | 44,727 |
| Hexagon AB, Class B(1) | | 13,262 | 138,733 |
| Holmen AB, Class B(1) | | 2,015 | 78,479 |
| Hufvudstaden AB, Class A(1) | | 2,401 | 27,889 |
| Investor AB, Class B(1) | | 3,101 | 75,952 |
| Kindred Group PLC SDR | | 2,181 | 24,438 |
| L E Lundbergforetagen AB, Class B(1) | | 987 | 48,647 |
| Millicom International Cellular SA SDR(2) | | 3,136 | 64,346 |
| Mycronic AB | | 1,879 | 65,397 |
| Nyfosa AB | | 5,192 | 44,915 |
22
See Notes to Financial Statements.
Tax-Managed International Equity Portfolio
April 30, 2024
Portfolio of Investments (Unaudited) — continued
| Security | Shares | Value |
| Sweden (continued) |
| Olink Holding AB ADR(2) | | 700 | $ 16,121 |
| Orron Energy AB(1)(2) | | 4,713 | 3,102 |
| Pandox AB(1) | | 1,960 | 30,310 |
| Paradox Interactive AB | | 1,527 | 23,087 |
| Skandinaviska Enskilda Banken AB, Class A | | 7,648 | 100,161 |
| Skanska AB, Class B | | 1,238 | 21,267 |
| SKF AB, Class B | | 2,466 | 50,696 |
| Spotify Technology SA(2) | | 1,019 | 285,768 |
| Svenska Cellulosa AB SCA, Class B | | 9,048 | 132,601 |
| Swedbank AB, Class A | | 4,828 | 92,322 |
| Swedish Orphan Biovitrum AB(2) | | 3,775 | 97,444 |
| Telefonaktiebolaget LM Ericsson, Class B | | 20,602 | 104,553 |
| Tethys Oil AB | | 4,284 | 14,154 |
| Trelleborg AB, Class B(1) | | 1,004 | 35,383 |
| Volvo AB, Class B | | 3,167 | 80,610 |
| Wallenstam AB, Class B(1) | | 5,276 | 23,322 |
| Wihlborgs Fastigheter AB(1) | | 6,283 | 52,624 |
| | | | $ 3,023,341 |
| Switzerland — 8.0% |
| ABB Ltd. | | 5,264 | $ 255,770 |
| ALSO Holding AG | | 245 | 60,348 |
| Baloise Holding AG | | 396 | 59,841 |
| Banque Cantonale Vaudoise(1) | | 570 | 59,607 |
| BKW AG | | 330 | 48,985 |
| Cembra Money Bank AG | | 670 | 51,222 |
| Cie Financiere Richemont SA, Class A | | 5,772 | 797,846 |
| DKSH Holding AG | | 773 | 50,376 |
| Flughafen Zurich AG | | 295 | 59,059 |
| Forbo Holding AG | | 26 | 30,030 |
| Galenica AG(1)(4) | | 858 | 65,653 |
| Givaudan SA | | 88 | 376,356 |
| Helvetia Holding AG(1) | | 425 | 55,592 |
| Holcim AG | | 5,395 | 451,603 |
| Intershop Holding AG | | 390 | 52,259 |
| Kuehne & Nagel International AG | | 464 | 122,634 |
| Landis & Gyr Group AG | | 1,111 | 82,196 |
| Logitech International SA | | 2,732 | 212,706 |
| Nestle SA | | 6,891 | 691,857 |
| Novartis AG | | 3,416 | 331,548 |
| PSP Swiss Property AG | | 379 | 46,852 |
| Roche Holding AG | | 1,250 | 299,518 |
| Schindler Holding AG | | 320 | 77,969 |
| Schindler Holding AG PC | | 353 | 87,987 |
| SGS SA | | 900 | 79,250 |
| Stadler Rail AG | | 1,511 | 44,827 |
| Security | Shares | Value |
| Switzerland (continued) |
| Swatch Group AG, Bearer Shares | | 279 | $ 58,621 |
| Swiss Life Holding AG | | 172 | 116,058 |
| Swiss Prime Site AG | | 1,669 | 154,103 |
| Swiss Re AG | | 1,223 | 132,947 |
| Swisscom AG | | 366 | 200,790 |
| Zurich Insurance Group AG | | 617 | 298,657 |
| | | | $ 5,513,067 |
| United Kingdom — 9.0% |
| Admiral Group PLC | | 1,759 | $ 59,871 |
| Airtel Africa PLC(4) | | 11,960 | 16,516 |
| Assura PLC | | 41,543 | 21,269 |
| AstraZeneca PLC | | 3,884 | 587,451 |
| Aviva PLC | | 12,379 | 71,874 |
| B&M European Value Retail SA | | 4,833 | 31,190 |
| Babcock International Group PLC | | 2,639 | 16,700 |
| BAE Systems PLC | | 5,635 | 93,723 |
| Berkeley Group Holdings PLC | | 509 | 29,891 |
| Big Yellow Group PLC | | 5,278 | 71,001 |
| Bloomsbury Publishing PLC | | 7,288 | 48,458 |
| BP PLC | | 12,013 | 77,431 |
| British American Tobacco PLC | | 7,381 | 216,679 |
| British Land Co. PLC | | 7,798 | 37,603 |
| BT Group PLC | | 13,183 | 16,858 |
| Bunzl PLC | | 1,400 | 53,687 |
| Bytes Technology Group PLC | | 4,672 | 28,417 |
| Centrica PLC | | 101,559 | 162,116 |
| Compass Group PLC | | 7,473 | 207,852 |
| Computacenter PLC | | 1,269 | 40,685 |
| Darktrace PLC(2) | | 8,597 | 64,175 |
| Derwent London PLC | | 1,158 | 29,672 |
| Direct Line Insurance Group PLC | | 9,041 | 20,991 |
| FDM Group Holdings PLC | | 2,454 | 10,669 |
| Flutter Entertainment PLC(2) | | 1,283 | 237,687 |
| Fresnillo PLC | | 3,353 | 23,222 |
| Glencore PLC | | 42,265 | 245,921 |
| Grainger PLC | | 16,347 | 52,152 |
| Great Portland Estates PLC | | 3,877 | 18,887 |
| GSK PLC | | 1,386 | 28,755 |
| HSBC Holdings PLC | | 29,049 | 251,795 |
| Informa PLC | | 20,603 | 203,967 |
| InterContinental Hotels Group PLC | | 410 | 39,989 |
| Intertek Group PLC | | 919 | 56,561 |
| Johnson Matthey PLC | | 1,536 | 33,639 |
| Land Securities Group PLC | | 4,810 | 38,875 |
| London Stock Exchange Group PLC | | 999 | 110,130 |
23
See Notes to Financial Statements.
Tax-Managed International Equity Portfolio
April 30, 2024
Portfolio of Investments (Unaudited) — continued
| Security | Shares | Value |
| United Kingdom (continued) |
| Manchester United PLC, Class A(1)(2) | | 3,500 | $ 56,700 |
| Moneysupermarket.com Group PLC | | 30,827 | 82,591 |
| National Grid PLC | | 27,610 | 362,165 |
| NCC Group PLC | | 21,199 | 35,842 |
| Next PLC | | 1,020 | 114,401 |
| Pearson PLC | | 7,487 | 90,846 |
| QinetiQ Group PLC | | 8,311 | 35,469 |
| RELX PLC | | 4,013 | 164,882 |
| Rentokil Initial PLC | | 8,784 | 44,341 |
| Rio Tinto PLC | | 3,810 | 257,787 |
| Sage Group PLC | | 15,349 | 222,574 |
| Shaftesbury Capital PLC | | 57,908 | 96,932 |
| Shell PLC | | 14,923 | 530,492 |
| Smiths Group PLC | | 2,292 | 46,207 |
| Spectris PLC | | 1,769 | 73,171 |
| Spirent Communications PLC | | 11,297 | 27,308 |
| Standard Chartered PLC | | 7,613 | 65,407 |
| Supermarket Income REIT PLC(1) | | 58,122 | 52,503 |
| Unilever PLC | | 5,865 | 303,401 |
| UNITE Group PLC | | 2,593 | 29,976 |
| Vodafone Group PLC | | 101,170 | 85,317 |
| Weir Group PLC | | 1,354 | 34,551 |
| Whitbread PLC | | 806 | 31,767 |
| | | | $ 6,200,989 |
Total Common Stocks
(identified cost $57,331,333) | | | $67,931,788 |
| Preferred Stocks — 0.0%(5) |
| Security | Shares | Value |
| Italy — 0.0%(5) |
| Danieli & C Officine Meccaniche SpA, 1.369% | | 1,102 | $ 28,289 |
Total Preferred Stocks
(identified cost $20,106) | | | $ 28,289 |
| Security | Shares | Value |
| Australia — 0.0%(5) |
| NEXTDC Ltd., Exp. 5/2/24(2) | | 1,874 | $ 1,566 |
Total Rights
(identified cost $0) | | | $ 1,566 |
| Short-Term Investments — 7.3% |
| Security | Shares | Value |
| Morgan Stanley Institutional Liquidity Funds - Government Portfolio, Institutional Class, 5.22%(6) | | 45,432 | $ 45,432 |
Total Affiliated Fund
(identified cost $45,432) | | | $ 45,432 |
| Securities Lending Collateral — 7.2% |
| Security | Shares | Value |
| State Street Navigator Securities Lending Government Money Market Portfolio, 5.34%(7) | | 4,975,095 | $ 4,975,095 |
Total Securities Lending Collateral
(identified cost $4,975,095) | | | $ 4,975,095 |
Total Short-Term Investments
(identified cost $5,020,527) | | | $ 5,020,527 |
| | | |
Total Investments — 106.1%
(identified cost $62,371,966) | | | $72,982,170 |
| Other Assets, Less Liabilities — (6.1)% | | | $ (4,190,029) |
| Net Assets — 100.0% | | | $68,792,141 |
| The percentage shown for each investment category in the Portfolio of Investments is based on net assets. |
| (1) | All or a portion of this security was on loan at April 30, 2024. The aggregate market value of securities on loan at April 30, 2024 was $8,743,529. |
| (2) | Non-income producing security. |
| (3) | Security exempt from registration under Regulation S of the Securities Act of 1933, as amended, which exempts from registration securities offered and sold outside the United States. Security may not be offered or sold in the United States except pursuant to an exemption from, or in a transaction not subject to, the registration requirements of the Securities Act of 1933, as amended. At April 30, 2024, the aggregate value of these securities is $326,579 or 0.5% of the Portfolio's net assets. |
| (4) | Security exempt from registration under Rule 144A of the Securities Act of 1933, as amended. These securities may be sold in certain transactions in reliance on an exemption from registration (normally to qualified institutional buyers). At April 30, 2024, the aggregate value of these securities is $1,277,507 or 1.9% of the Portfolio's net assets. |
| (5) | Amount is less than 0.05%. |
| (6) | May be deemed to be an affiliated investment company. The rate shown is the annualized seven-day yield as of April 30, 2024. |
| (7) | Represents investment of cash collateral received in connection with securities lending. |
24
See Notes to Financial Statements.
Tax-Managed International Equity Portfolio
April 30, 2024
Portfolio of Investments (Unaudited) — continued
| Sector Classification of Portfolio |
| Sector | Percentage
of Net Assets | Value |
| Financials | 12.0% | $8,233,322 |
| Industrials | 11.2 | 7,719,603 |
| Consumer Discretionary | 10.5 | 7,189,652 |
| Health Care | 9.8 | 6,750,036 |
| Consumer Staples | 9.5 | 6,516,022 |
| Materials | 9.3 | 6,420,966 |
| Information Technology | 8.8 | 6,071,194 |
| Communication Services | 8.6 | 5,924,258 |
| Utilities | 7.0 | 4,801,654 |
| Real Estate | 6.9 | 4,753,201 |
| Energy | 5.2 | 3,581,735 |
| Short-Term Investments | 7.3 | 5,020,527 |
| Total Investments | 106.1% | $72,982,170 |
| Abbreviations: |
| ADR | – American Depositary Receipt |
| CDI | – CHESS Depositary Interest |
| PC | – Participation Certificate |
| PFC Shares | – Preference Shares |
| SDR | – Swedish Depositary Receipt |
25
See Notes to Financial Statements.
Tax-Managed International Equity Portfolio
April 30, 2024
Statement of Assets and Liabilities (Unaudited)
| | April 30, 2024 |
| Assets | |
| Unaffiliated investments, at value (identified cost $62,326,534) — including $8,743,529 of securities on loan | $ 72,936,738 |
| Affiliated investments, at value (identified cost $45,432) | 45,432 |
| Foreign currency, at value (identified cost $387,293) | 384,359 |
| Interest and dividends receivable | 228,445 |
| Dividends receivable from affiliated investments | 432 |
| Securities lending income receivable | 9,099 |
| Tax reclaims receivable | 267,126 |
| Trustees' deferred compensation plan | 40,764 |
| Total assets | $73,912,395 |
| Liabilities | |
| Collateral for securities loaned | $ 4,975,095 |
| Payable to affiliates: | |
| Investment adviser fee | 28,388 |
| Trustees' fees | 395 |
| Trustees' deferred compensation plan | 40,764 |
| Accrued expenses | 75,612 |
| Total liabilities | $ 5,120,254 |
| Net Assets applicable to investors' interest in Portfolio | $68,792,141 |
26
See Notes to Financial Statements.
Tax-Managed International Equity Portfolio
April 30, 2024
Statement of Operations (Unaudited)
| | Six Months Ended |
| | April 30, 2024 |
| Investment Income | |
| Dividend income (net of foreign taxes withheld of $146,023) | $ 1,042,689 |
| Dividend income from affiliated investments | 2,356 |
| Securities lending income, net | 31,943 |
| Total investment income | $ 1,076,988 |
| Expenses | |
| Investment adviser fee | $ 170,724 |
| Trustees’ fees and expenses | 2,465 |
| Custodian fee | 44,732 |
| Legal and accounting services | 27,980 |
| Miscellaneous | 4,294 |
| Total expenses | $ 250,195 |
| Deduct: | |
| Waiver and/or reimbursement of expenses by affiliates | $ 71 |
| Total expense reductions | $ 71 |
| Net expenses | $ 250,124 |
| Net investment income | $ 826,864 |
| Realized and Unrealized Gain (Loss) | |
| Net realized gain (loss): | |
| Investment transactions | $ (1,020,436) |
| Foreign currency transactions | 6,605 |
| Net realized loss | $(1,013,831) |
| Change in unrealized appreciation (depreciation): | |
| Investments | $ 8,852,197 |
| Foreign currency | (5,437) |
| Net change in unrealized appreciation (depreciation) | $ 8,846,760 |
| Net realized and unrealized gain | $ 7,832,929 |
| Net increase in net assets from operations | $ 8,659,793 |
27
See Notes to Financial Statements.
Tax-Managed International Equity Portfolio
April 30, 2024
Statements of Changes in Net Assets
| | Six Months Ended
April 30, 2024
(Unaudited) | Year Ended
October 31, 2023 |
| Increase (Decrease) in Net Assets | | |
| From operations: | | |
| Net investment income | $ 826,864 | $ 1,830,919 |
| Net realized gain (loss) | (1,013,831) | 154,582 |
| Net change in unrealized appreciation (depreciation) | 8,846,760 | 5,622,277 |
| Net increase in net assets from operations | $ 8,659,793 | $ 7,607,778 |
| Capital transactions: | | |
| Contributions | $ 1,562,481 | $ 4,123,770 |
| Withdrawals | (4,005,930) | (8,732,642) |
| Net decrease in net assets from capital transactions | $ (2,443,449) | $ (4,608,872) |
| Net increase in net assets | $ 6,216,344 | $ 2,998,906 |
| Net Assets | | |
| At beginning of period | $ 62,575,797 | $ 59,576,891 |
| At end of period | $68,792,141 | $62,575,797 |
28
See Notes to Financial Statements.
Tax-Managed International Equity Portfolio
April 30, 2024
| | Six Months Ended
April 30, 2024
(Unaudited) | Year Ended October 31, |
| Ratios/Supplemental Data | 2023 | 2022 | 2021 | 2020 | 2019 |
| Ratios (as a percentage of average daily net assets): | | | | | | |
| Expenses | 0.73% (1)(2) | 0.72% (2) | 0.69% (2) | 0.68% | 0.69% | 0.74% |
| Net investment income | 2.42% (1) | 2.75% | 2.34% | 2.31% | 1.74% | 2.53% |
| Portfolio Turnover | 11% (3) | 36% | 22% | 23% | 10% | 37% |
| Total Return | 13.92% (3) | 12.91% | (25.13)% | 31.20% | (5.07)% | 11.59% |
| Net assets, end of period (000’s omitted) | $68,792 | $62,576 | $59,577 | $77,087 | $60,016 | $71,054 |
| (1) | Annualized. |
| (2) | Includes a reduction by the investment adviser of a portion of the Portfolio’s adviser fee due to the Portfolio’s investment in the Liquidity Fund (equal to less than 0.005% of average daily net assets for the six months ended April 30, 2024 and the years ended October 31, 2023 and 2022). |
| (3) | Not annualized. |
29
See Notes to Financial Statements.
Tax-Managed International Equity Portfolio
April 30, 2024
Notes to Financial Statements (Unaudited)
1 Significant Accounting Policies
Tax-Managed International Equity Portfolio (the Portfolio) is a Massachusetts business trust registered under the Investment Company Act of 1940, as amended (the 1940 Act), as a diversified, open-end management investment company. The Portfolio’s investment objective is to achieve long-term, after-tax returns by investing in a diversified portfolio of foreign equity securities. The Declaration of Trust permits the Trustees to issue interests in the Portfolio. At April 30, 2024, Parametric Tax-Managed International Equity Fund and Eaton Vance Tax-Managed Equity Asset Allocation Fund held an interest of 52.7% and 47.3%, respectively, in the Portfolio.
The following is a summary of significant accounting policies of the Portfolio. The policies are in conformity with accounting principles generally accepted in the United States of America (U.S. GAAP). The Portfolio is an investment company and follows accounting and reporting guidance in the Financial Accounting Standards Board (FASB) Accounting Standards Codification Topic 946.
A Investment Valuation—The following methodologies are used to determine the market value or fair value of investments.
Equity Securities. Equity securities listed on a U.S. securities exchange generally are valued at the last sale or closing price on the day of valuation or, if no sales took place on such date, at the mean between the closing bid and ask prices on the exchange where such securities are principally traded. Equity securities listed on the NASDAQ National Market System are valued at the NASDAQ official closing price. Unlisted or listed securities for which closing sales prices or closing quotations are not available are valued at the mean between the latest available bid and ask prices.
Foreign Securities and Currencies. Foreign securities and currencies are valued in U.S. dollars, based on foreign currency exchange rate quotations supplied by a third party pricing service. The pricing service uses a proprietary model to determine the exchange rate. Inputs to the model include reported trades and implied bid/ask spreads. The daily valuation of exchange-traded foreign securities generally is determined as of the close of trading on the principal exchange on which such securities trade. Events occurring after the close of trading on foreign exchanges may result in adjustments to the valuation of foreign securities to more accurately reflect their fair value as of the close of regular trading on the New York Stock Exchange. When valuing foreign equity securities that meet certain criteria, the Portfolio's Trustees have approved the use of a fair value service that values such securities to reflect market trading that occurs after the close of the applicable foreign markets of comparable securities or other instruments that have a strong correlation to the fair-valued securities.
Other. Investments in management investment companies (including money market funds) that do not trade on an exchange are valued at the net asset value as of the close of each business day.
Fair Valuation. In connection with Rule 2a-5 of the 1940 Act, the Trustees have designated the Portfolio’s investment adviser as its valuation designee. Investments for which valuations or market quotations are not readily available or are deemed unreliable are valued by the investment adviser, as valuation designee, at fair value using methods that most fairly reflect the security’s “fair value”, which is the amount that the Portfolio might reasonably expect to receive for the security upon its current sale in the ordinary course. Each such determination is based on a consideration of relevant factors, which are likely to vary from one pricing context to another. These factors may include, but are not limited to, the type of security, the existence of any contractual restrictions on the security’s disposition, the price and extent of public trading in similar securities of the issuer or of comparable companies or entities, quotations or relevant information obtained from broker/dealers or other market participants, information obtained from the issuer, analysts, and/or the appropriate stock exchange (for exchange-traded securities), an analysis of the company’s or entity’s financial statements, and an evaluation of the forces that influence the issuer and the market(s) in which the security is purchased and sold.
B Investment Transactions—Investment transactions for financial statement purposes are accounted for on a trade date basis. Realized gains and losses on investments sold are determined on the basis of identified cost.
C Income—Dividend income is recorded on the ex-dividend date for dividends received in cash and/or securities. However, if the ex-dividend date has passed, certain dividends from foreign securities are recorded as the Portfolio is informed of the ex-dividend date. Distributions from investment companies are recorded as dividend income, capital gains or return of capital based on the nature of the distribution. Withholding taxes on foreign dividends and capital gains have been provided for in accordance with the Fund’s understanding of the applicable countries’ tax rules and rates. In consideration of recent decisions rendered by European courts, the Portfolio has filed additional tax reclaims for previously withheld taxes on dividends earned in certain European Union countries. These filings are subject to various administrative and judicial proceedings within these countries. Due to the uncertainty as to the ultimate resolution of these proceedings, the likelihood of receipt of these reclaims, and the potential timing of payment, no amounts are reflected in the financial statements for such outstanding reclaims.
D Federal Taxes—The Portfolio has elected to be treated as a partnership for federal tax purposes. No provision is made by the Portfolio for federal or state taxes on any taxable income of the Portfolio because each investor in the Portfolio is ultimately responsible for the payment of any taxes on its share of taxable income. Since at least one of the Portfolio's investors is a regulated investment company that invests all or substantially all of its assets in the Portfolio, the Portfolio normally must satisfy the applicable source of income and diversification requirements (under the Internal Revenue Code) in order for its investors to satisfy them. The Portfolio will allocate, at least annually among its investors, each investor's distributive share of the Portfolio's net investment income, net realized capital gains and losses and any other items of income, gain, loss, deduction or credit.
Tax-Managed International Equity Portfolio
April 30, 2024
Notes to Financial Statements (Unaudited) — continued
As of April 30, 2024, the Portfolio had no uncertain tax positions that would require financial statement recognition, de-recognition, or disclosure. The Portfolio files a U.S. federal income tax return annually after its fiscal year-end, which is subject to examination by the Internal Revenue Service for a period of three years from the date of filing.
E Foreign Currency Translation—Investment valuations, other assets, and liabilities initially expressed in foreign currencies are translated each business day into U.S. dollars based upon current exchange rates. Purchases and sales of foreign investment securities and income and expenses denominated in foreign currencies are translated into U.S. dollars based upon currency exchange rates in effect on the respective dates of such transactions. Recognized gains or losses on investment transactions attributable to changes in foreign currency exchange rates are recorded for financial statement purposes as net realized gains and losses on investments. That portion of unrealized gains and losses on investments that results from fluctuations in foreign currency exchange rates is not separately disclosed.
F Use of Estimates—The preparation of the financial statements in conformity with U.S. GAAP requires management to make estimates and assumptions that affect the reported amounts of assets and liabilities at the date of the financial statements and the reported amounts of income and expense during the reporting period. Actual results could differ from those estimates.
G Indemnifications—Under the Portfolio’s organizational documents, its officers and Trustees may be indemnified against certain liabilities and expenses arising out of the performance of their duties to the Portfolio. Under Massachusetts law, if certain conditions prevail, interestholders in the Portfolio could be deemed to have personal liability for the obligations of the Portfolio. However, the Portfolio’s Declaration of Trust contains an express disclaimer of liability on the part of Portfolio interestholders. Additionally, in the normal course of business, the Portfolio enters into agreements with service providers that may contain indemnification clauses. The Portfolio’s maximum exposure under these arrangements is unknown as this would involve future claims that may be made against the Portfolio that have not yet occurred.
H Interim Financial Statements—The interim financial statements relating to April 30, 2024 and for the six months then ended have not been audited by an independent registered public accounting firm, but in the opinion of the Portfolio’s management, reflect all adjustments, consisting only of normal recurring adjustments, necessary for the fair presentation of the financial statements.
2 Investment Adviser Fee and Other Transactions with Affiliates
The investment adviser fee is earned by Boston Management and Research (BMR), an indirect, wholly-owned subsidiary of Morgan Stanley, as compensation for investment advisory services rendered to the Portfolio. The fee is computed at an annual rate as a percentage of the Portfolio’s average daily net assets as follows and is payable monthly:
| Average Daily Net Assets | Annual Fee Rate |
| Up to $1 billion | 0.500% |
| $1 billion but less than $2.5 billion | 0.475% |
| $2.5 billion but less than $5 billion | 0.455% |
| $5 billion and over | 0.440% |
For the six months ended April 30, 2024, the investment adviser fee amounted to $170,724 or 0.50% (annualized) of the Portfolio’s average daily net assets. Pursuant to an investment sub-advisory agreement, BMR has delegated the investment management of the Portfolio to Parametric Portfolio Associates LLC (Parametric), an affiliate of BMR and an indirect, wholly-owned subsidiary of Morgan Stanley. BMR pays Parametric a portion of its investment adviser fee for sub-advisory services provided to the Portfolio. The Portfolio may invest in a money market fund, the Institutional Class of the Morgan Stanley Institutional Liquidity Funds - Government Portfolio (the “Liquidity Fund”), an open-end management investment company managed by Morgan Stanley Investment Management Inc., a wholly-owned subsidiary of Morgan Stanley. The investment adviser fee paid by the Portfolio is reduced by an amount equal to its pro rata share of the advisory and administration fees paid by the Portfolio due to its investment in the Liquidity Fund. For the six months ended April 30, 2024, the investment adviser fee paid was reduced by $71 relating to the Portfolio's investment in the Liquidity Fund.
Trustees and officers of the Portfolio who are members of BMR’s organization receive remuneration for their services to the Portfolio out of the investment adviser fee. Trustees of the Portfolio who are not affiliated with the investment adviser may elect to defer receipt of all or a percentage of their annual fees in accordance with the terms of the Trustees Deferred Compensation Plan. Certain officers and Trustees of the Portfolio are officers of the above organization.
3 Purchases and Sales of Investments
Purchases and sales of investments, other than short-term obligations, aggregated $7,555,088 and $9,709,978, respectively, for the six months ended April 30, 2024.
Tax-Managed International Equity Portfolio
April 30, 2024
Notes to Financial Statements (Unaudited) — continued
4 Federal Income Tax Basis of Investments
The cost and unrealized appreciation (depreciation) of investments of the Portfolio at April 30, 2024, as determined on a federal income tax basis, were as follows:
| Aggregate cost | $ 63,045,208 |
| Gross unrealized appreciation | $ 13,615,728 |
| Gross unrealized depreciation | (3,678,766) |
| Net unrealized appreciation | $ 9,936,962 |
5 Line of Credit
The Portfolio participates with other portfolios and funds managed by BMR and its affiliates in a $650 million unsecured revolving line of credit agreement with a group of banks, which is in effect through October 22, 2024. Borrowings are made by the Portfolio solely for temporary purposes related to redemptions and other short-term cash needs. Interest is charged to the Portfolio based on its borrowings at an amount above either the Secured Overnight Financing Rate (SOFR) or Federal Funds rate. In addition, a fee computed at an annual rate of 0.15% on the daily unused portion of the line of credit is allocated among the participating portfolios and funds at the end of each quarter. In connection with the renewal of the agreement in October 2023, an arrangement fee totaling $150,000 was incurred that was allocated to the participating portfolios and funds. Because the line of credit is not available exclusively to the Portfolio, it may be unable to borrow some or all of its requested amounts at any particular time. The Portfolio did not have any significant borrowings or allocated fees during the six months ended April 30, 2024.
6 Securities Lending Agreement
The Portfolio has established a securities lending agreement with State Street Bank and Trust Company (SSBT) as securities lending agent in which the Portfolio lends portfolio securities to qualified borrowers in exchange for collateral consisting of either cash or securities issued or guaranteed by the U.S. government or its agencies or instrumentalities in an amount at least equal to the market value of the securities on loan. The market value of securities loaned is determined daily and any additional required collateral is delivered to the Portfolio on the next business day. Cash collateral is invested in the State Street Navigator Securities Lending Government Money Market Portfolio, a money market fund registered under the 1940 Act. The Portfolio earns interest on the amount invested but it must pay (and at times receive from) the broker a loan rebate fee computed as a varying percentage of the collateral received. For security loans secured by non-cash collateral, the Portfolio earns a negotiated lending fee from the borrower. A portion of the income earned by the Portfolio from its investment of cash collateral, net of rebate fees, and lending fees received is allocated to SSBT for its services as lending agent and the portion allocated to the Portfolio is presented as securities lending income, net on the Statement of Operations. Non-cash collateral is held by the lending agent on behalf of the Portfolio and cannot be sold or re-pledged by the Portfolio; accordingly, such collateral is not reflected in the Statement of Assets and Liabilities.
The Portfolio is subject to possible delay in the recovery of loaned securities. Pursuant to the securities lending agreement, SSBT has provided indemnification to the Portfolio in the event of default by a borrower with respect to a loan. The Portfolio bears the risk of loss with respect to the investment of cash collateral.
At April 30, 2024, the value of the securities loaned and the value of the collateral received, which exceeded the value of the securities loaned, amounted to $8,743,529 and $9,360,125, respectively. Collateral received was comprised of cash of $4,975,095 and U.S. government and/or agencies securities of $4,385,030. The securities lending transactions have no contractual maturity date and each of the Portfolio and borrower has the option to terminate a loan at any time.
The following table provides a breakdown of securities lending transactions accounted for as secured borrowings, the obligations by class of collateral pledged, and the remaining contractual maturity of those transactions as of April 30, 2024.
| | Remaining Contractual Maturity of the Transactions |
| | Overnight and
Continuous | <30 days | 30 to 90 days | >90 days | Total |
| Common Stocks | $4,975,095 | $ — | $ — | $ — | $4,975,095 |
Tax-Managed International Equity Portfolio
April 30, 2024
Notes to Financial Statements (Unaudited) — continued
The carrying amount of the liability for collateral for securities loaned at April 30, 2024 approximated its fair value. If measured at fair value, such liability would have been considered as Level 2 in the fair value hierarchy (see Note 8) at April 30, 2024.
7 Affiliated Investments
At April 30, 2024, the value of the Portfolio's investment in funds that may be deemed to be affiliated was $45,432, which represents 0.1% of the Portfolio's net assets. Transactions in such investments by the Portfolio for the six months ended April 30, 2024 were as follows:
| Name | Value,
beginning
of period | Purchases | Sales
proceeds | Net realized
gain (loss) | Change in
unrealized
appreciation
(depreciation) | Value, end
of period | Dividend
income | Shares,
end of period |
| Short-Term Investments |
| Liquidity Fund | $25,783 | $2,580,732 | $(2,561,083) | $ — | $ — | $45,432 | $2,356 | 45,432 |
8 Fair Value Measurements
Under generally accepted accounting principles for fair value measurements, a three-tier hierarchy to prioritize the assumptions, referred to as inputs, is used in valuation techniques to measure fair value. The three-tier hierarchy of inputs is summarized in the three broad levels listed below.
| • | Level 1 – quoted prices in active markets for identical investments |
| • | Level 2 – other significant observable inputs (including quoted prices for similar investments, interest rates, prepayment speeds, credit risk, etc.) |
| • | Level 3 – significant unobservable inputs (including a fund's own assumptions in determining the fair value of investments) |
In cases where the inputs used to measure fair value fall in different levels of the fair value hierarchy, the level disclosed is determined based on the lowest level input that is significant to the fair value measurement in its entirety. The inputs or methodology used for valuing securities are not necessarily an indication of the risk associated with investing in those securities.
At April 30, 2024, the hierarchy of inputs used in valuing the Portfolio's investments, which are carried at fair value, were as follows:
| Asset Description | Level 1 | Level 2 | Level 3 | Total |
| Common Stocks: | | | | |
| Asia/Pacific | $ 328,243 | $ 20,591,420 | $ — | $ 20,919,663 |
| Developed Europe | 678,987 | 44,943,520 | — | 45,622,507 |
| Developed Middle East | 205,502 | 1,184,116 | — | 1,389,618 |
| Total Common Stocks | $ 1,212,732 | $ 66,719,056* | $ — | $67,931,788 |
| Preferred Stocks | $ — | $ 28,289 | $ — | $ 28,289 |
| Rights | 1,566 | — | — | 1,566 |
| Short-Term Investments: | | | | |
| Affiliated Fund | 45,432 | — | — | 45,432 |
| Securities Lending Collateral | 4,975,095 | — | — | 4,975,095 |
| Total Investments | $ 6,234,825 | $ 66,747,345 | $ — | $72,982,170 |
| * | Includes foreign equity securities whose values were adjusted to reflect market trading of comparable securities or other correlated instruments that occurred after the close of trading in their applicable foreign markets. |
Tax-Managed International Equity Portfolio
April 30, 2024
Notes to Financial Statements (Unaudited) — continued
9 Risks and Uncertainties
Risks Associated with Foreign Investments
Foreign investments can be adversely affected by political, economic and market developments abroad, including the imposition of economic and other sanctions by the United States or another country. There may be less publicly available information about foreign issuers because they may not be subject to reporting practices, requirements or regulations comparable to those to which United States companies are subject. Foreign markets may be smaller, less liquid and more volatile than the major markets in the United States. Trading in foreign markets typically involves higher expense than trading in the United States. The Portfolio may have difficulties enforcing its legal or contractual rights in a foreign country. Securities that trade or are denominated in currencies other than the U.S. dollar may be adversely affected by fluctuations in currency exchange rates.
Parametric
Tax-Managed International Equity Fund
April 30, 2024
| Officers of Parametric Tax-Managed International Equity Fund |
Kenneth A. Topping
President | Nicholas S. Di Lorenzo
Secretary |
Deidre E. Walsh
Vice President and Chief Legal Officer | Laura T. Donovan
Chief Compliance Officer |
James F. Kirchner
Treasurer | |
| Officers of Tax-Managed International Equity Portfolio |
R. Kelly Williams, Jr.
President | Nicholas S. Di Lorenzo
Secretary |
Deidre E. Walsh
Vice President and Chief Legal Officer | Laura T. Donovan
Chief Compliance Officer |
James F. Kirchner
Treasurer | |
| Trustees of Parametric Tax-Managed International Equity Fund and Tax-Managed International Equity Portfolio | |
George J. Gorman
Chairperson | |
| Alan C. Bowser | |
| Mark R. Fetting | |
| Cynthia E. Frost | |
| Valerie A. Mosley | |
| Anchal Pachnanda* | |
| Keith Quinton | |
| Marcus L. Smith | |
| Susan J. Sutherland | |
| Scott E. Wennerholm | |
| Nancy A. Wiser | |
| U.S. Customer Privacy Notice | March 2024 |
| FACTS | WHAT DOES EATON VANCE DO WITH YOUR PERSONAL INFORMATION? |
| Why? | Financial companies choose how they share your personal information. Federal law gives consumers the right to limit some but not all sharing. Federal law also requires us to tell you how we collect, share, and protect your personal information. Please read this notice carefully to understand what we do. |
| |
| What? | The types of personal information we collect and share depend on the product or service you have with us. This information can include:■ Social Security number and income
■ investment experience and risk tolerance
■ checking account information and wire transfer instructions |
| |
| How? | All financial companies need to share customers’ personal information to run their everyday business. In the section below, we list the reasons financial companies can share their customers’ personal information; the reasons Eaton Vance chooses to share; and whether you can limit this sharing. |
| Reasons we can share your personal information | Does Eaton Vance
share? | Can you limit
this sharing? |
| For our everyday business purposes — such as to process your transactions, maintain your account(s), respond to court orders and legal investigations, or report to credit bureaus | Yes | No |
| For our marketing purposes — to offer our products and services to you | Yes | No |
| For joint marketing with other financial companies | No | We don’t share |
| For our affiliates’ everyday business purposes — information about your transactions and experiences | Yes | No* |
| For our affiliates’ everyday business purposes — information about your creditworthiness | Yes | Yes* |
| For our affiliates to market to you | Yes | Yes* |
| For nonaffiliates to market to you | No | We don’t share |
To limit our
sharing | Call toll-free 1-800-262-1122 or email: EVPrivacy@eatonvance.comPlease note:If you are a new customer, we can begin sharing your information 30 days from the date we sent this notice. When you are no longer our customer, we continue to share your information as described in this notice. However, you can contact us at any time to limit our sharing. |
| Questions? | Call toll-free 1-800-262-1122 or email: EVPrivacy@eatonvance.com |
| U.S. Customer Privacy Notice — continued | March 2024 |
| Who we are |
| Who is providing this notice? | Eaton Vance Management and our investment management affiliates (“Eaton Vance”) (see Affiliates definition below.) |
| What we do |
How does Eaton Vance
protect my personal
information? | To protect your personal information from unauthorized access and use, we use security measures that comply with federal law. These measures include computer safeguards and secured files and buildings. We have policies governing the proper handling of customer information by personnel and requiring third parties that provide support to adhere to appropriate security standards with respect to such information. |
How does Eaton Vance
collect my personal
information? | We collect your personal information, for example, when you■ open an account or make deposits or withdrawals from your account
■ buy securities from us or make a wire transfer
■ give us your contact informationWe also collect your personal information from others, such as credit bureaus, affiliates, or other companies. |
| Why can’t I limit all sharing? | Federal law gives you the right to limit only■ sharing for affiliates’ everyday business purposes — information about your creditworthiness
■ affiliates from using your information to market to you
■ sharing for nonaffiliates to market to youState laws and individual companies may give you additional rights to limit sharing. (See below for more on your rights under state law.) |
What happens when I limit
sharing for an account I hold
jointly with someone else? | Your choices will apply to everyone on your account. |
| Definitions |
| Affiliates | Companies related by common ownership or control. They can be financial and nonfinancial companies.■ Our affiliates include registered investment advisers such as Eaton Vance Management, Eaton Vance Advisers International Ltd., Boston Management and Research, Calvert Research and Management, Parametric Portfolio Associates LLC, Atlanta Capital Management Company LLC, Morgan Stanley Investment Management Inc., Morgan Stanley Investment Management Co.; registered broker-dealers such as Morgan Stanley Distributors Inc. and Eaton Vance Distributors, Inc. (together, the “Investment Management Affiliates”); and companies with a Morgan Stanley name and financial companies such as Morgan Stanley Smith Barney LLC and Morgan Stanley & Co. (the “Morgan Stanley Affiliates”). |
| Nonaffiliates | Companies not related by common ownership or control. They can be financial and nonfinancial companies.■ Eaton Vance does not share with nonaffiliates so they can market to you. |
| Joint marketing | A formal agreement between nonaffiliated financial companies that together market financial products or services to you.■ Eaton Vance does not jointly market. |
| U.S. Customer Privacy Notice — continued | March 2024 |
| Other important information |
| *PLEASE NOTE: Eaton Vance does not share your creditworthiness information or your transactions and experiences information with the Morgan Stanley Affiliates, nor does Eaton Vance enable the Morgan Stanley Affiliates to market to you. Your opt outs will prevent Eaton Vance from sharing your creditworthiness information with the Investment Management Affiliates and will prevent the Investment Management Affiliates from marketing their products to you.Vermont: Except as permitted by law, we will not share personal information we collect about Vermont residents with Nonaffiliates unless you provide us with your written consent to share such information.California: Except as permitted by law, we will not share personal information we collect about California residents with Nonaffiliates and we will limit sharing such personal information with our Affiliates to comply with California privacy laws that apply to us. |
Delivery of Shareholder Documents. The Securities and Exchange Commission (SEC) permits funds to deliver only one copy of shareholder documents, including prospectuses, proxy statements and shareholder reports, to fund investors with multiple accounts at the same residential or post office box address. This practice is often called “householding” and it helps eliminate duplicate mailings to shareholders. Eaton Vance, or your financial intermediary, may household the mailing of your documents indefinitely unless you instruct Eaton Vance, or your financial intermediary, otherwise. If you would prefer that your Eaton Vance documents not be householded, please contact Eaton Vance at 1-800-262-1122, or contact your financial intermediary. Your instructions that householding not apply to delivery of your Eaton Vance documents will typically be effective within 30 days of receipt by Eaton Vance or your financial intermediary.
Portfolio Holdings. Each Eaton Vance Fund and its underlying Portfolio(s) (if applicable) files a schedule of portfolio holdings on Part F to Form N-PORT with the SEC. Certain information filed on Form N-PORT may be viewed on the Eaton Vance website at www.eatonvance.com, by calling Eaton Vance at 1-800-262-1122 or in the EDGAR database on the SEC’s website at www.sec.gov.
Proxy Voting. From time to time, funds are required to vote proxies related to the securities held by the funds. The Eaton Vance Funds or their underlying Portfolios (if applicable) vote proxies according to a set of policies and procedures approved by the Funds’ and Portfolios’ Boards. You may obtain a description of these policies and procedures and information on how the Funds or Portfolios voted proxies relating to portfolio securities during the most recent 12-month period ended June 30, without charge, upon request, by calling 1-800-262-1122 and by accessing the SEC’s website at www.sec.gov.
Tailored Shareholder Reports. Effective January 24, 2023, the SEC adopted rule and form amendments to require open-end mutual funds and ETFs to transmit concise and visually engaging streamlined annual and semi-annual reports to shareholders that highlight key information. Other information, including financial statements, will no longer appear in a streamlined shareholder report but must be available online, delivered free of charge upon request, and filed on a semi-annual basis on Form N-CSR. The rule and form amendments have a compliance date of July 24, 2024. At this time, management is evaluating the impact of these amendments on the shareholder reports for the Eaton Vance Funds.
This Page Intentionally Left Blank
Investment Adviser of Tax-Managed International Equity Portfolio
Boston Management and Research
One Post Office Square
Boston, MA 02109
Investment Sub-Adviser of Parametric Tax-Managed International
Equity Fund and Tax-Managed International Equity Portfolio
Parametric Portfolio Associates LLC
800 Fifth Avenue, Suite 2800
Seattle, WA 98104
Investment Adviser and Administrator of Parametric Tax-Managed
International Equity Fund
Eaton Vance Management
One Post Office Square
Boston, MA 02109
Principal Underwriter*
Eaton Vance Distributors, Inc.
One Post Office Square
Boston, MA 02109
(617) 482-8260
Custodian
State Street Bank and Trust Company
One Congress Street, Suite 1
Boston, MA 02114-2016
Transfer Agent
BNY Mellon Investment Servicing (US) Inc.
Attn: Eaton Vance Funds
P.O. Box 534439
Pittsburgh, PA 15253-4439
(800) 262-1122
Fund Offices
One Post Office Square
Boston, MA 02109
*FINRA BrokerCheck. Investors may check the background of their Investment Professional by contacting the Financial Industry Regulatory Authority (FINRA). FINRA BrokerCheck is a free tool to help investors check the professional background of current and former FINRA-registered securities firms and brokers. FINRA BrokerCheck is available by calling 1-800-289-9999 and at www.FINRA.org. The FINRA BrokerCheck brochure describing this program is available to investors at www.FINRA.org.
Eaton Vance
Tax-Managed Multi-Cap Growth Fund
Semi-Annual Report
April 30, 2024
Commodity Futures Trading Commission Registration. The Commodity Futures Trading Commission (“CFTC”) has adopted regulations that subject registered investment companies and advisers to regulation by the CFTC if a fund invests more than a prescribed level of its assets in certain CFTC-regulated instruments (including futures, certain options and swap agreements) or markets itself as providing investment exposure to such instruments. The investment adviser has claimed an exclusion from the definition of “commodity pool operator” under the Commodity Exchange Act with respect to its management of the Fund. Accordingly, neither the Fund nor the adviser with respect to the operation of the Fund is subject to CFTC regulation. Because of its management of other strategies, the Fund's adviser is registered with the CFTC as a commodity pool operator. The adviser is also registered as a commodity trading advisor.
Fund shares are not insured by the FDIC and are not deposits or other obligations of, or guaranteed by, any depository institution. Shares are subject to investment risks, including possible loss of principal invested.
This report must be preceded or accompanied by a current summary prospectus or prospectus. Before investing, investors should consider carefully the investment objective, risks, and charges and expenses of a mutual fund. This and other important information is contained in the summary prospectus and prospectus, which can be obtained from a financial intermediary. Prospective investors should read the prospectus carefully before investing. For further information, please call 1-800-262-1122.
Semi-Annual Report April 30, 2024
Eaton Vance
Tax-Managed Multi-Cap Growth Fund
Eaton Vance
Tax-Managed Multi-Cap Growth Fund
April 30, 2024
Performance
Portfolio Manager(s) Douglas R. Rogers, CFA, CMT
| % Average Annual Total Returns1,2 | Class
Inception Date | Performance
Inception Date | Six Months | One Year | Five Years | Ten Years |
| Class A at NAV | 06/30/2000 | 06/30/2000 | 18.69% | 23.87% | 11.32% | 12.12% |
| Class A with 5.25% Maximum Sales Charge | — | — | 12.45 | 17.36 | 10.13 | 11.51 |
| Class C at NAV | 07/10/2000 | 07/10/2000 | 18.26 | 22.92 | 10.49 | 11.45 |
| Class C with 1% Maximum Deferred Sales Charge | — | — | 17.26 | 21.92 | 10.49 | 11.45 |
|
| Russell 3000® Growth Index | — | — | 23.45% | 30.75% | 15.74% | 14.95% |
| S&P 500® Index | — | — | 20.98 | 22.66 | 13.18 | 12.40 |
| % After-Tax Returns with Maximum Sales Charge2 | Class
Inception Date | Performance
Inception Date | One Year | Five Years | Ten Years |
| Class A After Taxes on Distributions | 06/30/2000 | 06/30/2000 | 17.36% | 9.76% | 11.26% |
| Class A After Taxes on Distributions and Sale of Fund Shares | — | — | 10.28 | 8.06 | 9.59 |
| Class C After Taxes on Distributions | 07/10/2000 | 07/10/2000 | 21.92 | 10.04 | 11.16 |
| Class C After Taxes on Distributions and Sale of Fund Shares | — | — | 12.98 | 8.36 | 9.54 |
| % Total Annual Operating Expense Ratios3 | Class A | Class C |
| | 1.26% | 2.01% |
See Endnotes and Additional Disclosures in this report.
Past performance is no guarantee of future results. Returns are historical and are calculated by determining the percentage change in net asset value (NAV) or offering price (as applicable) with all distributions reinvested. Furthermore, returns do not reflect the deduction of taxes that shareholders may have to pay on Fund distributions or upon the redemption of Fund shares. Investment return and principal value will fluctuate so that shares, when redeemed, may be worth more or less than their original cost. Performance for periods less than or equal to one year is cumulative. Performance is for the stated time period only; due to market volatility, current Fund performance may be lower or higher than the quoted return. For performance as of the most recent month-end, please refer to eatonvance.com.
Eaton Vance
Tax-Managed Multi-Cap Growth Fund
April 30, 2024
| Sector Allocation (% of net assets)1 |
| Top 10 Holdings (% of net assets)1 |
| Microsoft Corp. | 11.8% |
| Amazon.com, Inc. | 8.7 |
| Apple, Inc. | 8.1 |
| Alphabet, Inc., Class C | 5.0 |
| Alphabet, Inc., Class A | 4.7 |
| NVIDIA Corp. | 4.3 |
| Visa, Inc., Class A | 4.3 |
| Meta Platforms, Inc., Class A | 3.6 |
| Salesforce, Inc. | 3.0 |
| UnitedHealth Group, Inc. | 3.0 |
| Total | 56.5% |
Fund invests in an affiliated investment company (Portfolio) with the same objective(s) and policies as the Fund. References to investments are to the Portfolio’s holdings.
Footnotes:
| 1 | Excludes cash and cash equivalents. |
Eaton Vance
Tax-Managed Multi-Cap Growth Fund
April 30, 2024
Endnotes and Additional Disclosures
| 1 | Russell 3000® Growth Index is an unmanaged index of the broad growth segment of the U.S. equity universe. S&P 500® Index is an unmanaged index of large-cap stocks commonly used as a measure of U.S. stock market performance. S&P Dow Jones Indices are a product of S&P Dow Jones Indices LLC (“S&P DJI”) and have been licensed for use. S&P® and S&P 500® are registered trademarks of S&P DJI; Dow Jones® is a registered trademark of Dow Jones Trademark Holdings LLC (“Dow Jones”); S&P DJI, Dow Jones and their respective affiliates do not sponsor, endorse, sell or promote the Fund, will not have any liability with respect thereto and do not have any liability for any errors, omissions, or interruptions of the S&P Dow Jones Indices. Unless otherwise stated, index returns do not reflect the effect of any applicable sales charges, commissions, expenses, taxes or leverage, as applicable. It is not possible to invest directly in an index. |
| 2 | Total Returns at NAV do not include applicable sales charges. If sales charges were deducted, the returns would be lower. Total Returns shown with maximum sales charge reflect the stated maximum sales charge. Unless otherwise stated, performance does not reflect the deduction of taxes on Fund distributions or redemptions of Fund shares. After-tax returns are calculated using certain assumptions, including using the highest historical individual federal income tax rates, and do not reflect the impact of state/local taxes. Actual after-tax returns depend on a shareholder’s tax situation and the actual characterization of distributions and may differ from those shown. After-tax returns are not relevant to shareholders who hold shares in tax-deferred accounts or shares held by nontaxable entities. Return After Taxes on Distributions may be the same as Return Before Taxes for the same period because no taxable distributions were made during that period. Return After Taxes on Distributions and Sale of Fund Shares may be greater than or equal to Return After Taxes on Distributions for the same period because of losses realized on the sale of Fund shares. The Fund’s after-tax returns also may reflect foreign tax credits passed by the Fund to its shareholders.Effective November 5, 2020, Class C shares automatically convert to Class A shares eight years after purchase. The average annual total returns listed for Class C reflect conversion to Class A shares after eight years. Prior to November 5, 2020, Class C shares automatically converted to Class A shares ten years after purchase. |
| 3 | Source: Fund prospectus. The expense ratios for the current reporting period can be found in the Financial Highlights section of this report. Performance reflects expenses waived and/or reimbursed, if applicable. Without such waivers and/or reimbursements, performance would have been lower. |
| | Fund profile subject to change due to active management. |
Eaton Vance
Tax-Managed Multi-Cap Growth Fund
April 30, 2024
Example
As a Fund shareholder, you incur two types of costs: (1) transaction costs, including sales charges (loads) on purchases; and (2) ongoing costs, including management fees; distribution and/or service fees; and other Fund expenses. This Example is intended to help you understand your ongoing costs (in dollars) of Fund investing and to compare these costs with the ongoing costs of investing in other mutual funds. The Example is based on an investment of $1,000 invested at the beginning of the period and held for the entire period (November 1, 2023 to April 30, 2024).
Actual Expenses
The first section of the table below provides information about actual account values and actual expenses. You may use the information in this section, together with the amount you invested, to estimate the expenses that you paid over the period. Simply divide your account value by $1,000 (for example, an $8,600 account value divided by $1,000 = 8.6), then multiply the result by the number in the first section under the heading entitled “Expenses Paid During Period” to estimate the expenses you paid on your account during this period.
Hypothetical Example for Comparison Purposes
The second section of the table below provides information about hypothetical account values and hypothetical expenses based on the actual Fund expense ratio and an assumed rate of return of 5% per year (before expenses), which is not the actual Fund return. The hypothetical account values and expenses may not be used to estimate the actual ending account balance or expenses you paid for the period. You may use this information to compare the ongoing costs of investing in your Fund and other funds. To do so, compare this 5% hypothetical example with the 5% hypothetical examples that appear in the shareholder reports of the other funds.
Please note that the expenses shown in the table are meant to highlight your ongoing costs only and do not reflect any transactional costs, such as sales charges (loads). Therefore, the second section of the table is useful in comparing ongoing costs only, and will not help you determine the relative total costs of owning different funds. In addition, if these transactional costs were included, your costs would be higher.
| | Beginning
Account Value
(11/1/23) | Ending
Account Value
(4/30/24) | Expenses Paid
During Period*
(11/1/23 – 4/30/24) | Annualized
Expense
Ratio |
| Actual | | | | |
| Class A | $1,000.00 | $1,186.90 | $ 6.74 | 1.24% |
| Class C | $1,000.00 | $1,182.60 | $10.80 | 1.99% |
| |
| Hypothetical | | | | |
| (5% return per year before expenses) | | | | |
| Class A | $1,000.00 | $1,018.70 | $ 6.22 | 1.24% |
| Class C | $1,000.00 | $1,014.97 | $ 9.97 | 1.99% |
| * | Expenses are equal to the Fund’s annualized expense ratio for the indicated Class, multiplied by the average account value over the period, multiplied by 182/366 (to reflect the one-half year period). The Example assumes that the $1,000 was invested at the net asset value per share determined at the close of business on on October 31, 2023. The Example reflects the expenses of both the Fund and the Portfolio. |
Eaton Vance
Tax-Managed Multi-Cap Growth Fund
April 30, 2024
Statement of Assets and Liabilities (Unaudited)
| | April 30, 2024 |
| Assets | |
| Investment in Tax-Managed Multi-Cap Growth Portfolio, at value (identified cost $36,732,185) | $ 136,357,038 |
| Receivable for Fund shares sold | 30,916 |
| Total assets | $136,387,954 |
| Liabilities | |
| Payable for Fund shares redeemed | $ 33,442 |
| Payable to affiliates: | |
| Administration fee | 17,164 |
| Distribution and service fees | 32,818 |
| Payable for custodian fee | 11,196 |
| Payable for transfer and dividend disbursing agent fees | 14,198 |
| Payable for legal and accounting services | 15,343 |
| Accrued expenses | 13,340 |
| Total liabilities | $ 137,501 |
| Net Assets | $136,250,453 |
| Sources of Net Assets | |
| Paid-in capital | $ 44,419,179 |
| Distributable earnings | 91,831,274 |
| Net Assets | $136,250,453 |
| Class A Shares | |
| Net Assets | $ 129,562,739 |
| Shares Outstanding | 2,534,933 |
Net Asset Value and Redemption Price Per Share
(net assets ÷ shares of beneficial interest outstanding) | $ 51.11 |
Maximum Offering Price Per Share
(100 ÷ 94.75 of net asset value per share) | $ 53.94 |
| Class C Shares | |
| Net Assets | $ 6,687,714 |
| Shares Outstanding | 161,335 |
Net Asset Value and Offering Price Per Share*
(net assets ÷ shares of beneficial interest outstanding) | $ 41.45 |
| On sales of $50,000 or more, the offering price of Class A shares is reduced. |
| * | Redemption price per share is equal to the net asset value less any applicable contingent deferred sales charge. |
6
See Notes to Financial Statements.
Eaton Vance
Tax-Managed Multi-Cap Growth Fund
April 30, 2024
Statement of Operations (Unaudited)
| | Six Months Ended |
| | April 30, 2024 |
| Investment Income | |
| Dividend income allocated from Portfolio (net of foreign taxes withheld of $2,794) | $ 378,464 |
| Securities lending income allocated from Portfolio, net | 3,245 |
| Expenses allocated from Portfolio | (471,922) |
| Total investment loss from Portfolio | $ (90,213) |
| Expenses | |
| Administration fee | $ 101,591 |
| Distribution and service fees: | |
| Class A | 160,682 |
| Class C | 34,547 |
| Trustees’ fees and expenses | 208 |
| Custodian fee | 9,596 |
| Transfer and dividend disbursing agent fees | 32,699 |
| Legal and accounting services | 20,804 |
| Printing and postage | 6,116 |
| Registration fees | 19,142 |
| ReFlow liquidity program fees | 2,691 |
| Miscellaneous | 5,339 |
| Total expenses | $ 393,415 |
| Net investment loss | $ (483,628) |
| Realized and Unrealized Gain (Loss) from Portfolio | |
| Net realized gain (loss): | |
| Investment transactions | $ 3,380,464(1) |
| Foreign currency transactions | (10) |
| Net realized gain | $ 3,380,454 |
| Change in unrealized appreciation (depreciation): | |
| Investments | $ 18,722,273 |
| Foreign currency | 2 |
| Net change in unrealized appreciation (depreciation) | $18,722,275 |
| Net realized and unrealized gain | $22,102,729 |
| Net increase in net assets from operations | $21,619,101 |
| (1) | Includes $771,724 of net realized gains from redemptions in-kind. |
7
See Notes to Financial Statements.
Eaton Vance
Tax-Managed Multi-Cap Growth Fund
April 30, 2024
Statements of Changes in Net Assets
| | Six Months Ended
April 30, 2024
(Unaudited) | Year Ended
October 31, 2023 |
| Increase (Decrease) in Net Assets | | |
| From operations: | | |
| Net investment loss | $ (483,628) | $ (725,216) |
| Net realized gain | 3,380,454 (1) | 1,378,349 (2) |
| Net change in unrealized appreciation (depreciation) | 18,722,275 | 17,903,261 |
| Net increase in net assets from operations | $ 21,619,101 | $ 18,556,394 |
| Transactions in shares of beneficial interest: | | |
| Class A | $ (493,709) | $ (1,019,437) |
| Class C | (581,848) | (2,418,354) |
| Net decrease in net assets from Fund share transactions | $ (1,075,557) | $ (3,437,791) |
| Net increase in net assets | $ 20,543,544 | $ 15,118,603 |
| Net Assets | | |
| At beginning of period | $ 115,706,909 | $ 100,588,306 |
| At end of period | $136,250,453 | $115,706,909 |
| (1) | Includes $771,724 of net realized gains from redemptions in-kind. |
| (2) | Includes $1,658,636 of net realized gains from redemptions in-kind. |
8
See Notes to Financial Statements.
Eaton Vance
Tax-Managed Multi-Cap Growth Fund
April 30, 2024
| | Class A |
| | Six Months Ended
April 30, 2024
(Unaudited) | Year Ended October 31, |
| | 2023 | 2022 | 2021 | 2020 | 2019 |
| Net asset value — Beginning of period | $ 43.060 | $ 36.290 | $ 51.600 | $ 39.630 | $ 32.250 | $ 29.220 |
| Income (Loss) From Operations | | | | | | |
| Net investment loss(1) | $ (0.171) | $ (0.247) | $ (0.333) | $ (0.387) | $ (0.229) | $ (0.192) |
| Net realized and unrealized gain (loss) | 8.221 | 7.017 | (13.382) | 13.730 | 8.361 | 3.849 |
| Total income (loss) from operations | $ 8.050 | $ 6.770 | $(13.715) | $ 13.343 | $ 8.132 | $ 3.657 |
| Less Distributions | | | | | | |
| From net realized gain | $ — | $ — | $ (1.595) | $ (1.373) | $ (0.752) | $ (0.627) |
| Total distributions | $ — | $ — | $ (1.595) | $ (1.373) | $ (0.752) | $ (0.627) |
| Net asset value — End of period | $ 51.110 | $ 43.060 | $ 36.290 | $ 51.600 | $ 39.630 | $32.250 |
| Total Return(2) | 18.69% (3) | 18.66% | (27.42)% | 34.39% | 25.65% | 13.07% |
| Ratios/Supplemental Data | | | | | | |
| Net assets, end of period (000’s omitted) | $129,563 | $109,562 | $ 93,206 | $136,537 | $101,649 | $ 82,914 |
| Ratios (as a percentage of average daily net assets):(4) | | | | | | |
| Expenses | 1.24% (5)(6) | 1.26% (5) | 1.28% (5) | 1.25% | 1.28% | 1.33% |
| Net investment loss | (0.68)% (6) | (0.60)% | (0.79)% | (0.83)% | (0.64)% | (0.63)% |
| Portfolio Turnover of the Portfolio | 5% (3) | 2% | 0% (7) | 13% | 24% | 18% |
| (1) | Computed using average shares outstanding. |
| (2) | Returns are historical and are calculated by determining the percentage change in net asset value with all distributions reinvested and do not reflect the effect of sales charges. |
| (3) | Not annualized. |
| (4) | Includes the Fund’s share of the Portfolio’s allocated expenses. |
| (5) | Includes a reduction by the investment adviser of a portion of the Portfolio's adviser fee due to the Portfolio's investment in the Liquidity Fund (equal to less than 0.005% of average daily net assets for the six months ended April 30, 2024 and the years ended October 31, 2023 and 2022). |
| (6) | Annualized. |
| (7) | Amount is less than 0.5%. |
9
See Notes to Financial Statements.
Eaton Vance
Tax-Managed Multi-Cap Growth Fund
April 30, 2024
Financial Highlights — continued
| | Class C |
| | Six Months Ended
April 30, 2024
(Unaudited) | Year Ended October 31, |
| | 2023 | 2022 | 2021 | 2020 | 2019 |
| Net asset value — Beginning of period | $ 35.050 | $ 29.770 | $ 42.920 | $ 33.410 | $ 27.510 | $ 25.210 |
| Income (Loss) From Operations | | | | | | |
| Net investment loss(1) | $ (0.292) | $ (0.445) | $ (0.538) | $ (0.607) | $ (0.418) | $ (0.353) |
| Net realized and unrealized gain (loss) | 6.692 | 5.725 | (11.017) | 11.490 | 7.070 | 3.280 |
| Total income (loss) from operations | $ 6.400 | $ 5.280 | $(11.555) | $10.883 | $ 6.652 | $ 2.927 |
| Less Distributions | | | | | | |
| From net realized gain | $ — | $ — | $ (1.595) | $ (1.373) | $ (0.752) | $ (0.627) |
| Total distributions | $ — | $ — | $ (1.595) | $ (1.373) | $ (0.752) | $ (0.627) |
| Net asset value — End of period | $41.450 | $35.050 | $ 29.770 | $42.920 | $33.410 | $27.510 |
| Total Return(2) | 18.26% (3) | 17.74% | (27.95)% | 33.40% | 24.67% | 12.24% |
| Ratios/Supplemental Data | | | | | | |
| Net assets, end of period (000’s omitted) | $ 6,688 | $ 6,145 | $ 7,382 | $ 13,300 | $ 14,982 | $ 14,216 |
| Ratios (as a percentage of average daily net assets):(4) | | | | | | |
| Expenses | 1.99% (5)(6) | 2.01% (5) | 2.03% (5) | 2.00% | 2.03% | 2.09% |
| Net investment loss | (1.42)% (6) | (1.34)% | (1.53)% | (1.57)% | (1.39)% | (1.37)% |
| Portfolio Turnover of the Portfolio | 5% (3) | 2% | 0% (7) | 13% | 24% | 18% |
| (1) | Computed using average shares outstanding. |
| (2) | Returns are historical and are calculated by determining the percentage change in net asset value with all distributions reinvested and do not reflect the effect of sales charges. |
| (3) | Not annualized. |
| (4) | Includes the Fund’s share of the Portfolio’s allocated expenses. |
| (5) | Includes a reduction by the investment adviser of a portion of the Portfolio's adviser fee due to the Portfolio's investment in the Liquidity Fund (equal to less than 0.005% of average daily net assets for the six months ended April 30, 2024 and the years ended October 31, 2023 and 2022). |
| (6) | Annualized. |
| (7) | Amount is less than 0.5%. |
10
See Notes to Financial Statements.
Eaton Vance
Tax-Managed Multi-Cap Growth Fund
April 30, 2024
Notes to Financial Statements (Unaudited)
1 Significant Accounting Policies
Eaton Vance Tax-Managed Multi-Cap Growth Fund (the Fund) is a non-diversified series of Eaton Vance Mutual Funds Trust (the Trust). The Trust is a Massachusetts business trust registered under the Investment Company Act of 1940, as amended (the 1940 Act), as an open-end management investment company. The Fund offers two classes of shares. Class A shares are generally sold subject to a sales charge imposed at time of purchase. Class C shares are sold at net asset value and are generally subject to a contingent deferred sales charge (see Note 5). Effective November 5, 2020, Class C shares automatically convert to Class A shares eight years after their purchase as described in the Fund’s prospectus. Each class represents a pro rata interest in the Fund, but votes separately on class-specific matters and (as noted below) is subject to different expenses. Realized and unrealized gains and losses and net investment income and losses, other than class-specific expenses, are allocated daily to each class of shares based on the relative net assets of each class to the total net assets of the Fund. Each class of shares differs in its distribution plan and certain other class-specific expenses. The Fund invests its assets in interests in Tax-Managed Multi-Cap Growth Portfolio (the Portfolio), a Massachusetts business trust, having the same investment objective and policies as the Fund. The value of the Fund’s investment in the Portfolio reflects the Fund’s proportionate interest in the net assets of the Portfolio (55.5% at April 30, 2024). The performance of the Fund is directly affected by the performance of the Portfolio. The financial statements of the Portfolio, including the portfolio of investments, are included elsewhere in this report and should be read in conjunction with the Fund’s financial statements.
The following is a summary of significant accounting policies of the Fund. The policies are in conformity with accounting principles generally accepted in the United States of America (U.S. GAAP). The Fund is an investment company and follows accounting and reporting guidance in the Financial Accounting Standards Board (FASB) Accounting Standards Codification Topic 946.
A Investment Valuation—Valuation of securities by the Portfolio is discussed in Note 1A of the Portfolio's Notes to Financial Statements, which are included elsewhere in this report.
B Income—The Fund's net investment income or loss consists of the Fund's pro rata share of the net investment income or loss of the Portfolio, less all actual and accrued expenses of the Fund.
C Federal Taxes—The Fund's policy is to comply with the provisions of the Internal Revenue Code applicable to regulated investment companies and to distribute to shareholders each year substantially all of its net investment income, and all or substantially all of its net realized capital gains. Accordingly, no provision for federal income or excise tax is necessary.
As of April 30, 2024, the Fund had no uncertain tax positions that would require financial statement recognition, de-recognition, or disclosure. The Fund files a U.S. federal income tax return annually after its fiscal year-end, which is subject to examination by the Internal Revenue Service for a period of three years from the date of filing.
D Expenses—The majority of expenses of the Trust are directly identifiable to an individual fund. Expenses which are not readily identifiable to a specific fund are allocated taking into consideration, among other things, the nature and type of expense and the relative size of the funds.
E Use of Estimates—The preparation of the financial statements in conformity with U.S. GAAP requires management to make estimates and assumptions that affect the reported amounts of assets and liabilities at the date of the financial statements and the reported amounts of income and expense during the reporting period. Actual results could differ from those estimates.
F Indemnifications—Under the Trust’s organizational documents, its officers and Trustees may be indemnified against certain liabilities and expenses arising out of the performance of their duties to the Fund. Under Massachusetts law, if certain conditions prevail, shareholders of a Massachusetts business trust (such as the Trust) could be deemed to have personal liability for the obligations of the Trust. However, the Trust’s Declaration of Trust contains an express disclaimer of liability on the part of Fund shareholders and the By-laws provide that the Trust shall assume, upon request by the shareholder, the defense on behalf of any Fund shareholders. Moreover, the By-laws also provide for indemnification out of Fund property of any shareholder held personally liable solely by reason of being or having been a shareholder for all loss or expense arising from such liability. Additionally, in the normal course of business, the Fund enters into agreements with service providers that may contain indemnification clauses. The Fund's maximum exposure under these arrangements is unknown as this would involve future claims that may be made against the Fund that have not yet occurred.
G Other—Investment transactions are accounted for on a trade date basis.
H Interim Financial Statements—The interim financial statements relating to April 30, 2024 and for the six months then ended have not been audited by an independent registered public accounting firm, but in the opinion of the Fund’s management, reflect all adjustments, consisting only of normal recurring adjustments, necessary for the fair presentation of the financial statements.
Eaton Vance
Tax-Managed Multi-Cap Growth Fund
April 30, 2024
Notes to Financial Statements (Unaudited) — continued
2 Distributions to Shareholders and Income Tax Information
It is the present policy of the Fund to make at least one distribution annually (normally in December) of all or substantially all of its net investment income and to distribute annually all or substantially all of its net realized capital gains. Distributions to shareholders are recorded on the ex-dividend date. Distributions are declared separately for each class of shares. Shareholders may reinvest income and capital gain distributions in additional shares of the same class of the Fund at the net asset value as of the ex-dividend date or, at the election of the shareholder, receive distributions in cash. Distributions to shareholders are determined in accordance with income tax regulations, which may differ from U.S. GAAP. As required by U.S. GAAP, only distributions in excess of tax basis earnings and profits are reported in the financial statements as a return of capital. Permanent differences between book and tax accounting relating to distributions are reclassified to paid-in capital. For tax purposes, distributions from short-term capital gains are considered to be from ordinary income.
At October 31, 2023, the Fund, for federal income tax purposes, had deferred capital losses of $967,185 which would reduce its taxable income arising from future net realized gains on investment transactions, if any, to the extent permitted by the Internal Revenue Code, and thus would reduce the amount of distributions to shareholders, which would otherwise be necessary to relieve the Fund of any liability for federal income or excise tax. The deferred capital losses are treated as arising on the first day of the Fund’s next taxable year and retain the same short-term or long-term character as when originally deferred. Of the deferred capital losses at October 31, 2023, $967,185 are short-term.
Additionally, at October 31, 2023, the Fund had a late year ordinary loss of $643,574 which it has elected to defer to the following taxable year pursuant to income tax regulations. Late year ordinary losses represent certain specified losses realized in that portion of a taxable year after October 31 that are treated as ordinary for tax purposes plus ordinary losses attributable to that portion of a taxable year after December 31.
3 Investment Adviser Fee and Other Transactions with Affiliates
The investment adviser fee is earned by Eaton Vance Management (EVM), an indirect, wholly-owned subsidiary of Morgan Stanley, as compensation for investment advisory services rendered to the Fund. The fee is computed at an annual rate as a percentage of the Fund’s average daily net assets that are not invested in other investment companies for which EVM or its affiliates serve as investment adviser and receive an advisory fee as follows and is payable monthly:
| Average Daily Net Assets | Annual Fee Rate |
| Up to $500 million | 0.650% |
| $500 million but less than $1 billion | 0.625% |
| $1 billion but less than $2.5 billion | 0.600% |
| $2.5 billion and over | 0.600% |
For the six months ended April 30, 2024, the Fund incurred no investment adviser fee on such assets. To the extent the Fund’s assets are invested in the Portfolio, the Fund is allocated its share of the Portfolio’s investment adviser fee. The Portfolio has engaged Boston Management and Research (BMR) to render investment advisory services. See Note 2 of the Portfolio’s Notes to Financial Statements which are included elsewhere in this report. The administration fee is earned by EVM as compensation for administrative services rendered to the Fund. The fee is computed at an annual rate of 0.15% of the Fund’s average daily net assets. For the six months ended April 30, 2024, the administration fee amounted to $101,591.
EVM provides sub-transfer agency and related services to the Fund pursuant to a Sub-Transfer Agency Support Services Agreement. For the six months ended April 30, 2024, EVM earned $9,938 from the Fund pursuant to such agreement, which is included in transfer and dividend disbursing agent fees on the Statement of Operations. The Fund was informed that Eaton Vance Distributors, Inc. (EVD), an affiliate of EVM and the Fund's principal underwriter, received $5,207 as its portion of the sales charge on sales of Class A shares for the six months ended April 30, 2024. EVD also received distribution and service fees from Class A and Class C shares (see Note 4).
Trustees and officers of the Fund who are members of EVM’s or BMR's organizations receive remuneration for their services to the Fund out of the investment adviser fee. Certain officers and Trustees of the Fund and the Portfolio are officers of the above organizations.
4 Distribution Plans
The Fund has in effect a distribution plan for Class A shares (Class A Plan) pursuant to Rule 12b-1 under the 1940 Act. Pursuant to the Class A Plan, the Fund pays EVD a distribution and service fee of 0.25% per annum of its average daily net assets attributable to Class A shares for distribution services and facilities provided to the Fund by EVD, as well as for personal services and/or the maintenance of shareholder accounts. Distribution and service fees paid or accrued to EVD for the six months ended April 30, 2024 amounted to $160,682 for Class A shares.
Eaton Vance
Tax-Managed Multi-Cap Growth Fund
April 30, 2024
Notes to Financial Statements (Unaudited) — continued
The Fund also has in effect a distribution plan for Class C shares (Class C Plan) pursuant to Rule 12b-1 under the 1940 Act. Pursuant to the Class C Plan, the Fund pays EVD amounts equal to 0.75% per annum of its average daily net assets attributable to Class C shares for providing ongoing distribution services and facilities to the Fund. For the six months ended April 30, 2024, the Fund paid or accrued to EVD $25,910 for Class C shares.
Pursuant to the Class C Plan, the Fund also makes payments of service fees to EVD, financial intermediaries and other persons in amounts equal to 0.25% per annum of its average daily net assets attributable to that class. Service fees paid or accrued are for personal services and/or the maintenance of shareholder accounts. They are separate and distinct from the sales commissions and distribution fees payable to EVD. Service fees paid or accrued for the six months ended April 30, 2024 amounted to $8,637 for Class C shares.
Distribution fees are subject to the limitations contained in the Financial Industry Regulatory Authority Rule 2341(d).
5 Contingent Deferred Sales Charges
A contingent deferred sales charge (CDSC) of 1% generally is imposed on redemptions of Class C shares made within 12 months of purchase. Class A shares may be subject to a 1% CDSC if redeemed within 12 months of purchase (depending on the circumstances of purchase). Generally, the CDSC is based upon the lower of the net asset value at date of redemption or date of purchase. No charge is levied on shares acquired by reinvestment of dividends or capital gain distributions. For the six months ended April 30, 2024, the Fund was informed that EVD received no CDSCs paid by Class A and Class C shareholders.
6 Investment Transactions
For the six months ended April 30, 2024, increases and decreases in the Fund's investment in the Portfolio aggregated $1,418,446 and $2,909,259, respectively. Decreases in the Fund's investment in the Portfolio include distributions of securities as the result of redemptions in-kind of $1,540,383.
7 Shares of Beneficial Interest
The Fund’s Declaration of Trust permits the Trustees to issue an unlimited number of full and fractional shares of beneficial interest (without par value). Such shares may be issued in a number of different series (such as the Fund) and classes. Sales and redemptions of Class A shares include shares purchased and redeemed in connection with the ReFlow liquidity program, a program designed to provide an alternative liquidity source for mutual funds experiencing net redemptions of their shares. Transactions in Fund shares, including direct exchanges pursuant to share class conversions, were as follows:
| | Six Months Ended
April 30, 2024
(Unaudited) | | Year Ended
October 31, 2023 |
| | Shares | Amount | | Shares | Amount |
| Class A | | | | | |
| Sales | 90,999 | $ 4,642,740 | | 226,680 | $ 9,130,028 |
| Redemptions | (100,409) | (5,136,449) | | (250,401) | (10,149,465) |
| Net decrease | (9,410) | $ (493,709) | | (23,721) | $ (1,019,437) |
| Class C | | | | | |
| Sales | 6,432 | $ 268,077 | | 14,556 | $ 482,415 |
| Redemptions | (20,403) | (849,925) | | (87,232) | (2,900,769) |
| Net decrease | (13,971) | $ (581,848) | | (72,676) | $ (2,418,354) |
Tax-Managed Multi-Cap Growth Portfolio
April 30, 2024
Portfolio of Investments (Unaudited)
| Security | Shares | Value |
| Biotechnology — 2.4% |
| Vertex Pharmaceuticals, Inc.(1) | | 15,175 | $ 5,960,892 |
| | | | $ 5,960,892 |
| Broadline Retail — 8.7% |
| Amazon.com, Inc.(1) | | 122,446 | $ 21,428,050 |
| | | | $ 21,428,050 |
| Building Products — 0.6% |
| Trex Co., Inc.(1) | | 15,892 | $ 1,407,237 |
| | | | $ 1,407,237 |
| Capital Markets — 1.0% |
| S&P Global, Inc. | | 5,966 | $ 2,480,842 |
| | | | $ 2,480,842 |
| Chemicals — 1.8% |
| Celanese Corp. | | 4,789 | $ 735,638 |
| Ecolab, Inc. | | 7,531 | 1,703,136 |
| Sherwin-Williams Co. | | 6,570 | 1,968,438 |
| | | | $ 4,407,212 |
| Commercial Services & Supplies — 2.2% |
| Copart, Inc.(1) | | 49,420 | $ 2,684,000 |
| Waste Connections, Inc. | | 16,156 | 2,618,726 |
| | | | $ 5,302,726 |
| Consumer Staples Distribution & Retail — 2.2% |
| BJ's Wholesale Club Holdings, Inc.(1) | | 20,442 | $ 1,526,609 |
| Performance Food Group Co.(1) | | 58,516 | 3,972,066 |
| | | | $ 5,498,675 |
| Electrical Equipment — 2.4% |
| AMETEK, Inc. | | 34,300 | $ 5,990,838 |
| | | | $ 5,990,838 |
| Financial Services — 5.5% |
| Fiserv, Inc.(1) | | 13,974 | $ 2,133,411 |
| Shift4 Payments, Inc., Class A(1) | | 13,838 | 800,667 |
| Visa, Inc., Class A | | 38,845 | 10,434,155 |
| | | | $ 13,368,233 |
| Security | Shares | Value |
| Food Products — 1.0% |
| Mondelez International, Inc., Class A | | 35,144 | $ 2,528,259 |
| | | | $ 2,528,259 |
| Ground Transportation — 3.0% |
| J.B. Hunt Transport Services, Inc. | | 14,100 | $ 2,292,237 |
| Norfolk Southern Corp. | | 8,734 | 2,011,615 |
| Uber Technologies, Inc.(1) | | 47,387 | 3,140,336 |
| | | | $ 7,444,188 |
| Health Care Equipment & Supplies — 3.0% |
| Intuitive Surgical, Inc.(1) | | 8,574 | $ 3,177,696 |
| Stryker Corp. | | 12,668 | 4,262,782 |
| | | | $ 7,440,478 |
| Health Care Providers & Services — 3.0% |
| UnitedHealth Group, Inc. | | 15,062 | $ 7,285,489 |
| | | | $ 7,285,489 |
| Hotels, Restaurants & Leisure — 1.5% |
| Booking Holdings, Inc. | | 735 | $ 2,537,242 |
| Starbucks Corp. | | 12,443 | 1,101,081 |
| | | | $ 3,638,323 |
| Interactive Media & Services — 13.3% |
| Alphabet, Inc., Class A(1) | | 71,981 | $ 11,717,067 |
| Alphabet, Inc., Class C(1) | | 74,231 | 12,221,392 |
| Meta Platforms, Inc., Class A | | 20,515 | 8,824,938 |
| | | | $ 32,763,397 |
| IT Services — 4.4% |
| Accenture PLC, Class A | | 7,692 | $ 2,314,600 |
| Gartner, Inc.(1) | | 3,812 | 1,572,793 |
| GoDaddy, Inc., Class A(1) | | 44,180 | 5,406,749 |
| Okta, Inc.(1) | | 15,035 | 1,397,954 |
| | | | $ 10,692,096 |
| Life Sciences Tools & Services — 1.2% |
| Danaher Corp. | | 11,868 | $ 2,926,886 |
| | | | $ 2,926,886 |
| Pharmaceuticals — 1.4% |
| Zoetis, Inc. | | 21,452 | $ 3,416,016 |
| | | | $ 3,416,016 |
14
See Notes to Financial Statements.
Tax-Managed Multi-Cap Growth Portfolio
April 30, 2024
Portfolio of Investments (Unaudited) — continued
| Security | Shares | Value |
| Real Estate Management & Development — 0.5% |
| FirstService Corp. | | 7,851 | $ 1,154,097 |
| | | | $ 1,154,097 |
| Semiconductors & Semiconductor Equipment — 6.7% |
| Monolithic Power Systems, Inc. | | 8,854 | $ 5,926,248 |
| NVIDIA Corp. | | 12,159 | 10,505,619 |
| | | | $ 16,431,867 |
| Software — 19.2% |
| Adobe, Inc.(1) | | 13,431 | $ 6,216,270 |
| Altair Engineering, Inc., Class A(1) | | 7,902 | 635,716 |
| Intuit, Inc. | | 6,414 | 4,012,727 |
| Microsoft Corp. | | 74,352 | 28,947,464 |
| Salesforce, Inc. | | 27,530 | 7,403,918 |
| | | | $ 47,216,095 |
| Specialty Retail — 1.7% |
| TJX Cos., Inc. | | 44,664 | $ 4,202,436 |
| | | | $ 4,202,436 |
| Technology Hardware, Storage & Peripherals — 8.1% |
| Apple, Inc. | | 116,404 | $ 19,827,093 |
| | | | $ 19,827,093 |
| Textiles, Apparel & Luxury Goods — 2.1% |
| Lululemon Athletica, Inc.(1) | | 9,325 | $ 3,362,595 |
| NIKE, Inc., Class B | | 19,321 | 1,782,555 |
| | | | $ 5,145,150 |
| Trading Companies & Distributors — 2.4% |
| United Rentals, Inc. | | 8,869 | $ 5,924,403 |
| | | | $ 5,924,403 |
Total Common Stocks
(identified cost $71,178,687) | | | $243,880,978 |
| Short-Term Investments — 0.8% |
| Security | Shares | Value |
| Morgan Stanley Institutional Liquidity Funds - Government Portfolio, Institutional Class, 5.22%(2) | | 2,045,289 | $ 2,045,289 |
Total Short-Term Investments
(identified cost $2,045,289) | | | $ 2,045,289 |
Total Investments — 100.1%
(identified cost $73,223,976) | | | $245,926,267 |
| Other Assets, Less Liabilities — (0.1)% | | | $ (169,440) |
| Net Assets — 100.0% | | | $245,756,827 |
| The percentage shown for each investment category in the Portfolio of Investments is based on net assets. |
| (1) | Non-income producing security. |
| (2) | May be deemed to be an affiliated investment company. The rate shown is the annualized seven-day yield as of April 30, 2024. |
15
See Notes to Financial Statements.
Tax-Managed Multi-Cap Growth Portfolio
April 30, 2024
Statement of Assets and Liabilities (Unaudited)
| | April 30, 2024 |
| Assets | |
| Unaffiliated investments, at value (identified cost $71,178,687) | $ 243,880,978 |
| Affiliated investments, at value (identified cost $2,045,289) | 2,045,289 |
| Dividends receivable | 20,061 |
| Dividends receivable from affiliated investments | 7,116 |
| Securities lending income receivable | 2,139 |
| Tax reclaims receivable | 1,427 |
| Trustees' deferred compensation plan | 42,237 |
| Total assets | $245,999,247 |
| Liabilities | |
| Payable to affiliates: | |
| Investment adviser fee | $ 133,921 |
| Trustees' deferred compensation plan | 42,237 |
| Payable for custodian fee | 33,924 |
| Payable for legal and accounting services | 26,008 |
| Accrued expenses | 6,330 |
| Total liabilities | $ 242,420 |
| Net Assets applicable to investors' interest in Portfolio | $245,756,827 |
16
See Notes to Financial Statements.
Tax-Managed Multi-Cap Growth Portfolio
April 30, 2024
Statement of Operations (Unaudited)
| | Six Months Ended |
| | April 30, 2024 |
| Investment Income | |
| Dividend income (net of foreign taxes withheld of $5,024) | $ 644,292 |
| Dividend income from affiliated investments | 35,745 |
| Securities lending income, net | 5,835 |
| Total investment income | $ 685,872 |
| Expenses | |
| Investment adviser fee | $ 791,828 |
| Trustees’ fees and expenses | 6,735 |
| Custodian fee | 29,819 |
| Legal and accounting services | 20,227 |
| Miscellaneous | 718 |
| Total expenses | $ 849,327 |
| Deduct: | |
| Waiver and/or reimbursement of expenses by affiliates | $ 1,045 |
| Total expense reductions | $ 1,045 |
| Net expenses | $ 848,282 |
| Net investment loss | $ (162,410) |
| Realized and Unrealized Gain (Loss) | |
| Net realized gain (loss): | |
| Investment transactions | $ 6,085,024(1) |
| Foreign currency transactions | (19) |
| Net realized gain | $ 6,085,005 |
| Change in unrealized appreciation (depreciation): | |
| Investments | $ 33,528,498 |
| Foreign currency | 5 |
| Net change in unrealized appreciation (depreciation) | $33,528,503 |
| Net realized and unrealized gain | $39,613,508 |
| Net increase in net assets from operations | $39,451,098 |
| (1) | Includes $1,387,654 of net realized gains from redemptions in-kind. |
17
See Notes to Financial Statements.
Tax-Managed Multi-Cap Growth Portfolio
April 30, 2024
Statements of Changes in Net Assets
| | Six Months Ended
April 30, 2024
(Unaudited) | Year Ended
October 31, 2023 |
| Increase (Decrease) in Net Assets | | |
| From operations: | | |
| Net investment loss | $ (162,410) | $ (104,942) |
| Net realized gain | 6,085,005 (1) | 2,460,551 (2) |
| Net change in unrealized appreciation (depreciation) | 33,528,503 | 31,766,001 |
| Net increase in net assets from operations | $ 39,451,098 | $ 34,121,610 |
| Capital transactions: | | |
| Contributions | $ 2,921,726 | $ 4,277,854 |
| Withdrawals | (4,442,908) | (9,546,515) |
| Net decrease in net assets from capital transactions | $ (1,521,182) | $ (5,268,661) |
| Net increase in net assets | $ 37,929,916 | $ 28,852,949 |
| Net Assets | | |
| At beginning of period | $ 207,826,911 | $ 178,973,962 |
| At end of period | $245,756,827 | $207,826,911 |
| (1) | Includes $1,387,654 of net realized gains from redemptions in-kind. |
| (2) | Includes $2,960,554 of net realized gains from redemptions in-kind. |
18
See Notes to Financial Statements.
Tax-Managed Multi-Cap Growth Portfolio
April 30, 2024
| | Six Months Ended
April 30, 2024
(Unaudited) | Year Ended October 31, |
| Ratios/Supplemental Data | 2023 | 2022 | 2021 | 2020 | 2019 |
| Ratios (as a percentage of average daily net assets): | | | | | | |
| Expenses | 0.70% (1)(2) | 0.71% (1) | 0.72% (1) | 0.70% | 0.71% | 0.72% |
| Net investment loss | (0.13)% (2) | (0.05)% | (0.23)% | (0.28)% | (0.08)% | (0.01)% |
| Portfolio Turnover | 5% (3) | 2% | 0% (4) | 13% | 24% | 18% |
| Total Return | 19.00% (3) | 19.30% | (27.00)% | 35.12% | 26.36% | 13.76% |
| Net assets, end of period (000’s omitted) | $245,757 | $207,827 | $178,974 | $262,354 | $200,795 | $167,562 |
| (1) | Includes a reduction by the investment adviser of a portion of the Portfolio's adviser fee due to the Portfolio's investment in the Liquidity Fund (equal to less than 0.005% of average daily net assets for the six months ended April 30, 2024 and the years ended October 31, 2023 and 2022). |
| (2) | Annualized. |
| (3) | Not annualized. |
| (4) | Amount is less than 0.5%. |
Tax-Managed Multi-Cap Growth Portfolio
April 30, 2024
Notes to Financial Statements (Unaudited)
1 Significant Accounting Policies
Tax-Managed Multi-Cap Growth Portfolio (the Portfolio) is a Massachusetts business trust registered under the Investment Company Act of 1940, as amended (the 1940 Act), as a non-diversified, open-end management investment company. The Portfolio’s investment objective is to achieve long-term, after-tax returns by investing in a portfolio of equity securities. The Declaration of Trust permits the Trustees to issue interests in the Portfolio. At April 30, 2024, Eaton Vance Tax-Managed Multi-Cap Growth Fund and Eaton Vance Tax-Managed Equity Asset Allocation Fund held an interest of 55.5% and 44.5%, respectively, in the Portfolio.
The following is a summary of significant accounting policies of the Portfolio. The policies are in conformity with accounting principles generally accepted in the United States of America (U.S. GAAP). The Portfolio is an investment company and follows accounting and reporting guidance in the Financial Accounting Standards Board (FASB) Accounting Standards Codification Topic 946.
A Investment Valuation—The following methodologies are used to determine the market value or fair value of investments.
Equity Securities. Equity securities listed on a U.S. securities exchange generally are valued at the last sale or closing price on the day of valuation or, if no sales took place on such date, at the mean between the closing bid and ask prices on the exchange where such securities are principally traded. Equity securities listed on the NASDAQ National Market System are valued at the NASDAQ official closing price. Unlisted or listed securities for which closing sales prices or closing quotations are not available are valued at the mean between the latest available bid and ask prices.
Foreign Securities and Currencies. Foreign securities and currencies are valued in U.S. dollars, based on foreign currency exchange rate quotations supplied by a third party pricing service. The pricing service uses a proprietary model to determine the exchange rate. Inputs to the model include reported trades and implied bid/ask spreads. The daily valuation of exchange-traded foreign securities generally is determined as of the close of trading on the principal exchange on which such securities trade. Events occurring after the close of trading on foreign exchanges may result in adjustments to the valuation of foreign securities to more accurately reflect their fair value as of the close of regular trading on the New York Stock Exchange. When valuing foreign equity securities that meet certain criteria, the Portfolio's Trustees have approved the use of a fair value service that values such securities to reflect market trading that occurs after the close of the applicable foreign markets of comparable securities or other instruments that have a strong correlation to the fair-valued securities.
Other. Investments in management investment companies (including money market funds) that do not trade on an exchange are valued at the net asset value as of the close of each business day.
Fair Valuation. In connection with Rule 2a-5 of the 1940 Act, the Trustees have designated the Portfolio’s investment adviser as its valuation designee. Investments for which valuations or market quotations are not readily available or are deemed unreliable are valued by the investment adviser, as valuation designee, at fair value using methods that most fairly reflect the security’s “fair value”, which is the amount that the Portfolio might reasonably expect to receive for the security upon its current sale in the ordinary course. Each such determination is based on a consideration of relevant factors, which are likely to vary from one pricing context to another. These factors may include, but are not limited to, the type of security, the existence of any contractual restrictions on the security’s disposition, the price and extent of public trading in similar securities of the issuer or of comparable companies or entities, quotations or relevant information obtained from broker/dealers or other market participants, information obtained from the issuer, analysts, and/or the appropriate stock exchange (for exchange-traded securities), an analysis of the company’s or entity’s financial statements, and an evaluation of the forces that influence the issuer and the market(s) in which the security is purchased and sold.
B Investment Transactions—Investment transactions for financial statement purposes are accounted for on a trade date basis. Realized gains and losses on investments sold are determined on the basis of identified cost.
C Income—Dividend income is recorded on the ex-dividend date for dividends received in cash and/or securities. However, if the ex-dividend date has passed, certain dividends from foreign securities are recorded as the Portfolio is informed of the ex-dividend date. Withholding taxes on foreign dividends and capital gains have been provided for in accordance with the Portfolio's understanding of the applicable countries’ tax rules and rates. In consideration of recent decisions rendered by European courts, the Portfolio has filed additional tax reclaims for previously withheld taxes on dividends earned in certain European Union countries. These filings are subject to various administrative and judicial proceedings within these countries. Due to the uncertainty as to the ultimate resolution of these proceedings, the likelihood of receipt of these reclaims, and the potential timing of payment, no amounts are reflected in the financial statements for such outstanding reclaims.
D Federal Taxes—The Portfolio has elected to be treated as a partnership for federal tax purposes. No provision is made by the Portfolio for federal or state taxes on any taxable income of the Portfolio because each investor in the Portfolio is ultimately responsible for the payment of any taxes on its share of taxable income. Since at least one of the Portfolio's investors is a regulated investment company that invests all or substantially all of its assets in the Portfolio, the Portfolio normally must satisfy the applicable source of income and diversification requirements (under the Internal Revenue Code) in order for its investors to satisfy them. The Portfolio will allocate, at least annually among its investors, each investor's distributive share of the Portfolio's net investment income, net realized capital gains and losses and any other items of income, gain, loss, deduction or credit.
Tax-Managed Multi-Cap Growth Portfolio
April 30, 2024
Notes to Financial Statements (Unaudited) — continued
As of April 30, 2024, the Portfolio had no uncertain tax positions that would require financial statement recognition, de-recognition, or disclosure. The Portfolio files a U.S. federal income tax return annually after its fiscal year-end, which is subject to examination by the Internal Revenue Service for a period of three years from the date of filing.
E Foreign Currency Translation—Investment valuations, other assets, and liabilities initially expressed in foreign currencies are translated each business day into U.S. dollars based upon current exchange rates. Purchases and sales of foreign investment securities and income and expenses denominated in foreign currencies are translated into U.S. dollars based upon currency exchange rates in effect on the respective dates of such transactions. Recognized gains or losses on investment transactions attributable to changes in foreign currency exchange rates are recorded for financial statement purposes as net realized gains and losses on investments. That portion of unrealized gains and losses on investments that results from fluctuations in foreign currency exchange rates is not separately disclosed.
F Use of Estimates—The preparation of the financial statements in conformity with U.S. GAAP requires management to make estimates and assumptions that affect the reported amounts of assets and liabilities at the date of the financial statements and the reported amounts of income and expense during the reporting period. Actual results could differ from those estimates.
G Indemnifications—Under the Portfolio’s organizational documents, its officers and Trustees may be indemnified against certain liabilities and expenses arising out of the performance of their duties to the Portfolio. Under Massachusetts law, if certain conditions prevail, interestholders in the Portfolio could be deemed to have personal liability for the obligations of the Portfolio. However, the Portfolio’s Declaration of Trust contains an express disclaimer of liability on the part of Portfolio interestholders. Additionally, in the normal course of business, the Portfolio enters into agreements with service providers that may contain indemnification clauses. The Portfolio’s maximum exposure under these arrangements is unknown as this would involve future claims that may be made against the Portfolio that have not yet occurred.
H Interim Financial Statements—The interim financial statements relating to April 30, 2024 and for the six months then ended have not been audited by an independent registered public accounting firm, but in the opinion of the Portfolio’s management, reflect all adjustments, consisting only of normal recurring adjustments, necessary for the fair presentation of the financial statements.
2 Investment Adviser Fee and Other Transactions with Affiliates
The investment adviser fee is earned by Boston Management and Research (BMR), an indirect, wholly-owned subsidiary of Morgan Stanley, as compensation for investment advisory services rendered to the Portfolio. The fee is computed at an annual rate as a percentage of the Portfolio’s average daily net assets as follows and is payable monthly:
| Average Daily Net Assets | Annual Fee Rate |
| Up to $500 million | 0.650% |
| $500 million but less than $1 billion | 0.625% |
| $1 billion but less than $2.5 billion | 0.600% |
| $2.5 billion and over | 0.600% |
For the six months ended April 30, 2024, the investment adviser fee amounted to $791,828 or 0.65% (annualized) of the Portfolio’s average daily net assets. The Portfolio may invest in a money market fund, the Institutional Class of the Morgan Stanley Institutional Liquidity Funds - Government Portfolio (the “Liquidity Fund”), an open-end management investment company managed by Morgan Stanley Investment Management Inc., a wholly-owned subsidiary of Morgan Stanley. The investment adviser fee paid by the Portfolio is reduced by an amount equal to its pro rata share of the advisory and administration fees paid by the Portfolio due to its investment in the Liquidity Fund. For the six months ended April 30, 2024, the investment adviser fee paid was reduced by $1,045 relating to the Portfolio’s investment in the Liquidity Fund.
Trustees and officers of the Portfolio who are members of BMR’s organization receive remuneration for their services to the Portfolio out of the investment adviser fee. Trustees of the Portfolio who are not affiliated with the investment adviser may elect to defer receipt of all or a percentage of their annual fees in accordance with the terms of the Trustees Deferred Compensation Plan. Certain officers and Trustees of the Portfolio are officers of the above organization.
3 Purchases and Sales of Investments
Purchases and sales of investments, other than short-term obligations and in-kind transactions, aggregated $11,374,771 and $12,564,480, respectively, for the six months ended April 30, 2024. In-kind sales for the six months ended April 30, 2024 aggregated $1,540,383.
Tax-Managed Multi-Cap Growth Portfolio
April 30, 2024
Notes to Financial Statements (Unaudited) — continued
4 Federal Income Tax Basis of Investments
The cost and unrealized appreciation (depreciation) of investments of the Portfolio at April 30, 2024, as determined on a federal income tax basis, were as follows:
| Aggregate cost | $ 73,349,127 |
| Gross unrealized appreciation | $ 173,105,655 |
| Gross unrealized depreciation | (528,515) |
| Net unrealized appreciation | $172,577,140 |
5 Line of Credit
The Portfolio participates with other portfolios and funds managed by BMR and its affiliates in a $650 million unsecured revolving line of credit agreement with a group of banks, which is in effect through October 22, 2024. Borrowings are made by the Portfolio solely for temporary purposes related to redemptions and other short-term cash needs. Interest is charged to the Portfolio based on its borrowings at an amount above either the Secured Overnight Financing Rate (SOFR) or Federal Funds rate. In addition, a fee computed at an annual rate of 0.15% on the daily unused portion of the line of credit is allocated among the participating portfolios and funds at the end of each quarter. In connection with the renewal of the agreement in October 2023, an arrangement fee of $150,000 was incurred that was allocated to the participating portfolios and funds. Because the line of credit is not available exclusively to the Portfolio, it may be unable to borrow some or all of its requested amounts at any particular time. The Portfolio did not have any significant borrowings or allocated fees during the six months ended April 30, 2024.
6 Affiliated Investments
At April 30, 2024, the value of the Portfolio's investment in funds that may be deemed to be affiliated was $2,045,289, which represents 0.8% of the Portfolio's net assets. Transactions in such investments by the Portfolio for the six months ended April 30, 2024 were as follows:
| Name | Value,
beginning
of period | Purchases | Sales
proceeds | Net realized
gain (loss) | Change in
unrealized
appreciation
(depreciation) | Value, end
of period | Dividend
income | Shares,
end of period |
| Short-Term Investments |
| Liquidity Fund | $957,927 | $5,309,206 | $(4,221,844) | $ — | $ — | $2,045,289 | $35,745 | 2,045,289 |
7 Fair Value Measurements
Under generally accepted accounting principles for fair value measurements, a three-tier hierarchy to prioritize the assumptions, referred to as inputs, is used in valuation techniques to measure fair value. The three-tier hierarchy of inputs is summarized in the three broad levels listed below.
| • | Level 1 – quoted prices in active markets for identical investments |
| • | Level 2 – other significant observable inputs (including quoted prices for similar investments, interest rates, prepayment speeds, credit risk, etc.) |
| • | Level 3 – significant unobservable inputs (including a fund's own assumptions in determining the fair value of investments) |
In cases where the inputs used to measure fair value fall in different levels of the fair value hierarchy, the level disclosed is determined based on the lowest level input that is significant to the fair value measurement in its entirety. The inputs or methodology used for valuing securities are not necessarily an indication of the risk associated with investing in those securities.
Tax-Managed Multi-Cap Growth Portfolio
April 30, 2024
Notes to Financial Statements (Unaudited) — continued
At April 30, 2024, the hierarchy of inputs used in valuing the Portfolio's investments, which are carried at fair value, were as follows:
| Asset Description | Level 1 | Level 2 | Level 3 | Total |
| Common Stocks | $ 243,880,978* | $ — | $ — | $ 243,880,978 |
| Short-Term Investments | 2,045,289 | — | — | 2,045,289 |
| Total Investments | $ 245,926,267 | $ — | $ — | $245,926,267 |
| * | The level classification by major category of investments is the same as the category presentation in the Portfolio of Investments. |
Eaton Vance
Tax-Managed Multi-Cap Growth Fund
April 30, 2024
| Officers of Eaton Vance Tax-Managed Multi-Cap Growth Fund |
Kenneth A. Topping
President | Nicholas S. Di Lorenzo
Secretary |
Deidre E. Walsh
Vice President and Chief Legal Officer | Laura T. Donovan
Chief Compliance Officer |
James F. Kirchner
Treasurer | |
| Officers of Tax-Managed Multi-Cap Growth Portfolio |
R. Kelly Williams, Jr.
President | Nicholas S. Di Lorenzo
Secretary |
Deidre E. Walsh
Vice President and Chief Legal Officer | Laura T. Donovan
Chief Compliance Officer |
James F. Kirchner
Treasurer | |
| Trustees of Eaton Vance Tax-Managed Multi-Cap Growth Fund and Tax-Managed Multi-Cap Growth Portfolio | |
George J. Gorman
Chairperson | |
| Alan C. Bowser | |
| Mark R. Fetting | |
| Cynthia E. Frost | |
| Valerie A. Mosley | |
| Anchal Pachnanda* | |
| Keith Quinton | |
| Marcus L. Smith | |
| Susan J. Sutherland | |
| Scott E. Wennerholm | |
| Nancy A. Wiser | |
| U.S. Customer Privacy Notice | March 2024 |
| FACTS | WHAT DOES EATON VANCE DO WITH YOUR PERSONAL INFORMATION? |
| Why? | Financial companies choose how they share your personal information. Federal law gives consumers the right to limit some but not all sharing. Federal law also requires us to tell you how we collect, share, and protect your personal information. Please read this notice carefully to understand what we do. |
| |
| What? | The types of personal information we collect and share depend on the product or service you have with us. This information can include:■ Social Security number and income
■ investment experience and risk tolerance
■ checking account information and wire transfer instructions |
| |
| How? | All financial companies need to share customers’ personal information to run their everyday business. In the section below, we list the reasons financial companies can share their customers’ personal information; the reasons Eaton Vance chooses to share; and whether you can limit this sharing. |
| Reasons we can share your personal information | Does Eaton Vance
share? | Can you limit
this sharing? |
| For our everyday business purposes — such as to process your transactions, maintain your account(s), respond to court orders and legal investigations, or report to credit bureaus | Yes | No |
| For our marketing purposes — to offer our products and services to you | Yes | No |
| For joint marketing with other financial companies | No | We don’t share |
| For our affiliates’ everyday business purposes — information about your transactions and experiences | Yes | No* |
| For our affiliates’ everyday business purposes — information about your creditworthiness | Yes | Yes* |
| For our affiliates to market to you | Yes | Yes* |
| For nonaffiliates to market to you | No | We don’t share |
To limit our
sharing | Call toll-free 1-800-262-1122 or email: EVPrivacy@eatonvance.comPlease note:If you are a new customer, we can begin sharing your information 30 days from the date we sent this notice. When you are no longer our customer, we continue to share your information as described in this notice. However, you can contact us at any time to limit our sharing. |
| Questions? | Call toll-free 1-800-262-1122 or email: EVPrivacy@eatonvance.com |
| U.S. Customer Privacy Notice — continued | March 2024 |
| Who we are |
| Who is providing this notice? | Eaton Vance Management and our investment management affiliates (“Eaton Vance”) (see Affiliates definition below.) |
| What we do |
How does Eaton Vance
protect my personal
information? | To protect your personal information from unauthorized access and use, we use security measures that comply with federal law. These measures include computer safeguards and secured files and buildings. We have policies governing the proper handling of customer information by personnel and requiring third parties that provide support to adhere to appropriate security standards with respect to such information. |
How does Eaton Vance
collect my personal
information? | We collect your personal information, for example, when you■ open an account or make deposits or withdrawals from your account
■ buy securities from us or make a wire transfer
■ give us your contact informationWe also collect your personal information from others, such as credit bureaus, affiliates, or other companies. |
| Why can’t I limit all sharing? | Federal law gives you the right to limit only■ sharing for affiliates’ everyday business purposes — information about your creditworthiness
■ affiliates from using your information to market to you
■ sharing for nonaffiliates to market to youState laws and individual companies may give you additional rights to limit sharing. (See below for more on your rights under state law.) |
What happens when I limit
sharing for an account I hold
jointly with someone else? | Your choices will apply to everyone on your account. |
| Definitions |
| Affiliates | Companies related by common ownership or control. They can be financial and nonfinancial companies.■ Our affiliates include registered investment advisers such as Eaton Vance Management, Eaton Vance Advisers International Ltd., Boston Management and Research, Calvert Research and Management, Parametric Portfolio Associates LLC, Atlanta Capital Management Company LLC, Morgan Stanley Investment Management Inc., Morgan Stanley Investment Management Co.; registered broker-dealers such as Morgan Stanley Distributors Inc. and Eaton Vance Distributors, Inc. (together, the “Investment Management Affiliates”); and companies with a Morgan Stanley name and financial companies such as Morgan Stanley Smith Barney LLC and Morgan Stanley & Co. (the “Morgan Stanley Affiliates”). |
| Nonaffiliates | Companies not related by common ownership or control. They can be financial and nonfinancial companies.■ Eaton Vance does not share with nonaffiliates so they can market to you. |
| Joint marketing | A formal agreement between nonaffiliated financial companies that together market financial products or services to you.■ Eaton Vance does not jointly market. |
| U.S. Customer Privacy Notice — continued | March 2024 |
| Other important information |
| *PLEASE NOTE: Eaton Vance does not share your creditworthiness information or your transactions and experiences information with the Morgan Stanley Affiliates, nor does Eaton Vance enable the Morgan Stanley Affiliates to market to you. Your opt outs will prevent Eaton Vance from sharing your creditworthiness information with the Investment Management Affiliates and will prevent the Investment Management Affiliates from marketing their products to you.Vermont: Except as permitted by law, we will not share personal information we collect about Vermont residents with Nonaffiliates unless you provide us with your written consent to share such information.California: Except as permitted by law, we will not share personal information we collect about California residents with Nonaffiliates and we will limit sharing such personal information with our Affiliates to comply with California privacy laws that apply to us. |
Delivery of Shareholder Documents. The Securities and Exchange Commission (SEC) permits funds to deliver only one copy of shareholder documents, including prospectuses, proxy statements and shareholder reports, to fund investors with multiple accounts at the same residential or post office box address. This practice is often called “householding” and it helps eliminate duplicate mailings to shareholders. Eaton Vance, or your financial intermediary, may household the mailing of your documents indefinitely unless you instruct Eaton Vance, or your financial intermediary, otherwise. If you would prefer that your Eaton Vance documents not be householded, please contact Eaton Vance at 1-800-262-1122, or contact your financial intermediary. Your instructions that householding not apply to delivery of your Eaton Vance documents will typically be effective within 30 days of receipt by Eaton Vance or your financial intermediary.
Portfolio Holdings. Each Eaton Vance Fund and its underlying Portfolio(s) (if applicable) files a schedule of portfolio holdings on Part F to Form N-PORT with the SEC. Certain information filed on Form N-PORT may be viewed on the Eaton Vance website at www.eatonvance.com, by calling Eaton Vance at 1-800-262-1122 or in the EDGAR database on the SEC’s website at www.sec.gov.
Proxy Voting. From time to time, funds are required to vote proxies related to the securities held by the funds. The Eaton Vance Funds or their underlying Portfolios (if applicable) vote proxies according to a set of policies and procedures approved by the Funds’ and Portfolios’ Boards. You may obtain a description of these policies and procedures and information on how the Funds or Portfolios voted proxies relating to portfolio securities during the most recent 12-month period ended June 30, without charge, upon request, by calling 1-800-262-1122 and by accessing the SEC’s website at www.sec.gov.
Tailored Shareholder Reports. Effective January 24, 2023, the SEC adopted rule and form amendments to require open-end mutual funds and ETFs to transmit concise and visually engaging streamlined annual and semi-annual reports to shareholders that highlight key information. Other information, including financial statements, will no longer appear in a streamlined shareholder report but must be available online, delivered free of charge upon request, and filed on a semi-annual basis on Form N-CSR. The rule and form amendments have a compliance date of July 24, 2024. At this time, management is evaluating the impact of these amendments on the shareholder reports for the Eaton Vance Funds.
Investment Adviser of Tax-Managed Multi-Cap Growth Portfolio
Boston Management and Research
One Post Office Square
Boston, MA 02109
Investment Adviser and Administrator of Eaton Vance
Tax-Managed Multi-Cap Growth Fund
Eaton Vance Management
One Post Office Square
Boston, MA 02109
Principal Underwriter*
Eaton Vance Distributors, Inc.
One Post Office Square
Boston, MA 02109
(617) 482-8260
Custodian
State Street Bank and Trust Company
One Congress Street, Suite 1
Boston, MA 02114-2016
Transfer Agent
BNY Mellon Investment Servicing (US) Inc.
Attn: Eaton Vance Funds
P.O. Box 534439
Pittsburgh, PA 15253-4439
(800) 262-1122
Fund Offices
One Post Office Square
Boston, MA 02109
* FINRA BrokerCheck. Investors may check the background of their Investment Professional by contacting the Financial Industry Regulatory Authority (FINRA). FINRA BrokerCheck is a free tool to help investors check the professional background of current and former FINRA-registered securities firms and brokers. FINRA BrokerCheck is available by calling 1-800-289-9999 and at www.FINRA.org. The FINRA BrokerCheck brochure describing this program is available to investors at www.FINRA.org.
Eaton Vance
Tax-Managed Small-Cap Fund
Semi-Annual Report
April 30, 2024
Commodity Futures Trading Commission Registration. The Commodity Futures Trading Commission (“CFTC”) has adopted regulations that subject registered investment companies and advisers to regulation by the CFTC if a fund invests more than a prescribed level of its assets in certain CFTC-regulated instruments (including futures, certain options and swap agreements) or markets itself as providing investment exposure to such instruments. The investment adviser has claimed an exclusion from the definition of “commodity pool operator” under the Commodity Exchange Act with respect to its management of the Fund. Accordingly, neither the Fund nor the adviser with respect to the operation of the Fund is subject to CFTC regulation. Because of its management of other strategies, the Fund's adviser is registered with the CFTC as a commodity pool operator. The adviser is also registered as a commodity trading advisor.
Fund shares are not insured by the FDIC and are not deposits or other obligations of, or guaranteed by, any depository institution. Shares are subject to investment risks, including possible loss of principal invested.
This report must be preceded or accompanied by a current summary prospectus or prospectus. Before investing, investors should consider carefully the investment objective, risks, and charges and expenses of a mutual fund. This and other important information is contained in the summary prospectus and prospectus, which can be obtained from a financial intermediary. Prospective investors should read the prospectus carefully before investing. For further information, please call 1-800-262-1122.
Semi-Annual Report April 30, 2024
Eaton Vance
Tax-Managed Small-Cap Fund
Eaton Vance
Tax-Managed Small-Cap Fund
April 30, 2024
Performance
Portfolio Manager(s) J. Griffith Noble, CFA and Michael D. McLean, CFA
| % Average Annual Total Returns1,2 | Class
Inception Date | Performance
Inception Date | Six Months | One Year | Five Years | Ten Years |
| Class A at NAV | 09/25/1997 | 09/25/1997 | 19.49% | 5.57% | 6.16% | 7.80% |
| Class A with 5.25% Maximum Sales Charge | — | — | 13.22 | 0.04 | 5.02 | 7.22 |
| Class C at NAV | 09/29/1997 | 09/25/1997 | 19.04 | 4.80 | 5.37 | 7.16 |
| Class C with 1% Maximum Deferred Sales Charge | — | — | 18.04 | 3.80 | 5.37 | 7.16 |
| Class I at NAV | 10/01/2009 | 09/25/1997 | 19.66 | 5.89 | 6.42 | 8.07 |
|
| Russell 2000® Index | — | — | 19.66% | 13.32% | 5.82% | 7.21% |
| % After-Tax Returns with Maximum Sales Charge2 | Class
Inception Date | Performance
Inception Date | One Year | Five Years | Ten Years |
| Class A After Taxes on Distributions | 09/25/1997 | 09/25/1997 | (0.28)% | 4.20% | 6.03% |
| Class A After Taxes on Distributions and Sale of Fund Shares | — | — | 0.25 | 3.95 | 5.62 |
| Class C After Taxes on Distributions | 09/29/1997 | 09/25/1997 | 3.38 | 4.38 | 5.76 |
| Class C After Taxes on Distributions and Sale of Fund Shares | — | — | 2.54 | 4.27 | 5.55 |
| Class I After Taxes on Distributions | 10/01/2009 | 09/25/1997 | 5.51 | 5.58 | 6.87 |
| Class I After Taxes on Distributions and Sale of Fund Shares | — | — | 3.76 | 5.06 | 6.34 |
| % Total Annual Operating Expense Ratios3 | Class A | Class C | Class I |
| | 1.14% | 1.89% | 0.89% |
See Endnotes and Additional Disclosures in this report.
Past performance is no guarantee of future results. Returns are historical and are calculated by determining the percentage change in net asset value (NAV) or offering price (as applicable) with all distributions reinvested. Furthermore, returns do not reflect the deduction of taxes that shareholders may have to pay on Fund distributions or upon the redemption of Fund shares. Investment return and principal value will fluctuate so that shares, when redeemed, may be worth more or less than their original cost. Performance for periods less than or equal to one year is cumulative. Performance is for the stated time period only; due to market volatility, current Fund performance may be lower or higher than the quoted return. For performance as of the most recent month-end, please refer to eatonvance.com.
Eaton Vance
Tax-Managed Small-Cap Fund
April 30, 2024
| Sector Allocation (% of net assets)1 |
| Top 10 Holdings (% of net assets)1 |
| Valvoline, Inc. | 3.2% |
| Core & Main, Inc., Class A | 3.2 |
| AptarGroup, Inc. | 3.0 |
| Chemed Corp. | 2.9 |
| Dorman Products, Inc. | 2.9 |
| Essential Properties Realty Trust, Inc. | 2.7 |
| U.S. Physical Therapy, Inc. | 2.6 |
| CBIZ, Inc. | 2.5 |
| Commerce Bancshares, Inc. | 2.5 |
| Aramark | 2.4 |
| Total | 27.9% |
Fund invests in an affiliated investment company (Portfolio) with the same objective(s) and policies as the Fund. References to investments are to the Portfolio’s holdings.
Footnotes:
| 1 | Excludes cash and cash equivalents. |
Eaton Vance
Tax-Managed Small-Cap Fund
April 30, 2024
Endnotes and Additional Disclosures
| 1 | Russell 2000® Index is an unmanaged index of 2,000 U.S. small-cap stocks. Unless otherwise stated, index returns do not reflect the effect of any applicable sales charges, commissions, expenses, taxes or leverage, as applicable. It is not possible to invest directly in an index. |
| 2 | Total Returns at NAV do not include applicable sales charges. If sales charges were deducted, the returns would be lower. Total Returns shown with maximum sales charge reflect the stated maximum sales charge. Unless otherwise stated, performance does not reflect the deduction of taxes on Fund distributions or redemptions of Fund shares. After-tax returns are calculated using certain assumptions, including using the highest historical individual federal income tax rates, and do not reflect the impact of state/local taxes. Actual after-tax returns depend on a shareholder’s tax situation and the actual characterization of distributions and may differ from those shown. After-tax returns are not relevant to shareholders who hold shares in tax-deferred accounts or shares held by nontaxable entities. Return After Taxes on Distributions may be the same as Return Before Taxes for the same period because no taxable distributions were made during that period. Return After Taxes on Distributions and Sale of Fund Shares may be greater than or equal to Return After Taxes on Distributions for the same period because of losses realized on the sale of Fund shares. The Fund’s after-tax returns also may reflect foreign tax credits passed by the Fund to its shareholders.Effective November 5, 2020, Class C shares automatically convert to Class A shares eight years after purchase. The average annual total returns listed for Class C reflect conversion to Class A shares after eight years. Prior to November 5, 2020, Class C shares automatically converted to Class A shares ten years after purchase. |
| 3 | Source: Fund prospectus. The expense ratios for the current reporting period can be found in the Financial Highlights section of this report. Performance reflects expenses waived and/or reimbursed, if applicable. Without such waivers and/or reimbursements, performance would have been lower. |
| | Fund profile subject to change due to active management. |
Eaton Vance
Tax-Managed Small-Cap Fund
April 30, 2024
Example
As a Fund shareholder, you incur two types of costs: (1) transaction costs, including sales charges (loads) on purchases; and (2) ongoing costs, including management fees; distribution and/or service fees; and other Fund expenses. This Example is intended to help you understand your ongoing costs (in dollars) of Fund investing and to compare these costs with the ongoing costs of investing in other mutual funds. The Example is based on an investment of $1,000 invested at the beginning of the period and held for the entire period (November 1, 2023 to April 30, 2024).
Actual Expenses
The first section of the table below provides information about actual account values and actual expenses. You may use the information in this section, together with the amount you invested, to estimate the expenses that you paid over the period. Simply divide your account value by $1,000 (for example, an $8,600 account value divided by $1,000 = 8.6), then multiply the result by the number in the first section under the heading entitled “Expenses Paid During Period” to estimate the expenses you paid on your account during this period.
Hypothetical Example for Comparison Purposes
The second section of the table below provides information about hypothetical account values and hypothetical expenses based on the actual Fund expense ratio and an assumed rate of return of 5% per year (before expenses), which is not the actual Fund return. The hypothetical account values and expenses may not be used to estimate the actual ending account balance or expenses you paid for the period. You may use this information to compare the ongoing costs of investing in your Fund and other funds. To do so, compare this 5% hypothetical example with the 5% hypothetical examples that appear in the shareholder reports of the other funds.
Please note that the expenses shown in the table are meant to highlight your ongoing costs only and do not reflect any transactional costs, such as sales charges (loads). Therefore, the second section of the table is useful in comparing ongoing costs only, and will not help you determine the relative total costs of owning different funds. In addition, if these transactional costs were included, your costs would be higher.
| | Beginning
Account Value
(11/1/23) | Ending
Account Value
(4/30/24) | Expenses Paid
During Period*
(11/1/23 – 4/30/24) | Annualized
Expense
Ratio |
| Actual | | | | |
| Class A | $1,000.00 | $1,194.90 | $ 6.22 | 1.14% |
| Class C | $1,000.00 | $1,190.40 | $10.29 | 1.89% |
| Class I | $1,000.00 | $1,196.60 | $ 4.86 | 0.89% |
| |
| Hypothetical | | | | |
| (5% return per year before expenses) | | | | |
| Class A | $1,000.00 | $1,019.20 | $ 5.72 | 1.14% |
| Class C | $1,000.00 | $1,015.47 | $ 9.47 | 1.89% |
| Class I | $1,000.00 | $1,020.44 | $ 4.47 | 0.89% |
| * | Expenses are equal to the Fund's annualized expense ratio for the indicated Class, multiplied by the average account value over the period, multiplied by 182/366 (to reflect the one-half year period). The Example assumes that the $1,000 was invested at the net asset value per share determined at the close of business on October 31, 2023. The Example reflects the expenses of both the Fund and the Portfolio. |
Eaton Vance
Tax-Managed Small-Cap Fund
April 30, 2024
Statement of Assets and Liabilities (Unaudited)
| | April 30, 2024 |
| Assets | |
| Investment in Tax-Managed Small-Cap Portfolio, at value (identified cost $100,939,862) | $ 124,779,208 |
| Receivable for Fund shares sold | 41,544 |
| Total assets | $124,820,752 |
| Liabilities | |
| Payable for Fund shares redeemed | $ 84,031 |
| Payable to affiliates: | |
| Distribution and service fees | 20,579 |
| Payable for custodian fee | 10,892 |
| Payable for transfer and dividend disbursing agent fees | 23,740 |
| Payable for legal and accounting services | 17,644 |
| Accrued expenses | 11,136 |
| Total liabilities | $ 168,022 |
| Net Assets | $124,652,730 |
| Sources of Net Assets | |
| Paid-in capital | $ 101,657,600 |
| Distributable earnings | 22,995,130 |
| Net Assets | $124,652,730 |
| Class A Shares | |
| Net Assets | $ 89,105,950 |
| Shares Outstanding | 3,010,793 |
Net Asset Value and Redemption Price Per Share
(net assets ÷ shares of beneficial interest outstanding) | $ 29.60 |
Maximum Offering Price Per Share
(100 ÷ 94.75 of net asset value per share) | $ 31.24 |
| Class C Shares | |
| Net Assets | $ 2,305,886 |
| Shares Outstanding | 106,209 |
Net Asset Value and Offering Price Per Share*
(net assets ÷ shares of beneficial interest outstanding) | $ 21.71 |
| Class I Shares | |
| Net Assets | $ 33,240,894 |
| Shares Outstanding | 1,081,851 |
Net Asset Value, Offering Price and Redemption Price Per Share
(net assets ÷ shares of beneficial interest outstanding) | $ 30.73 |
| On sales of $50,000 or more, the offering price of Class A shares is reduced. |
| * | Redemption price per share is equal to the net asset value less any applicable contingent deferred sales charge. |
6
See Notes to Financial Statements.
Eaton Vance
Tax-Managed Small-Cap Fund
April 30, 2024
Statement of Operations (Unaudited)
| | Six Months Ended |
| | April 30, 2024 |
| Investment Income | |
| Dividend income allocated from Portfolio | $ 840,215 |
| Expenses allocated from Portfolio | (421,880) |
| Total investment income from Portfolio | $ 418,335 |
| Expenses | |
| Distribution and service fees: | |
| Class A | $ 110,026 |
| Class C | 11,669 |
| Trustees’ fees and expenses | 208 |
| Custodian fee | 9,282 |
| Transfer and dividend disbursing agent fees | 55,049 |
| Legal and accounting services | 23,020 |
| Printing and postage | 6,318 |
| Registration fees | 24,049 |
| ReFlow liquidity program fees | 3,794 |
| Miscellaneous | 5,438 |
| Total expenses | $ 248,853 |
| Net investment income | $ 169,482 |
| Realized and Unrealized Gain (Loss) from Portfolio | |
| Net realized gain (loss): | |
| Investment transactions | $ 4,538,772(1) |
| Net realized gain | $ 4,538,772 |
| Change in unrealized appreciation (depreciation): | |
| Investments | $ 15,987,806 |
| Net change in unrealized appreciation (depreciation) | $15,987,806 |
| Net realized and unrealized gain | $20,526,578 |
| Net increase in net assets from operations | $20,696,060 |
| (1) | Includes $1,007,595 of net realized gains from redemptions in-kind. |
7
See Notes to Financial Statements.
Eaton Vance
Tax-Managed Small-Cap Fund
April 30, 2024
Statements of Changes in Net Assets
| | Six Months Ended
April 30, 2024
(Unaudited) | Year Ended
October 31, 2023 |
| Increase (Decrease) in Net Assets | | |
| From operations: | | |
| Net investment income | $ 169,482 | $ 286,333 |
| Net realized gain | 4,538,772 (1) | 4,093,315 (2) |
| Net change in unrealized appreciation (depreciation) | 15,987,806 | (13,045,673) |
| Net increase (decrease) in net assets from operations | $ 20,696,060 | $ (8,666,025) |
| Distributions to shareholders: | | |
| Class A | $ (1,208,454) | $ (2,335,309) |
| Class C | (40,624) | (83,428) |
| Class I | (493,619) | (759,585) |
| Total distributions to shareholders | $ (1,742,697) | $ (3,178,322) |
| Transactions in shares of beneficial interest: | | |
| Class A | $ (1,580,252) | $ (2,786,288) |
| Class C | (118,754) | (235,003) |
| Class I | 1,411,136 | 2,556,539 |
| Net decrease in net assets from Fund share transactions | $ (287,870) | $ (464,752) |
| Net increase (decrease) in net assets | $ 18,665,493 | $ (12,309,099) |
| Net Assets | | |
| At beginning of period | $ 105,987,237 | $ 118,296,336 |
| At end of period | $124,652,730 | $105,987,237 |
| (1) | Includes $1,007,595 of net realized gains from redemptions in-kind. |
| (2) | Includes $2,379,832 of net realized gains from redemptions in-kind. |
8
See Notes to Financial Statements.
Eaton Vance
Tax-Managed Small-Cap Fund
April 30, 2024
| | Class A |
| | Six Months Ended
April 30, 2024
(Unaudited) | Year Ended October 31, |
| | 2023 | 2022 | 2021 | 2020 | 2019 |
| Net asset value — Beginning of period | $ 25.100 | $ 27.940 | $ 34.810 | $ 24.520 | $ 26.960 | $ 25.910 |
| Income (Loss) From Operations | | | | | | |
| Net investment income (loss)(1) | $ 0.033 | $ 0.056 | $ (0.014) | $ (0.052) | $ 0.016 | $ (0.001) |
| Net realized and unrealized gain (loss) | 4.866 | (2.146) | (4.121) | 10.369 | (0.739) | 2.765 |
| Total income (loss) from operations | $ 4.899 | $ (2.090) | $ (4.135) | $ 10.317 | $ (0.723) | $ 2.764 |
| Less Distributions | | | | | | |
| From net investment income | $ (0.031) | $ (0.041) | $ (0.025) | $ (0.027) | $ — | $ (0.032) |
| From net realized gain | (0.368) | (0.709) | (2.710) | — | (1.717) | (1.682) |
| Total distributions | $ (0.399) | $ (0.750) | $ (2.735) | $ (0.027) | $ (1.717) | $ (1.714) |
| Net asset value — End of period | $29.600 | $25.100 | $27.940 | $ 34.810 | $24.520 | $26.960 |
| Total Return(2) | 19.49% (3) | (7.62)% | (12.82)% | 42.10% | (3.09)% | 12.26% |
| Ratios/Supplemental Data | | | | | | |
| Net assets, end of period (000’s omitted) | $ 89,106 | $ 76,963 | $ 88,303 | $107,257 | $ 78,430 | $ 89,352 |
| Ratios (as a percentage of average daily net assets):(4) | | | | | | |
| Expenses | 1.14% (5)(6) | 1.14% (6) | 1.15% (6) | 1.11% | 1.17% | 1.20% |
| Net investment income (loss) | 0.23% (5) | 0.20% | (0.05)% | (0.16)% | 0.06% | (0.01)% |
| Portfolio Turnover of the Portfolio | 20% (3) | 38% | 43% | 40% | 44% | 51% |
| (1) | Computed using average shares outstanding. |
| (2) | Returns are historical and are calculated by determining the percentage change in net asset value with all distributions reinvested and do not reflect the effect of sales charges. |
| (3) | Not annualized. |
| (4) | Includes the Fund’s share of the Portfolio’s allocated expenses. |
| (5) | Annualized. |
| (6) | Includes a reduction by the investment adviser of a portion of the Portfolio’s adviser fee due to the Portfolio’s investment in the Liquidity Fund (equal to less than 0.005% of average daily net assets for the six months ended April 30, 2024 and the years ended October 31, 2023 and 2022). |
9
See Notes to Financial Statements.
Eaton Vance
Tax-Managed Small-Cap Fund
April 30, 2024
Financial Highlights — continued
| | Class C |
| | Six Months Ended
April 30, 2024
(Unaudited) | Year Ended October 31, |
| | 2023 | 2022 | 2021 | 2020 | 2019 |
| Net asset value — Beginning of period | $ 18.550 | $ 20.960 | $ 26.780 | $ 18.990 | $ 21.410 | $ 21.070 |
| Income (Loss) From Operations | | | | | | |
| Net investment loss(1) | $ (0.056) | $ (0.115) | $ (0.177) | $ (0.215) | $ (0.126) | $ (0.111) |
| Net realized and unrealized gain (loss) | 3.584 | (1.586) | (3.100) | 8.005 | (0.577) | 2.133 |
| Total income (loss) from operations | $ 3.528 | $ (1.701) | $ (3.277) | $ 7.790 | $ (0.703) | $ 2.022 |
| Less Distributions | | | | | | |
| From net realized gain | $ (0.368) | $ (0.709) | $ (2.543) | $ — | $ (1.717) | $ (1.682) |
| Total distributions | $ (0.368) | $ (0.709) | $ (2.543) | $ — | $ (1.717) | $ (1.682) |
| Net asset value — End of period | $21.710 | $18.550 | $20.960 | $26.780 | $18.990 | $21.410 |
| Total Return(2) | 19.04% (3) | (8.31)% | (13.43)% | 41.02% | (3.86)% | 11.45% |
| Ratios/Supplemental Data | | | | | | |
| Net assets, end of period (000’s omitted) | $ 2,306 | $ 2,073 | $ 2,574 | $ 3,236 | $ 3,565 | $ 5,675 |
| Ratios (as a percentage of average daily net assets):(4) | | | | | | |
| Expenses | 1.89% (5)(6) | 1.89% (6) | 1.90% (6) | 1.86% | 1.92% | 1.95% |
| Net investment loss | (0.52)% (5) | (0.55)% | (0.79)% | (0.87)% | (0.66)% | (0.55)% |
| Portfolio Turnover of the Portfolio | 20% (3) | 38% | 43% | 40% | 44% | 51% |
| (1) | Computed using average shares outstanding. |
| (2) | Returns are historical and are calculated by determining the percentage change in net asset value with all distributions reinvested and do not reflect the effect of sales charges. |
| (3) | Not annualized. |
| (4) | Includes the Fund’s share of the Portfolio’s allocated expenses. |
| (5) | Annualized. |
| (6) | Includes a reduction by the investment adviser of a portion of the Portfolio’s adviser fee due to the Portfolio’s investment in the Liquidity Fund (equal to less than 0.005% of average daily net assets for the six months ended April 30, 2024 and the years ended October 31, 2023 and 2022). |
10
See Notes to Financial Statements.
Eaton Vance
Tax-Managed Small-Cap Fund
April 30, 2024
Financial Highlights — continued
| | Class I |
| | Six Months Ended
April 30, 2024
(Unaudited) | Year Ended October 31, |
| | 2023 | 2022 | 2021 | 2020 | 2019 |
| Net asset value — Beginning of period | $ 26.080 | $ 29.010 | $ 36.020 | $ 25.370 | $ 27.770 | $ 26.650 |
| Income (Loss) From Operations | | | | | | |
| Net investment income(1) | $ 0.071 | $ 0.128 | $ 0.059 | $ 0.027 | $ 0.081 | $ 0.071 |
| Net realized and unrealized gain (loss) | 5.050 | (2.232) | (4.251) | 10.714 | (0.764) | 2.833 |
| Total income (loss) from operations | $ 5.121 | $ (2.104) | $ (4.192) | $10.741 | $ (0.683) | $ 2.904 |
| Less Distributions | | | | | | |
| From net investment income | $ (0.103) | $ (0.117) | $ (0.108) | $ (0.091) | $ — | $ (0.102) |
| From net realized gain | (0.368) | (0.709) | (2.710) | — | (1.717) | (1.682) |
| Total distributions | $ (0.471) | $ (0.826) | $ (2.818) | $ (0.091) | $ (1.717) | $ (1.784) |
| Net asset value — End of period | $30.730 | $26.080 | $29.010 | $36.020 | $25.370 | $27.770 |
| Total Return(2) | 19.66% (3) | (7.40)% | (12.56)% | 42.46% | (2.89)% | 12.52% |
| Ratios/Supplemental Data | | | | | | |
| Net assets, end of period (000’s omitted) | $ 33,241 | $ 26,951 | $ 27,419 | $ 30,248 | $ 20,346 | $ 24,763 |
| Ratios (as a percentage of average daily net assets):(4) | | | | | | |
| Expenses | 0.89% (5)(6) | 0.89% (6) | 0.90% (6) | 0.86% | 0.92% | 0.95% |
| Net investment income | 0.47% (5) | 0.44% | 0.19% | 0.08% | 0.32% | 0.27% |
| Portfolio Turnover of the Portfolio | 20% (3) | 38% | 43% | 40% | 44% | 51% |
| (1) | Computed using average shares outstanding. |
| (2) | Returns are historical and are calculated by determining the percentage change in net asset value with all distributions reinvested. |
| (3) | Not annualized. |
| (4) | Includes the Fund’s share of the Portfolio’s allocated expenses. |
| (5) | Annualized. |
| (6) | Includes a reduction by the investment adviser of a portion of the Portfolio’s adviser fee due to the Portfolio’s investment in the Liquidity Fund (equal to less than 0.005% of average daily net assets for the six months ended April 30, 2024 and the years ended October 31, 2023 and 2022). |
11
See Notes to Financial Statements.
Eaton Vance
Tax-Managed Small-Cap Fund
April 30, 2024
Notes to Financial Statements (Unaudited)
1 Significant Accounting Policies
Eaton Vance Tax-Managed Small-Cap Fund (the Fund) is a diversified series of Eaton Vance Mutual Funds Trust (the Trust). The Trust is a Massachusetts business trust registered under the Investment Company Act of 1940, as amended (the 1940 Act), as an open-end management investment company. The Fund offers three classes of shares. Class A shares are generally sold subject to a sales charge imposed at time of purchase. Class C shares are sold at net asset value and are generally subject to a contingent deferred sales charge (see Note 5). Effective November 5, 2020, Class C shares automatically convert to Class A shares eight years after their purchase as described in the Fund’s prospectus. Class I shares are sold at net asset value and are not subject to a sales charge. Each class represents a pro rata interest in the Fund, but votes separately on class-specific matters and (as noted below) is subject to different expenses. Realized and unrealized gains and losses and net investment income and losses, other than class-specific expenses, are allocated daily to each class of shares based on the relative net assets of each class to the total net assets of the Fund. Each class of shares differs in its distribution plan and certain other class-specific expenses. The Fund invests its assets in interests in Tax-Managed Small-Cap Portfolio (the Portfolio), a Massachusetts business trust, having the same investment objective and policies as the Fund. The value of the Fund’s investment in the Portfolio reflects the Fund’s proportionate interest in the net assets of the Portfolio (65.1% at April 30, 2024). The performance of the Fund is directly affected by the performance of the Portfolio. The financial statements of the Portfolio, including the portfolio of investments, are included elsewhere in this report and should be read in conjunction with the Fund’s financial statements.
The following is a summary of significant accounting policies of the Fund. The policies are in conformity with accounting principles generally accepted in the United States of America (U.S. GAAP). The Fund is an investment company and follows accounting and reporting guidance in the Financial Accounting Standards Board (FASB) Accounting Standards Codification Topic 946.
A Investment Valuation—Valuation of securities by the Portfolio is discussed in Note 1A of the Portfolio's Notes to Financial Statements, which are included elsewhere in this report.
B Income—The Fund's net investment income or loss consists of the Fund's pro rata share of the net investment income or loss of the Portfolio, less all actual and accrued expenses of the Fund.
C Federal Taxes—The Fund's policy is to comply with the provisions of the Internal Revenue Code applicable to regulated investment companies and to distribute to shareholders each year substantially all of its net investment income, and all or substantially all of its net realized capital gains. Accordingly, no provision for federal income or excise tax is necessary.
As of April 30, 2024, the Fund had no uncertain tax positions that would require financial statement recognition, de-recognition, or disclosure. The Fund files a U.S. federal income tax return annually after its fiscal year-end, which is subject to examination by the Internal Revenue Service for a period of three years from the date of filing.
D Expenses—The majority of expenses of the Trust are directly identifiable to an individual fund. Expenses which are not readily identifiable to a specific fund are allocated taking into consideration, among other things, the nature and type of expense and the relative size of the funds.
E Use of Estimates—The preparation of the financial statements in conformity with U.S. GAAP requires management to make estimates and assumptions that affect the reported amounts of assets and liabilities at the date of the financial statements and the reported amounts of income and expense during the reporting period. Actual results could differ from those estimates.
F Indemnifications—Under the Trust’s organizational documents, its officers and Trustees may be indemnified against certain liabilities and expenses arising out of the performance of their duties to the Fund. Under Massachusetts law, if certain conditions prevail, shareholders of a Massachusetts business trust (such as the Trust) could be deemed to have personal liability for the obligations of the Trust. However, the Trust’s Declaration of Trust contains an express disclaimer of liability on the part of Fund shareholders and the By-laws provide that the Trust shall assume, upon request by the shareholder, the defense on behalf of any Fund shareholders. Moreover, the By-laws also provide for indemnification out of Fund property of any shareholder held personally liable solely by reason of being or having been a shareholder for all loss or expense arising from such liability. Additionally, in the normal course of business, the Fund enters into agreements with service providers that may contain indemnification clauses. The Fund’s maximum exposure under these arrangements is unknown as this would involve future claims that may be made against the Fund that have not yet occurred.
G Other—Investment transactions are accounted for on a trade date basis.
H Interim Financial Statements—The interim financial statements relating to April 30, 2024 and for the six months then ended have not been audited by an independent registered public accounting firm, but in the opinion of the Fund’s management, reflect all adjustments, consisting only of normal recurring adjustments, necessary for the fair presentation of the financial statements.
Eaton Vance
Tax-Managed Small-Cap Fund
April 30, 2024
Notes to Financial Statements (Unaudited) — continued
2 Distributions to Shareholders and Income Tax Information
It is the present policy of the Fund to make at least one distribution annually (normally in December) of all or substantially all of its net investment income and to distribute annually all or substantially all of its net realized capital gains. Distributions to shareholders are recorded on the ex-dividend date. Distributions are declared separately for each class of shares. Shareholders may reinvest income and capital gain distributions in additional shares of the same class of the Fund at the net asset value as of the ex-dividend date or, at the election of the shareholder, receive distributions in cash. Distributions to shareholders are determined in accordance with income tax regulations, which may differ from U.S. GAAP. As required by U.S. GAAP, only distributions in excess of tax basis earnings and profits are reported in the financial statements as a return of capital. Permanent differences between book and tax accounting relating to distributions are reclassified to paid-in capital. For tax purposes, distributions from short-term capital gains are considered to be from ordinary income.
3 Investment Adviser Fee and Other Transactions with Affiliates
The investment adviser fee is earned by Eaton Vance Management (EVM), an indirect, wholly-owned subsidiary of Morgan Stanley, as compensation for investment advisory services rendered to the Fund. The fee is computed at an annual rate as a percentage of the Fund’s average daily net assets that are not invested in other investment companies for which EVM or its affiliates serve as investment adviser and receive an advisory fee as follows and is payable monthly:
| Average Daily Net Assets | Annual Fee Rate |
| Up to $500 million | 0.6250% |
| $500 million but less than $1 billion | 0.5625% |
| $1 billion but less than $1.5 billion | 0.5000% |
| $1.5 billion and over | 0.4375% |
For the six months ended April 30, 2024, the Fund incurred no investment adviser fee on such assets. To the extent that the Fund’s assets are invested in the Portfolio, the Fund is allocated its share of the Portfolio’s investment adviser fee. The Portfolio has engaged Boston Management and Research (BMR) to render investment advisory services. See Note 2 of the Portfolio’s Notes to Financial Statements which are included elsewhere in this report. EVM also serves as the administrator of the Fund, but receives no compensation.
EVM provides sub-transfer agency and related services to the Fund pursuant to a Sub-Transfer Agency Support Services Agreement. For the six months ended April 30, 2024, EVM earned $16,365 from the Fund pursuant to such agreement, which is included in transfer and dividend disbursing agent fees on the Statement of Operations. The Fund was informed that Eaton Vance Distributors, Inc. (EVD), an affiliate of EVM and the Fund's principal underwriter, received $828 as its portion of the sales charge on sales of Class A shares for the six months ended April 30, 2024. EVD also received distribution and service fees from Class A and Class C shares (see Note 4) and contingent deferred sales charges (see Note 5).
Trustees and officers of the Fund who are members of EVM’s or BMR's organizations receive remuneration for their services to the Fund out of the investment adviser fee. Certain officers and Trustees of the Fund and the Portfolio are officers of the above organizations.
4 Distribution Plans
The Fund has in effect a distribution plan for Class A shares (Class A Plan) pursuant to Rule 12b-1 under the 1940 Act. Pursuant to the Class A Plan, the Fund pays EVD a distribution and service fee of 0.25% per annum of its average daily net assets attributable to Class A shares for distribution services and facilities provided to the Fund by EVD, as well as for personal services and/or the maintenance of shareholder accounts. Distribution and service fees paid or accrued to EVD for the six months ended April 30, 2024 amounted to $110,026 for Class A shares.
The Fund also has in effect a distribution plan for Class C shares (Class C Plan) pursuant to Rule 12b-1 under the 1940 Act. Pursuant to the Class C Plan, the Fund pays EVD amounts equal to 0.75% per annum of its average daily net assets attributable to Class C shares for providing ongoing distribution services and facilities to the Fund. For the six months ended April 30, 2024, the Fund paid or accrued to EVD $8,752 for Class C shares.
Pursuant to the Class C Plan, the Fund also makes payments of service fees to EVD, financial intermediaries and other persons in amounts equal to 0.25% per annum of its average daily net assets attributable to that class. Service fees paid or accrued are for personal services and/or the maintenance of shareholder accounts. They are separate and distinct from the sales commissions and distribution fees payable to EVD. Service fees paid or accrued for the six months ended April 30, 2024 amounted to $2,917 for Class C shares.
Distribution and service fees are subject to the limitations contained in the Financial Industry Regulatory Authority Rule 2341(d).
Eaton Vance
Tax-Managed Small-Cap Fund
April 30, 2024
Notes to Financial Statements (Unaudited) — continued
5 Contingent Deferred Sales Charges
A contingent deferred sales charge (CDSC) of 1% generally is imposed on redemptions of Class C shares made within 12 months of purchase. Class A shares may be subject to a 1% CDSC if redeemed within 12 months of purchase (depending on the circumstances of purchase). Generally, the CDSC is based upon the lower of the net asset value at date of redemption or date of purchase. No charge is levied on shares acquired by reinvestment of dividends or capital gain distributions. For the six months ended April 30, 2024, the Fund was informed that EVD received less than $100 of CDSCs paid by Class C shareholders and no CDSCs paid by Class A shareholders.
6 Investment Transactions
For the six months ended April 30, 2024, increases and decreases in the Fund's investment in the Portfolio aggregated $1,414,177 and $3,561,221, respectively. Decreases in the Fund's investment in the Portfolio include distributions of securities as the result of redemptions in-kind of $1,848,902.
7 Shares of Beneficial Interest
The Fund’s Declaration of Trust permits the Trustees to issue an unlimited number of full and fractional shares of beneficial interest (without par value). Such shares may be issued in a number of different series (such as the Fund) and classes. Sales and redemptions of Class I shares include shares purchased and redeemed in connection with the ReFlow liquidity program, a program designed to provide an alternative liquidity source for mutual funds experiencing net redemptions of their shares. Transactions in Fund shares, including direct exchanges pursuant to share class conversions, were as follows:
| | Six Months Ended
April 30, 2024
(Unaudited) | | Year Ended
October 31, 2023 |
| | Shares | Amount | | Shares | Amount |
| Class A | | | | | |
| Sales | 22,552 | $ 661,519 | | 73,010 | $ 2,062,811 |
| Issued to shareholders electing to receive payments of distributions in Fund shares | 38,900 | 1,137,059 | | 82,542 | 2,187,359 |
| Redemptions | (116,397) | (3,378,830) | | (249,931) | (7,036,458) |
| Net decrease | (54,945) | $(1,580,252) | | (94,379) | $ (2,786,288) |
| Class C | | | | | |
| Sales | 3,890 | $ 83,100 | | 10,417 | $ 212,806 |
| Issued to shareholders electing to receive payments of distributions in Fund shares | 1,890 | 40,624 | | 4,235 | 83,420 |
| Redemptions | (11,344) | (242,478) | | (25,719) | (531,229) |
| Net decrease | (5,564) | $ (118,754) | | (11,067) | $ (235,003) |
| Class I | | | | | |
| Sales | 203,118 | $ 6,001,146 | | 437,764 | $ 12,709,225 |
| Issued to shareholders electing to receive payments of distributions in Fund shares | 15,696 | 475,900 | | 26,395 | 725,071 |
| Redemptions | (170,388) | (5,065,910) | | (376,018) | (10,877,757) |
| Net increase | 48,426 | $ 1,411,136 | | 88,141 | $ 2,556,539 |
Tax-Managed Small-Cap Portfolio
April 30, 2024
Portfolio of Investments (Unaudited)
| Security | Shares | Value |
| Aerospace & Defense — 2.7% |
| Hexcel Corp. | | 17,279 | $ 1,109,485 |
| Woodward, Inc. | | 24,640 | 4,000,550 |
| | | | $ 5,110,035 |
| Automobile Components — 3.6% |
| Dorman Products, Inc.(1) | | 63,132 | $ 5,520,893 |
| Visteon Corp.(1) | | 12,847 | 1,421,264 |
| | | | $ 6,942,157 |
| Banks — 7.4% |
| Commerce Bancshares, Inc. | | 86,799 | $ 4,746,169 |
| Community Bank System, Inc. | | 49,824 | 2,153,393 |
| First Financial Bankshares, Inc. | | 101,875 | 3,011,425 |
| SouthState Corp. | | 41,448 | 3,137,614 |
| Stock Yards Bancorp, Inc. | | 25,477 | 1,135,001 |
| | | | $ 14,183,602 |
| Building Products — 6.7% |
| AAON, Inc. | | 28,906 | $ 2,719,766 |
| AZEK Co., Inc.(1) | | 73,305 | 3,345,640 |
| CSW Industrials, Inc. | | 15,006 | 3,565,726 |
| Hayward Holdings, Inc.(1) | | 80,802 | 1,097,291 |
| Janus International Group, Inc.(1) | | 140,484 | 2,024,374 |
| | | | $ 12,752,797 |
| Capital Markets — 3.3% |
| Cohen & Steers, Inc. | | 41,686 | $ 2,867,163 |
| Stifel Financial Corp. | | 42,233 | 3,375,261 |
| | | | $ 6,242,424 |
| Chemicals — 1.9% |
| Balchem Corp. | | 1,434 | $ 202,739 |
| Quaker Chemical Corp. | | 18,920 | 3,529,148 |
| | | | $ 3,731,887 |
| Commercial Services & Supplies — 0.9% |
| Rentokil Initial PLC ADR | | 67,736 | $ 1,735,396 |
| | | | $ 1,735,396 |
| Consumer Staples Distribution & Retail — 3.1% |
| Casey's General Stores, Inc. | | 4,431 | $ 1,416,059 |
| Security | Shares | Value |
| Consumer Staples Distribution & Retail (continued) |
| Chefs' Warehouse, Inc.(1) | | 36,511 | $ 1,207,784 |
| Performance Food Group Co.(1) | | 49,782 | 3,379,202 |
| | | | $ 6,003,045 |
| Containers & Packaging — 3.0% |
| AptarGroup, Inc. | | 39,385 | $ 5,686,406 |
| | | | $ 5,686,406 |
| Diversified Consumer Services — 0.4% |
| Bright Horizons Family Solutions, Inc.(1) | | 7,935 | $ 822,939 |
| | | | $ 822,939 |
| Diversified REITs — 2.7% |
| Essential Properties Realty Trust, Inc. | | 194,237 | $ 5,116,203 |
| | | | $ 5,116,203 |
| Electric Utilities — 2.2% |
| IDACORP, Inc. | | 43,851 | $ 4,156,198 |
| | | | $ 4,156,198 |
| Electronic Equipment, Instruments & Components — 0.9% |
| Badger Meter, Inc. | | 9,936 | $ 1,817,493 |
| | | | $ 1,817,493 |
| Financial Services — 1.3% |
| Euronet Worldwide, Inc.(1) | | 23,526 | $ 2,415,650 |
| | | | $ 2,415,650 |
| Food Products — 1.1% |
| J & J Snack Foods Corp. | | 7,910 | $ 1,085,964 |
| Lancaster Colony Corp. | | 4,866 | 928,481 |
| | | | $ 2,014,445 |
| Ground Transportation — 1.3% |
| Landstar System, Inc. | | 14,840 | $ 2,588,244 |
| | | | $ 2,588,244 |
| Health Care Equipment & Supplies — 2.7% |
| Envista Holdings Corp.(1) | | 56,105 | $ 1,104,146 |
| Integer Holdings Corp.(1) | | 21,230 | 2,369,905 |
| Neogen Corp.(1) | | 138,787 | 1,711,244 |
| | | | $ 5,185,295 |
| Health Care Providers & Services — 7.8% |
| Addus HomeCare Corp.(1) | | 17,503 | $ 1,682,914 |
15
See Notes to Financial Statements.
Tax-Managed Small-Cap Portfolio
April 30, 2024
Portfolio of Investments (Unaudited) — continued
| Security | Shares | Value |
| Health Care Providers & Services (continued) |
| Chemed Corp. | | 9,879 | $ 5,611,272 |
| Option Care Health, Inc.(1) | | 90,924 | 2,717,718 |
| U.S. Physical Therapy, Inc. | | 49,192 | 4,993,480 |
| | | | $ 15,005,384 |
| Hotels, Restaurants & Leisure — 6.3% |
| Aramark | | 144,706 | $ 4,559,686 |
| Choice Hotels International, Inc. | | 15,450 | 1,827,117 |
| Texas Roadhouse, Inc. | | 7,888 | 1,268,233 |
| Wyndham Hotels & Resorts, Inc. | | 58,773 | 4,320,403 |
| | | | $ 11,975,439 |
| Industrial REITs — 3.0% |
| EastGroup Properties, Inc. | | 20,655 | $ 3,208,961 |
| Terreno Realty Corp. | | 46,642 | 2,534,993 |
| | | | $ 5,743,954 |
| Insurance — 7.5% |
| AMERISAFE, Inc. | | 29,127 | $ 1,328,191 |
| First American Financial Corp. | | 28,299 | 1,515,977 |
| RLI Corp. | | 24,717 | 3,493,748 |
| Selective Insurance Group, Inc. | | 39,484 | 4,013,549 |
| White Mountains Insurance Group Ltd. | | 2,255 | 4,009,706 |
| | | | $ 14,361,171 |
| Leisure Products — 0.5% |
| Brunswick Corp. | | 11,259 | $ 907,926 |
| | | | $ 907,926 |
| Machinery — 4.8% |
| Albany International Corp., Class A | | 28,337 | $ 2,259,876 |
| Atmus Filtration Technologies, Inc.(1) | | 56,377 | 1,707,659 |
| Franklin Electric Co., Inc. | | 15,410 | 1,483,521 |
| Middleby Corp.(1) | | 26,624 | 3,699,937 |
| | | | $ 9,150,993 |
| Professional Services — 3.2% |
| CBIZ, Inc.(1) | | 67,713 | $ 4,819,811 |
| NV5 Global, Inc.(1) | | 15,087 | 1,406,712 |
| | | | $ 6,226,523 |
| Retail REITs — 1.6% |
| NETSTREIT Corp. | | 185,563 | $ 3,126,737 |
| | | | $ 3,126,737 |
| Security | Shares | Value |
| Semiconductors & Semiconductor Equipment — 2.3% |
| Allegro MicroSystems, Inc.(1) | | 49,601 | $ 1,472,654 |
| Axcelis Technologies, Inc.(1) | | 10,635 | 1,100,935 |
| Diodes, Inc.(1) | | 25,039 | 1,828,097 |
| | | | $ 4,401,686 |
| Software — 6.2% |
| Altair Engineering, Inc., Class A(1) | | 20,725 | $ 1,667,326 |
| Clearwater Analytics Holdings, Inc., Class A(1) | | 82,462 | 1,301,250 |
| Envestnet, Inc.(1) | | 63,643 | 3,950,321 |
| PowerSchool Holdings, Inc., Class A(1) | | 70,690 | 1,224,351 |
| Progress Software Corp. | | 44,923 | 2,238,064 |
| SPS Commerce, Inc.(1) | | 9,017 | 1,567,786 |
| | | | $ 11,949,098 |
| Specialized REITs — 1.1% |
| CubeSmart | | 54,320 | $ 2,196,701 |
| | | | $ 2,196,701 |
| Specialty Retail — 3.8% |
| Burlington Stores, Inc.(1) | | 6,046 | $ 1,087,917 |
| Valvoline, Inc.(1) | | 145,360 | 6,180,707 |
| | | | $ 7,268,624 |
| Textiles, Apparel & Luxury Goods — 0.9% |
| Steven Madden Ltd. | | 41,484 | $ 1,676,368 |
| | | | $ 1,676,368 |
| Trading Companies & Distributors — 3.9% |
| Core & Main, Inc., Class A(1) | | 107,475 | $ 6,069,113 |
| Herc Holdings, Inc. | | 9,705 | 1,388,106 |
| | | | $ 7,457,219 |
Total Common Stocks
(identified cost $147,139,449) | | | $187,952,039 |
16
See Notes to Financial Statements.
Tax-Managed Small-Cap Portfolio
April 30, 2024
Portfolio of Investments (Unaudited) — continued
| Short-Term Investments — 2.0% |
| Security | Shares | Value |
| Morgan Stanley Institutional Liquidity Funds - Government Portfolio, Institutional Class, 5.22%(2) | | 3,831,905 | $ 3,831,905 |
Total Short-Term Investments
(identified cost $3,831,905) | | | $ 3,831,905 |
Total Investments — 100.1%
(identified cost $150,971,354) | | | $191,783,944 |
| Other Assets, Less Liabilities — (0.1)% | | | $ (234,157) |
| Net Assets — 100.0% | | | $191,549,787 |
| The percentage shown for each investment category in the Portfolio of Investments is based on net assets. |
| (1) | Non-income producing security. |
| (2) | May be deemed to be an affiliated investment company. The rate shown is the annualized seven-day yield as of April 30, 2024. |
| Abbreviations: |
| ADR | – American Depositary Receipt |
| REITs | – Real Estate Investment Trusts |
17
See Notes to Financial Statements.
Tax-Managed Small-Cap Portfolio
April 30, 2024
Statement of Assets and Liabilities (Unaudited)
| | April 30, 2024 |
| Assets | |
| Unaffiliated investments, at value (identified cost $147,139,449) | $ 187,952,039 |
| Affiliated investments, at value (identified cost $3,831,905) | 3,831,905 |
| Dividends receivable | 46,837 |
| Dividends receivable from affiliated investments | 15,158 |
| Receivable for investments sold | 66,009 |
| Trustees' deferred compensation plan | 62,773 |
| Total assets | $191,974,721 |
| Liabilities | |
| Payable for investments purchased | $ 199,248 |
| Payable to affiliates: | |
| Investment adviser fee | 99,638 |
| Trustees' fees | 17 |
| Trustees' deferred compensation plan | 62,773 |
| Payable for custodian fee | 28,975 |
| Payable for legal and accounting services | 23,201 |
| Accrued expenses | 11,082 |
| Total liabilities | $ 424,934 |
| Net Assets applicable to investors' interest in Portfolio | $191,549,787 |
18
See Notes to Financial Statements.
Tax-Managed Small-Cap Portfolio
April 30, 2024
Statement of Operations (Unaudited)
| | Six Months Ended |
| | April 30, 2024 |
| Investment Income | |
| Dividend income | $ 1,235,565 |
| Dividend income from affiliated investments | 48,977 |
| Total investment income | $ 1,284,542 |
| Expenses | |
| Investment adviser fee | $ 586,282 |
| Trustees’ fees and expenses | 5,300 |
| Custodian fee | 25,355 |
| Legal and accounting services | 24,650 |
| Miscellaneous | 5,121 |
| Total expenses | $ 646,708 |
| Deduct: | |
| Waiver and/or reimbursement of expenses by affiliates | $ 1,418 |
| Total expense reductions | $ 1,418 |
| Net expenses | $ 645,290 |
| Net investment income | $ 639,252 |
| Realized and Unrealized Gain (Loss) | |
| Net realized gain (loss): | |
| Investment transactions | $ 6,946,645(1) |
| Net realized gain | $ 6,946,645 |
| Change in unrealized appreciation (depreciation): | |
| Investments | $ 24,368,719 |
| Net change in unrealized appreciation (depreciation) | $24,368,719 |
| Net realized and unrealized gain | $31,315,364 |
| Net increase in net assets from operations | $31,954,616 |
| (1) | Includes $1,546,691 of net realized gains from redemptions in-kind. |
19
See Notes to Financial Statements.
Tax-Managed Small-Cap Portfolio
April 30, 2024
Statements of Changes in Net Assets
| | Six Months Ended
April 30, 2024
(Unaudited) | Year Ended
October 31, 2023 |
| Increase (Decrease) in Net Assets | | |
| From operations: | | |
| Net investment income | $ 639,252 | $ 1,181,477 |
| Net realized gain | 6,946,645 (1) | 6,239,441 (2) |
| Net change in unrealized appreciation (depreciation) | 24,368,719 | (19,977,504) |
| Net increase (decrease) in net assets from operations | $ 31,954,616 | $ (12,556,586) |
| Capital transactions: | | |
| Contributions | $ 2,806,103 | $ 5,986,402 |
| Withdrawals | (4,981,266) | (11,288,950) |
| Net decrease in net assets from capital transactions | $ (2,175,163) | $ (5,302,548) |
| Net increase (decrease) in net assets | $ 29,779,453 | $ (17,859,134) |
| Net Assets | | |
| At beginning of period | $ 161,770,334 | $ 179,629,468 |
| At end of period | $191,549,787 | $161,770,334 |
| (1) | Includes $1,546,691 of net realized gains from redemptions in-kind. |
| (2) | Includes $3,629,618 of net realized gains from redemptions in-kind. |
20
See Notes to Financial Statements.
Tax-Managed Small-Cap Portfolio
April 30, 2024
| | Six Months Ended
April 30, 2024
(Unaudited) | Year Ended October 31, |
| Ratios/Supplemental Data | 2023 | 2022 | 2021 | 2020 | 2019 |
| Ratios (as a percentage of average daily net assets): | | | | | | |
| Expenses | 0.69% (1)(2) | 0.68% (2) | 0.69% (2) | 0.68% | 0.69% | 0.69% |
| Net investment income | 0.68% (1) | 0.65% | 0.41% | 0.27% | 0.54% | 0.51% |
| Portfolio Turnover | 20% (3) | 38% | 43% | 40% | 44% | 51% |
| Total Return | 19.76% (3) | (7.19)% | (12.42)% | 42.69% | (2.63)% | 12.82% |
| Net assets, end of period (000’s omitted) | $191,550 | $161,770 | $179,629 | $215,268 | $155,429 | $178,500 |
| (1) | Annualized. |
| (2) | Includes a reduction by the investment adviser of a portion of its adviser fee due to the Portfolio’s investment in the Liquidity Fund (equal to less than 0.005% of average daily net assets for the six months ended April 30, 2024 and the years ended October 31, 2023 and 2022). |
| (3) | Not annualized. |
Tax-Managed Small-Cap Portfolio
April 30, 2024
Notes to Financial Statements (Unaudited)
1 Significant Accounting Policies
Tax-Managed Small-Cap Portfolio (the Portfolio) is a Massachusetts business trust registered under the Investment Company Act of 1940, as amended (the 1940 Act), as a diversified, open-end management investment company. The Portfolio’s investment objective is to achieve long-term, after-tax returns by investing primarily in a diversified portfolio of publicly-traded equity securities of small-cap companies. The Declaration of Trust permits the Trustees to issue interests in the Portfolio. At April 30, 2024, Eaton Vance Tax-Managed Small-Cap Fund and Eaton Vance Tax-Managed Equity Asset Allocation Fund held an interest of 65.1% and 34.9%, respectively, in the Portfolio.
The following is a summary of significant accounting policies of the Portfolio. The policies are in conformity with accounting principles generally accepted in the United States of America (U.S. GAAP). The Portfolio is an investment company and follows accounting and reporting guidance in the Financial Accounting Standards Board (FASB) Accounting Standards Codification Topic 946.
A Investment Valuation—The following methodologies are used to determine the market value or fair value of investments.
Equity Securities. Equity securities listed on a U.S. securities exchange generally are valued at the last sale or closing price on the day of valuation or, if no sales took place on such date, at the mean between the closing bid and ask prices on the exchange where such securities are principally traded. Equity securities listed on the NASDAQ National Market System are valued at the NASDAQ official closing price. Unlisted or listed securities for which closing sales prices or closing quotations are not available are valued at the mean between the latest available bid and ask prices.
Other. Investments in management investment companies (including money market funds) that do not trade on an exchange are valued at the net asset value as of the close of each business day.
Fair Valuation. In connection with Rule 2a-5 of the 1940 Act, the Trustees have designated the Portfolio’s investment adviser as its valuation designee. Investments for which valuations or market quotations are not readily available or are deemed unreliable are valued by the investment adviser, as valuation designee, at fair value using methods that most fairly reflect the security’s “fair value”, which is the amount that the Portfolio might reasonably expect to receive for the security upon its current sale in the ordinary course. Each such determination is based on a consideration of relevant factors, which are likely to vary from one pricing context to another. These factors may include, but are not limited to, the type of security, the existence of any contractual restrictions on the security’s disposition, the price and extent of public trading in similar securities of the issuer or of comparable companies or entities, quotations or relevant information obtained from broker/dealers or other market participants, information obtained from the issuer, analysts, and/or the appropriate stock exchange (for exchange-traded securities), an analysis of the company’s or entity’s financial statements, and an evaluation of the forces that influence the issuer and the market(s) in which the security is purchased and sold.
B Investment Transactions—Investment transactions for financial statement purposes are accounted for on a trade date basis. Realized gains and losses on investments sold are determined on the basis of identified cost.
C Income—Dividend income is recorded on the ex-dividend date for dividends received in cash and/or securities.
D Federal Taxes—The Portfolio has elected to be treated as a partnership for federal tax purposes. No provision is made by the Portfolio for federal or state taxes on any taxable income of the Portfolio because each investor in the Portfolio is ultimately responsible for the payment of any taxes on its share of taxable income. Since at least one of the Portfolio's investors is a regulated investment company that invests all or substantially all of its assets in the Portfolio, the Portfolio normally must satisfy the applicable source of income and diversification requirements (under the Internal Revenue Code) in order for its investors to satisfy them. The Portfolio will allocate, at least annually among its investors, each investor's distributive share of the Portfolio's net investment income, net realized capital gains and losses and any other items of income, gain, loss, deduction or credit.
As of April 30, 2024, the Portfolio had no uncertain tax positions that would require financial statement recognition, de-recognition, or disclosure. The Portfolio files a U.S. federal income tax return annually after its fiscal year-end, which is subject to examination by the Internal Revenue Service for a period of three years from the date of filing.
E Use of Estimates—The preparation of the financial statements in conformity with U.S. GAAP requires management to make estimates and assumptions that affect the reported amounts of assets and liabilities at the date of the financial statements and the reported amounts of income and expense during the reporting period. Actual results could differ from those estimates.
F Indemnifications—Under the Portfolio’s organizational documents, its officers and Trustees may be indemnified against certain liabilities and expenses arising out of the performance of their duties to the Portfolio. Under Massachusetts law, if certain conditions prevail, interestholders in the Portfolio could be deemed to have personal liability for the obligations of the Portfolio. However, the Portfolio’s Declaration of Trust contains an express disclaimer of liability on the part of Portfolio interestholders. Additionally, in the normal course of business, the Portfolio enters into agreements with service providers that may contain indemnification clauses. The Portfolio’s maximum exposure under these arrangements is unknown as this would involve future claims that may be made against the Portfolio that have not yet occurred.
G Interim Financial Statements—The interim financial statements relating to April 30, 2024 and for the six months then ended have not been audited by an independent registered public accounting firm, but in the opinion of the Portfolio’s management, reflect all adjustments, consisting only of normal recurring adjustments, necessary for the fair presentation of the financial statements.
Tax-Managed Small-Cap Portfolio
April 30, 2024
Notes to Financial Statements (Unaudited) — continued
2 Investment Adviser Fee and Other Transactions with Affiliates
The investment adviser fee is earned by Boston Management and Research (BMR), an indirect, wholly-owned subsidiary of Morgan Stanley, as compensation for investment advisory services rendered to the Portfolio. The fee is computed at an annual rate as a percentage of the Portfolio’s average daily net assets as follows and is payable monthly:
| Average Daily Net Assets | Annual Fee Rate |
| Up to $500 million | 0.6250% |
| $500 million but less than $1 billion | 0.5625% |
| $1 billion but less than $1.5 billion | 0.5000% |
| $1.5 billion and over | 0.4375% |
For the six months ended April 30, 2024, the investment adviser fee amounted to $586,282 or 0.625% (annualized) of the Portfolio’s average daily net assets. The Portfolio may invest in a money market fund, the Institutional Class of the Morgan Stanley Institutional Liquidity Funds - Government Portfolio (the “Liquidity Fund”), an open-end management investment company managed by Morgan Stanley Investment Management Inc., a wholly-owned subsidiary of Morgan Stanley. The investment adviser fee paid by the Portfolio is reduced by an amount equal to its pro rata share of the advisory and administration fees paid by the Portfolio due to its investment in the Liquidity Fund. For the six months ended April 30, 2024, the investment adviser fee paid was reduced by $1,418 relating to the Portfolio’s investment in the Liquidity Fund.
Trustees and officers of the Portfolio who are members of BMR’s organization receive remuneration for their services to the Portfolio out of the investment adviser fee. Trustees of the Portfolio who are not affiliated with the investment adviser may elect to defer receipt of all or a percentage of their annual fees in accordance with the terms of the Trustees Deferred Compensation Plan. Certain officers and Trustees of the Portfolio are officers of the above organization.
3 Purchases and Sales of Investments
Purchases and sales of investments, other than short-term obligations and in-kind transactions, aggregated $37,370,408 and $38,970,242, respectively, for the six months ended April 30, 2024. In-kind sales for the six months ended April 30, 2024 aggregated $1,848,902.
4 Federal Income Tax Basis of Investments
The cost and unrealized appreciation (depreciation) of investments of the Portfolio at April 30, 2024, as determined on a federal income tax basis, were as follows:
| Aggregate cost | $151,619,168 |
| Gross unrealized appreciation | $ 45,281,506 |
| Gross unrealized depreciation | (5,116,730) |
| Net unrealized appreciation | $ 40,164,776 |
5 Line of Credit
The Portfolio participates with other portfolios and funds managed by BMR and its affiliates in a $650 million unsecured revolving line of credit agreement with a group of banks, which is in effect through October 22, 2024. Borrowings are made by the Portfolio solely for temporary purposes related to redemptions and other short-term cash needs. Interest is charged to the Portfolio based on its borrowings at an amount above either the Secured Overnight Financing Rate (SOFR) or Federal Funds rate. In addition, a fee computed at an annual rate of 0.15% on the daily unused portion of the line of credit is allocated among the participating portfolios and funds at the end of each quarter. In connection with the renewal of the agreement in October 2023, an arrangement fee of $150,000 was incurred that was allocated to the participating portfolios and funds. Because the line of credit is not available exclusively to the Portfolio, it may be unable to borrow some or all of its requested amounts at any particular time. The Portfolio did not have any significant borrowings or allocated fees during the six months ended April 30, 2024.
Tax-Managed Small-Cap Portfolio
April 30, 2024
Notes to Financial Statements (Unaudited) — continued
6 Affiliated Investments
At April 30, 2024, the value of the Portfolio's investment in funds that may be deemed to be affiliated was $3,831,905, which represents 2.0% of the Portfolio's net assets. Transactions in such investments by the Portfolio for the fiscal year to date ended April 30, 2024 were as follows:
| Name | Value,
beginning
of period | Purchases | Sales
proceeds | Net realized
gain (loss) | Change in
unrealized
appreciation
(depreciation) | Value, end
of period | Dividend
income | Shares,
end of period |
| Short-Term Investments |
| Liquidity Fund | $1,508,206 | $20,215,454 | $(17,891,755) | $ — | $ — | $3,831,905 | $48,977 | 3,831,905 |
7 Fair Value Measurements
Under generally accepted accounting principles for fair value measurements, a three-tier hierarchy to prioritize the assumptions, referred to as inputs, is used in valuation techniques to measure fair value. The three-tier hierarchy of inputs is summarized in the three broad levels listed below.
| • | Level 1 – quoted prices in active markets for identical investments |
| • | Level 2 – other significant observable inputs (including quoted prices for similar investments, interest rates, prepayment speeds, credit risk, etc.) |
| • | Level 3 – significant unobservable inputs (including a fund's own assumptions in determining the fair value of investments) |
In cases where the inputs used to measure fair value fall in different levels of the fair value hierarchy, the level disclosed is determined based on the lowest level input that is significant to the fair value measurement in its entirety. The inputs or methodology used for valuing securities are not necessarily an indication of the risk associated with investing in those securities.
At April 30, 2024, the hierarchy of inputs used in valuing the Portfolio's investments, which are carried at fair value, were as follows:
| Asset Description | Level 1 | Level 2 | Level 3 | Total |
| Common Stocks | $ 187,952,039* | $ — | $ — | $ 187,952,039 |
| Short-Term Investments | 3,831,905 | — | — | 3,831,905 |
| Total Investments | $ 191,783,944 | $ — | $ — | $191,783,944 |
| * | The level classification by major category of investments is the same as the category presentation in the Portfolio of Investments. |
Eaton Vance
Tax-Managed Small-Cap Fund
April 30, 2024
| Officers of Eaton Vance Tax-Managed Small-Cap Fund |
Kenneth A. Topping
President | Nicholas S. Di Lorenzo
Secretary |
Deidre E. Walsh
Vice President and Chief Legal Officer | Laura T. Donovan
Chief Compliance Officer |
James F. Kirchner
Treasurer | |
| Officers of Tax-Managed Small-Cap Portfolio |
R. Kelly Williams, Jr.
President | Nicholas S. Di Lorenzo
Secretary |
Deidre E. Walsh
Vice President and Chief Legal Officer | Laura T. Donovan
Chief Compliance Officer |
James F. Kirchner
Treasurer | |
| Trustees of Eaton Vance Tax-Managed Small-Cap Fund and Tax-Managed Small-Cap Portfolio | |
George J. Gorman
Chairperson | |
| Alan C. Bowser | |
| Mark R. Fetting | |
| Cynthia E. Frost | |
| Valerie A. Mosley | |
| Anchal Pachnanda* | |
| Keith Quinton | |
| Marcus L. Smith | |
| Susan J. Sutherland | |
| Scott E. Wennerholm | |
| Nancy A. Wiser | |
| U.S. Customer Privacy Notice | March 2024 |
| FACTS | WHAT DOES EATON VANCE DO WITH YOUR PERSONAL INFORMATION? |
| Why? | Financial companies choose how they share your personal information. Federal law gives consumers the right to limit some but not all sharing. Federal law also requires us to tell you how we collect, share, and protect your personal information. Please read this notice carefully to understand what we do. |
| |
| What? | The types of personal information we collect and share depend on the product or service you have with us. This information can include:■ Social Security number and income
■ investment experience and risk tolerance
■ checking account information and wire transfer instructions |
| |
| How? | All financial companies need to share customers’ personal information to run their everyday business. In the section below, we list the reasons financial companies can share their customers’ personal information; the reasons Eaton Vance chooses to share; and whether you can limit this sharing. |
| Reasons we can share your personal information | Does Eaton Vance
share? | Can you limit
this sharing? |
| For our everyday business purposes — such as to process your transactions, maintain your account(s), respond to court orders and legal investigations, or report to credit bureaus | Yes | No |
| For our marketing purposes — to offer our products and services to you | Yes | No |
| For joint marketing with other financial companies | No | We don’t share |
| For our affiliates’ everyday business purposes — information about your transactions and experiences | Yes | No* |
| For our affiliates’ everyday business purposes — information about your creditworthiness | Yes | Yes* |
| For our affiliates to market to you | Yes | Yes* |
| For nonaffiliates to market to you | No | We don’t share |
To limit our
sharing | Call toll-free 1-800-262-1122 or email: EVPrivacy@eatonvance.comPlease note:If you are a new customer, we can begin sharing your information 30 days from the date we sent this notice. When you are no longer our customer, we continue to share your information as described in this notice. However, you can contact us at any time to limit our sharing. |
| Questions? | Call toll-free 1-800-262-1122 or email: EVPrivacy@eatonvance.com |
| U.S. Customer Privacy Notice — continued | March 2024 |
| Who we are |
| Who is providing this notice? | Eaton Vance Management and our investment management affiliates (“Eaton Vance”) (see Affiliates definition below.) |
| What we do |
How does Eaton Vance
protect my personal
information? | To protect your personal information from unauthorized access and use, we use security measures that comply with federal law. These measures include computer safeguards and secured files and buildings. We have policies governing the proper handling of customer information by personnel and requiring third parties that provide support to adhere to appropriate security standards with respect to such information. |
How does Eaton Vance
collect my personal
information? | We collect your personal information, for example, when you■ open an account or make deposits or withdrawals from your account
■ buy securities from us or make a wire transfer
■ give us your contact informationWe also collect your personal information from others, such as credit bureaus, affiliates, or other companies. |
| Why can’t I limit all sharing? | Federal law gives you the right to limit only■ sharing for affiliates’ everyday business purposes — information about your creditworthiness
■ affiliates from using your information to market to you
■ sharing for nonaffiliates to market to youState laws and individual companies may give you additional rights to limit sharing. (See below for more on your rights under state law.) |
What happens when I limit
sharing for an account I hold
jointly with someone else? | Your choices will apply to everyone on your account. |
| Definitions |
| Affiliates | Companies related by common ownership or control. They can be financial and nonfinancial companies.■ Our affiliates include registered investment advisers such as Eaton Vance Management, Eaton Vance Advisers International Ltd., Boston Management and Research, Calvert Research and Management, Parametric Portfolio Associates LLC, Atlanta Capital Management Company LLC, Morgan Stanley Investment Management Inc., Morgan Stanley Investment Management Co.; registered broker-dealers such as Morgan Stanley Distributors Inc. and Eaton Vance Distributors, Inc. (together, the “Investment Management Affiliates”); and companies with a Morgan Stanley name and financial companies such as Morgan Stanley Smith Barney LLC and Morgan Stanley & Co. (the “Morgan Stanley Affiliates”). |
| Nonaffiliates | Companies not related by common ownership or control. They can be financial and nonfinancial companies.■ Eaton Vance does not share with nonaffiliates so they can market to you. |
| Joint marketing | A formal agreement between nonaffiliated financial companies that together market financial products or services to you.■ Eaton Vance does not jointly market. |
| U.S. Customer Privacy Notice — continued | March 2024 |
| Other important information |
| *PLEASE NOTE: Eaton Vance does not share your creditworthiness information or your transactions and experiences information with the Morgan Stanley Affiliates, nor does Eaton Vance enable the Morgan Stanley Affiliates to market to you. Your opt outs will prevent Eaton Vance from sharing your creditworthiness information with the Investment Management Affiliates and will prevent the Investment Management Affiliates from marketing their products to you.Vermont: Except as permitted by law, we will not share personal information we collect about Vermont residents with Nonaffiliates unless you provide us with your written consent to share such information.California: Except as permitted by law, we will not share personal information we collect about California residents with Nonaffiliates and we will limit sharing such personal information with our Affiliates to comply with California privacy laws that apply to us. |
Delivery of Shareholder Documents. The Securities and Exchange Commission (SEC) permits funds to deliver only one copy of shareholder documents, including prospectuses, proxy statements and shareholder reports, to fund investors with multiple accounts at the same residential or post office box address. This practice is often called “householding” and it helps eliminate duplicate mailings to shareholders. Eaton Vance, or your financial intermediary, may household the mailing of your documents indefinitely unless you instruct Eaton Vance, or your financial intermediary, otherwise. If you would prefer that your Eaton Vance documents not be householded, please contact Eaton Vance at 1-800-262-1122, or contact your financial intermediary. Your instructions that householding not apply to delivery of your Eaton Vance documents will typically be effective within 30 days of receipt by Eaton Vance or your financial intermediary.
Portfolio Holdings. Each Eaton Vance Fund and its underlying Portfolio(s) (if applicable) files a schedule of portfolio holdings on Part F to Form N-PORT with the SEC. Certain information filed on Form N-PORT may be viewed on the Eaton Vance website at www.eatonvance.com, by calling Eaton Vance at 1-800-262-1122 or in the EDGAR database on the SEC’s website at www.sec.gov.
Proxy Voting. From time to time, funds are required to vote proxies related to the securities held by the funds. The Eaton Vance Funds or their underlying Portfolios (if applicable) vote proxies according to a set of policies and procedures approved by the Funds’ and Portfolios’ Boards. You may obtain a description of these policies and procedures and information on how the Funds or Portfolios voted proxies relating to portfolio securities during the most recent 12-month period ended June 30, without charge, upon request, by calling 1-800-262-1122 and by accessing the SEC’s website at www.sec.gov.
Tailored Shareholder Reports. Effective January 24, 2023, the SEC adopted rule and form amendments to require open-end mutual funds and ETFs to transmit concise and visually engaging streamlined annual and semi-annual reports to shareholders that highlight key information. Other information, including financial statements, will no longer appear in a streamlined shareholder report but must be available online, delivered free of charge upon request, and filed on a semi-annual basis on Form N-CSR. The rule and form amendments have a compliance date of July 24, 2024. At this time, management is evaluating the impact of these amendments on the shareholder reports for the Eaton Vance Funds.
This Page Intentionally Left Blank
This Page Intentionally Left Blank
This Page Intentionally Left Blank
Investment Adviser of Tax-Managed Small-Cap Portfolio
Boston Management and Research
One Post Office Square
Boston, MA 02109
Investment Adviser and Administrator of Eaton Vance
Tax-Managed Small-Cap Fund
Eaton Vance Management
One Post Office Square
Boston, MA 02109
Principal Underwriter*
Eaton Vance Distributors, Inc.
One Post Office Square
Boston, MA 02109
(617) 482-8260
Custodian
State Street Bank and Trust Company
One Congress Street, Suite 1
Boston, MA 02114-2016
Transfer Agent
BNY Mellon Investment Servicing (US) Inc.
Attn: Eaton Vance Funds
P.O. Box 534439
Pittsburgh, PA 15253-4439
(800) 262-1122
Fund Offices
One Post Office Square
Boston, MA 02109
* FINRA BrokerCheck. Investors may check the background of their Investment Professional by contacting the Financial Industry Regulatory Authority (FINRA). FINRA BrokerCheck is a free tool to help investors check the professional background of current and former FINRA-registered securities firms and brokers. FINRA BrokerCheck is available by calling 1-800-289-9999 and at www.FINRA.org. The FINRA BrokerCheck brochure describing this program is available to investors at www.FINRA.org.
Eaton Vance
Tax-Managed Value Fund
Semi-Annual Report
April 30, 2024
Commodity Futures Trading Commission Registration. The Commodity Futures Trading Commission (“CFTC”) has adopted regulations that subject registered investment companies and advisers to regulation by the CFTC if a fund invests more than a prescribed level of its assets in certain CFTC-regulated instruments (including futures, certain options and swap agreements) or markets itself as providing investment exposure to such instruments. The investment adviser has claimed an exclusion from the definition of “commodity pool operator” under the Commodity Exchange Act with respect to its management of the Fund. Accordingly, neither the Fund nor the adviser with respect to the operation of the Fund is subject to CFTC regulation. Because of its management of other strategies, the Fund's adviser is registered with the CFTC as a commodity pool operator. The adviser is also registered as a commodity trading advisor.
Fund shares are not insured by the FDIC and are not deposits or other obligations of, or guaranteed by, any depository institution. Shares are subject to investment risks, including possible loss of principal invested.
This report must be preceded or accompanied by a current summary prospectus or prospectus. Before investing, investors should consider carefully the investment objective, risks, and charges and expenses of a mutual fund. This and other important information is contained in the summary prospectus and prospectus, which can be obtained from a financial intermediary. Prospective investors should read the prospectus carefully before investing. For further information, please call 1-800-262-1122.
Semi-Annual Report April 30, 2024
Eaton Vance
Tax-Managed Value Fund
Eaton Vance
Tax-Managed Value Fund
April 30, 2024
Performance
Portfolio Manager(s) Aaron S. Dunn, CFA and Bradley T. Galko, CFA
| % Average Annual Total Returns1,2 | Class
Inception Date | Performance
Inception Date | Six Months | One Year | Five Years | Ten Years |
| Class A at NAV | 12/27/1999 | 12/27/1999 | 21.92% | 14.87% | 9.09% | 8.72% |
| Class A with 5.25% Maximum Sales Charge | — | — | 15.53 | 8.83 | 7.93 | 8.14 |
| Class C at NAV | 01/24/2000 | 01/24/2000 | 21.44 | 13.98 | 8.27 | 8.07 |
| Class C with 1% Maximum Deferred Sales Charge | — | — | 20.44 | 12.98 | 8.27 | 8.07 |
| Class I at NAV | 11/30/2007 | 12/27/1999 | 22.05 | 15.13 | 9.36 | 8.98 |
|
| Russell 1000® Value Index | — | — | 18.42% | 13.42% | 8.59% | 8.43% |
| % After-Tax Returns with Maximum Sales Charge | Class
Inception Date | Performance
Inception Date | One Year | Five Years | Ten Years |
| Class A After Taxes on Distributions | 12/27/1999 | 12/27/1999 | 14.01% | 8.54% | 7.93% |
| Class A After Taxes on Distributions and Sale of Fund Shares | — | — | 9.34 | 7.20 | 6.93 |
| Class C After Taxes on Distributions | 01/24/2000 | 01/24/2000 | 13.29 | 7.88 | 7.41 |
| Class C After Taxes on Distributions and Sale of Fund Shares | — | — | 8.71 | 6.54 | 6.41 |
| Class I After Taxes on Distributions | 11/30/2007 | 12/27/1999 | 14.20 | 8.75 | 8.13 |
| Class I After Taxes on Distributions and Sale of Fund Shares | — | — | 9.54 | 7.42 | 7.14 |
| % Total Annual Operating Expense Ratios3 | Class A | Class C | Class I |
| | 1.16% | 1.91% | 0.91% |
See Endnotes and Additional Disclosures in this report.
Past performance is no guarantee of future results. Returns are historical and are calculated by determining the percentage change in net asset value (NAV) or offering price (as applicable) with all distributions reinvested. Furthermore, returns do not reflect the deduction of taxes that shareholders may have to pay on Fund distributions or upon the redemption of Fund shares. Investment return and principal value will fluctuate so that shares, when redeemed, may be worth more or less than their original cost. Performance for periods less than or equal to one year is cumulative. Performance is for the stated time period only; due to market volatility, current Fund performance may be lower or higher than the quoted return. For performance as of the most recent month-end, please refer to eatonvance.com.
Eaton Vance
Tax-Managed Value Fund
April 30, 2024
| Sector Allocation (% of net assets)1 |
| Top 10 Holdings (% of net assets)1 |
| JPMorgan Chase & Co. | 4.6% |
| Micron Technology, Inc. | 3.4 |
| Charles Schwab Corp. | 3.2 |
| Chevron Corp. | 3.0 |
| Home Depot, Inc. | 2.8 |
| Ingersoll Rand, Inc. | 2.8 |
| Constellation Brands, Inc., Class A | 2.7 |
| NextEra Energy, Inc. | 2.7 |
| Thermo Fisher Scientific, Inc. | 2.7 |
| Sempra | 2.4 |
| Total | 30.3% |
Fund invests in an affiliated investment company (Portfolio) with the same objective(s) and policies as the Fund. References to investments are to the Portfolio’s holdings.
Footnotes:
| 1 | Excludes cash and cash equivalents. |
Eaton Vance
Tax-Managed Value Fund
April 30, 2024
Endnotes and Additional Disclosures
| 1 | Russell 1000® Value Index is an unmanaged index of U.S. large-cap value stocks. Unless otherwise stated, index returns do not reflect the effect of any applicable sales charges, commissions, expenses, taxes or leverage, as applicable. It is not possible to invest directly in an index. |
| 2 | Total Returns at NAV do not include applicable sales charges. If sales charges were deducted, the returns would be lower. Total Returns shown with maximum sales charge reflect the stated maximum sales charge. Unless otherwise stated, performance does not reflect the deduction of taxes on Fund distributions or redemptions of Fund shares. After-tax returns are calculated using certain assumptions, including using the highest historical individual federal income tax rates, and do not reflect the impact of state/local taxes. Actual after-tax returns depend on a shareholder’s tax situation and the actual characterization of distributions and may differ from those shown. After-tax returns are not relevant to shareholders who hold shares in tax-deferred accounts or shares held by nontaxable entities. Return After Taxes on Distributions may be the same as Return Before Taxes for the same period because no taxable distributions were made during that period. Return After Taxes on Distributions and Sale of Fund Shares may be greater than or equal to Return After Taxes on Distributions for the same period because of losses realized on the sale of Fund shares. The Fund’s after-tax returns also may reflect foreign tax credits passed by the Fund to its shareholders.Effective November 5, 2020, Class C shares automatically convert to Class A shares eight years after purchase. The average annual total returns listed for Class C reflect conversion to Class A shares after eight years. Prior to November 5, 2020, Class C shares automatically converted to Class A shares ten years after purchase. |
| 3 | Source: Fund prospectus. The expense ratios for the current reporting period can be found in the Financial Highlights section of this report. Performance reflects expenses waived and/or reimbursed, if applicable. Without such waivers and/or reimbursements, performance would have been lower. |
| | Fund profile subject to change due to active management. |
Eaton Vance
Tax-Managed Value Fund
April 30, 2024
Example
As a Fund shareholder, you incur two types of costs: (1) transaction costs, including sales charges (loads) on purchases; and (2) ongoing costs, including management fees; distribution and/or service fees; and other Fund expenses. This Example is intended to help you understand your ongoing costs (in dollars) of Fund investing and to compare these costs with the ongoing costs of investing in other mutual funds. The Example is based on an investment of $1,000 invested at the beginning of the period and held for the entire period (November 1, 2023 to April 30, 2024).
Actual Expenses
The first section of the table below provides information about actual account values and actual expenses. You may use the information in this section, together with the amount you invested, to estimate the expenses that you paid over the period. Simply divide your account value by $1,000 (for example, an $8,600 account value divided by $1,000 = 8.6), then multiply the result by the number in the first section under the heading entitled “Expenses Paid During Period” to estimate the expenses you paid on your account during this period.
Hypothetical Example for Comparison Purposes
The second section of the table below provides information about hypothetical account values and hypothetical expenses based on the actual Fund expense ratio and an assumed rate of return of 5% per year (before expenses), which is not the actual Fund return. The hypothetical account values and expenses may not be used to estimate the actual ending account balance or expenses you paid for the period. You may use this information to compare the ongoing costs of investing in your Fund and other funds. To do so, compare this 5% hypothetical example with the 5% hypothetical examples that appear in the shareholder reports of the other funds.
Please note that the expenses shown in the table are meant to highlight your ongoing costs only and do not reflect any transactional costs, such as sales charges (loads). Therefore, the second section of the table is useful in comparing ongoing costs only, and will not help you determine the relative total costs of owning different funds. In addition, if these transactional costs were included, your costs would be higher.
| | Beginning
Account Value
(11/1/23) | Ending
Account Value
(4/30/24) | Expenses Paid
During Period*
(11/1/23 – 4/30/24) | Annualized
Expense
Ratio |
| Actual | | | | |
| Class A | $1,000.00 | $1,219.20 | $ 6.40 | 1.16% |
| Class C | $1,000.00 | $1,214.40 | $10.52 | 1.91% |
| Class I | $1,000.00 | $1,220.50 | $ 5.02 | 0.91% |
| |
| Hypothetical | | | | |
| (5% return per year before expenses) | | | | |
| Class A | $1,000.00 | $1,019.10 | $ 5.82 | 1.16% |
| Class C | $1,000.00 | $1,015.37 | $ 9.57 | 1.91% |
| Class I | $1,000.00 | $1,020.34 | $ 4.57 | 0.91% |
| * | Expenses are equal to the Fund's annualized expense ratio for the indicated Class, multiplied by the average account value over the period, multiplied by 182/366 (to reflect the one-half year period). The Example assumes that the $1,000 was invested at the net asset value per share determined at the close of business on October 31, 2023. The Example reflects the expenses of both the Fund and the Portfolio. |
Eaton Vance
Tax-Managed Value Fund
April 30, 2024
Statement of Assets and Liabilities (Unaudited)
| | April 30, 2024 |
| Assets | |
| Investment in Tax-Managed Value Portfolio, at value (identified cost $343,534,451) | $ 779,174,774 |
| Receivable for Fund shares sold | 102,371 |
| Total assets | $779,277,145 |
| Liabilities | |
| Payable for Fund shares redeemed | $ 391,597 |
| Payable to affiliates: | |
| Administration fee | 96,166 |
| Distribution and service fees | 115,686 |
| Payable for transfer and dividend disbursing agent fees | 58,513 |
| Accrued expenses | 84,776 |
| Total liabilities | $ 746,738 |
| Net Assets | $778,530,407 |
| Sources of Net Assets | |
| Paid-in capital | $ 357,757,816 |
| Distributable earnings | 420,772,591 |
| Net Assets | $778,530,407 |
| Class A Shares | |
| Net Assets | $ 468,811,128 |
| Shares Outstanding | 12,003,652 |
Net Asset Value and Redemption Price Per Share
(net assets ÷ shares of beneficial interest outstanding) | $ 39.06 |
Maximum Offering Price Per Share
(100 ÷ 94.75 of net asset value per share) | $ 41.22 |
| Class C Shares | |
| Net Assets | $ 22,918,761 |
| Shares Outstanding | 611,932 |
Net Asset Value and Offering Price Per Share*
(net assets ÷ shares of beneficial interest outstanding) | $ 37.45 |
| Class I Shares | |
| Net Assets | $ 286,800,518 |
| Shares Outstanding | 7,378,597 |
Net Asset Value, Offering Price and Redemption Price Per Share
(net assets ÷ shares of beneficial interest outstanding) | $ 38.87 |
| On sales of $50,000 or more, the offering price of Class A shares is reduced. |
| * | Redemption price per share is equal to the net asset value less any applicable contingent deferred sales charge. |
6
See Notes to Financial Statements.
Eaton Vance
Tax-Managed Value Fund
April 30, 2024
Statement of Operations (Unaudited)
| | Six Months Ended |
| | April 30, 2024 |
| Investment Income | |
| Dividend income allocated from Portfolio (net of foreign taxes withheld of $42,023) | $ 7,081,539 |
| Securities lending income allocated from Portfolio, net | 744 |
| Expenses allocated from Portfolio | (2,517,003) |
| Total investment income from Portfolio | $ 4,565,280 |
| Expenses | |
| Administration fee | $ 556,246 |
| Distribution and service fees: | |
| Class A | 558,461 |
| Class C | 109,393 |
| Trustees’ fees and expenses | 208 |
| Custodian fee | 24,787 |
| Transfer and dividend disbursing agent fees | 149,049 |
| Legal and accounting services | 35,764 |
| Printing and postage | 21,646 |
| Registration fees | 26,333 |
| ReFlow liquidity program fees | 32,907 |
| Miscellaneous | 10,282 |
| Total expenses | $ 1,525,076 |
| Net investment income | $ 3,040,204 |
| Realized and Unrealized Gain (Loss) from Portfolio | |
| Net realized gain (loss): | |
| Investment transactions | $ 36,521,084(1) |
| Foreign currency transactions | (2,700) |
| Net realized gain | $ 36,518,384 |
| Change in unrealized appreciation (depreciation): | |
| Investments | $ 104,561,322 |
| Foreign currency | (3,471) |
| Net change in unrealized appreciation (depreciation) | $104,557,851 |
| Net realized and unrealized gain | $141,076,235 |
| Net increase in net assets from operations | $144,116,439 |
| (1) | Includes $13,421,021 of net realized gains from redemptions in-kind. |
7
See Notes to Financial Statements.
Eaton Vance
Tax-Managed Value Fund
April 30, 2024
Statements of Changes in Net Assets
| | Six Months Ended
April 30, 2024
(Unaudited) | Year Ended
October 31, 2023 |
| Increase (Decrease) in Net Assets | | |
| From operations: | | |
| Net investment income | $ 3,040,204 | $ 7,245,855 |
| Net realized gain | 36,518,384 (1) | 37,252,522 (2) |
| Net change in unrealized appreciation (depreciation) | 104,557,851 | (59,112,750) |
| Net increase (decrease) in net assets from operations | $144,116,439 | $ (14,614,373) |
| Distributions to shareholders: | | |
| Class A | $ (14,155,725) | $ (9,264,246) |
| Class C | (567,330) | (361,789) |
| Class I | (9,367,730) | (6,334,332) |
| Total distributions to shareholders | $ (24,090,785) | $ (15,960,367) |
| Transactions in shares of beneficial interest: | | |
| Class A | $ (3,126,962) | $ (13,926,797) |
| Class C | (467,531) | (3,598,530) |
| Class I | (2,728,975) | (6,008,615) |
| Net decrease in net assets from Fund share transactions | $ (6,323,468) | $ (23,533,942) |
| Net increase (decrease) in net assets | $113,702,186 | $ (54,108,682) |
| Net Assets | | |
| At beginning of period | $ 664,828,221 | $ 718,936,903 |
| At end of period | $778,530,407 | $664,828,221 |
| (1) | Includes $13,421,021 of net realized gains from redemptions in-kind. |
| (2) | Includes $21,085,534 of net realized gains from redemptions in-kind. |
8
See Notes to Financial Statements.
Eaton Vance
Tax-Managed Value Fund
April 30, 2024
| | Class A |
| | Six Months Ended
April 30, 2024
(Unaudited) | Year Ended October 31, |
| | 2023 | 2022 | 2021 | 2020 | 2019 |
| Net asset value — Beginning of period | $ 33.080 | $ 34.610 | $ 39.770 | $ 28.170 | $ 29.890 | $ 27.000 |
| Income (Loss) From Operations | | | | | | |
| Net investment income(1) | $ 0.138 | $ 0.329 | $ 0.425 | $ 0.286 | $ 0.354 | $ 0.344 |
| Net realized and unrealized gain (loss) | 7.024 | (1.111) | (3.833) | 11.731 | (1.720) | 2.931 |
| Total income (loss) from operations | $ 7.162 | $ (0.782) | $ (3.408) | $ 12.017 | $ (1.366) | $ 3.275 |
| Less Distributions | | | | | | |
| From net investment income | $ (0.264) | $ (0.387) | $ (0.307) | $ (0.341) | $ (0.339) | $ (0.278) |
| From net realized gain | (0.918) | (0.361) | (1.445) | (0.076) | (0.015) | (0.107) |
| Total distributions | $ (1.182) | $ (0.748) | $ (1.752) | $ (0.417) | $ (0.354) | $ (0.385) |
| Net asset value — End of period | $ 39.060 | $ 33.080 | $ 34.610 | $ 39.770 | $ 28.170 | $ 29.890 |
| Total Return(2) | 21.92% (3) | (2.32)% | (8.95)% | 43.03% | (4.66)% | 12.35% |
| Ratios/Supplemental Data | | | | | | |
| Net assets, end of period (000’s omitted) | $468,811 | $399,603 | $431,902 | $497,565 | $362,651 | $417,533 |
| Ratios (as a percentage of average daily net assets):(4) | | | | | | |
| Expenses | 1.16% (5)(6) | 1.16% (5) | 1.16% (5) | 1.15% | 1.17% | 1.18% |
| Net investment income | 0.75% (6) | 0.94% | 1.18% | 0.80% | 1.25% | 1.24% |
| Portfolio Turnover of the Portfolio | 15% (3) | 31% | 29% | 11% | 25% | 18% |
| (1) | Computed using average shares outstanding. |
| (2) | Returns are historical and are calculated by determining the percentage change in net asset value with all distributions reinvested and do not reflect the effect of sales charges. |
| (3) | Not annualized. |
| (4) | Includes the Fund’s share of the Portfolio’s allocated expenses. |
| (5) | Includes a reduction by the investment adviser of a portion of the Portfolio's adviser fee due to the Portfolio's investment in the Liquidity Fund (equal to less than 0.005% of average daily net assets for the six months ended April 30, 2024 and the years ended October 31, 2023 and 2022). |
| (6) | Annualized. |
9
See Notes to Financial Statements.
Eaton Vance
Tax-Managed Value Fund
April 30, 2024
Financial Highlights — continued
| | Class C |
| | Six Months Ended
April 30, 2024
(Unaudited) | Year Ended October 31, |
| | 2023 | 2022 | 2021 | 2020 | 2019 |
| Net asset value — Beginning of period | $ 31.650 | $ 33.140 | $ 38.170 | $ 27.020 | $ 28.580 | $ 25.810 |
| Income (Loss) From Operations | | | | | | |
| Net investment income(1) | $ —(2) | $ 0.066 | $ 0.148 | $ 0.018 | $ 0.137 | $ 0.150 |
| Net realized and unrealized gain (loss) | 6.718 | (1.061) | (3.677) | 11.278 | (1.673) | 2.794 |
| Total income (loss) from operations | $ 6.718 | $ (0.995) | $ (3.529) | $11.296 | $ (1.536) | $ 2.944 |
| Less Distributions | | | | | | |
| From net investment income | $ — | $ (0.134) | $ (0.056) | $ (0.070) | $ (0.009) | $ (0.067) |
| From net realized gain | (0.918) | (0.361) | (1.445) | (0.076) | (0.015) | (0.107) |
| Total distributions | $ (0.918) | $ (0.495) | $ (1.501) | $ (0.146) | $ (0.024) | $ (0.174) |
| Net asset value — End of period | $37.450 | $31.650 | $33.140 | $38.170 | $27.020 | $28.580 |
| Total Return(3) | 21.44% (4) | (3.05)% | (9.61)% | 41.94% | (5.38)% | 11.50% |
| Ratios/Supplemental Data | | | | | | |
| Net assets, end of period (000’s omitted) | $ 22,919 | $ 19,794 | $ 24,304 | $ 26,389 | $ 20,066 | $ 26,672 |
| Ratios (as a percentage of average daily net assets):(5) | | | | | | |
| Expenses | 1.91% (6)(7) | 1.91% (6) | 1.91% (6) | 1.90% | 1.92% | 1.93% |
| Net investment income | 0.00% (7)(8) | 0.20% | 0.43% | 0.05% | 0.50% | 0.58% |
| Portfolio Turnover of the Portfolio | 15% (4) | 31% | 29% | 11% | 25% | 18% |
| (1) | Computed using average shares outstanding. |
| (2) | Amount less than $0.005 per share. |
| (3) | Returns are historical and are calculated by determining the percentage change in net asset value with all distributions reinvested and do not reflect the effect of sales charges. |
| (4) | Not annualized. |
| (5) | Includes the Fund’s share of the Portfolio’s allocated expenses. |
| (6) | Includes a reduction by the investment adviser of a portion of the Portfolio's adviser fee due to the Portfolio's investment in the Liquidity Fund (equal to less than 0.005% of average daily net assets for the six months ended April 30, 2024 and the years ended October 31, 2023 and 2022). |
| (7) | Annualized. |
| (8) | Amount is less than 0.005%. |
10
See Notes to Financial Statements.
Eaton Vance
Tax-Managed Value Fund
April 30, 2024
Financial Highlights — continued
| | Class I |
| | Six Months Ended
April 30, 2024
(Unaudited) | Year Ended October 31, |
| | 2023 | 2022 | 2021 | 2020 | 2019 |
| Net asset value — Beginning of period | $ 32.960 | $ 34.510 | $ 39.650 | $ 28.080 | $ 29.790 | $ 26.920 |
| Income (Loss) From Operations | | | | | | |
| Net investment income(1) | $ 0.183 | $ 0.414 | $ 0.512 | $ 0.373 | $ 0.421 | $ 0.411 |
| Net realized and unrealized gain (loss) | 6.998 | (1.123) | (3.807) | 11.690 | (1.707) | 2.914 |
| Total income (loss) from operations | $ 7.181 | $ (0.709) | $ (3.295) | $ 12.063 | $ (1.286) | $ 3.325 |
| Less Distributions | | | | | | |
| From net investment income | $ (0.353) | $ (0.480) | $ (0.400) | $ (0.417) | $ (0.409) | $ (0.348) |
| From net realized gain | (0.918) | (0.361) | (1.445) | (0.076) | (0.015) | (0.107) |
| Total distributions | $ (1.271) | $ (0.841) | $ (1.845) | $ (0.493) | $ (0.424) | $ (0.455) |
| Net asset value — End of period | $ 38.870 | $ 32.960 | $ 34.510 | $ 39.650 | $ 28.080 | $ 29.790 |
| Total Return(2) | 22.05% (3) | (2.08)% | (8.70)% | 43.41% | (4.42)% | 12.61% |
| Ratios/Supplemental Data | | | | | | |
| Net assets, end of period (000’s omitted) | $286,801 | $245,432 | $262,732 | $283,334 | $189,549 | $195,921 |
| Ratios (as a percentage of average daily net assets):(4) | | | | | | |
| Expenses | 0.91% (5)(6) | 0.91% (5) | 0.91% (5) | 0.90% | 0.92% | 0.93% |
| Net investment income | 1.00% (6) | 1.19% | 1.42% | 1.05% | 1.49% | 1.49% |
| Portfolio Turnover of the Portfolio | 15% (3) | 31% | 29% | 11% | 25% | 18% |
| (1) | Computed using average shares outstanding. |
| (2) | Returns are historical and are calculated by determining the percentage change in net asset value with all distributions reinvested. |
| (3) | Not annualized. |
| (4) | Includes the Fund’s share of the Portfolio’s allocated expenses. |
| (5) | Includes a reduction by the investment adviser of a portion of the Portfolio's adviser fee due to the Portfolio's investment in the Liquidity Fund (equal to less than 0.005% of average daily net assets for the six months ended April 30, 2024 and the years ended October 31, 2023 and 2022). |
| (6) | Annualized. |
11
See Notes to Financial Statements.
Eaton Vance
Tax-Managed Value Fund
April 30, 2024
Notes to Financial Statements (Unaudited)
1 Significant Accounting Policies
Eaton Vance Tax-Managed Value Fund (the Fund) is a diversified series of Eaton Vance Mutual Funds Trust (the Trust). The Trust is a Massachusetts business trust registered under the Investment Company Act of 1940, as amended (the 1940 Act), as an open-end management investment company. The Fund offers three classes of shares. Class A shares are generally sold subject to a sales charge imposed at time of purchase. Class C shares are sold at net asset value and are generally subject to a contingent deferred sales charge (see Note 5). Effective November 5, 2020, Class C shares automatically convert to Class A shares eight years after their purchase as described in the Fund’s prospectus. Class I shares are sold at net asset value and are not subject to a sales charge. Each class represents a pro rata interest in the Fund, but votes separately on class-specific matters and (as noted below) is subject to different expenses. Realized and unrealized gains and losses and net investment income and losses, other than class-specific expenses, are allocated daily to each class of shares based on the relative net assets of each class to the total net assets of the Fund. Each class of shares differs in its distribution plan and certain other class-specific expenses. The Fund invests its assets in interests in Tax-Managed Value Portfolio (the Portfolio), a Massachusetts business trust, having the same investment objective and policies as the Fund. The value of the Fund’s investment in the Portfolio reflects the Fund’s proportionate interest in the net assets of the Portfolio (80.4% at April 30, 2024). The performance of the Fund is directly affected by the performance of the Portfolio. The financial statements of the Portfolio, including the portfolio of investments, are included elsewhere in this report and should be read in conjunction with the Fund’s financial statements.
The following is a summary of significant accounting policies of the Fund. The policies are in conformity with accounting principles generally accepted in the United States of America (U.S. GAAP). The Fund is an investment company and follows accounting and reporting guidance in the Financial Accounting Standards Board (FASB) Accounting Standards Codification Topic 946.
A Investment Valuation—Valuation of securities by the Portfolio is discussed in Note 1A of the Portfolio's Notes to Financial Statements, which are included elsewhere in this report.
B Income—The Fund's net investment income or loss consists of the Fund's pro rata share of the net investment income or loss of the Portfolio, less all actual and accrued expenses of the Fund.
C Federal Taxes—The Fund's policy is to comply with the provisions of the Internal Revenue Code applicable to regulated investment companies and to distribute to shareholders each year substantially all of its net investment income, and all or substantially all of its net realized capital gains. Accordingly, no provision for federal income or excise tax is necessary.
As of April 30, 2024, the Fund had no uncertain tax positions that would require financial statement recognition, de-recognition, or disclosure. The Fund files a U.S. federal income tax return annually after its fiscal year-end, which is subject to examination by the Internal Revenue Service for a period of three years from the date of filing.
D Expenses—The majority of expenses of the Trust are directly identifiable to an individual fund. Expenses which are not readily identifiable to a specific fund are allocated taking into consideration, among other things, the nature and type of expense and the relative size of the funds.
E Use of Estimates—The preparation of the financial statements in conformity with U.S. GAAP requires management to make estimates and assumptions that affect the reported amounts of assets and liabilities at the date of the financial statements and the reported amounts of income and expense during the reporting period. Actual results could differ from those estimates.
F Indemnifications—Under the Trust’s organizational documents, its officers and Trustees may be indemnified against certain liabilities and expenses arising out of the performance of their duties to the Fund. Under Massachusetts law, if certain conditions prevail, shareholders of a Massachusetts business trust (such as the Trust) could be deemed to have personal liability for the obligations of the Trust. However, the Trust’s Declaration of Trust contains an express disclaimer of liability on the part of Fund shareholders and the By-laws provide that the Trust shall assume, upon request by the shareholder, the defense on behalf of any Fund shareholders. Moreover, the By-laws also provide for indemnification out of Fund property of any shareholder held personally liable solely by reason of being or having been a shareholder for all loss or expense arising from such liability. Additionally, in the normal course of business, the Fund enters into agreements with service providers that may contain indemnification clauses. The Fund’s maximum exposure under these arrangements is unknown as this would involve future claims that may be made against the Fund that have not yet occurred.
G Other—Investment transactions are accounted for on a trade date basis.
H Interim Financial Statements—The interim financial statements relating to April 30, 2024 and for the six months then ended have not been audited by an independent registered public accounting firm, but in the opinion of the Fund’s management, reflect all adjustments, consisting only of normal recurring adjustments, necessary for the fair presentation of the financial statements.
Eaton Vance
Tax-Managed Value Fund
April 30, 2024
Notes to Financial Statements (Unaudited) — continued
2 Distributions to Shareholders and Income Tax Information
It is the present policy of the Fund to make at least one distribution annually (normally in December) of all or substantially all of its net investment income and to distribute annually all or substantially all of its net realized capital gains. Distributions to shareholders are recorded on the ex-dividend date. Distributions are declared separately for each class of shares. Shareholders may reinvest income and capital gain distributions in additional shares of the same class of the Fund at the net asset value as of the ex-dividend date or, at the election of the shareholder, receive distributions in cash. Distributions to shareholders are determined in accordance with income tax regulations, which may differ from U.S. GAAP. As required by U.S. GAAP, only distributions in excess of tax basis earnings and profits are reported in the financial statements as a return of capital. Permanent differences between book and tax accounting relating to distributions are reclassified to paid-in capital. For tax purposes, distributions from short-term capital gains are considered to be from ordinary income.
3 Investment Adviser Fee and Other Transactions with Affiliates
The investment adviser fee is earned by Eaton Vance Management (EVM), an indirect, wholly-owned subsidiary of Morgan Stanley, as compensation for investment advisory services rendered to the Fund. The fee is computed at an annual rate as a percentage of the Fund’s average daily net assets that are not invested in other investment companies for which EVM or its affiliates serve as investment adviser and receive an advisory fee as follows and is payable monthly:
| Average Daily Net Assets | Annual Fee Rate |
| Up to $500 million | 0.6500% |
| $500 million but less than $1 billion | 0.6250% |
| $1 billion but less than $2 billion | 0.6000% |
| $2 billion but less than $5 billion | 0.5750% |
| $5 billion and over | 0.5550% |
For the six months ended April 30, 2024, the Fund incurred no investment adviser fee on such assets. To the extent the Fund’s assets are invested in the Portfolio, the Fund is allocated its share of the Portfolio’s investment adviser fee. The Portfolio has engaged Boston Management and Research (BMR) to render investment advisory services. See Note 2 of the Portfolio’s Notes to Financial Statements which are included elsewhere in this report. The administration fee is earned by EVM as compensation for administrative services rendered to the Fund. The fee is computed at an annual rate of 0.15% of the Fund’s average daily net assets. For the six months ended April 30, 2024, the administration fee amounted to $556,246.
EVM provides sub-transfer agency and related services to the Fund pursuant to a Sub-Transfer Agency Support Services Agreement. For the six months ended April 30, 2024, EVM earned $29,051 from the Fund pursuant to such agreement, which is included in transfer and dividend disbursing agent fees on the Statement of Operations. The Fund was informed that Eaton Vance Distributors, Inc. (EVD), an affiliate of EVM and the Fund’s principal underwriter, received $2,913 as its portion of the sales charge on sales of Class A shares for the six months ended April 30, 2024. The Fund was informed that Morgan Stanley affiliated broker-dealers, which may be deemed to be affiliates of EVM, BMR and EVD, also received a portion of the sales charge on sales of Class A shares for the six months ended April 30, 2024 in the amount of less than $100. EVD also received distribution and service fees from Class A and Class C shares (see Note 4) and contingent deferred sales charges (see Note 5).
Trustees and officers of the Fund who are members of EVM’s or BMR's organizations receive remuneration for their services to the Fund out of the investment adviser fee. Certain officers and Trustees of the Fund and the Portfolio are officers of the above organizations.
4 Distribution Plans
The Fund has in effect a distribution plan for Class A shares (Class A Plan) pursuant to Rule 12b-1 under the 1940 Act. Pursuant to the Class A Plan, the Fund pays EVD a distribution and service fee of 0.25% per annum of its average daily net assets attributable to Class A shares for distribution services and facilities provided to the Fund by EVD, as well as for personal services and/or the maintenance of shareholder accounts. Distribution and service fees paid or accrued to EVD for the six months ended April 30, 2024 amounted to $558,461 for Class A shares.
The Fund also has in effect a distribution plan for Class C shares (Class C Plan) pursuant to Rule 12b-1 under the 1940 Act. Pursuant to the Class C Plan, the Fund pays EVD amounts equal to 0.75% per annum of its average daily net assets attributable to Class C shares for providing ongoing distribution services and facilities to the Fund. For the six months ended April 30, 2024, the Fund paid or accrued to EVD $82,045 for Class C shares.
Eaton Vance
Tax-Managed Value Fund
April 30, 2024
Notes to Financial Statements (Unaudited) — continued
Pursuant to the Class C Plan, the Fund also makes payments of service fees to EVD, financial intermediaries and other persons in amounts equal to 0.25% per annum of its average daily net assets attributable to that class. Service fees paid or accrued are for personal services and/or the maintenance of shareholder accounts. They are separate and distinct from the sales commissions and distribution fees payable to EVD. Service fees paid or accrued for the six months ended April 30, 2024 amounted to $27,348 for Class C shares.
Distribution and service fees are subject to the limitations contained in the Financial Industry Regulatory Authority Rule 2341(d).
5 Contingent Deferred Sales Charges
A contingent deferred sales charge (CDSC) of 1% generally is imposed on redemptions of Class C shares made within 12 months of purchase. Class A shares may be subject to a 1% CDSC if redeemed within 12 months of purchase (depending on the circumstances of purchase). Generally, the CDSC is based upon the lower of the net asset value at date of redemption or date of purchase. No charge is levied on shares acquired by reinvestment of dividends or capital gain distributions. For the year ended April 30, 2024, the Fund was informed that EVD received $428 and $441 of CDSCs paid by Class A and C shareholders, respectively.
6 Investment Transactions
For the six months ended April 30, 2024, increases and decreases in the Fund's investment in the Portfolio aggregated $3,838,916 and $36,539,762, respectively. Decreases in the Fund's investment in the Portfolio include distributions of securities as the result of redemptions in-kind of $19,333,729.
7 Shares of Beneficial Interest
The Fund’s Declaration of Trust permits the Trustees to issue an unlimited number of full and fractional shares of beneficial interest (without par value). Such shares may be issued in a number of different series (such as the Fund) and classes. Sales and redemptions of Class I shares include shares purchased and redeemed in connection with the ReFlow liquidity program, a program designed to provide an alternative liquidity source for mutual funds experiencing net redemptions of their shares. Transactions in Fund shares, including direct exchanges pursuant to share class conversions, were as follows:
| | Six Months Ended
April 30, 2024
(Unaudited) | | Year Ended
October 31, 2023 |
| | Shares | Amount | | Shares | Amount |
| Class A | | | | | |
| Sales | 168,792 | $ 6,220,675 | | 347,876 | $ 12,154,003 |
| Issued to shareholders electing to receive payments of distributions in Fund shares | 340,050 | 12,347,222 | | 236,811 | 8,039,734 |
| Redemptions | (586,037) | (21,694,859) | | (981,152) | (34,120,534) |
| Net decrease | (77,195) | $ (3,126,962) | | (396,465) | $(13,926,797) |
| Class C | | | | | |
| Sales | 31,248 | $ 1,104,946 | | 76,735 | $ 2,579,066 |
| Issued to shareholders electing to receive payments of distributions in Fund shares | 14,994 | 523,609 | | 10,082 | 329,566 |
| Redemptions | (59,797) | (2,096,086) | | (194,674) | (6,507,162) |
| Net decrease | (13,555) | $ (467,531) | | (107,857) | $ (3,598,530) |
| Class I | | | | | |
| Sales | 964,832 | $ 35,168,051 | | 1,650,812 | $ 57,264,037 |
| Issued to shareholders electing to receive payments of distributions in Fund shares | 234,043 | 8,451,280 | | 168,916 | 5,702,619 |
| Redemptions | (1,265,858) | (46,348,306) | | (1,988,179) | (68,975,271) |
| Net decrease | (66,983) | $ (2,728,975) | | (168,451) | $ (6,008,615) |
Tax-Managed Value Portfolio
April 30, 2024
Portfolio of Investments (Unaudited)
| Security | Shares | Value |
| Aerospace & Defense — 1.2% |
| RTX Corp. | | 113,000 | $ 11,471,760 |
| | | | $ 11,471,760 |
| Banks — 8.0% |
| JPMorgan Chase & Co. | | 230,958 | $ 44,283,887 |
| PNC Financial Services Group, Inc. | | 142,029 | 21,767,365 |
| Wells Fargo & Co. | | 188,847 | 11,202,404 |
| | | | $ 77,253,656 |
| Beverages — 2.7% |
| Constellation Brands, Inc., Class A | | 104,837 | $ 26,571,986 |
| | | | $ 26,571,986 |
| Biotechnology — 2.1% |
| AbbVie, Inc. | | 95,280 | $ 15,496,339 |
| Vertex Pharmaceuticals, Inc.(1) | | 13,474 | 5,292,722 |
| | | | $ 20,789,061 |
| Building Products — 0.7% |
| Carrier Global Corp. | | 113,000 | $ 6,948,370 |
| | | | $ 6,948,370 |
| Capital Markets — 6.5% |
| Ameriprise Financial, Inc. | | 19,677 | $ 8,102,792 |
| Cboe Global Markets, Inc. | | 22,561 | 4,086,925 |
| Charles Schwab Corp. | | 416,665 | 30,812,377 |
| Goldman Sachs Group, Inc. | | 22,892 | 9,768,245 |
| Interactive Brokers Group, Inc., Class A | | 90,310 | 10,396,487 |
| | | | $ 63,166,826 |
| Chemicals — 2.3% |
| FMC Corp. | | 74,271 | $ 4,382,732 |
| Linde PLC | | 40,582 | 17,895,039 |
| | | | $ 22,277,771 |
| Consumer Staples Distribution & Retail — 1.9% |
| BJ's Wholesale Club Holdings, Inc.(1) | | 251,748 | $ 18,800,541 |
| | | | $ 18,800,541 |
| Security | Shares | Value |
| Containers & Packaging — 0.5% |
| Ball Corp. | | 69,035 | $ 4,802,765 |
| | | | $ 4,802,765 |
| Electric Utilities — 2.7% |
| NextEra Energy, Inc. | | 392,766 | $ 26,303,539 |
| | | | $ 26,303,539 |
| Electrical Equipment — 1.0% |
| Rockwell Automation, Inc. | | 33,916 | $ 9,189,879 |
| | | | $ 9,189,879 |
| Electronic Equipment, Instruments & Components — 1.9% |
| Zebra Technologies Corp., Class A(1) | | 59,656 | $ 18,765,391 |
| | | | $ 18,765,391 |
| Energy Equipment & Services — 1.2% |
| Schlumberger NV | | 247,255 | $ 11,739,667 |
| | | | $ 11,739,667 |
| Entertainment — 1.7% |
| Walt Disney Co. | | 147,913 | $ 16,433,134 |
| | | | $ 16,433,134 |
| Financial Services — 3.1% |
| Fiserv, Inc.(1) | | 117,991 | $ 18,013,686 |
| Visa, Inc., Class A | | 44,697 | 12,006,061 |
| | | | $ 30,019,747 |
| Food Products — 1.5% |
| General Mills, Inc. | | 78,340 | $ 5,519,837 |
| Nestle SA | | 90,000 | 9,036,014 |
| | | | $ 14,555,851 |
| Ground Transportation — 1.2% |
| Union Pacific Corp. | | 50,876 | $ 12,065,752 |
| | | | $ 12,065,752 |
| Health Care Equipment & Supplies — 2.0% |
| Stryker Corp. | | 58,093 | $ 19,548,295 |
| | | | $ 19,548,295 |
| Health Care Providers & Services — 1.2% |
| McKesson Corp. | | 5,281 | $ 2,837,006 |
| UnitedHealth Group, Inc. | | 18,719 | 9,054,380 |
| | | | $ 11,891,386 |
15
See Notes to Financial Statements.
Tax-Managed Value Portfolio
April 30, 2024
Portfolio of Investments (Unaudited) — continued
| Security | Shares | Value |
| Household Durables — 1.5% |
| D.R. Horton, Inc. | | 99,360 | $ 14,157,807 |
| | | | $ 14,157,807 |
| Household Products — 1.4% |
| Clorox Co. | | 89,520 | $ 13,237,322 |
| | | | $ 13,237,322 |
| Industrial Conglomerates — 2.6% |
| 3M Co. | | 91,159 | $ 8,797,755 |
| Honeywell International, Inc. | | 83,731 | 16,137,476 |
| | | | $ 24,935,231 |
| Insurance — 3.8% |
| Arch Capital Group Ltd.(1) | | 183,981 | $ 17,209,583 |
| Reinsurance Group of America, Inc. | | 33,595 | 6,281,929 |
| Travelers Cos., Inc. | | 64,030 | 13,584,605 |
| | | | $ 37,076,117 |
| Interactive Media & Services — 2.4% |
| Alphabet, Inc., Class A(1) | | 141,849 | $ 23,090,180 |
| | | | $ 23,090,180 |
| IT Services — 0.5% |
| Accenture PLC, Class A | | 14,366 | $ 4,322,873 |
| | | | $ 4,322,873 |
| Life Sciences Tools & Services — 3.1% |
| Mettler-Toledo International, Inc.(1) | | 3,177 | $ 3,906,757 |
| Thermo Fisher Scientific, Inc. | | 45,967 | 26,142,352 |
| | | | $ 30,049,109 |
| Machinery — 7.4% |
| Ingersoll Rand, Inc. | | 287,559 | $ 26,835,006 |
| Otis Worldwide Corp. | | 56,500 | 5,152,800 |
| Parker-Hannifin Corp. | | 32,913 | 17,934,623 |
| Toro Co. | | 44,934 | 3,935,769 |
| Westinghouse Air Brake Technologies Corp. | | 109,778 | 17,683,040 |
| | | | $ 71,541,238 |
| Metals & Mining — 1.8% |
| Alcoa Corp. | | 488,450 | $ 17,164,133 |
| | | | $ 17,164,133 |
| Multi-Utilities — 3.1% |
| CMS Energy Corp. | | 111,375 | $ 6,750,439 |
| Security | Shares | Value |
| Multi-Utilities (continued) |
| Sempra | | 325,074 | $ 23,285,050 |
| | | | $ 30,035,489 |
| Oil, Gas & Consumable Fuels — 6.9% |
| Chevron Corp. | | 182,306 | $ 29,400,489 |
| ConocoPhillips | | 161,617 | 20,302,328 |
| EOG Resources, Inc. | | 51,427 | 6,795,049 |
| Phillips 66 | | 74,143 | 10,618,019 |
| | | | $ 67,115,885 |
| Pharmaceuticals — 8.2% |
| Eli Lilly & Co. | | 22,331 | $ 17,442,744 |
| Johnson & Johnson | | 49,590 | 7,170,218 |
| Merck & Co., Inc. | | 167,049 | 21,586,072 |
| Sanofi SA | | 170,680 | 16,861,998 |
| Zoetis, Inc. | | 101,295 | 16,130,216 |
| | | | $ 79,191,248 |
| Professional Services — 0.6% |
| Robert Half, Inc. | | 80,761 | $ 5,583,816 |
| | | | $ 5,583,816 |
| Residential REITs — 4.8% |
| AvalonBay Communities, Inc. | | 47,915 | $ 9,083,247 |
| Invitation Homes, Inc. | | 458,376 | 15,676,459 |
| Mid-America Apartment Communities, Inc. | | 166,510 | 21,646,300 |
| | | | $ 46,406,006 |
| Semiconductors & Semiconductor Equipment — 5.0% |
| Micron Technology, Inc. | | 289,648 | $ 32,718,638 |
| QUALCOMM, Inc. | | 69,710 | 11,561,403 |
| Texas Instruments, Inc. | | 24,085 | 4,249,076 |
| | | | $ 48,529,117 |
| Software — 0.6% |
| Oracle Corp. | | 52,884 | $ 6,015,555 |
| | | | $ 6,015,555 |
| Specialty Retail — 2.8% |
| Home Depot, Inc. | | 81,060 | $ 27,091,873 |
| | | | $ 27,091,873 |
Total Common Stocks
(identified cost $455,040,179) | | | $968,138,376 |
16
See Notes to Financial Statements.
Tax-Managed Value Portfolio
April 30, 2024
Portfolio of Investments (Unaudited) — continued
| Short-Term Investments — 0.1% |
| Security | Shares | Value |
| Morgan Stanley Institutional Liquidity Funds - Government Portfolio, Institutional Class, 5.22%(2) | | 761,020 | $ 761,020 |
Total Short-Term Investments
(identified cost $761,020) | | | $ 761,020 |
Total Investments — 100.0%
(identified cost $455,801,199) | | | $968,899,396 |
| Other Assets, Less Liabilities — 0.0%(3) | | | $ 241,690 |
| Net Assets — 100.0% | | | $969,141,086 |
| The percentage shown for each investment category in the Portfolio of Investments is based on net assets. |
| (1) | Non-income producing security. |
| (2) | May be deemed to be an affiliated investment company. The rate shown is the annualized seven-day yield as of April 30, 2024. |
| (3) | Amount is less than 0.05%. |
| Abbreviations: |
| REITs | – Real Estate Investment Trusts |
17
See Notes to Financial Statements.
Tax-Managed Value Portfolio
April 30, 2024
Statement of Assets and Liabilities (Unaudited)
| | April 30, 2024 |
| Assets | |
| Unaffiliated investments, at value (identified cost $455,040,179) | $ 968,138,376 |
| Affiliated investments, at value (identified cost $761,020) | 761,020 |
| Dividends receivable | 579,132 |
| Dividends receivable from affiliated investments | 6,875 |
| Tax reclaims receivable | 371,651 |
| Trustees' deferred compensation plan | 188,253 |
| Total assets | $970,045,307 |
| Liabilities | |
| Payable to affiliates: | |
| Investment adviser fee | $ 508,585 |
| Trustees' deferred compensation plan | 188,253 |
| Payable for custodian fee | 129,315 |
| Accrued expenses | 78,068 |
| Total liabilities | $ 904,221 |
| Net Assets applicable to investors' interest in Portfolio | $969,141,086 |
18
See Notes to Financial Statements.
Tax-Managed Value Portfolio
April 30, 2024
Statement of Operations (Unaudited)
| | Six Months Ended |
| | April 30, 2024 |
| Investment Income | |
| Dividend income (net of foreign taxes withheld of $52,202) | $ 8,704,481 |
| Dividend income from affiliated investments | 68,116 |
| Securities lending income, net | 919 |
| Total investment income | $ 8,773,516 |
| Expenses | |
| Investment adviser fee | $ 2,936,378 |
| Trustees’ fees and expenses | 24,750 |
| Custodian fee | 111,518 |
| Legal and accounting services | 44,432 |
| Miscellaneous | 3,819 |
| Total expenses | $ 3,120,897 |
| Deduct: | |
| Waiver and/or reimbursement of expenses by affiliates | $ 2,031 |
| Total expense reductions | $ 2,031 |
| Net expenses | $ 3,118,866 |
| Net investment income | $ 5,654,650 |
| Realized and Unrealized Gain (Loss) | |
| Net realized gain (loss): | |
| Investment transactions | $ 45,186,411(1) |
| Foreign currency transactions | (3,341) |
| Net realized gain | $ 45,183,070 |
| Change in unrealized appreciation (depreciation): | |
| Investments | $ 129,319,607 |
| Foreign currency | (4,406) |
| Net change in unrealized appreciation (depreciation) | $129,315,201 |
| Net realized and unrealized gain | $174,498,271 |
| Net increase in net assets from operations | $180,152,921 |
| (1) | Includes $16,630,649 of net realized gains from redemptions in-kind. |
19
See Notes to Financial Statements.
Tax-Managed Value Portfolio
April 30, 2024
Statements of Changes in Net Assets
| | Six Months Ended
April 30, 2024
(Unaudited) | Year Ended
October 31, 2023 |
| Increase (Decrease) in Net Assets | | |
| From operations: | | |
| Net investment income | $ 5,654,650 | $ 12,531,564 |
| Net realized gain | 45,183,070 (1) | 45,678,729 (2) |
| Net change in unrealized appreciation (depreciation) | 129,315,201 | (72,880,666) |
| Net increase (decrease) in net assets from operations | $180,152,921 | $ (14,670,373) |
| Capital transactions: | | |
| Contributions | $ 7,290,894 | $ 11,089,671 |
| Withdrawals | (40,061,474) | (55,288,578) |
| Net decrease in net assets from capital transactions | $ (32,770,580) | $ (44,198,907) |
| Net increase (decrease) in net assets | $147,382,341 | $ (58,869,280) |
| Net Assets | | |
| At beginning of period | $ 821,758,745 | $ 880,628,025 |
| At end of period | $969,141,086 | $821,758,745 |
| (1) | Includes $16,630,649 of net realized gains from redemptions in-kind. |
| (2) | Includes $25,897,342 of net realized gains from redemptions in-kind. |
20
See Notes to Financial Statements.
Tax-Managed Value Portfolio
April 30, 2024
| | Six Months Ended
April 30, 2024
(Unaudited) | Year Ended October 31, |
| Ratios/Supplemental Data | 2023 | 2022 | 2021 | 2020 | 2019 |
| Ratios (as a percentage of average daily net assets): | | | | | | |
| Expenses | 0.68% (1)(2) | 0.68% (2) | 0.68% (2) | 0.68% | 0.68% | 0.68% |
| Net investment income | 1.23% (1) | 1.42% | 1.65% | 1.27% | 1.73% | 1.74% |
| Portfolio Turnover | 15% (3) | 31% | 29% | 11% | 25% | 18% |
| Total Return | 22.20% (3) | (1.84)% | (8.51)% | 43.69% | (4.18)% | 12.90% |
| Net assets, end of period (000’s omitted) | $969,141 | $821,759 | $880,628 | $994,337 | $704,707 | $788,248 |
| (1) | Annualized. |
| (2) | Includes a reduction by the investment adviser of a portion of its adviser fee due to the Portfolio’s investment in the Liquidity Fund (equal to less than 0.005% of average daily net assets for the six months ended April 30, 2024 and the years ended October 31, 2023 and 2022). |
| (3) | Not annualized. |
21
See Notes to Financial Statements.
Tax-Managed Value Portfolio
April 30, 2024
Notes to Financial Statements (Unaudited)
1 Significant Accounting Policies
Tax-Managed Value Portfolio (the Portfolio) is a Massachusetts business trust registered under the Investment Company Act of 1940, as amended (the 1940 Act), as a diversified, open-end management investment company. The Portfolio’s investment objective is to achieve long-term, after-tax returns by investing primarily in value stocks. The Declaration of Trust permits the Trustees to issue interests in the Portfolio. At April 30, 2024, Eaton Vance Tax-Managed Value Fund and Eaton Vance Tax-Managed Equity Asset Allocation Fund held an interest of 80.4% and 19.6%, respectively, in the Portfolio.
The following is a summary of significant accounting policies of the Portfolio. The policies are in conformity with accounting principles generally accepted in the United States of America (U.S. GAAP). The Portfolio is an investment company and follows accounting and reporting guidance in the Financial Accounting Standards Board (FASB) Accounting Standards Codification Topic 946.
A Investment Valuation—The following methodologies are used to determine the market value or fair value of investments.
Equity Securities. Equity securities listed on a U.S. securities exchange generally are valued at the last sale or closing price on the day of valuation or, if no sales took place on such date, at the mean between the closing bid and ask prices on the exchange where such securities are principally traded. Equity securities listed on the NASDAQ National Market System are valued at the NASDAQ official closing price. Unlisted or listed securities for which closing sales prices or closing quotations are not available are valued at the mean between the latest available bid and ask prices.
Foreign Securities and Currencies. Foreign securities and currencies are valued in U.S. dollars, based on foreign currency exchange rate quotations supplied by a third party pricing service. The pricing service uses a proprietary model to determine the exchange rate. Inputs to the model include reported trades and implied bid/ask spreads. The daily valuation of exchange-traded foreign securities generally is determined as of the close of trading on the principal exchange on which such securities trade. Events occurring after the close of trading on foreign exchanges may result in adjustments to the valuation of foreign securities to more accurately reflect their fair value as of the close of regular trading on the New York Stock Exchange. When valuing foreign equity securities that meet certain criteria, the Portfolio's Trustees have approved the use of a fair value service that values such securities to reflect market trading that occurs after the close of the applicable foreign markets of comparable securities or other instruments that have a strong correlation to the fair-valued securities.
Other. Investments in management investment companies (including money market funds) that do not trade on an exchange are valued at the net asset value as of the close of each business day.
Fair Valuation. In connection with Rule 2a-5 of the 1940 Act, the Trustees have designated the Portfolio’s investment adviser as its valuation designee. Investments for which valuations or market quotations are not readily available or are deemed unreliable are valued by the investment adviser, as valuation designee, at fair value using methods that most fairly reflect the security’s “fair value”, which is the amount that the Portfolio might reasonably expect to receive for the security upon its current sale in the ordinary course. Each such determination is based on a consideration of relevant factors, which are likely to vary from one pricing context to another. These factors may include, but are not limited to, the type of security, the existence of any contractual restrictions on the security’s disposition, the price and extent of public trading in similar securities of the issuer or of comparable companies or entities, quotations or relevant information obtained from broker/dealers or other market participants, information obtained from the issuer, analysts, and/or the appropriate stock exchange (for exchange-traded securities), an analysis of the company’s or entity’s financial statements, and an evaluation of the forces that influence the issuer and the market(s) in which the security is purchased and sold.
B Investment Transactions—Investment transactions for financial statement purposes are accounted for on a trade date basis. Realized gains and losses on investments sold are determined on the basis of identified cost.
C Income—Dividend income is recorded on the ex-dividend date for dividends received in cash and/or securities. However, if the ex-dividend date has passed, certain dividends from foreign securities are recorded as the Portfolio is informed of the ex-dividend date. Withholding taxes on foreign dividends and capital gains have been provided for in accordance with the Portfolio's understanding of the applicable countries’ tax rules and rates. In consideration of recent decisions rendered by European courts, the Portfolio has filed additional tax reclaims for previously withheld taxes on dividends earned in certain European Union countries. These filings are subject to various administrative and judicial proceedings within these countries. Due to the uncertainty as to the ultimate resolution of these proceedings, the likelihood of receipt of these reclaims, and the potential timing of payment, no amounts are reflected in the financial statements for such outstanding reclaims.
D Federal Taxes—The Portfolio has elected to be treated as a partnership for federal tax purposes. No provision is made by the Portfolio for federal or state taxes on any taxable income of the Portfolio because each investor in the Portfolio is ultimately responsible for the payment of any taxes on its share of taxable income. Since at least one of the Portfolio's investors is a regulated investment company that invests all or substantially all of its assets in the Portfolio, the Portfolio normally must satisfy the applicable source of income and diversification requirements (under the Internal Revenue Code) in order for its investors to satisfy them. The Portfolio will allocate, at least annually among its investors, each investor's distributive share of the Portfolio's net investment income, net realized capital gains and losses and any other items of income, gain, loss, deduction or credit.
As of April 30, 2024, the Portfolio had no uncertain tax positions that would require financial statement recognition, de-recognition, or disclosure. The Portfolio files a U.S. federal income tax return annually after its fiscal year-end, which is subject to examination by the Internal Revenue Service for a period of three years from the date of filing.
Tax-Managed Value Portfolio
April 30, 2024
Notes to Financial Statements (Unaudited) — continued
E Foreign Currency Translation—Investment valuations, other assets, and liabilities initially expressed in foreign currencies are translated each business day into U.S. dollars based upon current exchange rates. Purchases and sales of foreign investment securities and income and expenses denominated in foreign currencies are translated into U.S. dollars based upon currency exchange rates in effect on the respective dates of such transactions. Recognized gains or losses on investment transactions attributable to changes in foreign currency exchange rates are recorded for financial statement purposes as net realized gains and losses on investments. That portion of unrealized gains and losses on investments that results from fluctuations in foreign currency exchange rates is not separately disclosed.
F Use of Estimates—The preparation of the financial statements in conformity with U.S. GAAP requires management to make estimates and assumptions that affect the reported amounts of assets and liabilities at the date of the financial statements and the reported amounts of income and expense during the reporting period. Actual results could differ from those estimates.
G Indemnifications—Under the Portfolio’s organizational documents, its officers and Trustees may be indemnified against certain liabilities and expenses arising out of the performance of their duties to the Portfolio. Under Massachusetts law, if certain conditions prevail, interestholders in the Portfolio could be deemed to have personal liability for the obligations of the Portfolio. However, the Portfolio’s Declaration of Trust contains an express disclaimer of liability on the part of Portfolio interestholders. Additionally, in the normal course of business, the Portfolio enters into agreements with service providers that may contain indemnification clauses. The Portfolio’s maximum exposure under these arrangements is unknown as this would involve future claims that may be made against the Portfolio that have not yet occurred.
H Interim Financial Statements—The interim financial statements relating to April 30, 2024 and for the six months then ended have not been audited by an independent registered public accounting firm, but in the opinion of the Portfolio’s management, reflect all adjustments, consisting only of normal recurring adjustments, necessary for the fair presentation of the financial statements.
2 Investment Adviser Fee and Other Transactions with Affiliates
The investment adviser fee is earned by Boston Management and Research (BMR), an indirect, wholly-owned subsidiary of Morgan Stanley, as compensation for investment advisory services rendered to the Portfolio. The fee is computed at an annual rate as a percentage of the Portfolio’s average daily net assets as follows and is payable monthly:
| Average Daily Net Assets | Annual Fee Rate |
| Up to $500 million | 0.650% |
| $500 million but less than $1 billion | 0.625% |
| $1 billion but less than $2 billion | 0.600% |
| $2 billion but less than $5 billion | 0.575% |
| $5 billion and over | 0.555% |
For the six months ended April 30, 2024, the investment adviser fee amounted to $2,936,378 or 0.64% (annualized) of the Portfolio's average daily net assets. The Portfolio may invest in a money market fund, the Institutional Class of the Morgan Stanley Institutional Liquidity Funds - Government Portfolio (the “Liquidity Fund”), an open-end management investment company managed by Morgan Stanley Investment Management Inc., a wholly-owned subsidiary of Morgan Stanley. The investment adviser fee paid by the Portfolio is reduced by an amount equal to its pro rata share of the advisory and administration fees paid by the Portfolio due to its investment in the Liquidity Fund. For the six months ended April 30, 2024, the investment adviser fee paid was reduced by $2,031 relating to the Portfolio's investment in the Liquidity Fund.
Trustees and officers of the Portfolio who are members of BMR’s organization receive remuneration for their services to the Portfolio out of the investment adviser fee. Trustees of the Portfolio who are not affiliated with the investment adviser may elect to defer receipt of all or a percentage of their annual fees in accordance with the terms of the Trustees Deferred Compensation Plan. Certain officers and Trustees of the Portfolio are officers of the above organization.
3 Purchases and Sales of Investments
Purchases and sales of investments, other than short-term obligations and in-kind transactions, aggregated $155,118,595 and $139,284,892, respectively, for the six months ended April 30, 2024. In-kind sales for the six months ended April 30, 2024 aggregated $19,333,729.
Tax-Managed Value Portfolio
April 30, 2024
Notes to Financial Statements (Unaudited) — continued
4 Federal Income Tax Basis of Investments
The cost and unrealized appreciation (depreciation) of investments of the Portfolio at April 30, 2024, as determined on a federal income tax basis, were as follows:
| Aggregate cost | $459,472,902 |
| Gross unrealized appreciation | $ 512,287,600 |
| Gross unrealized depreciation | (2,861,106) |
| Net unrealized appreciation | $509,426,494 |
5 Line of Credit
The Portfolio participates with other portfolios and funds managed by BMR and its affiliates in a $650 million unsecured revolving line of credit agreement with a group of banks, which is in effect through October 22, 2024. Borrowings are made by the Portfolio solely for temporary purposes related to redemptions and other short-term cash needs. Interest is charged to the Portfolio based on its borrowings at an amount above either the Secured Overnight Financing Rate (SOFR) or Federal Funds rate. In addition, a fee computed at an annual rate of 0.15% on the daily unused portion of the line of credit is allocated among the participating portfolios and funds at the end of each quarter. In connection with the renewal of the agreement in October 2023, an arrangement fee of $150,000 was incurred that was allocated to the participating portfolios and funds. Because the line of credit is not available exclusively to the Portfolio, it may be unable to borrow some or all of its requested amounts at any particular time. The Portfolio did not have any significant borrowings or allocated fees during the six months ended April 30, 2024.
6 Securities Lending Agreement
The Portfolio has established a securities lending agreement with State Street Bank and Trust Company (SSBT) as securities lending agent in which the Portfolio lends portfolio securities to qualified borrowers in exchange for collateral consisting of either cash or securities issued or guaranteed by the U.S. government or its agencies or instrumentalities in an amount at least equal to the market value of the securities on loan. The market value of securities loaned is determined daily and any additional required collateral is delivered to the Portfolio on the next business day. Cash collateral is invested in the State Street Navigator Securities Lending Government Money Market Portfolio, a money market fund registered under the 1940 Act. The Portfolio earns interest on the amount invested but it must pay (and at times receive from) the broker a loan rebate fee computed as a varying percentage of the collateral received. For security loans secured by non-cash collateral, the Portfolio earns a negotiated lending fee from the borrower. A portion of the income earned by the Portfolio from its investment of cash collateral, net of rebate fees, and lending fees received is allocated to SSBT for its services as lending agent and the portion allocated to the Portfolio is presented as securities lending income, net on the Statement of Operations. Non-cash collateral is held by the lending agent on behalf of the Portfolio and cannot be sold or re-pledged by the Portfolio; accordingly, such collateral is not reflected in the Statement of Assets and Liabilities.
The Portfolio is subject to possible delay in the recovery of loaned securities. Pursuant to the securities lending agreement, SSBT has provided indemnification to the Portfolio in the event of default by a borrower with respect to a loan. The Portfolio bears the risk of loss with respect to the investment of cash collateral. At April 30, 2024, the Portfolio had no securities on loan.
7 Affiliated Investments
At April 30, 2024, the value of the Portfolio's investment in funds that may be deemed to be affiliated was $761,020, which represents 0.1% of the Portfolio's net assets. Transactions in such investments by the Portfolio for the six months ended April 30, 2024 were as follows:
| Name | Value,
beginning
of period | Purchases | Sales
proceeds | Net realized
gain (loss) | Change in
unrealized
appreciation
(depreciation) | Value, end
of period | Dividend
income | Shares,
end of period |
| Short-Term Investments |
| Liquidity Fund | $32,183,861 | $39,504,622 | $(70,927,463) | $ — | $ — | $761,020 | $68,116 | 761,020 |
Tax-Managed Value Portfolio
April 30, 2024
Notes to Financial Statements (Unaudited) — continued
8 Fair Value Measurements
Under generally accepted accounting principles for fair value measurements, a three-tier hierarchy to prioritize the assumptions, referred to as inputs, is used in valuation techniques to measure fair value. The three-tier hierarchy of inputs is summarized in the three broad levels listed below.
| • | Level 1 – quoted prices in active markets for identical investments |
| • | Level 2 – other significant observable inputs (including quoted prices for similar investments, interest rates, prepayment speeds, credit risk, etc.) |
| • | Level 3 – significant unobservable inputs (including a fund's own assumptions in determining the fair value of investments) |
In cases where the inputs used to measure fair value fall in different levels of the fair value hierarchy, the level disclosed is determined based on the lowest level input that is significant to the fair value measurement in its entirety. The inputs or methodology used for valuing securities are not necessarily an indication of the risk associated with investing in those securities.
At April 30, 2024, the hierarchy of inputs used in valuing the Portfolio's investments, which are carried at fair value, were as follows:
| Asset Description | Level 1 | Level 2 | Level 3 | Total |
| Common Stocks: | | | | |
| Communication Services | $ 39,523,314 | $ — | $ — | $ 39,523,314 |
| Consumer Discretionary | 41,249,680 | — | — | 41,249,680 |
| Consumer Staples | 64,129,686 | 9,036,014 | — | 73,165,700 |
| Energy | 78,855,552 | — | — | 78,855,552 |
| Financials | 207,516,346 | — | — | 207,516,346 |
| Health Care | 144,607,101 | 16,861,998 | — | 161,469,099 |
| Industrials | 141,736,046 | — | — | 141,736,046 |
| Information Technology | 77,632,936 | — | — | 77,632,936 |
| Materials | 44,244,669 | — | — | 44,244,669 |
| Real Estate | 46,406,006 | — | — | 46,406,006 |
| Utilities | 56,339,028 | — | — | 56,339,028 |
| Total Common Stocks | $942,240,364 | $ 25,898,012* | $ — | $968,138,376 |
| Short-Term Investments | $ 761,020 | $ — | $ — | $ 761,020 |
| Total Investments | $943,001,384 | $ 25,898,012 | $ — | $968,899,396 |
| * | Includes foreign equity securities whose values were adjusted to reflect market trading of comparable securities or other correlated instruments that occurred after the close of trading in their applicable foreign markets. |
Eaton Vance
Tax-Managed Value Fund
April 30, 2024
| Officers of Eaton Vance Tax-Managed Value Fund |
Kenneth A. Topping
President | Nicholas S. Di. Lorenzo
Secretary |
Deidre E. Walsh
Vice President and Chief Legal Officer | Laura T. Donovan
Chief Compliance Officer |
James F. Kirchner
Treasurer | |
| Officers of Tax-Managed Value Portfolio |
R. Kelly Williams, Jr.
President | Nicholas S. Di. Lorenzo
Secretary |
Deidre E. Walsh
Vice President and Chief Legal Officer | Laura T. Donovan
Chief Compliance Officer |
James F. Kirchner
Treasurer | |
| Trustees of Eaton Vance Tax-Managed Value Fund and Tax-Managed Value Portfolio | |
George J. Gorman
Chairperson | |
| Alan C. Bowser | |
| Mark R. Fetting | |
| Cynthia E. Frost | |
| Valerie A. Mosley | |
| Anchal Pachnanda* | |
| Keith Quinton | |
| Marcus L. Smith | |
| Susan J. Sutherland | |
| Scott E. Wennerholm | |
| Nancy A. Wiser | |
| U.S. Customer Privacy Notice | March 2024 |
| FACTS | WHAT DOES EATON VANCE DO WITH YOUR PERSONAL INFORMATION? |
| Why? | Financial companies choose how they share your personal information. Federal law gives consumers the right to limit some but not all sharing. Federal law also requires us to tell you how we collect, share, and protect your personal information. Please read this notice carefully to understand what we do. |
| |
| What? | The types of personal information we collect and share depend on the product or service you have with us. This information can include:■ Social Security number and income
■ investment experience and risk tolerance
■ checking account information and wire transfer instructions |
| |
| How? | All financial companies need to share customers’ personal information to run their everyday business. In the section below, we list the reasons financial companies can share their customers’ personal information; the reasons Eaton Vance chooses to share; and whether you can limit this sharing. |
| Reasons we can share your personal information | Does Eaton Vance
share? | Can you limit
this sharing? |
| For our everyday business purposes — such as to process your transactions, maintain your account(s), respond to court orders and legal investigations, or report to credit bureaus | Yes | No |
| For our marketing purposes — to offer our products and services to you | Yes | No |
| For joint marketing with other financial companies | No | We don’t share |
| For our affiliates’ everyday business purposes — information about your transactions and experiences | Yes | No* |
| For our affiliates’ everyday business purposes — information about your creditworthiness | Yes | Yes* |
| For our affiliates to market to you | Yes | Yes* |
| For nonaffiliates to market to you | No | We don’t share |
To limit our
sharing | Call toll-free 1-800-262-1122 or email: EVPrivacy@eatonvance.comPlease note:If you are a new customer, we can begin sharing your information 30 days from the date we sent this notice. When you are no longer our customer, we continue to share your information as described in this notice. However, you can contact us at any time to limit our sharing. |
| Questions? | Call toll-free 1-800-262-1122 or email: EVPrivacy@eatonvance.com |
| U.S. Customer Privacy Notice — continued | March 2024 |
| Who we are |
| Who is providing this notice? | Eaton Vance Management and our investment management affiliates (“Eaton Vance”) (see Affiliates definition below.) |
| What we do |
How does Eaton Vance
protect my personal
information? | To protect your personal information from unauthorized access and use, we use security measures that comply with federal law. These measures include computer safeguards and secured files and buildings. We have policies governing the proper handling of customer information by personnel and requiring third parties that provide support to adhere to appropriate security standards with respect to such information. |
How does Eaton Vance
collect my personal
information? | We collect your personal information, for example, when you■ open an account or make deposits or withdrawals from your account
■ buy securities from us or make a wire transfer
■ give us your contact informationWe also collect your personal information from others, such as credit bureaus, affiliates, or other companies. |
| Why can’t I limit all sharing? | Federal law gives you the right to limit only■ sharing for affiliates’ everyday business purposes — information about your creditworthiness
■ affiliates from using your information to market to you
■ sharing for nonaffiliates to market to youState laws and individual companies may give you additional rights to limit sharing. (See below for more on your rights under state law.) |
What happens when I limit
sharing for an account I hold
jointly with someone else? | Your choices will apply to everyone on your account. |
| Definitions |
| Affiliates | Companies related by common ownership or control. They can be financial and nonfinancial companies.■ Our affiliates include registered investment advisers such as Eaton Vance Management, Eaton Vance Advisers International Ltd., Boston Management and Research, Calvert Research and Management, Parametric Portfolio Associates LLC, Atlanta Capital Management Company LLC, Morgan Stanley Investment Management Inc., Morgan Stanley Investment Management Co.; registered broker-dealers such as Morgan Stanley Distributors Inc. and Eaton Vance Distributors, Inc. (together, the “Investment Management Affiliates”); and companies with a Morgan Stanley name and financial companies such as Morgan Stanley Smith Barney LLC and Morgan Stanley & Co. (the “Morgan Stanley Affiliates”). |
| Nonaffiliates | Companies not related by common ownership or control. They can be financial and nonfinancial companies.■ Eaton Vance does not share with nonaffiliates so they can market to you. |
| Joint marketing | A formal agreement between nonaffiliated financial companies that together market financial products or services to you.■ Eaton Vance does not jointly market. |
| U.S. Customer Privacy Notice — continued | March 2024 |
| Other important information |
| *PLEASE NOTE: Eaton Vance does not share your creditworthiness information or your transactions and experiences information with the Morgan Stanley Affiliates, nor does Eaton Vance enable the Morgan Stanley Affiliates to market to you. Your opt outs will prevent Eaton Vance from sharing your creditworthiness information with the Investment Management Affiliates and will prevent the Investment Management Affiliates from marketing their products to you.Vermont: Except as permitted by law, we will not share personal information we collect about Vermont residents with Nonaffiliates unless you provide us with your written consent to share such information.California: Except as permitted by law, we will not share personal information we collect about California residents with Nonaffiliates and we will limit sharing such personal information with our Affiliates to comply with California privacy laws that apply to us. |
Delivery of Shareholder Documents. The Securities and Exchange Commission (SEC) permits funds to deliver only one copy of shareholder documents, including prospectuses, proxy statements and shareholder reports, to fund investors with multiple accounts at the same residential or post office box address. This practice is often called “householding” and it helps eliminate duplicate mailings to shareholders. Eaton Vance, or your financial intermediary, may household the mailing of your documents indefinitely unless you instruct Eaton Vance, or your financial intermediary, otherwise. If you would prefer that your Eaton Vance documents not be householded, please contact Eaton Vance at 1-800-262-1122, or contact your financial intermediary. Your instructions that householding not apply to delivery of your Eaton Vance documents will typically be effective within 30 days of receipt by Eaton Vance or your financial intermediary.
Portfolio Holdings. Each Eaton Vance Fund and its underlying Portfolio(s) (if applicable) files a schedule of portfolio holdings on Part F to Form N-PORT with the SEC. Certain information filed on Form N-PORT may be viewed on the Eaton Vance website at www.eatonvance.com, by calling Eaton Vance at 1-800-262-1122 or in the EDGAR database on the SEC’s website at www.sec.gov.
Proxy Voting. From time to time, funds are required to vote proxies related to the securities held by the funds. The Eaton Vance Funds or their underlying Portfolios (if applicable) vote proxies according to a set of policies and procedures approved by the Funds’ and Portfolios’ Boards. You may obtain a description of these policies and procedures and information on how the Funds or Portfolios voted proxies relating to portfolio securities during the most recent 12-month period ended June 30, without charge, upon request, by calling 1-800-262-1122 and by accessing the SEC’s website at www.sec.gov.
Tailored Shareholder Reports. Effective January 24, 2023, the SEC adopted rule and form amendments to require open-end mutual funds and ETFs to transmit concise and visually engaging streamlined annual and semi-annual reports to shareholders that highlight key information. Other information, including financial statements, will no longer appear in a streamlined shareholder report but must be available online, delivered free of charge upon request, and filed on a semi-annual basis on Form N-CSR. The rule and form amendments have a compliance date of July 24, 2024. At this time, management is evaluating the impact of these amendments on the shareholder reports for the Eaton Vance Funds.
This Page Intentionally Left Blank
This Page Intentionally Left Blank
Investment Adviser of Tax-Managed Value Portfolio
Boston Management and Research
One Post Office Square
Boston, MA 02109
Investment Adviser and Administrator of Eaton Vance Tax-Managed Value Fund
Eaton Vance Management
One Post Office Square
Boston, MA 02109
Principal Underwriter*
Eaton Vance Distributors, Inc.
One Post Office Square
Boston, MA 02109
(617) 482-8260
Custodian
State Street Bank and Trust Company
One Congress Street, Suite 1
Boston, MA 02114-2016
Transfer Agent
BNY Mellon Investment Servicing (US) Inc.
Attn: Eaton Vance Funds
P.O. Box 534439
Pittsburgh, PA 15253-4439
(800) 262-1122
Fund Offices
One Post Office Square
Boston, MA 02109
* FINRA BrokerCheck. Investors may check the background of their Investment Professional by contacting the Financial Industry Regulatory Authority (FINRA). FINRA BrokerCheck is a free tool to help investors check the professional background of current and former FINRA-registered securities firms and brokers. FINRA BrokerCheck is available by calling 1-800-289-9999 and at www.FINRA.org. The FINRA BrokerCheck brochure describing this program is available to investors at www.FINRA.org.
Eaton Vance
Floating-Rate Advantage Fund
Semi-Annual Report
April 30, 2024
Commodity Futures Trading Commission Registration. The Commodity Futures Trading Commission (“CFTC”) has adopted regulations that subject registered investment companies and advisers to regulation by the CFTC if a fund invests more than a prescribed level of its assets in certain CFTC-regulated instruments (including futures, certain options and swap agreements) or markets itself as providing investment exposure to such instruments. The investment adviser has claimed an exclusion from the definition of “commodity pool operator” under the Commodity Exchange Act with respect to its management of the Fund. Accordingly, neither the Fund nor the adviser with respect to the operation of the Fund is subject to CFTC regulation. Because of its management of other strategies, the Fund's adviser is registered with the CFTC as a commodity pool operator. The adviser is also registered as a commodity trading advisor.
Fund shares are not insured by the FDIC and are not deposits or other obligations of, or guaranteed by, any depository institution. Shares are subject to investment risks, including possible loss of principal invested.
This report must be preceded or accompanied by a current summary prospectus or prospectus. Before investing, investors should consider carefully the investment objective, risks, and charges and expenses of a mutual fund. This and other important information is contained in the summary prospectus and prospectus, which can be obtained from a financial intermediary. Prospective investors should read the prospectus carefully before investing. For further information, please call 1-800-262-1122.
Semi-Annual Report April 30, 2024
Eaton Vance
Floating-Rate Advantage Fund
Eaton Vance
Floating-Rate Advantage Fund
April 30, 2024
Performance
Portfolio Manager(s) Andrew N. Sveen, CFA, Ralph H. Hinckley, Jr., CFA and Jake T. Lemle, CFA
| % Average Annual Total Returns1,2 | Class
Inception Date | Performance
Inception Date | Six Months | One Year | Five Years | Ten Years |
| Advisers Class at NAV | 03/15/2008 | 08/04/1989 | 6.70% | 11.98% | 4.44% | 4.35% |
| Class A at NAV | 03/17/2008 | 08/04/1989 | 6.70 | 11.98 | 4.42 | 4.34 |
| Class A with 3.25% Maximum Sales Charge | — | — | 3.25 | 8.35 | 3.75 | 4.00 |
| Class C at NAV | 03/15/2008 | 08/04/1989 | 6.44 | 11.54 | 3.92 | 3.92 |
| Class C with 1% Maximum Deferred Sales Charge | — | — | 5.44 | 10.54 | 3.92 | 3.92 |
| Class I at NAV | 03/15/2008 | 08/04/1989 | 6.84 | 12.26 | 4.70 | 4.60 |
| Class R6 at NAV | 05/31/2019 | 08/04/1989 | 6.97 | 12.40 | 4.77 | 4.63 |
|
| Morningstar® LSTA® US Leveraged Loan IndexSM | — | — | 6.05% | 11.97% | 5.26% | 4.59% |
| % Total Annual Operating Expense Ratios3 | Advisers Class | Class A | Class C | Class I | Class R6 |
| | 2.82% | 2.82% | 3.32% | 2.57% | 2.53% |
| % Total Leverage4 | |
| Borrowings | 19.50% |
See Endnotes and Additional Disclosures in this report.
Past performance is no guarantee of future results. Returns are historical and are calculated by determining the percentage change in net asset value (NAV) or offering price (as applicable) with all distributions reinvested. Furthermore, returns do not reflect the deduction of taxes that shareholders may have to pay on Fund distributions or upon the redemption of Fund shares. Investment return and principal value will fluctuate so that shares, when redeemed, may be worth more or less than their original cost. Performance for periods less than or equal to one year is cumulative. Performance is for the stated time period only; due to market volatility, current Fund performance may be lower or higher than the quoted return. For performance as of the most recent month-end, please refer to eatonvance.com.
Eaton Vance
Floating-Rate Advantage Fund
April 30, 2024
| Top 10 Issuers (% of total investments)1 | |
| TransDigm, Inc. | 1.1% |
| Epicor Software Corporation | 1.1 |
| Applied Systems, Inc. | 0.9 |
| Carnival Corporation | 0.9 |
| Go Daddy Operating Company, LLC | 0.9 |
| Ineos US Finance LLC | 0.8 |
| American Airlines, Inc. | 0.8 |
| Uber Technologies, Inc. | 0.7 |
| Select Medical Corporation | 0.7 |
| Dynasty Acquisition Co., Inc. | 0.7 |
| Total | 8.6% |
| Top 10 Sectors (% of total investments)1 |
| Software | 12.7% |
| Hotels, Restaurants & Leisure | 5.6 |
| Capital Markets | 5.0 |
| Health Care Providers & Services | 4.9 |
| Machinery | 4.9 |
| Chemicals | 4.8 |
| IT Services | 3.6 |
| Professional Services | 3.3 |
| Trading Companies & Distributors | 3.0 |
| Commercial Services & Supplies | 2.4 |
| Total | 50.2% |
| Credit Quality (% of bonds, loans and asset-backed securities)2 |
Fund invests in an affiliated investment company (Portfolio) with the same objective(s) and policies as the Fund. References to investments are to the Portfolio’s holdings.
Footnotes:
| 1 | Excludes cash and cash equivalents. |
| 2 | Credit ratings are categorized using S&P Global Ratings (“S&P”). Ratings, which are subject to change, apply to the creditworthiness of the issuers of the underlying securities and not to the Fund or its shares. Credit ratings measure the quality of a bond based on the issuer’s creditworthiness, with ratings ranging from AAA, being the highest, to D, being the lowest based on S&P’s measures. Ratings of BBB or higher by S&P are considered to be investment-grade quality. Credit ratings are based largely on the ratings agency’s analysis at the time of rating. The rating assigned to any particular security is not necessarily a reflection of the issuer’s current financial condition and does not necessarily reflect its assessment of the volatility of a security’s market value or of the liquidity of an investment in the security. Holdings designated as “Not Rated” (if any) are not rated by S&P. |
Eaton Vance
Floating-Rate Advantage Fund
April 30, 2024
Endnotes and Additional Disclosures
| 1 | Morningstar® LSTA® US Leveraged Loan IndexSM is an unmanaged index of the institutional leveraged loan market. Morningstar® LSTA® Leveraged Loan indices are a product of Morningstar, Inc. (“Morningstar”) and have been licensed for use. Morningstar® is a registered trademark of Morningstar licensed for certain use. Loan Syndications and Trading Association® and LSTA® are trademarks of the LSTA licensed for certain use by Morningstar, and further sublicensed by Morningstar for certain use. Neither Morningstar nor LSTA guarantees the accuracy and/or completeness of the Morningstar® LSTA® US Leveraged Loan IndexSM or any data included therein, and shall have no liability for any errors, omissions, or interruptions therein. Unless otherwise stated, index returns do not reflect the effect of any applicable sales charges, commissions, expenses, taxes or leverage, as applicable. It is not possible to invest directly in an index. |
| 2 | Total Returns at NAV do not include applicable sales charges. If sales charges were deducted, the returns would be lower. Total Returns shown with maximum sales charge reflect the stated maximum sales charge. Unless otherwise stated, performance does not reflect the deduction of taxes on Fund distributions or redemptions of Fund shares.Effective November 5, 2020, Class C shares automatically convert to Class A shares eight years after purchase. The average annual total returns listed for Class C reflect conversion to Class A shares after eight years. Prior to November 5, 2020, Class C shares automatically converted to Class A shares ten years after purchase.Performance prior to the inception date of a class may be linked to the performance of an older class of the Fund. This linked performance is adjusted for any applicable sales charge, but is not adjusted for class expense differences. If adjusted for such differences, the performance would be different. The performance of Class R6 is linked to Class I. Performance presented in the Financial Highlights included in the financial statements is not linked. |
| 3 | Source: Fund prospectus. The expense ratios for the current reporting period can be found in the Financial Highlights section of this report. Performance reflects expenses waived and/or reimbursed, if applicable. Without such waivers and/or reimbursements, performance would have been lower. |
| 4 | Total leverage is shown as a percentage of the Fund’s aggregate net assets plus borrowings outstanding. The Fund employs leverage through borrowings. Use of leverage creates an opportunity for income, but creates risks including greater volatility of NAV. The cost of borrowings rises and falls with changes in short-term interest rates. The Fund may be required to maintain prescribed asset coverage for its leverage and may be required to reduce its leverage at an inopportune time. |
| | Fund profile subject to change due to active management. |
Eaton Vance
Floating-Rate Advantage Fund
April 30, 2024
Example
As a Fund shareholder, you incur two types of costs: (1) transaction costs, including sales charges (loads) on purchases; and (2) ongoing costs, including management fees; distribution and/or service fees; and other Fund expenses. This Example is intended to help you understand your ongoing costs (in dollars) of Fund investing and to compare these costs with the ongoing costs of investing in other mutual funds. The Example is based on an investment of $1,000 invested at the beginning of the period and held for the entire period (November 1, 2023 to April 30, 2024).
Actual Expenses
The first section of the table below provides information about actual account values and actual expenses. You may use the information in this section, together with the amount you invested, to estimate the expenses that you paid over the period. Simply divide your account value by $1,000 (for example, an $8,600 account value divided by $1,000 = 8.6), then multiply the result by the number in the first section under the heading entitled “Expenses Paid During Period” to estimate the expenses you paid on your account during this period.
Hypothetical Example for Comparison Purposes
The second section of the table below provides information about hypothetical account values and hypothetical expenses based on the actual Fund expense ratio and an assumed rate of return of 5% per year (before expenses), which is not the actual Fund return. The hypothetical account values and expenses may not be used to estimate the actual ending account balance or expenses you paid for the period. You may use this information to compare the ongoing costs of investing in your Fund and other funds. To do so, compare this 5% hypothetical example with the 5% hypothetical examples that appear in the shareholder reports of the other funds.
Please note that the expenses shown in the table are meant to highlight your ongoing costs only and do not reflect any transactional costs, such as sales charges (loads). Therefore, the second section of the table is useful in comparing ongoing costs only, and will not help you determine the relative total costs of owning different funds. In addition, if these transactional costs were included, your costs would be higher.
| | Beginning
Account Value
(11/1/23) | Ending
Account Value
(4/30/24) | Expenses Paid
During Period*
(11/1/23 – 4/30/24) | Annualized
Expense
Ratio |
| Actual | | | | |
| Advisers Class | $1,000.00 | $1,067.00 | $14.29 | 2.78% |
| Class A | $1,000.00 | $1,067.00 | $14.29 | 2.78% |
| Class C | $1,000.00 | $1,064.40 | $16.84 | 3.28% |
| Class I | $1,000.00 | $1,068.40 | $13.01 | 2.53% |
| Class R6 | $1,000.00 | $1,069.70 | $12.61 | 2.45% |
| |
| Hypothetical | | | | |
| (5% return per year before expenses) | | | | |
| Advisers Class | $1,000.00 | $1,011.04 | $13.90 | 2.78% |
| Class A | $1,000.00 | $1,011.04 | $13.90 | 2.78% |
| Class C | $1,000.00 | $1,008.55 | $16.38 | 3.28% |
| Class I | $1,000.00 | $1,012.28 | $12.66 | 2.53% |
| Class R6 | $1,000.00 | $1,012.68 | $12.26 | 2.45% |
| * | Expenses are equal to the Fund's annualized expense ratio for the indicated Class, multiplied by the average account value over the period, multiplied by 182/366 (to reflect the one-half year period). The Example assumes that the $1,000 was invested at the net asset value per share determined at the close of business on October 31, 2023. The Example reflects the expenses of both the Fund and the Portfolio. |
Eaton Vance
Floating-Rate Advantage Fund
April 30, 2024
Statement of Assets and Liabilities (Unaudited)
| | April 30, 2024 |
| Assets | |
| Investment in Senior Debt Portfolio, at value (identified cost $6,032,413,785) | $ 5,782,824,084 |
| Receivable for Fund shares sold | 11,514,627 |
| Total assets | $ 5,794,338,711 |
| Liabilities | |
| Payable for Fund shares redeemed | $ 20,101,207 |
| Distributions payable | 7,174,279 |
| Payable to affiliates: | |
| Administration fee | 467,834 |
| Distribution and service fees | 417,989 |
| Trustees' fees | 42 |
| Accrued expenses | 913,923 |
| Total liabilities | $ 29,075,274 |
| Net Assets | $ 5,765,263,437 |
| Sources of Net Assets | |
| Paid-in capital | $ 6,975,886,704 |
| Accumulated loss | (1,210,623,267) |
| Net Assets | $ 5,765,263,437 |
| Advisers Class Shares | |
| Net Assets | $ 61,610,970 |
| Shares Outstanding | 6,138,016 |
Net Asset Value, Offering Price and Redemption Price Per Share
(net assets ÷ shares of beneficial interest outstanding) | $ 10.04 |
| Class A Shares | |
| Net Assets | $ 1,127,286,290 |
| Shares Outstanding | 112,282,416 |
Net Asset Value and Redemption Price Per Share
(net assets ÷ shares of beneficial interest outstanding) | $ 10.04 |
Maximum Offering Price Per Share
(100 ÷ 96.75 of net asset value per share) | $ 10.38 |
| Class C Shares | |
| Net Assets | $ 281,705,948 |
| Shares Outstanding | 28,108,519 |
Net Asset Value and Offering Price Per Share*
(net assets ÷ shares of beneficial interest outstanding) | $ 10.02 |
| Class I Shares | |
| Net Assets | $ 4,256,834,407 |
| Shares Outstanding | 424,040,709 |
Net Asset Value, Offering Price and Redemption Price Per Share
(net assets ÷ shares of beneficial interest outstanding) | $ 10.04 |
6
See Notes to Financial Statements.
Eaton Vance
Floating-Rate Advantage Fund
April 30, 2024
Statement of Assets and Liabilities (Unaudited) — continued
| | April 30, 2024 |
| Class R6 Shares | |
| Net Assets | $37,825,822 |
| Shares Outstanding | 3,766,837 |
Net Asset Value, Offering Price and Redemption Price Per Share
(net assets ÷ shares of beneficial interest outstanding) | $ 10.04 |
| On sales of $100,000 or more, the offering price of Class A shares is reduced. |
| * | Redemption price per share is equal to the net asset value less any applicable contingent deferred sales charge. |
7
See Notes to Financial Statements.
Eaton Vance
Floating-Rate Advantage Fund
April 30, 2024
Statement of Operations (Unaudited)
| | Six Months Ended |
| | April 30, 2024 |
| Investment Income | |
| Dividend income allocated from Portfolio | $ 3,207,266 |
| Interest income allocated from Portfolio | 328,983,334 |
| Other income allocated from Portfolio | 5,864,122 |
| Expenses, excluding interest expense, allocated from Portfolio | (15,984,166) |
| Interest expense allocated from Portfolio | (50,161,976) |
| Total investment income from Portfolio | $ 271,908,580 |
| Expenses | |
| Administration fee | $ 2,810,184 |
| Distribution and service fees: | |
| Advisers Class | 79,187 |
| Class A | 1,416,984 |
| Class C | 1,079,223 |
| Trustees’ fees and expenses | 250 |
| Custodian fee | 30,935 |
| Transfer and dividend disbursing agent fees | 1,675,835 |
| Legal and accounting services | 115,799 |
| Printing and postage | 129,520 |
| Registration fees | 97,372 |
| Miscellaneous | 34,378 |
| Total expenses | $ 7,469,667 |
| Net investment income | $ 264,438,913 |
| Realized and Unrealized Gain (Loss) from Portfolio | |
| Net realized gain (loss): | |
| Investment transactions | $ (121,879,288) |
| Foreign currency transactions | (1,340,711) |
| Forward foreign currency exchange contracts | (2,050,762) |
| Net realized loss | $(125,270,761) |
| Change in unrealized appreciation (depreciation): | |
| Investments | $ 235,698,050 |
| Foreign currency | (1,182,093) |
| Forward foreign currency exchange contracts | 3,537,637 |
| Net change in unrealized appreciation (depreciation) | $ 238,053,594 |
| Net realized and unrealized gain | $ 112,782,833 |
| Net increase in net assets from operations | $ 377,221,746 |
8
See Notes to Financial Statements.
Eaton Vance
Floating-Rate Advantage Fund
April 30, 2024
Statements of Changes in Net Assets
| | Six Months Ended
April 30, 2024
(Unaudited) | Year Ended
October 31, 2023 |
| Increase (Decrease) in Net Assets | | |
| From operations: | | |
| Net investment income | $ 264,438,913 | $ 525,417,479 |
| Net realized loss | (125,270,761) | (305,782,403) |
| Net change in unrealized appreciation (depreciation) | 238,053,594 | 471,488,582 |
| Net increase in net assets from operations | $ 377,221,746 | $ 691,123,658 |
| Distributions to shareholders: | | |
| Advisers Class | $ (3,132,711) | $ (6,268,276) |
| Class A | (55,965,805) | (103,262,365) |
| Class C | (13,498,405) | (26,443,101) |
| Class I | (207,699,140) | (392,701,024) |
| Class R6 | (1,398,100) | (2,418,465) |
| Total distributions to shareholders | $ (281,694,161) | $ (531,093,231) |
| Transactions in shares of beneficial interest: | | |
| Advisers Class | $ (6,954,700) | $ (17,430,701) |
| Class A | (33,242,739) | (149,330,418) |
| Class C | (18,122,853) | (66,155,497) |
| Class I | 66,527,124 | (1,212,271,549) |
| Class R6 | 22,218,170 | (9,637,466) |
| Net increase (decrease) in net assets from Fund share transactions | $ 30,425,002 | $(1,454,825,631) |
| Net increase (decrease) in net assets | $ 125,952,587 | $(1,294,795,204) |
| Net Assets | | |
| At beginning of period | $ 5,639,310,850 | $ 6,934,106,054 |
| At end of period | $5,765,263,437 | $ 5,639,310,850 |
9
See Notes to Financial Statements.
Eaton Vance
Floating-Rate Advantage Fund
April 30, 2024
| | Advisers Class |
| | Six Months Ended
April 30, 2024
(Unaudited) | Year Ended October 31, |
| | 2023 | 2022 | 2021 | 2020 | 2019 |
| Net asset value — Beginning of period | $ 9.870 | $ 9.620 | $10.580 | $ 10.070 | $ 10.550 | $ 10.940 |
| Income (Loss) From Operations | | | | | | |
| Net investment income(1) | $ 0.462 | $ 0.849 | $ 0.487 | $ 0.398 | $ 0.457 | $ 0.558 |
| Net realized and unrealized gain (loss) | 0.200 | 0.261 | (0.966) | 0.528 | (0.473) | (0.390) |
| Total income (loss) from operations | $ 0.662 | $ 1.110 | $ (0.479) | $ 0.926 | $ (0.016) | $ 0.168 |
| Less Distributions | | | | | | |
| From net investment income | $ (0.492) | $ (0.860) | $ (0.481) | $ (0.416) | $ (0.464) | $ (0.558) |
| Total distributions | $ (0.492) | $ (0.860) | $ (0.481) | $ (0.416) | $ (0.464) | $ (0.558) |
| Net asset value — End of period | $10.040 | $ 9.870 | $ 9.620 | $10.580 | $10.070 | $ 10.550 |
| Total Return(2) | 6.70% (3) | 11.92% | (4.62)% | 9.30% | (0.05)% | 1.59% |
| Ratios/Supplemental Data | | | | | | |
| Net assets, end of period (000’s omitted) | $ 61,611 | $67,432 | $82,925 | $ 88,509 | $ 64,551 | $139,516 |
| Ratios (as a percentage of average daily net assets):(4) | | | | | | |
| Expenses excluding interest and fees | 1.00% (5) | 1.00% | 0.94% | 0.95% | 1.00% | 0.99% |
| Interest and fee expense | 1.78% (5) | 1.82% | 0.49% | 0.33% | 0.63% | 0.87% |
| Total expenses | 2.78% (5)(6) | 2.82% (6) | 1.43% (6) | 1.28% | 1.63% | 1.86% |
| Net investment income | 9.26% (5) | 8.62% | 4.79% | 3.79% | 4.50% | 5.21% |
| Portfolio Turnover of the Portfolio | 15% (3) | 18% | 27% | 28% | 30% | 17% |
| (1) | Computed using average shares outstanding. |
| (2) | Returns are historical and are calculated by determining the percentage change in net asset value with all distributions reinvested. |
| (3) | Not annualized. |
| (4) | Includes the Fund’s share of the Portfolio’s allocated expenses. |
| (5) | Annualized. |
| (6) | Includes a reduction by the investment adviser of a portion of the Portfolio’s adviser fee due to the Portfolio’s investment in the Liquidity Fund (equal to less than 0.005% of average daily net assets for the six months ended April 30, 2024 and the years ended October 31, 2023 and 2022). |
10
See Notes to Financial Statements.
Eaton Vance
Floating-Rate Advantage Fund
April 30, 2024
Financial Highlights — continued
| | Class A |
| | Six Months Ended
April 30, 2024
(Unaudited) | Year Ended October 31, |
| | 2023 | 2022 | 2021 | 2020 | 2019 |
| Net asset value — Beginning of period | $ 9.870 | $ 9.620 | $ 10.580 | $ 10.070 | $ 10.550 | $ 10.950 |
| Income (Loss) From Operations | | | | | | |
| Net investment income(1) | $ 0.462 | $ 0.851 | $ 0.485 | $ 0.399 | $ 0.447 | $ 0.559 |
| Net realized and unrealized gain (loss) | 0.200 | 0.259 | (0.964) | 0.527 | (0.463) | (0.401) |
| Total income (loss) from operations | $ 0.662 | $ 1.110 | $ (0.479) | $ 0.926 | $ (0.016) | $ 0.158 |
| Less Distributions | | | | | | |
| From net investment income | $ (0.492) | $ (0.860) | $ (0.481) | $ (0.416) | $ (0.464) | $ (0.558) |
| Total distributions | $ (0.492) | $ (0.860) | $ (0.481) | $ (0.416) | $ (0.464) | $ (0.558) |
| Net asset value — End of period | $ 10.040 | $ 9.870 | $ 9.620 | $ 10.580 | $ 10.070 | $ 10.550 |
| Total Return(2) | 6.70% (3) | 11.91% | (4.62)% | 9.30% | (0.05)% | 1.50% |
| Ratios/Supplemental Data | | | | | | |
| Net assets, end of period (000’s omitted) | $1,127,286 | $1,141,067 | $1,259,540 | $1,378,928 | $1,175,942 | $1,426,205 |
| Ratios (as a percentage of average daily net assets):(4) | | | | | | |
| Expenses excluding interest and fees | 1.00% (5) | 1.00% | 0.94% | 0.95% | 0.99% | 0.99% |
| Interest and fee expense | 1.78% (5) | 1.82% | 0.49% | 0.33% | 0.60% | 0.88% |
| Total expenses | 2.78% (5)(6) | 2.82% (6) | 1.43% (6) | 1.28% | 1.59% | 1.87% |
| Net investment income | 9.26% (5) | 8.64% | 4.77% | 3.80% | 4.44% | 5.21% |
| Portfolio Turnover of the Portfolio | 15% (3) | 18% | 27% | 28% | 30% | 17% |
| (1) | Computed using average shares outstanding. |
| (2) | Returns are historical and are calculated by determining the percentage change in net asset value with all distributions reinvested and do not reflect the effect of sales charges. |
| (3) | Not annualized. |
| (4) | Includes the Fund’s share of the Portfolio’s allocated expenses. |
| (5) | Annualized. |
| (6) | Includes a reduction by the investment adviser of a portion of the Portfolio’s adviser fee due to the Portfolio’s investment in the Liquidity Fund (equal to less than 0.005% of average daily net assets for the six months ended April 30, 2024 and the years ended October 31, 2023 and 2022). |
11
See Notes to Financial Statements.
Eaton Vance
Floating-Rate Advantage Fund
April 30, 2024
Financial Highlights — continued
| | Class C |
| | Six Months Ended
April 30, 2024
(Unaudited) | Year Ended October 31, |
| | 2023 | 2022 | 2021 | 2020 | 2019 |
| Net asset value — Beginning of period | $ 9.850 | $ 9.610 | $ 10.560 | $ 10.050 | $ 10.530 | $ 10.920 |
| Income (Loss) From Operations | | | | | | |
| Net investment income(1) | $ 0.436 | $ 0.799 | $ 0.430 | $ 0.347 | $ 0.397 | $ 0.503 |
| Net realized and unrealized gain (loss) | 0.200 | 0.250 | (0.950) | 0.526 | (0.464) | (0.390) |
| Total income (loss) from operations | $ 0.636 | $ 1.049 | $ (0.520) | $ 0.873 | $ (0.067) | $ 0.113 |
| Less Distributions | | | | | | |
| From net investment income | $ (0.466) | $ (0.809) | $ (0.430) | $ (0.363) | $ (0.413) | $ (0.503) |
| Total distributions | $ (0.466) | $ (0.809) | $ (0.430) | $ (0.363) | $ (0.413) | $ (0.503) |
| Net asset value — End of period | $ 10.020 | $ 9.850 | $ 9.610 | $ 10.560 | $ 10.050 | $ 10.530 |
| Total Return(2) | 6.44% (3) | 11.48% | (5.11)% | 8.77% | (0.56)% | 1.08% |
| Ratios/Supplemental Data | | | | | | |
| Net assets, end of period (000’s omitted) | $281,706 | $294,805 | $352,239 | $435,786 | $508,535 | $754,873 |
| Ratios (as a percentage of average daily net assets):(4) | | | | | | |
| Expenses excluding interest and fees | 1.50% (5) | 1.50% | 1.44% | 1.46% | 1.50% | 1.49% |
| Interest and fee expense | 1.78% (5) | 1.82% | 0.48% | 0.33% | 0.60% | 0.87% |
| Total expenses | 3.28% (5)(6) | 3.32% (6) | 1.92% (6) | 1.79% | 2.10% | 2.36% |
| Net investment income | 8.76% (5) | 8.13% | 4.23% | 3.31% | 3.95% | 4.71% |
| Portfolio Turnover of the Portfolio | 15% (3) | 18% | 27% | 28% | 30% | 17% |
| (1) | Computed using average shares outstanding. |
| (2) | Returns are historical and are calculated by determining the percentage change in net asset value with all distributions reinvested and do not reflect the effect of sales charges. |
| (3) | Not annualized. |
| (4) | Includes the Fund’s share of the Portfolio’s allocated expenses. |
| (5) | Annualized. |
| (6) | Includes a reduction by the investment adviser of a portion of the Portfolio’s adviser fee due to the Portfolio’s investment in the Liquidity Fund (equal to less than 0.005% of average daily net assets for the six months ended April 30, 2024 and the years ended October 31, 2023 and 2022). |
12
See Notes to Financial Statements.
Eaton Vance
Floating-Rate Advantage Fund
April 30, 2024
Financial Highlights — continued
| | Class I |
| | Six Months Ended
April 30, 2024
(Unaudited) | Year Ended October 31, |
| | 2023 | 2022 | 2021 | 2020 | 2019 |
| Net asset value — Beginning of period | $ 9.870 | $ 9.620 | $ 10.580 | $ 10.070 | $ 10.550 | $ 10.940 |
| Income (Loss) From Operations | | | | | | |
| Net investment income(1) | $ 0.474 | $ 0.873 | $ 0.507 | $ 0.423 | $ 0.474 | $ 0.586 |
| Net realized and unrealized gain (loss) | 0.200 | 0.262 | (0.961) | 0.529 | (0.465) | (0.392) |
| Total income (loss) from operations | $ 0.674 | $ 1.135 | $ (0.454) | $ 0.952 | $ 0.009 | $ 0.194 |
| Less Distributions | | | | | | |
| From net investment income | $ (0.504) | $ (0.885) | $ (0.506) | $ (0.442) | $ (0.489) | $ (0.584) |
| Total distributions | $ (0.504) | $ (0.885) | $ (0.506) | $ (0.442) | $ (0.489) | $ (0.584) |
| Net asset value — End of period | $ 10.040 | $ 9.870 | $ 9.620 | $ 10.580 | $ 10.070 | $ 10.550 |
| Total Return(2) | 6.84% (3) | 12.19% | (4.38)% | 9.57% | 0.20% | 1.84% |
| Ratios/Supplemental Data | | | | | | |
| Net assets, end of period (000’s omitted) | $4,256,834 | $4,120,653 | $5,215,271 | $5,898,403 | $3,545,676 | $4,898,901 |
| Ratios (as a percentage of average daily net assets):(4) | | | | | | |
| Expenses excluding interest and fees | 0.75% (5) | 0.75% | 0.69% | 0.70% | 0.75% | 0.74% |
| Interest and fee expense | 1.78% (5) | 1.82% | 0.47% | 0.32% | 0.60% | 0.88% |
| Total expenses | 2.53% (5)(6) | 2.57% (6) | 1.16% (6) | 1.02% | 1.35% | 1.62% |
| Net investment income | 9.50% (5) | 8.87% | 4.99% | 4.02% | 4.70% | 5.47% |
| Portfolio Turnover of the Portfolio | 15% (3) | 18% | 27% | 28% | 30% | 17% |
| (1) | Computed using average shares outstanding. |
| (2) | Returns are historical and are calculated by determining the percentage change in net asset value with all distributions reinvested. |
| (3) | Not annualized. |
| (4) | Includes the Fund’s share of the Portfolio’s allocated expenses. |
| (5) | Annualized. |
| (6) | Includes a reduction by the investment adviser of a portion of the Portfolio’s adviser fee due to the Portfolio’s investment in the Liquidity Fund (equal to less than 0.005% of average daily net assets for the six months ended April 30, 2024 and the years ended October 31, 2023 and 2022). |
13
See Notes to Financial Statements.
Eaton Vance
Floating-Rate Advantage Fund
April 30, 2024
Financial Highlights — continued
| | | Class R6 |
| | | Six Months Ended
April 30, 2024
(Unaudited) | | Year Ended October 31, | Period Ended
October 31, 2019(1) |
| | | 2023 | 2022 | 2021 | 2020 | |
| Net asset value — Beginning of period | | $ 9.870 | | $ 9.620 | $10.580 | $ 10.060 | $ 10.550 | $ 10.740 |
| Income (Loss) From Operations | | | | | | | | |
| Net investment income(2) | | $ 0.468 | | $ 0.914 | $ 0.480 | $ 0.427 | $ 0.460 | $ 0.247 |
| Net realized and unrealized gain (loss) | | 0.209 | | 0.224 | (0.931) | 0.540 | (0.455) | (0.190) |
| Total income (loss) from operations | | $ 0.677 | | $ 1.138 | $ (0.451) | $ 0.967 | $ 0.005 | $ 0.057 |
| Less Distributions | | | | | | | | |
| From net investment income | | $ (0.507) | | $ (0.888) | $ (0.509) | $ (0.447) | $ (0.495) | $ (0.247) |
| Total distributions | | $ (0.507) | | $ (0.888) | $ (0.509) | $ (0.447) | $ (0.495) | $ (0.247) |
| Net asset value — End of period | | $10.040 | | $ 9.870 | $ 9.620 | $ 10.580 | $10.060 | $10.550 |
| Total Return(3) | | 6.97% (4) | | 12.35% | (4.36)% | 9.63% | 0.16% | 0.53% (4) |
| Ratios/Supplemental Data | | | | | | | | |
| Net assets, end of period (000’s omitted) | | $ 37,826 | | $15,353 | $24,131 | $135,653 | $ 33,814 | $ 10 |
| Ratios (as a percentage of average daily net assets):(5) | | | | | | | | |
| Expenses excluding interest and fees | | 0.67% (6) | | 0.79% | 0.63% | 0.65% | 0.68% | 0.62% (6) |
| Interest and fee expense | | 1.78% (6) | | 1.82% | 0.38% | 0.30% | 0.55% | 0.94% (6) |
| Total expenses | | 2.45% (6)(7) | | 2.60% (7) | 1.01% (7) | 0.95% | 1.23% | 1.56% (6) |
| Net investment income | | 9.38% (6) | | 9.26% | 4.66% | 4.06% | 4.63% | 5.48% (6) |
| Portfolio Turnover of the Portfolio | | 15% (4) | | 18% | 27% | 28% | 30% | 17% (4)(8) |
| (1) | For the period from the commencement of operations, May 31, 2019, to October 31, 2019. |
| (2) | Computed using average shares outstanding. |
| (3) | Returns are historical and are calculated by determining the percentage change in net asset value with all distributions reinvested. |
| (4) | Not annualized. |
| (5) | Includes the Fund’s share of the Portfolio’s allocated expenses. |
| (6) | Annualized. |
| (7) | Includes a reduction by the investment adviser of a portion of the Portfolio’s adviser fee due to the Portfolio’s investment in the Liquidity Fund (equal to less than 0.005% of average daily net assets for the six months ended April 30, 2024 and the years ended October 31, 2023 and 2022). |
| (8) | For the year ended October 31, 2019. |
14
See Notes to Financial Statements.
Eaton Vance
Floating-Rate Advantage Fund
April 30, 2024
Notes to Financial Statements (Unaudited)
1 Significant Accounting Policies
Eaton Vance Floating-Rate Advantage Fund (the Fund) is a diversified series of Eaton Vance Mutual Funds Trust (the Trust). The Trust is a Massachusetts business trust registered under the Investment Company Act of 1940, as amended (the 1940 Act), as an open-end management investment company. The Fund offers five classes of shares. Class A shares are generally sold subject to a sales charge imposed at time of purchase. Class C shares are sold at net asset value and are generally subject to a contingent deferred sales charge (see Note 5). Effective November 5, 2020, Class C shares automatically convert to Class A shares eight years after their purchase as described in the Fund’s prospectus. Advisers Class, Class I and Class R6 shares are generally sold at net asset value and are not subject to a sales charge. Each class represents a pro rata interest in the Fund, but votes separately on class-specific matters and (as noted below) is subject to different expenses. Realized and unrealized gains and losses are allocated daily to each class of shares based on the relative net assets of each class to the total net assets of the Fund. Net investment income, other than class-specific expenses, is allocated daily to each class of shares based upon the ratio of the value of each class’s paid shares to the total value of all paid shares. Sub-accounting, recordkeeping and similar administrative fees payable to financial intermediaries, which are a component of transfer and dividend disbursing agent fees on the Statement of Operations, are not allocated to Class R6 shares. Each class of shares differs in its distribution plan and certain other class-specific expenses. The Fund invests all of its investable assets in interests in Senior Debt Portfolio (the Portfolio), a Massachusetts business trust, having the same investment objective and policies as the Fund. The value of the Fund’s investment in the Portfolio reflects the Fund’s proportionate interest in the net assets of the Portfolio (96.6% at April 30, 2024). The performance of the Fund is directly affected by the performance of the Portfolio. The financial statements of the Portfolio, including the portfolio of investments, are included elsewhere in this report and should be read in conjunction with the Fund’s financial statements.
The following is a summary of significant accounting policies of the Fund. The policies are in conformity with accounting principles generally accepted in the United States of America (U.S. GAAP). The Fund is an investment company and follows accounting and reporting guidance in the Financial Accounting Standards Board (FASB) Accounting Standards Codification Topic 946.
A Investment Valuation—Valuation of securities by the Portfolio is discussed in Note 1A of the Portfolio's Notes to Financial Statements, which are included elsewhere in this report.
B Income—The Fund's net investment income or loss consists of the Fund's pro rata share of the net investment income or loss of the Portfolio, less all actual and accrued expenses of the Fund.
C Federal Taxes—The Fund's policy is to comply with the provisions of the Internal Revenue Code applicable to regulated investment companies and to distribute to shareholders each year substantially all of its net investment income, and all or substantially all of its net realized capital gains. Accordingly, no provision for federal income or excise tax is necessary.
As of April 30, 2024, the Fund had no uncertain tax positions that would require financial statement recognition, de-recognition, or disclosure. The Fund files a U.S. federal income tax return annually after its fiscal year-end, which is subject to examination by the Internal Revenue Service for a period of three years from the date of filing.
D Expenses—The majority of expenses of the Trust are directly identifiable to an individual fund. Expenses which are not readily identifiable to a specific fund are allocated taking into consideration, among other things, the nature and type of expense and the relative size of the funds.
E Use of Estimates—The preparation of the financial statements in conformity with U.S. GAAP requires management to make estimates and assumptions that affect the reported amounts of assets and liabilities at the date of the financial statements and the reported amounts of income and expense during the reporting period. Actual results could differ from those estimates.
F Indemnifications—Under the Trust’s organizational documents, its officers and Trustees may be indemnified against certain liabilities and expenses arising out of the performance of their duties to the Fund. Under Massachusetts law, if certain conditions prevail, shareholders of a Massachusetts business trust (such as the Trust) could be deemed to have personal liability for the obligations of the Trust. However, the Trust’s Declaration of Trust contains an express disclaimer of liability on the part of Fund shareholders and the By-laws provide that the Trust shall assume, upon request by the shareholder, the defense on behalf of any Fund shareholders. Moreover, the By-laws also provide for indemnification out of Fund property of any shareholder held personally liable solely by reason of being or having been a shareholder for all loss or expense arising from such liability. Additionally, in the normal course of business, the Fund enters into agreements with service providers that may contain indemnification clauses. The Fund’s maximum exposure under these arrangements is unknown as this would involve future claims that may be made against the Fund that have not yet occurred.
G Other—Investment transactions are accounted for on a trade date basis.
H Interim Financial Statements—The interim financial statements relating to April 30, 2024 and for the six months then ended have not been audited by an independent registered public accounting firm, but in the opinion of the Fund’s management, reflect all adjustments, consisting only of normal recurring adjustments, necessary for the fair presentation of the financial statements.
Eaton Vance
Floating-Rate Advantage Fund
April 30, 2024
Notes to Financial Statements (Unaudited) — continued
2 Distributions to Shareholders and Income Tax Information
The Fund declares dividends daily to shareholders of record at the time of declaration. Distributions are generally paid monthly. Distributions of realized capital gains are made at least annually. Distributions are declared separately for each class of shares. Shareholders may reinvest income and capital gain distributions in additional shares of the same class of the Fund at the net asset value as of the reinvestment date or, at the election of the shareholder, receive distributions in cash. Distributions to shareholders are determined in accordance with income tax regulations, which may differ from U.S. GAAP. As required by U.S. GAAP, only distributions in excess of tax basis earnings and profits are reported in the financial statements as a return of capital. Permanent differences between book and tax accounting relating to distributions are reclassified to paid-in capital. For tax purposes, distributions from short-term capital gains are considered to be from ordinary income.
At October 31, 2023, the Fund, for federal income tax purposes, had deferred capital losses of $873,249,379 which would reduce its taxable income arising from future net realized gains on investment transactions, if any, to the extent permitted by the Internal Revenue Code, and thus would reduce the amount of distributions to shareholders, which would otherwise be necessary to relieve the Fund of any liability for federal income or excise tax. The deferred capital losses are treated as arising on the first day of the Fund’s next taxable year and retain the same short-term or long-term character as when originally deferred. Of the deferred capital losses at October 31, 2023, $775,036,648 are long-term and $98,212,731 are short-term.
3 Investment Adviser Fee and Other Transactions with Affiliates
The investment adviser fee is earned by Eaton Vance Management (EVM), an indirect, wholly-owned subsidiary of Morgan Stanley, as compensation for investment advisory services rendered to the Fund. The investment adviser fee is computed at an annual rate as a percentage of the Fund’s average daily gross assets that are not invested in other investment companies for which EVM or its affiliates serve as investment adviser and receive an advisory fee as follows and is payable monthly:
| Average Daily Gross Assets | Annual Fee Rate |
| Up to and including $1 billion | 0.5000% |
| In excess of $1 billion up to and including $2 billion | 0.4500% |
| In excess of $2 billion up to and including $7 billion | 0.4000% |
| In excess of $7 billion up to and including $10 billion | 0.3875% |
| In excess of $10 billion up to and including $15 billion | 0.3750% |
| In excess of $15 billion | 0.3625% |
Gross assets are calculated by deducting all liabilities of the Fund except the principal amount of any indebtedness for money borrowed. For the six months ended April 30, 2024, the Fund incurred no investment adviser fee on such assets. To the extent that the Fund’s assets are invested in the Portfolio, the Fund is allocated its share of the Portfolio’s investment adviser fee. The Portfolio has engaged Boston Management and Research (BMR) to render investment advisory services. See Note 2 of the Portfolio’s Notes to Financial Statements which are included elsewhere in this report.
The administration fee is earned by EVM as compensation for administrative services rendered to the Fund. The fee is computed at an annual rate of 0.10% of the Fund’s average daily net assets. For the six months ended April 30, 2024, the administration fee amounted to $2,810,184. EVM provides subtransfer agency and related services to the Fund pursuant to a Sub-Transfer Agency Support Services Agreement. For the six months ended April 30, 2024, EVM earned $92,424 from the Fund pursuant to such agreement, which is included in transfer and dividend disbursing agent fees on the Statement of Operations. The Fund was informed that Eaton Vance Distributors, Inc. (EVD), an affiliate of EVM and the Fund’s principal underwriter, received $37,963 as its portion of the sales charge on sales of Class A shares for the six months ended April 30, 2024. The Fund was informed that Morgan Stanley affiliated broker-dealers, which may be deemed to be affiliates of EVM, BMR and EVD, also received a portion of the sales charge on sales of Class A shares for the six months ended April 30, 2024 in the amount of $12,623. EVD also received distribution and service fees from Advisers Class, Class A and Class C shares (see Note 4) and contingent deferred sales charges (see Note 5).
Trustees and officers of the Fund who are members of EVM’s or BMR's organizations receive remuneration for their services to the Fund out of the investment adviser fee. Certain officers and Trustees of the Fund and the Portfolio are officers of the above organizations.
4 Distribution Plans
The Fund has in effect a distribution plan for Advisers Class shares and Class A shares (Advisers/Class A Plan) pursuant to Rule 12b-1 under the 1940 Act. Pursuant to the Advisers/Class A Plan, the Fund pays EVD a distribution and service fee of 0.25% per annum of its average daily net assets attributable to Advisers Class and Class A shares for distribution services and facilities provided to the Fund by EVD, as well as for personal services and/or the maintenance of shareholder accounts. Distribution and service fees paid or accrued to EVD for the six months ended April 30, 2024 amounted to $79,187 for Advisers Class shares and $1,416,984 for Class A shares.
Eaton Vance
Floating-Rate Advantage Fund
April 30, 2024
Notes to Financial Statements (Unaudited) — continued
The Fund also has in effect a distribution plan for Class C shares (Class C Plan) pursuant to Rule 12b-1 under the 1940 Act. Pursuant to the Class C Plan, the Fund pays EVD amounts equal to 0.60% per annum of its average daily net assets attributable to Class C shares for providing ongoing distribution services and facilities to the Fund. For the six months ended April 30, 2024, the Fund paid or accrued to EVD $863,378 for Class C shares.
Pursuant to the Class C Plan, the Fund also makes payments of service fees to EVD, financial intermediaries and other persons in amounts equal to 0.15% per annum of its average daily net assets attributable to Class C shares. Although there is no present intention to do so, Class C shares could pay service fees of up to 0.25% annually upon Trustee approval. Service fees paid or accrued are for personal services and/or the maintenance of shareholder accounts. They are separate and distinct from the sales commissions and distribution fees payable to EVD. Service fees paid or accrued for the six months ended April 30, 2024 amounted to $215,845 for Class C shares.
Distribution and service fees are subject to the limitations contained in the Financial Industry Regulatory Authority Rule 2341(d).
5 Contingent Deferred Sales Charges
A contingent deferred sales charge (CDSC) of 1% generally is imposed on redemptions of Class C shares made within 12 months of purchase. Class A shares may be subject to a 0.75% CDSC if redeemed within 12 months of purchase (depending on the circumstances of purchase). Generally, the CDSC is based upon the lower of the net asset value at date of redemption or date of purchase. No charge is levied on shares acquired by reinvestment of dividends or capital gain distributions. For the six months ended April 30, 2024, the Fund was informed that EVD received $4,898 and $4,883 of CDSCs paid by Class A and Class C shareholders, respectively.
6 Investment Transactions
For the six months ended April 30, 2024, increases and decreases in the Fund's investment in the Portfolio aggregated $155,468,850 and $409,570,834, respectively.
7 Shares of Beneficial Interest
The Fund’s Declaration of Trust permits the Trustees to issue an unlimited number of full and fractional shares of beneficial interest (without par value). Such shares may be issued in a number of different series (such as the Fund) and classes. Transactions in Fund shares, including direct exchanges pursuant to share class conversions, were as follows:
| | Six Months Ended
April 30, 2024
(Unaudited) | | Year Ended
October 31, 2023 |
| | Shares | Amount | | Shares | Amount |
| Advisers Class | | | | | |
| Sales | 621,129 | $ 6,235,195 | | 1,128,130 | $ 11,140,190 |
| Issued to shareholders electing to receive payments of distributions in Fund shares | 308,565 | 3,097,171 | | 630,898 | 6,215,546 |
| Redemptions | (1,624,828) | (16,287,066) | | (3,544,982) | (34,786,437) |
| Net decrease | (695,134) | $ (6,954,700) | | (1,785,954) | $ (17,430,701) |
| Class A | | | | | |
| Sales | 6,248,590 | $ 62,677,954 | | 13,520,333 | $ 133,342,035 |
| Issued to shareholders electing to receive payments of distributions in Fund shares | 4,748,010 | 47,658,750 | | 8,818,151 | 86,926,063 |
| Redemptions | (14,316,936) | (143,579,443) | | (37,618,515) | (369,598,516) |
| Net decrease | (3,320,336) | $ (33,242,739) | | (15,280,031) | $ (149,330,418) |
Eaton Vance
Floating-Rate Advantage Fund
April 30, 2024
Notes to Financial Statements (Unaudited) — continued
| | Six Months Ended
April 30, 2024
(Unaudited) | | Year Ended
October 31, 2023 |
| | Shares | Amount | | Shares | Amount |
| Class C | | | | | |
| Sales | 1,689,396 | $ 16,918,475 | | 2,918,796 | $ 28,717,972 |
| Issued to shareholders electing to receive payments of distributions in Fund shares | 1,242,667 | 12,454,136 | | 2,427,933 | 23,887,925 |
| Redemptions | (4,743,296) | (47,495,464) | | (12,093,790) | (118,761,394) |
| Net decrease | (1,811,233) | $ (18,122,853) | | (6,747,061) | $ (66,155,497) |
| Class I | | | | | |
| Sales | 75,526,583 | $ 757,773,836 | | 144,101,389 | $ 1,423,150,623 |
| Issued to shareholders electing to receive payments of distributions in Fund shares | 17,027,639 | 170,917,592 | | 32,436,796 | 319,569,650 |
| Redemptions | (86,022,659) | (862,164,304) | | (301,013,983) | (2,954,991,822) |
| Net increase (decrease) | 6,531,563 | $ 66,527,124 | | (124,475,798) | $(1,212,271,549) |
| Class R6 | | | | | |
| Sales | 2,666,892 | $ 26,792,193 | | 8,134,927 | $ 80,029,817 |
| Issued to shareholders electing to receive payments of distributions in Fund shares | 69,493 | 697,873 | | 108,951 | 1,073,201 |
| Redemptions | (524,904) | (5,271,896) | | (9,198,167) | (90,740,484) |
| Net increase (decrease) | 2,211,481 | $ 22,218,170 | | (954,289) | $ (9,637,466) |
Senior Debt Portfolio
April 30, 2024
Portfolio of Investments (Unaudited)
| Asset-Backed Securities — 4.5% |
| Security | Principal
Amount
(000's omitted) | Value |
| Alinea CLO Ltd.: | | | |
| Series 2018-1A, Class D, 8.686%, (3 mo. SOFR + 3.362%), 7/20/31(1)(2) | $ | 2,500 | $ 2,504,680 |
| Series 2018-1A, Class E, 11.586%, (3 mo. SOFR + 6.262%), 7/20/31(1)(2) | | 3,000 | 2,966,955 |
| AMMC CLO XII Ltd., Series 2013-12A, Class ER, 11.743%, (3 mo. SOFR + 6.442%), 11/10/30(1)(2) | | 3,525 | 3,441,641 |
| AMMC CLO XV Ltd., Series 2014-15A, Class ERR, 12.50%, (3 mo. SOFR + 7.172%), 1/15/32(1)(2) | | 5,000 | 4,810,550 |
| Apidos CLO XX Ltd., Series 2015-20A, Class DR, 11.289%, (3 mo. SOFR + 5.962%), 7/16/31(1)(2) | | 2,375 | 2,381,847 |
| ARES Loan Funding II Ltd., Series 2022-ALF2A, Class ER, 13.565%, (3 mo. SOFR + 8.24%), 10/20/36(1)(2) | | 1,675 | 1,707,967 |
| ARES LVIII CLO Ltd., Series 2020-58A, Class ER, 12.029%, (3 mo. SOFR + 6.70%), 1/15/35(1)(2) | | 3,000 | 2,997,270 |
| ARES XLIX CLO Ltd., Series 2018-49A, Class D, 8.586%, (3 mo. SOFR + 3.262%), 7/22/30(1)(2) | | 2,500 | 2,501,970 |
| ARES XXXIIR CLO Ltd.: | | | |
| Series 2014-32RA, Class C, 8.469%, (3 mo. SOFR + 3.162%), 5/15/30(1)(2) | | 5,000 | 5,000,845 |
| Series 2014-32RA, Class D, 11.419%, (3 mo. SOFR + 6.112%), 5/15/30(1)(2) | | 1,000 | 956,430 |
| ARES XXXVR CLO Ltd., Series 2015-35RA, Class E, 11.29%, (3 mo. SOFR + 5.962%), 7/15/30(1)(2) | | 4,000 | 3,955,192 |
| Bain Capital Credit CLO Ltd., Series 2018-1A, Class D, 8.288%, (3 mo. SOFR + 2.962%), 4/23/31(1)(2) | | 5,000 | 4,919,455 |
| Barings CLO Ltd.: | | | |
| Series 2015-1A, Class DR, 8.186%, (3 mo. SOFR + 2.862%), 1/20/31(1)(2) | | 2,500 | 2,499,900 |
| Series 2018-1A, Class C, 8.19%, (3 mo. SOFR + 2.862%), 4/15/31(1)(2) | | 3,500 | 3,443,625 |
| Battalion CLO XXII Ltd., Series 2021-22A, Class E, 12.536%, (3 mo. SOFR + 7.212%), 1/20/35(1)(2) | | 1,750 | 1,620,600 |
| Battalion CLO XXIII Ltd., Series 2022-23A, Class D, 9.279%, (3 mo. SOFR + 3.95%), 5/19/36(1)(2) | | 3,500 | 3,471,205 |
| Benefit Street Partners CLO VIII Ltd., Series 2015-8A, Class DR, 11.186%, (3 mo. SOFR + 5.862%), 1/20/31(1)(2) | | 5,401 | 5,345,445 |
| Benefit Street Partners CLO XIV Ltd., Series 2018-14A, Class D, 8.186%, (3 mo. SOFR + 2.862%), 4/20/31(1)(2) | | 1,500 | 1,502,513 |
| Security | Principal
Amount
(000's omitted) | Value |
| Benefit Street Partners CLO XVI Ltd., Series 2018-16A, Class E, 12.279%, (3 mo. SOFR + 6.962%), 1/17/32(1)(2) | $ | 2,250 | $ 2,259,866 |
| Benefit Street Partners CLO XVII Ltd., Series 2019-17A, Class ER, 11.94%, (3 mo. SOFR + 6.612%), 7/15/32(1)(2) | | 1,750 | 1,757,921 |
| Benefit Street Partners CLO XXII Ltd., Series 2020-22A, Class ER, 12.255%, (3 mo. SOFR + 6.93%), 4/20/35(1)(2) | | 1,000 | 1,003,100 |
| Benefit Street Partners CLO XXV Ltd., Series 2021-25A, Class E, 12.44%, (3 mo. SOFR + 7.112%), 1/15/35(1)(2) | | 3,000 | 3,008,664 |
| Betony CLO 2 Ltd.: | | | |
| Series 2018-1A, Class C, 8.491%, (3 mo. SOFR + 3.162%), 4/30/31(1)(2) | | 2,500 | 2,501,532 |
| Series 2018-1A, Class D, 11.241%, (3 mo. SOFR + 5.912%), 4/30/31(1)(2) | | 2,525 | 2,499,273 |
| BlueMountain CLO Ltd.: | | | |
| Series 2015-3A, Class CR, 8.186%, (3 mo. SOFR + 2.862%), 4/20/31(1)(2) | | 5,000 | 4,887,075 |
| Series 2015-3A, Class DR, 10.986%, (3 mo. SOFR + 5.662%), 4/20/31(1)(2) | | 3,000 | 2,774,613 |
| Series 2016-3A, Class DR, 8.669%, (3 mo. SOFR + 3.362%), 11/15/30(1)(2) | | 1,500 | 1,483,461 |
| Series 2016-3A, Class ER, 11.519%, (3 mo. SOFR + 6.212%), 11/15/30(1)(2) | | 1,500 | 1,441,254 |
| Series 2018-1A, Class D, 8.641%, (3 mo. SOFR + 3.312%), 7/30/30(1)(2) | | 2,500 | 2,442,440 |
| Series 2018-1A, Class E, 11.541%, (3 mo. SOFR + 6.212%), 7/30/30(1)(2) | | 2,000 | 1,829,416 |
| BlueMountain CLO XXIV Ltd., Series 2019-24A, Class ER, 12.426%, (3 mo. SOFR + 7.102%), 4/20/34(1)(2) | | 1,250 | 1,226,211 |
| BlueMountain CLO XXVI Ltd., Series 2019-26A, Class ER, 12.716%, (3 mo. SOFR + 7.392%), 10/20/34(1)(2) | | 3,000 | 2,946,033 |
| BlueMountain CLO XXX Ltd., Series 2020-30A, Class ER, 12.029%, (3 mo. SOFR + 6.70%), 4/15/35(1)(2) | | 2,000 | 1,955,000 |
| BlueMountain CLO XXXIII Ltd., Series 2021-33A, Class E, 12.411%, (3 mo. SOFR + 7.092%), 11/20/34(1)(2) | | 2,500 | 2,485,743 |
| BlueMountain CLO XXXV Ltd., Series 2022-35A, Class E, 13.075%, (3 mo. SOFR + 7.75%), 7/22/35(1)(2) | | 2,000 | 1,978,702 |
| Bryant Park Funding Ltd.: | | | |
| Series 2023-20A, Class D, 11.419%, (3 mo. SOFR + 6.09%), 7/15/36(1)(2) | | 5,250 | 5,359,830 |
| Series 2023-21A, Class D, 10.777%, (3 mo. SOFR + 5.45%), 10/18/36(1)(2) | | 4,475 | 4,539,521 |
| Canyon Capital CLO Ltd.: | | | |
| Series 2012-1RA, Class E, 11.29%, (3 mo. SOFR + 5.962%), 7/15/30(1)(2) | | 4,875 | 4,777,636 |
19
See Notes to Financial Statements.
Senior Debt Portfolio
April 30, 2024
Portfolio of Investments (Unaudited) — continued
| Security | Principal
Amount
(000's omitted) | Value |
| Canyon Capital CLO Ltd.: (continued) | | | |
| Series 2016-1A, Class ER, 11.34%, (3 mo. SOFR + 6.012%), 7/15/31(1)(2) | $ | 4,000 | $ 3,923,540 |
| Series 2016-2A, Class ER, 11.59%, (3 mo. SOFR + 6.262%), 10/15/31(1)(2) | | 4,500 | 4,444,677 |
| Series 2018-1A, Class D, 8.49%, (3 mo. SOFR + 3.162%), 7/15/31(1)(2) | | 3,000 | 2,964,834 |
| Series 2018-1A, Class E, 11.34%, (3 mo. SOFR + 6.012%), 7/15/31(1)(2) | | 2,750 | 2,701,875 |
| Series 2019-2A, Class ER, 12.34%, (3 mo. SOFR + 7.012%), 10/15/34(1)(2) | | 1,500 | 1,468,268 |
| Carlyle C17 CLO Ltd.: | | | |
| Series C17A, Class CR, 8.379%, (3 mo. SOFR + 3.062%), 4/30/31(1)(2) | | 5,000 | 4,968,750 |
| Series C17A, Class DR, 11.579%, (3 mo. SOFR + 6.262%), 4/30/31(1)(2) | | 3,500 | 3,407,106 |
| Carlyle Global Market Strategies CLO Ltd.: | | | |
| Series 2012-3A, Class CR2, 9.09%, (3 mo. SOFR + 3.762%), 1/14/32(1)(2) | | 2,500 | 2,504,097 |
| Series 2012-3A, Class DR2, 12.09%, (3 mo. SOFR + 6.762%), 1/14/32(1)(2) | | 1,500 | 1,479,825 |
| Series 2014-3RA, Class C, 8.537%, (3 mo. SOFR + 3.212%), 7/27/31(1)(2) | | 1,000 | 984,560 |
| Series 2014-3RA, Class D, 10.987%, (3 mo. SOFR + 5.662%), 7/27/31(1)(2) | | 2,150 | 2,104,841 |
| Series 2014-4RA, Class C, 8.49%, (3 mo. SOFR + 3.162%), 7/15/30(1)(2) | | 2,750 | 2,709,283 |
| Series 2014-4RA, Class D, 11.24%, (3 mo. SOFR + 5.912%), 7/15/30(1)(2) | | 1,500 | 1,451,039 |
| Carlyle U.S. CLO Ltd.: | | | |
| Series 2019-4A, Class DR, 11.929%, (3 mo. SOFR + 6.60%), 4/15/35(1)(2) | | 3,000 | 2,969,790 |
| Series 2021-7A, Class D, 11.84%, (3 mo. SOFR + 6.512%), 10/15/35(1)(2) | | 250 | 250,474 |
| Series 2022-6A, Class DR, 10.074%, (3 mo. SOFR + 4.75%), 10/25/36(1)(2) | | 2,800 | 2,845,769 |
| CarVal CLO IV Ltd., Series 2021-1A, Class E, 12.186%, (3 mo. SOFR + 6.862%), 7/20/34(1)(2) | | 1,000 | 1,003,442 |
| CIFC Funding Ltd.: | | | |
| Series 2022-1A, Class E, 11.717%, (3 mo. SOFR + 6.40%), 4/17/35(1)(2) | | 750 | 752,454 |
| Series 2022-4A, Class D, 8.878%, (3 mo. SOFR + 3.55%), 7/16/35(1)(2) | | 1,750 | 1,754,998 |
| Crown City CLO I, Series 2020-1A, Class DR, 12.586%, (3 mo. SOFR + 7.262%), 7/20/34(1)(2) | | 250 | 242,653 |
| Dryden CLO Ltd.: | | | |
| Series 2018-55A, Class D, 8.44%, (3 mo. SOFR + 3.112%), 4/15/31(1)(2) | | 1,500 | 1,468,382 |
| Series 2018-55A, Class E, 10.99%, (3 mo. SOFR + 5.662%), 4/15/31(1)(2) | | 2,000 | 1,871,134 |
| Security | Principal
Amount
(000's omitted) | Value |
| Dryden Senior Loan Fund: | | | |
| Series 2015-41A, Class DR, 8.19%, (3 mo. SOFR + 2.862%), 4/15/31(1)(2) | $ | 7,000 | $ 6,833,246 |
| Series 2015-41A, Class ER, 10.89%, (3 mo. SOFR + 5.562%), 4/15/31(1)(2) | | 1,268 | 1,164,014 |
| Series 2016-42A, Class DR, 8.52%, (3 mo. SOFR + 3.192%), 7/15/30(1)(2) | | 2,500 | 2,487,422 |
| Series 2016-42A, Class ER, 11.14%, (3 mo. SOFR + 5.812%), 7/15/30(1)(2) | | 3,500 | 3,311,444 |
| Elmwood CLO 17 Ltd., Series 2022-4A, Class E, 12.467%, (3 mo. SOFR + 7.15%), 7/17/35(1)(2) | | 2,000 | 2,015,158 |
| Empower CLO Ltd., Series 2023-2A, Class D, 10.729%, (3 mo. SOFR + 5.40%), 7/15/36(1)(2) | | 2,000 | 2,055,234 |
| Galaxy XIX CLO Ltd., Series 2015-19A, Class D1R, 12.115%, (3 mo. SOFR + 6.792%), 7/24/30(1)(2) | | 2,000 | 1,951,766 |
| Golub Capital Partners 48 LP, Series 2020-48A, Class D, 9.379%, (3 mo. SOFR + 4.062%), 4/17/33(1)(2) | | 2,000 | 2,003,958 |
| Golub Capital Partners CLO 53B Ltd., Series 2021-53A, Class E, 12.286%, (3 mo. SOFR + 6.962%), 7/20/34(1)(2) | | 1,250 | 1,253,823 |
| Golub Capital Partners CLO 58B Ltd., Series 2021-58A, Class E, 12.395%, (3 mo. SOFR + 7.072%), 1/25/35(1)(2) | | 2,500 | 2,507,357 |
| HalseyPoint CLO 5 Ltd., Series 2021-5A, Class E, 12.531%, (3 mo. SOFR + 7.202%), 1/30/35(1)(2) | | 2,000 | 1,960,532 |
| Harriman Park CLO Ltd., Series 2020-1A, Class ER, 11.986%, (3 mo. SOFR + 6.662%), 4/20/34(1)(2) | | 1,000 | 1,004,415 |
| ICG U.S. CLO Ltd.: | | | |
| Series 2018-2A, Class D, 8.686%, (3 mo. SOFR + 3.362%), 7/22/31(1)(2) | | 2,000 | 1,992,268 |
| Series 2018-2A, Class E, 11.336%, (3 mo. SOFR + 6.012%), 7/22/31(1)(2) | | 3,000 | 2,727,978 |
| Madison Park Funding LIX Ltd., Series 2021-59A, Class E, 12.189%, (3 mo. SOFR + 6.862%), 1/18/34(1)(2) | | 1,550 | 1,554,915 |
| Madison Park Funding XXXVI Ltd., Series 2019-36A, Class ER, 12.379%, (3 mo. SOFR + 7.05%), 4/15/35(1)(2) | | 2,500 | 2,508,510 |
| Madison Park Funding XXXVII Ltd., Series 2019-37A, Class ER2, 11.922%, (3 mo. SOFR + 6.60%), 4/15/37(1)(2) | | 750 | 754,146 |
| Marble Point CLO XXIV Ltd., Series 2022-1A, Class D1, 9.565%, (3 mo. SOFR + 4.24%), 4/20/35(1)(2) | | 2,000 | 1,951,146 |
| Neuberger Berman CLO XVIII Ltd., Series 2014-18A, Class DR2, 11.506%, (3 mo. SOFR + 6.182%), 10/21/30(1)(2) | | 2,000 | 2,006,908 |
20
See Notes to Financial Statements.
Senior Debt Portfolio
April 30, 2024
Portfolio of Investments (Unaudited) — continued
| Security | Principal
Amount
(000's omitted) | Value |
| Neuberger Berman CLO XXII Ltd.: | | | |
| Series 2016-22A, Class DR, 8.679%, (3 mo. SOFR + 3.362%), 10/17/30(1)(2) | $ | 2,500 | $ 2,504,072 |
| Series 2016-22A, Class ER, 11.639%, (3 mo. SOFR + 6.322%), 10/17/30(1)(2) | | 3,000 | 3,008,283 |
| Neuberger Berman Loan Advisers CLO 28 Ltd., Series 2018-28A, Class E, 11.186%, (3 mo. SOFR + 5.862%), 4/20/30(1)(2) | | 1,950 | 1,955,552 |
| Neuberger Berman Loan Advisers CLO Ltd., Series 2022-48A, Class E, 11.824%, (3 mo. SOFR + 6.50%), 4/25/36(1)(2) | | 2,600 | 2,607,168 |
| OCP CLO Ltd.: | | | |
| Series 2022-24A, Class D, 9.125%, (3 mo. SOFR + 3.80%), 7/20/35(1)(2) | | 500 | 500,819 |
| Series 2022-24A, Class E, 12.745%, (3 mo. SOFR + 7.42%), 7/20/35(1)(2) | | 1,000 | 1,002,958 |
| Palmer Square CLO Ltd.: | | | |
| Series 2013-2A, Class DRR, 11.429%, (3 mo. SOFR + 6.112%), 10/17/31(1)(2) | | 1,425 | 1,428,786 |
| Series 2015-1A, Class DR4, 12.076%, (3 mo. SOFR + 6.762%), 5/21/34(1)(2) | | 2,000 | 2,005,212 |
| Series 2021-2A, Class E, 11.94%, (3 mo. SOFR + 6.612%), 7/15/34(1)(2) | | 1,000 | 1,002,878 |
| RAD CLO 5 Ltd., Series 2019-5A, Class E, 12.285%, (3 mo. SOFR + 6.962%), 7/24/32(1)(2) | | 1,250 | 1,241,879 |
| RAD CLO 11 Ltd., Series 2021-11A, Class E, 11.84%, (3 mo. SOFR + 6.512%), 4/15/34(1)(2) | | 750 | 753,678 |
| RAD CLO 14 Ltd., Series 2021-14A, Class E, 12.09%, (3 mo. SOFR + 6.762%), 1/15/35(1)(2) | | 1,050 | 1,053,019 |
| Regatta XIII Funding Ltd.: | | | |
| Series 2018-2A, Class C, 8.69%, (3 mo. SOFR + 3.362%), 7/15/31(1)(2) | | 2,500 | 2,504,845 |
| Series 2018-2A, Class D, 11.54%, (3 mo. SOFR + 6.212%), 7/15/31(1)(2) | | 5,000 | 4,695,815 |
| Regatta XIV Funding Ltd.: | | | |
| Series 2018-3A, Class D, 8.785%, (3 mo. SOFR + 3.462%), 10/25/31(1)(2) | | 2,500 | 2,505,320 |
| Series 2018-3A, Class E, 11.535%, (3 mo. SOFR + 6.212%), 10/25/31(1)(2) | | 2,000 | 1,972,744 |
| Regatta XV Funding Ltd., Series 2018-4A, Class D, 12.085%, (3 mo. SOFR + 6.762%), 10/25/31(1)(2) | | 2,875 | 2,852,443 |
| Upland CLO Ltd.: | | | |
| Series 2016-1A, Class CR, 8.486%, (3 mo. SOFR + 3.162%), 4/20/31(1)(2) | | 4,500 | 4,505,679 |
| Series 2016-1A, Class DR, 11.486%, (3 mo. SOFR + 6.162%), 4/20/31(1)(2) | | 2,125 | 2,099,173 |
| Vibrant CLO IX, Ltd.: | | | |
| Series 2018-9A, Class C, 8.786%, (3 mo. SOFR + 3.462%), 7/20/31(1)(2) | | 2,500 | 2,493,255 |
| Security | Principal
Amount
(000's omitted) | Value |
| Vibrant CLO IX, Ltd.: (continued) | | | |
| Series 2018-9A, Class D, 11.836%, (3 mo. SOFR + 6.512%), 7/20/31(1)(2) | $ | 3,500 | $ 3,295,351 |
| Voya CLO Ltd.: | | | |
| Series 2014-1A, Class DR2, 11.589%, (3 mo. SOFR + 6.262%), 4/18/31(1)(2) | | 3,250 | 3,115,027 |
| Series 2015-3A, Class CR, 8.736%, (3 mo. SOFR + 3.412%), 10/20/31(1)(2) | | 2,500 | 2,433,613 |
| Series 2015-3A, Class DR, 11.786%, (3 mo. SOFR + 6.462%), 10/20/31(1)(2) | | 5,500 | 4,921,092 |
| Series 2016-3A, Class CR, 8.839%, (3 mo. SOFR + 3.512%), 10/18/31(1)(2) | | 2,000 | 1,969,078 |
| Series 2016-3A, Class DR, 11.669%, (3 mo. SOFR + 6.342%), 10/18/31(1)(2) | | 2,375 | 2,322,622 |
| Webster Park CLO Ltd.: | | | |
| Series 2015-1A, Class CR, 8.486%, (3 mo. SOFR + 3.162%), 7/20/30(1)(2) | | 2,000 | 2,002,116 |
| Series 2015-1A, Class DR, 11.086%, (3 mo. SOFR + 5.762%), 7/20/30(1)(2) | | 2,500 | 2,469,478 |
| Wellfleet CLO Ltd.: | | | |
| Series 2021-3A, Class E, 12.69%, (3 mo. SOFR + 7.362%), 1/15/35(1)(2) | | 1,050 | 993,526 |
| Series 2022-1A, Class D, 9.469%, (3 mo. SOFR + 4.14%), 4/15/34(1)(2) | | 1,000 | 996,488 |
| Series 2022-1A, Class E, 13.189%, (3 mo. SOFR + 7.86%), 4/15/34(1)(2) | | 2,300 | 2,296,877 |
| Series 2022-2A, Class E, 13.887%, (3 mo. SOFR + 8.56%), 10/18/35(1)(2) | | 1,000 | 1,018,706 |
Total Asset-Backed Securities
(identified cost $273,476,171) | | | $ 270,028,964 |
| Security | Shares | Value |
| Aerospace and Defense — 0.0% |
| IAP Worldwide Services LLC(3)(4)(5) | | 168 | $ 0 |
| | | | $ 0 |
| Chemicals — 0.0% |
| Flint Campfire Topco Ltd., Class A(3)(4)(5) | | 4,095,976 | $ 0 |
| | | | $ 0 |
| Commercial Services & Supplies — 0.1% |
| Monitronics International, Inc.(4)(5) | | 199,603 | $ 4,191,663 |
| Phoenix Services International LLC(4)(5) | | 291,132 | 1,492,052 |
| Phoenix Services International LLC(4)(5) | | 26,562 | 136,130 |
| | | | $ 5,819,845 |
21
See Notes to Financial Statements.
Senior Debt Portfolio
April 30, 2024
Portfolio of Investments (Unaudited) — continued
| Security | Shares | Value |
| Containers and Glass Products — 0.0%(6) |
| LG Parent Holding Co.(4)(5) | | 342,076 | $ 1,934,850 |
| | | | $ 1,934,850 |
| Electronics/Electrical — 0.0%(6) |
| Skillsoft Corp.(4)(5) | | 50,519 | $ 363,232 |
| | | | $ 363,232 |
| Entertainment — 0.0%(6) |
| New Cineworld Ltd.(4)(5) | | 113,548 | $ 2,178,702 |
| | | | $ 2,178,702 |
| Health Care — 0.1% |
| Akorn Holding Co. LLC(3)(4)(5) | | 792,089 | $ 0 |
| Envision Parent, Inc.(4)(5) | | 953,838 | 6,736,481 |
| | | | $ 6,736,481 |
| Household Durables — 0.2% |
| Serta Simmons Bedding, Inc.(4)(5) | | 1,401,999 | $ 9,930,779 |
| Serta SSB Equipment Co.(3)(4)(5) | | 1,401,999 | 0 |
| | | | $ 9,930,779 |
| Investment Companies — 0.0%(6) |
| Aegletes BV(4)(5) | | 138,671 | $ 288,436 |
| | | | $ 288,436 |
| Nonferrous Metals/Minerals — 0.2% |
| ACNR Holdings, Inc., Class A(4)(5) | | 116,152 | $ 9,655,135 |
| | | | $ 9,655,135 |
| Oil and Gas — 0.0%(6) |
| AFG Holdings, Inc.(3)(4)(5) | | 281,241 | $ 576,544 |
| McDermott International Ltd.(4)(5) | | 1,382,889 | 348,073 |
| | | | $ 924,617 |
| Pharmaceuticals — 0.3% |
| Covis Midco 1 SARL, Class A(4)(5) | | 8,349 | $ 4,258 |
| Covis Midco 1 SARL, Class B(4)(5) | | 8,349 | 4,258 |
| Covis Midco 1 SARL, Class C(4)(5) | | 8,349 | 4,258 |
| Covis Midco 1 SARL, Class D(4)(5) | | 8,349 | 4,258 |
| Covis Midco 1 SARL, Class E(4)(5) | | 8,349 | 4,258 |
| Mallinckrodt International Finance SA(4)(5) | | 307,065 | 16,197,679 |
| | | | $ 16,218,969 |
| Retail — 0.0% |
| Jubilee Enterprise PCL, Class A1(3)(4)(5) | | 2,563 | $ 0 |
| Security | Shares | Value |
| Retail (continued) |
| Jubilee Enterprise PCL, Class A2(3)(4)(5) | | 2,048,265 | $ 0 |
| | | | $ 0 |
| Retailers (Except Food and Drug) — 0.0%(6) |
| Phillips Feed Service, Inc.(3)(4)(5) | | 2,960 | $ 4,233 |
| | | | $ 4,233 |
| Telecommunications — 0.0% |
| GEE Acquisition Holdings Corp.(3)(4)(5) | | 390,679 | $ 0 |
| | | | $ 0 |
| Utilities — 0.0%(6) |
| Longview Intermediate Holdings LLC, Class A(4)(5) | | 359,046 | $ 987,377 |
| | | | $ 987,377 |
Total Common Stocks
(identified cost $100,239,338) | | | $ 55,042,656 |
| Security | Principal
Amount*
(000's omitted) | Value |
| Aerospace and Defense — 0.3% |
| TransDigm, Inc.: | | | |
| 6.75%, 8/15/28(1) | | 3,825 | $ 3,846,034 |
| 6.875%, 12/15/30(1) | | 17,000 | 17,131,740 |
| | | | $ 20,977,774 |
| Air Transport — 0.6% |
| American Airlines, Inc./AAdvantage Loyalty IP Ltd.: | | | |
| 5.50%, 4/20/26(1) | | 11,258 | $ 11,137,671 |
| 5.75%, 4/20/29(1) | | 14,475 | 13,990,995 |
| United Airlines, Inc.: | | | |
| 4.375%, 4/15/26(1) | | 5,050 | 4,862,161 |
| 4.625%, 4/15/29(1) | | 5,050 | 4,659,329 |
| | | | $ 34,650,156 |
| Automotive — 0.2% |
| Adient Global Holdings Ltd., 7.00%, 4/15/28(1) | | 2,650 | $ 2,679,935 |
| Clarios Global LP, 6.75%, 5/15/25(1) | | 2,183 | 2,185,810 |
| Clarios Global LP/Clarios U.S. Finance Co., 6.25%, 5/15/26(1) | | 4,478 | 4,476,715 |
| | | | $ 9,342,460 |
22
See Notes to Financial Statements.
Senior Debt Portfolio
April 30, 2024
Portfolio of Investments (Unaudited) — continued
| Security | Principal
Amount*
(000's omitted) | Value |
| Building and Development — 0.1% |
| Miter Brands Acquisition Holdco, Inc./MIWD Borrower LLC, 6.75%, 4/1/32(1) | | 5,425 | $ 5,391,103 |
| Winnebago Industries, Inc., 6.25%, 7/15/28(1) | | 1,100 | 1,077,806 |
| | | | $ 6,468,909 |
| Business Equipment and Services — 0.7% |
| Allied Universal Holdco LLC/Allied Universal Finance Corp., 6.625%, 7/15/26(1) | | 1,017 | $ 1,015,343 |
| Allied Universal Holdco LLC/Allied Universal Finance Corp./Atlas Luxco 4 SARL: | | | |
| 4.625%, 6/1/28(1) | | 18,725 | 16,817,069 |
| 4.625%, 6/1/28(1) | | 25,575 | 23,000,605 |
| Prime Security Services Borrower LLC/Prime Finance, Inc., 5.75%, 4/15/26(1) | | 4,175 | 4,126,222 |
| | | | $ 44,959,239 |
| Chemicals — 0.6% |
| INEOS Finance PLC: | | | |
| 3.375%, 3/31/26(1) | EUR | 2,000 | $ 2,096,370 |
| 7.50%, 4/15/29(1) | | 10,575 | 10,637,403 |
| Olympus Water U.S. Holding Corp.: | | | |
| 4.25%, 10/1/28(1) | | 10,050 | 9,066,308 |
| 7.125%, 10/1/27(1) | | 1,075 | 1,089,797 |
| 9.75%, 11/15/28(1) | | 11,400 | 12,111,002 |
| | | | $ 35,000,880 |
| Commercial Services — 0.5% |
| Neptune Bidco U.S., Inc., 9.29%, 4/15/29(1) | | 21,600 | $ 20,408,237 |
| Wand NewCo 3, Inc., 7.625%, 1/30/32(1) | | 8,025 | 8,164,999 |
| | | | $ 28,573,236 |
| Containers & Packaging — 0.3% |
| Pactiv Evergreen Group Issuer, Inc./Pactiv Evergreen Group Issuer LLC: | | | |
| 4.00%, 10/15/27(1) | | 6,325 | $ 5,874,568 |
| 4.375%, 10/15/28(1) | | 10,100 | 9,305,424 |
| | | | $ 15,179,992 |
| Diversified Financial Services — 0.3% |
| AG Issuer LLC, 6.25%, 3/1/28(1) | | 11,581 | $ 11,222,296 |
| AG TTMT Escrow Issuer LLC, 8.625%, 9/30/27(1) | | 3,350 | 3,454,118 |
| Aretec Group, Inc., 10.00%, 8/15/30(1) | | 5,375 | 5,845,087 |
| | | | $ 20,521,501 |
| Security | Principal
Amount*
(000's omitted) | Value |
| Diversified Telecommunication Services — 0.8% |
| Altice France SA: | | | |
| 5.125%, 1/15/29(1) | | 1,600 | $ 1,046,962 |
| 5.125%, 7/15/29(1) | | 42,775 | 27,924,183 |
| 5.50%, 10/15/29(1) | | 6,455 | 4,232,994 |
| Level 3 Financing, Inc., 10.75%, 12/15/30(1) | | 11,175 | 11,252,593 |
| Virgin Media Secured Finance PLC, 4.50%, 8/15/30(1) | | 7,625 | 6,440,679 |
| | | | $ 50,897,411 |
| Drugs — 0.2% |
| Jazz Securities DAC, 4.375%, 1/15/29(1) | | 10,050 | $ 9,153,465 |
| | | | $ 9,153,465 |
| Ecological Services and Equipment — 0.1% |
| GFL Environmental, Inc., 4.25%, 6/1/25(1) | | 6,025 | $ 5,944,062 |
| | | | $ 5,944,062 |
| Electronics/Electrical — 0.3% |
| Imola Merger Corp., 4.75%, 5/15/29(1) | | 20,200 | $ 18,616,740 |
| | | | $ 18,616,740 |
| Engineering & Construction — 0.1% |
| Artera Services LLC, 8.50%, 2/15/31(1) | | 6,375 | $ 6,528,217 |
| | | | $ 6,528,217 |
| Entertainment — 0.1% |
| Caesars Entertainment, Inc., 6.50%, 2/15/32(1) | | 5,275 | $ 5,200,772 |
| Live Nation Entertainment, Inc., 3.75%, 1/15/28(1) | | 2,412 | 2,192,229 |
| Six Flags Theme Parks, Inc., 7.00%, 7/1/25(1) | | 1,208 | 1,211,535 |
| | | | $ 8,604,536 |
| Health Care — 0.8% |
| Medline Borrower LP, 3.875%, 4/1/29(1) | | 25,150 | $ 22,555,678 |
| Tenet Healthcare Corp., 4.25%, 6/1/29 | | 25,375 | 23,265,219 |
| | | | $ 45,820,897 |
| Hotels, Restaurants & Leisure — 0.6% |
| Carnival Corp., 4.00%, 8/1/28(1) | | 37,975 | $ 34,746,956 |
| SeaWorld Parks & Entertainment, Inc., 8.75%, 5/1/25(1) | | 2,425 | 2,425,000 |
| | | | $ 37,171,956 |
23
See Notes to Financial Statements.
Senior Debt Portfolio
April 30, 2024
Portfolio of Investments (Unaudited) — continued
| Security | Principal
Amount*
(000's omitted) | Value |
| Household Products — 0.3% |
| Kronos Acquisition Holdings, Inc./KIK Custom Products, Inc., 5.00%, 12/31/26(1) | | 16,969 | $ 16,412,113 |
| | | | $ 16,412,113 |
| Insurance — 0.9% |
| Alliant Holdings Intermediate LLC/Alliant Holdings Co-Issuer: | | | |
| 4.25%, 10/15/27(1) | | 700 | $ 653,525 |
| 7.00%, 1/15/31(1) | | 3,500 | 3,513,412 |
| AmWINS Group, Inc., 6.375%, 2/15/29(1) | | 12,350 | 12,208,189 |
| Panther Escrow Issuer LLC, 7.125%, 6/1/31(1) | | 36,525 | 36,737,801 |
| | | | $ 53,112,927 |
| Internet Software & Services — 0.3% |
| Central Parent, Inc./CDK Global, Inc., 7.25%, 6/15/29(1) | | 15,225 | $ 15,402,067 |
| | | | $ 15,402,067 |
| Leisure Goods/Activities/Movies — 0.4% |
| Lindblad Expeditions LLC, 6.75%, 2/15/27(1) | | 3,475 | $ 3,445,350 |
| NCL Corp. Ltd., 5.875%, 2/15/27(1) | | 22,375 | 21,873,675 |
| | | | $ 25,319,025 |
| Machinery — 0.3% |
| Madison IAQ LLC, 4.125%, 6/30/28(1) | | 12,300 | $ 11,421,043 |
| TK Elevator U.S. Newco, Inc., 5.25%, 7/15/27(1) | | 4,950 | 4,740,261 |
| | | | $ 16,161,304 |
| Media — 0.3% |
| iHeartCommunications, Inc.: | | | |
| 4.75%, 1/15/28(1) | | 2,975 | $ 2,127,008 |
| 5.25%, 8/15/27(1) | | 2,500 | 1,836,412 |
| 6.375%, 5/1/26 | | 1,159 | 980,893 |
| Univision Communications, Inc.: | | | |
| 4.50%, 5/1/29(1) | | 10,075 | 8,773,377 |
| 7.375%, 6/30/30(1) | | 5,833 | 5,589,973 |
| | | | $ 19,307,663 |
| Oil, Gas & Consumable Fuels — 0.2% |
| CITGO Petroleum Corp., 7.00%, 6/15/25(1) | | 12,175 | $ 12,171,588 |
| | | | $ 12,171,588 |
| Security | Principal
Amount*
(000's omitted) | Value |
| Professional Services — 0.1% |
| CoreLogic, Inc., 4.50%, 5/1/28(1) | | 6,000 | $ 5,196,701 |
| | | | $ 5,196,701 |
| Real Estate Investment Trusts (REITs) — 0.3% |
| Cushman & Wakefield U.S. Borrower LLC, 6.75%, 5/15/28(1) | | 7,493 | $ 7,393,872 |
| Park Intermediate Holdings LLC/PK Domestic Property LLC/PK Finance Co-Issuer, 5.875%, 10/1/28(1) | | 7,925 | 7,702,981 |
| | | | $ 15,096,853 |
| Retail — 0.1% |
| Fertitta Entertainment LLC/Fertitta Entertainment Finance Co., Inc., 4.625%, 1/15/29(1) | | 6,790 | $ 6,147,953 |
| | | | $ 6,147,953 |
| Retailers (Except Food and Drug) — 0.0%(6) |
| PetSmart, Inc./PetSmart Finance Corp., 4.75%, 2/15/28(1) | | 1,575 | $ 1,455,132 |
| | | | $ 1,455,132 |
| Software — 0.7% |
| Boxer Parent Co., Inc., 7.125%, 10/2/25(1) | | 4,850 | $ 4,858,884 |
| Cloud Software Group, Inc., 9.00%, 9/30/29(1) | | 12,100 | 11,652,182 |
| GoTo Group, Inc.: | | | |
| 5.50%, 5/1/28(1) | | 5,405 | 4,624,631 |
| 5.50%, 5/1/28(1) | | 5,405 | 3,628,111 |
| UKG, Inc., 6.875%, 2/1/31(1) | | 10,525 | 10,551,688 |
| Veritas U.S., Inc./Veritas Bermuda Ltd., 7.50%, 9/1/25(1) | | 6,850 | 6,237,908 |
| | | | $ 41,553,404 |
| Technology — 0.3% |
| Clarivate Science Holdings Corp., 3.875%, 7/1/28(1) | | 12,575 | $ 11,462,107 |
| NCR Atleos Corp., 9.50%, 4/1/29(1) | | 8,700 | 9,256,004 |
| | | | $ 20,718,111 |
| Telecommunications — 0.3% |
| LCPR Senior Secured Financing DAC, 5.125%, 7/15/29(1) | | 10,450 | $ 8,738,090 |
| VMED O2 U.K. Financing I PLC, 4.25%, 1/31/31(1) | | 10,575 | 8,648,231 |
| | | | $ 17,386,321 |
24
See Notes to Financial Statements.
Senior Debt Portfolio
April 30, 2024
Portfolio of Investments (Unaudited) — continued
| Security | Principal
Amount*
(000's omitted) | Value |
| Wireless Telecommunication Services — 0.1% |
| Digicel Intermediate Holdings Ltd./Digicel International Finance Ltd./DIFL U.S., 10.50%, (9.00% cash, 1.50% PIK), 5/25/27 | | 7,252 | $ 7,040,050 |
| | | | $ 7,040,050 |
Total Corporate Bonds
(identified cost $714,277,209) | | | $ 670,892,643 |
| Exchange-Traded Funds — 0.3% |
| Security | Shares | Value |
| SPDR Blackstone Senior Loan ETF | | 384,000 | $ 16,120,320 |
Total Exchange-Traded Funds
(identified cost $17,625,066) | | | $ 16,120,320 |
| Senior Floating-Rate Loans — 105.0%(7) |
| Borrower/Description | Principal
Amount*
(000's omitted) | Value |
| Aerospace and Defense — 2.0% |
| Aernnova Aerospace SAU: | | | |
| Term Loan, 6.902%, (6 mo. EURIBOR + 3.00%), 2/26/27 | EUR | 1,071 | $ 1,138,665 |
| Term Loan, 6.952%, (3 mo. EURIBOR + 3.00%), 2/26/27 | EUR | 4,179 | 4,440,792 |
| Dynasty Acquisition Co., Inc.: | | | |
| Term Loan, 8.816%, (SOFR + 3.50%), 8/24/28 | | 38,302 | 38,525,360 |
| Term Loan, 8.816%, (SOFR + 3.50%), 8/24/28 | | 14,768 | 14,854,388 |
| IAP Worldwide Services, Inc., Term Loan - Second Lien, 12.152%, (3 mo. USD LIBOR + 6.50%), 7/18/23(3) | | 1,184 | 940,953 |
| TransDigm, Inc.: | | | |
| Term Loan, 8.059%, (SOFR + 2.75%), 8/24/28 | | 30,892 | 31,086,468 |
| Term Loan, 8.059%, (SOFR + 2.75%), 2/22/30 | | 29,371 | 29,535,017 |
| | | | $ 120,521,643 |
| Airlines — 0.5% |
| American Airlines, Inc., Term Loan, 10.336%, (SOFR + 4.75%), 4/20/28 | | 28,800 | $ 29,992,896 |
| | | | $ 29,992,896 |
| Apparel & Luxury Goods — 0.7% |
| Gloves Buyer, Inc., Term Loan, 9.43%, (SOFR + 4.00%), 12/29/27 | | 18,167 | $ 18,212,336 |
| Borrower/Description | Principal
Amount*
(000's omitted) | Value |
| Apparel & Luxury Goods (continued) |
| Hanesbrands, Inc., Term Loan, 9.066%, (SOFR + 3.75%), 3/8/30 | | 5,420 | $ 5,433,801 |
| Touchdown Acquirer, Inc.: | | | |
| Term Loan, 0.00%, 2/21/31(8) | | 2,174 | 2,185,729 |
| Term Loan, 7.929%, (3 mo. EURIBOR + 4.00%), 2/21/31 | EUR | 5,175 | 5,527,363 |
| Term Loan, 9.314%, (SOFR + 4.00%), 2/21/31 | | 10,001 | 10,057,756 |
| | | | $ 41,416,985 |
| Auto Components — 2.3% |
| Adient U.S. LLC, Term Loan, 8.066%, (SOFR + 2.75%), 1/31/31 | | 9,238 | $ 9,288,836 |
| Autokiniton U.S. Holdings, Inc., Term Loan, 9.43%, (SOFR + 4.00%), 4/6/28 | | 22,776 | 22,914,287 |
| Clarios Global LP, Term Loan, 7.098%, (1 mo. EURIBOR + 3.25%), 4/30/26 | EUR | 21,261 | 22,752,691 |
| DexKo Global, Inc.: | | | |
| Term Loan, 7.902%, (3 mo. EURIBOR + 4.00%), 10/4/28 | EUR | 3,604 | 3,805,958 |
| Term Loan, 7.902%, (3 mo. EURIBOR + 4.00%), 10/4/28 | EUR | 8,046 | 8,496,383 |
| Term Loan, 9.321%, (SOFR + 3.75%), 10/4/28 | | 14,186 | 14,103,295 |
| Garrett LX I SARL, Term Loan, 8.841%, (SOFR + 3.25%), 4/30/28 | | 6,240 | 6,257,547 |
| Garrett Motion, Inc., Term Loan, 9.83%, (SOFR + 4.50%), 4/30/28 | | 7,543 | 7,580,571 |
| LSF12 Badger Bidco LLC, Term Loan, 11.316%, (SOFR + 6.00%), 8/30/30 | | 3,990 | 4,014,938 |
| LTI Holdings, Inc.: | | | |
| Term Loan, 8.93%, (SOFR + 3.50%), 9/6/25 | | 8,030 | 7,961,019 |
| Term Loan, 10.18%, (SOFR + 4.75%), 7/24/26 | | 8,562 | 8,481,537 |
| RealTruck Group, Inc.: | | | |
| Term Loan, 8.93%, (SOFR + 3.50%), 1/31/28 | | 13,839 | 13,758,620 |
| Term Loan, 10.43%, (SOFR + 5.00%), 1/31/28 | | 8,950 | 8,923,893 |
| | | | $ 138,339,575 |
| Automobiles — 0.9% |
| Bombardier Recreational Products, Inc., Term Loan, 8.066%, (SOFR + 2.75%), 1/22/31 | | 35,009 | $ 35,063,786 |
| MajorDrive Holdings IV LLC: | | | |
| Term Loan, 9.571%, (SOFR + 4.00%), 6/1/28 | | 20,258 | 20,371,490 |
| Term Loan, 10.959%, (SOFR + 5.50%), 6/1/29 | | 1,489 | 1,500,702 |
| | | | $ 56,935,978 |
| Beverages — 0.9% |
| Arterra Wines Canada, Inc., Term Loan, 9.071%, (SOFR + 3.50%), 11/24/27 | | 3,387 | $ 3,119,884 |
25
See Notes to Financial Statements.
Senior Debt Portfolio
April 30, 2024
Portfolio of Investments (Unaudited) — continued
| Borrower/Description | Principal
Amount*
(000's omitted) | Value |
| Beverages (continued) |
| City Brewing Co. LLC: | | | |
| Term Loan, 9.09%, (SOFR + 3.50%), 4/5/28 | | 10,800 | $ 9,935,547 |
| Term Loan, 11.574%, (SOFR + 6.25%), 4/5/28 | | 7,190 | 7,172,507 |
| Term Loan - Second Lien, 10.59%, (SOFR + 3.50%), 9.09% cash, 1.50% PIK, 4/5/28 | | 10,800 | 7,883,641 |
| Triton Water Holdings, Inc., Term Loan, 8.814%, (SOFR + 3.25%), 3/31/28 | | 25,385 | 25,305,672 |
| | | | $ 53,417,251 |
| Biotechnology — 0.5% |
| Alkermes, Inc., Term Loan, 7.93%, (SOFR + 2.50%), 3/12/26 | | 12,637 | $ 12,700,243 |
| Alltech, Inc., Term Loan, 9.43%, (SOFR + 4.00%), 10/13/28 | | 6,807 | 6,773,165 |
| Grifols Worldwide Operations USA, Inc., Term Loan, 7.459%, (SOFR + 2.00%), 11/15/27 | | 9,220 | 9,032,034 |
| | | | $ 28,505,442 |
| Building Products — 1.1% |
| Cornerstone Building Brands, Inc., Term Loan, 8.671%, (SOFR + 3.25%), 4/12/28 | | 17,875 | $ 17,554,957 |
| CPG International, Inc., Term Loan, 7.916%, (SOFR + 2.50%), 4/28/29 | | 12,731 | 12,767,414 |
| LHS Borrower LLC, Term Loan, 10.166%, (SOFR + 4.75%), 2/16/29 | | 6,662 | 6,442,475 |
| MI Windows and Doors LLC, Term Loan, 8.816%, (SOFR + 3.50%), 3/28/31 | | 16,650 | 16,745,738 |
| Standard Industries, Inc., Term Loan, 7.68%, (SOFR + 2.25%), 9/22/28 | | 12,924 | 12,970,798 |
| | | | $ 66,481,382 |
| Capital Markets — 5.9% |
| Advisor Group, Inc., Term Loan, 9.816%, (SOFR + 4.50%), 8/17/28 | | 31,401 | $ 31,610,810 |
| AllSpring Buyer LLC, Term Loan, 8.677%, (SOFR + 3.25%), 11/1/28 | | 8,188 | 8,174,093 |
| Aretec Group, Inc., Term Loan, 9.916%, (SOFR + 4.50%), 8/9/30 | | 36,230 | 36,452,364 |
| Brookfield Property REIT, Inc., Term Loan, 7.816%, (SOFR + 2.50%), 8/27/25 | | 5,125 | 5,116,936 |
| CeramTec AcquiCo GmbH, Term Loan, 7.452%, (3 mo. EURIBOR + 3.50%), 3/16/29 | EUR | 14,461 | 15,413,971 |
| Citco Funding LLC, Term Loan, 8.422%, (SOFR + 3.25%), 4/27/28 | | 10,373 | 10,422,582 |
| Clipper Acquisitions Corp., Term Loan, 7.188%, (SOFR + 1.75%), 3/3/28 | | 6,802 | 6,785,375 |
| Borrower/Description | Principal
Amount*
(000's omitted) | Value |
| Capital Markets (continued) |
| Edelman Financial Center LLC: | | | |
| Term Loan, 8.93%, (SOFR + 3.50%), 4/7/28 | | 22,169 | $ 22,204,358 |
| Term Loan - Second Lien, 7/20/26(9) | | 7,446 | 7,489,628 |
| EIG Management Co. LLC, Term Loan, 9.166%, (SOFR + 3.75%), 2/22/25 | | 2,656 | 2,653,840 |
| FinCo I LLC, Term Loan, 8.33%, (SOFR + 3.00%), 6/27/29 | | 16,203 | 16,268,377 |
| Focus Financial Partners LLC: | | | |
| Term Loan, 7.816%, (SOFR + 2.50%), 6/30/28 | | 10,775 | 10,776,242 |
| Term Loan, 8.066%, (SOFR + 2.75%), 6/30/28 | | 42,236 | 42,279,658 |
| Franklin Square Holdings LP, Term Loan, 7.568%, (SOFR + 2.25%), 4/25/31 | | 13,200 | 13,208,250 |
| Guggenheim Partners LLC, Term Loan, 8.552%, (SOFR + 3.25%), 12/12/29 | | 32,190 | 32,394,542 |
| HighTower Holdings LLC, Term Loan, 9.586%, (SOFR + 4.00%), 4/21/28 | | 12,723 | 12,802,820 |
| Kestra Advisor Services Holdings A, Inc., Term Loan, 9.316%, (SOFR + 4.00%), 3/22/31 | | 8,400 | 8,451,190 |
| LPL Holdings, Inc., Term Loan, 7.179%, (SOFR + 1.75%), 11/12/26 | | 19,054 | 19,086,008 |
| Mariner Wealth Advisors LLC, Term Loan, 8.68%, (SOFR + 3.25%), 8/18/28 | | 14,997 | 15,016,225 |
| Press Ganey Holdings, Inc., Term Loan, 4/24/31(9) | | 8,325 | 8,309,391 |
| Victory Capital Holdings, Inc.: | | | |
| Term Loan, 7.652%, (SOFR + 2.25%), 7/1/26 | | 17,800 | 17,844,186 |
| Term Loan, 7.652%, (SOFR + 2.25%), 12/29/28 | | 8,463 | 8,468,542 |
| | | | $ 351,229,388 |
| Chemicals — 5.3% |
| Axalta Coating Systems U.S. Holdings, Inc., Term Loan, 7.33%, (SOFR + 2.00%), 12/20/29 | | 19,714 | $ 19,789,344 |
| CPC Acquisition Corp., Term Loan, 9.321%, (SOFR + 3.75%), 12/29/27 | | 17,474 | 14,831,131 |
| ECO Services Operations Corp., Term Loan, 7.93%, (SOFR + 2.50%), 6/9/28 | | 25,075 | 25,092,127 |
| Flint Group Midco Ltd., Term Loan, 10.588%, (SOFR + 5.262%), 9.838% cash, 0.75% PIK, 12/31/26 | | 5,792 | 5,548,595 |
| Flint Group Packaging INKS North America Holdings LLC: | | | |
| Term Loan, 8.892%, (3 mo. EURIBOR + 5.00%), 8.142% cash, 0.75% PIK, 12/31/26 | EUR | 1,288 | 1,316,471 |
| Term Loan, 10.892%, (3 mo. EURIBOR + 7.00%), 3.992% cash, 6.90% PIK, 12/30/27 | EUR | 658 | 580,669 |
26
See Notes to Financial Statements.
Senior Debt Portfolio
April 30, 2024
Portfolio of Investments (Unaudited) — continued
| Borrower/Description | Principal
Amount*
(000's omitted) | Value |
| Chemicals (continued) |
| Flint Group Packaging INKS North America Holdings LLC: (continued) | | | |
| Term Loan - Second Lien, 10.892%, (3 mo. EURIBOR + 7.00%), 3.992% cash, 6.90% PIK, 12/30/27 | EUR | 877 | $ 145,981 |
| Flint Group Topco Ltd.: | | | |
| Term Loan, 12.588%, (SOFR + 7.262%), 5.688% cash, 6.90% PIK, 12/31/27 | | 2,996 | 2,478,951 |
| Term Loan - Second Lien, 12.588%, (SOFR + 7.262%), 5.688% cash, 6.90% PIK, 12/31/27 | | 3,927 | 612,673 |
| Gemini HDPE LLC, Term Loan, 8.591%, (SOFR + 3.00%), 12/31/27 | | 5,542 | 5,552,104 |
| GEON Performance Solutions LLC, Term Loan, 10.314%, (SOFR + 4.75%), 8/18/28 | | 7,581 | 7,614,511 |
| Groupe Solmax, Inc., Term Loan, 10.252%, (SOFR + 4.75%), 5/29/28(10) | | 19,772 | 19,512,478 |
| INEOS Enterprises Holdings II Ltd., Term Loan, 7.952%, (3 mo. EURIBOR + 4.00%), 7/7/30 | EUR | 2,325 | 2,490,546 |
| INEOS Enterprises Holdings U.S. Finco LLC, Term Loan, 9.193%, (SOFR + 3.75%), 7/8/30 | | 13,965 | 14,017,369 |
| INEOS Finance PLC: | | | |
| Term Loan, 6.598%, (1 mo. EURIBOR + 2.75%), 11/8/28 | EUR | 9,675 | 10,283,865 |
| Term Loan, 7.848%, (1 mo. EURIBOR + 4.00%), 11/8/27 | EUR | 7,846 | 8,401,952 |
| INEOS Quattro Holdings U.K. Ltd.: | | | |
| Term Loan, 6.598%, (1 mo. EURIBOR + 2.75%), 1/29/26 | EUR | 2,537 | 2,710,628 |
| Term Loan, 7.848%, (1 mo. EURIBOR + 4.00%), 3/14/30 | EUR | 4,075 | 4,317,778 |
| Term Loan, 9.18%, (SOFR + 3.75%), 3/14/30 | | 6,079 | 6,075,263 |
| INEOS U.S. Finance LLC: | | | |
| Term Loan, 7.916%, (SOFR + 2.50%), 11/8/28 | | 6,733 | 6,730,044 |
| Term Loan, 8.916%, (SOFR + 3.50%), 2/18/30 | | 11,066 | 11,100,957 |
| Term Loan, 9.066%, (SOFR + 3.75%), 2/7/31 | | 7,100 | 7,131,063 |
| Term Loan, 9.166%, (SOFR + 3.75%), 11/8/27 | | 3,405 | 3,415,273 |
| Kraton Corp., Term Loan, 8.841%, (SOFR + 3.25%), 3/15/29 | | 6,101 | 5,869,828 |
| Kraton Polymers Holdings BV, Term Loan, 7.188%, (3 mo. EURIBOR + 3.25%), 3/15/29 | EUR | 4,650 | 4,808,953 |
| Lonza Group AG: | | | |
| Term Loan, 7.827%, (3 mo. EURIBOR + 3.93%), 7/3/28 | EUR | 9,600 | 9,590,165 |
| Term Loan, 9.334%, (SOFR + 3.93%), 7/3/28 | | 14,647 | 14,074,037 |
| Momentive Performance Materials, Inc., Term Loan, 9.817%, (SOFR + 4.50%), 3/29/28 | | 16,041 | 15,970,425 |
| Olympus Water U.S. Holding Corp.: | | | |
| Term Loan, 9.321%, (SOFR + 3.75%), 11/9/28 | | 4,416 | 4,430,426 |
| Term Loan, 9.576%, (SOFR + 4.25%), 11/9/28 | | 5,831 | 5,858,854 |
| Borrower/Description | Principal
Amount*
(000's omitted) | Value |
| Chemicals (continued) |
| Orion Engineered Carbons GmbH, Term Loan, 6.302%, (3 mo. EURIBOR + 2.40%), 9/24/28 | EUR | 1,250 | $ 1,318,159 |
| Rohm Holding GmbH: | | | |
| Term Loan, 8.366%, (6 mo. EURIBOR + 4.50%), 7/31/26 | EUR | 1,000 | 1,011,840 |
| Term Loan, 8.366%, (6 mo. EURIBOR + 4.50%), 7/31/26 | EUR | 13,700 | 13,862,201 |
| Term Loan, 10.581%, (SOFR + 5.00%), 7/31/26 | | 17,260 | 16,310,317 |
| SCUR-Alpha 1503 GmbH, Term Loan, 10.83%, (SOFR + 5.50%), 3/29/30 | | 10,771 | 9,990,458 |
| Tronox Finance LLC: | | | |
| Term Loan, 8.041%, (SOFR + 2.50%), 3/10/28(10) | | 12,836 | 12,850,864 |
| Term Loan, 8.552%, (SOFR + 3.25%), 4/4/29 | | 3,896 | 3,907,066 |
| Term Loan, 8.816%, (SOFR + 3.50%), 8/16/28 | | 6,409 | 6,430,299 |
| Term Loan, 4/4/29(9) | | 1,359 | 1,362,611 |
| W.R. Grace & Co.-Conn., Term Loan, 9.321%, (SOFR + 3.75%), 9/22/28 | | 12,903 | 12,940,517 |
| | | | $ 320,336,793 |
| Commercial Services & Supplies — 2.0% |
| Albion Financing 3 SARL: | | | |
| Term Loan, 10.575%, (SOFR + 5.25%), 8/17/26 | | 19,892 | $ 20,028,883 |
| Term Loan, 10.824%, (SOFR + 5.50%), 8/17/26 | | 4,232 | 4,258,702 |
| Belfor Holdings, Inc., Term Loan, 9.066%, (SOFR + 3.75%), 11/1/30 | | 7,913 | 7,947,491 |
| EnergySolutions LLC, Term Loan, 9.316%, (SOFR + 4.00%), 9/20/30 | | 17,161 | 17,252,275 |
| Foundever Group, Term Loan, 7.60%, (1 mo. EURIBOR + 3.75%), 8/28/28 | EUR | 4,575 | 4,005,126 |
| Foundever Worldwide Corp., Term Loan, 9.18%, (SOFR + 3.75%), 8/28/28 | | 15,834 | 12,319,591 |
| GFL Environmental, Inc., Term Loan, 7.826%, (SOFR + 2.50%), 5/31/27 | | 4,300 | 4,324,114 |
| Harsco Corp., Term Loan, 7.68%, (SOFR + 2.25%), 3/10/28 | | 1,294 | 1,293,074 |
| Heritage-Crystal Clean, Inc., Term Loan, 9.816%, (SOFR + 4.50%), 10/17/30 | | 9,352 | 9,388,090 |
| LABL, Inc., Term Loan, 10.416%, (SOFR + 5.00%), 10/29/28 | | 9,311 | 9,134,175 |
| Monitronics International, Inc., Term Loan, 13.091%, (SOFR + 7.50%), 6/30/28 | | 10,946 | 10,931,920 |
| Phoenix Services International LLC, Term Loan, 11.418%, (SOFR + 6.10%), 6/30/28 | | 3,554 | 3,323,182 |
| Tempo Acquisition LLC, Term Loan, 8.066%, (SOFR + 2.75%), 8/31/28 | | 4,178 | 4,194,686 |
27
See Notes to Financial Statements.
Senior Debt Portfolio
April 30, 2024
Portfolio of Investments (Unaudited) — continued
| Borrower/Description | Principal
Amount*
(000's omitted) | Value |
| Commercial Services & Supplies (continued) |
| TMF Group Holding BV, Term Loan, 9.306%, (SOFR + 4.00%), 5/3/28 | | 5,162 | $ 5,187,873 |
| TruGreen LP, Term Loan, 9.416%, (SOFR + 4.00%), 11/2/27 | | 9,285 | 8,944,153 |
| | | | $ 122,533,335 |
| Construction Materials — 0.4% |
| Quikrete Holdings, Inc.: | | | |
| Term Loan, 7.569%, (SOFR + 2.25%), 3/19/29 | | 13,385 | $ 13,404,910 |
| Term Loan, 7.819%, (SOFR + 2.50%), 4/14/31 | | 8,309 | 8,325,204 |
| U.S. Silica Co., Term Loan, 9.316%, (SOFR + 4.00%), 3/25/30 | | 4,314 | 4,322,188 |
| | | | $ 26,052,302 |
| Consumer Staples Distribution & Retail — 0.5% |
| Cardenas Markets, Inc., Term Loan, 12.159%, (SOFR + 6.75%), 8/1/29 | | 5,346 | $ 5,382,005 |
| Peer Holding III BV: | | | |
| Term Loan, 7.652%, (3 mo. EURIBOR + 3.75%), 9/29/28 | EUR | 7,550 | 8,099,665 |
| Term Loan, 8.559%, (SOFR + 3.25%), 10/28/30 | | 14,625 | 14,695,083 |
| | | | $ 28,176,753 |
| Containers & Packaging — 1.9% |
| Berlin Packaging LLC, Term Loan, 9.197%, (SOFR + 3.75%), 3/11/28(10) | | 9,631 | $ 9,649,490 |
| Clydesdale Acquisition Holdings, Inc., Term Loan, 9.091%, (SOFR + 3.68%), 4/13/29 | | 22,564 | 22,683,160 |
| Kouti BV: | | | |
| Term Loan, 7.127%, (3 mo. EURIBOR + 3.18%), 8/31/28 | EUR | 32,750 | 34,623,154 |
| Term Loan, 7.93%, (3 mo. EURIBOR + 4.00%), 8/31/28 | EUR | 2,000 | 2,141,071 |
| Pregis TopCo Corp.: | | | |
| Term Loan, 9.066%, (SOFR + 3.75%), 7/31/26 | | 2,322 | 2,332,061 |
| Term Loan, 9.18%, (SOFR + 3.75%), 7/31/26 | | 1,609 | 1,614,112 |
| Pretium Packaging LLC, Term Loan - Second Lien, 11.309%, (SOFR + 6.00%), 9.906% cash, 1.403% PIK, 10/2/28 | | 1,701 | 1,506,865 |
| Pretium PKG Holdings, Inc., Term Loan - Second Lien, 12.334%, (SOFR + 6.75%), 10/1/29 | | 7,100 | 4,375,375 |
| Proampac PG Borrower LLC, Term Loan, 9.326%, (SOFR + 4.00%), 9/15/28(10) | | 16,586 | 16,665,418 |
| Trident TPI Holdings, Inc.: | | | |
| Term Loan, 9.302%, (SOFR + 4.00%), 9/15/28 | | 13,467 | 13,510,935 |
| Borrower/Description | Principal
Amount*
(000's omitted) | Value |
| Containers & Packaging (continued) |
| Trident TPI Holdings, Inc.: (continued) | | | |
| Term Loan, 9.571%, (SOFR + 4.00%), 9/15/28 | | 6,463 | $ 6,477,516 |
| | | | $ 115,579,157 |
| Distributors — 0.7% |
| CD&R Hydra Buyer, Inc., Term Loan, 9.42%, (SOFR + 4.00%), 3/25/31 | | 11,225 | $ 11,328,483 |
| Parts Europe SA, Term Loan, 7.647%, (3 mo. EURIBOR + 3.75%), 2/3/31 | EUR | 19,225 | 20,598,219 |
| Phillips Feed Service, Inc., Term Loan, 12.416%, (SOFR + 7.00%), 11/13/24(3) | | 535 | 374,626 |
| Rubix Group Midco 3 Ltd.: | | | |
| Term Loan, 8.114%, (3 mo. EURIBOR + 4.25%), 9/30/26 | EUR | 6,000 | 6,428,362 |
| Term Loan, 8.149%, (6 mo. EURIBOR + 4.25%), 9/30/26 | EUR | 2,000 | 2,142,787 |
| Winterfell Financing SARL, Term Loan, 8.898%, (3 mo. EURIBOR + 5.00%), 5/4/28 | EUR | 2,500 | 2,629,094 |
| | | | $ 43,501,571 |
| Diversified Consumer Services — 1.4% |
| Ascend Learning LLC: | | | |
| Term Loan, 8.916%, (SOFR + 3.50%), 12/11/28 | | 9,908 | $ 9,886,999 |
| Term Loan - Second Lien, 11.18%, (SOFR + 5.75%), 12/10/29 | | 7,743 | 7,631,043 |
| Belron Finance U.S. LLC: | | | |
| Term Loan, 7.578%, (SOFR + 2.00%), 4/13/28 | | 9,894 | 9,922,861 |
| Term Loan, 7.677%, (SOFR + 2.25%), 4/18/29 | | 1,836 | 1,841,207 |
| FrontDoor, Inc., Term Loan, 7.68%, (SOFR + 2.25%), 6/17/28 | | 948 | 947,743 |
| KUEHG Corp., Term Loan, 9.823%, (SOFR + 4.50%), 6/12/30 | | 21,625 | 21,710,632 |
| Sotheby's, Term Loan, 10.09%, (SOFR + 4.50%), 1/15/27 | | 10,511 | 10,290,467 |
| Spring Education Group, Inc., Term Loan, 9.809%, (SOFR + 4.50%), 10/4/30 | | 4,713 | 4,738,521 |
| Wand NewCo 3, Inc., Term Loan, 9.066%, (SOFR + 3.75%), 1/30/31 | | 16,500 | 16,623,750 |
| | | | $ 83,593,223 |
| Diversified Financial Services — 0.1% |
| Concorde Midco Ltd., Term Loan, 7.851%, (6 mo. EURIBOR + 4.00%), 3/1/28 | EUR | 7,480 | $ 7,999,288 |
| | | | $ 7,999,288 |
28
See Notes to Financial Statements.
Senior Debt Portfolio
April 30, 2024
Portfolio of Investments (Unaudited) — continued
| Borrower/Description | Principal
Amount*
(000's omitted) | Value |
| Diversified Telecommunication Services — 0.8% |
| GEE Holdings 2 LLC: | | | |
| Term Loan, 13.413%, (SOFR + 8.00%), 3/24/25 | | 9,869 | $ 8,980,646 |
| Term Loan - Second Lien, 13.662%, (SOFR + 8.25%), 5.412% cash, 8.25% PIK, 3/23/26 | | 8,100 | 4,860,086 |
| Level 3 Financing, Inc.: | | | |
| Term Loan, 11.875%, (SOFR + 6.56%), 4/15/29 | | 5,750 | 5,667,344 |
| Term Loan, 11.875%, (SOFR + 6.56%), 4/15/30 | | 5,750 | 5,643,384 |
| Lumen Technologies, Inc.: | | | |
| Term Loan, 7.78%, (SOFR + 2.35%), 4/15/29 | | 12,109 | 8,739,684 |
| Term Loan, 7.78%, (SOFR + 2.35%), 4/15/30 | | 12,109 | 8,476,313 |
| Virgin Media Bristol LLC, Term Loan, 7.936%, (SOFR + 2.50%), 1/31/28 | | 4,843 | 4,759,668 |
| Virgin Media SFA Finance Ltd., Term Loan, 6.379%, (1 mo. EURIBOR + 2.50%), 1/31/29 | EUR | 1,125 | 1,172,336 |
| | | | $ 48,299,461 |
| Electrical Equipment — 0.7% |
| WEC U.S. Holdings Ltd., Term Loan, 8.066%, (SOFR + 2.75%), 1/27/31 | | 40,414 | $ 40,488,517 |
| | | | $ 40,488,517 |
| Electronic Equipment, Instruments & Components — 1.8% |
| Chamberlain Group, Inc., Term Loan, 9.066%, (SOFR + 3.75%), 11/3/28 | | 15,150 | $ 15,195,450 |
| Creation Technologies, Inc., Term Loan, 11.068%, (SOFR + 5.50%), 10/5/28 | | 15,435 | 14,624,389 |
| II-VI, Inc., Term Loan, 7.829%, (SOFR + 2.50%), 7/2/29 | | 1,403 | 1,408,357 |
| Ingram Micro, Inc., Term Loan, 8.571%, (SOFR + 3.00%), 6/30/28 | | 4,481 | 4,495,936 |
| Minimax Viking GmbH, Term Loan, 7.098%, (1 mo. EURIBOR + 3.25%), 7/31/28 | EUR | 3,964 | 4,258,989 |
| Mirion Technologies, Inc., Term Loan, 8.314%, (SOFR + 2.75%), 10/20/28 | | 2,350 | 2,356,652 |
| MX Holdings U.S., Inc., Term Loan, 8.18%, (SOFR + 2.75%), 7/31/28 | | 3,333 | 3,347,140 |
| Robertshaw U.S. Holding Corp.: | | | |
| DIP Loan, 6.309%, (SOFR + 1.00%), 9/27/24 | | 6,946 | 6,772,795 |
| Term Loan, 0.00%, 2/28/27(11) | | 4 | 3,929 |
| Term Loan, 0.00%, 2/28/27(11) | | 22,206 | 21,651,126 |
| Term Loan - Second Lien, 0.00%, 2/28/27(11) | | 20,615 | 11,338,315 |
| Borrower/Description | Principal
Amount*
(000's omitted) | Value |
| Electronic Equipment, Instruments & Components (continued) |
| TTM Technologies, Inc., Term Loan, 8.077%, (SOFR + 2.75%), 5/30/30 | | 6,948 | $ 6,960,526 |
| Verifone Systems, Inc., Term Loan, 9.585%, (SOFR + 4.00%), 8/20/25 | | 20,300 | 18,432,244 |
| | | | $ 110,845,848 |
| Energy Equipment & Services — 0.7% |
| Ameriforge Group, Inc.: | | | |
| Term Loan, 12.085%, (SOFR + 8.00%), 12/29/23(3)(8) | | 2,263 | $ 1,833,319 |
| Term Loan, 13.32%, (SOFR + 8.00%), 12/29/23(3) | | 17,780 | 14,403,568 |
| GIP Pilot Acquisition Partners LP, Term Loan, 8.308%, (SOFR + 3.00%), 10/4/30 | | 6,234 | 6,273,340 |
| Lealand Finance Co. BV: | | | |
| Term Loan, 3.63%, 6/28/24(8) | | 10,000 | 6,650,000 |
| Term Loan, 9.444%, (SOFR + 4.00%), 6.444% cash, 3.00% PIK, 6/30/25 | | 3,487 | 1,268,449 |
| PG Investment Co. 59 SARL, Term Loan, 8.813%, (SOFR + 3.50%), 3/26/31 | | 13,925 | 13,991,729 |
| | | | $ 44,420,405 |
| Engineering & Construction — 1.2% |
| Aegion Corp., Term Loan, 9.566%, (SOFR + 4.25%), 5/17/28 | | 17,597 | $ 17,715,311 |
| American Residential Services LLC, Term Loan, 9.071%, (SOFR + 3.50%), 10/15/27 | | 8,402 | 8,417,734 |
| APi Group DE, Inc., Term Loan, 7.93%, (SOFR + 2.50%), 1/3/29 | | 16,218 | 16,272,379 |
| Artera Services LLC, Term Loan, 9.809%, (SOFR + 4.50%), 2/15/31 | | 5,625 | 5,679,844 |
| Centuri Group, Inc., Term Loan, 7.93%, (SOFR + 2.50%), 8/27/28 | | 7,624 | 7,638,258 |
| Northstar Group Services, Inc.: | | | |
| Term Loan, 10.93%, (SOFR + 5.50%), 11/12/26 | | 12,698 | 12,742,803 |
| Term Loan, 10.93%, (SOFR + 5.50%), 11/12/26 | | 1,925 | 1,922,594 |
| | | | $ 70,388,923 |
| Entertainment — 1.2% |
| City Football Group Ltd., Term Loan, 8.439%, (SOFR + 3.00%), 7/21/28 | | 11,940 | $ 11,934,838 |
| Crown Finance U.S., Inc., Term Loan, 13.93%, (SOFR + 8.50%), 6.93% cash, 7.00% PIK, 7/31/28 | | 2,595 | 2,642,223 |
| Delta 2 (LUX) SARL, Term Loan, 7.559%, (SOFR + 2.25%), 1/15/30 | | 2,500 | 2,505,730 |
29
See Notes to Financial Statements.
Senior Debt Portfolio
April 30, 2024
Portfolio of Investments (Unaudited) — continued
| Borrower/Description | Principal
Amount*
(000's omitted) | Value |
| Entertainment (continued) |
| EP Purchaser LLC, Term Loan, 9.071%, (SOFR + 3.50%), 11/6/28 | | 992 | $ 987,960 |
| Playtika Holding Corp., Term Loan, 8.18%, (SOFR + 2.75%), 3/13/28 | | 23,141 | 23,155,875 |
| Renaissance Holding Corp., Term Loan, 9.566%, (SOFR + 4.25%), 4/5/30 | | 13,681 | 13,715,539 |
| UFC Holdings LLC, Term Loan, 8.336%, (SOFR + 2.75%), 4/29/26 | | 14,617 | 14,662,566 |
| Vue Entertainment International Ltd., Term Loan, 12.428%, (6 mo. EURIBOR + 8.50%), 4.028% cash, 8.40% PIK, 12/31/27 | EUR | 1,409 | 883,328 |
| Vue International Bidco PLC, Term Loan, 11.844%, (6 mo. EURIBOR + 8.00%), 6/30/27 | EUR | 385 | 410,618 |
| | | | $ 70,898,677 |
| Equity Real Estate Investment Trusts (REITs) — 0.4% |
| Iron Mountain, Inc.: | | | |
| Term Loan, 7.18%, (1 mo. USD LIBOR + 1.75%), 1/2/26 | | 7,930 | $ 7,925,869 |
| Term Loan, 7.566%, (SOFR + 2.25%), 1/31/31 | | 13,416 | 13,405,199 |
| | | | $ 21,331,068 |
| Financial Services — 1.5% |
| Ditech Holding Corp., Term Loan, 0.00%, 6/30/24(11) | | 15,063 | $ 1,656,959 |
| GTCR W Merger Sub LLC: | | | |
| Term Loan, 7.152%, (3 mo. EURIBOR + 3.25%), 1/31/31 | EUR | 1,000 | 1,072,982 |
| Term Loan, 8.309%, (SOFR + 3.00%), 1/31/31 | | 38,850 | 39,050,311 |
| NCR Atleos LLC, Term Loan, 10.18%, (SOFR + 4.75%), 3/27/29(10) | | 17,339 | 17,482,685 |
| Nuvei Technologies Corp., Term Loan, 8.416%, (SOFR + 3.00%), 12/19/30 | | 10,923 | 10,954,027 |
| Walker & Dunlop, Inc., Term Loan, 7.666%, (SOFR + 2.25%), 12/16/28 | | 13,905 | 13,957,081 |
| WEX, Inc., Term Loan, 7.316%, (SOFR + 2.00%), 3/31/28 | | 4,317 | 4,330,662 |
| | | | $ 88,504,707 |
| Food Products — 1.3% |
| 8th Avenue Food & Provisions, Inc., Term Loan, 10.18%, (SOFR + 4.75%), 10/1/25 | | 7,215 | $ 6,980,513 |
| Badger Buyer Corp., Term Loan, 8.93%, (SOFR + 3.50%), 9/30/24 | | 9,442 | 9,151,035 |
| CHG PPC Parent LLC, Term Loan, 8.43%, (SOFR + 3.00%), 12/8/28 | | 6,198 | 6,213,168 |
| Del Monte Foods, Inc., Term Loan, 9.668%, (SOFR + 4.25%), 5/16/29 | | 6,526 | 5,579,409 |
| Borrower/Description | Principal
Amount*
(000's omitted) | Value |
| Food Products (continued) |
| Froneri International Ltd.: | | | |
| Term Loan, 5.991%, (6 mo. EURIBOR + 2.13%), 1/29/27 | EUR | 1,500 | $ 1,596,999 |
| Term Loan, 7.666%, (SOFR + 2.25%), 1/29/27 | | 8,661 | 8,680,618 |
| Monogram Food Solutions LLC, Term Loan, 9.43%, (SOFR + 4.00%), 8/28/28 | | 1,761 | 1,764,979 |
| Nomad Foods U.S. LLC, Term Loan, 8.272%, (SOFR + 3.00%), 11/13/29 | | 14,174 | 14,221,437 |
| United Petfood Group BV, Term Loan, 6.583%, (6 mo. EURIBOR + 2.75%), 4/24/28 | EUR | 9,025 | 9,598,372 |
| Valeo F1 Co. Ltd. (Ireland): | | | |
| Term Loan, 7.858%, (6 mo. EURIBOR + 4.00%), 9/29/28 | EUR | 5,950 | 6,227,952 |
| Term Loan, 10.191%, (SONIA + 5.00%), 6/28/28 | GBP | 5,500 | 6,657,760 |
| | | | $ 76,672,242 |
| Gas Utilities — 0.4% |
| CQP Holdco LP, Term Loan, 8.302%, (SOFR + 3.00%), 12/31/30 | | 21,988 | $ 22,074,889 |
| | | | $ 22,074,889 |
| Health Care Equipment & Supplies — 0.9% |
| Bayou Intermediate II LLC, Term Loan, 10.091%, (SOFR + 4.50%), 8/2/28 | | 12,047 | $ 12,001,391 |
| Journey Personal Care Corp., Term Loan, 9.68%, (SOFR + 4.25%), 3/1/28 | | 26,013 | 25,895,444 |
| Medline Borrower LP: | | | |
| Term Loan, 7.112%, (1 mo. EURIBOR + 3.25%), 10/23/28 | EUR | 1,000 | 1,068,733 |
| Term Loan, 8.068%, (SOFR + 2.75%), 10/23/28 | | 17,424 | 17,490,545 |
| | | | $ 56,456,113 |
| Health Care Providers & Services — 5.6% |
| AEA International Holdings (Lux) SARL, Term Loan, 8.809%, (SOFR + 3.50%), 9/7/28(10) | | 14,785 | $ 14,859,062 |
| BW NHHC Holdco, Inc., Term Loan - Second Lien, 13.302%, (SOFR + 8.00%), 1/15/26 | | 22,904 | 19,811,593 |
| Cano Health LLC: | | | |
| DIP Loan, 16.322%, (SOFR + 11.00%), 10/7/24 | | 610 | 627,866 |
| DIP Loan, 16.322%, (SOFR + 11.00%), 10/7/24 | | 934 | 962,422 |
| Term Loan, 0.00%, 11/23/27(11) | | 7,589 | 2,049,157 |
| CCRR Parent, Inc., Term Loan, 9.18%, (SOFR + 3.75%), 3/6/28 | | 5,208 | 4,833,954 |
30
See Notes to Financial Statements.
Senior Debt Portfolio
April 30, 2024
Portfolio of Investments (Unaudited) — continued
| Borrower/Description | Principal
Amount*
(000's omitted) | Value |
| Health Care Providers & Services (continued) |
| Cerba Healthcare SAS: | | | |
| Term Loan, 7.548%, (1 mo. EURIBOR + 3.70%), 6/30/28 | EUR | 20,800 | $ 19,159,451 |
| Term Loan, 7.848%, (1 mo. EURIBOR + 4.00%), 2/16/29 | EUR | 8,600 | 7,976,764 |
| CHG Healthcare Services, Inc.: | | | |
| Term Loan, 8.68%, (SOFR + 3.25%), 9/29/28 | | 7,823 | ��� 7,851,570 |
| Term Loan, 9.091%, (SOFR + 3.75%), 9/29/28(10) | | 5,262 | 5,292,068 |
| Covis Finco SARL: | | | |
| Term Loan, 0.00%, 2/18/27(11) | | 10,270 | 4,287,896 |
| Term Loan, 0.00%, 2/18/27(11) | | 4,368 | 4,193,458 |
| Dedalus Finance GmbH, Term Loan, 7.612%, (6 mo. EURIBOR + 3.75%), 7/17/27 | EUR | 6,500 | 6,787,662 |
| Elsan SAS, Term Loan, 7.186%, (1 mo. EURIBOR + 3.35%), 6/16/28 | EUR | 4,150 | 4,401,476 |
| Ensemble RCM LLC, Term Loan, 8.33%, (SOFR + 3.00%), 8/1/29 | | 7,960 | 7,993,766 |
| IVC Acquisition Ltd.: | | | |
| Term Loan, 9.071%, (3 mo. EURIBOR + 5.00%), 12/12/28 | EUR | 20,825 | 22,095,972 |
| Term Loan, 10.809%, (SOFR + 5.50%), 12/12/28 | | 13,716 | 13,771,338 |
| Medical Solutions Holdings, Inc.: | | | |
| Term Loan, 8.666%, (SOFR + 3.25%), 11/1/28 | | 15,097 | 13,420,876 |
| Term Loan - Second Lien, 12.416%, (SOFR + 7.00%), 11/1/29 | | 9,500 | 7,671,250 |
| Mehilainen Yhtiot OYJ, Term Loan, 7.88%, (3 mo. EURIBOR + 4.00%), 8/8/25 | EUR | 6,475 | 6,949,774 |
| Midwest Physician Administrative Services LLC, Term Loan, 8.821%, (SOFR + 3.25%), 3/12/28 | | 9,979 | 7,833,169 |
| National Mentor Holdings, Inc.: | | | |
| Term Loan, 9.159%, (SOFR + 3.75%), 3/2/28 | | 438 | 400,205 |
| Term Loan, 9.165%, (SOFR + 3.75%), 3/2/28(10) | | 15,654 | 14,313,729 |
| Term Loan - Second Lien, 12.659%, (SOFR + 7.25%), 3/2/29 | | 6,475 | 5,743,862 |
| Pacific Dental Services LLC, Term Loan, 8.571%, (SOFR + 3.25%), 3/15/31 | | 11,150 | 11,190,073 |
| Phoenix Guarantor, Inc., Term Loan, 8.566%, (SOFR + 3.25%), 2/21/31 | | 22,084 | 21,946,452 |
| R1 RCM, Inc., Term Loan, 8.327%, (SOFR + 3.00%), 6/21/29 | | 3,017 | 3,033,183 |
| Radnet Management, Inc., Term Loan, 7.823%, (SOFR + 2.50%), 4/18/31 | | 9,300 | 9,311,625 |
| Ramsay Generale de Sante SA, Term Loan, 6.847%, (3 mo. EURIBOR + 2.95%), 4/22/27 | EUR | 7,400 | 7,905,924 |
| Select Medical Corp., Term Loan, 8.316%, (SOFR + 3.00%), 3/6/27 | | 54,052 | 54,232,626 |
| Borrower/Description | Principal
Amount*
(000's omitted) | Value |
| Health Care Providers & Services (continued) |
| Sound Inpatient Physicians, Term Loan, 8.591%, (SOFR + 3.00%), 6/27/25 | | 2,553 | $ 1,487,013 |
| Synlab Bondco PLC: | | | |
| Term Loan, 6.361%, (6 mo. EURIBOR + 2.50%), 7/1/27 | EUR | 2,600 | 2,761,542 |
| Term Loan, 12/23/30(9) | EUR | 6,925 | 7,418,122 |
| TTF Holdings LLC, Term Loan, 9.43%, (SOFR + 4.00%), 3/31/28 | | 5,644 | 5,660,787 |
| U.S. Anesthesia Partners, Inc., Term Loan, 9.692%, (SOFR + 4.25%), 10/1/28 | | 8,438 | 8,184,464 |
| | | | $ 336,420,151 |
| Health Care Technology — 1.9% |
| Certara LP, Term Loan, 9.105%, (SOFR + 3.50%), 8/15/26 | | 9,235 | $ 9,267,164 |
| Cotiviti Corp., Term Loan, 5/1/31(9) | | 4,600 | 4,613,418 |
| eResearchTechnology, Inc., Term Loan, 9.93%, (SOFR + 4.50%), 2/4/27 | | 9,513 | 9,554,421 |
| Imprivata, Inc., Term Loan, 9.091%, (SOFR + 3.50%), 12/1/27 | | 18,680 | 18,793,972 |
| MedAssets Software Intermediate Holdings, Inc.: | | | |
| Term Loan, 9.424%, (SOFR + 4.00%), 12/18/28 | | 12,457 | 10,549,287 |
| Term Loan - Second Lien, 12.18%, (SOFR + 6.75%), 12/17/29 | | 9,625 | 6,677,344 |
| PointClickCare Technologies, Inc., Term Loan, 8.324%, (SOFR + 3.00%), 12/29/27 | | 4,266 | 4,298,015 |
| Project Ruby Ultimate Parent Corp., Term Loan, 8.93%, (SOFR + 3.50%), 3/10/28 | | 4,675 | 4,687,660 |
| Symplr Software, Inc., Term Loan, 9.93%, (SOFR + 4.50%), 12/22/27 | | 11,386 | 10,840,718 |
| Verscend Holding Corp., Term Loan, 11.50%, (USD Prime + 3.00%), 8/27/25 | | 21,253 | 21,269,442 |
| Waystar Technologies, Inc., Term Loan, 9.316%, (SOFR + 4.00%), 10/22/29 | | 14,477 | 14,576,115 |
| | | | $ 115,127,556 |
| Hotels, Restaurants & Leisure — 5.5% |
| 1011778 BC Unlimited Liability Co., Term Loan, 7.566%, (SOFR + 2.25%), 9/20/30 | | 45,401 | $ 45,485,845 |
| Caesars Entertainment, Inc., Term Loan, 8.066%, (SOFR + 2.75%), 2/6/31 | | 30,225 | 30,309,993 |
| Carnival Corp., Term Loan, 8.067%, (SOFR + 2.75%), 10/18/28 | | 30,936 | 31,071,771 |
| ClubCorp Holdings, Inc., Term Loan, 10.564%, (SOFR + 5.00%), 9/18/26 | | 22,457 | 22,531,547 |
| Fertitta Entertainment LLC, Term Loan, 9.069%, (SOFR + 3.75%), 1/27/29 | | 29,477 | 29,585,492 |
31
See Notes to Financial Statements.
Senior Debt Portfolio
April 30, 2024
Portfolio of Investments (Unaudited) — continued
| Borrower/Description | Principal
Amount*
(000's omitted) | Value |
| Hotels, Restaurants & Leisure (continued) |
| Flutter Financing BV, Term Loan, 7.559%, (SOFR + 2.25%), 11/25/30 | | 41,222 | $ 41,350,505 |
| Great Canadian Gaming Corp., Term Loan, 9.59%, (SOFR + 4.00%), 11/1/26 | | 9,595 | 9,641,435 |
| GVC Holdings (Gibraltar) Ltd., Term Loan, 7.652%, (3 mo. EURIBOR + 3.75%), 6/30/28 | EUR | 21,325 | 22,845,761 |
| Light & Wonder International, Inc., Term Loan, 8.071%, (SOFR + 2.75%), 4/14/29 | | 7,865 | 7,888,746 |
| Ontario Gaming GTA LP, Term Loan, 9.559%, (SOFR + 4.25%), 8/1/30 | | 18,529 | 18,651,314 |
| Oravel Stays Singapore Pte. Ltd., Term Loan, 13.84%, (SOFR + 8.25%), 6/23/26 | | 3,820 | 3,822,732 |
| Playa Resorts Holding BV, Term Loan, 8.565%, (SOFR + 3.25%), 1/5/29 | | 41,573 | 41,795,849 |
| Scientific Games Holdings LP, Term Loan, 7.607%, (3 mo. EURIBOR + 3.75%), 4/4/29 | EUR | 1,000 | 1,067,541 |
| SeaWorld Parks & Entertainment, Inc., Term Loan, 7.816%, (SOFR + 2.50%), 8/25/28 | | 19,378 | 19,397,548 |
| Station Casinos LLC, Term Loan, 3/14/31(9) | | 5,875 | 5,881,938 |
| | | | $ 331,328,017 |
| Household Durables — 1.3% |
| ACProducts, Inc., Term Loan, 9.814%, (SOFR + 4.25%), 5/17/28 | | 23,115 | $ 20,100,782 |
| Libbey Glass, Inc., Term Loan, 11.975%, (SOFR + 6.50%), 11/22/27 | | 19,346 | 18,656,396 |
| Serta Simmons Bedding LLC: | | | |
| Term Loan, 12.924%, (SOFR + 7.50%), 6/29/28 | | 20,679 | 18,217,857 |
| Term Loan, 6/29/28(9) | | 2,245 | 2,205,656 |
| Solis IV BV, Term Loan, 8.824%, (SOFR + 3.50%), 2/26/29 | | 17,876 | 17,790,147 |
| | | | $ 76,970,838 |
| Household Products — 0.4% |
| Energizer Holdings, Inc., Term Loan, 7.68%, (SOFR + 2.25%), 12/22/27 | | 6,412 | $ 6,417,480 |
| Kronos Acquisition Holdings, Inc.: | | | |
| Term Loan, 9.314%, (SOFR + 3.75%), 12/22/26 | | 9,757 | 9,776,015 |
| Term Loan, 11.493%, (SOFR + 6.00%), 12/22/26 | | 5,621 | 5,648,728 |
| | | | $ 21,842,223 |
| Independent Power and Renewable Electricity Producers — 0.3% |
| Calpine Construction Finance Co. LP, Term Loan, 7.566%, (SOFR + 2.25%), 7/31/30 | | 10,466 | $ 10,472,565 |
| Borrower/Description | Principal
Amount*
(000's omitted) | Value |
| Independent Power and Renewable Electricity Producers (continued) |
| Calpine Corp.: | | | |
| Term Loan, 7.316%, (SOFR + 2.00%), 1/31/31 | | 3,166 | $ 3,165,254 |
| Term Loan, 7.316%, (SOFR + 2.00%), 1/31/31 | | 3,574 | 3,574,413 |
| | | | $ 17,212,232 |
| Industrial Conglomerates — 0.9% |
| Ammeraal Beltech Holding BV, Term Loan, 8.902%, (3 mo. EURIBOR + 5.00%), 12/30/28 | EUR | 10,775 | $ 11,578,936 |
| Kohler Energy Co. LLC, Term Loan, 1/30/31(9) | | 30,300 | 30,404,171 |
| Rain Carbon GmbH, Term Loan, 8.915%, (3 mo. EURIBOR + 5.00%), 10/31/28 | EUR | 13,948 | 14,755,349 |
| | | | $ 56,738,456 |
| Insurance — 2.0% |
| Alliant Holdings Intermediate LLC, Term Loan, 8.819%, (SOFR + 3.50%), 11/6/30 | | 13,765 | $ 13,834,361 |
| AmWINS Group, Inc.: | | | |
| Term Loan, 7.68%, (SOFR + 2.25%), 2/19/28 | | 11,244 | 11,264,157 |
| Term Loan, 8.18%, (SOFR + 2.75%), 2/19/28 | | 15,341 | 15,394,925 |
| AssuredPartners, Inc., Term Loan, 2/14/31(9) | | 28,736 | 28,875,660 |
| Financiere CEP SAS, Term Loan, 7.885%, (6 mo. EURIBOR + 4.00%), 6/18/27 | EUR | 6,242 | 6,680,924 |
| HUB International Ltd., Term Loan, 8.575%, (SOFR + 3.25%), 6/20/30 | | 17,714 | 17,821,252 |
| Ryan Specialty Group LLC, Term Loan, 8.066%, (SOFR + 2.75%), 9/1/27 | | 9,764 | 9,794,251 |
| Truist Insurance Holdings LLC: | | | |
| Term Loan, 5/6/31(9) | | 3,000 | 3,006,564 |
| Term Loan - Second Lien, 3/8/32(9) | | 2,500 | 2,522,813 |
| USI, Inc., Term Loan, 8.552%, (SOFR + 3.25%), 9/27/30 | | 9,005 | 9,041,327 |
| | | | $ 118,236,234 |
| Interactive Media & Services — 0.6% |
| Adevinta ASA: | | | |
| Term Loan, 6.348%, (1 mo. EURIBOR + 2.50%), 6/26/28 | EUR | 5,915 | $ 6,326,397 |
| Term Loan, 8.332%, (SOFR + 2.75%), 6/26/28 | | 2,658 | 2,666,554 |
| Buzz Finco LLC: | | | |
| Term Loan, 8.166%, (SOFR + 2.75%), 1/29/27 | | 2,720 | 2,729,048 |
| Term Loan, 8.666%, (SOFR + 3.25%), 1/29/27 | | 549 | 551,585 |
| Foundational Education Group, Inc., Term Loan, 9.341%, (SOFR + 3.75%), 8/31/28 | | 3,540 | 3,517,828 |
| Getty Images, Inc.: | | | |
| Term Loan, 8.875%, (1 mo. EURIBOR + 5.00%), 2/19/26 | EUR | 2,224 | 2,383,571 |
32
See Notes to Financial Statements.
Senior Debt Portfolio
April 30, 2024
Portfolio of Investments (Unaudited) — continued
| Borrower/Description | Principal
Amount*
(000's omitted) | Value |
| Interactive Media & Services (continued) |
| Getty Images, Inc.: (continued) | | | |
| Term Loan, 9.909%, (SOFR + 4.50%), 2/19/26 | | 12,463 | $ 12,494,032 |
| Match Group, Inc., Term Loan, 7.233%, (SOFR + 1.75%), 2/13/27 | | 3,100 | 3,097,418 |
| | | | $ 33,766,433 |
| IT Services — 4.5% |
| Asurion LLC: | | | |
| Term Loan, 9.416%, (SOFR + 4.00%), 8/19/28 | | 21,435 | $ 20,875,775 |
| Term Loan, 9.666%, (SOFR + 4.25%), 8/19/28 | | 7,301 | 7,139,479 |
| Term Loan - Second Lien, 10.68%, (SOFR + 5.25%), 1/31/28 | | 18,610 | 17,018,175 |
| Term Loan - Second Lien, 10.68%, (SOFR + 5.25%), 1/20/29 | | 4,375 | 3,956,299 |
| Endure Digital, Inc., Term Loan, 8.939%, (SOFR + 3.50%), 2/10/28 | | 33,572 | 32,601,423 |
| Gainwell Acquisition Corp., Term Loan, 9.409%, (SOFR + 4.00%), 10/1/27 | | 25,353 | 24,254,850 |
| Go Daddy Operating Co. LLC: | | | |
| Term Loan, 7.316%, (SOFR + 2.00%), 11/9/29 | | 54,535 | 54,600,750 |
| Term Loan, 7.43%, (SOFR + 2.00%), 8/10/27 | | 9,745 | 9,764,053 |
| Informatica LLC, Term Loan, 8.18%, (SOFR + 2.75%), 10/27/28 | | 34,153 | 34,255,459 |
| NAB Holdings LLC, Term Loan, 8.209%, (SOFR + 2.75%), 11/23/28 | | 13,727 | 13,732,794 |
| Rackspace Technology Global, Inc.: | | | |
| Term Loan, 11.552%, (SOFR + 6.25%), 5/15/28 | | 13,649 | 13,785,805 |
| Term Loan - Second Lien, 8.186%, (SOFR + 2.75%), 5/15/28 | | 27,685 | 13,288,649 |
| Sedgwick Claims Management Services, Inc., Term Loan, 9.066%, (SOFR + 3.75%), 2/24/28 | | 9,925 | 9,974,436 |
| team.blue Finco SARL: | | | |
| Term Loan, 7.062%, (1 mo. EURIBOR + 3.20%), 3/30/28 | EUR | 12,375 | 13,095,170 |
| Term Loan, 3/30/28(9) | EUR | 2,000 | 2,116,391 |
| | | | $ 270,459,508 |
| Leisure Products — 0.5% |
| Accell Group NV, Term Loan, 8.86%, (6 mo. EURIBOR + 4.90%), 6/14/29 | EUR | 3,500 | $ 1,385,760 |
| Fender Musical Instruments Corp., Term Loan, 9.418%, (SOFR + 4.00%), 12/1/28 | | 4,248 | 4,216,187 |
| Hayward Industries, Inc., Term Loan, 8.18%, (SOFR + 2.75%), 5/30/28 | | 12,218 | 12,234,278 |
| Recess Holdings, Inc., Term Loan, 9.843%, (SOFR + 4.50%), 2/20/30 | | 10,150 | 10,188,062 |
| | | | $ 28,024,287 |
| Borrower/Description | Principal
Amount*
(000's omitted) | Value |
| Life Sciences Tools & Services — 1.9% |
| Avantor Funding, Inc., Term Loan, 6.348%, (1 mo. EURIBOR + 2.50%), 6/12/28 | EUR | 12,012 | $ 12,862,874 |
| Cambrex Corp., Term Loan, 8.916%, (SOFR + 3.50%), 12/4/26 | | 5,936 | 5,736,117 |
| Catalent Pharma Solutions, Inc.: | | | |
| Term Loan, 7.43%, (SOFR + 2.00%), 2/22/28 | | 778 | 777,989 |
| Term Loan, 8.315%, (SOFR + 3.00%), 2/22/28 | | 3,550 | 3,569,969 |
| Curia Global, Inc., Term Loan, 9.18%, (SOFR + 3.75%), 8/30/26(10) | | 19,319 | 18,399,763 |
| ICON Luxembourg SARL, Term Loan, 7.32%, (SOFR + 2.00%), 7/3/28 | | 37,348 | 37,519,995 |
| LGC Group Holdings Ltd., Term Loan, 7.098%, (1 mo. EURIBOR + 3.25%), 4/21/27 | EUR | 4,025 | 4,252,888 |
| Loire Finco Luxembourg SARL, Term Loan, 8.916%, (SOFR + 3.50%), 4/21/27 | | 3,467 | 3,409,476 |
| Packaging Coordinators Midco, Inc., Term Loan, 9.071%, (SOFR + 3.50%), 11/30/27 | | 4,563 | 4,583,559 |
| PRA Health Sciences, Inc., Term Loan, 7.309%, (SOFR + 2.00%), 7/3/28 | | 9,305 | 9,348,310 |
| Sotera Health Holdings LLC, Term Loan, 8.18%, (SOFR + 2.75%), 12/11/26 | | 11,625 | 11,621,373 |
| | | | $ 112,082,313 |
| Machinery — 6.0% |
| AI Aqua Merger Sub, Inc., Term Loan, 9.324%, (SOFR + 4.00%), 7/31/28 | | 19,511 | $ 19,593,492 |
| Ali Group North America Corp., Term Loan, 7.43%, (SOFR + 2.00%), 7/30/29 | | 15,828 | 15,900,316 |
| American Trailer World Corp., Term Loan, 9.166%, (SOFR + 3.75%), 3/3/28 | | 16,117 | 15,824,409 |
| Apex Tool Group LLC: | | | |
| Term Loan, 15.315%, (SOFR + 10.00%), 2/8/30 | | 13,136 | 12,741,838 |
| Term Loan - Second Lien, 12.566%, (SOFR + 7.25%), 8.566% cash, 4.00% PIK, 2/8/29 | | 5,630 | 5,573,381 |
| Barnes Group, Inc., Term Loan, 7.816%, (SOFR + 2.50%), 9/3/30 | | 14,726 | 14,775,082 |
| Clark Equipment Co., Term Loan, 7.902%, (SOFR + 2.50%), 4/20/29 | | 12,332 | 12,385,598 |
| Conair Holdings LLC, Term Loan, 9.18%, (SOFR + 3.75%), 5/17/28 | | 25,911 | 25,746,378 |
| CPM Holdings, Inc., Term Loan, 9.827%, (SOFR + 4.50%), 9/28/28 | | 6,983 | 7,009,306 |
| Delachaux Group SA, Term Loan, 8.115%, (3 mo. EURIBOR + 4.25%), 4/16/29 | EUR | 7,964 | 8,568,912 |
| EMRLD Borrower LP, Term Loan, 7.816%, (SOFR + 2.50%), 5/31/30 | | 9,853 | 9,882,005 |
33
See Notes to Financial Statements.
Senior Debt Portfolio
April 30, 2024
Portfolio of Investments (Unaudited) — continued
| Borrower/Description | Principal
Amount*
(000's omitted) | Value |
| Machinery (continued) |
| Engineered Machinery Holdings, Inc.: | | | |
| Term Loan, 7.652%, (3 mo. EURIBOR + 3.75%), 5/21/28 | EUR | 11,822 | $ 12,632,082 |
| Term Loan, 9.321%, (SOFR + 3.75%), 5/19/28 | | 26,558 | 26,596,972 |
| Term Loan - Second Lien, 11.571%, (SOFR + 6.00%), 5/21/29 | | 3,700 | 3,695,020 |
| Term Loan - Second Lien, 12.071%, (SOFR + 6.50%), 5/21/29 | | 1,621 | 1,616,564 |
| Filtration Group Corp., Term Loan, 8.93%, (SOFR + 3.50%), 10/21/28 | | 3,202 | 3,212,288 |
| Gates Global LLC, Term Loan, 7.916%, (SOFR + 2.50%), 3/31/27 | | 16,908 | 16,974,590 |
| Icebox Holdco III, Inc., Term Loan, 9.321%, (SOFR + 3.75%), 12/22/28 | | 12,557 | 12,547,817 |
| INNIO Group Holding GmbH, Term Loan, 8.173%, (3 mo. EURIBOR + 4.25%), 11/2/28 | EUR | 4,722 | 5,074,804 |
| Madison IAQ LLC, Term Loan, 8.68%, (SOFR + 3.25%), 6/21/28 | | 22,908 | 22,937,802 |
| Pro Mach Group, Inc., Term Loan, 9.066%, (SOFR + 3.75%), 8/31/28 | | 4,761 | 4,786,361 |
| Roper Industrial Products Investment Co. LLC: | | | |
| Term Loan, 8.402%, (3 mo. EURIBOR + 4.50%), 11/22/29 | EUR | 990 | 1,064,920 |
| Term Loan, 9.302%, (SOFR + 4.00%), 11/22/29 | | 11,219 | 11,311,939 |
| SPX Flow, Inc., Term Loan, 9.916%, (SOFR + 4.50%), 4/5/29 | | 19,620 | 19,752,903 |
| Titan Acquisition Ltd., Term Loan, 10.317%, (SOFR + 5.00%), 2/1/29 | | 11,150 | 11,219,688 |
| TK Elevator Midco GmbH, Term Loan, 7.926%, (3 mo. EURIBOR + 4.00%), 4/30/30 | EUR | 11,450 | 12,275,961 |
| TK Elevator Topco GmbH, Term Loan, 7.491%, (6 mo. EURIBOR + 3.63%), 7/30/27 | EUR | 12,100 | 12,924,787 |
| TK Elevator U.S. Newco, Inc., Term Loan, 8.791%, (SOFR + 3.50%), 4/30/30 | | 16,204 | 16,278,719 |
| Zephyr German BidCo GmbH, Term Loan, 7.446%, (6 mo. EURIBOR + 3.60%), 3/10/28 | EUR | 13,675 | 14,439,914 |
| | | | $ 357,343,848 |
| Media — 0.8% |
| Aragorn Parent Corp., Term Loan, 9.569%, (SOFR + 4.25%), 12/15/28 | | 11,322 | $ 11,407,083 |
| Hubbard Radio LLC, Term Loan, 9.816%, (SOFR + 4.50%), 3/28/25 | | 6,646 | 5,499,708 |
| iHeartCommunications, Inc.: | | | |
| Term Loan, 8.43%, (SOFR + 3.00%), 5/1/26 | | 1,127 | 987,598 |
| Term Loan, 8.68%, (SOFR + 3.25%), 5/1/26 | | 3,165 | 2,759,643 |
| Borrower/Description | Principal
Amount*
(000's omitted) | Value |
| Media (continued) |
| Sinclair Television Group, Inc., Term Loan, 8.091%, (SOFR + 2.50%), 9/30/26 | | 5,277 | $ 4,927,654 |
| Univision Communications, Inc., Term Loan, 8.68%, (SOFR + 3.25%), 3/15/26 | | 23,075 | 23,116,432 |
| | | | $ 48,698,118 |
| Metals/Mining — 1.5% |
| Arsenal AIC Parent LLC, Term Loan, 9.066%, (SOFR + 3.75%), 8/18/30 | | 18,333 | $ 18,493,404 |
| Dynacast International LLC: | | | |
| Term Loan, 9.943%, (SOFR + 4.50%), 7/22/25 | | 16,283 | 15,624,611 |
| Term Loan, 14.443%, (SOFR + 9.00%), 10/22/25 | | 2,911 | 2,168,575 |
| PMHC II, Inc., Term Loan, 9.706%, (SOFR + 4.25%), 4/23/29 | | 24,516 | 24,200,044 |
| WireCo WorldGroup, Inc., Term Loan, 9.075%, (SOFR + 3.75%), 11/13/28 | | 6,308 | 6,339,921 |
| Zekelman Industries, Inc., Term Loan, 7.568%, (SOFR + 2.25%), 1/24/31 | | 23,738 | 23,806,695 |
| | | | $ 90,633,250 |
| Oil, Gas & Consumable Fuels — 1.3% |
| Freeport LNG Investments LLP, Term Loan, 9.086%, (SOFR + 3.50%), 12/21/28 | | 17,732 | $ 17,656,305 |
| GIP II Blue Holding LP, Term Loan, 9.066%, (SOFR + 3.75%), 9/29/28 | | 9,846 | 9,910,643 |
| ITT Holdings LLC, Term Loan, 8.421%, (SOFR + 3.00%), 10/11/30 | | 10,796 | 10,818,238 |
| Matador Bidco SARL, Term Loan, 9.916%, (SOFR + 4.50%), 10/15/26 | | 30,332 | 30,430,134 |
| Oxbow Carbon LLC, Term Loan, 9.413%, (SOFR + 4.00%), 5/10/30(10) | | 7,469 | 7,505,905 |
| | | | $ 76,321,225 |
| Passenger Airlines — 0.0%(6) |
| WestJet Loyalty LP, Term Loan, 9.048%, (SOFR + 3.75%), 2/14/31 | | 1,250 | $ 1,252,901 |
| | | | $ 1,252,901 |
| Pharmaceuticals — 1.7% |
| Aenova Holding GmbH, Term Loan, 8.328%, (1 mo. EURIBOR + 4.50%), 3/6/26 | EUR | 4,075 | $ 4,364,698 |
| AI Sirona (Luxembourg) Acquisition SARL, Term Loan, 7.848%, (3 mo. EURIBOR + 4.00%), 9/30/28 | EUR | 12,550 | 13,425,176 |
| Bausch Health Cos., Inc., Term Loan, 10.668%, (SOFR + 5.25%), 2/1/27 | | 14,691 | 12,382,461 |
34
See Notes to Financial Statements.
Senior Debt Portfolio
April 30, 2024
Portfolio of Investments (Unaudited) — continued
| Borrower/Description | Principal
Amount*
(000's omitted) | Value |
| Pharmaceuticals (continued) |
| Ceva Sante Animale: | | | |
| Term Loan, 8.152%, (3 mo. EURIBOR + 4.25%), 11/8/30 | EUR | 13,200 | $ 14,181,867 |
| Term Loan, 9.564%, (SOFR + 4.25%), 11/1/30 | | 5,375 | 5,416,990 |
| Jazz Financing Lux SARL, Term Loan, 8.43%, (SOFR + 3.00%), 5/5/28 | | 12,704 | 12,792,535 |
| Mallinckrodt International Finance SA: | | | |
| Term Loan, 12.819%, (SOFR + 7.50%), 11/14/28 | | 4,213 | 4,718,337 |
| Term Loan - Second Lien, 14.819%, (SOFR + 9.50%), 11/14/28 | | 23,875 | 26,122,949 |
| PharmaZell GmbH, Term Loan, 7.902%, (3 mo. EURIBOR + 4.00%), 5/12/27 | EUR | 1,950 | 2,066,301 |
| Recipharm AB, Term Loan, 6.865%, (3 mo. EURIBOR + 2.95%), 2/17/28 | EUR | 4,275 | 4,481,836 |
| | | | $ 99,953,150 |
| Professional Services — 3.5% |
| APFS Staffing Holdings, Inc., Term Loan, 9.316%, (SOFR + 4.00%), 12/29/28 | | 3,855 | $ 3,843,191 |
| Apleona Holding GmbH, Term Loan, 6.564%, (3 mo. EURIBOR + 2.70%), 4/28/28 | EUR | 10,525 | 11,121,974 |
| CoreLogic, Inc.: | | | |
| Term Loan, 8.93%, (SOFR + 3.50%), 6/2/28 | | 17,245 | 16,699,281 |
| Term Loan - Second Lien, 11.93%, (SOFR + 6.50%), 6/4/29 | | 1,524 | 1,384,608 |
| Corporation Service Co., Term Loan, 8.066%, (SOFR + 2.75%), 11/2/29 | | 4,515 | 4,531,457 |
| Crisis Prevention Institute, Inc., Term Loan, 10.043%, (SOFR + 4.75%), 4/9/31 | | 4,050 | 4,072,781 |
| EAB Global, Inc., Term Loan, 8.93%, (SOFR + 3.50%), 8/16/28 | | 15,616 | 15,669,936 |
| Employbridge Holding Co., Term Loan, 10.314%, (SOFR + 4.75%), 7/19/28 | | 23,680 | 19,262,956 |
| First Advantage Holdings LLC, Term Loan, 8.18%, (SOFR + 2.75%), 1/31/27 | | 3,606 | 3,611,349 |
| Fleet Midco I Ltd., Term Loan, 8.566%, (SOFR + 3.25%), 2/21/31 | | 9,750 | 9,798,750 |
| Genuine Financial Holdings LLC, Term Loan, 9.316%, (SOFR + 4.00%), 9/27/30 | | 5,149 | 5,141,885 |
| Neptune Bidco U.S., Inc., Term Loan, 10.406%, (SOFR + 5.00%), 4/11/29 | | 9,083 | 8,554,341 |
| Rockwood Service Corp., Term Loan, 9.68%, (SOFR + 4.25%), 1/23/27 | | 11,064 | 11,148,715 |
| Techem Verwaltungsgesellschaft 675 mbH, Term Loan, 7/15/29(9) | EUR | 20,375 | 21,774,110 |
| Teneo Holdings LLC, Term Loan, 10.066%, (SOFR + 4.75%), 3/13/31 | | 13,700 | 13,822,725 |
| Borrower/Description | Principal
Amount*
(000's omitted) | Value |
| Professional Services (continued) |
| Trans Union LLC: | | | |
| Term Loan, 7.166%, (SOFR + 1.75%), 11/16/26 | | 2,456 | $ 2,459,121 |
| Term Loan, 7.316%, (SOFR + 2.00%), 12/1/28 | | 33,516 | 33,602,173 |
| Vaco Holdings LLC, Term Loan, 10.434%, (SOFR + 5.00%), 1/21/29 | | 5,425 | 5,396,623 |
| Wood Mackenzie Ltd., Term Loan, 8.814%, (SOFR + 3.50%), 2/7/31 | | 15,750 | 15,839,570 |
| | | | $ 207,735,546 |
| Real Estate Management & Development — 1.0% |
| Cushman & Wakefield U.S. Borrower LLC: | | | |
| Term Loan, 8.18%, (SOFR + 2.75%), 8/21/25 | | 683 | $ 682,946 |
| Term Loan, 8.666%, (SOFR + 3.25%), 1/31/30 | | 10,581 | 10,607,111 |
| Term Loan, 9.066%, (SOFR + 3.75%), 1/31/30 | | 7,989 | 8,019,346 |
| Greystar Real Estate Partners LLC, Term Loan, 8.576%, (SOFR + 3.25%), 8/21/30 | | 10,603 | 10,642,312 |
| Homeserve USA Holding Corp., Term Loan, 8.319%, (SOFR + 3.00%), 10/21/30 | | 12,075 | 12,127,828 |
| RE/MAX International, Inc., Term Loan, 7.93%, (SOFR + 2.50%), 7/21/28 | | 17,797 | 16,846,848 |
| | | | $ 58,926,391 |
| Road & Rail — 2.2% |
| Avis Budget Car Rental LLC: | | | |
| Term Loan, 7.18%, (SOFR + 1.75%), 8/6/27 | | 28,608 | $ 28,429,347 |
| Term Loan, 8.416%, (SOFR + 3.00%), 3/16/29 | | 2,986 | 2,979,975 |
| Hertz Corp.: | | | |
| Term Loan, 8.68%, (SOFR + 3.25%), 6/30/28 | | 16,408 | 15,173,204 |
| Term Loan, 8.68%, (SOFR + 3.25%), 6/30/28 | | 3,180 | 2,945,196 |
| Term Loan, 9.065%, (SOFR + 3.75%), 6/30/28 | | 9,825 | 9,068,006 |
| Kenan Advantage Group, Inc., Term Loan, 9.066%, (SOFR + 3.75%), 1/25/29 | | 16,777 | 16,797,944 |
| Uber Technologies, Inc., Term Loan, 8.079%, (SOFR + 2.75%), 3/3/30 | | 54,323 | 54,724,974 |
| | | | $ 130,118,646 |
| Semiconductors & Semiconductor Equipment — 1.2% |
| Altar Bidco, Inc.: | | | |
| Term Loan, 7.947%, (SOFR + 3.10%), 2/1/29 | | 20,712 | $ 20,730,747 |
| Term Loan - Second Lien, 10.914%, (SOFR + 5.60%), 2/1/30 | | 7,300 | 7,239,169 |
| Bright Bidco BV, Term Loan, 14.33%, (SOFR + 9.00%), 6.33% cash, 8.00% PIK, 10/31/27 | | 4,546 | 1,375,156 |
| MaxLinear, Inc., Term Loan, 7.68%, (SOFR + 2.25%), 6/23/28 | | 3,250 | 3,233,750 |
35
See Notes to Financial Statements.
Senior Debt Portfolio
April 30, 2024
Portfolio of Investments (Unaudited) — continued
| Borrower/Description | Principal
Amount*
(000's omitted) | Value |
| Semiconductors & Semiconductor Equipment (continued) |
| MKS Instruments, Inc., Term Loan, 7.823%, (SOFR + 2.50%), 8/17/29 | | 36,048 | $ 36,152,947 |
| Synaptics, Inc., Term Loan, 7.835%, (SOFR + 2.25%), 12/2/28 | | 3,157 | 3,157,486 |
| | | | $ 71,889,255 |
| Software — 14.9% |
| Applied Systems, Inc., Term Loan, 8.809%, (SOFR + 3.50%), 2/24/31 | | 67,611 | $ 68,181,662 |
| Astra Acquisition Corp.: | | | |
| Term Loan, 10.578%, (SOFR + 5.25%), 10/25/28 | | 14,900 | 7,598,860 |
| Term Loan, 12.078%, (SOFR + 6.75%), 2/25/28 | | 3,382 | 3,330,839 |
| Term Loan, 2/25/28(9) | | 7,177 | 7,033,150 |
| Term Loan - Second Lien, 14.439%, (SOFR + 8.88%), 10/25/29 | | 21,995 | 6,231,828 |
| Banff Merger Sub, Inc.: | | | |
| Term Loan, 8.348%, (1 mo. EURIBOR + 4.50%), 12/29/28 | EUR | 5,907 | 6,349,774 |
| Term Loan, 9.566%, (SOFR + 4.25%), 12/29/28 | | 18,744 | 18,881,798 |
| Cegid Group SAS, Term Loan, 7.641%, (3 mo. EURIBOR + 3.75%), 7/10/28 | EUR | 7,850 | 8,406,368 |
| Central Parent, Inc., Term Loan, 9.309%, (SOFR + 4.00%), 7/6/29 | | 33,487 | 33,652,890 |
| Cloud Software Group, Inc.: | | | |
| Term Loan, 9.909%, (SOFR + 4.50%), 9/29/28 | | 22,345 | 22,368,427 |
| Term Loan, 9.909%, (SOFR + 4.50%), 3/30/29 | | 1,475 | 1,476,537 |
| Cloudera, Inc.: | | | |
| Term Loan, 9.166%, (SOFR + 3.75%), 10/8/28 | | 30,877 | 30,761,075 |
| Term Loan - Second Lien, 11.416%, (SOFR + 6.00%), 10/8/29 | | 4,450 | 4,294,250 |
| Constant Contact, Inc., Term Loan, 9.561%, (SOFR + 4.00%), 2/10/28 | | 12,927 | 12,623,667 |
| Cornerstone OnDemand, Inc., Term Loan, 9.18%, (SOFR + 3.75%), 10/16/28 | | 16,905 | 16,218,234 |
| Delta TopCo, Inc.: | | | |
| Term Loan, 9.121%, (SOFR + 3.75%), 12/1/27 | | 13,963 | 13,998,511 |
| Term Loan, 12/24/29(9) | | 4,000 | 4,005,000 |
| E2open LLC, Term Loan, 8.93%, (SOFR + 3.50%), 2/4/28 | | 19,961 | 20,063,864 |
| ECI Macola Max Holding LLC, Term Loan, 9.052%, (SOFR + 3.75%), 5/31/30 | | 28,731 | 28,892,419 |
| Epicor Software Corp.: | | | |
| Term Loan, 8.68%, (SOFR + 3.25%), 7/30/27 | | 69,387 | 69,757,217 |
| Term Loan, 9.066%, (SOFR + 3.75%), 7/30/27 | | 8,379 | 8,436,606 |
| Borrower/Description | Principal
Amount*
(000's omitted) | Value |
| Software (continued) |
| Fiserv Investment Solutions, Inc., Term Loan, 9.319%, (SOFR + 4.00%), 2/18/27 | | 11,973 | $ 11,511,339 |
| Gen Digital, Inc., Term Loan, 7.416%, (SOFR + 2.00%), 9/12/29 | | 2,914 | 2,921,164 |
| GoTo Group, Inc.: | | | |
| Term Loan, 10.173%, (SOFR + 4.75%), 4/30/28 | | 15,172 | 14,508,453 |
| Term Loan - Second Lien, 10.173%, (SOFR + 4.75%), 4/30/28 | | 12,724 | 9,691,722 |
| IGT Holding IV AB: | | | |
| Term Loan, 7.052%, (3 mo. EURIBOR + 3.15%), 3/31/28 | EUR | 6,205 | 6,627,040 |
| Term Loan, 8.972%, (SOFR + 3.40%), 3/31/28 | | 1,649 | 1,655,722 |
| iSolved, Inc., Term Loan, 8.819%, (SOFR + 3.50%), 10/15/30 | | 8,284 | 8,309,511 |
| Ivanti Software, Inc., Term Loan, 9.814%, (SOFR + 4.25%), 12/1/27 | | 10,223 | 9,507,019 |
| Magenta Buyer LLC, Term Loan, 10.591%, (SOFR + 5.00%), 7/27/28 | | 22,063 | 11,210,755 |
| Marcel LUX IV SARL: | | | |
| Term Loan, 8.335%, (3 mo. EURIBOR + 4.50%), 11/7/30 | EUR | 9,150 | 9,813,710 |
| Term Loan, 9.81%, (SOFR + 4.50%), 11/11/30 | | 32,108 | 32,288,773 |
| Maverick Bidco, Inc., Term Loan, 9.23%, (SOFR + 3.75%), 5/18/28 | | 7,331 | 7,317,289 |
| McAfee LLC, Term Loan, 9.177%, (SOFR + 3.75%), 3/1/29 | | 24,352 | 24,436,881 |
| Mosel Bidco SE: | | | |
| Term Loan, 8.652%, (3 mo. EURIBOR + 4.75%), 9/16/30 | EUR | 1,825 | 1,957,395 |
| Term Loan, 10.059%, (SOFR + 4.75%), 9/16/30 | | 3,275 | 3,293,422 |
| N-Able International Holdings II LLC, Term Loan, 8.355%, (SOFR + 2.75%), 7/19/28 | | 1,623 | 1,626,253 |
| Open Text Corp., Term Loan, 8.166%, (SOFR + 2.75%), 1/31/30 | | 26,868 | 26,980,925 |
| Polaris Newco LLC: | | | |
| Term Loan, 7.902%, (3 mo. EURIBOR + 4.00%), 6/2/28 | EUR | 9,116 | 9,319,447 |
| Term Loan, 9.591%, (SOFR + 4.00%), 6/2/28 | | 7,731 | 7,687,127 |
| Project Alpha Intermediate Holding, Inc., Term Loan, 10.08%, (SOFR + 4.75%), 10/28/30 | | 5,500 | 5,525,971 |
| Proofpoint, Inc., Term Loan, 8.68%, (SOFR + 3.25%), 8/31/28 | | 24,206 | 24,324,482 |
| Quartz Acquireco LLC, Term Loan, 8.809%, (SOFR + 3.50%), 6/28/30 | | 10,572 | 10,640,148 |
| Quest Software U.S. Holdings, Inc., Term Loan, 9.73%, (SOFR + 4.25%), 2/1/29 | | 23,998 | 16,978,828 |
36
See Notes to Financial Statements.
Senior Debt Portfolio
April 30, 2024
Portfolio of Investments (Unaudited) — continued
| Borrower/Description | Principal
Amount*
(000's omitted) | Value |
| Software (continued) |
| RealPage, Inc., Term Loan, 8.43%, (SOFR + 3.00%), 4/24/28 | | 10,925 | $ 10,547,076 |
| Redstone Holdco 2 LP, Term Loan, 10.18%, (SOFR + 4.75%), 4/27/28 | | 12,915 | 10,181,229 |
| Sabre GLBL, Inc.: | | | |
| Term Loan, 8.93%, (SOFR + 3.50%), 12/17/27 | | 8,392 | 7,356,293 |
| Term Loan, 8.93%, (SOFR + 3.50%), 12/17/27 | | 5,357 | 4,695,552 |
| Term Loan, 9.666%, (SOFR + 4.25%), 6/30/28 | | 7,345 | 6,467,905 |
| Term Loan, 10.416%, (SOFR + 5.00%), 6/30/28 | | 1,000 | 885,000 |
| Skillsoft Corp., Term Loan, 10.68%, (SOFR + 5.25%), 7/14/28 | | 14,835 | 11,954,279 |
| SolarWinds Holdings, Inc., Term Loan, 8.566%, (SOFR + 3.25%), 2/5/27 | | 28,230 | 28,313,479 |
| Sophia LP, Term Loan, 8.916%, (SOFR + 3.50%), 10/9/29 | | 32,580 | 32,730,471 |
| SS&C Technologies, Inc.: | | | |
| Term Loan, 7.666%, (SOFR + 2.25%), 3/22/29 | | 1,964 | 1,969,079 |
| Term Loan, 7.666%, (SOFR + 2.25%), 3/22/29 | | 4,641 | 4,653,966 |
| Turing Midco LLC, Term Loan, 7.93%, (SOFR + 2.50%), 3/24/28 | | 717 | 712,729 |
| UKG, Inc., Term Loan, 8.814%, (SOFR + 3.50%), 2/10/31 | | 42,268 | 42,512,379 |
| Veritas U.S., Inc., Term Loan, 10.43%, (SOFR + 5.00%), 9/1/25 | | 39,242 | 36,152,058 |
| Vision Solutions, Inc.: | | | |
| Term Loan, 9.841%, (SOFR + 4.25%), 4/24/28 | | 39,056 | 38,977,161 |
| Term Loan - Second Lien, 12.841%, (SOFR + 7.25%), 4/23/29 | | 1,500 | 1,411,875 |
| | | | $ 890,216,883 |
| Specialty Retail — 2.7% |
| Belron Luxembourg SARL, Term Loan, 6.347%, (3 mo. EURIBOR + 2.43%), 4/13/28 | EUR | 3,925 | $ 4,211,742 |
| Boels Topholding BV, Term Loan, 7.139%, (EURIBOR + 3.25%), 2/6/27(10) | EUR | 7,586 | 8,114,771 |
| Etraveli Holding AB, Term Loan, 8.902%, (3 mo. EURIBOR + 5.00%), 11/2/28 | EUR | 9,472 | 10,165,427 |
| Great Outdoors Group LLC, Term Loan, 9.18%, (SOFR + 3.75%), 3/6/28 | | 35,095 | 35,147,567 |
| Harbor Freight Tools USA, Inc., Term Loan, 8.18%, (SOFR + 2.75%), 10/19/27 | | 25,349 | 25,398,834 |
| Hoya Midco LLC, Term Loan, 8.58%, (SOFR + 3.25%), 2/3/29 | | 4,820 | 4,835,412 |
| Les Schwab Tire Centers, Term Loan, 8.317%, (SOFR + 3.00%), 4/23/31 | | 34,237 | 34,300,889 |
| LIDS Holdings, Inc., Term Loan, 10.98%, (SOFR + 5.50%), 12/14/26 | | 4,519 | 4,507,858 |
| Borrower/Description | Principal
Amount*
(000's omitted) | Value |
| Specialty Retail (continued) |
| Mattress Firm, Inc., Term Loan, 9.814%, (SOFR + 4.25%), 9/25/28 | | 17,357 | $ 17,421,629 |
| PetSmart, Inc., Term Loan, 9.166%, (SOFR + 3.75%), 2/11/28 | | 15,311 | 15,105,645 |
| | | | $ 159,209,774 |
| Technology Hardware, Storage & Peripherals — 0.2% |
| Poseidon Bidco SASU, Term Loan, 8.902%, (3 mo. EURIBOR + 5.00%), 3/13/30 | EUR | 11,050 | $ 11,633,095 |
| | | | $ 11,633,095 |
| Trading Companies & Distributors — 3.7% |
| Avolon TLB Borrower 1 (U.S.) LLC, Term Loan, 7.315%, (SOFR + 2.00%), 6/22/28 | | 41,059 | $ 41,174,534 |
| Beacon Roofing Supply, Inc., Term Loan, 7.316%, (SOFR + 2.00%), 5/19/28 | | 7,232 | 7,259,443 |
| Core & Main LP: | | | |
| Term Loan, 7.568%, (SOFR + 2.25%), 2/9/31 | | 4,963 | 4,987,375 |
| Term Loan, 7.918%, (SOFR + 2.50%), 7/27/28(10) | | 9,497 | 9,555,927 |
| DXP Enterprises, Inc., Term Loan, 10.164%, (SOFR + 4.75%), 10/11/30 | | 9,104 | 9,163,992 |
| Foundation Building Materials Holding Co. LLC, Term Loan, 9.33%, (SOFR + 4.00%), 1/29/31(10) | | 16,675 | 16,820,906 |
| Park River Holdings, Inc., Term Loan, 8.814%, (SOFR + 3.25%), 12/28/27 | | 3,707 | 3,666,852 |
| Patagonia Bidco Ltd., Term Loan, 10.473%, (SONIA + 5.25%), 11/1/28 | GBP | 20,050 | 22,132,070 |
| PEARLS (Netherlands) Bidco BV, Term Loan, 7.865%, (3 mo. EURIBOR + 4.00%), 2/26/29 | EUR | 6,000 | 6,401,423 |
| Spin Holdco, Inc., Term Loan, 9.585%, (SOFR + 4.00%), 3/4/28 | | 50,885 | 45,166,588 |
| SRS Distribution, Inc.: | | | |
| Term Loan, 8.666%, (SOFR + 3.25%), 6/2/28 | | 5,327 | 5,367,996 |
| Term Loan, 8.93%, (SOFR + 3.50%), 6/2/28 | | 16,210 | 16,346,124 |
| White Cap Buyer LLC, Term Loan, 9.066%, (SOFR + 3.75%), 10/19/27 | | 16,266 | 16,337,656 |
| Windsor Holdings III LLC, Term Loan, 9.319%, (SOFR + 4.00%), 8/1/30 | | 15,452 | 15,604,433 |
| | | | $ 219,985,319 |
| Wireless Telecommunication Services — 0.9% |
| CCI Buyer, Inc., Term Loan, 9.302%, (SOFR + 4.00%), 12/17/27 | | 25,880 | $ 25,886,690 |
37
See Notes to Financial Statements.
Senior Debt Portfolio
April 30, 2024
Portfolio of Investments (Unaudited) — continued
| Borrower/Description | Principal
Amount*
(000's omitted) | Value |
| Wireless Telecommunication Services (continued) |
| Digicel International Finance Ltd., Term Loan, 12.075%, (SOFR + 6.75%), 5/25/27 | | 20,071 | $ 19,193,169 |
| SBA Senior Finance II LLC, Term Loan, 7.32%, (SOFR + 2.00%), 1/25/31 | | 9,800 | 9,844,100 |
| | | | $ 54,923,959 |
Total Senior Floating-Rate Loans
(identified cost $6,445,647,624) | | | $ 6,282,043,420 |
| Short-Term Investments — 2.4% |
| Security | Shares | Value |
| Morgan Stanley Institutional Liquidity Funds - Government Portfolio, Institutional Class, 5.22%(12) | | 145,801,002 | $ 145,801,002 |
Total Short-Term Investments
(identified cost $145,801,002) | | | $ 145,801,002 |
Total Investments — 124.3%
(identified cost $7,697,066,410) | | | $ 7,439,929,005 |
| Less Unfunded Loan Commitments — (0.2)% | | | $ (12,383,334) |
Net Investments — 124.1%
(identified cost $7,684,683,076) | | | $ 7,427,545,671 |
| Other Assets, Less Liabilities — (24.1)% | | | $ (1,440,895,040) |
| Net Assets — 100.0% | | | $ 5,986,650,631 |
| The percentage shown for each investment category in the Portfolio of Investments is based on net assets. |
| * | In U.S. dollars unless otherwise indicated. |
| (1) | Security exempt from registration under Rule 144A of the Securities Act of 1933, as amended. These securities may be sold in certain transactions in reliance on an exemption from registration (normally to qualified institutional buyers). At April 30, 2024, the aggregate value of these securities is $909,635,445 or 15.2% of the Portfolio's net assets. |
| (2) | Variable rate security. The stated interest rate represents the rate in effect at April 30, 2024. |
| (3) | For fair value measurement disclosure purposes, security is categorized as Level 3 (see Note 8). |
| (4) | Non-income producing security. |
| (5) | Security was acquired in connection with a restructuring of a Senior Loan and may be subject to restrictions on resale. |
| (6) | Amount is less than 0.05%. |
| (7) | Senior floating-rate loans (Senior Loans) often require prepayments from excess cash flows or permit the borrowers to repay at their election. The degree to which borrowers repay, whether as a contractual requirement or at their election, cannot be predicted with accuracy. As a result, the actual remaining maturity may be substantially less than the stated maturities shown. However, Senior Loans will typically have an expected average life of approximately two to four years. Senior Loans typically have rates of interest which are redetermined periodically by reference to a base lending rate, plus a spread. These base lending rates are primarily the Secured Overnight Financing Rate (“SOFR”) and secondarily, the prime rate offered by one or more major United States banks (the “Prime Rate”). Base lending rates may be subject to a floor, or minimum rate. Rates for SOFR are generally 1 or 3-month tenors and may also be subject to a credit spread adjustment. Senior Loans are generally subject to contractual restrictions that must be satisfied before they can be bought or sold. |
| (8) | Unfunded or partially unfunded loan commitments. The stated interest rate reflects the weighted average of the reference rate and spread for the funded portion, if any, and the commitment fees on the portion of the loan that is unfunded. At April 30, 2024, the total value of unfunded loan commitments is $9,005,716. See Note 1F for description. |
| (9) | This Senior Loan will settle after April 30, 2024, at which time the interest rate will be determined. |
| (10) | The stated interest rate represents the weighted average interest rate at April 30, 2024 of contracts within the senior loan facility. Interest rates on contracts are primarily redetermined either monthly or quarterly by reference to the indicated base lending rate and spread and the reset period. |
| (11) | Issuer is in default with respect to interest and/or principal payments or has declared bankruptcy. For a variable rate security, interest rate has been adjusted to reflect non-accrual status. |
| (12) | May be deemed to be an affiliated investment company. The rate shown is the annualized seven-day yield as of April 30, 2024. |
| Forward Foreign Currency Exchange Contracts (OTC) |
| Currency Purchased | Currency Sold | Counterparty | Settlement
Date | Unrealized
Appreciation | Unrealized
(Depreciation) |
| USD | 321,581,709 | EUR | 297,407,318 | Standard Chartered Bank | 5/3/24 | $ 4,188,455 | $ — |
| GBP | 657,106 | USD | 830,173 | Citibank, N.A. | 5/31/24 | — | (8,966) |
| USD | 28,331,113 | EUR | 26,000,000 | Bank of America, N.A. | 5/31/24 | 552,994 | — |
| USD | 28,052,467 | EUR | 25,749,948 | Bank of America, N.A. | 5/31/24 | 541,501 | — |
38
See Notes to Financial Statements.
Senior Debt Portfolio
April 30, 2024
Portfolio of Investments (Unaudited) — continued
| Forward Foreign Currency Exchange Contracts (OTC) (continued) |
| Currency Purchased | Currency Sold | Counterparty | Settlement
Date | Unrealized
Appreciation | Unrealized
(Depreciation) |
| USD | 25,882,690 | EUR | 23,760,000 | Bank of America, N.A. | 5/31/24 | $ 497,763 | $ — |
| USD | 24,026,081 | EUR | 22,050,000 | Bank of America, N.A. | 5/31/24 | 468,100 | — |
| USD | 28,659,775 | EUR | 26,300,000 | State Street Bank and Trust Company | 5/31/24 | 561,139 | — |
| USD | 28,320,134 | EUR | 26,000,000 | State Street Bank and Trust Company | 5/31/24 | 542,014 | — |
| USD | 28,051,661 | EUR | 25,750,000 | State Street Bank and Trust Company | 5/31/24 | 540,639 | — |
| USD | 15,683,921 | GBP | 12,357,000 | HSBC Bank USA, N.A. | 5/31/24 | 240,963 | — |
| USD | 15,689,102 | GBP | 12,357,319 | State Street Bank and Trust Company | 5/31/24 | 245,745 | — |
| USD | 318,404,992 | EUR | 297,407,318 | Standard Chartered Bank | 6/4/24 | 605,934 | — |
| USD | 182,074,971 | EUR | 167,706,113 | State Street Bank and Trust Company | 6/28/24 | 2,678,800 | — |
| | | | | | | $11,664,047 | $(8,966) |
| Abbreviations: |
| DIP | – Debtor In Possession |
| EURIBOR | – Euro Interbank Offered Rate |
| LIBOR | – London Interbank Offered Rate |
| OTC | – Over-the-counter |
| PCL | – Public Company Limited |
| PIK | – Payment In Kind |
| SOFR | – Secured Overnight Financing Rate |
| SONIA | – Sterling Overnight Interbank Average |
| Currency Abbreviations: |
| EUR | – Euro |
| GBP | – British Pound Sterling |
| USD | – United States Dollar |
39
See Notes to Financial Statements.
Senior Debt Portfolio
April 30, 2024
Statement of Assets and Liabilities (Unaudited)
| | April 30, 2024 |
| Assets | |
| Unaffiliated investments, at value (identified cost $7,538,882,074) | $ 7,281,744,669 |
| Affiliated investments, at value (identified cost $145,801,002) | 145,801,002 |
| Cash | 34,132,802 |
| Deposits for derivatives collateral — forward foreign currency exchange contracts | 8,221,000 |
| Foreign currency, at value (identified cost $35,978,261) | 35,697,850 |
| Interest receivable | 44,961,290 |
| Dividends receivable from affiliated investments | 426,040 |
| Receivable for investments sold | 79,726,928 |
| Receivable for open forward foreign currency exchange contracts | 11,664,047 |
| Prepaid upfront fees on notes payable | 3,203 |
| Trustees' deferred compensation plan | 282,817 |
| Prepaid expenses | 91,621 |
| Total assets | $7,642,753,269 |
| Liabilities | |
| Notes payable | $ 1,450,000,000 |
| Cash collateral due to broker | 8,221,000 |
| Payable for investments purchased | 187,855,541 |
| Payable for open forward foreign currency exchange contracts | 8,966 |
| Payable to affiliates: | |
| Investment adviser fee | 2,544,292 |
| Trustees' fees | 9,042 |
| Trustees' deferred compensation plan | 282,817 |
| Accrued expenses | 7,180,980 |
| Total liabilities | $1,656,102,638 |
| Net Assets applicable to investors' interest in Portfolio | $5,986,650,631 |
40
See Notes to Financial Statements.
Senior Debt Portfolio
April 30, 2024
Statement of Operations (Unaudited)
| | Six Months Ended |
| | April 30, 2024 |
| Investment Income | |
| Dividend income | $ 959,569 |
| Dividend income from affiliated investments | 2,363,868 |
| Interest income | 340,846,495 |
| Other income | 6,080,042 |
| Total investment income | $ 350,249,974 |
| Expenses | |
| Investment adviser fee | $ 15,501,820 |
| Trustees’ fees and expenses | 54,250 |
| Custodian fee | 619,514 |
| Legal and accounting services | 239,089 |
| Interest expense and fees | 51,963,560 |
| Miscellaneous | 222,204 |
| Total expenses | $ 68,600,437 |
| Deduct: | |
| Waiver and/or reimbursement of expenses by affiliates | $ 70,155 |
| Total expense reductions | $ 70,155 |
| Net expenses | $ 68,530,282 |
| Net investment income | $ 281,719,692 |
| Realized and Unrealized Gain (Loss) | |
| Net realized gain (loss): | |
| Investment transactions | $ (126,305,220) |
| Foreign currency transactions | (1,398,653) |
| Forward foreign currency exchange contracts | (2,139,391) |
| Net realized loss | $(129,843,264) |
| Change in unrealized appreciation (depreciation): | |
| Investments | $ 244,500,848 |
| Foreign currency | (1,295,345) |
| Forward foreign currency exchange contracts | 3,706,065 |
| Net change in unrealized appreciation (depreciation) | $ 246,911,568 |
| Net realized and unrealized gain | $ 117,068,304 |
| Net increase in net assets from operations | $ 398,787,996 |
41
See Notes to Financial Statements.
Senior Debt Portfolio
April 30, 2024
Statements of Changes in Net Assets
| | Six Months Ended
April 30, 2024
(Unaudited) | Year Ended
October 31, 2023 |
| Increase (Decrease) in Net Assets | | |
| From operations: | | |
| Net investment income | $ 281,719,692 | $ 570,952,434 |
| Net realized loss | (129,843,264) | (321,860,745) |
| Net change in unrealized appreciation (depreciation) | 246,911,568 | 496,644,025 |
| Net increase in net assets from operations | $ 398,787,996 | $ 745,735,714 |
| Capital transactions: | | |
| Contributions | $ 167,568,807 | $ 365,123,130 |
| Withdrawals | (455,171,559) | (2,604,898,648) |
| Net decrease in net assets from capital transactions | $ (287,602,752) | $(2,239,775,518) |
| Net increase (decrease) in net assets | $ 111,185,244 | $(1,494,039,804) |
| Net Assets | | |
| At beginning of period | $ 5,875,465,387 | $ 7,369,505,191 |
| At end of period | $5,986,650,631 | $ 5,875,465,387 |
42
See Notes to Financial Statements.
Senior Debt Portfolio
April 30, 2024
Statement of Cash Flows (Unaudited)
| | Six Months Ended |
| | April 30, 2024 |
| Cash Flows From Operating Activities | |
| Net increase in net assets from operations | $ 398,787,996 |
| Adjustments to reconcile net increase in net assets from operations to net cash provided by operating activities: | |
| Investments purchased | (1,088,289,186) |
| Investments sold and principal repayments | 1,253,916,019 |
| Increase in short-term investments, net | (62,228,424) |
| Net amortization/accretion of premium (discount) | (10,159,206) |
| Amortization of prepaid upfront fees on notes payable | 1,397,054 |
| Decrease in interest receivable | 3,160,001 |
| Increase in dividends receivable from affiliated investments | (28,383) |
| Increase in Trustees’ deferred compensation plan | (9,670) |
| Increase in cash collateral due to broker | 8,221,000 |
| Decrease in payable to affiliate for investment adviser fee | (89,908) |
| Increase in payable to affiliate for Trustees' deferred compensation plan | 9,670 |
| Increase in accrued expenses | 187,343 |
| Increase in unfunded loan commitments | 2,173,503 |
| Net change in unrealized (appreciation) depreciation from investments | (244,500,848) |
| Net change in unrealized (appreciation) depreciation from forward foreign currency exchange contracts | (3,706,065) |
| Net realized loss from investments | 126,305,220 |
| Net cash provided by operating activities | $ 385,146,116 |
| Cash Flows From Financing Activities | |
| Proceeds from capital contributions | $ 167,568,807 |
| Payments for capital withdrawals | (455,171,559) |
| Proceeds from notes payable | 250,000,000 |
| Repayments of notes payable | (325,000,000) |
| Payment of prepaid upfront fees on notes payable | (92,877) |
| Net cash used in financing activities | $ (362,695,629) |
| Net increase in cash and restricted cash* | $ 22,450,487 |
| Cash and restricted cash at beginning of period (including foreign currency) | $ 55,601,165 |
| Cash and restricted cash at end of period (including foreign currency) | $ 78,051,652 |
| Supplemental disclosure of cash flow information: | |
| Cash paid for interest and fees on borrowings | $ 51,959,301 |
| * | Includes net change in unrealized (appreciation) depreciation on foreign currency of $304,359. |
The following table provides a reconciliation of cash and restricted cash reported within the Statement of Assets and Liabilities that sum to the total of such amounts shown on the Statement of Cash Flows.
| | |
| | April 30, 2024 |
| Cash | $ 34,132,802 |
| Deposits for derivatives collateral — forward foreign currency exchange contracts | 8,221,000 |
| Foreign currency | 35,697,850 |
| Total cash and restricted cash as shown on the Statement of Cash Flows | $78,051,652 |
43
See Notes to Financial Statements.
Senior Debt Portfolio
April 30, 2024
| | Six Months Ended
April 30, 2024
(Unaudited) | Year Ended October 31, |
| | 2023 | 2022 | 2021 | 2020 | 2019 |
| Ratios/Supplemental Data | | | | | | |
| Ratios (as a percentage of average daily net assets): | | | | | | |
| Expenses excluding interest and fees | 0.56% (1) | 0.56% | 0.52% | 0.53% | 0.56% | 0.55% |
| Interest and fee expense | 1.78% (1) | 1.81% | 0.47% | 0.32% | 0.60% | 0.88% |
| Total expenses | 2.34% (1)(2) | 2.37% (2) | 0.99% (2) | 0.85% | 1.16% | 1.43% |
| Net investment income | 9.63% (1) | 9.01% | 5.16% | 4.19% | 4.86% | 5.63% |
| Portfolio Turnover | 15% (3) | 18% | 27% | 28% | 30% | 17% |
| Total Return | 6.94% (3) | 12.42% | (4.22)% | 9.75% | 0.39% | 2.04% |
| Net assets, end of period (000’s omitted) | $5,986,651 | $5,875,465 | $7,369,505 | $8,423,553 | $5,449,434 | $7,343,453 |
| (1) | Annualized. |
| (2) | Includes a reduction by the investment adviser of a portion of its adviser fee due to the Portfolio's investment in the Liquidity Fund (equal to less than 0.005% of average daily net assets for the six months ended April 30, 2024 and the years ended October 31, 2023 and 2022). |
| (3) | Not annualized. |
44
See Notes to Financial Statements.
Senior Debt Portfolio
April 30, 2024
Notes to Financial Statements (Unaudited)
1 Significant Accounting Policies
Senior Debt Portfolio (the Portfolio) is a Massachusetts business trust registered under the Investment Company Act of 1940, as amended (the 1940 Act), as an open-end management investment company. The Portfolio’s investment objective is to provide a high level of current income. The Declaration of Trust permits the Trustees to issue interests in the Portfolio. At April 30, 2024, Eaton Vance Floating-Rate Advantage Fund, Eaton Vance Strategic Income Fund (formerly, Eaton Vance Short Duration Strategic Income Fund) and Eaton Vance Short Duration Inflation-Protected Income Fund held an interest of 96.6%, 1.7% and 1.7%, respectively, in the Portfolio.
The following is a summary of significant accounting policies of the Portfolio. The policies are in conformity with accounting principles generally accepted in the United States of America (U.S. GAAP). The Portfolio is an investment company and follows accounting and reporting guidance in the Financial Accounting Standards Board (FASB) Accounting Standards Codification Topic 946.
A Investment Valuation—The following methodologies are used to determine the market value or fair value of investments.
Senior Floating-Rate Loans. Interests in senior floating-rate loans (Senior Loans) are valued generally at the average mean of bid and ask quotations obtained from a third party pricing service. Senior Loans, for which a valuation is not available or deemed unreliable, are fair valued by the investment adviser utilizing one or more of the valuation techniques described below to assess the likelihood that the borrower will make a full repayment of the loan underlying such Senior Loan. If the investment adviser believes that there is a reasonable likelihood of full repayment, the investment adviser will determine fair value using a matrix pricing approach that considers the yield on the Senior Loan relative to yields on other Senior Loans issued by companies of comparable credit quality. If the investment adviser believes there is not a reasonable likelihood of full repayment, the investment adviser will determine fair value using analyses that include, but are not limited to: (i) a comparison of the value of the borrower’s outstanding equity and debt to that of comparable public companies; (ii) a discounted cash flow analysis; or (iii) when the investment adviser believes it is likely that a borrower will be liquidated or sold, an analysis of the terms of such liquidation or sale. In certain cases, the investment adviser will use a combination of analytical methods to determine fair value, such as when only a portion of a borrower’s assets are likely to be sold. In conducting its assessment and analyses for purposes of determining fair value of a Senior Loan, the investment adviser will use its discretion and judgment in considering and appraising relevant factors. Junior Loans (i.e., subordinated loans and second lien loans) are valued in the same manner as Senior Loans.
Debt Obligations. Debt obligations are generally valued on the basis of valuations provided by third party pricing services, as derived from such services’ pricing models. Inputs to the models may include, but are not limited to, reported trades, executable bid and ask prices, broker/dealer quotations, prices or yields of securities with similar characteristics, interest rates, anticipated prepayments, benchmark curves or information pertaining to the issuer, as well as industry and economic events. The pricing services may use a matrix approach, which considers information regarding securities with similar characteristics to determine the valuation for a security. Short-term debt obligations purchased with a remaining maturity of sixty days or less for which a valuation from a third party pricing service is not readily available may be valued at amortized cost, which approximates fair value.
Equity Securities. Equity securities listed on a U.S. securities exchange generally are valued at the last sale or closing price on the day of valuation or, if no sales took place on such date, at the mean between the closing bid and ask prices on the exchange where such securities are principally traded. Equity securities listed on the NASDAQ National Market System are valued at the NASDAQ official closing price. Unlisted or listed securities for which closing sales prices or closing quotations are not available are valued at the mean between the latest available bid and ask prices or, in the case of preferred equity securities that are not listed or traded in the over-the-counter market, by a third party pricing service that uses various techniques that consider factors including, but not limited to, prices or yields of securities with similar characteristics, benchmark yields, broker/dealer quotes, quotes of underlying common stock, issuer spreads, as well as industry and economic events.
Derivatives. Forward foreign currency exchange contracts are generally valued at the mean of the average bid and average ask prices that are reported by currency dealers to a third party pricing service at the valuation time. Such third party pricing service valuations are supplied for specific settlement periods and the Portfolio’s forward foreign currency exchange contracts are valued at an interpolated rate between the closest preceding and subsequent settlement period reported by the third party pricing service.
Foreign Securities and Currencies. Foreign securities and currencies are valued in U.S. dollars, based on foreign currency exchange rate quotations supplied by a third party pricing service. The pricing service uses a proprietary model to determine the exchange rate. Inputs to the model include reported trades and implied bid/ask spreads.
Other. Investments in management investment companies (including money market funds) that do not trade on an exchange are valued at the net asset value as of the close of each business day.
Fair Valuation. In connection with Rule 2a-5 of the 1940 Act, the Trustees have designated the Portfolio’s investment adviser as its valuation designee. Investments for which valuations or market quotations are not readily available or are deemed unreliable are valued by the investment adviser, as valuation designee, at fair value using methods that most fairly reflect the security’s “fair value”, which is the amount that the Portfolio might reasonably expect to receive for the security upon its current sale in the ordinary course. Each such determination is based on a consideration of relevant factors, which are likely to vary from one pricing context to another. These factors may include, but are not limited to, the type of security, the existence of any contractual restrictions on the security’s disposition, the price and extent of public trading in similar securities of the issuer or of comparable companies or entities,
Senior Debt Portfolio
April 30, 2024
Notes to Financial Statements (Unaudited) — continued
quotations or relevant information obtained from broker/dealers or other market participants, information obtained from the issuer, analysts, and/or the appropriate stock exchange (for exchange-traded securities), an analysis of the company’s or entity’s financial statements, and an evaluation of the forces that influence the issuer and the market(s) in which the security is purchased and sold.
B Investment Transactions—Investment transactions for financial statement purposes are accounted for on a trade date basis. Realized gains and losses on investments sold are determined on the basis of identified cost.
C Income—Interest income is recorded on the basis of interest accrued, adjusted for amortization of premium or accretion of discount. Fees associated with loan amendments are recognized immediately. Dividend income is recorded on the ex-dividend date for dividends received in cash and/or securities. Withholding taxes on foreign dividends have been provided for in accordance with the Portfolio’s understanding of the applicable countries’ tax rules and rates. Distributions from investment companies are recorded as dividend income, capital gains or return of capital based on the nature of the distribution.
D Federal Taxes—The Portfolio has elected to be treated as a partnership for federal tax purposes. No provision is made by the Portfolio for federal or state taxes on any taxable income of the Portfolio because each investor in the Portfolio is ultimately responsible for the payment of any taxes on its share of taxable income. Since at least one of the Portfolio's investors is a regulated investment company that invests all or substantially all of its assets in the Portfolio, the Portfolio normally must satisfy the applicable source of income and diversification requirements (under the Internal Revenue Code) in order for its investors to satisfy them. The Portfolio will allocate, at least annually among its investors, each investor's distributive share of the Portfolio's net investment income, net realized capital gains and losses and any other items of income, gain, loss, deduction or credit.
As of April 30, 2024, the Portfolio had no uncertain tax positions that would require financial statement recognition, de-recognition, or disclosure. The Portfolio files a U.S. federal income tax return annually after its fiscal year-end, which is subject to examination by the Internal Revenue Service for a period of three years from the date of filing.
E Foreign Currency Translation—Investment valuations, other assets, and liabilities initially expressed in foreign currencies are translated each business day into U.S. dollars based upon current exchange rates. Purchases and sales of foreign investment securities and income and expenses denominated in foreign currencies are translated into U.S. dollars based upon currency exchange rates in effect on the respective dates of such transactions. Recognized gains or losses on investment transactions attributable to changes in foreign currency exchange rates are recorded for financial statement purposes as net realized gains and losses on investments. That portion of unrealized gains and losses on investments that results from fluctuations in foreign currency exchange rates is not separately disclosed.
F Unfunded Loan Commitments—The Portfolio may enter into certain loan agreements all or a portion of which may be unfunded. The Portfolio is obligated to fund these commitments at the borrower's discretion. These commitments are disclosed in the accompanying Portfolio of Investments. At April 30, 2024, the Portfolio had sufficient cash and/or securities to cover these commitments.
G Use of Estimates—The preparation of the financial statements in conformity with U.S. GAAP requires management to make estimates and assumptions that affect the reported amounts of assets and liabilities at the date of the financial statements and the reported amounts of income and expense during the reporting period. Actual results could differ from those estimates.
H Indemnifications—Under the Portfolio’s organizational documents, its officers and Trustees may be indemnified against certain liabilities and expenses arising out of the performance of their duties to the Portfolio. Under Massachusetts law, if certain conditions prevail, interestholders in the Portfolio could be deemed to have personal liability for the obligations of the Portfolio. However, the Portfolio’s Declaration of Trust contains an express disclaimer of liability on the part of Portfolio interestholders. Additionally, in the normal course of business, the Portfolio enters into agreements with service providers that may contain indemnification clauses. The Portfolio’s maximum exposure under these arrangements is unknown as this would involve future claims that may be made against the Portfolio that have not yet occurred.
I Forward Foreign Currency Exchange Contracts—The Portfolio may enter into forward foreign currency exchange contracts for the purchase or sale of a specific foreign currency at a fixed price on a future date. The forward foreign currency exchange contracts are adjusted by the daily exchange rate of the underlying currency and any gains or losses are recorded as unrealized until such time as the contracts have been closed. Risks may arise upon entering these contracts from the potential inability of counterparties to meet the terms of their contracts and from movements in the value of a foreign currency relative to the U.S. dollar.
J When-Issued Securities and Delayed Delivery Transactions—The Portfolio may purchase securities on a delayed delivery or when-issued basis. Payment and delivery may take place after the customary settlement period for that security. At the time the transaction is negotiated, the price of the security that will be delivered is fixed. The Portfolio maintains cash and/or security positions for these commitments such that sufficient liquid assets will be available to make payments upon settlement. Securities purchased on a delayed delivery or when-issued basis are marked-to-market daily and begin earning interest on settlement date. Such security purchases are subject to the risk that when delivered they will be worth less than the agreed upon payment price. Losses may also arise if the counterparty does not perform under the contract.
Senior Debt Portfolio
April 30, 2024
Notes to Financial Statements (Unaudited) — continued
K Interim Financial Statements—The interim financial statements relating to April 30, 2024 and for the six months then ended have not been audited by an independent registered public accounting firm, but in the opinion of the Portfolio’s management, reflect all adjustments, consisting only of normal recurring adjustments, necessary for the fair presentation of the financial statements.
2 Investment Adviser Fee and Other Transactions with Affiliates
The investment adviser fee is earned by Boston Management and Research (BMR), an indirect, wholly-owned subsidiary of Morgan Stanley, as compensation for investment advisory services rendered to the Portfolio. The fee is computed at an annual rate as a percentage of average daily gross assets as follows and is payable monthly:
| Average Daily Gross Assets | Annual Fee Rate |
| Up to and including $1 billion | 0.5000% |
| In excess of $1 billion up to and including $2 billion | 0.4500% |
| In excess of $2 billion up to and including $7 billion | 0.4000% |
| In excess of $7 billion up to and including $10 billion | 0.3875% |
| In excess of $10 billion up to and including $15 billion | 0.3750% |
| In excess of $15 billion | 0.3625% |
Gross assets are calculated by deducting all liabilities of the Portfolio except the principal amount of any indebtedness for money borrowed. For the six months ended April 30, 2024, the Portfolio’s investment adviser fee amounted to $15,501,820 or 0.53% (annualized) of the Portfolio's average daily net assets. The Portfolio may invest in a money market fund, the Institutional Class of the Morgan Stanley Institutional Liquidity Funds - Government Portfolio (the “Liquidity Fund”), an open-end management investment company managed by Morgan Stanley Investment Management Inc., a wholly-owned subsidiary of Morgan Stanley. The investment adviser fee paid by the Portfolio is reduced by an amount equal to its pro rata share of the advisory and administration fees paid by the Portfolio due to its investment in the Liquidity Fund. For the six months ended April 30, 2024, the investment adviser fee paid was reduced by $70,155 relating to the Portfolio's investment in the Liquidity Fund.
During the six months ended April 30, 2024, EVM reimbursed the Portfolio $7,603 for a net realized loss due to a trading error. The amount of the
reimbursement had an impact on total return of less than 0.01%.
Trustees and officers of the Portfolio who are members of BMR’s organization receive remuneration for their services to the Portfolio out of the investment adviser fee. Trustees of the Portfolio who are not affiliated with the investment adviser may elect to defer receipt of all or a percentage of their annual fees in accordance with the terms of the Trustees Deferred Compensation Plan. Certain officers and Trustees of the Portfolio are officers of the above organization.
3 Purchases and Sales of Investments
Purchases and sales of investments, other than short-term obligations and including maturities, paydowns and principal repayments on Senior Loans, aggregated $1,092,519,519 and $1,266,210,769, respectively, for the six months ended April 30, 2024.
4 Federal Income Tax Basis of Investments
The cost and unrealized appreciation (depreciation) of investments, including open derivative contracts, of the Portfolio at April 30, 2024, as determined on a federal income tax basis, were as follows:
| Aggregate cost | $7,615,127,661 |
| Gross unrealized appreciation | $ 146,832,941 |
| Gross unrealized depreciation | (322,759,850) |
| Net unrealized depreciation | $ (175,926,909) |
Senior Debt Portfolio
April 30, 2024
Notes to Financial Statements (Unaudited) — continued
5 Financial Instruments
The Portfolio may trade in financial instruments with off-balance sheet risk in the normal course of its investing activities. These financial instruments may include forward foreign currency exchange contracts and may involve, to a varying degree, elements of risk in excess of the amounts recognized for financial statement purposes. The notional or contractual amounts of these instruments represent the investment the Portfolio has in particular classes of financial instruments and do not necessarily represent the amounts potentially subject to risk. The measurement of the risks associated with these instruments is meaningful only when all related and offsetting transactions are considered. A summary of obligations under these financial instruments at April 30, 2024 is included in the Portfolio of Investments. At April 30, 2024, the Portfolio had sufficient cash and/or securities to cover commitments under these contracts.
The Portfolio is subject to foreign exchange risk in the normal course of pursuing its investment objective. Because the Portfolio holds foreign currency denominated investments, the value of these investments and related receivables and payables may change due to future changes in foreign currency exchange rates. To hedge against this risk, the Portfolio enters into forward foreign currency exchange contracts.
The Portfolio enters into forward foreign currency exchange contracts that may contain provisions whereby the counterparty may terminate the contract under certain conditions, including but not limited to a decline in the Portfolio's net assets below a certain level over a certain period of time, which would trigger a payment by the Portfolio for those derivatives in a liability position. At April 30, 2024, the fair value of derivatives with credit related contingent features in a net liability position was $8,966. At April 30, 2024, there were no assets pledged by the Portfolio for such liability.
The over-the-counter (OTC) derivatives in which the Portfolio invests are subject to the risk that the counterparty to the contract fails to perform its obligations under the contract. To mitigate this risk, the Portfolio has entered into an International Swaps and Derivatives Association, Inc. Master Agreement (“ISDA Master Agreement”) or similar agreement with substantially all its derivative counterparties. An ISDA Master Agreement is a bilateral agreement between the Portfolio and a counterparty that governs certain OTC derivatives and typically contains, among other things, set-off provisions in the event of a default and/or termination event as defined under the relevant ISDA Master Agreement. Under an ISDA Master Agreement, the Portfolio may, under certain circumstances, offset with the counterparty certain derivative financial instruments’ payables and/or receivables with collateral held and/or posted and create one single net payment. The provisions of the ISDA Master Agreement typically permit a single net payment in the event of default including the bankruptcy or insolvency of the counterparty. However, bankruptcy or insolvency laws of a particular jurisdiction may impose restrictions on or prohibitions against the right of offset in bankruptcy or insolvency. Certain ISDA Master Agreements allow counterparties to OTC derivatives to terminate derivative contracts prior to maturity in the event the Portfolio’s net assets decline by a stated percentage or the Portfolio fails to meet the terms of its ISDA Master Agreements, which would cause the counterparty to accelerate payment by the Portfolio of any net liability owed to it.
The collateral requirements for derivatives traded under an ISDA Master Agreement are governed by a Credit Support Annex to the ISDA Master Agreement. Collateral requirements are determined at the close of business each day and are typically based on changes in market values for each transaction under an ISDA Master Agreement and netted into one amount for such agreement. Generally, the amount of collateral due from or to a counterparty is subject to a minimum transfer threshold amount before a transfer is required, which may vary by counterparty. Collateral pledged for the benefit of the Portfolio and/or counterparty is held in segregated accounts by the Portfolio’s custodian and cannot be sold, re-pledged, assigned or otherwise used while pledged. The portion of such collateral representing cash, if any, is reflected as deposits for derivatives collateral and, in the case of cash pledged by a counterparty for the benefit of the Portfolio, a corresponding liability on the Statement of Assets and Liabilities. Securities pledged by the Portfolio as collateral, if any, are identified as such in the Portfolio of Investments.The carrying amount of the liability for cash collateral due to broker at April 30, 2024 approximated its fair value. If measured at fair value, such liability would have been considered as Level 2 in the fair value hierarchy (see Note 8) at April 30, 2024.
The fair value of open derivative instruments (not considered to be hedging instruments for accounting disclosure purposes) and whose primary underlying risk exposure is foreign exchange risk at April 30, 2024 was as follows:
| | Fair Value |
| Derivative | Asset Derivative(1) | Liability Derivative(2) |
| Forward foreign currency exchange contracts | $11,664,047 | $(8,966) |
| (1) | Statement of Assets and Liabilities location: Receivable for open forward foreign currency exchange contracts. |
| (2) | Statement of Assets and Liabilities location: Payable for open forward foreign currency exchange contracts. |
Senior Debt Portfolio
April 30, 2024
Notes to Financial Statements (Unaudited) — continued
The Portfolio's derivative assets and liabilities at fair value by type, which are reported gross in the Statement of Assets and Liabilities, are presented in the table above.The following tables present the Portfolio’s derivative assets and liabilities by counterparty, net of amounts available for offset under a master netting agreement and net of the related collateral received by the Portfolio for such assets and pledged by the Portfolio for such liabilities as of April 30, 2024.
| Counterparty | Derivative
Assets Subject to
Master Netting
Agreement | Derivatives
Available
for Offset | Non-cash
Collateral
Received(a) | Cash
Collateral
Received(a) | Net Amount
of Derivative
Assets(b) |
| Bank of America, N.A. | $ 2,060,358 | $ — | $ — | $ (1,560,000) | $ 500,358 |
| HSBC Bank USA, N.A. | 240,963 | — | (166,413) | — | 74,550 |
| Standard Chartered Bank | 4,794,389 | — | — | (2,890,000) | 1,904,389 |
| State Street Bank and Trust Company | 4,568,337 | — | — | (3,771,000) | 797,337 |
| | $11,664,047 | $ — | $(166,413) | $(8,221,000) | $3,276,634 |
| Counterparty | Derivative
Liabilities Subject to
Master Netting
Agreement | Derivatives
Available
for Offset | Non-cash
Collateral
Pledged(a) | Cash
Collateral
Pledged(a) | Net Amount
of Derivative
Liabilities(c) |
| Citibank, N.A. | $(8,966) | $ — | $ — | $ — | $(8,966) |
| (a) | In some instances, the total collateral received and/or pledged may be more than the amount shown due to overcollateralization. |
| (b) | Net amount represents the net amount due from the counterparty in the event of default. |
| (c) | Net amount represents the net amount payable to the counterparty in the event of default. |
The effect of derivative instruments (not considered to be hedging instruments for accounting disclosure purposes) on the Statement of Operations and whose primary underlying risk exposure is foreign exchange risk for the six months ended April 30, 2024 was as follows:
| Derivative | Realized Gain (Loss)
on Derivatives Recognized
in Income(1) | Change in Unrealized
Appreciation (Depreciation) on
Derivatives Recognized in Income(2) |
| Forward foreign currency exchange contracts | $(2,139,391) | $3,706,065 |
| (1) | Statement of Operations location: Net realized gain (loss): Forward foreign currency exchange contracts. |
| (2) | Statement of Operations location: Change in unrealized appreciation (depreciation): Forward foreign currency exchange contracts. |
The average notional amount of forward foreign currency exchange contracts (based on the absolute value of notional amounts of currency purchased and currency sold) outstanding during the six months ended April 30, 2024, which is indicative of the volume of this derivative type, was approximately $1,071,935,000.
6 Revolving Credit and Security Agreement
The Portfolio has entered into a Revolving Credit and Security Agreement, as amended (the “Loan Facility”), with The Bank of Nova Scotia as direct lender and agent and certain other banks as direct lenders that allows it to borrow up to $2.525 billion and to invest the borrowings in accordance with its investment practices. Borrowings under the Loan Facility are secured by the assets of the Portfolio. The Loan Facility was in effect through March 4, 2024 and extended through May 3, 2024. Interest is generally charged at a rate equal to the 1-Month Term Secured Overnight Financing Rate (SOFR) plus 0.11448% credit spread adjustment. The Portfolio paid an upfront fee equal to 0.15% of the total commitment amount under the Loan Facility, which was amortized to interest expense through March 4, 2024. The Portfolio also paid (1) a drawn fee equal to 0.90% per annum on outstanding borrowings, and (2) a liquidity fee equal to 0.25% per annum of the undrawn amount under the Loan Facility. For periods prior to March 4, 2024, the liquidity fee was equal to 0.15% or 0.25% per annum of the undrawn amount under the Loan Facility depending on the amount borrowed by the Portfolio thereunder.
Senior Debt Portfolio
April 30, 2024
Notes to Financial Statements (Unaudited) — continued
Drawn and liquidity fees for the six months ended April 30, 2024 totaled $7,952,708 and are included in interest expense and fees on the Statement of Operations. In connection with the extension of the Loan Facility on March 4, 2024, the Portfolio paid an upfront fee of $92,877 which was being amortized to interest expense through May 3, 2024. The unamortized balance at April 30, 2024 is approximately $3,000 and is included in prepaid upfront fees on notes payable on the Statement of Assets and Liabilities. At April 30, 2024, the Portfolio had borrowings outstanding under the Loan Facility of $1,450,000,000 at an annual interest rate of 5.44%. Based on the short-term nature of borrowings under the Loan Facility and the variable interest rate, the carrying amount of the borrowings at April 30, 2024 approximated its fair value. If measured at fair value, borrowings under the Loan Facility would have been considered as Level 2 in the fair value hierarchy (see Note 8) at April 30, 2024. For the six months ended April 30, 2024, the average borrowings under the Loan Facility and the average annual interest rate (excluding fees) were $1,547,527,474 and 5.45%, respectively.
Effective May 2, 2024, the expiration date of the Loan Facility was extended to May 1, 2025. In connection with the extension of the expiration date, the total facility size was decreased to $2 billion, The Bank of Nova Scotia was replaced by Toronto Dominion Bank as direct lender and agent and the drawn fee was changed to 0.95% per annum. An upfront fee of $3 million and agency services fees of $600,000 were paid at this time.
7 Affiliated Investments
At April 30, 2024, the value of the Portfolio's investment in funds that may be deemed to be affiliated was $145,801,002, which represents 2.4% of the Portfolio's net assets. Transactions in such investments by the Portfolio for the six months ended April 30, 2024 were as follows:
| Name | Value,
beginning
of period | Purchases | Sales
proceeds | Net realized
gain (loss) | Change in
unrealized
appreciation
(depreciation) | Value, end
of period | Dividend
income | Shares,
end of period |
| Short-Term Investments |
| Liquidity Fund | $83,572,578 | $1,279,179,898 | $(1,216,951,474) | $ — | $ — | $145,801,002 | $2,363,868 | 145,801,002 |
8 Fair Value Measurements
Under generally accepted accounting principles for fair value measurements, a three-tier hierarchy to prioritize the assumptions, referred to as inputs, is used in valuation techniques to measure fair value. The three-tier hierarchy of inputs is summarized in the three broad levels listed below.
| • | Level 1 – quoted prices in active markets for identical investments |
| • | Level 2 – other significant observable inputs (including quoted prices for similar investments, interest rates, prepayment speeds, credit risk, etc.) |
| • | Level 3 – significant unobservable inputs (including a fund's own assumptions in determining the fair value of investments) |
In cases where the inputs used to measure fair value fall in different levels of the fair value hierarchy, the level disclosed is determined based on the lowest level input that is significant to the fair value measurement in its entirety. The inputs or methodology used for valuing securities are not necessarily an indication of the risk associated with investing in those securities.
At April 30, 2024, the hierarchy of inputs used in valuing the Portfolio's investments and open derivative instruments, which are carried at fair value, were as follows:
| Asset Description | Level 1 | Level 2 | Level 3* | Total |
| Asset-Backed Securities | $ — | $ 270,028,964 | $ — | $ 270,028,964 |
| Common Stocks | 363,232 | 54,098,647 | 580,777 | 55,042,656 |
| Corporate Bonds | — | 670,892,643 | — | 670,892,643 |
| Exchange-Traded Funds | 16,120,320 | — | — | 16,120,320 |
| Senior Floating-Rate Loans (Less Unfunded Loan Commitments) | — | 6,252,107,620 | 17,552,466 | 6,269,660,086 |
| Short-Term Investments | 145,801,002 | — | — | 145,801,002 |
| Total Investments | $ 162,284,554 | $ 7,247,127,874 | $ 18,133,243 | $ 7,427,545,671 |
| Forward Foreign Currency Exchange Contracts | $ — | $ 11,664,047 | $ — | $ 11,664,047 |
| Total | $ 162,284,554 | $ 7,258,791,921 | $ 18,133,243 | $ 7,439,209,718 |
Senior Debt Portfolio
April 30, 2024
Notes to Financial Statements (Unaudited) — continued
| Liability Description | Level 1 | Level 2 | Level 3 | Total |
| Forward Foreign Currency Exchange Contracts | $ — | $ (8,966) | $ — | $ (8,966) |
| Total | $ — | $ (8,966) | $ — | $ (8,966) |
| * | None of the unobservable inputs for Level 3 assets, individually or collectively, had a material impact on the Portfolio. |
Level 3 investments at the beginning and/or end of the period in relation to net assets were not significant and accordingly, a reconciliation of Level 3 assets for the six months ended April 30, 2024 is not presented.
9 Risks and Uncertainties
Risks Associated with Foreign Investments
Foreign investments can be adversely affected by political, economic and market developments abroad, including the imposition of economic and other sanctions by the United States or another country. There may be less publicly available information about foreign issuers because they may not be subject to reporting practices, requirements or regulations comparable to those to which United States companies are subject. Foreign markets may be smaller, less liquid and more volatile than the major markets in the United States. Trading in foreign markets typically involves higher expense than trading in the United States. The Portfolio may have difficulties enforcing its legal or contractual rights in a foreign country. Securities that trade or are denominated in currencies other than the U.S. dollar may be adversely affected by fluctuations in currency exchange rates.
Credit Risk
The Portfolio invests primarily in below investment grade floating-rate loans, which are considered speculative because of the credit risk of their issuers. Changes in economic conditions or other circumstances are more likely to reduce the capacity of issuers of these securities to make principal and interest payments. Such companies are more likely to default on their payments of interest and principal owed than issuers of investment grade bonds. An economic downturn generally leads to a higher non-payment rate, and a loan or other debt obligation may lose significant value before a default occurs. Lower rated investments also may be subject to greater price volatility than higher rated investments. Moreover, the specific collateral used to secure a loan may decline in value or become illiquid, which would adversely affect the loan’s value.
Eaton Vance
Floating-Rate Advantage Fund
April 30, 2024
| Officers of Eaton Vance Floating-Rate Advantage Fund and Senior Debt Portfolio |
Kenneth A. Topping
President | Nicholas S. Di Lorenzo
Secretary |
Deidre E. Walsh
Vice President and Chief Legal Officer | Laura T. Donovan
Chief Compliance Officer |
James F. Kirchner
Treasurer | |
| Trustees of Eaton Vance Floating-Rate Advantage Fund and Senior Debt Portfolio | |
George J. Gorman
Chairperson | |
| Alan C. Bowser | |
| Mark R. Fetting | |
| Cynthia E. Frost | |
| Valerie A. Mosley | |
| Anchal Pachnanda* | |
| Keith Quinton | |
| Marcus L. Smith | |
| Susan J. Sutherland | |
| Scott E. Wennerholm | |
| Nancy A. Wiser | |
| U.S. Customer Privacy Notice | March 2024 |
| FACTS | WHAT DOES EATON VANCE DO WITH YOUR PERSONAL INFORMATION? |
| Why? | Financial companies choose how they share your personal information. Federal law gives consumers the right to limit some but not all sharing. Federal law also requires us to tell you how we collect, share, and protect your personal information. Please read this notice carefully to understand what we do. |
| |
| What? | The types of personal information we collect and share depend on the product or service you have with us. This information can include:■ Social Security number and income
■ investment experience and risk tolerance
■ checking account information and wire transfer instructions |
| |
| How? | All financial companies need to share customers’ personal information to run their everyday business. In the section below, we list the reasons financial companies can share their customers’ personal information; the reasons Eaton Vance chooses to share; and whether you can limit this sharing. |
| Reasons we can share your personal information | Does Eaton Vance
share? | Can you limit
this sharing? |
| For our everyday business purposes — such as to process your transactions, maintain your account(s), respond to court orders and legal investigations, or report to credit bureaus | Yes | No |
| For our marketing purposes — to offer our products and services to you | Yes | No |
| For joint marketing with other financial companies | No | We don’t share |
| For our affiliates’ everyday business purposes — information about your transactions and experiences | Yes | No* |
| For our affiliates’ everyday business purposes — information about your creditworthiness | Yes | Yes* |
| For our affiliates to market to you | Yes | Yes* |
| For nonaffiliates to market to you | No | We don’t share |
To limit our
sharing | Call toll-free 1-800-262-1122 or email: EVPrivacy@eatonvance.comPlease note:If you are a new customer, we can begin sharing your information 30 days from the date we sent this notice. When you are no longer our customer, we continue to share your information as described in this notice. However, you can contact us at any time to limit our sharing. |
| Questions? | Call toll-free 1-800-262-1122 or email: EVPrivacy@eatonvance.com |
| U.S. Customer Privacy Notice — continued | March 2024 |
| Who we are |
| Who is providing this notice? | Eaton Vance Management and our investment management affiliates (“Eaton Vance”) (see Affiliates definition below.) |
| What we do |
How does Eaton Vance
protect my personal
information? | To protect your personal information from unauthorized access and use, we use security measures that comply with federal law. These measures include computer safeguards and secured files and buildings. We have policies governing the proper handling of customer information by personnel and requiring third parties that provide support to adhere to appropriate security standards with respect to such information. |
How does Eaton Vance
collect my personal
information? | We collect your personal information, for example, when you■ open an account or make deposits or withdrawals from your account
■ buy securities from us or make a wire transfer
■ give us your contact informationWe also collect your personal information from others, such as credit bureaus, affiliates, or other companies. |
| Why can’t I limit all sharing? | Federal law gives you the right to limit only■ sharing for affiliates’ everyday business purposes — information about your creditworthiness
■ affiliates from using your information to market to you
■ sharing for nonaffiliates to market to youState laws and individual companies may give you additional rights to limit sharing. (See below for more on your rights under state law.) |
What happens when I limit
sharing for an account I hold
jointly with someone else? | Your choices will apply to everyone on your account. |
| Definitions |
| Affiliates | Companies related by common ownership or control. They can be financial and nonfinancial companies.■ Our affiliates include registered investment advisers such as Eaton Vance Management, Eaton Vance Advisers International Ltd., Boston Management and Research, Calvert Research and Management, Parametric Portfolio Associates LLC, Atlanta Capital Management Company LLC, Morgan Stanley Investment Management Inc., Morgan Stanley Investment Management Co.; registered broker-dealers such as Morgan Stanley Distributors Inc. and Eaton Vance Distributors, Inc. (together, the “Investment Management Affiliates”); and companies with a Morgan Stanley name and financial companies such as Morgan Stanley Smith Barney LLC and Morgan Stanley & Co. (the “Morgan Stanley Affiliates”). |
| Nonaffiliates | Companies not related by common ownership or control. They can be financial and nonfinancial companies.■ Eaton Vance does not share with nonaffiliates so they can market to you. |
| Joint marketing | A formal agreement between nonaffiliated financial companies that together market financial products or services to you.■ Eaton Vance does not jointly market. |
| U.S. Customer Privacy Notice — continued | March 2024 |
| Other important information |
| *PLEASE NOTE: Eaton Vance does not share your creditworthiness information or your transactions and experiences information with the Morgan Stanley Affiliates, nor does Eaton Vance enable the Morgan Stanley Affiliates to market to you. Your opt outs will prevent Eaton Vance from sharing your creditworthiness information with the Investment Management Affiliates and will prevent the Investment Management Affiliates from marketing their products to you.Vermont: Except as permitted by law, we will not share personal information we collect about Vermont residents with Nonaffiliates unless you provide us with your written consent to share such information.California: Except as permitted by law, we will not share personal information we collect about California residents with Nonaffiliates and we will limit sharing such personal information with our Affiliates to comply with California privacy laws that apply to us. |
Delivery of Shareholder Documents. The Securities and Exchange Commission (SEC) permits funds to deliver only one copy of shareholder documents, including prospectuses, proxy statements and shareholder reports, to fund investors with multiple accounts at the same residential or post office box address. This practice is often called “householding” and it helps eliminate duplicate mailings to shareholders. Eaton Vance, or your financial intermediary, may household the mailing of your documents indefinitely unless you instruct Eaton Vance, or your financial intermediary, otherwise. If you would prefer that your Eaton Vance documents not be householded, please contact Eaton Vance at 1-800-262-1122, or contact your financial intermediary. Your instructions that householding not apply to delivery of your Eaton Vance documents will typically be effective within 30 days of receipt by Eaton Vance or your financial intermediary.
Portfolio Holdings. Each Eaton Vance Fund and its underlying Portfolio(s) (if applicable) files a schedule of portfolio holdings on Part F to Form N-PORT with the SEC. Certain information filed on Form N-PORT may be viewed on the Eaton Vance website at www.eatonvance.com, by calling Eaton Vance at 1-800-262-1122 or in the EDGAR database on the SEC’s website at www.sec.gov.
Proxy Voting. From time to time, funds are required to vote proxies related to the securities held by the funds. The Eaton Vance Funds or their underlying Portfolios (if applicable) vote proxies according to a set of policies and procedures approved by the Funds’ and Portfolios’ Boards. You may obtain a description of these policies and procedures and information on how the Funds or Portfolios voted proxies relating to portfolio securities during the most recent 12-month period ended June 30, without charge, upon request, by calling 1-800-262-1122 and by accessing the SEC’s website at www.sec.gov.
Tailored Shareholder Reports. Effective January 24, 2023, the SEC adopted rule and form amendments to require open-end mutual funds and ETFs to transmit concise and visually engaging streamlined annual and semi-annual reports to shareholders that highlight key information. Other information, including financial statements, will no longer appear in a streamlined shareholder report but must be available online, delivered free of charge upon request, and filed on a semi-annual basis on Form N-CSR. The rule and form amendments have a compliance date of July 24, 2024. At this time, management is evaluating the impact of these amendments on the shareholder reports for the Eaton Vance Funds.
Investment Adviser of Senior Debt Portfolio
Boston Management and Research
One Post Office Square
Boston, MA 02109
Investment Adviser and Administrator of Eaton Vance
Floating-Rate Advantage Fund
Eaton Vance Management
One Post Office Square
Boston, MA 02109
Principal Underwriter*
Eaton Vance Distributors, Inc.
One Post Office Square
Boston, MA 02109
(617) 482-8260
Custodian
State Street Bank and Trust Company
One Congress Street, Suite 1
Boston, MA 02114-2016
Transfer Agent
BNY Mellon Investment Servicing (US) Inc.
Attn: Eaton Vance Funds
P.O. Box 534439
Pittsburgh, PA 15253-4439
(800) 262-1122
Fund Offices
One Post Office Square
Boston, MA 02109
* FINRA BrokerCheck. Investors may check the background of their Investment Professional by contacting the Financial Industry Regulatory Authority (FINRA). FINRA BrokerCheck is a free tool to help investors check the professional background of current and former FINRA-registered securities firms and brokers. FINRA BrokerCheck is available by calling 1-800-289-9999 and at www.FINRA.org. The FINRA BrokerCheck brochure describing this program is available to investors at www.FINRA.org.
Eaton Vance
Multi-Asset Credit Fund
Semi-Annual Report
April 30, 2024
Commodity Futures Trading Commission Registration. The Commodity Futures Trading Commission (“CFTC”) has adopted regulations that subject registered investment companies and advisers to regulation by the CFTC if a fund invests more than a prescribed level of its assets in certain CFTC-regulated instruments (including futures, certain options and swap agreements) or markets itself as providing investment exposure to such instruments. The investment adviser has claimed an exclusion from the definition of “commodity pool operator” under the Commodity Exchange Act with respect to its management of the Fund. Accordingly, neither the Fund nor the adviser with respect to the operation of the Fund is subject to CFTC regulation. Because of its management of other strategies, the Fund's adviser is registered with the CFTC as a commodity pool operator. The adviser is also registered as a commodity trading advisor.
Fund shares are not insured by the FDIC and are not deposits or other obligations of, or guaranteed by, any depository institution. Shares are subject to investment risks, including possible loss of principal invested.
This report must be preceded or accompanied by a current summary prospectus or prospectus. Before investing, investors should consider carefully the investment objective, risks, and charges and expenses of a mutual fund. This and other important information is contained in the summary prospectus and prospectus, which can be obtained from a financial intermediary. Prospective investors should read the prospectus carefully before investing. For further information, please call 1-800-262-1122.
Semi-Annual Report April 30, 2024
Eaton Vance
Multi-Asset Credit Fund
Eaton Vance
Multi-Asset Credit Fund
April 30, 2024
Performance
Portfolio Manager(s) Justin H. Bourgette, CFA, Daniel P. McElaney, CFA and Kelley Gerrity of Eaton Vance Management; Jeffrey D. Mueller of Eaton Vance Advisers International Ltd.
| % Average Annual Total Returns1,2 | Class
Inception Date | Performance
Inception Date | Six Months | One Year | Five Years | Ten Years |
| Class A at NAV | 10/31/2011 | 10/31/2011 | 7.01% | 9.38% | 3.39% | 3.83% |
| Class A with 3.25% Maximum Sales Charge | — | — | 3.53 | 5.86 | 2.71 | 3.49 |
| Class C at NAV | 10/31/2011 | 10/31/2011 | 6.62 | 8.56 | 2.62 | 3.26 |
| Class C with 1% Maximum Deferred Sales Charge | — | — | 5.62 | 7.56 | 2.62 | 3.26 |
| Class I at NAV | 10/31/2011 | 10/31/2011 | 7.14 | 9.76 | 3.65 | 4.14 |
| Class R6 at NAV | 09/03/2019 | 10/31/2011 | 7.27 | 9.80 | 3.69 | 4.16 |
|
| Morningstar® LSTA® US Leveraged Loan IndexSM | — | — | 6.05% | 11.97% | 5.26% | 4.59% |
| ICE BofA Developed Markets High Yield ex-Subordinated Financials Index – Hedged USD | — | — | 8.73 | 9.66 | 3.66 | 4.35 |
| Blended Index | — | — | 7.40 | 10.84 | 4.49 | 4.49 |
| % Total Annual Operating Expense Ratios3 | Class A | Class C | Class I | Class R6 |
| | 0.95% | 1.71% | 0.70% | 0.65% |
See Endnotes and Additional Disclosures in this report.
Past performance is no guarantee of future results. Returns are historical and are calculated by determining the percentage change in net asset value (NAV) or offering price (as applicable) with all distributions reinvested. Furthermore, returns do not reflect the deduction of taxes that shareholders may have to pay on Fund distributions or upon the redemption of Fund shares. Investment return and principal value will fluctuate so that shares, when redeemed, may be worth more or less than their original cost. Performance for periods less than or equal to one year is cumulative. Performance is for the stated time period only; due to market volatility, current Fund performance may be lower or higher than the quoted return. For performance as of the most recent month-end, please refer to eatonvance.com.
Eaton Vance
Multi-Asset Credit Fund
April 30, 2024
| Asset Allocation (% of total investments) |
| Credit Quality (% of net assets)1 |
Footnotes:
| 1 | Ratings are based on Moody’s Investors Service, Inc. (“Moody’s”), S&P Global Ratings (“S&P”) or Fitch Ratings (“Fitch”), as applicable. For purposes of ratings restrictions, the average of Moody’s, S&P and Fitch is used. Ratings, which are subject to change, apply to the creditworthiness of the issuers of the underlying securities and not to the Fund or its shares. Credit ratings measure the quality of a bond based on the issuer’s creditworthiness, with ratings ranging from AAA, being the highest, to D, being the lowest based on S&P’s measures. Ratings of BBB or higher by S&P or Fitch (Baa or higher by Moody’s) are considered to be investment-grade quality. Credit ratings are based largely on the ratings agency’s analysis at the time of rating. The rating assigned to any particular security is not necessarily a reflection of the issuer’s current financial condition and does not necessarily reflect its assessment of the volatility of a security’s market value or of the liquidity of an investment in the security. Holdings designated as “Not Rated” (if any) are not rated by the national ratings agencies stated above. |
2 Amount is less than 0.05%.
Eaton Vance
Multi-Asset Credit Fund
April 30, 2024
Endnotes and Additional Disclosures
| 1 | Morningstar® LSTA® US Leveraged Loan IndexSM is an unmanaged index of the institutional leveraged loan market. Morningstar® LSTA® Leveraged Loan indices are a product of Morningstar, Inc. (“Morningstar”) and have been licensed for use. Morningstar® is a registered trademark of Morningstar licensed for certain use. Loan Syndications and Trading Association® and LSTA® are trademarks of the LSTA licensed for certain use by Morningstar, and further sublicensed by Morningstar for certain use. Neither Morningstar nor LSTA guarantees the accuracy and/or completeness of the Morningstar® LSTA® US Leveraged Loan IndexSM or any data included therein, and shall have no liability for any errors, omissions, or interruptions therein. Unless otherwise stated, index returns do not reflect the effect of any applicable sales charges, commissions, expenses, taxes or leverage, as applicable. It is not possible to invest directly in an index. ICE BofA Developed Markets High Yield ex-Subordinated Financials Index – Hedged USD is an unmanaged index of global developed market, below investment grade corporate bonds, USD hedged. ICE® BofA® indices are not for redistribution or other uses; provided “as is”, without warranties, and with no liability. Eaton Vance has prepared this report and ICE Data Indices, LLC does not endorse it, or guarantee, review, or endorse Eaton Vance’s products. BofA® is a licensed registered trademark of Bank of America Corporation in the United States and other countries. The Blended Index consists of 50% Morningstar® LSTA® US Leveraged Loan IndexSM and 50% ICE BofA Developed Markets High Yield ex-Subordinated Financials Index – Hedged USD, rebalanced monthly. Unless otherwise stated, index returns do not reflect the effect of any applicable sales charges, commissions, expenses, taxes or leverage, as applicable. It is not possible to invest directly in an index. |
| 2 | Total Returns at NAV do not include applicable sales charges. If sales charges were deducted, the returns would be lower. Total Returns shown with maximum sales charge reflect the stated maximum sales charge. Unless otherwise stated, performance does not reflect the deduction of taxes on Fund distributions or redemptions of Fund shares.Performance prior to the inception date of a class may be linked to the performance of an older class of the Fund. This linked performance is adjusted for any applicable sales charge, but is not adjusted for class expense differences. If adjusted for such differences, the performance would be different. The performance of Class R6 is linked to Class I. Performance presented in the Financial Highlights included in the financial statements is not linked.Effective November 5, 2020, Class C shares automatically convert to Class A shares eight years after purchase. The average annual total returns listed for Class C reflect conversion to Class A shares after eight years. Prior to November 5, 2020, Class C shares automatically converted to Class A shares ten years after purchase.Effective September 15, 2018, the Fund changed its investment strategy to invest at least 80% of its net assets (plus any borrowings for investment purposes) in credit-related investments. Prior to September 15, 2018, the Fund was a “fund-of-funds” and invested primarily among other investment companies managed by Eaton Vance and its affiliates that invested in various asset classes. |
| 3 | Source: Fund prospectus. The expense ratios for the current reporting period can be found in the Financial Highlights section of this report. |
| | Performance reflects expenses waived and/or reimbursed, if applicable. Without such waivers and/or reimbursements, performance would have been lower. |
| | Fund profile subject to change due to active management. |
Eaton Vance
Multi-Asset Credit Fund
April 30, 2024
Example
As a Fund shareholder, you incur two types of costs: (1) transaction costs, including sales charges (loads) on purchases; and (2) ongoing costs, including management fees; distribution and/or service fees; and other Fund expenses. This Example is intended to help you understand your ongoing costs (in dollars) of Fund investing and to compare these costs with the ongoing costs of investing in other mutual funds. The Example is based on an investment of $1,000 invested at the beginning of the period and held for the entire period (November 1, 2023 to April 30, 2024).
Actual Expenses
The first section of the table below provides information about actual account values and actual expenses. You may use the information in this section, together with the amount you invested, to estimate the expenses that you paid over the period. Simply divide your account value by $1,000 (for example, an $8,600 account value divided by $1,000 = 8.6), then multiply the result by the number in the first section under the heading entitled “Expenses Paid During Period” to estimate the expenses you paid on your account during this period.
Hypothetical Example for Comparison Purposes
The second section of the table below provides information about hypothetical account values and hypothetical expenses based on the actual Fund expense ratio and an assumed rate of return of 5% per year (before expenses), which is not the actual Fund return. The hypothetical account values and expenses may not be used to estimate the actual ending account balance or expenses you paid for the period. You may use this information to compare the ongoing costs of investing in your Fund and other funds. To do so, compare this 5% hypothetical example with the 5% hypothetical examples that appear in the shareholder reports of the other funds.
Please note that the expenses shown in the table are meant to highlight your ongoing costs only and do not reflect any transactional costs, such as sales charges (loads). Therefore, the second section of the table is useful in comparing ongoing costs only, and will not help you determine the relative total costs of owning different funds. In addition, if these transactional costs were included, your costs would be higher.
| | Beginning
Account Value
(11/1/23) | Ending
Account Value
(4/30/24) | Expenses Paid
During Period*
(11/1/23 – 4/30/24) | Annualized
Expense
Ratio |
| Actual | | | | |
| Class A | $1,000.00 | $1,070.10 | $4.89 | 0.95% |
| Class C | $1,000.00 | $1,066.20 | $8.73 | 1.70% |
| Class I | $1,000.00 | $1,071.40 | $3.61 | 0.70% |
| Class R6 | $1,000.00 | $1,072.70 | $3.40 | 0.66% |
| |
| Hypothetical | | | | |
| (5% return per year before expenses) | | | | |
| Class A | $1,000.00 | $1,020.14 | $4.77 | 0.95% |
| Class C | $1,000.00 | $1,016.41 | $8.52 | 1.70% |
| Class I | $1,000.00 | $1,021.38 | $3.52 | 0.70% |
| Class R6 | $1,000.00 | $1,021.58 | $3.32 | 0.66% |
| * | Expenses are equal to the Fund's annualized expense ratio for the indicated Class, multiplied by the average account value over the period, multiplied by 182/366 (to reflect the one-half year period). The Example assumes that the $1,000 was invested at the net asset value per share determined at the close of business on October 31, 2023. |
Eaton Vance
Multi-Asset Credit Fund
April 30, 2024
Portfolio of Investments (Unaudited)
| Asset-Backed Securities — 5.3% |
| Security | Principal
Amount
(000's omitted) | Value |
| ARES LII CLO Ltd., Series 2019-52A, Class DR, 8.886%, (3 mo. SOFR + 3.562%), 4/22/31(1)(2) | $ | 1,750 | $ 1,752,796 |
| Benefit Street Partners CLO XIX Ltd.: | | | |
| Series 2019-19A, Class D, 9.39%, (3 mo. SOFR + 4.062%), 1/15/33(1)(2) | | 1,000 | 1,002,113 |
| Series 2019-19A, Class E, 12.61%, (3 mo. SOFR + 7.282%), 1/15/33(1)(2) | | 1,000 | 1,011,145 |
| Benefit Street Partners CLO XVIII Ltd., Series 2019-18A, Class ER, 12.34%, (3 mo. SOFR + 7.012%), 10/15/34(1)(2) | | 500 | 505,283 |
| BlueMountain CLO XXVI Ltd., Series 2019-26A, Class ER, 12.716%, (3 mo. SOFR + 7.392%), 10/20/34(1)(2) | | 500 | 491,006 |
| Brookhaven Park CLO Ltd., Series 2024-1A, Class D, 8.894%, (3 mo. SOFR + 3.60%), 4/19/37(1)(2) | | 1,000 | 1,001,648 |
| Bryant Park Funding Ltd., Series 2023-20A, Class D, 11.419%, (3 mo. SOFR + 6.09%), 7/15/36(1)(2) | | 1,000 | 1,020,920 |
| Canyon CLO Ltd., Series 2020-3A, Class E, 12.84%, (3 mo. SOFR + 7.512%), 1/15/34(1)(2) | | 1,000 | 1,003,458 |
| Carlyle Global Market Strategies CLO Ltd.: | | | |
| Series 2014-3RA, Class C, 8.537%, (3 mo. SOFR + 3.212%), 7/27/31(1)(2) | | 2,725 | 2,682,926 |
| Series 2014-4RA, Class C, 8.49%, (3 mo. SOFR + 3.162%), 7/15/30(1)(2) | | 2,000 | 1,970,388 |
| Series 2014-4RA, Class D, 11.24%, (3 mo. SOFR + 5.912%), 7/15/30(1)(2) | | 250 | 241,840 |
| Series 2015-5A, Class DR, 12.286%, (3 mo. SOFR + 6.962%), 1/20/32(1)(2) | | 250 | 245,007 |
| Coinstar Funding LLC, Series 2017-1A, Class A2, 5.216%, 4/25/47(1) | | 60 | 54,151 |
| Crown City CLO III, Series 2021-1A, Class C, 8.886%, (3 mo. SOFR + 3.562%), 7/20/34(1)(2) | | 1,000 | 971,503 |
| Elmwood CLO VIII Ltd., Series 2021-1A, Class DR, 9.128%, (3 mo. SOFR + 3.80%), 4/20/37(1)(2) | | 1,000 | 1,003,703 |
| Empower CLO Ltd., Series 2024-1A, Class D1, 9.061%, (3 mo. SOFR + 3.75%), 4/25/37(1)(2) | | 1,000 | 1,006,540 |
| Galaxy 33 CLO Ltd., Series 2024-33A, Class D1, (3 mo. SOFR + 3.55%), 4/20/37(1)(3) | | 800 | 803,682 |
| Golub Capital Partners CLO 53B Ltd., Series 2021-53A, Class E, 12.286%, (3 mo. SOFR + 6.962%), 7/20/34(1)(2) | | 500 | 501,529 |
| Golub Capital Partners CLO 60B Ltd., Series 2022-60A, Class D, 9.094%, (3 mo. SOFR + 3.77%), 10/25/34(1)(2) | | 2,000 | 2,004,056 |
| Home Partners of America Trust, Series 2021-2, Class F, 3.799%, 12/17/26(1) | | 1,250 | 1,111,371 |
| Madison Park Funding XXXVI Ltd.: | | | |
| Series 2019-36A, Class D1R, 8.829%, (3 mo. SOFR + 3.50%), 4/15/35(1)(2) | | 1,000 | 1,002,954 |
| Security | Principal
Amount
(000's omitted) | Value |
| Madison Park Funding XXXVI Ltd.: (continued) | | | |
| Series 2019-36A, Class ER, 12.379%, (3 mo. SOFR + 7.05%), 4/15/35(1)(2) | $ | 1,000 | $ 1,003,404 |
| Neuberger Berman CLO XXII Ltd., Series 2016-22A, Class ER, 11.639%, (3 mo. SOFR + 6.322%), 10/17/30(1)(2) | | 250 | 250,690 |
| OCP CLO Ltd.: | | | |
| Series 2023-27A, Class DR, (3 mo. SOFR + 3.35%), 7/16/35(1)(3) | | 775 | 777,906 |
| Series 2024-32A, Class D1, 9.076%, (3 mo. SOFR + 3.75%), 4/23/37(1)(2) | | 1,000 | 1,001,565 |
| Octagon Investment Partners 49 Ltd., Series 2020-5A, Class D1R, 9.341%, (3 mo. SOFR + 4.05%), 4/15/37(1)(2) | | 1,200 | 1,211,678 |
| Palmer Square CLO Ltd., Series 2013-2A, Class DRR, 11.429%, (3 mo. SOFR + 6.112%), 10/17/31(1)(2) | | 250 | 250,664 |
| Stack Infrastructure Issuer LLC, Series 2021-1A, Class A2, 1.877%, 3/26/46(1) | | 890 | 817,595 |
| Theorem Funding Trust, Series 2022-3A, Class A, 7.60%, 4/15/29(1) | | 219 | 220,290 |
Total Asset-Backed Securities
(identified cost $26,710,369) | | | $ 26,921,811 |
| Collateralized Mortgage Obligations — 0.8% |
| Security | Principal
Amount
(000's omitted) | Value |
| Federal Home Loan Mortgage Corp. STACR REMICS Trust: | | | |
| Series 2021-DNA3, Class B2, 11.58%, (30-day SOFR Average + 6.25%), 10/25/33(1)(2) | $ | 855 | $ 1,000,255 |
| Series 2021-DNA6, Class B2, 12.83%, (30-day SOFR Average + 7.50%), 10/25/41(1)(2) | | 1,280 | 1,402,325 |
| Saluda Grade Alternative Mortgage Trust, Series 2024-RTL4, Class A1, 7.50%, 2/25/30(1) | | 750 | 755,501 |
| Unison Trust, Series 2021-1, Class A, 4.50%, 4/25/50(1)(4) | | 1,157 | 1,033,404 |
Total Collateralized Mortgage Obligations
(identified cost $4,220,501) | | | $ 4,191,485 |
| Commercial Mortgage-Backed Securities — 1.6% |
| Security | Principal
Amount*
(000's omitted) | Value |
| BBCMS Mortgage Trust, Series 2017-C1, Class D, 3.708%, 2/15/50(1)(4) | | 1,000 | $ 741,595 |
| CSMC Trust, Series 2022-CNTR, Class A, 9.265%, (1 mo. SOFR + 3.944%), 1/15/25(1)(2) | | 1,000 | 918,428 |
6
See Notes to Financial Statements.
Eaton Vance
Multi-Asset Credit Fund
April 30, 2024
Portfolio of Investments (Unaudited) — continued
| Security | Principal
Amount*
(000's omitted) | Value |
| JP Morgan Chase Commercial Mortgage Securities Trust: | | | |
| Series 2014-DSTY, Class B, 3.771%, 6/10/27(1) | | 150 | $ 20,869 |
| Series 2021-MHC, Class C, 6.986%, (1 mo. SOFR + 1.414%), 4/15/38(1)(2) | | 1,800 | 1,788,770 |
| JPMBB Commercial Mortgage Securities Trust, Series 2014-C23, Class D, 4.131%, 9/15/47(1)(4) | | 750 | 681,340 |
| Morgan Stanley Capital I Trust, Series 2019-BPR, Class A, 7.32%, (1 mo. SOFR + 1.992%), 5/15/36(1)(2)(5) | | 379 | 378,166 |
| Natixis Commercial Mortgage Securities Trust, Series 2018-FL1, Class C, 8.50%, (USD Prime), 6/15/35(1)(2) | | 100 | 42,401 |
| Vita Scientia DAC, Series 2022-1A, Class D, 6.423%, (3 mo. EURIBOR + 2.49%), 8/27/25(1)(2) | EUR | 450 | 441,053 |
| VMC Finance LLC, Series 2021-HT1, Class B, 9.933%, (1 mo. SOFR + 4.614%), 1/18/37(1)(2) | | 2,000 | 1,912,013 |
| Wells Fargo Commercial Mortgage Trust, Series 2016-C35, Class D, 3.142%, 7/15/48(1) | | 1,700 | 1,399,428 |
Total Commercial Mortgage-Backed Securities
(identified cost $8,792,434) | | | $ 8,324,063 |
| Security | Shares | Value |
| Health Care — 0.0%(6) |
| Endo, Inc.(7)(8) | | 126 | $ 3,607 |
| Endo, Inc.(7) | | 8,316 | 238,038 |
| | | | $ 241,645 |
| Pharmaceuticals — 0.1% |
| Mallinckrodt International Finance SA(7)(9) | | 5,038 | $ 265,755 |
| | | | $ 265,755 |
Total Common Stocks
(identified cost $373,477) | | | $ 507,400 |
| Security | Principal
Amount*
(000's omitted) | Value |
| Energy — 0.1% |
| NextEra Energy Partners LP, 2.50%, 6/15/26(1) | | 879 | $ 793,048 |
| | | | $ 793,048 |
| Leisure Goods/Activities/Movies — 0.1% |
| Peloton Interactive, Inc., 0.00%, 2/15/26 | | 588 | $ 482,899 |
| | | | $ 482,899 |
| Semiconductors & Semiconductor Equipment — 0.2% |
| ams-OSRAM AG, 0.00%, 3/5/25(10) | EUR | 800 | $ 810,232 |
| | | | $ 810,232 |
| Transportation — 0.2% |
| CryoPort, Inc., 0.75%, 12/1/26(1) | | 1,088 | $ 943,514 |
| | | | $ 943,514 |
Total Convertible Bonds
(identified cost $3,082,430) | | | $ 3,029,693 |
| Security | Principal
Amount*
(000's omitted) | Value |
| Aerospace and Defense — 1.1% |
| Bombardier, Inc.: | | | |
| 7.25%, 7/1/31(1) | | 536 | $ 537,989 |
| 8.75%, 11/15/30(1) | | 385 | 410,078 |
| Moog, Inc., 4.25%, 12/15/27(1) | | 791 | 739,194 |
| Rolls-Royce PLC, 5.75%, 10/15/27(1) | | 1,200 | 1,187,989 |
| Spirit AeroSystems, Inc.: | | | |
| 4.60%, 6/15/28 | | 174 | 160,516 |
| 9.375%, 11/30/29(1) | | 59 | 63,884 |
| TransDigm, Inc.: | | | |
| 4.625%, 1/15/29 | | 1,023 | 938,147 |
| 5.50%, 11/15/27 | | 943 | 917,218 |
| 6.375%, 3/1/29(1) | | 240 | 238,467 |
| 6.625%, 3/1/32(1) | | 240 | 239,892 |
| | | | $ 5,433,374 |
7
See Notes to Financial Statements.
Eaton Vance
Multi-Asset Credit Fund
April 30, 2024
Portfolio of Investments (Unaudited) — continued
| Security | Principal
Amount*
(000's omitted) | Value |
| Agriculture — 0.1% |
| Darling Ingredients, Inc., 6.00%, 6/15/30(1) | | 676 | $ 657,117 |
| | | | $ 657,117 |
| Air Transport — 0.8% |
| American Airlines, Inc./AAdvantage Loyalty IP Ltd., 5.50%, 4/20/26(1) | | 519 | $ 513,127 |
| Deutsche Lufthansa AG, 4.382% to 2/12/26, 8/12/75(10)(11) | EUR | 500 | 526,330 |
| Gatwick Airport Finance PLC, 4.375%, 4/7/26(10) | GBP | 1,270 | 1,533,165 |
| Heathrow Finance PLC, 6.625%, 3/1/31(10) | GBP | 1,340 | 1,635,518 |
| | | | $ 4,208,140 |
| Apparel & Luxury Goods — 0.1% |
| Hanesbrands, Inc., 9.00%, 2/15/31(1) | | 630 | $ 627,486 |
| | | | $ 627,486 |
| Automotive — 1.8% |
| Asbury Automotive Group, Inc.: | | | |
| 4.625%, 11/15/29(1) | | 392 | $ 354,854 |
| 4.75%, 3/1/30 | | 303 | 274,970 |
| Clarios Global LP/Clarios U.S. Finance Co.: | | | |
| 4.375%, 5/15/26(10) | EUR | 1,100 | 1,164,582 |
| 8.50%, 5/15/27(1) | | 670 | 672,139 |
| Dana Financing Luxembourg SARL: | | | |
| 3.00%, 7/15/29(10) | EUR | 300 | 288,317 |
| 8.50%, 7/15/31(10) | EUR | 300 | 349,893 |
| Dornoch Debt Merger Sub, Inc., 6.625%, 10/15/29(1) | | 595 | 492,142 |
| Ford Motor Co.: | | | |
| 4.75%, 1/15/43 | | 325 | 256,039 |
| 6.10%, 8/19/32 | | 530 | 520,087 |
| 6.625%, 10/1/28 | | 825 | 848,355 |
| 9.625%, 4/22/30 | | 44 | 50,569 |
| Forvia SE: | | | |
| 2.375%, 6/15/29(10) | EUR | 150 | 145,621 |
| 3.75%, 6/15/28(10) | EUR | 250 | 259,038 |
| Goodyear Tire & Rubber Co., 5.00%, 7/15/29 | | 690 | 626,500 |
| IHO Verwaltungs GmbH, 8.75%, (8.75% cash or 9.50% PIK), 5/15/28(10)(12) | EUR | 700 | 804,469 |
| Lithia Motors, Inc.: | | | |
| 3.875%, 6/1/29(1) | | 398 | 351,917 |
| 4.375%, 1/15/31(1) | | 452 | 396,158 |
| Real Hero Merger Sub 2, Inc., 6.25%, 2/1/29(1) | | 783 | 671,675 |
| Sonic Automotive, Inc.: | | | |
| 4.625%, 11/15/29(1) | | 587 | 526,006 |
| 4.875%, 11/15/31(1) | | 239 | 208,773 |
| Security | Principal
Amount*
(000's omitted) | Value |
| Automotive (continued) |
| Wheel Pros, Inc., 6.50%, 5/15/29(1) | | 332 | $ 103,335 |
| | | | $ 9,365,439 |
| Beverage and Tobacco — 0.1% |
| Triton Water Holdings, Inc., 6.25%, 4/1/29(1) | | 799 | $ 717,286 |
| | | | $ 717,286 |
| Building and Development — 1.7% |
| Ashton Woods USA LLC/Ashton Woods Finance Co.: | | | |
| 4.625%, 8/1/29(1) | | 136 | $ 123,141 |
| 4.625%, 4/1/30(1) | | 273 | 244,236 |
| Builders FirstSource, Inc.: | | | |
| 4.25%, 2/1/32(1) | | 1,030 | 897,988 |
| 5.00%, 3/1/30(1) | | 105 | 98,407 |
| CP Atlas Buyer, Inc., 7.00%, 12/1/28(1) | | 1,041 | 939,050 |
| EMRLD Borrower LP/Emerald Co-Issuer, Inc., 6.625%, 12/15/30(1) | | 1,017 | 1,009,158 |
| Meritage Homes Corp., 3.875%, 4/15/29(1) | | 285 | 258,640 |
| Miller Homes Group Finco PLC, 9.151%, (3 mo. EURIBOR + 5.25%), 5/15/28(2)(10) | EUR | 400 | 427,320 |
| MIWD Holdco II LLC/MIWD Finance Corp., 5.50%, 2/1/30(1) | | 257 | 233,016 |
| Patrick Industries, Inc., 4.75%, 5/1/29(1) | | 751 | 683,502 |
| Smyrna Ready Mix Concrete LLC, 6.00%, 11/1/28(1) | | 1,202 | 1,163,890 |
| Standard Industries, Inc.: | | | |
| 3.375%, 1/15/31(1) | | 275 | 225,515 |
| 4.75%, 1/15/28(1) | | 753 | 710,882 |
| Summit Materials LLC/Summit Materials Finance Corp., 7.25%, 1/15/31(1) | | 628 | 645,621 |
| White Cap Buyer LLC, 6.875%, 10/15/28(1) | | 939 | 908,293 |
| | | | $ 8,568,659 |
| Business Equipment and Services — 0.7% |
| Adtalem Global Education, Inc., 5.50%, 3/1/28(1) | | 942 | $ 893,488 |
| Allied Universal Holdco LLC/Allied Universal Finance Corp./Atlas Luxco 4 SARL: | | | |
| 3.625%, 6/1/28(10) | EUR | 350 | 343,340 |
| 4.625%, 6/1/28(1) | | 239 | 214,648 |
| GEMS MENASA Cayman Ltd./GEMS Education Delaware LLC: | | | |
| 7.125%, 7/31/26(1) | | 1,935 | 1,924,566 |
| 7.125%, 7/31/26(10) | | 260 | 258,598 |
| | | | $ 3,634,640 |
| Cable and Satellite Television — 1.6% |
| Altice Financing SA, 5.00%, 1/15/28(1) | | 860 | $ 679,664 |
8
See Notes to Financial Statements.
Eaton Vance
Multi-Asset Credit Fund
April 30, 2024
Portfolio of Investments (Unaudited) — continued
| Security | Principal
Amount*
(000's omitted) | Value |
| Cable and Satellite Television (continued) |
| CCO Holdings LLC/CCO Holdings Capital Corp.: | | | |
| 4.25%, 2/1/31(1) | | 411 | $ 321,973 |
| 4.50%, 8/15/30(1) | | 900 | 732,052 |
| 4.75%, 3/1/30(1) | | 988 | 821,769 |
| 5.00%, 2/1/28(1) | | 400 | 364,624 |
| 6.375%, 9/1/29(1) | | 601 | 551,343 |
| DISH Network Corp., 11.75%, 11/15/27(1) | | 397 | 400,532 |
| Virgin Media Vendor Financing Notes III DAC, 4.875%, 7/15/28(10) | GBP | 2,951 | 3,300,796 |
| Ziggo Bond Co. BV, 5.125%, 2/28/30(1) | | 900 | 747,695 |
| | | | $ 7,920,448 |
| Capital Goods — 0.1% |
| BWX Technologies, Inc.: | | | |
| 4.125%, 6/30/28(1) | | 609 | $ 556,976 |
| 4.125%, 4/15/29(1) | | 221 | 201,569 |
| | | | $ 758,545 |
| Chemicals — 0.5% |
| Calderys Financing LLC, 11.25%, 6/1/28(1) | | 870 | $ 924,835 |
| Olympus Water U.S. Holding Corp.: | | | |
| 9.625%, 11/15/28(10) | EUR | 200 | 227,825 |
| 9.75%, 11/15/28(1) | | 1,202 | 1,276,967 |
| | | | $ 2,429,627 |
| Chemicals and Plastics — 1.0% |
| Avient Corp., 7.125%, 8/1/30(1) | | 681 | $ 689,627 |
| Herens Holdco SARL, 4.75%, 5/15/28(1) | | 452 | 390,682 |
| Herens Midco SARL, 5.25%, 5/15/29(10) | EUR | 1,000 | 766,400 |
| INEOS Finance PLC, 6.375%, 4/15/29(10) | EUR | 400 | 430,349 |
| Italmatch Chemicals SpA: | | | |
| 9.408%, (3 mo. EURIBOR + 5.50%), 2/6/28(2)(10) | EUR | 200 | 215,443 |
| 10.00%, 2/6/28(10) | EUR | 750 | 843,122 |
| Nufarm Australia Ltd./Nufarm Americas, Inc., 5.00%, 1/27/30(1) | | 783 | 718,611 |
| Valvoline, Inc., 3.625%, 6/15/31(1) | | 908 | 764,621 |
| WR Grace Holdings LLC: | | | |
| 4.875%, 6/15/27(1) | | 376 | 357,341 |
| 7.375%, 3/1/31(1) | | 185 | 187,699 |
| | | | $ 5,363,895 |
| Commercial Services — 2.5% |
| Abertis Infraestructuras Finance BV, 3.248% to 11/24/25(10)(11)(13) | EUR | 600 | $ 623,349 |
| Security | Principal
Amount*
(000's omitted) | Value |
| Commercial Services (continued) |
| AMN Healthcare, Inc.: | | | |
| 4.00%, 4/15/29(1) | | 844 | $ 748,648 |
| 4.625%, 10/1/27(1) | | 54 | 50,781 |
| APi Group DE, Inc., 4.75%, 10/15/29(1) | | 662 | 604,586 |
| Boels Topholding BV, 5.75%, 5/15/30(10)(14) | EUR | 1,405 | 1,504,207 |
| Boost Newco Borrower LLC, 7.50%, 1/15/31(1) | | 250 | 258,203 |
| Boost Newco Borrower LLC/GTCR W Dutch Finance Sub BV, 8.50%, 1/15/31(10) | GBP | 330 | 440,546 |
| HealthEquity, Inc., 4.50%, 10/1/29(1) | | 721 | 657,606 |
| IPD 3 BV, 8.00%, 6/15/28(10) | EUR | 930 | 1,053,858 |
| Korn Ferry, 4.625%, 12/15/27(1) | | 620 | 588,463 |
| Mavis Tire Express Services Topco Corp., 6.50%, 5/15/29(1) | | 1,323 | 1,226,952 |
| Neptune Bidco U.S., Inc., 9.29%, 4/15/29(1) | | 550 | 519,654 |
| NESCO Holdings II, Inc., 5.50%, 4/15/29(1) | | 565 | 526,545 |
| Verisure Holding AB, 3.25%, 2/15/27(10) | EUR | 1,130 | 1,159,960 |
| VT Topco, Inc., 8.50%, 8/15/30(1) | | 995 | 1,030,664 |
| Wand NewCo 3, Inc., 7.625%, 1/30/32(1) | | 801 | 814,974 |
| WASH Multifamily Acquisition, Inc., 5.75%, 4/15/26(1) | | 1,110 | 1,077,278 |
| | | | $ 12,886,274 |
| Computers — 0.6% |
| McAfee Corp., 7.375%, 2/15/30(1) | | 855 | $ 792,769 |
| NCR Voyix Corp.: | | | |
| 5.125%, 4/15/29(1) | | 296 | 272,298 |
| 5.25%, 10/1/30(1) | | 405 | 361,156 |
| Presidio Holdings, Inc.: | | | |
| 4.875%, 2/1/27(1) | | 50 | 50,098 |
| 8.25%, 2/1/28(1) | | 963 | 974,655 |
| Seagate HDD Cayman: | | | |
| 4.091%, 6/1/29 | | 129 | 117,497 |
| 9.625%, 12/1/32 | | 594 | 667,060 |
| | | | $ 3,235,533 |
| Containers and Glass Products — 0.3% |
| Ardagh Metal Packaging Finance USA LLC/Ardagh Metal Packaging Finance PLC, 3.00%, 9/1/29(10) | EUR | 1,000 | $ 860,752 |
| Canpack SA/Canpack U.S. LLC, 3.875%, 11/15/29(1) | | 767 | 672,916 |
| | | | $ 1,533,668 |
| Cosmetics/Toiletries — 0.1% |
| Edgewell Personal Care Co.: | | | |
| 4.125%, 4/1/29(1) | | 238 | $ 215,382 |
| 5.50%, 6/1/28(1) | | 391 | 377,702 |
| | | | $ 593,084 |
9
See Notes to Financial Statements.
Eaton Vance
Multi-Asset Credit Fund
April 30, 2024
Portfolio of Investments (Unaudited) — continued
| Security | Principal
Amount*
(000's omitted) | Value |
| Distribution & Wholesale — 0.8% |
| BCPE Empire Holdings, Inc., 7.625%, 5/1/27(1) | | 908 | $ 884,589 |
| Performance Food Group, Inc., 4.25%, 8/1/29(1) | | 551 | 494,268 |
| Rexel SA, 5.25%, 9/15/30(10) | EUR | 880 | 969,724 |
| Ritchie Bros Holdings, Inc.: | | | |
| 6.75%, 3/15/28(1) | | 454 | 458,859 |
| 7.75%, 3/15/31(1) | | 193 | 200,406 |
| Windsor Holdings III LLC, 8.50%, 6/15/30(1) | | 842 | 878,016 |
| | | | $ 3,885,862 |
| Diversified Financial Services — 1.8% |
| AG TTMT Escrow Issuer LLC, 8.625%, 9/30/27(1) | | 485 | $ 500,074 |
| Encore Capital Group, Inc., 5.375%, 2/15/26(10) | GBP | 230 | 279,828 |
| Jane Street Group/JSG Finance, Inc., 4.50%, 11/15/29(1) | | 511 | 465,194 |
| Jefferson Capital Holdings LLC, 6.00%, 8/15/26(1) | | 744 | 732,067 |
| KOC Holding AS, 6.50%, 3/11/25(10) | | 1,400 | 1,403,794 |
| Macquarie Airfinance Holdings Ltd.: | | | |
| 6.40%, 3/26/29(1) | | 175 | 174,670 |
| 6.50%, 3/26/31(1) | | 210 | 210,352 |
| 8.125%, 3/30/29(1) | | 739 | 773,570 |
| PRA Group, Inc., 7.375%, 9/1/25(1) | | 220 | 219,177 |
| ProGroup AG: | | | |
| 5.125%, 4/15/29(10) | EUR | 515 | 551,411 |
| 5.375%, 4/15/31(10) | EUR | 801 | 852,156 |
| Rocket Mortgage LLC/Rocket Mortgage Co-Issuer, Inc.: | | | |
| 2.875%, 10/15/26(1) | | 261 | 239,853 |
| 3.625%, 3/1/29(1) | | 1,022 | 901,344 |
| 4.00%, 10/15/33(1) | | 65 | 53,125 |
| Sherwood Financing PLC, 6.00%, 11/15/26(10) | GBP | 934 | 959,836 |
| VistaJet Malta Finance PLC/Vista Management Holding, Inc., 6.375%, 2/1/30(1) | | 945 | 732,596 |
| | | | $ 9,049,047 |
| Drugs — 0.4% |
| Catalent Pharma Solutions, Inc., 2.375%, 3/1/28(10) | EUR | 640 | $ 649,579 |
| Endo Finance Holdings, Inc., 8.50%, 4/15/31(1) | | 350 | 356,061 |
| Perrigo Finance Unlimited Co.: | | | |
| 4.65%, 6/15/30 | | 699 | 641,135 |
| 4.90%, 12/15/44 | | 406 | 320,251 |
| | | | $ 1,967,026 |
| Ecological Services and Equipment — 0.8% |
| Clean Harbors, Inc., 4.875%, 7/15/27(1) | | 200 | $ 192,826 |
| Covanta Holding Corp., 4.875%, 12/1/29(1) | | 1,290 | 1,132,137 |
| Security | Principal
Amount*
(000's omitted) | Value |
| Ecological Services and Equipment (continued) |
| GFL Environmental, Inc.: | | | |
| 3.50%, 9/1/28(1) | | 889 | $ 800,089 |
| 4.25%, 6/1/25(1) | | 313 | 308,795 |
| 4.75%, 6/15/29(1) | | 906 | 836,804 |
| Paprec Holding SA, 7.25%, 11/17/29(10) | EUR | 550 | 626,318 |
| | | | $ 3,896,969 |
| Electric Utilities — 0.5% |
| Electricite de France SA, 7.50% to 9/6/28(10)(11)(13) | EUR | 400 | $ 466,569 |
| Energizer Gamma Acquisition BV, 3.50%, 6/30/29(10) | EUR | 258 | 246,545 |
| Pattern Energy Operations LP/Pattern Energy Operations, Inc., 4.50%, 8/15/28(1) | | 578 | 517,448 |
| TransAlta Corp., 7.75%, 11/15/29 | | 606 | 620,876 |
| WESCO Distribution, Inc.: | | | |
| 6.375%, 3/15/29(1) | | 308 | 306,352 |
| 6.625%, 3/15/32(1) | | 310 | 308,937 |
| | | | $ 2,466,727 |
| Electronics/Electrical — 0.4% |
| EquipmentShare.com, Inc., 8.625%, 5/15/32(1) | | 553 | $ 563,324 |
| Imola Merger Corp., 4.75%, 5/15/29(1) | | 1,174 | 1,081,983 |
| Sensata Technologies, Inc., 4.375%, 2/15/30(1) | | 610 | 546,796 |
| | | | $ 2,192,103 |
| Energy — 0.8% |
| Enviva Partners LP/Enviva Partners Finance Corp., 6.50%, 1/15/26(1)(15) | | 1,078 | $ 470,342 |
| Greenko Solar Mauritius Ltd.: | | | |
| 5.55%, 1/29/25(1) | | 1,100 | 1,087,625 |
| 5.95%, 7/29/26(1) | | 1,200 | 1,156,500 |
| Sunoco LP, 7.25%, 5/1/32(1) | | 445 | 452,330 |
| Sunoco LP/Sunoco Finance Corp.: | | | |
| 4.50%, 5/15/29 | | 583 | 532,715 |
| 4.50%, 4/30/30 | | 372 | 335,035 |
| | | | $ 4,034,547 |
| Engineering & Construction — 0.2% |
| Artera Services LLC, 8.50%, 2/15/31(1) | | 485 | $ 496,656 |
| TopBuild Corp., 4.125%, 2/15/32(1) | | 791 | 685,549 |
| | | | $ 1,182,205 |
| Entertainment — 2.3% |
| Allwyn Entertainment Financing U.K. PLC, 7.25%, 4/30/30(10) | EUR | 1,047 | $ 1,166,942 |
| Boyne USA, Inc., 4.75%, 5/15/29(1) | | 814 | 741,220 |
10
See Notes to Financial Statements.
Eaton Vance
Multi-Asset Credit Fund
April 30, 2024
Portfolio of Investments (Unaudited) — continued
| Security | Principal
Amount*
(000's omitted) | Value |
| Entertainment (continued) |
| Caesars Entertainment, Inc.: | | | |
| 6.50%, 2/15/32(1) | | 377 | $ 371,695 |
| 7.00%, 2/15/30(1) | | 250 | 251,912 |
| 8.125%, 7/1/27(1) | | 508 | 515,220 |
| Churchill Downs, Inc., 5.75%, 4/1/30(1) | | 669 | 637,056 |
| Cirsa Finance International SARL, 6.50%, 3/15/29(10) | EUR | 1,165 | 1,270,190 |
| CPUK Finance Ltd., 4.875%, 2/28/47(10) | GBP | 1,130 | 1,388,764 |
| Flutter Treasury DAC, 5.00%, 4/29/29(10) | EUR | 800 | 866,759 |
| Inter Media & Communication SpA, 6.75%, 2/9/27(10) | EUR | 1,007 | 1,059,831 |
| Jacobs Entertainment, Inc., 6.75%, 2/15/29(1) | | 755 | 717,374 |
| Light & Wonder International, Inc., 7.00%, 5/15/28(1) | | 719 | 722,021 |
| Lottomatica SpA, 7.942%, (3 mo. EURIBOR + 4.00%), 12/15/30(2)(10) | EUR | 1,080 | 1,167,704 |
| Motion Finco SARL, 7.375%, 6/15/30(10) | EUR | 250 | 278,273 |
| Speedway Motorsports LLC/Speedway Funding II, Inc., 4.875%, 11/1/27(1) | | 519 | 489,036 |
| | | | $ 11,643,997 |
| Financial Intermediaries — 0.9% |
| Ally Financial, Inc., Series B, 4.70% to 5/15/26(11)(13) | | 635 | $ 541,049 |
| Compass Group Diversified Holdings LLC, 5.25%, 4/15/29(1) | | 848 | 793,550 |
| Ford Motor Credit Co. LLC: | | | |
| 2.70%, 8/10/26 | | 800 | 742,973 |
| 2.90%, 2/16/28 | | 203 | 180,662 |
| 3.815%, 11/2/27 | | 1,141 | 1,057,512 |
| 5.113%, 5/3/29 | | 600 | 571,874 |
| MSCI, Inc.: | | | |
| 3.625%, 9/1/30(1) | | 357 | 311,087 |
| 3.875%, 2/15/31(1) | | 443 | 388,105 |
| | | | $ 4,586,812 |
| Food Products — 0.6% |
| Bellis Acquisition Co. PLC, 4.50%, 2/16/26(10) | GBP | 400 | $ 498,621 |
| Chobani LLC/Chobani Finance Corp., Inc., 4.625%, 11/15/28(1) | | 587 | 543,957 |
| Ingles Markets, Inc., 4.00%, 6/15/31(1) | | 762 | 656,633 |
| Pilgrim's Pride Corp.: | | | |
| 3.50%, 3/1/32 | | 951 | 783,816 |
| 6.875%, 5/15/34 | | 270 | 280,214 |
| Post Holdings, Inc., 6.25%, 2/15/32(1) | | 422 | 416,893 |
| | | | $ 3,180,134 |
| Security | Principal
Amount*
(000's omitted) | Value |
| Food Service — 0.7% |
| 1011778 BC ULC/New Red Finance, Inc.: | | | |
| 3.875%, 1/15/28(1) | | 386 | $ 356,428 |
| 4.00%, 10/15/30(1) | | 293 | 252,872 |
| 4.375%, 1/15/28(1) | | 673 | 626,513 |
| Chobani LLC/Chobani Finance Corp., Inc., 7.625%, 7/1/29(1) | | 834 | 843,863 |
| Fiesta Purchaser, Inc., 7.875%, 3/1/31(1) | | 488 | 497,645 |
| IRB Holding Corp., 7.00%, 6/15/25(1) | | 37 | 36,953 |
| U.S. Foods, Inc., 4.75%, 2/15/29(1) | | 816 | 761,112 |
| | | | $ 3,375,386 |
| Food/Drug Retailers — 0.2% |
| Albertsons Cos., Inc./Safeway, Inc./New Albertsons LP/Albertsons LLC, 5.875%, 2/15/28(1) | | 806 | $ 790,535 |
| | | | $ 790,535 |
| Health Care — 3.5% |
| AHP Health Partners, Inc., 5.75%, 7/15/29(1) | | 212 | $ 194,449 |
| Avantor Funding, Inc.: | | | |
| 2.625%, 11/1/25(10) | EUR | 300 | 313,027 |
| 4.625%, 7/15/28(1) | | 341 | 317,318 |
| Bausch & Lomb Corp., 8.375%, 10/1/28(1) | | 595 | 615,230 |
| Cerba Healthcare SACA, 3.50%, 5/31/28(10) | EUR | 250 | 218,808 |
| Chrome Holdco SAS, 5.00%, 5/31/29(10) | EUR | 1,100 | 757,782 |
| Encompass Health Corp., 4.75%, 2/1/30 | | 616 | 565,563 |
| Ephios Subco 3 SARL, 7.875%, 1/31/31(10) | EUR | 930 | 1,020,485 |
| Fortrea Holdings, Inc., 7.50%, 7/1/30(1) | | 664 | 670,622 |
| Grifols SA: | | | |
| 3.20%, 5/1/25(10) | EUR | 350 | 372,532 |
| 3.875%, 10/15/28(10) | EUR | 300 | 254,315 |
| Heartland Dental LLC/Heartland Dental Finance Corp., 10.50%, 4/30/28(1) | | 1,155 | 1,217,210 |
| IQVIA, Inc.: | | | |
| 2.25%, 3/15/29(10) | EUR | 611 | 592,246 |
| 2.875%, 6/15/28(10) | EUR | 350 | 353,328 |
| 6.50%, 5/15/30(1) | | 337 | 338,950 |
| Legacy LifePoint Health LLC, 4.375%, 2/15/27(1) | | 354 | 331,872 |
| LifePoint Health, Inc.: | | | |
| 5.375%, 1/15/29(1) | | 681 | 545,174 |
| 9.875%, 8/15/30(1) | | 290 | 302,339 |
| Medline Borrower LP, 5.25%, 10/1/29(1) | | 1,569 | 1,462,047 |
| ModivCare Escrow Issuer, Inc., 5.00%, 10/1/29(1) | | 429 | 298,448 |
| ModivCare, Inc., 5.875%, 11/15/25(1) | | 708 | 691,260 |
| Molina Healthcare, Inc.: | | | |
| 3.875%, 11/15/30(1) | | 573 | 497,523 |
11
See Notes to Financial Statements.
Eaton Vance
Multi-Asset Credit Fund
April 30, 2024
Portfolio of Investments (Unaudited) — continued
| Security | Principal
Amount*
(000's omitted) | Value |
| Health Care (continued) |
| Molina Healthcare, Inc.: (continued) | | | |
| 3.875%, 5/15/32(1) | | 814 | $ 681,804 |
| Option Care Health, Inc., 4.375%, 10/31/29(1) | | 1,197 | 1,073,087 |
| RegionalCare Hospital Partners Holdings, Inc./LifePoint Health, Inc., 9.75%, 12/1/26(1) | | 643 | 640,865 |
| Surgery Center Holdings, Inc., 7.25%, 4/15/32(1) | | 470 | 469,946 |
| Team Health Holdings, Inc., 6.375%, 2/1/25(1) | | 639 | 594,871 |
| Tenet Healthcare Corp.: | | | |
| 6.125%, 10/1/28 | | 523 | 516,924 |
| 6.875%, 11/15/31 | | 313 | 322,885 |
| U.S. Acute Care Solutions LLC: | | | |
| 6.375%, 3/1/26(1) | | 710 | 719,596 |
| 9.75%, 5/15/29(1)(14) | | 470 | 461,486 |
| Varex Imaging Corp., 7.875%, 10/15/27(1) | | 283 | 288,747 |
| | | | $ 17,700,739 |
| Home Furnishings — 0.2% |
| Tempur Sealy International, Inc.: | | | |
| 3.875%, 10/15/31(1) | | 872 | $ 718,772 |
| 4.00%, 4/15/29(1) | | 151 | 134,403 |
| | | | $ 853,175 |
| Hotels, Restaurants & Leisure — 0.1% |
| Resorts World Las Vegas LLC/RWLV Capital, Inc.: | | | |
| 4.625%, 4/6/31(10) | | 400 | $ 339,658 |
| 8.45%, 7/27/30(1) | | 200 | 209,671 |
| | | | $ 549,329 |
| Household Products — 0.3% |
| Kronos Acquisition Holdings, Inc./KIK Custom Products, Inc., 7.00%, 12/31/27(1) | | 649 | $ 628,430 |
| Spectrum Brands, Inc., 3.875%, 3/15/31(1) | | 758 | 710,007 |
| | | | $ 1,338,437 |
| Industrial Equipment — 0.2% |
| Madison IAQ LLC, 5.875%, 6/30/29(1) | | 864 | $ 802,284 |
| | | | $ 802,284 |
| Insurance — 0.7% |
| Alliant Holdings Intermediate LLC/Alliant Holdings Co-Issuer: | | | |
| 6.75%, 10/15/27(1) | | 480 | $ 471,093 |
| 7.00%, 1/15/31(1) | | 405 | 406,552 |
| Galaxy Finco Ltd., 9.25%, 7/31/27(10) | GBP | 881 | 1,060,441 |
| Security | Principal
Amount*
(000's omitted) | Value |
| Insurance (continued) |
| Howden U.K. Refinance PLC/Howden U.K. Refinance 2 PLC/Howden U.S. Refinance LLC: | | | |
| 7.25%, 2/15/31(1) | | 380 | $ 375,434 |
| 8.125%, 2/15/32(1) | | 200 | 196,999 |
| Jones Deslauriers Insurance Management, Inc., 10.50%, 12/15/30(1) | | 728 | 771,285 |
| Panther Escrow Issuer LLC, 7.125%, 6/1/31(1) | | 415 | 417,418 |
| | | | $ 3,699,222 |
| Internet Software & Services — 0.9% |
| Arches Buyer, Inc.: | | | |
| 4.25%, 6/1/28(1) | | 270 | $ 231,781 |
| 6.125%, 12/1/28(1) | | 853 | 694,572 |
| Cars.com, Inc., 6.375%, 11/1/28(1) | | 819 | 783,636 |
| Match Group Holdings II LLC, 3.625%, 10/1/31(1) | | 919 | 759,603 |
| Science Applications International Corp., 4.875%, 4/1/28(1) | | 971 | 917,512 |
| United Group BV: | | | |
| 6.75%, 2/15/31(10) | EUR | 385 | 422,481 |
| 8.134%, (3 mo. EURIBOR + 4.25%), 2/15/31(2)(10) | EUR | 655 | 701,201 |
| | | | $ 4,510,786 |
| Leisure Goods/Activities/Movies — 1.7% |
| Acushnet Co., 7.375%, 10/15/28(1) | | 382 | $ 392,541 |
| Carnival Corp., 6.00%, 5/1/29(1) | | 285 | 276,355 |
| Cinemark USA, Inc.: | | | |
| 5.25%, 7/15/28(1) | | 390 | 362,556 |
| 5.875%, 3/15/26(1) | | 375 | 371,488 |
| LHMC Finco 2 SARL, 7.25%, (7.25% cash or 8.00% PIK), 10/2/25(10)(12) | EUR | 945 | 1,010,416 |
| Life Time, Inc.: | | | |
| 5.75%, 1/15/26(1) | | 401 | 396,936 |
| 8.00%, 4/15/26(1) | | 821 | 823,097 |
| Lindblad Expeditions Holdings, Inc., 9.00%, 5/15/28(1) | | 228 | 238,697 |
| Lindblad Expeditions LLC, 6.75%, 2/15/27(1) | | 142 | 140,788 |
| NCL Corp. Ltd.: | | | |
| 5.875%, 3/15/26(1) | | 647 | 634,403 |
| 5.875%, 2/15/27(1) | | 102 | 99,715 |
| 7.75%, 2/15/29(1) | | 86 | 87,910 |
| NCL Finance Ltd., 6.125%, 3/15/28(1) | | 547 | 534,169 |
| Playtika Holding Corp., 4.25%, 3/15/29(1) | | 757 | 652,063 |
| Royal Caribbean Cruises Ltd.: | | | |
| 3.70%, 3/15/28 | | 215 | 197,720 |
| 6.25%, 3/15/32(1) | | 305 | 300,873 |
| TUI AG, 5.875%, 3/15/29(10) | EUR | 980 | 1,060,649 |
12
See Notes to Financial Statements.
Eaton Vance
Multi-Asset Credit Fund
April 30, 2024
Portfolio of Investments (Unaudited) — continued
| Security | Principal
Amount*
(000's omitted) | Value |
| Leisure Goods/Activities/Movies (continued) |
| Viking Cruises Ltd.: | | | |
| 5.875%, 9/15/27(1) | | 985 | $ 955,796 |
| 7.00%, 2/15/29(1) | | 205 | 204,390 |
| Viking Ocean Cruises Ship VII Ltd., 5.625%, 2/15/29(1) | | 131 | 125,464 |
| | | | $ 8,866,026 |
| Machinery — 0.8% |
| Chart Industries, Inc., 9.50%, 1/1/31(1) | | 736 | $ 790,864 |
| ESAB Corp., 6.25%, 4/15/29(1) | | 830 | 827,923 |
| Husky Injection Molding Systems Ltd./Titan Co-Borrower LLC, 9.00%, 2/15/29(1) | | 200 | 206,119 |
| IMA Industria Macchine Automatiche SpA: | | | |
| 3.75%, 1/15/28(10) | EUR | 700 | 703,071 |
| 7.654%, (3 mo. EURIBOR + 3.75%), 4/15/29(2)(10) | EUR | 915 | 981,371 |
| TK Elevator Holdco GmbH, 6.625%, 7/15/28(10) | EUR | 540 | 550,249 |
| | | | $ 4,059,597 |
| Media — 0.6% |
| CSC Holdings LLC, 11.75%, 1/31/29(1) | | 829 | $ 737,022 |
| Outfront Media Capital LLC/Outfront Media Capital Corp.: | | | |
| 4.625%, 3/15/30(1) | | 946 | 835,940 |
| 7.375%, 2/15/31(1) | | 525 | 539,220 |
| Summer BidCo BV, 10.00%, (10.00% cash or 10.75% PIK), 2/15/29(10)(12) | EUR | 500 | 539,722 |
| Univision Communications, Inc.: | | | |
| 7.375%, 6/30/30(1) | | 463 | 443,709 |
| 8.00%, 8/15/28(1) | | 168 | 167,957 |
| | | | $ 3,263,570 |
| Metals/Mining — 1.0% |
| Arsenal AIC Parent LLC, 11.50%, 10/1/31(1) | | 1,148 | $ 1,279,720 |
| Compass Minerals International, Inc., 6.75%, 12/1/27(1) | | 691 | 648,807 |
| First Quantum Minerals Ltd., 9.375%, 3/1/29(1) | | 415 | 429,286 |
| Freeport-McMoRan, Inc., 5.45%, 3/15/43 | | 416 | 381,731 |
| Hudbay Minerals, Inc.: | | | |
| 4.50%, 4/1/26(1) | | 503 | 487,025 |
| 6.125%, 4/1/29(1) | | 220 | 215,598 |
| Novelis Corp., 3.25%, 11/15/26(1) | | 237 | 221,842 |
| Novelis Sheet Ingot GmbH, 3.375%, 4/15/29(10) | EUR | 1,077 | 1,084,478 |
| Roller Bearing Co. of America, Inc., 4.375%, 10/15/29(1) | | 552 | 499,568 |
| | | | $ 5,248,055 |
| Security | Principal
Amount*
(000's omitted) | Value |
| Nonferrous Metals/Minerals — 0.3% |
| Eldorado Gold Corp., 6.25%, 9/1/29(1) | | 690 | $ 650,602 |
| New Gold, Inc., 7.50%, 7/15/27(1) | | 653 | 649,599 |
| | | | $ 1,300,201 |
| Oil and Gas — 1.8% |
| Aethon United BR LP/Aethon United Finance Corp., 8.25%, 2/15/26(1) | | 950 | $ 957,018 |
| Civitas Resources, Inc.: | | | |
| 8.625%, 11/1/30(1) | | 980 | 1,043,559 |
| 8.75%, 7/1/31(1) | | 280 | 297,358 |
| Matador Resources Co., 6.50%, 4/15/32(1) | | 545 | 540,523 |
| Parkland Corp.: | | | |
| 4.50%, 10/1/29(1) | | 480 | 435,412 |
| 4.625%, 5/1/30(1) | | 292 | 264,118 |
| Permian Resources Operating LLC: | | | |
| 5.875%, 7/1/29(1) | | 701 | 681,809 |
| 7.00%, 1/15/32(1) | | 418 | 426,391 |
| 7.75%, 2/15/26(1) | | 362 | 365,574 |
| Precision Drilling Corp., 7.125%, 1/15/26(1) | | 612 | 612,476 |
| Southwestern Energy Co., 4.75%, 2/1/32 | | 810 | 730,029 |
| Transocean Poseidon Ltd., 6.875%, 2/1/27(1) | | 395 | 393,927 |
| Transocean, Inc., 8.75%, 2/15/30(1) | | 195 | 203,775 |
| Vital Energy, Inc.: | | | |
| 7.875%, 4/15/32(1) | | 379 | 384,825 |
| 9.75%, 10/15/30 | | 466 | 508,134 |
| Wintershall Dea Finance 2 BV, Series NC5, 2.499% to 4/20/26(10)(11)(13) | EUR | 1,300 | 1,284,646 |
| | | | $ 9,129,574 |
| Packaging & Containers — 0.8% |
| Ball Corp., 6.875%, 3/15/28 | | 487 | $ 495,152 |
| Fiber Bidco SpA, 7.908%, (3 mo. EURIBOR + 4.00%), 1/15/30(2)(10) | EUR | 965 | 1,037,258 |
| Kleopatra Finco SARL, 4.25%, 3/1/26(10) | EUR | 700 | 623,106 |
| Owens-Brockway Glass Container, Inc., 7.25%, 5/15/31(1) | | 662 | 663,840 |
| Trivium Packaging Finance BV: | | | |
| 3.75%, 8/15/26(10) | EUR | 575 | 600,475 |
| 7.651%, (3 mo. EURIBOR + 3.75%), 8/15/26(2)(10) | EUR | 740 | 793,565 |
| | | | $ 4,213,396 |
| Pharmaceuticals — 0.5% |
| Bayer AG, 5.375% to 6/25/30, 3/25/82(10)(11) | EUR | 600 | $ 596,645 |
| BellRing Brands, Inc., 7.00%, 3/15/30(1) | | 535 | 541,881 |
13
See Notes to Financial Statements.
Eaton Vance
Multi-Asset Credit Fund
April 30, 2024
Portfolio of Investments (Unaudited) — continued
| Security | Principal
Amount*
(000's omitted) | Value |
| Pharmaceuticals (continued) |
| Cheplapharm Arzneimittel GmbH, 8.651%, (3 mo. EURIBOR + 4.75%), 5/15/30(2)(10) | EUR | 825 | $ 893,284 |
| P&L Development LLC/PLD Finance Corp., 7.75%, 11/15/25(1) | | 493 | 418,017 |
| Prestige Brands, Inc., 3.75%, 4/1/31(1) | | 215 | 183,108 |
| | | | $ 2,632,935 |
| Pipelines — 1.8% |
| Antero Midstream Partners LP/Antero Midstream Finance Corp.: | | | |
| 5.75%, 3/1/27(1) | | 621 | $ 610,215 |
| 7.875%, 5/15/26(1) | | 148 | 150,817 |
| Cheniere Energy Partners LP, 4.00%, 3/1/31 | | 611 | 545,637 |
| DT Midstream, Inc., 4.125%, 6/15/29(1) | | 599 | 543,391 |
| Energy Transfer LP, 5.00%, 5/15/50 | | 337 | 279,526 |
| EQM Midstream Partners LP: | | | |
| 4.50%, 1/15/29(1) | | 1,033 | 956,670 |
| 6.00%, 7/1/25(1) | | 75 | 74,938 |
| 6.50%, 7/1/27(1) | | 405 | 405,889 |
| 7.50%, 6/1/30(1) | | 536 | 562,460 |
| Global Partners LP/GLP Finance Corp., 8.25%, 1/15/32(1) | | 649 | 665,350 |
| Kinetik Holdings LP, 5.875%, 6/15/30(1) | | 679 | 657,030 |
| Plains All American Pipeline LP, Series B, 9.679%, (3 mo. SOFR + 4.372%)(2)(13) | | 926 | 920,164 |
| Venture Global LNG, Inc.: | | | |
| 8.125%, 6/1/28(1) | | 609 | 623,204 |
| 8.375%, 6/1/31(1) | | 574 | 589,425 |
| 9.50%, 2/1/29(1) | | 794 | 853,937 |
| 9.875%, 2/1/32(1) | | 522 | 557,356 |
| | | | $ 8,996,009 |
| Publishing — 0.1% |
| McGraw-Hill Education, Inc.: | | | |
| 5.75%, 8/1/28(1) | | 326 | $ 302,682 |
| 8.00%, 8/1/29(1) | | 481 | 442,245 |
| | | | $ 744,927 |
| Radio and Television — 0.3% |
| Clear Channel Outdoor Holdings, Inc.: | | | |
| 7.75%, 4/15/28(1) | | 875 | $ 742,656 |
| 7.875%, 4/1/30(1) | | 448 | 439,577 |
| Townsquare Media, Inc., 6.875%, 2/1/26(1) | | 563 | 546,896 |
| | | | $ 1,729,129 |
| Security | Principal
Amount*
(000's omitted) | Value |
| Real Estate Investment Trusts (REITs) — 1.2% |
| CTR Partnership LP/CareTrust Capital Corp., 3.875%, 6/30/28(1) | | 852 | $ 772,071 |
| Cushman & Wakefield U.S. Borrower LLC: | | | |
| 6.75%, 5/15/28(1) | | 284 | 280,262 |
| 8.875%, 9/1/31(1) | | 594 | 616,799 |
| Emeria SASU: | | | |
| 3.375%, 3/31/28(10) | EUR | 400 | 365,525 |
| 7.75%, 3/31/28(10) | EUR | 900 | 929,385 |
| Greystar Real Estate Partners LLC, 7.75%, 9/1/30(1) | | 1,060 | 1,092,867 |
| HAT Holdings I LLC/HAT Holdings II LLC: | | | |
| 3.375%, 6/15/26(1) | | 600 | 558,317 |
| 3.75%, 9/15/30(1) | | 785 | 652,156 |
| Heimstaden Bostad AB, 3.248% to 11/19/24(10)(11)(13) | EUR | 950 | 740,844 |
| Shimao Group Holdings Ltd., 5.60%, 7/15/26(10)(15) | | 1,250 | 43,750 |
| | | | $ 6,051,976 |
| Retail — 2.1% |
| B&M European Value Retail SA, 8.125%, 11/15/30(10) | GBP | 400 | $ 533,246 |
| CD&R Firefly Bidco PLC, 8.625%, 4/30/29(10) | GBP | 760 | 946,999 |
| Dufry One BV, 3.375%, 4/15/28(10) | EUR | 1,350 | 1,390,929 |
| Evergreen AcqCo 1 LP/TVI, Inc., 9.75%, 4/26/28(1) | | 784 | 831,271 |
| Ferrellgas LP/Ferrellgas Finance Corp., 5.875%, 4/1/29(1) | | 793 | 752,115 |
| Group 1 Automotive, Inc., 4.00%, 8/15/28(1) | | 575 | 523,512 |
| Ken Garff Automotive LLC, 4.875%, 9/15/28(1) | | 583 | 541,470 |
| LCM Investments Holdings II LLC: | | | |
| 4.875%, 5/1/29(1) | | 775 | 708,566 |
| 8.25%, 8/1/31(1) | | 92 | 95,659 |
| Midco GB SASU, 7.75%, (7.75% cash or 8.50% PIK), 11/1/27(10)(12) | EUR | 815 | 884,641 |
| NMG Holding Co., Inc./Neiman Marcus Group LLC, 7.125%, 4/1/26(1) | | 773 | 770,141 |
| PEU (Fin) PLC, 7.25%, 7/1/28(10) | EUR | 600 | 658,848 |
| Punch Finance PLC, 6.125%, 6/30/26(10) | GBP | 610 | 732,651 |
| Raising Cane's Restaurants LLC, 9.375%, 5/1/29(1) | | 662 | 710,829 |
| Suburban Propane Partners LP/Suburban Energy Finance Corp., 5.00%, 6/1/31(1) | | 590 | 524,625 |
| | | | $ 10,605,502 |
| Retailers (Except Food and Drug) — 0.5% |
| Bath & Body Works, Inc.: | | | |
| 6.875%, 11/1/35 | | 410 | $ 407,683 |
| 6.95%, 3/1/33 | | 282 | 272,769 |
| 9.375%, 7/1/25(1) | | 54 | 55,937 |
| Dave & Buster's, Inc., 7.625%, 11/1/25(1) | | 923 | 929,834 |
14
See Notes to Financial Statements.
Eaton Vance
Multi-Asset Credit Fund
April 30, 2024
Portfolio of Investments (Unaudited) — continued
| Security | Principal
Amount*
(000's omitted) | Value |
| Retailers (Except Food and Drug) (continued) |
| PetSmart, Inc./PetSmart Finance Corp., 7.75%, 2/15/29(1) | | 416 | $ 395,834 |
| Superior Plus LP/Superior General Partner, Inc., 4.50%, 3/15/29(1) | | 737 | 667,304 |
| | | | $ 2,729,361 |
| Semiconductors & Semiconductor Equipment — 0.4% |
| ams-OSRAM AG, 10.50%, 3/30/29(10) | EUR | 1,500 | $ 1,608,805 |
| ON Semiconductor Corp., 3.875%, 9/1/28(1) | | 554 | 503,229 |
| | | | $ 2,112,034 |
| Software — 0.5% |
| Central Parent LLC/CDK Global II LLC/CDK Financing Co., Inc., 8.00%, 6/15/29(1) | | 374 | $ 385,076 |
| Clarivate Science Holdings Corp., 4.875%, 7/1/29(1) | | 734 | 669,219 |
| Cloud Software Group, Inc.: | | | |
| 6.50%, 3/31/29(1) | | 344 | 326,530 |
| 9.00%, 9/30/29(1) | | 1,133 | 1,091,068 |
| Rocket Software, Inc., 9.00%, 11/28/28(1)(14) | | 210 | 210,988 |
| | | | $ 2,682,881 |
| Software and Services — 0.1% |
| Gartner, Inc., 3.75%, 10/1/30(1) | | 547 | $ 476,572 |
| | | | $ 476,572 |
| Specialty Retail — 0.1% |
| Fiber Bidco SpA, 11.00%, 10/25/27(10) | EUR | 270 | $ 311,571 |
| | | | $ 311,571 |
| Steel — 0.2% |
| Allegheny Ludlum LLC, 6.95%, 12/15/25 | | 401 | $ 406,800 |
| TMS International Corp., 6.25%, 4/15/29(1) | | 449 | 414,245 |
| | | | $ 821,045 |
| Surface Transport — 0.1% |
| Hertz Corp.: | | | |
| 4.625%, 12/1/26(1) | | 47 | $ 36,453 |
| 5.00%, 12/1/29(1) | | 440 | 302,567 |
| | | | $ 339,020 |
| Technology — 0.5% |
| athenahealth Group, Inc., 6.50%, 2/15/30(1) | | 1,055 | $ 950,742 |
| International Game Technology PLC: | | | |
| 3.50%, 6/15/26(10) | EUR | 250 | 263,150 |
| Security | Principal
Amount*
(000's omitted) | Value |
| Technology (continued) |
| International Game Technology PLC: (continued) | | | |
| 4.125%, 4/15/26(1) | | 573 | $ 552,200 |
| 6.25%, 1/15/27(1) | | 200 | 199,845 |
| 6.50%, 2/15/25(1) | | 383 | 383,300 |
| | | | $ 2,349,237 |
| Telecommunications — 2.5% |
| Ciena Corp., 4.00%, 1/31/30(1) | | 706 | $ 619,924 |
| Connect Finco SARL/Connect U.S. Finco LLC, 6.75%, 10/1/26(1) | | 1,299 | 1,259,202 |
| Iliad Holding SASU: | | | |
| 6.50%, 10/15/26(1) | | 943 | 939,359 |
| 7.00%, 10/15/28(1) | | 362 | 354,318 |
| LCPR Senior Secured Financing DAC, 5.125%, 7/15/29(1) | | 571 | 477,459 |
| Lorca Telecom Bondco SA, 4.00%, 9/18/27(10) | EUR | 1,100 | 1,146,950 |
| Network i2i Ltd., 3.975% to 3/3/26(10)(11)(13) | | 1,000 | 947,389 |
| PLT VII Finance SARL, 8.531%, (3 mo. EURIBOR + 4.625%), 1/5/26(2)(10) | EUR | 500 | 535,935 |
| Stagwell Global LLC, 5.625%, 8/15/29(1) | | 576 | 516,255 |
| Summer (BC) Holdco A SARL, 9.25%, 10/31/27(10) | EUR | 462 | 473,622 |
| Summer (BC) Holdco B SARL, 5.75%, 10/31/26(10) | EUR | 500 | 525,063 |
| Summer BC Bidco B LLC, 5.50%, 10/31/26(1) | | 383 | 366,054 |
| Telecom Italia Finance SA, 7.75%, 1/24/33 | EUR | 435 | 512,605 |
| Telecom Italia SpA: | | | |
| 6.875%, 2/15/28(10) | EUR | 300 | 335,609 |
| 7.875%, 7/31/28(10) | EUR | 600 | 697,131 |
| Telefonica Europe BV, 7.125% to 8/23/28(10)(11)(13) | EUR | 800 | 926,864 |
| Viasat, Inc., 5.625%, 4/15/27(1) | | 272 | 249,184 |
| Viavi Solutions, Inc., 3.75%, 10/1/29(1) | | 491 | 413,045 |
| Vodafone Group PLC, 4.875% to 7/3/25, 10/3/78(10)(11) | GBP | 500 | 613,262 |
| Wp/ap Telecom Holdings III BV, 5.50%, 1/15/30(10) | EUR | 800 | 776,768 |
| | | | $ 12,685,998 |
| Transportation — 0.4% |
| Cargo Aircraft Management, Inc., 4.75%, 2/1/28(1) | | 457 | $ 413,190 |
| Seaspan Corp., 5.50%, 8/1/29(1) | | 923 | 795,104 |
| Watco Cos. LLC/Watco Finance Corp., 6.50%, 6/15/27(1) | | 769 | 760,140 |
| | | | $ 1,968,434 |
| Utilities — 1.2% |
| Calpine Corp.: | | | |
| 5.00%, 2/1/31(1) | | 615 | $ 557,949 |
| 5.125%, 3/15/28(1) | | 450 | 427,257 |
15
See Notes to Financial Statements.
Eaton Vance
Multi-Asset Credit Fund
April 30, 2024
Portfolio of Investments (Unaudited) — continued
| Security | Principal
Amount*
(000's omitted) | Value |
| Utilities (continued) |
| Calpine Corp.: (continued) | | | |
| 5.25%, 6/1/26(1) | | 498 | $ 491,344 |
| Leeward Renewable Energy Operations LLC, 4.25%, 7/1/29(1) | | 411 | 340,602 |
| NRG Energy, Inc.: | | | |
| 3.625%, 2/15/31(1) | | 563 | 477,177 |
| 3.875%, 2/15/32(1) | | 118 | 99,529 |
| 5.75%, 1/15/28 | | 384 | 378,300 |
| 10.25% to 3/15/28(1)(11)(13) | | 621 | 670,011 |
| TerraForm Power Operating LLC: | | | |
| 4.75%, 1/15/30(1) | | 460 | 410,501 |
| 5.00%, 1/31/28(1) | | 450 | 420,352 |
| Vistra Operations Co. LLC: | | | |
| 4.375%, 5/1/29(1) | | 193 | 175,904 |
| 5.00%, 7/31/27(1) | | 695 | 662,055 |
| 6.875%, 4/15/32(1) | | 828 | 825,112 |
| | | | $ 5,936,093 |
Total Corporate Bonds
(identified cost $253,870,400) | | | $248,891,680 |
| Security | Shares | Value |
| Distribution & Wholesale — 0.2% |
| WESCO International, Inc., Series A, 10.625% to 6/22/25(11) | | 36,126 | $ 953,365 |
Total Preferred Stocks
(identified cost $1,027,931) | | | $ 953,365 |
| Senior Floating-Rate Loans — 37.5%(16) |
| Borrower/Description | Principal
Amount*
(000's omitted) | Value |
| Aerospace and Defense — 0.6% |
| Dynasty Acquisition Co., Inc.: | | | |
| Term Loan, 8.816%, (SOFR + 3.50%), 8/24/28 | | 915 | $ 920,732 |
| Term Loan, 8.816%, (SOFR + 3.50%), 8/24/28 | | 353 | 355,011 |
| TransDigm, Inc., Term Loan, 8.059%, (SOFR + 2.75%), 8/24/28 | | 1,886 | 1,898,389 |
| | | | $ 3,174,132 |
| Borrower/Description | Principal
Amount*
(000's omitted) | Value |
| Airlines — 0.5% |
| American Airlines, Inc., Term Loan, 10.336%, (SOFR + 4.75%), 4/20/28 | | 1,821 | $ 1,896,471 |
| Mileage Plus Holdings LLC, Term Loan, 10.733%, (SOFR + 5.25%), 6/21/27 | | 425 | 436,360 |
| | | | $ 2,332,831 |
| Apparel & Luxury Goods — 0.4% |
| ABG Intermediate Holdings 2 LLC, Term Loan, 8.918%, (SOFR + 3.50%), 12/21/28 | | 663 | $ 666,048 |
| Gloves Buyer, Inc., Term Loan, 9.43%, (SOFR + 4.00%), 12/29/27 | | 495 | 496,134 |
| Hanesbrands, Inc., Term Loan, 9.066%, (SOFR + 3.75%), 3/8/30 | | 1,042 | 1,044,592 |
| | | | $ 2,206,774 |
| Auto Components — 1.0% |
| Adient U.S. LLC, Term Loan, 8.066%, (SOFR + 2.75%), 1/31/31 | | 1,000 | $ 1,005,547 |
| Autokiniton U.S. Holdings, Inc., Term Loan, 9.43%, (SOFR + 4.00%), 4/6/28 | | 1,081 | 1,087,817 |
| Clarios Global LP, Term Loan, 8.316%, (SOFR + 3.00%), 5/6/30 | | 1,665 | 1,671,903 |
| DexKo Global, Inc.: | | | |
| Term Loan, 9.321%, (SOFR + 3.75%), 10/4/28 | | 515 | 511,519 |
| Term Loan, 9.559%, (SOFR + 4.25%), 10/4/28 | | 150 | 149,648 |
| LTI Holdings, Inc., Term Loan, 8.93%, (SOFR + 3.50%), 9/6/25 | | 708 | 701,561 |
| | | | $ 5,127,995 |
| Automobiles — 0.5% |
| Bombardier Recreational Products, Inc., Term Loan, 8.066%, (SOFR + 2.75%), 1/22/31 | | 1,382 | $ 1,384,388 |
| MajorDrive Holdings IV LLC, Term Loan, 9.571%, (SOFR + 4.00%), 6/1/28 | | 990 | 996,025 |
| | | | $ 2,380,413 |
| Beverages — 0.2% |
| Triton Water Holdings, Inc., Term Loan, 8.814%, (SOFR + 3.25%), 3/31/28 | | 1,242 | $ 1,237,823 |
| | | | $ 1,237,823 |
| Biotechnology — 0.1% |
| Alltech, Inc., Term Loan, 9.43%, (SOFR + 4.00%), 10/13/28 | | 728 | $ 724,547 |
| | | | $ 724,547 |
16
See Notes to Financial Statements.
Eaton Vance
Multi-Asset Credit Fund
April 30, 2024
Portfolio of Investments (Unaudited) — continued
| Borrower/Description | Principal
Amount*
(000's omitted) | Value |
| Building Products — 0.4% |
| Cornerstone Building Brands, Inc., Term Loan, 8.671%, (SOFR + 3.25%), 4/12/28 | | 495 | $ 486,031 |
| Oscar AcquisitionCo LLC, Term Loan, 9.902%, (SOFR + 4.50%), 4/29/29 | | 739 | 742,649 |
| Standard Industries, Inc., Term Loan, 7.68%, (SOFR + 2.25%), 9/22/28 | | 976 | 979,803 |
| | | | $ 2,208,483 |
| Capital Markets — 1.4% |
| Advisor Group, Inc., Term Loan, 9.816%, (SOFR + 4.50%), 8/17/28 | | 962 | $ 968,533 |
| Aretec Group, Inc., Term Loan, 9.916%, (SOFR + 4.50%), 8/9/30 | | 1,160 | 1,167,028 |
| Citco Funding LLC, Term Loan, 8.422%, (SOFR + 3.25%), 4/27/28 | | 1,219 | 1,224,716 |
| Edelman Financial Center LLC, Term Loan, 8.93%, (SOFR + 3.50%), 4/7/28 | | 742 | 743,565 |
| Focus Financial Partners LLC, Term Loan, 8.066%, (SOFR + 2.75%), 6/30/28 | | 1,167 | 1,168,253 |
| HighTower Holdings LLC, Term Loan, 9.586%, (SOFR + 4.00%), 4/21/28 | | 992 | 998,569 |
| Mariner Wealth Advisors LLC, Term Loan, 8.68%, (SOFR + 3.25%), 8/18/28 | | 792 | 793,174 |
| | | | $ 7,063,838 |
| Chemicals — 2.5% |
| Aruba Investments Holdings LLC, Term Loan, 9.416%, (SOFR + 4.00%), 11/24/27 | | 595 | $ 580,534 |
| Axalta Coating Systems U.S. Holdings, Inc., Term Loan, 7.33%, (SOFR + 2.00%), 12/20/29 | | 1,290 | 1,295,149 |
| Charter NEX U.S., Inc., Term Loan, 8.816%, (SOFR + 3.50%), 12/1/27 | | 892 | 896,165 |
| CPC Acquisition Corp., Term Loan, 9.321%, (SOFR + 3.75%), 12/29/27 | | 659 | 558,990 |
| ECO Services Operations Corp., Term Loan, 7.93%, (SOFR + 2.50%), 6/9/28 | | 999 | 999,802 |
| Groupe Solmax, Inc., Term Loan, 10.252%, (SOFR + 4.75%), 5/29/28(17) | | 495 | 488,415 |
| INEOS Quattro Holdings U.K. Ltd., Term Loan, 9.18%, (SOFR + 3.75%), 3/14/30 | | 769 | 768,707 |
| INEOS U.S. Finance LLC: | | | |
| Term Loan, 8.916%, (SOFR + 3.50%), 2/18/30 | | 496 | 497,801 |
| Term Loan, 9.166%, (SOFR + 3.75%), 11/8/27 | | 990 | 992,917 |
| Kraton Corp., Term Loan, 8.841%, (SOFR + 3.25%), 3/15/29 | | 840 | 808,141 |
| Lonza Group AG, Term Loan, 9.334%, (SOFR + 3.93%), 7/3/28 | | 496 | 476,852 |
| Borrower/Description | Principal
Amount*
(000's omitted) | Value |
| Chemicals (continued) |
| Momentive Performance Materials, Inc., Term Loan, 9.817%, (SOFR + 4.50%), 3/29/28 | | 545 | $ 542,118 |
| Olympus Water U.S. Holding Corp., Term Loan, 9.576%, (SOFR + 4.25%), 11/9/28 | | 975 | 979,708 |
| Starfruit Finco BV, Term Loan, 9.423%, (SOFR + 4.00%), 4/3/28 | | 720 | 722,373 |
| Tronox Finance LLC, Term Loan, 8.816%, (SOFR + 3.50%), 8/16/28 | | 998 | 1,000,825 |
| W.R. Grace & Co.-Conn., Term Loan, 9.321%, (SOFR + 3.75%), 9/22/28 | | 1,271 | 1,274,781 |
| | | | $ 12,883,278 |
| Commercial Services & Supplies — 1.4% |
| Albion Financing 3 SARL, Term Loan, 10.824%, (SOFR + 5.50%), 8/17/26 | | 594 | $ 597,713 |
| Allied Universal Holdco LLC, Term Loan, 9.166%, (SOFR + 3.75%), 5/12/28 | | 1,126 | 1,127,628 |
| EnergySolutions LLC, Term Loan, 9.316%, (SOFR + 4.00%), 9/20/30 | | 787 | 791,441 |
| Foundever Worldwide Corp., Term Loan, 9.18%, (SOFR + 3.75%), 8/28/28 | | 990 | 770,137 |
| Garda World Security Corp., Term Loan, 9.583%, (SOFR + 4.25%), 2/1/29 | | 1,047 | 1,053,319 |
| GFL Environmental, Inc., Term Loan, 7.826%, (SOFR + 2.50%), 5/31/27 | | 791 | 795,567 |
| Tempo Acquisition LLC, Term Loan, 8.066%, (SOFR + 2.75%), 8/31/28 | | 1,466 | 1,472,311 |
| TruGreen LP, Term Loan, 9.416%, (SOFR + 4.00%), 11/2/27 | | 595 | 573,504 |
| | | | $ 7,181,620 |
| Construction Materials — 0.3% |
| Quikrete Holdings, Inc., Term Loan, 7.569%, (SOFR + 2.25%), 3/19/29 | | 1,279 | $ 1,280,814 |
| | | | $ 1,280,814 |
| Containers & Packaging — 0.1% |
| Clydesdale Acquisition Holdings, Inc., Term Loan, 9.091%, (SOFR + 3.68%), 4/13/29 | | 739 | $ 742,613 |
| | | | $ 742,613 |
| Distributors — 0.2% |
| Parts Europe SA, Term Loan, 7.647%, (3 mo. EURIBOR + 3.75%), 2/3/31 | EUR | 1,135 | $ 1,216,072 |
| | | | $ 1,216,072 |
17
See Notes to Financial Statements.
Eaton Vance
Multi-Asset Credit Fund
April 30, 2024
Portfolio of Investments (Unaudited) — continued
| Borrower/Description | Principal
Amount*
(000's omitted) | Value |
| Diversified Consumer Services — 0.6% |
| Ascend Learning LLC, Term Loan, 8.916%, (SOFR + 3.50%), 12/11/28 | | 496 | $ 495,146 |
| Belron Finance U.S. LLC, Term Loan, 7.677%, (SOFR + 2.25%), 4/18/29 | | 1,390 | 1,393,346 |
| KUEHG Corp., Term Loan, 9.823%, (SOFR + 4.50%), 6/12/30 | | 970 | 974,215 |
| Wand NewCo 3, Inc., Term Loan, 9.066%, (SOFR + 3.75%), 1/30/31 | | 425 | 428,188 |
| | | | $ 3,290,895 |
| Electrical Equipment — 0.2% |
| WEC U.S. Holdings Ltd., Term Loan, 8.066%, (SOFR + 2.75%), 1/27/31 | | 1,253 | $ 1,255,244 |
| | | | $ 1,255,244 |
| Electronic Equipment, Instruments & Components — 1.3% |
| Chamberlain Group, Inc.: | | | |
| Term Loan, 8.666%, (SOFR + 3.25%), 11/3/28 | | 744 | $ 744,156 |
| Term Loan, 9.066%, (SOFR + 3.75%), 11/3/28 | | 400 | 401,200 |
| Creation Technologies, Inc., Term Loan, 11.068%, (SOFR + 5.50%), 10/5/28 | | 694 | 657,503 |
| Ingram Micro, Inc., Term Loan, 8.571%, (SOFR + 3.00%), 6/30/28 | | 372 | 372,720 |
| Robertshaw U.S. Holding Corp.: | | | |
| DIP Loan, 6.309%, (SOFR + 1.00%), 9/27/24 | | 635 | 618,853 |
| Term Loan, 0.00%, 2/28/27(15) | | 0 (18) | 359 |
| Term Loan, 0.00%, 2/28/27(15) | | 2,029 | 1,978,336 |
| Term Loan - Second Lien, 0.00%, 2/28/27(15) | | 1,868 | 1,027,377 |
| Verifone Systems, Inc., Term Loan, 9.585%, (SOFR + 4.00%), 8/20/25 | | 738 | 670,359 |
| | | | $ 6,470,863 |
| Energy Equipment & Services — 0.2% |
| GIP Pilot Acquisition Partners LP, Term Loan, 8.308%, (SOFR + 3.00%), 10/4/30 | | 923 | $ 928,454 |
| | | | $ 928,454 |
| Entertainment — 0.6% |
| Delta 2 (LUX) SARL, Term Loan, 7.559%, (SOFR + 2.25%), 1/15/30 | | 1,000 | $ 1,002,292 |
| Playtika Holding Corp., Term Loan, 8.18%, (SOFR + 2.75%), 3/13/28 | | 346 | 346,645 |
| Borrower/Description | Principal
Amount*
(000's omitted) | Value |
| Entertainment (continued) |
| Renaissance Holding Corp., Term Loan, 9.566%, (SOFR + 4.25%), 4/5/30 | | 622 | $ 623,434 |
| UFC Holdings LLC, Term Loan, 8.336%, (SOFR + 2.75%), 4/29/26 | | 1,303 | 1,307,290 |
| | | | $ 3,279,661 |
| Financial Services — 0.2% |
| GTCR W Merger Sub LLC, Term Loan, 8.309%, (SOFR + 3.00%), 1/31/31 | | 850 | $ 854,383 |
| | | | $ 854,383 |
| Food Products — 0.3% |
| Del Monte Foods, Inc., Term Loan, 9.668%, (SOFR + 4.25%), 5/16/29 | | 496 | $ 424,270 |
| Nomad Foods U.S. LLC, Term Loan, 8.272%, (SOFR + 3.00%), 11/13/29 | | 1,207 | 1,210,717 |
| | | | $ 1,634,987 |
| Gas Utilities — 0.4% |
| CQP Holdco LP, Term Loan, 8.302%, (SOFR + 3.00%), 12/31/30 | | 1,349 | $ 1,354,262 |
| Epic Y-Grade Services LP, Term Loan, 6/29/29(19) | | 613 | 606,611 |
| | | | $ 1,960,873 |
| Health Care Equipment & Supplies — 0.4% |
| Bausch & Lomb Corp., Term Loan, 8.669%, (SOFR + 3.25%), 5/10/27 | | 350 | $ 347,816 |
| Bayou Intermediate II LLC, Term Loan, 10.091%, (SOFR + 4.50%), 8/2/28 | | 499 | 496,854 |
| Journey Personal Care Corp., Term Loan, 9.68%, (SOFR + 4.25%), 3/1/28 | | 495 | 492,669 |
| Medline Borrower LP, Term Loan, 8.068%, (SOFR + 2.75%), 10/23/28 | | 627 | 629,028 |
| | | | $ 1,966,367 |
| Health Care Providers & Services — 1.6% |
| CCRR Parent, Inc., Term Loan, 9.18%, (SOFR + 3.75%), 3/6/28 | | 992 | $ 921,004 |
| CHG Healthcare Services, Inc., Term Loan, 8.68%, (SOFR + 3.25%), 9/29/28 | | 869 | 872,518 |
| Medical Solutions Holdings, Inc., Term Loan, 8.666%, (SOFR + 3.25%), 11/1/28 | | 981 | 871,902 |
| National Mentor Holdings, Inc.: | | | |
| Term Loan, 9.159%, (SOFR + 3.75%), 3/2/28 | | 27 | 25,127 |
| Term Loan, 9.165%, (SOFR + 3.75%), 3/2/28(17) | | 756 | 691,459 |
18
See Notes to Financial Statements.
Eaton Vance
Multi-Asset Credit Fund
April 30, 2024
Portfolio of Investments (Unaudited) — continued
| Borrower/Description | Principal
Amount*
(000's omitted) | Value |
| Health Care Providers & Services (continued) |
| Pluto Acquisition I, Inc.: | | | |
| Term Loan, 10.687%, (SOFR + 5.50%), 6/20/28 | | 230 | $ 232,489 |
| Term Loan - Second Lien, 9.316%, (SOFR + 4.00%), 9/20/28 | | 671 | 596,889 |
| Radnet Management, Inc., Term Loan, 7.823%, (SOFR + 2.50%), 4/18/31 | | 250 | 250,313 |
| Select Medical Corp., Term Loan, 8.316%, (SOFR + 3.00%), 3/6/27 | | 1,203 | 1,206,765 |
| Surgery Center Holdings, Inc., Term Loan, 8.815%, (SOFR + 3.50%), 12/19/30 | | 1,000 | 1,007,159 |
| Team Health Holdings, Inc., Term Loan, 10.58%, (SOFR + 5.25%), 3/2/27(17) | | 853 | 750,894 |
| TTF Holdings LLC, Term Loan, 9.43%, (SOFR + 4.00%), 3/31/28 | | 750 | 752,188 |
| | | | $ 8,178,707 |
| Health Care Technology — 0.6% |
| athenahealth Group, Inc., Term Loan, 8.566%, (SOFR + 3.25%), 2/15/29 | | 876 | $ 873,969 |
| Symplr Software, Inc., Term Loan, 9.93%, (SOFR + 4.50%), 12/22/27 | | 496 | 472,389 |
| Verscend Holding Corp., Term Loan, 11.50%, (USD Prime + 3.00%), 8/27/25 | | 1,023 | 1,023,495 |
| Waystar Technologies, Inc., Term Loan, 9.316%, (SOFR + 4.00%), 10/22/29 | | 659 | 663,132 |
| | | | $ 3,032,985 |
| Hotels, Restaurants & Leisure — 2.3% |
| Caesars Entertainment, Inc., Term Loan, 8.066%, (SOFR + 2.75%), 2/6/31 | | 800 | $ 802,250 |
| Carnival Corp., Term Loan, 8.067%, (SOFR + 2.75%), 10/18/28 | | 888 | 891,615 |
| ClubCorp Holdings, Inc., Term Loan, 10.564%, (SOFR + 5.00%), 9/18/26 | | 696 | 698,815 |
| Dave & Buster's, Inc., Term Loan, 8.625%, (SOFR + 3.25%), 6/29/29 | | 348 | 349,208 |
| Fertitta Entertainment LLC, Term Loan, 9.069%, (SOFR + 3.75%), 1/27/29 | | 850 | 852,835 |
| Flutter Financing BV, Term Loan, 7.559%, (SOFR + 2.25%), 11/25/30 | | 1,441 | 1,445,892 |
| Four Seasons Hotels Ltd., Term Loan, 7.316%, (SOFR + 2.00%), 11/30/29 | | 1,386 | 1,388,910 |
| IRB Holding Corp., Term Loan, 8.166%, (SOFR + 2.75%), 12/15/27 | | 2,206 | 2,210,950 |
| Playa Resorts Holding BV, Term Loan, 8.565%, (SOFR + 3.25%), 1/5/29 | | 1,247 | 1,253,533 |
| Borrower/Description | Principal
Amount*
(000's omitted) | Value |
| Hotels, Restaurants & Leisure (continued) |
| SeaWorld Parks & Entertainment, Inc., Term Loan, 7.816%, (SOFR + 2.50%), 8/25/28 | | 990 | $ 990,895 |
| Spectacle Gary Holdings LLC, Term Loan, 9.702%, (SOFR + 4.25%), 12/11/28 | | 765 | 754,144 |
| | | | $ 11,639,047 |
| Household Durables — 0.4% |
| ACProducts, Inc., Term Loan, 9.814%, (SOFR + 4.25%), 5/17/28 | | 1,038 | $ 902,495 |
| Solis IV BV, Term Loan, 8.824%, (SOFR + 3.50%), 2/26/29 | | 989 | 983,914 |
| | | | $ 1,886,409 |
| Household Products — 0.4% |
| Energizer Holdings, Inc., Term Loan, 7.68%, (SOFR + 2.25%), 12/22/27 | | 1,130 | $ 1,131,192 |
| Kronos Acquisition Holdings, Inc., Term Loan, 9.314%, (SOFR + 3.75%), 12/22/26 | | 893 | 894,614 |
| | | | $ 2,025,806 |
| Industrial Conglomerates — 0.2% |
| Kohler Energy Co. LLC, Term Loan, 1/30/31(19) | | 800 | $ 802,750 |
| | | | $ 802,750 |
| Insurance — 1.1% |
| Alliant Holdings Intermediate LLC, Term Loan, 8.819%, (SOFR + 3.50%), 11/6/30 | | 610 | $ 613,007 |
| AmWINS Group, Inc., Term Loan, 7.68%, (SOFR + 2.25%), 2/19/28 | | 1,671 | 1,674,090 |
| Ryan Specialty Group LLC, Term Loan, 8.066%, (SOFR + 2.75%), 9/1/27 | | 992 | 995,389 |
| Truist Insurance Holdings LLC, Term Loan - Second Lien, 3/8/32(19) | | 1,340 | 1,352,227 |
| USI, Inc., Term Loan, 8.302%, (SOFR + 3.00%), 11/22/29 | | 1,176 | 1,180,435 |
| | | | $ 5,815,148 |
| Interactive Media & Services — 0.1% |
| Getty Images, Inc., Term Loan, 9.909%, (SOFR + 4.50%), 2/19/26 | | 502 | $ 503,109 |
| | | | $ 503,109 |
| IT Services — 1.7% |
| Asurion LLC: | | | |
| Term Loan, 8.68%, (SOFR + 3.25%), 12/23/26 | | 1,524 | $ 1,492,011 |
19
See Notes to Financial Statements.
Eaton Vance
Multi-Asset Credit Fund
April 30, 2024
Portfolio of Investments (Unaudited) — continued
| Borrower/Description | Principal
Amount*
(000's omitted) | Value |
| IT Services (continued) |
| Asurion LLC: (continued) | | | |
| Term Loan - Second Lien, 10.68%, (SOFR + 5.25%), 1/31/28 | | 1,000 | $ 914,464 |
| Endure Digital, Inc., Term Loan, 8.939%, (SOFR + 3.50%), 2/10/28 | | 985 | 956,343 |
| Gainwell Acquisition Corp., Term Loan, 9.409%, (SOFR + 4.00%), 10/1/27 | | 1,070 | 1,023,635 |
| Go Daddy Operating Co. LLC, Term Loan, 7.316%, (SOFR + 2.00%), 11/9/29 | | 993 | 993,711 |
| Informatica LLC, Term Loan, 8.18%, (SOFR + 2.75%), 10/27/28 | | 1,789 | 1,793,865 |
| NAB Holdings LLC, Term Loan, 8.209%, (SOFR + 2.75%), 11/23/28 | | 992 | 992,800 |
| Rackspace Technology Global, Inc.: | | | |
| Term Loan, 11.552%, (SOFR + 6.25%), 5/15/28 | | 71 | 71,231 |
| Term Loan - Second Lien, 8.186%, (SOFR + 2.75%), 5/15/28 | | 353 | 169,678 |
| Travelport Finance (Luxembourg) SARL, Term Loan, 13.564%, (SOFR + 8.00%), 9/30/28 | | 357 | 330,673 |
| | | | $ 8,738,411 |
| Leisure Products — 0.1% |
| Peloton Interactive, Inc., Term Loan, 12.477%, (SOFR + 7.00%), 5/25/27 | | 310 | $ 310,276 |
| | | | $ 310,276 |
| Life Sciences Tools & Services — 0.1% |
| Curia Global, Inc., Term Loan, 9.18%, (SOFR + 3.75%), 8/30/26(17) | | 754 | $ 718,291 |
| | | | $ 718,291 |
| Machinery — 2.8% |
| AI Aqua Merger Sub, Inc., Term Loan, 9.324%, (SOFR + 4.00%), 7/31/28 | | 1,042 | $ 1,045,944 |
| Alliance Laundry Systems LLC, Term Loan, 8.90%, (SOFR + 3.50%), 10/8/27(17) | | 445 | 447,099 |
| Apex Tool Group LLC: | | | |
| Term Loan, 15.315%, (SOFR + 10.00%), 2/8/30 | | 463 | 449,460 |
| Term Loan - Second Lien, 12.566%, (SOFR + 7.25%), 8.566% cash, 4.00% PIK, 2/8/29 | | 199 | 196,597 |
| Barnes Group, Inc., Term Loan, 7.816%, (SOFR + 2.50%), 9/3/30 | | 995 | 998,316 |
| Clark Equipment Co., Term Loan, 7.902%, (SOFR + 2.50%), 4/20/29 | | 933 | 937,071 |
| Conair Holdings LLC, Term Loan, 9.18%, (SOFR + 3.75%), 5/17/28 | | 791 | 785,613 |
| CPM Holdings, Inc., Term Loan, 9.827%, (SOFR + 4.50%), 9/28/28 | | 499 | 500,665 |
| Borrower/Description | Principal
Amount*
(000's omitted) | Value |
| Machinery (continued) |
| EMRLD Borrower LP, Term Loan, 7.816%, (SOFR + 2.50%), 5/31/30 | | 816 | $ 818,469 |
| Engineered Machinery Holdings, Inc., Term Loan, 9.321%, (SOFR + 3.75%), 5/19/28 | | 1,328 | 1,330,402 |
| Filtration Group Corp., Term Loan, 8.93%, (SOFR + 3.50%), 10/21/28 | | 744 | 746,755 |
| Gates Global LLC, Term Loan, 7.916%, (SOFR + 2.50%), 3/31/27 | | 1,405 | 1,410,397 |
| Madison IAQ LLC, Term Loan, 8.68%, (SOFR + 3.25%), 6/21/28 | | 1,175 | 1,176,965 |
| Roper Industrial Products Investment Co. LLC, Term Loan, 9.302%, (SOFR + 4.00%), 11/22/29 | | 695 | 700,261 |
| SPX Flow, Inc., Term Loan, 9.916%, (SOFR + 4.50%), 4/5/29 | | 950 | 956,413 |
| Titan Acquisition Ltd., Term Loan, 10.317%, (SOFR + 5.00%), 2/1/29 | | 300 | 301,875 |
| TK Elevator U.S. Newco, Inc., Term Loan, 8.791%, (SOFR + 3.50%), 4/30/30 | | 1,412 | 1,418,581 |
| | | | $ 14,220,883 |
| Media — 0.2% |
| Aragorn Parent Corp., Term Loan, 9.569%, (SOFR + 4.25%), 12/15/28 | | 829 | $ 834,995 |
| | | | $ 834,995 |
| Metals/Mining — 0.6% |
| Arsenal AIC Parent LLC, Term Loan, 9.066%, (SOFR + 3.75%), 8/18/30 | | 871 | $ 878,249 |
| PMHC II, Inc., Term Loan, 9.706%, (SOFR + 4.25%), 4/23/29 | | 792 | 782,001 |
| WireCo WorldGroup, Inc., Term Loan, 9.075%, (SOFR + 3.75%), 11/13/28 | | 673 | 676,297 |
| Zekelman Industries, Inc., Term Loan, 7.568%, (SOFR + 2.25%), 1/24/31 | | 497 | 498,521 |
| | | | $ 2,835,068 |
| Oil, Gas & Consumable Fuels — 0.5% |
| Buckeye Partners LP, Term Loan, 7.816%, (SOFR + 2.50%), 11/22/30 | | 274 | $ 275,575 |
| ITT Holdings LLC, Term Loan, 8.421%, (SOFR + 3.00%), 10/11/30 | | 697 | 697,951 |
| Oryx Midstream Services Permian Basin LLC, Term Loan, 8.436%, (SOFR + 3.00%), 10/5/28 | | 742 | 745,898 |
| UGI Energy Services LLC, Term Loan, 8.666%, (SOFR + 3.25%), 2/22/30 | | 744 | 749,530 |
| | | | $ 2,468,954 |
20
See Notes to Financial Statements.
Eaton Vance
Multi-Asset Credit Fund
April 30, 2024
Portfolio of Investments (Unaudited) — continued
| Borrower/Description | Principal
Amount*
(000's omitted) | Value |
| Paper & Forest Products — 0.1% |
| Enviva Partners LP/Enviva Partners Finance Corp.: | | | |
| Term Loan, 4.00%, 12/13/24(20) | | 188 | $ 191,723 |
| Term Loan, 4.00%, 12/13/24(20) | | 92 | 107,979 |
| Term Loan, 13.297%, (SOFR + 8.00%), 12/13/24 | | 113 | 132,274 |
| | | | $ 431,976 |
| Passenger Airlines — 0.1% |
| WestJet Loyalty LP, Term Loan, 2/14/31(19) | | 600 | $ 601,393 |
| | | | $ 601,393 |
| Pharmaceuticals — 0.4% |
| Bausch Health Cos., Inc., Term Loan, 10.668%, (SOFR + 5.25%), 2/1/27 | | 822 | $ 692,992 |
| Jazz Financing Lux SARL, Term Loan, 8.43%, (SOFR + 3.00%), 5/5/28 | | 955 | 961,170 |
| Mallinckrodt International Finance SA: | | | |
| Term Loan, 12.819%, (SOFR + 7.50%), 11/14/28 | | 69 | 77,411 |
| Term Loan - Second Lien, 14.819%, (SOFR + 9.50%), 11/14/28 | | 392 | 428,579 |
| | | | $ 2,160,152 |
| Professional Services — 1.5% |
| AlixPartners LLP, Term Loan, 7.93%, (SOFR + 2.50%), 2/4/28 | | 1,098 | $ 1,102,025 |
| CoreLogic, Inc., Term Loan, 8.93%, (SOFR + 3.50%), 6/2/28 | | 569 | 550,810 |
| Employbridge Holding Co., Term Loan, 10.314%, (SOFR + 4.75%), 7/19/28 | | 794 | 646,032 |
| First Advantage Holdings LLC, Term Loan, 8.18%, (SOFR + 2.75%), 1/31/27 | | 1,237 | 1,238,544 |
| Fleet Midco I Ltd., Term Loan, 8.566%, (SOFR + 3.25%), 2/21/31 | | 250 | 251,250 |
| Genuine Financial Holdings LLC, Term Loan, 9.316%, (SOFR + 4.00%), 9/27/30 | | 498 | 496,801 |
| Neptune Bidco U.S., Inc., Term Loan, 10.406%, (SOFR + 5.00%), 4/11/29 | | 792 | 745,883 |
| Rockwood Service Corp., Term Loan, 9.68%, (SOFR + 4.25%), 1/23/27 | | 709 | 714,348 |
| Teneo Holdings LLC, Term Loan, 10.066%, (SOFR + 4.75%), 3/13/31 | | 375 | 378,359 |
| Trans Union LLC, Term Loan, 7.316%, (SOFR + 2.00%), 12/1/28 | | 1,108 | 1,110,517 |
| Wood Mackenzie Ltd., Term Loan, 8.814%, (SOFR + 3.50%), 2/7/31 | | 425 | 427,417 |
| | | | $ 7,661,986 |
| Borrower/Description | Principal
Amount*
(000's omitted) | Value |
| Real Estate Management & Development — 0.4% |
| Cushman & Wakefield U.S. Borrower LLC, Term Loan, 8.666%, (SOFR + 3.25%), 1/31/30 | | 912 | $ 913,965 |
| Greystar Real Estate Partners LLC, Term Loan, 8.576%, (SOFR + 3.25%), 8/21/30 | | 1,095 | 1,098,611 |
| | | | $ 2,012,576 |
| Road & Rail — 0.9% |
| Avis Budget Car Rental LLC, Term Loan, 8.416%, (SOFR + 3.00%), 3/16/29 | | 1,013 | $ 1,011,386 |
| First Student Bidco, Inc.: | | | |
| Term Loan, 8.564%, (SOFR + 3.00%), 7/21/28 | | 109 | 109,693 |
| Term Loan, 8.564%, (SOFR + 3.00%), 7/21/28 | | 360 | 360,625 |
| Hertz Corp.: | | | |
| Term Loan, 8.68%, (SOFR + 3.25%), 6/30/28 | | 1,208 | 1,117,260 |
| Term Loan, 8.68%, (SOFR + 3.25%), 6/30/28 | | 234 | 216,866 |
| Uber Technologies, Inc., Term Loan, 8.079%, (SOFR + 2.75%), 3/3/30 | | 1,502 | 1,513,377 |
| | | | $ 4,329,207 |
| Semiconductors & Semiconductor Equipment — 0.4% |
| Altar Bidco, Inc., Term Loan, 7.947%, (SOFR + 3.10%), 2/1/29 | | 989 | $ 989,564 |
| MKS Instruments, Inc., Term Loan, 7.823%, (SOFR + 2.50%), 8/17/29 | | 821 | 823,731 |
| | | | $ 1,813,295 |
| Software — 4.5% |
| Applied Systems, Inc., Term Loan, 8.809%, (SOFR + 3.50%), 2/24/31 | | 1,518 | $ 1,530,341 |
| Astra Acquisition Corp.: | | | |
| Term Loan, 10.821%, (SOFR + 5.25%), 10/25/28 | | 771 | 393,000 |
| Term Loan, 2/25/28(19) | | 297 | 290,696 |
| Banff Merger Sub, Inc., Term Loan, 9.566%, (SOFR + 4.25%), 12/29/28 | | 1,038 | 1,045,617 |
| Central Parent, Inc., Term Loan, 9.309%, (SOFR + 4.00%), 7/6/29 | | 1,191 | 1,197,152 |
| Cloud Software Group, Inc., Term Loan, 9.909%, (SOFR + 4.50%), 3/30/29(17) | | 1,090 | 1,091,607 |
| Delta TopCo, Inc., Term Loan, 9.121%, (SOFR + 3.75%), 12/1/27 | | 791 | 792,603 |
| Epicor Software Corp., Term Loan, 8.68%, (SOFR + 3.25%), 7/30/27 | | 1,693 | 1,701,732 |
| GoTo Group, Inc.: | | | |
| Term Loan, 10.074%, (SOFR + 4.75%), 8/31/27 | | 0 (18) | 102 |
| Term Loan, 10.173%, (SOFR + 4.75%), 4/30/28 | | 432 | 413,160 |
| Term Loan - Second Lien, 10.173%, (SOFR + 4.75%), 4/30/28 | | 362 | 276,002 |
21
See Notes to Financial Statements.
Eaton Vance
Multi-Asset Credit Fund
April 30, 2024
Portfolio of Investments (Unaudited) — continued
| Borrower/Description | Principal
Amount*
(000's omitted) | Value |
| Software (continued) |
| Magenta Buyer LLC, Term Loan, 10.591%, (SOFR + 5.00%), 7/27/28 | | 1,118 | $ 568,284 |
| Marcel LUX IV SARL: | | | |
| Term Loan, 9.81%, (SOFR + 4.50%), 11/11/30 | | 424 | 426,322 |
| Term Loan, 11/11/30(19) | | 300 | 300,750 |
| McAfee LLC, Term Loan, 9.177%, (SOFR + 3.75%), 3/1/29 | | 983 | 985,921 |
| Open Text Corp., Term Loan, 8.166%, (SOFR + 2.75%), 1/31/30 | | 803 | 806,432 |
| Polaris Newco LLC, Term Loan, 9.591%, (SOFR + 4.00%), 6/2/28 | | 719 | 714,901 |
| Proofpoint, Inc., Term Loan, 8.68%, (SOFR + 3.25%), 8/31/28 | | 1,127 | 1,132,732 |
| Quest Software U.S. Holdings, Inc., Term Loan, 9.73%, (SOFR + 4.25%), 2/1/29 | | 496 | 351,070 |
| RealPage, Inc., Term Loan, 8.43%, (SOFR + 3.00%), 4/24/28 | | 961 | 928,176 |
| Redstone Holdco 2 LP, Term Loan, 10.18%, (SOFR + 4.75%), 4/27/28 | | 610 | 480,597 |
| Riverbed Technology, Inc., Term Loan, 9.809%, (SOFR + 4.50%), 7.809% cash, 2.00% PIK, 7/1/28 | | 111 | 68,403 |
| Sabre GLBL, Inc., Term Loan, 9.666%, (SOFR + 4.25%), 6/30/28 | | 575 | 506,359 |
| Skillsoft Corp., Term Loan, 10.68%, (SOFR + 5.25%), 7/14/28 | | 745 | 600,056 |
| Sophia LP, Term Loan, 8.916%, (SOFR + 3.50%), 10/9/29 | | 1,454 | 1,460,419 |
| SS&C Technologies, Inc.: | | | |
| Term Loan, 7.666%, (SOFR + 2.25%), 3/22/29 | | 349 | 349,463 |
| Term Loan, 7.666%, (SOFR + 2.25%), 3/22/29 | | 824 | 825,964 |
| UKG, Inc., Term Loan, 8.814%, (SOFR + 3.50%), 2/10/31 | | 1,651 | 1,660,494 |
| Veritas U.S., Inc., Term Loan, 10.43%, (SOFR + 5.00%), 9/1/25 | | 948 | 873,742 |
| Vision Solutions, Inc., Term Loan, 11.75%, (USD Prime + 3.25%), 4/24/28 | | 1,214 | 1,212,001 |
| | | | $ 22,984,098 |
| Specialty Retail — 1.3% |
| Great Outdoors Group LLC, Term Loan, 9.18%, (SOFR + 3.75%), 3/6/28 | | 1,213 | $ 1,214,456 |
| Harbor Freight Tools USA, Inc., Term Loan, 8.18%, (SOFR + 2.75%), 10/19/27 | | 746 | 747,630 |
| Hoya Midco LLC, Term Loan, 8.58%, (SOFR + 3.25%), 2/3/29 | | 620 | 621,587 |
| Les Schwab Tire Centers, Term Loan, 8.317%, (SOFR + 3.00%), 4/23/31 | | 1,196 | 1,197,931 |
| Borrower/Description | Principal
Amount*
(000's omitted) | Value |
| Specialty Retail (continued) |
| Mattress Firm, Inc., Term Loan, 9.814%, (SOFR + 4.25%), 9/25/28 | | 746 | $ 748,827 |
| Mavis Tire Express Services Corp., Term Loan, 9.066%, (SOFR + 3.75%), 5/4/28 | | 398 | 399,524 |
| PetSmart, Inc., Term Loan, 9.166%, (SOFR + 3.75%), 2/11/28 | | 1,849 | 1,823,962 |
| | | | $ 6,753,917 |
| Trading Companies & Distributors — 1.2% |
| Core & Main LP, Term Loan, 7.918%, (SOFR + 2.50%), 7/27/28(17) | | 1,014 | $ 1,020,503 |
| Park River Holdings, Inc., Term Loan, 8.814%, (SOFR + 3.25%), 12/28/27 | | 495 | 489,567 |
| Spin Holdco, Inc., Term Loan, 9.585%, (SOFR + 4.00%), 3/4/28 | | 1,536 | 1,363,448 |
| SRS Distribution, Inc., Term Loan, 8.93%, (SOFR + 3.50%), 6/2/28 | | 1,232 | 1,242,583 |
| White Cap Buyer LLC, Term Loan, 9.066%, (SOFR + 3.75%), 10/19/27 | | 1,237 | 1,242,198 |
| Windsor Holdings III LLC, Term Loan, 9.319%, (SOFR + 4.00%), 8/1/30 | | 722 | 728,644 |
| | | | $ 6,086,943 |
| Wireless Telecommunication Services — 0.2% |
| CCI Buyer, Inc., Term Loan, 9.302%, (SOFR + 4.00%), 12/17/27 | | 793 | $ 793,058 |
| | | | $ 793,058 |
Total Senior Floating-Rate Loans
(identified cost $192,327,298) | | | $191,042,400 |
| Security | Principal
Amount | Value |
| Entertainment — 0.0% |
| National CineMedia, Inc., Escrow Certificates(7)(21) | $ | 333,000 | $ 0 |
| | | | $ 0 |
| Pharmaceuticals — 0.0% |
| Endo Design LLC, Escrow Certificates(7)(21) | $ | 400,000 | $ 0 |
| Endo Luxembourg Finance SARL, Escrow Certificates(7)(21) | | 459,000 | 0 |
| | | | $ 0 |
22
See Notes to Financial Statements.
Eaton Vance
Multi-Asset Credit Fund
April 30, 2024
Portfolio of Investments (Unaudited) — continued
| Security | Principal
Amount | Value |
| Surface Transport — 0.0%(6) |
| Hertz Corp., Escrow Certificates(1)(7) | $ | 105,000 | $ 10,500 |
| | | | $ 10,500 |
Total Miscellaneous
(identified cost $20,321) | | | $ 10,500 |
| Short-Term Investments — 5.2% |
| Security | Shares | Value |
| Morgan Stanley Institutional Liquidity Funds - Government Portfolio, Institutional Class, 5.22%(22) | | 26,817,955 | $ 26,817,955 |
Total Short-Term Investments
(identified cost $26,817,955) | | | $ 26,817,955 |
Total Investments — 100.2%
(identified cost $517,243,116) | | | $510,690,352 |
| Less Unfunded Loan Commitments — (0.1)% | | | $ (263,795) |
Net Investments — 100.1%
(identified cost $516,979,321) | | | $510,426,557 |
| Other Assets, Less Liabilities — (0.1)% | | | $ (921,191) |
| Net Assets — 100.0% | | | $509,505,366 |
| The percentage shown for each investment category in the Portfolio of Investments is based on net assets. |
| * | In U.S. dollars unless otherwise indicated. |
| (1) | Security exempt from registration under Rule 144A of the Securities Act of 1933, as amended. These securities may be sold in certain transactions in reliance on an exemption from registration (normally to qualified institutional buyers). At April 30, 2024, the aggregate value of these securities is $202,229,591 or 39.7% of the Fund's net assets. |
| (2) | Variable rate security. The stated interest rate represents the rate in effect at April 30, 2024. |
| (3) | When-issued, variable rate security whose interest rate will be determined after April 30, 2024 |
| (4) | Weighted average fixed-rate coupon that changes/updates monthly. Rate shown is the rate at April 30, 2024. |
| (5) | Represents an investment in an issuer that may be deemed to be an affiliate (see Note 11). |
| (6) | Amount is less than 0.05%. |
| (7) | Non-income producing security. |
| (8) | Restricted security (see Note 8). |
| (9) | Security was acquired in connection with a restructuring of a Senior Loan and may be subject to restrictions on resale. |
| (10) | Security exempt from registration under Regulation S of the Securities Act of 1933, as amended, which exempts from registration securities offered and sold outside the United States. Security may not be offered or sold in the United States except pursuant to an exemption from, or in a transaction not subject to, the registration requirements of the Securities Act of 1933, as amended. At April 30, 2024, the aggregate value of these securities is $69,230,050 or 13.6% of the Fund's net assets. |
| (11) | Security converts to variable rate after the indicated fixed-rate coupon period. |
| (12) | Represents a payment-in-kind security which may pay interest in additional principal at the issuer’s discretion. |
| (13) | Perpetual security with no stated maturity date but may be subject to calls by the issuer. |
| (14) | When-issued security. |
| (15) | Issuer is in default with respect to interest and/or principal payments. |
| (16) | Senior floating-rate loans (Senior Loans) often require prepayments from excess cash flows or permit the borrowers to repay at their election. The degree to which borrowers repay, whether as a contractual requirement or at their election, cannot be predicted with accuracy. As a result, the actual remaining maturity may be substantially less than the stated maturities shown. However, Senior Loans will typically have an expected average life of approximately two to four years. Senior Loans typically have rates of interest which are redetermined periodically by reference to a base lending rate, plus a spread. These base lending rates are primarily the Secured Overnight Financing Rate (“SOFR”) and secondarily, the prime rate offered by one or more major United States banks (the “Prime Rate”). Base lending rates may be subject to a floor, or minimum rate. Rates for SOFR are generally 1 or 3-month tenors and may also be subject to a credit spread adjustment. Senior Loans are generally subject to contractual restrictions that must be satisfied before they can be bought or sold. |
| (17) | The stated interest rate represents the weighted average interest rate at April 30, 2024 of contracts within the senior loan facility. Interest rates on contracts are primarily redetermined either monthly or quarterly by reference to the indicated base lending rate and spread and the reset period. |
| (18) | Principal amount is less than $500. |
| (19) | This Senior Loan will settle after April 30, 2024, at which time the interest rate will be determined. |
| (20) | Unfunded or partially unfunded loan commitments. The stated interest rate reflects the weighted average of the reference rate and spread for the funded portion, if any, and the commitment fees on the portion of the loan that is unfunded. At April 30, 2024, the total value of unfunded loan commitments is $299,702. See Note 1G for description. |
| (21) | For fair value measurement disclosure purposes, security is categorized as Level 3 (see Note 12). |
| (22) | May be deemed to be an affiliated investment company. The rate shown is the annualized seven-day yield as of April 30, 2024. |
23
See Notes to Financial Statements.
Eaton Vance
Multi-Asset Credit Fund
April 30, 2024
Portfolio of Investments (Unaudited) — continued
| Forward Foreign Currency Exchange Contracts (OTC) |
| Currency Purchased | Currency Sold | Counterparty | Settlement
Date | Unrealized
Appreciation | Unrealized
(Depreciation) |
| USD | 125,001 | GBP | 100,069 | Bank of America, N.A. | 5/1/24 | $ — | $ (40) |
| USD | 148,218 | EUR | 138,559 | JPMorgan Chase Bank, N.A. | 5/2/24 | 347 | — |
| EUR | 924,439 | USD | 987,232 | JPMorgan Chase Bank, N.A. | 5/13/24 | — | (283) |
| USD | 537,146 | EUR | 500,000 | State Street Bank and Trust Company | 6/28/24 | 2,293 | — |
| USD | 827 | EUR | 761 | State Street Bank and Trust Company | 6/28/24 | 12 | — |
| USD | 13,562,036 | EUR | 12,628,382 | Goldman Sachs International | 7/31/24 | 32,898 | — |
| USD | 24,802,456 | EUR | 23,113,000 | State Street Bank and Trust Company | 7/31/24 | 40,853 | — |
| USD | 15,501,670 | EUR | 14,445,899 | State Street Bank and Trust Company | 7/31/24 | 25,375 | — |
| USD | 454,359 | EUR | 423,445 | State Street Bank and Trust Company | 7/31/24 | 711 | — |
| USD | 83,783 | GBP | 67,051 | State Street Bank and Trust Company | 7/31/24 | — | (43) |
| USD | 14,046,999 | GBP | 11,267,896 | State Street Bank and Trust Company | 7/31/24 | — | (39,934) |
| | | | | | | $102,489 | $(40,300) |
| Abbreviations: |
| DIP | – Debtor In Possession |
| EURIBOR | – Euro Interbank Offered Rate |
| OTC | – Over-the-counter |
| PIK | – Payment In Kind |
| SOFR | – Secured Overnight Financing Rate |
| STACR | – Structured Agency Credit Risk |
| Currency Abbreviations: |
| EUR | – Euro |
| GBP | – British Pound Sterling |
| USD | – United States Dollar |
24
See Notes to Financial Statements.
Eaton Vance
Multi-Asset Credit Fund
April 30, 2024
Statement of Assets and Liabilities (Unaudited)
| | April 30, 2024 |
| Assets | |
| Unaffiliated investments, at value (identified cost $489,797,112) | $ 483,230,436 |
| Affiliated investments, at value (identified cost $27,182,209) | 27,196,121 |
| Cash | 2,161,572 |
| Deposits for derivatives collateral - forward foreign currency exchange contracts | 250,000 |
| Foreign currency, at value (identified cost $1,254,025) | 1,251,665 |
| Interest receivable | 5,160,538 |
| Interest and dividends receivable from affiliated investments | 126,129 |
| Receivable for investments sold | 2,448,290 |
| Receivable for Fund shares sold | 339,554 |
| Receivable for open forward foreign currency exchange contracts | 102,489 |
| Tax reclaims receivable | 17,906 |
| Trustees' deferred compensation plan | 56,094 |
| Total assets | $ 522,340,794 |
| Liabilities | |
| Cash collateral due to brokers | $ 250,000 |
| Payable for investments purchased | 7,506,410 |
| Payable for when-issued/delayed delivery/forward commitment securities | 3,745,350 |
| Payable for Fund shares redeemed | 637,606 |
| Payable for open forward foreign currency exchange contracts | 40,300 |
| Distributions payable | 109,107 |
| Payable to affiliates: | |
| Investment adviser and administration fee | 225,909 |
| Distribution and service fees | 10,831 |
| Trustees' fees | 2,687 |
| Trustees' deferred compensation plan | 56,094 |
| Accrued expenses | 251,134 |
| Total liabilities | $ 12,835,428 |
| Net Assets | $ 509,505,366 |
| Sources of Net Assets | |
| Paid-in capital | $ 754,336,741 |
| Accumulated loss | (244,831,375) |
| Net Assets | $ 509,505,366 |
| Class A Shares | |
| Net Assets | $ 40,039,401 |
| Shares Outstanding | 4,092,080 |
Net Asset Value and Redemption Price Per Share
(net assets ÷ shares of beneficial interest outstanding) | $ 9.78 |
Maximum Offering Price Per Share
(100 ÷ 96.75 of net asset value per share) | $ 10.11 |
| Class C Shares | |
| Net Assets | $ 3,057,290 |
| Shares Outstanding | 312,217 |
Net Asset Value and Offering Price Per Share*
(net assets ÷ shares of beneficial interest outstanding) | $ 9.79 |
| Class I Shares | |
| Net Assets | $ 189,959,439 |
| Shares Outstanding | 19,363,821 |
Net Asset Value, Offering Price and Redemption Price Per Share
(net assets ÷ shares of beneficial interest outstanding) | $ 9.81 |
25
See Notes to Financial Statements.
Eaton Vance
Multi-Asset Credit Fund
April 30, 2024
Statement of Assets and Liabilities (Unaudited) — continued
| | April 30, 2024 |
| Class R6 Shares | |
| Net Assets | $276,449,236 |
| Shares Outstanding | 28,191,034 |
Net Asset Value, Offering Price and Redemption Price Per Share
(net assets ÷ shares of beneficial interest outstanding) | $ 9.81 |
| On sales of $100,000 or more, the offering price of Class A shares is reduced. |
| * | Redemption price per share is equal to the net asset value less any applicable contingent deferred sales charge. |
26
See Notes to Financial Statements.
Eaton Vance
Multi-Asset Credit Fund
April 30, 2024
Statement of Operations (Unaudited)
| | Six Months Ended |
| | April 30, 2024 |
| Investment Income | |
| Dividend income (net of foreign taxes withheld of $1,702) | $ 46,278 |
| Dividend income from affiliated investments | 745,156 |
| Interest income | 18,893,649 |
| Interest income from affiliated investments | 14,640 |
| Other income | 174,973 |
| Total investment income | $19,874,696 |
| Expenses | |
| Investment adviser and administration fee | $ 1,351,696 |
| Distribution and service fees: | |
| Class A | 50,769 |
| Class C | 17,846 |
| Trustees’ fees and expenses | 16,023 |
| Custodian fee | 115,161 |
| Transfer and dividend disbursing agent fees | 59,440 |
| Legal and accounting services | 65,811 |
| Printing and postage | 12,997 |
| Registration fees | 38,131 |
| Miscellaneous | 27,588 |
| Total expenses | $ 1,755,462 |
| Deduct: | |
| Waiver and/or reimbursement of expenses by affiliates | $ 21,802 |
| Total expense reductions | $ 21,802 |
| Net expenses | $ 1,733,660 |
| Net investment income | $18,141,036 |
| Realized and Unrealized Gain (Loss) | |
| Net realized gain (loss): | |
| Investment transactions | $ (3,384,175) |
| Futures contracts | (68,539) |
| Foreign currency transactions | 131,553 |
| Forward foreign currency exchange contracts | (199,354) |
| Net realized loss | $ (3,520,515) |
| Change in unrealized appreciation (depreciation): | |
| Investments | $ 19,040,167 |
| Investments - affiliated investments | 10,560 |
| Foreign currency | 11,808 |
| Forward foreign currency exchange contracts | 12,971 |
| Net change in unrealized appreciation (depreciation) | $19,075,506 |
| Net realized and unrealized gain | $15,554,991 |
| Net increase in net assets from operations | $33,696,027 |
27
See Notes to Financial Statements.
Eaton Vance
Multi-Asset Credit Fund
April 30, 2024
Statements of Changes in Net Assets
| | Six Months Ended
April 30, 2024
(Unaudited) | Year Ended
October 31, 2023 |
| Increase (Decrease) in Net Assets | | |
| From operations: | | |
| Net investment income | $ 18,141,036 | $ 29,660,618 |
| Net realized loss | (3,520,515) | (23,163,762) |
| Net change in unrealized appreciation (depreciation) | 19,075,506 | 28,111,796 |
| Net increase in net assets from operations | $ 33,696,027 | $ 34,608,652 |
| Distributions to shareholders: | | |
| Class A | $ (1,593,009) | $ (2,908,778) |
| Class C | (127,207) | (323,146) |
| Class I | (7,569,440) | (13,472,073) |
| Class R6 | (10,555,497) | (13,600,022) |
| Total distributions to shareholders | $ (19,845,153) | $ (30,304,019) |
| Transactions in shares of beneficial interest: | | |
| Class A | $ (1,900,619) | $ (4,686,715) |
| Class C | (927,968) | (4,510,269) |
| Class I | 3,998,971 | (27,558,904) |
| Class R6 | 21,432,776 | 102,903,580 |
| Net increase in net assets from Fund share transactions | $ 22,603,160 | $ 66,147,692 |
| Net increase in net assets | $ 36,454,034 | $ 70,452,325 |
| Net Assets | | |
| At beginning of period | $ 473,051,332 | $ 402,599,007 |
| At end of period | $509,505,366 | $473,051,332 |
28
See Notes to Financial Statements.
Eaton Vance
Multi-Asset Credit Fund
April 30, 2024
| | Class A |
| | Six Months Ended
April 30, 2024
(Unaudited) | Year Ended October 31, |
| | 2023 | 2022 | 2021 | 2020 | 2019 |
| Net asset value — Beginning of period | $ 9.500 | $ 9.400 | $10.680 | $ 10.210 | $ 10.760 | $ 10.620 |
| Income (Loss) From Operations | | | | | | |
| Net investment income(1) | $ 0.347 | $ 0.636 | $ 0.468 | $ 0.394 | $ 0.423 | $ 0.496 |
| Net realized and unrealized gain (loss) | 0.314 | 0.114 | (1.287) | 0.489 | (0.500) | 0.148 |
| Total income (loss) from operations | $ 0.661 | $ 0.750 | $ (0.819) | $ 0.883 | $ (0.077) | $ 0.644 |
| Less Distributions | | | | | | |
| From net investment income | $ (0.381) | $ (0.650) | $ (0.461) | $ (0.413) | $ (0.473) | $ (0.504) |
| Total distributions | $ (0.381) | $ (0.650) | $ (0.461) | $ (0.413) | $ (0.473) | $ (0.504) |
| Net asset value — End of period | $ 9.780 | $ 9.500 | $ 9.400 | $10.680 | $10.210 | $10.760 |
| Total Return(2) | 7.01% (3) | 8.13% | (7.80)% | 8.73% | (0.66)% (4) | 6.22% (4) |
| Ratios/Supplemental Data | | | | | | |
| Net assets, end of period (000’s omitted) | $40,039 | $40,738 | $44,921 | $ 61,518 | $ 63,023 | $ 3,888 |
| Ratios (as a percentage of average daily net assets): | | | | | | |
| Expenses | 0.95% (5)(6) | 0.95% (6) | 0.97% (6) | 0.96% | 0.99% (4) | 1.00% (4) |
| Net investment income | 7.14% (5) | 6.63% | 4.66% | 3.70% | 4.13% | 4.64% |
| Portfolio Turnover | 16% (3) | 54% | 80% | 76% | 93% | 96% |
| (1) | Computed using average shares outstanding. |
| (2) | Returns are historical and are calculated by determining the percentage change in net asset value with all distributions reinvested and do not reflect the effect of sales charges. |
| (3) | Not annualized. |
| (4) | The investment adviser and administrator and sub-adviser reimbursed certain operating expenses (equal to 0.01% and 0.70% of average daily net assets for the years ended October 31, 2020 and 2019, respectively). Absent this reimbursement, total return would be lower. |
| (5) | Annualized. |
| (6) | Includes a reduction by the investment adviser of a portion of its adviser and administration fee due to the Fund’s investment in the Liquidity Fund (equal to 0.01%, 0.01% and less than 0.005% of average daily net assets for the six months ended April 30, 2024 and the years ended October 31, 2023 and 2022, respectively). |
29
See Notes to Financial Statements.
Eaton Vance
Multi-Asset Credit Fund
April 30, 2024
Financial Highlights — continued
| | Class C |
| | Six Months Ended
April 30, 2024
(Unaudited) | Year Ended October 31, |
| | 2023 | 2022 | 2021 | 2020 | 2019 |
| Net asset value — Beginning of period | $ 9.510 | $ 9.410 | $10.690 | $ 10.220 | $ 10.770 | $ 10.620 |
| Income (Loss) From Operations | | | | | | |
| Net investment income(1) | $ 0.312 | $ 0.558 | $ 0.352 | $ 0.315 | $ 0.353 | $ 0.411 |
| Net realized and unrealized gain (loss) | 0.313 | 0.121 | (1.246) | 0.489 | (0.508) | 0.154 |
| Total income (loss) from operations | $ 0.625 | $ 0.679 | $ (0.894) | $ 0.804 | $ (0.155) | $ 0.565 |
| Less Distributions | | | | | | |
| From net investment income | $ (0.345) | $ (0.579) | $ (0.386) | $ (0.334) | $ (0.395) | $ (0.415) |
| Total distributions | $(0.345) | $(0.579) | $ (0.386) | $ (0.334) | $ (0.395) | $ (0.415) |
| Net asset value — End of period | $ 9.790 | $ 9.510 | $ 9.410 | $10.690 | $10.220 | $10.770 |
| Total Return(2) | 6.62% (3) | 7.32% | (8.48)% | 7.92% | (1.40)% (4) | 5.43% (4) |
| Ratios/Supplemental Data | | | | | | |
| Net assets, end of period (000’s omitted) | $ 3,057 | $ 3,870 | $ 8,267 | $ 23,956 | $ 34,273 | $ 1,259 |
| Ratios (as a percentage of average daily net assets): | | | | | | |
| Expenses | 1.70% (5)(6) | 1.71% (6) | 1.72% (6) | 1.71% | 1.74% (4) | 1.75% (4) |
| Net investment income | 6.40% (5) | 5.82% | 3.47% | 2.95% | 3.45% | 3.85% |
| Portfolio Turnover | 16% (3) | 54% | 80% | 76% | 93% | 96% |
| (1) | Computed using average shares outstanding. |
| (2) | Returns are historical and are calculated by determining the percentage change in net asset value with all distributions reinvested and do not reflect the effect of sales charges. |
| (3) | Not annualized. |
| (4) | The investment adviser and administrator and sub-adviser reimbursed certain operating expenses (equal to 0.01% and 0.70% of average daily net assets for the years ended October 31, 2020 and 2019, respectively). Absent this reimbursement, total return would be lower. |
| (5) | Annualized. |
| (6) | Includes a reduction by the investment adviser of a portion of its adviser and administration fee due to the Fund’s investment in the Liquidity Fund (equal to 0.01%, 0.01% and less than 0.005% of average daily net assets for the six months ended April 30, 2024 and the years ended October 31, 2023 and 2022, respectively). |
30
See Notes to Financial Statements.
Eaton Vance
Multi-Asset Credit Fund
April 30, 2024
Financial Highlights — continued
| | Class I |
| | Six Months Ended
April 30, 2024
(Unaudited) | Year Ended October 31, |
| | 2023 | 2022 | 2021 | 2020 | 2019 |
| Net asset value — Beginning of period | $ 9.530 | $ 9.430 | $ 10.710 | $ 10.240 | $ 10.790 | $ 10.650 |
| Income (Loss) From Operations | | | | | | |
| Net investment income(1) | $ 0.360 | $ 0.661 | $ 0.461 | $ 0.420 | $ 0.449 | $ 0.526 |
| Net realized and unrealized gain (loss) | 0.315 | 0.115 | (1.253) | 0.491 | (0.499) | 0.146 |
| Total income (loss) from operations | $ 0.675 | $ 0.776 | $ (0.792) | $ 0.911 | $ (0.050) | $ 0.672 |
| Less Distributions | | | | | | |
| From net investment income | $ (0.395) | $ (0.676) | $ (0.488) | $ (0.441) | $ (0.500) | $ (0.532) |
| Total distributions | $ (0.395) | $ (0.676) | $ (0.488) | $ (0.441) | $ (0.500) | $ (0.532) |
| Net asset value — End of period | $ 9.810 | $ 9.530 | $ 9.430 | $ 10.710 | $ 10.240 | $10.790 |
| Total Return(2) | 7.14% (3) | 8.40% | (7.53)% | 8.99% | (0.40)% (4) | 6.48% (4) |
| Ratios/Supplemental Data | | | | | | |
| Net assets, end of period (000’s omitted) | $189,959 | $180,663 | $205,778 | $345,990 | $304,389 | $ 68,533 |
| Ratios (as a percentage of average daily net assets): | | | | | | |
| Expenses | 0.70% (5)(6) | 0.70% (6) | 0.72% (6) | 0.71% | 0.74% (4) | 0.75% (4) |
| Net investment income | 7.39% (5) | 6.88% | 4.56% | 3.93% | 4.38% | 4.90% |
| Portfolio Turnover | 16% (3) | 54% | 80% | 76% | 93% | 96% |
| (1) | Computed using average shares outstanding. |
| (2) | Returns are historical and are calculated by determining the percentage change in net asset value with all distributions reinvested. |
| (3) | Not annualized. |
| (4) | The investment adviser and administrator and sub-adviser reimbursed certain operating expenses (equal to 0.01% and 0.70% of average daily net assets for the years ended October 31, 2020 and 2019, respectively). Absent this reimbursement, total return would be lower. |
| (5) | Annualized. |
| (6) | Includes a reduction by the investment adviser of a portion of its adviser and administration fee due to the Fund’s investment in the Liquidity Fund (equal to 0.01%, 0.01% and less than 0.005% of average daily net assets for the six months ended April 30, 2024 and the years ended October 31, 2023 and 2022, respectively). |
31
See Notes to Financial Statements.
Eaton Vance
Multi-Asset Credit Fund
April 30, 2024
Financial Highlights — continued
| | | Class R6 |
| | | Six Months Ended
April 30, 2024
(Unaudited) | | Year Ended October 31, | Period Ended
October 31, 2019(1) |
| | | 2023 | 2022 | 2021 | 2020 | |
| Net asset value — Beginning of period | | $ 9.520 | | $ 9.420 | $ 10.710 | $ 10.230 | $ 10.790 | $ 10.820 |
| Income (Loss) From Operations | | | | | | | | |
| Net investment income(2) | | $ 0.362 | | $ 0.671 | $ 0.483 | $ 0.418 | $ 0.443 | $ 0.059 |
| Net realized and unrealized gain (loss) | | 0.324 | | 0.109 | (1.281) | 0.507 | (0.501) | (0.011) |
| Total income (loss) from operations | | $ 0.686 | | $ 0.780 | $ (0.798) | $ 0.925 | $ (0.058) | $ 0.048 |
| Less Distributions | | | | | | | | |
| From net investment income | | $ (0.396) | | $ (0.680) | $ (0.492) | $ (0.445) | $ (0.502) | $ (0.078) |
| Total distributions | | $ (0.396) | | $ (0.680) | $ (0.492) | $ (0.445) | $ (0.502) | $ (0.078) |
| Net asset value — End of period | | $ 9.810 | | $ 9.520 | $ 9.420 | $10.710 | $10.230 | $10.790 |
| Total Return(3) | | 7.27% (4) | | 8.44% | (7.58)% | 9.13% | (0.47)% (5) | 0.44% (4)(5) |
| Ratios/Supplemental Data | | | | | | | | |
| Net assets, end of period (000’s omitted) | | $276,449 | | $247,781 | $143,633 | $ 42,319 | $ 3,089 | $ 10 |
| Ratios (as a percentage of average daily net assets): | | | | | | | | |
| Expenses | | 0.66% (6)(7) | | 0.65% (7) | 0.66% (7) | 0.65% | 0.69% (5) | 0.75% (5)(6) |
| Net investment income | | 7.42% (6) | | 6.97% | 4.90% | 3.90% | 4.34% | 3.40% (6) |
| Portfolio Turnover | | 16% (4) | | 54% | 80% | 76% | 93% | 96% (8) |
| (1) | For the period from the commencement of operations, September 3, 2019, to October, 31, 2019. |
| (2) | Computed using average shares outstanding. |
| (3) | Returns are historical and are calculated by determining the percentage change in net asset value with all distributions reinvested. |
| (4) | Not annualized. |
| (5) | The investment adviser and administrator and sub-adviser reimbursed certain operating expenses (equal to 0.01% and 0.68% of average daily net assets for the year ended October 31, 2020 and the period ended 2019, respectively). Absent this reimbursement, total return would be lower. |
| (6) | Annualized. |
| (7) | Includes a reduction by the investment adviser of a portion of its adviser and administration fee due to the Fund’s investment in the Liquidity Fund (equal to 0.01%, 0.01% and less than 0.005% of average daily net assets for the six months ended April 30, 2024 and the years ended October 31, 2023 and 2022, respectively). |
| (8) | For the year ended October 31, 2019. |
32
See Notes to Financial Statements.
Eaton Vance
Multi-Asset Credit Fund
April 30, 2024
Notes to Financial Statements (Unaudited)
1 Significant Accounting Policies
Eaton Vance Multi-Asset Credit Fund (the Fund) is a diversified series of Eaton Vance Mutual Funds Trust (the Trust). The Trust is a Massachusetts business trust registered under the Investment Company Act of 1940, as amended (the 1940 Act), as an open-end management investment company. The Fund’s investment objective is to seek total return. The Fund offers four classes of shares. Class A shares are generally sold subject to a sales charge imposed at time of purchase. Class C shares are sold at net asset value and are generally subject to a contingent deferred sales charge (see Note 6). Effective November 5, 2020, Class C shares automatically convert to Class A shares eight years after their purchase as described in the Fund’s prospectus. Class I and Class R6 shares are sold at net asset value and are not subject to a sales charge. Each class represents a pro rata interest in the Fund, but votes separately on class-specific matters and (as noted below) is subject to different expenses. Realized and unrealized gains and losses are allocated daily to each class of shares based on the relative net assets of each class to the total net assets of the Fund. Net investment income, other than class-specific expenses, is allocated daily to each class of shares based upon the ratio of the value of each class’s paid shares to the total value of all paid shares. Sub-accounting, recordkeeping and similar administrative fees payable to financial intermediaries, which are a component of transfer and dividend disbursing agent fees on the Statement of Operations, are not allocated to Class R6 shares. Each class of shares differs in its distribution plan and certain other class-specific expenses.
The following is a summary of significant accounting policies of the Fund. The policies are in conformity with accounting principles generally accepted in the United States of America (U.S. GAAP). The Fund is an investment company and follows accounting and reporting guidance in the Financial Accounting Standards Board (FASB) Accounting Standards Codification Topic 946.
A Investment Valuation—The following methodologies are used to determine the market value or fair value of investments.
Debt Obligations. Debt obligations are generally valued on the basis of valuations provided by third party pricing services, as derived from such services’ pricing models. Inputs to the models may include, but are not limited to, reported trades, executable bid and ask prices, broker/dealer quotations, prices or yields of securities with similar characteristics, interest rates, anticipated prepayments, benchmark curves or information pertaining to the issuer, as well as industry and economic events. The pricing services may use a matrix approach, which considers information regarding securities with similar characteristics to determine the valuation for a security. Short-term debt obligations purchased with a remaining maturity of sixty days or less for which a valuation from a third party pricing service is not readily available may be valued at amortized cost, which approximates fair value.
Senior Floating-Rate Loans. Interests in senior floating-rate loans (Senior Loans) are valued generally at the average mean of bid and ask quotations obtained from a third party pricing service. Senior Loans, for which a valuation is not available or deemed unreliable, are fair valued by the investment adviser utilizing one or more of the valuation techniques described below to assess the likelihood that the borrower will make a full repayment of the loan underlying such Senior Loan. If the investment adviser believes that there is a reasonable likelihood of full repayment, the investment adviser will determine fair value using a matrix pricing approach that considers the yield on the Senior Loan relative to yields on other Senior Loans issued by companies of comparable credit quality. If the investment adviser believes there is not a reasonable likelihood of full repayment, the investment adviser will determine fair value using analyses that include, but are not limited to: (i) a comparison of the value of the borrower’s outstanding equity and debt to that of comparable public companies; (ii) a discounted cash flow analysis; or (iii) when the investment adviser believes it is likely that a borrower will be liquidated or sold, an analysis of the terms of such liquidation or sale. In certain cases, the investment adviser will use a combination of analytical methods to determine fair value, such as when only a portion of a borrower’s assets are likely to be sold. In conducting its assessment and analyses for purposes of determining fair value of a Senior Loan, the investment adviser will use its discretion and judgment in considering and appraising relevant factors. Junior Loans (i.e., subordinated loans and second lien loans) are valued in the same manner as Senior Loans.
Equity Securities. Equity securities listed on a U.S. securities exchange generally are valued at the last sale or closing price on the day of valuation or, if no sales took place on such date, at the mean between the closing bid and ask prices on the exchange where such securities are principally traded. Equity securities listed on the NASDAQ National Market System are valued at the NASDAQ official closing price. Unlisted or listed securities for which closing sales prices or closing quotations are not available are valued at the mean between the latest available bid and ask prices or, in the case of preferred equity securities that are not listed or traded in the over-the-counter market, by a third party pricing service that uses various techniques that consider factors including, but not limited to, prices or yields of securities with similar characteristics, benchmark yields, broker/dealer quotes, quotes of underlying common stock, issuer spreads, as well as industry and economic events.
Derivatives. Forward foreign currency exchange contracts are generally valued at the mean of the average bid and average ask prices that are reported by currency dealers to a third party pricing service at the valuation time. Such third party pricing service valuations are supplied for specific settlement periods and the Fund’s forward foreign currency exchange contracts are valued at an interpolated rate between the closest preceding and subsequent settlement period reported by the third party pricing service.
Foreign Securities and Currencies. Foreign securities and currencies are valued in U.S. dollars, based on foreign currency exchange rate quotations supplied by a third party pricing service. The pricing service uses a proprietary model to determine the exchange rate. Inputs to the model include reported trades and implied bid/ask spreads.
Other. Investments in management investment companies (including money market funds) that do not trade on an exchange are valued at the net asset value as of the close of each business day.
Eaton Vance
Multi-Asset Credit Fund
April 30, 2024
Notes to Financial Statements (Unaudited) — continued
Fair Valuation. In connection with Rule 2a-5 of the 1940 Act, the Trustees have designated the Fund’s investment adviser as its valuation designee. Investments for which valuations or market quotations are not readily available or are deemed unreliable are valued by the investment adviser, as valuation designee, at fair value using methods that most fairly reflect the security’s “fair value”, which is the amount that the Fund might reasonably expect to receive for the security upon its current sale in the ordinary course. Each such determination is based on a consideration of relevant factors, which are likely to vary from one pricing context to another. These factors may include, but are not limited to, the type of security, the existence of any contractual restrictions on the security’s disposition, the price and extent of public trading in similar securities of the issuer or of comparable companies or entities, quotations or relevant information obtained from broker/dealers or other market participants, information obtained from the issuer, analysts, and/or the appropriate stock exchange (for exchange-traded securities), an analysis of the company’s or entity’s financial statements, and an evaluation of the forces that influence the issuer and the market(s) in which the security is purchased and sold.
B Investment Transactions—Investment transactions for financial statement purposes are accounted for on a trade date basis. Realized gains and losses on investments sold are determined on the basis of identified cost.
C Income—Interest income is recorded on the basis of interest accrued, adjusted for amortization of premium or accretion of discount. Fees associated with loan amendments are recognized immediately. Dividend income is recorded on the ex-dividend date for dividends received in cash and/or securities. Withholding taxes on foreign dividends have been provided for in accordance with the Fund’s understanding of the applicable countries’ tax rules and rates. Distributions from investment companies are recorded as dividend income, capital gains or return of capital based on the nature of the distribution.
D Federal Taxes—The Fund's policy is to comply with the provisions of the Internal Revenue Code applicable to regulated investment companies and to distribute to shareholders each year substantially all of its net investment income, and all or substantially all of its net realized capital gains. Accordingly, no provision for federal income or excise tax is necessary.
As of April 30, 2024, the Fund had no uncertain tax positions that would require financial statement recognition, de-recognition, or disclosure. The Fund files a U.S. federal income tax return annually after its fiscal year-end, which is subject to examination by the Internal Revenue Service for a period of three years from the date of filing.
E Expenses—The majority of expenses of the Trust are directly identifiable to an individual fund. Expenses which are not readily identifiable to a specific fund are allocated taking into consideration, among other things, the nature and type of expense and the relative size of the funds.
F Foreign Currency Translation—Investment valuations, other assets, and liabilities initially expressed in foreign currencies are translated each business day into U.S. dollars based upon current exchange rates. Purchases and sales of foreign investment securities and income and expenses denominated in foreign currencies are translated into U.S. dollars based upon currency exchange rates in effect on the respective dates of such transactions. Recognized gains or losses on investment transactions attributable to changes in foreign currency exchange rates are recorded for financial statement purposes as net realized gains and losses on investments. That portion of unrealized gains and losses on investments that results from fluctuations in foreign currency exchange rates is not separately disclosed.
G Unfunded Loan Commitments—The Fund may enter into certain loan agreements all or a portion of which may be unfunded. The Fund is obligated to fund these commitments at the borrower's discretion. These commitments, if any, are disclosed in the accompanying Portfolio of Investments.
H Use of Estimates—The preparation of the financial statements in conformity with U.S. GAAP requires management to make estimates and assumptions that affect the reported amounts of assets and liabilities at the date of the financial statements and the reported amounts of income and expense during the reporting period. Actual results could differ from those estimates.
I Indemnifications—Under the Trust’s organizational documents, its officers and Trustees may be indemnified against certain liabilities and expenses arising out of the performance of their duties to the Fund. Under Massachusetts law, if certain conditions prevail, shareholders of a Massachusetts business trust (such as the Trust) could be deemed to have personal liability for the obligations of the Trust. However, the Trust’s Declaration of Trust contains an express disclaimer of liability on the part of Fund shareholders and the By-laws provide that the Trust shall assume, upon request by the shareholder, the defense on behalf of any Fund shareholders. Moreover, the By-laws also provide for indemnification out of Fund property of any shareholder held personally liable solely by reason of being or having been a shareholder for all loss or expense arising from such liability. Additionally, in the normal course of business, the Fund enters into agreements with service providers that may contain indemnification clauses. The Fund’s maximum exposure under these arrangements is unknown as this would involve future claims that may be made against the Fund that have not yet occurred.
J Forward Foreign Currency Exchange Contracts—The Fund may enter into forward foreign currency exchange contracts for the purchase or sale of a specific foreign currency at a fixed price on a future date. The forward foreign currency exchange contracts are adjusted by the daily exchange rate of the underlying currency and any gains or losses are recorded as unrealized until such time as the contracts have been closed. Risks may arise upon entering these contracts from the potential inability of counterparties to meet the terms of their contracts and from movements in the value of a foreign currency relative to the U.S. dollar.
K Futures Contracts—Upon entering into a futures contract, the Fund is required to deposit with the broker, either in cash or securities, an amount equal to a certain percentage of the contract amount (initial margin). Subsequent payments, known as variation margin, are made or received by the Fund each
Eaton Vance
Multi-Asset Credit Fund
April 30, 2024
Notes to Financial Statements (Unaudited) — continued
business day, depending on the daily fluctuations in the value of the underlying security, and are recorded as unrealized gains or losses by the Fund. Gains (losses) are realized upon the expiration or closing of the futures contracts. Should market conditions change unexpectedly, the Fund may not achieve the anticipated benefits of the futures contracts and may realize a loss. Futures contracts have minimal counterparty risk as they are exchange traded and the clearinghouse for the exchange is substituted as the counterparty, guaranteeing counterparty performance.
L When-Issued Securities and Delayed Delivery Transactions—The Fund may purchase securities on a delayed delivery or when-issued basis. Payment and delivery may take place after the customary settlement period for that security. At the time the transaction is negotiated, the price of the security that will be delivered is fixed. The Fund maintains cash and/or security positions for these commitments such that sufficient liquid assets will be available to make payments upon settlement. Securities purchased on a delayed delivery or when-issued basis are marked-to-market daily and begin earning interest on settlement date. Such security purchases are subject to the risk that when delivered they will be worth less than the agreed upon payment price. Losses may also arise if the counterparty does not perform under the contract.
M Interim Financial Statements—The interim financial statements relating to April 30, 2024 and for the six months then ended have not been audited by an independent registered public accounting firm, but in the opinion of the Fund’s management, reflect all adjustments, consisting only of normal recurring adjustments, necessary for the fair presentation of the financial statements.
2 Distributions to Shareholders and Income Tax Information
The Fund declares dividends daily to shareholders of record at the time of declaration. Distributions are generally paid monthly. Distributions of realized capital gains (if any) are made annually. Distributions to shareholders are recorded on the ex-dividend date. Distributions are declared separately for each class of shares. Shareholders may reinvest income and capital gain distributions in additional shares of the same class of the Fund at the net asset value as of the ex-dividend date or, at the election of the shareholder, receive distributions in cash. Distributions to shareholders are determined in accordance with income tax regulations, which may differ from U.S. GAAP. As required by U.S. GAAP, only distributions in excess of tax basis earnings and profits are reported in the financial statements as a return of capital. Permanent differences between book and tax accounting relating to distributions are reclassified to paid-in capital. For tax purposes, distributions from short-term capital gains are considered to be from ordinary income.
At October 31, 2023, the Fund, for federal income tax purposes, had deferred capital losses of $235,077,003 which would reduce its taxable income arising from future net realized gains on investment transactions, if any, to the extent permitted by the Internal Revenue Code, and thus would reduce the amount of distributions to shareholders, which would otherwise be necessary to relieve the Fund of any liability for federal income or excise tax. The deferred capital losses are treated as arising on the first day of the Fund’s next taxable year and retain the same short-term or long-term character as when originally deferred. Of the deferred capital losses at October 31, 2023, $5,196,025 are short-term and $229,880,978 are long-term.
The cost and unrealized appreciation (depreciation) of investments, including open derivative contracts, of the Fund at April 30, 2024, as determined on a federal income tax basis, were as follows:
| Aggregate cost | $ 518,171,106 |
| Gross unrealized appreciation | $ 6,228,452 |
| Gross unrealized depreciation | (13,910,812) |
| Net unrealized depreciation | $ (7,682,360) |
3 Investment Adviser and Administration Fee and Other Transactions with Affiliates
The investment adviser and administration fee is earned by Eaton Vance Management (EVM), an indirect, wholly-owned subsidiary of Morgan Stanley, as compensation for investment advisory and administrative services rendered to the Fund. The investment adviser and administration fee is computed at an annual rate as a percentage of the Fund’s average daily net assets that are not invested in other investment companies for which EVM or its affiliates serve as investment adviser and receive an advisory fee as follows and is payable monthly:
| Average Daily Net Assets | Annual Fee Rate |
| Up to $1 billion | 0.550% |
| $1 billion but less than $2.5 billion | 0.530% |
| $2.5 billion but less than $5 billion | 0.510% |
| $5 billion and over | 0.500% |
Eaton Vance
Multi-Asset Credit Fund
April 30, 2024
Notes to Financial Statements (Unaudited) — continued
For the six months ended April 30, 2024, the investment adviser and administration fee amounted to $1,351,696 or 0.55% (annualized) of the Fund’s average daily net assets. Pursuant to an investment sub-advisory agreement, EVM has delegated a portion of the investment management of the Fund to Eaton Vance Advisers International Ltd. (EVAIL), an affiliate of EVM. EVM pays EVAIL a portion of its investment adviser and administration fee for sub-advisory services provided to the Fund.
The Fund may invest in a money market fund, the Institutional Class of the Morgan Stanley Institutional Liquidity Funds - Government Portfolio (the "Liquidity Fund"), an open-end management investment company managed by Morgan Stanley Investment Management Inc., a wholly-owned subsidiary of Morgan Stanley. The investment adviser and administration fee paid by the Fund is reduced by an amount equal to its pro rata share of the advisory and administration fees paid by the Fund due to its investment in the Liquidity Fund. For the six months ended April 30, 2024, the investment adviser and administration fee paid was reduced by $21,802 relating to the Fund's investment in the Liquidity Fund.
EVM provides sub-transfer agency and related services to the Fund pursuant to a Sub-Transfer Agency Support Services Agreement. For the six months ended April 30, 2024, EVM earned $3,183 from the Fund pursuant to such agreement, which is included in transfer and dividend disbursing agent fees on the Statement of Operations. The Fund was informed that Eaton Vance Distributors, Inc. (EVD), an affiliate of EVM and the Fund’s principal underwriter, received $593 as its portion of the sales charge on sales of Class A shares for the six months ended April 30, 2024. EVD also received distribution and service fees from Class A and Class C shares (see Note 5) and contingent deferred sales charges (see Note 6).
Trustees and officers of the Fund who are members of EVM’s organization receive remuneration for their services to the Fund out of the investment adviser and administration fee. Trustees of the Fund who are not affiliated with EVM may elect to defer receipt of all or a percentage of their annual fees in accordance with the terms of the Trustees Deferred Compensation Plan. Certain officers and Trustees of the Fund are officers of EVM.
4 Purchases and Sales of Investments
Purchases and sales of investments, other than short-term obligations and including maturities, paydowns and principal repayments on Senior Loans, for the six months ended April 30, 2024 were as follows:
| | Purchases | Sales |
| Investments (non-U.S. Government) | $ 105,775,275 | $ 74,364,856 |
| U.S. Government and Agency Securities | 2,330,956 | — |
| | $108,106,231 | $74,364,856 |
5 Distribution Plans
The Fund has in effect a distribution plan for Class A shares (Class A Plan) pursuant to Rule 12b-1 under the 1940 Act. Pursuant to the Class A Plan, the Fund pays EVD a distribution and service fee of 0.25% per annum of its average daily net assets attributable to Class A shares for distribution services and facilities provided to the Fund by EVD, as well as for personal services and/or the maintenance of shareholder accounts. Distribution and service fees paid or accrued to EVD for the six months ended April 30, 2024 amounted to $50,769 for Class A shares.
The Fund also has in effect a distribution plan for Class C shares (Class C Plan) pursuant to Rule 12b-1 under the 1940 Act. Pursuant to the Class C Plan, the Fund pays EVD amounts equal to 0.75% per annum of its average daily net assets attributable to Class C shares for providing ongoing distribution services and facilities to the Fund. For the six months ended April 30, 2024, the Fund paid or accrued to EVD $13,385 for Class C shares.
Pursuant to the Class C Plan, the Fund also makes payments of service fees to EVD, financial intermediaries and other persons in amounts equal to 0.25% per annum of its average daily net assets attributable to that class. Service fees paid or accrued are for personal services and/or the maintenance of shareholder accounts. They are separate and distinct from the sales commissions and distribution fees payable to EVD. Service fees paid or accrued for the six months ended April 30, 2024 amounted to $4,461 for Class C shares.
Distribution and service fees are subject to the limitations contained in the Financial Industry Regulatory Authority Rule 2341(d).
6 Contingent Deferred Sales Charges
A contingent deferred sales charge (CDSC) of 1% generally is imposed on redemptions of Class C shares made within 12 months of purchase. Class A shares may be subject to a 0.75% CDSC if redeemed within 12 months of purchase (depending on the circumstances of purchase). Generally, the CDSC is based upon the lower of the net asset value at date of redemption or date of purchase. No charge is levied on shares acquired by reinvestment of dividends or capital gain distributions. For the six months ended April 30, 2024, the Fund was informed that EVD received no CDSCs paid by Class A and Class C shareholders.
Eaton Vance
Multi-Asset Credit Fund
April 30, 2024
Notes to Financial Statements (Unaudited) — continued
7 Shares of Beneficial Interest
The Fund’s Declaration of Trust permits the Trustees to issue an unlimited number of full and fractional shares of beneficial interest (without par value). Such shares may be issued in a number of different series (such as the Fund) and classes. Transactions in Fund shares, including direct exchanges pursuant to share class conversions, were as follows:
| | Six Months Ended
April 30, 2024
(Unaudited) | | Year Ended
October 31, 2023 |
| | Shares | Amount | | Shares | Amount |
| Class A | | | | | |
| Sales | 113,682 | $ 1,114,924 | | 491,044 | $ 4,697,337 |
| Issued to shareholders electing to receive payments of distributions in Fund shares | 140,781 | 1,380,781 | | 263,567 | 2,529,515 |
| Redemptions | (449,353) | (4,396,324) | | (1,244,833) | (11,913,567) |
| Net decrease | (194,890) | $ (1,900,619) | | (490,222) | $ (4,686,715) |
| Class C | | | | | |
| Sales | 15,044 | $ 148,019 | | 19,519 | $ 187,835 |
| Issued to shareholders electing to receive payments of distributions in Fund shares | 12,737 | 124,996 | | 32,545 | 312,531 |
| Redemptions | (122,493) | (1,200,983) | | (523,577) | (5,010,635) |
| Net decrease | (94,712) | $ (927,968) | | (471,513) | $ (4,510,269) |
| Class I | | | | | |
| Sales | 1,616,072 | $ 15,876,550 | | 2,693,183 | $ 25,833,259 |
| Issued to shareholders electing to receive payments of distributions in Fund shares | 748,319 | 7,358,476 | | 1,367,503 | 13,159,874 |
| Redemptions | (1,962,942) | (19,236,055) | | (6,925,581) | (66,552,037) |
| Net increase (decrease) | 401,449 | $ 3,998,971 | | (2,864,895) | $ (27,558,904) |
| Class R6 | | | | | |
| Sales | 1,642,981 | $ 16,196,446 | | 10,881,327 | $ 103,837,241 |
| Issued to shareholders electing to receive payments of distributions in Fund shares | 1,048,477 | 10,309,734 | | 1,393,936 | 13,411,166 |
| Redemptions | (517,939) | (5,073,404) | | (1,497,869) | (14,344,827) |
| Net increase | 2,173,519 | $ 21,432,776 | | 10,777,394 | $102,903,580 |
At April 30, 2024, donor advised and pooled income funds (established and maintained by a public charity) managed by EVM owned in the aggregate 22.6% of the value of the outstanding shares of the Fund.
Eaton Vance
Multi-Asset Credit Fund
April 30, 2024
Notes to Financial Statements (Unaudited) — continued
8 Restricted Securities
At April 30, 2024, the Fund owned the following security (representing less than 0.05% of net assets) which was restricted as to public resale and not registered under the Securities Act of 1933 (excluding Rule 144A securities). The value of restricted securities is determined based on valuations provided by brokers when available, or if not available, they are valued at fair value using methods determined in good faith by or at the direction of the Trustees.
| Description | Date(s) of
Acquisition | Shares | Cost | Value |
| Common Stocks | | | | |
| Endo, Inc. | 4/23/24 | 126 | $ 1,609 | $ 3,607 |
| Total Restricted Securities | | | $1,609 | $3,607 |
9 Financial Instruments
The Fund may trade in financial instruments with off-balance sheet risk in the normal course of its investing activities. These financial instruments may include forward foreign currency exchange contracts and futures contracts and may involve, to a varying degree, elements of risk in excess of the amounts recognized for financial statement purposes. The notional or contractual amounts of these instruments represent the investment the Fund has in particular classes of financial instruments and do not necessarily represent the amounts potentially subject to risk. The measurement of the risks associated with these instruments is meaningful only when all related and offsetting transactions are considered. A summary of obligations under these financial instruments at April 30, 2024 is included in the Portfolio of Investments. At April 30, 2024, the Fund had sufficient cash and/or securities to cover commitments under these contracts.
In the normal course of pursuing its investment objective, the Fund is subject to the following risks:
Foreign Exchange Risk: Because the Fund holds foreign currency denominated investments, the value of these investments and related receivables and payables may change due to future changes in foreign currency exchange rates. To hedge against this risk, the Fund enters into forward foreign currency exchange contracts.
Interest Rate Risk: During the six months ended April 30, 2024, the Fund entered into U.S. Treasury futures contracts to change the effective duration of its portfolio.
The Fund enters into forward foreign currency exchange contracts that may contain provisions whereby the counterparty may terminate the contract under certain conditions, including but not limited to a decline in the Fund's net assets below a certain level over a certain period of time, which would trigger a payment by the Fund for those derivatives in a liability position. At April 30, 2024, the fair value of derivatives with credit-related contingent features in a net liability position was $40,300. At April 30, 2024 there were no assets pledged by the Fund for such liability.
The over-the-counter (OTC) derivatives in which the Fund invests are subject to the risk that the counterparty to the contract fails to perform its obligations under the contract. To mitigate this risk, the Fund has entered into an International Swaps and Derivatives Association, Inc. Master Agreement (“ISDA Master Agreement”) or similar agreement with substantially all its derivative counterparties. An ISDA Master Agreement is a bilateral agreement between the Fund and a counterparty that governs certain OTC derivatives and typically contains, among other things, set-off provisions in the event of a default and/or termination event as defined under the relevant ISDA Master Agreement. Under an ISDA Master Agreement, the Fund may, under certain circumstances, offset with the counterparty certain derivative financial instruments’ payables and/or receivables with collateral held and/or posted and create one single net payment. The provisions of the ISDA Master Agreement typically permit a single net payment in the event of default including the bankruptcy or insolvency of the counterparty. However, bankruptcy or insolvency laws of a particular jurisdiction may impose restrictions on or prohibitions against the right of offset in bankruptcy or insolvency. Certain ISDA Master Agreements allow counterparties to OTC derivatives to terminate derivative contracts prior to maturity in the event the Fund’s net assets decline by a stated percentage or the Fund fails to meet the terms of its ISDA Master Agreements, which would cause the counterparty to accelerate payment by the Fund of any net liability owed to it.
The collateral requirements for derivatives traded under an ISDA Master Agreement are governed by a Credit Support Annex to the ISDA Master Agreement. Collateral requirements are determined at the close of business each day and are typically based on changes in market values for each transaction under an ISDA Master Agreement and netted into one amount for such agreement. Generally, the amount of collateral due from or to a counterparty is subject to a minimum transfer threshold amount before a transfer is required, which may vary by counterparty. Collateral pledged for the benefit of the Fund and/or counterparty is held in segregated accounts by the Fund’s custodian and cannot be sold, re-pledged, assigned or otherwise used while pledged. The portion of such collateral representing cash, if any, is reflected as deposits for derivatives collateral and, in the case of cash pledged by a counterparty for the benefit of the Fund, a corresponding liability on the Statement of Assets and Liabilities. Securities pledged by the Fund as collateral, if any, are identified as such in the Portfolio of Investments. The carrying amount of the liability for cash collateral due to brokers at April 30, 2024 approximated its fair value. If measured at fair value, such liability would have been considered as Level 2 in the fair value hierarchy (see Note 12) at April 30, 2024.
Eaton Vance
Multi-Asset Credit Fund
April 30, 2024
Notes to Financial Statements (Unaudited) — continued
The fair value of open derivative instruments (not considered to be hedging instruments for accounting disclosure purposes) and whose primary underlying risk exposure is foreign exchange risk at April 30, 2024 was as follows:
| | Fair Value |
| Derivative | Asset Derivative | Liability Derivative |
| Forward foreign currency exchange contracts | $102,489 (1) | $(40,300) (2) |
| (1) | Statement of Assets and Liabilities location: Receivable for open forward foreign currency exchange contracts. |
| (2) | Statement of Assets and Liabilities location: Payable for open forward foreign currency exchange contracts. |
The Fund’s derivative assets and liabilities at fair value by type, which are reported gross in the Statement of Assets and Liabilities, are presented in the table above. The following tables present the Fund’s derivative assets and liabilities by counterparty, net of amounts available for offset under a master netting agreement and net of the related collateral received by the Fund for such assets and pledged by the Fund for such liabilities as of April 30, 2024.
| Counterparty | Derivative
Assets Subject to
Master Netting
Agreement | Derivatives
Available
for Offset | Non-cash
Collateral
Received(a) | Cash
Collateral
Received(a) | Net Amount
of Derivative
Assets(b) |
| Goldman Sachs International | $ 32,898 | $ — | $ — | $ — | $ 32,898 |
| JPMorgan Chase Bank, N.A. | 347 | (283) | — | — | 64 |
| State Street Bank and Trust Company | 69,244 | (39,977) | — | — | 29,267 |
| | $102,489 | $(40,260) | $ — | $ — | $62,229 |
| Counterparty | Derivative
Liabilities Subject to
Master Netting
Agreement | Derivatives
Available
for Offset | Non-cash
Collateral
Pledged(a) | Cash
Collateral
Pledged(a) | Net Amount
of Derivative
Liabilities(c) |
| Bank of America, N.A. | $ (40) | $ — | $ — | $ — | $ (40) |
| JPMorgan Chase Bank, N.A. | (283) | 283 | — | — | — |
| State Street Bank and Trust Company | (39,977) | 39,977 | — | — | — |
| | $(40,300) | $40,260 | $ — | $ — | $ (40) |
| (a) | In some instances, the total collateral received and/or pledged may be more than the amount shown due to overcollateralization. |
| (b) | Net amount represents the net amount due from the counterparty in the event of default. |
| (c) | Net amount represents the net amount payable to the counterparty in the event of default. |
Eaton Vance
Multi-Asset Credit Fund
April 30, 2024
Notes to Financial Statements (Unaudited) — continued
The effect of derivative instruments (not considered to be hedging instruments for accounting disclosure purposes) on the Statement of Operations by risk exposure for the six months ended April 30, 2024 was as follows:
| Risk | Derivative | Realized Gain (Loss)
on Derivatives Recognized
in Income(1) | Change in Unrealized
Appreciation (Depreciation) on
Derivatives Recognized in Income(2) |
| Foreign Exchange | Forward foreign currency exchange contracts | $ (199,354) | $ 12,971 |
| Interest Rate | Futures contracts | (68,539) | — |
| Total | $(267,893) | $12,971 |
| (1) | Statement of Operations location: Net realized gain (loss): Forward foreign currency exchange contracts and Futures contracts, respectively. |
| (2) | Statement of Operations location: Change in unrealized appreciation (depreciation): Forward foreign currency exchange contracts. |
The average notional cost of futures contracts and average notional amounts of other derivative contracts outstanding during the six months ended April 30, 2024, which are indicative of the volume of these derivative types, were approximately as follows:
Futures
Contracts — Short | Forward
Foreign Currency
Exchange Contracts* |
| $267,000 | $69,279,000 |
| * | The average notional amount for forward foreign currency exchange contracts is based on the absolute value of notional amounts of currency purchased and currency sold. |
10 Line of Credit
The Fund participates with other portfolios and funds managed by EVM and its affiliates in a $650 million unsecured revolving line of credit agreement with a group of banks, which is in effect through October 22, 2024. Borrowings are made by the Fund solely for temporary purposes related to redemptions and other short-term cash needs. Interest is charged to the Fund based on its borrowings at an amount above either the Secured Overnight Financing Rate (SOFR) or Federal Funds rate. In addition, a fee computed at an annual rate of 0.15% on the daily unused portion of the line of credit is allocated among the participating portfolios and funds at the end of each quarter. In connection with the renewal of the agreement in October 2023, an arrangement fee of $150,000 was incurred that was allocated to the participating portfolios and funds. Because the line of credit is not available exclusively to the Fund, it may be unable to borrow some or all of its requested amounts at any particular time. The Fund did not have any significant borrowings or allocated fees during the six months ended April 30, 2024.
Eaton Vance
Multi-Asset Credit Fund
April 30, 2024
Notes to Financial Statements (Unaudited) — continued
11 Affiliated Investments
At April 30, 2024, the value of the Fund's investment in issuers and funds that may be deemed to be affiliated was $27,196,121, which represents 5.3% of the Fund's net assets. Transactions in such investments by the Fund for the six months ended April 30, 2024 were as follows:
| Name | Value,
beginning
of period | Purchases | Sales
proceeds | Net realized
gain (loss) | Change in
unrealized
appreciation
(depreciation) | Value, end
of period | Interest/
Dividend
income | Principal
amount/
Shares, end
of period |
| Commercial Mortgage-Backed Securities | | | | | | | | |
| Morgan Stanley Capital I Trust, Series 2019-BPR, Class A, 7.32%, (1 mo. SOFR + 1.992%), 5/15/36 | $ 366,998 | $ — | $ — | $ — | $ 10,560 | $ 378,166 | $ 14,640 | $ 378,948 |
| Short-Term Investments |
| Liquidity Fund | 45,142,813 | 88,727,444 | (107,052,302) | — | — | 26,817,955 | 745,156 | 26,817,955 |
| Total | | | | $ — | $10,560 | $27,196,121 | $759,796 | |
12 Fair Value Measurements
Under generally accepted accounting principles for fair value measurements, a three-tier hierarchy to prioritize the assumptions, referred to as inputs, is used in valuation techniques to measure fair value. The three-tier hierarchy of inputs is summarized in the three broad levels listed below.
| • | Level 1 – quoted prices in active markets for identical investments |
| • | Level 2 – other significant observable inputs (including quoted prices for similar investments, interest rates, prepayment speeds, credit risk, etc.) |
| • | Level 3 – significant unobservable inputs (including a fund's own assumptions in determining the fair value of investments) |
In cases where the inputs used to measure fair value fall in different levels of the fair value hierarchy, the level disclosed is determined based on the lowest level input that is significant to the fair value measurement in its entirety. The inputs or methodology used for valuing securities are not necessarily an indication of the risk associated with investing in those securities.
At April 30, 2024, the hierarchy of inputs used in valuing the Fund's investments and open derivative instruments, which are carried at fair value, were as follows:
| Asset Description | Level 1 | Level 2 | Level 3* | Total |
| Asset-Backed Securities | $ — | $ 26,921,811 | $ — | $ 26,921,811 |
| Collateralized Mortgage Obligations | — | 4,191,485 | — | 4,191,485 |
| Commercial Mortgage-Backed Securities | — | 8,324,063 | — | 8,324,063 |
| Common Stocks | — | 507,400 | — | 507,400 |
| Convertible Bonds | — | 3,029,693 | — | 3,029,693 |
| Corporate Bonds | — | 248,891,680 | — | 248,891,680 |
| Preferred Stocks | 953,365 | — | — | 953,365 |
| Senior Floating-Rate Loans (Less Unfunded Loan Commitments) | — | 190,778,605 | — | 190,778,605 |
| Miscellaneous | — | 10,500 | 0 | 10,500 |
| Short-Term Investments | 26,817,955 | — | — | 26,817,955 |
| Total Investments | $ 27,771,320 | $ 482,655,237 | $ 0 | $ 510,426,557 |
| Forward Foreign Currency Exchange Contracts | $ — | $ 102,489 | $ — | $ 102,489 |
| Total | $ 27,771,320 | $ 482,757,726 | $ 0 | $ 510,529,046 |
Eaton Vance
Multi-Asset Credit Fund
April 30, 2024
Notes to Financial Statements (Unaudited) — continued
| Liability Description | Level 1 | Level 2 | Level 3* | Total |
| Forward Foreign Currency Exchange Contracts | $ — | $ (40,300) | $ — | $ (40,300) |
| Total | $ — | $ (40,300) | $ — | $ (40,300) |
| * | None of the unobservable inputs for Level 3 assets, individually or collectively, had a material impact on the Fund. |
Level 3 investments at the beginning and/or end of the period in relation to net assets were not significant and accordingly, a reconciliation of Level 3 assets for the six months ended April 30, 2024 is not presented.
Eaton Vance
Multi-Asset Credit Fund
April 30, 2024
| Officers |
Kenneth A. Topping
President | Nicholas S. Di Lorenzo
Secretary |
Deidre E. Walsh
Vice President and Chief Legal Officer | Laura T. Donovan
Chief Compliance Officer |
James F. Kirchner
Treasurer | |
George J. Gorman
Chairperson | |
| Alan C. Bowser | |
| Mark R. Fetting | |
| Cynthia E. Frost | |
| Valerie A. Mosley | |
| Anchal Pachnanda* | |
| Keith Quinton | |
| Marcus L. Smith | |
| Susan J. Sutherland | |
| Scott E. Wennerholm | |
| Nancy A. Wiser | |
| U.S. Customer Privacy Notice | March 2024 |
| FACTS | WHAT DOES EATON VANCE DO WITH YOUR PERSONAL INFORMATION? |
| Why? | Financial companies choose how they share your personal information. Federal law gives consumers the right to limit some but not all sharing. Federal law also requires us to tell you how we collect, share, and protect your personal information. Please read this notice carefully to understand what we do. |
| |
| What? | The types of personal information we collect and share depend on the product or service you have with us. This information can include:■ Social Security number and income
■ investment experience and risk tolerance
■ checking account information and wire transfer instructions |
| |
| How? | All financial companies need to share customers’ personal information to run their everyday business. In the section below, we list the reasons financial companies can share their customers’ personal information; the reasons Eaton Vance chooses to share; and whether you can limit this sharing. |
| Reasons we can share your personal information | Does Eaton Vance
share? | Can you limit
this sharing? |
| For our everyday business purposes — such as to process your transactions, maintain your account(s), respond to court orders and legal investigations, or report to credit bureaus | Yes | No |
| For our marketing purposes — to offer our products and services to you | Yes | No |
| For joint marketing with other financial companies | No | We don’t share |
| For our affiliates’ everyday business purposes — information about your transactions and experiences | Yes | No* |
| For our affiliates’ everyday business purposes — information about your creditworthiness | Yes | Yes* |
| For our affiliates to market to you | Yes | Yes* |
| For nonaffiliates to market to you | No | We don’t share |
To limit our
sharing | Call toll-free 1-800-262-1122 or email: EVPrivacy@eatonvance.comPlease note:If you are a new customer, we can begin sharing your information 30 days from the date we sent this notice. When you are no longer our customer, we continue to share your information as described in this notice. However, you can contact us at any time to limit our sharing. |
| Questions? | Call toll-free 1-800-262-1122 or email: EVPrivacy@eatonvance.com |
| U.S. Customer Privacy Notice — continued | March 2024 |
| Who we are |
| Who is providing this notice? | Eaton Vance Management and our investment management affiliates (“Eaton Vance”) (see Affiliates definition below.) |
| What we do |
How does Eaton Vance
protect my personal
information? | To protect your personal information from unauthorized access and use, we use security measures that comply with federal law. These measures include computer safeguards and secured files and buildings. We have policies governing the proper handling of customer information by personnel and requiring third parties that provide support to adhere to appropriate security standards with respect to such information. |
How does Eaton Vance
collect my personal
information? | We collect your personal information, for example, when you■ open an account or make deposits or withdrawals from your account
■ buy securities from us or make a wire transfer
■ give us your contact informationWe also collect your personal information from others, such as credit bureaus, affiliates, or other companies. |
| Why can’t I limit all sharing? | Federal law gives you the right to limit only■ sharing for affiliates’ everyday business purposes — information about your creditworthiness
■ affiliates from using your information to market to you
■ sharing for nonaffiliates to market to youState laws and individual companies may give you additional rights to limit sharing. (See below for more on your rights under state law.) |
What happens when I limit
sharing for an account I hold
jointly with someone else? | Your choices will apply to everyone on your account. |
| Definitions |
| Affiliates | Companies related by common ownership or control. They can be financial and nonfinancial companies.■ Our affiliates include registered investment advisers such as Eaton Vance Management, Eaton Vance Advisers International Ltd., Boston Management and Research, Calvert Research and Management, Parametric Portfolio Associates LLC, Atlanta Capital Management Company LLC, Morgan Stanley Investment Management Inc., Morgan Stanley Investment Management Co.; registered broker-dealers such as Morgan Stanley Distributors Inc. and Eaton Vance Distributors, Inc. (together, the “Investment Management Affiliates”); and companies with a Morgan Stanley name and financial companies such as Morgan Stanley Smith Barney LLC and Morgan Stanley & Co. (the “Morgan Stanley Affiliates”). |
| Nonaffiliates | Companies not related by common ownership or control. They can be financial and nonfinancial companies.■ Eaton Vance does not share with nonaffiliates so they can market to you. |
| Joint marketing | A formal agreement between nonaffiliated financial companies that together market financial products or services to you.■ Eaton Vance does not jointly market. |
| U.S. Customer Privacy Notice — continued | March 2024 |
| Other important information |
| *PLEASE NOTE: Eaton Vance does not share your creditworthiness information or your transactions and experiences information with the Morgan Stanley Affiliates, nor does Eaton Vance enable the Morgan Stanley Affiliates to market to you. Your opt outs will prevent Eaton Vance from sharing your creditworthiness information with the Investment Management Affiliates and will prevent the Investment Management Affiliates from marketing their products to you.Vermont: Except as permitted by law, we will not share personal information we collect about Vermont residents with Nonaffiliates unless you provide us with your written consent to share such information.California: Except as permitted by law, we will not share personal information we collect about California residents with Nonaffiliates and we will limit sharing such personal information with our Affiliates to comply with California privacy laws that apply to us. |
Delivery of Shareholder Documents. The Securities and Exchange Commission (SEC) permits funds to deliver only one copy of shareholder documents, including prospectuses, proxy statements and shareholder reports, to fund investors with multiple accounts at the same residential or post office box address. This practice is often called “householding” and it helps eliminate duplicate mailings to shareholders. Eaton Vance, or your financial intermediary, may household the mailing of your documents indefinitely unless you instruct Eaton Vance, or your financial intermediary, otherwise. If you would prefer that your Eaton Vance documents not be householded, please contact Eaton Vance at 1-800-262-1122, or contact your financial intermediary. Your instructions that householding not apply to delivery of your Eaton Vance documents will typically be effective within 30 days of receipt by Eaton Vance or your financial intermediary.
Portfolio Holdings. Each Eaton Vance Fund and its underlying Portfolio(s) (if applicable) files a schedule of portfolio holdings on Part F to Form N-PORT with the SEC. Certain information filed on Form N-PORT may be viewed on the Eaton Vance website at www.eatonvance.com, by calling Eaton Vance at 1-800-262-1122 or in the EDGAR database on the SEC’s website at www.sec.gov.
Proxy Voting. From time to time, funds are required to vote proxies related to the securities held by the funds. The Eaton Vance Funds or their underlying Portfolios (if applicable) vote proxies according to a set of policies and procedures approved by the Funds’ and Portfolios’ Boards. You may obtain a description of these policies and procedures and information on how the Funds or Portfolios voted proxies relating to portfolio securities during the most recent 12-month period ended June 30, without charge, upon request, by calling 1-800-262-1122 and by accessing the SEC’s website at www.sec.gov.
Tailored Shareholder Reports. Effective January 24, 2023, the SEC adopted rule and form amendments to require open-end mutual funds and ETFs to transmit concise and visually engaging streamlined annual and semi-annual reports to shareholders that highlight key information. Other information, including financial statements, will no longer appear in a streamlined shareholder report but must be available online, delivered free of charge upon request, and filed on a semi-annual basis on Form N-CSR. The rule and form amendments have a compliance date of July 24, 2024. At this time, management is evaluating the impact of these amendments on the shareholder reports for the Eaton Vance Funds.
This Page Intentionally Left Blank
Investment Adviser and Administrator
Eaton Vance Management
One Post Office Square
Boston, MA 02109
Investment Sub-Adviser
Eaton Vance Advisers International Ltd.
125 Old Broad Street
London, EC2N 1AR
United Kingdom
Principal Underwriter*
Eaton Vance Distributors, Inc.
One Post Office Square
Boston, MA 02109
(617) 482-8260
Custodian
State Street Bank and Trust Company
One Congress Street, Suite 1
Boston, MA 02114-2016
Transfer Agent
BNY Mellon Investment Servicing (US) Inc.
Attn: Eaton Vance Funds
P.O. Box 534439
Pittsburgh, PA 15253-4439
(800) 262-1122
Fund Offices
One Post Office Square
Boston, MA 02109
* FINRA BrokerCheck. Investors may check the background of their Investment Professional by contacting the Financial Industry Regulatory Authority (FINRA). FINRA BrokerCheck is a free tool to help investors check the professional background of current and former FINRA-registered securities firms and brokers. FINRA BrokerCheck is available by calling 1-800-289-9999 and at www.FINRA.org. The FINRA BrokerCheck brochure describing this program is available to investors at www.FINRA.org.
Eaton Vance
Short Duration High Income Fund
Semi-Annual Report
April 30, 2024
Commodity Futures Trading Commission Registration. The Commodity Futures Trading Commission (“CFTC”) has adopted regulations that subject registered investment companies and advisers to regulation by the CFTC if a fund invests more than a prescribed level of its assets in certain CFTC-regulated instruments (including futures, certain options and swap agreements) or markets itself as providing investment exposure to such instruments. The investment adviser has claimed an exclusion from the definition of “commodity pool operator” under the Commodity Exchange Act with respect to its management of the Fund. Accordingly, neither the Fund nor the adviser with respect to the operation of the Fund is subject to CFTC regulation. Because of its management of other strategies, the Fund's adviser is registered with the CFTC as a commodity pool operator. The adviser is also registered as a commodity trading advisor.
Fund shares are not insured by the FDIC and are not deposits or other obligations of, or guaranteed by, any depository institution. Shares are subject to investment risks, including possible loss of principal invested.
This report must be preceded or accompanied by a current summary prospectus or prospectus. Before investing, investors should consider carefully the investment objective, risks, and charges and expenses of a mutual fund. This and other important information is contained in the summary prospectus and prospectus, which can be obtained from a financial intermediary. Prospective investors should read the prospectus carefully before investing. For further information, please call 1-800-262-1122.
Semi-Annual Report April 30, 2024
Eaton Vance
Short Duration High Income Fund
Eaton Vance
Short Duration High Income Fund
April 30, 2024
Performance
Portfolio Manager(s) Kelley Gerrity and Stephen C. Concannon, CFA
| % Average Annual Total Returns1,2 | Class
Inception Date | Performance
Inception Date | Six Months | One Year | Five Years | Ten Years |
| Class A at NAV | 11/01/2013 | 02/21/2012 | 4.99% | 6.83% | 3.40% | 3.43% |
| Class A with 3.25% Maximum Sales Charge | — | — | 1.61 | 3.33 | 2.73 | 3.08 |
| Class I at NAV | 11/01/2013 | 02/21/2012 | 5.12 | 6.98 | 3.64 | 3.68 |
|
| ICE BofA U.S. High Yield Cash Pay BB-B 1–3 Year Index | — | — | 5.86% | 8.05% | 3.91% | 4.21% |
| % Total Annual Operating Expense Ratios3 | Class A | Class I |
| Gross | 1.15% | 0.90% |
| Net | 0.91 | 0.66 |
See Endnotes and Additional Disclosures in this report.
Past performance is no guarantee of future results. Returns are historical and are calculated by determining the percentage change in net asset value (NAV) or offering price (as applicable) with all distributions reinvested. Furthermore, returns do not reflect the deduction of taxes that shareholders may have to pay on Fund distributions or upon the redemption of Fund shares. Investment return and principal value will fluctuate so that shares, when redeemed, may be worth more or less than their original cost. Performance for periods less than or equal to one year is cumulative. Performance is for the stated time period only; due to market volatility, current Fund performance may be lower or higher than the quoted return. For performance as of the most recent month-end, please refer to eatonvance.com.
Eaton Vance
Short Duration High Income Fund
April 30, 2024
| Credit Quality (% of total investments)1 |
Footnotes:
| 1 | Ratings are based on Moody’s Investors Service, Inc. (“Moody’s”), S&P Global Ratings (“S&P”) or Fitch Ratings (“Fitch”), as applicable. This breakdown assigns a numeric equivalent to the ratings from the aforementioned agencies and the mean is rounded to the nearest integer and converted to an equivalent S&P major rating category. Ratings, which are subject to change, apply to the creditworthiness of the issuers of the underlying securities and not to the Fund or its shares. Credit ratings measure the quality of a bond based on the issuer’s creditworthiness, with ratings ranging from AAA, being the highest, to D, being the lowest based on S&P’s measures. Ratings of BBB or higher by S&P or Fitch (Baa or higher by Moody’s) are considered to be investment-grade quality. Credit ratings are based largely on the ratings agency’s analysis at the time of rating. The rating assigned to any particular security is not necessarily a reflection of the issuer’s current financial condition and does not necessarily reflect its assessment of the volatility of a security’s market value or of the liquidity of an investment in the security. Holdings designated as “Not Rated” (if any) are not rated by the national ratings agencies stated above. |
Eaton Vance
Short Duration High Income Fund
April 30, 2024
Endnotes and Additional Disclosures
| 1 | ICE BofA U.S. High Yield Cash Pay BB-B 1–3 Year Index is an unmanaged index of U.S. corporate bonds currently paying a coupon, rated BB1 through B3, and having a maturity less than 3 years. ICE® BofA® indices are not for redistribution or other uses; provided “as is”, without warranties, and with no liability. Eaton Vance has prepared this report and ICE Data Indices, LLC does not endorse it, or guarantee, review, or endorse Eaton Vance’s products. BofA® is a licensed registered trademark of Bank of America Corporation in the United States and other countries. Unless otherwise stated, index returns do not reflect the effect of any applicable sales charges, commissions, expenses, taxes or leverage, as applicable. It is not possible to invest directly in an index. |
| 2 | Total Returns at NAV do not include applicable sales charges. If sales charges were deducted, the returns would be lower. Total Returns shown with maximum sales charge reflect the stated maximum sales charge. Unless otherwise stated, performance does not reflect the deduction of taxes on Fund distributions or redemptions of Fund shares.Performance prior to the inception date of Class A and Class I is linked to the performance of Short Duration High Income Portfolio (the Portfolio), the Portfolio that the Fund invested in prior to June 15, 2020. This linked performance is adjusted for any applicable sales charge, but is not adjusted for class expense differences. If adjusted for such differences, the performance would be different. Performance presented in the Financial Highlights included in the financial statements is not linked. |
| 3 | Source: Fund prospectus. Net expense ratios reflect a contractual expense reimbursement that continues through 3/1/25. The expense ratios for the current reporting period can be found in the Financial Highlights section of this report. Performance reflects expenses waived and/or reimbursed, if applicable. Without such waivers and/or reimbursements, performance would have been lower. |
| | Fund profile subject to change due to active management. |
Eaton Vance
Short Duration High Income Fund
April 30, 2024
Example
As a Fund shareholder, you incur two types of costs: (1) transaction costs, including sales charges (loads) on purchases; and (2) ongoing costs, including management fees; distribution and/or service fees; and other Fund expenses. This Example is intended to help you understand your ongoing costs (in dollars) of Fund investing and to compare these costs with the ongoing costs of investing in other mutual funds. The Example is based on an investment of $1,000 invested at the beginning of the period and held for the entire period (November 1, 2023 to April 30, 2024).
Actual Expenses
The first section of the table below provides information about actual account values and actual expenses. You may use the information in this section, together with the amount you invested, to estimate the expenses that you paid over the period. Simply divide your account value by $1,000 (for example, an $8,600 account value divided by $1,000 = 8.6), then multiply the result by the number in the first section under the heading entitled “Expenses Paid During Period” to estimate the expenses you paid on your account during this period.
Hypothetical Example for Comparison Purposes
The second section of the table below provides information about hypothetical account values and hypothetical expenses based on the actual Fund expense ratio and an assumed rate of return of 5% per year (before expenses), which is not the actual Fund return. The hypothetical account values and expenses may not be used to estimate the actual ending account balance or expenses you paid for the period. You may use this information to compare the ongoing costs of investing in your Fund and other funds. To do so, compare this 5% hypothetical example with the 5% hypothetical examples that appear in the shareholder reports of the other funds.
Please note that the expenses shown in the table are meant to highlight your ongoing costs only and do not reflect any transactional costs, such as sales charges (loads). Therefore, the second section of the table is useful in comparing ongoing costs only, and will not help you determine the relative total costs of owning different funds. In addition, if these transactional costs were included, your costs would be higher.
| | Beginning
Account Value
(11/1/23) | Ending
Account Value
(4/30/24) | Expenses Paid
During Period*
(11/1/23 – 4/30/24) | Annualized
Expense
Ratio |
| Actual | | | | |
| Class A | $1,000.00 | $1,049.90 | $4.54** | 0.89% |
| Class I | $1,000.00 | $1,051.20 | $3.26** | 0.64% |
| |
| Hypothetical | | | | |
| (5% return per year before expenses) | | | | |
| Class A | $1,000.00 | $1,020.44 | $4.47** | 0.89% |
| Class I | $1,000.00 | $1,021.68 | $3.22** | 0.64% |
| * | Expenses are equal to the Fund's annualized expense ratio for the indicated Class, multiplied by the average account value over the period, multiplied by 182/366 (to reflect the one-half year period). The Example assumes that the $1,000 was invested at the net asset value per share determined at the close of business on October 31, 2023. |
| ** | Absent an allocation of certain expenses to affiliate(s), expenses would be higher. |
Eaton Vance
Short Duration High Income Fund
April 30, 2024
Portfolio of Investments (Unaudited)
| Security | Shares | Value |
| Healthcare — 0.1% |
| Endo, Inc.(1)(2) | | 38 | $ 1,088 |
| Endo, Inc.(1) | | 2,517 | 72,047 |
Total Common Stocks
(identified cost $54,142) | | | $ 73,135 |
| Security | Principal
Amount*
(000's omitted) | Value |
| Containers — 0.5% |
| CryoPort, Inc., 0.75%, 12/1/26(3) | | 437 | $ 378,966 |
| | | | $ 378,966 |
| Homebuilders & Real Estate — 0.2% |
| HAT Holdings I LLC/HAT Holdings II LLC, 0.00%, 5/1/25(3) | | 200 | $ 205,870 |
| | | | $ 205,870 |
| Leisure — 0.3% |
| Peloton Interactive, Inc., 0.00%, 2/15/26 | | 316 | $ 259,518 |
| | | | $ 259,518 |
| Technology — 0.5% |
| ams-OSRAM AG, 0.00%, 3/5/25(4) | EUR | 400 | $ 405,116 |
| | | | $ 405,116 |
| Telecommunications — 0.4% |
| Liberty Latin America Ltd., 2.00%, 7/15/24 | | 330 | $ 322,080 |
| | | | $ 322,080 |
| Utility — 0.2% |
| NextEra Energy Partners LP, 2.50%, 6/15/26(3) | | 214 | $ 193,074 |
| | | | $ 193,074 |
Total Convertible Bonds
(identified cost $1,787,650) | | | $ 1,764,624 |
| Security | Principal
Amount
(000's omitted) | Value |
| Aerospace — 3.1% |
| Bombardier, Inc., 7.875%, 4/15/27(3) | $ | 1,058 | $ 1,052,068 |
| Rolls-Royce PLC, 3.625%, 10/14/25(3) | | 590 | 568,613 |
| TransDigm, Inc.: | | | |
| 4.625%, 1/15/29 | | 1,085 | 995,005 |
| 6.375%, 3/1/29(3) | | 100 | 99,361 |
| | | | $ 2,715,047 |
| Air Transportation — 1.9% |
| Air Canada, 3.875%, 8/15/26(3) | $ | 150 | $ 142,420 |
| Air Canada Pass-Through Trust, 10.50%, 7/15/26(3) | | 250 | 272,403 |
| American Airlines, Inc./AAdvantage Loyalty IP Ltd., 5.50%, 4/20/26(3) | | 800 | 791,455 |
| Delta Air Lines, Inc., 7.375%, 1/15/26 | | 400 | 409,511 |
| | | | $ 1,615,789 |
| Automotive & Auto Parts — 0.6% |
| Goodyear Tire & Rubber Co., 5.00%, 5/31/26 | $ | 518 | $ 502,280 |
| | | | $ 502,280 |
| Broadcasting — 0.4% |
| Townsquare Media, Inc., 6.875%, 2/1/26(3) | $ | 362 | $ 351,645 |
| | | | $ 351,645 |
| Building Materials — 1.4% |
| CP Atlas Buyer, Inc., 7.00%, 12/1/28(3) | $ | 331 | $ 298,584 |
| Standard Industries, Inc.: | | | |
| 3.375%, 1/15/31(3) | | 110 | 90,206 |
| 5.00%, 2/15/27(3) | | 883 | 851,278 |
| | | | $ 1,240,068 |
| Cable & Satellite TV — 1.4% |
| CCO Holdings LLC/CCO Holdings Capital Corp.: | | | |
| 5.125%, 5/1/27(3) | $ | 665 | $ 623,818 |
| 5.50%, 5/1/26(3) | | 577 | 565,803 |
| | | | $ 1,189,621 |
| Capital Goods — 0.7% |
| ESAB Corp., 6.25%, 4/15/29(3) | $ | 169 | $ 168,577 |
| Patrick Industries, Inc., 7.50%, 10/15/27(3) | | 400 | 405,169 |
| | | | $ 573,746 |
6
See Notes to Financial Statements.
Eaton Vance
Short Duration High Income Fund
April 30, 2024
Portfolio of Investments (Unaudited) — continued
| Security | Principal
Amount
(000's omitted) | Value |
| Chemicals — 2.3% |
| Avient Corp., 5.75%, 5/15/25(3) | $ | 500 | $ 497,980 |
| Compass Minerals International, Inc., 6.75%, 12/1/27(3) | | 258 | 242,246 |
| International Flavors & Fragrances, Inc., 1.23%, 10/1/25(3) | | 210 | 196,632 |
| NOVA Chemicals Corp., 5.00%, 5/1/25(3) | | 800 | 786,337 |
| WR Grace Holdings LLC, 4.875%, 6/15/27(3) | | 271 | 257,552 |
| | | | $ 1,980,747 |
| Consumer Products — 0.7% |
| Kronos Acquisition Holdings, Inc./KIK Custom Products, Inc., 7.00%, 12/31/27(3) | $ | 231 | $ 223,678 |
| Mattel, Inc., 3.375%, 4/1/26(3) | | 400 | 381,241 |
| | | | $ 604,919 |
| Containers — 3.7% |
| Berry Global, Inc., 4.50%, 2/15/26(3) | $ | 610 | $ 593,330 |
| Canpack SA/Canpack U.S. LLC, 3.125%, 11/1/25(3) | | 400 | 384,012 |
| Crown Americas LLC/Crown Americas Capital Corp. VI, 4.75%, 2/1/26 | | 500 | 489,763 |
| Graphic Packaging International LLC, 4.125%, 8/15/24 | | 575 | 570,483 |
| Owens-Brockway Glass Container, Inc., 6.375%, 8/15/25(3) | | 500 | 502,394 |
| Trivium Packaging Finance BV, 5.50%, 8/15/26(3) | | 630 | 619,760 |
| | | | $ 3,159,742 |
| Diversified Financial Services — 2.3% |
| Cargo Aircraft Management, Inc., 4.75%, 2/1/28(3) | $ | 352 | $ 318,256 |
| Castlelake Aviation Finance DAC, 5.00%, 4/15/27(3) | | 435 | 419,102 |
| Jefferson Capital Holdings LLC, 6.00%, 8/15/26(3) | | 243 | 239,102 |
| Macquarie Airfinance Holdings Ltd.: | | | |
| 6.40%, 3/26/29(3) | | 70 | 69,868 |
| 8.375%, 5/1/28(3) | | 279 | 293,233 |
| PRA Group, Inc., 7.375%, 9/1/25(3) | | 109 | 108,593 |
| Rocket Mortgage LLC/Rocket Mortgage Co-Issuer, Inc., 2.875%, 10/15/26(3) | | 542 | 498,086 |
| | | | $ 1,946,240 |
| Diversified Media — 1.0% |
| Arches Buyer, Inc.: | | | |
| 4.25%, 6/1/28(3) | $ | 200 | $ 171,689 |
| 6.125%, 12/1/28(3) | | 200 | 162,854 |
| TripAdvisor, Inc., 7.00%, 7/15/25(3) | | 500 | 500,656 |
| | | | $ 835,199 |
| Security | Principal
Amount
(000's omitted) | Value |
| Energy — 7.3% |
| Aethon United BR LP/Aethon United Finance Corp., 8.25%, 2/15/26(3) | $ | 630 | $ 634,654 |
| Antero Midstream Partners LP/Antero Midstream Finance Corp., 7.875%, 5/15/26(3) | | 350 | 356,662 |
| CITGO Petroleum Corp., 6.375%, 6/15/26(3) | | 537 | 536,867 |
| Civitas Resources, Inc., 5.00%, 10/15/26(3) | | 500 | 484,067 |
| CrownRock LP/CrownRock Finance, Inc., 5.625%, 10/15/25(3) | | 845 | 840,975 |
| EQM Midstream Partners LP: | | | |
| 4.00%, 8/1/24 | | 262 | 260,300 |
| 7.50%, 6/1/27(3) | | 500 | 509,827 |
| Nabors Industries, Inc., 7.375%, 5/15/27(3) | | 300 | 297,596 |
| Permian Resources Operating LLC: | | | |
| 5.375%, 1/15/26(3) | | 453 | 448,030 |
| 7.75%, 2/15/26(3) | | 360 | 363,555 |
| Precision Drilling Corp., 7.125%, 1/15/26(3) | | 183 | 183,142 |
| Southwestern Energy Co., 5.70%, 1/23/25 | | 200 | 199,260 |
| Sunoco LP, 7.00%, 5/1/29(3) | | 500 | 508,186 |
| Venture Global LNG, Inc.: | | | |
| 8.125%, 6/1/28(3) | | 450 | 460,495 |
| 9.50%, 2/1/29(3) | | 165 | 177,455 |
| | | | $ 6,261,071 |
| Entertainment & Film — 0.4% |
| Cinemark USA, Inc., 5.875%, 3/15/26(3) | $ | 319 | $ 316,012 |
| | | | $ 316,012 |
| Environmental — 1.3% |
| GFL Environmental, Inc., 3.75%, 8/1/25(3) | $ | 1,190 | $ 1,158,463 |
| | | | $ 1,158,463 |
| Food, Beverage & Tobacco — 1.0% |
| Darling Ingredients, Inc., 5.25%, 4/15/27(3) | $ | 600 | $ 581,965 |
| Triton Water Holdings, Inc., 6.25%, 4/1/29(3) | | 15 | 13,466 |
| U.S. Foods, Inc., 6.875%, 9/15/28(3) | | 230 | 232,245 |
| | | | $ 827,676 |
| Gaming — 4.3% |
| Caesars Entertainment, Inc., 8.125%, 7/1/27(3) | $ | 380 | $ 385,401 |
| International Game Technology PLC, 6.50%, 2/15/25(3) | | 812 | 812,637 |
| Light & Wonder International, Inc., 7.00%, 5/15/28(3) | | 400 | 401,681 |
| MGM Resorts International: | | | |
| 4.625%, 9/1/26 | | 352 | 339,190 |
| 5.75%, 6/15/25 | | 700 | 696,547 |
7
See Notes to Financial Statements.
Eaton Vance
Short Duration High Income Fund
April 30, 2024
Portfolio of Investments (Unaudited) — continued
| Security | Principal
Amount
(000's omitted) | Value |
| Gaming (continued) |
| Raptor Acquisition Corp./Raptor Co.-Issuer LLC, 4.875%, 11/1/26(3) | $ | 650 | $ 618,493 |
| Wynn Las Vegas LLC/Wynn Las Vegas Capital Corp., 5.25%, 5/15/27(3) | | 500 | 483,544 |
| | | | $ 3,737,493 |
| Healthcare — 4.8% |
| AMN Healthcare, Inc., 4.625%, 10/1/27(3) | $ | 662 | $ 622,536 |
| Heartland Dental LLC/Heartland Dental Finance Corp., 8.50%, 5/1/26(3) | | 310 | 309,191 |
| IQVIA, Inc., 5.00%, 10/15/26(3) | | 500 | 489,503 |
| ModivCare Escrow Issuer, Inc., 5.00%, 10/1/29(3) | | 26 | 18,088 |
| ModivCare, Inc., 5.875%, 11/15/25(3) | | 392 | 382,732 |
| P&L Development LLC/PLD Finance Corp., 7.75%, 11/15/25(3) | | 250 | 211,976 |
| RegionalCare Hospital Partners Holdings, Inc./LifePoint Health, Inc., 9.75%, 12/1/26(3) | | 856 | 853,158 |
| Team Health Holdings, Inc., 6.375%, 2/1/25(3) | | 250 | 232,735 |
| Teva Pharmaceutical Finance Netherlands III BV, 7.125%, 1/31/25 | | 460 | 461,605 |
| U.S. Acute Care Solutions LLC: | | | |
| 6.375%, 3/1/26(3) | | 356 | 360,811 |
| 9.75%, 5/15/29(3)(5) | | 190 | 186,558 |
| | | | $ 4,128,893 |
| Homebuilders & Real Estate — 4.0% |
| Brundage-Bone Concrete Pumping Holdings, Inc., 6.00%, 2/1/26(3) | $ | 271 | $ 266,999 |
| HAT Holdings I LLC/HAT Holdings II LLC: | | | |
| 3.375%, 6/15/26(3) | | 342 | 318,241 |
| 6.00%, 4/15/25(3) | | 300 | 298,745 |
| 8.00%, 6/15/27(3) | | 200 | 205,280 |
| Meritage Homes Corp., 6.00%, 6/1/25 | | 572 | 571,974 |
| Starwood Property Trust, Inc.: | | | |
| 3.75%, 12/31/24(3) | | 964 | 947,217 |
| 7.25%, 4/1/29(3) | | 255 | 251,875 |
| VICI Properties LP/VICI Note Co., Inc., 3.50%, 2/15/25(3) | | 619 | 607,652 |
| | | | $ 3,467,983 |
| Insurance — 1.0% |
| Alliant Holdings Intermediate LLC/Alliant Holdings Co-Issuer, 6.75%, 10/15/27(3) | $ | 900 | $ 883,299 |
| | | | $ 883,299 |
| Security | Principal
Amount
(000's omitted) | Value |
| Leisure — 7.2% |
| Carnival Corp.: | | | |
| 6.00%, 5/1/29(3) | $ | 115 | $ 111,512 |
| 7.625%, 3/1/26(3) | | 800 | 805,502 |
| Life Time, Inc., 8.00%, 4/15/26(3) | | 845 | 847,158 |
| Lindblad Expeditions Holdings, Inc., 9.00%, 5/15/28(3) | | 200 | 209,383 |
| Motion Bondco DAC, 6.625%, 11/15/27(3) | | 255 | 246,126 |
| NCL Corp. Ltd.: | | | |
| 5.875%, 3/15/26(3) | | 1,397 | 1,369,801 |
| 5.875%, 2/15/27(3) | | 300 | 293,278 |
| Royal Caribbean Cruises Ltd.: | | | |
| 5.375%, 7/15/27(3) | | 256 | 249,302 |
| 5.50%, 8/31/26(3) | | 466 | 457,441 |
| Speedway Motorsports LLC/Speedway Funding II, Inc., 4.875%, 11/1/27(3) | | 450 | 424,020 |
| Vail Resorts, Inc., 6.25%, 5/15/25(3) | | 450 | 450,576 |
| Viking Cruises Ltd., 6.25%, 5/15/25(3) | | 727 | 725,211 |
| | | | $ 6,189,310 |
| Metals & Mining — 1.6% |
| Arsenal AIC Parent LLC, 11.50%, 10/1/31(3) | $ | 477 | $ 531,731 |
| Constellium SE, 5.875%, 2/15/26(3) | | 250 | 247,943 |
| Hudbay Minerals, Inc., 4.50%, 4/1/26(3) | | 400 | 387,296 |
| New Gold, Inc., 7.50%, 7/15/27(3) | | 210 | 208,906 |
| | | | $ 1,375,876 |
| Paper — 0.3% |
| Enviva Partners LP/Enviva Partners Finance Corp., 6.50%, 1/15/26(3)(6) | $ | 520 | $ 226,881 |
| | | | $ 226,881 |
| Publishing & Printing — 0.4% |
| McGraw-Hill Education, Inc., 5.75%, 8/1/28(3) | $ | 357 | $ 331,465 |
| | | | $ 331,465 |
| Railroad — 0.4% |
| Watco Cos. LLC/Watco Finance Corp., 6.50%, 6/15/27(3) | $ | 400 | $ 395,391 |
| | | | $ 395,391 |
| Restaurant — 2.3% |
| 1011778 BC ULC/New Red Finance, Inc., 5.75%, 4/15/25(3) | $ | 356 | $ 354,687 |
| Dave & Buster's, Inc., 7.625%, 11/1/25(3) | | 518 | 521,835 |
8
See Notes to Financial Statements.
Eaton Vance
Short Duration High Income Fund
April 30, 2024
Portfolio of Investments (Unaudited) — continued
| Security | Principal
Amount
(000's omitted) | Value |
| Restaurant (continued) |
| IRB Holding Corp., 7.00%, 6/15/25(3) | $ | 753 | $ 752,038 |
| Sizzling Platter LLC/Sizzling Platter Finance Corp., 8.50%, 11/28/25(3) | | 325 | 328,861 |
| | | | $ 1,957,421 |
| Services — 6.5% |
| Allied Universal Holdco LLC/Allied Universal Finance Corp.: | | | |
| 6.625%, 7/15/26(3) | $ | 80 | $ 79,870 |
| 9.75%, 7/15/27(3) | | 350 | 349,053 |
| Allied Universal Holdco LLC/Allied Universal Finance Corp./Atlas Luxco 4 SARL, 4.625%, 6/1/28(3) | | 200 | 179,622 |
| Alta Equipment Group, Inc., 5.625%, 4/15/26(3) | | 262 | 252,648 |
| BCPE Empire Holdings, Inc., 7.625%, 5/1/27(3) | | 419 | 408,197 |
| GEMS MENASA Cayman Ltd./GEMS Education Delaware LLC, 7.125%, 7/31/26(3) | | 1,127 | 1,120,923 |
| Hertz Corp., 4.625%, 12/1/26(3) | | 579 | 449,069 |
| Korn Ferry, 4.625%, 12/15/27(3) | | 664 | 630,225 |
| Neptune Bidco U.S., Inc., 9.29%, 4/15/29(3) | | 200 | 188,965 |
| WASH Multifamily Acquisition, Inc., 5.75%, 4/15/26(3) | | 400 | 388,208 |
| WESCO Distribution, Inc.: | | | |
| 6.375%, 3/15/29(3) | | 131 | 130,299 |
| 7.125%, 6/15/25(3) | | 899 | 900,500 |
| White Cap Parent LLC, 8.25%, (8.25% cash or 9.00% PIK), 3/15/26(3)(7) | | 500 | 500,627 |
| | | | $ 5,578,206 |
| Steel — 0.6% |
| Allegheny Ludlum LLC, 6.95%, 12/15/25 | $ | 515 | $ 522,449 |
| | | | $ 522,449 |
| Super Retail — 2.3% |
| Bath & Body Works, Inc., 9.375%, 7/1/25(3) | $ | 309 | $ 320,086 |
| Evergreen AcqCo 1 LP/TVI, Inc., 9.75%, 4/26/28(3) | | 333 | 353,078 |
| Hanesbrands, Inc., 4.875%, 5/15/26(3) | | 518 | 501,475 |
| Kohl's Corp., 4.25%, 7/17/25 | | 270 | 263,468 |
| NMG Holding Co., Inc./Neiman Marcus Group LLC, 7.125%, 4/1/26(3) | | 395 | 393,539 |
| William Carter Co., 5.625%, 3/15/27(3) | | 185 | 180,251 |
| | | | $ 2,011,897 |
| Technology — 4.5% |
| CDK Global II LLC, 6.50%, 10/15/24 | $ | 500 | $ 490,045 |
| Clarios Global LP, 6.75%, 5/15/25(3) | | 299 | 299,385 |
| Clarios Global LP/Clarios U.S. Finance Co., 8.50%, 5/15/27(3) | | 750 | 752,395 |
| Security | Principal
Amount
(000's omitted) | Value |
| Technology (continued) |
| Gen Digital, Inc.: | | | |
| 5.00%, 4/15/25(3) | $ | 322 | $ 318,364 |
| 6.75%, 9/30/27(3) | | 500 | 502,281 |
| Presidio Holdings, Inc., 4.875%, 2/1/27(3) | | 21 | 21,041 |
| PTC, Inc., 3.625%, 2/15/25(3) | | 336 | 329,395 |
| Rocket Software, Inc., 9.00%, 11/28/28(3)(5) | | 85 | 85,400 |
| Seagate HDD Cayman, 4.75%, 1/1/25 | | 410 | 406,328 |
| Sensata Technologies BV, 5.00%, 10/1/25(3) | | 650 | 642,218 |
| | | | $ 3,846,852 |
| Telecommunications — 3.7% |
| Connect Finco SARL/Connect U.S. Finco LLC, 6.75%, 10/1/26(3) | $ | 1,020 | $ 988,750 |
| Iliad Holding SASU, 6.50%, 10/15/26(3) | | 1,460 | 1,454,363 |
| Sable International Finance Ltd., 5.75%, 9/7/27(3) | | 440 | 420,465 |
| Viasat, Inc., 5.625%, 9/15/25(3) | | 300 | 288,569 |
| | | | $ 3,152,147 |
| Utility — 3.5% |
| Calpine Corp.: | | | |
| 5.125%, 3/15/28(3) | $ | 250 | $ 237,365 |
| 5.25%, 6/1/26(3) | | 350 | 345,322 |
| Ferrellgas LP/Ferrellgas Finance Corp., 5.375%, 4/1/26(3) | | 400 | 392,262 |
| NextEra Energy Operating Partners LP, 4.25%, 7/15/24(3) | | 741 | 739,514 |
| NRG Energy, Inc.: | | | |
| 6.625%, 1/15/27 | | 300 | 299,674 |
| 10.25% to 3/15/28(3)(8)(9) | | 153 | 165,075 |
| Vistra Operations Co. LLC, 5.50%, 9/1/26(3) | | 868 | 847,869 |
| | | | $ 3,027,081 |
Total Corporate Bonds
(identified cost $66,163,905) | | | $66,110,909 |
| Senior Floating-Rate Loans — 16.6%(10) |
| Borrower/Description | Principal
Amount
(000's omitted) | Value |
| Aerospace — 1.3% |
| TransDigm, Inc., Term Loan, 8.059%, (SOFR + 2.75%), 8/24/28 | $ | 1,094 | $ 1,101,385 |
| | | | $ 1,101,385 |
9
See Notes to Financial Statements.
Eaton Vance
Short Duration High Income Fund
April 30, 2024
Portfolio of Investments (Unaudited) — continued
| Borrower/Description | Principal
Amount
(000's omitted) | Value |
| Air Transportation — 0.8% |
| Mileage Plus Holdings LLC, Term Loan, 10.733%, (SOFR + 5.25%), 6/21/27 | $ | 689 | $ 708,251 |
| | | | $ 708,251 |
| Capital Goods — 0.3% |
| EMRLD Borrower LP, Term Loan, 7.816%, (SOFR + 2.50%), 5/31/30 | $ | 274 | $ 274,735 |
| | | | $ 274,735 |
| Chemicals — 0.8% |
| Olympus Water U.S. Holding Corp., Term Loan, 9.321%, (SOFR + 3.75%), 11/9/28 | $ | 685 | $ 687,555 |
| | | | $ 687,555 |
| Energy — 0.3% |
| Epic Y-Grade Services LP, Term Loan, 6/29/29(11) | $ | 276 | $ 273,183 |
| | | | $ 273,183 |
| Food, Beverage & Tobacco — 0.3% |
| Triton Water Holdings, Inc., Term Loan, 3/31/28(11) | $ | 265 | $ 264,172 |
| | | | $ 264,172 |
| Gaming — 1.8% |
| Caesars Entertainment, Inc., Term Loan, 8.066%, (SOFR + 2.75%), 2/6/31 | $ | 1,000 | $ 1,002,812 |
| Spectacle Gary Holdings LLC, Term Loan, 9.702%, (SOFR + 4.25%), 12/11/28 | | 577 | 568,703 |
| | | | $ 1,571,515 |
| Healthcare — 3.1% |
| athenahealth Group, Inc., Term Loan, 8.566%, (SOFR + 3.25%), 2/15/29 | $ | 398 | $ 397,104 |
| Bausch & Lomb Corp., Term Loan, 8.669%, (SOFR + 3.25%), 5/10/27 | | 548 | 545,692 |
| Jazz Financing Lux SARL, Term Loan, 8.43%, (SOFR + 3.00%), 5/5/28 | | 714 | 718,783 |
| Pluto Acquisition I, Inc.: | | | |
| Term Loan, 10.687%, (SOFR + 5.50%), 6/20/28 | | 67 | 67,430 |
| Term Loan - Second Lien, 9.316%, (SOFR + 4.00%), 9/20/28 | | 220 | 195,836 |
| Team Health Holdings, Inc., Term Loan, 10.58%, (SOFR + 5.25%), 3/2/27(12) | | 239 | 210,777 |
| Verscend Holding Corp., Term Loan, 11.50%, (U.S. (Fed) Prime Rate + 3.00%), 8/27/25 | | 530 | 530,730 |
| | | | $ 2,666,352 |
| Borrower/Description | Principal
Amount
(000's omitted) | Value |
| Insurance — 0.7% |
| Truist Insurance Holdings LLC, Term Loan - Second Lien, 3/8/32(11) | $ | 570 | $ 575,201 |
| | | | $ 575,201 |
| Paper — 0.2% |
| Enviva Partners LP/Enviva Partners Finance Corp.: | | | |
| Term Loan, 4.00%, 12/13/24(13) | $ | 91 | $ 92,482 |
| Term Loan, 4.00%, 12/13/24(13) | | 36 | 42,537 |
| Term Loan, 13.297%, (SOFR + 8.00%), 12/13/24 | | 55 | 63,806 |
| | | | $ 198,825 |
| Restaurant — 1.5% |
| Dave & Buster's, Inc., Term Loan, 8.625%, (SOFR + 3.25%), 6/29/29 | $ | 766 | $ 769,666 |
| IRB Holding Corp., Term Loan, 8.166%, (SOFR + 2.75%), 12/15/27 | | 494 | 494,915 |
| | | | $ 1,264,581 |
| Services — 1.0% |
| AlixPartners LLP, Term Loan, 7.93%, (SOFR + 2.50%), 2/4/28 | $ | 869 | $ 871,945 |
| | | | $ 871,945 |
| Super Retail — 2.7% |
| Hanesbrands, Inc., Term Loan, 3/8/30(11) | $ | 400 | $ 401,000 |
| Mavis Tire Express Services Corp., Term Loan, 9.066%, (SOFR + 3.75%), 5/4/28 | | 863 | 866,589 |
| PetSmart, Inc., Term Loan, 9.166%, (SOFR + 3.75%), 2/11/28 | | 1,059 | 1,044,985 |
| | | | $ 2,312,574 |
| Technology — 1.8% |
| Clarios Global LP, Term Loan, 8.316%, (SOFR + 3.00%), 5/6/30 | $ | 200 | $ 200,850 |
| Cloud Software Group, Inc., Term Loan, 3/30/29(11) | | 167 | 167,478 |
| GoTo Group, Inc., Term Loan, 10.074%, (SOFR + 4.75%), 8/31/27 | | 2 | 1,075 |
| Presidio Holdings, Inc., Term Loan, 8.929%, (SOFR + 3.50%), 1/22/27(12) | | 827 | 828,948 |
10
See Notes to Financial Statements.
Eaton Vance
Short Duration High Income Fund
April 30, 2024
Portfolio of Investments (Unaudited) — continued
| Borrower/Description | Principal
Amount
(000's omitted) | Value |
| Technology (continued) |
| Riverbed Technology, Inc., Term Loan, 9.809%, (SOFR + 4.50%), 7.809% cash, 2.00% PIK, 7/1/28 | $ | 22 | $ 13,233 |
| Travelport Finance (Luxembourg) SARL, Term Loan, 13.564%, (SOFR + 8.00%), 9/30/28 | | 344 | 318,309 |
| | | | $ 1,529,893 |
Total Senior Floating-Rate Loans
(identified cost $14,272,736) | | | $14,300,167 |
| Security | Principal
Amount | Value |
| Healthcare — 0.0% |
| Endo Design LLC, Escrow Certificates(1)(14) | $ | 260,000 | $ 0 |
Total Miscellaneous
(identified cost $11,886) | | | $ 0 |
| Short-Term Investments — 5.4% |
| Security | Shares | Value |
| Morgan Stanley Institutional Liquidity Funds - Government Portfolio, Institutional Class, 5.22%(15) | | 4,591,024 | $ 4,591,024 |
Total Short-Term Investments
(identified cost $4,591,024) | | | $ 4,591,024 |
Total Investments — 101.1%
(identified cost $86,881,343) | | | $86,839,859 |
| Less Unfunded Loan Commitments — (0.1)% | | | $ (127,248) |
Net Investments — 101.0%
(identified cost $86,754,095) | | | $86,712,611 |
| Other Assets, Less Liabilities — (1.0)% | | | $ (801,467) |
| Net Assets — 100.0% | | | $85,911,144 |
| The percentage shown for each investment category in the Portfolio of Investments is based on net assets. |
| * | In U.S. dollars unless otherwise indicated. |
| (1) | Non-income producing security. |
| (2) | Restricted security (see Note 7). |
| (3) | Security exempt from registration under Rule 144A of the Securities Act of 1933, as amended. These securities may be sold in certain transactions in reliance on an exemption from registration (normally to qualified institutional buyers). At April 30, 2024, the aggregate value of these securities is $59,410,937 or 69.2% of the Fund's net assets. |
| (4) | Security exempt from registration under Regulation S of the Securities Act of 1933, as amended, which exempts from registration securities offered and sold outside the United States. Security may not be offered or sold in the United States except pursuant to an exemption from, or in a transaction not subject to, the registration requirements of the Securities Act of 1933, as amended. At April 30, 2024, the aggregate value of these securities is $405,116 or 0.5% of the Fund's net assets. |
| (5) | When-issued security. |
| (6) | Issuer is in default with respect to interest and/or principal payments or has declared bankruptcy. |
| (7) | Represents a payment-in-kind security which may pay interest in additional principal at the issuer’s discretion. |
| (8) | Perpetual security with no stated maturity date but may be subject to calls by the issuer. |
| (9) | Security converts to variable rate after the indicated fixed-rate coupon period. |
| (10) | Senior floating-rate loans (Senior Loans) often require prepayments from excess cash flows or permit the borrowers to repay at their election. The degree to which borrowers repay, whether as a contractual requirement or at their election, cannot be predicted with accuracy. As a result, the actual remaining maturity may be substantially less than the stated maturities shown. However, Senior Loans will typically have an expected average life of approximately two to four years. Senior Loans typically have rates of interest which are redetermined periodically by reference to a base lending rate, plus a spread. These base lending rates are primarily the Secured Overnight Financing Rate (“SOFR”) and secondarily, the prime rate offered by one or more major United States banks (the “Prime Rate”). Base lending rates may be subject to a floor, or minimum rate. Rates for SOFR are generally 1 or 3-month tenors and may also be subject to a credit spread adjustment. Senior Loans are generally subject to contractual restrictions that must be satisfied before they can be bought or sold. |
| (11) | This Senior Loan will settle after April 30, 2024, at which time the interest rate will be determined. |
| (12) | The stated interest rate represents the weighted average interest rate at April 30, 2024 of contracts within the senior loan facility. Interest rates on contracts are primarily redetermined either monthly or quarterly by reference to the indicated base lending rate and spread and the reset period. |
| (13) | Unfunded or partially unfunded loan commitments. The stated interest rate reflects the weighted average of the reference rate and spread for the funded portion, if any, and the commitment fees on the portion of the loan that is unfunded. At April 30, 2024, the total value of unfunded loan commitments is $135,019. See Note 1G for description. |
| (14) | For fair value measurement disclosure purposes, security is categorized as Level 3 (see Note 11). |
| (15) | May be deemed to be an affiliated investment company. The rate shown is the annualized seven-day yield as of April 30, 2024. |
11
See Notes to Financial Statements.
Eaton Vance
Short Duration High Income Fund
April 30, 2024
Portfolio of Investments (Unaudited) — continued
| Forward Foreign Currency Exchange Contracts (OTC) |
| Currency Purchased | Currency Sold | Counterparty | Settlement
Date | Unrealized
Appreciation | Unrealized
(Depreciation) |
| USD | 100,184 | EUR | 93,287 | Goldman Sachs International | 7/31/24 | $ 243 | $ — |
| USD | 183,499 | EUR | 171,000 | State Street Bank and Trust Company | 7/31/24 | 302 | — |
| USD | 114,512 | EUR | 106,713 | State Street Bank and Trust Company | 7/31/24 | 188 | — |
| | | | | | | $733 | $ — |
| Abbreviations: |
| OTC | – Over-the-counter |
| PIK | – Payment In Kind |
| SOFR | – Secured Overnight Financing Rate |
| Currency Abbreviations: |
| EUR | – Euro |
| USD | – United States Dollar |
12
See Notes to Financial Statements.
Eaton Vance
Short Duration High Income Fund
April 30, 2024
Statement of Assets and Liabilities (Unaudited)
| | April 30, 2024 |
| Assets | |
| Unaffiliated investments, at value (identified cost $82,163,071) | $ 82,121,587 |
| Affiliated investments, at value (identified cost $4,591,024) | 4,591,024 |
| Cash | 188,093 |
| Foreign currency, at value (identified cost $1,031) | 1,029 |
| Interest receivable | 1,111,538 |
| Dividends receivable from affiliated investments | 19,021 |
| Receivable for investments sold | 180,000 |
| Receivable for Fund shares sold | 25,898 |
| Receivable for open forward foreign currency exchange contracts | 733 |
| Tax reclaims receivable | 136 |
| Receivable from affiliates | 29,371 |
| Trustees' deferred compensation plan | 19,300 |
| Total assets | $88,287,730 |
| Liabilities | |
| Payable for investments purchased | $ 1,748,053 |
| Payable for when-issued securities | 271,335 |
| Payable for Fund shares redeemed | 206,519 |
| Distributions payable | 9,267 |
| Payable to affiliates: | |
| Investment adviser and administration fee | 37,854 |
| Distribution and service fees | 2,302 |
| Trustees' fees | 457 |
| Trustees' deferred compensation plan | 19,300 |
| Accrued expenses | 81,499 |
| Total liabilities | $ 2,376,586 |
| Net Assets | $85,911,144 |
| Sources of Net Assets | |
| Paid-in capital | $ 90,857,478 |
| Accumulated loss | (4,946,334) |
| Net Assets | $85,911,144 |
| Class A Shares | |
| Net Assets | $ 11,423,304 |
| Shares Outstanding | 1,287,540 |
Net Asset Value and Redemption Price Per Share
(net assets ÷ shares of beneficial interest outstanding) | $ 8.87 |
Maximum Offering Price Per Share
(100 ÷ 96.75 of net asset value per share) | $ 9.17 |
| Class I Shares | |
| Net Assets | $ 74,487,840 |
| Shares Outstanding | 8,385,813 |
Net Asset Value, Offering Price and Redemption Price Per Share
(net assets ÷ shares of beneficial interest outstanding) | $ 8.88 |
| On sales of $100,000 or more, the offering price of Class A shares is reduced. |
13
See Notes to Financial Statements.
Eaton Vance
Short Duration High Income Fund
April 30, 2024
Statement of Operations (Unaudited)
| | Six Months Ended |
| | April 30, 2024 |
| Investment Income | |
| Dividend income from affiliated investments | $ 109,061 |
| Interest income | 2,852,733 |
| Other income | 16,093 |
| Total investment income | $2,977,887 |
| Expenses | |
| Investment adviser and administration fee | $ 226,888 |
| Distribution and service fees: | |
| Class A | 12,938 |
| Trustees’ fees and expenses | 2,886 |
| Custodian fee | 19,780 |
| Transfer and dividend disbursing agent fees | 31,386 |
| Legal and accounting services | 46,440 |
| Printing and postage | 3,550 |
| Registration fees | 26,896 |
| Miscellaneous | 5,840 |
| Total expenses | $ 376,604 |
| Deduct: | |
| Waiver and/or reimbursement of expenses by affiliates | $ 98,608 |
| Total expense reductions | $ 98,608 |
| Net expenses | $ 277,996 |
| Net investment income | $2,699,891 |
| Realized and Unrealized Gain (Loss) | |
| Net realized gain (loss): | |
| Investment transactions | $ (328,642) |
| Foreign currency transactions | (256) |
| Forward foreign currency exchange contracts | (2,093) |
| Net realized loss | $ (330,991) |
| Change in unrealized appreciation (depreciation): | |
| Investments | $ 1,703,447 |
| Foreign currency | 111 |
| Forward foreign currency exchange contracts | 615 |
| Net change in unrealized appreciation (depreciation) | $1,704,173 |
| Net realized and unrealized gain | $1,373,182 |
| Net increase in net assets from operations | $4,073,073 |
14
See Notes to Financial Statements.
Eaton Vance
Short Duration High Income Fund
April 30, 2024
Statements of Changes in Net Assets
| | Six Months Ended
April 30, 2024
(Unaudited) | Year Ended
October 31, 2023 |
| Increase (Decrease) in Net Assets | | |
| From operations: | | |
| Net investment income | $ 2,699,891 | $ 4,391,955 |
| Net realized loss | (330,991) | (1,401,295) |
| Net change in unrealized appreciation (depreciation) | 1,704,173 | 1,237,804 |
| Net increase in net assets from operations | $ 4,073,073 | $ 4,228,464 |
| Distributions to shareholders: | | |
| Class A | $ (329,956) | $ (492,054) |
| Class I | (2,399,148) | (4,152,190) |
| Total distributions to shareholders | $ (2,729,104) | $ (4,644,244) |
| Transactions in shares of beneficial interest: | | |
| Class A | $ (415,297) | $ 5,040,226 |
| Class I | 7,382,160 | (3,032,600) |
| Net increase in net assets from Fund share transactions | $ 6,966,863 | $ 2,007,626 |
| Net increase in net assets | $ 8,310,832 | $ 1,591,846 |
| Net Assets | | |
| At beginning of period | $ 77,600,312 | $ 76,008,466 |
| At end of period | $85,911,144 | $77,600,312 |
15
See Notes to Financial Statements.
Eaton Vance
Short Duration High Income Fund
April 30, 2024
| | Class A |
| | Six Months Ended
April 30, 2024
(Unaudited) | Year Ended October 31, |
| | 2023 | 2022 | 2021 | 2020 | 2019 |
| Net asset value — Beginning of period | $ 8.720 | $ 8.750 | $ 9.500 | $ 9.120 | $ 9.540 | $ 9.470 |
| Income (Loss) From Operations | | | | | | |
| Net investment income(1) | $ 0.279 | $ 0.515 | $ 0.355 | $ 0.356 | $ 0.394 | $ 0.432 |
| Net realized and unrealized gain (loss) | 0.153 | (0.003) | (0.730) | 0.401 | (0.387) | 0.070 |
| Total income (loss) from operations | $ 0.432 | $ 0.512 | $(0.375) | $ 0.757 | $ 0.007 | $ 0.502 |
| Less Distributions | | | | | | |
| From net investment income | $ (0.282) | $ (0.542) | $ (0.375) | $ (0.377) | $ (0.414) | $ (0.432) |
| Tax return of capital | — | — | — | — | (0.013) | — |
| Total distributions | $ (0.282) | $ (0.542) | $(0.375) | $(0.377) | $(0.427) | $(0.432) |
| Net asset value — End of period | $ 8.870 | $ 8.720 | $ 8.750 | $ 9.500 | $ 9.120 | $ 9.540 |
| Total Return(2)(3) | 4.99% (4) | 5.96% | (4.00)% | 8.39% | 0.15% | 5.41% |
| Ratios/Supplemental Data | | | | | | |
| Net assets, end of period (000’s omitted) | $11,423 | $11,664 | $ 6,683 | $ 7,059 | $ 6,537 | $ 6,914 |
| Ratios (as a percentage of average daily net assets):(5) | | | | | | |
| Expenses (3) | 0.89% (6)(7) | 0.90% (7) | 0.90% (7) | 0.90% | 0.90% | 0.90% |
| Net investment income | 6.31% (6) | 5.84% | 3.89% | 3.76% | 4.29% | 4.54% |
| Portfolio Turnover of the Portfolio(8) | — | — | — | — | 50% | 63% |
| Portfolio Turnover of the Fund | 37% (4) | 70% | 96% | 75% | 34% (9) | — |
| (1) | Computed using average shares outstanding. |
| (2) | Returns are historical and are calculated by determining the percentage change in net asset value with all distributions reinvested and do not reflect the effect of sales charges. |
| (3) | The investment adviser and administrator of the Fund and/or the investment adviser of the Portfolio reimbursed certain operating expenses (equal to 0.23%, 0.24%, 0.23%, 0.30%, 0.31% and 0.39% of average daily net assets for the six months ended April 30, 2024 and the years ended October 31, 2023, 2022, 2021, 2020 and 2019, respectively). Absent this reimbursement, total return would be lower. |
| (4) | Not annualized. |
| (5) | Includes the Fund’s share of the Portfolio’s allocated expenses for the period while the Fund was investing in the Portfolio. |
| (6) | Annualized. |
| (7) | Includes a reduction by the investment adviser and administrator of a portion of its investment adviser and administration fee due to the Fund’s investment in the Liquidity Fund (equal to 0.01%, less than 0.01% and less than 0.005% of average daily net assets for the six months ended April 30, 2024 and the years ended October 31, 2023 and 2022, respectively). |
| (8) | Portfolio turnover represents the rate of portfolio activity for the period while the Fund was investing in the Portfolio. |
| (9) | For the period from June 15, 2020 through October 31, 2020 when the Fund was making investments directly in securities. |
| | References to Portfolio herein are to Short Duration High Income Portfolio, a Massachusetts business trust in which the Fund invested all of its investable assets prior to the close of business on June 12, 2020 and which had the same investment objective and policies as the Fund during such period. |
16
See Notes to Financial Statements.
Eaton Vance
Short Duration High Income Fund
April 30, 2024
Financial Highlights — continued
| | Class I |
| | Six Months Ended
April 30, 2024
(Unaudited) | Year Ended October 31, |
| | 2023 | 2022 | 2021 | 2020 | 2019 |
| Net asset value — Beginning of period | $ 8.730 | $ 8.760 | $ 9.510 | $ 9.130 | $ 9.560 | $ 9.490 |
| Income (Loss) From Operations | | | | | | |
| Net investment income(1) | $ 0.290 | $ 0.533 | $ 0.381 | $ 0.375 | $ 0.417 | $ 0.457 |
| Net realized and unrealized gain (loss) | 0.154 | 0.002 (2) | (0.733) | 0.407 | (0.396) | 0.069 |
| Total income (loss) from operations | $ 0.444 | $ 0.535 | $ (0.352) | $ 0.782 | $ 0.021 | $ 0.526 |
| Less Distributions | | | | | | |
| From net investment income | $ (0.294) | $ (0.565) | $ (0.398) | $ (0.402) | $ (0.437) | $ (0.456) |
| Tax return of capital | — | — | — | — | (0.014) | — |
| Total distributions | $ (0.294) | $ (0.565) | $ (0.398) | $ (0.402) | $ (0.451) | $ (0.456) |
| Net asset value — End of period | $ 8.880 | $ 8.730 | $ 8.760 | $ 9.510 | $ 9.130 | $ 9.560 |
| Total Return(3)(4) | 5.12% (5) | 6.23% | (3.75)% | 8.65% | 0.30% | 5.67% |
| Ratios/Supplemental Data | | | | | | |
| Net assets, end of period (000’s omitted) | $74,488 | $65,936 | $69,325 | $61,879 | $41,585 | $49,780 |
| Ratios (as a percentage of average daily net assets):(6) | | | | | | |
| Expenses (4) | 0.64% (7)(8) | 0.65% (8) | 0.65% (8) | 0.65% | 0.65% | 0.65% |
| Net investment income | 6.57% (7) | 6.04% | 4.18% | 3.95% | 4.53% | 4.79% |
| Portfolio Turnover of the Portfolio(9) | — | — | — | — | 50% | 63% |
| Portfolio Turnover of the Fund | 37% (5) | 70% | 96% | 75% | 34% (10) | — |
| (1) | Computed using average shares outstanding. |
| (2) | The per share amount is not in accord with the net realized and unrealized gain (loss) for the period because of the timing of Fund share transactions and the amount of the per share realized and unrealized gains and losses at such time. |
| (3) | Returns are historical and are calculated by determining the percentage change in net asset value with all distributions reinvested. |
| (4) | The investment adviser and administrator of the Fund and/or the investment adviser of the Portfolio reimbursed certain operating expenses (equal to 0.23%, 0.24%, 0.23%, 0.30%, 0.31% and 0.39% of average daily net assets for the six months ended April 30, 2024 and the years ended October 31, 2023, 2022, 2021, 2020 and 2019, respectively). Absent this reimbursement, total return would be lower. |
| (5) | Not annualized. |
| (6) | Includes the Fund’s share of the Portfolio’s allocated expenses for the period while the Fund was investing in the Portfolio. |
| (7) | Annualized. |
| (8) | Includes a reduction by the investment adviser and administrator of a portion of its investment adviser and administration fee due to the Fund’s investment in the Liquidity Fund (equal to 0.01%, less than 0.01% and less than 0.005% of average daily net assets for the six months ended April 30, 2024 and the years ended October 31, 2023 and 2022, respectively). |
| (9) | Portfolio turnover represents the rate of portfolio activity for the period while the Fund was investing in the Portfolio. |
| (10) | For the period from June 15, 2020 through October 31, 2020 when the Fund was making investments directly in securities. |
| | References to Portfolio herein are to Short Duration High Income Portfolio, a Massachusetts business trust in which the Fund invested all of its investable assets prior to the close of business on June 12, 2020 and which had the same investment objective and policies as the Fund during such period. |
17
See Notes to Financial Statements.
Eaton Vance
Short Duration High Income Fund
April 30, 2024
Notes to Financial Statements (Unaudited)
1 Significant Accounting Policies
Eaton Vance Short Duration High Income Fund (the Fund) is a diversified series of Eaton Vance Mutual Funds Trust (the Trust). The Trust is a Massachusetts business trust registered under the Investment Company Act of 1940, as amended (the 1940 Act), as an open-end management investment company. The Fund’s investment objective is total return. The Fund offers two classes of shares. Class A shares are generally sold subject to a sales charge imposed at time of purchase. Class A shares may be subject to a 0.75% contingent deferred sales charge (CDSC) if redeemed within 12 months of purchase (depending on the circumstances of purchase). Class I shares are sold at net asset value and are not subject to a sales charge. Each class represents a pro rata interest in the Fund, but votes separately on class-specific matters and (as noted below) is subject to different expenses. Realized and unrealized gains and losses are allocated daily to each class of shares based on the relative net assets of each class to the total net assets of the Fund. Net investment income, other than class-specific expenses, is allocated daily to each class of shares based upon the ratio of the value of each class’s paid shares to the total value of all paid shares. Each class of shares differs in its distribution plan and certain other class-specific expenses.
The following is a summary of significant accounting policies of the Fund. The policies are in conformity with accounting principles generally accepted in the United States of America (U.S. GAAP). The Fund is an investment company and follows accounting and reporting guidance in the Financial Accounting Standards Board (FASB) Accounting Standards Codification Topic 946.
A Investment Valuation—The following methodologies are used to determine the market value or fair value of investments.
Debt Obligations. Debt obligations are generally valued on the basis of valuations provided by third party pricing services, as derived from such services’ pricing models. Inputs to the models may include, but are not limited to, reported trades, executable bid and ask prices, broker/dealer quotations, prices or yields of securities with similar characteristics, interest rates, anticipated prepayments, benchmark curves or information pertaining to the issuer, as well as industry and economic events. The pricing services may use a matrix approach, which considers information regarding securities with similar characteristics to determine the valuation for a security. Short-term debt obligations purchased with a remaining maturity of sixty days or less for which a valuation from a third party pricing service is not readily available may be valued at amortized cost, which approximates fair value.
Senior Floating-Rate Loans. Interests in senior floating-rate loans (Senior Loans) are valued generally at the average mean of bid and ask quotations obtained from a third party pricing service. Senior Loans, for which a valuation is not available or deemed unreliable, are fair valued by the investment adviser utilizing one or more of the valuation techniques described below to assess the likelihood that the borrower will make a full repayment of the loan underlying such Senior Loan. If the investment adviser believes that there is a reasonable likelihood of full repayment, the investment adviser will determine fair value using a matrix pricing approach that considers the yield on the Senior Loan relative to yields on other Senior Loans issued by companies of comparable credit quality. If the investment adviser believes there is not a reasonable likelihood of full repayment, the investment adviser will determine fair value using analyses that include, but are not limited to: (i) a comparison of the value of the borrower's outstanding equity and debt to that of comparable public companies; (ii) a discounted cash flow analysis; or (iii) when the investment adviser believes it is likely that a borrower will be liquidated or sold, an analysis of the terms of such liquidation or sale. In certain cases, the investment adviser will use a combination of analytical methods to determine fair value, such as when only a portion of a borrower's assets are likely to be sold. In conducting its assessment and analyses for purposes of determining fair value of a Senior Loan, the investment adviser will use its discretion and judgment in considering and appraising relevant factors. Junior Loans (i.e., subordinated loans and second lien loans) are valued in the same manner as Senior Loans.
Equity Securities. Equity securities listed on a U.S. securities exchange generally are valued at the last sale or closing price on the day of valuation or, if no sales took place on such date, at the mean between the closing bid and ask prices on the exchange where such securities are principally traded. Equity securities listed on the NASDAQ National Market System are valued at the NASDAQ official closing price. Unlisted or listed securities for which closing sales prices or closing quotations are not available are valued at the mean between the latest available bid and ask prices or, in the case of preferred equity securities that are not listed or traded in the over-the-counter market, by a third party pricing service that uses various techniques that consider factors including, but not limited to, prices or yields of securities with similar characteristics, benchmark yields, broker/dealer quotes, quotes of underlying common stock, issuer spreads, as well as industry and economic events.
Derivatives. Forward foreign currency exchange contracts are generally valued at the mean of the average bid and average ask prices that are reported by currency dealers to a third party pricing service at the valuation time. Such third party pricing service valuations are supplied for specific settlement periods and the Fund’s forward foreign currency exchange contracts are valued at an interpolated rate between the closest preceding and subsequent settlement period reported by the third party pricing service.
Foreign Securities and Currencies. Foreign securities and currencies are valued in U.S. dollars, based on foreign currency exchange rate quotations supplied by a third party pricing service. The pricing service uses a proprietary model to determine the exchange rate. Inputs to the model include reported trades and implied bid/ask spreads.
Other. Investments in management investment companies (including money market funds) that do not trade on an exchange are valued at the net asset value as of the close of each business day.
Fair Valuation. In connection with Rule 2a-5 of the 1940 Act, the Trustees have designated the Fund’s investment adviser as its valuation designee. Investments for which valuations or market quotations are not readily available or are deemed unreliable are valued by the investment adviser, as valuation designee, at fair value using methods that most fairly reflect the security’s “fair value”, which is the amount that the Fund might reasonably expect to receive for the security upon its current sale in the ordinary course. Each such determination is based on a consideration of relevant factors, which are
Eaton Vance
Short Duration High Income Fund
April 30, 2024
Notes to Financial Statements (Unaudited) — continued
likely to vary from one pricing context to another. These factors may include, but are not limited to, the type of security, the existence of any contractual restrictions on the security’s disposition, the price and extent of public trading in similar securities of the issuer or of comparable companies or entities, quotations or relevant information obtained from broker/dealers or other market participants, information obtained from the issuer, analysts, and/or the appropriate stock exchange (for exchange-traded securities), an analysis of the company’s or entity’s financial statements, and an evaluation of the forces that influence the issuer and the market(s) in which the security is purchased and sold.
B Investment Transactions—Investment transactions for financial statement purposes are accounted for on a trade date basis. Realized gains and losses on investments sold are determined on the basis of identified cost.
C Income—Interest income is recorded on the basis of interest accrued, adjusted for amortization of premium or accretion of discount. Fees associated with loan amendments are recognized immediately. Dividend income is recorded on the ex-dividend date for dividends received in cash and/or securities. Distributions from investment companies are recorded as dividend income, capital gains or return of capital based on the nature of the distribution.
D Federal Taxes—The Fund’s policy is to comply with the provisions of the Internal Revenue Code applicable to regulated investment companies and to distribute to shareholders each year substantially all of its net investment income, and all or substantially all of its net realized capital gains. Accordingly, no provision for federal income or excise tax is necessary.
As of April 30, 2024, the Fund had no uncertain tax positions that would require financial statement recognition, de-recognition, or disclosure. The Fund files a U.S. federal income tax return annually after its fiscal year-end, which is subject to examination by the Internal Revenue Service for a period of three years from the date of filing.
E Expenses—The majority of expenses of the Trust are directly identifiable to an individual fund. Expenses which are not readily identifiable to a specific fund are allocated taking into consideration, among other things, the nature and type of expense and the relative size of the funds.
F Foreign Currency Translation—Investment valuations, other assets, and liabilities initially expressed in foreign currencies are translated each business day into U.S. dollars based upon current exchange rates. Purchases and sales of foreign investment securities and income and expenses denominated in foreign currencies are translated into U.S. dollars based upon currency exchange rates in effect on the respective dates of such transactions. Recognized gains or losses on investment transactions attributable to changes in foreign currency exchange rates are recorded for financial statement purposes as net realized gains and losses on investments. That portion of unrealized gains and losses on investments that results from fluctuations in foreign currency exchange rates is not separately disclosed.
G Unfunded Loan Commitments—The Fund may enter into certain loan agreements all or a portion of which may be unfunded. The Fund is obligated to fund these commitments at the borrower's discretion. These commitments are disclosed in the accompanying Portfolio of Investments. At April 30, 2024, the Fund had sufficient cash and/or securities to cover these commitments.
H Use of Estimates—The preparation of the financial statements in conformity with U.S. GAAP requires management to make estimates and assumptions that affect the reported amounts of assets and liabilities at the date of the financial statements and the reported amounts of income and expense during the reporting period. Actual results could differ from those estimates.
I Indemnifications—Under the Trust’s organizational documents, its officers and Trustees may be indemnified against certain liabilities and expenses arising out of the performance of their duties to the Fund. Under Massachusetts law, if certain conditions prevail, shareholders of a Massachusetts business trust (such as the Trust) could be deemed to have personal liability for the obligations of the Trust. However, the Trust’s Declaration of Trust contains an express disclaimer of liability on the part of Fund shareholders and the By-laws provide that the Trust shall assume, upon request by the shareholder, the defense on behalf of any Fund shareholders. Moreover, the By-laws also provide for indemnification out of Fund property of any shareholder held personally liable solely by reason of being or having been a shareholder for all loss or expense arising from such liability. Additionally, in the normal course of business, the Fund enters into agreements with service providers that may contain indemnification clauses. The Fund's maximum exposure under these arrangements is unknown as this would involve future claims that may be made against the Fund that have not yet occurred.
J Forward Foreign Currency Exchange Contracts—The Fund may enter into forward foreign currency exchange contracts for the purchase or sale of a specific foreign currency at a fixed price on a future date. The forward foreign currency exchange contracts are adjusted by the daily exchange rate of the underlying currency and any gains or losses are recorded as unrealized until such time as the contracts have been closed. Risks may arise upon entering these contracts from the potential inability of counterparties to meet the terms of their contracts and from movements in the value of a foreign currency relative to the U.S. dollar.
K When-Issued Securities and Delayed Delivery Transactions—The Fund may purchase securities on a delayed delivery or when-issued basis. Payment and delivery may take place after the customary settlement period for that security. At the time the transaction is negotiated, the price of the security that will be delivered is fixed. The Fund maintains cash and/or security positions for these commitments such that sufficient liquid assets will be available to make payments upon settlement. Securities purchased on a delayed delivery or when-issued basis are marked-to-market daily and begin earning interest on settlement date. Such security purchases are subject to the risk that when delivered they will be worth less than the agreed upon payment price. Losses may also arise if the counterparty does not perform under the contract.
Eaton Vance
Short Duration High Income Fund
April 30, 2024
Notes to Financial Statements (Unaudited) — continued
L Interim Financial Statements—The interim financial statements relating to April 30, 2024 and for the six months then ended have not been audited by an independent registered public accounting firm, but in the opinion of the Fund’s management, reflect all adjustments, consisting only of normal recurring adjustments, necessary for the fair presentation of the financial statements.
2 Distributions to Shareholders and Income Tax Information
The Fund declares dividends daily to shareholders of record at the time of declaration. Distributions are generally paid monthly. Distributions of realized capital gains are made at least annually. Distributions are declared separately for each class of shares. Shareholders may reinvest income and capital gain distributions in additional shares of the same class of the Fund at the net asset value as of the reinvestment date or, at the election of the shareholder, receive distributions in cash. Distributions to shareholders are determined in accordance with income tax regulations, which may differ from U.S. GAAP. As required by U.S. GAAP, only distributions in excess of tax basis earnings and profits are reported in the financial statements as a return of capital. Permanent differences between book and tax accounting relating to distributions are reclassified to paid-in capital. For tax purposes, distributions from short-term capital gains are considered to be from ordinary income.
At October 31, 2023, the Fund, for federal income tax purposes, had deferred capital losses of $4,306,245 which would reduce its taxable income arising from future net realized gains on investment transactions, if any, to the extent permitted by the Internal Revenue Code, and thus would reduce the amount of distributions to shareholders, which would otherwise be necessary to relieve the Fund of any liability for federal income or excise tax. The deferred capital losses are treated as arising on the first day of the Fund’s next taxable year and retain the same short-term or long-term character as when originally deferred. Of the deferred capital losses at October 31, 2023, $2,169,815 are short-term and $2,136,430 are long-term.
The cost and unrealized appreciation (depreciation) of investments, including open derivative contracts, of the Fund at April 30, 2024, as determined on a federal income tax basis, were as follows:
| Aggregate cost | $86,978,684 |
| Gross unrealized appreciation | $ 665,045 |
| Gross unrealized depreciation | (930,385) |
| Net unrealized depreciation | $ (265,340) |
3 Investment Adviser and Administration Fee and Other Transactions with Affiliates
The investment adviser and administration fee is earned by Eaton Vance Management (EVM), an indirect, wholly-owned subsidiary of Morgan Stanley, as compensation for investment advisory and administrative services rendered to the Fund. The investment adviser and administration fee is computed at an annual rate as a percentage of the Fund’s average daily net assets as follows and is payable monthly:
| Average Daily Net Assets | Annual Fee Rate |
| Up to $1 billion | 0.550% |
| $1 billion but less than $2.5 billion | 0.525% |
| $2.5 billion but less than $5 billion | 0.505% |
| $5 billion and over | 0.490% |
For the six months ended April 30, 2024, the Fund's investment adviser and administration fee amounted to $226,888 or 0.55% (annualized) of the Fund’s average daily net assets. The Fund may invest in a money market fund, the Institutional Class of the Morgan Stanley Institutional Liquidity Funds - Government Portfolio (the "Liquidity Fund"), an open-end management investment company managed by Morgan Stanley Investment Management Inc., a wholly-owned subsidiary of Morgan Stanley. The investment adviser and administration fee paid by the Fund is reduced by an amount equal to its pro rata share of the advisory and administration fees paid by the Fund due to its investment in the Liquidity Fund. For the six months ended April 30, 2024, the investment adviser and administration fee paid was reduced by $3,194 relating to the Fund's investment in the Liquidity Fund.
EVM has agreed to reimburse the Fund’s expenses to the extent that total annual operating expenses (relating to ordinary operating expenses only and excluding such expenses as brokerage commissions, acquired fund fees and expenses of unaffiliated funds, borrowing costs, taxes or litigation expenses) exceed 0.90% and 0.65% of the Fund’s average daily net assets for Class A and Class I, respectively. This agreement may be changed or terminated after March 1, 2025. Pursuant to this agreement, EVM was allocated $95,414 of the Fund’s operating expenses for the six months ended April 30, 2024.
Eaton Vance
Short Duration High Income Fund
April 30, 2024
Notes to Financial Statements (Unaudited) — continued
EVM provides sub-transfer agency and related services to the Fund pursuant to a Sub-Transfer Agency Support Services Agreement. For the six months ended April 30, 2024, EVM earned $1,152 from the Fund pursuant to such agreement, which is included in transfer and dividend disbursing agent fees on the Statement of Operations. The Fund was informed that Eaton Vance Distributors, Inc. (EVD), an affiliate of EVM and the Fund's principal underwriter, received $2,109 as its portion of the sales charge on sales of Class A shares and no CDSCs paid by Class A shareholders for the six months ended April 30, 2024. EVD also received distribution and service fees from Class A shares (see Note 4).
Trustees and officers of the Fund who are members of EVM’s organization receive remuneration for their services to the Fund out of the investment adviser and administration fee. Trustees of the Fund who are not affiliated with EVM may elect to defer receipt of all or a percentage of their annual fees in accordance with the terms of the Trustees Deferred Compensation Plan. Certain officers and Trustees of the Fund are officers of EVM.
4 Distribution Plan
The Fund has in effect a distribution plan for Class A shares (Class A Plan) pursuant to Rule 12b-1 under the 1940 Act. Pursuant to the Class A Plan, the Fund pays EVD a distribution and service fee of 0.25% per annum of its average daily net assets attributable to Class A shares for distribution services and facilities provided to the Fund by EVD, as well as for personal services and/or the maintenance of shareholder accounts. Distribution and service fees paid or accrued to EVD for the six months ended April 30, 2024 amounted to $12,938 for Class A shares.
Distribution and service fees are subject to the limitations contained in the Financial Industry Regulatory Authority Rule 2341(d).
5 Purchases and Sales of Investments
Purchases and sales of investments, other than short-term obligations and including maturities, paydowns and principal repayments on Senior Loans, aggregated $35,701,837 and $28,333,231, respectively, for the six months ended April 30, 2024.
6 Shares of Beneficial Interest
The Fund’s Declaration of Trust permits the Trustees to issue an unlimited number of full and fractional shares of beneficial interest (without par value). Such shares may be issued in a number of different series (such as the Fund) and classes. Transactions in Fund shares were as follows:
| | Six Months Ended
April 30, 2024
(Unaudited) | | Year Ended
October 31, 2023 |
| | Shares | Amount | | Shares | Amount |
| Class A | | | | | |
| Sales | 301,615 | $ 2,678,916 | | 831,920 | $ 7,311,993 |
| Issued to shareholders electing to receive payments of distributions in Fund shares | 36,597 | 325,200 | | 54,543 | 480,324 |
| Redemptions | (388,572) | (3,419,413) | | (312,285) | (2,752,091) |
| Net increase (decrease) | (50,360) | $ (415,297) | | 574,178 | $ 5,040,226 |
| Class I | | | | | |
| Sales | 2,531,246 | $ 22,488,967 | | 5,714,700 | $ 50,433,326 |
| Issued to shareholders electing to receive payments of distributions in Fund shares | 265,737 | 2,364,319 | | 464,178 | 4,094,270 |
| Redemptions | (1,964,980) | (17,471,126) | | (6,538,541) | (57,560,196) |
| Net increase (decrease) | 832,003 | $ 7,382,160 | | (359,663) | $ (3,032,600) |
Eaton Vance
Short Duration High Income Fund
April 30, 2024
Notes to Financial Statements (Unaudited) — continued
7 Restricted Securities
At April 30, 2024, the Fund owned the following security (representing less than 0.05% of net assets) which was restricted as to public resale and not registered under the Securities Act of 1933 (excluding Rule 144A securities). The value of restricted securities is determined based on valuations provided by brokers when available, or if not available, they are valued at fair value using methods determined in good faith by or at the direction of the Trustees’ valuation designee.
| Description | Date(s) of
Acquisition | Shares | Cost | Value |
| Common Stocks | | | | |
| Endo, Inc. | 4/23/24 | 38 | $ 485 | $ 1,088 |
| Total Restricted Securities | | | $485 | $1,088 |
8 Financial Instruments
The Fund may trade in financial instruments with off-balance sheet risk in the normal course of its investing activities. These financial instruments may include forward foreign currency exchange contracts and may involve, to a varying degree, elements of risk in excess of the amounts recognized for financial statement purposes. The notional or contractual amounts of these instruments represent the investment the Fund has in particular classes of financial instruments and do not necessarily represent the amounts potentially subject to risk. The measurement of the risks associated with these instruments is meaningful only when all related and offsetting transactions are considered. A summary of obligations under these financial instruments at April 30, 2024 is included in the Portfolio of Investments. At April 30, 2024, the Fund had sufficient cash and/or securities to cover commitments under these contracts.
The Fund is subject to foreign exchange risk in the normal course of pursuing its investment objective. Because the Fund holds foreign currency denominated investments, the value of these investments and related receivables and payables may change due to future changes in foreign currency exchange rates. To hedge against this risk, the Fund enters into forward foreign currency exchange contracts.
The Fund enters into forward foreign currency exchange contracts that may contain provisions whereby the counterparty may terminate the contract under certain conditions, including but not limited to a decline in the Fund’s net assets below a certain level over a certain period of time, which would trigger a payment by the Fund for those derivatives in a liability position. At April 30, 2023, the Fund had no open derivatives with credit-related contingent features in a net liability position.
The over-the-counter (OTC) derivatives in which the Fund invests are subject to the risk that the counterparty to the contract fails to perform its obligations under the contract. To mitigate this risk, the Fund has entered into an International Swaps and Derivatives Association, Inc. Master Agreement (“ISDA Master Agreement”) or similar agreement with substantially all its derivative counterparties. An ISDA Master Agreement is a bilateral agreement between the Fund and a counterparty that governs certain OTC derivatives and typically contains, among other things, set-off provisions in the event of a default and/or termination event as defined under the relevant ISDA Master Agreement. Under an ISDA Master Agreement, the Fund may, under certain circumstances, offset with the counterparty certain derivative financial instruments’ payables and/or receivables with collateral held and/or posted and create one single net payment. The provisions of the ISDA Master Agreement typically permit a single net payment in the event of default including the bankruptcy or insolvency of the counterparty. However, bankruptcy or insolvency laws of a particular jurisdiction may impose restrictions on or prohibitions against the right of offset in bankruptcy or insolvency. Certain ISDA Master Agreements allow counterparties to OTC derivatives to terminate derivative contracts prior to maturity in the event the Fund’s net assets decline by a stated percentage or the Fund fails to meet the terms of its ISDA Master Agreements, which would cause the counterparty to accelerate payment by the Fund of any net liability owed to it.
The collateral requirements for derivatives traded under an ISDA Master Agreement are governed by a Credit Support Annex to the ISDA Master Agreement. Collateral requirements are determined at the close of business each day and are typically based on changes in market values for each transaction under an ISDA Master Agreement and netted into one amount for such agreement. Generally, the amount of collateral due from or to a counterparty is subject to a minimum transfer threshold amount before a transfer is required, which may vary by counterparty. Collateral pledged for the benefit of the Fund and/or counterparty is held in segregated accounts by the Fund’s custodian and cannot be sold, re-pledged, assigned or otherwise used while pledged. The portion of such collateral representing cash, if any, is reflected as deposits for derivatives collateral and, in the case of cash pledged by a counterparty for the benefit of the Fund, a corresponding liability on the Statement of Assets and Liabilities. Securities pledged by the Fund as collateral, if any, are identified as such in the Portfolio of Investments.
Eaton Vance
Short Duration High Income Fund
April 30, 2024
Notes to Financial Statements (Unaudited) — continued
The fair value of open derivative instruments (not considered to be hedging instruments for accounting disclosure purposes) and whose primary underlying risk exposure is foreign exchange risk at April 30, 2024 was as follows:
| | Fair Value |
| Derivative | Asset Derivative | Liability Derivative |
| Forward foreign currency exchange contracts | $733 (1) | $ — |
| (1) | Statement of Assets and Liabilities location: Receivable for open forward foreign currency exchange contracts. |
The Fund's derivative assets at fair value by type, which are reported gross in the Statement of Assets and Liabilities, are presented in the table above. The following table presents the Fund's derivative assets by counterparty, net of amounts available for offset under a master netting agreement and net of the related collateral received by the Fund for such assets as of April 30, 2024.
| Counterparty | Derivative
Assets Subject to
Master Netting
Agreement | Derivatives
Available
for Offset | Non-cash
Collateral
Received(a) | Cash
Collateral
Received(a) | Net Amount
of Derivative
Assets(b) |
| Goldman Sachs International | $ 243 | $ — | $ — | $ — | $ 243 |
| State Street Bank and Trust Company | 490 | — | — | — | 490 |
| | $733 | $ — | $ — | $ — | $733 |
| (a) | In some instances, the total collateral received and/or pledged may be more than the amount shown due to overcollateralization. |
| (b) | Net amount represents the net amount due from the counterparty in the event of default. |
The effect of derivative instruments (not considered to be hedging instruments for accounting disclosure purposes) on the Statement of Operations and whose primary underlying risk exposure is foreign exchange risk for the six months ended April 30, 2024 was as follows:
| Derivative | Realized Gain (Loss)
on Derivatives Recognized
in Income(1) | Change in Unrealized
Appreciation (Depreciation) on
Derivatives Recognized in Income(2) |
| Forward foreign currency exchange contracts | $(2,093) | $615 |
| (1) | Statement of Operations location: Net realized gain (loss): Forward foreign currency exchange contracts. |
| (2) | Statement of Operations location: Change in unrealized appreciation (depreciation): Forward foreign currency exchange contracts. |
The average notional amount of forward foreign currency exchange contracts (based on the absolute value of notional amounts of currency purchased and currency sold) outstanding during the six months ended April 30, 2024, which is indicative of the volume of this derivative type, was approximately $998,000.
9 Line of Credit
The Fund participates with other portfolios and funds managed by EVM and its affiliates in a $650 million unsecured revolving line of credit agreement with a group of banks, which is in effect through October 22, 2024. Borrowings are made by the Fund solely for temporary purposes related to redemptions and other short-term cash needs. Interest is charged to the Fund based on its borrowings at an amount above either the Secured Overnight Financing Rate (SOFR) or Federal Funds rate. In addition, a fee computed at an annual rate of 0.15% on the daily unused portion of the line of credit is allocated among the participating portfolios and funds at the end of each quarter. In connection with the renewal of the agreement in October 2023, an arrangement fee of $150,000 was incurred that was allocated to the participating portfolios and funds. Because the line of credit is not available exclusively to the Fund, it may be unable to borrow some or all of its requested amounts at any particular time. The Fund did not have any significant borrowings or allocated fees during the six months ended April 30, 2024.
Eaton Vance
Short Duration High Income Fund
April 30, 2024
Notes to Financial Statements (Unaudited) — continued
10 Affiliated Investments
At April 30, 2024, the value of the Fund's investment in funds that may be deemed to be affiliated was $4,591,024, which represents 5.4% of the Fund's net assets. Transactions in such investments by the Fund for the six months ended April 30, 2024 were as follows:
| Name | Value,
beginning
of period | Purchases | Sales
proceeds | Net realized
gain (loss) | Change in
unrealized
appreciation
(depreciation) | Value, end
of period | Dividend
income | Shares,
end of period |
| Short-Term Investments |
| Liquidity Fund | $4,875,056 | $32,595,647 | $(32,879,679) | $ — | $ — | $4,591,024 | $109,061 | 4,591,024 |
11 Fair Value Measurements
Under generally accepted accounting principles for fair value measurements, a three-tier hierarchy to prioritize the assumptions, referred to as inputs, is used in valuation techniques to measure fair value. The three-tier hierarchy of inputs is summarized in the three broad levels listed below.
| • | Level 1 – quoted prices in active markets for identical investments |
| • | Level 2 – other significant observable inputs (including quoted prices for similar investments, interest rates, prepayment speeds, credit risk, etc.) |
| • | Level 3 – significant unobservable inputs (including a fund's own assumptions in determining the fair value of investments) |
In cases where the inputs used to measure fair value fall in different levels of the fair value hierarchy, the level disclosed is determined based on the lowest level input that is significant to the fair value measurement in its entirety. The inputs or methodology used for valuing securities are not necessarily an indication of the risk associated with investing in those securities.
At April 30, 2024, the hierarchy of inputs used in valuing the Fund's investments and open derivative instruments, which are carried at fair value, were as follows:
| Asset Description | Level 1 | Level 2 | Level 3* | Total |
| Common Stocks | $ — | $ 73,135 | $ — | $ 73,135 |
| Convertible Bonds | — | 1,764,624 | — | 1,764,624 |
| Corporate Bonds | — | 66,110,909 | — | 66,110,909 |
| Senior Floating-Rate Loans (Less Unfunded Loan Commitments) | — | 14,172,919 | — | 14,172,919 |
| Miscellaneous | — | — | 0 | 0 |
| Short-Term Investments | 4,591,024 | — | — | 4,591,024 |
| Total Investments | $ 4,591,024 | $ 82,121,587 | $ — | $86,712,611 |
| Forward Foreign Currency Exchange Contracts | $ — | $ 733 | $ — | $ 733 |
| Total | $ 4,591,024 | $ 82,122,320 | $ — | $86,713,344 |
| * | None of the unobservable inputs for Level 3 assets, individually or collectively, had a material impact on the Fund. |
Level 3 investments at the beginning and/or end of the period in relation to net assets were not significant and accordingly, a reconciliation of Level 3 assets for the six months ended April 30, 2024 is not presented.
12 Risks and Uncertainties
Credit Risk
The Fund primarily invests in lower rated and comparable quality unrated high yield securities. These investments have different risks than investments in debt securities rated investment grade. Risk of loss upon default by the borrower is significantly greater with respect to such debt than with other debt securities because these securities are generally unsecured and are more sensitive to adverse economic conditions, such as recession or increasing interest rates, than are investment grade issuers.
Eaton Vance
Short Duration High Income Fund
April 30, 2024
| Officers |
Kenneth A. Topping
President | Nicholas S. Di Lorenzo
Secretary |
Deidre E. Walsh
Vice President and Chief Legal Officer | Laura T. Donovan
Chief Compliance Officer |
James F. Kirchner
Treasurer | |
George J. Gorman
Chairperson | |
| Alan C. Bowser | |
| Mark R. Fetting | |
| Cynthia E. Frost | |
| Valerie A. Mosley | |
| Anchal Pachnanda* | |
| Keith Quinton | |
| Marcus L. Smith | |
| Susan J. Sutherland | |
| Scott E. Wennerholm | |
| Nancy A. Wiser | |
| U.S. Customer Privacy Notice | March 2024 |
| FACTS | WHAT DOES EATON VANCE DO WITH YOUR PERSONAL INFORMATION? |
| Why? | Financial companies choose how they share your personal information. Federal law gives consumers the right to limit some but not all sharing. Federal law also requires us to tell you how we collect, share, and protect your personal information. Please read this notice carefully to understand what we do. |
| |
| What? | The types of personal information we collect and share depend on the product or service you have with us. This information can include:■ Social Security number and income
■ investment experience and risk tolerance
■ checking account information and wire transfer instructions |
| |
| How? | All financial companies need to share customers’ personal information to run their everyday business. In the section below, we list the reasons financial companies can share their customers’ personal information; the reasons Eaton Vance chooses to share; and whether you can limit this sharing. |
| Reasons we can share your personal information | Does Eaton Vance
share? | Can you limit
this sharing? |
| For our everyday business purposes — such as to process your transactions, maintain your account(s), respond to court orders and legal investigations, or report to credit bureaus | Yes | No |
| For our marketing purposes — to offer our products and services to you | Yes | No |
| For joint marketing with other financial companies | No | We don’t share |
| For our affiliates’ everyday business purposes — information about your transactions and experiences | Yes | No* |
| For our affiliates’ everyday business purposes — information about your creditworthiness | Yes | Yes* |
| For our affiliates to market to you | Yes | Yes* |
| For nonaffiliates to market to you | No | We don’t share |
To limit our
sharing | Call toll-free 1-800-262-1122 or email: EVPrivacy@eatonvance.comPlease note:If you are a new customer, we can begin sharing your information 30 days from the date we sent this notice. When you are no longer our customer, we continue to share your information as described in this notice. However, you can contact us at any time to limit our sharing. |
| Questions? | Call toll-free 1-800-262-1122 or email: EVPrivacy@eatonvance.com |
| U.S. Customer Privacy Notice — continued | March 2024 |
| Who we are |
| Who is providing this notice? | Eaton Vance Management and our investment management affiliates (“Eaton Vance”) (see Affiliates definition below.) |
| What we do |
How does Eaton Vance
protect my personal
information? | To protect your personal information from unauthorized access and use, we use security measures that comply with federal law. These measures include computer safeguards and secured files and buildings. We have policies governing the proper handling of customer information by personnel and requiring third parties that provide support to adhere to appropriate security standards with respect to such information. |
How does Eaton Vance
collect my personal
information? | We collect your personal information, for example, when you■ open an account or make deposits or withdrawals from your account
■ buy securities from us or make a wire transfer
■ give us your contact informationWe also collect your personal information from others, such as credit bureaus, affiliates, or other companies. |
| Why can’t I limit all sharing? | Federal law gives you the right to limit only■ sharing for affiliates’ everyday business purposes — information about your creditworthiness
■ affiliates from using your information to market to you
■ sharing for nonaffiliates to market to youState laws and individual companies may give you additional rights to limit sharing. (See below for more on your rights under state law.) |
What happens when I limit
sharing for an account I hold
jointly with someone else? | Your choices will apply to everyone on your account. |
| Definitions |
| Affiliates | Companies related by common ownership or control. They can be financial and nonfinancial companies.■ Our affiliates include registered investment advisers such as Eaton Vance Management, Eaton Vance Advisers International Ltd., Boston Management and Research, Calvert Research and Management, Parametric Portfolio Associates LLC, Atlanta Capital Management Company LLC, Morgan Stanley Investment Management Inc., Morgan Stanley Investment Management Co.; registered broker-dealers such as Morgan Stanley Distributors Inc. and Eaton Vance Distributors, Inc. (together, the “Investment Management Affiliates”); and companies with a Morgan Stanley name and financial companies such as Morgan Stanley Smith Barney LLC and Morgan Stanley & Co. (the “Morgan Stanley Affiliates”). |
| Nonaffiliates | Companies not related by common ownership or control. They can be financial and nonfinancial companies.■ Eaton Vance does not share with nonaffiliates so they can market to you. |
| Joint marketing | A formal agreement between nonaffiliated financial companies that together market financial products or services to you.■ Eaton Vance does not jointly market. |
| U.S. Customer Privacy Notice — continued | March 2024 |
| Other important information |
| *PLEASE NOTE: Eaton Vance does not share your creditworthiness information or your transactions and experiences information with the Morgan Stanley Affiliates, nor does Eaton Vance enable the Morgan Stanley Affiliates to market to you. Your opt outs will prevent Eaton Vance from sharing your creditworthiness information with the Investment Management Affiliates and will prevent the Investment Management Affiliates from marketing their products to you.Vermont: Except as permitted by law, we will not share personal information we collect about Vermont residents with Nonaffiliates unless you provide us with your written consent to share such information.California: Except as permitted by law, we will not share personal information we collect about California residents with Nonaffiliates and we will limit sharing such personal information with our Affiliates to comply with California privacy laws that apply to us. |
Delivery of Shareholder Documents. The Securities and Exchange Commission (SEC) permits funds to deliver only one copy of shareholder documents, including prospectuses, proxy statements and shareholder reports, to fund investors with multiple accounts at the same residential or post office box address. This practice is often called “householding” and it helps eliminate duplicate mailings to shareholders. Eaton Vance, or your financial intermediary, may household the mailing of your documents indefinitely unless you instruct Eaton Vance, or your financial intermediary, otherwise. If you would prefer that your Eaton Vance documents not be householded, please contact Eaton Vance at 1-800-262-1122, or contact your financial intermediary. Your instructions that householding not apply to delivery of your Eaton Vance documents will typically be effective within 30 days of receipt by Eaton Vance or your financial intermediary.
Portfolio Holdings. Each Eaton Vance Fund and its underlying Portfolio(s) (if applicable) files a schedule of portfolio holdings on Part F to Form N-PORT with the SEC. Certain information filed on Form N-PORT may be viewed on the Eaton Vance website at www.eatonvance.com, by calling Eaton Vance at 1-800-262-1122 or in the EDGAR database on the SEC’s website at www.sec.gov.
Proxy Voting. From time to time, funds are required to vote proxies related to the securities held by the funds. The Eaton Vance Funds or their underlying Portfolios (if applicable) vote proxies according to a set of policies and procedures approved by the Funds’ and Portfolios’ Boards. You may obtain a description of these policies and procedures and information on how the Funds or Portfolios voted proxies relating to portfolio securities during the most recent 12-month period ended June 30, without charge, upon request, by calling 1-800-262-1122 and by accessing the SEC’s website at www.sec.gov.
Tailored Shareholder Reports. Effective January 24, 2023, the SEC adopted rule and form amendments to require open-end mutual funds and ETFs to transmit concise and visually engaging streamlined annual and semi-annual reports to shareholders that highlight key information. Other information, including financial statements, will no longer appear in a streamlined shareholder report but must be available online, delivered free of charge upon request, and filed on a semi-annual basis on Form N-CSR. The rule and form amendments have a compliance date of July 24, 2024. At this time, management is evaluating the impact of these amendments on the shareholder reports for the Eaton Vance Funds.
This Page Intentionally Left Blank
This Page Intentionally Left Blank
This Page Intentionally Left Blank
Investment Adviser and Administrator
Eaton Vance Management
One Post Office Square
Boston, MA 02109
Principal Underwriter*
Eaton Vance Distributors, Inc.
One Post Office Square
Boston, MA 02109
(617) 482-8260
Custodian
State Street Bank and Trust Company
One Congress Street, Suite 1
Boston, MA 02114-2016
Transfer Agent
BNY Mellon Investment Servicing (US) Inc.
Attn: Eaton Vance Funds
P.O. Box 534439
Pittsburgh, PA 15253-4439
(800) 262-1122
Fund Offices
One Post Office Square
Boston, MA 02109
* FINRA BrokerCheck. Investors may check the background of their Investment Professional by contacting the Financial Industry Regulatory Authority (FINRA). FINRA BrokerCheck is a free tool to help investors check the professional background of current and former FINRA-registered securities firms and brokers. FINRA BrokerCheck is available by calling 1-800-289-9999 and at www.FINRA.org. The FINRA BrokerCheck brochure describing this program is available to investors at www.FINRA.org.
Eaton Vance
Emerging and Frontier Countries Equity Fund
Semi-Annual Report
April 30, 2024
Commodity Futures Trading Commission Registration. The Commodity Futures Trading Commission (“CFTC”) has adopted regulations that subject registered investment companies and advisers to regulation by the CFTC if a fund invests more than a prescribed level of its assets in certain CFTC-regulated instruments (including futures, certain options and swap agreements) or markets itself as providing investment exposure to such instruments. The investment adviser has claimed an exclusion from the definition of “commodity pool operator” under the Commodity Exchange Act with respect to its management of the Fund. Accordingly, neither the Fund nor the adviser with respect to the operation of the Fund is subject to CFTC regulation. Because of its management of other strategies, the Fund's adviser is registered with the CFTC as a commodity pool operator. The adviser is also registered as a commodity trading advisor.
Fund shares are not insured by the FDIC and are not deposits or other obligations of, or guaranteed by, any depository institution. Shares are subject to investment risks, including possible loss of principal invested.
This report must be preceded or accompanied by a current summary prospectus or prospectus. Before investing, investors should consider carefully the investment objective, risks, and charges and expenses of a mutual fund. This and other important information is contained in the summary prospectus and prospectus, which can be obtained from a financial intermediary. Prospective investors should read the prospectus carefully before investing. For further information, please call 1-800-262-1122.
Semi-Annual Report April 30, 2024
Eaton Vance
Emerging and Frontier Countries Equity Fund
Eaton Vance
Emerging and Frontier Countries Equity Fund
April 30, 2024
Performance
Portfolio Manager(s) Federico Sequeda, CFA, Sahil Tandon, CFA and Steven Vanne, CFA
| % Average Annual Total Returns1,2 | Class
Inception Date | Performance
Inception Date | Six Months | One Year | Five Years | Ten Years |
| Class A at NAV | 11/03/2014 | 11/01/2013 | 21.50% | 22.03% | 8.71% | 5.14% |
| Class A with 5.25% Maximum Sales Charge | — | — | 15.11 | 15.59 | 7.55 | 4.52 |
| Class I at NAV | 11/03/2014 | 11/01/2013 | 21.69 | 22.43 | 8.99 | 5.39 |
|
| MSCI Emerging Markets Equal Country Weighted Index | — | — | 14.08% | 11.34% | 3.23% | 1.60% |
| MSCI Frontier Markets Index | — | — | 12.71 | 10.00 | 2.36 | 0.92 |
| Blended Index | — | — | 13.44 | 10.76 | 3.00 | 1.42 |
| % Total Annual Operating Expense Ratios3 | Class A | Class I |
| Gross | 1.55% | 1.30% |
| Net | 1.40 | 1.15 |
See Endnotes and Additional Disclosures in this report.
Past performance is no guarantee of future results. Returns are historical and are calculated by determining the percentage change in net asset value (NAV) or offering price (as applicable) with all distributions reinvested. Furthermore, returns do not reflect the deduction of taxes that shareholders may have to pay on Fund distributions or upon the redemption of Fund shares. Investment return and principal value will fluctuate so that shares, when redeemed, may be worth more or less than their original cost. Performance for periods less than or equal to one year is cumulative. Performance is for the stated time period only; due to market volatility, current Fund performance may be lower or higher than the quoted return. For performance as of the most recent month-end, please refer to eatonvance.com.
Eaton Vance
Emerging and Frontier Countries Equity Fund
April 30, 2024
| Sector Allocation (% of net assets)1,2 |
| Country Allocation (% of net assets)1 |
Fund invests in an affiliated investment company (Portfolio) with the same objective(s) and policies as the Fund. References to investments are to the Portfolio’s holdings.
Footnotes:
| * | Amount is less than 0.05%. |
| 1 | Depiction does not reflect the Fund’s derivatives positions. |
| 2 | Excludes cash and cash equivalents. |
Eaton Vance
Emerging and Frontier Countries Equity Fund
April 30, 2024
Endnotes and Additional Disclosures
| 1 | MSCI Emerging Markets Equal Country Weighted Index is an unmanaged index of emerging markets common stock where each country within the index has the same weight. MSCI Frontier Markets Index is an unmanaged index that measures the performance of stock markets with less-developed economies and financial markets than emerging markets, and that typically have more restrictions on foreign stock ownership. MSCI indexes are net of foreign withholding taxes. Source: MSCI. MSCI data may not be reproduced or used for any other purpose. MSCI provides no warranties, has not prepared or approved this report, and has no liability hereunder. The Blended Index consists of 50% MSCI Emerging Markets Equal Country Weighted Index and 50% MSCI Frontier Markets Index, rebalanced monthly. Unless otherwise stated, index returns do not reflect the effect of any applicable sales charges, commissions, expenses, taxes or leverage, as applicable. It is not possible to invest directly in an index. |
| 2 | Total Returns at NAV do not include applicable sales charges. If sales charges were deducted, the returns would be lower. Total Returns shown with maximum sales charge reflect the stated maximum sales charge. Unless otherwise stated, performance does not reflect the deduction of taxes on Fund distributions or redemptions of Fund shares.Performance prior to the inception date of Class A and Class I is linked to the performance of Global Macro Capital Opportunities Portfolio (the Portfolio) in which the Fund invests. This linked performance is adjusted for any applicable sales charge, but is not adjusted for class expense differences. If adjusted for such differences, the performance would be different. Performance presented in the Financial Highlights included in the financial statements is not linked. |
| 3 | Source: Fund prospectus. Net expense ratios reflect a contractual expense reimbursement that continues through 3/1/25. The expense ratios for the current reporting period can be found in the Financial Highlights section of this report. Performance reflects expenses waived and/or reimbursed, if applicable. Without such waivers and/or reimbursements, performance would have been lower. |
| | Fund profile subject to change due to active management. |
Eaton Vance
Emerging and Frontier Countries Equity Fund
April 30, 2024
Example
As a Fund shareholder, you incur two types of costs: (1) transaction costs, including sales charges (loads) on purchases; and (2) ongoing costs, including management fees; distribution and/or service fees; and other Fund expenses. This Example is intended to help you understand your ongoing costs (in dollars) of Fund investing and to compare these costs with the ongoing costs of investing in other mutual funds. The Example is based on an investment of $1,000 invested at the beginning of the period and held for the entire period (November 1, 2023 to April 30, 2024).
Actual Expenses
The first section of the table below provides information about actual account values and actual expenses. You may use the information in this section, together with the amount you invested, to estimate the expenses that you paid over the period. Simply divide your account value by $1,000 (for example, an $8,600 account value divided by $1,000 = 8.6), then multiply the result by the number in the first section under the heading entitled “Expenses Paid During Period” to estimate the expenses you paid on your account during this period.
Hypothetical Example for Comparison Purposes
The second section of the table below provides information about hypothetical account values and hypothetical expenses based on the actual Fund expense ratio and an assumed rate of return of 5% per year (before expenses), which is not the actual Fund return. The hypothetical account values and expenses may not be used to estimate the actual ending account balance or expenses you paid for the period. You may use this information to compare the ongoing costs of investing in your Fund and other funds. To do so, compare this 5% hypothetical example with the 5% hypothetical examples that appear in the shareholder reports of the other funds.
Please note that the expenses shown in the table are meant to highlight your ongoing costs only and do not reflect any transactional costs, such as sales charges (loads). Therefore, the second section of the table is useful in comparing ongoing costs only, and will not help you determine the relative total costs of owning different funds. In addition, if these transactional costs were included, your costs would be higher.
| | Beginning
Account Value
(11/1/23) | Ending
Account Value
(4/30/24) | Expenses Paid
During Period*
(11/1/23 – 4/30/24) | Annualized
Expense
Ratio |
| Actual | | | | |
| Class A | $1,000.00 | $1,215.00 | $7.71** | 1.40% |
| Class I | $1,000.00 | $1,216.90 | $6.34** | 1.15% |
| |
| Hypothetical | | | | |
| (5% return per year before expenses) | | | | |
| Class A | $1,000.00 | $1,017.90 | $7.02** | 1.40% |
| Class I | $1,000.00 | $1,019.15 | $5.77** | 1.15% |
| * | Expenses are equal to the Fund's annualized expense ratio for the indicated Class, multiplied by the average account value over the period, multiplied by 182/366 (to reflect the one-half year period). The Example assumes that the $1,000 was invested at the net asset value per share determined at the close of business on October 31, 2023. The Example reflects the expenses of both the Fund and the Portfolio. |
| ** | Absent an allocation of certain expenses to affiliate(s), expenses would be higher. |
Eaton Vance
Emerging and Frontier Countries Equity Fund
April 30, 2024
Statement of Assets and Liabilities (Unaudited)
| | April 30, 2024 |
| Assets | |
| Investment in Global Macro Capital Opportunities Portfolio, at value (identified cost $714,863,600) | $ 844,392,096 |
| Receivable for Fund shares sold | 2,718,931 |
| Receivable from affiliates | 192,747 |
| Total assets | $847,303,774 |
| Liabilities | |
| Payable for Fund shares redeemed | $ 1,173,632 |
| Payable to affiliates: | |
| Distribution and service fees | 2,648 |
| Trustees' fees | 42 |
| Accrued expenses | 144,417 |
| Total liabilities | $ 1,320,739 |
| Net Assets | $845,983,035 |
| Sources of Net Assets | |
| Paid-in capital | $ 735,815,277 |
| Distributable earnings | 110,167,758 |
| Net Assets | $845,983,035 |
| Class A Shares | |
| Net Assets | $ 12,938,873 |
| Shares Outstanding | 939,967 |
Net Asset Value and Redemption Price Per Share
(net assets ÷ shares of beneficial interest outstanding) | $ 13.77 |
Maximum Offering Price Per Share
(100 ÷ 94.75 of net asset value per share) | $ 14.53 |
| Class I Shares | |
| Net Assets | $ 833,044,162 |
| Shares Outstanding | 60,051,890 |
Net Asset Value, Offering Price and Redemption Price Per Share
(net assets ÷ shares of beneficial interest outstanding) | $ 13.87 |
| On sales of $50,000 or more, the offering price of Class A shares is reduced. |
6
See Notes to Financial Statements.
Eaton Vance
Emerging and Frontier Countries Equity Fund
April 30, 2024
Statement of Operations (Unaudited)
| | Six Months Ended |
| | April 30, 2024 |
| Investment Income | |
| Dividend income allocated from Portfolio (net of foreign taxes withheld of $840,820) | $ 8,770,956 |
| Interest income allocated from Portfolio (net of foreign taxes withheld of $17) | 1,243,829 |
| Expenses allocated from Portfolio | (3,420,647) |
| Total investment income from Portfolio | $ 6,594,138 |
| Expenses | |
| Distribution and service fees: | |
| Class A | $ 11,756 |
| Trustees’ fees and expenses | 250 |
| Custodian fee | 22,358 |
| Transfer and dividend disbursing agent fees | 249,128 |
| Legal and accounting services | 34,998 |
| Printing and postage | 31,902 |
| Registration fees | 56,722 |
| Miscellaneous | 7,474 |
| Total expenses | $ 414,588 |
| Deduct: | |
| Waiver and/or reimbursement of expenses by affiliates | $ 281,535 |
| Total expense reductions | $ 281,535 |
| Net expenses | $ 133,053 |
| Net investment income | $ 6,461,085 |
| Realized and Unrealized Gain (Loss) from Portfolio | |
| Net realized gain (loss): | |
| Investment transactions (net of foreign capital gains taxes of $66,597) | $ (3,721,579) |
| Written options | (2,267,360) |
| Futures contracts | (565,960) |
| Swap contracts | 2,846,921 |
| Foreign currency transactions | 46,618 |
| Forward foreign currency exchange contracts | 1,172,721 |
| Net realized loss | $ (2,488,639) |
| Change in unrealized appreciation (depreciation): | |
| Investments (including net increase in accrued foreign capital gains taxes of $1,231,985) | $ 96,445,854 |
| Futures contracts | 729,768 |
| Swap contracts | 2,994,334 |
| Foreign currency | (16,794) |
| Forward foreign currency exchange contracts | 673,366 |
| Net change in unrealized appreciation (depreciation) | $100,826,528 |
| Net realized and unrealized gain | $ 98,337,889 |
| Net increase in net assets from operations | $104,798,974 |
7
See Notes to Financial Statements.
Eaton Vance
Emerging and Frontier Countries Equity Fund
April 30, 2024
Statements of Changes in Net Assets
| | Six Months Ended
April 30, 2024
(Unaudited) | Year Ended
October 31, 2023 |
| Increase (Decrease) in Net Assets | | |
| From operations: | | |
| Net investment income | $ 6,461,085 | $ 5,885,371 |
| Net realized loss | (2,488,639) | (7,880,398) |
| Net change in unrealized appreciation (depreciation) | 100,826,528 | 22,518,567 |
| Net increase in net assets from operations | $104,798,974 | $ 20,523,540 |
| Distributions to shareholders: | | |
| Class A | $ (144,267) | $ (150,490) |
| Class I | (10,304,320) | (10,163,031) |
| Total distributions to shareholders | $ (10,448,587) | $ (10,313,521) |
| Transactions in shares of beneficial interest: | | |
| Class A | $ 5,231,151 | $ 3,802,805 |
| Class I | 366,562,322 | 182,063,035 |
| Net increase in net assets from Fund share transactions | $371,793,473 | $185,865,840 |
| Net increase in net assets | $466,143,860 | $196,075,859 |
| Net Assets | | |
| At beginning of period | $ 379,839,175 | $ 183,763,316 |
| At end of period | $845,983,035 | $379,839,175 |
8
See Notes to Financial Statements.
Eaton Vance
Emerging and Frontier Countries Equity Fund
April 30, 2024
| | Class A |
| | Six Months Ended
April 30, 2024
(Unaudited) | Year Ended October 31, |
| | 2023 | 2022 | 2021 | 2020 | 2019 |
| Net asset value — Beginning of period | $ 11.530 | $ 10.510 | $ 12.990 | $ 9.610 | $10.100 | $ 9.700 |
| Income (Loss) From Operations | | | | | | |
| Net investment income(1) | $ 0.126 | $ 0.262 | $ 0.221 | $ 0.073 | $ 0.040 | $ 0.091 |
| Net realized and unrealized gain (loss) | 2.348 | 1.344 | (2.387) | 3.307 | (0.349) | 0.571 |
| Total income (loss) from operations | $ 2.474 | $ 1.606 | $ (2.166) | $ 3.380 | $ (0.309) | $ 0.662 |
| Less Distributions | | | | | | |
| From net investment income | $ (0.234) | $ (0.586) | $ (0.096) | $ — | $ (0.181) | $ (0.262) |
| From net realized gain | — | — | (0.218) | — | — | — |
| Total distributions | $ (0.234) | $ (0.586) | $ (0.314) | $ — | $ (0.181) | $ (0.262) |
| Net asset value — End of period | $13.770 | $11.530 | $10.510 | $12.990 | $ 9.610 | $10.100 |
| Total Return(2) | 21.50% (3)(4) | 15.84% (4) | (17.13)% (4) | 35.17% | (3.20)% (4) | 7.05% (4) |
| Ratios/Supplemental Data | | | | | | |
| Net assets, end of period (000’s omitted) | $ 12,939 | $ 6,276 | $ 2,340 | $ 1,387 | $ 1,572 | $ 2,328 |
| Ratios (as a percentage of average daily net assets):(5) | | | | | | |
| Expenses | 1.40% (4)(6)(7) | 1.40% (4)(7) | 1.56% (4)(7) | 1.64% | 1.65% (4) | 1.66% (4)(8) |
| Net investment income | 1.92% (6) | 2.22% | 1.90% | 0.60% | 0.43% | 0.91% |
| Portfolio Turnover of the Portfolio | 18% (3) | 69% | 67% | 70% | 44% | 43% |
| (1) | Computed using average shares outstanding. |
| (2) | Returns are historical and are calculated by determining the percentage change in net asset value with all distributions reinvested and do not reflect the effect of sales charges. |
| (3) | Not annualized. |
| (4) | The investment adviser reimbursed certain operating expenses (equal to 0.09%, 0.15%, 0.09%, 0.08% and 0.07% of average daily net assets for the six months ended April 30, 2024 and the years ended October 31, 2023, 2022, 2020 and 2019, respectively). Absent this reimbursement, total return would be lower. |
| (5) | Includes the Fund’s share of the Portfolio’s allocated expenses. |
| (6) | Annualized. |
| (7) | Includes a reduction by the investment adviser of a portion of the Portfolio’s adviser fee due to the Portfolio’s investment in the Liquidity Fund (equal to less than 0.01% of average daily net assets for the six months ended April 30, 2024 and less than 0.005% of average daily net assets for the years ended October 31, 2023 and 2022). |
| (8) | Includes interest expense of 0.01% of average daily net assets for the year ended October 31, 2019. |
9
See Notes to Financial Statements.
Eaton Vance
Emerging and Frontier Countries Equity Fund
April 30, 2024
Financial Highlights — continued
| | Class I |
| | Six Months Ended
April 30, 2024
(Unaudited) | Year Ended October 31, |
| | 2023 | 2022 | 2021 | 2020 | 2019 |
| Net asset value — Beginning of period | $ 11.620 | $ 10.580 | $ 13.080 | $ 9.660 | $ 10.150 | $ 9.740 |
| Income (Loss) From Operations | | | | | | |
| Net investment income(1) | $ 0.138 | $ 0.272 | $ 0.252 | $ 0.111 | $ 0.067 | $ 0.117 |
| Net realized and unrealized gain (loss) | 2.366 | 1.371 | (2.398) | 3.321 | (0.348) | 0.572 |
| Total income (loss) from operations | $ 2.504 | $ 1.643 | $ (2.146) | $ 3.432 | $ (0.281) | $ 0.689 |
| Less Distributions | | | | | | |
| From net investment income | $ (0.254) | $ (0.603) | $ (0.136) | $ (0.012) | $ (0.209) | $ (0.279) |
| From net realized gain | — | — | (0.218) | — | — | — |
| Total distributions | $ (0.254) | $ (0.603) | $ (0.354) | $ (0.012) | $ (0.209) | $ (0.279) |
| Net asset value — End of period | $ 13.870 | $ 11.620 | $ 10.580 | $ 13.080 | $ 9.660 | $ 10.150 |
| Total Return(2) | 21.69% (3)(4) | 16.11% (4) | (16.91)% (4) | 35.54% | (2.93)% (4) | 7.31% (4) |
| Ratios/Supplemental Data | | | | | | |
| Net assets, end of period (000’s omitted) | $833,044 | $373,563 | $181,423 | $189,060 | $143,908 | $176,468 |
| Ratios (as a percentage of average daily net assets):(5) | | | | | | |
| Expenses | 1.15% (4)(6)(7) | 1.15% (4)(7) | 1.31% (4)(7) | 1.39% | 1.40% (4) | 1.41% (4)(8) |
| Net investment income | 2.10% (6) | 2.30% | 2.12% | 0.89% | 0.71% | 1.17% |
| Portfolio Turnover of the Portfolio | 18% (3) | 69% | 67% | 70% | 44% | 43% |
| (1) | Computed using average shares outstanding. |
| (2) | Returns are historical and are calculated by determining the percentage change in net asset value with all distributions reinvested. |
| (3) | Not annualized. |
| (4) | The investment adviser reimbursed certain operating expenses (equal to 0.09%, 0.15%, 0.09%, 0.08% and 0.07% of average daily net assets for the six months ended April 30, 2024 and the years ended October 31, 2023, 2022, 2020 and 2019, respectively). Absent this reimbursement, total return would be lower. |
| (5) | Includes the Fund’s share of the Portfolio’s allocated expenses. |
| (6) | Annualized. |
| (7) | Includes a reduction by the investment adviser of a portion of the Portfolio’s adviser fee due to the Portfolio’s investment in the Liquidity Fund (equal to less than 0.01% of average daily net assets for the six months ended April 30, 2024 and less than 0.005% of average daily net assets for the years ended October 31, 2023 and 2022). |
| (8) | Includes interest expense of 0.01% of average daily net assets for the year ended October 31, 2019. |
10
See Notes to Financial Statements.
Eaton Vance
Emerging and Frontier Countries Equity Fund
April 30, 2024
Notes to Financial Statements (Unaudited)
1 Significant Accounting Policies
Eaton Vance Emerging and Frontier Countries Equity Fund (the Fund) is a diversified series of Eaton Vance Mutual Funds Trust (the Trust). The Trust is a Massachusetts business trust registered under the Investment Company Act of 1940, as amended (the 1940 Act), as an open-end management investment company. The Fund offers two classes of shares. Class A shares are generally sold subject to a sales charge imposed at time of purchase. Class I shares are sold at net asset value and are not subject to a sales charge. Each class represents a pro rata interest in the Fund, but votes separately on class-specific matters and (as noted below) is subject to different expenses. Realized and unrealized gains and losses and net investment income and losses, other than class-specific expenses, are allocated daily to each class of shares based on the relative net assets of each class to the total net assets of the Fund. Each class of shares differs in its distribution plan and certain other class-specific expenses. The Fund invests its assets in interests in Global Macro Capital Opportunities Portfolio (the Portfolio), a Massachusetts business trust, having the same investment objective and policies as the Fund. The value of the Fund’s investment in the Portfolio reflects the Fund’s proportionate interest in the net assets of the Portfolio (approximately 100% at April 30, 2024). The performance of the Fund is directly affected by the performance of the Portfolio. The financial statements of the Portfolio, including the portfolio of investments, are included elsewhere in this report and should be read in conjunction with the Fund’s financial statements.
The following is a summary of significant accounting policies of the Fund. The policies are in conformity with accounting principles generally accepted in the United States of America (U.S. GAAP). The Fund is an investment company and follows accounting and reporting guidance in the Financial Accounting Standards Board (FASB) Accounting Standards Codification Topic 946.
A Investment Valuation—Valuation of securities by the Portfolio is discussed in Note 1A of the Portfolio's Notes to Financial Statements, which are included elsewhere in this report.
B Income—The Fund's net investment income or loss consists of the Fund's pro rata share of the net investment income or loss of the Portfolio, less all actual and accrued expenses of the Fund.
C Federal and Other Taxes—The Fund’s policy is to comply with the provisions of the Internal Revenue Code applicable to regulated investment companies and to distribute to shareholders each year substantially all of its net investment income, and all or substantially all of its net realized capital gains. Accordingly, no provision for federal income or excise tax is necessary.
In addition to the requirements of the Internal Revenue Code, the Fund may also be required to recognize its pro rata share of the capital gains taxes incurred by the Portfolio. In doing so, the daily net asset value would reflect the Fund’s pro rata share of the estimated reserve for such taxes incurred by the Portfolio.
As of April 30, 2024, the Fund had no uncertain tax positions that would require financial statement recognition, de-recognition, or disclosure. The Fund files a U.S. federal income tax return annually after its fiscal year-end, which is subject to examination by the Internal Revenue Service for a period of three years from the date of filing.
D Expenses—The majority of expenses of the Trust are directly identifiable to an individual fund. Expenses which are not readily identifiable to a specific fund are allocated taking into consideration, among other things, the nature and type of expense and the relative size of the funds.
E Use of Estimates—The preparation of the financial statements in conformity with U.S. GAAP requires management to make estimates and assumptions that affect the reported amounts of assets and liabilities at the date of the financial statements and the reported amounts of income and expense during the reporting period. Actual results could differ from those estimates.
F Indemnifications—Under the Trust’s organizational documents, its officers and Trustees may be indemnified against certain liabilities and expenses arising out of the performance of their duties to the Fund. Under Massachusetts law, if certain conditions prevail, shareholders of a Massachusetts business trust (such as the Fund) could be deemed to have personal liability for the obligations of the Trust. However, the Trust’s Declaration of Trust contains an express disclaimer of liability on the part of Fund shareholders and the By-laws provide that the Trust shall assume, upon request by the shareholder, the defense on behalf of any Fund shareholders. Moreover, the By-laws also provide for indemnification out of Fund property of any shareholder held personally liable solely by reason of being or having been a shareholder for all loss or expense arising from such liability. Additionally, in the normal course of business, the Fund enters into agreements with service providers that may contain indemnification clauses. The Fund’s maximum exposure under these arrangements is unknown as this would involve future claims that may be made against the Fund that have not yet occurred.
G Other—Investment transactions are accounted for on a trade date basis.
H Interim Financial Statements—The interim financial statements relating to April 30, 2024 and for the six months then ended have not been audited by an independent registered public accounting firm, but in the opinion of the Fund’s management, reflect all adjustments, consisting only of normal recurring adjustments, necessary for the fair presentation of the financial statements.
Eaton Vance
Emerging and Frontier Countries Equity Fund
April 30, 2024
Notes to Financial Statements (Unaudited) — continued
2 Distributions to Shareholders and Income Tax Information
It is the present policy of the Fund to make at least one distribution annually (normally in December) of all or substantially all of its net investment income and to distribute annually all or substantially all of its net realized capital gains. Distributions to shareholders are recorded on the ex-dividend date. Distributions are declared separately for each class of shares. Shareholders may reinvest income and capital gain distributions in additional shares of the same class of the Fund at the net asset value as of the ex-dividend date or, at the election of the shareholder, receive distributions in cash. Distributions to shareholders are determined in accordance with income tax regulations, which may differ from U.S. GAAP. As required by U.S. GAAP, only distributions in excess of tax basis earnings and profits are reported in the financial statements as a return of capital. Permanent differences between book and tax accounting relating to distributions are reclassified to paid-in capital. For tax purposes, distributions from short-term capital gains are considered to be from ordinary income.
At October 31, 2023, the Fund, for federal income tax purposes, had deferred capital losses of $15,528,009 which would reduce its taxable income arising from future net realized gains on investment transactions, if any, to the extent permitted by the Internal Revenue Code, and thus would reduce the amount of distributions to shareholders, which would otherwise be necessary to relieve the Fund of any liability for federal income or excise tax. The deferred capital losses are treated as arising on the first day of the Fund’s next taxable year and retain the same short-term or long-term character as when originally deferred. Of the deferred capital losses at October 31, 2023, $15,528,009 are short-term.
3 Investment Adviser Fee and Other Transactions with Affiliates
The investment adviser fee is earned by Eaton Vance Management (EVM), an indirect, wholly-owned subsidiary of Morgan Stanley, as compensation for investment advisory services rendered to the Fund. The investment adviser fee is computed at an annual rate as a percentage of the Fund’s average daily net assets that are not invested in other investment companies for which EVM or its affiliates serve as investment adviser and receive an advisory fee as follows and is payable monthly:
| Average Daily Net Assets | Annual Fee Rate |
| Up to $500 million | 1.000% |
| $500 million but less than $1 billion | 0.950% |
| $1 billion but less than $2.5 billion | 0.925% |
| $2.5 billion but less than $5 billion | 0.900% |
| $5 billion and over | 0.880% |
For the six months ended April 30, 2024, the Fund incurred no investment adviser fee on such assets. Pursuant to an investment sub-advisory agreement,
EVM has delegated a portion of the investment management of the Fund to Eaton Vance Advisers International Ltd. (EVAIL), an affiliate of EVM and an indirect, wholly-owned subsidiary of Morgan Stanley. EVM pays EVAIL a portion of its investment adviser fee for sub-advisory services provided to the Fund. To the extent the Fund’s assets are invested in the Portfolio, the Fund is allocated its share of the Portfolio’s investment adviser fee. The Portfolio has engaged Boston Management and Research (BMR) to render investment advisory services. See Note 2 of the Portfolio’s Notes to Financial Statements which are included elsewhere in this report. EVM also serves as the administrator of the Fund, but receives no compensation.
EVM has agreed to reimburse the Fund’s expenses to the extent that total annual operating expenses (relating to ordinary operating expenses only and excluding such expenses as brokerage commissions, acquired fund fees of unaffiliated funds, borrowing costs, taxes or litigation expenses) exceed 1.40% and 1.15% of the Fund’s average daily net assets for Class A and Class I, respectively. This agreement may be changed or terminated after March 1, 2025. Pursuant to this agreement, $281,535 of operating expenses were allocated to EVM for the six months ended April 30, 2024.
EVM provides sub-transfer agency and related services to the Fund pursuant to a Sub-Transfer Agency Support Services Agreement. For the six months ended April 30, 2024, EVM earned $5,190 from the Fund pursuant to such agreement, which is included in transfer and dividend disbursing agent fees on the Statement of Operations. The Fund was informed that Eaton Vance Distributors, Inc. (EVD), an affiliate of EVM and the Fund’s principal underwriter, received $1,192 as its portion of the sales charge on sales of Class A shares for the six months ended April 30, 2024. EVD also received distribution and service fees from Class A shares (see Note 4).
Trustees and officers of the Fund who are members of EVM’s or BMR's organizations receive remuneration for their services to the Fund out of the investment adviser fee. Certain officers and Trustees of the Fund and the Portfolio are officers of the above organizations.
Eaton Vance
Emerging and Frontier Countries Equity Fund
April 30, 2024
Notes to Financial Statements (Unaudited) — continued
4 Distribution Plan
The Fund has in effect a distribution plan for Class A shares (Class A Plan) pursuant to Rule 12b-1 under the 1940 Act. Pursuant to the Class A Plan, the Fund pays EVD a distribution and service fee of 0.25% per annum of its average daily net assets attributable to Class A shares for distribution services and facilities provided to the Fund by EVD, as well as for personal services and/or the maintenance of shareholder accounts. Distribution and service fees paid or accrued to EVD for the six months ended April 30, 2024 amounted to $11,756 for Class A shares.
Distribution and service fees are subject to the limitations contained in the Financial Industry Regulatory Authority Rule 2341(d).
5 Contingent Deferred Sales Charges
Class A shares may be subject to a 1% contingent deferred sales charge (CDSC) if redeemed within 12 months of purchase (depending on the circumstances of purchase). Generally, the CDSC is based upon the lower of the net asset value at date of redemption or date of purchase. No charge is levied on shares acquired by reinvestment of dividends or capital gain distributions. For the six months ended April 30, 2024, the Fund was informed that EVD received no CDSCs paid by Class A shareholders.
6 Investment Transactions
For the six months ended April 30, 2024, increases and decreases in the Fund's investment in the Portfolio aggregated $382,896,588 and $19,845,182, respectively.
7 Shares of Beneficial Interest
The Fund’s Declaration of Trust permits the Trustees to issue an unlimited number of full and fractional shares of beneficial interest (without par value). Such shares may be issued in a number of different series (such as the Fund) and classes. Transactions in Fund shares were as follows:
| | Six Months Ended
April 30, 2024
(Unaudited) | | Year Ended
October 31, 2023 |
| | Shares | Amount | | Shares | Amount |
| Class A | | | | | |
| Sales | 463,075 | $ 6,126,859 | | 392,007 | $ 4,637,046 |
| Issued to shareholders electing to receive payments of distributions in Fund shares | 9,048 | 116,723 | | 7,187 | 75,324 |
| Redemptions | (76,410) | (1,012,431) | | (77,602) | (909,565) |
| Net increase | 395,713 | $ 5,231,151 | | 321,592 | $ 3,802,805 |
| Class I | | | | | |
| Sales | 33,928,015 | $ 447,150,486 | | 18,978,983 | $ 229,309,289 |
| Issued to shareholders electing to receive payments of distributions in Fund shares | 792,954 | 10,300,468 | | 964,078 | 10,161,384 |
| Redemptions | (6,812,531) | (90,888,632) | | (4,947,577) | (57,407,638) |
| Net increase | 27,908,438 | $366,562,322 | | 14,995,484 | $182,063,035 |
Global Macro Capital Opportunities Portfolio
April 30, 2024
Portfolio of Investments (Unaudited)
| Security | Shares | Value |
| Argentina — 5.2% |
| Adecoagro SA | | 174,100 | $ 1,888,985 |
| Arcos Dorados Holdings, Inc., Class A | | 251,400 | 2,710,092 |
| Banco BBVA Argentina SA ADR(1) | | 142,300 | 1,360,388 |
| Banco Macro SA ADR(1) | | 118,700 | 6,428,792 |
| Bioceres Crop Solutions Corp.(1) | | 50,100 | 591,180 |
| Central Puerto SA ADR | | 234,400 | 2,416,664 |
| Corp. America Airports SA(1) | | 70,100 | 1,187,494 |
| Cresud SACIF y A ADR | | 74,250 | 708,345 |
| Despegar.com Corp.(1) | | 117,600 | 1,433,544 |
| Empresa Distribuidora Y Comercializadora Norte ADR(1) | | 44,000 | 750,200 |
| Grupo Financiero Galicia SA ADR(1) | | 232,000 | 7,523,760 |
| Grupo Supervielle SA ADR(1) | | 122,600 | 776,058 |
| IRSA Inversiones y Representaciones SA ADR(1) | | 63,212 | 600,514 |
| Loma Negra Cia Industrial Argentina SA ADR | | 107,300 | 766,122 |
| Pampa Energia SA ADR(1) | | 77,200 | 3,425,364 |
| Telecom Argentina SA ADR(1) | | 174,700 | 1,353,925 |
| Transportadora de Gas del Sur SA, Class B ADR(1) | | 143,500 | 2,522,730 |
| YPF SA ADR(1) | | 333,100 | 7,314,876 |
| | | | $ 43,759,033 |
| Bulgaria — 0.1% |
| Eurohold Bulgaria AD(1) | | 944,905 | $ 676,619 |
| | | | $ 676,619 |
| China — 0.0%(2) |
| Ganfeng Lithium Group Co. Ltd., Class H(3) | | 2,800 | $ 8,211 |
| | | | $ 8,211 |
| Cyprus — 1.7% |
| Bank of Cyprus Holdings PLC(4) | | 45,800 | $ 177,874 |
| Bank of Cyprus Holdings PLC(4) | | 3,619,793 | 14,453,725 |
| | | | $ 14,631,599 |
| Egypt — 0.5% |
| Abou Kir Fertilizers & Chemical Industries | | 200,100 | $ 260,090 |
| Commercial International Bank - Egypt (CIB) | | 2,473,361 | 3,716,952 |
| Misr Fertilizers Production Co. SAE | | 335,100 | 293,835 |
| | | | $ 4,270,877 |
| Georgia — 5.4% |
| Bank of Georgia Group PLC | | 206,566 | $ 13,831,462 |
| Security | Shares | Value |
| Georgia (continued) |
| Georgia Capital PLC(1) | | 1,014,117 | $ 17,230,009 |
| TBC Bank Group PLC | | 333,622 | 14,393,813 |
| | | | $ 45,455,284 |
| Greece — 20.5% |
| Aegean Airlines SA(1) | | 118,953 | $ 1,595,957 |
| Alpha Services and Holdings SA(1) | | 7,675,878 | 12,961,622 |
| Athens International Airport SA(1) | | 94,031 | 833,908 |
| Athens Water Supply & Sewage Co. SA | | 106,068 | 646,809 |
| Autohellas Tourist & Trading SA | | 49,238 | 672,749 |
| Avax SA | | 281,000 | 442,885 |
| Cenergy Holdings SA | | 408,618 | 3,449,525 |
| Ellaktor SA(1) | | 333,572 | 931,504 |
| Eurobank Ergasias Services and Holdings SA, Class A(1) | | 9,059,798 | 19,381,138 |
| GEK TERNA SA | | 275,481 | 4,908,387 |
| Hellenic Exchanges - Athens Stock Exchange SA | | 87,000 | 477,011 |
| Hellenic Telecommunications Organization SA | | 681,277 | 10,349,721 |
| Helleniq Energy Holdings SA | | 766,405 | 6,870,492 |
| Holding Co. ADMIE IPTO SA | | 348,857 | 827,982 |
| Ideal Holdings SA | | 85,500 | 569,546 |
| JUMBO SA | | 418,095 | 13,012,204 |
| LAMDA Development SA(1) | | 253,589 | 1,861,016 |
| Motor Oil (Hellas) Corinth Refineries SA | | 241,214 | 6,998,585 |
| Mytilineos SA | | 364,037 | 14,769,023 |
| National Bank of Greece SA(1) | | 2,733,221 | 21,996,197 |
| OPAP SA | | 447,300 | 7,441,548 |
| Optima bank SA(1) | | 403,252 | 4,575,406 |
| Piraeus Financial Holdings SA(1) | | 4,466,539 | 17,892,740 |
| Public Power Corp. SA(1) | | 774,536 | 9,245,200 |
| Sarantis SA | | 94,905 | 1,198,754 |
| Terna Energy SA | | 191,539 | 3,723,590 |
| Titan Cement International SA | | 142,647 | 4,515,249 |
| Trade Estates Real Estate Investment SA(1) | | 456,600 | 837,323 |
| | | | $172,986,071 |
| India — 9.7% |
| Adani Energy Solutions Ltd.(1) | | 44,159 | $ 564,027 |
| Adani Green Energy Ltd.(1) | | 14,178 | 304,556 |
| Affle India Ltd.(1) | | 117,452 | 1,573,488 |
| Apollo Hospitals Enterprise Ltd. | | 6,219 | 443,115 |
| Asian Paints Ltd. | | 17,811 | 612,470 |
| Avenue Supermarts Ltd.(1)(3) | | 10,455 | 577,057 |
| Axis Bank Ltd. | | 89,132 | 1,240,431 |
| Bajaj Finance Ltd. | | 11,500 | 951,125 |
| Bharti Airtel Ltd. | | 171,957 | 2,726,380 |
| Brightcom Group Ltd.(1) | | 2,938,392 | 490,588 |
14
See Notes to Financial Statements.
Global Macro Capital Opportunities Portfolio
April 30, 2024
Portfolio of Investments (Unaudited) — continued
| Security | Shares | Value |
| India (continued) |
| Cipla Ltd. | | 24,973 | $ 418,219 |
| Divi's Laboratories Ltd. | | 6,252 | 299,255 |
| Dr. Reddy's Laboratories Ltd. | | 2,326 | 172,497 |
| Easy Trip Planners Ltd. | | 1,018,984 | 565,824 |
| Eicher Motors Ltd. | | 1,090 | 60,245 |
| FSN E-Commerce Ventures Ltd.(1) | | 1,462,357 | 3,087,202 |
| GAIL (India) Ltd. | | 88,026 | 219,899 |
| Grasim Industries Ltd. | | 13,486 | 388,578 |
| Grasim Industries Ltd. (partly-paid shares)(1) | | 537 | 7,466 |
| Happiest Minds Technologies Ltd. | | 162,472 | 1,582,352 |
| Havells India Ltd. | | 9,907 | 197,429 |
| HCL Technologies Ltd. | | 14,542 | 237,400 |
| HDFC Bank Ltd. | | 110,900 | 2,007,848 |
| Hindalco Industries Ltd. | | 80,564 | 619,215 |
| Hindustan Unilever Ltd. | | 12,230 | 327,119 |
| ICICI Bank Ltd. | | 200,982 | 2,768,959 |
| IndiaMart InterMesh Ltd.(3) | | 65,121 | 2,065,755 |
| Indian Railway Catering & Tourism Corp. Ltd. | | 386,186 | 4,802,545 |
| Info Edge India Ltd. | | 67,933 | 4,906,066 |
| Infosys Ltd. | | 169,415 | 2,862,907 |
| Intellect Design Arena Ltd. | | 174,959 | 2,254,081 |
| ITC Ltd. | | 43,445 | 226,377 |
| Jindal Steel & Power Ltd. | | 13,591 | 150,837 |
| Jio Financial Services Ltd.(1) | | 73,861 | 331,504 |
| JSW Steel Ltd. | | 36,383 | 384,068 |
| Jubilant Foodworks Ltd. | | 433,143 | 2,397,057 |
| Kotak Mahindra Bank Ltd. | | 42,229 | 820,586 |
| Larsen & Toubro Ltd. | | 42,276 | 1,816,084 |
| LTIMindtree Ltd.(3) | | 3,328 | 186,904 |
| Mahindra & Mahindra Ltd. | | 66,683 | 1,722,845 |
| Maruti Suzuki India Ltd. | | 7,283 | 1,115,826 |
| Mphasis Ltd. | | 3,178 | 88,044 |
| Nazara Technologies Ltd.(1) | | 82,001 | 626,493 |
| Nestle India Ltd. | | 5,403 | 162,353 |
| NTPC Ltd. | | 66,589 | 289,232 |
| Petronet LNG Ltd. | | 28,740 | 106,557 |
| PI Industries Ltd. | | 2,863 | 124,645 |
| Power Grid Corp. of India Ltd. | | 81,117 | 292,571 |
| Reliance Industries Ltd. | | 323,311 | 11,341,858 |
| Route Mobile Ltd. | | 62,087 | 1,130,843 |
| SRF Ltd. | | 5,781 | 181,355 |
| State Bank of India | | 21,636 | 212,362 |
| Sun Pharmaceutical Industries Ltd. | | 15,899 | 284,963 |
| Tanla Platforms Ltd. | | 160,048 | 1,753,538 |
| Tata Consultancy Services Ltd. | | 5,859 | 267,636 |
| Tata Consumer Products Ltd. | | 128,575 | 1,701,394 |
| Security | Shares | Value |
| India (continued) |
| Tata Elxsi Ltd. | | 1,296 | $ 109,384 |
| Tata Motors Ltd. | | 63,438 | 765,078 |
| Tata Steel Ltd. | | 424,533 | 835,564 |
| Tech Mahindra Ltd. | | 14,567 | 219,259 |
| Titan Co. Ltd. | | 21,289 | 914,917 |
| Trent Ltd. | | 6,864 | 363,720 |
| Tube Investments of India Ltd. | | 4,113 | 184,868 |
| UltraTech Cement Ltd. | | 6,678 | 796,379 |
| UPL Ltd. | | 18,027 | 109,244 |
| Varun Beverages Ltd. | | 24,259 | 429,586 |
| Wipro Ltd. | | 48,521 | 267,211 |
| Zomato Ltd.(1) | | 4,204,319 | 9,723,355 |
| | | | $ 81,768,595 |
| Pakistan — 0.3% |
| Bank Al Habib Ltd. | | 138,826 | $ 48,158 |
| Bank Alfalah Ltd. | | 189,000 | 39,936 |
| Engro Corp. Ltd. | | 143,780 | 190,843 |
| Engro Fertilizers Ltd. | | 202,914 | 116,325 |
| Fauji Fertilizer Co. Ltd. | | 255,510 | 133,718 |
| Habib Bank Ltd. | | 410,555 | 172,061 |
| Hub Power Co. Ltd. | | 1,036,225 | 495,007 |
| Interloop Ltd. | | 473,300 | 121,129 |
| Lucky Cement Ltd. | | 43,500 | 130,376 |
| Mari Petroleum Co. Ltd. | | 6,653 | 65,223 |
| MCB Bank Ltd. | | 172,005 | 129,370 |
| Millat Tractors Ltd. | | 15,165 | 32,613 |
| Oil & Gas Development Co. Ltd. | | 543,075 | 260,594 |
| Pakistan Oilfields Ltd. | | 30,300 | 48,720 |
| Pakistan Petroleum Ltd. | | 530,215 | 219,902 |
| Pakistan State Oil Co. Ltd. | | 90,870 | 58,238 |
| SUI Northern Gas Pipeline | | 152,745 | 36,940 |
| Systems Ltd. | | 93,965 | 130,701 |
| TRG Pakistan(1) | | 381,600 | 87,496 |
| United Bank Ltd. | | 338,040 | 235,914 |
| | | | $ 2,753,264 |
| Philippines — 1.3% |
| Aboitiz Equity Ventures, Inc. | | 438,600 | $ 319,452 |
| Ayala Corp. | | 74,220 | 788,931 |
| Ayala Land, Inc. | | 1,725,400 | 855,316 |
| Bank of the Philippine Islands | | 326,800 | 721,187 |
| BDO Unibank, Inc. | | 665,190 | 1,704,899 |
| International Container Terminal Services, Inc. | | 259,200 | 1,482,470 |
| JG Summit Holdings, Inc. | | 808,300 | 471,944 |
| Jollibee Foods Corp. | | 135,720 | 551,846 |
15
See Notes to Financial Statements.
Global Macro Capital Opportunities Portfolio
April 30, 2024
Portfolio of Investments (Unaudited) — continued
| Security | Shares | Value |
| Philippines (continued) |
| Manila Electric Co. | | 72,820 | $ 465,173 |
| Metropolitan Bank & Trust Co. | | 462,470 | 559,587 |
| PLDT, Inc. | | 22,680 | 528,179 |
| SM Investments Corp. | | 63,900 | 1,049,145 |
| SM Prime Holdings, Inc. | | 2,947,500 | 1,424,248 |
| Universal Robina Corp. | | 257,510 | 459,785 |
| | | | $ 11,382,162 |
| Poland — 10.4% |
| Alior Bank SA(1) | | 84,349 | $ 2,148,814 |
| Allegro.eu SA(1)(3) | | 604,288 | 5,037,409 |
| AmRest Holdings SE(1) | | 95,608 | 619,499 |
| Asseco Poland SA | | 72,938 | 1,433,450 |
| Bank Millennium SA(1) | | 601,255 | 1,368,988 |
| Bank Polska Kasa Opieki SA | | 230,217 | 9,531,051 |
| Budimex SA | | 16,661 | 2,818,426 |
| CCC SA(1) | | 47,994 | 1,112,496 |
| CD Projekt SA | | 83,230 | 2,421,355 |
| Cyfrowy Polsat SA(1) | | 304,841 | 751,258 |
| Dino Polska SA(1)(3) | | 44,741 | 4,286,300 |
| Enea SA(1) | | 311,811 | 650,505 |
| Eurocash SA | | 107,405 | 361,088 |
| Grupa Azoty SA(1) | | 70,443 | 380,483 |
| Grupa Kety SA | | 13,067 | 2,707,673 |
| Jastrzebska Spolka Weglowa SA(1) | | 65,755 | 495,030 |
| KGHM Polska Miedz SA | | 179,150 | 6,159,112 |
| KRUK SA | | 16,844 | 1,914,671 |
| LPP SA | | 1,470 | 5,664,191 |
| mBank SA(1) | | 14,771 | 2,480,622 |
| Orange Polska SA | | 861,921 | 1,666,129 |
| ORLEN SA | | 598,482 | 9,757,880 |
| Pepco Group NV(1)(5) | | 212,744 | 1,003,037 |
| PGE Polska Grupa Energetyczna SA(1) | | 1,081,331 | 1,611,718 |
| Powszechna Kasa Oszczednosci Bank Polski SA | | 547,641 | 8,130,894 |
| Powszechny Zaklad Ubezpieczen SA | | 756,368 | 9,519,562 |
| Santander Bank Polska SA | | 8,288 | 1,135,729 |
| Tauron Polska Energia SA(1) | | 1,276,987 | 916,516 |
| Text SA | | 22,315 | 494,109 |
| Warsaw Stock Exchange | | 29,402 | 325,631 |
| XTB SA(3) | | 44,157 | 690,086 |
| | | | $ 87,593,712 |
| Saudi Arabia — 5.2% |
| Advanced Petrochemical Co. | | 48,600 | $ 554,095 |
| Al Hammadi Holding | | 35,300 | 522,008 |
| Al Rajhi Bank | | 39,800 | 846,516 |
| Security | Shares | Value |
| Saudi Arabia (continued) |
| Alamar Foods | | 28,300 | $ 707,634 |
| Al-Dawaa Medical Services Co. | | 26,200 | 667,312 |
| Alinma Bank | | 24,500 | 217,328 |
| Almarai Co. JSC | | 17,800 | 269,276 |
| Arabian Contracting Services Co. | | 57,281 | 3,336,451 |
| Arabian Internet & Communications Services Co. | | 7,100 | 656,601 |
| Ataa Educational Co. | | 29,094 | 549,824 |
| Bank AlBilad | | 12,250 | 116,441 |
| Banque Saudi Fransi | | 11,800 | 115,143 |
| Catrion Catering Holding Co. | | 30,900 | 1,039,731 |
| Cenomi Centers | | 174,800 | 1,165,943 |
| City Cement Co. | | 194,300 | 1,074,344 |
| Dallah Healthcare Co. | | 11,603 | 506,459 |
| Dr Sulaiman Al Habib Medical Services Group Co. | | 6,900 | 570,545 |
| Etihad Etisalat Co. | | 149,200 | 2,065,249 |
| Jarir Marketing Co. | | 121,000 | 436,149 |
| Leejam Sports Co. JSC | | 23,388 | 1,305,529 |
| Lumi Rental Co.(1) | | 36,800 | 863,912 |
| Najran Cement Co.(1) | | 326,900 | 866,479 |
| National Agriculture Development Co.(1) | | 150,219 | 1,401,318 |
| National Co. for Learning & Education | | 17,800 | 715,155 |
| National Medical Care Co. | | 24,400 | 1,195,555 |
| Riyad Bank | | 28,500 | 210,143 |
| SABIC Agri-Nutrients Co. | | 15,900 | 489,965 |
| Sahara International Petrochemical Co. | | 144,300 | 1,318,869 |
| Saudi Arabian Mining Co.(1) | | 57,900 | 780,508 |
| Saudi Arabian Oil Co.(3) | | 170,110 | 1,363,042 |
| Saudi Awwal Bank | | 20,600 | 223,549 |
| Saudi Basic Industries Corp. | | 58,600 | 1,320,276 |
| Saudi Electricity Co. | | 49,600 | 245,736 |
| Saudi Industrial Investment Group | | 93,300 | 576,005 |
| Saudi National Bank | | 59,100 | 591,618 |
| Saudi Telecom Co. | | 198,200 | 1,988,794 |
| Saudia Dairy & Foodstuff Co. | | 21,461 | 2,090,744 |
| Savola Group | | 95,300 | 1,280,607 |
| Theeb Rent A Car Co. | | 155,307 | 2,828,005 |
| United Electronics Co. | | 135,831 | 3,584,355 |
| United International Transportation Co. | | 139,643 | 3,107,856 |
| | | | $ 43,765,069 |
| Slovenia — 1.7% |
| Nova Ljubljanska Banka DD(3) | | 72,121 | $ 7,971,505 |
| Nova Ljubljanska Banka DD GDR(5) | | 277,752 | 5,969,075 |
| | | | $ 13,940,580 |
16
See Notes to Financial Statements.
Global Macro Capital Opportunities Portfolio
April 30, 2024
Portfolio of Investments (Unaudited) — continued
| Security | Shares | Value |
| South Korea — 8.2% |
| Celltrion, Inc. | | 12,921 | $ 1,754,470 |
| CosmoAM&T Co. Ltd.(1) | | 2,880 | 311,035 |
| DB Insurance Co. Ltd. | | 9,279 | 650,874 |
| Doosan Enerbility Co. Ltd.(1) | | 24,045 | 290,328 |
| Ecopro BM Co. Ltd.(1) | | 3,137 | 533,242 |
| Ecopro Co. Ltd.(1) | | 9,745 | 736,618 |
| Hana Financial Group, Inc. | | 40,498 | 1,708,076 |
| Hanwha Aerospace Co. Ltd. | | 1,870 | 284,046 |
| HD Korea Shipbuilding & Offshore Engineering Co. Ltd.(1) | | 7,801 | 736,543 |
| HLB, Inc.(1) | | 12,548 | 1,002,586 |
| HMM Co. Ltd. | | 47,574 | 543,158 |
| Hyundai Mobis Co. Ltd. | | 7,046 | 1,152,721 |
| Hyundai Motor Co. | | 13,753 | 2,473,833 |
| Kakao Corp. | | 31,433 | 1,091,633 |
| KB Financial Group, Inc. | | 49,614 | 2,690,909 |
| Kia Corp. | | 29,488 | 2,498,299 |
| Korea Electric Power Corp. | | 14,700 | 224,414 |
| Korea Zinc Co. Ltd. | | 330 | 109,928 |
| Korean Air Lines Co. Ltd. | | 34,730 | 523,734 |
| Krafton, Inc.(1) | | 1,570 | 270,207 |
| KT&G Corp. | | 5,015 | 323,145 |
| L&F Co. Ltd.(1) | | 5,618 | 657,193 |
| LG Chem Ltd. | | 4,916 | 1,412,604 |
| LG Corp. | | 4,970 | 283,578 |
| LG Electronics, Inc. | | 5,190 | 345,665 |
| Meritz Financial Group, Inc. | | 5,200 | 297,323 |
| NAVER Corp. | | 13,801 | 1,820,344 |
| POSCO Future M Co. Ltd. | | 1,589 | 319,671 |
| POSCO Holdings, Inc. | | 7,008 | 2,023,075 |
| Samsung Biologics Co. Ltd.(1)(3) | | 1,263 | 709,878 |
| Samsung C&T Corp. | | 8,399 | 905,692 |
| Samsung E&A Co. Ltd.(1) | | 33,691 | 638,758 |
| Samsung Electro-Mechanics Co. Ltd. | | 2,829 | 315,556 |
| Samsung Electronics Co. Ltd. | | 488,175 | 27,136,007 |
| Samsung Fire & Marine Insurance Co. Ltd. | | 1,523 | 340,886 |
| Samsung Heavy Industries Co. Ltd.(1) | | 37,555 | 254,452 |
| Samsung Life Insurance Co. Ltd. | | 4,244 | 267,427 |
| Samsung SDS Co. Ltd. | | 2,175 | 249,863 |
| Shinhan Financial Group Co. Ltd. | | 52,694 | 1,770,375 |
| SK Hynix, Inc. | | 67,180 | 8,290,388 |
| SK Innovation Co. Ltd.(1) | | 3,233 | 256,478 |
| SK Square Co. Ltd.(1) | | 5,126 | 281,635 |
| SK, Inc. | | 2,018 | 240,470 |
| Woori Financial Group, Inc. | | 31,211 | 319,842 |
| Yuhan Corp. | | 10,319 | 536,768 |
| | | | $ 69,583,727 |
| Security | Shares | Value |
| Taiwan — 5.7% |
| Accton Technology Corp. | | 14,000 | $ 196,132 |
| Alchip Technologies Ltd. | | 2,000 | 188,630 |
| ASE Technology Holding Co. Ltd. | | 96,000 | 431,865 |
| Asustek Computer, Inc. | | 21,000 | 275,368 |
| Cathay Financial Holding Co. Ltd. | | 297,000 | 459,267 |
| Chailease Holding Co. Ltd. | | 45,000 | 237,342 |
| China Steel Corp. | | 353,000 | 268,923 |
| Chunghwa Telecom Co. Ltd. | | 121,000 | 459,901 |
| CTBC Financial Holding Co. Ltd. | | 567,000 | 591,788 |
| Delta Electronics, Inc. | | 63,000 | 616,977 |
| E.Sun Financial Holding Co. Ltd. | | 430,000 | 361,330 |
| First Financial Holding Co. Ltd. | | 318,000 | 266,587 |
| Formosa Chemicals & Fibre Corp. | | 95,000 | 161,466 |
| Formosa Plastics Corp. | | 113,000 | 237,406 |
| Fubon Financial Holding Co. Ltd. | | 249,000 | 526,764 |
| Hon Hai Precision Industry Co. Ltd. | | 433,000 | 2,061,230 |
| Largan Precision Co. Ltd. | | 3,000 | 199,974 |
| Lite-On Technology Corp. | | 56,000 | 169,500 |
| MediaTek, Inc. | | 53,000 | 1,598,012 |
| Mega Financial Holding Co. Ltd. | | 365,000 | 447,275 |
| Nan Ya Plastics Corp. | | 142,000 | 246,569 |
| Novatek Microelectronics Corp. | | 17,000 | 321,219 |
| Quanta Computer, Inc. | | 88,000 | 690,645 |
| Realtek Semiconductor Corp. | | 14,000 | 220,852 |
| Taiwan Cement Corp. | | 188,000 | 184,794 |
| Taiwan Cooperative Financial Holding Co. Ltd. | | 299,000 | 240,285 |
| Taiwan Semiconductor Manufacturing Co. Ltd. | | 1,460,000 | 34,957,881 |
| Unimicron Technology Corp. | | 39,000 | 215,671 |
| Uni-President Enterprises Corp. | | 147,000 | 344,804 |
| United Microelectronics Corp. | | 363,000 | 557,721 |
| Wistron Corp. | | 73,000 | 249,956 |
| Yuanta Financial Holding Co. Ltd. | | 290,000 | 272,030 |
| | | | $ 48,258,164 |
| Turkey — 5.0% |
| Akbank TAS | | 2,334,409 | $ 4,296,694 |
| Aselsan Elektronik Sanayi Ve Ticaret AS | | 1,541,302 | 2,891,408 |
| BIM Birlesik Magazalar AS | | 343,652 | 4,105,592 |
| Eregli Demir ve Celik Fabrikalari TAS | | 1,084,078 | 1,438,723 |
| Ford Otomotiv Sanayi AS | | 53,111 | 1,829,360 |
| Haci Omer Sabanci Holding AS(1) | | 784,230 | 2,238,686 |
| Hektas Ticaret TAS(1) | | 769,632 | 360,765 |
| KOC Holding AS | | 589,372 | 4,113,284 |
| Koza Altin Isletmeleri AS | | 642,699 | 461,652 |
| Pegasus Hava Tasimaciligi AS(1) | | 35,398 | 1,126,932 |
| Sasa Polyester Sanayi AS(1) | | 989,838 | 1,260,225 |
17
See Notes to Financial Statements.
Global Macro Capital Opportunities Portfolio
April 30, 2024
Portfolio of Investments (Unaudited) — continued
| Security | Shares | Value |
| Turkey (continued) |
| Tofas Turk Otomobil Fabrikasi AS | | 118,495 | $ 1,007,118 |
| Turk Hava Yollari AO(1) | | 426,599 | 4,290,873 |
| Turkcell Iletisim Hizmetleri AS | | 924,063 | 2,300,500 |
| Turkiye Is Bankasi AS, Class C | | 6,725,719 | 2,845,658 |
| Turkiye Petrol Rafinerileri AS | | 724,138 | 4,371,711 |
| Turkiye Sise ve Cam Fabrikalari AS | | 439,174 | 682,152 |
| Yapi ve Kredi Bankasi AS | | 2,568,907 | 2,572,437 |
| | | | $ 42,193,770 |
| United Arab Emirates — 7.1% |
| Abu Dhabi Commercial Bank PJSC | | 1,522,550 | $ 3,457,230 |
| Abu Dhabi Islamic Bank PJSC | | 683,259 | 2,077,300 |
| Abu Dhabi National Oil Co. for Distribution PJSC | | 1,279,514 | 1,214,682 |
| Agthia Group PJSC | | 2,115,079 | 3,288,448 |
| Air Arabia PJSC | | 4,202,594 | 3,059,932 |
| Al Ansari Financial Services PJSC | | 1,805,311 | 519,547 |
| Al Waha Capital PJSC | | 6,168,401 | 2,513,594 |
| Aldar Properties PJSC | | 3,502,652 | 5,205,348 |
| Amanat Holdings PJSC(1) | | 10,123,250 | 2,867,617 |
| Americana Restaurants International PLC(1)(4) | | 684,268 | 619,542 |
| Americana Restaurants International PLC(1)(4) | | 494,400 | 450,363 |
| Deyaar Development PJSC | | 16,085,701 | 3,284,415 |
| Dubai Electricity & Water Authority PJSC | | 1,686,287 | 1,078,273 |
| Dubai Islamic Bank PJSC | | 1,323,277 | 2,003,512 |
| Emaar Properties PJSC(1) | | 3,802,469 | 8,502,684 |
| Emirates NBD Bank PJSC | | 557,760 | 2,582,790 |
| Emirates Telecommunications Group Co. PJSC | | 1,370,667 | 6,357,484 |
| First Abu Dhabi Bank PJSC | | 1,808,399 | 6,148,158 |
| Multiply Group PJSC(1) | | 1,377,700 | 861,927 |
| National Central Cooling Co. PJSC | | 689,840 | 571,017 |
| Q Holding PJSC(1) | | 227,300 | 182,225 |
| Ras Al Khaimah Ceramics | | 3,875,806 | 2,911,198 |
| Taaleem Holdings PJSC | | 29,300 | 29,830 |
| | | | $ 59,787,116 |
| Vietnam — 5.5% |
| Airports Corp. of Vietnam JSC(1) | | 133,300 | $ 438,636 |
| Asia Commercial Bank JSC | | 1,085,000 | 1,228,009 |
| Century Land JSC(1) | | 520,000 | 165,184 |
| Dat Xanh Real Estate Services JSC(1) | | 592,200 | 163,857 |
| Digiworld Corp. | | 1,064,800 | 2,460,292 |
| Dong Hai JSC of Bentre | | 208,600 | 312,602 |
| Duc Giang Chemicals JSC | | 712,600 | 3,325,875 |
| FPT Corp. | | 2,020,570 | 10,504,301 |
| FPT Digital Retail JSC | | 663,860 | 4,204,665 |
| Gemadept Corp. | | 745,200 | 2,466,425 |
| Security | Shares | Value |
| Vietnam (continued) |
| Khang Dien House Trading & Investment JSC(1) | | 138,900 | $ 191,078 |
| Kinh Bac City Development Holding Corp.(1) | | 138,400 | 157,451 |
| Military Commercial Joint Stock Bank | | 1,280,000 | 1,198,072 |
| Mobile World Investment Corp. | | 3,033,000 | 6,542,172 |
| Novaland Investment Group Corp.(1) | | 7,524 | 4,503 |
| PetroVietnam Drilling & Well Services JSC(1) | | 211,700 | 247,341 |
| PetroVietnam Technical Services Corp. | | 156,100 | 244,646 |
| Phat Dat Real Estate Development Corp.(1) | | 3,271 | 3,389 |
| Phu Nhuan Jewelry JSC | | 1,282,566 | 4,944,010 |
| Refrigeration Electrical Engineering Corp. | | 652,803 | 1,695,048 |
| Saigon Thuong Tin Commercial JSB(1) | | 932,100 | 1,033,612 |
| Sao Ta Foods JSC | | 402,800 | 769,706 |
| Vietnam Dairy Products JSC | | 128,800 | 329,869 |
| Vietnam Engine & Agricultural Machinery Corp. | | 241,100 | 338,653 |
| Vietnam Joint Stock Commercial Bank for Industry & Trade(1) | | 881,700 | 1,137,195 |
| Vietnam Technological & Commercial Joint Stock Bank(1) | | 807,400 | 1,524,833 |
| Viettel Construction Joint Stock Corp. | | 96,000 | 468,036 |
| VNDirect Securities Corp.(1) | | 792,700 | 641,563 |
| | | | $ 46,741,023 |
Total Common Stocks
(identified cost $663,322,536) | | | $789,554,876 |
| Loan Participation Notes — 1.3% |
| Security | Principal
Amount
(000's omitted) | Value |
| Uzbekistan — 1.3% |
| Daryo Finance BV (borrower - Uzbek Industrial and Construction Bank ATB), 18.75%, 6/15/25(5)(6)(7) | UZS | 48,512,190 | $ 4,132,768 |
| Europe Asia Investment Finance BV (borrower - Joint Stock Commercial Bank “Asaka”), 18.70%, 7/21/26(5)(6)(7) | UZS | 81,043,560 | 6,649,833 |
Total Loan Participation Notes
(identified cost $10,873,070) | | | $ 10,782,601 |
| Security | Shares | Value |
| South Korea — 0.7% |
| Hyundai Motor Co. | | 9,472 | $ 1,082,344 |
18
See Notes to Financial Statements.
Global Macro Capital Opportunities Portfolio
April 30, 2024
Portfolio of Investments (Unaudited) — continued
| Security | Shares | Value |
| South Korea (continued) |
| LG Chem Ltd. | | 3,399 | $ 652,341 |
| Samsung Electronics Co. Ltd. | | 89,398 | 4,174,091 |
Total Preferred Stocks
(identified cost $5,630,460) | | | $ 5,908,776 |
| Sovereign Government Bonds — 0.0%(2) |
| Security | Principal
Amount
(000's omitted) | Value |
| Greece — 0.0%(2) |
| Hellenic Republic Government Bonds, 0.00%, GDP-Linked, 10/15/42 | EUR | 149,000 | $ 445,235 |
Total Sovereign Government Bonds
(identified cost $536,975) | | | $ 445,235 |
| Short-Term Investments — 3.8% |
| Security | Shares | Value |
| Morgan Stanley Institutional Liquidity Funds - Government Portfolio, Institutional Class, 5.22%(8) | | 30,630,473 | $ 30,630,473 |
Total Affiliated Fund
(identified cost $30,630,473) | | | $ 30,630,473 |
| U.S. Treasury Obligations — 0.2% |
| Security | Principal
Amount
(000's omitted) | Value |
| U.S. Treasury Bills: | | | |
| 0.00%, 5/9/24 | $ | 506 | $ 505,407 |
| 0.00%, 6/13/24 | | 500 | 496,859 |
| 0.00%, 6/20/24 | | 500 | 496,340 |
Total U.S. Treasury Obligations
(identified cost $1,498,665) | | | $ 1,498,606 |
Total Short-Term Investments
(identified cost $32,129,138) | | | $ 32,129,079 |
| | | Value |
Total Purchased Options — 0.1%
(identified cost $385,560) | | | $ 375,713 |
Total Investments — 99.4%
(identified cost $712,877,739) | | | $839,196,280 |
| Other Assets, Less Liabilities — 0.6% | | | $ 5,197,517 |
| Net Assets — 100.0% | | | $844,393,797 |
| The percentage shown for each investment category in the Portfolio of Investments is based on net assets. |
| (1) | Non-income producing security. |
| (2) | Amount is less than 0.05%. |
| (3) | Security exempt from registration under Rule 144A of the Securities Act of 1933, as amended. These securities may be sold in certain transactions in reliance on an exemption from registration (normally to qualified institutional buyers). At April 30, 2024, the aggregate value of these securities is $22,896,147 or 2.7% of the Portfolio's net assets. |
| (4) | Securities are traded on separate exchanges for the same entity. |
| (5) | Security exempt from registration under Regulation S of the Securities Act of 1933, as amended, which exempts from registration securities offered and sold outside the United States. Security may not be offered or sold in the United States except pursuant to an exemption from, or in a transaction not subject to, the registration requirements of the Securities Act of 1933, as amended. At April 30, 2024, the aggregate value of these securities is $17,754,713 or 2.1% of the Portfolio's net assets. |
| (6) | For fair value measurement disclosure purposes, security is categorized as Level 3 (see Note 8). |
| (7) | Limited recourse note whose payments by the issuer are limited to amounts received by the issuer from the borrower pursuant to a loan agreement with the borrower. |
| (8) | May be deemed to be an affiliated investment company. The rate shown is the annualized seven-day yield as of April 30, 2024. |
19
See Notes to Financial Statements.
Global Macro Capital Opportunities Portfolio
April 30, 2024
Portfolio of Investments (Unaudited) — continued
| Sector Classification of Portfolio |
| Sector | Percentage
of Net Assets | Value |
| Financials | 33.9% | $286,422,347 |
| Information Technology | 13.1 | 110,637,132 |
| Consumer Discretionary | 11.4 | 95,973,931 |
| Industrials | 10.0 | 84,646,324 |
| Energy | 6.2 | 52,048,873 |
| Communication Services | 5.6 | 47,084,145 |
| Materials | 4.8 | 40,395,557 |
| Utilities | 3.4 | 29,001,393 |
| Consumer Staples | 3.2 | 27,197,964 |
| Real Estate | 2.9 | 24,422,269 |
| Health Care | 1.0 | 8,416,318 |
| Government | 0.0 (1) | 445,235 |
| Short-Term Investments | 3.8 | 32,129,079 |
| Total | 99.3% | $838,820,567 |
| (1) | Amount is less than 0.05%. |
| Purchased Currency Options (OTC) — 0.1% |
| Description | Counterparty | Notional Amount | Exercise
Price | Expiration
Date | Value |
| Put USD vs. Call INR | JPMorgan Chase Bank, N.A. | USD | 22,600,000 | INR | 85.50 | 1/25/29 | $183,308 |
| Put USD vs. Call INR | JPMorgan Chase Bank, N.A. | USD | 12,100,000 | INR | 85.50 | 1/25/29 | 98,143 |
| Put USD vs. Call INR | JPMorgan Chase Bank, N.A. | USD | 11,600,000 | INR | 85.50 | 1/30/29 | 94,262 |
| Total | | | | | | | $375,713 |
| Forward Foreign Currency Exchange Contracts (Centrally Cleared) |
| Currency Purchased | Currency Sold | Settlement
Date | Value/Unrealized
Appreciation
(Depreciation) |
| EUR | 1,296,988 | USD | 1,417,525 | 6/20/24 | $ (30,623) |
| EUR | 19,062,883 | USD | 20,834,504 | 6/20/24 | (450,084) |
| INR | 1,951,000,000 | USD | 23,478,515 | 6/20/24 | (149,240) |
| KRW | 33,500,000,000 | USD | 25,657,718 | 6/20/24 | (1,430,494) |
| USD | 102,399,162 | EUR | 93,691,851 | 6/20/24 | 2,212,109 |
| USD | 52,741,595 | EUR | 48,600,000 | 6/20/24 | 772,392 |
| USD | 24,620,468 | EUR | 22,687,117 | 6/20/24 | 360,563 |
| USD | 20,687,384 | EUR | 19,062,883 | 6/20/24 | 302,964 |
| USD | 4,533,587 | EUR | 4,148,082 | 6/20/24 | 97,938 |
| USD | 3,911,564 | EUR | 3,578,952 | 6/20/24 | 84,501 |
| USD | 2,310,181 | EUR | 2,113,739 | 6/20/24 | 49,906 |
| USD | 2,306,489 | EUR | 2,110,361 | 6/20/24 | 49,827 |
20
See Notes to Financial Statements.
Global Macro Capital Opportunities Portfolio
April 30, 2024
Portfolio of Investments (Unaudited) — continued
| Forward Foreign Currency Exchange Contracts (Centrally Cleared) (continued) |
| Currency Purchased | Currency Sold | Settlement
Date | Value/Unrealized
Appreciation
(Depreciation) |
| USD | 1,694,050 | EUR | 1,550,000 | 6/20/24 | $ 36,596 |
| | | | | | $ 1,906,355 |
| Total Return Swaps (OTC) |
| Counterparty | Notional Amount
(000's omitted) | Portfolio Receives | Portfolio Pays | Termination
Date | Value/Unrealized
Appreciation
(Depreciation) |
| Citibank, N.A. | KRW | 157,500 | Positive Return on KOSPI 200 Index Futures 6/2024 (pays upon termination) | Negative Return on KOSPI 200 Index Futures 6/2024 (pays upon termination) | 6/13/24 | $ 767,022 |
| | | | | | | $767,022 |
| Abbreviations: |
| ADR | – American Depositary Receipt |
| GDP | – Gross Domestic Product |
| GDR | – Global Depositary Receipt |
| OTC | – Over-the-counter |
| Currency Abbreviations: |
| EUR | – Euro |
| INR | – Indian Rupee |
| KRW | – South Korean Won |
| USD | – United States Dollar |
| UZS | – Uzbekistani Som |
21
See Notes to Financial Statements.
Global Macro Capital Opportunities Portfolio
April 30, 2024
Statement of Assets and Liabilities (Unaudited)
| | April 30, 2024 |
| Assets | |
| Unaffiliated investments, at value (identified cost $682,247,266) | $ 808,565,807 |
| Affiliated investments, at value (identified cost $30,630,473) | 30,630,473 |
| Cash | 194,390 |
| Deposits for derivatives collateral: | |
| Centrally cleared derivatives | 12,585,778 |
| OTC derivatives | 2,634,453 |
| Foreign currency, at value (identified cost $7,054,841) | 7,036,349 |
| Interest and dividends receivable | 3,272,014 |
| Dividends receivable from affiliated investments | 99,489 |
| Receivable for investments sold | 12,066,493 |
| Receivable for variation margin on open centrally cleared derivatives | 715,317 |
| Receivable for open swap contracts | 767,022 |
| Tax reclaims receivable | 244,496 |
| Trustees' deferred compensation plan | 14,573 |
| Total assets | $878,826,654 |
| Liabilities | |
| Cash collateral due to brokers | $ 390,000 |
| Payable for investments purchased | 31,613,488 |
| Payable to affiliates: | |
| Investment adviser fee | 636,814 |
| Trustees' fees | 2,962 |
| Trustees' deferred compensation plan | 14,573 |
| Accrued foreign capital gains taxes | 1,282,888 |
| Accrued expenses | 492,132 |
| Total liabilities | $ 34,432,857 |
| Net Assets applicable to investors' interest in Portfolio | $844,393,797 |
22
See Notes to Financial Statements.
Global Macro Capital Opportunities Portfolio
April 30, 2024
Statement of Operations (Unaudited)
| | Six Months Ended |
| | April 30, 2024 |
| Investment Income | |
| Dividend income (net of foreign taxes withheld of $840,822) | $ 8,160,865 |
| Dividend income from affiliated investments | 610,111 |
| Interest income (net of foreign taxes withheld of $17) | 1,243,833 |
| Total investment income | $ 10,014,809 |
| Expenses | |
| Investment adviser fee | $ 3,031,455 |
| Trustees’ fees and expenses | 18,987 |
| Custodian fee | 315,698 |
| Legal and accounting services | 63,358 |
| Miscellaneous | 8,730 |
| Total expenses | $ 3,438,228 |
| Deduct: | |
| Waiver and/or reimbursement of expenses by affiliates | $ 17,573 |
| Total expense reductions | $ 17,573 |
| Net expenses | $ 3,420,655 |
| Net investment income | $ 6,594,154 |
| Realized and Unrealized Gain (Loss) | |
| Net realized gain (loss): | |
| Investment transactions (net of foreign capital gains taxes of $66,597) | $ (3,721,586) |
| Written options | (2,267,365) |
| Futures contracts | (565,961) |
| Swap contracts | 2,846,927 |
| Foreign currency transactions | 46,618 |
| Forward foreign currency exchange contracts | 1,172,724 |
| Net realized loss | $ (2,488,643) |
| Change in unrealized appreciation (depreciation): | |
| Investments (including net increase in accrued foreign capital gains taxes of $1,231,990) | $ 96,446,122 |
| Futures contracts | 729,771 |
| Swap contracts | 2,994,357 |
| Foreign currency | (16,794) |
| Forward foreign currency exchange contracts | 673,366 |
| Net change in unrealized appreciation (depreciation) | $100,826,822 |
| Net realized and unrealized gain | $ 98,338,179 |
| Net increase in net assets from operations | $104,932,333 |
23
See Notes to Financial Statements.
Global Macro Capital Opportunities Portfolio
April 30, 2024
Statements of Changes in Net Assets
| | Six Months Ended
April 30, 2024
(Unaudited) | Year Ended
October 31, 2023 |
| Increase (Decrease) in Net Assets | | |
| From operations: | | |
| Net investment income | $ 6,594,154 | $ 5,896,052 |
| Net realized loss | (2,488,643) | (7,880,442) |
| Net change in unrealized appreciation (depreciation) | 100,826,822 | 22,518,767 |
| Net increase in net assets from operations | $104,932,333 | $ 20,534,377 |
| Capital transactions: | | |
| Contributions | $ 382,896,588 | $ 190,449,338 |
| Withdrawals | (19,845,182) | (18,206,673) |
| Net increase in net assets from capital transactions | $363,051,406 | $172,242,665 |
| Net increase in net assets | $467,983,739 | $192,777,042 |
| Net Assets | | |
| At beginning of period | $ 376,410,058 | $ 183,633,016 |
| At end of period | $844,393,797 | $376,410,058 |
24
See Notes to Financial Statements.
Global Macro Capital Opportunities Portfolio
April 30, 2024
| | Six Months Ended
April 30, 2024
(Unaudited) | Year Ended October 31, |
| | 2023 | 2022 | 2021 | 2020 | 2019 |
| Ratios/Supplemental Data | | | | | | |
| Ratios (as a percentage of average daily net assets): | | | | | | |
| Expenses | 1.11% (1)(2) | 1.15% (2)(3) | 1.26% (2) | 1.24% | 1.28% | 1.29% (4) |
| Net investment income | 2.14% (1) | 2.30% | 2.17% | 1.04% | 0.84% | 1.29% |
| Portfolio Turnover | 18% (5) | 69% | 67% | 70% | 44% | 43% |
| Total Return | 21.73% (5) | 16.11% (3) | (16.87)% | 35.70% | (2.84)% | 7.44% |
| Net assets, end of period (000’s omitted) | $844,394 | $376,410 | $183,633 | $190,503 | $145,694 | $179,334 |
| (1) | Annualized. |
| (2) | Includes a reduction by the investment adviser of a portion of its adviser fee due to the Portfolio’s investment in the Liquidity Fund (equal to less than 0.01% of average daily net assets for the six months ended April 30, 2024 and less than 0.005% of average daily net assets for the years ended October 31, 2023 and 2022). |
| (3) | The investment adviser reimbursed certain operating expenses (equal to 0.05% of average daily net assets for the year ended October 31, 2023). Absent this reimbursement, total return would be lower. |
| (4) | Includes interest expense of 0.01% of average daily net assets for the year ended October 31, 2019. |
| (5) | Not annualized. |
25
See Notes to Financial Statements.
Global Macro Capital Opportunities Portfolio
April 30, 2024
Notes to Financial Statements (Unaudited)
1 Significant Accounting Policies
Global Macro Capital Opportunities Portfolio (the Portfolio) is a Massachusetts business trust registered under the Investment Company Act of 1940, as amended (the 1940 Act), as a diversified, open-end management investment company. The Portfolio’s investment objective is total return. The Declaration of Trust permits the Trustees to issue interests in the Portfolio. At April 30, 2024, Eaton Vance Emerging and Frontier Countries Equity Fund held an interest of approximately 100% in the Portfolio.
The following is a summary of significant accounting policies of the Portfolio. The policies are in conformity with accounting principles generally accepted in the United States of America (U.S. GAAP). The Portfolio is an investment company and follows accounting and reporting guidance in the Financial Accounting Standards Board (FASB) Accounting Standards Codification Topic 946.
A Investment Valuation—The following methodologies are used to determine the market value or fair value of investments.
Equity Securities. Equity securities listed on a U.S. securities exchange generally are valued at the last sale or closing price on the day of valuation or, if no sales took place on such date, at the mean between the closing bid and ask prices on the exchange where such securities are principally traded. Equity securities listed on the NASDAQ National Market System are valued at the NASDAQ official closing price. Unlisted or listed securities for which closing sales prices or closing quotations are not available are valued at the mean between the latest available bid and ask prices or, in the case of preferred equity securities that are not listed or traded in the over-the-counter market, by a third party pricing service that uses various techniques that consider factors including, but not limited to, prices or yields of securities with similar characteristics, benchmark yields, broker/dealer quotes, quotes of underlying common stock, issuer spreads, as well as industry and economic events.
Debt Obligations. Debt obligations are generally valued on the basis of valuations provided by third party pricing services, as derived from such services’ pricing models. Inputs to the models may include, but are not limited to, reported trades, executable bid and ask prices, broker/dealer quotations, prices or yields of securities with similar characteristics, interest rates, anticipated prepayments, benchmark curves or information pertaining to the issuer, as well as industry and economic events. The pricing services may use a matrix approach, which considers information regarding securities with similar characteristics to determine the valuation for a security. Short-term debt obligations purchased with a remaining maturity of sixty days or less for which a valuation from a third party pricing service is not readily available may be valued at amortized cost, which approximates fair value.
Derivatives. U.S. exchange-traded options are valued at the mean between the bid and ask prices at valuation time as reported by the Options Price Reporting Authority. Non-U.S. exchange-traded options and over-the-counter options (including options on securities, indices and foreign currencies) are valued by a third party pricing service using techniques that consider factors including the value of the underlying instrument, the volatility of the underlying instrument and the period of time until option expiration. Forward foreign currency exchange contracts are generally valued at the mean of the average bid and average ask prices that are reported by currency dealers to a third party pricing service at the valuation time. Such third party pricing service valuations are supplied for specific settlement periods and the Portfolio’s forward foreign currency exchange contracts are valued at an interpolated rate between the closest preceding and subsequent settlement period reported by the third party pricing service. Total return swaps are valued using valuations provided by a third party pricing service based on the value of the underlying index or instrument and reference interest rate. Future cash flows on swaps are discounted to their present value using swap rates provided by electronic data services or by broker/dealers.
Foreign Securities and Currencies. Foreign securities and currencies are valued in U.S. dollars, based on foreign currency exchange rate quotations supplied by a third party pricing service. The pricing service uses a proprietary model to determine the exchange rate. Inputs to the model include reported trades and implied bid/ask spreads. The daily valuation of exchange-traded foreign securities generally is determined as of the close of trading on the principal exchange on which such securities trade. Foreign ownership of shares of certain Indian companies may be subject to limitations. When foreign ownership of such an Indian company’s shares approaches the limitation, foreign investors may be willing to pay a premium to the local share price to acquire shares from other foreign investors. Such shares are valued at the closing price for foreign investors as provided by the exchange on which they trade. Events occurring after the close of trading on foreign exchanges may result in adjustments to the valuation of foreign securities to more accurately reflect their fair value as of the close of regular trading on the New York Stock Exchange. When valuing foreign equity securities that meet certain criteria, the Portfolio's Trustees have approved the use of a fair value service that values such securities to reflect market trading that occurs after the close of the applicable foreign markets of comparable securities or other instruments that have a strong correlation to the fair-valued securities.
Other. Investments in management investment companies (including money market funds) that do not trade on an exchange are valued at the net asset value as of the close of each business day.
Fair Valuation. In connection with Rule 2a-5 of the 1940 Act, the Trustees have designated the Portfolio’s investment adviser as its valuation designee. Investments for which valuations or market quotations are not readily available or are deemed unreliable are valued by the investment adviser, as valuation designee, at fair value using methods that most fairly reflect the security’s “fair value”, which is the amount that the Portfolio might reasonably expect to receive for the security upon its current sale in the ordinary course. Each such determination is based on a consideration of relevant factors, which are likely to vary from one pricing context to another. These factors may include, but are not limited to, the type of security, the existence of any contractual restrictions on the security’s disposition, the price and extent of public trading in similar securities of the issuer or of comparable companies or entities, quotations or relevant information obtained from broker/dealers or other market participants, information obtained from the issuer, analysts, and/or the appropriate stock exchange (for exchange-traded securities), an analysis of the company’s or entity’s financial statements, and an evaluation of the forces that influence the issuer and the market(s) in which the security is purchased and sold.
Global Macro Capital Opportunities Portfolio
April 30, 2024
Notes to Financial Statements (Unaudited) — continued
B Investment Transactions—Investment transactions for financial statement purposes are accounted for on a trade date basis. Realized gains and losses on investments sold are determined on the basis of identified cost.
C Income—Dividend income is recorded on the ex-dividend date for dividends received in cash and/or securities. However, if the ex-dividend date has passed, certain dividends from foreign securities are recorded as the Portfolio is informed of the ex-dividend date. Withholding taxes on foreign dividends, interest and capital gains have been provided for in accordance with the Portfolio’s understanding of the applicable countries’ tax rules and rates. Interest income is recorded on the basis of interest accrued, adjusted for amortization of premium or accretion of discount.
D Federal and Other Taxes—The Portfolio has elected to be treated as a partnership for federal tax purposes. No provision is made by the Portfolio for federal or state taxes on any taxable income of the Portfolio because each investor in the Portfolio is ultimately responsible for the payment of any taxes on its share of taxable income. Since at least one of the Portfolio’s investors is a regulated investment company that invests all or substantially all of its assets in the Portfolio, the Portfolio normally must satisfy the applicable source of income and diversification requirements (under the Internal Revenue Code) in order for its investors to satisfy them. The Portfolio will allocate, at least annually among its investors, each investor’s distributive share of the Portfolio’s net investment income, net realized capital gains and losses and any other items of income, gain, loss, deduction or credit.
In addition to the requirements of the Internal Revenue Code, the Portfolio may also be subject to local taxes on the recognition of capital gains in India. In determining the daily net asset value, the Portfolio estimates the accrual for such taxes, if any, based on the unrealized appreciation on certain portfolio securities, the holding period of such securities, the related tax rates, and the availability of any realized losses in excess of gains that may be carried forward to offset future gains. Taxes attributable to unrealized appreciation are included in the change in unrealized appreciation (depreciation) on investments. Capital gains taxes on certain Indian securities sold at a gain are included in net realized gain (loss) on investments.
As of April 30, 2024, the Portfolio had no uncertain tax positions that would require financial statement recognition, de-recognition, or disclosure. The Portfolio files a U.S. federal income tax return annually after its fiscal year-end, which is subject to examination by the Internal Revenue Service for a period of three years from the date of filing.
E Foreign Currency Translation—Investment valuations, other assets, and liabilities initially expressed in foreign currencies are translated each business day into U.S. dollars based upon current exchange rates. Purchases and sales of foreign investment securities and income and expenses denominated in foreign currencies are translated into U.S. dollars based upon currency exchange rates in effect on the respective dates of such transactions. Recognized gains or losses on investment transactions attributable to changes in foreign currency exchange rates are recorded for financial statement purposes as net realized gains and losses on investments. That portion of unrealized gains and losses on investments that results from fluctuations in foreign currency exchange rates is not separately disclosed.
F Use of Estimates—The preparation of the financial statements in conformity with U.S. GAAP requires management to make estimates and assumptions that affect the reported amounts of assets and liabilities at the date of the financial statements and the reported amounts of income and expense during the reporting period. Actual results could differ from those estimates.
G Indemnifications—Under the Portfolio’s organizational documents, its officers and Trustees may be indemnified against certain liabilities and expenses arising out of the performance of their duties to the Portfolio. Under Massachusetts law, if certain conditions prevail, interestholders in the Portfolio could be deemed to have personal liability for the obligations of the Portfolio. However, the Portfolio’s Declaration of Trust contains an express disclaimer of liability on the part of Portfolio interestholders. Additionally, in the normal course of business, the Portfolio enters into agreements with service providers that may contain indemnification clauses. The Portfolio’s maximum exposure under these arrangements is unknown as this would involve future claims that may be made against the Portfolio that have not yet occurred.
H Futures Contracts—Upon entering into a futures contract, the Portfolio is required to deposit with the broker, either in cash or securities, an amount equal to a certain percentage of the contract amount (initial margin). Subsequent payments, known as variation margin, are made or received by the Portfolio each business day, depending on the daily fluctuations in the value of the underlying security or index, and are recorded as unrealized gains or losses by the Portfolio. Gains (losses) are realized upon the expiration or closing of the futures contracts. Should market conditions change unexpectedly, the Portfolio may not achieve the anticipated benefits of the futures contracts and may realize a loss. Futures contracts have minimal counterparty risk as they are exchange traded and the clearinghouse for the exchange is substituted as the counterparty, guaranteeing counterparty performance.
I Forward Foreign Currency Exchange Contracts—The Portfolio may enter into forward foreign currency exchange contracts for the purchase or sale of a specific foreign currency at a fixed price on a future date. The forward foreign currency exchange contracts are adjusted by the daily exchange rate of the underlying currency and any gains or losses are recorded as unrealized until such time as the contracts have been closed. While forward foreign currency exchange contracts are privately negotiated agreements between the Portfolio and a counterparty, certain contracts may be “centrally cleared”, whereby all payments made or received by the Portfolio pursuant to the contract are with a central clearing party (CCP) rather than the original counterparty. The CCP guarantees the performance of the original parties to the contract. Upon entering into centrally cleared contracts, the Portfolio is required to deposit with the CCP, either in cash or securities, an amount of initial margin determined by the CCP, which is subject to adjustment. For centrally cleared contracts, the daily change in valuation is recorded as a receivable or payable for variation margin and settled in cash with the CCP daily. Risks may arise upon entering these contracts from the potential inability of counterparties to meet the terms of their contracts and from movements in the value of a foreign currency relative to the U.S. dollar. In the case of centrally cleared contracts, counterparty risk is minimal due to protections provided by the CCP.
Global Macro Capital Opportunities Portfolio
April 30, 2024
Notes to Financial Statements (Unaudited) — continued
J Purchased Options—Upon the purchase of a call or put option, the premium paid by the Portfolio is included in the Statement of Assets and Liabilities as an investment. The amount of the investment is subsequently marked-to-market to reflect the current market value of the option purchased, in accordance with the Portfolio’s policies on investment valuations discussed above. Premiums paid for purchasing options that expire are treated as realized losses. Premiums paid for purchasing options that are exercised or closed are added to the amounts paid or offset against the proceeds on the underlying investment transaction to determine the realized gain or loss. The risk associated with purchasing options is limited to the premium originally paid. Purchased options traded over-the-counter involve risk that the issuer or counterparty will fail to perform its contractual obligations.
K Written Options—Upon the writing of a call or a put option, the premium received by the Portfolio is included in the Statement of Assets and Liabilities as a liability. The amount of the liability is subsequently marked-to-market to reflect the current market value of the option written, in accordance with the Portfolio’s policies on investment valuations discussed above. Premiums received from writing options that expire are treated as realized gains. Premiums received from writing options that are exercised or are closed are added to or offset against the proceeds or amount paid on the transaction to determine the realized gain or loss. The Portfolio, as a writer of an option, may have no control over whether the underlying instrument may be sold (call) or purchased (put) and, as a result, bears the market risk of an unfavorable change in the price of the instrument underlying the written option. The Portfolio may also bear the risk of not being able to enter into a closing transaction if a liquid secondary market does not exist.
L Total Return Swaps—In a total return swap, the buyer receives a periodic return equal to the total return of a specified security, securities or index for a specified period of time. In return, the buyer pays the counterparty a fixed or variable stream of payments, typically based upon short-term interest rates, possibly plus or minus an agreed upon spread. During the term of the outstanding swap agreement, changes in the underlying value of the swap are recorded as unrealized gains and losses. Periodic payments received or made are recorded as realized gains or losses. The Portfolio is exposed to credit loss in the event of nonperformance by the swap counterparty. Risk may also arise from the unanticipated movements in value of exchange rates, interest rates, securities, or the index.
M Interim Financial Statements—The interim financial statements relating to April 30, 2024 and for the six months then ended have not been audited by an independent registered public accounting firm, but in the opinion of the Portfolio’s management, reflect all adjustments, consisting only of normal recurring adjustments, necessary for the fair presentation of the financial statements.
2 Investment Adviser Fee and Other Transactions with Affiliates
The investment adviser fee is earned by Boston Management and Research (BMR), an indirect, wholly-owned subsidiary of Morgan Stanley, as compensation for investment advisory services rendered to the Portfolio. The investment adviser fee is computed at an annual rate as a percentage of the Portfolio’s average daily net assets as follows and is payable monthly:
| Average Daily Net Assets | Annual Fee Rate |
| Up to $500 million | 1.000% |
| $500 million but less than $1 billion | 0.950% |
| $1 billion but less than $2.5 billion | 0.925% |
| $2.5 billion but less than $5 billion | 0.900% |
| $5 billion and over | 0.880% |
For the six months ended April 30, 2024, the Portfolio’s investment adviser fee amounted to $3,031,455 or 0.98% (annualized) of the Portfolio’s average daily net assets. Pursuant to an investment sub-advisory agreement, BMR has delegated a portion of the investment management of the Portfolio to Eaton Vance Advisers International Ltd. (EVAIL), an affiliate of BMR and an indirect, wholly-owned subsidiary of Morgan Stanley. BMR pays EVAIL a portion of its investment adviser fee for sub-advisory services provided to the Portfolio.
The Portfolio may invest in a money market fund, the Institutional Class of the Morgan Stanley Institutional Liquidity Funds - Government Portfolio (the “Liquidity Fund”), an open-end management investment company managed by Morgan Stanley Investment Management Inc., a wholly-owned subsidiary of Morgan Stanley. The investment adviser fee paid by the Portfolio is reduced by an amount equal to its pro rata share of the advisory and administration fees paid by the Portfolio due to its investment in the Liquidity Fund. For the six months ended April 30, 2024, the investment adviser fee paid was reduced by $17,573 relating to the Portfolio’s investment in the Liquidity Fund.
Trustees and officers of the Portfolio who are members of BMR’s organization receive remuneration for their services to the Portfolio out of the investment adviser fee. Trustees of the Portfolio who are not affiliated with the investment adviser may elect to defer receipt of all or a percentage of their annual fees in accordance with the terms of the Trustees Deferred Compensation Plan. Certain officers and Trustees of the Portfolio are officers of the above organization.
Global Macro Capital Opportunities Portfolio
April 30, 2024
Notes to Financial Statements (Unaudited) — continued
3 Purchases and Sales of Investments
Purchases and sales of investments, other than short-term obligations, aggregated $488,250,611 and $103,291,982, respectively, for the six months ended April 30, 2024.
4 Federal Income Tax Basis of Investments
The cost and unrealized appreciation (depreciation) of investments, including open derivative contracts, of the Portfolio at April 30, 2024, as determined on a federal income tax basis, were as follows:
| Aggregate cost | $ 719,671,364 |
| Gross unrealized appreciation | $ 136,788,942 |
| Gross unrealized depreciation | (14,590,649) |
| Net unrealized appreciation | $ 122,198,293 |
5 Financial Instruments
The Portfolio may trade in financial instruments with off-balance sheet risk in the normal course of its investing activities. These financial instruments may include written options, forward foreign currency exchange contracts, futures contracts and swap contracts and may involve, to a varying degree, elements of risk in excess of the amounts recognized for financial statement purposes. The notional or contractual amounts of these instruments represent the investment the Portfolio has in particular classes of financial instruments and do not necessarily represent the amounts potentially subject to risk. The measurement of the risks associated with these instruments is meaningful only when all related and offsetting transactions are considered. A summary of obligations under these financial instruments at April 30, 2024 is included in the Portfolio of Investments. At April 30, 2024, the Portfolio had sufficient cash and/or securities to cover commitments under these contracts.
In the normal course of pursuing its investment objective, the Portfolio is subject to the following risks:
Equity Price Risk: During the six months ended April 30, 2024, the Portfolio entered into equity index futures contracts, equity index options and total return swaps to enhance total return, to manage certain investment risks and/or as a substitute for the purchase of securities.
Foreign Exchange Risk: The Portfolio engages in forward foreign currency exchange contracts and currency options to enhance total return, to seek to hedge against fluctuations in currency exchange rates and/or as a substitute for the purchase or sale of securities or currencies.
The Portfolio enters into over-the-counter (OTC) derivatives that may contain provisions whereby the counterparty may terminate the contract under certain conditions, including but not limited to a decline in the Portfolio’s net assets below a certain level over a certain period of time, which would trigger a payment by the Portfolio for those derivatives in a liability position. At April 30, 2024, the Portfolio had no open derivatives with credit-related contingent features in a net liability position.
The OTC derivatives in which the Portfolio invests (except for written options as the Portfolio, not the counterparty, is obligated to perform) are subject to the risk that the counterparty to the contract fails to perform its obligations under the contract. To mitigate this risk, the Portfolio has entered into an International Swaps and Derivatives Association, Inc. Master Agreement (“ISDA Master Agreement”) or similar agreement with substantially all its derivative counterparties. An ISDA Master Agreement is a bilateral agreement between the Portfolio and a counterparty that governs certain OTC derivatives and typically contains, among other things, set-off provisions in the event of a default and/or termination event as defined under the relevant ISDA Master Agreement. Under an ISDA Master Agreement, the Portfolio may, under certain circumstances, offset with the counterparty certain derivative financial instruments’ payables and/or receivables with collateral held and/or posted and create one single net payment. The provisions of the ISDA Master Agreement typically permit a single net payment in the event of default including the bankruptcy or insolvency of the counterparty. However, bankruptcy or insolvency laws of a particular jurisdiction may impose restrictions on or prohibitions against the right of offset in bankruptcy or insolvency. Certain ISDA Master Agreements allow counterparties to OTC derivatives to terminate derivative contracts prior to maturity in the event the Portfolio’s net assets decline by a stated percentage or the Portfolio fails to meet the terms of its ISDA Master Agreements, which would cause the counterparty to accelerate payment by the Portfolio of any net liability owed to it.
The collateral requirements for derivatives traded under an ISDA Master Agreement are governed by a Credit Support Annex to the ISDA Master Agreement. Collateral requirements are determined at the close of business each day and are typically based on changes in market values for each transaction under an ISDA Master Agreement and netted into one amount for such agreement. Generally, the amount of collateral due from or to a counterparty is subject to a minimum transfer threshold amount before a transfer is required, which may vary by counterparty. Collateral pledged for the benefit of the Portfolio and/or counterparty is held in segregated accounts by the Portfolio’s custodian and cannot be sold, re-pledged, assigned or otherwise used while pledged. The portion of such collateral representing cash, if any, is reflected as deposits for derivatives collateral and, in the case of cash pledged by a counterparty for
Global Macro Capital Opportunities Portfolio
April 30, 2024
Notes to Financial Statements (Unaudited) — continued
the benefit of the Portfolio, a corresponding liability on the Statement of Assets and Liabilities. Securities pledged by the Portfolio as collateral, if any, are identified as such in the Portfolio of Investments. The carrying amount of the liability for cash collateral due to brokers at April 30, 2024 approximated its fair value. If measured at fair value, such liability would have been considered as Level 2 in the fair value hierarchy (see Note 8) at April 30, 2024.
The fair value of open derivative instruments (not considered to be hedging instruments for accounting disclosure purposes) by risk exposure at April 30, 2024 was as follows:
| | Fair Value |
| Statement of Assets and Liabilities Caption | Equity
Price | Foreign
Exchange | Total |
| Unaffiliated investments, at value | $ — | $ 375,713 | $ 375,713 |
| Not applicable | — | 3,966,796* | 3,966,796 |
| Receivable for open swap contracts | 767,022 | — | 767,022 |
| Total Asset Derivatives | $767,022 | $ 4,342,509 | $ 5,109,531 |
| Derivatives not subject to master netting or similar agreements | $ — | $ 3,966,796 | $ 3,966,796 |
| Total Asset Derivatives subject to master netting or similar agreements | $767,022 | $ 375,713 | $ 1,142,735 |
| Not applicable | — | (2,060,441)* | (2,060,441) |
| Derivatives not subject to master netting or similar agreements | $ — | $(2,060,441) | $(2,060,441) |
| Total Liability Derivatives subject to master netting or similar agreements | $ — | $ — | $ — |
| * | Only the current day’s variation margin on open centrally cleared derivatives is reported within the Statement of Assets and Liabilities as Receivable or Payable for variation margin on open centrally cleared derivatives. |
The Portfolio’s derivative assets and liabilities at fair value by risk, which are reported gross in the Statement of Assets and Liabilities, are presented in the table above. The following table presents the Portfolio’s derivative assets by counterparty, net of amounts available for offset under a master netting agreement and net of the related collateral received by the Portfolio for such assets as of April 30, 2024.
| Counterparty | Derivative
Assets Subject to
Master Netting
Agreement | Derivatives
Available
for Offset | Non-cash
Collateral
Received(a) | Cash
Collateral
Received(a) | Net Amount
of Derivative
Assets(b) | Total Cash
Collateral
Received |
| Citibank, N.A. | $ 767,022 | $ — | $ — | $ — | $ 767,022 | $ — |
| JPMorgan Chase Bank, N.A. | 375,713 | — | — | (375,713) | — | 390,000 |
| | $1,142,735 | $ — | $ — | $(375,713) | $767,022 | $390,000 |
| (a) | In some instances, the total collateral received may be more than the amount shown due to overcollateralization. |
| (b) | Net amount represents the net amount due from the counterparty in the event of default. |
Global Macro Capital Opportunities Portfolio
April 30, 2024
Notes to Financial Statements (Unaudited) — continued
The effect of derivative instruments (not considered to be hedging instruments for accounting disclosure purposes) on the Statement of Operations by risk exposure for the six months ended April 30, 2024 was as follows:
| Statement of Operations Caption | Equity
Price | Foreign
Exchange | Total |
| Net realized gain (loss): | | | |
| Investment transactions | $ 3,159,415(1) | $ — | $ 3,159,415 |
| Written options | (2,267,365) | — | (2,267,365) |
| Futures contracts | (565,961) | — | (565,961) |
| Swap contracts | 2,846,927 | — | 2,846,927 |
| Forward foreign currency exchange contracts | — | 1,172,724 | 1,172,724 |
| Total | $ 3,173,016 | $1,172,724 | $ 4,345,740 |
| Change in unrealized appreciation (depreciation): | | | |
| Investments | $ — | $ (9,847)(1) | $ (9,847) |
| Futures contracts | 729,771 | — | 729,771 |
| Swap contracts | 2,994,357 | — | 2,994,357 |
| Forward foreign currency exchange contracts | — | 673,366 | 673,366 |
| Total | $ 3,724,128 | $ 663,519 | $ 4,387,647 |
| (1) | Relates to purchased options. |
The average notional cost of futures contracts and average notional amounts of other derivative contracts outstanding during the six months ended April 30, 2024, which are indicative of the volume of these derivative types, were approximately as follows:
Futures
Contracts — Long | Forward
Foreign Currency
Exchange Contracts* | Swap
Contracts |
| $34,554,000 | $237,842,000 | $38,802,000 |
| * | The average notional amount for forward foreign currency exchange contracts is based on the absolute value of notional amounts of currency purchased and currency sold. |
The average number of purchased and written equity index options contracts outstanding during the six months ended April 30, 2024, which is indicative of the volume of this derivative type, was 709 and 709 contracts, respectively. The average principal amount of purchased currency options contracts outstanding during the six months ended April 30, 2024, which is indicative of the volume of this derivative type, was approximately $26,457,000.
6 Line of Credit
The Portfolio participates with other portfolios and funds managed by BMR and its affiliates in a $650 million unsecured revolving line of credit agreement with a group of banks, which is in effect through October 22, 2024. Borrowings are made by the Portfolio solely for temporary purposes related to redemptions and other short-term cash needs. Interest is charged to the Portfolio based on its borrowings at an amount above either the Secured Overnight Financing Rate (SOFR) or Federal Funds rate. In addition, a fee computed at an annual rate of 0.15% on the daily unused portion of the line of credit is allocated among the participating portfolios and funds at the end of each quarter. In connection with the renewal of the agreement in October 2023, an arrangement fee of $150,000 was incurred that was allocated to the participating portfolios and funds. Because the line of credit is not available exclusively to the Portfolio, it may be unable to borrow some or all of its requested amounts at any particular time. The Portfolio did not have any significant borrowings or allocated fees during the six months ended April 30, 2024.
Global Macro Capital Opportunities Portfolio
April 30, 2024
Notes to Financial Statements (Unaudited) — continued
7 Affiliated Investments
At April 30, 2024, the value of the Portfolio's investment in funds that may be deemed to be affiliated was $30,630,473, which represents 3.6% of the Portfolio's net assets. Transactions in such investments by the Portfolio for the six months ended April 30, 2024 were as follows:
| Name | Value,
beginning
of period | Purchases | Sales
proceeds | Net realized
gain (loss) | Change in
unrealized
appreciation
(depreciation) | Value, end
of period | Dividend
income | Shares,
end of period |
| Short-Term Investments |
| Liquidity Fund | $28,891,215 | $359,452,993 | $(357,713,735) | $ — | $ — | $30,630,473 | $610,111 | 30,630,473 |
8 Fair Value Measurements
Under generally accepted accounting principles for fair value measurements, a three-tier hierarchy to prioritize the assumptions, referred to as inputs, is used in valuation techniques to measure fair value. The three-tier hierarchy of inputs is summarized in the three broad levels listed below.
| • | Level 1 – quoted prices in active markets for identical investments |
| • | Level 2 – other significant observable inputs (including quoted prices for similar investments, interest rates, prepayment speeds, credit risk, etc.) |
| • | Level 3 – significant unobservable inputs (including a fund's own assumptions in determining the fair value of investments) |
In cases where the inputs used to measure fair value fall in different levels of the fair value hierarchy, the level disclosed is determined based on the lowest level input that is significant to the fair value measurement in its entirety. The inputs or methodology used for valuing securities are not necessarily an indication of the risk associated with investing in those securities.
At April 30, 2024, the hierarchy of inputs used in valuing the Portfolio’s investments and open derivative instruments, which are carried at fair value, were as follows:
| Asset Description | Level 1 | Level 2 | Level 3 | Total |
| Common Stocks: | | | | |
| Asia/Pacific | $ 1,147,243 | $ 259,347,903 | $ — | $ 260,495,146 |
| Emerging Europe | 833,908 | 376,643,727 | — | 377,477,635 |
| Latin America | 43,759,033 | — | — | 43,759,033 |
| Middle East/Africa | — | 107,823,062 | — | 107,823,062 |
| Total Common Stocks | $ 45,740,184 | $ 743,814,692* | $ — | $ 789,554,876 |
| Loan Participation Notes | $ — | $ — | $ 10,782,601 | $ 10,782,601 |
| Preferred Stocks | — | 5,908,776 | — | 5,908,776 |
| Sovereign Government Bonds | — | 445,235 | — | 445,235 |
| Short-Term Investments: | | | | |
| Affiliated Fund | 30,630,473 | — | — | 30,630,473 |
| U.S. Treasury Obligations | — | 1,498,606 | — | 1,498,606 |
| Purchased Currency Options | — | 375,713 | — | 375,713 |
| Total Investments | $ 76,370,657 | $ 752,043,022 | $ 10,782,601 | $ 839,196,280 |
| Forward Foreign Currency Exchange Contracts | $ — | $ 3,966,796 | $ — | $ 3,966,796 |
| Swap Contracts | — | 767,022 | — | 767,022 |
| Total | $ 76,370,657 | $ 756,776,840 | $ 10,782,601 | $ 843,930,098 |
Global Macro Capital Opportunities Portfolio
April 30, 2024
Notes to Financial Statements (Unaudited) — continued
| Liability Description | Level 1 | Level 2 | Level 3 | Total |
| Forward Foreign Currency Exchange Contracts | $ — | $ (2,060,441) | $ — | $ (2,060,441) |
| Total | $ — | $ (2,060,441) | $ — | $ (2,060,441) |
| * | Includes foreign equity securities whose values were adjusted to reflect market trading of comparable securities or other correlated instruments that occurred after the close of trading in their applicable foreign markets. |
The following is a reconciliation of Level 3 investments for which significant unobservable inputs were used to determine fair value:
| | Loan
Participation
Notes |
| Balance as of October 31, 2023 | $10,052,327 |
| Realized gains (losses) | — |
| Change in net unrealized appreciation (depreciation) | 637,264 |
| Cost of purchases | — |
| Proceeds from sales, including return of capital | — |
| Accrued discount (premium) | 93,010 |
| Transfers to Level 3 | — |
| Transfers from Level 3 | — |
| Balance as of April 30, 2024 | $10,782,601 |
| Change in net unrealized appreciation (depreciation) on investments still held as of April 30, 2024 | $ 637,264 |
The following is a summary of quantitative information about significant unobservable valuation inputs for Level 3 investments held as of April 30, 2024:
| Type of Investment | Fair Value as of
April 30, 2024 | Valuation Technique | Unobservable Input | Range of Unobservable Input | Impact to
Valuation from an
Increase to Input* |
| Loan Participation Notes | $10,782,601 | Matrix Pricing | Adjusted Credit Spread to the Central Bank of Uzbekistan Quoted Policy Rate | 4.38% - 6.67%** | Decrease |
| * | Represents the directional change in the fair value of the Level 3 investments that would result from an increase to the corresponding unobservable input. A decrease to the unobservable input would have the opposite effect. |
| ** | The weighted average of the unobservable input is 5.81% based on relative principal amounts. |
9 Risks and Uncertainties
Risks Associated with Foreign Investments
Foreign investments can be adversely affected by political, economic and market developments abroad, including the imposition of economic and other sanctions by the United States or another country. There may be less publicly available information about foreign issuers because they may not be subject to reporting practices, requirements or regulations comparable to those to which United States companies are subject. Foreign markets may be smaller, less liquid and more volatile than the major markets in the United States. Trading in foreign markets typically involves higher expense than trading in the United States. The Portfolio may have difficulties enforcing its legal or contractual rights in a foreign country. Securities that trade or are denominated in currencies other than the U.S. dollar may be adversely affected by fluctuations in currency exchange rates.
Global Macro Capital Opportunities Portfolio
April 30, 2024
Notes to Financial Statements (Unaudited) — continued
Emerging market securities often involve greater risks than developed market securities. Investment markets within emerging market countries are typically smaller, less liquid, less developed and more volatile than those in more developed markets like the United States, and may be focused in certain economic sectors. The information available about an emerging market issuer may be less reliable than for comparable issuers in more developed capital markets. Governmental actions can have a significant effect on the economic conditions in emerging market countries. It may be more difficult to make a claim or obtain a judgment in the courts of these countries than it is in the United States. The possibility of fraud, negligence, undue influence being exerted by an issuer or refusal to recognize ownership exists in some emerging markets. Disruptions due to work stoppages and trading improprieties in foreign securities markets have caused such markets to close. Emerging market securities are also subject to speculative trading, which contributes to their volatility.
Frontier markets are among the smallest and least mature investment markets. Frontier market countries may have greater political or economic instability and may also be subject to trade barriers, adjustments in currency values and developing or changing securities laws and other regulations. Investments in frontier market countries generally are less liquid and subject to greater price volatility than investments in developed markets or emerging markets.
Eaton Vance
Emerging and Frontier Countries Equity Fund
April 30, 2024
| Officers of Eaton Vance Emerging and Frontier Countries Equity Fund and Global Macro Capital Opportunities Portfolio |
Kenneth A. Topping
President | Nicholas S. Di Lorenzo
Secretary |
Deidre E. Walsh
Vice President and Chief Legal Officer | Laura T. Donovan
Chief Compliance Officer |
James F. Kirchner
Treasurer | |
| Trustees of Eaton Vance Emerging and Frontier Countries Equity Fund and Global Macro Capital Opportunities Portfolio | |
George J. Gorman
Chairperson | |
| Alan C. Bowser | |
| Mark R. Fetting | |
| Cynthia E. Frost | |
| Valerie A. Mosley | |
| Anchal Pachnanda* | |
| Keith Quinton | |
| Marcus L. Smith | |
| Susan J. Sutherland | |
| Scott E. Wennerholm | |
| Nancy A. Wiser | |
| U.S. Customer Privacy Notice | March 2024 |
| FACTS | WHAT DOES EATON VANCE DO WITH YOUR PERSONAL INFORMATION? |
| Why? | Financial companies choose how they share your personal information. Federal law gives consumers the right to limit some but not all sharing. Federal law also requires us to tell you how we collect, share, and protect your personal information. Please read this notice carefully to understand what we do. |
| |
| What? | The types of personal information we collect and share depend on the product or service you have with us. This information can include:■ Social Security number and income
■ investment experience and risk tolerance
■ checking account information and wire transfer instructions |
| |
| How? | All financial companies need to share customers’ personal information to run their everyday business. In the section below, we list the reasons financial companies can share their customers’ personal information; the reasons Eaton Vance chooses to share; and whether you can limit this sharing. |
| Reasons we can share your personal information | Does Eaton Vance
share? | Can you limit
this sharing? |
| For our everyday business purposes — such as to process your transactions, maintain your account(s), respond to court orders and legal investigations, or report to credit bureaus | Yes | No |
| For our marketing purposes — to offer our products and services to you | Yes | No |
| For joint marketing with other financial companies | No | We don’t share |
| For our affiliates’ everyday business purposes — information about your transactions and experiences | Yes | No* |
| For our affiliates’ everyday business purposes — information about your creditworthiness | Yes | Yes* |
| For our affiliates to market to you | Yes | Yes* |
| For nonaffiliates to market to you | No | We don’t share |
To limit our
sharing | Call toll-free 1-800-262-1122 or email: EVPrivacy@eatonvance.comPlease note:If you are a new customer, we can begin sharing your information 30 days from the date we sent this notice. When you are no longer our customer, we continue to share your information as described in this notice. However, you can contact us at any time to limit our sharing. |
| Questions? | Call toll-free 1-800-262-1122 or email: EVPrivacy@eatonvance.com |
| U.S. Customer Privacy Notice — continued | March 2024 |
| Who we are |
| Who is providing this notice? | Eaton Vance Management and our investment management affiliates (“Eaton Vance”) (see Affiliates definition below.) |
| What we do |
How does Eaton Vance
protect my personal
information? | To protect your personal information from unauthorized access and use, we use security measures that comply with federal law. These measures include computer safeguards and secured files and buildings. We have policies governing the proper handling of customer information by personnel and requiring third parties that provide support to adhere to appropriate security standards with respect to such information. |
How does Eaton Vance
collect my personal
information? | We collect your personal information, for example, when you■ open an account or make deposits or withdrawals from your account
■ buy securities from us or make a wire transfer
■ give us your contact informationWe also collect your personal information from others, such as credit bureaus, affiliates, or other companies. |
| Why can’t I limit all sharing? | Federal law gives you the right to limit only■ sharing for affiliates’ everyday business purposes — information about your creditworthiness
■ affiliates from using your information to market to you
■ sharing for nonaffiliates to market to youState laws and individual companies may give you additional rights to limit sharing. (See below for more on your rights under state law.) |
What happens when I limit
sharing for an account I hold
jointly with someone else? | Your choices will apply to everyone on your account. |
| Definitions |
| Affiliates | Companies related by common ownership or control. They can be financial and nonfinancial companies.■ Our affiliates include registered investment advisers such as Eaton Vance Management, Eaton Vance Advisers International Ltd., Boston Management and Research, Calvert Research and Management, Parametric Portfolio Associates LLC, Atlanta Capital Management Company LLC, Morgan Stanley Investment Management Inc., Morgan Stanley Investment Management Co.; registered broker-dealers such as Morgan Stanley Distributors Inc. and Eaton Vance Distributors, Inc. (together, the “Investment Management Affiliates”); and companies with a Morgan Stanley name and financial companies such as Morgan Stanley Smith Barney LLC and Morgan Stanley & Co. (the “Morgan Stanley Affiliates”). |
| Nonaffiliates | Companies not related by common ownership or control. They can be financial and nonfinancial companies.■ Eaton Vance does not share with nonaffiliates so they can market to you. |
| Joint marketing | A formal agreement between nonaffiliated financial companies that together market financial products or services to you.■ Eaton Vance does not jointly market. |
| U.S. Customer Privacy Notice — continued | March 2024 |
| Other important information |
| *PLEASE NOTE: Eaton Vance does not share your creditworthiness information or your transactions and experiences information with the Morgan Stanley Affiliates, nor does Eaton Vance enable the Morgan Stanley Affiliates to market to you. Your opt outs will prevent Eaton Vance from sharing your creditworthiness information with the Investment Management Affiliates and will prevent the Investment Management Affiliates from marketing their products to you.Vermont: Except as permitted by law, we will not share personal information we collect about Vermont residents with Nonaffiliates unless you provide us with your written consent to share such information.California: Except as permitted by law, we will not share personal information we collect about California residents with Nonaffiliates and we will limit sharing such personal information with our Affiliates to comply with California privacy laws that apply to us. |
Delivery of Shareholder Documents. The Securities and Exchange Commission (SEC) permits funds to deliver only one copy of shareholder documents, including prospectuses, proxy statements and shareholder reports, to fund investors with multiple accounts at the same residential or post office box address. This practice is often called “householding” and it helps eliminate duplicate mailings to shareholders. Eaton Vance, or your financial intermediary, may household the mailing of your documents indefinitely unless you instruct Eaton Vance, or your financial intermediary, otherwise. If you would prefer that your Eaton Vance documents not be householded, please contact Eaton Vance at 1-800-262-1122, or contact your financial intermediary. Your instructions that householding not apply to delivery of your Eaton Vance documents will typically be effective within 30 days of receipt by Eaton Vance or your financial intermediary.
Portfolio Holdings. Each Eaton Vance Fund and its underlying Portfolio(s) (if applicable) files a schedule of portfolio holdings on Part F to Form N-PORT with the SEC. Certain information filed on Form N-PORT may be viewed on the Eaton Vance website at www.eatonvance.com, by calling Eaton Vance at 1-800-262-1122 or in the EDGAR database on the SEC’s website at www.sec.gov.
Proxy Voting. From time to time, funds are required to vote proxies related to the securities held by the funds. The Eaton Vance Funds or their underlying Portfolios (if applicable) vote proxies according to a set of policies and procedures approved by the Funds’ and Portfolios’ Boards. You may obtain a description of these policies and procedures and information on how the Funds or Portfolios voted proxies relating to portfolio securities during the most recent 12-month period ended June 30, without charge, upon request, by calling 1-800-262-1122 and by accessing the SEC’s website at www.sec.gov.
Tailored Shareholder Reports. Effective January 24, 2023, the SEC adopted rule and form amendments to require open-end mutual funds and ETFs to transmit concise and visually engaging streamlined annual and semi-annual reports to shareholders that highlight key information. Other information, including financial statements, will no longer appear in a streamlined shareholder report but must be available online, delivered free of charge upon request, and filed on a semi-annual basis on Form N-CSR. The rule and form amendments have a compliance date of July 24, 2024. At this time, management is evaluating the impact of these amendments on the shareholder reports for the Eaton Vance Funds.
This Page Intentionally Left Blank
Investment Adviser of Global Macro Capital Opportunities Portfolio
Boston Management and Research
One Post Office Square
Boston, MA 02109
Investment Adviser and Administrator of Eaton Vance
Emerging and Frontier Countries Equity Fund
Eaton Vance Management
One Post Office Square
Boston, MA 02109
Investment Sub-Adviser
Eaton Vance Advisers International Ltd.
125 Old Broad Street
London, EC2N 1AR
United Kingdom
Principal Underwriter*
Eaton Vance Distributors, Inc.
One Post Office Square
Boston, MA 02109
(617) 482-8260
Custodian
State Street Bank and Trust Company
One Congress Street, Suite 1
Boston, MA 02114-2016
Transfer Agent
BNY Mellon Investment Servicing (US) Inc.
Attn: Eaton Vance Funds
P.O. Box 534439
Pittsburgh, PA 15253-4439
(800) 262-1122
Fund Offices
One Post Office Square
Boston, MA 02109
* FINRA BrokerCheck. Investors may check the background of their Investment Professional by contacting the Financial Industry Regulatory Authority (FINRA). FINRA BrokerCheck is a free tool to help investors check the professional background of current and former FINRA-registered securities firms and brokers. FINRA BrokerCheck is available by calling 1-800-289-9999 and at www.FINRA.org. The FINRA BrokerCheck brochure describing this program is available to investors at www.FINRA.org.
Item 2. Code of Ethics
Not required in this filing.
Item 3. Audit Committee Financial Expert
Not required in this filing.
Item 4. Principal Accountant Fees and Services
Not required in this filing.
Item 5. Audit Committee of Listed Registrants
Not applicable.
Item 6. Schedule of Investments
Please see schedule of investments contained in the Report to Stockholders included under Item 1 of this Form N-CSR.
Item 7. Disclosure of Proxy Voting Policies and Procedures for Closed-End Management Investment Companies
Not applicable.
Item 8. Portfolio Managers of Closed-End Management Investment Companies
Not applicable.
Item 9. Purchases of Equity Securities by Closed-End Management Investment Company and Affiliated Purchasers
Not applicable.
Item 10. Submission of Matters to a Vote of Security Holders
No material changes.
Item 11. Controls and Procedures
(a) It is the conclusion of the registrant’s principal executive officer and principal financial officer that the effectiveness of the registrant’s current disclosure controls and procedures (such disclosure controls and procedures having been evaluated within 90 days of the date of this filing) provide reasonable assurance that the information required to be disclosed by the registrant has been recorded, processed, summarized and reported within the time period specified in the Commission’s rules and forms and that the information required to be disclosed by the registrant has been accumulated and communicated to the registrant’s principal executive officer and principal financial officer in order to allow timely decisions regarding required disclosure.
(b) There have been no changes in the registrant’s internal controls over financial reporting during the period covered by this report that has materially affected, or is reasonably likely to materially affect, the registrant’s internal control over financial reporting.
Item 12. Disclosure of Securities Lending Activities for Closed-End Management Investment Companies
Not applicable.
Item 13. Exhibits
| (a)(1) | Registrant’s Code of Ethics – Not applicable (please see Item 2). |
Signatures
Pursuant to the requirements of the Securities Exchange Act of 1934 and the Investment Company Act of 1940, the registrant has duly caused this report to be signed on its behalf by the undersigned, thereunto duly authorized.
| | |
| Eaton Vance Mutual Funds Trust |
| |
| By: | | /s/ Kenneth A. Topping |
| | Kenneth A. Topping |
| | Principal Executive Officer |
| |
| Date: | | June 25, 2024 |
Pursuant to the requirements of the Securities Exchange Act of 1934 and the Investment Company Act of 1940, this report has been signed below by the following persons on behalf of the registrant and in the capacities and on the dates indicated.
| | |
| By: | | /s/ James F. Kirchner |
| | James F. Kirchner |
| | Principal Financial Officer |
| |
| Date: | | June 25, 2024 |
| |
| By: | | /s/ Kenneth A. Topping |
| | Kenneth A. Topping |
| | Principal Executive Officer |
| |
| Date: | | June 25, 2024 |