UNITED STATES
SECURITIES AND EXCHANGE COMMISSION
Washington, D.C. 20549
Form N-CSR
CERTIFIED SHAREHOLDER REPORT OF REGISTERED
MANAGEMENT INVESTMENT COMPANIES
Investment Company Act File Number: 811-04015
Eaton Vance Mutual Funds Trust
(Exact Name of Registrant as Specified in Charter)
One Post Office Square, Boston, Massachusetts 02109
(Address of Principal Executive Offices)
Deidre E. Walsh
One Post Office Square, Boston, Massachusetts 02109
(Name and Address of Agent for Services)
(617) 482-8260
(Registrant’s Telephone Number)
December 31
Date of Fiscal Year End
June 30, 2024
Date of Reporting Period
Item 1. Reports to Stockholders
(a)
Parametric Commodity Strategy Fund
Class I EIPCX
Semi-Annual Shareholder Report June 30, 2024
This semi-annual shareholder report contains important information about the Parametric Commodity Strategy Fund for the period of January 1, 2024 to June 30, 2024. You can find additional information about the Fund at www.eatonvance.com/parametric-fund-documents.php. You can also request this information by contacting us at 1-800-260-0761.
What were the Fund costs for the last six months?
(based on a hypothetical $10,000 investment)
Class Name | Costs of a $10,000 investment | Costs paid as a percentage of a $10,000 investment |
---|---|---|
Class I | $34 | 0.65% |
Key Fund Statistics
Total Net Assets | $1,377,337,609 |
# of Portfolio Holdings (including derivatives) | 86 |
Portfolio Turnover Rate | 0% |
What did the Fund invest in?
The following tables reflect what the Fund invested in as of the report date.
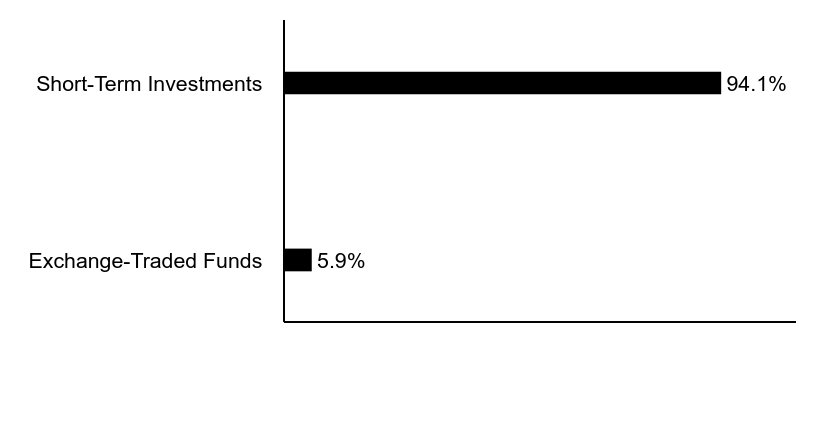
Asset Allocation (% of total investments)Footnote Reference*
Value | Value |
---|---|
Exchange-Traded Funds | 5.9% |
Short-Term Investments | 94.1% |
Footnote | Description |
Footnote* | Short-Term Investments are held as collateral for the Fund's futures contracts positions. |
Commodity Exposure (% of net assets)
Energy | 26.9% |
Agriculture | 25.1% |
Industrial Metals | 23.5% |
Precious Metals | 18.1% |
Livestock | 6.3% |
Additional Information
If you wish to view additional information about the Fund, including the prospectus, statement of additional information, financial statements and holdings, please scan the QR code or visit www.eatonvance.com/parametric-fund-documents.php.
Householding
The Funds may deliver a single copy of certain required shareholder documents (including prospectuses, shareholder reports, and proxy materials) to investors with the same last name and the same address. Your participation will continue indefinitely unless you instruct otherwise by calling 1-800-260-0761 or by contacting your financial intermediary. Your instruction will typically be effective within 30 days of receipt.
Not FDIC Insured | May Lose Value | No Bank Guarantee
Semi-Annual Shareholder Report June 30, 2024
EIPCX-TSR-SAR
Parametric Commodity Strategy Fund
Class A EAPCX
Semi-Annual Shareholder Report June 30, 2024
This semi-annual shareholder report contains important information about the Parametric Commodity Strategy Fund for the period of January 1, 2024 to June 30, 2024. You can find additional information about the Fund at www.eatonvance.com/parametric-fund-documents.php. You can also request this information by contacting us at 1-800-260-0761.
What were the Fund costs for the last six months?
(based on a hypothetical $10,000 investment)
Class Name | Costs of a $10,000 investment | Costs paid as a percentage of a $10,000 investment |
---|---|---|
Class A | $47 | 0.90% |
Key Fund Statistics
Total Net Assets | $1,377,337,609 |
# of Portfolio Holdings (including derivatives) | 86 |
Portfolio Turnover Rate | 0% |
What did the Fund invest in?
The following tables reflect what the Fund invested in as of the report date.
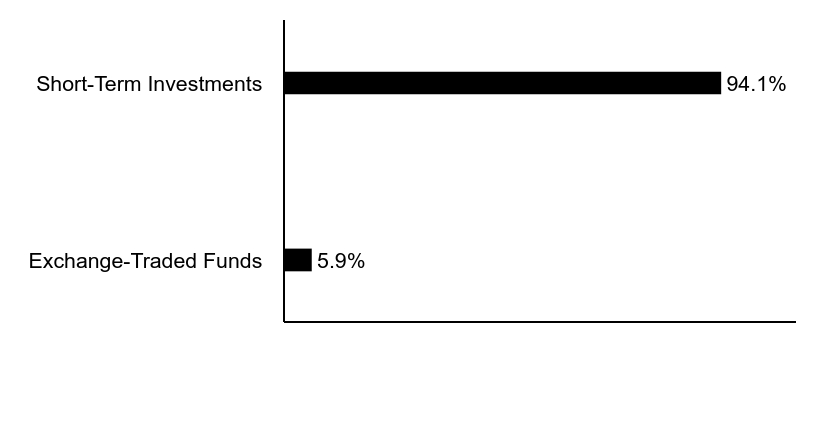
Asset Allocation (% of total investments)Footnote Reference*
Value | Value |
---|---|
Exchange-Traded Funds | 5.9% |
Short-Term Investments | 94.1% |
Footnote | Description |
Footnote* | Short-Term Investments are held as collateral for the Fund's futures contracts positions. |
Commodity Exposure (% of net assets)
Energy | 26.9% |
Agriculture | 25.1% |
Industrial Metals | 23.5% |
Precious Metals | 18.1% |
Livestock | 6.3% |
Additional Information
If you wish to view additional information about the Fund, including the prospectus, statement of additional information, financial statements and holdings, please scan the QR code or visit www.eatonvance.com/parametric-fund-documents.php.
Householding
The Funds may deliver a single copy of certain required shareholder documents (including prospectuses, shareholder reports, and proxy materials) to investors with the same last name and the same address. Your participation will continue indefinitely unless you instruct otherwise by calling 1-800-260-0761 or by contacting your financial intermediary. Your instruction will typically be effective within 30 days of receipt.
Not FDIC Insured | May Lose Value | No Bank Guarantee
Semi-Annual Shareholder Report June 30, 2024
EAPCX-TSR-SAR
Eaton Vance Stock Fund
Class A EAERX
Semi-Annual Shareholder Report June 30, 2024
This semi-annual shareholder report contains important information about the Eaton Vance Stock Fund for the period of January 1, 2024 to June 30, 2024. You can find additional information about the Fund at www.eatonvance.com/open-end-mutual-fund-documents.php. You can also request this information by contacting us at 1-800-262-1122.
What were the Fund costs for the last six months?Footnote Reference1
(based on a hypothetical $10,000 investment)
Class Name | Costs of a $10,000 investment | Costs paid as a percentage of a $10,000 investment |
---|---|---|
Class A | $54 | 0.98% |
Footnote | Description |
Footnote1 | Expenses in the table reflect the expenses of both the Fund and Stock Portfolio, the Portfolio in which it invests. |
Key Fund Statistics
Total Net Assets | $92,920,467 |
# of Portfolio Holdings (for Stock Portfolio) | 53 |
Portfolio Turnover Rate (for Stock Portfolio) | 19% |
What did the Fund invest in?
The following tables reflect what the Fund invested in as of the report date.
References to the Fund's investments are to the Fund's pro rata share of the investments of Stock Portfolio, an affiliated investment company in which the Fund invests substantially all of its assets.
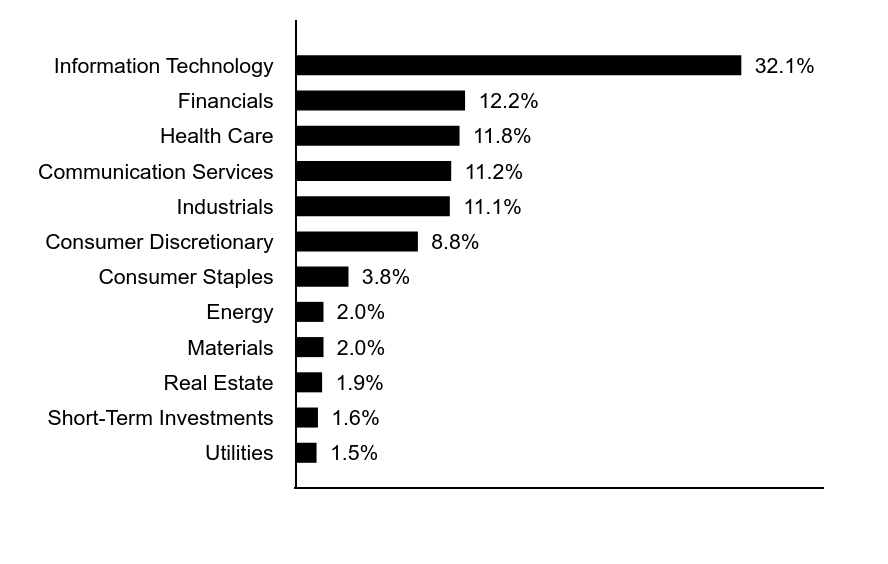
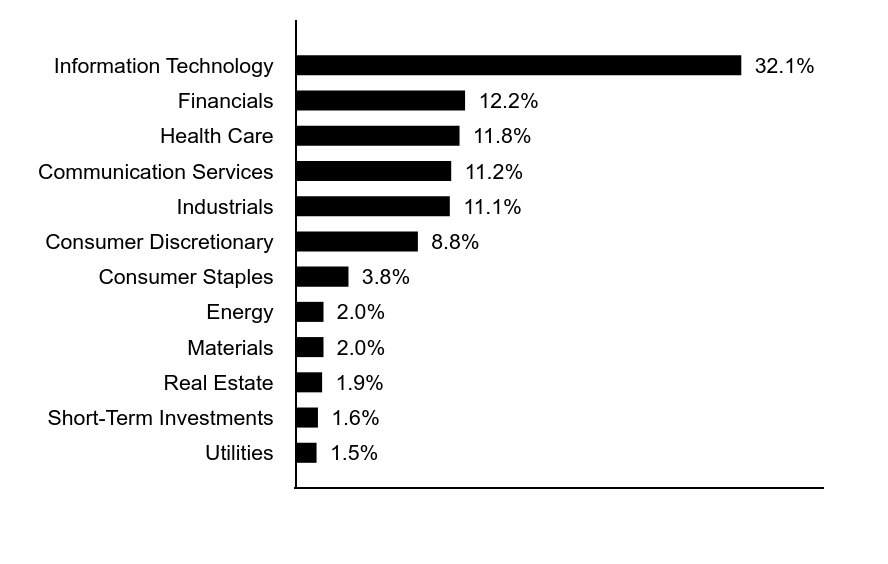
Sector Allocation (% of total investments)
Value | Value |
---|---|
Utilities | 1.5% |
Short-Term Investments | 1.6% |
Real Estate | 1.9% |
Materials | 2.0% |
Energy | 2.0% |
Consumer Staples | 3.8% |
Consumer Discretionary | 8.8% |
Industrials | 11.1% |
Communication Services | 11.2% |
Health Care | 11.8% |
Financials | 12.2% |
Information Technology | 32.1% |
Top Ten Holdings (% of total investments)Footnote Referencea
Microsoft Corp. | 8.4% |
Apple, Inc. | 7.2% |
NVIDIA Corp. | 7.2% |
Alphabet, Inc., Class C | 4.8% |
Amazon.com, Inc. | 4.7% |
Meta Platforms, Inc., Class A | 2.9% |
Broadcom, Inc. | 2.6% |
Eli Lilly & Co. | 2.5% |
AbbVie, Inc. | 2.4% |
Walmart, Inc. | 2.4% |
Total | 45.1% |
Footnote | Description |
Footnotea | Excluding cash equivalents |
Additional Information
If you wish to view additional information about the Fund, including the prospectus, statement of additional information, financial statements and holdings, please scan the QR code or visit www.eatonvance.com/open-end-mutual-fund-documents.php.
Householding
The Funds may deliver a single copy of certain required shareholder documents (including prospectuses, shareholder reports, and proxy materials) to investors with the same last name and the same address. Your participation will continue indefinitely unless you instruct otherwise by calling 1-800-262-1122 or by contacting your financial intermediary. Your instruction will typically be effective within 30 days of receipt.
Not FDIC Insured | May Lose Value | No Bank Guarantee
Semi-Annual Shareholder Report June 30, 2024
EAERX-TSR-SAR
Eaton Vance Stock Fund
Class C ECERX
Semi-Annual Shareholder Report June 30, 2024
This semi-annual shareholder report contains important information about the Eaton Vance Stock Fund for the period of January 1, 2024 to June 30, 2024. You can find additional information about the Fund at www.eatonvance.com/open-end-mutual-fund-documents.php. You can also request this information by contacting us at 1-800-262-1122.
What were the Fund costs for the last six months?Footnote Reference1
(based on a hypothetical $10,000 investment)
Class Name | Costs of a $10,000 investment | Costs paid as a percentage of a $10,000 investment |
---|---|---|
Class C | $95 | 1.73% |
Footnote | Description |
Footnote1 | Expenses in the table reflect the expenses of both the Fund and Stock Portfolio, the Portfolio in which it invests. |
Key Fund Statistics
Total Net Assets | $92,920,467 |
# of Portfolio Holdings (for Stock Portfolio) | 53 |
Portfolio Turnover Rate (for Stock Portfolio) | 19% |
What did the Fund invest in?
The following tables reflect what the Fund invested in as of the report date.
References to the Fund's investments are to the Fund's pro rata share of the investments of Stock Portfolio, an affiliated investment company in which the Fund invests substantially all of its assets.
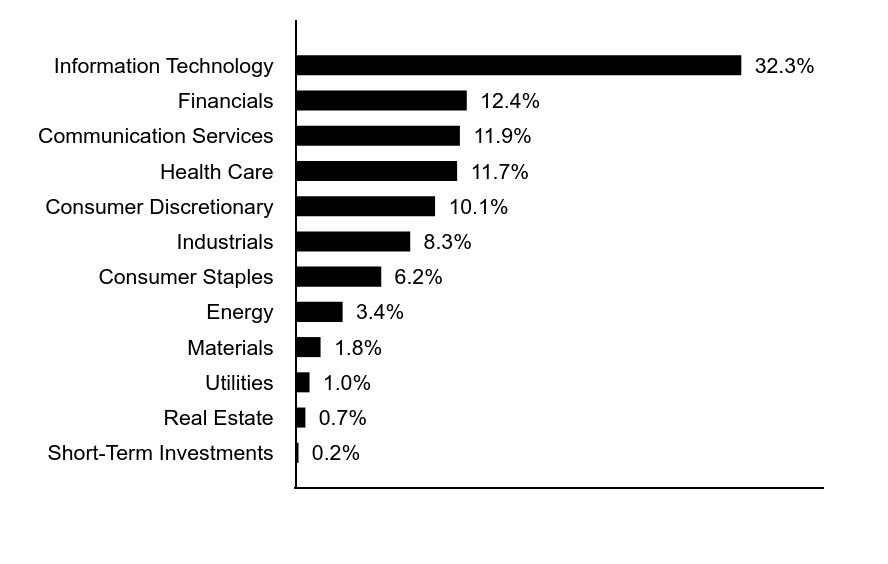
Sector Allocation (% of total investments)
Value | Value |
---|---|
Utilities | 1.5% |
Short-Term Investments | 1.6% |
Real Estate | 1.9% |
Materials | 2.0% |
Energy | 2.0% |
Consumer Staples | 3.8% |
Consumer Discretionary | 8.8% |
Industrials | 11.1% |
Communication Services | 11.2% |
Health Care | 11.8% |
Financials | 12.2% |
Information Technology | 32.1% |
Top Ten Holdings (% of total investments)Footnote Referencea
Microsoft Corp. | 8.4% |
Apple, Inc. | 7.2% |
NVIDIA Corp. | 7.2% |
Alphabet, Inc., Class C | 4.8% |
Amazon.com, Inc. | 4.7% |
Meta Platforms, Inc., Class A | 2.9% |
Broadcom, Inc. | 2.6% |
Eli Lilly & Co. | 2.5% |
AbbVie, Inc. | 2.4% |
Walmart, Inc. | 2.4% |
Total | 45.1% |
Footnote | Description |
Footnotea | Excluding cash equivalents |
Additional Information
If you wish to view additional information about the Fund, including the prospectus, statement of additional information, financial statements and holdings, please scan the QR code or visit www.eatonvance.com/open-end-mutual-fund-documents.php.
Householding
The Funds may deliver a single copy of certain required shareholder documents (including prospectuses, shareholder reports, and proxy materials) to investors with the same last name and the same address. Your participation will continue indefinitely unless you instruct otherwise by calling 1-800-262-1122 or by contacting your financial intermediary. Your instruction will typically be effective within 30 days of receipt.
Not FDIC Insured | May Lose Value | No Bank Guarantee
Semi-Annual Shareholder Report June 30, 2024
ECERX-TSR-SAR
Eaton Vance Stock Fund
Class I EIERX
Semi-Annual Shareholder Report June 30, 2024
This semi-annual shareholder report contains important information about the Eaton Vance Stock Fund for the period of January 1, 2024 to June 30, 2024. You can find additional information about the Fund at www.eatonvance.com/open-end-mutual-fund-documents.php. You can also request this information by contacting us at 1-800-262-1122.
What were the Fund costs for the last six months?Footnote Reference1
(based on a hypothetical $10,000 investment)
Class Name | Costs of a $10,000 investment | Costs paid as a percentage of a $10,000 investment |
---|---|---|
Class I | $40 | 0.73% |
Footnote | Description |
Footnote1 | Expenses in the table reflect the expenses of both the Fund and Stock Portfolio, the Portfolio in which it invests. |
Key Fund Statistics
Total Net Assets | $92,920,467 |
# of Portfolio Holdings (for Stock Portfolio) | 53 |
Portfolio Turnover Rate (for Stock Portfolio) | 19% |
What did the Fund invest in?
The following tables reflect what the Fund invested in as of the report date.
References to the Fund's investments are to the Fund's pro rata share of the investments of Stock Portfolio, an affiliated investment company in which the Fund invests substantially all of its assets.
Sector Allocation (% of total investments)
Value | Value |
---|---|
Utilities | 1.5% |
Short-Term Investments | 1.6% |
Real Estate | 1.9% |
Materials | 2.0% |
Energy | 2.0% |
Consumer Staples | 3.8% |
Consumer Discretionary | 8.8% |
Industrials | 11.1% |
Communication Services | 11.2% |
Health Care | 11.8% |
Financials | 12.2% |
Information Technology | 32.1% |
Top Ten Holdings (% of total investments)Footnote Referencea
Microsoft Corp. | 8.4% |
Apple, Inc. | 7.2% |
NVIDIA Corp. | 7.2% |
Alphabet, Inc., Class C | 4.8% |
Amazon.com, Inc. | 4.7% |
Meta Platforms, Inc., Class A | 2.9% |
Broadcom, Inc. | 2.6% |
Eli Lilly & Co. | 2.5% |
AbbVie, Inc. | 2.4% |
Walmart, Inc. | 2.4% |
Total | 45.1% |
Footnote | Description |
Footnotea | Excluding cash equivalents |
Additional Information
If you wish to view additional information about the Fund, including the prospectus, statement of additional information, financial statements and holdings, please scan the QR code or visit www.eatonvance.com/open-end-mutual-fund-documents.php.
Householding
The Funds may deliver a single copy of certain required shareholder documents (including prospectuses, shareholder reports, and proxy materials) to investors with the same last name and the same address. Your participation will continue indefinitely unless you instruct otherwise by calling 1-800-262-1122 or by contacting your financial intermediary. Your instruction will typically be effective within 30 days of receipt.
Not FDIC Insured | May Lose Value | No Bank Guarantee
Semi-Annual Shareholder Report June 30, 2024
EIERX-TSR-SAR
Eaton Vance Tax-Managed Growth Fund 1.1
Class A ETTGX
Semi-Annual Shareholder Report June 30, 2024
This semi-annual shareholder report contains important information about the Eaton Vance Tax-Managed Growth Fund 1.1 for the period of January 1, 2024 to June 30, 2024. You can find additional information about the Fund at www.eatonvance.com/open-end-mutual-fund-documents.php. You can also request this information by contacting us at 1-800-262-1122.
What were the Fund costs for the last six months?Footnote Reference*
(based on a hypothetical $10,000 investment)
Class Name | Costs of a $10,000 investment | Costs paid as a percentage of a $10,000 investment |
---|---|---|
Class A | $39 | 0.72% |
Footnote | Description |
Footnote* | Expenses in the table reflect the expenses of both the Fund and the Tax-Managed Growth Portfolio, the Portfolio in which it invests. |
Key Fund Statistics
Total Net Assets | $2,574,224,921 |
# of Portfolio Holdings (for Tax-Managed Growth Portfolio) | 161 |
Portfolio Turnover Rate (for Tax-Managed Growth Portfolio) | 4% |
What did the Fund invest in?
The following tables reflect what the Fund invested in as of the report date.
References to the Fund's investments are to the Fund's pro rata share of Tax-Managed Growth Portfolio, an affiliated investment company in which the Fund invests substantially all of its assests.
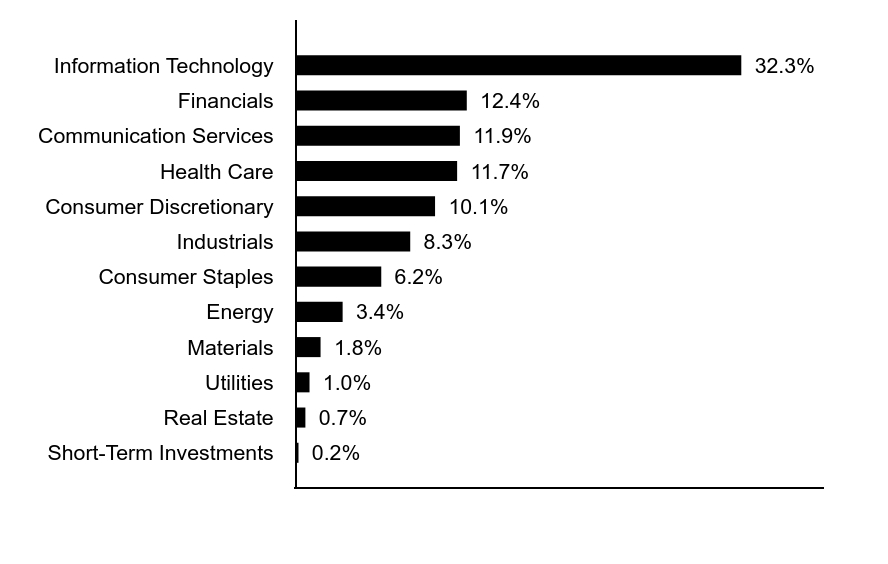
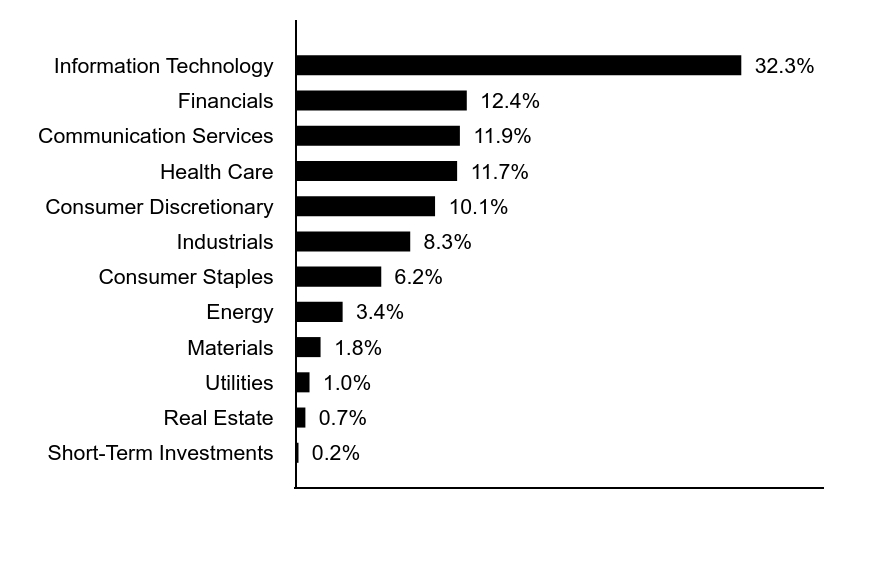
Sector Allocation (% of total investments)
Value | Value |
---|---|
Short-Term Investments | 0.2% |
Real Estate | 0.7% |
Utilities | 1.0% |
Materials | 1.8% |
Energy | 3.4% |
Consumer Staples | 6.2% |
Industrials | 8.3% |
Consumer Discretionary | 10.1% |
Health Care | 11.7% |
Communication Services | 11.9% |
Financials | 12.4% |
Information Technology | 32.3% |
Top Ten Holdings (% of total investments)Footnote Referencea
Apple, Inc. | 7.1% |
Microsoft Corp. | 7.1% |
NVIDIA Corp. | 6.5% |
Amazon.com, Inc. | 4.8% |
Meta Platforms, Inc., Class A | 3.4% |
Alphabet, Inc., Class C | 3.1% |
Alphabet, Inc., Class A | 2.7% |
Eli Lilly & Co. | 2.0% |
JPMorgan Chase & Co. | 1.8% |
Costco Wholesale Corp. | 1.7% |
Total | 40.2% |
Footnote | Description |
Footnotea | Excluding cash equivalents |
Additional Information
If you wish to view additional information about the Fund, including the prospectus, statement of additional information, financial statements and holdings, please scan the QR code or visit www.eatonvance.com/open-end-mutual-fund-documents.php.
Householding
The Funds may deliver a single copy of certain required shareholder documents (including prospectuses, shareholder reports, and proxy materials) to investors with the same last name and the same address. Your participation will continue indefinitely unless you instruct otherwise by calling 1-800-262-1122 or by contacting your financial intermediary. Your instruction will typically be effective within 30 days of receipt.
Not FDIC Insured | May Lose Value | No Bank Guarantee
Semi-Annual Shareholder Report June 30, 2024
ETTGX-TSR-SAR
Eaton Vance Tax-Managed Growth Fund 1.1
Class C ECTGX
Semi-Annual Shareholder Report June 30, 2024
This semi-annual shareholder report contains important information about the Eaton Vance Tax-Managed Growth Fund 1.1 for the period of January 1, 2024 to June 30, 2024. You can find additional information about the Fund at www.eatonvance.com/open-end-mutual-fund-documents.php. You can also request this information by contacting us at 1-800-262-1122.
What were the Fund costs for the last six months?Footnote Reference*
(based on a hypothetical $10,000 investment)
Class Name | Costs of a $10,000 investment | Costs paid as a percentage of a $10,000 investment |
---|---|---|
Class C | $80 | 1.48% |
Footnote | Description |
Footnote* | Expenses in the table reflect the expenses of both the Fund and the Tax-Managed Growth Portfolio, the Portfolio in which it invests. |
Key Fund Statistics
Total Net Assets | $2,574,224,921 |
# of Portfolio Holdings (for Tax-Managed Growth Portfolio) | 161 |
Portfolio Turnover Rate (for Tax-Managed Growth Portfolio) | 4% |
What did the Fund invest in?
The following tables reflect what the Fund invested in as of the report date.
References to the Fund's investments are to the Fund's pro rata share of Tax-Managed Growth Portfolio, an affiliated investment company in which the Fund invests substantially all of its assests.
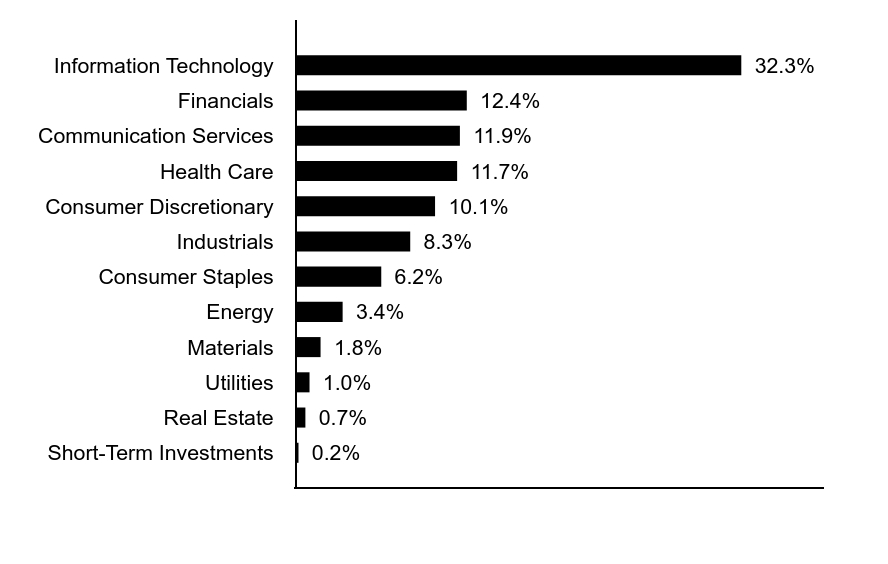
Sector Allocation (% of total investments)
Value | Value |
---|---|
Short-Term Investments | 0.2% |
Real Estate | 0.7% |
Utilities | 1.0% |
Materials | 1.8% |
Energy | 3.4% |
Consumer Staples | 6.2% |
Industrials | 8.3% |
Consumer Discretionary | 10.1% |
Health Care | 11.7% |
Communication Services | 11.9% |
Financials | 12.4% |
Information Technology | 32.3% |
Top Ten Holdings (% of total investments)Footnote Referencea
Apple, Inc. | 7.1% |
Microsoft Corp. | 7.1% |
NVIDIA Corp. | 6.5% |
Amazon.com, Inc. | 4.8% |
Meta Platforms, Inc., Class A | 3.4% |
Alphabet, Inc., Class C | 3.1% |
Alphabet, Inc., Class A | 2.7% |
Eli Lilly & Co. | 2.0% |
JPMorgan Chase & Co. | 1.8% |
Costco Wholesale Corp. | 1.7% |
Total | 40.2% |
Footnote | Description |
Footnotea | Excluding cash equivalents |
Additional Information
If you wish to view additional information about the Fund, including the prospectus, statement of additional information, financial statements and holdings, please scan the QR code or visit www.eatonvance.com/open-end-mutual-fund-documents.php.
Householding
The Funds may deliver a single copy of certain required shareholder documents (including prospectuses, shareholder reports, and proxy materials) to investors with the same last name and the same address. Your participation will continue indefinitely unless you instruct otherwise by calling 1-800-262-1122 or by contacting your financial intermediary. Your instruction will typically be effective within 30 days of receipt.
Not FDIC Insured | May Lose Value | No Bank Guarantee
Semi-Annual Shareholder Report June 30, 2024
ECTGX-TSR-SAR
Eaton Vance Tax-Managed Growth Fund 1.1
Class I EITMX
Semi-Annual Shareholder Report June 30, 2024
This semi-annual shareholder report contains important information about the Eaton Vance Tax-Managed Growth Fund 1.1 for the period of January 1, 2024 to June 30, 2024. You can find additional information about the Fund at www.eatonvance.com/open-end-mutual-fund-documents.php. You can also request this information by contacting us at 1-800-262-1122.
What were the Fund costs for the last six months?Footnote Reference*
(based on a hypothetical $10,000 investment)
Class Name | Costs of a $10,000 investment | Costs paid as a percentage of a $10,000 investment |
---|---|---|
Class I | $25 | 0.47% |
Footnote | Description |
Footnote* | Expenses in the table reflect the expenses of both the Fund and the Tax-Managed Growth Portfolio, the Portfolio in which it invests. |
Key Fund Statistics
Total Net Assets | $2,574,224,921 |
# of Portfolio Holdings (for Tax-Managed Growth Portfolio) | 161 |
Portfolio Turnover Rate (for Tax-Managed Growth Portfolio) | 4% |
What did the Fund invest in?
The following tables reflect what the Fund invested in as of the report date.
References to the Fund's investments are to the Fund's pro rata share of Tax-Managed Growth Portfolio, an affiliated investment company in which the Fund invests substantially all of its assests.
Sector Allocation (% of total investments)
Value | Value |
---|---|
Short-Term Investments | 0.2% |
Real Estate | 0.7% |
Utilities | 1.0% |
Materials | 1.8% |
Energy | 3.4% |
Consumer Staples | 6.2% |
Industrials | 8.3% |
Consumer Discretionary | 10.1% |
Health Care | 11.7% |
Communication Services | 11.9% |
Financials | 12.4% |
Information Technology | 32.3% |
Top Ten Holdings (% of total investments)Footnote Referencea
Apple, Inc. | 7.1% |
Microsoft Corp. | 7.1% |
NVIDIA Corp. | 6.5% |
Amazon.com, Inc. | 4.8% |
Meta Platforms, Inc., Class A | 3.4% |
Alphabet, Inc., Class C | 3.1% |
Alphabet, Inc., Class A | 2.7% |
Eli Lilly & Co. | 2.0% |
JPMorgan Chase & Co. | 1.8% |
Costco Wholesale Corp. | 1.7% |
Total | 40.2% |
Footnote | Description |
Footnotea | Excluding cash equivalents |
Additional Information
If you wish to view additional information about the Fund, including the prospectus, statement of additional information, financial statements and holdings, please scan the QR code or visit www.eatonvance.com/open-end-mutual-fund-documents.php.
Householding
The Funds may deliver a single copy of certain required shareholder documents (including prospectuses, shareholder reports, and proxy materials) to investors with the same last name and the same address. Your participation will continue indefinitely unless you instruct otherwise by calling 1-800-262-1122 or by contacting your financial intermediary. Your instruction will typically be effective within 30 days of receipt.
Not FDIC Insured | May Lose Value | No Bank Guarantee
Semi-Annual Shareholder Report June 30, 2024
EITMX-TSR-SAR
Eaton Vance Tax-Managed Growth Fund 1.2
Class A EXTGX
Semi-Annual Shareholder Report June 30, 2024
This semi-annual shareholder report contains important information about the Eaton Vance Tax-Managed Growth Fund 1.2 for the period of January 1, 2024 to June 30, 2024. You can find additional information about the Fund at www.eatonvance.com/open-end-mutual-fund-documents.php. You can also request this information by contacting us at 1-800-262-1122.
What were the Fund costs for the last six months?Footnote Reference*
(based on a hypothetical $10,000 investment)
Class Name | Costs of a $10,000 investment | Costs paid as a percentage of a $10,000 investment |
---|---|---|
Class A | $47 | 0.88% |
Footnote | Description |
Footnote* | Expenses in the table reflect the expenses of both the Fund and the Tax-Managed Growth Portfolio, the Portfolio in which it invests. |
Key Fund Statistics
Total Net Assets | $1,436,129,226 |
# of Portfolio Holdings (for Tax-Managed Growth Portfolio) | 161 |
Portfolio Turnover Rate (for Tax-Managed Growth Portfolio) | 4% |
What did the Fund invest in?
The following tables reflect what the Fund invested in as of the report date.
References to the Fund's investments are to the Fund's pro rata share of Tax-Managed Growth Portfolio, an affiliated investment company in which the Fund invests substantially all of its assests.
Sector Allocation (% of total investments)
Value | Value |
---|---|
Short-Term Investments | 0.2% |
Real Estate | 0.7% |
Utilities | 1.0% |
Materials | 1.8% |
Energy | 3.4% |
Consumer Staples | 6.2% |
Industrials | 8.3% |
Consumer Discretionary | 10.1% |
Health Care | 11.7% |
Communication Services | 11.9% |
Financials | 12.4% |
Information Technology | 32.3% |
Top Ten Holdings (% of total investments)Footnote Referencea
Apple, Inc. | 7.1% |
Microsoft Corp. | 7.1% |
NVIDIA Corp. | 6.5% |
Amazon.com, Inc. | 4.8% |
Meta Platforms, Inc., Class A | 3.4% |
Alphabet, Inc., Class C | 3.1% |
Alphabet, Inc., Class A | 2.7% |
Eli Lilly & Co. | 2.0% |
JPMorgan Chase & Co. | 1.8% |
Costco Wholesale Corp. | 1.7% |
Total | 40.2% |
Footnote | Description |
Footnotea | Excluding cash equivalents |
Additional Information
If you wish to view additional information about the Fund, including the prospectus, statement of additional information, financial statements and holdings, please scan the QR code or visit www.eatonvance.com/open-end-mutual-fund-documents.php.
Householding
The Funds may deliver a single copy of certain required shareholder documents (including prospectuses, shareholder reports, and proxy materials) to investors with the same last name and the same address. Your participation will continue indefinitely unless you instruct otherwise by calling 1-800-262-1122 or by contacting your financial intermediary. Your instruction will typically be effective within 30 days of receipt.
Not FDIC Insured | May Lose Value | No Bank Guarantee
Semi-Annual Shareholder Report June 30, 2024
EXTGX-TSR-SAR
Eaton Vance Tax-Managed Growth Fund 1.2
Class C EZTGX
Semi-Annual Shareholder Report June 30, 2024
This semi-annual shareholder report contains important information about the Eaton Vance Tax-Managed Growth Fund 1.2 for the period of January 1, 2024 to June 30, 2024. You can find additional information about the Fund at www.eatonvance.com/open-end-mutual-fund-documents.php. You can also request this information by contacting us at 1-800-262-1122.
What were the Fund costs for the last six months?Footnote Reference*
(based on a hypothetical $10,000 investment)
Class Name | Costs of a $10,000 investment | Costs paid as a percentage of a $10,000 investment |
---|---|---|
Class C | $88 | 1.63% |
Footnote | Description |
Footnote* | Expenses in the table reflect the expenses of both the Fund and the Tax-Managed Growth Portfolio, the Portfolio in which it invests. |
Key Fund Statistics
Total Net Assets | $1,436,129,226 |
# of Portfolio Holdings (for Tax-Managed Growth Portfolio) | 161 |
Portfolio Turnover Rate (for Tax-Managed Growth Portfolio) | 4% |
What did the Fund invest in?
The following tables reflect what the Fund invested in as of the report date.
References to the Fund's investments are to the Fund's pro rata share of Tax-Managed Growth Portfolio, an affiliated investment company in which the Fund invests substantially all of its assests.
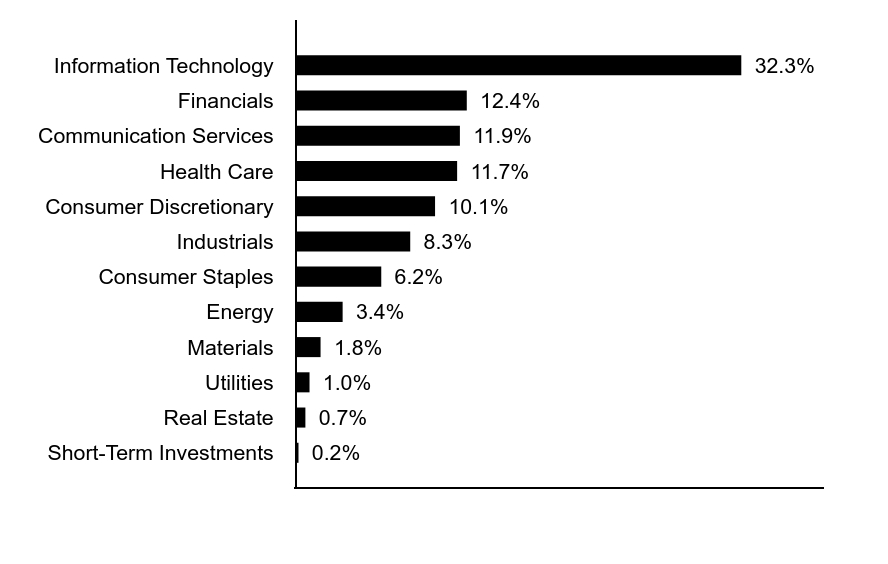
Sector Allocation (% of total investments)
Value | Value |
---|---|
Short-Term Investments | 0.2% |
Real Estate | 0.7% |
Utilities | 1.0% |
Materials | 1.8% |
Energy | 3.4% |
Consumer Staples | 6.2% |
Industrials | 8.3% |
Consumer Discretionary | 10.1% |
Health Care | 11.7% |
Communication Services | 11.9% |
Financials | 12.4% |
Information Technology | 32.3% |
Top Ten Holdings (% of total investments)Footnote Referencea
Apple, Inc. | 7.1% |
Microsoft Corp. | 7.1% |
NVIDIA Corp. | 6.5% |
Amazon.com, Inc. | 4.8% |
Meta Platforms, Inc., Class A | 3.4% |
Alphabet, Inc., Class C | 3.1% |
Alphabet, Inc., Class A | 2.7% |
Eli Lilly & Co. | 2.0% |
JPMorgan Chase & Co. | 1.8% |
Costco Wholesale Corp. | 1.7% |
Total | 40.2% |
Footnote | Description |
Footnotea | Excluding cash equivalents |
Additional Information
If you wish to view additional information about the Fund, including the prospectus, statement of additional information, financial statements and holdings, please scan the QR code or visit www.eatonvance.com/open-end-mutual-fund-documents.php.
Householding
The Funds may deliver a single copy of certain required shareholder documents (including prospectuses, shareholder reports, and proxy materials) to investors with the same last name and the same address. Your participation will continue indefinitely unless you instruct otherwise by calling 1-800-262-1122 or by contacting your financial intermediary. Your instruction will typically be effective within 30 days of receipt.
Not FDIC Insured | May Lose Value | No Bank Guarantee
Semi-Annual Shareholder Report June 30, 2024
EZTGX-TSR-SAR
Eaton Vance Tax-Managed Growth Fund 1.2
Class I EITGX
Semi-Annual Shareholder Report June 30, 2024
This semi-annual shareholder report contains important information about the Eaton Vance Tax-Managed Growth Fund 1.2 for the period of January 1, 2024 to June 30, 2024. You can find additional information about the Fund at www.eatonvance.com/open-end-mutual-fund-documents.php. You can also request this information by contacting us at 1-800-262-1122.
What were the Fund costs for the last six months?Footnote Reference*
(based on a hypothetical $10,000 investment)
Class Name | Costs of a $10,000 investment | Costs paid as a percentage of a $10,000 investment |
---|---|---|
Class I | $34 | 0.63% |
Footnote | Description |
Footnote* | Expenses in the table reflect the expenses of both the Fund and the Tax-Managed Growth Portfolio, the Portfolio in which it invests. |
Key Fund Statistics
Total Net Assets | $1,436,129,226 |
# of Portfolio Holdings (for Tax-Managed Growth Portfolio) | 161 |
Portfolio Turnover Rate (for Tax-Managed Growth Portfolio) | 4% |
What did the Fund invest in?
The following tables reflect what the Fund invested in as of the report date.
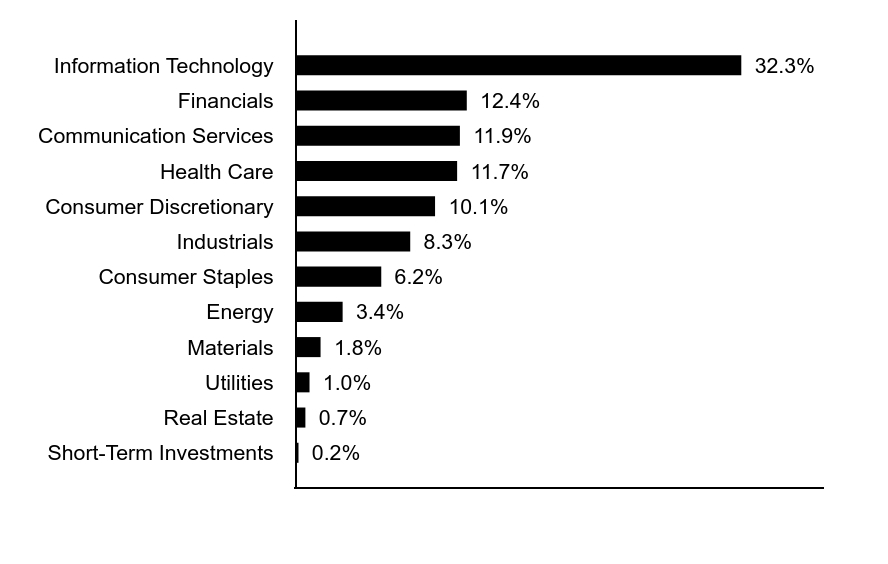
References to the Fund's investments are to the Fund's pro rata share of Tax-Managed Growth Portfolio, an affiliated investment company in which the Fund invests substantially all of its assests.
Sector Allocation (% of total investments)
Value | Value |
---|---|
Short-Term Investments | 0.2% |
Real Estate | 0.7% |
Utilities | 1.0% |
Materials | 1.8% |
Energy | 3.4% |
Consumer Staples | 6.2% |
Industrials | 8.3% |
Consumer Discretionary | 10.1% |
Health Care | 11.7% |
Communication Services | 11.9% |
Financials | 12.4% |
Information Technology | 32.3% |
Top Ten Holdings (% of total investments)Footnote Referencea
Apple, Inc. | 7.1% |
Microsoft Corp. | 7.1% |
NVIDIA Corp. | 6.5% |
Amazon.com, Inc. | 4.8% |
Meta Platforms, Inc., Class A | 3.4% |
Alphabet, Inc., Class C | 3.1% |
Alphabet, Inc., Class A | 2.7% |
Eli Lilly & Co. | 2.0% |
JPMorgan Chase & Co. | 1.8% |
Costco Wholesale Corp. | 1.7% |
Total | 40.2% |
Footnote | Description |
Footnotea | Excluding cash equivalents |
Additional Information
If you wish to view additional information about the Fund, including the prospectus, statement of additional information, financial statements and holdings, please scan the QR code or visit www.eatonvance.com/open-end-mutual-fund-documents.php.
Householding
The Funds may deliver a single copy of certain required shareholder documents (including prospectuses, shareholder reports, and proxy materials) to investors with the same last name and the same address. Your participation will continue indefinitely unless you instruct otherwise by calling 1-800-262-1122 or by contacting your financial intermediary. Your instruction will typically be effective within 30 days of receipt.
Not FDIC Insured | May Lose Value | No Bank Guarantee
Semi-Annual Shareholder Report June 30, 2024
EITGX-TSR-SAR
(b) Not applicable.
Item 2. Code of Ethics
Not required in this filing.
Item 3. Audit Committee Financial Expert
Not required in this filing.
Item 4. Principal Accountant Fees and Services
Not required in this filing.
Item 5. Audit Committee of Listed Registrants
Not applicable.
Item 6. Schedule of Investments
(a) | Please see schedule of investments contained in the Financial Statements and Financial Highlights included under Item 7 of this Form N-CSR. |
(b) | Not applicable. |
Item 7. Financial Statements and Financial Highlights for Open-End Management Investment Companies
June 30, 2024 | |
Assets | |
Investment in Stock Portfolio, at value (identified cost $40,849,458) | $92,951,668 |
Receivable for Fund shares sold | 106,690 |
Receivable from affiliates | 11,974 |
Total assets | $93,070,332 |
Liabilities | |
Payable for Fund shares redeemed | $114,854 |
Payable to affiliates: | |
Distribution and service fees | 16,556 |
Payable for transfer and dividend disbursing agent fees | 15,540 |
Accrued expenses | 2,915 |
Total liabilities | $149,865 |
Net Assets | $92,920,467 |
Sources of Net Assets | |
Paid-in capital | $49,782,712 |
Distributable earnings | 43,137,755 |
Net Assets | $92,920,467 |
Class A Shares | |
Net Assets | $64,101,077 |
Shares Outstanding | 2,871,265 |
Net Asset Value and Redemption Price Per Share (net assets ÷ shares of beneficial interest outstanding) | $22.33 |
Maximum Offering Price Per Share (100 ÷ 94.75 of net asset value per share) | $23.57 |
Class C Shares | |
Net Assets | $4,273,850 |
Shares Outstanding | 203,212 |
Net Asset Value and Offering Price Per Share* (net assets ÷ shares of beneficial interest outstanding) | $21.03 |
Class I Shares | |
Net Assets | $24,545,540 |
Shares Outstanding | 1,097,048 |
Net Asset Value, Offering Price and Redemption Price Per Share (net assets ÷ shares of beneficial interest outstanding) | $22.37 |
On sales of $50,000 or more, the offering price of Class A shares is reduced. | |
* | Redemption price per share is equal to the net asset value less any applicable contingent deferred sales charge. |
Six Months Ended | |
June 30, 2024 | |
Investment Income | |
Dividend income allocated from Portfolio (net of foreign taxes withheld of $1,924) | $398,406 |
Expenses allocated from Portfolio | (280,759) |
Total investment income from Portfolio | $117,647 |
Expenses | |
Distribution and service fees: | |
Class A | $71,729 |
Class C | 23,640 |
Trustees’ fees and expenses | 125 |
Custodian fee | 7,518 |
Transfer and dividend disbursing agent fees | 28,557 |
Legal and accounting services | 20,467 |
Printing and postage | 2,071 |
Registration fees | 24,972 |
Miscellaneous | 5,442 |
Total expenses | $184,521 |
Deduct: | |
Waiver and/or reimbursement of expenses by affiliates | $47,622 |
Total expense reductions | $47,622 |
Net expenses | $136,899 |
Net investment loss | $(19,252) |
Realized and Unrealized Gain (Loss) from Portfolio | |
Net realized gain (loss): | |
Investment transactions | $4,324,753 |
Net realized gain | $4,324,753 |
Change in unrealized appreciation (depreciation): | |
Investments | $12,058,529 |
Foreign currency | (10) |
Net change in unrealized appreciation (depreciation) | $12,058,519 |
Net realized and unrealized gain | $16,383,272 |
Net increase in net assets from operations | $16,364,020 |
Six Months Ended June 30, 2024 (Unaudited) | Year Ended December 31, 2023 | |
Increase (Decrease) in Net Assets | ||
From operations: | ||
Net investment income (loss) | $(19,252) | $210,063 |
Net realized gain | 4,324,753 | 6,121,054 |
Net change in unrealized appreciation (depreciation) | 12,058,519 | 10,129,030 |
Net increase in net assets from operations | $16,364,020 | $16,460,147 |
Distributions to shareholders: | ||
Class A | $— | $(8,061,895) |
Class C | — | (777,005) |
Class I | — | (3,368,037) |
Total distributions to shareholders | $— | $(12,206,937) |
Transactions in shares of beneficial interest: | ||
Class A | $1,027,195 | $3,221,556 |
Class C | (1,624,036) | (878,150) |
Class I | (2,330,529) | (1,183,453) |
Net increase (decrease) in net assets from Fund share transactions | $(2,927,370) | $1,159,953 |
Net increase in net assets | $13,436,650 | $5,413,163 |
Net Assets | ||
At beginning of period | $79,483,817 | $74,070,654 |
At end of period | $92,920,467 | $79,483,817 |
Class A | ||||||
Six Months Ended June 30, 2024 (Unaudited) | Year Ended December 31, | |||||
2023 | 2022 | 2021 | 2020 | 2019 | ||
Net asset value — Beginning of period | $18.500 | $17.510 | $24.120 | $22.120 | $19.110 | $14.720 |
Income (Loss) From Operations | ||||||
Net investment income (loss)(1) | $(0.007) | $0.050 | $0.102 | $0.049 | $0.097 | $0.114 |
Net realized and unrealized gain (loss) | 3.837 | 4.144 | (4.175) | 4.959 | 3.346 | 5.023 |
Total income (loss) from operations | $3.830 | $4.194 | $(4.073) | $5.008 | $3.443 | $5.137 |
Less Distributions | ||||||
From net investment income | $— | $(0.043) | $(0.118) | $(0.097) | $(0.041) | $(0.096) |
From net realized gain | — | (3.161) | (2.423) | (2.913) | (0.392) | (0.653) |
Total distributions | $— | $(3.204) | $(2.541) | $(3.010) | $(0.433) | $(0.749) |
Portfolio transaction fee, net(1) | $— | $— | $0.004 | $0.002 | $(0.000)(2) | $0.002 |
Net asset value — End of period | $22.330 | $18.500 | $17.510 | $24.120 | $22.120 | $19.110 |
Total Return(3)(4) | 20.70%(5) | 24.02% | (16.78)% | 22.78% | 18.22% | 35.01% |
Ratios/Supplemental Data | ||||||
Net assets, end of period (000’s omitted) | $64,101 | $52,274 | $46,464 | $61,304 | $60,148 | $53,153 |
Ratios (as a percentage of average daily net assets):(6) | ||||||
Expenses(4) | 0.98%(7)(8) | 0.98%(7) | 0.98%(7) | 0.98% | 0.98% | 0.98% |
Net investment income (loss) | (0.07)%(8) | 0.26% | 0.49% | 0.20% | 0.51% | 0.65% |
Portfolio Turnover of the Portfolio | 19%(5) | 44% | 52% | 44% | 70% | 55% |
(1) | Computed using average shares outstanding. |
(2) | Amount is less than $(0.0005). |
(3) | Returns are historical and are calculated by determining the percentage change in net asset value with all distributions reinvested and do not reflect the effect of sales charges. |
(4) | The administrator reimbursed certain operating expenses (equal to 0.11%, 0.13%, 0.13%, 0.07%, 0.10% and 0.12% of average daily net assets for the six months ended June 30, 2024 and the years ended December 31, 2023, 2022, 2021, 2020 and 2019, respectively). Absent this reimbursement, total return would be lower. |
(5) | Not annualized. |
(6) | Includes the Fund’s share of the Portfolio’s allocated expenses. |
(7) | Includes a reduction by the investment adviser of a portion of the Portfolio’s adviser fee due to the Portfolio’s investment in the Liquidity Fund (equal to less than 0.005% of average daily net assets for the six months ended June 30, 2024 and the years ended December 31, 2023 and 2022). |
(8) | Annualized. |
Class C | ||||||
Six Months Ended June 30, 2024 (Unaudited) | Year Ended December 31, | |||||
2023 | 2022 | 2021 | 2020 | 2019 | ||
Net asset value — Beginning of period | $17.490 | $16.790 | $23.230 | $21.400 | $18.610 | $14.380 |
Income (Loss) From Operations | ||||||
Net investment loss(1) | $(0.080) | $(0.089) | $(0.054) | $(0.130) | $(0.040) | $(0.018) |
Net realized and unrealized gain (loss) | 3.620 | 3.950 | (4.014) | 4.784 | 3.235 | 4.899 |
Total income (loss) from operations | $3.540 | $3.861 | $(4.068) | $4.654 | $3.195 | $4.881 |
Less Distributions | ||||||
From net investment income | $— | $— | $— | $— | $(0.013) | $— |
From net realized gain | — | (3.161) | (2.376) | (2.826) | (0.392) | (0.653) |
Total distributions | $— | $(3.161) | $(2.376) | $(2.826) | $(0.405) | $(0.653) |
Portfolio transaction fee, net(1) | $— | $— | $0.004 | $0.002 | $(0.000)(2) | $0.002 |
Net asset value — End of period | $21.030 | $17.490 | $16.790 | $23.230 | $21.400 | $18.610 |
Total Return(3)(4) | 20.24%(5) | 23.13% | (17.46)% | 21.88% | 17.36% | 34.04% |
Ratios/Supplemental Data | ||||||
Net assets, end of period (000’s omitted) | $4,274 | $5,027 | $5,579 | $7,418 | $6,728 | $11,418 |
Ratios (as a percentage of average daily net assets):(6) | ||||||
Expenses(4) | 1.73%(7)(8) | 1.73%(7) | 1.73%(7) | 1.73% | 1.73% | 1.73% |
Net investment loss | (0.83)%(8) | (0.49)% | (0.27)% | (0.55)% | (0.22)% | (0.11)% |
Portfolio Turnover of the Portfolio | 19%(5) | 44% | 52% | 44% | 70% | 55% |
(1) | Computed using average shares outstanding. |
(2) | Amount is less than $(0.0005). |
(3) | Returns are historical and are calculated by determining the percentage change in net asset value with all distributions reinvested and do not reflect the effect of sales charges. |
(4) | The administrator reimbursed certain operating expenses (equal to 0.11%, 0.13%, 0.13%, 0.07%, 0.10% and 0.12% of average daily net assets for the six months ended June 30, 2024 and the years ended December 31, 2023, 2022, 2021, 2020 and 2019, respectively). Absent this reimbursement, total return would be lower. |
(5) | Not annualized. |
(6) | Includes the Fund’s share of the Portfolio’s allocated expenses. |
(7) | Includes a reduction by the investment adviser of a portion of the Portfolio’s adviser fee due to the Portfolio’s investment in the Liquidity Fund (equal to less than 0.005% of average daily net assets for the six months ended June 30, 2024 and the years ended December 31, 2023 and 2022). |
(8) | Annualized. |
Class I | ||||||
Six Months Ended June 30, 2024 (Unaudited) | Year Ended December 31, | |||||
2023 | 2022 | 2021 | 2020 | 2019 | ||
Net asset value — Beginning of period | $18.520 | $17.520 | $24.140 | $22.130 | $19.110 | $14.720 |
Income (Loss) From Operations | ||||||
Net investment income(1) | $0.017 | $0.098 | $0.154 | $0.110 | $0.146 | $0.158 |
Net realized and unrealized gain (loss) | 3.833 | 4.153 | (4.181) | 4.974 | 3.354 | 5.023 |
Total income (loss) from operations | $3.850 | $4.251 | $(4.027) | $5.084 | $3.500 | $5.181 |
Less Distributions | ||||||
From net investment income | $— | $(0.090) | $(0.174) | $(0.163) | $(0.088) | $(0.140) |
From net realized gain | — | (3.161) | (2.423) | (2.913) | (0.392) | (0.653) |
Total distributions | $— | $(3.251) | $(2.597) | $(3.076) | $(0.480) | $(0.793) |
Portfolio transaction fee, net(1) | $— | $— | $0.004 | $0.002 | $(0.000)(2) | $0.002 |
Net asset value — End of period | $22.370 | $18.520 | $17.520 | $24.140 | $22.130 | $19.110 |
Total Return(3)(4) | 20.79%(5) | 24.41% | (16.62)% | 23.12% | 18.52% | 35.32% |
Ratios/Supplemental Data | ||||||
Net assets, end of period (000’s omitted) | $24,546 | $22,182 | $22,027 | $32,558 | $40,943 | $37,375 |
Ratios (as a percentage of average daily net assets):(6) | ||||||
Expenses(4) | 0.73%(7)(8) | 0.73%(7) | 0.73%(7) | 0.73% | 0.73% | 0.73% |
Net investment income | 0.16%(8) | 0.51% | 0.73% | 0.45% | 0.76% | 0.89% |
Portfolio Turnover of the Portfolio | 19%(5) | 44% | 52% | 44% | 70% | 55% |
(1) | Computed using average shares outstanding. |
(2) | Amount is less than $(0.0005). |
(3) | Returns are historical and are calculated by determining the percentage change in net asset value with all distributions reinvested. |
(4) | The administrator reimbursed certain operating expenses (equal to 0.11%, 0.13%, 0.13%, 0.07%, 0.10% and 0.12% of average daily net assets for the six months ended June 30, 2024 and the years ended December 31, 2023, 2022, 2021, 2020 and 2019, respectively). Absent this reimbursement, total return would be lower. |
(5) | Not annualized. |
(6) | Includes the Fund’s share of the Portfolio’s allocated expenses. |
(7) | Includes a reduction by the investment adviser of a portion of the Portfolio’s adviser fee due to the Portfolio’s investment in the Liquidity Fund (equal to less than 0.005% of average daily net assets for the six months ended June 30, 2024 and the years ended December 31, 2023 and 2022). |
(8) | Annualized. |
Average Daily Net Assets | Annual Fee Rate |
Up to $500 million | 0.600% |
$500 million but less than $1 billion | 0.575% |
$1 billion but less than $2.5 billion | 0.550% |
$2.5 billion but less than $5 billion | 0.530% |
$5 billion and over | 0.515% |
Six Months Ended June 30, 2024 (Unaudited) | Year Ended December 31, 2023 | ||||
Shares | Amount | Shares | Amount | ||
Class A | |||||
Sales | 245,549 | $5,031,302 | 241,532 | $4,759,148 | |
Issued to shareholders electing to receive payments of distributions in Fund shares | — | — | 426,500 | 7,830,540 | |
Redemptions | (200,030) | (4,004,107) | (495,112) | (9,368,132) | |
Net increase | 45,519 | $1,027,195 | 172,920 | $3,221,556 | |
Class C | |||||
Sales | 12,606 | $ 248,739 | 19,000 | $ 359,148 | |
Issued to shareholders electing to receive payments of distributions in Fund shares | — | — | 44,733 | 777,005 | |
Redemptions | (96,794) | (1,872,775) | (108,565) | (2,014,303) | |
Net decrease | (84,188) | $(1,624,036) | (44,832) | $ (878,150) | |
Class I | |||||
Sales | 369,319 | $7,507,213 | 93,175 | $1,865,470 | |
Issued to shareholders electing to receive payments of distributions in Fund shares | — | — | 183,245 | 3,368,037 | |
Redemptions | (470,193) | (9,837,742) | (335,433) | (6,416,960) | |
Net decrease | (100,874) | $(2,330,529) | (59,013) | $(1,183,453) |
Common Stocks — 98.4% |
Security | Shares | Value | |
Aerospace & Defense — 1.1% | |||
HEICO Corp. | 34,997 | $ 7,825,679 | |
$ 7,825,679 | |||
Biotechnology — 2.4% | |||
AbbVie, Inc. | 100,299 | $ 17,203,285 | |
$ 17,203,285 | |||
Broadline Retail — 4.7% | |||
Amazon.com, Inc.(1) | 172,784 | $ 33,390,508 | |
$ 33,390,508 | |||
Capital Markets — 5.2% | |||
Intercontinental Exchange, Inc. | 63,763 | $ 8,728,517 | |
S&P Global, Inc. | 21,914 | 9,773,644 | |
Stifel Financial Corp. | 87,015 | 7,322,312 | |
Tradeweb Markets, Inc., Class A | 98,613 | 10,452,978 | |
$ 36,277,451 | |||
Chemicals — 1.0% | |||
Linde PLC | 15,376 | $ 6,747,143 | |
$ 6,747,143 | |||
Commercial Services & Supplies — 2.1% | |||
GFL Environmental, Inc. | 188,736 | $ 7,347,492 | |
Waste Management, Inc. | 34,067 | 7,267,854 | |
$ 14,615,346 | |||
Consumer Staples Distribution & Retail — 3.8% | |||
BJ's Wholesale Club Holdings, Inc.(1) | 114,627 | $ 10,068,836 | |
Walmart, Inc. | 245,269 | 16,607,164 | |
$ 26,676,000 | |||
Containers & Packaging — 1.0% | |||
AptarGroup, Inc. | 52,257 | $ 7,358,308 | |
$ 7,358,308 | |||
Electric Utilities — 1.5% | |||
NextEra Energy, Inc. | 150,870 | $ 10,683,105 | |
$ 10,683,105 |
Security | Shares | Value | |
Electrical Equipment — 1.4% | |||
AMETEK, Inc. | 58,157 | $ 9,695,353 | |
$ 9,695,353 | |||
Entertainment — 1.8% | |||
Netflix, Inc.(1) | 15,121 | $ 10,204,861 | |
Spotify Technology SA(1) | 7,738 | 2,428,107 | |
$ 12,632,968 | |||
Financial Services — 3.4% | |||
Shift4 Payments, Inc., Class A(1) | 124,307 | $ 9,117,919 | |
Visa, Inc., Class A | 56,471 | 14,821,943 | |
$ 23,939,862 | |||
Ground Transportation — 1.7% | |||
Uber Technologies, Inc.(1) | 166,200 | $ 12,079,416 | |
$ 12,079,416 | |||
Health Care Equipment & Supplies — 1.4% | |||
Intuitive Surgical, Inc.(1) | 22,720 | $ 10,106,992 | |
$ 10,106,992 | |||
Health Care Providers & Services — 3.0% | |||
Elevance Health, Inc. | 22,002 | $ 11,922,004 | |
Tenet Healthcare Corp.(1) | 69,956 | 9,306,246 | |
$ 21,228,250 | |||
Hotels, Restaurants & Leisure — 1.1% | |||
Marriott International, Inc., Class A | 33,404 | $ 8,076,085 | |
$ 8,076,085 | |||
Insurance — 3.6% | |||
Allstate Corp. | 82,599 | $ 13,187,756 | |
W.R. Berkley Corp. | 156,770 | 12,318,987 | |
$ 25,506,743 | |||
Interactive Media & Services — 7.7% | |||
Alphabet, Inc., Class C | 185,427 | $ 34,011,020 | |
Meta Platforms, Inc., Class A | 40,457 | 20,399,229 | |
$ 54,410,249 | |||
IT Services — 1.5% | |||
Gartner, Inc.(1) | 22,752 | $ 10,217,013 | |
$ 10,217,013 |
Security | Shares | Value | |
Life Sciences Tools & Services — 1.4% | |||
Thermo Fisher Scientific, Inc. | 17,700 | $ 9,788,100 | |
$ 9,788,100 | |||
Machinery — 0.8% | |||
Parker-Hannifin Corp. | 11,800 | $ 5,968,558 | |
$ 5,968,558 | |||
Media — 0.8% | |||
Comcast Corp., Class A | 150,027 | $ 5,875,057 | |
$ 5,875,057 | |||
Oil, Gas & Consumable Fuels — 2.1% | |||
ConocoPhillips | 126,241 | $ 14,439,446 | |
$ 14,439,446 | |||
Pharmaceuticals — 3.5% | |||
Eli Lilly & Co. | 19,265 | $ 17,442,146 | |
Novo Nordisk AS ADR | 50,571 | 7,218,504 | |
$ 24,660,650 | |||
Professional Services — 4.0% | |||
Automatic Data Processing, Inc. | 38,771 | $ 9,254,250 | |
Booz Allen Hamilton Holding Corp. | 42,985 | 6,615,391 | |
TransUnion | 164,356 | 12,188,641 | |
$ 28,058,282 | |||
Real Estate Management & Development — 1.9% | |||
CoStar Group, Inc.(1) | 76,058 | $ 5,638,940 | |
FirstService Corp. | 50,571 | 7,705,503 | |
$ 13,344,443 | |||
Semiconductors & Semiconductor Equipment — 12.7% | |||
Analog Devices, Inc. | 47,200 | $ 10,773,872 | |
Broadcom, Inc. | 11,581 | 18,593,643 | |
Lam Research Corp. | 9,168 | 9,762,545 | |
NVIDIA Corp. | 407,446 | 50,335,879 | |
$ 89,465,939 | |||
Software — 10.7% | |||
Fair Isaac Corp.(1) | 7,274 | $ 10,828,513 | |
Microsoft Corp. | 132,327 | 59,143,553 | |
Palo Alto Networks, Inc.(1) | 16,014 | 5,428,906 | |
$ 75,400,972 |
Security | Shares | Value | |
Specialty Retail — 2.4% | |||
Burlington Stores, Inc.(1) | 35,877 | $ 8,610,480 | |
TJX Cos., Inc. | 73,247 | 8,064,495 | |
$ 16,674,975 | |||
Technology Hardware, Storage & Peripherals — 7.2% | |||
Apple, Inc. | 240,212 | $ 50,593,451 | |
$ 50,593,451 | |||
Textiles, Apparel & Luxury Goods — 0.6% | |||
NIKE, Inc., Class B | 53,161 | $ 4,006,745 | |
$ 4,006,745 | |||
Wireless Telecommunication Services — 0.9% | |||
T-Mobile U.S., Inc. | 34,286 | $ 6,040,507 | |
$ 6,040,507 | |||
Total Common Stocks (identified cost $376,253,477) | $692,986,881 |
Short-Term Investments — 1.6% |
Security | Shares | Value | |
Morgan Stanley Institutional Liquidity Funds - Government Portfolio, Institutional Class, 5.22%(2) | 11,041,181 | $ 11,041,181 | |
Total Short-Term Investments (identified cost $11,041,181) | $ 11,041,181 | ||
Total Investments — 100.0% (identified cost $387,294,658) | $704,028,062 | ||
Other Assets, Less Liabilities — (0.0)%(3) | $ (215,840) | ||
Net Assets — 100.0% | $703,812,222 |
The percentage shown for each investment category in the Portfolio of Investments is based on net assets. | |
(1) | Non-income producing security. |
(2) | May be deemed to be an affiliated investment company. The rate shown is the annualized seven-day yield as of June 30, 2024. |
(3) | Amount is less than (0.05)%. |
Abbreviations: | |
ADR | – American Depositary Receipt |
June 30, 2024 | |
Assets | |
Unaffiliated investments, at value (identified cost $376,253,477) | $692,986,881 |
Affiliated investments, at value (identified cost $11,041,181) | 11,041,181 |
Dividends receivable | 263,047 |
Dividends receivable from affiliated investments | 24,316 |
Tax reclaims receivable | 25,141 |
Trustees' deferred compensation plan | 64,575 |
Total assets | $704,405,141 |
Liabilities | |
Due to custodian | $78,385 |
Payable to affiliates: | |
Investment adviser fee | 336,829 |
Trustees' fees | 9,565 |
Trustees' deferred compensation plan | 64,575 |
Payable for custodian fee | 50,972 |
Accrued expenses | 52,593 |
Total liabilities | $592,919 |
Net Assets applicable to investors' interest in Portfolio | $703,812,222 |
Six Months Ended | |
June 30, 2024 | |
Investment Income | |
Dividend income (net of foreign taxes withheld of $13,885) | $2,869,453 |
Dividend income from affiliated investments | 71,775 |
Total investment income | $2,941,228 |
Expenses | |
Investment adviser fee | $1,928,623 |
Trustees’ fees and expenses | 28,695 |
Custodian fee | 75,900 |
Legal and accounting services | 13,486 |
Miscellaneous | 18,987 |
Total expenses | $2,065,691 |
Deduct: | |
Waiver and/or reimbursement of expenses by affiliates | $1,941 |
Total expense reductions | $1,941 |
Net expenses | $2,063,750 |
Net investment income | $877,478 |
Realized and Unrealized Gain (Loss) | |
Net realized gain (loss): | |
Investment transactions | $31,786,097 |
Net realized gain | $31,786,097 |
Change in unrealized appreciation (depreciation): | |
Investments | $90,139,400 |
Foreign currency | (77) |
Net change in unrealized appreciation (depreciation) | $90,139,323 |
Net realized and unrealized gain | $121,925,420 |
Net increase in net assets from operations | $122,802,898 |
Six Months Ended June 30, 2024 (Unaudited) | Year Ended December 31, 2023 | |
Increase (Decrease) in Net Assets | ||
From operations: | ||
Net investment income | $877,478 | $3,395,003 |
Net realized gain | 31,786,097 | 45,840,944 |
Net change in unrealized appreciation (depreciation) | 90,139,323 | 74,502,318 |
Net increase in net assets from operations | $122,802,898 | $123,738,265 |
Capital transactions: | ||
Contributions | $13,969,574 | $11,099,572 |
Withdrawals | (27,442,285) | (90,392,247) |
Net decrease in net assets from capital transactions | $(13,472,711) | $(79,292,675) |
Net increase in net assets | $109,330,187 | $44,445,590 |
Net Assets | ||
At beginning of period | $594,482,035 | $550,036,445 |
At end of period | $703,812,222 | $594,482,035 |
Six Months Ended June 30, 2024 (Unaudited) | Year Ended December 31, | |||||
Ratios/Supplemental Data | 2023 | 2022 | 2021 | 2020 | 2019 | |
Ratios (as a percentage of average daily net assets): | ||||||
Expenses | 0.63%(1)(2) | 0.64%(2) | 0.64%(2) | 0.63% | 0.64% | 0.63% |
Net investment income | 0.27%(1) | 0.60% | 0.82% | 0.55% | 0.84% | 0.99% |
Portfolio Turnover | 19%(3) | 44% | 52% | 44% | 70% | 55% |
Total Return | 20.91%(3) | 24.43% | (16.49)% | 23.21% | 18.61% | 35.47% |
Net assets, end of period (000’s omitted) | $703,812 | $594,482 | $550,036 | $871,310 | $804,446 | $683,548 |
(1) | Annualized. |
(2) | Includes a reduction by the investment adviser of a portion of its adviser fee due to the Portfolio’s investment in the Liquidity Fund (equal to less than 0.005% of average daily net assets for the six months ended June 30, 2024 and the years ended December 31, 2023 and 2022). |
(3) | Not annualized. |
Average Daily Net Assets | Annual Fee Rate |
Up to $500 million | 0.600% |
$500 million but less than $1 billion | 0.575% |
$1 billion but less than $2.5 billion | 0.550% |
$2.5 billion but less than $5 billion | 0.530% |
$5 billion and over | 0.515% |
Aggregate cost | $389,064,266 |
Gross unrealized appreciation | $316,861,104 |
Gross unrealized depreciation | (1,897,308) |
Net unrealized appreciation | $314,963,796 |
Name | Value, beginning of period | Purchases | Sales proceeds | Net realized gain (loss) | Change in unrealized appreciation (depreciation) | Value, end of period | Dividend income | Shares, end of period |
Short-Term Investments | ||||||||
Liquidity Fund | $2,428,547 | $57,218,128 | $(48,605,494) | $ — | $ — | $11,041,181 | $71,775 | 11,041,181 |
• | Level 1 – quoted prices in active markets for identical investments |
• | Level 2 – other significant observable inputs (including quoted prices for similar investments, interest rates, prepayment speeds, credit risk, etc.) |
• | Level 3 – significant unobservable inputs (including a fund's own assumptions in determining the fair value of investments) |
Asset Description | Level 1 | Level 2 | Level 3 | Total |
Common Stocks | $692,986,881* | $ — | $ — | $692,986,881 |
Short-Term Investments | 11,041,181 | — | — | 11,041,181 |
Total Investments | $ 704,028,062 | $ — | $ — | $704,028,062 |
* | The level classification by major category of investments is the same as the category presentation in the Portfolio of Investments. |
June 30, 2024 | ||
Tax-Managed Growth Fund 1.1 | Tax-Managed Growth Fund 1.2 | |
Assets | ||
Investment in Tax-Managed Growth Portfolio, at value | $2,575,075,547 | $1,436,736,914 |
Receivable for Fund shares sold | 1,356,238 | 1,553,974 |
Total assets | $2,576,431,785 | $1,438,290,888 |
Liabilities | ||
Payable for Fund shares redeemed | $1,452,098 | $1,588,222 |
Payable to affiliates: | ||
Administration fee | — | 174,350 |
Distribution and service fees | 444,826 | 242,083 |
Trustees' fees | 125 | 125 |
Payable for transfer and dividend disbursing agent fees | 244,978 | 88,735 |
Accrued expenses | 64,837 | 68,147 |
Total liabilities | $2,206,864 | $2,161,662 |
Net Assets | $2,574,224,921 | $1,436,129,226 |
Sources of Net Assets | ||
Paid-in capital | $1,117,631,173 | $803,806,982 |
Distributable earnings | 1,456,593,748 | 632,322,244 |
Net Assets | $2,574,224,921 | $1,436,129,226 |
Class A Shares | ||
Net Assets | $2,170,787,101 | $985,792,093 |
Shares Outstanding | 19,538,956 | 19,738,542 |
Net Asset Value and Redemption Price Per Share (net assets ÷ shares of beneficial interest outstanding) | $111.10 | $49.94 |
Maximum Offering Price Per Share (100 ÷ 94.75 of net asset value per share) | $117.26 | $52.71 |
Class C Shares | ||
Net Assets | $5,505,475 | $52,268,977 |
Shares Outstanding | 55,760 | 1,094,940 |
Net Asset Value and Offering Price Per Share* (net assets ÷ shares of beneficial interest outstanding) | $98.74 | $47.74 |
Class I Shares | ||
Net Assets | $397,932,345 | $398,068,156 |
Shares Outstanding | 3,845,845 | 7,941,130 |
Net Asset Value, Offering Price and Redemption Price Per Share (net assets ÷ shares of beneficial interest outstanding) | $103.47 | $50.13 |
On sales of $50,000 or more, the offering price of Class A shares is reduced. | |
* | Redemption price per share is equal to the net asset value less any applicable contingent deferred sales charge. |
Six Months Ended June 30, 2024 | ||
Tax-Managed Growth Fund 1.1 | Tax-Managed Growth Fund 1.2 | |
Investment Income | ||
Dividend income allocated from Portfolio (net of foreign taxes, $101,805 and $56,427, respectively) | $13,760,105 | $7,627,483 |
Expenses allocated from Portfolio | (5,153,799) | (2,856,444) |
Total investment income from Portfolio | $8,606,306 | $4,771,039 |
Expenses | ||
Administration fee | $— | $997,897 |
Distribution and service fees: | ||
Class A | 2,546,285 | 1,144,080 |
Class C | 29,288 | 250,078 |
Trustees’ fees and expenses | 250 | 250 |
Custodian fee | 25,894 | 25,822 |
Transfer and dividend disbursing agent fees | 255,874 | 172,432 |
Professional fees | 76,232 | 46,182 |
Printing and postage | 17,196 | 27,552 |
Registration fees | 29,974 | 30,242 |
Miscellaneous | 74,853 | 31,417 |
Total expenses | $3,055,846 | $2,725,952 |
Net investment income | $5,550,460 | $2,045,087 |
Realized and Unrealized Gain (Loss) from Portfolio | ||
Net realized gain (loss): | ||
Investment transactions(1) | $74,626,291 | $41,353,226 |
Foreign currency transactions | (1,610) | (897) |
Net realized gain | $74,624,681 | $41,352,329 |
Change in unrealized appreciation (depreciation): | ||
Investments | $298,558,046 | $165,392,667 |
Foreign currency | (8,456) | (4,661) |
Net change in unrealized appreciation (depreciation) | $298,549,590 | $165,388,006 |
Net realized and unrealized gain | $373,174,271 | $206,740,335 |
Net increase in net assets from operations | $378,724,731 | $208,785,422 |
(1) | Includes $44,182,988 and $24,487,872 respectively, of net realized gains from redemptions in-kind. |
Tax-Managed Growth Fund 1.1 | ||
Six Months Ended June 30, 2024 (Unaudited) | Year Ended December 31, 2023 | |
Increase (Decrease) in Net Assets | ||
From operations: | ||
Net investment income | $5,550,460 | $13,986,190 |
Net realized gain | 74,624,681 | 35,155,123 |
Net change in unrealized appreciation (depreciation) | 298,549,590 | 461,206,558 |
Net increase in net assets from operations | $378,724,731 | $510,347,871 |
Distributions to shareholders: | ||
Class A | $— | $(11,070,935) |
Class I | — | (2,836,689) |
Total distributions to shareholders | $— | $(13,907,624) |
Transactions in shares of beneficial interest: | ||
Class A | $(72,299,094) | $(104,263,620) |
Class C | (1,333,864) | (1,141,693) |
Class I | 10,298,161 | 23,238,891 |
Net decrease in net assets from Fund share transactions | $(63,334,797) | $(82,166,422) |
Net increase in net assets | $315,389,934 | $414,273,825 |
Net Assets | ||
At beginning of period | $2,258,834,987 | $1,844,561,162 |
At end of period | $2,574,224,921 | $2,258,834,987 |
Tax-Managed Growth Fund 1.2 | ||
Six Months Ended June 30, 2024 (Unaudited) | Year Ended December 31, 2023 | |
Increase (Decrease) in Net Assets | ||
From operations: | ||
Net investment income | $2,045,087 | $6,013,868 |
Net realized gain | 41,352,329 | 19,114,493 |
Net change in unrealized appreciation (depreciation) | 165,388,006 | 250,077,347 |
Net increase in net assets from operations | $208,785,422 | $275,205,708 |
Distributions to shareholders: | ||
Class A | $— | $(3,752,755) |
Class I | — | (2,219,213) |
Total distributions to shareholders | $— | $(5,971,968) |
Transactions in shares of beneficial interest: | ||
Class A | $(11,776,747) | $(22,436,758) |
Class C | (3,385,628) | (6,578,837) |
Class I | 3,229,579 | 4,515,887 |
Net decrease in net assets from Fund share transactions | $(11,932,796) | $(24,499,708) |
Net increase in net assets | $196,852,626 | $244,734,032 |
Net Assets | ||
At beginning of period | $1,239,276,600 | $994,542,568 |
At end of period | $1,436,129,226 | $1,239,276,600 |
Tax-Managed Growth Fund 1.1 — Class A | ||||||
Six Months Ended June 30, 2024 (Unaudited) | Year Ended December 31, | |||||
2023 | 2022 | 2021 | 2020 | 2019 | ||
Net asset value — Beginning of period | $94.950 | $74.460 | $93.810 | $75.510 | $61.750 | $48.150 |
Income (Loss) From Operations | ||||||
Net investment income(1) | $0.219 | $0.550 | $0.491 | $0.338 | $0.481 | $0.539 |
Net realized and unrealized gain (loss) | 15.931 | 20.489 | (19.363) | 18.292 | 13.748 | 13.572 |
Total income (loss) from operations | $16.150 | $21.039 | $(18.872) | $18.630 | $14.229 | $14.111 |
Less Distributions | ||||||
From net investment income | $— | $(0.549) | $(0.478) | $(0.330) | $(0.469) | $(0.511) |
Total distributions | $— | $(0.549) | $(0.478) | $(0.330) | $(0.469) | $(0.511) |
Net asset value — End of period | $111.100 | $94.950 | $74.460 | $93.810 | $75.510 | $61.750 |
Total Return(2) | 17.02%(3) | 28.24% | (20.11)% | 24.68% | 23.05% | 29.45% |
Ratios/Supplemental Data | ||||||
Net assets, end of period (000’s omitted) | $2,170,787 | $1,921,882 | $1,598,685 | $2,108,253 | $1,784,383 | $1,565,795 |
Ratios (as a percentage of average daily net assets):(4) | ||||||
Expenses | 0.72%(5)(6) | 0.74%(5) | 0.74%(5) | 0.73% | 0.76% | 0.78% |
Net investment income | 0.43%(6) | 0.65% | 0.62% | 0.40% | 0.77% | 0.96% |
Portfolio Turnover of the Portfolio(7) | 4%(3) | 7% | 3% | 1% | 1% | 1% |
(1) | Computed using average shares outstanding. |
(2) | Returns are historical and are calculated by determining the percentage change in net asset value with all distributions reinvested and do not reflect the effect of sales charges. |
(3) | Not annualized. |
(4) | Includes the Fund’s share of the Portfolio's allocated expenses. |
(5) | Includes a reduction by the investment adviser of a portion of the Portfolio's adviser fee due to the Portfolio's investment in the Liquidity Fund (equal to less than 0.005% of average daily net assets for the six months ended June 30, 2024 and the years ended December 31, 2023 and 2022). |
(6) | Annualized. |
(7) | Excludes the value of portfolio securities contributed or distributed as a result of in-kind shareholder transactions. |
Tax-Managed Growth Fund 1.1 — Class C | ||||||
Six Months Ended June 30, 2024 (Unaudited) | Year Ended December 31, | |||||
2023 | 2022 | 2021 | 2020 | 2019 | ||
Net asset value — Beginning of period | $84.700 | $66.540 | $83.920 | $67.810 | $55.530 | $43.280 |
Income (Loss) From Operations | ||||||
Net investment income (loss)(1) | $(0.148) | $(0.074) | $(0.099) | $(0.268) | $0.015 | $(0.018) |
Net realized and unrealized gain (loss) | 14.188 | 18.234 | (17.281) | 16.378 | 12.265 | 12.268 |
Total income (loss) from operations | $14.040 | $18.160 | $(17.380) | $16.110 | $12.280 | $12.250 |
Net asset value — End of period | $98.740 | $84.700 | $66.540 | $83.920 | $67.810 | $55.530 |
Total Return(2) | 16.59%(3) | 27.28% | (20.71)% | 23.76% | 22.11% | 28.34% |
Ratios/Supplemental Data | ||||||
Net assets, end of period (000’s omitted) | $5,505 | $5,935 | $5,665 | $8,801 | $9,517 | $13,730 |
Ratios (as a percentage of average daily net assets):(4) | ||||||
Expenses | 1.48%(5)(6) | 1.49%(5) | 1.49%(5) | 1.48% | 1.51% | 1.55% |
Net investment income (loss) | (0.33)%(6) | (0.10)% | (0.14)% | (0.35)% | 0.03% | (0.04)% |
Portfolio Turnover of the Portfolio(7) | 4%(3) | 7% | 3% | 1% | 1% | 1% |
(1) | Computed using average shares outstanding. |
(2) | Returns are historical and are calculated by determining the percentage change in net asset value with all distributions reinvested and do not reflect the effect of sales charges. |
(3) | Not annualized. |
(4) | Includes the Fund’s share of the Portfolio's allocated expenses. |
(5) | Includes a reduction by the investment adviser of a portion of the Portfolio's adviser fee due to the Portfolio's investment in the Liquidity Fund (equal to less than 0.005% of average daily net assets for the six months ended June 30, 2024 and the years ended December 31, 2023 and 2022). |
(6) | Annualized. |
(7) | Excludes the value of portfolio securities contributed or distributed as a result of in-kind shareholder transactions. |
Tax-Managed Growth Fund 1.1 — Class I | ||||||
Six Months Ended June 30, 2024 (Unaudited) | Year Ended December 31, | |||||
2023 | 2022 | 2021 | 2020 | 2019 | ||
Net asset value — Beginning of period | $88.320 | $69.290 | $87.380 | $70.350 | $57.570 | $44.920 |
Income (Loss) From Operations | ||||||
Net investment income(1) | $0.324 | $0.708 | $0.644 | $0.514 | $0.594 | $0.628 |
Net realized and unrealized gain (loss) | 14.826 | 19.094 | (18.050) | 17.064 | 12.817 | 12.675 |
Total income (loss) from operations | $15.150 | $19.802 | $(17.406) | $17.578 | $13.411 | $13.303 |
Less Distributions | ||||||
From net investment income | $— | $(0.772) | $(0.684) | $(0.548) | $(0.631) | $(0.653) |
Total distributions | $— | $(0.772) | $(0.684) | $(0.548) | $(0.631) | $(0.653) |
Net asset value — End of period | $103.470 | $88.320 | $69.290 | $87.380 | $70.350 | $57.570 |
Total Return(2) | 17.17%(3) | 28.56% | (19.92)% | 25.00% | 23.31% | 29.74% |
Ratios/Supplemental Data | ||||||
Net assets, end of period (000’s omitted) | $397,932 | $331,018 | $240,211 | $297,628 | $227,801 | $183,702 |
Ratios (as a percentage of average daily net assets):(4) | ||||||
Expenses | 0.47%(5)(6) | 0.50%(5) | 0.49%(5) | 0.48% | 0.51% | 0.53% |
Net investment income | 0.68%(6) | 0.90% | 0.87% | 0.64% | 1.01% | 1.20% |
Portfolio Turnover of the Portfolio(7) | 4%(3) | 7% | 3% | 1% | 1% | 1% |
(1) | Computed using average shares outstanding. |
(2) | Returns are historical and are calculated by determining the percentage change in net asset value with all distributions reinvested. |
(3) | Not annualized. |
(4) | Includes the Fund’s share of the Portfolio's allocated expenses. |
(5) | Includes a reduction by the investment adviser of a portion of the Portfolio's adviser fee due to the Portfolio's investment in the Liquidity Fund (equal to less than 0.005% of average daily net assets for the six months ended June 30, 2024 and the years ended December 31, 2023 and 2022). |
(6) | Annualized. |
(7) | Excludes the value of portfolio securities contributed or distributed as a result of in-kind shareholder transactions. |
Tax-Managed Growth Fund 1.2 — Class A | ||||||
Six Months Ended June 30, 2024 (Unaudited) | Year Ended December 31, | |||||
2023 | 2022 | 2021 | 2020 | 2019 | ||
Net asset value — Beginning of period | $42.720 | $33.500 | $42.190 | $33.950 | $27.770 | $21.650 |
Income (Loss) From Operations | ||||||
Net investment income(1) | $0.062 | $0.192 | $0.166 | $0.093 | $0.171 | $0.205 |
Net realized and unrealized gain (loss) | 7.158 | 9.216 | (8.700) | 8.216 | 6.171 | 6.108 |
Total income (loss) from operations | $7.220 | $9.408 | $(8.534) | $8.309 | $6.342 | $6.313 |
Less Distributions | ||||||
From net investment income | $— | $(0.188) | $(0.156) | $(0.069) | $(0.162) | $(0.193) |
Total distributions | $— | $(0.188) | $(0.156) | $(0.069) | $(0.162) | $(0.193) |
Net asset value — End of period | $49.940 | $42.720 | $33.500 | $42.190 | $33.950 | $27.770 |
Total Return(2) | 16.93%(3) | 28.05% | (20.23)% | 24.48% | 22.84% | 29.28% |
Ratios/Supplemental Data | ||||||
Net assets, end of period (000’s omitted) | $985,792 | $854,181 | $689,946 | $894,809 | $736,814 | $629,530 |
Ratios (as a percentage of average daily net assets):(4) | ||||||
Expenses | 0.88%(5)(6) | 0.89%(5) | 0.89%(5) | 0.88% | 0.92% | 0.93% |
Net investment income | 0.27%(6) | 0.51% | 0.46% | 0.24% | 0.61% | 0.81% |
Portfolio Turnover of the Portfolio(7) | 4%(3) | 7% | 3% | 1% | 1% | 1% |
(1) | Computed using average shares outstanding. |
(2) | Returns are historical and are calculated by determining the percentage change in net asset value with all distributions reinvested and do not reflect the effect of sales charges. |
(3) | Not annualized. |
(4) | Includes the Fund’s share of the Portfolio's allocated expenses. |
(5) | Includes a reduction by the investment adviser of a portion of the Portfolio's adviser fee due to the Portfolio's investment in the Liquidity Fund (equal to less than 0.005% of average daily net assets for the six months ended June 30, 2024 and the years ended December 31, 2023 and 2022). |
(6) | Annualized. |
(7) | Excludes the value of portfolio securities contributed or distributed as a result of in-kind shareholder transactions. |
Tax-Managed Growth Fund 1.2 — Class C | ||||||
Six Months Ended June 30, 2024 (Unaudited) | Year Ended December 31, | |||||
2023 | 2022 | 2021 | 2020 | 2019 | ||
Net asset value — Beginning of period | $40.980 | $32.240 | $40.720 | $32.960 | $27.030 | $21.080 |
Income (Loss) From Operations | ||||||
Net investment income (loss)(1) | $(0.107) | $(0.089) | $(0.099) | $(0.188) | $(0.037) | $0.003 |
Net realized and unrealized gain (loss) | 6.867 | 8.829 | (8.381) | 7.948 | 5.967 | 5.947 |
Total income (loss) from operations | $6.760 | $8.740 | $(8.480) | $7.760 | $5.930 | $5.950 |
Net asset value — End of period | $47.740 | $40.980 | $32.240 | $40.720 | $32.960 | $27.030 |
Total Return(2) | 16.50%(3) | 27.11% | (20.83)% | 23.54% | 21.94% | 28.22% |
Ratios/Supplemental Data | ||||||
Net assets, end of period (000’s omitted) | $52,269 | $47,967 | $43,673 | $61,484 | $54,119 | $61,397 |
Ratios (as a percentage of average daily net assets):(4) | ||||||
Expenses | 1.63%(5)(6) | 1.64%(5) | 1.65%(5) | 1.63% | 1.67% | 1.68% |
Net investment income (loss) | (0.48)%(6) | (0.24)% | (0.29)% | (0.51)% | (0.14)% | 0.01% |
Portfolio Turnover of the Portfolio(7) | 4%(3) | 7% | 3% | 1% | 1% | 1% |
(1) | Computed using average shares outstanding. |
(2) | Returns are historical and are calculated by determining the percentage change in net asset value with all distributions reinvested and do not reflect the effect of sales charges. |
(3) | Not annualized. |
(4) | Includes the Fund’s share of the Portfolio's allocated expenses. |
(5) | Includes a reduction by the investment adviser of a portion of the Portfolio's adviser fee due to the Portfolio's investment in the Liquidity Fund (equal to less than 0.005% of average daily net assets for the six months ended June 30, 2024 and the years ended December 31, 2023 and 2022). |
(6) | Annualized. |
(7) | Excludes the value of portfolio securities contributed or distributed as a result of in-kind shareholder transactions. |
Tax-Managed Growth Fund 1.2 — Class I | ||||||
Six Months Ended June 30, 2024 (Unaudited) | Year Ended December 31, | |||||
2023 | 2022 | 2021 | 2020 | 2019 | ||
Net asset value — Beginning of period | $42.820 | $33.580 | $42.290 | $34.030 | $27.830 | $21.690 |
Income (Loss) From Operations | ||||||
Net investment income(1) | $0.120 | $0.288 | $0.257 | $0.190 | $0.242 | $0.266 |
Net realized and unrealized gain (loss) | 7.190 | 9.238 | (8.719) | 8.235 | 6.192 | 6.130 |
Total income (loss) from operations | $7.310 | $9.526 | $(8.462) | $8.425 | $6.434 | $6.396 |
Less Distributions | ||||||
From net investment income | $— | $(0.286) | $(0.248) | $(0.165) | $(0.234) | $(0.256) |
Total distributions | $— | $(0.286) | $(0.248) | $(0.165) | $(0.234) | $(0.256) |
Net asset value — End of period | $50.130 | $42.820 | $33.580 | $42.290 | $34.030 | $27.830 |
Total Return(2) | 17.07%(3) | 28.37% | (20.01)% | 24.77% | 23.13% | 29.61% |
Ratios/Supplemental Data | ||||||
Net assets, end of period (000’s omitted) | $398,068 | $337,129 | $260,923 | $326,586 | $256,802 | $223,771 |
Ratios (as a percentage of average daily net assets):(4) | ||||||
Expenses | 0.63%(5)(6) | 0.64%(5) | 0.64%(5) | 0.63% | 0.67% | 0.68% |
Net investment income | 0.52%(6) | 0.75% | 0.72% | 0.49% | 0.85% | 1.05% |
Portfolio Turnover of the Portfolio(7) | 4%(3) | 7% | 3% | 1% | 1% | 1% |
(1) | Computed using average shares outstanding. |
(2) | Returns are historical and are calculated by determining the percentage change in net asset value with all distributions reinvested. |
(3) | Not annualized. |
(4) | Includes the Fund’s share of the Portfolio's allocated expenses. |
(5) | Includes a reduction by the investment adviser of a portion of the Portfolio's adviser fee due to the Portfolio's investment in the Liquidity Fund (equal to less than 0.005% of average daily net assets for the six months ended June 30, 2024 and the years ended December 31, 2023 and 2022). |
(6) | Annualized. |
(7) | Excludes the value of portfolio securities contributed or distributed as a result of in-kind shareholder transactions. |
Tax-Managed Growth Fund 1.1 | Tax-Managed Growth Fund 1.2 | |
Deferred capital losses: | ||
Short-term | $621,977 | $349,710 |
Average Daily Net Assets | Annual Fee Rate |
Up to $500 million | 0.5575% |
$500 million but less than $1 billion | 0.4950% |
$1 billion but less than $1.5 billion | 0.4325% |
$1.5 billion but less than $7 billion | 0.3700% |
$7 billion but less than $10 billion | 0.3575% |
$10 billion but less than $15 billion | 0.3450% |
$15 billion but less than $20 billion | 0.3325% |
$20 billion but less than $25 billion | 0.3225% |
$25 billion but less than $30 billion | 0.3125% |
$30 billion but less than $35 billion | 0.3020% |
$35 billion but less than $45 billion | 0.2970% |
$45 billion and over | 0.2920% |
Tax-Managed Growth Fund 1.1 | Tax-Managed Growth Fund 1.2 | |
EVM's Sub-Transfer Agent Fees | $84,268 | $31,172 |
EVD's Class A Sales Charges | $4,420 | $26,921 |
Morgan Stanley affiliated broker-dealers’ Class A Sales Charges | $2,326 | $4,005 |
Tax-Managed Growth Fund 1.1 | Tax-Managed Growth Fund 1.2 | |
Class A Distribution and Service Fees | $2,546,285 | $1,144,080 |
Tax-Managed Growth Fund 1.1 | Tax-Managed Growth Fund 1.2 | |
Class C Distribution Fees | $21,966 | $187,558 |
Tax-Managed Growth Fund 1.1 | Tax-Managed Growth Fund 1.2 | |
Class C Service Fees | $7,322 | $62,520 |
Tax-Managed Growth Fund 1.1 | Tax-Managed Growth Fund 1.2 | |
Class A | $ — | $ —(1) |
Class C | $ —(1) | $875 |
(1) | Amount is less than $100. |
Fund | Increases | Decreases |
Tax-Managed Growth Fund 1.1 | $2,356 | $67,331,675 |
Tax-Managed Growth Fund 1.2 | $5,845,126 | $19,095,897 |
Fund | Redemptions in-kind |
Tax-Managed Growth Fund 1.1 | $44,140,070 |
Tax-Managed Growth Fund 1.2 | $9,399,154 |
Tax-Managed Growth Fund 1.1 | ||||||
Six Months Ended June 30, 2024 (Unaudited) | Year Ended December 31, 2023 | |||||
Shares | Amount | Shares | Amount | |||
Class A | ||||||
Sales | 62,830 | $ 6,484,547 | 87,027 | $ 7,401,737 | ||
Issued to shareholders electing to receive payments of distributions in Fund shares | — | — | 99,334 | 9,452,625 | ||
Redemptions | (765,587) | (78,783,641) | (1,415,112) | (121,117,982) | ||
Net decrease | (702,757) | $(72,299,094) | (1,228,751) | $(104,263,620) |
Tax-Managed Growth Fund 1.1 (continued) | ||||||
Six Months Ended June 30, 2024 (Unaudited) | Year Ended December 31, 2023 | |||||
Shares | Amount | Shares | Amount | |||
Class C | ||||||
Sales | 1,192 | $ 109,038 | 3,003 | $ 221,476 | ||
Redemptions | (15,510) | (1,442,902) | (18,066) | (1,363,169) | ||
Net decrease | (14,318) | $(1,333,864) | (15,063) | $ (1,141,693) | ||
Class I | ||||||
Sales | 715,102 | $68,574,916 | 1,466,176 | $116,507,251 | ||
Issued to shareholders electing to receive payments of distributions in Fund shares | — | — | 27,698 | 2,451,513 | ||
Redemptions | (617,338) | (58,276,755) | (1,212,568) | (95,719,873) | ||
Net increase | 97,764 | $10,298,161 | 281,306 | $ 23,238,891 |
Tax-Managed Growth Fund 1.2 | ||||||
Six Months Ended June 30, 2024 (Unaudited) | Year Ended December 31, 2023 | |||||
Shares | Amount | Shares | Amount | |||
Class A | ||||||
Sales | 388,157 | $18,178,258 | 712,652 | $27,465,299 | ||
Issued to shareholders electing to receive payments of distributions in Fund shares | — | — | 78,737 | 3,370,736 | ||
Redemptions | (646,082) | (29,955,005) | (1,389,390) | (53,272,793) | ||
Net decrease | (257,925) | $(11,776,747) | (598,001) | $(22,436,758) | ||
Class C | ||||||
Sales | 63,167 | $ 2,789,492 | 152,687 | $ 5,662,028 | ||
Redemptions | (138,660) | (6,175,120) | (336,827) | (12,240,865) | ||
Net decrease | (75,493) | $(3,385,628) | (184,140) | $(6,578,837) | ||
Class I | ||||||
Sales | 631,420 | $29,126,685 | 1,623,779 | $62,042,021 | ||
Issued to shareholders electing to receive payments of distributions in Fund shares | — | — | 48,137 | 2,066,034 | ||
Redemptions | (563,152) | (25,897,106) | (1,570,170) | (59,592,168) | ||
Net increase | 68,268 | $ 3,229,579 | 101,746 | $ 4,515,887 |
Common Stocks — 99.9% |
Security | Shares | Value | |
Aerospace & Defense — 1.6% | |||
Boeing Co.(1) | 142,446 | $ 25,926,597 | |
General Dynamics Corp. | 37,550 | 10,894,757 | |
General Electric Co. | 163,119 | 25,931,027 | |
Lockheed Martin Corp. | 18,733 | 8,750,184 | |
Northrop Grumman Corp. | 16,117 | 7,026,206 | |
RTX Corp. | 156,984 | 15,759,624 | |
$ 94,288,395 | |||
Air Freight & Logistics — 0.8% | |||
C.H. Robinson Worldwide, Inc. | 71,226 | $ 6,276,435 | |
FedEx Corp. | 76,229 | 22,856,503 | |
United Parcel Service, Inc., Class B | 127,908 | 17,504,210 | |
$ 46,637,148 | |||
Banks — 3.3% | |||
Bank of America Corp. | 478,599 | $ 19,033,882 | |
Fifth Third Bancorp | 491,355 | 17,929,544 | |
JPMorgan Chase & Co. | 514,622 | 104,087,446 | |
PNC Financial Services Group, Inc. | 15,834 | 2,461,870 | |
Regions Financial Corp. | 261,997 | 5,250,420 | |
Truist Financial Corp. | 311,559 | 12,104,067 | |
U.S. Bancorp | 71,160 | 2,825,052 | |
Wells Fargo & Co. | 446,596 | 26,523,337 | |
$ 190,215,618 | |||
Beverages — 1.2% | |||
Constellation Brands, Inc., Class A | 66,155 | $ 17,020,359 | |
Monster Beverage Corp.(1) | 322,992 | 16,133,450 | |
PepsiCo, Inc. | 228,875 | 37,748,354 | |
$ 70,902,163 | |||
Biotechnology — 2.2% | |||
AbbVie, Inc. | 193,103 | $ 33,121,027 | |
Amgen, Inc. | 97,100 | 30,338,895 | |
Argenx SE ADR(1) | 41,279 | 17,751,621 | |
Gilead Sciences, Inc. | 42,704 | 2,929,921 | |
Vertex Pharmaceuticals, Inc.(1) | 83,684 | 39,224,365 | |
$ 123,365,829 | |||
Broadline Retail — 4.8% | |||
Amazon.com, Inc.(1) | 1,419,500 | $ 274,318,375 | |
$ 274,318,375 |
Security | Shares | Value | |
Building Products — 0.2% | |||
Carrier Global Corp. | 189,214 | $ 11,935,619 | |
$ 11,935,619 | |||
Capital Markets — 3.0% | |||
Bank of New York Mellon Corp. | 142,205 | $ 8,516,658 | |
BlackRock, Inc. | 7,289 | 5,738,776 | |
Cboe Global Markets, Inc. | 75,857 | 12,900,241 | |
Charles Schwab Corp. | 371,381 | 27,367,066 | |
CME Group, Inc. | 36,417 | 7,159,582 | |
Goldman Sachs Group, Inc. | 126,078 | 57,027,601 | |
Intercontinental Exchange, Inc. | 60,970 | 8,346,183 | |
Moody's Corp. | 66,944 | 28,178,738 | |
S&P Global, Inc. | 32,008 | 14,275,568 | |
$ 169,510,413 | |||
Chemicals — 1.6% | |||
DuPont de Nemours, Inc. | 142,744 | $ 11,489,465 | |
Ecolab, Inc. | 110,020 | 26,184,760 | |
Linde PLC | 72,347 | 31,746,587 | |
PPG Industries, Inc. | 89,144 | 11,222,338 | |
Sherwin-Williams Co. | 32,982 | 9,842,818 | |
$ 90,485,968 | |||
Commercial Services & Supplies — 0.6% | |||
Waste Connections, Inc. | 57,850 | $ 10,144,576 | |
Waste Management, Inc. | 108,692 | 23,188,351 | |
$ 33,332,927 | |||
Communications Equipment — 1.2% | |||
Arista Networks, Inc.(1) | 129,548 | $ 45,403,983 | |
Cisco Systems, Inc. | 517,461 | 24,584,572 | |
$ 69,988,555 | |||
Consumer Finance — 0.8% | |||
American Express Co. | 120,199 | $ 27,832,079 | |
Discover Financial Services | 144,856 | 18,948,613 | |
$ 46,780,692 | |||
Consumer Staples Distribution & Retail — 2.9% | |||
Costco Wholesale Corp. | 113,479 | $ 96,456,015 | |
Walmart, Inc. | 985,500 | 66,728,205 | |
$ 163,184,220 | |||
Electric Utilities — 0.9% | |||
Duke Energy Corp. | 368,733 | $ 36,958,109 |
Security | Shares | Value | |
Electric Utilities (continued) | |||
Edison International | 197,713 | $ 14,197,770 | |
$ 51,155,879 | |||
Electrical Equipment — 1.0% | |||
AMETEK, Inc. | 54,862 | $ 9,146,044 | |
Emerson Electric Co. | 269,079 | 29,641,743 | |
GE Vernova, Inc.(1) | 27,228 | 4,669,874 | |
Rockwell Automation, Inc. | 50,722 | 13,962,752 | |
$ 57,420,413 | |||
Energy Equipment & Services — 0.3% | |||
Halliburton Co. | 166,374 | $ 5,620,114 | |
Schlumberger NV | 205,631 | 9,701,670 | |
$ 15,321,784 | |||
Entertainment — 2.4% | |||
Netflix, Inc.(1) | 115,984 | $ 78,275,282 | |
Walt Disney Co. | 612,448 | 60,809,962 | |
$ 139,085,244 | |||
Financial Services — 3.8% | |||
Berkshire Hathaway, Inc., Class A(1) | 84 | $ 51,428,244 | |
Berkshire Hathaway, Inc., Class B(1) | 224,230 | 91,216,764 | |
Mastercard, Inc., Class A | 36,635 | 16,161,896 | |
Visa, Inc., Class A | 212,810 | 55,856,241 | |
$ 214,663,145 | |||
Food Products — 0.4% | |||
Hershey Co. | 47,710 | $ 8,770,529 | |
Lamb Weston Holdings, Inc. | 70,384 | 5,917,887 | |
McCormick & Co., Inc., Non Voting Shares | 96,258 | 6,828,543 | |
$ 21,516,959 | |||
Ground Transportation — 1.5% | |||
Norfolk Southern Corp. | 65,062 | $ 13,968,161 | |
Uber Technologies, Inc.(1) | 551,998 | 40,119,214 | |
Union Pacific Corp. | 148,572 | 33,615,901 | |
$ 87,703,276 | |||
Health Care Equipment & Supplies — 2.4% | |||
Abbott Laboratories | 260,303 | $ 27,048,085 | |
Boston Scientific Corp.(1) | 289,826 | 22,319,500 | |
GE HealthCare Technologies, Inc. | 135,517 | 10,559,485 | |
Intuitive Surgical, Inc.(1) | 101,205 | 45,021,044 |
Security | Shares | Value | |
Health Care Equipment & Supplies (continued) | |||
Stryker Corp. | 72,313 | $ 24,604,498 | |
Zimmer Biomet Holdings, Inc. | 77,057 | 8,362,996 | |
$ 137,915,608 | |||
Health Care Providers & Services — 2.0% | |||
Elevance Health, Inc. | 46,712 | $ 25,311,365 | |
HCA Healthcare, Inc. | 64,083 | 20,588,586 | |
UnitedHealth Group, Inc. | 137,254 | 69,897,972 | |
$ 115,797,923 | |||
Hotels, Restaurants & Leisure — 2.2% | |||
Airbnb, Inc., Class A(1) | 74,000 | $ 11,220,620 | |
Booking Holdings, Inc. | 15,827 | 62,698,661 | |
Marriott International, Inc., Class A | 46,029 | 11,128,431 | |
Starbucks Corp. | 374,947 | 29,189,624 | |
Yum! Brands, Inc. | 78,214 | 10,360,226 | |
$ 124,597,562 | |||
Household Products — 1.3% | |||
Colgate-Palmolive Co. | 397,371 | $ 38,560,882 | |
Procter & Gamble Co. | 220,699 | 36,397,679 | |
$ 74,958,561 | |||
Industrial Conglomerates — 0.1% | |||
Honeywell International, Inc. | 15,509 | $ 3,311,792 | |
$ 3,311,792 | |||
Industrial REITs — 0.2% | |||
EastGroup Properties, Inc. | 74,500 | $ 12,672,450 | |
$ 12,672,450 | |||
Insurance — 1.6% | |||
Aflac, Inc. | 154,400 | $ 13,789,464 | |
Aon PLC, Class A | 27,135 | 7,966,293 | |
Arthur J. Gallagher & Co. | 47,054 | 12,201,573 | |
Markel Group, Inc.(1) | 6,362 | 10,024,349 | |
Marsh & McLennan Cos., Inc. | 46,353 | 9,767,504 | |
Progressive Corp. | 151,029 | 31,370,234 | |
Travelers Cos., Inc. | 20,353 | 4,138,579 | |
$ 89,257,996 | |||
Interactive Media & Services — 9.3% | |||
Alphabet, Inc., Class A | 857,372 | $ 156,170,310 |
Security | Shares | Value | |
Interactive Media & Services (continued) | |||
Alphabet, Inc., Class C | 980,031 | $ 179,757,286 | |
Meta Platforms, Inc., Class A | 390,389 | 196,841,941 | |
$ 532,769,537 | |||
IT Services — 0.9% | |||
Accenture PLC, Class A | 147,397 | $ 44,721,724 | |
Akamai Technologies, Inc.(1) | 105,245 | 9,480,469 | |
$ 54,202,193 | |||
Life Sciences Tools & Services — 1.3% | |||
Agilent Technologies, Inc. | 176,400 | $ 22,866,732 | |
Danaher Corp. | 212,007 | 52,969,949 | |
$ 75,836,681 | |||
Machinery — 1.9% | |||
Caterpillar, Inc. | 55,142 | $ 18,367,800 | |
Deere & Co. | 32,269 | 12,056,666 | |
Donaldson Co., Inc. | 73,526 | 5,261,521 | |
Dover Corp. | 96,347 | 17,385,816 | |
Illinois Tool Works, Inc. | 143,086 | 33,905,659 | |
Otis Worldwide Corp. | 68,364 | 6,580,719 | |
Parker-Hannifin Corp. | 24,957 | 12,623,500 | |
$ 106,181,681 | |||
Media — 0.1% | |||
Comcast Corp., Class A | 147,653 | $ 5,782,091 | |
$ 5,782,091 | |||
Metals & Mining — 0.3% | |||
Alcoa Corp. | 240,000 | $ 9,547,200 | |
Nucor Corp. | 35,624 | 5,631,442 | |
$ 15,178,642 | |||
Multi-Utilities — 0.1% | |||
Consolidated Edison, Inc. | 50,472 | $ 4,513,206 | |
$ 4,513,206 | |||
Oil, Gas & Consumable Fuels — 3.2% | |||
Antero Resources Corp.(1) | 328,489 | $ 10,718,596 | |
Cheniere Energy, Inc. | 149,498 | 26,136,735 | |
ConocoPhillips | 285,715 | 32,680,082 | |
EOG Resources, Inc. | 16,793 | 2,113,735 | |
Exxon Mobil Corp. | 789,802 | 90,922,006 |
Security | Shares | Value | |
Oil, Gas & Consumable Fuels (continued) | |||
Marathon Petroleum Corp. | 69,480 | $ 12,053,391 | |
Phillips 66 | 51,867 | 7,322,064 | |
$ 181,946,609 | |||
Pharmaceuticals — 3.8% | |||
Bristol-Myers Squibb Co. | 136,371 | $ 5,663,488 | |
Eli Lilly & Co. | 128,949 | 116,747,846 | |
Johnson & Johnson | 267,485 | 39,095,607 | |
Merck & Co., Inc. | 214,406 | 26,543,463 | |
Pfizer, Inc. | 210,749 | 5,896,757 | |
Zoetis, Inc. | 120,003 | 20,803,720 | |
$ 214,750,881 | |||
Professional Services — 0.6% | |||
Automatic Data Processing, Inc. | 68,245 | $ 16,289,399 | |
Jacobs Solutions, Inc. | 54,159 | 7,566,554 | |
Verisk Analytics, Inc. | 46,792 | 12,612,784 | |
$ 36,468,737 | |||
Residential REITs — 0.3% | |||
Invitation Homes, Inc. | 437,000 | $ 15,683,930 | |
$ 15,683,930 | |||
Semiconductors & Semiconductor Equipment — 11.4% | |||
Analog Devices, Inc. | 133,698 | $ 30,517,905 | |
Applied Materials, Inc. | 203,182 | 47,948,920 | |
Broadcom, Inc. | 24,966 | 40,083,662 | |
Intel Corp. | 583,547 | 18,072,451 | |
Lam Research Corp. | 25,000 | 26,621,250 | |
Marvell Technology, Inc. | 70,777 | 4,947,312 | |
NVIDIA Corp. | 3,013,691 | 372,311,386 | |
ON Semiconductor Corp.(1) | 175,000 | 11,996,250 | |
QUALCOMM, Inc. | 332,116 | 66,150,865 | |
Texas Instruments, Inc. | 158,452 | 30,823,668 | |
$ 649,473,669 | |||
Software — 11.6% | |||
Adobe, Inc.(1) | 80,383 | $ 44,655,972 | |
Cadence Design Systems, Inc.(1) | 83,984 | 25,846,076 | |
Fortinet, Inc.(1) | 100,000 | 6,027,000 | |
Intuit, Inc. | 37,210 | 24,454,784 | |
Microsoft Corp. | 909,092 | 406,318,669 | |
Oracle Corp. | 77,826 | 10,989,031 | |
Palo Alto Networks, Inc.(1) | 168,632 | 57,167,934 | |
Salesforce, Inc. | 112,456 | 28,912,438 |
Security | Shares | Value | |
Software (continued) | |||
ServiceNow, Inc.(1) | 63,729 | $ 50,133,693 | |
Workday, Inc., Class A(1) | 35,900 | 8,025,804 | |
$ 662,531,401 | |||
Specialized REITs — 0.2% | |||
CubeSmart | 303,500 | $ 13,709,095 | |
$ 13,709,095 | |||
Specialty Retail — 2.5% | |||
Lowe's Cos., Inc. | 212,443 | $ 46,835,184 | |
O'Reilly Automotive, Inc.(1) | 31,700 | 33,477,102 | |
Ross Stores, Inc. | 139,505 | 20,272,867 | |
TJX Cos., Inc. | 219,657 | 24,184,236 | |
Tractor Supply Co. | 50,157 | 13,542,390 | |
Ulta Beauty, Inc.(1) | 16,927 | 6,531,621 | |
$ 144,843,400 | |||
Technology Hardware, Storage & Peripherals — 7.1% | |||
Apple, Inc. | 1,935,119 | $ 407,574,764 | |
$ 407,574,764 | |||
Textiles, Apparel & Luxury Goods — 0.6% | |||
NIKE, Inc., Class B | 419,131 | $ 31,589,903 | |
$ 31,589,903 | |||
Tobacco — 0.4% | |||
Altria Group, Inc. | 157,274 | $ 7,163,831 | |
Philip Morris International, Inc. | 162,661 | 16,482,439 | |
$ 23,646,270 | |||
Total Common Stocks (identified cost $1,659,213,394) | $5,707,007,204 |
Short-Term Investments — 0.1% |
Security | Shares | Value | |
Morgan Stanley Institutional Liquidity Funds - Government Portfolio, Institutional Class, 5.22%(2) | 9,391,380 | $ 9,391,380 | |
Total Short-Term Investments (identified cost $9,391,380) | $ 9,391,380 | ||
Total Investments — 100.0% (identified cost $1,668,604,774) | $5,716,398,584 | ||
Other Assets, Less Liabilities — (0.0)%(3) | $ (1,674,755) | ||
Net Assets — 100.0% | $5,714,723,829 |
The percentage shown for each investment category in the Portfolio of Investments is based on net assets. | |
(1) | Non-income producing security. |
(2) | May be deemed to be an affiliated investment company. The rate shown is the annualized seven-day yield as of June 30, 2024. |
(3) | Amount is less than (0.05)%. |
Abbreviations: | |
ADR | – American Depositary Receipt |
REITs | – Real Estate Investment Trusts |
June 30, 2024 | |
Assets | |
Unaffiliated investments, at value (identified cost $1,659,213,394) | $5,707,007,204 |
Affiliated investments, at value (identified cost $9,391,380) | 9,391,380 |
Dividends receivable | 2,038,653 |
Dividends receivable from affiliated investments | 39,422 |
Receivable for investments sold | 4,391,410 |
Tax reclaims receivable | 393,691 |
Receivable from affiliates | 2,895 |
Trustees' deferred compensation plan | 292,138 |
Total assets | $5,723,556,793 |
Liabilities | |
Payable for investments purchased | $5,845,271 |
Payable to affiliates: | |
Investment adviser fee | 1,865,701 |
Trustees' deferred compensation plan | 292,138 |
Accrued expenses | 829,854 |
Total liabilities | $8,832,964 |
Net Assets applicable to investors' interest in Portfolio | $5,714,723,829 |
Six Months Ended | |
June 30, 2024 | |
Investment Income | |
Dividend income (net of foreign taxes withheld of $226,568) | $30,367,042 |
Dividend income from affiliated investments | 298,009 |
Total investment income | $30,665,051 |
Expenses | |
Investment adviser fee | $10,834,228 |
Trustees’ fees and expenses | 27,125 |
Custodian fee | 338,388 |
Professional fees | 265,884 |
Miscellaneous | 135,940 |
Total expenses | $11,601,565 |
Deduct: | |
Waiver and/or reimbursement of expenses by affiliates | $117,344 |
Total expense reductions | $117,344 |
Net expenses | $11,484,221 |
Net investment income | $19,180,830 |
Realized and Unrealized Gain (Loss) | |
Net realized gain (loss): | |
Investment transactions(1) | $166,502,630 |
Foreign currency transactions | (3,581) |
Net realized gain | $166,499,049 |
Change in unrealized appreciation (depreciation): | |
Investments | $665,742,622 |
Foreign currency | (18,918) |
Net change in unrealized appreciation (depreciation) | $665,723,704 |
Net realized and unrealized gain | $832,222,753 |
Net increase in net assets from operations | $851,403,583 |
(1) | Aggregate amount includes $98,711,497 of net realized gains from redemptions in-kind. |
Six Months Ended June 30, 2024 (Unaudited) | Year Ended December 31, 2023 | |
Increase (Decrease) in Net Assets | ||
From operations: | ||
Net investment income | $19,180,830 | $52,994,979 |
Net realized gain | 166,499,049 | 59,644,550 |
Net change in unrealized appreciation (depreciation) | 665,723,704 | 2,155,004,517 |
Net increase in net assets from operations | $851,403,583 | $2,267,644,046 |
Capital transactions: | ||
Contributions | $9,622,139 | $90,713,310 |
Withdrawals | (181,173,278) | (27,916,548,380) |
Net decrease in net assets from capital transactions | $(171,551,139) | $(27,825,835,070) |
Net increase (decrease) in net assets | $679,852,444 | $(25,558,191,024) |
Net Assets | ||
At beginning of period | $5,034,871,385 | $30,593,062,409 |
At end of period | $5,714,723,829 | $5,034,871,385 |
Six Months Ended June 30, 2024 (Unaudited) | Year Ended December 31, | |||||
Ratios/Supplemental Data | 2023 | 2022 | 2021 | 2020 | 2019 | |
Ratios (as a percentage of average daily net assets): | ||||||
Expenses | 0.43%(1)(2)(3) | 0.43%(2)(3) | 0.43%(3) | 0.43% | 0.44% | 0.45% |
Net investment income | 0.72%(1) | 0.95% | 0.93% | 0.69% | 1.07% | 1.28% |
Portfolio Turnover(4) | 4%(5) | 7% | 3% | 1% | 1% | 1% |
Total Return | 17.19%(5) | 28.67% | (19.86)% | 25.05% | 23.42% | 29.87% |
Net assets, end of period (000’s omitted) | $5,714,724 | $5,034,871 | $30,593,062 | $37,312,610 | $27,986,714 | $22,013,353 |
(1) | Annualized. |
(2) | The investment adviser reimbursed certain operating expenses (equal to less than 0.005% and 0.02% of average daily net assets for the six months ended June 30, 2024 and the year ended December 31, 2023, respectively). Absent this reimbursement, total return would be lower. |
(3) | Includes a reduction by the investment adviser of a portion of its adviser fee due to the Portfolio’s investment in the Liquidity Fund (equal to less than 0.005% of average daily net assets for the six months ended June 30, 2024 and the years ended December 31, 2023 and 2022). |
(4) | Excludes the value of portfolio securities contributed or distributed as a result of in-kind shareholder transactions. |
(5) | Not annualized. |
Average Daily Net Assets | Annual Fee Rate |
Up to $500 million | 0.5575% |
$500 million but less than $1 billion | 0.4950% |
$1 billion but less than $1.5 billion | 0.4325% |
$1.5 billion but less than $7 billion | 0.3700% |
$7 billion but less than $10 billion | 0.3575% |
$10 billion but less than $15 billion | 0.3450% |
$15 billion but less than $20 billion | 0.3325% |
$20 billion but less than $25 billion | 0.3225% |
$25 billion but less than $30 billion | 0.3125% |
$30 billion but less than $35 billion | 0.3020% |
$35 billion but less than $45 billion | 0.2970% |
$45 billion and over | 0.2920% |
Aggregate cost | $1,841,361,980 |
Gross unrealized appreciation | $3,875,464,022 |
Gross unrealized depreciation | (427,418) |
Net unrealized appreciation | $3,875,036,604 |
Name | Value, beginning of period | Purchases | Sales proceeds | Net realized gain (loss) | Change in unrealized appreciation (depreciation) | Value, end of period | Dividend income | Shares, end of period |
Short-Term Investments | ||||||||
Liquidity Fund | $2,564,731 | $91,834,104 | $(85,007,455) | $ — | $ — | $9,391,380 | $298,009 | 9,391,380 |
• | Level 1 – quoted prices in active markets for identical investments |
• | Level 2 – other significant observable inputs (including quoted prices for similar investments, interest rates, prepayment speeds, credit risk, etc.) |
• | Level 3 – significant unobservable inputs (including a fund's own assumptions in determining the fair value of investments) |
Asset Description | Level 1 | Level 2 | Level 3 | Total |
Common Stocks | $5,707,007,204* | $ — | $ — | $5,707,007,204 |
Short-Term Investments | 9,391,380 | — | — | 9,391,380 |
Total Investments | $ 5,716,398,584 | $ — | $ — | $5,716,398,584 |
* | The level classification by major category of investments is the same as the category presentation in the Portfolio of Investments. |
Exchange-Traded Funds — 5.3% |
Security | Shares | Value | |
Equity Funds — 5.3% | |||
SPDR Gold MiniShares Trust(1) | 1,577,000 | $ 72,683,930 | |
Total Exchange-Traded Funds (identified cost $54,345,418) | $ 72,683,930 |
Short-Term Investments — 84.2% |
Affiliated Fund — 2.6% |
Security | Shares | Value | |
Morgan Stanley Institutional Liquidity Funds - Government Portfolio, Institutional Class, 5.22%(2) | 36,865,568 | $ 36,865,568 | |
Total Affiliated Fund (identified cost $36,865,568) | $ 36,865,568 |
U.S. Treasury Obligations — 81.6% |
Security | Principal Amount (000's omitted) | Value | |
U.S. Treasury Bills: | |||
0.00%, 7/11/24 | $ | 41,830 | $ 41,769,037 |
0.00%, 8/1/24 | 15,130 | 15,061,737 | |
0.00%, 8/8/24 | 129,410 | 128,694,901 | |
0.00%, 9/5/24 | 47,660 | 47,205,062 | |
0.00%, 10/31/24 | 30,720 | 30,181,768 | |
0.00%, 11/29/24 | 15,590 | 15,255,523 | |
0.00%, 12/26/24 | 20,947 | 20,417,751 | |
0.00%, 1/23/25 | 60,367 | 58,674,376 | |
0.00%, 2/20/25 | 30,720 | 29,729,088 | |
0.00%, 3/20/25 | 52,127 | 50,251,812 | |
0.00%, 4/17/25 | 20,947 | 20,118,910 | |
0.00%, 5/15/25 | 70,947 | 67,884,011 | |
U.S. Treasury Bonds, 7.625%, 2/15/25 | 20,947 | 21,283,126 | |
U.S. Treasury Inflation-Indexed Bonds, 2.375%, 1/15/25(3) | 89,813 | 89,008,831 |
Security | Principal Amount (000's omitted) | Value | |
U.S. Treasury Inflation-Indexed Notes:(3) | |||
0.125%, 7/15/24 | $ | 132,033 | $ 131,948,532 |
0.125%, 4/15/25 | 60,687 | 59,037,213 | |
U.S. Treasury Notes: | |||
0.25%, 5/31/25 | 50,000 | 47,813,167 | |
0.375%, 8/15/24 | 13,750 | 13,664,952 | |
0.375%, 4/30/25 | 20,947 | 20,134,687 | |
1.125%, 1/15/25 | 23,830 | 23,306,305 | |
1.25%, 8/31/24 | 13,750 | 13,654,104 | |
1.375%, 1/31/25 | 23,830 | 23,296,813 | |
1.50%, 2/15/25 | 20,947 | 20,457,699 | |
1.75%, 3/15/25 | 36,537 | 35,661,157 | |
2.75%, 5/15/25 | 20,947 | 20,514,609 | |
3.00%, 7/31/24 | 13,750 | 13,722,938 | |
3.875%, 3/31/25 | 15,590 | 15,437,554 | |
4.25%, 5/31/25 | 50,000 | 49,584,714 | |
Total U.S. Treasury Obligations (identified cost $1,125,177,150) | $1,123,770,377 | ||
Total Short-Term Investments (identified cost $1,162,042,718) | $1,160,635,945 | ||
Total Investments — 89.5% (identified cost $1,216,388,136) | $1,233,319,875 | ||
Other Assets, Less Liabilities — 10.5% | $ 144,017,734 | ||
Net Assets — 100.0% | $1,377,337,609 |
The percentage shown for each investment category in the Consolidated Portfolio of Investments is based on net assets. | |
(1) | Non-income producing security. |
(2) | May be deemed to be an affiliated investment company. The rate shown is the annualized seven-day yield as of June 30, 2024. |
(3) | Inflation-linked security whose principal is adjusted for inflation based on changes in the U.S. Consumer Price Index. Interest is calculated based on the inflation-adjusted principal. |
Futures Contracts | |||||
Description | Number of Contracts | Position | Expiration Date | Notional Amount | Value/Unrealized Appreciation (Depreciation) |
Commodity Futures | |||||
Brent Crude Oil | 312 | Long | 8/30/24 | $ 26,267,280 | $ 2,053,320 |
Cocoa | 283 | Long | 9/13/24 | 21,878,730 | 180,240 |
Coffee | 638 | Long | 9/18/24 | 54,261,900 | 6,638,878 |
Futures Contracts (continued) | |||||
Description | Number of Contracts | Position | Expiration Date | Notional Amount | Value/Unrealized Appreciation (Depreciation) |
Commodity Futures (continued) | |||||
Copper | 433 | Long | 9/26/24 | $ 47,537,988 | $(1,954,525) |
Corn | 2,208 | Long | 9/13/24 | 44,988,000 | (6,695,711) |
Cotton No. 2 | 625 | Long | 12/6/24 | 22,715,625 | (1,016,780) |
Feeder Cattle | 93 | Long | 9/26/24 | 12,073,725 | 159,725 |
Gold | 112 | Long | 12/27/24 | 26,718,720 | (397,240) |
Kansas Wheat | 400 | Long | 9/13/24 | 11,725,000 | (1,374,950) |
Lean Hogs | 771 | Long | 10/14/24 | 23,353,590 | (1,122,300) |
Live Cattle | 688 | Long | 10/31/24 | 50,877,600 | 1,255,890 |
LME Copper | 201 | Long | 7/15/24 | 47,684,537 | 576,468 |
LME Copper | 197 | Long | 8/19/24 | 47,015,478 | (1,947,151) |
LME Copper | 200 | Long | 9/16/24 | 47,960,750 | (1,754,350) |
LME Lead | 447 | Long | 7/15/24 | 24,463,640 | 503,322 |
LME Lead | 443 | Long | 8/19/24 | 24,506,206 | (147,961) |
LME Lead | 442 | Long | 9/16/24 | 24,631,003 | (79,671) |
LME Nickel | 447 | Long | 7/15/24 | 45,844,070 | (1,765,748) |
LME Nickel | 432 | Long | 8/19/24 | 44,557,102 | (5,410,403) |
LME Nickel | 434 | Long | 9/16/24 | 44,978,267 | (2,774,041) |
LME Primary Aluminum | 1,531 | Long | 7/15/24 | 95,324,653 | 1,475,884 |
LME Primary Aluminum | 1,513 | Long | 8/19/24 | 94,909,734 | (2,012,791) |
LME Primary Aluminum | 1,544 | Long | 9/16/24 | 97,409,416 | (4,073,612) |
LME Tin | 82 | Long | 7/15/24 | 13,338,530 | 1,600,640 |
LME Tin | 75 | Long | 8/19/24 | 12,243,000 | 249,000 |
LME Tin | 75 | Long | 9/16/24 | 12,280,500 | 516,000 |
LME Zinc | 731 | Long | 7/15/24 | 52,821,146 | 4,344,150 |
LME Zinc | 684 | Long | 8/19/24 | 49,855,905 | 17,502 |
LME Zinc | 677 | Long | 9/16/24 | 49,682,830 | 1,089,801 |
Low Sulphur Gasoil | 699 | Long | 9/12/24 | 54,801,600 | 5,222,650 |
Natural Gas | 2,657 | Long | 12/27/24 | 101,603,680 | (4,490,012) |
NY Harbor ULSD | 509 | Long | 8/30/24 | 54,490,384 | 4,477,242 |
Palladium | 263 | Long | 9/26/24 | 25,718,770 | 540,760 |
Platinum | 493 | Long | 10/29/24 | 24,997,565 | 8,735 |
RBOB Gasoline | 1,035 | Long | 8/30/24 | 107,414,370 | 7,352,881 |
Robusta Coffee | 286 | Long | 9/24/24 | 11,471,460 | (875,570) |
Silver | 676 | Long | 9/26/24 | 99,912,800 | 8,771,773 |
Soybean Meal | 708 | Long | 12/13/24 | 23,753,400 | (2,527,070) |
Soybean Oil | 1,875 | Long | 12/13/24 | 49,263,750 | (431,400) |
Soybeans | 858 | Long | 11/14/24 | 47,361,600 | (4,110,949) |
Sugar No. 11 | 1,073 | Long | 9/30/24 | 24,395,728 | 1,208,895 |
Wheat | 743 | Long | 9/13/24 | 21,305,525 | (2,583,037) |
White Sugar | 449 | Long | 9/13/24 | 12,893,035 | 796,780 |
WTI Crude Oil | 330 | Long | 8/20/24 | 26,611,200 | 2,384,370 |
LME Copper | (201) | Short | 7/15/24 | (47,684,537) | 2,007,889 |
LME Copper | (197) | Short | 8/19/24 | (47,015,478) | 1,785,411 |
Futures Contracts (continued) | |||||
Description | Number of Contracts | Position | Expiration Date | Notional Amount | Value/Unrealized Appreciation (Depreciation) |
Commodity Futures (continued) | |||||
LME Lead | (447) | Short | 7/15/24 | $(24,463,640) | $ 246,520 |
LME Lead | (443) | Short | 8/19/24 | (24,506,206) | 79,408 |
LME Nickel | (447) | Short | 7/15/24 | (45,844,070) | 5,693,269 |
LME Nickel | (432) | Short | 8/19/24 | (44,557,102) | 2,776,887 |
LME Primary Aluminum | (1,531) | Short | 7/15/24 | (95,324,653) | 2,099,568 |
LME Primary Aluminum | (1,513) | Short | 8/19/24 | (94,909,734) | 3,986,377 |
LME Tin | (82) | Short | 7/15/24 | (13,338,530) | (54,150) |
LME Tin | (75) | Short | 8/19/24 | (12,243,000) | (507,004) |
LME Zinc | (731) | Short | 7/15/24 | (52,821,146) | 200,429 |
LME Zinc | (684) | Short | 8/19/24 | (49,855,905) | (1,030,446) |
$21,163,792 |
Abbreviations: | |
LME | – London Metal Exchange |
RBOB | – Reformulated Blendstock for Oxygenate Blending |
ULSD | – Ultra-Low Sulfur Diesel |
WTI | – West Texas Intermediate |
June 30, 2024 | |
Assets | |
Unaffiliated investments, at value (identified cost $1,179,522,568) | $1,196,454,307 |
Affiliated investments, at value (identified cost $36,865,568) | 36,865,568 |
Deposits for derivatives collateral — futures contracts | 136,906,000 |
Interest receivable | 2,922,571 |
Dividends receivable from affiliated investments | 402,085 |
Receivable for Fund shares sold | 3,423,685 |
Receivable for variation margin on open futures contracts | 6,527,859 |
Trustees' deferred compensation plan | 23,242 |
Total assets | $1,383,525,317 |
Liabilities | |
Payable for Fund shares redeemed | $5,040,886 |
Payable to affiliates: | |
Investment adviser and administration fee | 604,749 |
Distribution and service fees | 22,395 |
Trustees' fees | 9,625 |
Trustees' deferred compensation plan | 23,242 |
Accrued expenses | 486,811 |
Total liabilities | $6,187,708 |
Net Assets | $1,377,337,609 |
Sources of Net Assets | |
Paid-in capital | $1,758,581,830 |
Accumulated loss | (381,244,221) |
Net Assets | $1,377,337,609 |
Class A Shares | |
Net Assets | $108,189,545 |
Shares Outstanding | 16,865,324 |
Net Asset Value and Redemption Price Per Share (net assets ÷ shares of beneficial interest outstanding) | $6.41 |
Maximum Offering Price Per Share (100 ÷ 96.75 of net asset value per share) | $6.63 |
Class I Shares | |
Net Assets | $1,269,148,064 |
Shares Outstanding | 195,643,298 |
Net Asset Value, Offering Price and Redemption Price Per Share (net assets ÷ shares of beneficial interest outstanding) | $6.49 |
On sales of $100,000 or more, the offering price of Class A shares is reduced. |
Six Months Ended | |
June 30, 2024 | |
Investment Income | |
Dividend income from affiliated investments | $4,903,276 |
Interest income | 27,543,531 |
Total investment income | $32,446,807 |
Expenses | |
Investment adviser and administration fee | $3,457,933 |
Distribution and service fees: | |
Class A | 131,213 |
Trustees’ fees and expenses | 21,000 |
Custodian fee | 157,505 |
Transfer and dividend disbursing agent fees | 446,849 |
Legal and accounting services | 90,120 |
Printing and postage | 24,410 |
Registration fees | 33,078 |
Miscellaneous | 37,961 |
Total expenses | $4,400,069 |
Deduct: | |
Waiver and/or reimbursement of expenses by affiliates | $139,904 |
Total expense reductions | $139,904 |
Net expenses | $4,260,165 |
Net investment income | $28,186,642 |
Realized and Unrealized Gain (Loss) | |
Net realized gain (loss): | |
Futures contracts | $67,348,357 |
Net realized gain | $67,348,357 |
Change in unrealized appreciation (depreciation): | |
Investments | $7,434,542 |
Futures contracts | 8,662,451 |
Net change in unrealized appreciation (depreciation) | $16,096,993 |
Net realized and unrealized gain | $83,445,350 |
Net increase in net assets from operations | $111,631,992 |
Six Months Ended June 30, 2024 (Unaudited) | Year Ended December 31, 2023 | |
Increase (Decrease) in Net Assets | ||
From operations: | ||
Net investment income | $28,186,642 | $53,954,917 |
Net realized gain (loss) | 67,348,357 | (94,127,427) |
Net change in unrealized appreciation (depreciation) | 16,096,993 | (38,275,579) |
Net increase (decrease) in net assets from operations | $111,631,992 | $(78,448,089) |
Distributions to shareholders: | ||
Class A | $— | $(3,611,212) |
Class I | — | (40,103,075) |
Total distributions to shareholders | $— | $(43,714,287) |
Transactions in shares of beneficial interest: | ||
Class A | $(5,263,724) | $(29,164,244) |
Class I | 69,213,420 | (416,072,596) |
Net increase (decrease) in net assets from Fund share transactions | $63,949,696 | $(445,236,840) |
Net increase (decrease) in net assets | $175,581,688 | $(567,399,216) |
Net Assets | ||
At beginning of period | $1,201,755,921 | $1,769,155,137 |
At end of period | $1,377,337,609 | $1,201,755,921 |
Class A | ||||||
Six Months Ended June 30, 2024 (Unaudited) | Year Ended December 31, | |||||
2023 | 2022 | 2021 | 2020 | 2019 | ||
Net asset value — Beginning of period | $5.860 | $6.370 | $6.260 | $5.510 | $5.270 | $4.880 |
Income (Loss) From Operations | ||||||
Net investment income (loss)(1) | $0.129 | $0.210 | $0.059 | $(0.047) | $(0.002) | $0.077 |
Net realized and unrealized gain (loss) | 0.421 | (0.519) | 0.994 | 1.657 | 0.408 | 0.372 |
Total income (loss) from operations | $0.550 | $(0.309) | $1.053 | $1.610 | $0.406 | $0.449 |
Less Distributions | ||||||
From net investment income | $— | $(0.201) | $(0.943) | $(0.860) | $(0.161) | $(0.059) |
From net realized gain | — | — | — | — | (0.005) | — |
Total distributions | $— | $(0.201) | $(0.943) | $(0.860) | $(0.166) | $(0.059) |
Net asset value — End of period | $6.410 | $5.860 | $6.370 | $6.260 | $5.510 | $5.270 |
Total Return(2) | 9.39%(3) | (4.86)% | 17.05% | 29.60% | 7.73%(4) | 9.18%(4) |
Ratios/Supplemental Data | ||||||
Net assets, end of period (000's omitted) | $108,190 | $104,222 | $143,687 | $92,413 | $27,473 | $9,700 |
Ratios (as a percentage of average daily net assets): | ||||||
Expenses | 0.90%(5)(6) | 0.92%(6) | 0.90%(6) | 0.91% | 0.93%(4) | 0.90%(4) |
Net investment income (loss) | 4.18%(5) | 3.38% | 0.81% | (0.71)% | (0.03)% | 1.51% |
Portfolio Turnover | 0% | 0% | 20% | 0% | 0% | 0% |
(1) | Computed using average shares outstanding. |
(2) | Returns are historical and are calculated by determining the percentage change in net asset value with all distributions reinvested and do not reflect the effect of sales charges, if any. |
(3) | Not annualized. |
(4) | The investment adviser and administrator and sub-adviser reimbursed certain operating expenses (equal to 0.01% and 0.06% of average daily net assets for the years ended December 31, 2020 and 2019, respectively). Absent this reimbursement, total return would be lower. |
(5) | Annualized. |
(6) | Includes a reduction by the investment adviser of a portion of its adviser and administration fee due to the Fund’s investment in the Liquidity Fund (equal to 0.02%, less than 0.01% and less than 0.005% of average daily net assets for the six months ended June 30, 2024 and the years ended December 31, 2023 and 2022, respectively.) |
Class I | ||||||
Six Months Ended June 30, 2024 (Unaudited) | Year Ended December 31, | |||||
2023 | 2022 | 2021 | 2020 | 2019 | ||
Net asset value — Beginning of period | $5.920 | $6.440 | $6.310 | $5.550 | $5.310 | $4.930 |
Income (Loss) From Operations | ||||||
Net investment income (loss)(1) | $0.138 | $0.228 | $0.075 | $(0.031) | $0.018 | $0.088 |
Net realized and unrealized gain (loss) | 0.432 | (0.529) | 1.017 | 1.664 | 0.394 | 0.374 |
Total income (loss) from operations | $0.570 | $(0.301) | $1.092 | $1.633 | $0.412 | $0.462 |
Less Distributions | ||||||
From net investment income | $— | $(0.219) | $(0.962) | $(0.873) | $(0.167) | $(0.082) |
From net realized gain | — | — | — | — | (0.005) | — |
Total distributions | $— | $(0.219) | $(0.962) | $(0.873) | $(0.172) | $(0.082) |
Net asset value — End of period | $6.490 | $5.920 | $6.440 | $6.310 | $5.550 | $5.310 |
Total Return(2) | 9.63%(3) | (4.69)% | 17.56% | 29.80% | 7.79%(4) | 9.58%(4) |
Ratios/Supplemental Data | ||||||
Net assets, end of period (000’s omitted) | $1,269,148 | $1,097,534 | $1,625,468 | $1,360,085 | $410,539 | $332,240 |
Ratios (as a percentage of average daily net assets): | ||||||
Expenses | 0.65%(5)(6) | 0.67%(6) | 0.65%(6) | 0.66% | 0.68%(4) | 0.65%(4) |
Net investment income (loss) | 4.44%(5) | 3.63% | 1.02% | (0.46)% | 0.37% | 1.70% |
Portfolio Turnover | 0% | 0% | 20% | 0% | 0% | 0% |
(1) | Computed using average shares outstanding. |
(2) | Returns are historical and are calculated by determining the percentage change in net asset value with all distributions reinvested. |
(3) | Not annualized. |
(4) | The investment adviser and administrator and sub-adviser reimbursed certain operating expenses (equal to 0.01% and 0.06% of average daily net assets for the years ended December 31, 2020 and 2019, respectively). Absent this reimbursement, total return would be lower. |
(5) | Annualized. |
(6) | Includes a reduction by the investment adviser of a portion of its adviser and administration fee due to the Fund’s investment in the Liquidity Fund (equal to 0.02%, less than 0.01% and less than 0.005% of average daily net assets for the six months ended June 30, 2024 and the years ended December 31, 2023 and 2022, respectively.) |
Aggregate cost | $1,450,457,309 |
Gross unrealized appreciation | $85,841 |
Gross unrealized depreciation | (73,831,027) |
Net unrealized depreciation | $(73,745,186) |
Consolidated Average Daily Net Assets | Annual Fee Rate |
Up to $1 billion | 0.550% |
$1 billion but less than $2.5 billion | 0.525% |
$2.5 billion but less than $5 billion | 0.505% |
$5 billion and over | 0.490% |
Six Months Ended June 30, 2024 (Unaudited) | Year Ended December 31, 2023 | ||||
Shares | Amount | Shares | Amount | ||
Class A | |||||
Sales | 2,998,102 | $ 18,589,399 | 5,893,400 | $ 36,774,602 | |
Issued to shareholders electing to receive payments of distributions in Fund shares | — | — | 605,339 | 3,559,393 | |
Redemptions | (3,904,192) | (23,853,123) | (11,269,576) | (69,498,239) | |
Net decrease | (906,090) | $ (5,263,724) | (4,770,837) | $ (29,164,244) | |
Class I | |||||
Sales | 45,552,026 | $286,817,252 | 87,143,649 | $ 547,778,007 | |
Issued to shareholders electing to receive payments of distributions in Fund shares | — | — | 6,566,252 | 39,003,536 | |
Redemptions | (35,207,138) | (217,603,832) | (160,884,990) | (1,002,854,139) | |
Net increase (decrease) | 10,344,888 | $ 69,213,420 | (67,175,089) | $ (416,072,596) |
Fair Value | ||
Derivative | Asset Derivative | Liability Derivative |
Futures contracts | $70,300,664(1) | $(49,136,872)(1) |
(1) | Amount represents cumulative unrealized appreciation or (depreciation) on futures contracts. Only the variation margin on open futures contracts is reported within the Consolidated Statement of Assets and Liabilities as Receivable or Payable for variation margin on open futures contracts, as applicable. |
Derivative | Realized Gain (Loss) on Derivatives Recognized in Income | Change in Unrealized Appreciation (Depreciation) on Derivatives Recognized in Income |
Futures contracts | $67,348,357(1) | $8,662,451(2) |
(1) | Consolidated Statement of Operations location: Net realized gain (loss) - Futures contracts. |
(2) | Consolidated Statement of Operations location: Change in unrealized appreciation (depreciation) - Futures contracts. |
Futures Contracts — Long | Futures Contracts — Short |
$1,735,973,000 | $546,567,000 |
Name | Value, beginning of period | Purchases | Sales proceeds | Net realized gain (loss) | Change in unrealized appreciation (depreciation) | Value, end of period | Dividend income | Shares, end of period |
Short-Term Investments | ||||||||
Liquidity Fund | $66,269,993 | $1,341,371,695 | $(1,370,776,120) | $ — | $ — | $36,865,568 | $4,903,276 | 36,865,568 |
• | Level 1 – quoted prices in active markets for identical investments |
• | Level 2 – other significant observable inputs (including quoted prices for similar investments, interest rates, prepayment speeds, credit risk, etc.) |
• | Level 3 – significant unobservable inputs (including a fund's own assumptions in determining the fair value of investments) |
Asset Description | Level 1 | Level 2 | Level 3 | Total |
Exchange-Traded Funds | $ 72,683,930 | $ — | $ — | $ 72,683,930 |
Short-Term Investments: | ||||
Affiliated Fund | 36,865,568 | — | — | 36,865,568 |
U.S. Treasury Obligations | — | 1,123,770,377 | — | 1,123,770,377 |
Total Investments | $109,549,498 | $1,123,770,377 | $ — | $1,233,319,875 |
Futures Contracts | $ 70,300,664 | $ — | $ — | $ 70,300,664 |
Total | $179,850,162 | $1,123,770,377 | $ — | $1,303,620,539 |
Liability Description | ||||
Futures Contracts | $(49,136,872) | $ — | $ — | $ (49,136,872) |
Total | $(49,136,872) | $ — | $ — | $ (49,136,872) |
Item 8. Changes in and Disagreements with Accountants for Open-End Management Investment Companies
Not applicable.
Item 9. Proxy Disclosures for Open-End Management Investment Companies
Not applicable.
Item 10. Remuneration Paid to Directors, Officers, and Others of Open-End Management Investment Companies
The information is disclosed as part of the Financial Statements included in Item 7 of this Form N-CSR.
Item 11. Statement Regarding Basis for Approval of Investment Advisory Contract
The information is included in Item 7 of this Form N-CSR.
Item 12. Disclosure of Proxy Voting Policies and Procedures for Closed-End Management Investment Companies
Not applicable.
Item 13. Portfolio Managers of Closed-End Management Investment Companies
Not applicable.
Item 14. Purchases of Equity Securities by Closed-End Management Investment Company and Affiliated Purchasers
Not applicable.
Item 15. Submission of Matters to a Vote of Security Holders
There have been no material changes to the procedures by which shareholders may recommend nominee to the Fund’s Board of Trustees since the Fund last provided disclosure in response to this item.
Item 16. Controls and Procedures
(a) | It is the conclusion of the registrant’s principal executive officer and principal financial officer that the effectiveness of the registrant’s current disclosure controls and procedures (such disclosure controls and procedures having been evaluated within 90 days of the date of this filing) provide reasonable assurance that the information required to be disclosed by the registrant has been recorded, processed, summarized and reported within the time period specified in the Commission’s rules and forms and that the information required to be disclosed by the registrant has been accumulated and communicated to the registrant’s principal executive officer and principal financial officer in order to allow timely decisions regarding required disclosure. |
(b) | There have been no changes in the registrant’s internal controls over financial reporting during the period covered by this report that has materially affected, or is reasonably likely to materially affect, the registrant’s internal control over financial reporting. |
Item 17. Disclosure of Securities Lending Activities for Closed-End Management Investment Companies
Not applicable.
Item 18. Recovery of Erroneously Awarded Compensation
Not applicable.
Item 19. Exhibits
(a)(1) | Registrant’s Code of Ethics – Not applicable (please see Item 2). | |
(a)(2)(i) | Principal Financial Officer’s Section 302 certification. | |
(a)(2)(ii) | Principal Executive Officer’s Section 302 certification. | |
(b) | Combined Section 906 certification. |
Signatures
Pursuant to the requirements of the Securities Exchange Act of 1934 and the Investment Company Act of 1940, the registrant has duly caused this report to be signed on its behalf by the undersigned, thereunto duly authorized.
Eaton Vance Mutual Funds Trust | ||
By: | /s/ Kenneth A. Topping | |
Kenneth A. Topping | ||
Principal Executive Officer | ||
Date: | August 23, 2024 |
Pursuant to the requirements of the Securities Exchange Act of 1934 and the Investment Company Act of 1940, this report has been signed below by the following persons on behalf of the registrant and in the capacities and on the dates indicated.
By: | /s/ James F. Kirchner | |
James F. Kirchner | ||
Principal Financial Officer | ||
Date: | August 23, 2024 | |
By: | /s/ Kenneth A. Topping | |
Kenneth A. Topping | ||
Principal Executive Officer | ||
Date: | August 23, 2024 |