UNITED STATES
SECURITIES AND EXCHANGE COMMISSION
Washington, D.C. 20549
FORM N-CSR
CERTIFIED SHAREHOLDER REPORT OF REGISTERED
MANAGEMENT INVESTMENT COMPANIES
Investment Company Act file number 811-04014
Meridian Fund, Inc.®
(Exact name of registrant as specified in charter)
60 E. Sir Francis Drake Boulevard
Suite 306
Larkspur, CA 94939
(Address of principal executive offices) (Zip code)
Gregg B. Keeling
60 E. Sir Francis Drake Boulevard
Suite 306
Larkspur, CA 94939
(Name and address of agent for service)
registrant’s telephone number, including area code: 415-461-8770
Date of fiscal year end: June 30
Date of reporting period: June 30, 2012
Form N-CSR is to be used by management investment companies to file reports with the Commission not later than 10 days after the transmission to stockholders of any report that is required to be transmitted to stockholders under Rule 30e-1 under the Investment Company Act of 1940 (17 CFR 270.30e-1). The Commission may use the information provided on Form N-CSR in its regulatory, disclosure review, inspection, and policymaking roles.
A registrant is required to disclose the information specified by Form N-CSR, and the Commission will make this information public. A registrant is not required to respond to the collection of information contained in Form N-CSR unless the Form displays a currently valid Office of Management and Budget (“OMB”) control number. Please direct comments concerning the accuracy of the information collection burden estimate and any suggestions for reducing the burden to Secretary, Securities and Exchange Commission, 100 F Street, NE, Washington, DC 20549. The OMB has reviewed this collection of information under the clearance requirements of 44 U.S.C. § 3507.
| Item 1. | Reports to Stockholders. |
The Report to Shareholders is attached herewith.
MERIDIAN FUND, INC.
July 5, 2012
To Our Shareholders:
Stocks declined in the quarter ended June 30, 2012 as worries about European economies intensified, domestic economic indicators weakened and emerging markets such as China, India and Brazil showed slowing growth. The S&P 500 declined 3.3%, the NASDAQ lost 5.1% and the Russell 2000, which includes smaller companies, fell 3.8%. The quarter’s best performing sectors included utilities, consumer staples and health care stocks. Energy, industrials and financials were among the worst performing groups. The yield on the ten-year Treasury bond fell from 2.22% to 1.66% during the quarter, reflecting concerns regarding slowing domestic economic growth.
GDP grew at 1.9% during the first quarter of 2012, a meaningful decline from 3% in the fourth quarter. It is widely speculated that unusually favorable winter weather across much of the country pulled some economic activity into the fourth quarter from the first. The increase in GDP came from personal consumption expenditures, exports and residential fixed investment, offset by declining federal, state and local government spending. We continue to believe that the economy will expand modestly in 2012. It is difficult to foresee greater upside given that ongoing concerns regarding deficits, government spending, health care and taxes will likely be a drag on domestic growth. Euro zone economic problems are likely to persist and there is risk that growth in emerging market economies could slow further. Historically high corporate profit margins may be difficult to sustain and act as a headwind to earnings growth. Recent sharp increases in crop prices could raise the unwelcome specter of food inflation. On the positive side, interest rates remain low and recent declines in energy related commodities, if they persist, may provide some relief.
Long-term investment results, history clearly shows, are improved by buying good companies or mutual funds consistently over an extended period of time.
We welcome those new shareholders who joined the Meridian Funds during the quarter and we appreciate the continued confidence of our existing shareholders.
Jamie England
William Tao
Larry Cordisco
Jim O’Connor
Meridian Equity Income Fund® (MEIFX)
The Meridian Equity Income Fund’s net asset value per share at June 30, 2012 was $10.71. This represents an increase of 4.8% calendar year-to-date. The Fund’s total return and average annual compound rate of return since inception January 31, 2005 were 39.2% and 4.6%, respectively. At the close of the quarter, total net assets were $30,743,736 and were invested 4.3% in cash and other assets net of liabilities and 95.7% in stocks. At the close of the quarter there were 474 shareholders in the Equity Income Fund.
The Fund continues to seek to invest in companies that have the potential for capital appreciation and that have, in our opinion, the ability to grow dividends. The Fund is diversified with 59 holdings representing 57 different industry groups. At the end of the June 2012 quarter, the portfolio’s average holding had a five-year average return on equity of 19.4% and an average dividend yield of 3.8%, both measures substantially higher than the average S&P 500 stock, with an average market capitalization of $42.9 billion and an average debt to capital ratio of 40.2%.
During the quarter we purchased shares of Digital Realty Trust. We sold our shares in American Eagle Outfitters, Kimco Realty, Mattel, PPL Corporation, R.R. Donnelley & Sons, Verizon Communications and Willis Group Holdings.
Abbott Laboratories, one of the Fund’s largest holdings, is a leading manufacturer and marketer of healthcare products. Areas of focus include pharmaceuticals, diagnostic products, nutritional products and vascular devices. We believe Abbott’s diversification and business mix position it well for steady growth amid the dynamic changes occurring in the healthcare industry. In particular, diagnostics, nutritional products and expansion into emerging markets stand out as growth drivers. Abbott’s over 3% dividend yield is well supported by earnings, cash flow and low financial leverage. Moreover, Abbott has a forty year track record of increasing dividends. At less than 13x this year’s earnings, we believe Abbott represents an attractive investment.
Meridian Growth Fund® (MERDX)
The Meridian Growth Fund’s net asset value per share at June 30, 2012 was $45.06. This represents an increase of 8.2% calendar year-to-date. The Fund’s total return and average annual compound rate of return since inception August 1, 1984 were 2,597.6% and 12.5%, respectively. At the close of the quarter, total net assets were $2,484,083,833 and were invested 5.4% in cash, cash equivalents and other assets net of liabilities and 94.6% in stocks. At the close of the quarter there were 95,703 shareholders in the Growth Fund.
Despite macroeconomic worries, there are reasons for some optimism. Corporate balance sheets are relatively strong and employment levels continue to gradually increase. Many small and mid-sized growth stocks sell at what we believe are reasonable valuations. We continue to follow the investment strategy that has served the Fund well for the past 28 years. Our portfolio remains diversified. We invest in growth companies which we identify as being, for
2
the most part, market leaders, having strong returns on capital, solid growth prospects and selling at reasonable valuations. The Fund is invested in 54 positions along with Treasury Bills. Our heaviest areas of concentration remain the technology and consumer sectors.
During the quarter we purchased shares of LKQ Corporation, Tumi Holdings and World Fuel Services. We sold our positions in Cooper Industries, T. Rowe Price Group and Willis Group Holdings.
East West Bancorp, one of the Fund’s largest holdings, is the largest Chinese American bank with most of its retail branches located in California. As a group, Chinese Americans have a very favorable economic profile relative to the rest of the population in terms of median household income, business formation rate and unemployment rate, etc. We believe that the bank should continue to benefit from the immigration of Chinese Americans and the increase in trade between US and China, as it is one of the few foreign banks with a full service banking license in China. East West is, in our opinion, well capitalized, with superior credit quality relative to its regional peers, and is well positioned to make more acquisitions to further strengthen its competitive position in the California market. The company has an experienced management team with a strong track record. We believe East West is positioned to grow faster than the industry over the next few years.
Meridian Value Fund® (MVALX)
The Meridian Value Fund’s net asset value per share at June 30, 2012 was $30.60. This represents an increase of 9.0% calendar year-to-date. The Fund’s total return and average annual compound rate of return since June 30, 1995 were 762.1% and 13.5%, respectively. The comparable period returns for the S&P 500 with dividends were 239.9% and 7.5%, respectively. At the close of the quarter, total net assets were $688,647,460 and were invested 8.0% in cash, cash equivalents and other assets net of liabilities and 92.0% in stocks. At the close of the quarter there were 33,743 shareholders in the Value Fund.
Our investment strategy remains unchanged. We continue to seek out-of-favor companies typically having experienced an extended period of declining earnings. In recent years most earnings problems have been related to poor economic conditions. With some stability in the economy, albeit tenuous, we now see more companies that meet our strategy for company-specific reasons. These investments are the traditional strength and point of differentiation of the Meridian Value Fund. The Fund is invested in 52 positions, representing 34 industry groups along with Treasury Bills. We continue to invest in companies of all market capitalizations and our largest areas of concentration are technology, retail and transportation.
During the quarter we purchased shares of Brocade Communications, Haemonetics Corp, Lancaster Colony Corp. and Maidenform Brands.
3
Equifax, one of the Fund’s largest holdings, is a leading provider of information solutions that help financial institutions and other entities make decisions about extending credit. It holds the number one market share position in the majority of its geographic regions, generates strong margins and cash flow and maintains conservative financial leverage. The recession caused both borrowers and lenders to retrench, bringing down the earnings of Equifax as well. Consumer borrowing is improving in areas such as credit cards, auto loans and home mortgages. We believe that Equifax is particularly well positioned for this improvement beyond its core consumer credit database. It is up-selling exclusive data such as wealth and income data to help customers make more informed credit decisions. Additional growth opportunities are international expansion, commercial credit decision making and personal credit score monitoring. We believe the company is a compelling value at twelve times our four dollar per share estimate of earnings power.
Miscellaneous
You can sign up for E-mail Alerts on our website at www.meridianfund.com. When you sign up for E-mail Alerts you will receive notification of news items, shareholder reports, SEC filings and other information regarding the Meridian Funds.
The Meridian Funds are no-load and there are no transaction fees or commissions charged when you purchase shares directly through our transfer agent, BNY Mellon Investment Servicing (U.S.), Inc. This is a very cost-effective way to purchase shares of the Meridian Funds if you do not need the services of a broker-dealer or if you make multiple purchases.
The information provided in this report should not be considered investment advice or a recommendation to purchase or sell any particular security. There is no assurance that any securities discussed herein will remain in a particular Fund’s portfolio at the time you receive this report or that securities sold have not been repurchased. Securities discussed are presented as illustrations of companies that fit a particular Fund’s investment strategy and do not represent a Fund’s entire portfolio and in the aggregate may represent only a small percentage of a Fund’s portfolio holdings. It should not be assumed that any of the securities transactions or holdings discussed were or will prove to be profitable, or that investment decisions Fund management makes in the future will be profitable or will equal the investment performance of the securities discussed herein. Management’s views presented herein and any discussion of a particular Fund’s portfolio holdings or performance are as of June 30, 2012 and are subject to change without notice. Past performance is not predictive of future results.
4
Meridian Equity Income Fund
Summary of Portfolio Holdings
June 30, 2012
Portfolio Holdings by Category (% of total net assets) | ||||||||
Software & Services | 3.5 | % | $ | 1,062,727 | ||||
Media | 3.3 | 1,011,712 | ||||||
Health Care Products | 2.0 | 606,018 | ||||||
Chemicals-Specialty | 1.9 | 598,400 | ||||||
Asset Management & Custody Banks | 1.9 | 596,505 | ||||||
Consumer Products-Household | 1.9 | 590,579 | ||||||
Soft Drinks | 1.9 | 589,553 | ||||||
Home Improvement Retail | 1.9 | 577,591 | ||||||
Industrial Conglomerates | 1.9 | 577,268 | ||||||
Insurance-Multi-Line | 1.9 | 571,967 | ||||||
Multi-Utilities | 1.8 | 559,601 | ||||||
Telecommunication Services-Integrated | 1.8 | 559,149 | ||||||
Leisure & Amusement | 1.8 | 558,601 | ||||||
Hypermarkets & Super Centers | 1.8 | 551,834 | ||||||
Tobacco | 1.8 | 545,171 | ||||||
Media-Broadcasting & Cable TV | 1.8 | 541,860 | ||||||
Air Freight & Logistics | 1.7 | 536,749 | ||||||
Pharmaceuticals | 1.7 | 532,711 | ||||||
Banking-Regional Banks | 1.7 | 517,410 | ||||||
Data Processing & Outsourced Services | 1.7 | 515,124 | ||||||
Food Distributors | 1.7 | 512,732 | ||||||
REITs-Diversified | 1.7 | 510,476 | ||||||
Banking-Commercial | 1.7 | 510,045 | ||||||
Food & Meats-Packaged | 1.6 | 505,922 | ||||||
Aerospace & Defense | 1.6 | 505,064 | ||||||
Electrical Components & Equipment | 1.6 | 498,406 | ||||||
Energy | 1.6 | 495,850 | ||||||
Brewers | 1.6 | 495,159 | ||||||
Chemicals-Diversified | 1.6 | 494,575 | ||||||
Semiconductor Equipment Manufacturing | 1.6 | 492,992 | ||||||
Railroads | 1.6 | 488,036 | ||||||
Computer Hardware | 1.6 | 487,212 | ||||||
5
Meridian Equity Income Fund
Summary of Portfolio Holdings (continued)
June 30, 2012
Health Care Technology | 1.6 | % | $ | 484,125 | ||||
Construction & Engineering | 1.6 | 482,880 | ||||||
Household-Home Furnishings | 1.6 | 482,292 | ||||||
Diversified Capital Markets | 1.6 | 480,392 | ||||||
Environmental Facilities & Services | 1.6 | 477,286 | ||||||
Oil & Gas-Storage & Transportation | 1.5 | 476,584 | ||||||
Insurance-Property & Casualty | 1.5 | 472,746 | ||||||
Retail | 1.5 | 470,793 | ||||||
Distribution & Wholesale | 1.5 | 469,046 | ||||||
Consulting Services | 1.5 | 468,214 | ||||||
Electronic Equipment Manufacturing | 1.5 | 466,830 | ||||||
Independent Power Producers & Energy | 1.5 | 458,324 | ||||||
Retail-Drug Store | 1.5 | 455,532 | ||||||
Restaurants | 1.5 | 448,404 | ||||||
Semiconductors | 1.5 | 446,580 | ||||||
Diversified Financial Services | 1.4 | 442,416 | ||||||
Paper & Packaging | 1.4 | 437,175 | ||||||
Office Supplies | 1.4 | 434,565 | ||||||
Steel | 1.4 | 432,439 | ||||||
Industrial Machinery | 1.4 | 425,626 | ||||||
Paper & Forest Products | 1.3 | 413,413 | ||||||
Metal & Glass Containers | 1.3 | 405,900 | ||||||
Food Retail | 1.3 | 404,745 | ||||||
Office Services & Supplies | 1.3 | 390,717 | ||||||
Health Care Equipment & Supplies | 1.3 | 389,656 | ||||||
Cash & Other Assets, Less Liabilities | 4.3 | 1,330,057 | ||||||
|
|
|
| |||||
| 100.0 | % | $ | 30,743,736 | |||||
|
|
|
| |||||
6
Meridian Growth Fund
Summary of Portfolio Holdings
June 30, 2012
Portfolio Holdings by Category (% of total net assets) | ||||||||
Retail | 14.9 | % | $ | 370,585,322 | ||||
Tech-Software | 11.6 | 287,115,216 | ||||||
Technology | 6.7 | 165,848,794 | ||||||
Banking-Commercial | 5.5 | 136,397,866 | ||||||
Energy | 4.9 | 122,721,657 | ||||||
Health Care Products | 4.5 | 110,701,266 | ||||||
Brokerage & Money Management | 4.1 | 102,163,114 | ||||||
Leisure & Amusement | 3.1 | 77,845,729 | ||||||
Building Products | 3.0 | 74,104,332 | ||||||
Restaurants | 2.9 | 72,227,319 | ||||||
Cellular Communications | 2.9 | 72,084,101 | ||||||
Industrial Services | 2.8 | 70,223,468 | ||||||
Insurance Brokers | 2.8 | 68,429,020 | ||||||
Flooring & Carpets | 2.6 | 65,374,148 | ||||||
U.S. Government Obligations | 2.6 | �� | 64,995,229 | |||||
Electronic Equipment Manufacturing | 2.4 | 60,112,353 | ||||||
Distribution & Wholesale | 2.2 | 55,172,699 | ||||||
Health Care Technology | 2.1 | 53,430,977 | ||||||
Trucking | 2.1 | 51,022,666 | ||||||
Real Estate Management & Services | 2.0 | 48,751,984 | ||||||
Industrial Conglomerates | 1.8 | 45,043,406 | ||||||
Consumer Services | 1.8 | 44,136,569 | ||||||
Health Care Information Services | 1.7 | 42,113,617 | ||||||
Furniture & Fixtures | 1.5 | 38,331,307 | ||||||
Air Freight & Logistics | 1.5 | 36,915,575 | ||||||
Chemicals-Specialty | 1.2 | 29,580,000 | ||||||
Business Services | 1.1 | 26,362,307 | ||||||
Automotive Wholesale Services | 0.9 | 22,802,180 | ||||||
Cash & Other Assets, Less Liabilities | 2.8 | 69,491,612 | ||||||
|
|
|
| |||||
| 100.0 | % | $ | 2,484,083,833 | |||||
|
|
|
| |||||
7
Meridian Value Fund
Summary of Portfolio Holdings
June 30, 2012
Portfolio Holdings by Category (% of total net assets) | ||||||||
Diversified Financial Services | 8.6 | % | $ | 59,329,272 | ||||
Leisure & Amusement | 7.8 | 53,797,729 | ||||||
Technology | 6.5 | 45,018,907 | ||||||
Industrial | 5.1 | 34,920,211 | ||||||
Railroads | 4.9 | 33,725,233 | ||||||
Energy | 4.5 | 31,286,709 | ||||||
Retail | 3.8 | 26,144,092 | ||||||
Transportation | 3.6 | 24,542,925 | ||||||
Industrial Services | 3.4 | 23,170,283 | ||||||
Utilities | 3.1 | 21,603,187 | ||||||
Brokerage & Money Management | 2.8 | 19,531,000 | ||||||
Automotive Wholesale Services | 2.7 | 18,553,700 | ||||||
Office Services & Supplies | 2.7 | 18,257,757 | ||||||
Business Services | 2.5 | 17,247,087 | ||||||
Industrial Products | 2.2 | 15,304,179 | ||||||
Agriculture | 2.2 | 15,281,188 | ||||||
Home Improvement Retail | 2.2 | 14,915,845 | ||||||
Health Care Services | 2.1 | 14,468,766 | ||||||
Consulting Services | 2.1 | 14,233,005 | ||||||
Household Appliances | 2.0 | 13,862,500 | ||||||
Pharmaceuticals | 1.9 | 13,330,544 | ||||||
Metals | 1.9 | 12,748,428 | ||||||
Banking-Commercial | 1.7 | 11,961,909 | ||||||
Semiconductors | 1.7 | 11,630,140 | ||||||
Tech-Software | 1.7 | 11,579,523 | ||||||
Health Care Products | 1.6 | 10,783,005 | ||||||
Storage | 1.3 | 8,576,568 | ||||||
Banking | 1.0 | 6,922,080 | ||||||
Restaurants | 1.0 | 6,698,184 | ||||||
REITs-Diversified | 0.9 | 6,469,526 | ||||||
Aerospace & Defense | 0.9 | 6,161,548 | ||||||
Food | 0.8 | 5,739,526 | ||||||
U.S. Government Obligations | 0.7 | 4,999,220 | ||||||
Air Freight & Logistics | 0.6 | 4,330,404 | ||||||
Apparel | 0.2 | 1,561,728 | ||||||
Cash & Other Assets, Less Liabilities | 7.3 | 49,961,552 | ||||||
|
|
|
| |||||
| 100.0 | % | $ | 688,647,460 | |||||
|
|
|
| |||||
8
Meridian Fund, Inc.
Disclosure of Fund Expenses (Unaudited)
For the Six Month Period January 1, 2012 to June 30, 2012
We believe it is important for you to understand the impact of fees and expenses on your investment. All mutual funds have operating expenses. As a shareholder of the Fund, you incur ongoing costs, which generally include costs for portfolio management and administrative services, and other Fund expenses. Operating expenses, which are deducted from a Fund’s gross income, directly reduce the investment return of the portfolio. A Fund’s expenses are expressed as a percentage of its average net assets. This figure is known as the expense ratio. The following examples are intended to help you understand the ongoing costs (in dollars) of investing in your Fund and to compare these costs with those of other mutual funds. The examples are based on an investment of $1,000 made at the beginning of the period shown and held for the entire period and assume reinvestment of all dividends and distributions.
| Beginning Account Value 1/1/12 | Ending Account Value 6/30/12 | Expense Ratio(1) | Expenses Paid During Period(2) | |||||||||||||
Actual Fund Return | ||||||||||||||||
( See explanation below) | ||||||||||||||||
Meridian Equity Income Fund | $ | 1,000.00 | $ | 1,047.90 | 1.25 | %(3) | $ | 6.40 | ||||||||
Meridian Growth Fund | $ | 1,000.00 | $ | 1,082.40 | 0.86 | % | $ | 4.48 | ||||||||
Meridian Value Fund | $ | 1,000.00 | $ | 1,089.80 | 1.14 | % | $ | 5.96 | ||||||||
Hypothetical 5% Return(4) | ||||||||||||||||
( See explanation below) | ||||||||||||||||
Meridian Equity Income Fund | $ | 1,000.00 | $ | 1,018.75 | 1.25 | %(3) | $ | 6.31 | ||||||||
Meridian Growth Fund | $ | 1,000.00 | $ | 1,020.70 | 0.86 | % | $ | 4.34 | ||||||||
Meridian Value Fund | $ | 1,000.00 | $ | 1,019.30 | 1.14 | % | $ | 5.76 | ||||||||
| (1) | Annualized, based on the Fund’s most recent fiscal half-year expenses. |
| (2) | Expenses are equal to the Fund’s annualized expense ratio multiplied by the average account value over the period, multiplied by 183, the number of days in the most recent fiscal half-year, then divided by 366. |
| (3) | See note 2 to Financial Statements. |
| (4) | Before expenses. |
9
Meridian Fund, Inc.
Disclosure of Fund Expenses (Unaudited) (continued)
For the Six Month Period January 1, 2012 to June 30, 2012
The table above illustrates your Fund’s costs in two ways:
Actual Fund Return: This section helps you to estimate the actual expenses that you paid over the period. The “Ending Account Value” shown is derived from the Fund’s actual return, the third column shows the period’s annualized expense ratio, and the last column shows the dollar amount that would have been paid by an investor who started with $1,000 in the Fund at the beginning of the period. You may use the information here, together with your account value, to estimate the expenses that you paid over the period.
To do so, simply divide your account value by $1,000 (for example, an $8,600 account value divided by $1,000 = 8.6), then multiply the result by the number in the first line under the heading entitled “Expenses Paid During Period.”
Hypothetical 5% Return: This section is intended to help you compare your Fund’s costs with those of other mutual funds. It assumes that the Fund had a return of 5% before expenses during the period shown, but that the expense ratio is unchanged. In this case, because the return used is not the Fund’s actual return, the results do not apply to your investment. You can assess your Fund’s costs by comparing this 5% Return hypothetical example with the 5% Return hypothetical examples that appear in shareholder reports of other funds.
Please note that the expenses shown in the table are meant to highlight your ongoing costs only and do not reflect any transactional costs such as short-term redemption and exchange fees or sales and service charges you may pay third party broker/dealers. Had these transactional costs been included, your costs would have been higher. Therefore, the hypothetical section of the table is useful in comparing ongoing costs only, and will not help you determine the relative total costs of owning different funds.
10
Management’s Discussion of Meridian Equity Income Fund® Performance
During the fiscal year ended June 30, 2012, the Meridian Equity Income Fund gained 3.09% compared to a gain of 5.38% for the S&P 500 with reinvested dividends.
The Equity Income Fund is highly diversified. During the period the Fund was invested in companies individually comprising 67 sectors. During the period each sector holding was typically weighted between 1.50% and 1.75% of net assets. As a result of this strategy one sector cannot move the performance dramatically in any direction.
The Fund’s strongest performance was from companies in the apparel, home improvement, insurance, hypermarkets & super centers and household consumer products sectors. The Fund’s weakest performance was from companies in the commercial printing, packaging, office services & supplies, diversified capital markets and retail drug stores sectors.
The Fund strategy emphasizes investments in companies that typically pay dividends or interest, have the potential for capital appreciation and which the Investment Adviser believes may have the capacity to raise dividends in the future.
Value of $10,000 invested in the Meridian Equity Income Fund and the S&P 500 Index
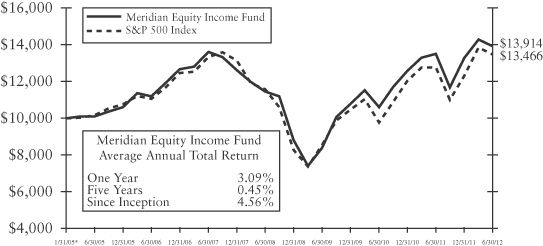
Past performance is not predictive of future performance. The graph and table do not reflect the deduction of taxes that a shareholder would pay on Fund distributions or the redemption of Fund shares and do not reflect the imposition of a 2% redemption fee on shares held 60 days or less to deter market timers. If reflected, the taxes and fees would reduce the performance quoted. Net asset value, investment return and principal value will fluctuate, so shares, when redeemed, may be worth more or less than their original cost.
| * | Inception date. |
11
Management’s Discussion of Meridian Growth Fund®
Performance
During the fiscal year ended June 30, 2012, the Meridian Growth Fund gained 2.45% compared to a gain of 5.38% for the S&P 500 with reinvested dividends, a loss of 2.08% for the Russell 2000.
The Growth Fund’s performance reflected the strength of our holdings in the retail, commercial banking, brokerage & money management, healthcare products and industrial conglomerates sectors (representing approximately fourteen, five, five, four and four percent of total portfolio holdings, respectively), as well as the performance of individual stocks that may be the only issue we own in a particular sector. This was offset primarily by relative weakness in the technology, energy, insurance brokers and distribution & wholesale sectors (representing approximately nineteen, five, five, and three percent of total portfolio holdings, respectively), as well as the performance of individual stocks that may be the only issue we own in a particular sector.
Value of $10,000 invested in the Meridian Growth Fund, the Russell 2000 Index and the S&P 500 Index
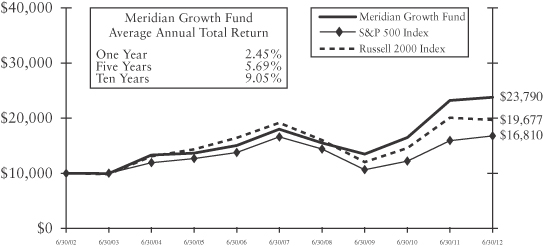
Past performance is not predictive of future performance. The graph and table do not reflect the deduction of taxes that a shareholder would pay on Fund distributions or the redemption of Fund shares and do not reflect the imposition of a 2% redemption fee on shares held 60 days or less to deter market timers. If reflected, the taxes and fees would reduce the performance quoted. Net asset value, investment return and principal value will fluctuate, so shares, when redeemed, may be worth more or less than their original cost.
12
Management’s Discussion of Meridian Value Fund®
Performance
During the fiscal year ended June 30, 2012, the Meridian Value Fund gained 3.89% compared to a gain of 5.38% for the S&P 500 with reinvested dividends.
The Value Fund’s performance reflected the strength of our holdings in the diversified financial services, leisure & amusement, retail, railroad and industrial sectors (together representing approximately twenty-nine percent of total portfolio holdings), as well as the performance of individual stocks that may comprise the only holding in a particular sector. This was offset primarily by relative weakness in the energy, industrial products, technology and brokerage and money management sector holdings, along with weakness in individual stocks in sectors including real estate and storage that represent the only issue we may own in a particular sector.
The Meridian Value Fund’s strategy is to invest in stocks, across a range of market capitalizations, which the Investment Adviser believes are undervalued in relation to the issuer’s long-term earnings power, asset value and/or the stock market in general. Based on this strategy, the Fund’s average compounded annual return for the ten-year period from June 30, 2002 to June 30, 2012 was a 6.98% gain compared to 5.30% gain for the S&P 500, with reinvested dividends. The Meridian Value Fund’s average compounded annual return from inception to June 30, 2012 was a gain of 12.59%, compared to a gain of 8.36% for the S&P 500, with reinvested dividends. (Inception date: February 10, 1994. Prior to June 30, 1995 the Value Fund’s cash position was approximately 50%, as the Fund was in the start-up process of becoming fully invested).
Value of $10,000 invested in the Meridian Value Fund and the S&P 500 Index
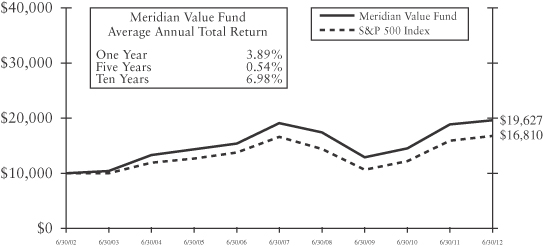
Past performance is not predictive of future performance. The graph and table do not reflect the deduction of taxes that a shareholder would pay on Fund distributions or the redemption of Fund shares and do not reflect the imposition of a 2% redemption fee on shares held 60 days or less to deter market timers. If reflected, the taxes and fees would reduce the performance quoted. Net asset value, investment return and principal value will fluctuate, so shares, when redeemed, may be worth more or less than their original cost.
13
Meridian Equity Income Fund
Schedule of Investments
June 30, 2012
| Shares | Value | |||||||
COMMON STOCKS - 95.7% |
| |||||||
AEROSPACE & DEFENSE - 1.6% |
| |||||||
Lockheed Martin Corp. | 5,800 | $ | 505,064 | |||||
AIR FREIGHT & LOGISTICS - 1.7% |
| |||||||
United Parcel Service, Inc. Class B | 6,815 | 536,749 | ||||||
ASSET MANAGEMENT & CUSTODY BANKS - 1.9% |
| |||||||
Federated Investors, Inc. Class B | 27,300 | 596,505 | ||||||
BANKING-COMMERCIAL - 1.7% |
| |||||||
Bank of Hawaii Corp. | 11,100 | 510,045 | ||||||
BANKING-REGIONAL BANKS - 1.7% |
| |||||||
Cullen/Frost Bankers, Inc. | 9,000 | 517,410 | ||||||
BREWERS - 1.6% |
| |||||||
Molson Coors Brewing Co. Class B | 11,900 | 495,159 | ||||||
CHEMICALS-DIVERSIFIED - 1.6% |
| |||||||
EI du Pont de Nemours & Co. | 9,780 | 494,575 | ||||||
CHEMICALS-SPECIALTY - 1.9% |
| |||||||
RPM International, Inc. | 22,000 | 598,400 | ||||||
COMPUTER HARDWARE - 1.6% |
| |||||||
Diebold, Inc. | 13,200 | 487,212 | ||||||
CONSTRUCTION & ENGINEERING - 1.6% |
| |||||||
Mine Safety Appliances Co. | 12,000 | 482,880 | ||||||
CONSULTING SERVICES - 1.5% |
| |||||||
H&R Block, Inc. | 29,300 | 468,214 | ||||||
CONSUMER PRODUCTS-HOUSEHOLD - 1.9% |
| |||||||
Kimberly-Clark Corp. | 7,050 | 590,579 | ||||||
| Shares | Value | |||||||
DATA PROCESSING & OUTSOURCED SERVICES - 1.7% |
| |||||||
Paychex, Inc. | 16,400 | $ | 515,124 | |||||
DISTRIBUTION & WHOLESALE - 1.5% |
| |||||||
Genuine Parts Co. | 7,785 | 469,046 | ||||||
DIVERSIFIED CAPITAL MARKETS - 1.6% |
| |||||||
NYSE Euronext | 18,780 | 480,392 | ||||||
DIVERSIFIED FINANCIAL SERVICES - 1.4% |
| |||||||
Broadridge Financial Solutions, | 20,800 | 442,416 | ||||||
ELECTRICAL COMPONENTS & EQUIPMENT - 1.6% |
| |||||||
Emerson Electric Co. | 10,700 | 498,406 | ||||||
ELECTRONIC EQUIPMENT MANUFACTURING - 1.5% |
| |||||||
Molex, Inc. | 19,500 | 466,830 | ||||||
ENERGY - 1.6% |
| |||||||
Chevron Corp. | 4,700 | 495,850 | ||||||
ENVIRONMENTAL FACILITIES & SERVICES - 1.6% |
| |||||||
Waste Management, Inc. | 14,290 | 477,286 | ||||||
FOOD DISTRIBUTORS - 1.7% |
| |||||||
SYSCO Corp. | 17,200 | 512,732 | ||||||
FOOD & MEATS-PACKAGED - 1.6% |
| |||||||
Kraft Foods, Inc. Class A | 13,100 | 505,922 | ||||||
FOOD RETAIL - 1.3% |
| |||||||
Safeway, Inc. | 22,300 | 404,745 | ||||||
HEALTH CARE EQUIPMENT & SUPPLIES - 1.3% |
| |||||||
Hillenbrand, Inc. | 21,200 | 389,656 | ||||||
The accompanying notes are an integral part of the financial statements.
14
Meridian Equity Income Fund
Schedule of Investments (continued)
June 30, 2012
| Shares | Value | |||||||
COMMON STOCKS (continued) |
| |||||||
HEALTH CARE PRODUCTS - 2.0% |
| |||||||
Abbott Laboratories | 9,400 | $ | 606,018 | |||||
HEALTH CARE TECHNOLOGY - 1.6% |
| |||||||
Medtronic, Inc. | 12,500 | 484,125 | ||||||
HOME IMPROVEMENT RETAIL - 1.9% |
| |||||||
Home Depot, Inc. (The) | 10,900 | 577,591 | ||||||
HOUSEHOLD-HOME FURNISHINGS - 1.6% |
| |||||||
Leggett & Platt, Inc. | 22,825 | 482,292 | ||||||
HYPERMARKETS & SUPER CENTERS - 1.8% |
| |||||||
Wal-Mart Stores, Inc. | 7,915 | 551,834 | ||||||
INDEPENDENT POWER PRODUCERS & ENERGY - 1.5% |
| |||||||
Exelon Corp. | 12,183 | 458,324 | ||||||
INDUSTRIAL CONGLOMERATES - 1.9% |
| |||||||
General Electric Co. | 27,700 | 577,268 | ||||||
INDUSTRIAL MACHINERY - 1.4% |
| |||||||
Eaton Corp. | 10,740 | 425,626 | ||||||
INSURANCE-MULTI-LINE - 1.9% |
| |||||||
Allstate Corp. (The) | 16,300 | 571,967 | ||||||
INSURANCE-PROPERTY & CASUALTY - 1.5% |
| |||||||
Mercury General Corp. | 11,345 | 472,746 | ||||||
LEISURE & AMUSEMENT - 1.8% |
| |||||||
Carnival Corp. | 16,300 | 558,601 | ||||||
MEDIA - 3.3% |
| |||||||
Meredith Corp. | 14,800 | 472,712 | ||||||
Time Warner, Inc. | 14,000 | 539,000 | ||||||
|
| |||||||
| 1,011,712 | ||||||||
| Shares | Value | |||||||
MEDIA-BROADCASTING & CABLE TV - 1.8% |
| |||||||
Time Warner Cable, Inc. | 6,600 | $ | 541,860 | |||||
METAL & GLASS CONTAINERS - 1.3% |
| |||||||
Greif, Inc. Class A | 9,900 | 405,900 | ||||||
MULTI-UTILITIES - 1.8% |
| |||||||
Integrys Energy Group, Inc. | 9,840 | 559,601 | ||||||
OFFICE SUPPLIES - 1.4% |
| |||||||
Staples, Inc. | 33,300 | 434,565 | ||||||
OFFICE SERVICES & SUPPLIES - 1.3% |
| |||||||
Pitney Bowes, Inc. | 26,100 | 390,717 | ||||||
OIL & GAS-STORAGE & TRANSPORTATION - 1.5% |
| |||||||
Spectra Energy Corp. | 16,400 | 476,584 | ||||||
PAPER & FOREST PRODUCTS - 1.3% |
| |||||||
International Paper Co. | 14,300 | 413,413 | ||||||
PAPER & PACKAGING - 1.4% |
| |||||||
Sonoco Products Co. | 14,500 | 437,175 | ||||||
PHARMACEUTICALS - 1.7% |
| |||||||
Johnson & Johnson | 7,885 | 532,711 | ||||||
RAILROADS - 1.6% |
| |||||||
Norfolk Southern Corp. | 6,800 | 488,036 | ||||||
REITS-DIVERSIFIED - 1.7% |
| |||||||
Digital Realty Trust, Inc. REIT | 6,800 | 510,476 | ||||||
RESTAURANTS - 1.5% |
| |||||||
McDonald’s Corp. | 5,065 | 448,404 | ||||||
RETAIL - 1.5% |
| |||||||
Hasbro, Inc. | 13,900 | 470,793 | ||||||
The accompanying notes are an integral part of the financial statements.
15
Meridian Equity Income Fund
Schedule of Investments (continued)
June 30, 2012
| Shares | Value | |||||||
COMMON STOCKS (continued) |
| |||||||
RETAIL-DRUG STORE - 1.5% |
| |||||||
Walgreen Co. | 15,400 | $ | 455,532 | |||||
SEMICONDUCTORS - 1.5% |
| |||||||
Microchip Technology, Inc. | 13,500 | 446,580 | ||||||
SEMICONDUCTOR EQUIPMENT MANUFACTURING - 1.6% |
| |||||||
KLA-Tencor Corp. | 10,010 | 492,992 | ||||||
SOFT DRINKS - 1.9% |
| |||||||
Coca-Cola Co. (The) | 7,540 | 589,553 | ||||||
SOFTWARE & SERVICES - 3.5% |
| |||||||
CA, Inc. | 19,700 | 533,673 | ||||||
Microsoft Corp. | 17,295 | 529,054 | ||||||
|
| |||||||
| 1,062,727 | ||||||||
STEEL - 1.4% | ||||||||
Nucor Corp. | 11,410 | 432,439 | ||||||
TELECOMMUNICATION SERVICES - INTEGRATED - 1.8% |
| |||||||
AT&T, Inc. | 15,680 | 559,149 | ||||||
TOBACCO - 1.8% | ||||||||
Reynolds American, Inc. | 12,150 | 545,171 | ||||||
TOTAL INVESTMENTS - 95.7% |
| 29,413,679 | ||||||
CASH AND OTHER ASSETS, LESS |
| 1,330,057 | ||||||
|
| |||||||
NET ASSETS - 100.0% |
| $ | 30,743,736 | |||||
|
| |||||||
REIT - Real Estate Investment Trust
The accompanying notes are an integral part of the financial statements.
16
Meridian Growth Fund
Schedule of Investments
June 30, 2012
| Shares | Value | |||||||
COMMON STOCKS - 94.6% |
| |||||||
AIR FREIGHT & LOGISTICS - 1.5% |
| |||||||
Expeditors International of Washington, Inc. | 952,660 | $ | 36,915,575 | |||||
AUTOMOTIVE WHOLESALE SERVICES - 0.9% |
| |||||||
LKQ Corp.* | 682,700 | 22,802,180 | ||||||
BANKING-COMMERCIAL - 5.5% |
| |||||||
Bank of Hawaii Corp. | 1,153,030 | 52,981,729 | ||||||
CVB Financial Corp. | 1,174,450 | 13,682,343 | ||||||
East West Bancorp, Inc. | 2,972,455 | 69,733,794 | ||||||
|
| |||||||
| 136,397,866 | ||||||||
BROKERAGE & MONEY MANAGEMENT - 4.1% |
| |||||||
Affiliated Managers Group, Inc.* | 481,295 | 52,677,738 | ||||||
LPL Financial Holdings, | 1,465,365 | 49,485,376 | ||||||
|
| |||||||
| 102,163,114 | ||||||||
BUILDING PRODUCTS - 3.0% |
| |||||||
Valspar Corp. | 1,411,780 | 74,104,332 | ||||||
BUSINESS SERVICES - 1.1% |
| |||||||
VeriFone Systems, Inc.* | 796,685 | 26,362,307 | ||||||
CELLULAR COMMUNICATIONS - 2.9% |
| |||||||
SBA Communications Corp. Class A* | 1,263,525 | 72,084,101 | ||||||
CHEMICALS-SPECIALTY - 1.2% |
| |||||||
RPM International, Inc. | 1,087,500 | 29,580,000 | ||||||
CONSUMER SERVICES - 1.8% |
| |||||||
Rollins, Inc. | 1,973,025 | 44,136,569 | ||||||
DISTRIBUTION & WHOLESALE - 2.2% |
| |||||||
Watsco, Inc. | 586,305 | 43,269,309 | ||||||
World Fuel Services Corp. | 313,000 | 11,903,390 | ||||||
|
| |||||||
| 55,172,699 | ||||||||
| Shares | Value | |||||||
ELECTRONIC EQUIPMENT MANUFACTURING - 2.4% |
| |||||||
AMETEK, Inc. | 1,204,415 | $ | 60,112,353 | |||||
ENERGY - 4.9% |
| |||||||
Continental Resources, Inc.* | 539,925 | 35,969,804 | ||||||
Core Laboratories NV (Netherlands) | 232,985 | 27,002,962 | ||||||
FMC Technologies, Inc.* | 576,140 | 22,601,972 | ||||||
Noble Energy, Inc. | 437,950 | 37,146,919 | ||||||
|
| |||||||
| 122,721,657 | ||||||||
FLOORING & CARPETS - 2.6% |
| |||||||
Mohawk Industries, Inc.* | 936,190 | 65,374,148 | ||||||
FURNITURE & FIXTURES - 1.5% |
| |||||||
Herman Miller, Inc. | 2,069,725 | 38,331,307 | ||||||
HEALTH CARE INFORMATION SERVICES - 1.7% |
| |||||||
Cerner Corp.* | 509,480 | 42,113,617 | ||||||
HEALTH CARE PRODUCTS - 4.5% |
| |||||||
DENTSPLY International, | 1,446,810 | 54,703,886 | ||||||
Edwards Lifesciences Corp.* | 542,085 | 55,997,380 | ||||||
|
| |||||||
| 110,701,266 | ||||||||
HEALTH CARE TECHNOLOGY - 2.1% |
| |||||||
IDEXX Laboratories, | 555,820 | 53,430,977 | ||||||
INDUSTRIAL CONGLOMERATES - 1.8% |
| |||||||
Pall Corp. | 821,810 | 45,043,406 | ||||||
INDUSTRIAL SERVICES - 2.8% |
| |||||||
Ritchie Bros. Auctioneers, Inc. (Canada) | 816,205 | 17,344,356 | ||||||
Waste Connections, Inc. | 1,767,350 | 52,879,112 | ||||||
|
| |||||||
| 70,223,468 | ||||||||
The accompanying notes are an integral part of the financial statements.
17
Meridian Growth Fund
Schedule of Investments (continued)
June 30, 2012
| Shares | Value | |||||||
COMMON STOCKS (continued) |
| |||||||
INSURANCE BROKERS - 2.8% |
| |||||||
Brown & Brown, Inc. | 2,509,315 | $ | 68,429,020 | |||||
LEISURE & AMUSEMENT - 3.1% |
| |||||||
International Game Technology | 1,767,835 | 27,843,401 | ||||||
Royal Caribbean Cruises, Ltd. | 1,920,950 | 50,002,328 | ||||||
|
| |||||||
| 77,845,729 | ||||||||
REAL ESTATE MANAGEMENT & SERVICES - 2.0% |
| |||||||
Jones Lang LaSalle, Inc. | 692,795 | 48,751,984 | ||||||
RESTAURANTS - 2.9% |
| |||||||
Arcos Dorados Holdings, Inc. Class A (Argentina) | 2,329,330 | 34,427,497 | ||||||
Cracker Barrel Old Country Store, Inc. | 601,908 | 37,799,822 | ||||||
|
| |||||||
| 72,227,319 | ||||||||
RETAIL - 14.9% |
| |||||||
Advance Auto Parts, Inc. | 670,485 | 45,740,487 | ||||||
Bed Bath & Beyond, Inc.* | 850,500 | 52,560,900 | ||||||
CarMax, Inc.* | 1,842,395 | 47,791,726 | ||||||
Coach, Inc. | 809,495 | 47,339,268 | ||||||
Family Dollar Stores, Inc | 946,815 | 62,944,261 | ||||||
Mattel, Inc. | 1,240,335 | 40,236,467 | ||||||
PetSmart, Inc. | 920,350 | 62,749,463 | ||||||
Tumi Holdings, Inc.* | 641,300 | 11,222,750 | ||||||
|
| |||||||
| 370,585,322 | ||||||||
TECHNOLOGY - 6.7% |
| |||||||
Autodesk, Inc.* | 1,065,295 | 37,274,672 | ||||||
Open Text Corp.* (Canada) | 675,150 | 33,689,985 | ||||||
Trimble Navigation, Ltd.* | 1,206,295 | 55,501,633 | ||||||
Zebra Technologies Corp. Class A* | 1,146,173 | 39,382,504 | ||||||
|
| |||||||
| 165,848,794 | ||||||||
TECH-SOFTWARE - 11.6% |
| |||||||
Advent Software, Inc.* | 1,379,606 | 37,401,119 | ||||||
| Shares | Value | |||||||
TECH-SOFTWARE (continued) |
| |||||||
Blackbaud, Inc. | 1,419,200 | $ | 36,430,864 | |||||
Citrix Systems, Inc.* | 576,730 | 48,410,716 | ||||||
MICROS Systems, Inc.* | 698,865 | 35,781,888 | ||||||
Nuance Communications, Inc.* | 1,528,930 | 36,419,113 | ||||||
Solera Holdings, Inc | 1,038,925 | 43,416,676 | ||||||
Teradata Corp.* | 684,000 | 49,254,840 | ||||||
|
| |||||||
| 287,115,216 | ||||||||
TRUCKING - 2.1% |
| |||||||
J.B. Hunt Transport | 856,085 | 51,022,666 | ||||||
TOTAL COMMON STOCKS - 94.6% (Cost $1,857,795,289) |
| 2,349,596,992 | ||||||
|
| |||||||
U.S. GOVERNMENT OBLIGATIONS - 2.6% |
| |||||||
U.S. Treasury Bill @ .071%** |
| 49,997,569 | ||||||
U.S. Treasury Bill @ .076%** |
| 14,997,660 | ||||||
|
| |||||||
TOTAL U.S. GOVERNMENT OBLIGATIONS |
| 64,995,229 | ||||||
|
| |||||||
TOTAL INVESTMENTS - 97.2% |
| 2,414,592,221 | ||||||
CASH AND OTHER ASSETS, LESS LIABILITIES - 2.8% |
| 69,491,612 | ||||||
|
| |||||||
NET ASSETS - 100.0% |
| $ | 2,484,083,833 | |||||
|
| |||||||
| * | Non-income producing securities |
| ** | Annualized yield at date of purchase |
The accompanying notes are an integral part of the financial statements.
18
Meridian Value Fund
Schedule of Investments
June 30, 2012
| Shares | Value | |||||||
COMMON STOCKS - 92.0% |
| |||||||
AEROSPACE & DEFENSE - 0.9% |
| |||||||
Orbital Sciences Corp.* | 476,900 | $ | 6,161,548 | |||||
AGRICULTURE - 2.2% |
| |||||||
Monsanto Co. | 184,600 | 15,281,188 | ||||||
AIR FREIGHT & LOGISTICS - 0.6% |
| |||||||
UTi Worldwide, Inc. | 296,400 | 4,330,404 | ||||||
APPAREL - 0.2% |
| |||||||
Maidenform Brands, Inc.* | 78,400 | 1,561,728 | ||||||
AUTOMOTIVE WHOLESALE SERVICES - 2.7% |
| |||||||
LKQ Corp.* | 555,500 | 18,553,700 | ||||||
BANKING - 1.0% |
| |||||||
Wells Fargo & Co. | 207,000 | 6,922,080 | ||||||
BANKING-COMMERCIAL - 1.7% |
| |||||||
Associated Banc-Corp. | 646,600 | 8,528,654 | ||||||
CVB Financial Corp. | 294,700 | 3,433,255 | ||||||
|
| |||||||
| 11,961,909 | ||||||||
BROKERAGE & MONEY MANAGEMENT - 2.8% |
| |||||||
KBW, Inc. | 662,000 | 10,889,900 | ||||||
TD Ameritrade Holding | 508,300 | 8,641,100 | ||||||
|
| |||||||
| 19,531,000 | ||||||||
BUSINESS SERVICES - 2.5% |
| |||||||
Cintas Corp. | 446,700 | 17,247,087 | ||||||
CONSULTING SERVICES - 2.1% |
| |||||||
Huron Consulting Group, Inc.* | 449,700 | 14,233,005 | ||||||
DIVERSIFIED FINANCIAL SERVICES - 8.6% |
| |||||||
Broadridge Financial Solutions, Inc. | 910,400 | 19,364,208 | ||||||
| Shares | Value | |||||||
DIVERSIFIED FINANCIAL SERVICES (continued) |
| |||||||
Equifax, Inc. | 431,400 | $ | 20,103,240 | |||||
Heartland Payment Systems, Inc. | 660,300 | 19,861,824 | ||||||
|
| |||||||
| 59,329,272 | ||||||||
ENERGY - 4.5% |
| |||||||
Apache Corp. | 144,000 | 12,656,160 | ||||||
EOG Resources, Inc. | 129,000 | 11,624,190 | ||||||
Ultra Petroleum Corp.* | 303,700 | 7,006,359 | ||||||
|
| |||||||
| 31,286,709 | ||||||||
FOOD - 0.8% |
| |||||||
Lancaster Colony Corp. | 80,600 | 5,739,526 | ||||||
HEALTH CARE PRODUCTS - 1.6% |
| |||||||
Haemonetics Corp.* | 145,500 | 10,783,005 | ||||||
HEALTH CARE SERVICES - 2.1% |
| |||||||
ICON Plc ADR* (Ireland) | 642,200 | 14,468,766 | ||||||
HOME IMPROVEMENT RETAIL - 2.2% |
| |||||||
Sherwin-Williams Co. (The) | 112,700 | 14,915,845 | ||||||
HOUSEHOLD APPLIANCES - 2.0% |
| |||||||
Stanley Black & Decker, Inc. | 215,390 | 13,862,500 | ||||||
INDUSTRIAL - 5.1% |
| |||||||
Aecon Group, Inc. (Canada) | 550,600 | 6,497,080 | ||||||
Flowserve Corp. | 125,300 | 14,378,175 | ||||||
Lennox International, Inc. | 301,200 | 14,044,956 | ||||||
|
| |||||||
| 34,920,211 | ||||||||
INDUSTRIAL PRODUCTS - 2.2% |
| |||||||
Cummins, Inc. | 60,500 | 5,863,055 | ||||||
Lincoln Electric Holdings, Inc. | 215,600 | 9,441,124 | ||||||
|
| |||||||
| 15,304,179 | ||||||||
INDUSTRIAL SERVICES - 3.4% |
| |||||||
Ritchie Bros. Auctioneers, Inc. (Canada) | 445,100 | 9,458,375 | ||||||
W.W. Grainger, Inc. | 71,700 | 13,711,908 | ||||||
|
| |||||||
| 23,170,283 | ||||||||
The accompanying notes are an integral part of the financial statements.
19
Meridian Value Fund
Schedule of Investments (continued)
June 30, 2012
| Shares | Value | |||||||
COMMON STOCKS (continued) |
| |||||||
LEISURE & AMUSEMENT - 7.8% |
| |||||||
Bally Technologies, Inc.* | 373,100 | $ | 17,408,846 | |||||
Carnival Corp. | 372,900 | 12,779,283 | ||||||
International Speedway Corp. Class A | 430,700 | 11,275,726 | ||||||
Polaris Industries, Inc. | 172,550 | 12,333,874 | ||||||
|
| |||||||
| 53,797,729 | ||||||||
METALS - 1.9% |
| |||||||
Newmont Mining Corp. | 262,800 | 12,748,428 | ||||||
OFFICE SERVICES & SUPPLIES - 2.7% |
| |||||||
Steelcase, Inc. Class A | 2,021,900 | 18,257,757 | ||||||
PHARMACEUTICALS - 1.9% |
| |||||||
BioMarin Pharmaceutical, Inc.* | 336,800 | 13,330,544 | ||||||
RAILROADS - 4.9% | ||||||||
GATX Corp. | 428,800 | 16,508,800 | ||||||
Union Pacific Corp. | 144,300 | 17,216,433 | ||||||
|
| |||||||
| 33,725,233 | ||||||||
REITS-DIVERSIFIED - 0.9% |
| |||||||
Host Hotels & Resorts, Inc. REIT | 408,946 | 6,469,526 | ||||||
RESTAURANTS - 1.0% | ||||||||
Denny’s Corp.* | 1,508,600 | 6,698,184 | ||||||
RETAIL - 3.8% |
| |||||||
Costco Wholesale Corp. | 161,900 | 15,380,500 | ||||||
Mattel, Inc. | 331,800 | 10,763,592 | ||||||
|
| |||||||
| 26,144,092 | ||||||||
SEMICONDUCTORS - 1.7% |
| |||||||
Power Integrations, Inc. | 311,800 | 11,630,140 | ||||||
STORAGE - 1.3% | ||||||||
Mobile Mini, Inc.* | 595,595 | 8,576,568 | ||||||
| Shares | Value | |||||||
TECHNOLOGY - 6.5% |
| |||||||
Autodesk, Inc.* | 455,000 | $ | 15,920,450 | |||||
Brocade Communications Systems, Inc.* | 1,141,900 | 5,629,567 | ||||||
eBay, Inc.* | 307,800 | 12,930,678 | ||||||
Zebra Technologies Corp. Class A* | 306,700 | 10,538,212 | ||||||
|
| |||||||
| 45,018,907 | ||||||||
TECH-SOFTWARE - 1.7% |
| |||||||
Citrix Systems, Inc.* | 137,950 | 11,579,523 | ||||||
TRANSPORTATION - 3.6% |
| |||||||
Alexander & Baldwin Holdings, Inc. | 460,900 | 24,542,925 | ||||||
UTILITIES - 3.1% |
| |||||||
Hawaiian Electric Industries, Inc. | 757,475 | 21,603,187 | ||||||
TOTAL COMMON STOCKS - 92.0% (Cost $506,657,925) |
| 633,686,688 | ||||||
|
| |||||||
The accompanying notes are an integral part of the financial statements.
20
Meridian Value Fund
Schedule of Investments (continued)
June 30, 2012
| Value | ||||||
U.S. GOVERNMENT OBLIGATIONS - 0.7% |
| |||||
U.S. Treasury Bill @ .076%** | $ | 4,999,220 | ||||
TOTAL U.S. GOVERNMENT OBLIGATIONS | 4,999,220 | |||||
|
| |||||
TOTAL INVESTMENTS - 92.7% | 638,685,908 | |||||
CASH AND OTHER ASSETS, LESS LIABILITIES - 7.3% | 49,961,552 | |||||
|
| |||||
NET ASSETS - 100.0% | $ | 688,647,460 | ||||
|
| |||||
ADR - American Depositary Receipt
REIT - Real Estate Investment Trust
| * | Non-income producing securities |
| ** | Annualized yield at date of purchase |
The accompanying notes are an integral part of the financial statements.
21
Meridian Fund, Inc.
Statements of Assets and Liabilities
June 30, 2012
| Equity Income Fund | Growth Fund | Value Fund | ||||||||||
ASSETS | ||||||||||||
Investments (Cost $26,660,171, $1,922,790,327 and $511,657,081 respectively) | $ | 29,413,679 | $ | 2,414,592,221 | $ | 638,685,908 | ||||||
Cash | 1,299,624 | 64,499,948 | 49,390,904 | |||||||||
Receivable for: | ||||||||||||
Capital shares purchased | — | 748,718 | 16,134 | |||||||||
Securities sold | — | 16,019,993 | 2,307,925 | |||||||||
Dividends | 67,936 | 1,115,419 | 757,277 | |||||||||
Interest | 5 | 188 | 124 | |||||||||
Prepaid expenses | 28,177 | 28,247 | 8,152 | |||||||||
|
|
|
|
|
| |||||||
TOTAL ASSETS | 30,809,421 | 2,497,004,734 | 691,166,424 | |||||||||
|
|
|
|
|
| |||||||
LIABILITIES | ||||||||||||
Payable for: | ||||||||||||
Capital shares sold | 1,300 | 1,524,457 | 450,825 | |||||||||
Securities purchased | — | 9,413,623 | 1,259,771 | |||||||||
Accrued expenses: | ||||||||||||
Investment advisory fees | 17,703 | 1,507,200 | 549,107 | |||||||||
Pricing fees | 4,313 | 42,505 | 14,112 | |||||||||
Professional fees | 37,735 | 135,685 | 103,952 | |||||||||
Other payables and accrued expenses | 4,634 | 297,431 | 141,197 | |||||||||
|
|
|
|
|
| |||||||
TOTAL LIABILITIES | 65,685 | 12,920,901 | 2,518,964 | |||||||||
|
|
|
|
|
| |||||||
NET ASSETS | $ | 30,743,736 | $ | 2,484,083,833 | $ | 688,647,460 | ||||||
|
|
|
|
|
| |||||||
Capital shares issued and outstanding, par value $0.01 (500,000,000, 500,000,000 and 500,000,000 shares authorized, respectively) | 2,871,195 | 55,127,855 | 22,506,868 | |||||||||
|
|
|
|
|
| |||||||
Net asset value per share (offering and redemption price) | $ | 10.71 | $ | 45.06 | $ | 30.60 | ||||||
|
|
|
|
|
| |||||||
Net Assets consist of: | ||||||||||||
Paid in capital | $ | 31,852,749 | $ | 1,838,533,579 | $ | 719,409,059 | ||||||
Accumulated net realized gain(loss) | (4,380,537 | ) | 151,583,139 | (160,072,920 | ) | |||||||
Net unrealized appreciation on investments | 2,753,508 | 491,801,894 | 127,028,827 | |||||||||
Undistributed net investment income | 518,016 | 2,165,221 | 2,282,494 | |||||||||
|
|
|
|
|
| |||||||
| $ | 30,743,736 | $ | 2,484,083,833 | $ | 688,647,460 | |||||||
|
|
|
|
|
| |||||||
The accompanying notes are an integral part of the financial statements.
22
Meridian Fund, Inc.
Statements of Operations
For the Year Ended June 30, 2012
| Equity Income Fund | Growth Fund | Value Fund | ||||||||||
INVESTMENT INCOME | ||||||||||||
Dividends | $ | 1,127,713 | $ | 26,545,336 | $ | 10,714,452 | ||||||
Foreign tax withholding | — | (113,907 | ) | (49,495 | ) | |||||||
Interest | 842 | 61,934 | 17,697 | |||||||||
|
|
|
|
|
| |||||||
Total investment income | 1,128,555 | 26,493,363 | 10,682,654 | |||||||||
|
|
|
|
|
| |||||||
EXPENSES | ||||||||||||
Investment advisory fees | 303,946 | 18,808,464 | 7,352,597 | |||||||||
Custodian fees | 10,946 | 258,974 | 69,619 | |||||||||
Directors’ fees and expenses | 887 | 198,162 | 55,263 | |||||||||
Pricing fees | 29,929 | 253,006 | 91,396 | |||||||||
Professional fees | 67,700 | 343,552 | 149,694 | |||||||||
Registration and filing fees | 35,868 | 57,403 | 31,499 | |||||||||
Reports to shareholders | 607 | 518,661 | 239,536 | |||||||||
Transfer agent fees | 14,056 | 594,212 | 398,520 | |||||||||
Miscellaneous expenses | 514 | 35,230 | 11,927 | |||||||||
|
|
|
|
|
| |||||||
Total expenses | 464,453 | 21,067,664 | 8,400,051 | |||||||||
Fees waived by Adviser (Note 2) | (52,027 | ) | — | — | ||||||||
|
|
|
|
|
| |||||||
Net expenses | 412,426 | 21,067,664 | 8,400,051 | |||||||||
|
|
|
|
|
| |||||||
Net investment income | 716,129 | 5,425,699 | 2,282,603 | |||||||||
|
|
|
|
|
| |||||||
NET REALIZED AND UNREALIZED GAIN (LOSS) ON INVESTMENTS | ||||||||||||
Net realized gain on investments | 1,247,536 | 182,254,242 | 67,572,308 | |||||||||
Net change in unrealized appreciation/depreciation on investments | (1,059,666 | ) | (132,481,769 | ) | (51,595,129 | ) | ||||||
|
|
|
|
|
| |||||||
Net realized and unrealized gain on investments | 187,870 | 49,772,473 | 15,977,179 | |||||||||
|
|
|
|
|
| |||||||
NET INCREASE IN NET ASSETS RESULTING FROM OPERATIONS | $ | 903,999 | $ | 55,198,172 | $ | 18,259,782 | ||||||
|
|
|
|
|
| |||||||
The accompanying notes are an integral part of the financial statements.
23
Meridian Fund, Inc.
Statements of Changes in Net Assets
| Equity Income Fund | Growth Fund | |||||||||||||||
| Year Ended June 30, 2012 | Year Ended June 30, 2011 | Year Ended June 30, 2012 | Year Ended June 30, 2011 | |||||||||||||
OPERATIONS | ||||||||||||||||
Net investment income | $ | 716,129 | $ | 623,868 | $ | 5,425,699 | $ | 3,697,464 | ||||||||
Net realized gain on investments | 1,247,536 | 1,390,957 | 182,254,242 | 183,214,046 | ||||||||||||
Net change in unrealized appreciation/depreciation on investments | (1,059,666 | ) | 4,992,670 | (132,481,769 | ) | 431,052,677 | ||||||||||
|
|
|
|
|
|
|
| |||||||||
Net increase in net assets from operations | 903,999 | 7,007,495 | 55,198,172 | 617,964,187 | ||||||||||||
|
|
|
|
|
|
|
| |||||||||
DISTRIBUTIONS TO SHAREHOLDERS |
| |||||||||||||||
Distributions from ordinary income | (666,723 | ) | (617,600 | ) | (3,952,996 | ) | (3,004,679 | ) | ||||||||
Distributions from net realized capital gains | — | — | (179,546,182 | ) | (345,185 | ) | ||||||||||
|
|
|
|
|
|
|
| |||||||||
Net distributions | (666,723 | ) | (617,600 | ) | (183,499,178 | ) | (3,349,864 | ) | ||||||||
|
|
|
|
|
|
|
| |||||||||
CAPITAL SHARE TRANSACTIONS | ||||||||||||||||
Proceeds from sales of shares | 1,755,274 | 4,344,602 | 606,354,021 | 944,903,617 | ||||||||||||
Reinvestment of distributions | 661,090 | 611,890 | 177,474,961 | 3,175,566 | ||||||||||||
Redemption fees | 3,282 | 218 | 172,598 | 237,068 | ||||||||||||
Less: redemptions of shares | (7,556,784 | ) | (639,833 | ) | (786,698,568 | ) | (386,114,353 | ) | ||||||||
|
|
|
|
|
|
|
| |||||||||
Increase (decrease) resulting from capital share transactions | (5,137,138 | ) | 4,316,877 | (2,696,988 | ) | 562,201,898 | ||||||||||
|
|
|
|
|
|
|
| |||||||||
Total increase (decrease) in net assets | (4,899,862 | ) | 10,706,772 | (130,997,994 | ) | 1,176,816,221 | ||||||||||
|
|
|
|
|
|
|
| |||||||||
NET ASSETS | ||||||||||||||||
Beginning of year | 35,643,598 | 24,936,826 | 2,615,081,827 | 1,438,265,606 | ||||||||||||
|
|
|
|
|
|
|
| |||||||||
End of year | $ | 30,743,736 | $ | 35,643,598 | $ | 2,484,083,833 | $ | 2,615,081,827 | ||||||||
|
|
|
|
|
|
|
| |||||||||
Undistributed net investment income at end of year | $ | 518,016 | $ | 468,610 | $ | 2,165,221 | $ | 692,785 | ||||||||
|
|
|
|
|
|
|
| |||||||||
The accompanying notes are an integral part of the financial statements.
24
Meridian Fund, Inc.
Statements of Changes in Net Assets
| Value Fund | ||||||||
| Year Ended June 30, 2012 | Year Ended June 30, 2011 | |||||||
OPERATIONS | ||||||||
Net investment income | $ | 2,282,603 | $ | 3,256,620 | ||||
Net realized gain on investments | 67,572,308 | 115,450,037 | ||||||
Net change in unrealized appreciation/depreciation on investments | (51,595,129 | ) | 110,782,863 | |||||
|
|
|
| |||||
Net increase in net assets from operations | 18,259,782 | 229,489,520 | ||||||
|
|
|
| |||||
DISTRIBUTIONS TO SHAREHOLDERS | ||||||||
Distributions from ordinary income | (3,256,492 | ) | (2,508,893 | ) | ||||
|
|
|
| |||||
Net distributions | (3,256,492 | ) | (2,508,893 | ) | ||||
|
|
|
| |||||
CAPITAL SHARE TRANSACTIONS | ||||||||
Proceeds from sales of shares | 17,262,910 | 41,931,473 | ||||||
Reinvestment of distributions | 3,188,208 | 2,443,388 | ||||||
Redemption fees | 8,236 | 6,091 | ||||||
Less: redemptions of shares | (216,127,160 | ) | (204,985,104 | ) | ||||
|
|
|
| |||||
Decrease resulting from capital share transactions | (195,667,806 | ) | (160,604,152 | ) | ||||
|
|
|
| |||||
Total increase (decrease) in net assets | (180,664,516 | ) | 66,376,475 | |||||
|
|
|
| |||||
NET ASSETS | ||||||||
Beginning of year | 869,311,976 | 802,935,501 | ||||||
|
|
|
| |||||
End of year | $ | 688,647,460 | $ | 869,311,976 | ||||
|
|
|
| |||||
Undistributed net investment income at end of year | $ | 2,282,494 | $ | 3,256,383 | ||||
|
|
|
| |||||
The accompanying notes are an integral part of the financial statements.
25
Meridian Equity Income Fund
Financial Highlights
Selected data for each share of capital stock outstanding throughout each period
| For the Fiscal Year Ended June 30, | For the fiscal period from January 31, 2005 through June 30, 2005+ | |||||||||||||||||||||||||||||||
| 2012 | 2011 | 2010 | 2009 | 2008 | 2007 | 2006 | ||||||||||||||||||||||||||
Net Asset Value - Beginning of Period | $ | 10.61 | $ | 8.51 | $ | 6.88 | $ | 10.37 | $ | 13.14 | $ | 11.05 | $ | 10.10 | $ | 10.00 | ||||||||||||||||
|
|
|
|
|
|
|
|
|
|
|
|
|
|
|
| |||||||||||||||||
Income (Loss) from Investment Operations | ||||||||||||||||||||||||||||||||
Net Investment Income | 0.22 | 1 | 0.20 | 1 | 0.19 | 1 | 0.22 | 1 | 0.24 | 1 | 0.18 | 0.15 | 0.06 | |||||||||||||||||||
Net Gains (Losses) on Investments (both realized and unrealized) | 0.09 | 2.11 | 1.63 | (2.96 | ) | (2.25 | ) | 2.19 | 0.93 | 0.04 | ||||||||||||||||||||||
|
|
|
|
|
|
|
|
|
|
|
|
|
|
|
| |||||||||||||||||
Total From Investment Operations | 0.31 | 2.31 | 1.82 | (2.74 | ) | (2.01 | ) | 2.37 | 1.08 | 0.10 | ||||||||||||||||||||||
|
|
|
|
|
|
|
|
|
|
|
|
|
|
|
| |||||||||||||||||
Less Distributions | ||||||||||||||||||||||||||||||||
Distributions from Net Investment Income | (0.21 | ) | (0.21 | ) | (0.19 | ) | (0.22 | ) | (0.22 | ) | (0.17 | ) | (0.12 | ) | 0.00 | |||||||||||||||||
Distributions from Net Realized Capital Gains | 0.00 | 0.00 | 0.00 | (0.53 | ) | (0.54 | ) | (0.11 | ) | (0.01 | ) | 0.00 | ||||||||||||||||||||
|
|
|
|
|
|
|
|
|
|
|
|
|
|
|
| |||||||||||||||||
Total Distributions | (0.21 | ) | (0.21 | ) | (0.19 | ) | (0.75 | ) | (0.76 | ) | (0.28 | ) | (0.13 | ) | 0.00 | |||||||||||||||||
|
|
|
|
|
|
|
|
|
|
|
|
|
|
|
| |||||||||||||||||
Net Asset Value - End of Period | $ | 10.71 | $ | 10.61 | $ | 8.51 | $ | 6.88 | $ | 10.37 | $ | 13.14 | $ | 11.05 | $ | 10.10 | ||||||||||||||||
|
|
|
|
|
|
|
|
|
|
|
|
|
|
|
| |||||||||||||||||
Total Return | 3.09% | 27.30% | 26.44% | (26.75% | ) | (15.84% | ) | 21.61% | 10.75% | 1.00% | 2 | |||||||||||||||||||||
|
|
|
|
|
|
|
|
|
|
|
|
|
|
|
| |||||||||||||||||
Ratios/Supplemental Data | ||||||||||||||||||||||||||||||||
Net Assets, End of Period (000’s) | $ | 30,744 | $ | 35,644 | $ | 24,937 | $ | 20,719 | $ | 33,519 | $ | 43,188 | $ | 25,451 | $ | 8,412 | ||||||||||||||||
Ratio of Expenses to Average Net Assets |
| |||||||||||||||||||||||||||||||
Before fees waived | 1.41% | 1.25% | 1.30% | 1.43% | 1.25% | 4 | 1.29% | 1.67% | 3.96% | 5 | ||||||||||||||||||||||
After fees waived6 | 1.25% | 1.25% | 3 | 1.25% | 1.25% | 1.25% | 1.25% | 1.25% | 1.25% | 5 | ||||||||||||||||||||||
Ratio of Net Investment Income to Average Net Assets |
| |||||||||||||||||||||||||||||||
After fees waived | 2.17% | 2.04% | 2.27% | 2.73% | 2.02% | 1.64% | 1.80% | 2.11% | 5 | |||||||||||||||||||||||
Portfolio Turnover Rate | 31% | 29% | 63% | 49% | 62% | 37% | 60% | 25% | ||||||||||||||||||||||||
| + | The Fund commenced investment operations on January 31, 2005. |
| 1 | Per share net investment income has been calculated using the average daily shares method. |
| 2 | Not Annualized. |
| 3 | Includes fees waived, which were less than 0.01%. |
| 4 | The Advisor recouped $4,849 during the fiscal year ended June 30, 2008, representing previously reimbursed expenses. Had such payment not been made, the expense ratio would have been 1.24%. |
| 5 | Annualized. |
| 6 | See note 2 to Financial Statements. |
The accompanying notes are an integral part of the financial statements.
26
Meridian Growth Fund
Financial Highlights
Selected data for each share of capital stock outstanding throughout each period
| For the Fiscal Year Ended June 30, | ||||||||||||||||||||||||||||||||||||||||
| 2012 | 2011 | 2010 | 2009 | 2008 | 2007 | 2006 | 2005 | 2004 | 2003 | |||||||||||||||||||||||||||||||
Net Asset Value - Beginning of Year | $ | 47.61 | $ | 33.94 | $ | 27.89 | $ | 33.60 | $ | 42.74 | $ | 38.54 | $ | 35.77 | $ | 35.38 | $ | 27.24 | $ | 28.10 | ||||||||||||||||||||
|
|
|
|
|
|
|
|
|
|
|
|
|
|
|
|
|
|
|
| |||||||||||||||||||||
Income (Loss) from Investment Operations |
| |||||||||||||||||||||||||||||||||||||||
Net Investment Income (Loss) | 0.10 | 1 | 0.08 | 1 | 0.08 | 1 | 0.15 | 1 | 0.05 | 1 | 0.04 | (0.01 | ) | (0.07 | ) | (0.04 | ) | (0.08 | ) | |||||||||||||||||||||
Net Gains (Losses) on Investments (both realized and unrealized) | 0.69 | 13.67 | 6.11 | (4.68 | ) | (5.56 | ) | 7.29 | 3.58 | 1.02 | 9.10 | (0.11 | ) | |||||||||||||||||||||||||||
|
|
|
|
|
|
|
|
|
|
|
|
|
|
|
|
|
|
|
| |||||||||||||||||||||
Total From Investment Operations | 0.79 | 13.75 | 6.19 | (4.53 | ) | (5.51 | ) | 7.33 | 3.57 | 0.95 | 9.06 | (0.19 | ) | |||||||||||||||||||||||||||
|
|
|
|
|
|
|
|
|
|
|
|
|
|
|
|
|
|
|
| |||||||||||||||||||||
Less Distributions | ||||||||||||||||||||||||||||||||||||||||
Distributions from Net Investment Income | (0.07 | ) | (0.07 | ) | (0.12 | ) | (0.09 | ) | (0.05 | ) | (0.01 | ) | 0.00 | 0.00 | 0.00 | (0.06 | ) | |||||||||||||||||||||||
Distributions from Net Realized Capital Gains | (3.27 | ) | (0.01 | ) | 0.00 | (1.09 | ) | (3.58 | ) | (3.12 | ) | (0.80 | ) | (0.56 | ) | (0.92 | ) | (0.61 | ) | |||||||||||||||||||||
Distributions from Paid in Capital Distribution | 0.00 | 0.00 | (0.02 | ) | (0.00 | )2 | 0.00 | 0.00 | 0.00 | 0.00 | 0.00 | 0.00 | ||||||||||||||||||||||||||||
|
|
|
|
|
|
|
|
|
|
|
|
|
|
|
|
|
|
|
| |||||||||||||||||||||
Total Distributions | (3.34 | ) | (0.08 | ) | (0.14 | ) | (1.18 | ) | (3.63 | ) | (3.13 | ) | (0.80 | ) | (0.56 | ) | (0.92 | ) | (0.67 | ) | ||||||||||||||||||||
|
|
|
|
|
|
|
|
|
|
|
|
|
|
|
|
|
|
|
| |||||||||||||||||||||
Net Asset Value - End of Year | $ | 45.06 | $ | 47.61 | $ | 33.94 | $ | 27.89 | $ | 33.60 | $ | 42.74 | $ | 38.54 | $ | 35.77 | $ | 35.38 | $ | 27.24 | ||||||||||||||||||||
|
|
|
|
|
|
|
|
|
|
|
|
|
|
|
|
|
|
|
| |||||||||||||||||||||
Total Return | 2.45% | 40.51% | 22.18% | (13.01% | ) | (13.80% | ) | 19.69% | 10.08% | 2.65% | 33.65% | (0.20% | ) | |||||||||||||||||||||||||||
|
|
|
|
|
|
|
|
|
|
|
|
|
|
|
|
|
|
|
| |||||||||||||||||||||
Ratios/Supplemental Data |
| |||||||||||||||||||||||||||||||||||||||
Net Assets, End of Year (000’s) | $ | 2,484,084 | $ | 2,615,082 | $ | 1,438,266 | $ | 1,197,656 | $ | 1,516,015 | $ | 2,066,750 | $ | 1,689,374 | $ | 1,693,564 | $ | 1,273,302 | $ | 448,393 | ||||||||||||||||||||
Ratio of Expenses to Average Net | 0.85% | 0.81% | 0.84% | 0.86% | 0.84% | 0.84% | 0.85% | 0.86% | 0.88% | 0.95% | ||||||||||||||||||||||||||||||
Ratio of Net Investment Income (Loss) to Average Net Assets | 0.22% | 0.18% | 0.24% | 0.52% | 0.13% | 0.11% | (0.03% | ) | (0.21% | ) | (0.21% | ) | (0.47% | ) | ||||||||||||||||||||||||||
Portfolio Turnover Rate | 25% | 26% | 37% | 35% | 39% | 40% | 29% | 32% | 19% | 27% | ||||||||||||||||||||||||||||||
| 1 | Per share net investment income (loss) has been calculated using the average daily shares method. |
| 2 | Distribution includes a return of capital that rounds to less than $.01 per share. |
The accompanying notes are an integral part of the financial statements.
27
Meridian Value Fund
Financial Highlights
Selected data for each share of capital stock outstanding throughout each period
| For the Fiscal Year Ended June 30, | ||||||||||||||||||||||||||||||||||||||||
| 2012 | 2011 | 2010 | 2009 | 2008 | 2007 | 2006 | 2005 | 2004 | 2003 | |||||||||||||||||||||||||||||||
Net Asset Value - Beginning of Year | $ | 29.59 | $ | 22.80 | $ | 20.53 | $ | 29.43 | $ | 38.79 | $ | 36.14 | $ | 38.11 | $ | 40.35 | $ | 31.65 | $ | 30.34 | ||||||||||||||||||||
|
|
|
|
|
|
|
|
|
|
|
|
|
|
|
|
|
|
|
| |||||||||||||||||||||
Income (Loss) from Investment Operations | ||||||||||||||||||||||||||||||||||||||||
Net Investment Income (Loss) | 0.09 | 1 | 0.10 | 1 | 0.07 | 1 | 0.22 | 1 | 0.15 | 1 | 0.41 | 0.18 | 0.19 | 0.00 | (0.03 | ) | ||||||||||||||||||||||||
Net Gains (Losses) on Investments (both realized and unrealized) | 1.05 | 2 | 6.77 | 2.45 | (7.80 | ) | (3.12 | ) | 7.74 | 2.45 | 2.96 | 8.70 | 1.34 | |||||||||||||||||||||||||||
|
|
|
|
|
|
|
|
|
|
|
|
|
|
|
|
|
|
|
| |||||||||||||||||||||
Total From Investment Operations | 1.14 | 6.87 | 2.52 | (7.58 | ) | (2.97 | ) | 8.15 | 2.63 | 3.15 | 8.70 | 1.31 | ||||||||||||||||||||||||||||
|
|
|
|
|
|
|
|
|
|
|
|
|
|
|
|
|
|
|
| |||||||||||||||||||||
Less Distributions | ||||||||||||||||||||||||||||||||||||||||
Distributions from Net Investment Income | (0.13 | ) | (0.08 | ) | (0.25 | ) | 0.00 | (0.35 | ) | (0.41 | ) | (0.32 | ) | (0.28 | ) | 0.00 | 0.00 | |||||||||||||||||||||||
Distributions from Net Realized Capital Gains | 0.00 | 0.00 | 0.00 | (1.32 | ) | (6.04 | ) | (5.09 | ) | (4.28 | ) | (5.11 | ) | 0.00 | 0.00 | |||||||||||||||||||||||||
|
|
|
|
|
|
|
|
|
|
|
|
|
|
|
|
|
|
|
| |||||||||||||||||||||
Total Distributions | (0.13 | ) | (0.08 | ) | (0.25 | ) | (1.32 | ) | (6.39 | ) | (5.50 | ) | (4.60 | ) | (5.39 | ) | 0.00 | 0.00 | ||||||||||||||||||||||
|
|
|
|
|
|
|
|
|
|
|
|
|
|
|
|
|
|
|
| |||||||||||||||||||||
Net Asset Value - End of Year | $ | 30.60 | $ | 29.59 | $ | 22.80 | $ | 20.53 | $ | 29.43 | $ | 38.79 | $ | 36.14 | $ | 38.11 | $ | 40.35 | $ | 31.65 | ||||||||||||||||||||
|
|
|
|
|
|
|
|
|
|
|
|
|
|
|
|
|
|
|
| |||||||||||||||||||||
Total Return | 3.89% | 2 | 30.13% | 12.20% | (25.72% | ) | (8.82% | ) | 23.90% | 7.35% | 8.00% | 27.49% | 4.32% | |||||||||||||||||||||||||||
|
|
|
|
|
|
|
|
|
|
|
|
|
|
|
|
|
|
|
| |||||||||||||||||||||
Ratios/Supplemental Data | ||||||||||||||||||||||||||||||||||||||||
Net Assets, End of Year (000’s) | $ | 688,647 | $ | 869,312 | $ | 802,936 | $ | 831,572 | $ | 1,319,186 | $ | 1,819,440 | $ | 1,686,874 | $ | 2,271,478 | $ | 2,226,590 | $ | 1,456,552 | ||||||||||||||||||||
Ratio of Expenses to Average Net Assets | 1.14% | 1.09% | 1.09% | 1.12% | 1.09% | 1.08% | 1.09% | 1.08% | 1.09% | 1.11% | ||||||||||||||||||||||||||||||
Ratio of Net Investment Income (Loss) to Average Net Assets | 0.31% | 0.37% | 0.27% | 0.97% | 0.44% | 0.59% | 0.49% | 0.48% | 0.01% | (0.12% | ) | |||||||||||||||||||||||||||||
Portfolio Turnover Rate | 20% | 38% | 45% | 87% | 61% | 75% | 58% | 59% | 81% | 60% | ||||||||||||||||||||||||||||||
| 1 | Per share net investment income (loss) has been calculated using the average daily shares method. |
| 2 | Includes a gain resulting from litigation payments on securities owned in a prior year. Without these gains, the net realized gains on investments per share would have been $0.99, and the return would have been 3.69%. |
The accompanying notes are an integral part of the financial statements.
28
Meridian Fund, Inc.
Notes to Financial Statements
For the Year Ended June 30, 2012
| 1. | Organization and Significant Accounting Policies: Meridian Fund, Inc. (the “Meridian Funds”) is comprised of the Meridian Equity Income Fund (the “Equity Income Fund”), the Meridian Growth Fund (the “Growth Fund”) and the Meridian Value Fund (the “Value Fund”). The Equity Income Fund, the Growth Fund and the Value Fund (each a “Fund” and collectively, the “Funds”) are registered under the Investment Company Act of 1940, as no-load, diversified, open-end management investment companies. The Equity Income Fund began operations and was registered on January 31, 2005. The Growth Fund began operations and was registered on August 1, 1984. The Value Fund began operations on February 10, 1994 and was registered on February 7, 1994. |
The primary investment objective of the Equity Income Fund is to seek long-term growth of capital along with income as a component of total return.
The primary investment objective of the Growth Fund is to seek long-term growth of capital.
The primary investment objective of the Value Fund is to seek long-term growth of capital.
The following is a summary of significant accounting policies for all of the Funds:
| a. | Investment Valuations: Marketable securities are valued at the closing price or last sales price on the principal exchange or market on which they are traded; or, if there were no sales that day, at the last reported bid price. Securities and other assets for which reliable market quotations are not readily available or for which a significant event has occurred since the time of the most recent market quotation, will be valued at their fair value as determined by Aster Investment Management Company, Inc. (the “Adviser”) under the guidelines established by, and under the general supervision and responsibility of, the Funds’ Board of Directors (the “Board”). Short-term debt securities with original or remaining maturities in excess of 60 days are valued at the mean of their quoted bid and asked prices. Short-term debt securities with 60 days or less to maturity are valued at amortized cost which approximates fair market value. |
| b. | Federal Income Taxes: It is the Funds’ policy to comply with the requirements of Subchapter M of the Internal Revenue Code of 1986, as amended, applicable to regulated investment companies and to distribute all of their taxable income to their shareholders; therefore, no federal income tax provision is required. |
| c. | Security Transactions: Security transactions are accounted for on the date the securities are purchased or sold (trade date). Realized gains and losses on security transactions are determined on the basis of specific identification for both financial statement and federal income tax purposes. Dividend income is recorded on the ex-dividend date. Interest income is accrued daily. |
| d. | Cash and Cash Equivalents: All highly liquid investments with an original maturity of three months or less are considered to be cash equivalents. Available funds are automatically swept into a Cash Reserve account, which preserves capital with a consistently competitive rate of return. Interest accrues daily and is credited by the third business day of the following month. |
29
Meridian Fund, Inc.
Notes to Financial Statements (continued)
For the Year Ended June 30, 2012
| e. | Expenses: Expenses arising in connection with a Fund are charged directly to that Fund. Expenses common to the Funds are generally allocated to each Fund in proportion to their relative net assets. |
| f. | Use of Estimates: The preparation of financial statements in accordance with accounting principals generally accepted in the U.S. (“GAAP”) requires management to make estimates and assumptions that affect the reported amount of assets and liabilities and revenue and expenses at the date of the financial statements. Actual amounts could differ from those estimates. |
| g. | Distributions to Shareholders: The Funds record distributions to shareholders on the ex-dividend date. The amount of distributions from net investment income and net realized capital gains are determined in accordance with federal income tax regulations which may differ from GAAP. These “book/tax” differences are either considered temporary or permanent in nature. To the extent these differences are permanent in nature, such amounts are reclassified within the capital accounts based on their federal tax-basis treatment; temporary differences do not require reclassification. |
Distributions which exceed net investment income and net realized capital gains are reported as distributions in excess of net investment income or distributions in excess of net realized capital gains for financial reporting purposes but not for tax purposes. To the extent they exceed net investment income and net realized capital gains for tax purposes, they are reported as distributions of paid-in-capital.
| h. | Guarantees and Indemnification: Under the Funds’ organizational documents, its Officers and Directors are indemnified against certain liability arising out of the performance of their duties to the Funds. Additionally, in the normal course of business, the Funds enter into contracts with service providers that contain general indemnification clauses. The Funds’ maximum exposure under these arrangements is unknown, as this would involve future claims that may be made against the Funds that have not yet occurred. However, based on experience, the Funds expect the risk of loss to be remote. |
| i. | Foreign Currency Translation: Securities denominated in foreign currencies are converted into U.S. dollars using the spot market rate of exchange at the time of valuation. Purchases and sales of such securities and related dividend and interest income are converted into U.S. dollars using the spot market rate of exchange prevailing on the respective dates of such translations. Foreign securities and currency transactions may involve risks not associated with U.S. securities and currency. The Funds do not separately report the effect of changes in foreign exchange rates from changes in market prices on securities held. Such changes are included in net realized and unrealized gain or loss from investments as reported in the Statement of Operations. |
| j. | Fair Value Measurements: As described in Note 1.a. above, the Funds utilize various methods to determine and measure the fair value of investment securities on a recurring basis. The |
30
Meridian Fund, Inc.
Notes to Financial Statements (continued)
For the Year Ended June 30, 2012
| objective of a fair value measurement is to determine the price that would be received to sell an asset or paid to transfer a liability in an orderly transaction between market participants at the measurement date (an exit price). Accordingly, the fair value hierarchy gives the highest priority to quoted prices (unadjusted) in active markets for identical assets or liabilities (Level 1) and the lowest priority to unobservable inputs (Level 3). The three levels of the fair value hierarchy are described below: |
Level 1 - quoted prices in active markets for identical securities;
Level 2 - other significant observable inputs (including quoted prices for similar securities, interest rates, prepayment speeds, credit risk, etc.); and
Level 3 - significant unobservable inputs (including the Fund’s determinations as to the fair value of investments).
The inputs or methodology used for valuing securities are not necessarily an indication of the risks associated with investing in those securities. The summary of inputs used to value the Funds’ securities as of June 30, 2012 is as follows:
Valuation Inputs | Equity Income Fund | Growth Fund | Value Fund | |||||||||
Level 1 - Quoted Prices* | $ | 29,413,679 | $ | 2,349,596,992 | $ | 633,686,688 | ||||||
Level 2 - Other Significant Observable Inputs** | — | 64,995,229 | 4,999,220 | |||||||||
Level 3 - Significant Unobservable Inputs | — | — | — | |||||||||
|
|
|
|
|
| |||||||
Total Market Value of Investments | $ | 29,413,679 | $ | 2,414,592,221 | $ | 638,685,908 | ||||||
|
|
|
|
|
| |||||||
| * | Level 1 investments are comprised of common stock with industry classifications as defined on the Schedule of Investments. |
| ** | Level 2 investments are limited to U.S. Treasury Securities. |
During the fiscal year ended June 30, 2012 there were no reportable transfers between levels.
| 2. | Related Parties: Effective July 13, 2012, the Meridian Funds, on behalf of each Fund, entered into a new Investment Management Agreement and Service Agreement with the Adviser (the “Management Agreement”). The Funds’ Board, and each Fund’s shareholders, approved, among other matters, the Management Agreement with the Adviser. Please see the Board Consideration of Proposed Management Agreement (unaudited) and Shareholder Meeting Results (unaudited) sections for additional information. |
Prior to his death on February 16, 2012, Richard F. Aster, Jr. owned approximately 96% of the Adviser. In connection with his death, Mr. Aster’s ownership interest in the Adviser, among other
31
Meridian Fund, Inc.
Notes to Financial Statements (continued)
For the Year Ended June 30, 2012
assets, was transferred (the “Transfer”) to a trust (the “Trust”). First Republic Trust Company (“First Republic”), as a co-trustee of the Trust, has sole authority to act under the Trust agreement with respect to the Trust’s ownership interest in the Adviser. In this regard, First Republic has the authority, on behalf of the Trust, without limitation, to make all decisions regarding the Trust’s ownership interest in the Adviser, as well as the administration, management and operations of the Adviser. First Republic has advised that it is considering its options with respect to its holdings of shares of the Adviser, and First Republic has indicated that it has hired an independent financial adviser to assist it in identifying and evaluating potential options. A transfer by the Trust of some or all of its shares in the Adviser may result in a change of control of the Adviser, thereby requiring shareholder approval of a new management agreement.
The Funds were previously managed by the Adviser under an Investment Management Agreement, Power of Attorney and Service Agreement, dated November 1, 2000 (for the Growth Fund and the Value Fund), and an Investment Management Agreement, dated January 31, 2005 (for the Equity Income Fund) (together, the “Previous Management Agreements”). The Management Agreement has the same fee rates as, and is otherwise substantially similar to, the Previous Management Agreements for each Fund. None of the differences between the Management Agreement and the Previous Management Agreements are considered to be material in nature.
The Adviser receives from the Equity Income Fund, as compensation for its services, an annual fee of 1% of the first $10,000,000 of the Equity Income Fund’s net assets, 0.90% of the next $20,000,000 of the Equity Income Fund’s net assets, 0.80% of the next $20,000,000 of the Equity Income Fund’s net assets and 0.70% of the Equity Income Fund’s net assets in excess of $50,000,000. The fee is paid monthly in arrears and calculated based on that month’s daily average net assets.
The Adviser receives from the Growth Fund, as compensation for its services, an annual fee of 1% of the first $50,000,000 of the Growth Fund’s net assets and 0.75% of the Growth Fund’s net assets in excess of $50,000,000. The fee is paid monthly in arrears and calculated based on that month’s daily average net assets.
The Adviser receives from the Value Fund, as compensation for its services, an annual fee of 1% of the Value Fund’s net assets. The fee is paid monthly in arrears and calculated based on that month’s daily average net assets.
The Adviser voluntarily agreed to waive its fee and reimburse expenses, to the extent that total annual operating expenses for the Equity Income Fund exceeds 1.25%. The Investment Adviser has voluntarily agreed to limit the operating expenses of the Growth and Value Funds to 2.50%. With respect to these limits, the Adviser waived fees in the amount of $52,027 for the Equity Income Fund but did not waive fees for the Growth and Value Funds, during the fiscal year ended June 30, 2012.
For a period not to exceed three years from the date on which a waiver or reimbursement of expenses in excess of the expense limitation is made by the Adviser, the Equity Income Fund will
32
Meridian Fund, Inc.
Notes to Financial Statements (continued)
For the Year Ended June 30, 2012
carry forward, and may repay the Adviser such amounts; provided the Fund is able to effect such reimbursement and maintain the expense limitation.
At June 30, 2012, the balance of carried forward recoupable expenses along with the year of expiration for the Equity Income Fund was:
Amount | Expiration | |||
$12,855 | 2013 | |||
1,193 | 2014 | |||
52,027 | 2015 | |||
Subject to the approval of the Board, the Fund will repay the Adviser the amount of its reimbursement for the Equity Income Fund for up to three years following the reimbursement to the extent the Equity Income Fund’s expenses drop below 1.25%, after giving effect to repayment by the Fund. Either the Fund or the Adviser can modify or terminate this arrangement at any time.
The Richard F. Aster, Jr. Trust owns the majority of the shares of the Adviser. Beneficial ownership in the Funds by the Richard F. Aster, Jr. Trust as of June 30, 2012 were as follows:
Equity Income Fund* | 72.92 | % | ||
Growth Fund | 0.88 | % | ||
Value Fund | 2.99 | % |
| * | The Richard F. Aster, Jr. Trust redeemed 427,658 shares of the Equity Income Fund in August 2012. As of the date that these financial statements were issued, the Richard F. Aster, Jr. Trust was the benefical owner of 68.41% of the outstanding shares of the Equity Income Fund. |
| 3. | Capital Shares Transactions: Transactions in capital shares for the fiscal year ended June 30, 2012 and the fiscal year ended June 30, 2011 were as follows: |
| Equity Income Fund | ||||||||
| June 30, 2012 | June 30, 2011 | |||||||
Increase in Fund shares: | ||||||||
Shares sold | 168,446 | 430,560 | ||||||
Shares issued from reinvestment of distributions | 66,844 | 62,694 | ||||||
|
|
|
| |||||
| 235,290 | 493,254 | |||||||
Shares redeemed | (722,117 | ) | (64,601 | ) | ||||
|
|
|
| |||||
Net increase (decrease) | (486,827 | ) | 428,653 | |||||
|
|
|
| |||||
33
Meridian Fund, Inc.
Notes to Financial Statements (continued)
For the Year Ended June 30, 2012
| Growth Fund | ||||||||
| June 30, 2012 | June 30, 2011 | |||||||
Increase in Fund shares: | ||||||||
Shares sold | 13,733,443 | 21,278,458 | ||||||
Shares issued from reinvestment of distributions | 4,381,018 | 72,106 | ||||||
|
|
|
| |||||
| 18,114,461 | 21,350,564 | |||||||
Shares redeemed | (17,918,599 | ) | (8,799,381 | ) | ||||
|
|
|
| |||||
Net increase | 195,862 | 12,551,183 | ||||||
|
|
|
| |||||
| Value Fund | ||||||||
| June 30, 2012 | June 30, 2011 | |||||||
Increase in Fund shares: | ||||||||
Shares sold | 601,947 | 1,509,297 | ||||||
Shares issued from reinvestment of distributions | 117,473 | 86,096 | ||||||
|
|
|
| |||||
| 719,420 | 1,595,393 | |||||||
Shares redeemed | (7,589,319 | ) | (7,430,764 | ) | ||||
|
|
|
| |||||
Net decrease | (6,869,899 | ) | (5,835,371 | ) | ||||
|
|
|
| |||||
| 4. | Directors and Officers: Certain Directors and/or Officers of the Funds are also Directors and/or Officers of the Adviser. The sole Director and acting Chief Executive Officer of the Adviser is a Director of the Funds and is a minority shareholder of the Adviser. Directors and Officers of the Funds who are Directors and/or Officers of the Adviser receive no compensation from the Funds. Prior to January 1, 2012, the Directors of the Funds who are considered not interested persons, as defined in the Investment Company Act of 1940 (the “Non-Interested Directors”), received compensation in the amount of a minimum of $13,000 per year, and that, upon the election of each Non-Interested Director, a portion of such compensation could be invested in any of the Funds, at each Non-Interested Director’s discretion. |
Effective January 1, 2012, each Non-Interested Director will be paid an annual fee set at $40,000. An additional $5,000 will be paid to each Non-Interested Director for attendance at each in-person meeting of the Board and an additional $1,000 will be paid to each Non-Interested Director for participating in a telephonic meeting of the Board. An additional $3,000 will be paid to each member of the Audit or Governance Committee of the Board for attendance at an in-person Audit or Governance Committee meeting and an additional $1,000 will be paid to each member of the Audit or Governance Committee of the Board for participating in a telephonic Audit or Governance Committee meeting.
34
Meridian Fund, Inc.
Notes to Financial Statements (continued)
For the Year Ended June 30, 2012
An additional $10,000 will be paid to the Chairman of the Board and the Chairman of a Committee of the Board. The Chairman of the Board will also receive an additional $2,500 for attending each in-person meeting of the Board. The Chairman of a Committee will receive an additional $2,000 for attending each in person Committee meeting.
| 5. | Investment Transactions: The cost of investments purchased and the proceeds from sales of investments, excluding short-term securities and U.S. government obligations, for the fiscal year ended June 30, 2012, were as follows: |
| Purchases | Proceeds from Sales | |||||||
Equity Income Fund | $ | 9,784,584 | $ | 14,304,185 | ||||
Growth Fund | 600,511,437 | 785,848,759 | ||||||
Value Fund | 140,727,657 | 351,617,697 | ||||||
| 6. | Distribution Information: Income and long-term capital gains distributions are determined in accordance with federal income tax regulations, which may differ from GAAP. The tax character of distributions made during the fiscal years ended June 30, 2012 and June 30, 2011 were as follows: |
| 2012 Taxable Distributions | ||||||||||||
| Ordinary Income | Net Long-Term Capital Gain | Total Distributions | ||||||||||
Equity Income Fund | $ | 666,723 | $ | — | $ | 666,723 | ||||||
Growth Fund | 4,922,849 | 178,576,329 | 183,499,178 | |||||||||
Value Fund | 3,256,492 | — | 3,256,492 | |||||||||
| 2011 Taxable Distributions | ||||||||||||
| Ordinary Income | Net Long-Term Capital Gain | Total Distributions | ||||||||||
Equity Income Fund | $ | 617,600 | $ | — | $ | 617,600 | ||||||
Growth Fund | 3,004,679 | 345,185 | 3,349,864 | |||||||||
Value Fund | 2,508,893 | — | 2,508,893 | |||||||||
| 7. | Federal Income Taxes Information: Management has analyzed the Funds’ tax positions taken on federal income tax returns for all open tax years (current and prior three tax years), and has concluded that no provision for federal income tax is required in the Funds’ financial statements. The Funds’ federal and state income and federal excise tax returns for tax years for which the applicable statutes of limitations have not expired are subject to examination by the Internal Revenue Service and state departments of revenue. |
35
Meridian Fund, Inc.
Notes to Financial Statements (continued)
For the Year Ended June 30, 2012
Permanent differences, incurred during the year ended June 30, 2012, resulting from differences in book and tax accounting have been reclassified at year end to undistributed net investment income and accumulated realized gain/(loss) as follows:
| Increase/(Decrease) Paid-in-Capital | Decrease Undistributed Net Investment Income | Increase/(Decrease) Accumulated Realized Gain/(Loss) | ||||||||||
Equity Income Fund | $ | — | $ | — | $ | — | ||||||
Growth Fund | — | (267 | ) | 267 | ||||||||
Value Fund | — | — | — | |||||||||
The aggregate cost of investments, unrealized appreciation and depreciation, for federal income tax purposes at June 30, 2012 is as follows:
| Aggregate Cost | Aggregate Gross Unrealized Appreciation | Aggregate Gross Unrealized Depreciation | Net Unrealized Appreciation/ (Depreciation) | |||||||||||||
Equity Income Fund | $ | 26,670,729 | $ | 3,620,445 | $ | (877,495 | ) | $ | 2,742,950 | |||||||
Growth Fund | 1,924,668,543 | 546,891,591 | (56,967,913 | ) | 489,923,678 | |||||||||||
Value Fund | 512,098,978 | 152,581,972 | (25,995,042 | ) | 126,586,930 | |||||||||||
| Components of Accumulated Earnings (Losses) on a Tax Basis | ||||||||||||
| Equity Income Fund | Growth Fund | Value Fund | ||||||||||
Undistributed ordinary income | $ | 518,016 | $ | 2,165,221 | $ | 2,282,494 | ||||||
Capital loss carry forward | (4,369,979 | ) | — | (156,963,829 | ) | |||||||
Undistributed long-term capital gains | — | 153,461,355 | — | |||||||||
Unrealized Appreciation/(Depreciation) | 2,742,950 | 489,923,678 | 126,586,930 | |||||||||
Qualified Late-Year Deferred Losses | — | — | (2,667,194 | ) | ||||||||
|
|
|
|
|
| |||||||
Total Accumulated Earnings/(Losses) | $ | (1,109,013 | ) | $ | 645,550,254 | $ | (30,761,599 | ) | ||||
|
|
|
|
|
| |||||||
The differences between book and tax-basis unrealized appreciations are attributable to the tax deferral of losses on wash sales.
As of June 30, 2012 the Funds had capital loss carry forwards available to offset future realized capital gains through the indicated expiration dates:
| Amount | Expires | |||||||
Equity Income Fund | $ | 4,369,979 | 2018 | |||||
Value Fund | 156,963,829 | 2018 | ||||||
Capital loss carryforwards utilized in the current year were $1,235,986, and $68,603,243 for Equity Income Fund and Value Fund, respectively.
36
Meridian Fund, Inc.
Notes to Financial Statements (continued)
For the Year Ended June 30, 2012
Under the Regulated Investment Company Modernization Act of 2010, the eight-year limit on the carry forward and use of capital losses was eliminated and capital losses incurred by the Funds after June 30, 2011 will not be subject to expiration. In addition, losses incurred after June 30, 2011 will retain their character as either a short-term or long-term capital loss on the first day of the next taxable year and must be utilized prior to the losses incurred in pre-enactment taxable years.
| 8. | Concentration and Market Risk: Investing in the Funds may involve certain risks, as discussed in the Funds’ prospectus, including, but not limited to, those described below. Any of these risks could cause an investor to lose money. |
The value of a Fund’s stock investments will fluctuate in response to the activities of individual companies and general stock market and economic conditions.
From time to time, the Funds may have individual shareholders holding a significant percentage of shares outstanding. Investment activities of these shareholders could have a material impact on the Funds. In this regard, as indicated in Note 2 Related Parties, the Richard F. Aster, Jr. Trust owned 72.92% of the Meridian Equity Income Fund as of June 30, 2012.
| 9. | Subsequent Events: Management has evaluated the impact of all subsequent events on the Funds through the date the financial statements were issued, and has noted no additional events that require recognition or disclosure in the financial statements, other than as described in Note 2 above. |
37
Report of Independent Registered Public Accounting Firm
To the Board of Directors and Shareholders of Meridian Fund, Inc.:
In our opinion, the accompanying statements of assets and liabilities, including the schedules of investments, and the related statements of operations and of changes in net assets and the financial highlights present fairly, in all material respects, the financial position of the Meridian Equity Income Fund, Meridian Growth Fund and Meridian Value Fund (constituting Meridian Fund, Inc. hereafter referred to as the “Funds”) at June 30, 2012, the results of each of their operations for the year then ended, the changes in each of their net assets for the two years then ended and the financial highlights for each of the periods presented, in conformity with accounting principles generally accepted in the United States of America. These financial statements and financial highlights (hereafter referred to as “financial statements”) are the responsibility of the Funds’ management; our responsibility is to express an opinion on these financial statements based on our audits. We conducted our audits of these financial statements in accordance with the standards of the Public Company Accounting Oversight Board (United States). Those standards require that we plan and perform the audits to obtain reasonable assurance about whether the financial statements are free of material misstatement. An audit includes examining, on a test basis, evidence supporting the amounts and disclosures in the financial statements, assessing the accounting principles used and significant estimates made by management, and evaluating the overall financial statement presentation. We believe that our audits, which included confirmation of securities at June 30, 2012 by correspondence with the custodian and brokers, provide a reasonable basis for our opinion.

PricewaterhouseCoopers LLP
San Francisco, California
August 21, 2012
38
Meridian Fund, Inc.
Shareholder Meeting Results (unaudited)
A Joint Special Meeting of Shareholders (the “Meeting”) of the Equity Income Fund, the Growth Fund and the Value Fund, each a series of the Meridian Funds, was held on June 19, 2012 and, for certain matters, adjourned to July 10, 2012. The Meeting was held to approve the new Management Agreement with the Adviser. The Meeting was also held to consider the election of 5 directors to the Meridian Funds’ Board of Directors, each to hold office for an indefinite term. Shareholders of the Equity Income Fund approved the new Management Agreement with the Adviser on June 19, 2012. Shareholders of the Meridian Funds also elected the Directors to the Board on June 19, 2012. The Meeting, as it related to each of the Growth Fund’s and the Value Fund’s approval of the new Management Agreement, was adjourned until July 10, 2012, at which time the proposals were approved by shareholders of each such Fund. The following votes were recorded:
PROPOSAL 1: Election of 5 directors to the Board of Directors of the Meridian Funds.
NOMINEE | SHARES VOTED | % VOTED | % OF TOTAL | |||||
| John S. Emrich | FOR | 55,356,776.028 | 96.206% | 65.135% | ||||
| WITHHELD | 2,183,575.181 | 3.794% | 2.569% | |||||
| Michael S. Erickson | FOR | 55,494,347.527 | 96.445% | 65.297% | ||||
| WITHHELD | 2,046,003.682 | 3.555% | 2.407% | |||||
| James B. Glavin | FOR | 55,399,128.186 | 96.279% | 65.185% | ||||
| WITHHELD | 2,141,223.023 | 3.721% | 2.519% | |||||
| Ronald Rotter | FOR | 55,435,271.930 | 96.342% | 65.228% | ||||
| WITHHELD | 2,105,079.279 | 3.658% | 2.476% | |||||
| Michael Stolper | FOR | 55,353,744.654 | 96.200% | 65.132% | ||||
| WITHHELD | 2,186,606.555 | 3.800% | 2.572% |
PROPOSAL 2: Approval of a new Management Agreement with the Adviser.
FUNDS | SHARES VOTED | % OF VOTED | % OF TOTAL | |||||
| Meridian Equity Income Fund | FOR | 2,724,133.870 | 96.927% | 84.030% | ||||
| AGAINST | 9,235.909 | 0.329% | 0.285% | |||||
| ABSTAIN | 12,079.011 | 0.429% | 0.372% | |||||
| BROKER NON-VOTE | 65,074.534 | 2.315% | 2.007% | |||||
| Meridian Growth Fund | FOR | 25,165,083.196 | 71.174% | 43.115% | ||||
| AGAINST | 506,415.930 | 1.433% | 0.867% | |||||
| ABSTAIN | 815,263.978 | 2.305% | 1.397% | |||||
| BROKER NON-VOTE | 8,870,659.801 | 25.088% | 15.198% | |||||
| Meridian Value Fund | FOR | 10,590,978.590 | 69.298% | 45.304% | ||||
| AGAINST | 314,778.256 | 2.060% | 1.346% | |||||
| ABSTAIN | 509,731.995 | 3.335% | 2.180% | |||||
| BROKER NON-VOTE | 3,867,793.955 | 25.307% | 16.545% |
39
Board Consideration of Proposed Management
Agreement (unaudited)
At a meeting held on April 13, 2012, the Directors of the Funds, including a majority of the Non-Interested Directors, unanimously approved the proposed management agreement (the “Proposed Management Agreement”) for each Fund and determined to recommend that shareholders of each Fund approve the Proposed Management Agreement.
In preparation for the meeting, the Directors received and evaluated information supplied by the Adviser in response to a request letter addressed to the Adviser by Fund counsel, at the Board’s request, which identified items that should be provided in order for the Directors to gain reasonable assurance that they have sufficiently considered all relevant and required information related to approval of the Proposed Management Agreement for each Fund. The Directors noted that they oversee on a continuous basis, including at a meeting held on October 5, 2011 when they most recently re-approved the Previous Management Agreements, the nature and quality of the services provided by the Adviser, the investment performance of the Funds, compliance functions and a variety of other matters relating to the Funds’ operations. The Directors emphasized that, in light of Mr. Aster’s death and the Transfer, it was critical that they confirm the Adviser’s ability to continue to manage the Funds under the current circumstances.
The Directors examined and considered, among other items, performance and expense information of other retail and institutional investment companies with similar objectives, derived from data compiled by an independent third-party provider, as well as other information received from the Adviser and, in particular, reports and information from the Adviser regarding the Adviser’s capabilities following the death of Mr. Aster.
Prior to voting to approve the Proposed Management Agreement with respect to each of the Funds, the Non-Interested Directors also met in a private session at which the interested Director and the representatives of the Adviser were not present. In the process of making their determinations, the Directors considered factors they believed relevant to the selection of the Adviser, the approval of the fee structures and amounts to be paid under the Proposed Management Agreement. The Directors based their determinations on a comprehensive consideration of all information presented to, and/or requested by, them and such determinations were not disproportionately influenced by any single controlling factor. The Directors evaluated all information available to them for each of the Funds, and their determinations were made separately in respect of each Fund. Some of the factors considered are discussed in more detail below.
The Board considered alternatives to approving the Proposed Management Agreement, including whether to appoint a different investment adviser. While the Board was mindful of the potential disruptions of the Funds’ operations and various risks, uncertainties and other effects that could occur as a result of a decision not to continue such relationship, its primary focus was on confirming the Adviser’s continued ability to manage the Funds. After considering all information presented, the Board determined that approving the Proposed Management Agreement was in the best interests of each Fund and its shareholders, despite the availability of alternatives.
40
Board Consideration of Proposed Management
Agreement (unaudited) (continued)
Nature, Extent and Quality of Services
The Directors considered the nature, extent and quality of the investment research and portfolio management functions of the Adviser and the resources dedicated by the Adviser and the resources expected to continue to be dedicated in performing services for the Funds. In light of Mr. Aster’s death, in evaluating whether to approve the Proposed Management Agreement, the Board met with each of the investment management professionals at the Adviser and evaluated their backgrounds, qualifications and experiences. The Board noted that the individuals at the Adviser, who assumed the primary portfolio management responsibilities for the Funds upon Mr. Aster’s death, have served as key members of the investment management team at the Adviser for a number of years. The Directors also considered the operational structure and status of the Adviser. They noted that, while Mr. Aster was the President of the Adviser, other key personnel had extensive experience managing the day-to-day administrative and financial operations of the Adviser.
The Directors also considered the respective investment strategies of the Funds and noted favorably the Adviser’s demonstrated ability, over time, to achieve a competitive rate of return for long-term investors. The Directors considered the Adviser’s ability to provide other services, including the Adviser’s assistance in the coordination of the activities of the Funds relating to other service providers, fund administration and compliance programs. Based on the above factors, together with those referenced below, the Directors concluded that, in all material respects, they were satisfied with the nature, extent and quality of services provided, and expected to be provided, to the Funds under the Proposed Management Agreement.
Performance
The Directors reviewed the performance of the Funds. The Directors considered historical performance information, as well as recent performance since the death of Mr. Aster, which the Directors recognized was for a short period of time. The Directors noted that, while the Value Fund’s one- and three-year performance trailed the performance index comprising all retail and institutional funds within its investment category as determined by an independent third-party provider (“performance universe”) over the longer five- and ten-year periods the Value Fund outperformed its performance universe. The Directors also noted that the Equity Income Fund and the Growth Fund outperformed their respective performance universe over each of the applicable one-, three-, five- and ten-year time periods.
In addition to the information reviewed by the Directors during their meeting, the Directors received detailed monthly performance reports for the Funds throughout the year. These reports present the Funds’ performance in comparison to both broad market and peer group indices. The Directors noted that the Adviser’s management of the Funds’ investment portfolios had resulted in competitive performance overall and, in particular, solid returns for long-term investors. The Directors also considered reports from the Adviser indicating that the Funds were continuing to be managed according to the same process and strategies that were in place under the Previous Management Agreements.
41
Board Consideration of Proposed Management
Agreement (unaudited) (continued)
Fees, Cost of the Advisory Services and Profitability
In connection with the Board’s review of the level of the advisory fee rates under the Proposed Management Agreement, the Board considered a variety of factors. The Board noted that the fee rates under the Proposed Management Agreement were identical to those under the Previous Management Agreements. The Board’s analysis and review of each Fund’s advisory fee and estimated expenses included a discussion and review of data concerning the current fee and expense ratios of each Fund compared to their respective peer group. The Board noted that each Fund’s advisory fee and expense ratio were generally in line with those of their peer group. The Board also noted the advisory fee breakpoints for the Growth Fund and the Equity Income Fund as well as applicable fee waiver commitments.
The Directors also considered the existing and projected direct and indirect costs of the Adviser in providing investment management services for the Funds.
The Directors considered the profits being realized by the Adviser from its relationship with the Funds. The Directors, in exercising their business judgment, with consideration duly given to, among other things, the nature and quality of services provided, the solid long-term performance of the Funds, investment industry practices and comparable funds’ average fee expense, determined using independent third party data, did not deem the profits the Adviser received from providing services to the Funds to be unreasonable. The Directors recognized that it is difficult to make comparisons of profitability from investment advisory contracts. This is because comparative information is not generally publicly available and is affected by numerous factors, including the structure of the particular adviser, the type of clients it advises, its business mix, and numerous assumptions regarding allocations and the adviser’s capital and management structure.
Economies of Scale
The Directors considered the information provided by the Adviser relating to economies of scale. While intending to monitor future Fund assets, and the extent that economies of scale are realized, the Directors noted that current advisory fee levels and applicable fee waiver arrangements reflect an equitable sharing of benefits with shareholders.
Ancillary Benefits and other Factors
The Directors additionally considered certain benefits the Adviser realizes due to its relationship with the Funds. In particular, the Adviser has arrangements under which certain brokers may provide industry research to the Adviser’s portfolio managers through the use of a portion of the brokerage commissions generated from the Adviser’s trading activities on behalf of the Funds. Under this arrangement, the Directors believe that the Funds’ shareholders benefit as well from these research products paid for through broker commissions and soft dollar arrangements.
42
Board Consideration of Proposed Management
Agreement (unaudited) (continued)
Conclusion
After an evaluation of the above-described factors, and based on their deliberations and analysis of the information provided and alternatives considered, the Directors, including all of the Non-Interested Directors, unanimously approved the Proposed Management Agreement for each Fund.
43
Meridian Fund, Inc.
Additional Information (Unaudited)
For the Year Ended June 30, 2012
| 1. | Proxy Voting Record and Proxy Voting Policies and Procedures: A description of the policies and procedures that each Fund uses to determine how to vote proxies relating to portfolio securities along with information regarding how the Fund voted proxies relating to portfolio securities during the most recent 12 month period ended June 30 is available (i) without charge, upon request, by calling (800) 446-6662; (ii) on our website at http://www.meridianfund.com; and (iii) on the Securities and Exchange Commission (“SEC”) website at http://www.sec.gov. |
| 2. | Information on Form N-Q: The Company files its complete schedule of portfolio holdings with the SEC for the first and third quarters of each fiscal year on Form N-Q within sixty days after the end of the period. The Company’s Form N-Q is available on the SEC’s website at http://www.sec.gov, and may be reviewed and copied at the SEC’s Public Reference Room in Washington, DC. Information on the operation of the Public Reference Room may be obtained by calling (800) 732-0330. |
44
Information About the Directors and
Officers of Meridian Fund, Inc.
The individuals listed below serve as directors or officers of Meridian Fund, Inc. (the “Meridian Funds”). Each director of the Meridian Funds serves until a successor is elected and qualified or until resignation. Each officer of the Meridian Funds is elected annually by the Board of Directors. The address of all officers and directors is 60 East Sir Francis Drake Blvd., Suite 306, Larkspur, CA 94939. The Meridian Funds’ Statement of Additional Information (SAI) includes more information about the Directors. To request a free copy, call Meridian at 1-800-446-6662.
Interested Director *
Michael Stolper (67)
Positions(s) Held with Fund: Director
Length of Service (Beginning Date): May 3, 1985
Principal Occupation(s) During Past 5 Years: President, Stolper & Company, Inc., an investment adviser and broker dealer; Director since April 2012 and Acting Chief Executive Officer since June 2012, Aster Investment Management Co., Inc.; Trustee, Ewing Marion Kauffman Foundation, March 2010 to present
Number of Portfolios Overseen: 3
Other Directorships: Windowpane Funds
| * | Aster Investment Management Co., Inc. is investment adviser to the Meridian Funds. |
| Mr. | Stolper is a minority owner of Aster Investment Management Co., Inc. |
45
Information About the Directors and
Officers of Meridian Fund, Inc. (continued)
Independent Directors
Ronald Rotter (69)
Positions(s) Held with Fund: Director
Length of Service (Beginning Date): May 2, 2007
Principal Occupation(s) During Past 5 Years: Co-founder, Managing Partner and Portfolio Manager, RBR Capital Management; Private Investor
Number of Portfolios Overseen: 3
Other Directorships: N/A
Michael S. Erickson (60)
Positions(s) Held with Fund: Director
Length of Service (Beginning Date): May 3, 1985
Principal Occupation(s) During Past 5 Years: Private Investor; Trustee and Treasurer, The Marin School.
Number of Portfolios Overseen: 3
Other Directorships: N/A
James Bernard Glavin (77)
Positions(s) Held with Fund: Director and Chairman of the Board
Length of Service (Beginning Date): May 3, 1985
Principal Occupation(s) During Past 5 Years: Chairman of the Board, Orchestra Therapeutics, Inc.
Number of Portfolios Overseen: 3
Other Directorships: N/A
John S. Emrich, CFA (44)
Positions(s) Held with Fund: Director
Length of Service (Beginning Date): October 6, 2010
Principal Occupation(s) During Past 5 Years: Co-founder and Portfolio Manager, Ironworks Capital Management; Member and Manager, Iroquois Valley Farms, LLC
Number of Portfolios Overseen: 3
Other Directorships: N/A
Officers
Gregg B. Keeling, CPA (57)
Positions(s) Held with Fund: Chief Financial Officer, Treasurer, Secretary, Chief Compliance Officer and
Acting President, (Principal Executive Officer), since February 2012
Length of Service: (Beginning Date) April 1999
Principal Occupation(s) During Past 5 Years: Aster Investment Management Co., Inc.,
Vice President of Operations, Principal Financial and Accounting Officer and Chief Compliance Officer
46
2012 TAX NOTICE TO SHAREHOLDERS (Unaudited)
The information set forth below is for each Fund’s fiscal year as required by federal laws. Shareholders, however, must report distributions on a calendar year basis for income tax purposes, which may include distributions for portions of two fiscal years of a fund. Accordingly, the information needed by shareholders for income tax purposes will be sent to them in early 2013. Please consult your tax advisor for proper treatment of this information.
For the period July 1, 2011 to June 30, 2012 the Funds reported the following terms with regard to distributions paid during the period. All information is based on financial information available as of the date of this annual report and, accordingly, is subject to change. For each item, it is the intention of each Fund to report the maximum amount permitted under the Internal Revenue Code and the regulations thereunder.
Pursuant to Internal Revenue Code Section 852(b)(3), the Growth Fund reported the amount $178,576,329 as a long-term capital gain distribution for the year ended June 30, 2012.
Pursuant to Internal Revenue Code Section 854(b)(2), the Funds listed below report a percentage of their ordinary income dividends distributed during the year ended June 30, 2012 as qualifying for the corporate dividends-received deduction:
Equity Income Fund | 100.00 | % | ||
Growth Fund | 100.00 | % | ||
Value Fund | 100.00 | % |
Pursuant to Section I (h)(11) of the Internal Revenue Code, the Funds listed below report the following amounts of their income dividends paid during the year ended June 30, 2012 as qualified dividend income (QDI):
Equity Income Fund | 100.00 | % | ||
Growth Fund | 100.00 | % | ||
Value Fund | 100.00 | % |
U.S. Government interest represents the amount of interest that was derived from direct U.S. Government obligations and distributed during the fiscal year. This amount is reflected as a percentage of total ordinary income distributions (the total of short-term capital gain and net investment income distributions). Generally, interest from direct U.S. Government obligations is exempt from state income tax. However, for residents of California, Connecticut and New York, the statutory threshold requirements were not satisfied to permit exception of these amounts from state income for the Funds.
U.S Government interest:
Equity Income Fund | 0.00 | % | ||
Growth Fund | 0.16 | % | ||
Value Fund | 0.25 | % |
47
MERIDIAN FUND, INC.
This report is submitted for
the information of shareholders of
Meridian Fund, Inc. It is not
authorized for distribution to
prospective investors unless
preceded or accompanied by an
effective prospectus.
Officers and Directors
JOHN EMRICH
MICHAEL S. ERICKSON
JAMES B. GLAVIN
RONALD ROTTER
MICHAEL STOLPER
Directors
GREGG B. KEELING
Acting President
Chief Financial Officer
Treasurer, Secretary and
Chief Compliance Officer
Custodian
THE BANK OF NEW YORK MELLON
New York, New York
Transfer Agent and Disbursing Agent
BNY MELLON INVESTMENT SERVICING (US) INC.
King of Prussia, Pennsylvania
(800) 446-6662
Counsel
GOODWIN PROCTER LLP
Washington, D.C.
Independent Registered Public Accounting Firm
PRICEWATERHOUSECOOPERS LLP
San Francisco, California
MERIDIAN EQUITY INCOME FUND®
MERIDIAN GROWTH FUND®
MERIDIAN VALUE FUND®
ANNUAL REPORT

60 E. Sir Francis Drake Blvd.
Wood Island, Suite 306
Larkspur, CA 94939
www.meridianfund.com
Telephone (800) 446-6662
June 30, 2012
| Item 2. | Code of Ethics. |
| (a) | The registrant, as of the end of the period covered by this report, has adopted a code of ethics that applies to the registrant’s principal executive officer, principal financial officer, principal accounting officer or controller, or persons performing similar functions, regardless of whether these individuals are employed by the registrant or a third party. |
| (c) | There have been no amendments, during the period covered by this report, to a provision of the code of ethics that applies to the registrant’s principal executive officer, principal financial officer, principal accounting officer or controller, or persons performing similar functions, regardless of whether these individuals are employed by the registrant or a third party, and that relates to any element of the code of ethics description. |
| (d) | The registrant has not granted any waivers, including an implicit waiver, from a provision of the code of ethics that applies to the registrant’s principal executive officer, principal financial officer, principal accounting officer or controller, or persons performing similar functions, regardless of whether these individuals are employed by the registrant or a third party, that relates to one or more of the items set forth in paragraph (b) of this item’s instructions. |
| Item 3. | Audit Committee Financial Expert. |
As of the end of the period covered by the report, the registrant’s board of directors has determined that James Glavin is qualified to serve as an audit committee financial expert serving on its audit committee and that he is “independent,” as defined by Item 3 of Form N-CSR.
| Item 4. | Principal Accountant Fees and Services. |
Audit Fees
| (a) | The aggregate fees billed for each of the last two fiscal years for professional services rendered by the principal accountant for the audit of the registrant’s annual financial statements or services that are normally provided by the accountant in connection with statutory and regulatory filings or engagements for those fiscal years are $95,100 in 2012 and $91,880 in 2011. |
Audit-Related Fees
| (b) | The aggregate fees billed in each of the last two fiscal years for assurance and related services by the principal accountant that are reasonably related to the performance of the audit of the registrant’s financial statements and are not reported under paragraph (a) of this Item are $0 in 2012 and $0 in 2011. |
Tax Fees
| (c) | The aggregate fees billed in each of the last two fiscal years for professional services rendered by the principal accountant for tax compliance, tax advice, and tax planning are $21,900 in 2012 and $21,210 in 2011. |
All Other Fees
| (d) | The aggregate fees billed in each of the last two fiscal years for products and services provided by the principal accountant, other than the services reported in paragraphs (a) through (c) of this Item are $0 in 2012 and $0 in 2011. |
| (e)(1) | Disclose the audit committee’s pre-approval policies and procedures described in paragraph (c)(7) of Rule 2-01 of Regulation S-X. |
PRE-APPROVAL OF AUDIT AND PERMITTED NON-AUDIT SERVICES PROVIDED TO
THE COMPANY
| 1. | Pre-Approval Requirements. The Committee shall pre-approve all auditing services and permissible non-audit services (e.g., tax services) to be provided to the Company by the Auditor, including the fees therefore. The Committee may delegate to one or more of its members the authority to grant pre-approvals. In connection with such delegation, the Committee shall establish pre-approval policies and procedures, including the requirement that the decisions of any member to whom authority is delegated under this section shall be presented to the full Committee at each of its scheduled meetings. |
| 2. | De Minimis Exception to Pre-Approval: Pre-approval for a permitted non-audit service shall not be required if: |
| a. | the aggregate amount of all such non-audit services is not more than 5% of the total revenues paid by the Company to the Auditor in the fiscal year in which the non-audit services are provided; |
| b. | such services were not recognized by the Company at the time of the engagement to be non-audit services; and |
| c. | such services are promptly brought to the attention of the Committee and approved prior to the completion of the audit by the Committee or by one or more members of the Committee to whom authority to grant such approvals has been delegated by the Committee. |
Additionally, the Committee shall pre-approve the Auditor’s engagements for non-audit services with the Adviser and any affiliate of the Adviser that provides ongoing services to the Company in accordance with the foregoing, if the engagement relates directly to the operations and financial reporting of the Company, unless the aggregate amount of all services provided constitutes no more than 5% of the total amount of revenues paid to the Auditor by the Company, the Adviser and any affiliate of the Adviser that provides ongoing services to the Company during the fiscal year in which the services are provided that would have to be pre-approved by the Committee pursuant to this paragraph (without regard to this exception).
PROHIBITED SERVICES
The Committee shall confirm with the Auditor engaged to perform the audit of the Company that the Auditor is not performing contemporaneously any of the following non-audit services for the Company, the Adviser, or any affiliates of the Company or Adviser:
| 1. | bookkeeping or other services related to the accounting records or financial statements of the Company; |
| 2. | financial information systems design and implementation; |
| 3. | appraisal or valuation services, fairness opinions, or contribution-in-kind reports; |
| 4. | actuarial services; |
| 5. | internal audit outsourcing services; |
| 6. | management functions or human resources; |
| 7. | broker or dealer, investment adviser, or investment banking services; |
| 8. | legal services and expert services unrelated to the audit; and |
| 9. | any other service that the Public Company Accounting Oversight Board determines, by regulation, is impermissible. |
The Auditor is responsible for informing the Committee of whether it believes that a particular service is permissible or prohibited pursuant to applicable regulations and standards.
| (e)(2) | The percentage of services described in each of paragraphs (b) through (d) of this Item that were approved by the audit committee pursuant to paragraph (c)(7)(i)(C) of Rule 2-01 of Regulation S-X are as follows: |
| (b) | N/A |
| (c) | 100% |
| (d) | N/A |
| (f) | The percentage of hours expended on the principal accountant’s engagement to audit the registrant’s financial statements for the most recent fiscal year that were attributed to work performed by persons other than the principal accountant’s full-time, permanent employees was less than fifty percent. |
| (g) | The aggregate non-audit fees billed by the registrant’s accountant for services rendered to the registrant, and rendered to the registrant’s investment adviser (not including any sub-adviser whose role is primarily portfolio management and is subcontracted with or overseen by another investment adviser), and any entity controlling, controlled by, or under common control with the adviser that provides ongoing services to the registrant for each of the last two fiscal years of the registrant was $0 in 2012 and $0 in 2011. |
| (h) | Not applicable. |
| Item 5. | Audit Committee of Listed registrants. |
Not applicable.
| Item 6. | Investments. |
| (a) | Schedule of Investments in securities of unaffiliated issuers as of the close of the reporting period is included as part of the report to shareholders filed under Item 1 of this form. |
| (b) | Not applicable. |
| Item 7. | Disclosure of Proxy Voting Policies and Procedures for Closed-End Management Investment Companies. |
Not applicable.
| Item 8. | Portfolio Managers of Closed-End Management Investment Companies. |
Not applicable.
| Item 9. | Purchases of Equity Securities by Closed-End Management Investment Company and Affiliated Purchasers. |
Not applicable.
| Item 10. | Submission of Matters to a Vote of Security Holders. |
There have been no material changes to the procedures by which the shareholders may recommend nominees to the registrant’s board of directors, where those changes were implemented after the registrant last provided disclosure in response to the requirements of Item 407(c)(2)(iv) of Regulation S-K (17 CFR 229.407) (as required by Item 22(b)(15) of Schedule 14A (17 CFR 240.14a-101)), or this Item.
| Item 11. | Controls and Procedures. |
| (a) | The registrant’s principal executive and principal financial officers, or persons performing similar functions, have concluded that the registrant’s disclosure controls and procedures (as defined in Rule 30a-3(c) under the Investment Company Act of 1940, as amended (the “1940 |
Act”) (17 CFR 270.30a-3(c))) are effective, as of a date within 90 days of the filing date of the report that includes the disclosure required by this paragraph, based on their evaluation of these controls and procedures required by Rule 30a-3(b) under the 1940 Act (17 CFR 270.30a-3(b)) and Rules 13a-15(b) or 15d-15(b) under the Securities Exchange Act of 1934, as amended (17 CFR 240.13a-15(b) or 240.15d-15(b)).
| (b) | There were no changes in the registrant’s internal control over financial reporting (as defined in Rule 30a-3(d) under the 1940 Act (17 CFR 270.30a-3(d)) that occurred during the period covered by this report that has materially affected, or is reasonably likely to materially affect, the registrant’s internal control over financial reporting. |
| Item 12. | Exhibits. |
| (a)(1) | Code of ethics that is the subject of disclosure required by Item 2 was included as Exhibit (a)(1) of the registrant’s Form N-CSR filed on August 31, 2009 (Accession No. 0000950123-09-039788), and is hereby incorporated by reference. |
| (a)(2) | Certifications pursuant to Rule 30a-2(a) under the 1940 Act and Section 302 of the Sarbanes-Oxley Act of 2002 are attached hereto. |
| (a)(3) | Not applicable. |
| (b) | Certifications pursuant to Rule 30a-2(b) under the 1940 Act and Section 906 of the Sarbanes- Oxley Act of 2002 are attached hereto. |
SIGNATURES
Pursuant to the requirements of the Securities Exchange Act of 1934 and the Investment Company Act of 1940, the registrant has duly caused this report to be signed on its behalf by the undersigned, thereunto duly authorized.
| (registrant) | Meridian Fund, Inc.® | |
| By (Signature and Title)* | /s/ Gregg B. Keeling | |
Gregg B. Keeling, Acting President, CFO & Treasurer (principal executive officer and principal financial officer) | ||
| Date | 8/28/12 | |
Pursuant to the requirements of the Securities Exchange Act of 1934 and the Investment Company Act of 1940, this report has been signed below by the following persons on behalf of the registrant and in the capacities and on the dates indicated.
| By (Signature and Title)* | /s/ Gregg B. Keeling | |
Gregg B. Keeling, Acting President, CFO & Treasurer (principal executive officer and principal financial officer) | ||
| Date | 8/28/12 | |
| * | Print the name and title of each signing officer under his or her signature. |