Table of Contents
UNITED STATES
SECURITIES AND EXCHANGE COMMISSION
Washington, D.C. 20549
FORM N-CSR
CERTIFIED SHAREHOLDER REPORT OF REGISTERED
MANAGEMENT INVESTMENT COMPANIES
Investment Company Act file number 811-04014
Meridian Fund, Inc.®
(Exact name of registrant as specified in charter)
100 Fillmore Street, Suite 325
Denver, CO 80206
(Address of principal executive offices) (Zip code)
David J. Corkins
100 Fillmore Street, Suite 325
Denver, CO 80206
(Name and address of agent for service)
Registrant’s telephone number, including area code: 303-398-2929
Date of fiscal year end: June 30
Date of reporting period: June 30, 2015
Table of Contents
Item 1. Reports to Stockholders.
The Report to Shareholders is attached herewith.
Table of Contents


Table of Contents
Table of Contents
Table of Contents
Portfolio Performance and Composition (Unaudited)
| • | Cimpress provides marketing products and services through the Internet to small and micro businesses. The company returned 108% over the one-year period due to organic revenue growth, which has accelerated for each of the last four quarters, and to the expansion of net margins. These factors, in addition to attractive acquisitions, have resulted in adjusted earnings-per-share doubling over the past two years even in the face of headwinds from currency exposures. We reduced our position during the period as the risk-reward profile for the company has become less favorable. |
| • | Carter’s is a leading manufacturer and retailer of infant and toddler apparel. The company continues to benefit from stable demand and solid execution, which has led to double-digit earnings growth. Key drivers of performance for Carter’s include continued store growth, e-commerce initiatives, improved OshKosh fundamentals and international expansion. We reduced the position as the company returned 56% over the period. |
| • | SS&C Technologies is a technology provider to the financial services industry. The company returned 42% over the one-year period. SS&C has continued to create shareholder value through its acquisition strategy – with two acquisitions being announced in the last 12 months. The most recent acquisition, Advent Software, is the largest in the company’s history. We continue to like the stability of the company’s revenues, especially now that approximately 92% of total revenues are recurring in nature. We reduced the position size, as the earnings-per-share multiple has expanded and the share price has approached our estimate of fair value. |
| • | Stratasys is a 3-D printing company that specializes in rapid prototyping and additive manufacturing solutions. The company continues to invest in channel development, which has put near-term pressure on margins and |
| Meridian Funds | 4 | www.meridianfund.com |
Table of Contents
Portfolio Performance and Composition (Unaudited) (continued)
| earnings. Given the nascent industry, we believe these investments will generate attractive long-term returns. Our investment thesis is supported by continued market share gains, a solid balance sheet and robust consumable revenue growth. We added to the position during the period. | |
| • | CHC Group is a helicopter service company that specializes in transportation to offshore oil and gas platforms. The company underperformed over the past year due to continued low oil prices and declining activity in the offshore segment of the market. We believe the company is still well-positioned for the long term, but its exposure to large exploration and production companies will likely continue to be a drag on performance in the short term. We maintained our position. |
| • | RigNet provides communication- and network-based services to the oil and gas industry, specifically offshore drilling rigs. The market’s concern with the decline in offshore drilling activity negatively impacted share price performance. The outlook this year for the oil and gas industry remains difficult to predict; however, we have conviction that RigNet can still grow at a positive rate based on the recurring revenue from service contracts. We added to the position during the period. |
| Meridian Funds | 5 | www.meridianfund.com |
Table of Contents
Portfolio Performance and Composition (Unaudited) (continued)
| Share Class | Inception | 1 Year | 5 Year | 10 Year | Since Inception |
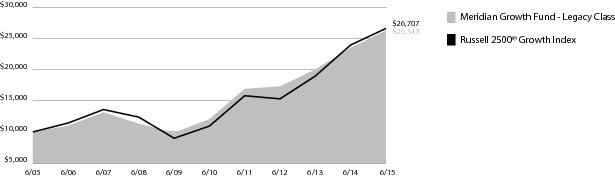
| Legacy Class (MERDX) | 8/1/84 | 11.85% | 16.89% | 10.17% | 12.76% |
| Investor Class (MRIGX) | 11/15/13 | 11.56% | — | — | 10.84% |
| Advisor Class (MRAGX) | 11/15/13 | 11.08% | — | — | 10.44% |
| Institutional Class (MRRGX) | 12/24/14 | — | — | — | 3.70% |
| Russell 2500® Growth Index | 8/1/84 | 11.30% | 19.55% | 10.32% | N/A |
| Meridian Funds | 6 | www.meridianfund.com |
Table of Contents
Portfolio Performance and Composition (Unaudited) (continued)
6.30.15
| Cadence Design Systems, Inc. | 2.95% |
| LPL Financial Holdings, Inc. | 2.90% |
| Clean Harbors, Inc. | 2.86% |
| National CineMedia, Inc. | 2.29% |
| Solera Holdings, Inc. | 2.26% |
| CEB, Inc. | 2.16% |
| Carter's, Inc. | 2.09% |
| ServiceMaster Global Holdings, Inc. | 2.01% |
| HEICO Corp. Class A | 1.99% |
| RigNet, Inc. | 1.95% |

| Meridian Funds | 7 | www.meridianfund.com |
Table of Contents
Portfolio Performance and Composition (Unaudited)
| • | Neurocrine Biosciences is a pharmaceutical company with two development-stage programs focused on neurological and endocrine-based health problems. The company came to our attention after poor clinical trial results for one of its programs resulted in a 40% reduction in the share price. We invested because the issues with the trial were related to trial design, not drug efficacy. Management presented a credible plan for addressing the design issues, and the company’s valuation was capturing only a fraction of the potential cash flows that could be generated by both drug programs. Over the past year, both of Neurocrine’s drug programs have delivered strong clinical trial results and are on track for commercialization, which may drive significant earnings and cash flow growth. We have reduced our position somewhat over the past year due to the strong appreciation in share price but continue to hold shares in Neurocrine Biosciences. |
| • | ServiceMaster Global Holdings is a leading provider of termite and pest control services, home warranties and other residential services. The company had problems with marketing and service missteps at its lawn care division, which is no longer part of the company. We invested in ServiceMaster because of its dominant positions in fragmented markets, including 40% market share in home warranties, and consistent sales growth, driven by 80% customer retention and share gains from smaller competitors. The stock outperformed over the past year, as earnings results showed continued revenue growth and much better than expected profit margins driven by cost- |
| Meridian Funds | 8 | www.meridianfund.com |
Table of Contents
Portfolio Performance and Composition (Unaudited) (continued)
| saving initiatives, lower fuel costs and product mix. We remain ServiceMaster shareholders as its business continues to improve and the sectors in which it operates remain attractive. We maintain a significant position in ServiceMaster though we have reduced our position, as the valuation multiple has increased significantly since our initial investment. | |
| • | Denny’s is an iconic casual dining chain with approximately 1,500 franchises and 160 company-owned restaurants. The company came across our contrarian screens repeatedly during years of decline under a series of previous management teams. We invested in 2011 when strong new management took over with a coherent turnaround plan. Denny’s made solid progress, stabilizing the business with menu and marketing improvements and using solid free-cash flow to pay down debt, repurchase shares and fund a successful restaurant remodel program, though sales growth remained subdued. An inflection point came in 2014 as sales improved significantly, aided by lower gas prices that alleviated pressure on Denny’s core customer. This is a trend that accelerated through the remainder of the year and has held up in 2015. We remain shareholders though we reduced our position significantly due to the rise in the stock. |
| Meridian Funds | 9 | www.meridianfund.com |
Table of Contents
Portfolio Performance and Composition (Unaudited) (continued)
| Share Class | Inception | 1 Year | 5 Year | 10 Year | Since Inception |
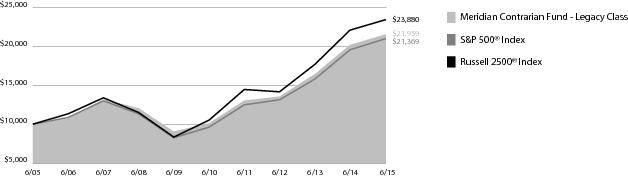
| Legacy Class (MVALX) | 2/10/94 | 6.84% | 16.79% | 8.19% | 13.22% |
| Investor Class (MFCIX) | 11/15/13 | 6.67% | — | — | 8.54% |
| Advisor Class (MFCAX) | 11/15/13 | 6.38% | — | — | 8.26% |
| Russell 2500® Index | 2/10/94 | 5.92% | 17.85% | 9.09% | 10.46% |
| S&P 500® Index * | 2/10/94 | 7.41% | 17.33% | 7.89% | 9.12% |
| Meridian Funds | 10 | www.meridianfund.com |
Table of Contents
Portfolio Composition (Unaudited)
6.30.15
| LKQ Corp. | 2.51% |
| Pfizer, Inc. | 2.48% |
| Bank of Hawaii Corp. | 2.43% |
| Hologic, Inc. | 2.35% |
| Gildan Activewear, Inc. (Canada) | 2.31% |
| Microsoft Corp. | 2.25% |
| NVIDIA Corp. | 2.17% |
| CACI International, Inc. Class A | 2.17% |
| Verint Systems, Inc. | 2.09% |
| Alexander & Baldwin, Inc. | 1.94% |
| Meridian Funds | 11 | www.meridianfund.com |
Table of Contents
Portfolio Performance and Composition (Unaudited)
| Meridian Funds | 12 | www.meridianfund.com |
Table of Contents
Portfolio Performance and Composition (Unaudited) (continued)
| • | Health and Wellness |
| • | Defense / Homeland Security / Cyberwarfare |
| Meridian Funds | 13 | www.meridianfund.com |
Table of Contents
Portfolio Performance and Composition (Unaudited) (continued)
| Meridian Funds | 14 | www.meridianfund.com |
Table of Contents
Portfolio Performance and Composition (Unaudited) (continued)


| Meridian Funds | 15 | www.meridianfund.com |
Table of Contents
Portfolio Performance and Composition (Unaudited) (continued)

| Share Class | Inception | 1 Year | 5 Year | 10 Year | Since Inception |
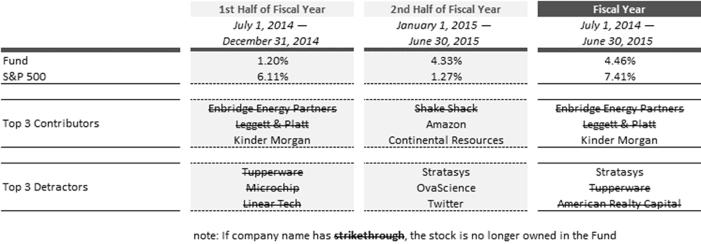
| Legacy Class (MEIFX) | 1/31/05 | 4.46% | 14.24% | 7.41% | 7.21% |
| Investor Class (MRIEX) | 11/15/13 | 4.44% | — | — | 7.01% |
| Advisor Class (MRAEX) | 11/15/13 | 4.24% | — | — | 6.77% |
| S&P 500® Index | 1/31/05 | 7.41% | 17.33% | 7.89% | 7.73% |
| Meridian Funds | 16 | www.meridianfund.com |
Table of Contents
Portfolio Performance and Composition (Unaudited) (continued)
| Meridian Funds | 17 | www.meridianfund.com |
Table of Contents
Portfolio Composition (Unaudited)
6.30.15
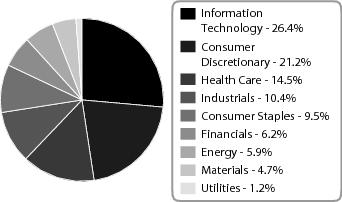
| Apple, Inc. | 4.23% |
| Microsoft Corp. | 2.45% |
| Amazon.com, Inc. | 2.33% |
| Gilead Sciences, Inc. | 2.30% |
| Starbucks Corp. | 2.09% |
| Walt Disney Co. (The) | 2.05% |
| Google, Inc. Class A | 2.00% |
| NIKE Class B | 2.00% |
| Costco Wholesale Corp. | 1.99% |
| Equifax, Inc. | 1.94% |
| Meridian Funds | 18 | www.meridianfund.com |
Table of Contents
Portfolio Performance and Composition (Unaudited)
| • | Cimpress provides marketing products and services through the Internet to small and micro businesses. The company returned 108% over the one-year period due to organic revenue growth, which has accelerated for each of the last four quarters, and to the expansion of net margins. These factors, in addition to attractive acquisitions, have resulted in adjusted earnings-per-share doubling over the past two years even in the face of headwinds from currency exposures. We reduced our position over the period as the risk-reward profile for the company has become less favorable. |
| • | 2U Inc. is a leading technology company that helps enable top colleges and universities to develop and deliver online degree programs. 2U’s business development, growth and profit targets continue to track at or ahead of plan and should continue to scale higher as the company delivers on its expansion strategy. We increased our position during the year given the company’s large addressable market, limited competition and solid execution. |
| • | ServiceMaster provides essential residential and commercial services primarily through its Terminix (termite and pest control) and American Home Shield (home warranty) brands. We like the stability and pricing power in both of these businesses which provide essential services for homeowners. In its first year as a public company, ServiceMaster executed well, with revenue up 7% and EBITDA up 16% in the most recently reported quarter. We increased our position over the past 12 months and the company returned 98% over the period. |
| • | RigNet provides communication- and network-based services to the oil and gas industry, specifically offshore drilling rigs. The market’s concern with the decline in offshore drilling activity negatively impacted share price performance. The outlook this year for the oil and gas industry remains difficult to predict; however, we have conviction that RigNet can still grow at a positive rate based on the recurring revenue from service contracts. We added to the position during the period. |
| • | Stratasys is a 3-D printing company that specializes in rapid prototyping and additive manufacturing solutions. The company continues to invest in channel development, which has put near-term pressure on margins and |
| Meridian Funds | 19 | www.meridianfund.com |
Table of Contents
Portfolio Performance and Composition (Unaudited) (continued)
| earnings. Given the nascent industry, we believe these investments will generate attractive long-term returns. Our investment thesis is supported by continued market share gains, a solid balance sheet and robust consumable revenue growth. We added to the position during the period. | |
| • | Evolution Petroleum is a small oil exploration and production company that uses technology to increase production rates for established oil and natural gas wells. The company declined 37% over the 12-month period, primarily due to the impact of the rapid decline in oil prices in late 2014. Despite the decline, we continue to like the company’s strong balance sheet, which has no debt. Unlike most exploration and production companies, Evolution Petroleum has positive free-cash flow even at these depressed commodity prices. We added to the position during the year. |
| Meridian Funds | 20 | www.meridianfund.com |
Table of Contents
Portfolio Performance and Composition (Unaudited) (continued)
| Share Class | Inception | 1 Year | Since Inception |
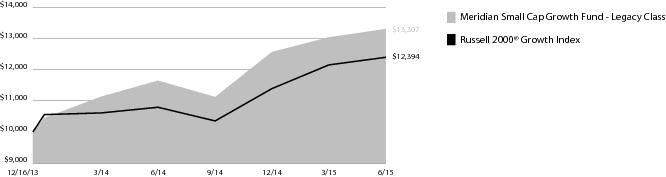
| Legacy Class (MSGGX) | 12/16/13 | 14.23% | 20.43% |
| Investor Class (MISGX) | 12/16/13 | 14.14% | 20.37% |
| Advisor Class (MSGAX) | 12/16/13 | 13.82% | 20.01% |
| Institutional Class (MSGRX) | 12/24/14 | — | 6.13% |
| Russell 2000® Growth Index | 12/16/13 | 12.34% | 12.45% |
| Meridian Funds | 21 | www.meridianfund.com |
Table of Contents
Portfolio Composition (Unaudited)
6.30.15
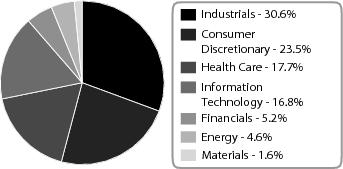
| Heritage-Crystal Clean, Inc. | 2.43% |
| Clean Harbors, Inc. | 2.37% |
| CEB, Inc. | 2.30% |
| Wolverine World Wide, Inc. | 2.09% |
| National CineMedia, Inc. | 2.03% |
| SP Plus Corp. | 1.79% |
| Proto Labs, Inc. | 1.69% |
| RigNet, Inc. | 1.69% |
| ServiceMaster Global Holdings, Inc. | 1.67% |
| HEICO Corp. Class A | 1.64% |
| Meridian Funds | 22 | www.meridianfund.com |
Table of Contents
Table of Contents
| Actual | Annualized Expense Ratio | Beginning Account Value January 1, 2015 | Ending Account Value June 30, 2015 | Expenses Paid During the Period 1 |
| Legacy Class (MERDX) | 0.84% | $1,000.00 | $1,039.30 | $4.25 |
| Investor Class (MRIGX) | 1.18% | $1,000.00 | $1,037.80 | $5.96 |
| Advisor Class (MRAGX) | 1.55% | $1,000.00 | $1,035.80 | $7.82 |
| Institutional Class (MRRGX) | 0.90% | $1,000.00 | $1,038.80 | $4.55 |
| Hypothetical 2 | Annualized Expense Ratio | Beginning Account Value January 1, 2015 | Ending Account Value June 30, 2015 | Expenses Paid During the Period 1 |
| Legacy Class (MERDX) | 0.84% | $1,000.00 | $1,020.63 | $4.21 |
| Investor Class (MRIGX) | 1.18% | $1,000.00 | $1,018.94 | $5.91 |
| Advisor Class (MRAGX) | 1.55% | $1,000.00 | $1,017.11 | $7.75 |
| Institutional Class (MRRGX) | 0.90% | $1,000.00 | $1,020.33 | $4.51 |
| 1 | Expenses are equal to the Fund’s annualized expense ratio multiplied by the average account value over the period, multiplied by 181 days, the number of days in the most recent fiscal half-year, then divided by 365. |
| 2 | Hypothetical 5% return before expenses. |
| Actual | Annualized Expense Ratio | Beginning Account Value January 1, 2015 | Ending Account Value June 30, 2015 | Expenses Paid During the Period 1 |
| Legacy Class (MVALX) | 1.10% | $1,000.00 | $1,042.50 | $5.57 |
| Investor Class (MFCIX) | 1.35% | $1,000.00 | $1,041.20 | $6.83 |
| Advisor Class (MFCAX) | 1.60% | $1,000.00 | $1,039.80 | $8.09 |
| Meridian Funds | 23 | www.meridianfund.com |
Table of Contents
| Hypothetical 2 | Annualized Expense Ratio | Beginning Account Value January 1, 2015 | Ending Account Value June 30, 2015 | Expenses Paid During the Period 1 |
| Legacy Class (MVALX) | 1.10% | $1,000.00 | $1,019.34 | $5.51 |
| Investor Class (MFCIX) | 1.35% | $1,000.00 | $1,018.10 | $6.76 |
| Advisor Class (MFCAX) | 1.60% | $1,000.00 | $1,016.86 | $8.00 |
| 1 | Expenses are equal to the Fund’s annualized expense ratio multiplied by the average account value over the period, multiplied by 181 days, the number of days in the most recent fiscal half-year, then divided by 365. |
| 2 | Hypothetical 5% return before expenses. |
| Actual | Annualized Expense Ratio | Beginning Account Value January 1, 2015 | Ending Account Value June 30, 2015 | Expenses Paid During the Period 1 |
| Legacy Class (MEIFX) | 1.25% | $1,000.00 | $1,038.20 | $6.32 |
| Investor Class (MRIEX) | 1.35% | $1,000.00 | $1,038.10 | $6.82 |
| Advisor Class (MRAEX) | 1.60% | $1,000.00 | $1,037.40 | $8.08 |
| Hypothetical 2 | Annualized Expense Ratio | Beginning Account Value January 1, 2015 | Ending Account Value June 30, 2015 | Expenses Paid During the Period 1 |
| Legacy Class (MEIFX) | 1.25% | $1,000.00 | $1,018.60 | $6.26 |
| Investor Class (MRIEX) | 1.35% | $1,000.00 | $1,018.10 | $6.76 |
| Advisor Class (MRAEX) | 1.60% | $1,000.00 | $1,016.86 | $8.00 |
| 1 | Expenses are equal to the Fund’s annualized expense ratio multiplied by the average account value over the period, multiplied by 181 days, the number of days in the most recent fiscal half-year, then divided by 365. |
| 2 | Hypothetical 5% return before expenses. |
| Meridian Funds | 24 | www.meridianfund.com |
Table of Contents
| Actual | Annualized Expense Ratio | Beginning Account Value January 1, 2015 | Ending Account Value June 30, 2015 | Expenses Paid During the Period 1 |
| Legacy Class (MSGGX) | 1.20% | $1,000.00 | $1,058.70 | $6.13 |
| Investor Class (MISGX) | 1.33% | $1,000.00 | $1,057.90 | $6.79 |
| Advisor Class (MSGAX) | 1.60% | $1,000.00 | $1,056.50 | $8.16 |
| Institutional Class (MSGRX) | 1.10% | $1,000.00 | $1,058.70 | $5.61 |
| Hypothetical 2 | Annualized Expense Ratio | Beginning Account Value January 1, 2015 | Ending Account Value June 30, 2015 | Expenses Paid During the Period 1 |
| Legacy Class (MSGGX) | 1.20% | $1,000.00 | $1,018.84 | $6.01 |
| Investor Class (MISGX) | 1.33% | $1,000.00 | $1,018.20 | $6.66 |
| Advisor Class (MSGAX) | 1.60% | $1,000.00 | $1,016.86 | $8.00 |
| Institutional Class (MSGRX) | 1.10% | $1,000.00 | $1,019.34 | $5.51 |
| 1 | Expenses are equal to the Fund’s annualized expense ratio multiplied by the average account value over the period, multiplied by 181 days, the number of days in the most recent fiscal half-year, then divided by 365. |
| 2 | Hypothetical 5% return before expenses. |
| Meridian Funds | 25 | www.meridianfund.com |
Table of Contents
Performance and Expense Disclosures
| Meridian Funds | 26 | www.meridianfund.com |
Table of Contents
Schedule of Investments
| Shares | Value | |
| Common Stocks - 90.6% | ||
| Consumer Discretionary - 20.4% | ||
| Distributors - 1.5% | ||
| LKQ Corp.* | 1,015,476 | $ 30,713,072 |
| Diversified Consumer Services - 3.1% | ||
| Grand Canyon Education, Inc.* | 485,621 | 20,590,330 |
| ServiceMaster Global Holdings, Inc.* | 1,116,470 | 40,382,720 |
| 60,973,050 | ||
| Hotels, Restaurants & Leisure - 1.7% | ||
| Dunkin' Brands Group, Inc. | 605,979 | 33,328,845 |
| Media - 2.3% | ||
| National CineMedia, Inc. | 2,892,781 | 46,168,785 |
| Specialty Retail - 6.7% | ||
| DSW, Inc. Class A | 597,077 | 19,924,459 |
| Five Below, Inc.* | 737,999 | 29,173,100 |
| Hibbett Sports, Inc.* | 671,598 | 31,283,035 |
| Monro Muffler Brake, Inc. | 319,016 | 19,830,035 |
| Sally Beauty Holdings, Inc.* | 1,092,121 | 34,489,181 |
| 134,699,810 | ||
| Textiles, Apparel & Luxury Goods - 5.1% | ||
| Carter's, Inc. | 396,179 | 42,113,828 |
| Tumi Holdings, Inc.* | 1,088,522 | 22,336,471 |
| Wolverine World Wide, Inc. | 1,351,598 | 38,493,511 |
| 102,943,810 | ||
| Total Consumer Discretionary | 408,827,372 | |
| Energy - 4.1% | ||
| Energy Equipment & Services - 4.1% | ||
| CHC Group Ltd.* | 2,600,057 | 2,315,351 |
| Core Laboratories N.V. (Netherlands) | 180,675 | 20,604,177 |
| Dril-Quip, Inc.* | 274,952 | 20,690,138 |
| RigNet, Inc.* | 1,282,945 | 39,219,629 |
| Total Energy | 82,829,295 | |
| Financials - 7.5% | ||
| Capital Markets - 5.0% | ||
| Financial Engines, Inc. | 395,940 | 16,819,531 |
| LPL Financial Holdings, Inc. | 1,257,058 | 58,440,626 |
| WisdomTree Investments, Inc. | 1,153,034 | 25,326,392 |
| 100,586,549 | ||
| Commercial Banks - 2.2% | ||
| Bank of the Ozarks, Inc. | 752,567 | 34,429,940 |
| East West Bancorp., Inc. | 228,387 | 10,236,306 |
| 44,666,246 | ||
| Real Estate Investment Trusts - 0.3% | ||
| National Storage Affiliates Trust | 526,328 | 6,526,467 |
| Total Financials | 151,779,262 | |
| Shares | Value | |
| Health Care - 12.8% | ||
| Biotechnology - 2.9% | ||
| Chimerix, Inc. * | 267,613 | $ 12,363,721 |
| Dyax Corp.* | 395,216 | 10,473,224 |
| Exact Sciences Corp.* | 363,975 | 10,824,616 |
| Juno Therapeutics, Inc. * | 201,973 | 10,771,220 |
| Neurocrine Biosciences, Inc.* | 277,902 | 13,272,600 |
| 57,705,381 | ||
| Health Care Equipment & Supplies - 1.7% | ||
| Align Technology, Inc.* | 285,442 | 17,900,068 |
| LDR Holding Corp. * | 402,914 | 17,426,030 |
| 35,326,098 | ||
| Health Care Providers & Services - 4.6% | ||
| Cooper Cos., Inc. (The) | 134,645 | 23,962,771 |
| DexCom, Inc.* | 148,673 | 11,890,866 |
| Endologix, Inc.* | 1,755,091 | 26,923,096 |
| Insulet Corp.* | 421,435 | 13,058,163 |
| Novadaq Technologies, Inc.* | 665,717 | 8,061,833 |
| Quidel Corp.* | 389,319 | 8,934,871 |
| 92,831,600 | ||
| Health Care Technology - 1.7% | ||
| athenahealth, Inc.* | 74,810 | 8,571,730 |
| Medidata Solutions, Inc.* | 190,529 | 10,349,535 |
| Spectranetics Corp. (The)* | 639,012 | 14,703,666 |
| 33,624,931 | ||
| Pharmaceuticals - 1.9% | ||
| Prestige Brands Holdings, Inc.* | 582,420 | 26,931,101 |
| Revance Therapeutics, Inc.* | 325,361 | 10,405,045 |
| 37,336,146 | ||
| Total Health Care | 256,824,156 | |
| Industrials - 24.9% | ||
| Aerospace & Defense - 2.0% | ||
| HEICO Corp. Class A | 790,279 | 40,122,465 |
| Air Freight & Logistics - 1.8% | ||
| Expeditors International of Washington, Inc. | 205,555 | 9,477,113 |
| Forward Air Corp. | 489,222 | 25,566,742 |
| 35,043,855 | ||
| Commercial Services & Supplies - 3.8% | ||
| Clean Harbors, Inc.* | 1,070,061 | 57,505,078 |
| Ritchie Bros. Auctioneers, Inc. (Canada) | 693,198 | 19,354,088 |
| 76,859,166 | ||
| Electrical Equipment - 1.4% | ||
| Sensata Technologies Holding N.V. (Netherlands)* | 533,150 | 28,118,331 |
| Meridian Funds | 27 | www.meridianfund.com |
Table of Contents
Schedule of Investments (continued)
| Shares | Value | |
| Machinery - 5.3% | ||
| Kennametal, Inc. | 653,171 | $ 22,286,195 |
| Proto Labs, Inc.* | 451,469 | 30,465,128 |
| Tennant Co. | 396,695 | 25,920,051 |
| Woodward, Inc. | 500,040 | 27,497,200 |
| 106,168,574 | ||
| Marine - 1.1% | ||
| Kirby Corp.* | 289,874 | 22,221,741 |
| Professional Services - 3.5% | ||
| Advisory Board Co. (The)* | 210,339 | 11,499,233 |
| CEB, Inc. | 499,792 | 43,511,892 |
| TriNet Group, Inc.* | 581,611 | 14,743,839 |
| 69,754,964 | ||
| Road & Rail - 2.9% | ||
| Heartland Express, Inc. | 1,462,221 | 29,580,731 |
| Roadrunner Transportation Systems, Inc.* | 834,314 | 21,525,301 |
| Saia, Inc.* | 203,098 | 7,979,720 |
| 59,085,752 | ||
| Trading Companies & Distributors - 3.1% | ||
| MSC Industrial Direct Co., Class A | 513,860 | 35,852,012 |
| WESCO International, Inc.* | 390,000 | 26,769,600 |
| 62,621,612 | ||
| Total Industrials | 499,996,460 | |
| Information Technology - 19.9% | ||
| Electronic Equipment & Instruments - 1.8% | ||
| Trimble Navigation Ltd.* | 1,544,075 | 36,223,999 |
| Internet Software & Services - 4.5% | ||
| ChannelAdvisor Corp.* | 1,121,391 | 13,400,623 |
| Cimpress, N.V. (Netherlands)* | 118,935 | 10,009,570 |
| CoStar Group, Inc.* | 52,924 | 10,651,484 |
| Dealertrack Technologies, Inc.* | 409,210 | 25,694,296 |
| Demandware, Inc.* | 218,540 | 15,533,823 |
| SPS Commerce, Inc.* | 237,049 | 15,597,824 |
| 90,887,620 | ||
| IT Services - 2.9% | ||
| Euronet Worldwide, Inc.* | 327,013 | 20,176,702 |
| Gartner, Inc.* | 433,053 | 37,147,286 |
| 57,323,988 | ||
| Software - 9.7% | ||
| Cadence Design Systems, Inc.* | 3,014,943 | 59,273,779 |
| Descartes Systems Group, Inc. (The)* | 125,802 | 2,019,122 |
| Fleetmatics Group Plc (Ireland)* | 188,374 | 8,821,555 |
| Shares | Value | |
| RealPage, Inc.* | 521,363 | $ 9,942,392 |
| SolarWinds, Inc.* | 724,173 | 33,406,101 |
| Solera Holdings, Inc. | 1,019,652 | 45,435,693 |
| SS&C Technologies Holdings, Inc. | 574,422 | 35,901,375 |
| 194,800,017 | ||
| Technology Hardware, Storage & Peripherals - 1.0% | ||
| Stratasys Ltd.* | 582,858 | 20,359,230 |
| Total Information Technology | 399,594,854 | |
| Materials - 1.0% | ||
| Chemicals - 1.0% | ||
| Valspar Corp. (The) | 240,297 | 19,661,101 |
| Total Materials | 19,661,101 | |
| Total Investments - 90.6% (Cost $1,611,041,077) | 1,819,512,500 | |
| Cash and Other Assets, Less Liabilities - 9.4% | 188,282,803 | |
| Net Assets - 100.0% | $2,007,795,303 | |
| N.V.—Naamloze Vennootschap is the Dutch term for limited liability company |
| Plc—Public Limited Company |
| * | Non-income producing securities |
| Meridian Funds | 28 | www.meridianfund.com |
Table of Contents
Schedule of Investments
| Shares | Value | |
| Common Stocks - 91.5% | ||
| Consumer Discretionary - 20.1% | ||
| Automotives - 0.7% | ||
| Harley-Davidson, Inc. | 88,533 | $ 4,988,835 |
| Distributors - 2.5% | ||
| LKQ Corp.* | 557,256 | 16,854,208 |
| Diversified Consumer Services - 2.6% | ||
| Regis Corp.* | 296,000 | 4,664,960 |
| ServiceMaster Global Holdings, Inc.* | 359,177 | 12,991,432 |
| 17,656,392 | ||
| Food & Staples Retailing - 1.2% | ||
| Fresh Market, Inc. (The) * | 248,000 | 7,970,720 |
| Hotels, Restaurants & Leisure - 2.1% | ||
| Denny's Corp.* | 381,247 | 4,426,278 |
| Las Vegas Sands Corp. | 181,060 | 9,518,324 |
| 13,944,602 | ||
| Multiline Retail - 0.5% | ||
| Fred's, Inc. Class A | 190,000 | 3,665,100 |
| Specialty Retail - 5.5% | ||
| Children's Place, Inc. (The) | 188,161 | 12,307,611 |
| Dick's Sporting Goods, Inc. | 204,455 | 10,584,635 |
| Five Below, Inc.* | 116,317 | 4,598,011 |
| Inter Parfums, Inc. | 100,637 | 3,414,613 |
| Select Comfort Corp.* | 225,878 | 6,792,152 |
| 37,697,022 | ||
| Textiles, Apparel & Luxury Goods - 5.0% | ||
| Coach, Inc. | 211,913 | 7,334,309 |
| Gildan Activewear, Inc. (Canada) | 468,000 | 15,556,320 |
| Tumi Holdings, Inc.* | 536,451 | 11,007,974 |
| 33,898,603 | ||
| Total Consumer Discretionary | 136,675,482 | |
| Energy - 5.9% | ||
| Energy Equipment & Services - 1.3% | ||
| Core Laboratories N.V. (Netherlands) | 30,565 | 3,485,632 |
| Helmerich & Payne, Inc. | 72,661 | 5,116,788 |
| 8,602,420 | ||
| Oil, Gas & Consumable Fuels - 4.6% | ||
| Cameco Corp. | 572,464 | 8,174,786 |
| EOG Resources, Inc. | 125,600 | 10,996,280 |
| Occidental Petroleum Corp. | 159,026 | 12,367,452 |
| 31,538,518 | ||
| Total Energy | 40,140,938 | |
| Shares | Value | |
| Financials - 13.3% | ||
| Commercial Banks - 7.8% | ||
| Bank of Hawaii Corp. | 245,157 | $ 16,347,069 |
| Citigroup, Inc. | 235,000 | 12,981,400 |
| Citizens Financial Group Inc. | 451,918 | 12,341,880 |
| Synchrony Financial * | 344,876 | 11,356,767 |
| 53,027,116 | ||
| Insurance - 2.9% | ||
| MetLife, Inc. | 120,000 | 6,718,800 |
| Old Republic International Corp. | 819,878 | 12,814,693 |
| 19,533,493 | ||
| Real Estate Investment Trusts - 0.7% | ||
| Rayonier, Inc. | 187,929 | 4,801,586 |
| Real Estate Management & Development - 1.9% | ||
| Alexander & Baldwin, Inc. | 332,003 | 13,080,918 |
| Total Financials | 90,443,113 | |
| Health Care - 12.9% | ||
| Biotechnology - 1.2% | ||
| Neurocrine Biosciences, Inc.* | 175,906 | 8,401,271 |
| Health Care Equipment & Supplies - 2.9% | ||
| CR Bard, Inc. | 71,681 | 12,235,947 |
| Endologix, Inc.* | 468,447 | 7,185,977 |
| 19,421,924 | ||
| Health Care Providers & Services - 3.0% | ||
| Hologic, Inc. * | 415,000 | 15,794,900 |
| Insulet Corp.* | 141,000 | 4,368,885 |
| 20,163,785 | ||
| Life Sciences Tools & Services - 1.7% | ||
| Accelerate Diagnostics, Inc. * | 170,150 | 4,391,571 |
| ICON, Plc* | 102,500 | 6,898,250 |
| 11,289,821 | ||
| Pharmaceuticals - 4.1% | ||
| Impax Laboratories, Inc.* | 151,923 | 6,976,304 |
| Nektar Therapeutics * | 347,605 | 4,348,538 |
| Pfizer, Inc. | 497,043 | 16,665,852 |
| 27,990,694 | ||
| Total Health Care | 87,267,495 | |
| Industrials - 10.9% | ||
| Air Freight & Logistics - 2.0% | ||
| Hub Group, Inc. Class A* | 237,543 | 9,582,485 |
| UTi Worldwide, Inc.* | 392,039 | 3,916,469 |
| 13,498,954 | ||
| Building Products - 1.3% | ||
| NCI Building Systems, Inc.* | 595,368 | 8,972,196 |
| Commercial Services & Supplies - 1.9% | ||
| Clean Harbors, Inc.* | 233,200 | 12,532,168 |
| Meridian Funds | 29 | www.meridianfund.com |
Table of Contents
Schedule of Investments (continued)
| Shares | Value | |
| Machinery - 3.2% | ||
| Lindsay Corp. | 33,500 | $ 2,944,985 |
| Stanley Black & Decker, Inc. | 69,064 | 7,268,296 |
| Xylem, Inc. | 310,132 | 11,496,593 |
| 21,709,874 | ||
| Marine - 0.7% | ||
| Kirby Corp.* | 57,385 | 4,399,134 |
| Professional Services - 1.1% | ||
| Verisk Analytics, Inc., Class A* | 105,000 | 7,639,800 |
| Road & Rail - 0.7% | ||
| Norfolk Southern Corp. | 56,700 | 4,953,312 |
| Total Industrials | 73,705,438 | |
| Information Technology - 26.4% | ||
| Electronic Equipment & Instruments - 2.1% | ||
| FLIR Systems, Inc. | 238,051 | 7,336,732 |
| Trimble Navigation Ltd.* | 298,534 | 7,003,608 |
| 14,340,340 | ||
| Internet Software & Services - 5.0% | ||
| Bankrate, Inc.* | 280,328 | 2,940,641 |
| LinkedIn Corp. Class A* | 35,000 | 7,232,050 |
| Marketo, Inc.* | 214,490 | 6,018,589 |
| RetailMeNot, Inc. * | 185,000 | 3,298,550 |
| Twitter, Inc. * | 216,901 | 7,856,154 |
| Yelp, Inc. * | 151,567 | 6,521,928 |
| 33,867,912 | ||
| IT Services - 3.0% | ||
| Broadridge Financial Solutions, Inc. | 109,040 | 5,453,090 |
| CACI International, Inc. Class A* | 180,500 | 14,600,645 |
| 20,053,735 | ||
| Semiconductors - 6.0% | ||
| Linear Technology Corp. | 218,221 | 9,651,915 |
| Mellanox Technologies Ltd.* | 134,204 | 6,520,973 |
| NVIDIA Corp. | 727,357 | 14,627,149 |
| Power Integrations, Inc. | 218,651 | 9,878,652 |
| 40,678,689 | ||
| Software - 7.9% | ||
| Barracuda Networks, Inc.* | 95,603 | 3,787,791 |
| Fortinet, Inc.* | 248,459 | 10,268,810 |
| Microsoft Corp. | 343,258 | 15,154,841 |
| Silver Spring Networks, Inc.* | 450,303 | 5,588,260 |
| Verint Systems, Inc.* | 231,700 | 14,074,616 |
| Zynga, Inc. Class A* | 1,755,853 | 5,021,740 |
| 53,896,058 | ||
| Shares | Value | |
| Technology Hardware, Storage & Peripherals - 2.4% | ||
| Apple, Inc. | 83,599 | $ 10,485,405 |
| Stratasys Ltd.* | 162,656 | 5,681,574 |
| 16,166,979 | ||
| Total Information Technology | 179,003,713 | |
| Materials - 0.7% | ||
| Metals & Mining - 0.7% | ||
| Newmont Mining Corp. | 194,000 | 4,531,840 |
| Total Materials | 4,531,840 | |
| Telecommunication Services - 1.3% | ||
| Diversified Telecommunications - 1.3% | ||
| Iridium Communications, Inc.* | 997,121 | 9,063,830 |
| Total Telecommunication Services | 9,063,830 | |
| Total Investments - 91.5% (Cost $516,413,126) | 620,831,849 | |
| Cash and Other Assets, Less Liabilities - 8.5% | 57,936,052 | |
| Net Assets - 100.0% | $678,767,901 | |
| N.V.—Naamloze Vennootschap is the Dutch term for limited liability company |
| Plc—Public Limited Company |
| * | Non-income producing securities |
| Meridian Funds | 30 | www.meridianfund.com |
Table of Contents
Schedule of Investments
| Shares | Value | |
| Common Stocks - 76.7% | ||
| Consumer Discretionary - 16.3% | ||
| Hotels, Restaurants & Leisure - 4.4% | ||
| Las Vegas Sands Corp. | 14,500 | $ 762,265 |
| Restaurant Brands International, Inc. | 13,000 | 496,730 |
| Starbucks Corp. | 21,036 | 1,127,845 |
| 2,386,840 | ||
| Internet & Catalog Retail - 2.4% | ||
| Amazon.com, Inc.* | 2,900 | 1,258,861 |
| Media - 3.8% | ||
| Time Warner, Inc. | 11,000 | 961,510 |
| Walt Disney Co. (The)^ | 9,693 | 1,106,359 |
| 2,067,869 | ||
| Specialty Retail - 1.9% | ||
| TJX Companies, Inc. (The)^ | 15,500 | 1,025,635 |
| Textiles, Apparel & Luxury Goods - 3.8% | ||
| NIKE Class B | 9,970 | 1,076,960 |
| VF Corp. | 14,000 | 976,360 |
| 2,053,320 | ||
| Total Consumer Discretionary | 8,792,525 | |
| Consumer Staples - 7.3% | ||
| Beverages - 1.7% | ||
| Brown-Forman Corp. Class B | 9,000 | 901,620 |
| Food & Staples Retailing - 2.0% | ||
| Costco Wholesale Corp.^ | 7,930 | 1,071,026 |
| Food Products - 1.0% | ||
| Hershey Co. (The) | 6,000 | 532,980 |
| Tobacco - 2.6% | ||
| Altria Group, Inc. | 18,000 | 880,380 |
| Reynolds American, Inc. | 7,413 | 553,454 |
| 1,433,834 | ||
| Total Consumer Staples | 3,939,460 | |
| Energy - 4.5% | ||
| Energy Equipment & Services - 1.9% | ||
| National Oilwell Varco, Inc. | 21,000 | 1,013,880 |
| Oil, Gas & Consumable Fuels - 2.6% | ||
| Cameco Corp. | 21,500 | 307,020 |
| EOG Resources, Inc. | 5,694 | 498,510 |
| Kinder Morgan, Inc. | 8,847 | 339,636 |
| MarkWest Energy Partners LP | 4,595 | 259,066 |
| 1,404,232 | ||
| Total Energy | 2,418,112 | |
| Financials - 4.8% | ||
| Commercial Banks - 4.0% | ||
| JPMorgan Chase & Co. | 12,554 | 850,659 |
| U.S. Bancorp | 13,656 | 592,670 |
| Wells Fargo & Co. | 12,919 | 726,565 |
| 2,169,894 | ||
| Shares | Value | |
| Diversified Financial Services - 0.8% | ||
| Intercontinental Exchange, Inc. | 1,836 | $ 410,548 |
| Total Financials | 2,580,442 | |
| Health Care - 11.1% | ||
| Biotechnology - 6.1% | ||
| Biogen, Inc.* | 1,450 | 585,713 |
| Exact Sciences Corp.* | 18,888 | 561,729 |
| Gilead Sciences, Inc. | 10,590 | 1,239,877 |
| OvaScience, Inc. * | 14,000 | 405,020 |
| Vertex Pharmaceuticals, Inc. * | 4,342 | 536,150 |
| 3,328,489 | ||
| Life Sciences Tools & Services - 2.4% | ||
| Accelerate Diagnostics, Inc. * | 20,000 | 516,200 |
| Illumina, Inc. * | 3,500 | 764,260 |
| 1,280,460 | ||
| Pharmaceuticals - 2.6% | ||
| Novartis AG, ADR | 6,660 | 654,944 |
| Perrigo Co., Plc | 3,967 | 733,221 |
| 1,388,165 | ||
| Total Health Care | 5,997,114 | |
| Industrials - 7.9% | ||
| Aerospace & Defense - 2.7% | ||
| General Dynamics Corp. | 2,563 | 363,152 |
| Lockheed Martin Corp. | 3,496 | 649,906 |
| Raytheon Co. | 4,754 | 454,863 |
| 1,467,921 | ||
| Air Freight & Logistics - 1.3% | ||
| United Parcel Service, Inc. Class B | 7,000 | 678,370 |
| Professional Services - 1.9% | ||
| Equifax, Inc. | 10,801 | 1,048,669 |
| Road & Rail - 0.9% | ||
| Union Pacific Corp.^ | 4,957 | 472,749 |
| Trading Companies & Distributors - 1.1% | ||
| WW Grainger, Inc. | 2,628 | 621,916 |
| Total Industrials | 4,289,625 | |
| Information Technology - 20.3% | ||
| Communications Equipment - 0.9% | ||
| QUALCOMM, Inc. | 7,974 | 499,412 |
| Internet Software & Services - 7.4% | ||
| Alibaba Group Holding Ltd. ADR* | 8,888 | 731,216 |
| Facebook, Inc. Class A* | 9,952 | 853,533 |
| Google, Inc. Class A*,^ | 2,000 | 1,080,080 |
| LinkedIn Corp. Class A* | 3,660 | 756,266 |
| Twitter, Inc. * | 15,000 | 543,300 |
| 3,964,395 | ||
| Meridian Funds | 31 | www.meridianfund.com |
Table of Contents
Schedule of Investments (continued)
| Shares | Value | |
| IT Services - 2.4% | ||
| Black Knight Financial Services, Inc. Class A* | 18,500 | $ 571,095 |
| International Business Machines Corp. | 4,250 | 691,305 |
| 1,262,400 | ||
| Semiconductors - 1.5% | ||
| NVIDIA Corp. | 40,000 | 804,400 |
| Software - 3.5% | ||
| Microsoft Corp.^ | 30,000 | 1,324,500 |
| Oracle Corp.^ | 14,500 | 584,350 |
| 1,908,850 | ||
| Technology Hardware, Storage & Peripherals - 4.6% | ||
| Apple, Inc.^ | 18,205 | 2,283,362 |
| Stratasys Ltd.* | 6,000 | 209,580 |
| 2,492,942 | ||
| Total Information Technology | 10,932,399 | |
| Materials - 3.6% | ||
| Chemicals - 2.0% | ||
| Dow Chemical Co. (The) | 10,027 | 513,082 |
| Mosaic Co. (The) | 12,500 | 585,625 |
| 1,098,707 | ||
| Metals & Mining - 1.6% | ||
| Royal Gold, Inc. | 13,500 | 831,465 |
| Total Materials | 1,930,172 | |
| Utilities - 0.9% | ||
| Multi-Utilities - 0.9% | ||
| Dominion Resources, Inc. | 7,660 | 512,224 |
| Total Utilities | 512,224 | |
| Total Common Stocks - 76.7% (Cost $39,451,073) | 41,392,073 | |
| Principal Value | ||
| Corporate Bonds - 0.9% | ||
| Energy - 0.9% | ||
| Oil, Gas & Consumable Fuels - 0.9% | ||
| Halcon Resources Corp., 9.75%, 7/15/20 | $ 750,000 | 504,375 |
| Total Corporate Bonds - 0.9% (Cost $544,947) | 504,375 | |
| Number of Contracts | Value | |
| Call Options Purchased - 0.4% | ||
| Continental Resources, Inc. Expiring January 20, 2017 at $40.00 | 150 | $ 138,000 |
| Halliburton Co. Expiring January 20, 2017 at $50.00 | 150 | 51,600 |
| Microsoft Corp. Expiring January 15, 2016 at $50.00 | 50 | 4,000 |
| Twitter, Inc. Expiring January 20, 2017 at $50.00 | 25 | 9,000 |
| Total Call Options Purchased - 0.4% (Cost $240,848) | 202,600 | |
| Total Investments - 78.0% (Cost $40,236,868) | 42,099,048 | |
| Cash and Other Assets, Less Liabilities - 22.0% | 11,862,297 | |
| Net Assets - 100.0% | $ 53,961,345 | |
| Number of Contracts | Value | |
| Call Options Written - (0.0)% | ||
| Apple, Inc. Expiring August 21, 2015 at $145.00 | (14) | $ (392) |
| Illumina, Inc. Expiring September 18, 2015 at $230.00 | (8) | (5,568) |
| NIKE, Inc., Class B Expiring October 16, 2015 at $115.00 | (10) | (1,830) |
| Stratasys Ltd. | ||
| Expiring January 15, 2016 at $50.00 | (20) | (2,200) |
| Expiring January 20, 2017 at $50.00 | (20) | (8,400) |
| Total Call Options Written - (0.0)% (Premium received $(55,831)) | $ (18,390) | |
| ADR—American Depositary Receipt. |
| Plc—Public Limited Company |
| ^ | Securities, or a portion thereof, were pledged as collateral for call options written by the Fund. |
| * | Non-income producing securities |
| Meridian Funds | 32 | www.meridianfund.com |
Table of Contents
Schedule of Investments
| Shares | Value | |
| Common Stocks - 90.0% | ||
| Consumer Discretionary - 21.2% | ||
| Auto Components - 1.0% | ||
| Dorman Products, Inc.* | 53,896 | $ 2,568,683 |
| Distributors - 0.7% | ||
| Fenix Parts, Inc.* | 166,345 | 1,666,777 |
| Diversified Consumer Services - 4.4% | ||
| 2U, Inc.* | 121,875 | 3,923,156 |
| Grand Canyon Education, Inc.* | 65,317 | 2,769,441 |
| ServiceMaster Global Holdings, Inc.* | 114,759 | 4,150,833 |
| 10,843,430 | ||
| Hotels, Restaurants & Leisure - 2.7% | ||
| Del Frisco's Restaurant Group, Inc.* | 184,627 | 3,439,601 |
| Papa Murphy's Holdings, Inc.* | 71,349 | 1,478,352 |
| Texas Roadhouse, Inc. | 47,861 | 1,791,437 |
| 6,709,390 | ||
| Leisure Equipment & Products - 1.4% | ||
| Arctic Cat, Inc. | 36,047 | 1,197,121 |
| Malibu Boats, Inc. Class A* | 118,543 | 2,381,529 |
| 3,578,650 | ||
| Media - 2.8% | ||
| National CineMedia, Inc. | 315,291 | 5,032,044 |
| Rentrak Corp.* | 26,007 | 1,815,289 |
| 6,847,333 | ||
| Specialty Retail - 5.4% | ||
| Boot Barn Holdings, Inc. * | 104,256 | 3,336,192 |
| DavidsTea, Inc.* | 10,695 | 229,835 |
| Five Below, Inc.* | 73,190 | 2,893,201 |
| Hibbett Sports, Inc.* | 86,503 | 4,029,310 |
| Monro Muffler Brake, Inc. | 26,218 | 1,629,711 |
| Winmark Corp. | 14,133 | 1,392,100 |
| 13,510,349 | ||
| Textiles, Apparel & Luxury Goods - 2.8% | ||
| Tumi Holdings, Inc.* | 85,632 | 1,757,169 |
| Wolverine World Wide, Inc. | 182,276 | 5,191,220 |
| 6,948,389 | ||
| Total Consumer Discretionary | 52,673,001 | |
| Energy - 4.1% | ||
| Energy Equipment & Services - 2.5% | ||
| Era Group, Inc. * | 97,033 | 1,987,236 |
| RigNet, Inc.* | 137,010 | 4,188,396 |
| 6,175,632 | ||
| Oil, Gas & Consumable Fuels - 1.6% | ||
| Evolution Petroleum Corp. | 615,085 | 4,053,410 |
| Total Energy | 10,229,042 | |
| Shares | Value | |
| Financials - 4.6% | ||
| Capital Markets - 2.6% | ||
| Financial Engines, Inc. | 44,835 | $ 1,904,591 |
| PennantPark Investment Corp. | 167,484 | 1,470,510 |
| WisdomTree Investments, Inc. | 142,388 | 3,127,552 |
| 6,502,653 | ||
| Commercial Banks - 1.5% | ||
| Bank of the Ozarks, Inc. | 82,260 | 3,763,395 |
| Real Estate Investment Trusts - 0.5% | ||
| National Storage Affiliates Trust | 105,125 | 1,303,550 |
| Total Financials | 11,569,598 | |
| Health Care - 15.9% | ||
| Biotechnology - 5.7% | ||
| Aduro Biotech Inc.* | 11,620 | 352,435 |
| Atara Biotherapeutics, Inc. * | 23,927 | 1,262,388 |
| Blueprint Medicines Corp.* | 57,628 | 1,526,566 |
| Cellectis SA, ADR * | 14,306 | 516,160 |
| Chimerix, Inc. * | 27,884 | 1,288,241 |
| Exact Sciences Corp.* | 44,191 | 1,314,240 |
| Neurocrine Biosciences, Inc.* | 28,796 | 1,375,297 |
| OvaScience, Inc. * | 41,581 | 1,202,938 |
| Repligen Corp.* | 29,462 | 1,215,897 |
| Spark Therapeutics, Inc. * | 20,811 | 1,254,279 |
| Versartis, Inc.* | 80,637 | 1,227,295 |
| Xencor, Inc. * | 70,146 | 1,541,108 |
| 14,076,844 | ||
| Health Care Equipment & Supplies - 6.0% | ||
| Endologix, Inc.* | 185,081 | 2,839,143 |
| Insulet Corp.* | 53,411 | 1,654,940 |
| LDR Holding Corp. * | 55,680 | 2,408,160 |
| Merit Medical Systems, Inc.* | 102,513 | 2,208,130 |
| Nevro Corp. * | 25,073 | 1,347,674 |
| Novadaq Technologies, Inc.* | 110,091 | 1,333,202 |
| Quidel Corp.* | 53,992 | 1,239,116 |
| Spectranetics Corp. (The)* | 83,153 | 1,913,350 |
| 14,943,715 | ||
| Health Care Providers & Services - 1.0% | ||
| National Research Corp. Class A | 63,034 | 895,713 |
| Trupanion, Inc. * | 181,423 | 1,494,926 |
| 2,390,639 | ||
| Health Care Technology - 1.0% | ||
| Castlight Health Inc. Class B* | 142,337 | 1,158,623 |
| Evolent Health, Inc. Class A* | 10,695 | 208,553 |
| Medidata Solutions, Inc.* | 21,900 | 1,189,608 |
| 2,556,784 | ||
| Meridian Funds | 33 | www.meridianfund.com |
Table of Contents
Schedule of Investments (continued)
| Shares | Value | |
| Pharmaceuticals - 2.2% | ||
| Marinus Pharmaceuticals, Inc.* | 110,797 | $ 1,285,245 |
| Prestige Brands Holdings, Inc.* | 66,190 | 3,060,626 |
| Revance Therapeutics, Inc.* | 39,024 | 1,247,987 |
| 5,593,858 | ||
| Total Health Care | 39,561,840 | |
| Industrials - 27.6% | ||
| Aerospace & Defense - 1.6% | ||
| HEICO Corp. Class A | 79,982 | 4,060,686 |
| Air Freight & Logistics - 2.3% | ||
| Forward Air Corp. | 67,605 | 3,533,037 |
| Park-Ohio Holdings Corp. | 46,030 | 2,230,614 |
| 5,763,651 | ||
| Commercial Services & Supplies - 8.2% | ||
| Clean Harbors, Inc.* | 109,541 | 5,886,733 |
| Heritage-Crystal Clean, Inc.* | 410,270 | 6,030,969 |
| InnerWorkings, Inc.* | 188,883 | 1,259,850 |
| Ritchie Bros. Auctioneers, Inc. (Canada) | 95,540 | 2,667,477 |
| SP Plus Corp.* | 170,011 | 4,438,987 |
| 20,284,016 | ||
| Electrical Equipment - 0.9% | ||
| Power Solutions International, Inc.* | 40,989 | 2,214,226 |
| Industrial Conglomerates - 0.6% | ||
| Raven Industries, Inc. | 77,034 | 1,566,101 |
| Machinery - 4.4% | ||
| Kennametal, Inc. | 80,371 | 2,742,259 |
| Proto Labs, Inc.* | 62,196 | 4,196,986 |
| Tennant Co. | 48,678 | 3,180,620 |
| voxeljet AG ADR (Germany)* | 126,124 | 862,688 |
| 10,982,553 | ||
| Professional Services - 4.6% | ||
| Advisory Board Co. (The)* | 27,027 | 1,477,566 |
| CEB, Inc. | 65,656 | 5,716,011 |
| TriNet Group, Inc.* | 99,342 | 2,518,320 |
| TrueBlue, Inc.* | 59,170 | 1,769,183 |
| 11,481,080 | ||
| Road & Rail - 3.1% | ||
| Heartland Express, Inc. | 197,227 | 3,989,902 |
| Roadrunner Transportation Systems, Inc.* | 85,890 | 2,215,962 |
| Saia, Inc.* | 36,498 | 1,434,007 |
| 7,639,871 | ||
| Trading Companies & Distributors - 1.9% | ||
| Titan Machinery, Inc.* | 80,980 | 1,192,835 |
| WESCO International, Inc.* | 50,918 | 3,495,012 |
| 4,687,847 | ||
| Total Industrials | 68,680,031 | |
| Shares | Value | |
| Information Technology - 15.1% | ||
| Electronic Equipment & Instruments - 1.0% | ||
| DTS, Inc.* | 39,920 | $ 1,217,161 |
| Mesa Laboratories, Inc. | 15,763 | 1,401,330 |
| 2,618,491 | ||
| Internet Software & Services - 6.2% | ||
| Carbonite, Inc.* | 198,658 | 2,346,151 |
| ChannelAdvisor Corp.* | 275,685 | 3,294,436 |
| Cimpress, N.V. (Netherlands)* | 15,501 | 1,304,564 |
| Dealertrack Technologies, Inc.* | 46,890 | 2,944,223 |
| LivePerson, Inc.* | 224,169 | 2,199,098 |
| New Relic Inc. * | 12,478 | 439,101 |
| SciQuest, Inc.* | 81,283 | 1,203,801 |
| SPS Commerce, Inc.* | 27,473 | 1,807,723 |
| 15,539,097 | ||
| IT Services - 2.3% | ||
| Cass Information Systems, Inc. | 59,924 | 3,368,927 |
| Euronet Worldwide, Inc.* | 37,024 | 2,284,381 |
| 5,653,308 | ||
| Software - 4.5% | ||
| Advent Software, Inc. | 18,562 | 820,626 |
| Callidus Software, Inc.* | 126,437 | 1,969,889 |
| Descartes Systems Group, Inc. (The)* | 16,443 | 263,910 |
| Exa Corp.* | 162,974 | 1,817,160 |
| Fleetmatics Group Plc (Ireland)* | 25,527 | 1,195,430 |
| RealPage, Inc.* | 62,832 | 1,198,206 |
| SolarWinds, Inc.* | 84,402 | 3,893,464 |
| 11,158,685 | ||
| Technology Hardware, Storage & Peripherals - 1.1% | ||
| Stratasys Ltd.* | 78,629 | 2,746,511 |
| Total Information Technology | 37,716,092 | |
| Meridian Funds | 34 | www.meridianfund.com |
Table of Contents
Schedule of Investments (continued)
| Shares | Value | |
| Materials - 1.5% | ||
| Chemicals - 1.5% | ||
| Balchem Corp. | 65,264 | $ 3,636,510 |
| Total Materials | 3,636,510 | |
| Total Investments - 90.0% (Cost $208,164,264) | 224,066,114 | |
| Cash and Other Assets, Less Liabilities - 10.0% | 24,824,505 | |
| Net Assets - 100.0% | $248,890,619 | |
| ADR—American Depositary Receipt. |
| N.V.—Naamloze Vennootschap is the Dutch term for limited liability company |
| Plc—Public Limited Company |
| * | Non-income producing securities |
| Meridian Funds | 35 | www.meridianfund.com |
Table of Contents
Statements of Assets and Liabilities
| June 30, 2015 | Meridian Growth Fund | Meridian Contrarian Fund | Meridian Equity Income Fund | Meridian Small Cap Growth Fund |
| Assets | ||||
Investments, at value1 | $1,819,512,500 | $620,831,849 | $42,099,048 | $224,066,114 |
Cash and cash equivalents | 193,145,586 | 51,920,165 | 11,871,945 | 27,068,566 |
| Receivables and other assets: | ||||
Fund shares purchased | 438,450 | 9,156 | 14,250 | 2,030,816 |
Investments sold | — | 10,348,317 | — | — |
Dividends and Interest | 241,281 | 291,110 | 61,602 | 88,419 |
Prepaid expenses | 74,616 | 52,018 | 53,876 | 44,135 |
Total Assets | 2,013,412,433 | 683,452,615 | 54,100,721 | 253,298,050 |
| Liabilities | ||||
| Payables and other accrued expenses: | ||||
Call options written2 | — | — | 18,390 | — |
Fund shares sold | 708,371 | 261,230 | 48,500 | 124,948 |
Investments purchased | 3,302,568 | 3,719,797 | — | 4,011,940 |
Investment advisory fees | 1,257,740 | 570,339 | 38,955 | 188,356 |
Distribution fees | 331 | — | 216 | 31 |
Service plan fees | 12,945 | 298 | 406 | 16,507 |
Professional fees | 140,153 | 49,289 | 17,066 | 18,924 |
Directors' fees | 1,322 | 491 | 22 | 10 |
Transfer agent fees | 48,926 | 28,756 | 1,109 | 21,686 |
Other | 144,774 | 54,514 | 14,712 | 25,029 |
Total liabilities | 5,617,130 | 4,684,714 | 139,376 | 4,407,431 |
Net Assets | $2,007,795,303 | $678,767,901 | $53,961,345 | $248,890,619 |
| Net Assets Consist of | ||||
Paid in capital | $1,622,969,651 | $496,796,884 | $50,155,426 | $229,061,124 |
Accumulated net realized gain on investments, written options, and foreign currency transactions | 176,354,229 | 78,329,598 | 1,906,298 | 3,927,645 |
Net unrealized appreciation on investments and foreign currency translations | 208,471,423 | 104,418,723 | 1,862,180 | 15,901,850 |
Net unrealized appreciation on written options | — | — | 37,441 | — |
Undistributed (distributions in excess of) net investment income | — | (777,304) | — | — |
Net Assets | $2,007,795,303 | $678,767,901 | $53,961,345 | $248,890,619 |
1 Investments at cost | 1,611,041,077 | 516,413,126 | 40,236,868 | 208,164,264 |
| 2 | Written options, premium received of $—, $—, $55,831, and $—, respectively. |
| Meridian Funds | 36 | www.meridianfund.com |
Table of Contents
Statements of Assets and Liabilities (continued)
| June 30, 2015 | Meridian Growth Fund | Meridian Contrarian Fund | Meridian Equity Income Fund | Meridian Small Cap Growth Fund |
| Net Asset Value | ||||
| Legacy Class | ||||
Net Assets | $1,937,346,211 | $677,138,489 | $53,125,370 | $ 59,459,125 |
Shares outstanding3 | 51,250,824 | 16,744,278 | 4,245,176 | 4,581,136 |
Net Asset value per share (offering and redemption price) | $ 37.80 | $ 40.44 | $ 12.51 | $ 12.98 |
| Investor Class | ||||
Net Assets | $ 42,061,714 | $ 1,007,592 | $ 335,310 | $131,210,528 |
Shares outstanding3 | 1,118,405 | 24,943 | 26,762 | 10,113,611 |
Net Asset value per share (offering and redemption price) | $ 37.61 | $ 40.40 | $ 12.53 | $ 12.97 |
| Advisor Class | ||||
Net Assets | $ 8,812,689 | $ 621,820 | $ 500,665 | $ 45,185,955 |
Shares outstanding3 | 235,817 | 15,459 | 40,059 | 3,500,581 |
Net Asset value per share (offering and redemption price) | $ 37.37 | $ 40.22 | $ 12.50 | $ 12.91 |
| Institutional Class | ||||
Net Assets | $ 19,574,689 | $ — | $ — | $ 13,035,011 |
Shares outstanding3 | 517,924 | — | — | 1,003,966 |
Net Asset value per share (offering and redemption price) | $ 37.79 | $ — | $ — | $ 12.98 |
| 3 | 500,000,000 shares authorized, $0.01 par value. |
| Meridian Funds | 37 | www.meridianfund.com |
Table of Contents
Statements of Operations
| For the Year Ended June 30, 2015 | Meridian Growth Fund | Meridian Contrarian Fund | Meridian Equity Income Fund | Meridian Small Cap Growth Fund |
| Investment Income | ||||
Dividends | $ 8,986,325 | $ 7,930,418 | $ 442,208 | $ 642,401 |
Foreign taxes withheld | (100,496) | (81,522) | (2,011) | (7,279) |
Interest Income | — | — | 52,300 | — |
Total investment income | 8,885,829 | 7,848,896 | 492,497 | 635,122 |
| Expenses | ||||
Investment advisory fees | 15,283,202 | 7,097,226 | 215,449 | 1,242,499 |
Custodian fees | 185,800 | 72,219 | 11,741 | 30,784 |
| Distribution and service plan fees: | ||||
Investor Class | 74,240 | 550 | 212 | 30,745 |
Advisor Class | 30,518 | 2,014 | 1,185 | 77,401 |
Directors' fees | 258,608 | 91,646 | 2,776 | 15,321 |
Pricing fees | 195,531 | 82,758 | 22,598 | 31,350 |
Audit and tax fees | 133,248 | 38,295 | 3,080 | 6,884 |
Legal fees | 91,484 | 32,128 | 1,218 | 3,925 |
Registration and filing fees | 99,881 | 70,425 | 55,645 | 100,039 |
Shareholder communications | 200,508 | 62,766 | 1,967 | 20,182 |
Transfer agent fees | 516,358 | 312,641 | 11,736 | 143,872 |
Recoupment of investment advisory fees previously waived | — | — | — | 11,972 |
Miscellaneous expenses | 162,094 | 53,286 | 7,602 | 9,822 |
Total expenses | 17,231,472 | 7,915,954 | 335,209 | 1,724,796 |
Less waivers and/or reimbursements (Note 5) | (18,313) | (23,426) | (44,499) | (51,290) |
Net expenses | 17,213,159 | 7,892,528 | 290,710 | 1,673,506 |
Net investment income (loss) | (8,327,330) | (43,632) | 201,787 | (1,038,384) |
| Realized and Unrealized Gain (Loss) | ||||
Net realized gain on investments and foreign currency transactions | 256,624,172 | 98,718,841 | 7,924,649 | 6,225,848 |
Net realized loss on written options | — | — | (12,559) | — |
Net change in unrealized appreciation(depreciation) on investments and foreign currency translations | (15,775,934) | (53,402,467) | (6,192,919) | 15,017,109 |
Net change in unrealized appreciation on written options | — | — | 37,441 | — |
Total realized and unrealized gain | 240,848,238 | 45,316,374 | 1,756,612 | 21,242,957 |
Net Increase in net assets resulting from operations | $232,520,908 | $ 45,272,742 | $ 1,958,399 | $20,204,573 |
| Meridian Funds | 38 | www.meridianfund.com |
Table of Contents
Statements of Changes in Net Assets
| Meridian Growth Fund | Meridian Contrarian Fund | ||||
| Changes in Net Assets From: | Year Ended June 30, 2015 | Year Ended June 30, 2014 | Year Ended June 30, 2015 | Year Ended June 30, 2014 | |
| Operations | |||||
Net investment income/(loss) | $ (8,327,330) | $ (5,858,482) | $ (43,632) | $ 109,511 | |
Net realized gain on investments, written options, and foreign currency transactions | 256,624,172 | 556,304,765 | 98,718,841 | 157,634,506 | |
Net change in unrealized appreciation (depreciation) on investments, written options, and foreign currency translations | (15,775,934) | (212,344,132) | (53,402,467) | (1,572,341) | |
Net increase in net assets resulting from operations and foreign currency translations | 232,520,908 | 338,102,151 | 45,272,742 | 156,171,676 | |
| Distributions to Shareholders From: | |||||
| Net Investment income: | |||||
Legacy Class | — | (1,246) | (1,287,678) | (3,275,946) | |
Investor Class | — | — | — | (41) | |
Advisor Class | — | — | — | (51) | |
Institutional Class | — | — | — | — | |
| Net Realized Gains: | |||||
Legacy Class | (219,516,396) | (598,507,009) | (115,863,711) | (2,568,833) | |
Investor Class | (3,083,406) | — | (174,302) | — | |
Advisor Class | (595,614) | — | (155,510) | — | |
Institutional Class | — | — | — | — | |
Decrease in net assets from distributions | (223,195,416) | (598,508,255) | (117,481,201) | (5,844,871) | |
| Fund Share Transactions | |||||
Net increase (decrease) in net assets resulting from fund share transactions (Note 2) | (46,379,756) | 192,310,546 | (15,931,502) | (87,941,564) | |
Total increase (decrease) in net assets | (37,054,264) | (68,095,558) | (88,139,961) | 62,385,241 | |
| Net Assets | |||||
Beginning of Year | 2,044,849,567 | 2,112,945,125 | 766,907,862 | 704,522,621 | |
End of Year* | $2,007,795,303 | $2,044,849,567 | $ 678,767,901 | $766,907,862 | |
*Includes accumulated undistributed (distributions in excess of) net investment income | $ — | $ — | $ (777,304) | $ 150,000 | |
| Meridian Funds | 39 | www.meridianfund.com |
Table of Contents
Statements of Changes in Net Assets (continued)
| Meridian Equity Income Fund | Meridian Small Cap Growth Fund | ||||
| Changes in Net Assets From: | Year Ended June 30, 2015 | Year Ended June 30, 2014 | Year Ended June 30, 2015 | For the Period December 16, 2013 to June 30, 2014 | |
| Operations | |||||
Net investment income/(loss) | $ 201,787 | $ 553,968 | $ (1,038,384) | $ (49,643) | |
Net realized gain on investments, written options, and foreign currency transactions | 7,912,090 | 2,242,362 | 6,225,848 | 1,120,438 | |
Net change in unrealized appreciation (depreciation) on investments, written options, and foreign currency translations | (6,155,478) | 2,899,378 | 15,017,109 | 884,741 | |
Net increase in net assets resulting from operations and foreign currency translations | 1,958,399 | 5,695,708 | 20,204,573 | 1,955,536 | |
| Distributions to Shareholders From: | |||||
| Net Investment income: | |||||
Legacy Class | (664,498) | (500,908) | — | — | |
Investor Class | (876) | (148) | — | — | |
Advisor Class | (2,071) | (145) | — | — | |
Institutional Class | — | — | — | — | |
| Net Realized Gains: | |||||
Legacy Class | (5,535,693) | — | (836,030) | — | |
Investor Class | (7,536) | — | (939,505) | — | |
Advisor Class | (19,039) | — | (556,328) | — | |
Institutional Class | — | — | — | — | |
Decrease in net assets from distributions | (6,229,713) | (501,201) | (2,331,863) | — | |
| Fund Share Transactions | |||||
Net increase (decrease) in net assets resulting from fund share transactions (Note 2) | 24,525,359 | (184,365) | 212,520,461 | 16,541,912 | |
Total increase in net assets | 20,254,045 | 5,010,142 | 230,393,171 | 18,497,448 | |
| Net Assets | |||||
Beginning of Year | 33,707,300 | 28,697,158 | 18,497,448 | — | |
End of Year* | $53,961,345 | $33,707,300 | $248,890,619 | $18,497,448 | |
*Includes accumulated undistributed net investment income | $ — | $ 481,813 | $ — | $ — | |
| Meridian Funds | 40 | www.meridianfund.com |
Table of Contents
Financial Highlights
| For the Fiscal Year Ended June 30, | |||||
| Legacy Class | 2015 | 2014 | 2013 | 2012 | 2011 |
| Per Share Operating Performance | |||||
Net asset value, beginning of period | $ 37.86 | $ 44.31 | $ 45.06 | $ 47.61 | $ 33.94 |
| Income from investment operations | |||||
Net investment income (loss)1 | (0.15) | (0.11) | 0.05 | 0.10 | 0.08 |
Net realized and unrealized gain | 4.37 | 6.89 | 6.23 | 0.69 | 13.67 |
Net increase from investment operations | 4.22 | 6.78 | 6.28 | 0.79 | 13.75 |
| Less distributions to shareholders: | |||||
Distributions from net investment income | 0.00 | (0.00) 2 | (0.15) | (0.07) | (0.07) |
Distributions from net realized capital gains | (4.28) | (13.23) | (6.88) | (3.27) | (0.01) |
Total distributions to shareholders | (4.28) | (13.23) | (7.03) | (3.34) | (0.08) |
Redemption fees | 0.00 2 | 0.00 | 0.00 | 0.00 | 0.00 |
Net asset value, end of period | $ 37.80 | $ 37.86 | $ 44.31 | $ 45.06 | $ 47.61 |
Total return | 11.85% | 17.31% | 15.54% | 2.45% | 40.51% |
| Ratios to Average Net Assets | |||||
Ratio of net investment income (loss) to average net assets | (0.41)% | (0.27)% | 0.11% | 0.22% | 0.18% |
Ratio of expenses to average net assets: | 0.84% | 0.86% | 0.87% | 0.85% | 0.81% |
| Supplemental Data | |||||
Net Assets, End of Period (000's) | $1,937,346 | $2,021,197 | $2,112,945 | $2,484,084 | $2,615,082 |
Portfolio Turnover Rate | 46% | 96% | 37% | 25% | 26% |
| 1 | Per share net investment income has been calculated using the average daily shares method. |
| 2 | Less than $0.005 per share. |
| Meridian Funds | 41 | www.meridianfund.com |
Table of Contents
Financial Highlights
| For the Fiscal Year Ended June 30,2015 | For the Period Ended June 30,2014 | For the Fiscal Year Ended June 30,2015 | For the Period Ended June 30,2014 | ||||
| Investor Class | Investor Class1 | Advisor Class | Advisor Class1 | ||||
| Per Share Operating Performance | |||||||
Net asset value, beginning of period | $ 37.78 | $ 35.67 | $ 37.72 | $ 35.67 | |||
| Income from investment operations | |||||||
Net investment loss2 | (0.27) | (0.16) | (0.41) | (0.21) | |||
Net realized and unrealized gain | 4.37 | 2.27 | 4.33 | 2.26 | |||
Net increase from investment operations | 4.10 | 2.11 | 3.92 | 2.05 | |||
| Less distributions to shareholders: | |||||||
Distributions from net realized capital gains | (4.28) | (0.00) 3 | (4.28) | (0.00) 3 | |||
Total distributions to shareholders | (4.28) | (0.00) 3 | (4.28) | (0.00) 3 | |||
Redemption fees | 0.01 | 0.00 | 0.01 | 0.00 | |||
Net asset value, end of period | $ 37.61 | $ 37.78 | $ 37.37 | $ 37.72 | |||
Total return | 11.56% | 5.92% 4 | 11.08% | 5.75% 4 | |||
| Ratios to Average Net Assets | |||||||
Ratio of net investment loss to average net assets | (0.73)% | (0.70)% 5 | (1.11)% | (0.93)% 5 | |||
Ratio of expenses to average net assets: | |||||||
Before fees waived | 1.16% | 1.30% 5 | 1.69% | 2.00% 5 | |||
After fees waived6 | 1.16% | 1.30% 5 | 1.55% | 1.55% 5 | |||
| Supplemental Data | |||||||
Net Assets, End of Period (000's) | $ 42,062 | $ 18,749 | $ 8,812 | $ 4,904 | |||
Portfolio Turnover Rate | 46% | 96% 4 | 46% | 96% 4 | |||
| 1 | Commenced operations on November 15, 2013. |
| 2 | Per share net investment income has been calculated using the average daily shares method. |
| 3 | Less than $0.005 per share. |
| 4 | Not Annualized. |
| 5 | Annualized. |
| 6 | See Note 5 to Financial Statements. |
| Meridian Funds | 42 | www.meridianfund.com |
Table of Contents
Financial Highlights
| Institutional Class | For the Period Ended June 30, 20151 |
| Per Share Operating Performance | |
Net asset value, beginning of period | $ 36.44 |
| Income from investment operations | |
Net investment loss2 | (0.04) |
Net realized and unrealized gain | 1.39 |
Net increase from investment operations | 1.35 |
| Less distributions to shareholders: | |
Distributions from net investment income | 0.00 |
Distributions from net realized capital gains | 0.00 |
Total distributions to shareholders | 0.00 |
Net asset value, end of period | $ 37.79 |
Total return | 3.70% 3 |
| Ratios to Average Net Assets | |
Ratio of net investment loss to average net assets | (0.21)% 4 |
Ratio of expenses to average net assets: | |
Before fees waived | 1.15% 4 |
After fees waived5 | 0.90% 4 |
| Supplemental Data | |
Net Assets, End of Period (000's) | $ 19,575 |
Portfolio Turnover Rate | 46% 3 |
| 1 | Commenced operations on December 24, 2014. |
| 2 | Per share net investment income has been calculated using the average daily shares method. |
| 3 | Not Annualized. |
| 4 | Annualized. |
| 5 | See Note 5 to Financial Statements. |
| Meridian Funds | 43 | www.meridianfund.com |
Table of Contents
Financial Highlights
| For the Fiscal Year Ended June 30, | |||||
| Legacy Class | 2015 | 2014 | 2013 | 2012 | 2011 |
| Per Share Operating Performance | |||||
Net asset value, beginning of period | $ 45.52 | $ 37.20 | $ 30.60 | $ 29.59 | $ 22.80 |
| Income from investment operations | |||||
Net investment income (loss)1 | (0.00) 2 | 0.01 | 0.14 | 0.09 | 0.10 |
Net realized and unrealized gain | 2.66 | 8.63 | 6.57 | 1.05 3 | 6.77 |
Net increase from investment operations | 2.66 | 8.64 | 6.71 | 1.14 | 6.87 |
| Less distributions to shareholders: | |||||
Distributions from net investment income | (0.09) | (0.18) | (0.11) | (0.13) | (0.08) |
Distributions from net realized capital gains | (7.65) | (0.14) | 0.00 | 0.00 | 0.00 |
Total distributions to shareholders | (7.74) | (0.32) | (0.11) | (0.13) | (0.08) |
Redemption fees | 0.00 2 | 0.00 | 0.00 | 0.00 | 0.00 |
Net asset value, end of period | $ 40.44 | $ 45.52 | $ 37.20 | $ 30.60 | $ 29.59 |
Total return | 6.84% | 23.31% | 21.98% | 3.89% 3 | 30.13% |
| Ratios to Average Net Assets | |||||
Ratio of net investment income (loss) to average net assets | (0.01)% | 0.01% | 0.41% | 0.31% | 0.37% |
Ratio of expenses to average net assets: | 1.11% | 1.13% | 1.16% | 1.14% | 1.09% |
| Supplemental Data | |||||
Net Assets, End of Period (000's) | $677,138 | $764,882 | $704,523 | $688,467 | $869,312 |
Portfolio Turnover Rate | 76% | 67% | 55% | 20% | 38% |
| 1 | Per share net investment income has been calculated using the average daily shares method. |
| 2 | Less than $0.005 per share. |
| 3 | Includes a gain resulting from litigation payments on securities owned in a prior year. Without these gains, the net realized gains on investments per share would have been $0.99, and the total return would have been 3.69%. |
| Meridian Funds | 44 | www.meridianfund.com |
Table of Contents
Financial Highlights
| For the Fiscal Year Ended June 30,2015 | For the Period Ended June 30,2014 | For the Fiscal Year Ended June 30,2015 | For the Period Ended June 30,2014 | ||||
| Investor Class | Investor Class1 | Advisor Class | Advisor Class1 | ||||
| Per Share Operating Performance | |||||||
Net asset value, beginning of period | $ 45.47 | $ 42.64 | $ 45.41 | $ 42.64 | |||
| Income from investment operations | |||||||
Net investment loss2 | (0.09) | (0.02) | (0.22) | (0.08) | |||
Net realized and unrealized gain | 2.66 | 3.03 | 2.68 | 3.02 | |||
Net increase from investment operations | 2.57 | 3.01 | 2.46 | 2.94 | |||
| Less distributions to shareholders: | |||||||
Distributions from net investment income | 0.00 | (0.18) | 0.00 | (0.17) | |||
Distributions from net realized capital gains | (7.65) | (0.00) | (7.65) | (0.00) | |||
Total distributions to shareholders | (7.65) | (0.18) | (7.65) | (0.17) | |||
Redemption fees | 0.01 | 0.00 | 0.00 | 0.00 | |||
Net asset value, end of period | $ 40.40 | $ 45.47 | $ 40.22 | $ 45.41 | |||
Total return | 6.67% | 7.08% 3 | 6.38% | 6.91% 3 | |||
| Ratios to Average Net Assets | |||||||
Ratio of net investment loss to average net assets | (0.21)% | (0.09)% 4 | (0.52)% | (0.30)% 4 | |||
Ratio of expenses to average net assets: | |||||||
Before fees waived | 2.34% | 3.51% 4 | 3.46% | 7.46% 4 | |||
After fees waived5 | 1.35% | 1.35% 4 | 1.60% | 1.60% 4 | |||
| Supplemental Data | |||||||
Net Assets, End of Period (000's) | $ 1,008 | $ 1,564 | $ 622 | $ 462 | |||
Portfolio Turnover Rate | 76% | 67% 3 | 76% | 67% 3 | |||
| 1 | Commenced operations on November 15, 2013. |
| 2 | Per share net investment income has been calculated using the average daily shares method. |
| 3 | Not Annualized. |
| 4 | Annualized. |
| 5 | See Note 5 to Financial Statements. |
| Meridian Funds | 45 | www.meridianfund.com |
Table of Contents
Financial Highlights
| For the Fiscal Year Ended June 30, | |||||
| Legacy Class | 2015 | 2014 | 2013 | 2012 | 2011 |
| Per Share Operating Performance | |||||
Net asset value, beginning of period | $ 14.59 | $ 12.35 | $ 10.71 | $ 10.61 | $ 8.51 |
| Income from investment operations | |||||
Net investment income (loss)1 | 0.12 | 0.24 | 0.24 | 0.22 | 0.20 |
Net realized and unrealized gain | 0.47 | 2.22 | 1.68 | 0.09 | 2.11 |
Net increase from investment operations | 0.59 | 2.46 | 1.92 | 0.31 | 2.31 |
| Less distributions to shareholders: | |||||
Distributions from net investment income | (0.25) | (0.22) | (0.28) | (0.21) | (0.21) |
Distributions from net realized capital gains | (2.42) | 0.00 | 0.00 | 0.00 | 0.00 |
Total distributions to shareholders | (2.67) | (0.22) | (0.28) | (0.21) | (0.21) |
Redemption fees | 0.00 2 | 0.00 2 | 0.00 | 0.00 | 0.00 |
Net asset value, end of period | $ 12.51 | $ 14.59 | $ 12.35 | $ 10.71 | $ 10.61 |
Total return | 4.46% | 20.04% | 18.28% | 3.09% | 27.30% |
| Ratios to Average Net Assets | |||||
Ratio of net investment income to average net assets | 0.88% | 1.75% | 2.08% | 2.17% | 2.04% |
Ratio of expenses to average net assets: | |||||
Before fees waived | 1.33% | 1.37% | 1.53% | 1.41% | 1.25% |
After fees waived3 | 1.25% | 1.25% | 1.25% | 1.25% | 1.25% 4 |
| Supplemental Data | |||||
Net Assets, End of Period (000's) | $53,125 | $ 33,649 | $ 28,697 | $30,744 | $ 35,644 |
Portfolio Turnover Rate | 266% | 35% | 44% | 31% | 29% |
| 1 | Per share net investment income has been calculated using the average daily shares method. |
| 2 | Less than $0.005 per share. |
| 3 | See Note 5 to Financial Statements. |
| 4 | Includes fees waived, which were less than 0.01%. |
| Meridian Funds | 46 | www.meridianfund.com |
Table of Contents
Financial Highlights
| For the Fiscal Year Ended June 30,2015 | For the Period Ended June 30,2014 | For the Fiscal Year Ended June 30,2015 | For the Period Ended June 30,2014 | ||||
| Investor Class | Investor Class1 | Advisor Class | Advisor Class1 | ||||
| Per Share Operating Performance | |||||||
Net asset value, beginning of period | $ 14.60 | $ 13.87 | $ 14.58 | $ 13.87 | |||
| Income from investment operations | |||||||
Net investment income (loss)2 | (0.02) | 0.15 | (0.02) | 0.13 | |||
Net realized and unrealized gain | 0.61 | 0.79 | 0.58 | 0.78 | |||
Net increase from investment operations | 0.59 | 0.94 | 0.56 | 0.91 | |||
| Less distributions to shareholders: | |||||||
Distributions from net investment income | (0.24) | (0.21) | (0.22) | (0.20) | |||
Distributions from net realized capital gains | (2.42) | (0.00) | (2.42) | (0.00) | |||
Total distributions to shareholders | (2.66) | (0.21) | (2.64) | (0.20) | |||
Net asset value, end of period | $ 12.53 | $ 14.60 | $ 12.50 | $ 14.58 | |||
Total return | 4.44% | 6.87% 3 | 4.24% | 6.69% 3 | |||
| Ratios to Average Net Assets | |||||||
Ratio of net investment income (loss) to average net assets | (0.13)% | 1.72% 4 | (0.11)% | 1.55% 4 | |||
Ratio of expenses to average net assets: | |||||||
Before fees waived | 16.83% | 39.23% 4 | 7.46% | 132.38% 4 | |||
After fees waived5 | 1.35% | 1.35% 4 | 1.60% | 1.60% 4 | |||
| Supplemental Data | |||||||
Net Assets, End of Period (000's) | $ 335 | $ 45 | $ 501 | $ 13 | |||
Portfolio Turnover Rate | 266% | 35% 3 | 266% | 35% 3 | |||
| 1 | Commenced operations on November 15, 2013. |
| 2 | Per share net investment income has been calculated using the average daily shares method. |
| 3 | Not Annualized. |
| 4 | Annualized. |
| 5 | See Note 5 to Financial Statements. |
| Meridian Funds | 47 | www.meridianfund.com |
Table of Contents
Financial Highlights
| For the Fiscal Year Ended June 30,2015 | For the Period Ended June 30,2014 | For the Fiscal Year Ended June 30,2015 | For the Period Ended June 30,2014 | ||||
| Legacy Class | Legacy Class1 | Investor Class | Investor Class1 | ||||
| Per Share Operating Performance | |||||||
Net asset value, beginning of period | $ 11.65 | $ 10.00 | $ 11.65 | $ 10.00 | |||
| Income from investment operations | |||||||
Net investment loss2 | (0.09) | (0.04) | (0.10) | (0.04) | |||
Net realized and unrealized gain | 1.72 | 1.69 | 1.73 | 1.69 | |||
Net increase from investment operations | 1.63 | 1.65 | 1.63 | 1.65 | |||
| Less distributions to shareholders: | |||||||
Distributions from net investment income | 0.00 | 0.00 | (0.01) | 0.00 | |||
Distributions from net realized capital gains | (0.30) | 0.00 | (0.30) | 0.00 | |||
Total distributions to shareholders | (0.30) | 0.00 | (0.31) | 0.00 | |||
Redemption fees | 0.00 3 | 0.00 | 0.00 | 0.00 | |||
Net asset value, end of period | $ 12.98 | $ 11.65 | $ 12.97 | $ 11.65 | |||
Total return | 14.23% | 16.50% 4 | 14.14% | 16.50% 4 | |||
| Ratios to Average Net Assets | |||||||
Ratio of net investment loss to average net assets | (0.69)% | (0.61)% 5 | (0.83)% | (0.70)% 5 | |||
Ratio of expenses to average net assets: | |||||||
Before fees waived | 1.24% | 2.35% 5 | 1.33% | 3.63% 5 | |||
After fees waived6 | 1.20% | 1.20% 5 | 1.33% | 1.35% 5 | |||
| Supplemental Data | |||||||
Net Assets, End of Period (000's) | $ 59,459 | $ 9,839 | $131,211 | $ 2,135 | |||
Portfolio Turnover Rate | 45% | 78% 4 | 44% | 78% 4 | |||
| 1 | Commenced operations on December 16, 2013. |
| 2 | Per share net investment income has been calculated using the average daily shares method. |
| 3 | Less than $0.005 per share. |
| 4 | Not Annualized. |
| 5 | Annualized. |
| 6 | See Note 5 to Financial Statements. |
| Meridian Funds | 48 | www.meridianfund.com |
Table of Contents
Financial Highlights
| For The Fiscal Year Ended June 30,2015 | For The Period Ended June 30,2014 | For The Period Ended June 30,2015 | |||
| Advisor Class | Advisor Class1 | Institutional Class2 | |||
| Per Share Operating Performance | |||||
Net asset value, beginning of period | $ 11.63 | $ 10.00 | $ 12.23 | ||
| Income from investment operations | |||||
Net investment income (loss)3 | (0.13) | (0.06) | (0.02) | ||
Net realized and unrealized gain | 1.71 | 1.69 | 0.77 | ||
Net increase from investment operations | 1.58 | 1.63 | 0.75 | ||
| Less distributions to shareholders: | |||||
Distributions from net realized capital gains | (0.30) | 0.00 | 0.00 | ||
Total distributions to shareholders | (0.30) | 0.00 | 0.00 | ||
Redemption fees | 0.00 4 | 0.00 | 0.00 | ||
Net asset value, end of period | $ 12.91 | $ 11.63 | $ 12.98 | ||
Total return | 13.82% | 16.30% 5 | 6.13% 5 | ||
| Ratios to Average Net Assets | |||||
Ratio of net investment loss to average net assets | (1.09)% | (1.01)% 6 | (0.29)% 6 | ||
Ratio of expenses to average net assets: | |||||
Before fees waived | 1.69% | 2.99% 6 | 2.03% 6 | ||
After fees waived7 | 1.60% | 1.60% 6 | 1.10% 6 | ||
| Supplemental Data | |||||
Net Assets, End of Period (000's) | $ 45,186 | $ 6,524 | $ 13,035 | ||
Portfolio Turnover Rate | 44% | 78% 5 | 44% 5 | ||
| 1 | Commenced operations on December 16, 2013. |
| 2 | Commenced operations on December 24, 2014. |
| 3 | Per share net investment income has been calculated using the average daily shares method. |
| 4 | Less than $0.005 per share. |
| 5 | Not Annualized. |
| 6 | Annualized. |
| 7 | See Note 5 to Financial Statements. |
| Meridian Funds | 49 | www.meridianfund.com |
Table of Contents
Notes to Financial Statements
| 1. | Organization and Significant Accounting Policies: Meridian Fund, Inc. (the “Meridian Funds” or the “Company”) comprises the following separate series: the Meridian Growth Fund (the “Growth Fund”), the Meridian Contrarian Fund (the “Contrarian Fund”), the Meridian Equity Income Fund (the “Equity Income Fund”), and the Meridian Small Cap Growth Fund (the “Small Cap Growth Fund”) (each a “Fund” and collectively, the “Funds”). The Company is registered as an open-end investment company under the Investment Company Act of 1940 and is organized as a Maryland Corporation. |
| The Meridian Funds offer four share classes: Legacy Class Shares, Investor Class Shares, Advisor Class Shares and Institutional Class Shares. As of June 30, 2015, Institutional Class Shares of the Meridian Equity Income Fund and Meridian Contrarian Fund are not currently being offered for sale. Legacy Class Shares are available to investors who have continuously held an investment in any Meridian Fund prior to November 15, 2013. Institutional Class Shares are available to certain eligible investors including endowments, foundations and qualified retirement plans. Advisor Class and Investor Class Shares are available for purchase through financial intermediary platforms. All Classes are sold without a sales charge and have identical rights and privileges with respect to the Fund in general, and exclusive voting rights with respect to Class specific matters. Net Asset Value per share may differ by class due to each class having its own expenses directly attributable to that class. Investor Class and Advisor Class Shares are subject to shareholder servicing and sub-transfer agent fees. Advisor Class Shares are also subject to certain expenses related to the distribution of these shares. See Note 11 for further information on additional share classes and changes to shareholder servicing and distribution plans. | |
| The primary investment objectives of the Growth Fund and Contrarian Fund are to seek long-term growth of capital. | |
| The primary investment objective of the Equity Income Fund is to seek long-term growth of capital along with income as a component of total return. | |
| The primary investment objective of the Small Cap Growth Fund is to seek long-term growth of capital by investing primarily in equity securities of small capitalization companies. | |
| The Funds’ Board of Directors (the “Board”), and the Board and shareholders of Jordan Opportunity Fund (the “Target Fund”), approved the reorganization of the Target Fund into the Equity Income Fund pursuant to which the Equity Income Fund acquired substantially all of the assets and assumed substantially all of the liabilities of the Target Fund in exchange for an equal aggregate value of newly-issued Legacy Class shares of the Equity Income Fund. | |
| Each shareholder of the Target Fund received Legacy Class shares of the Equity Income Fund in an amount equal to the aggregate net asset value of such shareholder’s Target Fund shares, as determined at the close of business on June 12, 2015, less the costs of the Target Fund’s reorganization. | |
| The reorganization was accomplished by a tax-free exchange of shares of the Equity Income Fund in the following amounts and at the following conversion ratios: |
| Target Fund | Shares Prior To Reorganization | Conversion Ratio | Shares of Equity Income Fund | ||
| Jordan Opportunity Fund | 2,510,536 | 1.327805 | 3,333,502 |
| Target Fund | Paid-In Capital | Distributions in Excess of Net Investment Income | Realized Gain/Loss | Net Unrealized Appreciation/ Depreciation | Net Assets | ||||
| Jordan Opportunity Fund | $40,461,298 | $(312,518) | $324,647 | $1,636,531 | $42,109,958 |
| Meridian Funds | 50 | www.meridianfund.com |
Table of Contents
Notes to Financial Statements (continued)
| Target Fund | Fair Value of Investments | Cost of Investments | |
| Jordan Opportunity Fund | $42,122,077 | $40,485,547 |
| • | Net investment loss: $(149,432) |
| • | Net realized and change in unrealized gain/loss on investments: $4,396,282 |
| • | Net increase in net assets resulting from operations: $4,246,850 |
| a. | Share Valuation: The NAV of each Fund is calculated by dividing the sum of the value of the securities held by each Fund, plus cash or other assets, minus all liabilities (including estimated accrued expenses), by the total number of shares outstanding of each Fund. The result is rounded to the nearest cent. Each Funds’ shares will not be priced on the days in which the New York Stock Exchange (NYSE) is closed for trading. |
| b. | Investment Valuations: Equity securities are valued at the closing price or last sales price on the principal exchange or market on which they are traded; or, if there were no sales that day, at the last reported bid price. |
| Fixed income (debt) securities with original or remaining maturities in excess of 60 days are valued at the mean of their quoted bid and asked prices. Short-term debt securities with 60 days or less to maturity are valued at amortized cost which approximates fair market value. | |
| Exchange-traded options are valued at the mean between the last bid and ask prices at the close of the options market in which the options trade. An exchange-traded option for which there is no mean price is valued at the last bid (long positions) or ask (short positions) price. If no bid or ask price is available, the prior day’s price will be used, unless it is determined that the prior day’s price no longer reflects the fair value of the option. | |
| Securities and other assets for which reliable market quotations are not readily available or for which a significant event has occurred since the time of the most recent market quotation, will be valued based upon other available factors deemed relevant by the Adviser under the guidelines established by, and under the general supervision and responsibility of, the Board. These factors include but are not limited to (i) attributes specific to the investment; (ii) the principal market for the investment; (iii) the customary participants in the principal market for the investment; (iv) data assumptions by market participants for the investment, if reasonably available; (v) quoted prices for similar investments in active markets; and (vi) other factors, such as future cash flows, interest rates, yield curves, volatilities, prepayment speeds, loss severities, credit risks and/or default rates. Valuations based on such factors are reported to the Board on a quarterly basis. | |
| c. | Fair Value Measurements: As described in Note 1.b. above, the Funds utilize various methods to determine and |
| Meridian Funds | 51 | www.meridianfund.com |
Table of Contents
Notes to Financial Statements (continued)
| measure the fair value of investment securities on a recurring basis. The objective of a fair value measurement is to determine the price that would be received to sell an asset or paid to transfer a liability in an orderly transaction between market participants at the measurement date (an exit price). Accordingly, the fair value hierarchy gives the highest priority to quoted prices (unadjusted) in active markets for identical assets or liabilities (Level 1) and the lowest priority to unobservable inputs (Level 3) that are significant to the fair value instrument. The three levels of the fair value hierarchy are described below: | |
| Level 1 - quoted prices in active markets for identical securities; | |
| Level 2 - other significant observable inputs (including quoted prices for similar securities, interest rates, prepayment speeds, credit risk, etc.); and | |
| Level 3 - significant unobservable inputs (including the Fund’s determinations as to the fair value of investments). | |
| The inputs or methodology used for valuing securities are not necessarily an indication of the risks associated with investing in those securities. The summary of inputs used to value the Funds’ securities as of June 30, 2015 is as follows: |
| Valuation Inputs | Growth Fund | Contrarian Fund | Equity Income Fund | Small Cap Growth Fund | ||||
Level 1 - Quoted Prices* | $1,819,512,500 | $620,831,849 | $41,594,673 | $224,066,114 | ||||
Level 2 - Other Significant Observable Inputs | — | — | 504,375 | — | ||||
Level 3 - Significant Unobservable Inputs | — | — | — | — | ||||
Total Market Value of Investments | $1,819,512,500 | $620,831,849 | $42,099,048 | $224,066,114 | ||||
Call Options Written (Level 1) | $ — | $ — | $ (18,390) | $ — |
| * | Level 1 investments are comprised of common stock with industry classifications as defined on the Schedule of Investments. |
| d. | Investment Transactions and Investment Income: Security transactions are accounted for on the date the securities are purchased or sold (trade date). Realized gains and losses on security transactions are determined on the basis of specific identification for both financial statement and federal income tax purposes. Dividend income is recorded on the ex-dividend date. Interest income is accrued daily. |
| e. | Option writing: When the Fund writes an option, an amount equal to the premium received by the Fund is recorded as a liability and subsequently adjusted to the current fair value of the option written. Premiums received from writing options that expire unexercised are treated by the Fund on the expiration date as realized gains from investments. The difference between the premium and amount paid on effecting a closing purchase transaction, including brokerage commissions, is also treated as a realized gain or, if the premium is less than the amount paid for the closing purchase transaction, as a realized loss. If a call option is exercised, the premium is added to the proceeds from the sale of the underlying security or currency in determining whether the Fund has realized a gain or loss. If a put option is exercised, the premium reduces the cost basis of the securities purchased by the Fund. The Fund as writer of an option bears the market risk of an unfavorable change in the price of the security underlying the written option. |
| Meridian Funds | 52 | www.meridianfund.com |
Table of Contents
Notes to Financial Statements (continued)
| f. | Allocation of Income, Expenses, Gains and Losses: Income, gains and losses are allocated on a daily basis to each share class based on the relative proportion of the net assets of the class to each Fund’s total net assets. Expenses are allocated on the basis of relative net assets of the class to the Fund, or if an expense is specific to a share class, to that specific share class. |
| g. | Use of Estimates: The preparation of financial statements in accordance with accounting principals generally accepted in the U.S. (“GAAP”) requires management to make estimates and assumptions that affect the reported amount of assets and liabilities and revenue and expenses at the date of the financial statements. Actual amounts could differ from those estimates, and such differences could be significant. |
| h. | Foreign Currency Translation: Securities denominated in foreign currencies are converted into U.S. dollars using the spot market rate of exchange at the time of valuation. Purchases and sales of such securities and related dividend and interest income are converted into U.S. dollars using the spot market rate of exchange prevailing on the respective dates of such translations. The Funds do not separately report the effect of changes in foreign exchange rates from changes in market prices on securities held. Such changes are included in net realized and unrealized gain or loss from investments as reported in the Statement of Operations. |
| i. | Federal Income Taxes: It is the Funds’ policy to comply with the requirements of Subchapter M of the Internal Revenue Code of 1986, as amended, applicable to regulated investment companies and to distribute all of their taxable income to their shareholders; therefore, no federal income tax provision is required. |
| j. | Distributions to Shareholders: The Funds record distributions to shareholders on the ex-dividend date. The amount of distributions from net investment income and net realized capital gains are determined in accordance with federal income tax regulations which may differ from GAAP. These “book/tax” differences are either considered temporary or permanent in nature. To the extent these differences are permanent in nature, such amounts are reclassified within the capital accounts based on their federal tax-basis treatment; temporary differences do not require reclassification. |
| Distributions which exceed net investment income and net realized capital gains are reported as distributions in excess of net investment income or distributions in excess of net realized capital gains for financial reporting purposes but not for tax purposes. To the extent they exceed net investment income and net realized capital gains for tax purposes, they are reported as distributions of paid-in-capital. | |
| k. | Guarantees and Indemnification: Under the Funds’ organizational documents, its Officers and Directors are indemnified against certain liability arising out of the performance of their duties to the Funds. Additionally, in the normal course of business, the Funds enter into contracts with service providers that contain general indemnification clauses. The Funds’ maximum exposure under these arrangements is unknown, as this would involve future claims that may be made against the Funds that have not yet occurred. However, based on experience, the Funds expect the risk of loss to be remote. |
| 2. | Capital Shares Transactions: Transactions in capital shares were as follows: |
| Meridian Funds | 53 | www.meridianfund.com |
Table of Contents
Notes to Financial Statements (continued)
| Year Ended June 30, 20151 | Year Ended June 30, 20142 | |||||
| Shares | Amount | Shares | Amount | |||
| Growth Fund: | ||||||
| Legacy Class | ||||||
Shares sold | 6,497,797 | $ 240,532,008 | 10,014,988 | $ 393,045,340 | ||
Shares issued from reinvestment of distributions | 6,062,601 | 215,889,243 | 16,379,845 | 581,156,891 | ||
Redemption fees | — | 20,823 | — | 57,692 | ||
Shares redeemed | (14,697,527) | (549,202,740) | (20,688,964) | (804,765,033) | ||
Net increase/(decrease) | (2,137,129) | $ (92,760,666) | 5,705,869 | $ 169,494,890 | ||
| Investor Class | ||||||
Shares sold | 920,727 | $ 34,143,889 | 544,259 | $ 20,321,746 | ||
Shares issued from reinvestment of distributions | 83,780 | 2,973,367 | — | — | ||
Redemption fees | — | 9,917 | — | 3,821 | ||
Shares redeemed | (382,401) | (14,102,596) | (47,960) | (2,225,053) | ||
Net increase | 622,106 | $ 23,024,577 | 496,299 | $ 18,100,514 | ||
| Advisor Class | ||||||
Shares sold | 176,885 | $ 6,547,088 | 146,597 | $ 5,320,397 | ||
Shares issued from reinvestment of distributions | 15,188 | 536,592 | — | — | ||
Redemption fees | — | 1,509 | — | 1,301 | ||
Shares redeemed | (86,276) | (3,194,129) | (16,577) | (606,556) | ||
Net increase | 105,797 | $ 3,891,060 | 130,020 | $ 4,715,142 | ||
| Institutional Class | ||||||
Shares sold | 521,290 | $ 19,592,273 | — | $ — | ||
Shares issued from reinvestment of distributions | — | — | — | — | ||
Shares redeemed | (3,366) | (127,000) | — | — | ||
Net increase | 517,924 | $ 19,465,273 | — | $ — | ||
| Meridian Funds | 54 | www.meridianfund.com |
Table of Contents
Notes to Financial Statements (continued)
| Year Ended June 30, 20151 | Year Ended June 30, 20142 | |||||
| Shares | Amount | Shares | Amount | |||
| Contrarian Fund: | ||||||
| Legacy Class | ||||||
Shares sold | 126,877 | $ 5,277,730 | 241,010 | $ 10,132,026 | ||
Shares issued from reinvestment of distributions | 2,985,897 | 113,941,819 | 134,284 | 5,700,050 | ||
Redemption fees | — | 8,643 | — | 10,129 | ||
Shares redeemed | (3,171,397) | (134,972,919) | (2,512,845) | (105,721,357) | ||
Net decrease | (58,623) | $ (15,744,727) | (2,137,551) | $ (89,879,152) | ||
| Investor Class | ||||||
Shares sold | 3,360 | $ 141,443 | 34,399 | $ 1,500,479 | ||
Shares issued from reinvestment of distributions | 3,732 | 142,308 | 1 | 54 | ||
Redemption fees | — | 139 | — | — | ||
Shares redeemed | (16,549) | (727,305) | — | — | ||
Net increase/(decrease) | (9,457) | $ (443,415) | 34,400 | $ 1,500,533 | ||
| Advisor Class | ||||||
Shares sold | 13,232 | $ 582,725 | 10,182 | $ 438,766 | ||
Shares issued from reinvestment of distributions | 2,821 | 107,325 | 1 | 39 | ||
Shares redeemed | (10,759) | (433,410) | (18) | (1,750) | ||
Net increase | 5,294 | $ 256,640 | 10,165 | $ 437,055 | ||
| Equity Income Fund: | ||||||
| Legacy Class | ||||||
Shares sold | 3,698,867 3 | $45,005,167 3 | 53,466 | $ 735,117 | ||
Shares issued from reinvestment of distributions | 490,554 | 6,112,916 | 36,708 | 494,457 | ||
Redemption fees | — | 198 | — | 542 | ||
Shares redeemed | (2,249,917) | (27,399,494) | (107,442) | (1,469,985) | ||
Net increase/(decrease) | 1,939,504 | $ 23,718,787 | (17,268) | $ (239,869) | ||
| Investor Class | ||||||
Shares sold | 22,979 | $ 291,957 | 3,098 | $ 43,105 | ||
Shares issued from reinvestment of distributions | 674 | 8,412 | 11 | 148 | ||
Shares redeemed | — | — | — | — | ||
Net increase | 23,653 | $ 300,369 | 3,109 | $ 43,253 | ||
| Advisor Class | ||||||
Shares sold | 48,390 | $ 634,811 | 885 | $ 12,285 | ||
Shares issued from reinvestment of distributions | 1,696 | 21,110 | 11 | 145 | ||
Redemption fees | — | — | — | 2 | ||
Shares redeemed | (10,910) | (149,718) | (13) | (181) | ||
Net increase | 39,176 | $ 506,203 | 883 | $ 12,251 | ||
| Meridian Funds | 55 | www.meridianfund.com |
Table of Contents
Notes to Financial Statements (continued)
| Year Ended June 30, 20151 | Year Ended June 30, 20142 | |||||
| Shares | Amount | Shares | Amount | |||
| Small Cap Growth Fund: | ||||||
| Legacy Class | ||||||
Shares sold | 3,852,242 | $ 46,370,426 | 844,877 | $8,575,976 | ||
Shares issued from reinvestment of distributions | 70,018 | 835,314 | — | — | ||
Redemption fees | — | 1,241 | — | — | ||
Shares redeemed | (185,662) | (2,261,922) | (339) | (3,739) | ||
Net increase | 3,736,598 | $ 44,945,059 | 844,538 | $8,572,237 | ||
| Investor Class | ||||||
Shares sold | 11,475,007 | $138,940,112 | 183,546 | $1,977,647 | ||
Shares issued from reinvestment of distributions | 65,822 | 784,601 | — | — | ||
Redemption fees | — | 58,412 | — | — | ||
Shares redeemed | (1,610,523) | (20,312,792) | (241) | (2,514) | ||
Net increase | 9,930,306 | $119,470,333 | 183,305 | $1,975,133 | ||
| Advisor Class | ||||||
Shares sold | 3,469,892 | $ 41,768,471 | 606,032 | $6,471,230 | ||
Shares issued from reinvestment of distributions | 45,993 | 546,859 | — | — | ||
Redemption fees | — | 4,039 | — | 588 | ||
Shares redeemed | (576,238) | (7,063,995) | (45,099) | (477,276) | ||
Net increase | 2,939,647 | $ 35,255,374 | 560,933 | $5,994,542 | ||
| Institutional Class | ||||||
Shares sold | 1,008,763 | $ 12,908,934 | — | $ — | ||
Shares issued from reinvestment of distributions | — | — | — | — | ||
Shares redeemed | (4,797) | (59,239) | — | — | ||
Net increase | 1,003,966 | $ 12,849,695 | — | $ — | ||
| 1 | For the twelve months ending June 30, 2015 for Legacy, Investor, and Advisor Class Shares of all Funds. For the period from December 24, 2014 for the Institutional Class Shares for the Growth and Small Cap Growth Funds. |
| 2 | For the twelve month period ending June 30, 2014 for Legacy Class Shares of the Growth, Contrarian, and Equity Income Funds. For the period from November 15, 2013 for Institutional and Advisor Class Shares for the Growth, Contrarian, and Equity Income Funds. For the period from December 16, 2013 for all Classes of Small Cap Growth Fund. |
| 3 | Includes shares and dollars issued in connection with reorganization of the Target Fund in the amount of 3,333,502 shares and $42,122,077, respectively. |
| 3. | Investment Transactions: The cost of investments purchased and the proceeds from sales of investments, excluding short-term securities and U.S. government obligations, for the year ended June 30, 2015, were as follows: |
| Purchases | Proceeds from Sales | ||
Growth Fund | $843,925,650 | $1,154,056,746 | |
Contrarian Fund | $499,900,865 | $ 630,708,056 | |
Equity Income Fund | $ 63,350,817 | $ 60,041,566 | |
Small Cap Growth Fund | $233,786,260 | $ 47,536,966 |
| Meridian Funds | 56 | www.meridianfund.com |
Table of Contents
Notes to Financial Statements (continued)
| 4. | Options: Certain Funds purchase and write call and put options to increase or decrease their exposure to underlying instruments (including equity risk, interest rate risk and/or commodity price risk) and/or, in the case of options written, to generate gains from options premiums. A call option gives the purchaser (holder) of the option the right (but not the obligation) to buy, and obligates the seller (writer) to sell (when the option is exercised) the underlying instrument at the exercise or strike price at any time or at a specified time during the option period. A put option gives the holder the right to sell and obligates the writer to buy the underlying instrument at the exercise or strike price at any time or at a specified time during the option period. When the Funds purchase (write) an option, an amount equal to the premium paid (received) by the Funds is reflected as an asset (liability). The amount of the asset (liability) is subsequently marked-to-market to reflect the current market value of the option purchased (written). When an instrument is purchased or sold through an exercise of an option, the related premium paid (or received) is added to (or deducted from) the basis of the instrument acquired or deducted from (or added to) the proceeds of the instrument sold. When an option expires (or the Funds enter into a closing transaction), the Funds realize a gain or loss on the option to the extent of the premiums received or paid (or gain or loss to the extent the cost of the closing transaction exceeds the premiums received or paid). When the Funds write a call option, such option is “covered,” meaning that the Funds hold the underlying instrument subject to being called by the option counterparty. When the Funds write a put option, such option is covered by cash in an amount sufficient to cover the obligation. |
| In purchasing and writing options, the Funds bear the risk of an unfavorable change in the value of the underlying instrument or the risk that the Funds may not be able to enter into a closing transaction due to an illiquid market. Exercise of a written option could result in the Funds purchasing or selling a security when it otherwise would not, or at a price different from the current market value. | |
| Transactions in options written during the year ended June 30, 2015, were as follows: |
| Meridian Equity Income Fund | Number of Contracts | Premiums Received | |
Options outstanding at June 30, 2014 | — | $ — | |
Options written | 567 | 250,571 | |
Options terminated in closing purchase transactions | (486) | (193,507) | |
Options expired | (9) | (1,233) | |
Options exercised | — | — | |
Options outstanding at June 30, 2015 | 72 | $ 55,831 |
| 5. | Market and Debt Securities Risk |
| In the normal course of business, each Funds’ investment activities expose it to various types of risk associated with the financial instruments and markets in which it invests. The significant types of financial risks each Fund is exposed to include market risk and debt securities risk. Each Fund’s prospectus provides details of these and other types of risk. | |
| Market Risk: Market risk refers to the possibility that the market values of securities or other investments that a Fund holds will fall, sometimes rapidly or unpredictably, or fail to rise. Security values may fall or fail to rise because of a variety of factors affecting (or the market’s perception of) individual companies or other issuers (e.g., an unfavorable earnings report), industries or sectors, or the market as a whole, reducing the value of an investment in a Fund. Accordingly, an investment in the Fund could lose money over short or even long periods. The market values of the securities the Fund holds also can be affected by changes (or perceived changes) in U.S. or foreign economies and financial markets, and the liquidity of these securities, among other factors. In general, equity securities tend to have greater price volatility than debt securities. In addition, stock prices may be sensitive to rising interest rates, as the cost of capital rises and borrowing costs increase. As a result, the value of your investments in a Fund may be more or less than the value of your purchase price. |
| Meridian Funds | 57 | www.meridianfund.com |
Table of Contents
Notes to Financial Statements (continued)
| Debt Securities Risk: Each Fund may invest in debt securities of both governmental and corporate issuers. A decline in prevailing levels of interest rates generally increases the value of debt securities in a Fund’s portfolio, while an increase in rates usually reduces the value of those securities. The value of a Fund’s debt securities, including bonds and convertible securities, are affected by movements in interest rates; if interest rates rise, the value of these securities may fall. Generally, the longer the average maturity of a debt security, the greater the change in its value. As a result, to the extent that a Fund invests in debt securities, interest rate fluctuations will affect the Fund’s net asset value, but not the income it receives from debt securities it owns. Debt securities are also subject to credit, liquidity risk and prepayment and extension risk. Credit risk is the risk that the entity that issued a debt security may become unable to make payments of principal and interest, and includes the risk of default. Liquidity risk is the risk that a Fund may not be able to sell portfolio securities because there are too few buyers for them. Prepayment and extension risk is the risk that a loan, bond or other security might be called or otherwise converted, prepaid or redeemed before maturity. If a loan or security is converted, prepaid or redeemed before maturity, particularly during a time of declining interest rates or spreads, the portfolio managers may not be able to invest the proceeds in securities or loans providing as high a level of income, resulting in a reduced yield to a Fund. Conversely, as interest rates rise or spreads widen, the likelihood of prepayment decreases. The portfolio managers may be unable to capitalize on securities with higher interest rates or wider spreads because a Fund’s investments are locked in at a lower rate for a longer period of time. |
| 6. | Affiliate Transactions and Fees |
| Management Fees: Under the Investment Management Agreement, the Adviser receives the following fees for providing certain investment management and other services necessary for managing each Fund. The fee is paid monthly in arrears and calculated based on that month’s daily average net assets. |
| Growth Fund: | Contrarian and Small Cap Growth Funds: | |||||
| Average Daily Net Assets | Investment Management Fee | Average Daild Net Assets | Investment Management Fee | |||
Up to $50,000,000 | 1.00% | Greater than $0 | 1.00% | |||
Greater than $50,000,000 | 0.75% | |||||
| Equity Income Fund: | ||
| Average Daily Net Assets | Investment Management Fee | |
Up to $10,000,000 | 1.00% | |
$10,000,001 to $30,000,000 | 0.90% | |
$30,000,001 to $50,000,000 | 0.80% | |
Greater than $50,000,000 | 0.70% | |
| Meridian Funds | 58 | www.meridianfund.com |
Table of Contents
Notes to Financial Statements (continued)
| Expense Limitation | Total Waivers and Reimbursements for the year ended June 30, 2015 | ||
| Growth Fund | |||
Investor Class | 1.30% | $ — | |
Advisor Class | 1.55% | $ 8,383 | |
Institutional Class | 0.90% | $ 9,930 | |
| Contrarian Fund | |||
Investor Class | 1.35% | $10,946 | |
Advisor Class | 1.60% | $12,480 | |
| Equity Income Fund | |||
Legacy Class | 1.25% | $17,471 | |
Investor Class | 1.35% | $13,130 | |
Advisor Class | 1.60% | $13,898 | |
| Small Cap Growth Fund | |||
Legacy Class | 1.20% | $14,331 | |
Investor Class | 1.35% | $ — | |
Advisor Class | 1.60% | $22,327 | |
Institutional Class | 1.10% | $14,632 |
| Expiration June 30, 2015, | |||||
| 2016 | 2017 | 2018 | |||
Growth Fund | — | $ 7,178 | $18,313 | ||
Contrarian Fund | — | 16,794 | 23,426 | ||
Equity Income Fund | $75,932 | 54,486 | 44,499 | ||
Small Cap Growth Fund | — | 77,336 | 51,290 | ||
| 7. | Directors and Officers: Certain Directors and/or Officers of the Funds are also Directors and/or Officers of the Adviser. Directors and Officers of the Funds who are Directors and/or Officers of the Adviser receive no compensation from the Funds. Each Non-Interested Director is paid an annual fee set at $40,000. An additional $5,000 is paid to each Non-Interested Director for attendance at each in-person meeting of the Board and an additional $1,000 is paid to each Non-Interested Director for participating in a telephonic meeting of the Board. An additional $3,000 is paid to each member of the Audit or Governance Committee of the Board for attendance at an in-person Audit or Governance Committee meeting and an additional $1,000 is paid to each member of the Audit or Governance Committee of the Board for participating in a telephonic Audit or Governance Committee meeting. |
| An additional $10,000 is paid to the Chairman of the Board and the Chairman of a Committee of the Board. The Chairman of the Board also receives an additional $2,500 for attending each in-person meeting of the Board. The Chairman of a Committee receives an additional $2,000 for attending each in person Committee meeting. |
| Meridian Funds | 59 | www.meridianfund.com |
Table of Contents
Notes to Financial Statements (continued)
| 8. | Distribution Information: Income and long-term capital gains distributions are determined in accordance with federal income tax regulations, which may differ from GAAP. The tax character of distributions made during the fiscal year ended June 30, 2015 is as follows: |
| 2015 Taxable Distributions | |||||
| Ordinary Income | Net Long-Term Capital Gain | Total Distributions | |||
Growth Fund | $77,347,939 | $145,847,477 | $223,195,416 | ||
Contrarian Fund | 880,964 | 116,600,237 | 117,481,201 | ||
Equity Income Fund | 635,031 | 5,594,682 | 6,229,713 | ||
Small Cap Growth Fund | 2,331,863 | — | 2,331,863 | ||
| 9. | Federal Income Taxes Information: Management has analyzed the Funds’ tax positions taken on federal income tax returns for all open tax years (current and prior three tax years), and has concluded that no provision for federal income tax is required in the Funds’ financial statements. The Funds’ federal and state income and federal excise tax returns for tax years for which the applicable statutes of limitations have not expired are subject to examination by the Internal Revenue Service and state departments of revenue. The Funds are not aware of any tax positions for which it is reasonably possible that the total amounts of unrecognized tax benefits will significantly change in the next 12 months. The Funds recognize interest and penalties, if any, related to unrecognized tax benefits as income tax expense in the Statement of Operations. During the year ended June 30, 2015, the Funds did not incur any interest or penalties. |
| Permanent differences, incurred during the year ended June 30, 2015, resulting from differences in book and tax accounting have been reclassified at year end to undistributed net investment income and accumulated realized gain/(loss) as follows: |
| (Decrease) Paid-in-Capital | Increase/(Decrease) Undistributed Net Investment Income/(Loss) | Increase/(Decrease) Accumulated Realized Gain/(Loss) | |||
Growth Fund | — | $8,327,330 | $(8,327,330) | ||
Contrarian Fund | — | 404,006 | (404,006) | ||
Equity Income Fund | $(2,654) | (16,155) | 18,809 | ||
Small Cap Growth Fund | — | 1,038,384 | (1,038,384) |
| Aggregrate Cost | Aggregrate Gross Unrealized Appreciation | Aggregrate Gross Unrealized Depreciation | Net Unrealized Appreciation | ||||
Growth Fund | $1,616,183,480 | $312,579,083 | $(109,250,063) | $203,329,020 | |||
Contrarian Fund | 517,018,297 | 115,023,405 | (11,209,853) | 103,813,552 | |||
Equity Income Fund | 40,287,957 | 2,768,013 | (956,922) | 1,811,091 | |||
Small Cap Growth Fund | 208,547,823 | 24,332,566 | (8,814,275) | 15,518,291 |
| Components of Accumulated Earnings (Losses) on a Tax Basis | |||||||
| Growth Fund | Contrarian Fund | Equity Income Fund | Small Cap Growth Fund | ||||
Undistributed ordinary income | $ 38,193,978 | — | — | $ 3,839,170 | |||
Capital loss carry forward | — | — | — | — | |||
Undistributed long-term capital gains | 143,302,654 | $ 78,934,769 | $1,957,387 | 472,034 | |||
Unrealized appreciation/(depreciation) | 203,329,020 | 103,813,552 | 1,848,532 | 15,518,291 | |||
Qualified late year deferred losses | — | (777,304) | — | — | |||
Total Accumulated Earnings/(Losses) | $384,825,652 | $181,971,017 | $3,805,919 | $19,829,495 | |||
| Meridian Funds | 60 | www.meridianfund.com |
Table of Contents
Notes to Financial Statements (continued)
| 10. | Other Matters: As of April 9, 2010, the Adviser and certain affiliated entities became defendants in a lawsuit brought by another company alleging trademark infringement, unfair competition and related claims. The complaint alleges that the Adviser’s and affiliated entities’ use of their Arrowpoint trademark and the Arrowpoint logo infringes the rights of the plaintiff in various trademarks that it uses. The complaint seeks injunctive relief requiring the Adviser and the affiliated entities to cease use of the Arrowpoint trademark and logo and unspecified monetary damages, which the plaintiff claims to be unable to quantify. The Adviser has responded to the lawsuit in the United States District Court for the District of Delaware by denying the material allegations of the compliant and opposing the plaintiff’s motion for a preliminary injunction, which is now pending before the Court. |
| The Adviser believes the complaint to be without legal merit and intends to defend against it vigorously. Any legal costs associated with the compliant will be borne by the Adviser, and not the Meridian Funds. While an outcome regarding the complaint is unknown at this time, the Adviser believes that this complaint should not have a material effect on its operations or impair its ability to perform its duties to the Meridian Funds. |
| 11. | Subsequent Events: On July 1, 2015, the Funds launched two new classes of shares: Class A Shares (formerly known as the Advisor Class Shares) and Class C Shares. |
| Also effective July 1, 2015, the shareholder servicing fees was reduced for the Investor Class Shares and the Adviser Class Shares (now Class A) from 0.25% to 0.05%. Going forward, the Investor Class Shares, Class A Shares and Class C Shares will be charged an annual shareholding servicing fee of 0.05% under the revised Shareholder Servicing Plan. Class A Shares and Class C Shares will additionally incur charges under a Distribution Plan at annual rates of 0.25% and 1.00%, respectively. | |
| Management has evaluated the impact of all subsequent events on the Funds through the date the financial statements were issued, and has noted no additional events that require recognition or disclosure in the financial statements. |
| Meridian Funds | 61 | www.meridianfund.com |
Table of Contents
| Meridian Funds | 62 | www.meridianfund.com |
Table of Contents
Information About the Directors and Officers
| Interested Directors* | Positions(s) Held with Fund: | Length of Service (Beginning Date) | Principal Occupation(s) During Past 5 Years | Number of Portfolios Overseen | Other Directorships |
| Michael Stolper* (70) | Director | Indefinite term since May 3, 1985 | President, Stolper & Company, Inc. (an investment adviser), September 1975 to present; Managing Director, Windowpane Advisors, LLC (an investment adviser), January 1, 2005 to present; Trustee, Ewing Marion Kauffman Foundation, March 2010 to present. | 4 | Window Pane Funds (one portfolio) |
| * Mr. Stolper is treated as an “interested” person of the Funds, as such term is defined in the 1940 Act, because, as a result of his prior ownership interest in Aster Investment Management, Inc. (the “Previous Investment Adviser”, the previous investment adviser to the Meridian Equity Income Fund, Meridian Growth Fund, and Meridian Contrarian Fund.) | |||||
| Non-Interested Directors | Position(s) Held with Fund: | Length of Service (Beginning Date) | Princiapl Occupation(s) During Past 5 Years | Number of Portfolios Overseen | Other Directorships |
| Guy M. Arnold, CFA (47) | Director | Indefinite term since May 12, 2015 | President of Hunt Development Group from July 2015 to present; Owner/Manager of GMA Holdings, LLC from January 2013 to July 2015; President of Dividend Capital Diversified Property Fund from January 2008 to January 2013. | 4 | MidFirst Bank –Colorado Advisory Member, The Children's Hospital of Colorado Finance Committee |
| John S. Emrich, CFA (47) | Director | Indefinite term since October 6, 2010 | Private Investor, January 2011 to present; Co- Founder and Portfolio Manager, Ironworks Capital Management (an investment adviser), April 2005 to December 2010; Member and Manager, Iroquois Valley Farms, LLC, June 2012 to present. | 4 | None |
| Michael S. Erickson (63) | Director | Indefinite term since May 3, 1985 | Private Investor, August 2007 to present. | 4 | None |
| James Bernard Glavin (80) | Director and Chairman of the Board | Indefinite term since May 3, 1985 | Retired; previously Chairman of the Board, Orchestra Theraputics, Inc. | 4 | None |
| Edward F. Keely (48) | Director | Indefinite term since February 13, 2015 | Chief Investment Officer/Portfolio Manager at Borgen Investment Group, 2008 to present. | 4 | None |
| Officers | Position(s) Held with Fund: | Length of Service | Principal Occupation(s) During Past 5 Years |
| David Corkins (48) | President (Principal Executive Officer) | Indefinite; Since September 5, 2013 | Co-Founder, Principal and Portfolio Manager, Arrowpoint Asset Management, LLC |
| Rick Grove (46) | Vice President, Secretary and Chief Compliance Officer | Indefinite; Since September 5, 2013 | Chief Operating Officer and Chief Compliance Officer, Arrowpoint Asset Management, LLC |
| Derek Mullins (41) | Chief Financial Officer (Principal Financial Officer) and Treasurer | Indefinite; Since September 5, 2013 | Director of Operations, Arrowpoint Asset Management, LLC |
| Katie Jones (31) | Assistant Treasurer | Indefinite; Since August 12, 2014 | Controller, Arrowpoint Asset Management, LLC; formerly, Assistant Controller and Alternative Investment Accounting Supervisor, ALPS Fund Services |
| Meridian Funds | 63 | www.meridianfund.com |
Table of Contents
2015 TAX NOTICE TO SHAREHOLDERS (Unaudited)
| Growth Fund | 12.81% |
| Contrarian Fund | 100.00% |
| Equity Income Fund | 100.00% |
| Small Cap Growth Fund | 6.81% |
| Growth Fund | 13.59% |
| Contrarian Fund | 100.00% |
| Equity Income Fund | 100.00% |
| Small Cap Growth Fund | 6.96% |
| Growth Fund | 0.00% |
| Contrarian Fund | 0.00% |
| Equity Income Fund | 0.00% |
| Small Cap Growth Fund | 0.00% |
| Meridian Funds | 64 | www.meridianfund.com |
Table of Contents
Glossary of Terms Used in this Report (Unaudited)
| Meridian Funds | 65 | www.meridianfund.com |
Table of Contents
Other Information (Unaudited)
(800) 446-6662
(303) 398-2929
(877) 796-3434
Arrowpoint Asset Management LLC
100 Fillmore Street, Suite 325
Denver, CO 80206
Destra Capital Investments LLC
One North Wacker Drive, 48th Floor
Chicago, IL 60606
BNY Mellon Investment Servicing (US) Inc.
760 Moore Road
King of Prussia, PA
The Bank of New York Mellon
2 Hanson Place, 7th Floor
Brooklyn, NY 11217
Davis Graham & Stubbs LLP
1550 Seventeenth Street, Suite 500
Denver, CO 80202
PricewaterhouseCoopers LLP
Three Embarcadero Center
San Francisco, CA 94111
James B. Glavin, Chairman
Guy M. Arnold
John Emrich
Michael S. Erickson
Edward Keely
Michael Stolper*
David Corkins, President
Derek Mullins, Treasurer
Richard Grove, Vice President, Secretary & Chief Compliance Officer
Table of Contents
Item 2. Code of Ethics.
| (a) | The registrant, as of the end of the period covered by this report, has adopted a code of ethics that applies to the registrant’s principal executive officer, principal financial officer, principal accounting officer or controller, or persons performing similar functions, regardless of whether these individuals are employed by the registrant or a third party. |
| (c) | There have been no amendments, during the period covered by this report, to a provision of the code of ethics that applies to the registrant’s principal executive officer, principal financial officer, principal accounting officer or controller, or persons performing similar functions, regardless of whether these individuals are employed by the registrant or a third party, and that relates to any element of the code of ethics description. |
| (d) | The registrant has not granted any waivers, including an implicit waiver, from a provision of the code of ethics that applies to the registrant’s principal executive officer, principal financial officer, principal accounting officer or controller, or persons performing similar functions, regardless of whether these individuals are employed by the registrant or a third party, that relates to one or more of the items set forth in paragraph (b) of this item’s instructions. |
| (f) | A copy of the registrant’s code of ethics is filed as Exhibit 12(a)(1) to this report. |
Item 3. Audit Committee Financial Expert.
As of the end of the period covered by the report, the registrant’s board of directors has determined that James Glavin is qualified to serve as an audit committee financial expert serving on its audit committee and that he is “independent,” as defined by Item 3 of Form N-CSR.
Item 4. Principal Accountant Fees and Services.
Audit Fees
| (a) | The aggregate fees billed for each of the last two fiscal years for professional services rendered by the principal accountant for the audit of the registrant’s annual financial statements or services that are normally provided by the accountant in connection with statutory and regulatory filings or engagements for those fiscal years are $137,800 in 2015 and $122,800 in 2014. |
Audit-Related Fees
| (b) | The aggregate fees billed in each of the last two fiscal years for assurance and related services by the principal accountant that are reasonably related to the performance of the audit of the registrant’s financial statements and are not reported under paragraph (a) of this Item are $0 in 2015 and $0 in 2014. |
Table of Contents
Tax Fees
| (c) | The aggregate fees billed in each of the last two fiscal years for professional services rendered by the principal accountant for tax compliance, tax advice, and tax planning are $32,480 in 2015 and $31,220 in 2014. |
All Other Fees
| (d) | The aggregate fees billed in each of the last two fiscal years for products and services provided by the principal accountant, other than the services reported in paragraphs (a) through (c) of this Item are $0 in 2015 and $0 in 2014. |
| (e)(1) | Disclose the audit committee’s pre-approval policies and procedures described in paragraph (c)(7) of Rule 2-01 of Regulation S-X. |
PRE-APPROVAL OF AUDIT AND PERMITTED NON-AUDIT SERVICES PROVIDED TO THE COMPANY
| 1. | Pre-Approval Requirements. The Committee shall pre-approve all auditing services and permissible non-audit services (e.g., tax services) to be provided to the Company by the Auditor, including the fees therefore. The Committee may delegate to one or more of its members the authority to grant pre-approvals. In connection with such delegation, the Committee shall establish pre-approval policies and procedures, including the requirement that the decisions of any member to whom authority is delegated under this section shall be presented to the full Committee at each of its scheduled meetings. |
| 2. | De Minimis Exception to Pre-Approval: Pre-approval for a permitted non-audit service shall not be required if: |
| a. | the aggregate amount of all such non-audit services is not more than 5% of the total revenues paid by the Company to the Auditor in the fiscal year in which the non-audit services are provided; |
| b. | such services were not recognized by the Company at the time of the engagement to be non-audit services; and |
| c. | such services are promptly brought to the attention of the Committee and approved prior to the completion of the audit by the Committee or by one or more members of the Committee to whom authority to grant such approvals has been delegated by the Committee. |
Additionally, the Committee shall pre-approve the Auditor’s engagements for non-audit services with the Adviser and any affiliate of the Adviser that provides ongoing services to the Company in accordance with the foregoing, if the engagement relates directly to the operations and financial reporting of the Company, unless the aggregate amount of all services provided constitutes no more than 5% of the total amount of revenues paid to the Auditor by the Company, the Adviser and any affiliate of the Adviser that provides ongoing services to the Company during the fiscal year in which the services are provided that would have to be pre-approved by the Committee pursuant to this paragraph (without regard to this exception).
Table of Contents
PROHIBITED SERVICES
The Committee shall confirm with the Auditor engaged to perform the audit of the Company that the Auditor is not performing contemporaneously any of the following non-audit services for the Company, the Adviser, or any affiliates of the Company or Adviser:
| 1. | bookkeeping or other services related to the accounting records or financial statements of the Company; |
| 2. | financial information systems design and implementation; |
| 3. | appraisal or valuation services, fairness opinions, or contribution-in-kind reports; |
| 4. | actuarial services; |
| 5. | internal audit outsourcing services; |
| 6. | management functions or human resources; |
| 7. | broker or dealer, investment adviser, or investment banking services; |
| 8. | legal services and expert services unrelated to the audit; and |
| 9. | any other service that the Public Company Accounting Oversight Board determines, by regulation, is impermissible. |
The Auditor is responsible for informing the Committee of whether it believes that a particular service is permissible or prohibited pursuant to applicable regulations and standards.
| (e)(2) | The percentage of services described in each of paragraphs (b) through (d) of this Item that were approved by the audit committee pursuant to paragraph (c)(7)(i)(C) of Rule 2-01 of Regulation S-X are as follows: |
| (b) | N/A |
| (c) | N/A |
| (d) | N/A |
| (f) | The percentage of hours expended on the principal accountant’s engagement to audit the registrant’s financial statements for the most recent fiscal year that were attributed to work performed by persons other than the principal accountant’s full-time, permanent employees was less than fifty percent. |
| (g) | The aggregate non-audit fees billed by the registrant’s accountant for services rendered to the registrant, and rendered to the registrant’s investment adviser (not including any sub-adviser whose role is primarily portfolio management and is subcontracted with or overseen by another investment adviser), and any entity controlling, controlled by, or under common control with the adviser that provides ongoing services to the registrant for each of the last two fiscal years of the registrant was $0 in 2015 and $0 in 2014. |
| (h) | Not applicable. |
Table of Contents
Item 5. Audit Committee of Listed Registrants.
Not applicable.
Item 6. Investments.
| (a) | Schedule of Investments in securities of unaffiliated issuers as of the close of the reporting period is included as part of the report to shareholders filed under Item 1 of this form. |
| (b) | Not applicable. |
Item 7. Disclosure of Proxy Voting Policies and Procedures for Closed-End Management Investment Companies.
Not applicable.
Item 8. Portfolio Managers of Closed-End Management Investment Companies.
Not applicable.
Item 9. Purchases of Equity Securities by Closed-End Management Investment Company and Affiliated Purchasers.
Not applicable.
Item 10. Submission of Matters to a Vote of Security Holders.
There have been no material changes to the procedures by which the shareholders may recommend nominees to the registrant’s board of directors, where those changes were implemented after the registrant last provided disclosure in response to the requirements of Item 407(c)(2)(iv) of Regulation S-K (17 CFR 229.407) (as required by Item 22(b)(15) of Schedule 14A (17 CFR 240.14a-101)), or this Item.
Item 11. Controls and Procedures.
| (a) | The registrant’s principal executive and principal financial officers, or persons performing similar functions, have concluded that the registrant’s disclosure controls and procedures (as defined in Rule 30a-3(c) under the Investment Company Act of 1940, as amended (the “1940 Act”) (17 CFR 270.30a-3(c))) are effective, as of a date within 90 days of the filing date of the report that includes the disclosure required by this paragraph, based on their evaluation of these controls and procedures required by Rule 30a-3(b) under the 1940 Act (17 CFR 270.30a-3(b)) and Rules 13a-15(b) or 15d-15(b) under the Securities Exchange Act of 1934, as amended (17 CFR 240.13a-15(b) or 240.15d-15(b)). |
Table of Contents
| (b) | There were no changes in the registrant’s internal control over financial reporting (as defined in Rule 30a-3(d) under the 1940 Act (17 CFR 270.30a-3(d)) that occurred during the registrant’s second fiscal quarter of the period covered by this report that has materially affected, or is reasonably likely to materially affect, the registrant’s internal control over financial reporting. |
Item 12. Exhibits.
| (a)(1) | Code of Ethics, or any amendment thereto, that is subject of disclosure required by Item 2 is attached hereto. |
| (a)(2) | Certifications pursuant to Rule 30a-2(a) under the 1940 Act and Section 302 of the Sarbanes-Oxley Act of 2002 are attached hereto. |
| (a)(3) | Not applicable. |
| (b) | Certifications pursuant to Rule 30a-2(b) under the 1940 Act and Section 906 of the Sarbanes-Oxley Act of 2002 are attached hereto. |
Table of Contents
SIGNATURES
Pursuant to the requirements of the Securities Exchange Act of 1934 and the Investment Company Act of 1940, the registrant has duly caused this report to be signed on its behalf by the undersigned, thereunto duly authorized.
| (Registrant) | Meridian Fund, Inc.® | |||||
| By (Signature and Title)* | /s/ David J. Corkins | |||||
| David J. Corkins | ||||||
| Principal Executive Officer and President | ||||||
| Date | August 26, 2015 | |||||
Pursuant to the requirements of the Securities Exchange Act of 1934 and the Investment Company Act of 1940, this report has been signed below by the following persons on behalf of the registrant and in the capacities and on the dates indicated.
| By (Signature and Title)* | /s/ David J. Corkins | |||||
| David J. Corkins | ||||||
| Principal Executive Officer and President | ||||||
| Date | August 26, 2015 | |||||
| By (Signature and Title)* | /s/ Derek J. Mullins | |||||
| Derek J. Mullins | ||||||
| Principal Financial Officer and Treasurer | ||||||
| Date | August 26, 2015 | |||||
| * | Print the name and title of each signing officer under his or her signature. |