Table of Contents
UNITED STATES
SECURITIES AND EXCHANGE COMMISSION
Washington, D.C. 20549
FORM N-CSR
CERTIFIED SHAREHOLDER REPORT OF REGISTERED
MANAGEMENT INVESTMENT COMPANIES
Investment Company Act file number 811-04014
Meridian Fund, Inc.®
(Exact name of registrant as specified in charter)
100 Fillmore St., Suite 325
Denver, CO 80206
(Address of principal executive offices) (Zip code)
David J. Corkins
100 Fillmore St., Suite 325
Denver, CO 80206
(Name and address of agent for service)
Registrant’s telephone number, including area code: 303-398-2929
Date of fiscal year end: June 30
Date of reporting period: June 30, 2016
Table of Contents
Item 1. Reports to Stockholders.
The Report to Shareholders is attached herewith.
Table of Contents


Table of Contents
Table of Contents
Table of Contents
Portfolio Performance and Composition (Unaudited)
| • | SolarWinds, Inc. (SWI) accepted a $4.5 billion offer to be acquired by two private equity firms in October 2015. The developer of IT infrastructure management software agreed to be purchased at a nearly 20% premium by |
| Meridian Funds | 4 | www.meridianfund.com |
Table of Contents
Portfolio Performance and Composition (Unaudited) (continued)
| Silver Lake Partners and Thomas Bravo. We initiated a position in SolarWinds in 2013 based on our belief that the company would benefit from an increasingly large market opportunity created by a pervasiveness of performance-driven IT infrastructures. We opportunistically added to the position when the stock pulled back earlier in the period and were rewarded by the takeout. | |
| • | Solera Holdings, Inc. (SLH) was a long time holding of the Fund before being acquired by Vista Equity Partners for $6.5 billion in March 2016. As a provider of risk and asset management software and services to the global automotive industry, Solera is a stable business that is both predictable and defensive in nature. The majority of the company’s revenues are recurring, and it has a strong competitive position, particularly outside of the U.S., where it generates over half of its revenue. |
| • | Cadence Design Systems, Inc. (CDNS), provides “mission critical” electronic design automation (EDA) software to the semiconductor industry. After facing cash flow predictability issues in 2008, the company transitioned to a term licensed model which created more stable revenue and cash flow streams for the company. In addition to a high percentage of recurring revenues, we are also attracted to the company’s ability to consistently increase prices, a rarity in the semiconductor space. During the period, the company initiated a $1.2B share buyback program which represented approximately 20% of Cadence’s market cap at the time of the announcement. We continue to own the company due to its high quality business model and ability to take share within the EDA market. |
| • | LPL Financial Holdings, Inc. (LPLA), a leading financial services provider to independent advisors and RIAs in the U.S., suffered a significant drop in profits in late 2015 as a result of weak brokerage sales and declining stock markets. LPL was also weighed down by concerns about new industry regulations which will likely increase the compliance burden for financial advisors managing client retirement accounts. A poorly timed share buyback program compounded LPL’s problems further, creating concerns about financial leverage. We took advantage of the volatility in LPL’s share price volatility to trim the position early in the period and add to the position on weakness later in the period. |
| • | RigNet, Inc. (RNET), a communications service provider to offshore rigs, declined in unison with the oil and gas industry. The increasing number of offshore rigs being stacked or scrapped has challenged growth prospects for the company and left revenues down significantly during the period. Management has worked hard to cut costs and take steps to expand and enhance service capabilities beyond pure energy companies, which may help RigNet minimize further revenue declines. The company has one of the better balance sheets in the small cap energy space and therefore has the ability to weather the downturn and capitalize on weaker competitors to gain market share. We maintained our position in RigNet. |
| • | Roadrunner Transportation Systems, Inc. (RRTS) is an asset-light transportation and logistics service provider that declined along with other transportation service providers. Industrial weakness and elevated inventories at retailers continued to take its toll, which created weak freight demand and pressured rates across most of its end markets. Roadrunner’s revenue and profits consequently pulled back during the period. Roadrunner’s balance sheet carries leverage which has put additional pressure on the shares as a result of recent profit declines. Nonetheless, we are holding the name given attractive valuation and improved cash flow generation. We will continue to monitor the effectiveness of management’s growth initiatives, cost control efforts, and ability to pay down debt. |
| Meridian Funds | 5 | www.meridianfund.com |
Table of Contents
Portfolio Performance and Composition (Unaudited) (continued)
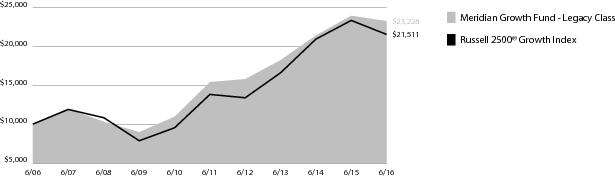
| Inception | 1 Year | 5 Year | 10 Year | Since Inception | |
| Legacy Class (MERDX) | 8/1/84 | (2.94)% | 8.56% | 8.79% | 12.23% |
| Institutional Class (MRRGX) | 12/24/14 | (2.97)% | — | — | 0.41% |
| Class A (MRAGX) w/o sales charge | 11/15/13 | (3.45)% | — | — | 4.92% |
| Class A (MRAGX) with sales charge1 | 11/15/13 | (9.00)% | — | — | 2.57% |
| Class C (MRCGX) | 7/1/15 | — | — | — | (3.95)% |
| Investor Class (MRIGX) | 11/15/13 | (3.04)% | — | — | 5.32% |
| Russell 2500® Growth Index | 8/1/84 | (7.69)% | 9.27% | 7.96% | N/A 2 |
| 1 | Assuming maximum sales charge, if any. Class A Shares are subject to a maximum initial sales charge of 5.75%. |
| 2 | Inception date of Russell 2500® Growth Index is July 1, 1995. |
| Meridian Funds | 6 | www.meridianfund.com |
Table of Contents
Portfolio Performance and Composition (Unaudited) (continued)
6.30.16
| Clean Harbors, Inc. | 2.93% |
| Cadence Design Systems, Inc. | 2.90% |
| ServiceMaster Global Holdings, Inc. | 2.74% |
| Sally Beauty Holdings, Inc. | 2.68% |
| National CineMedia, Inc. | 2.59% |
| Demandware, Inc. | 2.06% |
| Carter's, Inc. | 2.00% |
| CEB, Inc. | 1.99% |
| Sensata Technologies Holding N.V. (Netherlands) | 1.98% |
| Heartland Express, Inc. | 1.83% |

| Meridian Funds | 7 | www.meridianfund.com |
Table of Contents
Portfolio Performance and Composition (Unaudited)
| • | NVIDIA Corp. (NVDA) is the dominant provider of visual computing technologies used for PC-based video games and is expanding into new markets in enterprise computing and automotive. We originally invested in the company after management significantly increased research and development spending in order to enter the mobile, automotive, and enterprise markets. These investments depressed earnings, and investors were initially disappointed with failed product launches in cell phones and tablets. However, we viewed NVIDIA’s technology as highly differentiated, and felt that there were excellent opportunities outside of mobile devices. Stock performance this period was driven by another solid earnings report, supported by exceptional demand for computing platforms used in artificial intelligence and deep learning, and continued growth in the traditional PC gaming industry and sales of chips for automotive infotainment systems. Based on the market opportunities in auto and deep learning, we continue to hold shares. |
| • | Newmont Mining Corp. (NEM) is the second largest gold miner with production primarily in North America and Australia. Like most gold miners, Newmont struggled over the past decade to expand gold production and control mining costs. Led by a new CEO who came on board from global mining giant Rio Tinto in 2013, Newmont is undergoing a significant transformation to improve its operational performance. Specifically, the company is focused on sustainably growing gold production, lowering mining costs, increasing cash flow and paying down debt. Newmont delivered on all fronts in 2015 as gold production rose 4%, mining costs dropped 10%, free cash flow doubled, and net debt decreased 19%. These fundamental improvements led to strong outperformance for the stock in 1Q16 as gold prices showed signs of life. We maintain our position in Newmont. While ultimately the price of gold will be a key determinant of the stock price, the company’s continued operational improvements position the company well to outperform physical gold and other miners regardless of the direction of gold prices. |
| • | Xylem, Inc. (XYL) is a leading water-focused industrial company with products that enable water collection, distribution, treatment and disposal. The company originally met our contrarian screening criteria due to macro headwinds facing its European and municipal customers. Xylem has competitive advantages in technology, distribution, product breadth and customer relationships and should benefit from the compelling long-term secular trend towards more efficient global water usage through conservation and reuse enabled by technology. The stock performed strongly over the past year as municipal spending increased on water infrastructure due to |
| Meridian Funds | 8 | www.meridianfund.com |
Table of Contents
Portfolio Performance and Composition (Unaudited) (continued)
| accelerating failure rates of aging equipment and an increased profile of water issues due to events such as the California drought and the Flint water crisis. We continue to hold our investment in Xylem as we believe we are at the beginning of multiple years of secular earnings growth. |
| • | Verint Systems, Inc. (VRNT) develops technologies that provide collection and analysis of unstructured data including voice, video, email, internet and other data transmissions. Solutions are used for security, interception, surveillance, defense, customer service and enterprise intelligence. The company is a leader in its markets with competitive advantages derived from a core analytical technology platform that can be applied to different products and end markets. We invested when earnings declined due to significant investment by the company in new products to re-accelerate product development and sales. Verint has been a strong performer for the Fund over the three years since our original investment and the company has recently shown improvements in its customer engagement business segment. Over the last year, however, the stock has suffered from adverse foreign exchange and cautious guidance in foreign markets due to macro factors. The company continues to have leading technology and a significant market opportunity for its new cyber-security products. As such we continue to own Verint shares, but are reviewing the company to confirm our thesis is still intact. |
| • | Twitter, Inc. (TWTR), an online social networking platform focused on delivering information instantly to its user-base, was sold off during the period as user engagement and growth flattened. We initially invested in the company and were drawn to its unique customer engagement offering and platform. Although advertising revenue had slowed in recent quarters, we believed this trend would reverse, but we were early to invest and were hurt as the company’s shares continued to slide. Upon reviewing our initial thesis and comparing it to recent performance, we exited the position, but will continue to monitor the company’s turnaround story and customer engagement metrics. |
| • | Fitbit, Inc. (FIT) is a leader in the wearable device category, with a product and software platform designed to help people make behavioral changes to be more active, exercise more, eat smarter, sleep better and manage weight. The company came across our underperformers screen due to market fears about product commoditization and a potential reversal of the fitness tracking ‘fad’. We recognized these fears as real but believed (1) that the stock was investible following a 40%+ price decline from its post-IPO peak and at a valuation of roughly 15x earnings ex-cash, and (2) that the company has a large opportunity and first mover advantage in the corporate wellness market. We misjudged downside, as the stock traded down to 10x earnings ex-cash following product launches and timing that disappointed the market. We liquidated our Fitbit position but continue to monitor the company for potential investment in the future as we believe that if Fitbit is able to eventually penetrate the corporate wellness market there could be meaningful upside potential to the stock. |
| Meridian Funds | 9 | www.meridianfund.com |
Table of Contents
Portfolio Performance and Composition (Unaudited) (continued)
| Meridian Funds | 10 | www.meridianfund.com |
Table of Contents
Portfolio Performance and Composition (Unaudited) (continued)
| Inception | 1 Year | 5 Year | 10 Year | Since Inception | |
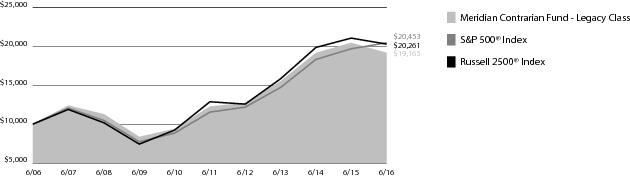
| Legacy Class (MVLAX) | 2/10/94 | (6.33)% | 9.36% | 6.72% | 12.27% |
| Class A (MFCAX) w/o sales charge | 11/15/13 | (6.75)% | — | — | 2.27% |
| Class A (MFACX) with sales charge1 | 11/15/13 | (12.10)% | — | — | (0.02)% |
| Class C (MFCCX) | 7/1/15 | — | — | — | (7.50)% |
| Investor Class (MFCIX) | 11/15/13 | (6.50)% | — | — | 2.54% |
| Russell 2500® Index | 2/10/94 | (3.67)% | 9.48% | 7.32% | 9.78% |
| S&P 500® Index | 2/10/94 | 3.98% | 12.09% | 7.42% | 8.89% |
| 1 | Assuming maximum sales charge, if any. Class A Shares are subject to a maximum initial sales charge of 5.75%. |
| Meridian Funds | 11 | www.meridianfund.com |
Table of Contents
Portfolio Composition (Unaudited)
6.30.16
| Microsoft Corp. | 3.99% |
| CACI International, Inc. Class A | 3.77% |
| EOG Resources, Inc. | 3.48% |
| Xylem, Inc. | 3.30% |
| NVIDIA Corp. | 3.03% |
| Alexander & Baldwin, Inc. | 2.90% |
| Celgene Corp. | 2.76% |
| Gildan Activewear, Inc. (Canada) | 2.63% |
| QUALCOMM, Inc. | 2.52% |
| Children's Place, Inc. (The) | 2.40% |
| Meridian Funds | 12 | www.meridianfund.com |
Table of Contents
Portfolio Performance and Composition (Unaudited)
| • | California Resources Corp., 8.00%, 12/15/22 are second lien notes for California Resources Corp., an oil and natural gas exploration and drilling company in which we also own stock. Although we were originally attracted to CRC’s equity offerings, continued in-depth research of the company revealed an interesting opportunity to invest in its debt and to further diversify the portfolio through a high-quality, income-producing investment. In anticipation of a return to higher oil prices, we expect the liens to recover to par value. Since mid February, we’ve already seen a partial recovery, fueled by a weaker U.S. dollar and rising gold and oil prices, which consequently boosted the value of the company. If the price of oil per barrel returns to $50, we also expect our equity holdings in CRC to fare well. Our CRC investment demonstrates our team’s ability to work across the capital structure and deploy capital to what we believe are the best investment opportunities. In the case of CRC, cross-capital structure collaboration enabled us to get comfortable with the secured second lien note position and rewarded us with strong performance. |
| • | NVIDIA Corp. (NVDA) continues to successfully evolve its business by radically changing its product mix. Originally known as a supplier of graphics chips to original equipment manufacturers and the broader PC market, NVIDIA now also offers solutions that cater to higher-margin business segments such as gaming, high-performance computing and cloud computing. During the period, the company launched GeForce GTX 1080 and GTX 1070, based on NVIDIA’s new Pascal architecture, bringing the biggest performance gains over the previous generation of processors in a decade. Also contributing to the company’s strength is a competitive advantage gained through programming languages that enable better, faster and easier programming for developers creating next-generation scientific, engineering, and enterprise applications. As virtual reality, driverless cars and other life-changing technologies continue to emerge, we believe demand for NVIDIA’s smart, fast chips will increase. |
| • | Amazon.com, Inc. (Amazon) exceeded earnings estimates in the first quarter and posted its fourth consecutive quarter of profits. Financial highlights included a 64% sales increase for Amazon Web Services (AWS), which rents computing power and storage for corporate customers. Consumer and enterprise cloud-based computing services is a theme in the portfolio and AWS is a leader in this space. The company continues to strengthen its |
| Meridian Funds | 13 | www.meridianfund.com |
Table of Contents
Portfolio Performance and Composition (Unaudited) (continued)
| competitive advantage through major feature releases, more data centers, and price cuts for several of its services. We also like Amazon.com’s focus on “customer centricity.” Its business model is to maximize an intangible asset not on the balance sheet—customer goodwill. At critical mass, customers love Amazon.com so much that they want to subscribe to the company via Amazon Prime and AWS. The predictability of subscription revenue streams allows Amazon.com to invest in new, value-added services in a virtual loop. |
| • | California Resources Corp. (CRC), an oil and natural gas exploration and drilling company we’ve discussed in previous quarters, continued to be pressured by fluctuating oil prices. We maintain our conviction that a return to $50-a-barrel oil and a decline in U.S. oil production will eventually reward investors in this stock, and we are encouraged by modest improvements in oil prices during the second quarter. In the meantime, we will keep a watchful eye on developments and periodically reassess our investment in CRC to ensure our thesis for the company remains intact. Notably, we also invest in the company’s debt instruments, which have been among the Fund’s top contributing investments for the second consecutive quarter. Details of this investment are provided above in the “Top Three” portion of this letter. |
| • | Perrigo Co. Plc (PRGO), a manufacturer of private-label over-the-counter pharmaceuticals, is suffering from a number of setbacks that caused investors to put Perrigo in the “penalty box” during the period. To begin, the stock took a hit late in 2015 when the company turned down a very large premium takeout from generic and specialty pharmaceuticals company Mylan. At the same time integration issues with Belgium-based Omega Pharma, acquired by Perrigo in early 2015, began to take a toll on the stock. Perrigo’s share price declined further following an announcement in March that the company’s CEO had resigned and, later, news of disappointing first-quarter earnings. We believe Perrigo can overcome these near-term issues and therefore maintained our position in the stock. Our conviction is based on the fact that the company’s consumer health care business is a stable, long-duration business with nearly 70% market share and that the company continues to successfully differentiate its generic and specialty topical pharmaceutical business, which is high-margin. We also feel there is ample opportunity for growth in the company’s specialty science business, which focuses on the treatment of multiple sclerosis. |
| • | Fitbit, Inc. (FIT), the leading brand in wireless-enabled wearable fitness-tracking devices, reported weaker-than-expected first-quarter earnings in May, triggering a sharp decline in the stock. Although sales of the company’s wearable devices remain strong, up 25% in the first quarter, Apple and other key players in the smart watch category recently have whittled away at Fitbit’s market share. However, our investment thesis for Fitbit isn’t based on consumer sales but rather on corporate sales, which currently account for only 10% of the company’s revenue and, therefore, represent a huge opportunity for growth. As companies increase their investment in corporate wellness programs, we believe Fitbit stands to benefit. Already, the company has sold devices in bulk to more than 70 large American employers, including Target, which recently bought 330,000 wearable devices. We believe Fitbit has successfully positioned itself as the go-to device for employees and that our investment thesis for the company is right on target. |
| Meridian Funds | 14 | www.meridianfund.com |
Table of Contents
Portfolio Performance and Composition (Unaudited) (continued)
| Meridian Funds | 15 | www.meridianfund.com |
Table of Contents
Portfolio Performance and Composition (Unaudited) (continued)

| Inception | 1 Year | 5 Year | 10 Year | Since Inception | |
| Legacy Class (MEIFX) | 1/31/05 | (3.35)% | 8.12% | 5.95% | 6.24% |
| Class A (MRAEX) w/o sales charge | 11/15/13 | (3.76)% | — | — | 2.63% |
| Class A (MRAEX) with sales charge1 | 11/15/13 | (9.28)% | — | — | 0.32% |
| Class C (MRCEX) | 7/1/15 | — | — | — | (4.55)% |
| Investor Class (MRIEX) | 11/15/13 | (3.51)% | — | — | 2.87% |
| S&P 500® Index | 1/31/05 | 3.98% | 12.09% | 7.42% | 7.40% |
| 1 | Assuming maximum sales charge, if any. Class A Shares are subject to a maximum initial sales charge of 5.75%. |
| Meridian Funds | 16 | www.meridianfund.com |
Table of Contents
Portfolio Composition (Unaudited)
6.30.16
| California Resources Corp. 8.00%, 12/15/22 | 5.58% |
| Royal Gold, Inc. | 4.70% |
| Microsoft Corp. | 4.28% |
| Apple, Inc. | 4.16% |
| Equifax, Inc. | 4.06% |
| Facebook, Inc. Class A | 3.53% |
| United Parcel Service, Inc. Class B | 3.51% |
| NVIDIA Corp. | 3.11% |
| Amazon.com, Inc. | 2.78% |
| Lockheed Martin Corp. | 2.59% |
| Meridian Funds | 17 | www.meridianfund.com |
Table of Contents
Portfolio Performance and Composition (Unaudited)
| • | SolarWinds, Inc. (SWI) accepted a $4.5 billion offer to be acquired by two private equity firms in October 2015. The developer of IT infrastructure management software agreed to be purchased at a nearly 20% premium by Silver Lake Partners and Thomas Bravo. We initiated a position in SolarWinds in 2013 based on our belief that the company would benefit from an increasingly large market opportunity created by a pervasiveness of performance-driven IT infrastructures. We opportunistically added to the position when the stock pulled back earlier in the period and were rewarded by the takeout. |
| • | Solera Holdings, Inc. (SLH) was added to the Fund in July 2015, shortly before it was announced that the company would be acquired by Vista Equity Partners for $6.5 billion. We took advantage of the decline in the company’s market value into the small cap space to establish an initial position. As a provider of risk and asset |
| Meridian Funds | 18 | www.meridianfund.com |
Table of Contents
Portfolio Performance and Composition (Unaudited) (continued)
| management software and services to the global automotive industry, Solera is a stable business that is both predictable and defensive in nature. The majority of the company’s revenues are recurring, and it has a strong competitive position, particularly outside of the U.S., where it generates over half of its revenue. | |
| • | Demandware, Inc. (DWRE) is a leading provider of cloud-based e-commerce platforms and solutions to retailers such as fashion brand Kate Spade and party supply store Party City. We have owned the company since April, 2014 due to the company’s strong secular demand drivers, differentiated cloud based business model, and rapid market share gains. We especially like the company’s revenue model where Demandware charges a percentage of its customers’ gross merchandise value (GMV). In the first quarter of 2016, Demandware’s comparable customer GMV grew 23% in constant currency which, along with strong new customer additions, drove 33% constant currency subscription revenue growth. These characteristics were not lost on Salesforce.com which announced in early June that they would acquire Demandware for $2.8B, a 56% premium. |
| • | RigNet, Inc. (RNET), a communications service provider to offshore rigs, declined in unison with the oil and gas industry. The increasing number of offshore rigs being stacked or scrapped has challenged growth prospects for the company and left revenues down significantly during the period. Management has worked hard to cut costs and take steps to expand and enhance service capabilities beyond pure energy companies, which may help RigNet minimize further revenue declines. The company has one of the better balance sheets in the small cap energy space and therefore has the ability to weather the downturn and capitalize on weaker competitors to gain market share. We maintained our position in RigNet. |
| • | Roadrunner Transportation Systems, Inc. (RRTS) is an asset-light transportation and logistics service provider that declined along with other transportation service providers. Industrial weakness and elevated inventories at retailers continued to take its toll, which created weak freight demand and pressured rates across most of its end markets. Roadrunner’s revenue and profits consequently pulled back during the period. Roadrunner’s balance sheet carries leverage which has put additional pressure on the shares as a result of recent profit declines. Nonetheless, we are holding the name given attractive valuation and improved cash flow generation. We will continue to monitor the effectiveness of management’s growth initiatives, cost control efforts, and ability to pay down debt. |
| • | Power Solutions International, Inc. (PSIX), a leading maker of alternative-fuel and conventional power systems, sold off for many of the same reasons that RigNet and other oil and gas names fell. While their engines can burn a variety of fuels to take advantage of price, lower diesel fuel costs have made this flexibility less attractive. As a result, adoption and profitability of alternative engines has been pressured. Meanwhile, Power Solutions’ ability to sell to the oil and gas industry has also been hampered by the sector’s idle capacity and an 80% decline in rig count. The company also experienced missteps with two poorly executed acquisitions, which stressed its balance sheet. We decided to exit the position and reinvest the proceeds from the sale in other more attractive opportunities. |
| Meridian Funds | 19 | www.meridianfund.com |
Table of Contents
Portfolio Performance and Composition (Unaudited) (continued)
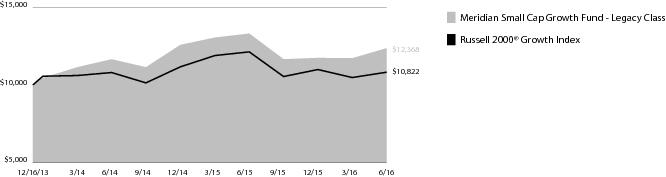
| Inception | 1 Year | 5 Year | 10 Year | Since Inception | |
| Legacy Class (MSGGX) | 12/16/13 | (7.06)% | — | — | 8.74% |
| Institutional Class (MSGRX) | 12/24/14 | (6.98)% | — | — | (0.85)% |
| Class A (MSGAX) w/o sales charge | 12/16/13 | (7.41)% | — | — | 8.35% |
| Class A (MSGAX) with sales charge1 | 12/16/13 | (12.75)% | — | — | 5.85% |
| Class C (MSGCX) | 7/1/15 | — | — | — | (8.00)% |
| Investor Class (MISGX) | 12/16/13 | (7.15)% | — | — | 8.67% |
| Russell 2000® Growth Index | 12/16/13 | (10.75)% | 8.51% | 7.14% | 2.67% |
| 1 | Assuming maximum sales charge, if any. Class A Shares are subject to a maximum initial sales charge of 5.75%. |
| Meridian Funds | 20 | www.meridianfund.com |
Table of Contents
Portfolio Composition (Unaudited)
6.30.16
| National CineMedia, Inc. | 2.28% |
| Clean Harbors, Inc. | 2.05% |
| Heritage-Crystal Clean, Inc. | 2.00% |
| CEB, Inc. | 1.86% |
| ChannelAdvisor Corp. | 1.83% |
| Demandware, Inc. | 1.72% |
| SP Plus Corp. | 1.61% |
| Exa Corp. | 1.59% |
| Wolverine World Wide, Inc. | 1.56% |
| INC Research Holdings, Inc. Class A | 1.51% |

| Meridian Funds | 21 | www.meridianfund.com |
Table of Contents
| Actual | Annualized Expense Ratio | Beginning Account Value January 1, 2016 | Ending Account Value June 30, 2016 | Expenses Paid During the Period 1 |
| Legacy Class (MERDX) | 0.87% | $1,000.00 | $1,065.50 | $4.47 |
| Institutional Class (MRRGX) | 0.89% | $1,000.00 | $1,065.50 | $4.57 |
| Class A (MRAGX) 2 | 1.24% | $1,000.00 | $1,063.60 | $6.36 |
| Class C (MRCGX) 3 | 1.95% | $1,000.00 | $1,060.00 | $9.99 |
| Investor Class (MRIGX) | 1.02% | $1,000.00 | $1,064.90 | $5.24 |
| Hypothetical 4 | Annualized Expense Ratio | Beginning Account Value January 1, 2016 | Ending Account Value June 30, 2016 | Expenses Paid During the Period 1 |
| Legacy Class (MERDX) | 0.87% | $1,000.00 | $1,020.54 | $4.37 |
| Institutional Class (MRRGX) | 0.89% | $1,000.00 | $1,020.44 | $4.47 |
| Class A (MRAGX) 2 | 1.24% | $1,000.00 | $1,018.70 | $6.22 |
| Class C (MRCGX) 3 | 1.95% | $1,000.00 | $1,015.17 | $9.77 |
| Investor Class (MRIGX) | 1.02% | $1,000.00 | $1,019.79 | $5.12 |
| 1 | Expenses are equal to the Fund’s annualized expense ratio multiplied by the average account value over the period, multiplied by 182 days, the number of days in the most recent fiscal half-year, then divided by 366. |
| 2 | On July 1, 2015, the Fund’s Advisor Class Shares were redesignated as Class A Shares. |
| 3 | Commenced operations on July 1, 2015. |
| 4 | Hypothetical 5% return before expenses. |
| Meridian Funds | 22 | www.meridianfund.com |
Table of Contents
| Actual | Annualized Expense Ratio | Beginning Account Value January 1, 2016 | Ending Account Value June 30, 2016 | Expenses Paid During the Period 1 |
| Legacy Class (MVALX) | 1.13% | $1,000.00 | $1,011.20 | $ 5.65 |
| Class A (MFCAX) 2 | 1.60% | $1,000.00 | $1,009.10 | $ 7.99 |
| Class C (MFCCX) 3 | 2.20% | $1,000.00 | $1,006.30 | $10.97 |
| Investor Class (MFCIX) | 1.35% | $1,000.00 | $1,010.60 | $ 6.75 |
| Hypothetical 4 | Annualized Expense Ratio | Beginning Account Value January 1, 2016 | Ending Account Value June 30, 2016 | Expenses Paid During the Period 1 |
| Legacy Class (MVALX) | 1.13% | $1,000.00 | $1,019.24 | $ 5.67 |
| Class A (MFCAX) 2 | 1.60% | $1,000.00 | $1,016.91 | $ 8.02 |
| Class C (MFCCX) 3 | 2.20% | $1,000.00 | $1,013.92 | $11.02 |
| Investor Class (MFCIX) | 1.35% | $1,000.00 | $1,018.15 | $ 6.77 |
| 1 | Expenses are equal to the Fund’s annualized expense ratio multiplied by the average account value over the period, multiplied by 182 days, the number of days in the most recent fiscal half-year, then divided by 366. |
| 2 | On July 1, 2015, the Fund’s Advisor Class Shares were redesignated as Class A Shares. |
| 3 | Commenced operations on July 1, 2015. |
| 4 | Hypothetical 5% return before expenses. |
| Meridian Funds | 23 | www.meridianfund.com |
Table of Contents
| Actual | Annualized Expense Ratio | Beginning Account Value January 1, 2016 | Ending Account Value June 30, 2016 | Expenses Paid During the Period 1 |
| Legacy Class (MEIFX) | 1.33% | $1,000.00 | $1,013.10 | $ 6.66 |
| Class A (MRAEX) 2 | 1.67% | $1,000.00 | $1,010.50 | $ 8.35 |
| Class C (MRCEX) 3 | 2.14% | $1,000.00 | $1,007.90 | $10.68 |
| Investor Class (MRIEX) | 1.43% | $1,000.00 | $1,012.20 | $ 7.15 |
| Hypothetical 4 | Annualized Expense Ratio | Beginning Account Value January 1, 2016 | Ending Account Value June 30, 2016 | Expenses Paid During the Period 1 |
| Legacy Class (MEIFX) | 1.33% | $1,000.00 | $1,018.25 | $ 6.67 |
| Class A (MRAEX) 2 | 1.67% | $1,000.00 | $1,016.56 | $ 8.37 |
| Class C (MRCEX) 3 | 2.14% | $1,000.00 | $1,014.22 | $10.72 |
| Investor Class (MRIEX) | 1.43% | $1,000.00 | $1,017.75 | $ 7.17 |
| 1 | Expenses are equal to the Fund’s annualized expense ratio multiplied by the average account value over the period, multiplied by 182 days, the number of days in the most recent fiscal half-year, then divided by 366. |
| 2 | On July 1, 2015, the Fund’s Advisor Class Shares were redesignated as Class A Shares. |
| 3 | Commenced operations on July 1, 2015. |
| 4 | Hypothetical 5% return before expenses. |
| Meridian Funds | 24 | www.meridianfund.com |
Table of Contents
| Actual | Annualized Expense Ratio | Beginning Account Value January 1, 2016 | Ending Account Value June 30, 2016 | Expenses Paid During the Period 1 |
| Legacy Class (MSGGX) | 1.20% | $1,000.00 | $1,054.20 | $ 6.13 |
| Institutional Class (MSGRX) | 1.10% | $1,000.00 | $1,054.10 | $ 5.62 |
| Class A (MSGAX) 2 | 1.60% | $1,000.00 | $1,051.90 | $ 8.16 |
| Class C (MSGCX) 3 | 2.26% | $1,000.00 | $1,048.20 | $11.51 |
| Investor Class (MISGX) | 1.39% | $1,000.00 | $1,053.30 | $ 7.10 |
| Hypothetical 4 | Annualized Expense Ratio | Beginning Account Value January 1, 2016 | Ending Account Value June 30, 2016 | Expenses Paid During the Period 1 |
| Legacy Class (MSGGX) | 1.20% | $1,000.00 | $1,018.90 | $ 6.02 |
| Institutional Class (MSGRX) | 1.10% | $1,000.00 | $1,019.39 | $ 5.52 |
| Class A (MSGAX) 2 | 1.60% | $1,000.00 | $1,016.91 | $ 8.02 |
| Class C (MSGCX) 3 | 2.26% | $1,000.00 | $1,013.63 | $11.31 |
| Investor Class (MISGX) | 1.39% | $1,000.00 | $1,017.95 | $ 6.97 |
| 1 | Expenses are equal to the Fund’s annualized expense ratio multiplied by the average account value over the period, multiplied by 182 days, the number of days in the most recent fiscal half-year, then divided by 366. |
| 2 | On July 1, 2015, the Fund’s Advisor Class Shares were redesignated as Class A Shares. |
| 3 | Commenced operations on July 1, 2015. |
| 4 | Hypothetical 5% return before expenses. |
| Meridian Funds | 25 | www.meridianfund.com |
Table of Contents
Performance and Expense Disclosures
| Meridian Funds | 26 | www.meridianfund.com |
Table of Contents
Schedule of Investments
| Shares | Value | |
| Common Stocks - 95.7% | ||
| Consumer Discretionary - 22.9% | ||
| Diversified Consumer Services - 5.8% | ||
| 2U, Inc.1,2 | 761,879 | $ 22,406,861 |
| Grand Canyon Education, Inc.1 | 389,446 | 15,546,684 |
| ServiceMaster Global Holdings, Inc.1 | 859,767 | 34,218,727 |
| 72,172,272 | ||
| Hotels, Restaurants & Leisure - 1.4% | ||
| Dunkin' Brands Group, Inc.2 | 394,326 | 17,200,500 |
| Leisure Equipment & Products - 1.2% | ||
| Polaris Industries, Inc.2 | 188,960 | 15,449,370 |
| Media - 2.6% | ||
| National CineMedia, Inc. | 2,094,478 | 32,422,519 |
| Specialty Retail - 7.5% | ||
| Dick's Sporting Goods, Inc. | 222,734 | 10,036,394 |
| DSW, Inc. Class A | 548,965 | 11,627,079 |
| Five Below, Inc.1 | 275,196 | 12,771,847 |
| Hibbett Sports, Inc.1,2 | 466,775 | 16,239,102 |
| Monro Muffler Brake, Inc.2 | 156,627 | 9,955,212 |
| Sally Beauty Holdings, Inc.1,2 | 1,137,313 | 33,448,375 |
| 94,078,009 | ||
| Textiles, Apparel & Luxury Goods - 4.4% | ||
| Carter's, Inc. | 234,622 | 24,980,204 |
| Tumi Holdings, Inc.1 | 321,800 | 8,604,932 |
| Wolverine World Wide, Inc. | 1,057,764 | 21,493,765 |
| 55,078,901 | ||
| Total Consumer Discretionary | 286,401,571 | |
| Consumer Staples - 0.5% | ||
| Beverages - 0.5% | ||
| Boston Beer Co., Inc. (The) Class A1,2 | 33,386 | 5,710,008 |
| Total Consumer Staples | 5,710,008 | |
| Energy - 2.0% | ||
| Energy Equipment & Services - 2.0% | ||
| Dril-Quip, Inc.1 | 99,565 | 5,817,583 |
| RigNet, Inc.1 | 930,845 | 12,464,014 |
| US Silica Holdings, Inc. | 190,010 | 6,549,645 |
| Total Energy | 24,831,242 | |
| Financials - 6.0% | ||
| Capital Markets - 4.0% | ||
| Financial Engines, Inc.2 | 572,505 | 14,810,704 |
| LPL Financial Holdings, Inc.2 | 966,808 | 21,782,184 |
| WisdomTree Investments, Inc.2 | 1,296,000 | 12,687,840 |
| 49,280,728 | ||
| Commercial Banks - 0.6% | ||
| Bank of the Ozarks, Inc.2 | 196,123 | 7,358,535 |
| Shares | Value | |
| Diversified Financial Services - 0.5% | ||
| Bats Global Markets, Inc.2 | 245,974 | $ 6,319,072 |
| Real Estate Investment Trusts - 0.9% | ||
| National Storage Affiliates Trust | 547,996 | 11,409,277 |
| Total Financials | 74,367,612 | |
| Health Care - 18.9% | ||
| Biotechnology - 3.8% | ||
| Alnylam Pharmaceuticals, Inc.1 | 114,101 | 6,331,465 |
| Atara Biotherapeutics, Inc. 1,2 | 307,706 | 6,926,462 |
| Bluebird Bio, Inc.1,2 | 163,330 | 7,070,556 |
| DBV Technologies SA ADR (France)1 | 186,154 | 6,072,343 |
| Dyax Corp. CVR1 | 316,946 | 351,810 |
| Exact Sciences Corp.1,2 | 588,464 | 7,208,684 |
| Juno Therapeutics, Inc. 1,2 | 161,912 | 6,223,897 |
| Neurocrine Biosciences, Inc.1 | 166,884 | 7,584,878 |
| 47,770,095 | ||
| Health Care Equipment & Supplies - 9.9% | ||
| ABIOMED, Inc.1 | 93,983 | 10,271,402 |
| Align Technology, Inc.1 | 120,236 | 9,685,010 |
| Cooper Cos., Inc. (The) | 111,412 | 19,114,957 |
| DexCom, Inc.1 | 140,394 | 11,137,456 |
| Endologix, Inc.1,2 | 1,232,710 | 15,359,567 |
| Insulet Corp.1 | 219,338 | 6,632,781 |
| LDR Holding Corp. 1 | 524,022 | 19,362,613 |
| Nevro Corp. 1,2 | 86,842 | 6,405,466 |
| Novadaq Technologies, Inc.1,2 | 658,366 | 6,478,321 |
| Quidel Corp.1 | 368,846 | 6,587,590 |
| Spectranetics Corp. (The)1,2 | 644,723 | 12,062,767 |
| 123,097,930 | ||
| Health Care Providers & Services - 1.4% | ||
| Diplomat Pharmacy, Inc.1 | 301,575 | 10,555,125 |
| Patterson Cos, Inc. | 131,466 | 6,295,907 |
| 16,851,032 | ||
| Health Care Technology - 1.7% | ||
| athenahealth, Inc.1,2 | 59,995 | 8,279,910 |
| Medidata Solutions, Inc.1 | 277,324 | 12,998,176 |
| 21,278,086 | ||
| Life Sciences Tools & Services - 1.5% | ||
| INC Research Holdings, Inc. Class A1 | 501,762 | 19,132,185 |
| Pharmaceuticals - 0.6% | ||
| Revance Therapeutics, Inc.1,2 | 480,762 | 6,538,363 |
| Syndax Pharmaceuticals, Inc.1 | 84,439 | 831,724 |
| Meridian Funds | 27 | www.meridianfund.com |
Table of Contents
Schedule of Investments (continued)
| Shares | Value | |
| Syndax Pharmaceuticals, Inc. Acquisition Date: 8/18/15, Cost $1,116,2441,3,4 | 79,782 | $ 667,772 |
| 8,037,859 | ||
| Total Health Care | 236,167,187 | |
| Industrials - 24.6% | ||
| Aerospace & Defense - 1.7% | ||
| HEICO Corp. Class A | 393,543 | 21,113,582 |
| Air Freight & Logistics - 1.5% | ||
| Forward Air Corp. | 429,113 | 19,108,402 |
| Commercial Services & Supplies - 3.7% | ||
| Clean Harbors, Inc.1 | 701,851 | 36,573,456 |
| Ritchie Bros. Auctioneers, Inc. (Canada) | 295,294 | 9,975,031 |
| 46,548,487 | ||
| Electrical Equipment - 2.0% | ||
| Sensata Technologies Holding N.V. (Netherlands)1 | 707,104 | 24,670,859 |
| Machinery - 5.9% | ||
| Donaldson Co., Inc.2 | 264,101 | 9,074,510 |
| Kennametal, Inc. | 393,702 | 8,704,751 |
| Proto Labs, Inc.1,2 | 217,676 | 12,529,430 |
| Tennant Co. | 318,148 | 17,138,633 |
| Wabtec Corp.2 | 220,307 | 15,472,161 |
| Woodward, Inc.2 | 194,023 | 11,183,486 |
| 74,102,971 | ||
| Marine - 1.1% | ||
| Kirby Corp. | 216,026 | 13,477,862 |
| Professional Services - 4.4% | ||
| Advisory Board Co. (The)1 | 211,160 | 7,472,952 |
| CEB, Inc. | 403,920 | 24,913,786 |
| TriNet Group, Inc.1 | 1,053,367 | 21,899,500 |
| 54,286,238 | ||
| Road & Rail - 2.7% | ||
| Heartland Express, Inc.2 | 1,314,102 | 22,852,234 |
| Roadrunner Transportation Systems, Inc.1 | 648,700 | 4,839,302 |
| Saia, Inc.1 | 247,375 | 6,219,007 |
| 33,910,543 | ||
| Trading Companies & Distributors - 1.6% | ||
| MSC Industrial Direct Co., Inc. Class A | 289,346 | 20,416,254 |
| Total Industrials | 307,635,198 | |
| Information Technology - 20.8% | ||
| Electronic Equipment & Instruments - 2.2% | ||
| CDW Corp. | 182,538 | 7,316,123 |
| Shares | Value | |
| Trimble Navigation Ltd.1 | 823,880 | $ 20,069,717 |
| 27,385,840 | ||
| Internet Software & Services - 7.4% | ||
| ChannelAdvisor Corp.1 | 977,248 | 14,160,323 |
| Cimpress, N.V. (Netherlands)1,2 | 167,289 | 15,470,887 |
| CoStar Group, Inc.1 | 42,443 | 9,280,586 |
| Demandware, Inc.1 | 342,725 | 25,670,102 |
| New Relic, Inc. 1,2 | 262,854 | 7,722,651 |
| Shutterstock, Inc.1,2 | 233,407 | 10,690,041 |
| SPS Commerce, Inc.1 | 152,192 | 9,222,835 |
| 92,217,425 | ||
| IT Services - 2.9% | ||
| Euronet Worldwide, Inc.1 | 86,087 | 5,956,360 |
| Gartner, Inc.1 | 215,133 | 20,956,105 |
| MAXIMUS, Inc. | 167,938 | 9,298,727 |
| 36,211,192 | ||
| Software - 7.6% | ||
| Barracuda Networks, Inc.1 | 691,078 | 10,462,921 |
| Cadence Design Systems, Inc.1 | 1,489,530 | 36,195,579 |
| Descartes Systems Group, Inc. (The)1 | 511,211 | 9,759,018 |
| Fleetmatics Group Plc (Ireland)1,2 | 429,695 | 18,618,684 |
| RealPage, Inc.1 | 277,820 | 6,203,721 |
| SS&C Technologies Holdings, Inc. | 515,942 | 14,487,651 |
| 95,727,574 | ||
| Technology Hardware, Storage & Peripherals - 0.7% | ||
| Stratasys Ltd.1,2 | 387,939 | 8,879,924 |
| Total Information Technology | 260,421,955 | |
| Total Common Stocks - 95.7% (Cost $1,111,146,974) | 1,195,534,773 | |
| Shares/ Principal Amount | ||
| Short-Term Investments - 15.4%5 | ||
| Money Market Funds - 2.1% | ||
| Federated Treasury Obligations Fund, 0.24% | 6,687,000 | 6,687,000 |
| Fidelity Money Market Funds, Government Portfolio, Institutional Class, 0.30% | 6,615,000 | 6,615,000 |
| Invesco Short Term Investments Government & Agency Portfolio, 0.30% | 6,621,000 | 6,621,000 |
| Meridian Funds | 28 | www.meridianfund.com |
Table of Contents
Schedule of Investments (continued)
| Shares/ Principal Amount | Value | |
| Morgan Stanley Liquidity Funds, Government Portfolio, Institutional Class, 0.27% | 6,687,000 | $ 6,687,000 |
| Total Money Market Funds | 26,610,000 | |
| Repurchase Agreements - 13.3% | ||
| Citigroup Global Markets, Inc., dated 6/30/16, due 7/1/16, 0.44%, total to be received $44,806,244 (collateralized by various U.S. Government Sponsored Agency and U.S. Treasury Obligations, 0.50% - 7.50%, 4/30/17 - 3/15/57, totaling $45,701,812) | $44,805,696 | 44,805,696 |
| HSBC Securities, Inc., dated 6/30/16, due 7/1/16, 0.40%, total to be received $31,477,062 (collateralized by various U.S. Government Sponsored Agency Obligations, 3.00% - 8.00%, 8/1/22 - 6/1/46, totaling $32,106,340) | 31,476,712 | 31,476,712 |
| Merrill Lynch Pierce Fenner & Smith, Inc., dated 6/30/16, due 7/1/16, 0.44%, total to be received $44,806,244 (collateralized by various U.S. Government Sponsored Agency Obligations, 4.00%, 3/20/46 - 5/20/46, totaling $45,701,810) | 44,805,696 | 44,805,696 |
| Shares/ Principal Amount | Value | |
| Nomura Securities International, Inc., dated 6/30/16, due 7/1/16, 0.42%, total to be received $40,806,219 (collateralized by various U.S. Government Sponsored Agency and U.S. Treasury Obligations, 0.00% - 8.00%, 12/1/16 - 2/20/66, totaling $45,701,811) | $44,805,696 | $ 44,805,696 |
| Total Repurchase Agreements | 165,893,800 | |
| Total Short-Term Investments - 15.4% (Cost $192,503,800) | 192,503,800 | |
| Total Investments - 111.1% (Cost $1,303,650,774) | 1,388,038,573 | |
| Liabilities in Excess of Other Assets - (11.1)% | (139,020,606) | |
| Net Assets - 100.0% | $1,249,017,967 |
| Meridian Funds | 29 | www.meridianfund.com |
Table of Contents
Schedule of Investments (continued)
| ADR—American Depositary Receipt |
| CVR—Contingent Value Rights |
| N.V.—Naamloze Vennootschap is the Dutch term for limited liability company |
| Plc—Public Limited Company |
| 1 | Non-income producing securities |
| 2 | All or portion of this security is on loan at June 30, 2016. Total value of such securities at period-end amounts to $247,443,978 and represents 19.81% of net assets of the Fund. |
| 3 | Level 3 security. See Note 1 in Notes to Financial Statements. |
| 4 | Restricted security; cannot be offered for public resale without first being registered under the Securities Act of 1933 and related rules. Acquisition date represents the date on which an enforceable right to acquire such security is obtained and is presented along with related cost in the security description. The Fund has registration rights for certain restricted securities. Any costs related to such registration are borne by the issuer. The aggregate value of restricted securities at period-end amounts to $667,772 and represents 0.05% of net assets of the Fund. |
| 5 | Collateral received from brokers for securities lending was invested in short-term investments. |
| Meridian Funds | 30 | www.meridianfund.com |
Table of Contents
Schedule of Investments
| Shares | Value | |
| Common Stocks - 92.8% | ||
| Consumer Discretionary - 17.4% | ||
| Diversified Consumer Services - 2.3% | ||
| Regis Corp.1 | 567,601 | $ 7,066,632 |
| ServiceMaster Global Holdings, Inc.1 | 137,612 | 5,476,958 |
| 12,543,590 | ||
| Hotels, Restaurants & Leisure - 0.9% | ||
| Las Vegas Sands Corp. | 107,433 | 4,672,261 |
| Leisure Equipment & Products - 0.8% | ||
| Polaris Industries, Inc.2 | 55,999 | 4,578,478 |
| Multiline Retail - 1.9% | ||
| Fred's, Inc. Class A | 638,870 | 10,292,196 |
| Specialty Retail - 8.9% | ||
| Cabela's, Inc1 | 174,626 | 8,741,777 |
| Children's Place, Inc. (The) | 161,217 | 12,926,379 |
| Dick's Sporting Goods, Inc. | 181,252 | 8,167,215 |
| Five Below, Inc.1 | 180,702 | 8,386,380 |
| Select Comfort Corp.1 | 445,878 | 9,532,872 |
| 47,754,623 | ||
| Textiles, Apparel & Luxury Goods - 2.6% | ||
| Gildan Activewear, Inc. (Canada) | 483,184 | 14,171,787 |
| Total Consumer Discretionary | 94,012,935 | |
| Consumer Staples - 1.9% | ||
| Beverages - 1.6% | ||
| Diageo Plc ADR2 | 75,870 | 8,564,206 |
| Food Products - 0.3% | ||
| Nomad Foods Ltd.1 | 190,000 | 1,516,200 |
| Total Consumer Staples | 10,080,406 | |
| Energy - 6.6% | ||
| Energy Equipment & Services - 0.6% | ||
| Helmerich & Payne, Inc. 2 | 44,373 | 2,978,759 |
| Oil, Gas & Consumable Fuels - 6.0% | ||
| California Resources Corp.1,2 | 210,000 | 2,562,000 |
| EOG Resources, Inc. | 224,826 | 18,754,985 |
| TOTAL SA ADR | 229,000 | 11,014,900 |
| 32,331,885 | ||
| Total Energy | 35,310,644 | |
| Financials - 12.3% | ||
| Capital Markets - 1.9% | ||
| Oaktree Capital Group LLC 2 | 234,970 | 10,517,257 |
| Commercial Banks - 5.4% | ||
| Bank of Hawaii Corp.2 | 145,754 | 10,027,875 |
| Citizens Financial Group Inc. | 624,504 | 12,477,590 |
| Synchrony Financial 1 | 270,118 | 6,828,583 |
| 29,334,048 | ||
| Shares | Value | |
| Real Estate Investment Trusts - 2.1% | ||
| Rayonier, Inc. | 421,842 | $ 11,069,134 |
| Real Estate Management & Development - 2.9% | ||
| Alexander & Baldwin, Inc. | 431,677 | 15,600,807 |
| Total Financials | 66,521,246 | |
| Health Care - 9.4% | ||
| Biotechnology - 4.4% | ||
| Agios Pharmaceuticals, Inc.1,2 | 84,500 | 3,540,128 |
| Celgene Corp.1 | 151,000 | 14,893,130 |
| Neurocrine Biosciences, Inc.1 | 119,022 | 5,409,550 |
| 23,842,808 | ||
| Health Care Equipment & Supplies - 2.9% | ||
| CR Bard, Inc. | 42,801 | 10,065,083 |
| Endologix, Inc.1 | 433,378 | 5,399,890 |
| 15,464,973 | ||
| Life Sciences Tools & Services - 0.9% | ||
| Accelerate Diagnostics, Inc. 1,2 | 337,769 | 4,860,496 |
| Pharmaceuticals - 1.2% | ||
| Nektar Therapeutics 1,2 | 472,593 | 6,724,998 |
| Total Health Care | 50,893,275 | |
| Industrials - 10.9% | ||
| Aerospace & Defense - 0.8% | ||
| KLX, Inc.1 | 130,000 | 4,030,000 |
| Commercial Services & Supplies - 1.7% | ||
| Clean Harbors, Inc.1 | 175,703 | 9,155,883 |
| Electrical Equipment - 1.7% | ||
| EnerSys, Inc. | 151,000 | 8,979,970 |
| Machinery - 3.9% | ||
| Lindsay Corp.2 | 49,503 | 3,359,274 |
| Xylem, Inc. | 397,985 | 17,770,030 |
| 21,129,304 | ||
| Marine - 1.1% | ||
| Kirby Corp. | 97,207 | 6,064,745 |
| Professional Services - 0.5% | ||
| TriNet Group, Inc.1 | 126,950 | 2,639,290 |
| Road & Rail - 1.2% | ||
| Union Pacific Corp. | 76,000 | 6,631,000 |
| Total Industrials | 58,630,192 | |
| Information Technology - 27.2% | ||
| Electronic Equipment & Instruments - 3.9% | ||
| Trimble Navigation Ltd.1 | 517,961 | 12,617,530 |
| Zebra Technologies Corp. Class A1 | 164,000 | 8,216,400 |
| 20,833,930 | ||
| IT Services - 4.9% | ||
| Acxiom Corp.1 | 272,045 | 5,982,270 |
| Meridian Funds | 31 | www.meridianfund.com |
Table of Contents
Schedule of Investments (continued)
| Shares | Value | |
| CACI International, Inc. Class A1 | 224,800 | $ 20,324,168 |
| 26,306,438 | ||
| Semiconductors - 8.7% | ||
| Mellanox Technologies Ltd.1 | 146,382 | 7,020,481 |
| Micron Technology, Inc.1 | 280,000 | 3,852,800 |
| NVIDIA Corp. | 346,955 | 16,310,354 |
| Power Integrations, Inc. | 124,373 | 6,227,356 |
| QUALCOMM, Inc. | 253,000 | 13,553,210 |
| 46,964,201 | ||
| Software - 9.7% | ||
| Barracuda Networks, Inc.1 | 275,239 | 4,167,119 |
| Fortinet, Inc.1 | 227,115 | 7,174,563 |
| Microsoft Corp. | 420,200 | 21,501,634 |
| Silver Spring Networks, Inc.1 | 590,303 | 7,172,181 |
| Verint Systems, Inc.1 | 367,000 | 12,158,710 |
| 52,174,207 | ||
| Total Information Technology | 146,278,776 | |
| Materials - 5.6% | ||
| Chemicals - 2.2% | ||
| Flotek Industries, Inc.1,2 | 260,790 | 3,442,428 |
| Platform Specialty Products Corp.1,2 | 640,000 | 5,683,200 |
| Potash Corp. of Saskatchewan, Inc. | 150,000 | 2,436,000 |
| 11,561,628 | ||
| Containers & Packaging - 1.6% | ||
| Owens-Illinois, Inc.1 | 481,000 | 8,662,810 |
| Metals & Mining - 1.8% | ||
| Newmont Mining Corp. | 252,210 | 9,866,455 |
| Total Materials | 30,090,893 | |
| Telecommunication Services - 1.5% | ||
| Diversified Telecommunications - 1.5% | ||
| Iridium Communications, Inc.1,2 | 935,515 | 8,307,373 |
| Total Telecommunication Services | 8,307,373 | |
| Total Common Stocks - 92.8% (Cost $433,500,188) | 500,125,740 | |
| Shares/ Principal Amount | ||
| Short-Term Investments - 8.5%3 | ||
| Money Market Funds - 1.2% | ||
| Federated Treasury Obligations Fund, 0.24% | 1,583,000 | 1,583,000 |
| Fidelity Money Market Funds, Government Portfolio, Institutional Class, 0.30% | 1,593,000 | 1,593,000 |
| Shares/ Principal Amount | Value | |
| Invesco Short Term Investments Government & Agency Portfolio, 0.30% | 1,583,000 | $ 1,583,000 |
| Morgan Stanley Liquidity Funds, Government Portfolio, Institutional Class, 0.27% | 1,583,000 | 1,583,000 |
| Total Money Market Funds | 6,342,000 | |
| Repurchase Agreements - 7.3% | ||
| Citigroup Global Markets, Inc., dated 6/30/16, due 7/1/16, 0.44%, total to be received $10,585,284 (collateralized by various U.S. Government Sponsored Agency and U.S. Treasury Obligations, 0.50% - 7.50%, 4/30/17 - 3/15/57, totaling $10,796,859) | $10,585,155 | 10,585,155 |
| HSBC Securities, Inc., dated 6/30/16, due 7/1/16, 0.40%, total to be received $7,380,813 (collateralized by various U.S. Government Sponsored Agency Obligations, 3.00% - 8.00%, 8/1/22 - 6/1/46, totaling $7,528,368) | 7,380,731 | 7,380,731 |
| Merrill Lynch Pierce Fenner & Smith, Inc., dated 6/30/16, due 7/1/16, 0.44%, total to be received $10,585,284 (collateralized by various U.S. Government Sponsored Agency Obligations, 4.00%, 3/20/46 - 5/20/46, totaling $10,796,858) | 10,585,155 | 10,585,155 |
| Meridian Funds | 32 | www.meridianfund.com |
Table of Contents
Schedule of Investments (continued)
| Shares/ Principal Amount | Value | |
| Nomura Securities International, Inc., dated 6/30/16, due 7/1/16, 0.42%, total to be received $10,585,278 (collateralized by various U.S. Government Sponsored Agency and U.S. Treasury Obligations, 0.00% - 8.00%, 12/1/16 - 2/20/66, totaling $10,796,858) | $10,585,155 | $ 10,585,155 |
| Total Repurchase Agreements | 39,136,196 | |
| Total Short-Term Investments - 8.5% (Cost $45,478,196) | 45,478,196 | |
| Total Investments - 101.3% (Cost $478,978,384) | 545,603,936 | |
| Liabilities in Excess of Other Assets - (1.3)% | (6,889,282) | |
| Net Assets - 100.0% | $538,714,654 |
| ADR—American Depositary Receipt |
| Plc—Public Limited Company |
| 1 | Non-income producing securities |
| 2 | All or portion of this security is on loan at June 30, 2016. Total value of such securities at period-end amounts to $44,995,500 and represents 8.35% of net assets of the Fund. |
| 3 | Collateral received from brokers for securities lending was invested in short-term investments. |
| Meridian Funds | 33 | www.meridianfund.com |
Table of Contents
Schedule of Investments
| Shares | Value | |
| Common Stocks - 79.6% | ||
| Consumer Discretionary - 14.7% | ||
| Hotels, Restaurants & Leisure - 3.7% | ||
| Las Vegas Sands Corp. | 14,531 | $ 631,953 |
| Starbucks Corp. | 18,247 | 1,042,269 |
| 1,674,222 | ||
| Internet & Catalog Retail - 2.8% | ||
| Amazon.com, Inc.1 | 1,785 | 1,277,381 |
| Media - 2.2% | ||
| Walt Disney Co. (The) | 10,379 | 1,015,274 |
| Specialty Retail - 3.6% | ||
| Tiffany & Co.2 | 11,064 | 670,921 |
| TJX Companies, Inc. (The) | 12,975 | 1,002,059 |
| 1,672,980 | ||
| Textiles, Apparel & Luxury Goods - 2.4% | ||
| NIKE, Inc. Class B | 20,000 | 1,104,000 |
| Total Consumer Discretionary | 6,743,857 | |
| Consumer Staples - 6.0% | ||
| Beverages - 1.6% | ||
| Brown-Forman Corp. Class B | 7,300 | 728,248 |
| Food & Staples Retailing - 2.2% | ||
| Costco Wholesale Corp. | 6,432 | 1,010,081 |
| Tobacco - 2.2% | ||
| Altria Group, Inc. | 14,946 | 1,030,676 |
| Total Consumer Staples | 2,769,005 | |
| Energy - 1.8% | ||
| Oil, Gas & Consumable Fuels - 1.8% | ||
| California Resources Corp.1,2 | 30,000 | 366,000 |
| EOG Resources, Inc. | 5,678 | 473,659 |
| Total Energy | 839,659 | |
| Financials - 2.9% | ||
| Commercial Banks - 1.8% | ||
| U.S. Bancorp | 20,679 | 833,984 |
| Diversified Financial Services - 1.1% | ||
| Intercontinental Exchange, Inc. | 2,027 | 518,831 |
| Total Financials | 1,352,815 | |
| Health Care - 8.5% | ||
| Biotechnology - 6.0% | ||
| Alnylam Pharmaceuticals, Inc.1,2 | 6,500 | 360,685 |
| Celgene Corp.1 | 5,737 | 565,840 |
| Chimerix, Inc. 1 | 10,337 | 40,624 |
| Exact Sciences Corp.1,2 | 25,000 | 306,250 |
| Gilead Sciences, Inc. | 12,570 | 1,048,589 |
| OvaScience, Inc. 1,2 | 25,941 | 135,153 |
| Vertex Pharmaceuticals, Inc. 1 | 3,736 | 321,371 |
| 2,778,512 | ||
| Shares | Value | |
| Life Sciences Tools & Services - 0.9% | ||
| Accelerate Diagnostics, Inc. 1,2 | 26,964 | $ 388,012 |
| Pharmaceuticals - 1.6% | ||
| Perrigo Co. Plc | 8,304 | 752,924 |
| Total Health Care | 3,919,448 | |
| Industrials - 10.2% | ||
| Aerospace & Defense - 2.6% | ||
| Lockheed Martin Corp. | 4,809 | 1,193,450 |
| Air Freight & Logistics - 3.5% | ||
| United Parcel Service, Inc. Class B | 15,000 | 1,615,800 |
| Professional Services - 4.1% | ||
| Equifax, Inc. | 14,531 | 1,865,780 |
| Total Industrials | 4,675,030 | |
| Information Technology - 27.9% | ||
| Electronic Equipment & Instruments - 0.9% | ||
| Fitbit, Inc. Class A1,2 | 35,953 | 439,346 |
| Internet Software & Services - 8.6% | ||
| Alphabet, Inc. Class A1 | 1,622 | 1,141,125 |
| Facebook, Inc. Class A1 | 14,192 | 1,621,862 |
| LinkedIn Corp. Class A1 | 2,491 | 471,422 |
| Twilio, Inc. Class A1,2 | 10,000 | 365,000 |
| Twitter, Inc. 1,2 | 20,345 | 344,034 |
| 3,943,443 | ||
| IT Services - 3.9% | ||
| International Business Machines Corp. | 3,448 | 523,337 |
| MasterCard, Inc. Class A | 5,934 | 522,548 |
| Visa, Inc. Class A | 9,964 | 739,030 |
| 1,784,915 | ||
| Semiconductors - 5.5% | ||
| NVIDIA Corp. | 30,405 | 1,429,339 |
| QUALCOMM, Inc. | 20,758 | 1,112,006 |
| 2,541,345 | ||
| Software - 4.8% | ||
| Atlassian Corp. Plc Class A1,2 | 8,685 | 224,942 |
| Microsoft Corp. | 38,523 | 1,971,222 |
| 2,196,164 | ||
| Technology Hardware, Storage & Peripherals - 4.2% | ||
| Apple, Inc. | 20,000 | 1,912,000 |
| Total Information Technology | 12,817,213 | |
| Materials - 6.5% | ||
| Chemicals - 1.8% | ||
| Dow Chemical Co. (The) | 8,133 | 404,292 |
| Mosaic Co. (The) 2 | 16,607 | 434,771 |
| 839,063 | ||
| Meridian Funds | 34 | www.meridianfund.com |
Table of Contents
Schedule of Investments (continued)
| Shares | Value | |
| Metals & Mining - 4.7% | ||
| Royal Gold, Inc. 2 | 30,000 | $ 2,160,600 |
| Total Materials | 2,999,663 | |
| Utilities - 1.1% | ||
| Multi-Utilities - 1.1% | ||
| Dominion Resources, Inc. | 6,211 | 484,023 |
| Total Utilities | 484,023 | |
| Total Common Stocks - 79.6% (Cost $34,661,544) | 36,600,713 | |
| Exchange Traded Funds - 1.8% | ||
| Sprott Physical Gold Trust2 | 75,000 | 823,500 |
| Total Exchange Traded Funds - 1.8% (Cost $765,948) | 823,500 | |
| Principal Amount | ||
| Corporate Bonds - 5.6% | ||
| Energy - 5.6% | ||
| Oil, Gas & Consumable Fuels - 5.6% | ||
| California Resources Corp., 8.00%, 12/15/22 | $3,616,000 | 2,567,360 |
| Total Corporate Bonds - 5.6% (Cost $1,554,253) | 2,567,360 | |
| Number of Contracts | ||
| Call Options Purchased - 0.0% | ||
| Twitter, Inc. Expiring January 20, 2017 at $50.00 | 25 | 100 |
| Twitter, Inc. Expiring January 19, 2018 at $30.00 | 250 | 25,000 |
| Total Call Options Purchased - 0.0% (Cost $77,093) | 25,100 | |
| Principal Amount | Value | |
| Short-Term Investments - 11.9%3 | ||
| Repurchase Agreements - 11.9% | ||
| Citigroup Global Markets, Inc., dated 6/30/16, due 7/1/16, 0.44%, total to be received $1,280,199 (collateralized by various U.S. Government Sponsored Agency and U.S. Treasury Obligations, 0.50% - 7.50%, 4/30/17 - 3/15/57, totaling $1,305,787) | $1,280,183 | $ 1,280,183 |
| Daiwa Capital Markets America, Inc., dated 6/30/16, due 7/1/16, 0.50%, total to be received $1,280,201 (collateralized by various U.S. Government Sponsored Agency and U.S. Treasury Obligations, 0.00% - 9.00%, 7/7/16 - 2/1/49, totaling $1,305,787) | 1,280,183 | 1,280,183 |
| Merrill Lynch Pierce Fenner & Smith, Inc., dated 6/30/16, due 7/1/16, 0.44%, total to be received $1,280,199 (collateralized by various U.S. Government Sponsored Agency Obligations, 4.00%, 3/20/46 - 5/20/46, totaling $1,305,787) | 1,280,183 | 1,280,183 |
| Mizuho Securities USA, Inc., dated 6/30/16, due 7/1/16, 0.45%, total to be received $379,458 (collateralized by various U.S. Government Sponsored Agency Obligations, 1.00% - 8.00%, 6/1/22 - 11/20/45, totaling $387,042) | 379,453 | 379,453 |
| Meridian Funds | 35 | www.meridianfund.com |
Table of Contents
Schedule of Investments (continued)
| Principal Amount | Value | |
| Nomura Securities International, Inc., dated 6/30/16, due 7/1/16, 0.42%, total to be received $1,280,198 (collateralized by various U.S. Government Sponsored Agency and U.S. Treasury Obligations, 0.00% - 8.00%, 12/1/16 - 2/20/66, totaling $1,305,787) | $1,280,183 | $ 1,280,183 |
| Total Repurchase Agreements | 5,500,185 | |
| Total Investments - 98.9% (Cost $42,559,023) | 45,516,858 | |
| Cash and Other Assets, Less Liabilities - 1.1% | 489,365 | |
| Net Assets - 100.0% | $46,006,223 |
| Shares | Value | |
| Securities Sold Short - (5.7)% | ||
| Consumer Discretionary - (3.2)% | ||
| Hotels, Restaurants & Leisure - (2.0)% | ||
| McDonald's Corp. | (7,500) | $ (902,550) |
| Textiles, Apparel & Luxury Goods - (1.2)% | ||
| Deckers Outdoor Corp.1 | (10,000) | (575,200) |
| Total Consumer Discretionary | (1,477,750) | |
| Consumer Staples - (2.5)% | ||
| Household Products - (2.5)% | ||
| Procter & Gamble Co. (The) | (13,500) | (1,143,045) |
| Total Consumer Staples | (1,143,045) | |
| Total Securities Sold Short - (5.7%) (Proceeds $(2,446,254)) | $(2,620,795) | |
| Plc—Public Limited Company |
| 1 | Non-income producing securities |
| 2 | All or portion of this security is on loan at June 30, 2016. Total value of such securities at period-end amounts to $ 6,093,532 and represents 13.25% of net assets of the Fund. |
| 3 | Collateral received from brokers for securities lending was invested in short-term investments. |
| Meridian Funds | 36 | www.meridianfund.com |
Table of Contents
Schedule of Investments
| Shares | Value | |
| Common Stocks - 90.0% | ||
| Consumer Discretionary - 18.5% | ||
| Auto Components - 1.0% | ||
| Dorman Products, Inc.1 | 59,412 | $ 3,398,366 |
| Distributors - 0.3% | ||
| Fenix Parts, Inc.1,2 | 277,030 | 1,088,728 |
| Diversified Consumer Services - 4.4% | ||
| 2U, Inc.1,2 | 168,824 | 4,965,114 |
| Easterly Acquisition Corp.1,2 | 287,830 | 2,907,083 |
| Grand Canyon Education, Inc.1 | 98,736 | 3,941,541 |
| Pace Holdings Corp.1,2 | 268,786 | 2,687,860 |
| 14,501,598 | ||
| Hotels, Restaurants & Leisure - 2.1% | ||
| Del Frisco's Restaurant Group, Inc.1 | 181,805 | 2,603,448 |
| Dunkin' Brands Group, Inc.2 | 81,878 | 3,571,518 |
| Papa Murphy's Holdings, Inc.1,2 | 135,505 | 899,076 |
| 7,074,042 | ||
| Leisure Equipment & Products - 1.2% | ||
| Arctic Cat, Inc.2 | 105,593 | 1,795,081 |
| Malibu Boats, Inc. Class A1 | 179,132 | 2,163,915 |
| 3,958,996 | ||
| Media - 2.3% | ||
| National CineMedia, Inc. | 493,809 | 7,644,163 |
| Specialty Retail - 5.1% | ||
| Boot Barn Holdings, Inc. 1,2 | 321,636 | 2,772,502 |
| Five Below, Inc.1,2 | 68,799 | 3,192,962 |
| Hibbett Sports, Inc.1,2 | 118,891 | 4,136,218 |
| Monro Muffler Brake, Inc. | 31,828 | 2,022,988 |
| Sally Beauty Holdings, Inc.1,2 | 118,634 | 3,489,026 |
| Winmark Corp. | 14,696 | 1,464,750 |
| 17,078,446 | ||
| Textiles, Apparel & Luxury Goods - 2.1% | ||
| Tumi Holdings, Inc.1 | 68,744 | 1,838,214 |
| Wolverine World Wide, Inc. | 256,884 | 5,219,883 |
| 7,058,097 | ||
| Total Consumer Discretionary | 61,802,436 | |
| Energy - 2.8% | ||
| Energy Equipment & Services - 1.3% | ||
| RigNet, Inc.1 | 202,087 | 2,705,945 |
| US Silica Holdings, Inc. | 48,731 | 1,679,757 |
| 4,385,702 | ||
| Oil, Gas & Consumable Fuels - 1.5% | ||
| Evolution Petroleum Corp. | 892,591 | 4,882,473 |
| Total Energy | 9,268,175 | |
| Financials - 5.4% | ||
| Capital Markets - 2.6% | ||
| Financial Engines, Inc.2 | 150,796 | 3,901,092 |
| Shares | Value | |
| PennantPark Investment Corp.1 | 234,637 | $ 1,602,571 |
| WisdomTree Investments, Inc.2 | 345,777 | 3,385,157 |
| 8,888,820 | ||
| Commercial Banks - 0.6% | ||
| Bank of the Ozarks, Inc.2 | 50,300 | 1,887,256 |
| Diversified Financial Services - 0.5% | ||
| Bats Global Markets, Inc.2 | 68,262 | 1,753,651 |
| Insurance - 0.5% | ||
| Trupanion, Inc. 1,2 | 125,760 | 1,666,320 |
| Real Estate Investment Trusts - 1.2% | ||
| Jernigan Capital, Inc.2 | 97,349 | 1,357,045 |
| National Storage Affiliates Trust | 122,727 | 2,555,176 |
| 3,912,221 | ||
| Total Financials | 18,108,268 | |
| Health Care - 17.3% | ||
| Biotechnology - 4.7% | ||
| Atara Biotherapeutics, Inc. 1,2 | 70,920 | 1,596,409 |
| Bluebird Bio, Inc.1,2 | 42,607 | 1,844,457 |
| Chimerix, Inc. 1 | 272,226 | 1,069,848 |
| DBV Technologies SA ADR (France)1 | 56,623 | 1,847,042 |
| Exact Sciences Corp.1,2 | 154,625 | 1,894,156 |
| Neurocrine Biosciences, Inc.1 | 37,500 | 1,704,375 |
| Repligen Corp.1 | 67,347 | 1,842,614 |
| Versartis, Inc.1,2 | 178,842 | 1,977,993 |
| Xencor, Inc. 1,2 | 104,889 | 1,991,842 |
| 15,768,736 | ||
| Health Care Equipment & Supplies - 6.0% | ||
| Endologix, Inc.1,2 | 301,701 | 3,759,195 |
| Insulet Corp.1,2 | 56,637 | 1,712,703 |
| LDR Holding Corp. 1 | 134,548 | 4,971,549 |
| Merit Medical Systems, Inc.1 | 83,988 | 1,665,482 |
| Nevro Corp. 1,2 | 22,522 | 1,661,223 |
| Novadaq Technologies, Inc.1 | 166,930 | 1,642,591 |
| Quidel Corp.1,2 | 95,661 | 1,708,505 |
| Spectranetics Corp. (The)1,2 | 161,709 | 3,025,575 |
| 20,146,823 | ||
| Health Care Providers & Services - 1.1% | ||
| Diplomat Pharmacy, Inc.1,2 | 78,971 | 2,763,985 |
| National Research Corp. Class A | 63,034 | 863,566 |
| 3,627,551 | ||
| Health Care Technology - 1.9% | ||
| Castlight Health, Inc. Class B1,2 | 349,213 | 1,382,883 |
| HealthStream, Inc.1 | 68,385 | 1,813,570 |
| Medidata Solutions, Inc.1 | 64,642 | 3,029,771 |
| 6,226,224 | ||
| Life Sciences Tools & Services - 2.4% | ||
| Accelerate Diagnostics, Inc. 1,2 | 112,324 | 1,616,342 |
| INC Research Holdings, Inc. Class A1 | 132,004 | 5,033,313 |
| Meridian Funds | 37 | www.meridianfund.com |
Table of Contents
Schedule of Investments (continued)
| Shares | Value | |
| Pacific Biosciences of California, Inc.1,2 | 204,647 | $ 1,439,692 |
| 8,089,347 | ||
| Pharmaceuticals - 1.2% | ||
| Marinus Pharmaceuticals, Inc.1 | 245,714 | 312,057 |
| NeuroDerm Ltd.1,2 | 101,280 | 1,645,800 |
| Revance Therapeutics, Inc.1,2 | 126,640 | 1,722,304 |
| Syndax Pharmaceuticals, Inc.1,2 | 19,781 | 194,843 |
| Syndax Pharmaceuticals, Inc. Acquisition Date: 8/18/15, Cost $210,9991,3,4 | 15,081 | 126,226 |
| 4,001,230 | ||
| Total Health Care | 57,859,911 | |
| Industrials - 22.8% | ||
| Aerospace & Defense - 1.9% | ||
| HEICO Corp. Class A | 83,170 | 4,462,071 |
| TASER International, Inc.1,2 | 79,205 | 1,970,620 |
| 6,432,691 | ||
| Air Freight & Logistics - 1.9% | ||
| Forward Air Corp. | 110,872 | 4,937,130 |
| Park-Ohio Holdings Corp. | 53,737 | 1,519,683 |
| 6,456,813 | ||
| Commercial Services & Supplies - 7.3% | ||
| Clean Harbors, Inc.1 | 131,881 | 6,872,319 |
| Heritage-Crystal Clean, Inc.1 | 548,269 | 6,694,365 |
| InnerWorkings, Inc.1 | 358,723 | 2,966,639 |
| Ritchie Bros. Auctioneers, Inc. (Canada) | 70,893 | 2,394,766 |
| SP Plus Corp.1 | 239,249 | 5,402,242 |
| 24,330,331 | ||
| Machinery - 2.8% | ||
| Kennametal, Inc. | 92,079 | 2,035,867 |
| Proto Labs, Inc.1,2 | 58,234 | 3,351,949 |
| Tennant Co. | 72,965 | 3,930,624 |
| 9,318,440 | ||
| Marine - 1.0% | ||
| Kirby Corp. | 52,383 | 3,268,175 |
| Professional Services - 4.3% | ||
| Advisory Board Co. (The)1 | 44,203 | 1,564,344 |
| CEB, Inc. | 100,836 | 6,219,565 |
| TriNet Group, Inc.1 | 237,372 | 4,934,964 |
| TrueBlue, Inc.1 | 90,423 | 1,710,803 |
| 14,429,676 | ||
| Road & Rail - 2.3% | ||
| Heartland Express, Inc.2 | 289,262 | 5,030,266 |
| Roadrunner Transportation Systems, Inc.1 | 156,896 | 1,170,444 |
| Shares | Value | |
| Saia, Inc.1 | 63,408 | $ 1,594,077 |
| 7,794,787 | ||
| Trading Companies & Distributors - 1.3% | ||
| MSC Industrial Direct Co., Inc. Class A | 59,358 | 4,188,300 |
| Total Industrials | 76,219,213 | |
| Information Technology - 22.5% | ||
| Electronic Equipment & Instruments - 1.5% | ||
| DTS, Inc.1 | 130,879 | 3,461,750 |
| Mesa Laboratories, Inc. 2 | 12,909 | 1,587,807 |
| 5,049,557 | ||
| Internet Software & Services - 12.1% | ||
| Actua Corp.1,2 | 223,555 | 2,018,702 |
| Carbonite, Inc.1 | 499,627 | 4,861,371 |
| ChannelAdvisor Corp.1 | 422,043 | 6,115,403 |
| Cimpress, N.V. (Netherlands)1,2 | 35,902 | 3,320,217 |
| comScore, Inc.1 | 69,043 | 1,648,747 |
| Demandware, Inc.1 | 77,013 | 5,768,274 |
| Envestnet, Inc.1 | 89,511 | 2,981,611 |
| LivePerson, Inc.1 | 404,108 | 2,562,045 |
| New Relic, Inc. 1,2 | 58,056 | 1,705,685 |
| Q2 Holdings, Inc.1 | 71,438 | 2,001,693 |
| SciQuest, Inc.1,2 | 106,648 | 1,883,404 |
| Shutterstock, Inc.1,2 | 63,218 | 2,895,384 |
| SPS Commerce, Inc.1 | 33,575 | 2,034,645 |
| Twilio, Inc. Class A1,2 | 20,657 | 753,980 |
| 40,551,161 | ||
| IT Services - 1.7% | ||
| Cass Information Systems, Inc. | 50,191 | 2,594,875 |
| Euronet Worldwide, Inc.1 | 19,085 | 1,320,491 |
| Forrester Research, Inc. | 48,346 | 1,782,034 |
| 5,697,400 | ||
| Software - 6.6% | ||
| Barracuda Networks, Inc.1,2 | 170,765 | 2,585,382 |
| Callidus Software, Inc.1 | 187,623 | 3,748,708 |
| Descartes Systems Group, Inc. (The)1 | 128,304 | 2,449,323 |
| Exa Corp.1 | 367,984 | 5,317,369 |
| Fleetmatics Group Plc (Ireland)1 | 100,575 | 4,357,915 |
| QAD, Inc. Class A1 | 90,531 | 1,744,532 |
| RealPage, Inc.1 | 82,362 | 1,839,143 |
| 22,042,372 | ||
| Technology Hardware, Storage & Peripherals - 0.6% | ||
| Stratasys Ltd.1,2 | 90,760 | 2,077,496 |
| Total Information Technology | 75,417,986 | |
| Meridian Funds | 38 | www.meridianfund.com |
Table of Contents
Schedule of Investments (continued)
| Shares | Value | |
| Materials - 0.7% | ||
| Chemicals - 0.7% | ||
| Balchem Corp. | 41,849 | $ 2,496,293 |
| Total Materials | 2,496,293 | |
| Total Common Stocks - 90.0% (Cost $290,751,676) | 301,172,282 | |
| Shares/ Principal Amount | ||
| Short-Term Investments - 18.5%5 | ||
| Money Market Funds - 2.3% | ||
| Federated Treasury Obligations Fund, 0.24% | 1,953,000 | 1,953,000 |
| Fidelity Money Market Funds, Government Portfolio, Institutional Class, 0.30% | 1,970,000 | 1,970,000 |
| Invesco Short Term Investments Government & Agency Portfolio, 0.30% | 2,056,000 | 2,056,000 |
| Morgan Stanley Liquidity Funds, Government Portfolio, Institutional Class, 0.27% | 1,869,000 | 1,869,000 |
| Total Money Market Funds | 7,848,000 | |
| Repurchase Agreements - 16.2% | ||
| Citigroup Global Markets, Inc., dated 6/30/16, due 7/1/16, 0.44%, total to be received $14,442,202 (collateralized by various U.S. Government Sponsored Agency and U.S. Treasury Obligations, 0.50% - 7.50%, 4/30/17 - 3/15/57, totaling $14,730,866) | $14,442,025 | 14,442,025 |
| Daiwa Capital Markets America, Inc., dated 6/30/16, due 7/1/16, 0.50%, total to be received $14,442,226 (collateralized by various U.S. Government Sponsored Agency and U.S. Treasury Obligations, 0.00% - 9.00%, 7/7/16 - 2/1/49, totaling $14,730,866) | 14,442,025 | 14,442,025 |
| Shares/ Principal Amount | Value | |
| HSBC Securities, Inc., dated 6/30/16, due 7/1/16, 0.40%, total to be received $10,874,927 (collateralized by various U.S. Government Sponsored Agency Obligations, 3.00% - 8.00%, 8/1/22 - 6/1/46, totaling $11,092,335) | $10,874,806 | $ 10,874,806 |
| Nomura Securities International, Inc., dated 6/30/16, due 7/1/16, 0.42%, total to be received $14,442,193 (collateralized by various U.S. Government Sponsored Agency and U.S. Treasury Obligations, 0.00% - 8.00%, 12/1/16 - 2/20/66, totaling $14,730,866) | 14,442,025 | 14,442,025 |
| Total Repurchase Agreements | 54,200,881 | |
| Total Short-Term Investments - 18.5% (Cost $62,048,881) | 62,048,881 | |
| Total Investments - 108.5% (Cost $352,800,557) | 363,221,163 | |
| Liabilities in Excess of Other Assets - (8.5)% | (28,477,817) | |
| Net Assets - 100.0% | $334,743,346 |
| Meridian Funds | 39 | www.meridianfund.com |
Table of Contents
Schedule of Investments (continued)
| ADR—American Depositary Receipt |
| N.V.—Naamloze Vennootschap is the Dutch term for limited liability company |
| Plc—Public Limited Company |
| 1 | Non-income producing securities |
| 2 | All or portion of this security is on loan at June 30, 2016. Total value of such securities at period-end amounts to $66,628,285 and represents 19.90% of net assets of the Fund. |
| 3 | Level 3 security. See Note 1 in Notes to Financial Statements. |
| 4 | Restricted security; cannot be offered for public resale without first being registered under the Securities Act of 1933 and related rules. Acquisition date represents the date on which an enforceable right to acquire such security is obtained and is presented along with related cost in the security description. The Fund has registration rights for certain restricted securities. Any costs related to such registration are borne by the issuer. The aggregate value of restricted securities at period-end amounts to $126,226 and represents 0.04% of net assets of the Fund. |
| 5 | Collateral received from brokers for securities lending was invested in short-term investments. |
| Meridian Funds | 40 | www.meridianfund.com |
Table of Contents
Statements of Assets and Liabilities
| June 30, 2016 | Meridian Growth Fund | Meridian Contrarian Fund | Meridian Equity Income Fund | Meridian Small Cap Growth Fund |
| Assets | ||||
Investments, at value1,2 | $1,222,144,773 | $506,467,740 | $40,016,673 | $309,020,282 |
Repurchase agreements3 | 165,893,800 | 39,136,196 | 5,500,185 | 54,200,881 |
Cash and cash equivalents | 54,456,221 | 42,801,905 | 3,296,144 | 33,525,827 |
Cash held as collateral | — | 1,000,000 | 5,413,828 | — |
| Receivables and other assets: | ||||
Fund shares purchased | 931,626 | 9,782 | 69 | 1,146,511 |
Investments sold | — | — | 722,631 | 1,994,285 |
Dividends and interest | 196,428 | 188,286 | 53,079 | 152,727 |
Securities lending interest | 86,692 | 30,152 | — | 56,665 |
Prepaid expenses | 49,380 | 27,072 | 18,150 | 24,640 |
Total Assets | 1,443,758,920 | 589,661,133 | 55,020,759 | 400,121,818 |
| Liabilities | ||||
Securities sold short4 | — | — | 2,620,795 | — |
Collateral held for securities on loan | 192,503,800 | 45,478,196 | 5,500,185 | 62,048,881 |
| Payables and other accrued expenses: | ||||
Fund shares sold | 1,208,469 | 191,430 | — | 108,104 |
Investments purchased | — | 4,706,835 | 848,407 | 2,817,857 |
Investment advisory fees | 780,820 | 449,629 | 27,761 | 259,560 |
Service plan fees | 4,906 | 320 | 289 | 40,374 |
Professional fees | 125,699 | 57,212 | 8,701 | 36,022 |
Transfer agent fees | 58,265 | 34,316 | 1,869 | 48,362 |
Other | 58,994 | 28,541 | 6,529 | 19,312 |
Total Liabilities | 194,740,953 | 50,946,479 | 9,014,536 | 65,378,472 |
Net Assets | $1,249,017,967 | $538,714,654 | $46,006,223 | $334,743,346 |
| Net Assets Consist of | ||||
Paid in capital | $1,208,378,352 | $485,556,723 | $46,129,267 | $335,784,114 |
Accumulated net realized loss on investments, written options, and foreign currency transactions | (40,758,077) | (13,043,757) | (3,273,230) | (10,465,945) |
Net unrealized appreciation on investments and foreign currency translations | 84,387,799 | 66,625,552 | 2,783,294 | 10,420,606 |
Undistributed (distributions in excess of) net investment income | (2,990,107) | (423,864) | 366,892 | (995,429) |
Net Assets | $1,249,017,967 | $538,714,654 | $46,006,223 | $334,743,346 |
1 Investments at cost | 1,137,756,974 | 439,842,188 | 37,058,838 | 298,599,676 |
| 2 | Including securities on loan valued at $247,443,978, $44,995,500, $6,093,532 and $66,628,285, respectively. See Note 4 in Notes to Financial Statements. |
| 3 | Repurchase agreements at cost $165,893,800, $39,136,196, $5,500,185 and $54,200,881, respectively. |
| 4 | Proceeds received from Securities sold short $—, $—, $2,446,254 and $—, respectively. |
| Meridian Funds | 41 | www.meridianfund.com |
Table of Contents
Statements of Assets and Liabilities (continued)
| June 30, 2016 | Meridian Growth Fund | Meridian Contrarian Fund | Meridian Equity Income Fund | Meridian Small Cap Growth Fund |
| Net Asset Value | ||||
| Legacy Class | ||||
Net Assets | $1,161,981,162 | $536,799,358 | $45,251,227 | $ 44,001,496 |
Shares outstanding4 | 35,536,693 | 16,556,444 | 3,902,233 | 3,708,054 |
Net Asset value per share (offering and redemption price) | $ 32.70 | $ 32.42 | $ 11.60 | $ 11.87 |
| Institutional Class | ||||
Net Assets | $ 45,686,831 | $ — | $ — | $ 52,784,304 |
Shares outstanding4 | 1,397,997 | — | — | 4,442,615 |
Net Asset value per share (offering and redemption price) | $ 32.68 | $ — | $ — | $ 11.88 |
| Class A5 | ||||
Net Assets | $ 8,831,720 | $ 430,681 | $ 502,171 | $ 52,172,612 |
Shares outstanding4 | 275,137 | 13,425 | 43,520 | 4,438,049 |
Net Asset value per share (offering and redemption price) | $ 32.10 | $ 32.08 | $ 11.54 | $ 11.76 |
| Class C6 | ||||
Net Assets | $ 803,944 | $ 13,741 | $ 955 | $ 23,689,325 |
Shares outstanding4 | 24,855 | 428 | 83 | 2,018,504 |
Net Asset value per share (offering and redemption price) | $ 32.347 | $ 32.097 | $ 11.507 | $ 11.74 |
| Investor Class | ||||
Net Assets | $ 31,714,310 | $ 1,470,874 | $ 251,870 | $162,095,609 |
Shares outstanding4 | 976,436 | 45,481 | 21,713 | 13,677,444 |
Net Asset value per share (offering and redemption price) | $ 32.48 | $ 32.34 | $ 11.60 | $ 11.85 |
| 4 | 500,000,000 shares authorized, $0.01 par value. |
| 5 | On July 1, 2015, the Fund's Advisor Class Shares were redesignated as Class A Shares. |
| 6 | Commenced operations on July 1, 2015. |
| 7 | The NAV reported above represents the traded NAV at June 30, 2016. |
| Meridian Funds | 42 | www.meridianfund.com |
Table of Contents
Statements of Operations
| For the Year Ended June 30, 2016 | Meridian Growth Fund | Meridian Contrarian Fund | Meridian Equity Income Fund | Meridian Small Cap Growth Fund |
| Investment Income | ||||
Dividends | $ 7,000,894 | $ 5,326,789 | $ 689,390 | $ 1,509,970 |
Foreign taxes withheld | (89,541) | (126,287) | (3,495) | (10,750) |
Interest income | — | — | 271,710 | — |
Securities lending | 1,443,691 | 602,797 | 49,328 | 406,440 |
Total investment income | 8,355,044 | 5,803,299 | 1,006,933 | 1,905,660 |
| Expenses | ||||
Investment advisory fees | 11,405,057 | 5,833,604 | 420,103 | 2,717,967 |
Custodian fees | 142,848 | 59,483 | 11,610 | 35,424 |
| Distribution and service plan fees: | ||||
Investor Class | 17,247 | 596 | 141 | 68,640 |
Class A1 | 25,190 | 1,475 | 1,570 | 140,417 |
Class C2 | 3,034 | 98 | 10 | 150,216 |
Directors' fees | 256,018 | 100,669 | 8,218 | 46,252 |
Pricing fees | 153,774 | 72,707 | 25,655 | 45,168 |
Audit and tax fees | 107,091 | 43,136 | 3,590 | 26,535 |
Legal fees | 65,646 | 24,755 | 1,792 | 10,711 |
Registration and filing fees | 106,305 | 90,394 | 85,352 | 112,448 |
Shareholder communications | 149,289 | 67,295 | 6,564 | 41,385 |
Transfer agent fees | 465,945 | 267,993 | 15,479 | 344,920 |
Recoupment of investment advisory fees previously waived | 25,491 | 2,023 | 10,149 | 19,869 |
Miscellaneous expenses | 84,613 | 34,657 | 6,921 | 18,397 |
Total expenses excluding dividend expense | 13,007,548 | 6,598,885 | 597,154 | 3,778,349 |
Dividend expense | — | — | 21,400 | — |
Total expense | 13,007,548 | 6,598,885 | 618,554 | 3,778,349 |
Less waivers and/or reimbursements (Note 6) | — | — | (216) | (39,500) |
Net expenses | 13,007,548 | 6,598,885 | 618,338 | 3,738,849 |
Net investment income (loss) | (4,652,504) | (795,586) | 388,595 | (1,833,189) |
| Realized and Unrealized Gain (Loss) | ||||
Net realized gain/(loss) on investments and foreign currency transactions | 25,097,317 3 | (5,981,383) | (3,392,851) | (10,082,386) |
Net realized gain on written options | — | — | 157,135 | — |
Net change in unrealized appreciation/ (depreciation) on investments and foreign currency translations | (124,083,624) | (37,793,171) | 1,095,655 | (5,481,244) |
Net change in unrealized depreciation on securities sold short | — | — | (174,541) | — |
Net change in unrealized depreciaton on written options | — | — | (37,441) | — |
Total realized and unrealized loss | (98,986,307) | (43,774,554) | (2,352,043) | (15,563,630) |
Net decrease in net assets resulting from operations | $(103,638,811) | $(44,570,140) | $(1,963,448) | $(17,396,819) |
| 1 | On July 1, 2015, the Fund's Advisor Class Shares were redesignated as Class A Shares. |
| 2 | Commenced operations on July 1, 2015. |
| 3 | Including in-kind redemptions gain of $61,962,037, $—, $—, and $—, respectively. |
| Meridian Funds | 43 | www.meridianfund.com |
Table of Contents
Statements of Changes in Net Assets
| Meridian Growth Fund | Meridian Contrarian Fund | ||||
| Changes in Net Assets From: | Year Ended June 30, 2016 | Year Ended June 30, 2015 | Year Ended June 30, 2016 | Year Ended June 30, 2015 | |
| Operations | |||||
Net investment loss | $ (4,652,504) | $ (8,327,330) | $ (795,586) | $ (43,632) | |
Net realized gain/(loss) on investments and foreign currency transactions | 25,097,317 | 256,624,172 | (5,981,383) | 98,718,841 | |
Net change in unrealized depreciation on investments | (124,083,624) | (15,775,934) | (37,793,171) | (53,402,467) | |
Net increase (decrease) in net assets resulting from operations and foreign currency translations | (103,638,811) | 232,520,908 | (44,570,140) | 45,272,742 | |
| Distributions to Shareholders From: | |||||
| Net Investment income: | |||||
Legacy Class | — | — | (371,096) | (1,287,678) | |
Institutional Class | — | — | — | — | |
Class A1 | — | — | — | — | |
Class C2 | — | — | — | — | |
Investor Class | — | — | — | — | |
| Net Realized Gains: | |||||
Legacy Class | (131,256,915) | (219,516,396) | (84,726,393) | (115,863,711) | |
Institutional Class | (4,467,337) | — | — | — | |
Class A1 | (897,195) | (595,614) | (76,522) | (155,510) | |
Class C2 | (15,808) | — | (1,960) | — | |
Investor Class | (3,547,289) | (3,083,406) | (122,913) | (174,302) | |
Decrease in net assets from distributions | (140,184,544) | (223,195,416) | (85,298,884) | (117,481,201) | |
| Fund Share Transactions | |||||
Net decrease in net assets resulting from fund share transactions (Note 2) | (514,953,981) | (46,379,756) | (10,184,223) | (15,931,502) | |
Total decrease in net assets | (758,777,336) | (37,054,264) | (140,053,247) | (88,139,961) | |
| Net Assets | |||||
Beginning of Year | 2,007,795,303 | 2,044,849,567 | 678,767,901 | 766,907,862 | |
End of Year* | $1,249,017,967 | $2,007,795,303 | $ 538,714,654 | $ 678,767,901 | |
*Includes accumulated distributions in excess of net investment income | $ (2,990,107) | $ — | $ (423,864) | $ (777,304) | |
| 1 | On July 1, 2015, the Fund's Advisor Class Shares were redesignated as Class A Shares. |
| 2 | Commenced operations on July 1, 2015. |
| Meridian Funds | 44 | www.meridianfund.com |
Table of Contents
Statements of Changes in Net Assets (continued)
| Meridian Equity Income Fund | Meridian Small Cap Growth Fund | ||||
| Changes in Net Assets From: | Year Ended June 30, 2016 | Year Ended June 30, 2015 | Year Ended June 30, 2016 | Year Ended June 30, 2015 | |
| Operations | |||||
Net investment income/(loss) | $ 388,595 | $ 201,787 | $ (1,833,189) | $ (1,038,384) | |
Net realized gain/(loss) on investments and foreign currency transactions | (3,235,716) | 7,912,090 | (10,082,386) | 6,225,848 | |
Net change in unrealized appreciation/(depreciation) on investments, written options, securities sold short, and foreign currency translations | 883,673 | (6,155,478) | (5,481,244) | 15,017,109 | |
Net increase (decrease) in net assets resulting from operations and foreign currency translations | (1,963,448) | 1,958,399 | (17,396,819) | 20,204,573 | |
| Distributions to Shareholders From: | |||||
| Net Investment income: | |||||
Legacy Class | — | (664,498) | — | — | |
Institutional Class | — | — | — | — | |
Class A1 | — | (2,071) | — | — | |
Class C2 | — | — | — | — | |
Investor Class | — | (876) | — | — | |
| Net Realized Gains: | |||||
Legacy Class | (1,933,942) | (5,535,693) | (625,851) | (836,030) | |
Institutional Class | — | — | (380,054) | — | |
Class A1 | (22,469) | (19,039) | (766,627) | (556,328) | |
Class C2 | (39) | — | (267,924) | — | |
Investor Class | (9,061) | (7,536) | (2,271,069) | (939,505) | |
Decrease in net assets from distributions | (1,965,511) | (6,229,713) | (4,311,525) | (2,331,863) | |
| Fund Share Transactions | |||||
Net increase (decrease) in net assets resulting from fund share transactions (Note 2) | (4,026,163) | 24,525,359 | 107,561,071 | 212,520,461 | |
Total increase (decrease) in net assets | (7,955,122) | 20,254,045 | 85,852,727 | 230,393,171 | |
| Net Assets | |||||
Beginning of Year | 53,961,345 | 33,707,300 | 248,890,619 | 18,497,448 | |
End of Year* | $46,006,223 | $53,961,345 | $334,743,346 | $248,890,619 | |
*Includes accumulated undistributed (distributions in excess of) net investment income | $ 366,892 | $ — | $ (995,429) | $ — | |
| 1 | On July 1, 2015, the Fund's Advisor Class Shares were redesignated as Class A Shares. |
| 2 | Commenced operations on July 1, 2015. |
| Meridian Funds | 45 | www.meridianfund.com |
Table of Contents
Financial Highlights
| For the Fiscal Year Ended June 30, | |||||
| Legacy Class | 2016 | 2015 | 2014 | 2013 | 2012 |
| Per Share Operating Performance | |||||
Net asset value, beginning of period | $37.80 | $37.86 | $44.31 | $45.06 | $47.61 |
| Income (loss) from investment operations | |||||
Net investment income (loss)1 | (0.10) | (0.15) | (0.11) | 0.05 | 0.10 |
Net realized and unrealized gain(loss) | (1.26) | 4.37 | 6.89 | 6.23 | 0.69 |
Net increase(decrease) from investment operations | (1.36) | 4.22 | 6.78 | 6.28 | 0.79 |
| Less distributions to shareholders: | |||||
Distributions from net investment income | 0.00 | 0.00 | (0.00)2 | (0.15) | (0.07) |
Distributions from net realized capital gains | (3.74) | (4.28) | (13.23) | (6.88) | (3.27) |
Total distributions to shareholders | (3.74) | (4.28) | (13.23) | (7.03) | (3.34) |
Redemption fees | 0.002 | 0.002 | 0.00 | 0.00 | 0.00 |
Net asset value, end of period | $32.70 | $37.80 | $37.86 | $44.31 | $45.06 |
Total return | (2.94)% | 11.85% | 17.31% | 15.54% | 2.45% |
| Ratios to Average Net Assets | |||||
Ratio of net investment income (loss) to average net assets | (0.30)% | (0.41)% | (0.27)% | 0.11% | 0.22% |
Ratio of expenses to average net assets: | 0.86% | 0.84% | 0.86% | 0.87% | 0.85% |
| Supplemental Data | |||||
Net Assets, End of Period (000's) | $1,161,981 | $1,937,346 | $2,021,197 | $2,112,945 | $2,484,084 |
Portfolio Turnover Rate | 67% | 46% | 96% | 37% | 25% |
| 1 | Per share net investment income has been calculated using the average daily shares method. |
| 2 | Less than $0.005 per share. |
| Meridian Funds | 46 | www.meridianfund.com |
Table of Contents
Financial Highlights
| Institutional Class | For the Fiscal Year Ended June 30,2016 | For the Period Ended June 30,20151 | |
| Per Share Operating Performance | |||
Net asset value, beginning of period | $ 37.79 | $ 36.44 | |
| Income (loss) from investment operations | |||
Net investment loss2 | (0.13) | (0.04) | |
Net realized and unrealized gain(loss) | (1.24) | 1.39 | |
Net increase(decrease) from investment operations | (1.37) | 1.35 | |
| Less distributions to shareholders: | |||
Distributions from net realized capital gains | (3.74) | 0.00 | |
Total distributions to shareholders | (3.74) | 0.00 | |
Redemption fees | 0.00 3 | 0.00 | |
Net asset value, end of period | $ 32.68 | $ 37.79 | |
Total return | (2.97)% | 3.70% 4 | |
| Ratios to Average Net Assets | |||
Ratio of net investment loss to average net assets | (0.40)% | (0.21)% 5 | |
| Ratio of expenses to average net assets: | |||
Total expense | 0.90% | 1.15% 5 | |
Before fees waived and excluding recoupment of past waived fees | 0.87% | 1.15% 5 | |
After fees waived and excluding recoupment of past waived fees6 | 0.87% | 0.90% 5 | |
| Supplemental Data | |||
Net Assets, End of Period (000's) | $ 45,687 | $ 19,575 | |
Portfolio Turnover Rate | 67% | 46% 4 | |
| 1 | Commenced operations on December 24, 2014. |
| 2 | Per share net investment income has been calculated using the average daily shares method. |
| 3 | Less than $0.005 per share. |
| 4 | Not Annualized. |
| 5 | Annualized. |
| 6 | See Note 6 to Financial Statements. |
| Meridian Funds | 47 | www.meridianfund.com |
Table of Contents
Financial Highlights
| For the Fiscal Year Ended June 30, | For the Period Ended June 30, | |||
| Class A | 2016 1 | 2015 | 2014 2 | |
| Per Share Operating Performance | ||||
Net asset value, beginning of period | $ 37.37 | $ 37.72 | $ 35.67 | |
| Income (loss) from investment operations | ||||
Net investment loss3 | (0.29) | (0.41) | (0.21) | |
Net realized and unrealized gain(loss) | (1.24) | 4.33 | 2.26 | |
Net increase(decrease) from investment operations | (1.53) | 3.92 | 2.05 | |
| Less distributions to shareholders: | ||||
Distributions from net realized capital gains | (3.74) | (4.28) | (0.00) 4 | |
Total distributions to shareholders | (3.74) | (4.28) | (0.00) 4 | |
Redemption fees | 0.00 4 | 0.01 | 0.00 | |
Net asset value, end of period | $ 32.10 | $ 37.37 | $ 37.72 | |
Total return | (3.45)% | 11.08% | 5.75% 5 | |
| Ratios to Average Net Assets | ||||
Ratio of net investment loss to average net assets | (0.89)% | (1.11)% | (0.93)% 6 | |
| Ratio of expenses to average net assets: | ||||
Total expense | 1.40% | 1.69% | 2.00% 6 | |
Before fees waived and excluding recoupment of past waived fees | 1.22% | 1.69% | 2.00% 6 | |
After fees waived and excluding recoupment of past waived fees7 | 1.22% | 1.55% | 1.55% 6 | |
| Supplemental Data | ||||
Net Assets, End of Period (000's) | $ 8,832 | $ 8,812 | $ 4,904 | |
Portfolio Turnover Rate | 67% | 46% | 96% 5 | |
| 1 | On July 1, 2015, the Fund's Advisor Class Shares were redesignated as Class A Shares. |
| 2 | Commenced operations on November 15, 2013. |
| 3 | Per share net investment income has been calculated using the average daily shares method. |
| 4 | Less than $0.005 per share. |
| 5 | Not Annualized. |
| 6 | Annualized. |
| 7 | See Note 6 to Financial Statements. |
| Meridian Funds | 48 | www.meridianfund.com |
Table of Contents
Financial Highlights
| Class C | For the Fiscal Year Ended June 30,20161 |
| Per Share Operating Performance | |
Net asset value, beginning of period | $ 37.80 |
| Income loss from investment operations | |
| Net investment loss2 | (0.52) |
Net realized and unrealized loss | (1.20) |
Net decrease from investment operations | (1.72) |
| Less distributions to shareholders: | |
Distributions from net realized capital gains | (3.74) |
Total distributions to shareholders | (3.74) |
Redemption fees | 0.00 |
Net asset value, end of period | $ 32.34 |
Total return | (3.95)% 3 |
| Ratios to Average Net Assets | |
Ratio of net investment loss to average net assets | (1.68)% 4 |
Ratio of expenses to average net assets: | 1.95% 4 |
| Supplemental Data | |
Net Assets, End of Period (000's) | $ 804 |
Portfolio Turnover Rate | 67% 3 |
| 1 | Commenced operations on July 1, 2015. |
| 2 | Per share net investment income has been calculated using the average daily shares method. |
| 3 | Not Annualized. |
| 4 | Annualized. |
| Meridian Funds | 49 | www.meridianfund.com |
Table of Contents
Financial Highlights
| For the Fiscal Year Ended June 30, | For the Period Ended June 30, | |||
| Investor Class | 2016 | 2015 | 2014 1 | |
| Per Share Operating Performance | ||||
Net asset value, beginning of period | $37.61 | $37.78 | $35.67 | |
| Income (loss) from investment operations | ||||
Net investment loss2 | (0.14) | (0.27) | (0.16) | |
Net realized and unrealized gain/(loss) | (1.26) | 4.37 | 2.27 | |
Net increase(decrease) from investment operations | (1.40) | 4.10 | 2.11 | |
| Less distributions to shareholders: | ||||
Distributions from net realized capital gains | (3.74) | (4.28) | (0.00)3 | |
Total distributions to shareholders | (3.74) | (4.28) | (0.00)3 | |
Redemption fees | 0.01 | 0.01 | 0.00 | |
Net asset value, end of period | $32.48 | $37.61 | $37.78 | |
Total return | (3.04)% | 11.56% | 5.92%4 | |
| Ratios to Average Net Assets | ||||
Ratio of net investment loss to average net assets | (0.43)% | (0.73)% | (0.70)%5 | |
| Ratio of expenses to average net assets: | ||||
Total expense | 0.97% | 1.16% | 1.30%5 | |
Before fees waived and excluding recoupment of past waived fees | 0.97% | 1.16% | 1.30%5 | |
After fees waived and excluding recoupment of past waived fees6 | 0.97% | 1.16% | 1.30%5 | |
| Supplemental Data | ||||
Net Assets, End of Period (000's) | $31,714 | $42,062 | $18,749 | |
Portfolio Turnover Rate | 67% | 46% | 96%4 | |
| 1 | Commenced operations on November 15, 2013. |
| 2 | Per share net investment income has been calculated using the average daily shares method. |
| 3 | Less than $0.005 per share. |
| 4 | Not Annualized. |
| 5 | Annualized. |
| 6 | See Note 6 to Financial Statements. |
| Meridian Funds | 50 | www.meridianfund.com |
Table of Contents
Financial Highlights
| For the Fiscal Year Ended June 30, | |||||
| Legacy Class | 2016 | 2015 | 2014 | 2013 | 2012 |
| Per Share Operating Performance | |||||
Net asset value, beginning of period | $40.44 | $45.52 | $37.20 | $30.60 | $29.59 |
| Income (loss) from investment operations | |||||
Net investment income (loss)1 | (0.05) | (0.00)2 | 0.01 | 0.14 | 0.09 |
Net realized and unrealized gain(loss) | (2.60) | 2.66 | 8.63 | 6.57 | 1.053 |
Net increase(decrease) from investment operations | (2.65) | 2.66 | 8.64 | 6.71 | 1.14 |
| Less distributions to shareholders: | |||||
Distributions from net investment income | (0.02) | (0.09) | (0.18) | (0.11) | (0.13) |
Distributions from net realized capital gains | (5.35) | (7.65) | (0.14) | 0.00 | 0.00 |
Total distributions to shareholders | (5.37) | (7.74) | (0.32) | (0.11) | (0.13) |
Redemption fees | 0.002 | 0.002 | 0.00 | 0.00 | 0.00 |
Net asset value, end of period | $32.42 | $40.44 | $45.52 | $37.20 | $30.60 |
Total return | (6.33)% | 6.84% | 23.31% | 21.98% | 3.89%3 |
| Ratios to Average Net Assets | |||||
Ratio of net investment income (loss) to average net assets | (0.14)% | (0.01)% | 0.01% | 0.41% | 0.31% |
Ratio of expenses to average net assets: | 1.13% | 1.11% | 1.13% | 1.16% | 1.14% |
| Supplemental Data | |||||
Net Assets, End of Period (000's) | $536,799 | $677,138 | $764,882 | $704,523 | $688,467 |
Portfolio Turnover Rate | 73% | 76% | 67% | 55% | 20% |
| 1 | Per share net investment income has been calculated using the average daily shares method. |
| 2 | Less than $0.005 per share. |
| 3 | Includes a gain resulting from litigation payments on securities owned in a prior year. Without these gains, the net realized gains on investments per share would have been $0.99, and the total return would have been 3.69%. |
| Meridian Funds | 51 | www.meridianfund.com |
Table of Contents
Financial Highlights
| For the Fiscal Year Ended June 30, | For the Period Ended June 30, | |||
| Class A | 20161 | 2015 | 2014 2 | |
| Per Share Operating Performance | ||||
Net asset value, beginning of period | $40.22 | $45.41 | $42.64 | |
| Income (loss) from investment operations | ||||
Net investment loss3 | (0.21) | (0.22) | (0.08) | |
Net realized and unrealized gain(loss) | (2.58) | 2.68 | 3.02 | |
Net increase(decrease) from investment operations | (2.79) | 2.46 | 2.94 | |
| Less distributions to shareholders: | ||||
Distributions from net investment income | 0.00 | 0.00 | (0.17) | |
Distributions from net realized capital gains | (5.35) | (7.65) | 0.00 | |
Total distributions to shareholders | (5.35) | (7.65) | (0.17) | |
Redemption fees | 0.00 | 0.00 | 0.00 | |
Net asset value, end of period | $32.08 | $40.22 | $45.41 | |
Total return | (6.75)% | 6.38% | 6.91%4 | |
| Ratios to Average Net Assets | ||||
Ratio of net investment loss to average net assets | (0.60)% | (0.52)% | (0.30)%5 | |
| Ratio of expenses to average net assets: | ||||
Total expense | 1.60% | 3.46% | 7.46%5 | |
Before fees waived and excluding recoupment of past waived fees | 1.46% | 3.46% | 7.46%5 | |
After fees waived and excluding recoupment of past waived fees6 | 1.46% | 1.60% | 1.60%5 | |
| Supplemental Data | ||||
Net Assets, End of Period (000's) | $431 | $622 | $462 | |
Portfolio Turnover Rate | 73% | 76% | 67%4 | |
| 1 | On July 1, 2015, the Fund's Advisor Class Shares were redesignated as Class A Shares. |
| 2 | Commenced operations on November 15, 2013. |
| 3 | Per share net investment income has been calculated using the average daily shares method. |
| 4 | Not Annualized. |
| 5 | Annualized. |
| 6 | See Note 6 to Financial Statements. |
| Meridian Funds | 52 | www.meridianfund.com |
Table of Contents
Financial Highlights
| Class C | For the Fiscal Year Ended June 30,20161 |
| Per Share Operating Performance | |
Net asset value, beginning of period | $ 40.54 |
| Income loss from investment operations | |
| Net investment loss2 | (0.36) |
Net realized and unrealized loss | (2.74) |
Net decrease from investment operations | (3.10) |
| Less distributions to shareholders: | |
Distributions from net realized capital gains | (5.35) |
Total distributions to shareholders | (5.35) |
Redemption fees | 0.00 |
Net asset value, end of period | $ 32.09 |
Total return | (7.50)% 3 |
| Ratios to Average Net Assets | |
Ratio of net investment loss to average net assets | (1.11)% 4 |
Ratio of expenses to average net assets: | 2.19% 4 |
| Supplemental Data | |
Net Assets, End of Period (000's) | $ 14 |
Portfolio Turnover Rate | 73% 3 |
| 1 | Commenced operations on July 1, 2015. |
| 2 | Per share net investment income has been calculated using the average daily shares method. |
| 3 | Not Annualized. |
| 4 | Annualized. |
| Meridian Funds | 53 | www.meridianfund.com |
Table of Contents
Financial Highlights
| For the Fiscal Year Ended June 30, | For the Period Ended June 30, | |||
| Investor Class | 2016 | 2015 | 2014 1 | |
| Per Share Operating Performance | ||||
Net asset value, beginning of period | $ 40.40 | $ 45.47 | $ 42.64 | |
| Income (loss) from investment operations | ||||
Net investment loss2 | (0.13) | (0.09) | (0.02) | |
Net realized and unrealized gain/(loss) | (2.59) | 2.66 | 3.03 | |
Net increase(decrease) from investment operations | (2.72) | 2.57 | 3.01 | |
| Less distributions to shareholders: | ||||
Distributions from net investment income | 0.00 | 0.00 | (0.18) | |
Distributions from net realized capital gains | (5.35) | (7.65) | 0.00 | |
Total distributions to shareholders | (5.35) | (7.65) | (0.18) | |
Redemption fees | 0.01 | 0.01 | 0.00 | |
Net asset value, end of period | $ 32.34 | $ 40.40 | $ 45.47 | |
Total return | (6.50)% | 6.67% | 7.08% 3 | |
| Ratios to Average Net Assets | ||||
Ratio of net investment loss to average net assets | (0.40)% | (0.21)% | (0.09)% 4 | |
| Ratio of expenses to average net assets: | ||||
Total expense | 1.35% | 2.34% | 3.51% 4 | |
Before fees waived and excluding recoupment of past waived fees | 1.24% | 2.34% | 3.51% 4 | |
After fees waived and excluding recoupment of past waived fees5 | 1.24% | 1.35% | 1.35% 4 | |
| Supplemental Data | ||||
Net Assets, End of Period (000's) | $ 1,471 | $ 1,008 | $ 1,564 | |
Portfolio Turnover Rate | 73% | 76% | 67% 3 | |
| 1 | Commenced operations on November 15, 2013. |
| 2 | Per share net investment income has been calculated using the average daily shares method. |
| 3 | Not Annualized. |
| 4 | Annualized. |
| 5 | See Note 6 to Financial Statements. |
| Meridian Funds | 54 | www.meridianfund.com |
Table of Contents
Financial Highlights
| For the Fiscal Year Ended June 30, | |||||
| Legacy Class | 2016 | 2015 | 2014 | 2013 | 2012 |
| Per Share Operating Performance | |||||
Net asset value, beginning of period | $12.51 | $14.59 | $12.35 | $10.71 | $10.61 |
| Income (loss) from investment operations | |||||
Net investment income1 | 0.09 | 0.12 | 0.24 | 0.24 | 0.22 |
Net realized and unrealized gain(loss) | (0.51) | 0.47 | 2.22 | 1.68 | 0.09 |
Net increase(decrease) from investment operations | (0.42) | 0.59 | 2.46 | 1.92 | 0.31 |
| Less distributions to shareholders: | |||||
Distributions from net investment income | 0.00 | (0.25) | (0.22) | (0.28) | (0.21) |
Distributions from net realized capital gains | (0.49) | (2.42) | 0.00 | 0.00 | 0.00 |
Total distributions to shareholders | (0.49) | (2.67) | (0.22) | (0.28) | (0.21) |
Redemption fees | 0.002 | 0.002 | 0.002 | 0.00 | 0.00 |
Net asset value, end of period | $11.60 | $12.51 | $14.59 | $12.35 | $10.71 |
Total return | (3.35)% | 4.46% | 20.04% | 18.28% | 3.09% |
| Ratios to Average Net Assets | |||||
Ratio of net investment income to average net assets | 0.82% | 0.88% | 1.75% | 2.08% | 2.17% |
Ratio of expenses to average net assets: | |||||
Total expense | 1.29% | 1.33% | 1.37% | 1.53% | 1.41% |
Before fees waived and excluding recoupment of past waived fees | 1.27% | 1.33% | 1.37% | 1.53% | 1.41% |
After fees waived and excluding recoupment of past waived fees3 | 1.27% | 1.25% | 1.25% | 1.25% | 1.25% |
After fees waived and excluding recoupment of past waived fess and dividend expenses | 1.23% | 1.25% | 1.25% | 1.25% | 1.25% |
| Supplemental Data | |||||
Net Assets, End of Period (000's) | $45,251 | $53,125 | $33,649 | $28,697 | $30,744 |
Portfolio Turnover Rate | 57% | 266% | 35% | 44% | 31% |
| 1 | Per share net investment income has been calculated using the average daily shares method. |
| 2 | Less than $0.005 per share. |
| 3 | See Note 6 to Financial Statements. |
| Meridian Funds | 55 | www.meridianfund.com |
Table of Contents
Financial Highlights
| For the Fiscal Year Ended June 30, | For the Period Ended June 30, | |||
| Class A | 2016 1 | 2015 | 2014 2 | |
| Per Share Operating Performance | ||||
Net asset value, beginning of period | $12.50 | $14.58 | $13.87 | |
| Income (loss) from investment operations | ||||
Net investment income (loss)3 | 0.06 | (0.02) | 0.13 | |
Net realized and unrealized gain(loss) | (0.53) | 0.58 | 0.78 | |
Net increase(decrease) from investment operations | (0.47) | 0.56 | 0.91 | |
| Less distributions to shareholders: | ||||
Distributions from net investment income | 0.00 | (0.22) | (0.20) | |
Distributions from net realized capital gains | (0.49) | (2.42) | 0.00 | |
Total distributions to shareholders | (0.49) | (2.64) | (0.20) | |
Redemption fees | 0.00 | 0.00 | 0.00 | |
Net asset value, end of period | $11.54 | $12.50 | $14.58 | |
Total return | (3.76)% | 4.24% | 6.69%4 | |
| Ratios to Average Net Assets | ||||
Ratio of net investment income(loss) to average net assets | 0.50% | (0.11)% | 1.55%5 | |
| Ratio of expenses to average net assets: | ||||
Total expense | 1.69% | 7.46% | 132.38%5 | |
Before fees waived and excluding recoupment of past waived fees | 1.69% | 7.46% | 132.38%5 | |
After fees waived and excluding recoupment of past waived fees6 | 1.64% | 1.60% | 1.60%5 | |
After fees waived and excluding recoupment of past waived fess and dividend expenses | 1.60% | 1.60% | 1.60%5 | |
| Supplemental Data | ||||
Net Assets, End of Period (000's) | $502 | $501 | $13 | |
Portfolio Turnover Rate | 57% | 266% | 35%4 | |
| 1 | On July 1, 2015, the Fund's Advisor Class Shares were redesignated as Class A Shares. |
| 2 | Commenced operations on November 15, 2013. |
| 3 | Per share net investment income has been calculated using the average daily shares method. |
| 4 | Not Annualized. |
| 5 | Annualized. |
| 6 | See Note 6 to Financial Statements. |
| Meridian Funds | 56 | www.meridianfund.com |
Table of Contents
Financial Highlights
| Class C | For the Fiscal Year Ended June 30,20161 |
| Per Share Operating Performance | |
Net asset value, beginning of period | $ 12.56 |
| Income loss from investment operations | |
| Net investment income2 | 0.00 |
Net realized and unrealized loss | (0.57) |
Net decrease from investment operations | (0.57) |
| Less distributions to shareholders: | |
Distributions from net realized capital gains | (0.49) |
Total distributions to shareholders | (0.49) |
Redemption fees | 0.00 |
Net asset value, end of period | $ 11.50 |
Total return | (4.55)% 3 |
| Ratios to Average Net Assets | |
Ratio of net investment income to average net assets | 0.04% 4 |
| Ratio of expenses to average net assets: | |
Total expense | 2.33% 4 |
Before fees waived and excluding recoupment of past waived fees | 2.33% 4 |
After fees waived and excluding recoupment of past waived fees5 | 2.04% 4 |
After fees waived and excluding recoupment of past waived fess and dividend expenses | 2.00% 4 |
| Supplemental Data | |
Net Assets, End of Period (000's) | $ 1 |
Portfolio Turnover Rate | 57% 3 |
| 1 | Commenced operations on July 1, 2015. |
| 2 | Per share net investment income has been calculated using the average daily shares method. |
| 3 | Not Annualized. |
| 4 | Annualized. |
| 5 | See Note 6 to Financial Statements. |
| Meridian Funds | 57 | www.meridianfund.com |
Table of Contents
Financial Highlights
| For the Fiscal Year Ended June 30, | For the Period Ended June 30, | ||||
| Investor Class | 2016 | 2015 | 20141 | ||
| Per Share Operating Performance | |||||
Net asset value, beginning of period | $12.53 | $14.60 | $13.87 | ||
| Income (loss) from investment operations | |||||
Net investment income (loss)2 | 0.08 | (0.02) | 0.15 | ||
Net realized and unrealized gain/(loss) | (0.52) | 0.61 | 0.79 | ||
Net increase(decrease) from investment operations | (0.44) | 0.59 | 0.94 | ||
| Less distributions to shareholders: | |||||
Distributions from net investment income | 0.00 | (0.24) | (0.21) | ||
Distributions from net realized capital gains | (0.49) | (2.42) | 0.00 | ||
Total distributions to shareholders | (0.49) | (2.66) | (0.21) | ||
Redemption fees | 0.003 | 0.00 | 0.00 | ||
Net asset value, end of period | $11.60 | $12.53 | $14.60 | ||
Total return | (3.51)% | 4.44% | 6.87%4 | ||
| Ratios to Average Net Assets | |||||
Ratio of net investment income(loss) to average net assets | 0.68% | (0.13)% | 1.72%5 | ||
| Ratio of expenses to average net assets: | |||||
Total expense | 1.39% | 16.83% | 39.23%5 | ||
Before fees waived and excluding recoupment of past waived fees | 1.37% | 16.83% | 39.23%5 | ||
After fees waived and excluding recoupment of past waived fees6 | 1.37% | 1.35% | 1.35%5 | ||
After fees waived and excluding recoupment of past waived fess and dividend expenses6 | 1.32% | 1.35% | 1.35%5 | ||
| Supplemental Data | |||||
Net Assets, End of Period (000's) | $252 | $335 | $45 | ||
Portfolio Turnover Rate | 57% | 266% | 35%4 | ||
| 1 | Commenced operations on November 15, 2013. |
| 2 | Per share net investment income has been calculated using the average daily shares method. |
| 3 | Less than $0.005 per share. |
| 4 | Not Annualized. |
| 5 | Annualized. |
| 6 | See Note 6 to Financial Statements. |
| Meridian Funds | 58 | www.meridianfund.com |
Table of Contents
Financial Highlights
| For the Fiscal Year Ended June 30, | For the Period Ended June 30, | |||
| Legacy Class | 2016 | 2015 | 20141 | |
| Per Share Operating Performance | ||||
Net asset value, beginning of period | $12.98 | $11.65 | $10.00 | |
| Income (loss) from investment operations | ||||
Net investment loss2 | (0.06) | (0.09) | (0.04) | |
Net realized and unrealized gain(loss) | (0.87) | 1.72 | 1.69 | |
Net increase(decrease) from investment operations | (0.93) | 1.63 | 1.65 | |
| Less distributions to shareholders: | ||||
Distributions from net realized capital gains | (0.18) | (0.30) | 0.00 | |
Total distributions to shareholders | (0.18) | (0.30) | 0.00 | |
Redemption fees | 0.003 | 0.003 | 0.00 | |
Net asset value, end of period | $11.87 | $12.98 | $11.65 | |
Total return | (7.06)% | 14.23% | 16.50%4 | |
| Ratios to Average Net Assets | ||||
Ratio of net investment loss to average net assets | (0.52)% | (0.69)% | (0.61)%5 | |
Ratio of expenses to average net assets: | ||||
Total expense | 1.20% | 1.24% | 2.35%5 | |
Before fees waived and excluding recoupment of past waived fees | 1.20% | 1.24% | 2.35%5 | |
After fees waived and excluding recoupment of past waived fees6 | 1.20% | 1.20% | 1.20%5 | |
| Supplemental Data | ||||
Net Assets, End of Period (000's) | $44,001 | $59,459 | $9,839 | |
Portfolio Turnover Rate | 62% | 45% | 78%4 | |
| 1 | Commenced operations on December 16, 2013. |
| 2 | Per share net investment income has been calculated using the average daily shares method. |
| 3 | Less than $0.005 per share. |
| 4 | Not Annualized. |
| 5 | Annualized. |
| 6 | See Note 6 to Financial Statements. |
| Meridian Funds | 59 | www.meridianfund.com |
Table of Contents
Financial Highlights
| Institutional Class | For the Fiscal Year Ended June 30,2016 | For the Period Ended June 30,20151 | |
| Per Share Operating Performance | |||
Net asset value, beginning of period | $ 12.98 | $ 12.23 | |
| Income (loss) from investment operations | |||
Net investment loss2 | (0.05) | (0.02) | |
Net realized and unrealized gain(loss) | (0.87) | 0.77 | |
Net increase(decrease) from investment operations | (0.92) | 0.75 | |
| Less distributions to shareholders: | |||
Distributions from net realized capital gains | (0.18) | 0.00 | |
Total distributions to shareholders | (0.18) | 0.00 | |
Redemption fees | 0.00 3 | 0.00 | |
Net asset value, end of period | $ 11.88 | $ 12.98 | |
Total return | (6.98)% | 6.13% 4 | |
| Ratios to Average Net Assets | |||
Ratio of net investment loss to average net assets | (0.45)% | (0.29)% 5 | |
| Ratio of expenses to average net assets: | |||
Total expense | 1.22% | 2.03% 5 | |
Before fees waived and excluding recoupment of past waived fees | 1.22% | 2.03% 5 | |
After fees waived and excluding recoupment of past waived fees6 | 1.10% | 1.10% 5 | |
| Supplemental Data | |||
Net Assets, End of Period (000's) | $ 52,784 | $ 13,035 | |
Portfolio Turnover Rate | 62% | 44% 4 | |
| 1 | Commenced operations on December 24, 2014. |
| 2 | Per share net investment income has been calculated using the average daily shares method. |
| 3 | Less than $0.005 per share. |
| 4 | Not Annualized. |
| 5 | Annualized. |
| 6 | See Note 6 to Financial Statements. |
| Meridian Funds | 60 | www.meridianfund.com |
Table of Contents
Financial Highlights
| For the Fiscal Year Ended June 30, | For the Period Ended June 30, | |||
| Class A | 2016 1 | 2015 | 2014 2 | |
| Per Share Operating Performance | ||||
Net asset value, beginning of period | $ 12.91 | $ 11.63 | $ 10.00 | |
| Income (loss) from investment operations | ||||
Net investment loss3 | (0.10) | (0.13) | (0.06) | |
Net realized and unrealized gain(loss) | (0.87) | 1.71 | 1.69 | |
Net increase(decrease) from investment operations | (0.97) | 1.58 | 1.63 | |
| Less distributions to shareholders: | ||||
Distributions from net realized capital gains | (0.18) | (0.30) | 0.00 | |
Total distributions to shareholders | (0.18) | (0.30) | 0.00 | |
Redemption fees | 0.00 4 | 0.00 4 | 0.00 | |
Net asset value, end of period | $ 11.76 | $ 12.91 | $ 11.63 | |
Total return | (7.41)% | 13.82% | 16.30% 5 | |
| Ratios to Average Net Assets | ||||
Ratio of net investment loss to average net assets | (0.89)% | (1.09)% | (1.01)% 6 | |
| Ratio of expenses to average net assets: | ||||
Total expense | 1.60% | 1.69% | 2.99% 6 | |
Before fees waived and excluding recoupment of past waived fees | 1.56% | 1.69% | 2.99% 6 | |
After fees waived and excluding recoupment of past waived fees7 | 1.56% | 1.60% | 1.60% 6 | |
| Supplemental Data | ||||
Net Assets, End of Period (000's) | $ 52,173 | $ 45,186 | $ 6,524 | |
Portfolio Turnover Rate | 62% | 44% | 78% 5 | |
| 1 | On July 1, 2015, the Fund's Advisor Class Shares were redesignated as Class A Shares. |
| 2 | Commenced operations on November 15, 2013. |
| 3 | Per share net investment income has been calculated using the average daily shares method. |
| 4 | Less than $0.005 per share. |
| 5 | Not Annualized. |
| 6 | Annualized. |
| 7 | See Note 6 to Financial Statements. |
| Meridian Funds | 61 | www.meridianfund.com |
Table of Contents
Financial Highlights
| Class C | For the Fiscal Year Ended June 30,20161 |
| Per Share Operating Performance | |
Net asset value, beginning of period | $ 12.97 |
| Income loss from investment operations | |
| Net investment loss2 | (0.17) |
Net realized and unrealized loss | (0.88) |
Net decrease from investment operations | (1.05) |
| Less distributions to shareholders: | |
Distributions from net realized capital gains | (0.18) |
Total distributions to shareholders | (0.18) |
Redemption fees | 0.00 3 |
Net asset value, end of period | $ 11.74 |
Total return | (8.00)% 4 |
| Ratios to Average Net Assets | |
Ratio of net investment loss to average net assets | (1.50)% 5 |
| Ratio of expenses to average net assets: | |
Total expense | 2.28% 5 |
Before fees waived and excluding recoupment of past waived fees | 2.28% 5 |
After fees waived and excluding recoupment of past waived fees6 | 2.25% 5 |
| Supplemental Data | |
Net Assets, End of Period (000's) | $ 23,689 |
Portfolio Turnover Rate | 62% 4 |
| 1 | Commenced operations on July 1, 2015. |
| 2 | Per share net investment income has been calculated using the average daily shares method. |
| 3 | Less than $0.005 per share. |
| 4 | Not Annualized. |
| 5 | Annualized. |
| 6 | See Note 6 to Financial Statements. |
| Meridian Funds | 62 | www.meridianfund.com |
Table of Contents
Financial Highlights
| For the Fiscal Year Ended June 30, | For the Period Ended June 30, | |||
| Investor Class | 2016 | 2015 | 2014 1 | |
| Per Share Operating Performance | ||||
Net asset value, beginning of period | $ 12.97 | $ 11.65 | $ 10.00 | |
| Income (loss) from investment operations | ||||
Net investment loss2 | (0.07) | (0.10) | (0.04) | |
Net realized and unrealized gain/(loss) | (0.87) | 1.73 | 1.69 | |
Net increase(decrease) from investment operations | (0.94) | 1.63 | 1.65 | |
| Less distributions to shareholders: | ||||
Distributions from net investment income | 0.00 | (0.01) | 0.00 | |
Distributions from net realized capital gains | (0.18) | (0.30) | 0.00 | |
Total distributions to shareholders | (0.18) | (0.31) | 0.00 | |
Redemption fees | 0.00 3 | 0.00 | 0.00 | |
Net asset value, end of period | $ 11.85 | $ 12.97 | $ 11.65 | |
Total return | (7.15)% | 14.14% | 16.50% 4 | |
| Ratios to Average Net Assets | ||||
Ratio of net investment loss to average net assets | (0.61)% | (0.83)% | (0.70)% 5 | |
| Ratio of expenses to average net assets: | ||||
Total expense | 1.32% | 1.33% | 3.63% 5 | |
Before fees waived and excluding recoupment of past waived fees | 1.32% | 1.33% | 3.63% 5 | |
After fees waived and excluding recoupment of past waived fees6 | 1.32% | 1.33% | 1.35% 5 | |
| Supplemental Data | ||||
Net Assets, End of Period (000's) | $162,096 | $131,211 | $ 2,135 | |
Portfolio Turnover Rate | 62% | 44% | 78% 4 | |
| 1 | Commenced operations on November 15, 2013. |
| 2 | Per share net investment income has been calculated using the average daily shares method. |
| 3 | Less than $0.005 per share. |
| 4 | Not Annualized. |
| 5 | Annualized. |
| 6 | See Note 6 to Financial Statements. |
| Meridian Funds | 63 | www.meridianfund.com |
Table of Contents
Notes to Financial Statements
| 1. | Organization and Significant Accounting Policies: Meridian Fund, Inc. (the “Meridian Funds” or the “Company”) comprises the following separate series: the Meridian Growth Fund (the “Growth Fund”), the Meridian Contrarian Fund (the “Contrarian Fund”), the Meridian Equity Income Fund (the “Equity Income Fund”), and the Meridian Small Cap Growth Fund (the “Small Cap Growth Fund”) (each a “Fund” and collectively, the “Funds”). The Company is registered as an open-end investment company under the Investment Company Act of 1940 and is organized as a Maryland corporation. Each Fund is classified as a "diversified" management investment company. |
| Meridian Funds offer five share classes: Legacy Class Shares, Investor Class Shares, Class A Shares, Class C Shares and Institutional Class Shares. Prior to July 1, 2015, Class A Shares were known as Advisor Class Shares. As of June 30, 2016, Institutional Class Shares of the Meridian Equity Income Fund and Meridian Contrarian Fund are not currently being offered for sale. Legacy Class Shares are available to investors who have continuously held an investment in any Meridian Fund prior to November 15, 2013. Institutional Class Shares are available to certain eligible investors including endowments, foundations and qualified retirement plans. Class A, Class C and Investor Class Shares are available for purchase through financial intermediary platforms. Class A Shares are subject to a maximum initial sales charge (front-end load) of 5.75%. Class C Shares are subject to a 1.00% contingent deferred sales charge ("CDSC") if redeemed within one year of purchase. Investor Class Shares are not subject to frond-end load or CDSC and require a higher minimum initial investment. All Classes have identical rights and privileges with respect to the Fund in general, and exclusive voting rights with respect to Class specific matters. Net Asset Value ("NAV") per share may differ by class due to each class having its own expenses directly attributable to that class. Investor Class, Class A and Class C Shares are subject to shareholder servicing and sub-transfer agent fees. Class A and Class C Shares are also subject to certain expenses related to the distribution of these shares. See Note 6 for further information on additional share classes and changes to shareholder servicing and distribution plans. | |
| The primary investment objectives of the Growth Fund and Contrarian Fund are to seek long-term growth of capital. | |
| The primary investment objective of the Equity Income Fund is to seek long-term growth of capital along with income as a component of total return. | |
| The primary investment objective of the Small Cap Growth Fund is to seek long-term growth of capital by investing primarily in equity securities of small capitalization companies. | |
| The following significant accounting policies are consistently followed by the Funds in the preparation of their financial statements in conformity with accounting principles generally accepted in the United States of America (“U.S. GAAP”). Each Fund is considered an investment company under U.S. GAAP and follows the accounting and reporting guidance applicable to investment companies. |
| a. | Share Valuation: The NAV of each Fund is calculated by dividing the sum of the value of the securities held by each Fund, plus cash or other assets, minus all liabilities (including estimated accrued expenses), by the total number of shares outstanding of each Fund. The result is rounded to the nearest cent. Each Funds’ shares will not be priced on the days in which the New York Stock Exchange ("NYSE") is closed for trading. |
| b. | Investment Valuations: Equity securities are valued at the closing price or last sales price on the principal exchange or market on which they are traded; or, if there were no sales that day, at the last reported bid price. |
| Fixed income (debt) securities with original or remaining maturities in excess of 60 days are valued at the mean of their quoted bid and asked prices. Short-term debt securities with 60 days or less to maturity and repurchase agreements are valued at amortized cost which approximates fair market value. | |
| Bond investments are valued on the basis of last available bid prices or current market quotations provided by dealers or pricing services. In determining the value of a particular investment, pricing services may use certain information with respect to transactions in such investments, quotations from dealers, pricing matrixes, market transactions in comparable investments, various relationships observed in the market between investments and calculated yield measures. | |
| Investments in open-end U.S. mutual funds are valued at NAV each business day. | |
| The market value of the Fund’s investments in the exchange traded funds is based on the published NAV of each fund computed as of the close of regular trading on the NYSE on days when the NYSE is open. |
| Meridian Funds | 64 | www.meridianfund.com |
Table of Contents
Notes to Financial Statements (continued)
| Exchange-traded options are valued at the mean between the last bid and ask prices at the close of the options market in which the options trade. An exchange-traded option for which there is no mean price is valued at the last bid (long positions) or ask (short positions) price. If no bid or ask price is available, the prior day’s price will be used, unless it is determined that the prior day’s price no longer reflects the fair value of the option. | |
| Securities and other assets for which reliable market quotations are not readily available or for which a significant event has occurred since the time of the most recent market quotation, will be valued based upon other available factors deemed relevant by the Adviser under the guidelines established by, and under the general supervision and responsibility of, the Board. These factors include but are not limited to (i) attributes specific to the investment; (ii) the principal market for the investment; (iii) the customary participants in the principal market for the investment; (iv) data assumptions by market participants for the investment, if reasonably available; (v) quoted prices for similar investments in active markets; and (vi) other factors, such as future cash flows, interest rates, yield curves, volatilities, prepayment speeds, loss severities, credit risks and/or default rates. Valuations based on such factors are reported to the Board on a quarterly basis. | |
| c. | Fair Value Measurements: As described in Note 1.b. above, the Funds utilize various methods to determine and measure the fair value of investment securities on a recurring basis. The objective of a fair value measurement is to determine the price that would be received to sell an asset or paid to transfer a liability in an orderly transaction between market participants at the measurement date (an exit price). Accordingly, the fair value hierarchy gives the highest priority to quoted prices (unadjusted) in active markets for identical assets or liabilities (Level 1) and the lowest priority to unobservable inputs (Level 3) that are significant to the fair value instrument. The three levels of the fair value hierarchy are described below: |
| Level 1 - quoted prices in active markets for identical securities; | |
| Level 2 - other significant observable inputs (including quoted prices for similar securities, interest rates, prepayment speeds, credit risk, etc.); and | |
| Level 3 - significant unobservable inputs (including the Fund’s determinations as to the fair value of investments). | |
| The inputs or methodology used for valuing securities are not necessarily an indication of the risks associated with investing in those securities. The summary of inputs used to value the Funds’ securities as of June 30, 2016 is as follows: | |
| Level 1 | Level 2 | Level 3 | Total | ||||
| Meridian Growth Fund | |||||||
Common Stocks1 | $ 1,194,515,191 | $ 351,810 | $ 667,772 | $ 1,195,534,773 | |||
Short-Term Investments | 26,610,000 | 165,893,800 | — | 192,503,800 | |||
Total Investments | $ 1,221,125,191 | $ 166,245,610 | $ 667,772 | $ 1,388,038,573 | |||
| Meridian Contrarian Fund | |||||||
Common Stocks1 | $ 500,125,740 | — | — | $ 500,125,740 | |||
Short-Term Investments | 6,342,000 | $ 39,136,196 | — | 45,478,196 | |||
Total Investments | $ 506,467,740 | $ 39,136,196 | — | $ 545,603,936 | |||
| Meridian Equity Income Fund | |||||||
| Assets: | |||||||
Common Stocks1 | $ 36,600,713 | — | — | $ 36,600,713 | |||
Corporate Bonds | — | $ 2,567,360 | — | 2,567,360 | |||
Call Options Purchased | 25,100 | — | — | 25,100 | |||
Exchange Traded Funds | 823,500 | — | — | 823,500 | |||
| Meridian Funds | 65 | www.meridianfund.com |
Table of Contents
Notes to Financial Statements (continued)
| Level 1 | Level 2 | Level 3 | Total | ||||
| Meridian Equity Income Fund (continued) | |||||||
Short-Term Investments | — | $ 5,500,185 | — | $ 5,500,185 | |||
Total Investments - Assets | $ 37,449,313 | $ 8,067,545 | — | $ 45,516,858 | |||
| Liabilities: | |||||||
Securities Sold Short | $ (2,620,795) | — | — | $ (2,620,795) | |||
Total Investments - Liabilities | $ (2,620,795) | — | — | $ (2,620,795) | |||
| Meridian Small Cap Growth Fund | |||||||
Common Stocks1 | $ 301,046,056 | — | $ 126,226 | $ 301,172,282 | |||
Short-Term Investments | 7,848,000 | $ 54,200,881 | — | 62,048,881 | |||
Total Investments | $ 308,894,056 | $ 54,200,881 | $ 126,226 | $ 363,221,163 | |||
| Meridian Growth Fund | |||||||||
| Beginning Balance 07/01/15 | Total Purchases | Total Sales | Net Change in Unrealized Gain/(Loss) | Ending Balance 6/30/16 | |||||
| Investments in Securities | |||||||||
Common Stocks | $ — | $ 1,489,005 | $ (372,761)1 | $ (448,472) | $ 667,772 | ||||
Total Level 3 | $ — | $ 1,489,005 | $ (372,761) | $ (448,472) | $ 667,772 | ||||
| 1 Amount decreased due to in-kind redemptions. | |||||||||
| Meridian Small Cap Growth Fund | |||||||||
| Beginning Balance 07/01/15 | Total Purchases | Total Sales | Net Change in Unrealized Gain/(Loss) | Ending Balance 6/30/16 | |||||
| Investments in Securities | |||||||||
Common Stocks | $ — | $ 210,999 | $ — | $ (84,773) | $ 126,226 | ||||
Total Level 3 | $ — | $ 210,999 | $ — | $ (84,773) | $ 126,226 | ||||
| d. | Investment Transactions and Investment Income: Security transactions are accounted for on the date the securities are purchased or sold (trade date). Realized gains and losses on security transactions are determined on the basis of specific identification for both financial statement and federal income tax purposes. Dividend income is recorded on the ex-dividend date. Interest income is accrued daily. |
| e. | Option writing: When the Fund writes an option, an amount equal to the premium received by the Fund is recorded as a liability and subsequently adjusted to the current fair value of the option written. Premiums received from writing options that expire unexercised are treated by the Fund on the expiration date as realized gains from investments. The difference between the premium and amount paid on effecting a closing purchase |
| Meridian Funds | 66 | www.meridianfund.com |
Table of Contents
Notes to Financial Statements (continued)
| transaction, including brokerage commissions, is also treated as a realized gain or, if the premium is less than the amount paid for the closing purchase transaction, as a realized loss. If a call option is exercised, the premium is added to the proceeds from the sale of the underlying security or currency in determining whether the Fund has realized a gain or loss. If a put option is exercised, the premium reduces the cost basis of the securities purchased by the Fund. The Fund as writer of an option bears the market risk of an unfavorable change in the price of the security underlying the written option. | |
| f. | Allocation of Income, Expenses, Gains and Losses: Income, gains and losses are allocated on a daily basis to each share class based on the relative proportion of the net assets of the class to each Fund’s total net assets. Expenses are allocated on the basis of relative net assets of the class to the Fund, or if an expense is specific to a share class, to that specific share class. |
| g. | Use of Estimates: The preparation of financial statements in accordance with accounting principals generally accepted in the U.S. (“GAAP”) requires management to make estimates and assumptions that affect the reported amount of assets and liabilities and revenue and expenses at the date of the financial statements. Actual amounts could differ from those estimates, and such differences could be significant. |
| h. | Foreign Currency Translation: Securities denominated in foreign currencies are converted into U.S. dollars using the spot market rate of exchange at the time of valuation. Purchases and sales of such securities and related dividend and interest income are converted into U.S. dollars using the spot market rate of exchange prevailing on the respective dates of such translations. The Funds do not separately report the effect of changes in foreign exchange rates from changes in market prices on securities held. Such changes are included in net realized and unrealized gain or loss from investments as reported in the Statement of Operations. |
| i. | Federal Income Taxes: It is the Funds’ policy to comply with the requirements of Subchapter M of the Internal Revenue Code of 1986, as amended, applicable to regulated investment companies and to distribute all of their taxable income to their shareholders; therefore, no federal income tax provision is required. |
| j. | Distributions to Shareholders: The Funds record distributions to shareholders on the ex-dividend date. The amount of distributions from net investment income and net realized capital gains are determined in accordance with federal income tax regulations which may differ from GAAP. These “book/tax” differences are either considered temporary or permanent in nature. To the extent these differences are permanent in nature, such amounts are reclassified within the capital accounts based on their federal tax-basis treatment; temporary differences do not require reclassification. |
| Distributions which exceed net investment income and net realized capital gains are reported as distributions in excess of net investment income or distributions in excess of net realized capital gains for financial reporting purposes but not for tax purposes. To the extent they exceed net investment income and net realized capital gains for tax purposes, they are reported as distributions of paid-in-capital. | |
| k. | Guarantees and Indemnification: Under the Funds’ organizational documents, its Officers and Directors are indemnified against certain liability arising out of the performance of their duties to the Funds. Additionally, in the normal course of business, the Funds enter into contracts with service providers that contain general indemnification clauses. The Funds’ maximum exposure under these arrangements is unknown, as this would involve future claims that may be made against the Funds that have not yet occurred. However, based on experience, the Funds expect the risk of loss to be remote. |
| j. | In-Kind Redemptions: The Fund transferred securities and cash to shareholders in connection with an in-kind redemption transaction. For purposes of U.S. GAAP, these transactions were treated as a sale of securities and the resulting gains and losses were recognized based on the market value of the securities on the date of the transfer. For the year ended June 30, 2016, the Growth Fund transacted in-kind redemptions of $379,639,733. |
| Meridian Funds | 67 | www.meridianfund.com |
Table of Contents
Notes to Financial Statements (continued)
| 2. | Capital Shares Transactions: Transactions in capital shares were as follows: |
| Year Ended June 30, 2016 | Year Ended June 30, 20151 | ||||||
| Shares | Amount | Shares | Amount | ||||
| Growth Fund: | |||||||
| Legacy Class | |||||||
Shares sold | 1,358,601 | $ 42,364,119 | 6,497,797 | $ 240,532,008 | |||
Shares issued from reinvestment of distributions | 4,193,907 | 128,417,422 | 6,062,601 | 215,889,243 | |||
Redemption fees | — | 27,621 | — | 20,823 | |||
Shares redeemed | (21,266,639) | (712,564,252) | (14,697,527) | (549,202,740) | |||
Net decrease | (15,714,131) | $(541,755,090) | (2,137,129) | $ (92,760,666) | |||
| Institutional Class | |||||||
Shares sold | 745,916 | $ 25,468,717 | 521,290 | $ 19,592,273 | |||
Shares issued from reinvestment of distributions | 145,944 | 4,467,337 | — | — | |||
Redemption fees | — | 458 | — | — | |||
Shares redeemed | (11,787) | (366,683) | (3,366) | (127,000) | |||
Net increase | 880,073 | $ 29,569,829 | 517,924 | $ 19,465,273 | |||
| Class A2 | |||||||
Shares sold | 119,574 | $ 3,907,150 | 176,885 | $ 6,547,088 | |||
Shares issued from reinvestment of distributions | 23,866 | 718,845 | 15,188 | 536,592 | |||
Redemption fees | — | 767 | — | 1,509 | |||
Shares redeemed | (104,120) | (3,341,094) | (86,276) | (3,194,129) | |||
Net increase | 39,320 | $ 1,285,668 | 105,797 | $ 3,891,060 | |||
| Class C3 | |||||||
Shares sold | 24,336 | $ 746,689 | — | $ — | |||
Shares issued from reinvestment of distributions | 519 | 15,809 | — | — | |||
Redemption fees | — | — | — | — | |||
Shares redeemed | — | — | — | — | |||
Net increase | 24,855 | $ 762,498 | — | $ — | |||
| Investor Class | |||||||
Shares sold | 455,432 | $ 15,060,609 | 920,727 | $ 34,143,889 | |||
Shares issued from reinvestment of distributions | 104,065 | 3,167,743 | 83,780 | 2,973,367 | |||
Redemption fees | — | 5,516 | — | 9,917 | |||
Shares redeemed | (701,466) | (23,050,754) | (382,401) | (14,102,596) | |||
Net increase/(decrease) | (141,969) | $ (4,816,886) | 622,106 | $ 23,024,577 | |||
| 1 | For the twelve months ending June 30, 2015 for Legacy, Investor, and Advisor Class Shares of all Funds. For the period from December 24, 2014 for the Institutional Class Shares for the Growth and Small Cap Growth Funds. |
| 2 | On July 1, 2015, the Fund's Advisor Class Shares were redesignated as Class A Shares. |
| 3 | Commenced operations on July 1, 2015. |
| Meridian Funds | 68 | www.meridianfund.com |
Table of Contents
Notes to Financial Statements (continued)
| Year Ended June 30, 2016 | Year Ended June 30, 20151 | ||||||
| Shares | Amount | Shares | Amount | ||||
| Contrarian Fund: | |||||||
| Legacy Class | |||||||
Shares sold | 121,771 | $ 4,065,895 | 126,877 | $ 5,277,730 | |||
Shares issued from reinvestment of distributions | 2,597,565 | 82,836,341 | 2,985,897 | 113,941,819 | |||
Redemption fees | — | 4,810 | — | 8,643 | |||
Shares redeemed | (2,907,170) | (97,653,536) | (3,171,397) | (134,972,919) | |||
Net decrease | (187,834) | $(10,746,490) | (58,623) | $ (15,744,727) | |||
| Class A2 | |||||||
Shares sold | 1,550 | $ 52,224 | 13,232 | $ 582,725 | |||
Shares issued from reinvestment of distributions | 1,350 | 42,706 | 2,821 | 107,325 | |||
Redemption fees | — | — | — | — | |||
Shares redeemed | (4,934) | (168,353) | (10,759) | (433,410) | |||
Net increase/(decrease) | (2,034) | $ (73,423) | 5,294 | $ 256,640 | |||
| Class C3 | |||||||
Shares sold | 366 | $ 13,770 | — | $ — | |||
Shares issued from reinvestment of distributions | 62 | 1,960 | — | — | |||
Redemption fees | — | — | — | — | |||
Shares redeemed | — | — | — | — | |||
Net increase | 428 | $ 15,730 | — | $ — | |||
| Investor Class | |||||||
Shares sold | 44,349 | $ 1,385,574 | 3,360 | $ 141,443 | |||
Shares issued from reinvestment of distributions | 3,099 | 98,671 | 3,732 | 142,308 | |||
Redemption fees | — | 286 | — | 139 | |||
Shares redeemed | (26,910) | (864,571) | (16,549) | (727,305) | |||
Net increase/(decrease) | 20,538 | $ 619,960 | (9,457) | $ (443,415) | |||
| 1 | For the twelve months ending June 30, 2015 for Legacy, Investor, and Advisor Class Shares of all Funds. For the period from December 24, 2014 for the Institutional Class Shares for the Growth and Small Cap Growth Funds. |
| 2 | On July 1, 2015, the Fund's Advisor Class Shares were redesignated as Class A Shares. |
| 3 | Commenced operations on July 1, 2015. |
| Meridian Funds | 69 | www.meridianfund.com |
Table of Contents
Notes to Financial Statements (continued)
| Year Ended June 30, 2016 | Year Ended June 30, 20151 | ||||||
| Shares | Amount | Shares | Amount | ||||
| Equity Income Fund: | |||||||
| Legacy Class | |||||||
Shares sold | 61,738 | $ 719,828 | 3,698,867 2 | $45,005,167 2 | |||
Shares issued from reinvestment of distributions | 164,032 | 1,881,451 | 490,554 | 6,112,916 | |||
Redemption fees | — | 326 | — | 198 | |||
Shares redeemed | (568,713) | (6,608,467) | (2,249,917) | (27,399,494) | |||
Net increase/(decrease) | (342,943) | $(4,006,862) | 1,939,504 | $ 23,718,787 | |||
| Class A3 | |||||||
Shares sold | 7,200 | $ 86,187 | 48,390 | $ 634,811 | |||
Shares issued from reinvestment of distributions | 1,966 | 22,469 | 1,696 | 21,110 | |||
Redemption fees | — | — | — | — | |||
Shares redeemed | (5,705) | (64,742) | (10,910) | (149,718) | |||
Net increase | 3,461 | $ 43,914 | 39,176 | $ 506,203 | |||
| Class C4 | |||||||
Shares sold | 80 | $ 1,000 | — | $ — | |||
Shares issued from reinvestment of distributions | 3 | 39 | — | — | |||
Redemption fees | — | — | — | — | |||
Shares redeemed | — | — | — | — | |||
Net increase | 83 | $ 1,039 | — | $ — | |||
| Investor Class | |||||||
Shares sold | 3,993 | $ 46,100 | 22,979 | $ 291,957 | |||
Shares issued from reinvestment of distributions | 739 | 8,487 | 674 | 8,412 | |||
Redemption fees | — | 2 | — | — | |||
Shares redeemed | (9,781) | (118,843) | — | — | |||
Net increase/(decrease) | (5,049) | $ (64,254) | 23,653 | $ 300,369 | |||
| 1 | For the twelve months ending June 30, 2015 for Legacy, Investor, and Advisor Class Shares of all Funds. For the period from December 24, 2014 for the Institutional Class Shares for the Growth and Small Cap Growth Funds. |
| 2 | Includes shares and dollars issued in connection with reorganization of the Jordan Opportunity Fund in the amount of 3,333,502 shares and $42,122,077, respectively. |
| 3 | On July 1, 2015, the Fund's Advisor Class Shares were redesignated as Class A Shares. |
| 4 | Commenced operations on July 1, 2015. |
| Meridian Funds | 70 | www.meridianfund.com |
Table of Contents
Notes to Financial Statements (continued)
| Year Ended June 30, 2016 | Year Ended June 30, 20151 | ||||||
| Shares | Amount | Shares | Amount | ||||
| Small Cap Growth Fund: | |||||||
| Legacy Class | |||||||
Shares sold | 1,148,798 | $ 12,656,976 | 3,852,242 | $ 46,370,426 | |||
Shares issued from reinvestment of distributions | 55,930 | 625,306 | 70,018 | 835,314 | |||
Redemption fees | — | 1,855 | — | 1,241 | |||
Shares redeemed | (2,077,810) | (25,040,437) | (185,662) | (2,261,922) | |||
Net increase/(decrease) | (873,082) | $ (11,756,300) | 3,736,598 | $ 44,945,059 | |||
| Institutional Class | |||||||
Shares sold | 3,747,760 | $ 43,537,374 | 1,008,763 | $ 12,908,934 | |||
Shares issued from reinvestment of distributions | 26,608 | 297,754 | — | — | |||
Redemption fees | — | 1,061 | — | — | |||
Shares redeemed | (335,719) | (3,814,163) | (4,797) | (59,239) | |||
Net increase | 3,438,649 | $ 40,022,026 | 1,003,966 | $ 12,849,695 | |||
| Class A2 | |||||||
Shares sold | 2,577,458 | $ 29,873,325 | 3,469,892 | $ 41,768,471 | |||
Shares issued from reinvestment of distributions | 65,916 | 731,663 | 45,993 | 546,859 | |||
Redemption fees | — | 8,051 | — | 4,039 | |||
Shares redeemed | (1,705,906) | (19,414,644) | (576,238) | (7,063,995) | |||
Net increase | 937,468 | $ 11,198,395 | 2,939,647 | $ 35,255,374 | |||
| Class C3 | |||||||
Shares sold | 2,024,487 | $ 23,963,146 | — | $ — | |||
Shares issued from reinvestment of distributions | 23,521 | 261,553 | — | — | |||
Redemption fees | — | 96 | — | — | |||
Shares redeemed | (29,504) | (299,994) | — | — | |||
Net increase | 2,018,504 | $ 23,924,801 | — | $ — | |||
| Investor Class | |||||||
Shares sold | 9,280,681 | $107,156,143 | 11,475,007 | $138,940,112 | |||
Shares issued from reinvestment of distributions | 166,693 | 1,863,626 | 65,822 | 784,601 | |||
Redemption fees | — | 45,749 | — | 58,412 | |||
Shares redeemed | (5,883,541) | (64,893,369) | (1,610,523) | (20,312,792) | |||
Net increase | 3,563,833 | $ 44,172,149 | 9,930,306 | $119,470,333 | |||
| 1 | For the twelve months ending June 30, 2015 for Legacy, Investor, and Advisor Class Shares of all Funds. For the period from December 24, 2014 for the Institutional Class Shares for the Growth and Small Cap Growth Funds. |
| 2 | On July 1, 2015, the Fund's Advisor Class Shares were redesignated as Class A Shares. |
| 3 | Commenced operations on July 1, 2015. |
| Meridian Funds | 71 | www.meridianfund.com |
Table of Contents
Notes to Financial Statements (continued)
| 3. | Investment Transactions: The cost of investments purchased and the proceeds from sales of investments, excluding short-term securities and U.S. government obligations, for the year ended June 30, 2016, were as follows: |
| Purchases | Proceeds from Sales | ||
Growth Fund | $912,199,049 | $1,054,996,061 | |
Contrarian Fund | $388,476,316 | $ 464,734,410 | |
Equity Income Fund | $ 24,610,190 | $ 24,351,997 | |
Small Cap Growth Fund | $242,450,441 | $ 149,367,616 |
| 4. | Other Investment Transactions |
| a. | Restricted Securities: The Funds may invest in securities that are subject to legal or contractual restrictions on resale. Prompt sale of such securities at an acceptable price may be difficult and may involve substantial delays and additional costs. |
| b. | Securities Lending: The Funds have entered into an agreement with The Bank of New York Mellon (the “Lending Agent”), dated September 23, 2015, (“Securities Lending Agreement”), to provide securities lending services to the Funds. Under this program, the proceeds (cash collateral) received from borrowers are used to invest in money market funds or joint repurchase agreements. Under the Securities Lending Agreement, the borrowers may pay the Funds negotiated lender fees and the Funds receive cash and/or securities as collateral in an amount equal to not less than 102% of the market value of loaned securities. The market value of the loaned securities is determined at the close of each business day of the Fund and any additional required collateral is delivered to the Fund, or excess collateral is returned by the Fund, on the next business day. The borrower pays fees at the Funds’ direction to the Lending Agent. Although the risk of lending is generally mitigated by the collateral, the Funds could experience a delay in recovering securities and a possible loss of income or value if the borrower fails to return them. |
| The following table summarizes the securities received as collateral for securities lending: | |
| Collateral Type | Coupon Range | Maturity Date Range | Market Value | ||||
Growth Fund | U.S. Government Obligations | 0.00% - 7.63% | 7/15/16 - 2/15/46 | $56,722,456 | |||
Contrarian Fund | U.S. Government Obligations | 0.00% - 7.63% | 7/15/16 - 2/15/45 | 342,782 | |||
Equity Income Fund | U.S. Government Obligations | 0.63% - 3.13% | 4/30/17 - 8/15/25 | 677,591 | |||
Small Cap Growth Fund | U.S. Government Obligations | 0.00% - 5.38% | 7/15/16 - 2/15/46 | 5,335,272 |
| c. | Repurchase Agreements and Joint Repurchase Agreements: The Funds may enter into repurchase agreements for temporary cash management purposes provided that the value of the underlying collateral, including accrued interest, will equal or exceed the value of the repurchase agreement during the term of the agreement. The underlying collateral for all repurchase agreements is held in safekeeping by the Fund’s custodian or at the Federal Reserve Bank. If the seller defaults and the value of the collateral declines, or if bankruptcy proceedings commence with respect to the seller of the security, realization of the collateral by the Funds may be delayed or limited. |
| Additionally, the Funds may enter into joint repurchase agreements for reinvestment of cash collateral on securities lending transactions under the securities lending program offered by the Lending Agent (the “Program”), provided that the value of the underlying collateral, including accrued interest will equal or exceed the value of the joint repurchase agreement during the term of the agreement. The Funds participate on a pro rata |
| Meridian Funds | 72 | www.meridianfund.com |
Table of Contents
Notes to Financial Statements (continued)
| basis with other clients of the Lending Agent in its share of the underlying collateral under such joint repurchase agreements and in its share of proceeds from any repurchase or other disposition of the underlying collateral. The underlying collateral for joint repurchase agreements is held in safekeeping by the Fund’s custodian or at the Federal Reserve Bank. If the seller defaults and the value of the collateral declines, or if bankruptcy proceedings commence with respect to the seller of the security, realization of the collateral by the Funds may be delayed or limited. Pursuant to the Program, the Funds are indemnified for such losses by the Lending Agent. | |
| At June 30, 2016, the market value of repurchase agreements or joint repurchase agreements outstanding for the Meridian Growth Fund, Meridian Contrarian Fund, Meridian Equity Income Fund, and the Meridian Small Cap Growth Fund were $165,893,800, $39,136,196, $5,500,185 and $54,200,881, respectively. | |
| d. | Master Netting Arrangements: The Funds may enter into master netting agreements with their counterparties for the securities lending program and repurchase agreements, which provide the right, in the event of default (including bankruptcy or insolvency) for the non-defaulting party to liquidate the collateral and calculate net exposure to the defaulting party or request additional collateral. For financial reporting purposes, the Funds do not offset financial assets and financial liabilities that are subject to master netting agreements in the Statement of Assets and Liabilities. For securities lending transactions see Note 4.b. |
| The following table is a summary of the Funds’ open repurchase agreements that are subject to a master netting arrangement as of June 30, 2016: | |
| Assets | |||||
| Gross Amounts Presented in Statements of Assets and Liabilities | Collateral Received | Net Amount | |||
| Growth Fund | |||||
Repurchase agreement | $ 165,893,800 | $ (165,893,800)1 | $ — | ||
| Contrarian Fund | |||||
Repurchase agreement | 39,136,196 | (39,136,196) 1 | — | ||
| Equity Income Fund | |||||
Repurchase agreement | 5,500,185 | (5,500,185) 1 | — | ||
| Small Cap Growth Fund | |||||
Repurchase agreement | 54,200,881 | (54,200,881) 1 | — | ||
| 1 | The amount of collateral presented is limited such that the net amount cannot be less than zero. Collateral received in excess of the market value of securities on loan is not presented in this table. |
| e. | Options: Certain Funds purchase and write call and put options to increase or decrease their exposure to underlying instruments (including equity risk, interest rate risk and/or commodity price risk) and/or, in the case of options written, to generate gains from options premiums. A call option gives the purchaser (holder) of the option the right (but not the obligation) to buy, and obligates the seller (writer) to sell (when the option is exercised) the underlying instrument at the exercise or strike price at any time or at a specified time during the option period. A put option gives the holder the right to sell and obligates the writer to buy the underlying instrument at the exercise or strike price at any time or at a specified time during the option period. When the Funds purchase (write) an option, an amount equal to the premium paid (received) by the Funds is reflected as an asset (liability). The amount of the asset (liability) is subsequently marked-to-market to reflect the current market value of the option purchased (written). When an instrument is purchased or sold through an exercise of an option, the related premium paid (or received) is added to (or deducted from) the basis of the instrument acquired or deducted from (or added to) the proceeds of the instrument sold. When an option expires (or the Funds enter into a closing transaction), the Funds realize a gain or loss on the option to the extent of the premiums received or paid (or gain or loss to the extent the cost of the closing transaction exceeds the premiums received or paid). When the Funds write a call option, such option is “covered,” meaning that the Funds hold the underlying instrument subject to being called by the option counterparty. When the Funds write a put option, such option is covered by cash in an amount sufficient to cover the obligation. |
| Meridian Funds | 73 | www.meridianfund.com |
Table of Contents
Notes to Financial Statements (continued)
| In purchasing and writing options, the Funds bear the risk of an unfavorable change in the value of the underlying instrument or the risk that the Funds may not be able to enter into a closing transaction due to an illiquid market. Exercise of a written option could result in the Funds purchasing or selling a security when it otherwise would not, or at a price different from the current market value. | |
| Transactions in options written during the year ended June 30, 2016, were as follows: | |
| Meridian Equity Income Fund | Number of Contracts | Premiums Received | |
Options outstanding at June 30, 2015 | 72 | $ 55,831 | |
Options written | 2,463 | 332,192 | |
Options terminated in closing purchase transactions | (1,553) | (278,383) | |
Options expired | (450) | (60,259) | |
Options exercised | (532) | (49,381) | |
Options outstanding at June 30, 2016 | — | $ — |
| f. | Short Sales: The Funds may enter into short sales. A short sale occurs when a fund sells a security it generally does not own (the security is borrowed), in anticipation of a decline in the security’s price. The initial amount of a short sale is recorded as a liability which is marked-to-market daily. Fluctuations in the value of the short liability are recorded as unrealized gains or losses. If a Fund shorts a security when also holding a long position in the security (a “short against the box”), as the security’s price declines, the short position increases in value, offsetting the long position’s decrease in value. The opposite effect occurs if the security’s price rises. A Fund realizes a gain or loss upon closing of the short sale (returning the security to the counterparty by way of purchase or delivery of a long position owned). Possible losses from short sales may be unlimited, whereas losses from security purchases cannot exceed the total amount invested. The Funds are liable to the buyer for any dividends payable on securities while those securities are in a short position. These dividends are an expense of the Funds. The Funds designate collateral consisting of cash, U.S. government securities or other liquid assets sufficient to collateralize the market value of short positions. |
| 5. | Market and Debt Securities Risk |
| In the normal course of business, each Funds’ investment activities expose it to various types of risk associated with the financial instruments and markets in which it invests. The significant types of financial risks each Fund is exposed to include market risk and debt securities risk. Each Fund’s prospectus provides details of these and other types of risk. | |
| Market Risk: Market risk refers to the possibility that the market values of securities or other investments that a Fund holds will fall, sometimes rapidly or unpredictably, or fail to rise. Security values may fall or fail to rise because of a variety of factors affecting (or the market’s perception of) individual companies or other issuers (e.g., an unfavorable earnings report), industries or sectors, or the market as a whole, reducing the value of an investment in a Fund. Accordingly, an investment in the Fund could lose money over short or even long periods. The market values of the securities the Fund holds also can be affected by changes (or perceived changes) in U.S. or foreign economies and financial markets, and the liquidity of these securities, among other factors. In general, equity securities tend to have greater price volatility than debt securities. In addition, stock prices may be sensitive to rising interest rates, as the cost of capital rises and borrowing costs increase. As a result, the value of your investments in a Fund may be more or less than the value of your purchase price. | |
| Debt Securities Risk: Each Fund may invest in debt securities of both government and corporate issuers. A decline in prevailing levels of interest rates generally increases the value of debt securities in a Fund’s portfolio, while an increase in rates usually reduces the value of those securities. The value of a Fund’s debt securities, including bonds and convertible securities, are affected by movements in interest rates; if interest rates rise, the value of these securities may fall. Generally, the longer the average maturity of a debt security, the greater the change in its value. As a result, to the extent that a Fund invests in debt securities, interest rate fluctuations will affect the Fund’s net asset value, but not the |
| Meridian Funds | 74 | www.meridianfund.com |
Table of Contents
Notes to Financial Statements (continued)
| income it receives from debt securities it owns. Debt securities are also subject to credit, liquidity risk and prepayment and extension risk. Credit risk is the risk that the entity that issued a debt security may become unable to make payments of principal and interest, and includes the risk of default. Liquidity risk is the risk that a Fund may not be able to sell portfolio securities because there are too few buyers for them. Prepayment and extension risk is the risk that a loan, bond or other security might be called or otherwise converted, prepaid or redeemed before maturity. If a loan or security is converted, prepaid or redeemed before maturity, particularly during a time of declining interest rates or spreads, the portfolio managers may not be able to invest the proceeds in securities or loans providing as high a level of income, resulting in a reduced yield to a Fund. Conversely, as interest rates rise or spreads widen, the likelihood of prepayment decreases. The portfolio managers may be unable to capitalize on securities with higher interest rates or wider spreads because a Fund’s investments are locked in at a lower rate for a longer period of time. |
| 6. | Affiliate Transactions and Fees |
| Management Fees: Under the Investment Management Agreement, the Adviser receives the following fees for providing certain investment management and other services necessary for managing each Fund. The fee is paid monthly in arrears and calculated based on that month’s daily average net assets. | |
| Growth Fund: | Contrarian and Small Cap Growth Funds: | |||||
| Average Daily Net Assets | Investment Management Fee | Average Daily Net Assets | Investment Management Fee | |||
Up to $50,000,000 | 1.00% | Greater than $0 | 1.00% | |||
Greater than $50,000,000 | 0.75% | |||||
| Equity Income Fund: | ||
| Average Daily Net Assets | Investment Management Fee | |
Up to $10,000,000 | 1.00% | |
$10,000,001 to $30,000,000 | 0.90% | |
$30,000,001 to $50,000,000 | 0.80% | |
Greater than $50,000,000 | 0.70% | |
| Meridian Funds | 75 | www.meridianfund.com |
Table of Contents
Notes to Financial Statements (continued)
| Expense Limitation | Total Waivers and Reimbursements for the year ended June 30, 2016 | ||
| Growth Fund | |||
Institutional Class | 0.90% | $ — | |
Class A | 1.55% | $ — | |
Class C | 2.25% | $ — | |
Investor Class | 1.30% | $ — | |
| Contrarian Fund | |||
Class A | 1.60% | $ — | |
Class C | 2.20% | $ — | |
Investor Class | 1.35% | $ — | |
| Equity Income Fund | |||
Legacy Class | 1.25% | $ — | |
Class A | 1.60% | $ 213 | |
Class C | 2.00% | $ 3 | |
Investor Class | 1.35% | $ — | |
| Small Cap Growth Fund | |||
Legacy Class | 1.20% | $ — | |
Institutional Class | 1.10% | $34,831 | |
Class A | 1.60% | $ — | |
Class C | 2.25% | $ 4,669 | |
Investor Class | 1.35% | $ — |
| Expiration June 30, | |||||
| 2017 | 2018 | 2019 | |||
Growth Fund | — | — | — | ||
Contrarian Fund | $14,771 | $23,426 | — | ||
Equity Income Fund | 54,402 | 44,499 | $ 216 | ||
Small Cap Growth Fund | 57,467 | 51,290 | 39,500 | ||
| 7. | Directors and Officers: Certain Directors and/or Officers of the Funds are also Directors and/or Officers of the Adviser. Directors and Officers of the Funds who are Directors and/or Officers of the Adviser receive no compensation from the Funds. Each Non-Interested Director is paid an annual fee set at $40,000. An additional $5,000 is paid to each Non-Interested Director for attendance at each in-person meeting of the Board and an additional $1,000 is paid to each Non-Interested Director for participating in a telephonic meeting of the Board. An additional $3,000 is paid to each member of the Audit or Governance Committee of the Board for attendance at an in-person Audit or Governance |
| Meridian Funds | 76 | www.meridianfund.com |
Table of Contents
Notes to Financial Statements (continued)
| Committee meeting and an additional $1,000 is paid to each member of the Audit or Governance Committee of the Board for participating in a telephonic Audit or Governance Committee meeting. | |
| An additional $10,000 is paid to the Chairman of the Board and the Chairman of a Committee of the Board. The Chairman of the Board also receives an additional $2,500 for attending each in-person meeting of the Board. The Chairman of a Committee receives an additional $2,000 for attending each in person Committee meeting. |
| 8. | Distribution Information: Income and long-term capital gains distributions are determined in accordance with federal income tax regulations, which may differ from GAAP. The tax character of distributions made during the fiscal year ended June 30, 2016 is as follows: |
| 2016 Taxable Distributions | |||||
| Ordinary Income | Net Long-Term Capital Gain | Total Distributions | |||
Growth Fund | 29,993,917 | 110,190,627 | 140,184,544 | ||
Contrarian Fund | 194,812 | 85,104,072 | 85,298,884 | ||
Equity Income Fund | 9 | 1,965,502 | 1,965,511 | ||
Small Cap Growth Fund | 3,839,325 | 472,200 | 4,311,525 | ||
| 9. | Federal Income Taxes Information: Management has analyzed the Funds’ tax positions taken on federal income tax returns for all open tax years (current and prior three tax years), and has concluded that no provision for federal income tax is required in the Funds’ financial statements. The Funds’ federal and state income and federal excise tax returns for tax years for which the applicable statutes of limitations have not expired are subject to examination by the Internal Revenue Service and state departments of revenue. The Funds are not aware of any tax positions for which it is reasonably possible that the total amounts of unrecognized tax benefits will significantly change in the next 12-months. The Funds recognize interest and penalties, if any, related to unrecognized tax benefits as income tax expense in the Statements of Operations. During the year ended June 30, 2016, the Funds did not incur any interest or penalties. |
| Permanent differences, incurred during the year ended June 30, 2016, resulting from differences in book and tax accounting, have been reclassified at year end to undistributed net investment income and accumulated realized gain/(loss) as follows: | |
| Increase/(Decrease) Paid-in-Capital | Increase/(Decrease) Undistributed Net Investment Income/(Loss) | Increase/(Decrease) Accumulated Realized Gain/(Loss) | |||
Growth Fund | $100,362,682 | $1,662,397 | $(102,025,079) | ||
Contrarian Fund | (1,055,938) | 1,520,122 | (464,184) | ||
Equity Income Fund | 4 | (21,703) | 21,699 | ||
Small Cap Growth Fund | (838,081) | 837,760 | 321 |
| Aggregrate Cost | Aggregrate Gross Unrealized Appreciation | Aggregrate Gross Unrealized Depreciation | Net Unrealized Appreciation | ||||
Growth Fund | $1,307,736,560 | $184,638,091 | $(104,336,078) | $80,302,013 | |||
Contrarian Fund | 481,531,388 | 83,033,660 | (18,961,112) | 64,072,548 | |||
Equity Income Fund | 42,674,805 | 6,668,052 | (3,825,999) | 2,842,053 | |||
Small Cap Growth Fund | 354,300,732 | 35,853,134 | (26,932,703) | 8,920,431 |
| Meridian Funds | 77 | www.meridianfund.com |
Table of Contents
Notes to Financial Statements (continued)
| Components of Accumulated Earnings (Losses) on a Tax Basis | |||||||
| Growth Fund | Contrarian Fund | Equity Income Fund | Small Cap Growth Fund | ||||
Undistributed ordinary income | $ — | $ — | $ 366,892 | $ — | |||
Capital loss carry forward | (36,672,291) | — | (3,157,448) | (8,965,770) | |||
Undistributed long-term capital gains | — | — | — | — | |||
Unrealized appreciation/(depreciation) | 80,302,013 | 64,072,548 | 2,667,512 | 8,920,431 | |||
Qualified late year deferred losses | (2,990,107) | (10,914,617) | — | (995,429) | |||
Total Accumulated Earnings/(Losses) | $ 40,639,615 | $ 53,157,931 | $ (123,044) | $(1,040,768) | |||
| Short-Term | Long-Term | Total | |||
| Growth Fund | 15,713,205 | 20,959,086 | 36,672,291 | ||
| Equity Income Fund | 3,001,411 | 156,037 | 3,157,448 | ||
| Small Cap Growth Fund | 6,112,612 | 2,853,158 | 8,965,770 |
| 10. | Other Matters: As of April 9, 2010, the Adviser and certain affiliated entities became defendants in a lawsuit brought by another company alleging trademark infringement, unfair competition and related claims. The complaint alleges that the Adviser’s and affiliated entities’ use of their Arrowpoint trademark and the Arrowpoint logo infringes the rights of the plaintiff in various trademarks that it uses. The complaint seeks injunctive relief requiring the Adviser and the affiliated entities to cease use of the Arrowpoint trademark and logo and unspecified monetary damages, which the plaintiff claims to be unable to quantify. The Adviser has responded to the lawsuit in the United States District Court for the District of Delaware by denying the material allegations of the compliant and opposing the plaintiff’s motion for a preliminary injunction, which is now pending before the Court. |
| The Adviser believes the complaint to be without legal merit and intends to defend against it vigorously. Any legal costs associated with the compliant will be borne by the Adviser, and not the Meridian Funds. While an outcome regarding the complaint is unknown at this time, the Adviser believes that this complaint should not have a material effect on its operations or impair its ability to perform its duties to the Meridian Funds. |
| 11. | Subsequent Events: Management has evaluated the impact of all subsequent events on the Funds through the date the financial statements were available to be issued, and has noted no additional events that require recognition or disclosure in the financial statements. |
| Meridian Funds | 78 | www.meridianfund.com |
Table of Contents
| Meridian Funds | 79 | www.meridianfund.com |
Table of Contents
Information About the Directors and Officers
| Interested Directors* (Name & Year of Birth) | Positions(s) Held with Fund: | Length of Service (Beginning Date) | Principal Occupation(s) During Past 5 Years | Number of Portfolios Overseen | Other Directorships |
| Michael Stolper* (1945) | Director | Indefinite term since May 3, 1985 | President, Stolper & Company, Inc. (an investment adviser), September 1975 to present; Managing Director, Windowpane Advisors, LLC (an investment adviser), January 1, 2005 to present; Trustee, Ewing Marion Kauffman Foundation, March 2010 to present. | 4 | Window Pane Funds (one portfolio) |
| * Mr. Stolper is treated as an “interested” person of the Funds, as such term is defined in the 1940 Act, because, as a result of his prior ownership interest in Aster Investment Management, Inc. (the “Previous Investment Adviser”, the previous investment adviser to the Meridian Equity Income Fund, Meridian Growth Fund, and Meridian Contrarian Fund.) | |||||
| Non-Interested Directors (Name & Year of Birth) | Position(s) Held with Fund: | Length of Service (Beginning Date) | Princiapl Occupation(s) During Past 5 Years | Number of Portfolios Overseen | Other Directorships |
| Guy M. Arnold (1968) | Director | Indefinite term since May 12, 2015 | President of Hunt Development Group from July 2015 to present Owner/Manager of GMA Holdings, LLC from January 2013 to July 2015; President of Dividend Capital Diversified Property Fund from January 2008 to January 2013. | 4 | MidFirst Bank –Colorado Advisory Member, The Children's Hospital of Colorado Finance Committee |
| John S. Emrich, CFA (1967) | Director | Indefinite term since October 6, 2010 | Private Investor, January 2011 to present; Co- Founder and Portfolio Manager, Ironworks Capital Management (an investment adviser), April 2005 to December 2010; Member and Manager, Iroquois Valley Farms, LLC, June 2012 to August 2015. | 4 | Destra Funds (4 Funds) |
| Michael S. Erickson (1952) | Director | Indefinite term since May 3, 1985 | Private Investor, August 2007 to present; Treasurer and Vice President, Erickson Holding Corp, 2003 to present; Treasurer, Vice President and Manager, McGee Island LLC, 2015 to present. | 4 | Destra Funds (4 Funds) |
| James Bernard Glavin (1935) | Director and Chairman of the Board | Indefinite term since May 3, 1985 | Retired; previously Chairman of the Board, Orchestra Theraputics, Inc. | 4 | Destra Funds (4 Funds) |
| Edward F. Keely, CFA (1966) | Director | Indefinite term since February 13, 2015 | Chief Investment Officer/Portfolio Manager at Borgen Investment Group, 2008 to present. | 4 | None |
| Meridian Funds | 80 | www.meridianfund.com |
Table of Contents
Information About the Directors and Officers (continued)
| Officers (Name & Year of Birth) | Position(s) Held with Fund: | Length of Service | Principal Occupation(s) During Past 5 Years |
| David Corkins (1966) | President (Principal Executive Officer) | Indefinite; Since September 5, 2013 | Co-Founder, Principal and Portfolio Manager, Arrowpoint Asset Management, LLC |
| Rick Grove (1968) | Vice President, Secretary and Chief Compliance Officer | Indefinite; Since September 5, 2013 | Chief Operating Officer and Chief Compliance Officer, Arrowpoint Asset Management, LLC |
| Derek Mullins (1973) | Chief Financial Officer (Principal Financial Officer) and Treasurer | Indefinite; Since September 5, 2013 | Director of Operations, Arrowpoint Asset Management, LLC |
| Katie Jones (1984) | Assistant Treasurer | Indefinite; Since August 12, 2014 | Controller, Arrowpoint Asset Management, LLC; formerly, Assistant Controller and Alternative Investment Accounting Supervisor, ALPS Fund Services |
| Meridian Funds | 81 | www.meridianfund.com |
Table of Contents
2016 TAX NOTICE TO SHAREHOLDERS (Unaudited)
| Growth Fund | 11.23% |
| Contrarian Fund | 0.00% |
| Equity Income Fund | 100.00% |
| Small Cap Growth Fund | 9.72% |
| Growth Fund | 12.10% |
| Contrarian Fund | 0.00% |
| Equity Income Fund | 100.00% |
| Small Cap Growth Fund | 10.27% |
| Growth Fund | 0.00% |
| Contrarian Fund | 0.00% |
| Small Cap Growth Fund | 0.00% |
| Growth Fund | 100.00% |
| Contrarian Fund | 0.00% |
| Small Cap Growth Fund | 100.00% |
| Growth Fund | 0.00% |
| Contrarian Fund | 0.00% |
| Equity Income Fund | 0.00% |
| Small Cap Growth Fund | 0.00% |
| Meridian Funds | 82 | www.meridianfund.com |
Table of Contents
Glossary of Terms Used in this Report (Unaudited)
| Meridian Funds | 83 | www.meridianfund.com |
Table of Contents
| • | Applications or other forms |
| • | Transactions with us, our affiliates, or others |
Table of Contents
P.O. Box 9792
1-800-446-6662
| • | For a fee, by writing the Public Reference Section of the Commission, Washington, D.C. 20549-1520, by electronic request at the following E-mail address: publicinfo@sec.gov, or by calling 202-551-8090 |
| • | Free from the Commission’s Website at http://www.sec.gov. |
Table of Contents
Table of Contents
Table of Contents
Other Information (Unaudited)
(800) 446-6662
(303) 398-2929
(877) 796-3434
Arrowpoint Asset Management LLC
100 Fillmore Street, Suite 325
Denver, CO 80206
Destra Capital Investments LLC
One North Wacker Drive, 48th Floor
Chicago, IL 60606
BNY Mellon Investment Servicing (US) Inc.
760 Moore Road
King of Prussia, PA 19406
The Bank of New York Mellon
One Wall Street
New York, NY 10286
Davis Graham & Stubbs LLP
1550 17th Street, Suite 500
Denver, CO 80202
PricewaterhouseCoopers LLP
Three Embarcadero Center
San Francisco, CA 94111
James Bernard Glavin, Chairman
Guy M. Arnold
John S. Emrich
Michael S. Erickson
Edward F. Keely
Michael Stolper*
David Corkins, President
Derek Mullins, Chief Financial Officer and Treasurer
Richard Grove, Vice President, Secretary and Chief
Compliance Officer
Table of Contents
Item 2. Code of Ethics.
| (a) | The registrant, as of the end of the period covered by this report, has adopted a code of ethics that applies to the registrant’s principal executive officer, principal financial officer, principal accounting officer or controller, or persons performing similar functions, regardless of whether these individuals are employed by the registrant or a third party. |
| (c) | There have been no amendments, during the period covered by this report, to a provision of the code of ethics that applies to the registrant’s principal executive officer, principal financial officer, principal accounting officer or controller, or persons performing similar functions, regardless of whether these individuals are employed by the registrant or a third party, and that relates to any element of the code of ethics description. |
| (d) | The registrant has not granted any waivers, including an implicit waiver, from a provision of the code of ethics that applies to the registrant’s principal executive officer, principal financial officer, principal accounting officer or controller, or persons performing similar functions, regardless of whether these individuals are employed by the registrant or a third party, that relates to one or more of the items set forth in paragraph (b) of this item’s instructions. |
| (f) | A copy of the registrant’s code of ethics is filed as Exhibit 12(a)(1) to this report. |
Item 3. Audit Committee Financial Expert.
As of the end of the period covered by the report, the registrant’s board of directors has determined that James Glavin is qualified to serve as an audit committee financial expert serving on its audit committee and that he is “independent,” as defined by Item 3 of Form N-CSR.
Item 4. Principal Accountant Fees and Services.
Audit Fees
| (a) | The aggregate fees billed for each of the last two fiscal years for professional services rendered by the principal accountant for the audit of the registrant’s annual financial statements or services that are normally provided by the accountant in connection with statutory and regulatory filings or engagements for those fiscal years are $141,800 in 2016 and $137,800 in 2015. |
Audit-Related Fees
| (b) | The aggregate fees billed in each of the last two fiscal years for assurance and related services by the principal accountant that are reasonably related to the performance of the audit of the |
Table of Contents
registrant’s financial statements and are not reported under paragraph (a) of this Item are $0 in 2016 and $0 in 2015.
Tax Fees
| (c) | The aggregate fees billed in each of the last two fiscal years for professional services rendered by the principal accountant for tax compliance, tax advice, and tax planning are $36,600 in 2016 and $32,480 in 2015. The fiscal year tax fees were for review of each fund’s federal and excise tax returns and year-end distributions. |
All Other Fees
| (d) | The aggregate fees billed in each of the last two fiscal years for products and services provided by the principal accountant, other than the services reported in paragraphs (a) through (c) of this Item are $7,375 in 2016 and $0 in 2015. The fiscal year other fees were for review of the Meridian Growth Fund’s tax equalization calculation. |
| (e)(1) | Disclose the audit committee’s pre-approval policies and procedures described in paragraph (c)(7) of Rule 2-01 of Regulation S-X. |
PRE-APPROVAL OF AUDIT AND PERMITTED NON-AUDIT SERVICES PROVIDED TO THE COMPANY
| 1. | Pre-Approval Requirements. The Committee shall pre-approve all auditing services and permissible non-audit services (e.g., tax services) to be provided to the Company by the Auditor, including the fees therefore. The Committee may delegate to one or more of its members the authority to grant pre-approvals. In connection with such delegation, the Committee shall establish pre-approval policies and procedures, including the requirement that the decisions of any member to whom authority is delegated under this section shall be presented to the full Committee at each of its scheduled meetings. |
| 2. | De Minimis Exception to Pre-Approval: Pre-approval for a permitted non-audit service shall not be required if: |
| a. | the aggregate amount of all such non-audit services is not more than 5% of the total revenues paid by the Company to the Auditor in the fiscal year in which the non-audit services are provided; |
| b. | such services were not recognized by the Company at the time of the engagement to be non-audit services; and |
| c. | such services are promptly brought to the attention of the Committee and approved prior to the completion of the audit by the Committee or by one or more members of the |
Table of Contents
Committee to whom authority to grant such approvals has been delegated by the Committee.
Additionally, the Committee shall pre-approve the Auditor’s engagements for non-audit services with the Adviser and any affiliate of the Adviser that provides ongoing services to the Company in accordance with the foregoing, if the engagement relates directly to the operations and financial reporting of the Company, unless the aggregate amount of all services provided constitutes no more than 5% of the total amount of revenues paid to the Auditor by the Company, the Adviser and any affiliate of the Adviser that provides ongoing services to the Company during the fiscal year in which the services are provided that would have to be pre-approved by the Committee pursuant to this paragraph (without regard to this exception).
PROHIBITED SERVICES
The Committee shall confirm with the Auditor engaged to perform the audit of the Company that the Auditor is not performing contemporaneously any of the following non-audit services for the Company, the Adviser, or any affiliates of the Company or Adviser:
| 1. | bookkeeping or other services related to the accounting records or financial statements of the Company; |
| 2. | financial information systems design and implementation; |
| 3. | appraisal or valuation services, fairness opinions, or contribution-in-kind reports; |
| 4. | actuarial services; |
| 5. | internal audit outsourcing services; |
| 6. | management functions or human resources; |
| 7. | broker or dealer, investment adviser, or investment banking services; |
| 8. | legal services and expert services unrelated to the audit; and |
| 9. | any other service that the Public Company Accounting Oversight Board determines, by regulation, is impermissible. |
The Auditor is responsible for informing the Committee of whether it believes that a particular service is permissible or prohibited pursuant to applicable regulations and standards.
| (e)(2) | The percentage of services described in each of paragraphs (b) through (d) of this Item that were approved by the audit committee pursuant to paragraph (c)(7)(i)(C) of Rule 2-01 of Regulation S-X are as follows: |
| (b) | N/A |
| (c) | N/A |
Table of Contents
| (d) | N/A |
| (f) | The percentage of hours expended on the principal accountant’s engagement to audit the registrant’s financial statements for the most recent fiscal year that were attributed to work performed by persons other than the principal accountant’s full-time, permanent employees was less than fifty percent. |
| (g) | The aggregate non-audit fees billed by the registrant’s accountant for services rendered to the registrant, and rendered to the registrant’s investment adviser (not including any sub-adviser whose role is primarily portfolio management and is subcontracted with or overseen by another investment adviser), and any entity controlling, controlled by, or under common control with the adviser that provides ongoing services to the registrant for each of the last two fiscal years of the registrant was $0 in 2016 and $0 in 2015. |
| (h) | Not applicable. |
Item 5. Audit Committee of Listed Registrants.
Not applicable.
Item 6. Investments.
| (a) | Schedule of Investments in securities of unaffiliated issuers as of the close of the reporting period is included as part of the report to shareholders filed under Item 1 of this form. |
| (b) | Not applicable. |
Item 7. Disclosure of Proxy Voting Policies and Procedures for Closed-End Management Investment Companies.
Not applicable.
Item 8. Portfolio Managers of Closed-End Management Investment Companies.
Not applicable.
Item 9. Purchases of Equity Securities by Closed-End Management Investment Company and Affiliated Purchasers.
Not applicable.
Item 10. Submission of Matters to a Vote of Security Holders.
Table of Contents
There have been no material changes to the procedures by which the shareholders may recommend nominees to the registrant’s board of directors, where those changes were implemented after the registrant last provided disclosure in response to the requirements of Item 407(c)(2)(iv) of Regulation S-K (17 CFR 229.407) (as required by Item 22(b)(15) of Schedule 14A (17 CFR 240.14a-101)), or this Item.
Item 11. Controls and Procedures.
| (a) | The registrant’s principal executive and principal financial officers, or persons performing similar functions, have concluded that the registrant’s disclosure controls and procedures (as defined in Rule 30a-3(c) under the Investment Company Act of 1940, as amended (the “1940 Act”) (17 CFR 270.30a-3(c))) are effective, as of a date within 90 days of the filing date of the report that includes the disclosure required by this paragraph, based on their evaluation of these controls and procedures required by Rule 30a-3(b) under the 1940 Act (17 CFR 270.30a-3(b)) and Rules 13a-15(b) or 15d-15(b) under the Securities Exchange Act of 1934, as amended (17 CFR 240.13a-15(b) or 240.15d-15(b)). |
| (b) | There were no changes in the registrant’s internal control over financial reporting (as defined in Rule 30a-3(d) under the 1940 Act (17 CFR 270.30a-3(d))) that occurred during the registrant’s second fiscal quarter of the period covered by this report that has materially affected, or is reasonably likely to materially affect, the registrant’s internal control over financial reporting. |
Item 12. Exhibits.
| (a)(1) | Code of Ethics, or any amendment thereto, that is subject of disclosure required by Item 2 is attached hereto. |
| (a)(2) | Certifications pursuant to Rule 30a-2(a) under the 1940 Act and Section 302 of the Sarbanes-Oxley Act of 2002 are attached hereto. |
| (a)(3) | Not applicable. |
| (b) | Certifications pursuant to Rule 30a-2(b) under the 1940 Act and Section 906 of the Sarbanes-Oxley Act of 2002 are attached hereto. |
Table of Contents
SIGNATURES
Pursuant to the requirements of the Securities Exchange Act of 1934 and the Investment Company Act of 1940, the registrant has duly caused this report to be signed on its behalf by the undersigned, thereunto duly authorized.
(Registrant) | Meridian Fund, Inc.® | |||||
| By (Signature and Title)* | /s/ David J. Corkins | |||||
| David J. Corkins | ||||||
| Principal Executive Officer and President | ||||||
| Date | 8/25/16 | |||||
Pursuant to the requirements of the Securities Exchange Act of 1934 and the Investment Company Act of 1940, this report has been signed below by the following persons on behalf of the registrant and in the capacities and on the dates indicated.
| By (Signature and Title)* | /s/ David J. Corkins | |||||
| David J. Corkins | ||||||
| Principal Executive Officer and President | ||||||
| Date | 8/25/16 | |||||
| By (Signature and Title)* | /s/ Derek J. Mullins | |||||
| Derek J. Mullins | ||||||
| Principal Financial Officer and Treasurer | ||||||
| Date | 8/25/16 | |||||
| * | Print the name and title of each signing officer under his or her signature. |