United States
Securities and Exchange Commission
Washington, D.C. 20549
Form N-CSR
Certified Shareholder Report of Registered Management Investment Companies
811-4017
(Investment Company Act File Number)
Federated Equity Funds
(Exact Name of Registrant as Specified in Charter)
Federated Investors Funds
4000 Ericsson Drive
Warrendale, Pennsylvania 15086-7561
(Address of Principal Executive Offices)
(412) 288-1900
(Registrant's Telephone Number)
John W. McGonigle, Esquire
Federated Investors Tower
1001 Liberty Avenue
Pittsburgh, Pennsylvania 15222-3779
(Name and Address of Agent for Service)
(Notices should be sent to the Agent for Service)
Date of Fiscal Year End: 09/30/2010
Date of Reporting Period: 09/30/2010
Item 1. Reports to Stockholders
Federated Clover Small Value Fund(Successor to the Touchstone Diversified Small Cap Value Fund Established 1996)
A Portfolio of Federated Equity Funds
ANNUAL SHAREHOLDER REPORTSeptember 30, 2010
Class A Shares
Class C Shares
FINANCIAL HIGHLIGHTS
SHAREHOLDER EXPENSE EXAMPLE
MANAGEMENT'S DISCUSSION OF FUND PERFORMANCE
PORTFOLIO OF INVESTMENTS SUMMARY TABLE
PORTFOLIO OF INVESTMENTS
STATEMENT OF ASSETS AND LIABILITIES
STATEMENT OF OPERATIONS
STATEMENT OF CHANGES IN NET ASSETS
NOTES TO FINANCIAL STATEMENTS
REPORT OF INDEPENDENT REGISTERED PUBLIC ACCOUNTING FIRM
BOARD OF TRUSTEES AND TRUST OFFICERS
EVALUATION AND APPROVAL OF ADVISORY CONTRACT
VOTING PROXIES ON FUND PORTFOLIO SECURITIES
QUARTERLY PORTFOLIO SCHEDULE
Financial Highlights - Class A Shares
(For a Share Outstanding Throughout Each Period)
| Year Ended September 30, | PeriodEnded
9/30/20071,3,4 |
| 2010 | 20091,2 | 20081,3 |
| Net Asset Value, Beginning of Period | $16.07 | $17.97 | $27.81 | $38.31 |
| Income From Investment Operations: | | | | |
| Net investment income | 0.055 | 0.105 | 0.05 | 0.03 |
| Net realized and unrealized gain (loss) on investments | 2.21 | (1.07) | (2.30) | 0.54 |
| TOTAL FROM INVESTMENT OPERATIONS | 2.26 | (0.97) | (2.25) | 0.57 |
| Less Distributions: | | | | |
| Distributions from net investment income | (0.01) | (0.12) | (0.11) | — |
| Distributions from net realized gain on investments | (0.14) | (0.81) | (7.48) | (11.07) |
| TOTAL DISTRIBUTIONS | (0.15) | (0.93) | (7.59) | (11.07) |
| Net Asset Value, End of Period | $18.18 | $16.07 | $17.97 | $27.81 |
| Total Return6 | 14.16% | (3.41)% | (8.85)% | 1.68% |
| Ratios to Average Net Assets: | | | | |
| Net expenses | 1.31% | 1.45% | 1.45% | 1.28%7 |
| Net investment income | 0.30% | 1.12% | 0.67% | 0.23%7 |
| Expense waiver/reimbursement8 | 0.39% | 0.11% | 4.42% | 0.53%7 |
| Supplemental Data: | | | | |
| Net assets, end of period (000 omitted) | $106,030 | $102,599 | $625 | $205 |
| Portfolio turnover | 72% | 68% | 67% | 79% |
| 1 | Touchstone Diversified Small Cap Value Fund (the “Predecessor Fund”) was reorganized into Federated Clover Small Value Fund (the “Fund”) as of the close of business on August 28, 2009. The Fund is the successor to the Predecessor Fund. The performance information and financial information presented incorporates the operations of the Predecessor Fund, which, as a result of the reorganization, are the Fund's operations. See Note 2 to the Financial Statements. |
| 2 | Beginning with the year ended September 30, 2009, the Fund was audited by KPMG LLP. The previous years were audited by another independent registered public accounting firm. |
| 3 | Due to the reorganization: (1) the number of outstanding shares of the Predecessor Fund decreased by a factor of 1.42; and (2) since the Predecessor Fund's total number of shares outstanding decreased, the net asset value increased. The reorganization did not affect the value of the Predecessor Fund's net assets or each shareholder's proportional ownership interest in those assets. Per share data has been restated, where applicable. |
| 4 | Reflects operations for the period from November 20, 2006 (commencement of operations) to September 30, 2007. |
| 5 | Per share numbers have been calculated using the average shares method. |
| 6 | Based on net asset value, which does not reflect the sales charge, redemption fee or contingent deferred sales charge, if applicable. Total returns for periods of less than one year are not annualized. |
| 7 | Computed on an annualized basis. |
| 8 | This expense decrease is reflected in both the net expense and the net investment income ratios shown above. |
See Notes which are an integral part of the Financial Statements
Annual Shareholder Report1
Financial Highlights - Class C Shares
(For a Share Outstanding Throughout Each Period)
| Year Ended September 30, | PeriodEnded
9/30/20071,3,4 |
| 2010 | 20091,2 | 20081,3 |
| Net Asset Value, Beginning of Period | $16.02 | $17.88 | $27.90 | $38.60 |
| Income From Investment Operations: | | | | |
| Net investment income (loss) | (0.08)5 | 0.015 | (0.01) | (0.06) |
| Net realized and unrealized gain (loss) on investments | 2.19 | (1.01) | (2.44) | 0.43 |
| TOTAL FROM INVESTMENT OPERATIONS | 2.11 | (1.00) | (2.45) | 0.37 |
| Less Distributions: | | | | |
| Distributions from net investment income | — | (0.05) | (0.09) | — |
| Distributions from net realized gain on investments | (0.14) | (0.81) | (7.48) | (11.07) |
| TOTAL DISTRIBUTIONS | (0.14) | (0.86) | (7.57) | (11.07) |
| Net Asset Value, End of Period | $17.99 | $16.02 | $17.88 | $27.90 |
| Total Return6 | 13.28% | (3.64)% | (9.56)% | 1.26% |
| Ratios to Average Net Assets: | | | | |
| Net expenses | 2.06% | 2.20% | 2.20% | 1.86%7 |
| Net investment income (loss) | (0.44)% | 0.08% | (0.09)% | (0.38)%7 |
| Expense waiver/reimbursement8 | 0.39% | 0.93% | 2.19% | — |
| Supplemental Data: | | | | |
| Net assets, end of period (000 omitted) | $7,075 | $5,071 | $619 | $79 |
| Portfolio turnover | 72% | 68% | 67% | 79% |
| 1 | Touchstone Diversified Small Cap Value Fund (the “Predecessor Fund”) was reorganized into Federated Clover Small Value Fund (the “Fund”) as of the close of business on August 28, 2009. The Fund is the successor to the Predecessor Fund. The performance information and financial information presented incorporates the operations of the Predecessor Fund, which, as a result of the reorganization, are the Fund's operations. See Note 2 to the Financial Statements. |
| 2 | Beginning with the year ended September 30, 2009, the Fund was audited by KPMG LLP. The previous years were audited by another independent registered public accounting firm. |
| 3 | Due to the reorganization: (1) the number of outstanding shares of the Predecessor Fund decreased by a factor of 1.42; and (2) since the Predecessor Fund's total number of shares outstanding decreased, the net asset value increased. The reorganization did not affect the value of the Predecessor Fund's net assets or each shareholder's proportional ownership interest in those assets. Per share data has been restated, where applicable. |
| 4 | Reflects operations for the period from November 20, 2006 (commencement of operations) to September 30, 2007. |
| 5 | Per share numbers have been calculated using the average shares method. |
| 6 | Based on net asset value, which does not reflect the sales charge, redemption fee or contingent deferred sales charge, if applicable. Total returns for periods of less than one year are not annualized. |
| 7 | Computed on an annualized basis. |
| 8 | This expense decrease is reflected in both the net expense and the net investment income ratios shown above. |
See Notes which are an integral part of the Financial Statements
Annual Shareholder Report2
Shareholder Expense Example (unaudited)
As a shareholder of the Fund, you incur two types of costs: (1) transaction costs, including sales charges (loads) on purchase or redemption payments; and (2) ongoing costs, including management fees and to the extent applicable, distribution (12b-1) fees and/or shareholder services fees and other Fund expenses. This Example is intended to help you to understand your ongoing costs (in dollars) of investing in the Fund and to compare these costs with the ongoing costs of investing in other mutual funds. It is based on an investment of $1,000 invested at the beginning of the period and held for the entire period from April 1, 2010 to September 30, 2010.
ACTUAL EXPENSES
The first section of the table below provides information about actual account values and actual expenses. You may use the information in this section, together with the amount you invested, to estimate the expenses that you incurred over the period. Simply divide your account value by $1,000 (for example, an $8,600 account value divided by $1,000 = 8.6), then multiply the result by the number in the first section under the heading entitled “Expenses Paid During Period” to estimate the expenses attributable to your investment during this period.
HYPOTHETICAL EXAMPLE FOR COMPARISON PURPOSES
The second section of the table below provides information about hypothetical account values and hypothetical expenses based on the Fund's actual expense ratio and an assumed rate of return of 5% per year before expenses, which is not the Fund's actual return. Thus, you should not use the hypothetical account values and expenses to estimate the actual ending account balance or your expenses for the period. Rather, these figures are required to be provided to enable you to compare the ongoing costs of investing in the Fund with other funds. To do so, compare this 5% hypothetical example with the 5% hypothetical examples that appear in the shareholder reports of the other funds.
Annual Shareholder Report3
Please note that the expenses shown in the table are meant to highlight your ongoing costs only and do not reflect any transaction costs, such as sales charges (loads) on purchase or redemption payments. Therefore, the second section of the table is useful in comparing ongoing costs only, and will not help you determine the relative total costs of owning different funds. In addition, if these transaction costs were included, your costs would have been higher. | Beginning
Account Value
4/1/2010 | Ending
Account Value
9/30/2010 | Expenses Paid
During Period1 |
| Actual: | | | |
| Class A Shares | $1,000 | $1,000.60 | $6.57 |
| Class C Shares | $1,000 | $996.10 | $10.31 |
Hypothetical (assuming a 5% return
before expenses): | | | |
| Class A Shares | $1,000 | $1,018.50 | $6.63 |
| Class C Shares | $1,000 | $1,014.74 | $10.40 |
| 1 | Expenses are equal to the Fund's annualized net expense ratios, multiplied by the average account value over the period, multiplied by 183/365 (to reflect the one-half-year period). The annualized net expense ratios are as follows: |
| Class A Shares | 1.31% |
| Class C Shares | 2.06% |
Annual Shareholder Report4
Performance data quoted represents past performance which is no guarantee of future results. Investment return and principal value will fluctuate so that an investor's shares, when redeemed, may be worth more or less than their original cost. Mutual fund performance changes over time and current performance may be lower or higher than what is stated. For current to the most recent month-end performance and after-tax returns, visit FederatedInvestors.com or call 1-800-341-7400.
Management's Discussion of Fund Performance (unaudited)
For the fiscal year ended September 30, 2010, the Fund produced a total return, based on net asset value, of 14.16% for Class A Shares and 13.28% for Class C Shares. For the same period, the total return for the Russell 2000® Value Index1 (RU2V), a broad-based securities market index, was 11.84%. The Fund's total return for the fiscal year reflected actual cash flows, transaction costs and other expenses which were not reflected in the total return of the RU2V.
The following discussion will focus on the performance of the Fund's
Class A Shares.
MARKET OVERVIEW
The Fund's fiscal year was characterized by see-saw market action driven by alternating waves of encouraging and dispiriting news flow. Reevaluations of the velocity and direction of interest rates, employment, housing, currencies and earnings kept investors paralyzed and largely on the sidelines, and declining market volumes were a symptom of the apathetic mood. During this period, the broad market, as measured by the Standard & Poor's 500 Index (S&P 500),2 managed to return 10.16%. Despite lingering economic woes, the ever-forward-looking stock market took an optimistic turn in September, to finish the period firmly in positive territory.
| 1 | The Russell 2000 Value Index measures the performance of the small-cap value segment of the U.S. equity universe. It includes those Russell 2000 companies with lower price-to-book ratios and lower forecasted growth values. The index is unmanaged, and unlike the Fund, is not affected by cash flows. It is not possible to invest directly in an index. |
| 2 | The S&P 500 Index is an unmanaged capitalization-weighted index of 500 stocks designed to measure performance of the broad domestic economy through changes in the aggregate market value of 500 stocks representing all major industries. The index is unmanaged and, unlike the Fund, is not affected by cash flows. It is not possible to invest directly in an index. |
Annual Shareholder Report5
FUND PERFORMANCE
The key driver of performance for the Fund3 versus the RU2V was strong stock selection across multiple sectors and industries. Particularly strong contributions were derived from the Materials and Health Care sectors. Small sector over- and underweights relative to the RU2V also made a modest positive contribution to performance. Detracting from performance during the reporting period was stock selection within the Information Technology space. The Fund's overall outperformance during this rollercoaster period was also driven by Fund management's focus on deploying capital to inexpensive stocks with improving fundamentals as well as its adherence to risk controls.
Individual stocks that contributed to the Fund's outperformance resided in multiple sectors across the Fund. In the Materials sector, iron ore producer Cliffs Natural Resources benefitted from resurgent demand. In the Information Technology sector, optical components company Finisar Corp. enjoyed improving markets driven by rapid increases in band-width consumption. Within Consumer Staples, The Pantry, Inc., a convenience store operator, benefitted from improving margins in response to operational realignments. Tenneco, an automobile components supplier, produced strong returns as the auto industry continued to regain its footing. The top five positive individual contributors were: United Continental Holdings; Finisar Corp.; Cliffs Natural Resources; Tenneco; and The Pantry, Inc. As referenced earlier, the contribution of individual sector over- and underweights were modest and in total had a small positive impact on overall portfolio performance.
POSITIONING AND STRATEGY
During the reporting period, many of the Fund's stock selections focused on companies with the financial strength to weather today's uncertain environment. The Fund's emphasis on companies with consistent cash flows and strong balance sheets is an integral part of the Adviser's investment process. Across various industries during the fiscal year, adaptations to today's more competitive business environment presented opportunities for stronger companies to bolster their balance sheets and improve their strategic position.
| 3 | Because the Fund invests in smaller companies, it may be more volatile and subject to greater short-term risk than funds that invest in larger companies. Smaller companies may have limited resources, product lines and markets and their securities may trade less frequently and in more limited volumes than securities of larger companies. Value stocks tend to have higher dividends and thus have a higher income-related component in their total return than growth stocks. Value stocks also may lag growth stocks in performance, particularly in late stages of a market advance. |
Annual Shareholder Report6
During the period, the volatility of the broad market presented opportunities for the Fund to purchase companies whose long-term intrinsic value appeared to be underestimated by the market. Fund management observed multiple situations surrounded by fear, uncertainty or adverse news flow which provided opportunities that could be acted upon to the potential benefit of shareholders. Fund management's disciplined approach to evaluating these situations resulted in purchases across multiple sectors within the portfolio.The Fund concluded the fiscal year with small overweights relative to the RU2V in Information Technology and Materials, while being underweight in the Financial Services sector. The Fund's characteristically small sector over- or underweights relative to the RU2V were driven not by economic forecasts; but rather, by the analysts' view of company-specific opportunities within each sector. While the Fund's managers remained cognizant of macroeconomic factors, the investment approach focused primarily on bottom-up, fundamental analysis that sought to construct a well-diversified,4 risk-controlled portfolio.
| 4 | Diversification does not assure a profit nor protect against loss. |
Annual Shareholder Report7
GROWTH OF A $10,000 INVESTMENT - CLASS a SHARES1
The graph below illustrates the hypothetical investment of $10,0002 in the Federated Clover Small Value Fund (the “Fund”) from September 30, 2000 to September 30, 2010, compared to the Russell 2000® Value Index (RU2V).3
| Average Annual Total Returns4 for the Period Ended 9/30/2010 | |
| 1 Year | 7.88% |
| 5 Years | 2.38% |
| 10 Years | 7.69% |
Performance data quoted represents past performance which is no guarantee of future results. Investment return and principal value will fluctuate so that an investor's shares, when redeemed, may be worth more or less than their original cost. Mutual fund performance changes over time and current performance may be lower or higher than what is stated. For current to the most recent month-end performance and after-tax returns, visit FederatedInvestors.com or call 1-800-341-7400. Returns shown do not reflect the deduction of taxes that a shareholder would pay on fund distributions or the redemption of fund shares. Mutual funds are not obligations of or guaranteed by any bank and are not federally insured. Total returns shown include the maximum sales charge of 5.50%.
| 1 | Federated Clover Small Value Fund is the successor to Touchstone Diversified Small Cap Value Fund, a portfolio of Touchstone Funds Group Trust, pursuant to a reorganization that took place as of the close of business on August 28, 2009. The information presented above, for the periods prior to August 28, 2009, is historical information for Touchstone Diversified Small Cap Value Fund. |
| 2 | Represents a hypothetical investment of $10,000 in the Fund after deducting the maximum sales charge of 5.50% ($10,000 investment minus $550 sales charges = $9,450). The Fund's performance assumes the reinvestment of all dividends and distributions. The RU2V has been adjusted to reflect reinvestment of dividends on securities in the index. |
| 3 | The RU2V is not adjusted to reflect sales charges, expenses or other fees that the Securities and Exchange Commission (SEC) requires to be reflected in the Fund's performance. The index is unmanaged, and unlike the Fund, is not affected by cash flows. It is not possible to invest directly in an index. |
| 4 | Total returns quoted reflect all applicable sales charges. |
Annual Shareholder Report8
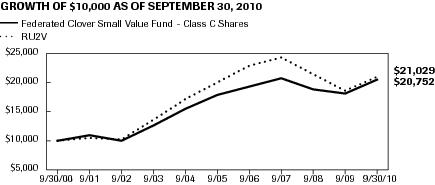
GROWTH OF A $10,000 INVESTMENT - CLASS c SHARES1
The graph below illustrates the hypothetical investment of $10,0002 in the Federated Clover Small Value Fund (the “Fund”) from September 30, 2000 to September 30, 2010, compared to the Russell 2000® Value Index (RU2V).3
| Average Annual Total Returns4 for the Period Ended 9/30/2010 | |
| 1 Year | 12.28% |
| 5 Years | 2.91% |
| 10 Years | 7.57% |
Performance data quoted represents past performance which is no guarantee of future results. Investment return and principal value will fluctuate so that an investor's shares, when redeemed, may be worth more or less than their original cost. Mutual fund performance changes over time and current performance may be lower or higher than what is stated. For current to the most recent month-end performance and after-tax returns, visit FederatedInvestors.com or call 1-800-341-7400. Returns shown do not reflect the deduction of taxes that a shareholder would pay on fund distributions or the redemption of fund shares. Mutual funds are not obligations of or guaranteed by any bank and are not federally insured. Total returns shown include the maximum contingent deferred sales charge of 1.00%.
| 1 | Federated Clover Small Value Fund is the successor to Touchstone Diversified Small Cap Value Fund, a portfolio of Touchstone Funds Group Trust, pursuant to a reorganization that took place as of the close of business on August 28, 2009. The information presented above, for the periods prior to August 28, 2009, is historical information for Touchstone Diversified Small Cap Value Fund. |
| 2 | Represents a hypothetical investment of $10,000 in the Fund. A 1.00% contingent deferred sales charge would be applied in any redemption less than one year from the purchase date. The Fund's performance assumes the reinvestment of all dividends and distributions. The RU2V has been adjusted to reflect reinvestment of dividends on securities in the index. |
| 3 | The RU2V is not adjusted to reflect sales charges, expenses or other fees that the SEC requires to be reflected in the Fund's performance. The index is unmanaged, and unlike the Fund, is not affected by cash flows. It is not possible to invest directly in an index. |
| 4 | Total returns quoted reflect all applicable contingent deferred sales charges. |
Annual Shareholder Report9
Portfolio of Investments Summary Table (unaudited)
At September 30, 2010, the Fund's sector composition1 was as follows:
| Sector Composition | Percentage of
Total Net Assets |
| Financials | 31.8% |
| Industrials | 13.6% |
| Consumer Discretionary | 11.5% |
| Information Technology | 10.2% |
| Energy | 7.2% |
| Materials | 6.6% |
| Utilities | 6.4% |
| Health Care | 4.9% |
| Consumer Staples | 2.8% |
| Cash Equivalents2 | 4.4% |
| Other Assets and Liabilities — Net3 | 0.6% |
| TOTAL | 100.0% |
| 1 | Except for Cash Equivalents and Other Assets and Liabilities, sector classifications are based upon, and individual portfolio securities are assigned to, the classifications of the Global Industry Classification Standard (GICS) except that the Adviser assigns a classification to securities not classified by the GICS and to securities for which the Adviser does not have access to the classification made by the GICS. |
| 2 | Cash Equivalents include any investments in money market mutual funds and/or overnight repurchase agreements. |
| 3 | Assets, other than investments in securities, less liabilities. See Statement of Assets and Liabilities. |
Annual Shareholder Report10
Portfolio of Investments
September 30, 2010
| Shares | | | Value |
| | COMMON STOCKS – 95.0% | |
| | Consumer Discretionary – 11.5% | |
| 77,680 | 1 | Asbury Automotive Group, Inc. | 1,092,958 |
| 107,800 | | bebe stores, Inc. | 777,238 |
| 108,242 | 1 | Build-A-Bear Workshop, Inc. | 654,864 |
| 123,000 | | Callaway Golf Co. | 861,000 |
| 84,435 | | Cooper Tire & Rubber Co. | 1,657,459 |
| 55,575 | | Dillards, Inc., Class A | 1,313,793 |
| 55,150 | | Finish Line, Inc., Class A | 767,137 |
| 224,475 | | Hot Topic, Inc. | 1,344,605 |
| 47,725 | 1 | JAKKS Pacific, Inc. | 841,869 |
| 66,650 | | Jones Apparel Group, Inc. | 1,309,006 |
| 77,400 | 1 | K-Swiss, Inc., Class A | 986,850 |
| 89,900 | 1 | La-Z Boy Chair Co. | 758,756 |
| 51,775 | | Rent-A-Center, Inc. | 1,158,724 |
| 77,735 | | Service Corp. International | 670,076 |
| 51,975 | 1 | Skechers USA, Inc., Class A | 1,220,893 |
| 103,525 | | Spartan Motors, Inc. | 480,356 |
| 37,660 | 1 | Tenneco Automotive, Inc. | 1,091,010 |
| 46,275 | 1 | Volcom, Inc. | 884,778 |
| 329,970 | 1 | Wet Seal, Inc., Class A | 1,118,598 |
| | TOTAL | 18,989,970 |
| | Consumer Staples – 2.8% | |
| 192,275 | 1 | Alliance One International, Inc. | 797,941 |
| 32,945 | | Spartan Stores, Inc. | 477,702 |
| 55,425 | 1 | The Pantry, Inc. | 1,336,297 |
| 42,530 | 1 | TreeHouse Foods, Inc. | 1,960,633 |
| | TOTAL | 4,572,573 |
| | Energy – 7.2% | |
| 82,950 | 1 | Complete Production Services, Inc. | 1,696,328 |
| 10,400 | 1 | Dril-Quip, Inc. | 645,944 |
| 30,075 | 1 | Forest Oil Corp. | 893,228 |
| 110,130 | 1 | Helix Energy Solutions Group, Inc. | 1,226,848 |
| 384,500 | 1 | Kodiak Oil & Gas Corp. | 1,303,455 |
| 93,425 | 1 | Newpark Resources, Inc. | 784,770 |
| 53,725 | | RPC, Inc. | 1,136,821 |
| 27,615 | | SM Energy Co. | 1,034,458 |
Annual Shareholder Report11
| Shares | | | Value |
| 68,675 | 1 | Venoco, Inc. | 1,348,090 |
| 18,875 | 1 | Whiting Petroleum Corp. | 1,802,751 |
| | TOTAL | 11,872,693 |
| | Financials – 31.8% | |
| 85,250 | | Alterra Capital Holdings Ltd. | 1,698,180 |
| 36,040 | | American Campus Communities, Inc. | 1,097,058 |
| 170,900 | | Anworth Mortgage Asset Corp. | 1,218,517 |
| 44,145 | | Ares Capital Corp. | 690,869 |
| 40,358 | | Argo Group International Holdings Ltd. | 1,402,037 |
| 123,325 | | Boston Private Financial Holdings | 806,546 |
| 116,450 | 1 | CNO Financial Group, Inc. | 645,133 |
| 14,925 | | Cash America International, Inc. | 522,375 |
| 37,225 | | City Holding Co. | 1,141,691 |
| 42,180 | | Columbia Banking Systems, Inc. | 828,837 |
| 49,875 | | Delphi Financial Group, Inc., Class A | 1,246,376 |
| 135,775 | 1 | DiamondRock Hospitality Co. | 1,288,505 |
| 78,370 | | Dime Community Bancorp, Inc. | 1,085,424 |
| 33,145 | 1 | E*Trade Group, Inc. | 481,928 |
| 65,375 | | East West Bancorp, Inc. | 1,064,305 |
| 75,350 | | Employers Holdings, Inc. | 1,188,269 |
| 143,920 | | FNB Corp. (PA) | 1,231,955 |
| 86,200 | | First Niagara Financial Group, Inc. | 1,004,230 |
| 74,425 | | First Potomac Realty Trust | 1,116,375 |
| 61,044 | | FirstMerit Corp. | 1,118,326 |
| 93,665 | | Flushing Financial Corp. | 1,082,767 |
| 254,425 | | Hersha Hospitality Trust | 1,317,921 |
| 31,640 | | Highwoods Properties, Inc. | 1,027,351 |
| 18,055 | | Iberiabank Corp. | 902,389 |
| 40,030 | | Independent Bank Corp.- Massachusetts | 901,476 |
| 115,975 | 1 | Knight Capital Group, Inc., Class A | 1,436,930 |
| 53,920 | | LTC Properties, Inc. | 1,376,038 |
| 26,025 | | Lazard Ltd., Class A | 912,957 |
| 216,150 | | Lexington Realty Trust | 1,547,634 |
| 144,160 | | MFA Mortgage Investments, Inc. | 1,099,941 |
| 73,730 | 1 | MGIC Investment Corp. | 680,528 |
| 173,320 | | Maiden Holdings Ltd. | 1,318,965 |
| 70,630 | | Montpelier Re Holdings Ltd. | 1,223,312 |
| 173,010 | | National Penn Bancshares, Inc. | 1,081,312 |
Annual Shareholder Report12
| Shares | | | Value |
| 61,325 | | National Retail Properties, Inc. | 1,539,871 |
| 58,995 | | Newalliance Bancshares, Inc. | 744,517 |
| 49,075 | 1 | Ocwen Financial Corp. | 497,621 |
| 141,800 | | Old National Bancorp | 1,488,900 |
| 66,125 | | Oriental Financial Group | 879,462 |
| 33,410 | | Platinum Underwriters Holdings Ltd. | 1,454,003 |
| 18,971 | | Potlatch Corp. | 645,014 |
| 23,725 | 1 | ProAssurance Corp. | 1,366,323 |
| 27,100 | | Prosperity Bancshares, Inc. | 879,937 |
| 15,200 | 1 | SVB Financial Group | 643,264 |
| 47,760 | | Sun Communities, Inc. | 1,466,232 |
| 45,105 | | Trustmark Corp. | 980,583 |
| 44,225 | | Umpqua Holdings Corp. | 501,512 |
| 59,370 | | Washington Federal, Inc. | 905,986 |
| 50,900 | | Webster Financial Corp. Waterbury | 893,804 |
| 29,100 | | Wintrust Financial Corp. | 943,131 |
| | TOTAL | 52,616,617 |
| | Health Care – 4.9% | |
| 158,660 | 1 | Akorn, Inc. | 640,986 |
| 14,150 | 1 | Amerigroup Corp. | 600,950 |
| 66,740 | 1 | Celera Corp. | 449,828 |
| 16,925 | 1 | Covance, Inc. | 791,921 |
| 25,975 | 1 | Coventry Health Care, Inc. | 559,242 |
| 26,075 | 1 | ICON PLC, ADR | 563,742 |
| 25,480 | 1 | Magellan Health Services, Inc. | 1,203,675 |
| 45,050 | 1 | Merit Medical Systems, Inc. | 715,844 |
| 33,700 | | Omnicare, Inc. | 804,756 |
| 21,030 | 1 | Par Pharmaceutical Cos., Inc. | 611,552 |
| 42,790 | 1 | ViroPharma, Inc. | 637,999 |
| 35,475 | 1 | Wright Medical Group, Inc. | 511,195 |
| | TOTAL | 8,091,690 |
| | Industrials – 13.6% | |
| 154,250 | 1 | Air Transport Services Group Inc. | 939,382 |
| 31,130 | | Ampco-Pittsburgh Corp. | 772,647 |
| 45,375 | | Arkansas Best Corp. | 1,099,436 |
| 62,220 | | Barnes Group, Inc. | 1,094,450 |
| 49,830 | 1 | Ceradyne, Inc. | 1,163,530 |
| 21,385 | | Curtiss Wright Corp. | 647,966 |
Annual Shareholder Report13
| Shares | | | Value |
| 39,160 | | Deluxe Corp. | 749,131 |
| 31,185 | 1 | EnPro Industries, Inc. | 975,467 |
| 27,135 | 1 | Esterline Technologies Corp. | 1,552,936 |
| 24,825 | 1 | Exponent, Inc. | 833,872 |
| 30,500 | | Freightcar America, Inc. | 750,300 |
| 43,900 | 1 | GrafTech International Ltd. | 686,157 |
| 43,025 | 1 | Hub Group, Inc. | 1,258,911 |
| 91,875 | 1 | Interline Brands, Inc. | 1,657,425 |
| 125,075 | 1 | Jet Blue Airways Corp. | 836,752 |
| 91,530 | 1 | Pike Electric Corp. | 666,338 |
| 67,875 | 1 | RailAmerica, Inc. | 653,636 |
| 36,790 | 1 | School Specialty, Inc. | 478,638 |
| 116,550 | | Seaspan Corp. | 1,438,227 |
| 19,350 | 1 | Thomas & Betts Corp. | 793,737 |
| 54,650 | | Tredegar Industries, Inc. | 1,037,257 |
| 13,140 | | Triumph Group, Inc. | 980,113 |
| 32,725 | 1 | UAL Corp. | 773,292 |
| 18,708 | 1 | URS Corp. | 710,530 |
| | TOTAL | 22,550,130 |
| | Information Technology – 10.2% | |
| 15,975 | 1 | Anixter International, Inc. | 862,490 |
| 92,200 | 1 | Arris Group, Inc. | 900,794 |
| 38,090 | | Black Box Corp. | 1,221,166 |
| 33,635 | 1 | CSG Systems International, Inc. | 613,166 |
| 51,570 | | CTS Corp. | 496,103 |
| 85,236 | 1 | Finisar Corp. | 1,601,585 |
| 79,520 | 1 | Insight Enterprises, Inc. | 1,243,693 |
| 39,610 | 1 | j2 Global Communications, Inc. | 942,322 |
| 27,625 | | MTS Systems Corp. | 856,375 |
| 35,510 | 1 | NICE-Systems Ltd., ADR | 1,111,108 |
| 79,200 | 1 | Oplink Communications, Inc. | 1,571,328 |
| 94,520 | 1 | SeaChange International, Inc. | 700,393 |
| 90,360 | 1 | Symmetricom, Inc. | 516,859 |
| 126,200 | | Technitrol, Inc. | 556,542 |
| 43,645 | 1 | Verifone Systems, Inc. | 1,356,050 |
| 32,700 | 1 | ViaSat, Inc. | 1,344,297 |
| 130,200 | 1 | Zoran Corp. | 994,728 |
| | TOTAL | 16,888,999 |
Annual Shareholder Report14
| Shares | | | Value |
| | Materials – 6.6% | |
| 36,445 | 1 | Brush Engineered Materials, Inc. | 1,036,496 |
| 78,775 | 1 | Calgon Carbon Corp. | 1,142,237 |
| 73,175 | 1 | Ferro Corp. | 943,226 |
| 46,475 | 1 | Globe Specialty Metals Inc. | 652,509 |
| 129,825 | 1 | Hecla Mining Co. | 820,494 |
| 36,790 | | Innospec, Inc. | 560,312 |
| 32,625 | | Koppers Holdings, Inc. | 876,634 |
| 15,525 | | Minerals Technologies, Inc. | 914,733 |
| 13,825 | 1 | Molycorp, Inc. | 391,109 |
| 94,910 | | Myers Industries, Inc. | 815,277 |
| 24,880 | 1 | OM Group, Inc. | 749,386 |
| 41,775 | 1 | RTI International Metals | 1,279,150 |
| 62,075 | 1 | Thompson Creek Metals Co., Inc. | 669,168 |
| | TOTAL | 10,850,731 |
| | Utilities – 6.4% | |
| 22,265 | | AGL Resources, Inc. | 854,086 |
| 7,825 | | ITC Holdings Corp. | 487,106 |
| 22,400 | | Idacorp, Inc. | 804,608 |
| 24,720 | | MGE Energy, Inc. | 978,665 |
| 45,900 | | Northwestern Corp. | 1,308,150 |
| 120,875 | | Portland General Electric Co. | 2,451,345 |
| 68,425 | | Questar Corp. | 1,199,490 |
| 101,530 | | Westar Energy, Inc. | 2,460,072 |
| | TOTAL | 10,543,522 |
| | TOTAL COMMON STOCKS
(IDENTIFIED COST $142,344,957) | 156,976,925 |
| | MUTUAL FUND – 4.4% | |
| 7,291,642 | 2,3 | Federated Prime Value Obligations Fund, Institutional Shares, 0.23%
(AT NET ASSET VALUE) | 7,291,642 |
| | TOTAL INVESTMENTS — 99.4%
(IDENTIFIED COST $149,636,599)4 | 164,268,567 |
| | OTHER ASSETS AND LIABILITIES - NET — 0.6%5 | 971,941 |
| | TOTAL NET ASSETS — 100% | $165,240,508 |
| 1 | Non-income producing security. |
| 2 | Affiliated company. |
| 3 | 7-Day net yield. |
| 4 | The cost of investments for federal tax purposes amounts to $151,010,283. |
| 5 | Assets, other than investments in securities, less liabilities. See Statement of Assets and Liabilities. |
Note: The categories of investments are shown as a percentage of total net assets at September 30, 2010.
Annual Shareholder Report15
Various inputs are used in determining the value of the Fund's investments. These inputs are summarized in the three broad levels listed below:
Level 1 — quoted prices in active markets for identical securities
Level 2 — other significant observable inputs (including quoted prices for similar securities, interest rates, prepayment speeds, credit risk, etc.)
Level 3 — significant unobservable inputs (including the Fund's own assumptions in determining the fair value of investments)
The inputs or methodology used for valuing securities are not an indication of the risk associated with investing in those securities.
As of September 30, 2010, all investments of the Fund utilized Level 1 inputs in valuing the Fund's assets carried at fair value.
The following acronym is used throughout this portfolio:
| ADR | — American Depositary Receipt |
See Notes which are an integral part of the Financial Statements
Annual Shareholder Report16
Statement of Assets and Liabilities
September 30, 2010
| Assets: | | |
| Total investments in securities, at value including $7,291,642 of investments in an affiliated issuer (Note 6) (identified cost $149,636,599) | | $164,268,567 |
| Income receivable | | 130,543 |
| Receivable for investments sold | | 3,926,884 |
| Receivable for shares sold | | 1,238,203 |
| TOTAL ASSETS | | 169,564,197 |
| Liabilities: | | |
| Payable for investments purchased | $4,079,812 | |
| Payable for shares redeemed | 128,518 | |
| Payable for Directors'/Trustees' fees | 299 | |
| Payable for distribution services fee (Note 6) | 4,106 | |
| Payable for shareholder services fee (Note 6) | 38,136 | |
| Accrued expenses | 72,818 | |
| TOTAL LIABILITIES | | 4,323,689 |
| Net assets for 9,086,178 shares outstanding | | $165,240,508 |
| Net Assets Consist of: | | |
| Paid-in capital | | $167,632,754 |
| Net unrealized appreciation of investments | | 14,631,968 |
| Accumulated net realized loss on investments | | (17,452,164) |
| Undistributed net investment income | | 427,950 |
| TOTAL NET ASSETS | | $165,240,508 |
| Net Asset Value, Offering Price and Redemption Proceeds Per Share | | |
| Class A Shares: | | |
| Net asset value per share ($106,029,787 ÷ 5,833,132 shares outstanding), no par value, unlimited shares authorized | | $18.18 |
| Offering price per share (100/94.50 of $18.18) | | $19.24 |
| Redemption proceeds per share | | $18.18 |
| Class C Shares: | | |
| Net asset value per share ($7,075,137 ÷ 393,224 shares outstanding), no par value, unlimited shares authorized | | $17.99 |
| Offering price per share | | $17.99 |
| Redemption proceeds per share (99.00/100 of $17.99) | | $17.81 |
| Institutional Shares: | | |
| Net asset value per share ($52,135,584 ÷ 2,859,822 shares outstanding), no par value, unlimited shares authorized | | $18.23 |
| Offering price per share | | $18.23 |
| Redemption proceeds per share | | $18.23 |
See Notes which are an integral part of the Financial Statements
Annual Shareholder Report17
Statement of Operations
Year Ended September 30, 2010
| Investment Income: | | | |
| Dividends (including $9,630 received from an affiliated issuer (Note 6) and net of foreign taxes withheld of $1,573) | | | $2,141,931 |
| Expenses: | | | |
| Investment adviser fee (Note 6) | | $1,186,146 | |
| Administrative personnel and services fee (Note 6) | | 230,000 | |
| Custodian fees | | 28,845 | |
| Transfer and dividend disbursing agent fees and expenses | | 249,795 | |
| Directors'/Trustees' fees | | 1,588 | |
| Auditing fees | | 40,500 | |
| Legal fees | | 4,932 | |
| Portfolio accounting fees | | 69,411 | |
| Distribution services fee — Class C Shares (Note 6) | | 42,954 | |
| Shareholder services fee — Class A Shares (Note 6) | | 246,654 | |
| Shareholder services fee — Class C Shares (Note 6) | | 14,330 | |
| Account administration fee — Class A Shares | | 185 | |
| Share registration costs | | 50,921 | |
| Printing and postage | | 52,346 | |
| Insurance premiums | | 4,527 | |
| Miscellaneous | | 787 | |
| TOTAL EXPENSES | | 2,223,921 | |
| Waivers and Reimbursement (Note 6): | | | |
| Waiver/reimbursement of investment adviser fee | $(472,642) | | |
| Waiver of administrative personnel and services fee | (43,683) | | |
| TOTAL WAIVERS AND REIMBURSEMENT | | (516,325) | |
| Net expenses | | | 1,707,596 |
| Net investment income | | | 434,335 |
| Realized and Unrealized Gain on Investments: | | | |
| Net realized gain on investments | | | 6,346,111 |
| Net change in unrealized appreciation of investments | | | 9,363,073 |
| Net realized and unrealized gain on investments | | | 15,709,184 |
| Change in net assets resulting from operations | | | $16,143,519 |
See Notes which are an integral part of the Financial Statements
Annual Shareholder Report18
Statement of Changes in Net Assets
| Year Ended September 30 | 2010 | 2009 |
| Increase (Decrease) in Net Assets | | |
| Operations: | | |
| Net investment income | $434,335 | $964,464 |
| Net realized gain (loss) on investments | 6,346,111 | (22,889,037) |
| Net change in unrealized appreciation/depreciation of investments | 9,363,073 | 13,402,567 |
| CHANGE IN NET ASSETS RESULTING FROM OPERATIONS | 16,143,519 | (8,522,006) |
| Distributions to Shareholders: | | |
| Distributions from net investment income | | |
| Class A Shares | (33,735) | (810,062) |
| Class C Shares | — | (2,791) |
| Institutional Shares | (22,528) | — |
| Distributions from net realized gain on investments | | |
| Class A Shares | (790,862) | (5,479,391) |
| Class C Shares | (42,004) | (30,402) |
| Institutional Shares | (146,162) | — |
| CHANGE IN NET ASSETS RESULTING FROM DISTRIBUTIONS TO SHAREHOLDERS | (1,035,291) | (6,322,646) |
| Share Transactions: | | |
| Proceeds from sale of shares | 103,114,617 | 17,673,694 |
| Exchange of Successor Fund shares in connection with the tax-free reorganization of Touchstone Diversified Small Cap Value Fund (Note 2) | — | 19,896,773 |
| Net asset value of shares issued to shareholders in payment of distributions declared | 1,013,962 | 6,154,348 |
| Cost of shares redeemed | (70,828,204) | (36,016,916) |
| CHANGE IN NET ASSETS RESULTING FROM SHARE TRANSACTIONS | 33,300,375 | 7,707,899 |
| Change in net assets | 48,408,603 | (7,136,753) |
| Net Assets: | | |
| Beginning of period | 116,831,905 | 123,968,658 |
| End of period (including undistributed net investment income of $427,950 and $49,878, respectively) | $165,240,508 | $116,831,905 |
See Notes which are an integral part of the Financial Statements
Annual Shareholder Report19
Notes to Financial Statements
September 30, 2010
1. ORGANIZATION
Federated Equity Funds (the “Trust”) is registered under the Investment Company Act of 1940, as amended (the “Act”), as an open-end management investment company. The Trust consists of 12 diversified portfolios. The financial statements included herein are only those of Federated Clover Small Value Fund (the “Fund”). The financial statements of the other portfolios are presented separately. The assets of each portfolio are segregated and a shareholder's interest is limited to the portfolio in which shares are held. Each portfolio pays its own expenses. The Fund offers three classes of shares: Class A Shares, Class C Shares and Institutional Shares. All shares of the Fund have equal rights with respect to voting, except on class-specific matters. The financial highlights of the Institutional Shares are presented separately. The investment objective of the Fund is to seek capital appreciation.
2. reorganization
The Fund is the successor (“Successor Fund”) to Touchstone Diversified Small Cap Value Fund (the “Predecessor Fund”), a portfolio of Touchstone Funds Group Trust, pursuant to a reorganization that took place as of the close of business on August 28, 2009. On that date, Class A Shares, Class C Shares and Class Z Shares of the Predecessor Fund were exchanged for Class A Shares, Class C Shares and Class A Shares of the Fund, respectively. As a result of the reorganization on August 28, 2009, the Predecessor Fund became the accounting survivor. Accordingly, the performance information presented in the financial statements for the periods prior to August 28, 2009, is historical information of the Predecessor Fund.
On August 28, 2009, the Fund received a tax-free transfer of assets from Touchstone Diversified Small Cap Value Fund, as follows:
Shares of the
Fund Issued | Touchstone
Diversified Small
Cap Value Fund
Net Assets
Received | Unrealized
Depreciation1 | Net Assets
of the Fund
Immediately
Prior to
Combination | Net Assets
of the Fund
Immediately
After
Combination |
| 6,128,495 | $94,465,611 | $(1,599,031) | $19,896,773 | $114,362,384 |
| 1 | Unrealized depreciation is included in the Touchstone Diversified Small Cap Value Fund Net Assets Received amount shown above. |
On the date of the reorganization, the Successor Fund's net assets included $2,163,853 of net unrealized appreciation.
3. SIGNIFICANT ACCOUNTING POLICIES
The following is a summary of significant accounting policies consistently followed by the Fund in the preparation of its financial statements. These policies are in conformity with U.S. generally accepted accounting principles (GAAP).
Investment Valuation
In calculating its net asset value (NAV), the Fund generally values investments as follows:
- Equity securities listed on an exchange or traded through a regulated market system are valued at their last reported sale price or official closing price in their principal exchange or market.
Annual Shareholder Report20
- Shares of other mutual funds are valued based upon their reported NAVs.
- Fixed-income securities acquired with remaining maturities greater than 60 days are fair valued using price evaluations provided by a pricing service approved by the Board of Trustees (the “Trustees”).
- Fixed-income securities acquired with remaining maturities of 60 days or less are valued at their cost (adjusted for the accretion of any discount or amortization of any premium).
- Derivative contracts listed on exchanges are valued at their reported settlement or closing price.
- Over-the-counter (OTC) derivative contracts are fair valued using price evaluations provided by a pricing service approved by the Trustees.
If the Fund cannot obtain a price or price evaluation from a pricing service for an investment, the Fund may attempt to value the investment based upon the mean of bid and asked quotations or fair value the investment based on price evaluations, from one or more dealers. If any price, quotation, price evaluation or other pricing source is not readily available when the NAV is calculated, the Fund uses the fair value of the investment determined in accordance with the procedures described below. There can be no assurance that the Fund could purchase or sell an investment at the price used to calculate the Fund's NAV.
Fair Valuation and Significant Events Procedures
The Trustees have authorized the use of pricing services to provide evaluations of the current fair value of certain investments for purposes of calculating the NAV. Factors considered by pricing services in evaluating an investment include the yields or prices of investments of comparable quality, coupon, maturity, call rights and other potential prepayments, terms and type, reported transactions, indications as to values from dealers and general market conditions. Some pricing services provide a single price evaluation reflecting the bid-side of the market for an investment (a “bid” evaluation). Other pricing services offer both bid evaluations and price evaluations indicative of a price between the prices bid and asked for the investment (a “mid” evaluation). The Fund normally uses bid evaluations for U.S. Treasury and Agency securities, mortgage-backed securities and municipal securities. The Fund normally uses mid evaluations for other types of fixed-income securities and OTC derivative contracts. In the event that market quotations and price evaluations are not available for an investment, the fair value of the investment is determined in accordance with procedures adopted by the Trustees.
The Trustees also have adopted procedures requiring an investment to be priced at its fair value whenever the Adviser determines that a significant event affecting the value of the investment has occurred between the time as of which the price of the investment would otherwise be determined and the time as of which the NAV is computed. An event is considered significant if there is both an affirmative expectation that the investment's value will change in response to the event and a reasonable basis for quantifying the resulting change in value. Examples of significant events that may occur after the close of the principal market on which a security is traded, or after the time of a price evaluation provided by a pricing service or a dealer, include:
- With respect to securities traded in foreign markets, significant trends in U.S. equity markets or in the trading of foreign securities index futures or options contracts;
- With respect to price evaluations of fixed-income securities determined before the close of regular trading on the NYSE, actions by the Federal Reserve Open Market Committee and other significant trends in U.S. fixed-income markets;
Annual Shareholder Report21
- Political or other developments affecting the economy or markets in which an issuer conducts its operations or its securities are traded; and
- Announcements concerning matters such as acquisitions, recapitalizations, litigation developments, a natural disaster affecting the issuer's operations or regulatory changes or market developments affecting the issuer's industry.
The Trustees have approved the use of a pricing service to determine the fair value of equity securities traded principally in foreign markets when the Adviser determines that there has been a significant trend in the U.S. equity markets or in index futures trading. For other significant events, the Fund may seek to obtain more current quotations or price evaluations from alternative pricing sources. If a reliable alternative pricing source is not available, the Fund will determine the fair value of the investment using another method approved by the Trustees.
Investment Income, Gains and Losses, Expenses and Distributions
Investment transactions are accounted for on a trade-date basis. Realized gains and losses from investment transactions are recorded on an identified-cost basis. Interest income and expenses are accrued daily. Dividend income and distributions to shareholders are recorded on the ex-dividend date. Foreign dividends are recorded on the ex-dividend date or when the Fund is informed of the ex-dividend date. Distributions of net investment income are declared and paid annually. Non-cash dividends included in dividend income, if any, are recorded at fair value. Investment income, realized and unrealized gains and losses, and certain fund-level expenses are allocated to each class based on relative average daily net assets, except that each class may bear certain expenses unique to that class such as account administration, distribution services and shareholder services fees. Dividends are declared separately for each class. No class has preferential dividend rights; differences in per share dividend rates are generally due to differences in separate class expenses.
Premium and Discount Amortization
All premiums and discounts on fixed-income securities are amortized/accreted for financial statement purposes.
Federal Taxes
It is the Fund's policy to comply with the Subchapter M provision of the Internal Revenue Code (the “Code”) and to distribute to shareholders each year substantially all of its income. Accordingly, no provision for federal income tax is necessary. As of and during the year ended September 30, 2010, the Fund did not have a liability for any uncertain tax positions. The Fund recognizes interest and penalties, if any, related to tax liabilities as income tax expense in the Statement of Operations. As of September 30, 2010, tax years 2009 and 2010 remain subject to examination by the Fund's major tax jurisdictions, which include the United States of America and the Commonwealth of Massachusetts.
The Fund may be subject to taxes imposed by governments of countries in which it invests. Such taxes are generally based on either income or gains earned or repatriated. The Fund accrues and applies such taxes to net investment income, net realized gains and net unrealized gains as income and/or gains are earned.
Annual Shareholder Report22
When-Issued and Delayed Delivery TransactionsThe Fund may engage in when-issued or delayed delivery transactions. The Fund records when-issued securities on the trade date and maintains security positions such that sufficient liquid assets will be available to make payment for the securities purchased. Securities purchased on a when-issued or delayed delivery basis are marked to market daily and begin earning interest on the settlement date. Losses may occur on these transactions due to changes in market conditions or the failure of counterparties to perform under the contract.
Securities Lending
The Fund participates in a securities lending program providing for the lending of equity securities to qualified brokers. The Fund normally receives cash collateral for securities loaned that is invested in an affiliated money market fund or short-term securities including repurchase agreements. Collateral is maintained at a minimum level of 100% of the market value of investments loaned, plus interest, if applicable. In accordance with the Fund's securities lending agreement, the market value of securities on loan is determined each day at the close of business and any additional collateral required to cover the value of securities on loan is delivered to the Fund on the next business day. Earnings on collateral are allocated between the securities lending agent, as a fee for its services under the program, and the Fund, according to agreed-upon rates.
As of September 30, 2010, the Fund had no outstanding securities on loan.
Other
The preparation of financial statements in conformity with GAAP requires management to make estimates and assumptions that affect the amounts of assets, liabilities, expenses and revenues reported in the financial statements. Actual results could differ from those estimated.
4. SHARES OF BENEFICIAL INTEREST
The following tables summarize share activity:
| Year Ended September 30 | 2010 | 2009 |
| Class A Shares: | Shares | Amount | Shares | Amount |
| Shares sold | 2,991,044 | $52,885,211 | 411,102 | $4,295,554 |
| Transfer in Class Z Shares1 | — | — | 8,469,843 | 116,130,888 |
| Shares issued to shareholders in payment of distributions declared | 51,050 | 807,289 | 21,333 | 176,843 |
| Exchange of Successor Fund shares in connection with the tax-free reorganization of Touchstone Diversified Small Cap Value Fund | — | — | 511,629 | 7,886,533 |
Adjustment of Predecessor Fund
shares in connection with
tax-free reorganization | — | — | (2,538,389) | — |
| Shares redeemed | (3,594,710) | (62,243,784) | (539,185) | (6,137,710) |
NET CHANGE RESULTING
FROM CLASS A
SHARE TRANSACTIONS | (552,616) | $(8,551,284) | 6,336,333 | $122,352,108 |
Annual Shareholder Report23
| Year Ended September 30 | 2010 | 2009 |
| Class C Shares: | Shares | Amount | Shares | Amount |
| Shares sold | 203,409 | $3,613,984 | 42,358 | $394,233 |
| Shares issued to shareholders in payment of distributions declared | 2,433 | 38,222 | 1,978 | 16,109 |
| Exchange of Successor Fund shares in connection with the tax-free reorganization of Touchstone Diversified Small Cap Value Fund | — | — | 264,944 | 4,073,170 |
Adjustment of Predecessor Fund
shares in connection with
tax-free reorganization | — | — | (25,050) | — |
| Shares redeemed | (129,220) | (2,191,574) | (17,176) | (215,460) |
NET CHANGE RESULTING
FROM CLASS C
SHARE TRANSACTIONS | 76,622 | $1,460,632 | 267,054 | $4,268,052 |
| Year Ended
9/30/2010 | Period Ended
9/30/20092 |
| Institutional Shares: | Shares | Amount | Shares | Amount |
| Shares sold | 2,654,753 | $46,615,422 | 54,875 | $885,430 |
| Exchange of Successor Fund shares in connection with the tax-free reorganization of Touchstone Diversified Small Cap Value Fund | — | — | 514,618 | 7,937,070 |
| Shares issued to shareholders in payment of distributions declared | 10,582 | 168,451 | — | — |
| Shares redeemed | (375,006) | (6,392,846) | — | — |
NET CHANGE RESULTING
FROM INSTITUTIONAL
SHARE TRANSACTIONS | 2,290,329 | $40,391,027 | 569,493 | $8,822,500 |
| Year Ended September 30 | 2010 | 2009 |
| Class Z Shares:1 | Shares | Amount | Shares | Amount |
| Shares sold | — | $ — | 1,326,917 | $12,098,477 |
| Shares issued to shareholders in payment of distributions declared | — | — | 720,122 | 5,961,396 |
| Shares redeemed | — | — | (3,299,698) | (29,663,746) |
NET CHANGE RESULTING
FROM CLASS Z
SHARE TRANSACTIONS | — | $ — | (1,252,659) | $(11,603,873) |
FINAL REDEMPTION
FROM CLASS Z SHARES | — | $ — | (8,469,843) | $(116,130,888) |
NET CHANGE RESULTING
FROM TOTAL FUND
SHARE TRANSACTIONS | 1,814,335 | $33,300,375 | (2,549,622) | $7,707,899 |
| 1 | At the close of business on August 28, 2009, Class Z Shares were reorganized into Class A Shares. |
| 2 | Reflects operations for the period from August 29, 2009 (deemed the date of initial investment, pursuant to a reorganization that took place on August 28, 2009) to September 30, 2009. |
Annual Shareholder Report24
5. FEDERAL TAX INFORMATION
The tax character of distributions as reported on the Statement of Changes in Net Assets for the years ended September 30, 2010 and 2009, was as follows:
| 2010 | 2009 |
| Ordinary income1 | $1,035,291 | $812,853 |
| Long-term capital gains | $ — | $5,509,793 |
| 1 | For tax purposes, short-term capital gain distributions are considered ordinary income distributions. |
As of September 30, 2010, the components of distributable earnings on a tax basis were as follows:
| Undistributed ordinary income | $427,950 |
| Net unrealized appreciation | $13,258,284 |
| Capital loss carryforwards | $(16,078,480) |
The difference between book-basis and tax-basis net unrealized appreciation/depreciation is attributable in part to differing treatments for the deferral of losses on wash sales and REIT adjustments.
At September 30, 2010, the cost of investments for federal tax purposes was $151,010,283. The net unrealized appreciation of investments for federal tax purposes was $13,258,284. This consists of net unrealized appreciation from investments for those securities having an excess of value over cost of $21,186,947 and net unrealized depreciation from investments for those securities having an excess of cost over value of $7,928,663.
At September 30, 2010, the Fund had a capital loss carryforward of $16,078,480 which will reduce the Fund's taxable income arising from future net realized gains on investments, if any, to the extent permitted by the Code and thus will reduce the amount of distributions to shareholders which would otherwise be necessary to relieve the Fund of any liability for federal income tax. Pursuant to the Code, such capital loss carryforward will expire in 2017.
As a result of the tax-free transfer of assets from Touchstone Diversified Small Cap Value Fund, the use of certain capital loss carryforwards listed above may be limited.
The Fund used capital loss carryforwards of $5,437,692 to offset taxable capital gains realized during the year ended September 30, 2010.
6. INVESTMENT ADVISER FEE AND OTHER TRANSACTIONS WITH AFFILIATES
Investment Adviser Fee
Federated Global Investment Management Corporation is the Fund's investment adviser (the “Adviser”). The advisory agreement between the Fund and the Adviser provides for an annual fee equal to 0.90% of the Fund's average daily net assets. Subject to the terms described in the Expense Limitation note, the Adviser may voluntarily choose to waive any portion of its fee. For the year ended September 30, 2010, the Adviser voluntarily waived $467,306 of its fee.
Prior to close of business on August 28, 2009, the Predecessor Fund's investment adviser was Touchstone Advisors, Inc. After the close of business on August 28, 2009, the Predecessor Fund was reorganized into the Fund. The annual investment adviser fee did not change due to this reorganization.
Annual Shareholder Report25
Administrative FeeFederated Administrative Services (FAS), under the Administrative Services Agreement, provides the Fund with administrative personnel and services. The fee paid to FAS is based on the average aggregate daily net assets of certain Federated funds as specified below:
| Administrative Fee | Average Aggregate Daily Net Assets
of the Federated Funds |
| 0.150% | on the first $5 billion |
| 0.125% | on the next $5 billion |
| 0.100% | on the next $10 billion |
| 0.075% | on assets in excess of $20 billion |
The administrative fee received during any fiscal year shall be at least $150,000 per portfolio and $40,000 per each additional class of Shares. Subject to the terms described in the Expense Limitation note, FAS may voluntarily choose to waive any portion of its fee. For the year ended September 30, 2010, the net fee paid to FAS was 0.141% of average daily net assets of the Fund. FAS waived $43,683 of its fee.
Prior to close of business on August 28, 2009, Touchstone Advisors, Inc. provided administrative services to the Predecessor Fund.
Distribution Services Fee
The Fund has adopted a Distribution Plan (the “Plan”) pursuant to Rule 12b-1 under the Act. Under the terms of the Plan, the Fund will compensate Federated Securities Corp. (FSC), the principal distributor, from the daily net assets of the Fund's Class A Shares and Class C Shares to finance activities intended to result in the sale of these shares. The Plan provides that the Fund may incur distribution expenses at the following percentages of average daily net assets annually, to compensate FSC:
| Share Class Name | Percentage of Average Daily
Net Assets of Class |
| Class A Shares | 0.05% |
| Class C Shares | 0.75% |
Subject to the terms described in the Expense Limitation note, FSC may voluntarily choose to waive any portion of its fee. When FSC receives fees, it may pay some or all of them to financial intermediaries whose customers purchase shares. For the year ended September 30, 2010, FSC retained $320 of fees paid by the Fund. For the year ended September 30, 2010, the Fund's Class A Shares did not incur a distribution services fee; however, it may begin to incur this fee upon approval of the Trustees.
Prior to close of business on August 28, 2009, Touchstone Securities, Inc., was the principal distributor for the Predecessor Fund.
Sales Charges
Front-end sales charges and contingent deferred sales charges (CDSC) do not represent expenses of the Fund. They are deducted from the proceeds of sales of Fund shares prior to investment or from redemption proceeds prior to remittance, as applicable. For the year ended September 30, 2010, FSC retained $13,936 in sales charges from the sale of Class A Shares. FSC also retained $174 of CDSC relating to redemptions of Class C Shares.
Annual Shareholder Report26
Shareholder Services FeeThe Fund may pay fees (“Service Fees”) up to 0.25% of the average daily net assets of the Fund's Class A Shares and Class C Shares to financial intermediaries or to Federated Shareholder Services Company (FSSC) for providing services to shareholders and maintaining shareholder accounts. Subject to the terms described in the Expense Limitation note, FSSC may voluntarily reimburse the Fund for Service Fees. For the year ended September 30, 2010, FSSC received $38,040 of fees paid by the Fund.
Prior to close of business on August 28, 2009, Touchstone Securities, Inc., received Service Fees from the Predecessor Fund.
Expense Limitation
Effective December 1, 2010, the Adviser and its affiliates (which may include FSC, FAS and FSSC) have voluntarily agreed to waive their fees and/or reimburse expenses so that the total annual fund operating expenses (as shown in the financial highlights) paid by the Fund's Class A Shares, Class C Shares and Institutional Shares (after the voluntary waivers and reimbursements) will not exceed 1.26%, 2.01% and 1.01% (the “Fee Limit”), respectively, through the later of (the “Termination Date”): (a) November 30, 2011; or (b) the date of the Fund's next effective Prospectus. While the Adviser and its affiliates currently do not anticipate terminating or increasing these arrangements prior to the Termination Date, these arrangements may only be terminated or the Fee Limit increased prior to the Termination Date with the agreement of the Trustees.
General
Certain Officers and Trustees of the Fund are Officers and Directors or Trustees of the above companies.
Transactions with Affiliated Companies
Affiliated holdings are mutual funds which are managed by the Adviser or an affiliate of the Adviser. The Adviser has agreed to reimburse the Fund for certain investment adviser fees as a result of transactions in other affiliated mutual funds. For the year ended September 30, 2010, the Adviser reimbursed $5,336. Transactions with the affiliated company during the year ended September 30, 2010, were as follows:
| Affiliate | Balance of
Shares Held
9/30/2009 | Purchases/
Additions | Sales/
Reductions | Balance of
Shares Held
9/30/2010 | Value | Dividend
Income |
| Federated Prime Value Obligations Fund, Institutional Shares | 3,636,312 | 75,708,421 | 72,053,091 | 7,291,642 | $7,291,642 | $9,630 |
7. Investment TRANSACTIONS
Purchases and sales of investments, excluding long-term U.S. government securities and short-term obligations, for the year ended September 30, 2010, were as follows:
| Purchases | $120,907,008 |
| Sales | $91,534,267 |
Annual Shareholder Report27
8. LINE OF CREDIT
The Fund participates in a $100,000,000 unsecured, uncommitted revolving line of credit (LOC) agreement with PNC Bank. The LOC was made available for extraordinary or emergency purposes, primarily for financing redemption payments. Borrowings are charged interest at a rate offered to the Fund by PNC Bank at the time of the borrowing. As of September 30, 2010, there were no outstanding loans. During the year ended September 30, 2010, the Fund did not utilize the LOC.
9. INTERFUND LENDING
Pursuant to an Exemptive Order issued by the Securities and Exchange Commission, the Fund, along with other funds advised by subsidiaries of Federated Investors, Inc., may participate in an interfund lending program. This program provides an alternative credit facility allowing the Fund to borrow from other participating affiliated funds. As of September 30, 2010, there were no outstanding loans. During the year ended September 30, 2010, the program was not utilized.
10. Legal Proceedings
Since February, 2004, Federated Investors, Inc. and related entities (collectively, “Federated”), have been named as defendants in several lawsuits that are now pending in the United States District Court for the Western District of Pennsylvania. These lawsuits have been consolidated into a single action alleging excessive advisory fees involving one of the Federated-sponsored mutual funds (“Federated Funds”). Federated and its counsel have been defending this litigation. Additional lawsuits based upon similar allegations may be filed in the future. The potential impact of these lawsuits, all of which seek monetary damages, attorneys' fees and expenses, and future potential similar suits is uncertain. Although we do not believe that these lawsuits will have a material adverse effect on the Federated Funds, there can be no assurance that these suits, ongoing adverse publicity and/or other developments resulting from the allegations in these matters will not result in increased redemptions, or reduced sales, of shares of the Federated Funds or other adverse consequences for the Federated Funds.
11. Subsequent events
Management has evaluated subsequent events through the date the financial statements were issued, and determined that no events have occurred that require additional disclosure.
12. FEDERAL TAX INFORMATION (UNAUDITED)
For the fiscal year ended September 30, 2010, 100.0% of total income (including short-term capital gain) distributions made by the Fund are qualifying dividends which may be subject to a maximum tax rate of 15%, as provided for by the Jobs and Growth Tax Relief Act of 2003. Complete information is reported in conjunction with the reporting of your distributions on Form 1099-DIV.
Of the ordinary income (including short-term capital gain) distributions made by the Fund during the year ended September 30, 2010, 100.0% qualify for the dividend received deduction available to corporate shareholders.
Annual Shareholder Report28
Report of Independent Registered Public Accounting Firm
TO THE BOARD OF TRUSTEES OF THE FEDERATED EQUITY FUNDS AND SHAREHOLDERS OF Federated clover small value fund:
We have audited the accompanying statement of assets and liabilities, including the portfolio of investments, of the Federated Clover Small Value Fund (the “Fund”), a portfolio of Federated Equity Funds, as of September 30, 2010, and the related statement of operations for the year then ended, the statements of changes in net assets for each of the years or periods in the two-year period then ended, and the financial highlights for each of the years or periods in the two-year period then ended. These financial statements and financial highlights are the responsibility of the Fund's management. Our responsibility is to express an opinion on these financial statements and financial highlights based on our audits. The financial highlights for the periods presented prior to October 1, 2008, were audited by other independent registered public accountants whose report thereon dated November 25, 2008, expressed an unqualified opinion on those statements.
We conducted our audits in accordance with the standards of the Public Company Accounting Oversight Board (United States). Those standards require that we plan and perform the audit to obtain reasonable assurance about whether the financial statements and financial highlights are free of material misstatement. An audit includes examining, on a test basis, evidence supporting the amounts and disclosures in the financial statements. Our procedures included confirmation of securities owned as of September 30, 2010, by correspondence with the custodian, transfer agent and brokers, or by other appropriate auditing procedures. An audit also includes assessing the accounting principles used and significant estimates made by management, as well as evaluating the overall financial statement presentation. We believe that our audits provide a reasonable basis for our opinion.
In our opinion, the financial statements and financial highlights referred to above present fairly, in all material respects, the financial position of the Federated Clover Small Value Fund as of September 30, 2010, and the results of its operations for the year then ended, the changes in its net assets for the two years or periods in the period then ended, and the financial highlights for each of the years or periods in the two-year period then ended, in conformity with U.S. generally accepted accounting principles.
Boston, Massachusetts
November 22, 2010
Annual Shareholder Report29
Board of Trustees and Trust Officers
The Board of Trustees is responsible for managing the Trust's business affairs and for exercising all the Trust's powers except those reserved for the shareholders. The following tables give information about each Trustee and the senior officers of the Fund. Where required, the tables separately list Trustees who are “interested persons” of the Fund (i.e., “Interested” Trustees) and those who are not (i.e., “Independent” Trustees). Unless otherwise noted, the address of each person listed is Federated Investors Tower, 1001 Liberty Avenue, Pittsburgh, PA 15222. The address of all Independent Trustees listed is 4000 Ericsson Drive, Warrendale, PA 15086-7561; Attention: Mutual Fund Board. As of December 31, 2009, the Trust comprised 13 portfolio(s), and the Federated Fund Family consisted of 43 investment companies (comprising 145 portfolios). Unless otherwise noted, each Officer is elected annually. Unless otherwise noted, each Trustee oversees all portfolios in the Federated Fund Family and serves for an indefinite term. The Fund's Statement of Additional Information includes additional information about Trust Trustees and is available, without charge and upon request, by calling 1-800-341-7400.
Interested TRUSTEES Background
Name
Birth Date
Positions Held with Trust
Date Service Began | Principal Occupation(s) for Past Five Years,
Other Directorships Held and Previous Position(s) |
John F. Donahue*
Birth Date: July 28, 1924
Trustee
Began serving: April 1984 | Principal Occupations: Director or Trustee of the Federated Fund Family; Chairman and Director, Federated Investors, Inc.; Chairman of the Federated Fund Family's Executive Committee.
Previous Positions: Chairman of the Federated Fund Family; Trustee, Federated Investment Management Company; Chairman and Director, Federated Investment Counseling. |
J. Christopher Donahue*
Birth Date: April 11, 1949
President and Trustee
Began serving: January 2000 | Principal Occupations: Principal Executive Officer and President of the Federated Fund Family; Director or Trustee of some of the Funds in the Federated Fund Family; President, Chief Executive Officer and Director, Federated Investors, Inc.; Chairman and Trustee, Federated Investment Management Company; Trustee, Federated Investment Counseling; Chairman and Director, Federated Global Investment Management Corp.; Chairman, Federated Equity Management Company of Pennsylvania and Passport Research, Ltd. (investment advisory subsidiary of Federated); Trustee, Federated Shareholder Services Company; Director, Federated Services Company.
Previous Positions: President, Federated Investment Counseling; President and Chief Executive Officer, Federated Investment Management Company, Federated Global Investment Management Corp. and Passport Research, Ltd. |
| * | Family relationships and reasons for “interested” status: John F. Donahue is the father of J. Christopher Donahue; both are “interested” due to their beneficial ownership of shares of Federated Investors, Inc. and the positions they hold with Federated and its subsidiaries. |
Annual Shareholder Report30
INDEPENDENT TRUSTEES Background
Name
Birth Date
Positions Held with Trust
Date Service Began | Principal Occupation(s) for Past Five Years,
Other Directorships Held, Previous Position(s) and Qualifications |
John T. Conroy, Jr., Ph.D.
Birth Date: June 23, 1937
Trustee
Began serving: November 1991 | Principal Occupations: Director or Trustee of the Federated Fund Family; Chairman of the Board, Investment Properties Corporation; Partner or Trustee in private real estate ventures in Southwest Florida; Assistant Professor in Theology, Blessed Edmund Rice School for Pastoral Ministry.
Previous Positions: President, Investment Properties Corporation; Senior Vice President, John R. Wood and Associates, Inc., Realtors; President, Naples Property Management, Inc. and Northgate Village Development Corporation.
Qualifications: Business management and director experience. |
Nicholas P. Constantakis, CPA
Birth Date: September 3, 1939
Trustee
Began serving: February 1998 | Principal Occupation: Director or Trustee of the Federated Fund Family.
Other Directorship Held: Director and Chairman of the Audit Committee, Michael Baker Corporation (architecture, engineering and construction services).
Previous Position: Partner, Andersen Worldwide SC.
Qualifications: Public accounting and director experience. |
John F. Cunningham
Birth Date: March 5, 1943
Trustee
Began serving: January 1999 | Principal Occupation: Director or Trustee of the Federated Fund Family.
Other Directorships Held: Chairman, President and Chief Executive Officer, Cunningham & Co., Inc. (strategic business consulting); Trustee Associate, Boston College.
Previous Positions: Director, Redgate Communications and EMC Corporation (computer storage systems); Chairman of the Board and Chief Executive Officer, Computer Consoles, Inc.; President and Chief Operating Officer, Wang Laboratories; Director, First National Bank of Boston; Director, Apollo Computer, Inc.
Qualifications: Business management and director experience. |
Maureen Lally-Green
Birth Date: July 5, 1949
Trustee
Began serving: August 2009 | Principal Occupations: Director or Trustee of the Federated Fund Family; Director, Office of Church Relations, Diocese of Pittsburgh; Adjunct Professor of Law, Duquesne University School of Law.
Other Directorships Held: Trustee, St. Francis University; Director, Ireland Institute of Pittsburgh; Director, UPMC Mercy Hospital; Regent, St. Vincent Seminary; Director, Epilepsy Foundation of Western and Central Pennsylvania; Director, Saint Thomas More Society, Allegheny County; Director, Carlow University.
Previous Position: Pennsylvania Superior Court Judge.
Qualifications: Legal and director experience. |
Annual Shareholder Report31
Name
Birth Date
Positions Held with Trust
Date Service Began | Principal Occupation(s) for Past Five Years,
Other Directorships Held, Previous Position(s) and Qualifications |
Peter E. Madden
Birth Date: March 16, 1942
Trustee
Began serving: November 1991 | Principal Occupation: Director or Trustee, and Chairman of the Board of Directors or Trustees, of the Federated Fund Family.
Other Directorship Held: Board of Overseers, Babson College.
Previous Positions: Representative, Commonwealth of Massachusetts General Court; President, Chief Operating Officer and Director, State Street Bank and Trust Company and State Street Corporation (retired); Director, VISA USA and VISA International; Chairman and Director, Massachusetts Bankers Association; Director, Depository Trust Corporation; Director, The Boston Stock Exchange.
Qualifications: Business management, mutual fund services and director experience. |
Charles F. Mansfield, Jr.
Birth Date: April 10, 1945
Trustee
Began serving: January 1999 | Principal Occupations: Director or Trustee and Chairman of the Audit Committee of the Federated Fund Family; Management Consultant.
Previous Positions: Chief Executive Officer, PBTC International Bank; Partner, Arthur Young & Company (now Ernst & Young LLP); Chief Financial Officer of Retail Banking Sector, Chase Manhattan Bank; Senior Vice President, HSBC Bank USA (formerly, Marine Midland Bank); Vice President, Citibank; Assistant Professor of Banking and Finance, Frank G. Zarb School of Business, Hofstra University; Executive Vice President, DVC Group, Inc. (marketing, communications and technology).
Qualifications: Banking, business management, public accounting and director experience. |
R. James Nicholson
Birth Date: February 4, 1938
Trustee
Began serving: January 2008 | Principal Occupations: Director or Trustee of the Federated Fund Family; Senior Counsel, Brownstein Hyatt Farber Schrek, P.C.; Former Secretary of the U.S. Dept. of Veterans Affairs; Former U.S. Ambassador to the Holy See; Former Chairman of the Republican National Committee.
Other Directorships Held: Director, Horatio Alger Association; Director, The Daniels Fund.
Previous Positions: Colonel, U.S. Army Reserve; Partner, Calkins, Kramer, Grimshaw and Harring, P.C.; General Counsel, Colorado Association of Housing and Building; Chairman and CEO, Nicholson Enterprises, Inc. (real estate holding company); Chairman and CEO, Renaissance Homes of Colorado.
Qualifications: Legal, government, business management and mutual fund director experience. |
Annual Shareholder Report32
Name
Birth Date
Positions Held with Trust
Date Service Began | Principal Occupation(s) for Past Five Years,
Other Directorships Held, Previous Position(s) and Qualifications |
Thomas M. O'Neill
Birth Date: June 14, 1951
Trustee
Began serving: October 2006 | Principal Occupations: Director or Trustee of the Federated Fund Family; Sole Proprietor, Navigator Management Company (investment and strategic consulting).
Other Directorships Held: Board of Overseers, Children's Hospital of Boston; Visiting Committee on Athletics, Harvard College.
Previous Positions: Chief Executive Officer and President, Managing Director and Chief Investment Officer, Fleet Investment Advisors; President and Chief Executive Officer, Aeltus Investment Management, Inc.; General Partner, Hellman, Jordan Management Co., Boston, MA; Chief Investment Officer, The Putnam Companies, Boston, MA; Credit Analyst and Lending Officer, Fleet Bank; Director and Consultant, EZE Castle Software (investment order management software); Director, Midway Pacific (lumber).
Qualifications: Business management, mutual fund, director and investment experience. |
John S. Walsh
Birth Date: November 28, 1957
Trustee
Began serving: January 1999 | Principal Occupations: Director or Trustee of the Federated Fund Family; President and Director, Heat Wagon, Inc. (manufacturer of construction temporary heaters); President and Director, Manufacturers Products, Inc. (distributor of portable construction heaters); President, Portable Heater Parts, a division of Manufacturers Products, Inc.
Previous Position: Vice President, Walsh & Kelly, Inc.
Qualifications: Business management and director experience. |
James F. Will
Birth Date: October 12, 1938
Trustee
Began serving: April 2006 | Principal Occupations: Director or Trustee of the Federated Fund Family; formerly, Vice Chancellor and President, Saint Vincent College.
Other Directorships Held: Trustee, Saint Vincent College; Director, Alleghany Corporation; Trustee, Wheeling Jesuit University; Director, Liberty Tire Recycling.
Previous Positions: Chairman, President and Chief Executive Officer, Armco, Inc.; President and Chief Executive Officer, Cyclops Industries; President and Chief Operating Officer, Kaiser Steel Corporation.
Qualifications: Business management, education and director experience. |
Annual Shareholder Report33
OFFICERS
Name
Birth Date
Address
Positions Held with Trust
Date Service Began | Principal Occupation(s) for Past Five Years
and Previous Position(s) |
John W. McGonigle
Birth Date: October 26, 1938
EXECUTIVE VICE PRESIDENT AND SECRETARY
Began serving: April 1984 | Principal Occupations: Executive Vice President and Secretary of the Federated Fund Family; Vice Chairman, Executive Vice President, Secretary and Director, Federated Investors, Inc.
Previous Positions: Trustee, Federated Investment Management Company and Federated Investment Counseling; Director, Federated Global Investment Management Corp., Federated Services Company and Federated Securities Corp. |
Richard A. Novak
Birth Date: December 25, 1963
TREASURER
Began serving: January 2006 | Principal Occupations: Principal Financial Officer and Treasurer of the Federated Fund Family; Senior Vice President, Federated Administrative Services; Financial and Operations Principal for Federated Securities Corp., Edgewood Services, Inc. and Southpointe Distribution Services, Inc.
Previous Positions: Controller of Federated Investors, Inc.; Vice President, Finance of Federated Services Company; held various financial management positions within The Mercy Hospital of Pittsburgh; Auditor, Arthur Andersen & Co. |
Brian P. Bouda
Birth Date: February 28, 1947
CHIEF COMPLIANCE OFFICER AND SENIOR VICE PRESIDENT
Began serving: August 2004 | Principal Occupations: Senior Vice President and Chief Compliance Officer of the Federated Fund Family; Vice President and Chief Compliance Officer of Federated Investors, Inc. and Chief Compliance Officer of its subsidiaries. Mr. Bouda joined Federated in 1999 and is a member of the American Bar Association and the State Bar Association of Wisconsin. |
Stephen F. Auth
Birth Date: September 3, 1956
450 Lexington Avenue
Suite 3700
New York, NY 10017-3943
CHIEF INVESTMENT OFFICER
Began serving: November 2002 | Principal Occupations: Mr. Auth is Chief Investment Officer of this Fund and various other Funds in the Federated Fund Family; Executive Vice President, Federated Investment Counseling, Federated Global Investment Management Corp. and Federated Equity Management Company of Pennsylvania.
Previous Positions: Executive Vice President, Federated Investment Management Company, and Passport Research, Ltd. (investment advisory subsidiary of Federated); Senior Vice President, Global Portfolio Management Services Division; Senior Vice President, Federated Investment Management Company and Passport Research, Ltd.; Senior Managing Director and Portfolio Manager, Prudential Investments. |
Lawrence Auriana
Birth Date: January 8, 1944
140 East 45th Street
New York, NY 10017
VICE PRESIDENT
Began serving: November 2001 | Principal Occupations: Lawrence Auriana is Vice President of the Trust. Mr. Auriana joined Federated in April 2001 as Co-Head of Investments/Federated Kaufmann. From August 1984 to April 2001, Mr. Auriana was President and Treasurer of Edgemont Asset Management Corp., and Chairman of the Board and Portfolio Manager to The Kaufmann Fund, Inc. (predecessor to the Federated Kaufmann Fund). Mr. Auriana earned a B.S. in economics from Fordham University and has been engaged in the securities business since 1965. |
Annual Shareholder Report34
Name
Birth Date
Address
Positions Held with Trust
Date Service Began | Principal Occupation(s) for Past Five Years
and Previous Position(s) |
Walter C. Bean
Birth Date: June 22, 1945
VICE PRESIDENT
Began serving: November 2006 | Principal Occupations: Walter C. Bean is Vice President of the Trust. Mr. Bean is a Senior Vice President, Senior Portfolio Manager and the Head of the Equity Income Management Team of the Fund's Adviser. Mr. Bean joined Federated in 2000. His previous associations included: various investment management and research positions with C.S. McKee & Company; First Chicago Investment Advisors; CIGNA Investment Advisors; and Mellon Bank. Mr. Bean earned a Bachelors Degree in Business Administration from Ohio University and an M.B.A. from the Pennsylvania State University. Mr. Bean has received the Chartered Financial Analyst designation and has 36 years of investment experience. |
Richard B. Fisher
Birth Date: May 17, 1923
VICE PRESIDENT
Began serving: April 1984 | Principal Occupations: Vice Chairman or Vice President of some of the Funds in the Federated Fund Family; Vice Chairman, Federated Investors, Inc.; Chairman, Federated Securities Corp.
Previous Positions: President and Director or Trustee of some of the Funds in the Federated Fund Family; Executive Vice President, Federated Investors, Inc.; Director and Chief Executive Officer, Federated Securities Corp. |
Hans P. Utsch
Birth Date: July 3, 1936
140 East 45th Street
New York, NY 10017
VICE PRESIDENT
Began serving: November 2001 | Principal Occupations: Hans P. Utsch is Vice President of the Trust. Mr. Utsch joined Federated in April 2001 as Co-Head of Investments/Federated Kaufmann. From August 1984 to April 2001, Mr. Utsch was Chairman of the Board and Secretary of Edgemont Asset Management Corp., and President and Portfolio Manager to The Kaufmann Fund, Inc. (predecessor to the Federated Kaufmann Fund). Mr. Utsch graduated from Amherst College and holds an M.B.A. from Columbia University. He has been engaged in the securities business since 1962. |
Annual Shareholder Report35
Evaluation and Approval of Advisory Contract - May 2010
Federated Clover Small Value Fund (the “Fund”)
The Fund's Board reviewed the Fund's investment advisory contract at meetings held in May 2010. The Board's decision regarding the contract reflects the exercise of its business judgment on whether to continue the existing arrangements.
In this connection, the Federated funds' Board had previously appointed a Senior Officer, whose duties include specified responsibilities relating to the process by which advisory fees are to be charged to a Federated fund. The Senior Officer has the authority to retain consultants, experts, or staff as may be reasonably necessary to assist in the performance of his duties, reports directly to the Board, and may be terminated only with the approval of a majority of the independent members of the Board. The Senior Officer prepared and furnished to the Board an independent, written evaluation that covered topics discussed below. The Board considered that evaluation, along with other information, in deciding to approve the advisory contract.
During its review of the contract, the Board considered compensation and benefits received by the Adviser. This included the fees received for services provided to the Fund by other entities in the Federated organization and research services (if any) received by the Adviser from brokers that execute Federated fund trades, as well as advisory fees. The Board is also familiar with and considered judicial decisions concerning allegedly excessive investment advisory fees, which have indicated that the following factors may be relevant to an Adviser's fiduciary duty with respect to its receipt of compensation from a fund: the nature and quality of the services provided by the Adviser, including the performance of the fund; the Adviser's cost of providing the services; the extent to which the Adviser may realize “economies of scale” as a fund grows larger; any indirect benefits that may accrue to the Adviser and its affiliates as a result of the Adviser's relationship with a fund; performance and expenses of comparable funds; and the extent to which the independent Board members are fully informed about all facts the Board deems relevant bearing on the Adviser's services and fees. The Board further considered management fees (including any components thereof) charged to institutional and other clients of the Adviser for what might be viewed as like services, and the cost to the Adviser and its affiliates of supplying services pursuant to the management fee agreements, excluding any intra-corporate profit and profit margins of the Adviser and its affiliates for supplying such services. The Board was aware of these factors and was guided by them in its review of the Fund's advisory contract to the extent it considered them to be appropriate and relevant, as discussed further below.
Annual Shareholder Report36
The Board considered and weighed these circumstances in light of its substantial accumulated experience in governing the Fund and working with Federated on matters relating to the Federated funds, and was assisted in its deliberations by independent legal counsel. Throughout the year, the Board has requested and received substantial and detailed information about the Fund and the Federated organization that was in addition to the extensive materials that comprise and accompany the Senior Officer's evaluation. Federated provided much of this information at each regular meeting of the Board, and furnished additional reports in connection with the particular meeting at which the Board's formal review of the advisory contract occurred. Between regularly scheduled meetings, the Board also received information on particular matters as the need arose. Thus, the Board's consideration of the advisory contract included review of the Senior Officer's evaluation, accompanying data and additional reports covering such matters as: the Adviser's investment philosophy, revenue, profitability, personnel and processes; investment and operating strategies; the Fund's short- and long-term performance (in absolute terms, both on a gross basis and net of expenses, as well as in relationship to its particular investment program and certain competitor or “peer group” funds and/or other benchmarks, as appropriate), and comments on the reasons for performance; the Fund's investment objectives; the Fund's expenses (including the advisory fee itself and the overall expense structure of the Fund, both in absolute terms and relative to similar and/or competing funds, with due regard for contractual or voluntary expense limitations); the use and allocation of brokerage commissions derived from trading the Fund's portfolio securities (if any); and the nature, quality and extent of the advisory and other services provided to the Fund by the Adviser and its affiliates. The Board also considered the preferences and expectations of Fund shareholders and their relative sophistication; the continuing state of competition in the mutual fund industry and market practices; the range of comparable fees for similar funds in the mutual fund industry; the Fund's relationship to the Federated family of funds which include a comprehensive array of funds with different investment objectives, policies and strategies which are available for exchange without the incurrence of additional sales charges; compliance and audit reports concerning the Federated funds and the Federated companies that service them (including communications from regulatory agencies), as well as Federated's responses to any issues raised therein; and relevant developments in the mutual fund industry and how the Federated funds and/or Federated are responding to them. The Board's evaluation process is evolutionary. The criteria considered and the emphasis placed on relevant criteria change in recognition of changing circumstances in the mutual fund marketplace. With respect to the Fund's performance and expenses in particular, the Board has found the use of comparisons to other mutual funds with comparable investment programs to be relevant, given the high degree of competition in the mutual fund business. The Board focused on comparisons with other similar Annual Shareholder Report37
mutual funds more heavily than non-mutual fund products or services because it is believed that they are more relevant. For example, other mutual funds are the products most like the Fund, they are readily available to Fund shareholders as alternative investment vehicles, and they are the type of investment vehicle in fact chosen and maintained by the Fund's investors. The range of their fees and expenses therefore appears to be a generally reliable indication of what consumers have found to be reasonable in the precise marketplace in which the Fund competes. The Fund's ability to deliver competitive performance when compared to its peer group was a useful indicator of how the Adviser is executing the Fund's investment program, which in turn assisted the Board in reaching a conclusion that the nature, extent, and quality of the Adviser's investment management services were such as to warrant continuation of the advisory contract. In this regard, the Senior Officer has reviewed Federated's fees for providing advisory services to products outside the Federated family of funds (e.g., institutional and separate accounts). He concluded that mutual funds and institutional accounts are inherently different products. Those differences include, but are not limited to, different types of targeted investors; being subject to different laws and regulations; different legal structures; different average account sizes; different associated costs; different portfolio management techniques made necessary by different cash flows; and portfolio manager time spent in review of securities pricing. The Senior Officer did not consider these fee schedules to be determinative in judging the appropriateness of mutual fund advisory contracts.The Senior Officer reviewed reports compiled by Federated, using data supplied by independent fund ranking organizations, regarding the performance of, and fees charged by, other mutual funds, noting his view that comparisons to fund peer groups are relevant in judging the reasonableness of proposed fees.
For the periods covered by the report, the Fund's performance for the three-year and five-year periods was above the median of the relevant peer group, and the Fund's performance fell below the median of the relevant peer group for the one-year period. The Board discussed the Fund's performance with the Adviser and recognized the efforts being undertaken by the Adviser. The Board will continue to monitor these efforts and the performance of the Fund.
The Board also received financial information about Federated, including reports on the compensation and benefits Federated derived from its relationships with the Federated funds. These reports covered not only the fees under the advisory contracts, but also fees received by Federated's subsidiaries for providing other services to the Federated funds under separate contracts (e.g., for serving as the Federated funds' administrator). The reports also discussed any indirect benefit Federated may derive from its receipt of research services from brokers who execute Federated fund trades. In addition, the Board considered the fact that, in order for a fund to be competitive in the marketplace, Federated and its affiliates frequently waived fees and/or Annual Shareholder Report38
reimbursed expenses and have disclosed to fund investors and/or indicated to the Board their intention to do so in the future, where appropriate. Moreover, the Board receives regular reports regarding the institution or elimination of these voluntary waivers.Federated furnished reports, requested by the Senior Officer, that reported revenues on a fund-by-fund basis and made estimates of the allocation of expenses on a fund-by-fund basis, using allocation methodologies specified by the Senior Officer. The Senior Officer noted that, although they may apply consistent allocation processes, the inherent difficulties in allocating costs (and the unavoidable arbitrary aspects of that exercise) and the lack of consensus on how to allocate those costs may render such allocation reports unreliable. The allocation reports were considered in the analysis by the Board but were determined to be of limited use.
The Board and the Senior Officer also reviewed a report compiled by Federated comparing profitability information for Federated to other publicly held fund management companies. In this regard, the Senior Officer noted the limited availability of such information, but nonetheless concluded that Federated's profit margins did not appear to be excessive and the Board agreed.
The Senior Officer's evaluation also discussed the notion of possible realization of “economies of scale” as a fund grows larger. The Board considered in this regard that the Adviser has made significant and long-term investments in areas that support all of the Federated funds, such as personnel and processes for the portfolio management, compliance, and risk management functions; and systems technology; and that the benefits of these efforts (as well as any economies, should they exist) were likely to be enjoyed by the fund complex as a whole. Finally, the Board also noted the absence of any applicable regulatory or industry guidelines on this subject, which (as discussed in the Senior Officer's evaluation) is compounded by the lack of any common industry practice or general pattern with respect to structuring fund advisory fees with “breakpoints” that serve to reduce the fee as the fund attains a certain size. The Senior Officer did not recommend institution of breakpoints in pricing Federated's fund advisory services at this time.
It was noted in the materials for the Board meeting that for the period covered by the report, the Fund's investment advisory fee, after waivers and expense reimbursements, if any, was above the median of the relevant peer group. The Board reviewed the fees and other expenses of the Fund with the Adviser and was satisfied that the overall expense structure of the Fund remained competitive. The Board will continue to monitor advisory fees and other expenses borne by the Fund.
The Senior Officer's evaluation noted his belief that the information and observations contained in his evaluation supported a finding that the proposed management fees are reasonable, and that Federated appeared to provide appropriate administrative services to the Fund for the fees paid. Under these Annual Shareholder Report39
circumstances, no changes were recommended to, and no objection was raised to, the continuation of the Fund's advisory contract. The Board concluded that the nature, quality and scope of services provided the Fund by the Adviser and its affiliates were satisfactory.In its decision to continue an existing investment advisory contract, the Board was mindful of the potential disruptions of the Fund's operations and various risks, uncertainties and other effects that could occur as a result of a decision to terminate or not renew an advisory contract. In particular, the Board recognized that many shareholders have invested in the Fund on the strength of the Adviser's industry standing and reputation and with the expectation that the Adviser will have a continuing role in providing advisory services to the Fund. Thus, the Board's approval of the advisory contract reflected the fact that it is the shareholders who have effectively selected the Adviser by virtue of having invested in the Fund.
The Board based its decision to approve the advisory contract on the totality of the circumstances and relevant factors and with a view to past and future long-term considerations. Not all of the factors and considerations identified above were necessarily relevant to the Fund, nor did the Board consider any one of them to be determinative. With respect to the factors that were relevant, the Board's decision to approve the contract reflects its determination that Federated's performance and actions provided a satisfactory basis to support the decision to continue the existing arrangements.
Annual Shareholder Report40
Voting Proxies on Fund Portfolio Securities
A description of the policies and procedures that the Fund uses to determine how to vote proxies, if any, relating to securities held in the Fund's portfolio is available, without charge and upon request, by calling 1-800-341-7400. A report on “Form N-PX” of how the Fund voted any such proxies during the most recent 12-month period ended June 30 is available from Federated's website at FederatedInvestors.com. To access this information from the “Products” section of the website, click on the “Prospectuses and Regulatory Reports” link under “Related Information,” then select the appropriate link opposite the name of the Fund; or select the name of the Fund and from the Fund's page, click on the “Prospectuses and Regulatory Reports” link. Form N-PX filings are also available at the SEC's website at www.sec.gov.
Quarterly Portfolio Schedule
The Fund files with the SEC a complete schedule of its portfolio holdings, as of the close of the first and third quarters of its fiscal year, on “Form N-Q.” These filings are available on the SEC's website at www.sec.gov and may be reviewed and copied at the SEC's Public Reference Room in Washington, DC. (Call 1-800-SEC-0330 for information on the operation of the Public Reference Room.) You may also access this information from the “Products” section of Federated's website at FederatedInvestors.com by clicking on “Portfolio Holdings” under “Related Information,” then selecting the appropriate link opposite the name of the Fund; or select the name of the Fund and from the Fund's page, click on the “Portfolio Holdings” link.
Annual Shareholder Report41
Mutual funds are not bank deposits or obligations, are not guaranteed by any bank and are not insured or guaranteed by the U.S. government, the Federal Deposit Insurance Corporation, the Federal Reserve Board or any other government agency. Investment in mutual funds involves investment risk, including the possible loss of principal.
This Report is authorized for distribution to prospective investors only when preceded or accompanied by the Fund's Prospectus, which contains facts concerning its objective and policies, management fees, expenses and other information.
Federated Clover Small Value Fund
Federated Investors Funds
4000 Ericsson Drive
Warrendale, PA 15086-7561
Contact us at FederatedInvestors.com
or call 1-800-341-7400.
Federated Securities Corp., Distributor
Cusip 314172289
Cusip 314172271
41198 (11/10)
Federated is a registered mark of Federated Investors, Inc.
2010 © Federated Investors, Inc.
Federated Clover Small Value Fund
A Portfolio of Federated Equity Funds
ANNUAL SHAREHOLDER REPORTSeptember 30, 2010
Institutional Shares
FINANCIAL HIGHLIGHTS
SHAREHOLDER EXPENSE EXAMPLE
MANAGEMENT'S DISCUSSION OF FUND PERFORMANCE
PORTFOLIO OF INVESTMENTS SUMMARY TABLE
PORTFOLIO OF INVESTMENTS
STATEMENT OF ASSETS AND LIABILITIES
STATEMENT OF OPERATIONS
STATEMENT OF CHANGES IN NET ASSETS
NOTES TO FINANCIAL STATEMENTS
REPORT OF INDEPENDENT REGISTERED PUBLIC ACCOUNTING FIRM
BOARD OF TRUSTEES AND TRUST OFFICERS
EVALUATION AND APPROVAL OF ADVISORY CONTRACT
VOTING PROXIES ON FUND PORTFOLIO SECURITIES
QUARTERLY PORTFOLIO SCHEDULE
Financial Highlights - Institutional Shares
(For a Share Outstanding Throughout Each Period)
| YearEnded
9/30/2010 | Period
Ended
9/30/20091 |
| Net Asset Value, Beginning of Period | $16.09 | $15.42 |
| Income From Investment Operations: | | |
| Net investment income | 0.102 | 0.012 |
| Net realized and unrealized gain on investments | 2.20 | 0.66 |
| TOTAL FROM INVESTMENT OPERATIONS | 2.30 | 0.67 |
| Less Distributions: | | |
| Distributions from net investment income | (0.02) | — |
| Distributions from net realized gain on investments | (0.14) | — |
| TOTAL DISTRIBUTIONS | (0.16) | — |
| Net Asset Value, End of Period | $18.23 | $16.09 |
| Total Return3 | 14.43% | 4.35% |
| Ratios to Average Net Assets: | | |
| Net expenses | 1.06% | 1.19%4 |
| Net investment income | 0.60% | 0.70%4 |
| Expense waiver/reimbursement5 | 0.41% | 0.25%4 |
| Supplemental Data: | | |
| Net assets, end of period (000 omitted) | $52,136 | $9,161 |
| Portfolio turnover | 72% | 68%6 |
| 1 | Reflects operations for the period from August 29, 2009 (deemed the date of initial investment, pursuant to a reorganization that took place on August 28, 2009) to September 30, 2009. See Note 2 to the Financial Statements. |
| 2 | Per share numbers have been calculated using the average shares method. |
| 3 | Based on net asset value. Total returns for periods of less than one year are not annualized. |
| 4 | Computed on an annualized basis. |
| 5 | This expense decrease is reflected in both the net expense and the net investment income ratios shown above. |
| 6 | Portfolio turnover is calculated at the Fund level. Percentage indicated was calculated for the entire fiscal year ended September 30, 2009. |
See Notes which are an integral part of the Financial Statements
Annual Shareholder Report1
Shareholder Expense Example (unaudited)
As a shareholder of the Fund, you incur ongoing costs, including management fees and to the extent applicable, distribution (12b-1) fees and/or shareholder services fees and other Fund expenses. This Example is intended to help you to understand your ongoing costs (in dollars) of investing in the Fund and to compare these costs with the ongoing costs of investing in other mutual funds. It is based on an investment of $1,000 invested at the beginning of the period and held for the entire period from April 1, 2010 to September 30, 2010.
The first section of the table below provides information about actual account values and actual expenses. You may use the information in this section, together with the amount you invested, to estimate the expenses that you incurred over the period. Simply divide your account value by $1,000 (for example, an $8,600 account value divided by $1,000 = 8.6), then multiply the result by the number in the first section under the heading entitled “Expenses Paid During Period” to estimate the expenses attributable to your investment during this period.
HYPOTHETICAL EXAMPLE FOR COMPARISON PURPOSES
The second section of the table below provides information about hypothetical account values and hypothetical expenses based on the Fund's actual expense ratio and an assumed rate of return of 5% per year before expenses, which is not the Fund's actual return. Thus, you should not use the hypothetical account values and expenses to estimate the actual ending account balance or your expenses for the period. Rather, these figures are required to be provided to enable you to compare the ongoing costs of investing in the Fund with other funds. To do so, compare this 5% hypothetical example with the 5% hypothetical examples that appear in the shareholder reports of the other funds.
Please note that the expenses shown in the table are meant to highlight your ongoing costs only. Therefore, the second section of the table is useful in comparing ongoing costs only, and will not help you determine the relative total costs of owning different funds.
| Beginning
Account Value
4/1/2010 | Ending
Account Value
9/30/2010 | Expenses Paid
During Period1 |
| Actual | $1,000 | $1,001.60 | $5.32 |
Hypothetical (assuming a 5% return
before expenses) | $1,000 | $1,019.75 | $5.37 |
| 1 | Expenses are equal to the Fund's annualized net expense ratio of 1.06%, multiplied by the average account value over the period, multiplied by 183/365 (to reflect the one-half-year period). |
Annual Shareholder Report2
Performance data quoted represents past performance which is no guarantee of future results. Investment return and principal value will fluctuate so that an investor's shares, when redeemed, may be worth more or less than their original cost. Mutual fund performance changes over time and current performance may be lower or higher than what is stated. For current to the most recent month-end performance and after-tax returns, visit FederatedInvestors.com or call 1-800-341-7400.
Management's Discussion of Fund Performance (unaudited)
For the fiscal year ended September 30, 2010, the Fund produced a total return, based on net asset value, of 14.43%. For the same period, the total return for the Russell 2000® Value Index1 (RU2V), a broad-based securities market index, was 11.84%. The Fund's total return for the fiscal year reflected actual cash flows, transaction costs and other expenses which were not reflected in the total return of the RU2V.
MARKET OVERVIEW
The Fund's fiscal year was characterized by see-saw market action driven by alternating waves of encouraging and dispiriting news flow. Reevaluations of the velocity and direction of interest rates, employment, housing, currencies and earnings kept investors paralyzed and largely on the sidelines, and declining market volumes were a symptom of the apathetic mood. During this period, the broad market, as measured by the Standard & Poor's 500 Index (S&P 500),2 managed to return 10.16%. Despite lingering economic woes, the ever-forward-looking stock market took an optimistic turn in September, to finish the period firmly in positive territory.
| 1 | The Russell 2000 Value Index measures the performance of the small-cap value segment of the U.S. equity universe. It includes those Russell 2000 companies with lower price-to-book ratios and lower forecasted growth values. The index is unmanaged, and unlike the Fund, is not affected by cash flows. It is not possible to invest directly in an index. |
| 2 | The S&P 500 Index is an unmanaged capitalization-weighted index of 500 stocks designed to measure performance of the broad domestic economy through changes in the aggregate market value of 500 stocks representing all major industries. The index is unmanaged, and unlike the Fund, is not affected by cash flows. It is not possible to invest directly in an index. |
Annual Shareholder Report3
FUND PERFORMANCE
The key driver of performance for the Fund3 versus the RU2V was strong stock selection across multiple sectors and industries. Particularly strong contributions were derived from the Materials and Health Care sectors. Small sector over- and underweights relative to the RU2V also made a modest positive contribution to performance. Detracting from performance during the reporting period was stock selection within the Information Technology space. The Fund's overall outperformance during this rollercoaster period was also driven by Fund management's focus on deploying capital to inexpensive stocks with improving fundamentals as well as its adherence to risk controls.
Individual stocks that contributed to the Fund's outperformance resided in multiple sectors across the Fund. In the Materials sector, iron ore producer Cliffs Natural Resources benefitted from resurgent demand. In the Information Technology sector, optical components company Finisar Corp. enjoyed improving markets driven by rapid increases in band-width consumption. Within Consumer Staples, The Pantry, Inc., a convenience store operator, benefitted from improving margins in response to operational realignments. Tenneco, an automobile components supplier, produced strong returns as the auto industry continued to regain its footing. The top five positive individual contributors were: United Continental Holdings; Finisar Corp.; Cliffs Natural Resources; Tenneco; and The Pantry, Inc. As referenced earlier, the contribution of individual sector over- and underweights were modest and in total had a small positive impact on overall portfolio performance.
POSITIONING AND STRATEGY
During the reporting period, many of the Fund's stock selections focused on companies with the financial strength to weather today's uncertain environment. The Fund's emphasis on companies with consistent cash flows and strong balance sheets is an integral part of the Adviser's investment process. Across various industries during the fiscal year, adaptations to today's more competitive business environment presented opportunities for stronger companies to bolster their balance sheets and improve their strategic position.
| 3 | Because the Fund invests in smaller companies, it may be more volatile, and subject to greater short-term risk, than funds that invest in larger companies. Smaller companies may have limited resources, product lines and markets, and their securities may trade less frequently and in more limited volumes than securities of larger companies. Value stocks tend to have higher dividends and thus have a higher income-related component in their total return than growth stocks. Value stocks also may lag growth stocks in performance, particularly in late stages of a market advance. |
Annual Shareholder Report4
During the period, the volatility of the broad market presented opportunities for the Fund to purchase companies whose long-term intrinsic value appeared to be underestimated by the market. Fund management observed multiple situations surrounded by fear, uncertainty or adverse news flow which provided opportunities that could be acted upon to the potential benefit of shareholders. Fund management's disciplined approach to evaluating these situations resulted in purchases across multiple sectors within the portfolio.The Fund concluded the fiscal year with small overweights relative to the RU2V in Information Technology and Materials, while being underweight in the Financial Services sector. The Fund's characteristically small sector over- or underweights relative to the RU2V were driven not by economic forecasts; but rather, by the analysts' view of company-specific opportunities within each sector. While the Fund's managers remained cognizant of macroeconomic factors, the investment approach focused primarily on bottom-up, fundamental analysis that sought to construct a well-diversified,4 risk-controlled portfolio.
| 4 | Diversification does not assure a profit nor protect against loss. |
Annual Shareholder Report5
GROWTH OF A $10,000 INVESTMENT - institutional shares
The Fund's Institutional Shares commenced operations on August 29, 2009. The Fund offers two other classes of shares: Class A Shares and Class C Shares. For the period prior to commencement of operations of the Institutional Shares, the performance information shown is for the Fund's Class A Shares. The performance of Class A Shares has not been adjusted to reflect the expenses of the Institutional Shares since the Institutional Shares have a lower expense ratio than the expense ratio of the Class A Shares. The performance of Class A Shares has been adjusted to remove any voluntary waiver of Fund expenses related to the Class A Shares that may have occurred during the period prior to commencement of operations of the Institutional Shares. The graph below illustrates the hypothetical investment of $10,0001 in Federated Clover Small Value Fund (Institutional Shares) (the “Fund”) from September 30, 2000 to September 30, 2010, compared to the Russell 2000® Value Index (RU2V).2
| Average Annual Total Returns for the Period Ended 9/30/2010 | |
| 1 Year | 14.43% |
| 5 Years | 3.60% |
| 10 Years | 8.34% |
Performance data quoted represents past performance which is no guarantee of future results. Investment return and principal value will fluctuate so that an investor's shares, when redeemed, may be worth more or less than their original cost. Mutual fund performance changes over time and current performance may be lower or higher than what is stated. For current to the most recent month-end performance and after-tax returns, visit FederatedInvestors.com or call 1-800-341-7400. Returns shown do not reflect the deduction of taxes that a shareholder would pay on fund distributions or the redemption of fund shares. Mutual funds are not obligations of or guaranteed by any bank and are not federally insured.
| 1 | Represents a hypothetical investment of $10,000 in the Fund. The Fund's performance assumes the reinvestment of all dividends and distributions. The RU2V has been adjusted to reflect reinvestment of dividends on securities in the index. |
| 2 | The RU2V is not adjusted to reflect sales charges, expenses or other fees that the Securities and Exchange Commission requires to be reflected in the Fund's performance. The index is unmanaged, and unlike the Fund, is not affected by cash flows. It is not possible to invest directly in an index. |
Annual Shareholder Report6
Portfolio of Investments Summary Table (unaudited)
At September 30, 2010, the Fund's sector composition1 was as follows:
| Sector Composition | Percentage of
Total Net Assets |
| Financials | 31.8% |
| Industrials | 13.6% |
| Consumer Discretionary | 11.5% |
| Information Technology | 10.2% |
| Energy | 7.2% |
| Materials | 6.6% |
| Utilities | 6.4% |
| Health Care | 4.9% |
| Consumer Staples | 2.8% |
| Cash Equivalents2 | 4.4% |
| Other Assets and Liabilities — Net3 | 0.6% |
| TOTAL | 100.0% |
| 1 | Except for Cash Equivalents and Other Assets and Liabilities, sector classifications are based upon, and individual portfolio securities are assigned to, the classifications of the Global Industry Classification Standard (GICS) except that the Adviser assigns a classification to securities not classified by the GICS and to securities for which the Adviser does not have access to the classification made by the GICS. |
| 2 | Cash Equivalents include any investments in money market mutual funds and/or overnight repurchase agreements. |
| 3 | Assets, other than investments in securities, less liabilities. See Statement of Assets and Liabilities. |
Annual Shareholder Report7
Portfolio of Investments
September 30, 2010
| Shares | | | Value |
| | COMMON STOCKS – 95.0% | |
| | Consumer Discretionary – 11.5% | |
| 77,680 | 1 | Asbury Automotive Group, Inc. | 1,092,958 |
| 107,800 | | bebe stores, Inc. | 777,238 |
| 108,242 | 1 | Build-A-Bear Workshop, Inc. | 654,864 |
| 123,000 | | Callaway Golf Co. | 861,000 |
| 84,435 | | Cooper Tire & Rubber Co. | 1,657,459 |
| 55,575 | | Dillards, Inc., Class A | 1,313,793 |
| 55,150 | | Finish Line, Inc., Class A | 767,137 |
| 224,475 | | Hot Topic, Inc. | 1,344,605 |
| 47,725 | 1 | JAKKS Pacific, Inc. | 841,869 |
| 66,650 | | Jones Apparel Group, Inc. | 1,309,006 |
| 77,400 | 1 | K-Swiss, Inc., Class A | 986,850 |
| 89,900 | 1 | La-Z Boy Chair Co. | 758,756 |
| 51,775 | | Rent-A-Center, Inc. | 1,158,724 |
| 77,735 | | Service Corp. International | 670,076 |
| 51,975 | 1 | Skechers USA, Inc., Class A | 1,220,893 |
| 103,525 | | Spartan Motors, Inc. | 480,356 |
| 37,660 | 1 | Tenneco Automotive, Inc. | 1,091,010 |
| 46,275 | 1 | Volcom, Inc. | 884,778 |
| 329,970 | 1 | Wet Seal, Inc., Class A | 1,118,598 |
| | TOTAL | 18,989,970 |
| | Consumer Staples – 2.8% | |
| 192,275 | 1 | Alliance One International, Inc. | 797,941 |
| 32,945 | | Spartan Stores, Inc. | 477,702 |
| 55,425 | 1 | The Pantry, Inc. | 1,336,297 |
| 42,530 | 1 | TreeHouse Foods, Inc. | 1,960,633 |
| | TOTAL | 4,572,573 |
| | Energy – 7.2% | |
| 82,950 | 1 | Complete Production Services, Inc. | 1,696,328 |
| 10,400 | 1 | Dril-Quip, Inc. | 645,944 |
| 30,075 | 1 | Forest Oil Corp. | 893,228 |
| 110,130 | 1 | Helix Energy Solutions Group, Inc. | 1,226,848 |
| 384,500 | 1 | Kodiak Oil & Gas Corp. | 1,303,455 |
| 93,425 | 1 | Newpark Resources, Inc. | 784,770 |
| 53,725 | | RPC, Inc. | 1,136,821 |
| 27,615 | | SM Energy Co. | 1,034,458 |
Annual Shareholder Report8
| Shares | | | Value |
| 68,675 | 1 | Venoco, Inc. | 1,348,090 |
| 18,875 | 1 | Whiting Petroleum Corp. | 1,802,751 |
| | TOTAL | 11,872,693 |
| | Financials – 31.8% | |
| 85,250 | | Alterra Capital Holdings Ltd. | 1,698,180 |
| 36,040 | | American Campus Communities, Inc. | 1,097,058 |
| 170,900 | | Anworth Mortgage Asset Corp. | 1,218,517 |
| 44,145 | | Ares Capital Corp. | 690,869 |
| 40,358 | | Argo Group International Holdings Ltd. | 1,402,037 |
| 123,325 | | Boston Private Financial Holdings | 806,546 |
| 116,450 | 1 | CNO Financial Group, Inc. | 645,133 |
| 14,925 | | Cash America International, Inc. | 522,375 |
| 37,225 | | City Holding Co. | 1,141,691 |
| 42,180 | | Columbia Banking Systems, Inc. | 828,837 |
| 49,875 | | Delphi Financial Group, Inc., Class A | 1,246,376 |
| 135,775 | 1 | DiamondRock Hospitality Co. | 1,288,505 |
| 78,370 | | Dime Community Bancorp, Inc. | 1,085,424 |
| 33,145 | 1 | E*Trade Group, Inc. | 481,928 |
| 65,375 | | East West Bancorp, Inc. | 1,064,305 |
| 75,350 | | Employers Holdings, Inc. | 1,188,269 |
| 143,920 | | FNB Corp. (PA) | 1,231,955 |
| 86,200 | | First Niagara Financial Group, Inc. | 1,004,230 |
| 74,425 | | First Potomac Realty Trust | 1,116,375 |
| 61,044 | | FirstMerit Corp. | 1,118,326 |
| 93,665 | | Flushing Financial Corp. | 1,082,767 |
| 254,425 | | Hersha Hospitality Trust | 1,317,921 |
| 31,640 | | Highwoods Properties, Inc. | 1,027,351 |
| 18,055 | | Iberiabank Corp. | 902,389 |
| 40,030 | | Independent Bank Corp.- Massachusetts | 901,476 |
| 115,975 | 1 | Knight Capital Group, Inc., Class A | 1,436,930 |
| 53,920 | | LTC Properties, Inc. | 1,376,038 |
| 26,025 | | Lazard Ltd., Class A | 912,957 |
| 216,150 | | Lexington Realty Trust | 1,547,634 |
| 144,160 | | MFA Mortgage Investments, Inc. | 1,099,941 |
| 73,730 | 1 | MGIC Investment Corp. | 680,528 |
| 173,320 | | Maiden Holdings Ltd. | 1,318,965 |
| 70,630 | | Montpelier Re Holdings Ltd. | 1,223,312 |
| 173,010 | | National Penn Bancshares, Inc. | 1,081,312 |
Annual Shareholder Report9
| Shares | | | Value |
| 61,325 | | National Retail Properties, Inc. | 1,539,871 |
| 58,995 | | Newalliance Bancshares, Inc. | 744,517 |
| 49,075 | 1 | Ocwen Financial Corp. | 497,621 |
| 141,800 | | Old National Bancorp | 1,488,900 |
| 66,125 | | Oriental Financial Group | 879,462 |
| 33,410 | | Platinum Underwriters Holdings Ltd. | 1,454,003 |
| 18,971 | | Potlatch Corp. | 645,014 |
| 23,725 | 1 | ProAssurance Corp. | 1,366,323 |
| 27,100 | | Prosperity Bancshares, Inc. | 879,937 |
| 15,200 | 1 | SVB Financial Group | 643,264 |
| 47,760 | | Sun Communities, Inc. | 1,466,232 |
| 45,105 | | Trustmark Corp. | 980,583 |
| 44,225 | | Umpqua Holdings Corp. | 501,512 |
| 59,370 | | Washington Federal, Inc. | 905,986 |
| 50,900 | | Webster Financial Corp. Waterbury | 893,804 |
| 29,100 | | Wintrust Financial Corp. | 943,131 |
| | TOTAL | 52,616,617 |
| | Health Care – 4.9% | |
| 158,660 | 1 | Akorn, Inc. | 640,986 |
| 14,150 | 1 | Amerigroup Corp. | 600,950 |
| 66,740 | 1 | Celera Corp. | 449,828 |
| 16,925 | 1 | Covance, Inc. | 791,921 |
| 25,975 | 1 | Coventry Health Care, Inc. | 559,242 |
| 26,075 | 1 | ICON PLC, ADR | 563,742 |
| 25,480 | 1 | Magellan Health Services, Inc. | 1,203,675 |
| 45,050 | 1 | Merit Medical Systems, Inc. | 715,844 |
| 33,700 | | Omnicare, Inc. | 804,756 |
| 21,030 | 1 | Par Pharmaceutical Cos., Inc. | 611,552 |
| 42,790 | 1 | ViroPharma, Inc. | 637,999 |
| 35,475 | 1 | Wright Medical Group, Inc. | 511,195 |
| | TOTAL | 8,091,690 |
| | Industrials – 13.6% | |
| 154,250 | 1 | Air Transport Services Group Inc. | 939,382 |
| 31,130 | | Ampco-Pittsburgh Corp. | 772,647 |
| 45,375 | | Arkansas Best Corp. | 1,099,436 |
| 62,220 | | Barnes Group, Inc. | 1,094,450 |
| 49,830 | 1 | Ceradyne, Inc. | 1,163,530 |
| 21,385 | | Curtiss Wright Corp. | 647,966 |
Annual Shareholder Report10
| Shares | | | Value |
| 39,160 | | Deluxe Corp. | 749,131 |
| 31,185 | 1 | EnPro Industries, Inc. | 975,467 |
| 27,135 | 1 | Esterline Technologies Corp. | 1,552,936 |
| 24,825 | 1 | Exponent, Inc. | 833,872 |
| 30,500 | | Freightcar America, Inc. | 750,300 |
| 43,900 | 1 | GrafTech International Ltd. | 686,157 |
| 43,025 | 1 | Hub Group, Inc. | 1,258,911 |
| 91,875 | 1 | Interline Brands, Inc. | 1,657,425 |
| 125,075 | 1 | Jet Blue Airways Corp. | 836,752 |
| 91,530 | 1 | Pike Electric Corp. | 666,338 |
| 67,875 | 1 | RailAmerica, Inc. | 653,636 |
| 36,790 | 1 | School Specialty, Inc. | 478,638 |
| 116,550 | | Seaspan Corp. | 1,438,227 |
| 19,350 | 1 | Thomas & Betts Corp. | 793,737 |
| 54,650 | | Tredegar Industries, Inc. | 1,037,257 |
| 13,140 | | Triumph Group, Inc. | 980,113 |
| 32,725 | 1 | UAL Corp. | 773,292 |
| 18,708 | 1 | URS Corp. | 710,530 |
| | TOTAL | 22,550,130 |
| | Information Technology – 10.2% | |
| 15,975 | 1 | Anixter International, Inc. | 862,490 |
| 92,200 | 1 | Arris Group, Inc. | 900,794 |
| 38,090 | | Black Box Corp. | 1,221,166 |
| 33,635 | 1 | CSG Systems International, Inc. | 613,166 |
| 51,570 | | CTS Corp. | 496,103 |
| 85,236 | 1 | Finisar Corp. | 1,601,585 |
| 79,520 | 1 | Insight Enterprises, Inc. | 1,243,693 |
| 39,610 | 1 | j2 Global Communications, Inc. | 942,322 |
| 27,625 | | MTS Systems Corp. | 856,375 |
| 35,510 | 1 | NICE-Systems Ltd., ADR | 1,111,108 |
| 79,200 | 1 | Oplink Communications, Inc. | 1,571,328 |
| 94,520 | 1 | SeaChange International, Inc. | 700,393 |
| 90,360 | 1 | Symmetricom, Inc. | 516,859 |
| 126,200 | | Technitrol, Inc. | 556,542 |
| 43,645 | 1 | Verifone Systems, Inc. | 1,356,050 |
| 32,700 | 1 | ViaSat, Inc. | 1,344,297 |
| 130,200 | 1 | Zoran Corp. | 994,728 |
| | TOTAL | 16,888,999 |
Annual Shareholder Report11
| Shares | | | Value |
| | Materials – 6.6% | |
| 36,445 | 1 | Brush Engineered Materials, Inc. | 1,036,496 |
| 78,775 | 1 | Calgon Carbon Corp. | 1,142,237 |
| 73,175 | 1 | Ferro Corp. | 943,226 |
| 46,475 | 1 | Globe Specialty Metals Inc. | 652,509 |
| 129,825 | 1 | Hecla Mining Co. | 820,494 |
| 36,790 | | Innospec, Inc. | 560,312 |
| 32,625 | | Koppers Holdings, Inc. | 876,634 |
| 15,525 | | Minerals Technologies, Inc. | 914,733 |
| 13,825 | 1 | Molycorp, Inc. | 391,109 |
| 94,910 | | Myers Industries, Inc. | 815,277 |
| 24,880 | 1 | OM Group, Inc. | 749,386 |
| 41,775 | 1 | RTI International Metals | 1,279,150 |
| 62,075 | 1 | Thompson Creek Metals Co., Inc. | 669,168 |
| | TOTAL | 10,850,731 |
| | Utilities – 6.4% | |
| 22,265 | | AGL Resources, Inc. | 854,086 |
| 7,825 | | ITC Holdings Corp. | 487,106 |
| 22,400 | | Idacorp, Inc. | 804,608 |
| 24,720 | | MGE Energy, Inc. | 978,665 |
| 45,900 | | Northwestern Corp. | 1,308,150 |
| 120,875 | | Portland General Electric Co. | 2,451,345 |
| 68,425 | | Questar Corp. | 1,199,490 |
| 101,530 | | Westar Energy, Inc. | 2,460,072 |
| | TOTAL | 10,543,522 |
| | TOTAL COMMON STOCKS
(IDENTIFIED COST $142,344,957) | 156,976,925 |
| | MUTUAL FUND – 4.4% | |
| 7,291,642 | 2,3 | Federated Prime Value Obligations Fund, Institutional Shares, 0.23%
(AT NET ASSET VALUE) | 7,291,642 |
| | TOTAL INVESTMENTS — 99.4%
(IDENTIFIED COST $149,636,599)4 | 164,268,567 |
| | OTHER ASSETS AND LIABILITIES - NET — 0.6%5 | 971,941 |
| | TOTAL NET ASSETS — 100% | $165,240,508 |
| 1 | Non-income producing security. |
| 2 | Affiliated company. |
| 3 | 7-Day net yield. |
| 4 | The cost of investments for federal tax purposes amounts to $151,010,283. |
| 5 | Assets, other than investments in securities, less liabilities. See Statement of Assets and Liabilities. |
Note: The categories of investments are shown as a percentage of total net assets at September 30, 2010.
Annual Shareholder Report12
Various inputs are used in determining the value of the Fund's investments. These inputs are summarized in the three broad levels listed below:
Level 1 — quoted prices in active markets for identical securities
Level 2 — other significant observable inputs (including quoted prices for similar securities, interest rates, prepayment speeds, credit risk, etc.)
Level 3 — significant unobservable inputs (including the Fund's own assumptions in determining the fair value of investments)
The inputs or methodology used for valuing securities are not an indication of the risk associated with investing in those securities.
As of September 30, 2010, all investments of the Fund utilized Level 1 inputs in valuing the Fund's assets carried at fair value.
The following acronym is used throughout this portfolio:
| ADR | — American Depositary Receipt |
See Notes which are an integral part of the Financial Statements
Annual Shareholder Report13
Statement of Assets and Liabilities
September 30, 2010
| Assets: | | |
| Total investments in securities, at value including $7,291,642 of investments in an affiliated issuer (Note 6) (identified cost $149,636,599) | | $164,268,567 |
| Income receivable | | 130,543 |
| Receivable for investments sold | | 3,926,884 |
| Receivable for shares sold | | 1,238,203 |
| TOTAL ASSETS | | 169,564,197 |
| Liabilities: | | |
| Payable for investments purchased | $4,079,812 | |
| Payable for shares redeemed | 128,518 | |
| Payable for Directors'/Trustees' fees | 299 | |
| Payable for distribution services fee (Note 6) | 4,106 | |
| Payable for shareholder services fee (Note 6) | 38,136 | |
| Accrued expenses | 72,818 | |
| TOTAL LIABILITIES | | 4,323,689 |
| Net assets for 9,086,178 shares outstanding | | $165,240,508 |
| Net Assets Consist of: | | |
| Paid-in capital | | $167,632,754 |
| Net unrealized appreciation of investments | | 14,631,968 |
| Accumulated net realized loss on investments | | (17,452,164) |
| Undistributed net investment income | | 427,950 |
| TOTAL NET ASSETS | | $165,240,508 |
| Net Asset Value, Offering Price and Redemption Proceeds Per Share | | |
| Class A Shares: | | |
| Net asset value per share ($106,029,787 ÷ 5,833,132 shares outstanding), no par value, unlimited shares authorized | | $18.18 |
| Offering price per share (100/94.50 of $18.18) | | $19.24 |
| Redemption proceeds per share | | $18.18 |
| Class C Shares: | | |
| Net asset value per share ($7,075,137 ÷ 393,224 shares outstanding), no par value, unlimited shares authorized | | $17.99 |
| Offering price per share | | $17.99 |
| Redemption proceeds per share (99.00/100 of $17.99) | | $17.81 |
| Institutional Shares: | | |
| Net asset value per share ($52,135,584 ÷ 2,859,822 shares outstanding), no par value, unlimited shares authorized | | $18.23 |
| Offering price per share | | $18.23 |
| Redemption proceeds per share | | $18.23 |
See Notes which are an integral part of the Financial Statements
Annual Shareholder Report14
Statement of Operations
Year Ended September 30, 2010
| Investment Income: | | | |
| Dividends (including $9,630 received from an affiliated issuer (Note 6) and net of foreign taxes withheld of $1,573) | | | $2,141,931 |
| Expenses: | | | |
| Investment adviser fee (Note 6) | | $1,186,146 | |
| Administrative personnel and services fee (Note 6) | | 230,000 | |
| Custodian fees | | 28,845 | |
| Transfer and dividend disbursing agent fees and expenses | | 249,795 | |
| Directors'/Trustees' fees | | 1,588 | |
| Auditing fees | | 40,500 | |
| Legal fees | | 4,932 | |
| Portfolio accounting fees | | 69,411 | |
| Distribution services fee — Class C Shares (Note 6) | | 42,954 | |
| Shareholder services fee — Class A Shares (Note 6) | | 246,654 | |
| Shareholder services fee — Class C Shares (Note 6) | | 14,330 | |
| Account administration fee — Class A Shares | | 185 | |
| Share registration costs | | 50,921 | |
| Printing and postage | | 52,346 | |
| Insurance premiums | | 4,527 | |
| Miscellaneous | | 787 | |
| TOTAL EXPENSES | | 2,223,921 | |
| Waivers and Reimbursement (Note 6): | | | |
| Waiver/reimbursement of investment adviser fee | $(472,642) | | |
| Waiver of administrative personnel and services fee | (43,683) | | |
| TOTAL WAIVERS AND REIMBURSEMENT | | (516,325) | |
| Net expenses | | | 1,707,596 |
| Net investment income | | | 434,335 |
| Realized and Unrealized Gain on Investments: | | | |
| Net realized gain on investments | | | 6,346,111 |
| Net change in unrealized appreciation of investments | | | 9,363,073 |
| Net realized and unrealized gain on investments | | | 15,709,184 |
| Change in net assets resulting from operations | | | $16,143,519 |
See Notes which are an integral part of the Financial Statements
Annual Shareholder Report15
Statement of Changes in Net Assets
| Year Ended September 30 | 2010 | 2009 |
| Increase (Decrease) in Net Assets | | |
| Operations: | | |
| Net investment income | $434,335 | $964,464 |
| Net realized gain (loss) on investments | 6,346,111 | (22,889,037) |
| Net change in unrealized appreciation/depreciation of investments | 9,363,073 | 13,402,567 |
| CHANGE IN NET ASSETS RESULTING FROM OPERATIONS | 16,143,519 | (8,522,006) |
| Distributions to Shareholders: | | |
| Distributions from net investment income | | |
| Class A Shares | (33,735) | (810,062) |
| Class C Shares | — | (2,791) |
| Institutional Shares | (22,528) | — |
| Distributions from net realized gain on investments | | |
| Class A Shares | (790,862) | (5,479,391) |
| Class C Shares | (42,004) | (30,402) |
| Institutional Shares | (146,162) | — |
| CHANGE IN NET ASSETS RESULTING FROM DISTRIBUTIONS TO SHAREHOLDERS | (1,035,291) | (6,322,646) |
| Share Transactions: | | |
| Proceeds from sale of shares | 103,114,617 | 17,673,694 |
| Exchange of Successor Fund shares in connection with the tax-free reorganization of Touchstone Diversified Small Cap Value Fund (Note 2) | — | 19,896,773 |
| Net asset value of shares issued to shareholders in payment of distributions declared | 1,013,962 | 6,154,348 |
| Cost of shares redeemed | (70,828,204) | (36,016,916) |
| CHANGE IN NET ASSETS RESULTING FROM SHARE TRANSACTIONS | 33,300,375 | 7,707,899 |
| Change in net assets | 48,408,603 | (7,136,753) |
| Net Assets: | | |
| Beginning of period | 116,831,905 | 123,968,658 |
| End of period (including undistributed net investment income of $427,950 and $49,878, respectively) | $165,240,508 | $116,831,905 |
See Notes which are an integral part of the Financial Statements
Annual Shareholder Report16
Notes to Financial Statements
September 30, 2010
1. ORGANIZATION
Federated Equity Funds (the “Trust”) is registered under the Investment Company Act of 1940, as amended (the “Act”), as an open-end management investment company. The Trust consists of 12 diversified portfolios. The financial statements included herein are only those of Federated Clover Small Value Fund (the “Fund”). The financial statements of the other portfolios are presented separately. The assets of each portfolio are segregated and a shareholder's interest is limited to the portfolio in which shares are held. Each portfolio pays its own expenses. The Fund offers three classes of shares: Class A Shares, Class C Shares and Institutional Shares. All shares of the Fund have equal rights with respect to voting, except on class-specific matters. The financial highlights of the Class A Shares and Class C Shares are presented separately. The investment objective of the Fund is to seek capital appreciation.
2. reorganization
The Fund is the successor (“Successor Fund”) to Touchstone Diversified Small Cap Value Fund (the “Predecessor Fund”), a portfolio of Touchstone Funds Group Trust, pursuant to a reorganization that took place as of the close of business on August 28, 2009. On that date, Class A Shares, Class C Shares and Class Z Shares of the Predecessor Fund were exchanged for Class A Shares, Class C Shares and Class A Shares of the Fund, respectively. As a result of the reorganization on August 28, 2009, the Predecessor Fund became the accounting survivor. Accordingly, the performance information presented in the financial statements for the periods prior to August 28, 2009, is historical information of the Predecessor Fund.
On August 28, 2009, the Fund received a tax-free transfer of assets from Touchstone Diversified Small Cap Value Fund, as follows:
Shares of the
Fund Issued | Touchstone
Diversified Small
Cap Value Fund
Net Assets
Received | Unrealized
Depreciation1 | Net Assets
of the Fund
Immediately
Prior to
Combination | Net Assets
of the Fund
Immediately
After
Combination |
| 6,128,495 | $94,465,611 | $(1,599,031) | $19,896,773 | $114,362,384 |
| 1 | Unrealized depreciation is included in the Touchstone Diversified Small Cap Value Fund Net Assets Received amount shown above. |
On the date of the reorganization, the Successor Fund's net assets included $2,163,853 of net unrealized appreciation.
3. SIGNIFICANT ACCOUNTING POLICIES
The following is a summary of significant accounting policies consistently followed by the Fund in the preparation of its financial statements. These policies are in conformity with U.S. generally accepted accounting principles (GAAP).
Investment Valuation
In calculating its net asset value (NAV), the Fund generally values investments as follows:
- Equity securities listed on an exchange or traded through a regulated market system are valued at their last reported sale price or official closing price in their principal exchange or market.
- Shares of other mutual funds are valued based upon their reported NAVs.
Annual Shareholder Report17
- Fixed-income securities acquired with remaining maturities greater than 60 days are fair valued using price evaluations provided by a pricing service approved by the Board of Trustees (the “Trustees”).
- Fixed-income securities acquired with remaining maturities of 60 days or less are valued at their cost (adjusted for the accretion of any discount or amortization of any premium).
- Derivative contracts listed on exchanges are valued at their reported settlement or closing price.
- Over-the-counter (OTC) derivative contracts are fair valued using price evaluations provided by a pricing service approved by the Trustees.
If the Fund cannot obtain a price or price evaluation from a pricing service for an investment, the Fund may attempt to value the investment based upon the mean of bid and asked quotations or fair value the investment based on price evaluations, from one or more dealers. If any price, quotation, price evaluation or other pricing source is not readily available when the NAV is calculated, the Fund uses the fair value of the investment determined in accordance with the procedures described below. There can be no assurance that the Fund could purchase or sell an investment at the price used to calculate the Fund's NAV.
Fair Valuation and Significant Events Procedures
The Trustees have authorized the use of pricing services to provide evaluations of the current fair value of certain investments for purposes of calculating the NAV. Factors considered by pricing services in evaluating an investment include the yields or prices of investments of comparable quality, coupon, maturity, call rights and other potential prepayments, terms and type, reported transactions, indications as to values from dealers and general market conditions. Some pricing services provide a single price evaluation reflecting the bid-side of the market for an investment (a “bid” evaluation). Other pricing services offer both bid evaluations and price evaluations indicative of a price between the prices bid and asked for the investment (a “mid” evaluation). The Fund normally uses bid evaluations for U.S. Treasury and Agency securities, mortgage-backed securities and municipal securities. The Fund normally uses mid evaluations for other types of fixed-income securities and OTC derivative contracts. In the event that market quotations and price evaluations are not available for an investment, the fair value of the investment is determined in accordance with procedures adopted by the Trustees.
The Trustees also have adopted procedures requiring an investment to be priced at its fair value whenever the Adviser determines that a significant event affecting the value of the investment has occurred between the time as of which the price of the investment would otherwise be determined and the time as of which the NAV is computed. An event is considered significant if there is both an affirmative expectation that the investment's value will change in response to the event and a reasonable basis for quantifying the resulting change in value. Examples of significant events that may occur after the close of the principal market on which a security is traded, or after the time of a price evaluation provided by a pricing service or a dealer, include:
- With respect to securities traded in foreign markets, significant trends in U.S. equity markets or in the trading of foreign securities index futures or options contracts;
- With respect to price evaluations of fixed-income securities determined before the close of regular trading on the NYSE, actions by the Federal Reserve Open Market Committee and other significant trends in U.S. fixed-income markets;
Annual Shareholder Report18
- Political or other developments affecting the economy or markets in which an issuer conducts its operations or its securities are traded; and
- Announcements concerning matters such as acquisitions, recapitalizations, litigation developments, a natural disaster affecting the issuer's operations or regulatory changes or market developments affecting the issuer's industry.
The Trustees have approved the use of a pricing service to determine the fair value of equity securities traded principally in foreign markets when the Adviser determines that there has been a significant trend in the U.S. equity markets or in index futures trading. For other significant events, the Fund may seek to obtain more current quotations or price evaluations from alternative pricing sources. If a reliable alternative pricing source is not available, the Fund will determine the fair value of the investment using another method approved by the Trustees.
Investment Income, Gains and Losses, Expenses and Distributions
Investment transactions are accounted for on a trade-date basis. Realized gains and losses from investment transactions are recorded on an identified-cost basis. Interest income and expenses are accrued daily. Dividend income and distributions to shareholders are recorded on the ex-dividend date. Foreign dividends are recorded on the ex-dividend date or when the Fund is informed of the ex-dividend date. Distributions of net investment income are declared and paid annually. Non-cash dividends included in dividend income, if any, are recorded at fair value. Investment income, realized and unrealized gains and losses, and certain fund-level expenses are allocated to each class based on relative average daily net assets, except that each class may bear certain expenses unique to that class such as account administration, distribution services and shareholder services fees. Dividends are declared separately for each class. No class has preferential dividend rights; differences in per share dividend rates are generally due to differences in separate class expenses.
Premium and Discount Amortization
All premiums and discounts on fixed-income securities are amortized/accreted for financial statement purposes.
Federal Taxes
It is the Fund's policy to comply with the Subchapter M provision of the Internal Revenue Code (the “Code”) and to distribute to shareholders each year substantially all of its income. Accordingly, no provision for federal income tax is necessary. As of and during the year ended September 30, 2010, the Fund did not have a liability for any uncertain tax positions. The Fund recognizes interest and penalties, if any, related to tax liabilities as income tax expense in the Statement of Operations. As of September 30, 2010, tax years 2009 and 2010 remain subject to examination by the Fund's major tax jurisdictions, which include the United States of America and the Commonwealth of Massachusetts.
The Fund may be subject to taxes imposed by governments of countries in which it invests. Such taxes are generally based on either income or gains earned or repatriated. The Fund accrues and applies such taxes to net investment income, net realized gains and net unrealized gains as income and/or gains are earned.
Annual Shareholder Report19
When-Issued and Delayed Delivery TransactionsThe Fund may engage in when-issued or delayed delivery transactions. The Fund records when-issued securities on the trade date and maintains security positions such that sufficient liquid assets will be available to make payment for the securities purchased. Securities purchased on a when-issued or delayed delivery basis are marked to market daily and begin earning interest on the settlement date. Losses may occur on these transactions due to changes in market conditions or the failure of counterparties to perform under the contract.
Securities Lending
The Fund participates in a securities lending program providing for the lending of equity securities to qualified brokers. The Fund normally receives cash collateral for securities loaned that is invested in an affiliated money market fund or short-term securities including repurchase agreements. Collateral is maintained at a minimum level of 100% of the market value of investments loaned, plus interest, if applicable. In accordance with the Fund's securities lending agreement, the market value of securities on loan is determined each day at the close of business and any additional collateral required to cover the value of securities on loan is delivered to the Fund on the next business day. Earnings on collateral are allocated between the securities lending agent, as a fee for its services under the program, and the Fund, according to agreed-upon rates.
As of September 30, 2010, the Fund had no outstanding securities on loan.
Other
The preparation of financial statements in conformity with GAAP requires management to make estimates and assumptions that affect the amounts of assets, liabilities, expenses and revenues reported in the financial statements. Actual results could differ from those estimated.
4. SHARES OF BENEFICIAL INTEREST
The following tables summarize share activity:
| Year Ended September 30 | 2010 | 2009 |
| Class A Shares: | Shares | Amount | Shares | Amount |
| Shares sold | 2,991,044 | $52,885,211 | 411,102 | $4,295,554 |
| Transfer in Class Z Shares1 | — | — | 8,469,843 | 116,130,888 |
| Shares issued to shareholders in payment of distributions declared | 51,050 | 807,289 | 21,333 | 176,843 |
| Exchange of Successor Fund shares in connection with the tax-free reorganization of Touchstone Diversified Small Cap Value Fund | — | — | 511,629 | 7,886,533 |
Adjustment of Predecessor Fund
shares in connection with
tax-free reorganization | — | — | (2,538,389) | — |
| Shares redeemed | (3,594,710) | (62,243,784) | (539,185) | (6,137,710) |
NET CHANGE RESULTING
FROM CLASS A
SHARE TRANSACTIONS | (552,616) | $(8,551,284) | 6,336,333 | $122,352,108 |
Annual Shareholder Report20
| Year Ended September 30 | 2010 | 2009 |
| Class C Shares: | Shares | Amount | Shares | Amount |
| Shares sold | 203,409 | $3,613,984 | 42,358 | $394,233 |
| Shares issued to shareholders in payment of distributions declared | 2,433 | 38,222 | 1,978 | 16,109 |
| Exchange of Successor Fund shares in connection with the tax-free reorganization of Touchstone Diversified Small Cap Value Fund | — | — | 264,944 | 4,073,170 |
Adjustment of Predecessor Fund
shares in connection with
tax-free reorganization | — | — | (25,050) | — |
| Shares redeemed | (129,220) | (2,191,574) | (17,176) | (215,460) |
NET CHANGE RESULTING
FROM CLASS C
SHARE TRANSACTIONS | 76,622 | $1,460,632 | 267,054 | $4,268,052 |
| Year Ended
9/30/2010 | Period Ended
9/30/20092 |
| Institutional Shares: | Shares | Amount | Shares | Amount |
| Shares sold | 2,654,753 | $46,615,422 | 54,875 | $885,430 |
| Exchange of Successor Fund shares in connection with the tax-free reorganization of Touchstone Diversified Small Cap Value Fund | — | — | 514,618 | 7,937,070 |
| Shares issued to shareholders in payment of distributions declared | 10,582 | 168,451 | — | — |
| Shares redeemed | (375,006) | (6,392,846) | — | — |
NET CHANGE RESULTING
FROM INSTITUTIONAL
SHARE TRANSACTIONS | 2,290,329 | $40,391,027 | 569,493 | $8,822,500 |
| Year Ended September 30 | 2010 | 2009 |
| Class Z Shares:1 | Shares | Amount | Shares | Amount |
| Shares sold | — | $ — | 1,326,917 | $12,098,477 |
| Shares issued to shareholders in payment of distributions declared | — | — | 720,122 | 5,961,396 |
| Shares redeemed | — | — | (3,299,698) | (29,663,746) |
NET CHANGE RESULTING
FROM CLASS Z
SHARE TRANSACTIONS | — | $ — | (1,252,659) | $(11,603,873) |
FINAL REDEMPTION
FROM CLASS Z SHARES | — | $ — | (8,469,843) | $(116,130,888) |
NET CHANGE RESULTING
FROM TOTAL FUND
SHARE TRANSACTIONS | 1,814,335 | $33,300,375 | (2,549,622) | $7,707,899 |
| 1 | At the close of business on August 28, 2009, Class Z Shares were reorganized into Class A Shares. |
| 2 | Reflects operations for the period from August 29, 2009 (deemed the date of initial investment, pursuant to a reorganization that took place on August 28, 2009) to September 30, 2009. |
Annual Shareholder Report21
5. FEDERAL TAX INFORMATION
The tax character of distributions as reported on the Statement of Changes in Net Assets for the years ended September 30, 2010 and 2009, was as follows:
| 2010 | 2009 |
| Ordinary income1 | $1,035,291 | $812,853 |
| Long-term capital gains | $ — | $5,509,793 |
| 1 | For tax purposes, short-term capital gain distributions are considered ordinary income distributions. |
As of September 30, 2010, the components of distributable earnings on a tax basis were as follows:
| Undistributed ordinary income | $427,950 |
| Net unrealized appreciation | $13,258,284 |
| Capital loss carryforwards | $(16,078,480) |
The difference between book-basis and tax-basis net unrealized appreciation/depreciation is attributable in part to differing treatments for the deferral of losses on wash sales and REIT adjustments.
At September 30, 2010, the cost of investments for federal tax purposes was $151,010,283. The net unrealized appreciation of investments for federal tax purposes was $13,258,284. This consists of net unrealized appreciation from investments for those securities having an excess of value over cost of $21,186,947 and net unrealized depreciation from investments for those securities having an excess of cost over value of $7,928,663.
At September 30, 2010, the Fund had a capital loss carryforward of $16,078,480 which will reduce the Fund's taxable income arising from future net realized gains on investments, if any, to the extent permitted by the Code and thus will reduce the amount of distributions to shareholders which would otherwise be necessary to relieve the Fund of any liability for federal income tax. Pursuant to the Code, such capital loss carryforward will expire in 2017.
As a result of the tax-free transfer of assets from Touchstone Diversified Small Cap Value Fund, the use of certain capital loss carryforwards listed above may be limited.
The Fund used capital loss carryforwards of $5,437,692 to offset taxable capital gains realized during the year ended September 30, 2010.
6. INVESTMENT ADVISER FEE AND OTHER TRANSACTIONS WITH AFFILIATES
Investment Adviser Fee
Federated Global Investment Management Corporation is the Fund's investment adviser (the “Adviser”). The advisory agreement between the Fund and the Adviser provides for an annual fee equal to 0.90% of the Fund's average daily net assets. Subject to the terms described in the Expense Limitation note, the Adviser may voluntarily choose to waive any portion of its fee. For the year ended September 30, 2010, the Adviser voluntarily waived $467,306 of its fee.
Prior to close of business on August 28, 2009, the Predecessor Fund's investment adviser was Touchstone Advisors, Inc. After the close of business on August 28, 2009, the Predecessor Fund was reorganized into the Fund. The annual investment adviser fee did not change due to this reorganization.
Annual Shareholder Report22
Administrative FeeFederated Administrative Services (FAS), under the Administrative Services Agreement, provides the Fund with administrative personnel and services. The fee paid to FAS is based on the average aggregate daily net assets of certain Federated funds as specified below:
| Administrative Fee | Average Aggregate Daily Net Assets
of the Federated Funds |
| 0.150% | on the first $5 billion |
| 0.125% | on the next $5 billion |
| 0.100% | on the next $10 billion |
| 0.075% | on assets in excess of $20 billion |
The administrative fee received during any fiscal year shall be at least $150,000 per portfolio and $40,000 per each additional class of Shares. Subject to the terms described in the Expense Limitation note, FAS may voluntarily choose to waive any portion of its fee. For the year ended September 30, 2010, the net fee paid to FAS was 0.141% of average daily net assets of the Fund. FAS waived $43,683 of its fee.
Prior to close of business on August 28, 2009, Touchstone Advisors, Inc. provided administrative services to the Predecessor Fund.
Distribution Services Fee
The Fund has adopted a Distribution Plan (the “Plan”) pursuant to Rule 12b-1 under the Act. Under the terms of the Plan, the Fund will compensate Federated Securities Corp. (FSC), the principal distributor, from the daily net assets of the Fund's Class A Shares and Class C Shares to finance activities intended to result in the sale of these shares. The Plan provides that the Fund may incur distribution expenses at the following percentages of average daily net assets annually, to compensate FSC:
| Share Class Name | Percentage of Average Daily
Net Assets of Class |
| Class A Shares | 0.05% |
| Class C Shares | 0.75% |
Subject to the terms described in the Expense Limitation note, FSC may voluntarily choose to waive any portion of its fee. When FSC receives fees, it may pay some or all of them to financial intermediaries whose customers purchase shares. For the year ended September 30, 2010, FSC retained $320 of fees paid by the Fund. For the year ended September 30, 2010, the Fund's Class A Shares did not incur a distribution services fee; however, it may begin to incur this fee upon approval of the Trustees.
Prior to close of business on August 28, 2009, Touchstone Securities, Inc., was the principal distributor for the Predecessor Fund.
Sales Charges
Front-end sales charges and contingent deferred sales charges (CDSC) do not represent expenses of the Fund. They are deducted from the proceeds of sales of Fund shares prior to investment or from redemption proceeds prior to remittance, as applicable. For the year ended September 30, 2010, FSC retained $13,936 in sales charges from the sale of Class A Shares. FSC also retained $174 of CDSC relating to redemptions of Class C Shares.
Annual Shareholder Report23
Shareholder Services FeeThe Fund may pay fees (“Service Fees”) up to 0.25% of the average daily net assets of the Fund's Class A Shares and Class C Shares to financial intermediaries or to Federated Shareholder Services Company (FSSC) for providing services to shareholders and maintaining shareholder accounts. Subject to the terms described in the Expense Limitation note, FSSC may voluntarily reimburse the Fund for Service Fees. For the year ended September 30, 2010, FSSC received $38,040 of fees paid by the Fund.
Prior to close of business on August 28, 2009, Touchstone Securities, Inc., received Service Fees from the Predecessor Fund.
Expense Limitation
Effective December 1, 2010, the Adviser and its affiliates (which may include FSC, FAS and FSSC) have voluntarily agreed to waive their fees and/or reimburse expenses so that the total annual fund operating expenses (as shown in the financial highlights) paid by the Fund's Class A Shares, Class C Shares and Institutional Shares (after the voluntary waivers and reimbursements) will not exceed 1.26%, 2.01% and 1.01% (the “Fee Limit”), respectively, through the later of (the “Termination Date”): (a) November 30, 2011; or (b) the date of the Fund's next effective Prospectus. While the Adviser and its affiliates currently do not anticipate terminating or increasing these arrangements prior to the Termination Date, these arrangements may only be terminated or the Fee Limit increased prior to the Termination Date with the agreement of the Trustees.
General
Certain Officers and Trustees of the Fund are Officers and Directors or Trustees of the above companies.
Transactions with Affiliated Companies
Affiliated holdings are mutual funds which are managed by the Adviser or an affiliate of the Adviser. The Adviser has agreed to reimburse the Fund for certain investment adviser fees as a result of transactions in other affiliated mutual funds. For the year ended September 30, 2010, the Adviser reimbursed $5,336. Transactions with the affiliated company during the year ended September 30, 2010, were as follows:
| Affiliate | Balance of
Shares Held
9/30/2009 | Purchases/
Additions | Sales/
Reductions | Balance of
Shares Held
9/30/2010 | Value | Dividend
Income |
| Federated Prime Value Obligations Fund, Institutional Shares | 3,636,312 | 75,708,421 | 72,053,091 | 7,291,642 | $7,291,642 | $9,630 |
7. Investment TRANSACTIONS
Purchases and sales of investments, excluding long-term U.S. government securities and short-term obligations, for the year ended September 30, 2010, were as follows:
| Purchases | $120,907,008 |
| Sales | $91,534,267 |
Annual Shareholder Report24
8. LINE OF CREDIT
The Fund participates in a $100,000,000 unsecured, uncommitted revolving line of credit (LOC) agreement with PNC Bank. The LOC was made available for extraordinary or emergency purposes, primarily for financing redemption payments. Borrowings are charged interest at a rate offered to the Fund by PNC Bank at the time of the borrowing. As of September 30, 2010, there were no outstanding loans. During the year ended September 30, 2010, the Fund did not utilize the LOC.
9. INTERFUND LENDING
Pursuant to an Exemptive Order issued by the Securities and Exchange Commission, the Fund, along with other funds advised by subsidiaries of Federated Investors, Inc., may participate in an interfund lending program. This program provides an alternative credit facility allowing the Fund to borrow from other participating affiliated funds. As of September 30, 2010, there were no outstanding loans. During the year ended September 30, 2010, the program was not utilized.
10. Legal Proceedings
Since February, 2004, Federated Investors, Inc. and related entities (collectively, “Federated”), have been named as defendants in several lawsuits that are now pending in the United States District Court for the Western District of Pennsylvania. These lawsuits have been consolidated into a single action alleging excessive advisory fees involving one of the Federated-sponsored mutual funds (“Federated Funds”). Federated and its counsel have been defending this litigation. Additional lawsuits based upon similar allegations may be filed in the future. The potential impact of these lawsuits, all of which seek monetary damages, attorneys' fees and expenses, and future potential similar suits is uncertain. Although we do not believe that these lawsuits will have a material adverse effect on the Federated Funds, there can be no assurance that these suits, ongoing adverse publicity and/or other developments resulting from the allegations in these matters will not result in increased redemptions, or reduced sales, of shares of the Federated Funds or other adverse consequences for the Federated Funds.
11. Subsequent events
Management has evaluated subsequent events through the date the financial statements were issued, and determined that no events have occurred that require additional disclosure.
12. FEDERAL TAX INFORMATION (UNAUDITED)
For the fiscal year ended September 30, 2010, 100.0% of total income (including short-term capital gain) distributions made by the Fund are qualifying dividends which may be subject to a maximum tax rate of 15%, as provided for by the Jobs and Growth Tax Relief Act of 2003. Complete information is reported in conjunction with the reporting of your distributions on Form 1099-DIV.
Of the ordinary income (including short-term capital gain) distributions made by the Fund during the year ended September 30, 2010, 100.0% qualify for the dividend received deduction available to corporate shareholders.
Annual Shareholder Report25
Report of Independent Registered Public Accounting Firm
TO THE BOARD OF TRUSTEES OF THE FEDERATED EQUITY FUNDS AND SHAREHOLDERS OF Federated clover small value fund:
We have audited the accompanying statement of assets and liabilities, including the portfolio of investments, of the Federated Clover Small Value Fund (the “Fund”), a portfolio of Federated Equity Funds, as of September 30, 2010, and the related statement of operations for the year then ended, the statements of changes in net assets for each of the years or periods in the two-year period then ended, and the financial highlights for each of the years or periods in the two-year period then ended. These financial statements and financial highlights are the responsibility of the Fund's management. Our responsibility is to express an opinion on these financial statements and financial highlights based on our audits. The financial highlights for the periods presented prior to October 1, 2008, were audited by other independent registered public accountants whose report thereon dated November 25, 2008, expressed an unqualified opinion on those statements.
We conducted our audits in accordance with the standards of the Public Company Accounting Oversight Board (United States). Those standards require that we plan and perform the audit to obtain reasonable assurance about whether the financial statements and financial highlights are free of material misstatement. An audit includes examining, on a test basis, evidence supporting the amounts and disclosures in the financial statements. Our procedures included confirmation of securities owned as of September 30, 2010, by correspondence with the custodian, transfer agent and brokers, or by other appropriate auditing procedures. An audit also includes assessing the accounting principles used and significant estimates made by management, as well as evaluating the overall financial statement presentation. We believe that our audits provide a reasonable basis for our opinion.
In our opinion, the financial statements and financial highlights referred to above present fairly, in all material respects, the financial position of the Federated Clover Small Value Fund as of September 30, 2010, and the results of its operations for the year then ended, the changes in its net assets for the two years or periods in the period then ended, and the financial highlights for each of the years or periods in the two-year period then ended, in conformity with U.S. generally accepted accounting principles.
Boston, Massachusetts
November 22, 2010
Annual Shareholder Report26
Board of Trustees and Trust Officers
The Board of Trustees is responsible for managing the Trust's business affairs and for exercising all the Trust's powers except those reserved for the shareholders. The following tables give information about each Trustee and the senior officers of the Fund. Where required, the tables separately list Trustees who are “interested persons” of the Fund (i.e., “Interested” Trustees) and those who are not (i.e., “Independent” Trustees). Unless otherwise noted, the address of each person listed is Federated Investors Tower, 1001 Liberty Avenue, Pittsburgh, PA 15222. The address of all Independent Trustees listed is 4000 Ericsson Drive, Warrendale, PA 15086-7561; Attention: Mutual Fund Board. As of December 31, 2009, the Trust comprised 13 portfolio(s), and the Federated Fund Family consisted of 43 investment companies (comprising 145 portfolios). Unless otherwise noted, each Officer is elected annually. Unless otherwise noted, each Trustee oversees all portfolios in the Federated Fund Family and serves for an indefinite term. The Fund's Statement of Additional Information includes additional information about Trust Trustees and is available, without charge and upon request, by calling 1-800-341-7400.
Interested TRUSTEES Background
Name
Birth Date
Positions Held with Trust
Date Service Began | Principal Occupation(s) for Past Five Years,
Other Directorships Held and Previous Position(s) |
John F. Donahue*
Birth Date: July 28, 1924
Trustee
Began serving: April 1984 | Principal Occupations: Director or Trustee of the Federated Fund Family; Chairman and Director, Federated Investors, Inc.; Chairman of the Federated Fund Family's Executive Committee.
Previous Positions: Chairman of the Federated Fund Family; Trustee, Federated Investment Management Company; Chairman and Director, Federated Investment Counseling. |
J. Christopher Donahue*
Birth Date: April 11, 1949
President and Trustee
Began serving: January 2000 | Principal Occupations: Principal Executive Officer and President of the Federated Fund Family; Director or Trustee of some of the Funds in the Federated Fund Family; President, Chief Executive Officer and Director, Federated Investors, Inc.; Chairman and Trustee, Federated Investment Management Company; Trustee, Federated Investment Counseling; Chairman and Director, Federated Global Investment Management Corp.; Chairman, Federated Equity Management Company of Pennsylvania and Passport Research, Ltd. (investment advisory subsidiary of Federated); Trustee, Federated Shareholder Services Company; Director, Federated Services Company.
Previous Positions: President, Federated Investment Counseling; President and Chief Executive Officer, Federated Investment Management Company, Federated Global Investment Management Corp. and Passport Research, Ltd. |
| * | Family relationships and reasons for “interested” status: John F. Donahue is the father of J. Christopher Donahue; both are “interested” due to their beneficial ownership of shares of Federated Investors, Inc. and the positions they hold with Federated and its subsidiaries. |
Annual Shareholder Report27
INDEPENDENT TRUSTEES Background
Name
Birth Date
Positions Held with Trust
Date Service Began | Principal Occupation(s) for Past Five Years,
Other Directorships Held, Previous Position(s) and Qualifications |
John T. Conroy, Jr., Ph.D.
Birth Date: June 23, 1937
Trustee
Began serving: November 1991 | Principal Occupations: Director or Trustee of the Federated Fund Family; Chairman of the Board, Investment Properties Corporation; Partner or Trustee in private real estate ventures in Southwest Florida; Assistant Professor in Theology, Blessed Edmund Rice School for Pastoral Ministry.
Previous Positions: President, Investment Properties Corporation; Senior Vice President, John R. Wood and Associates, Inc., Realtors; President, Naples Property Management, Inc. and Northgate Village Development Corporation.
Qualifications: Business management and director experience. |
Nicholas P. Constantakis, CPA
Birth Date: September 3, 1939
Trustee
Began serving: February 1998 | Principal Occupation: Director or Trustee of the Federated Fund Family.
Other Directorship Held: Director and Chairman of the Audit Committee, Michael Baker Corporation (architecture, engineering and construction services).
Previous Position: Partner, Andersen Worldwide SC.
Qualifications: Public accounting and director experience. |
John F. Cunningham
Birth Date: March 5, 1943
Trustee
Began serving: January 1999 | Principal Occupation: Director or Trustee of the Federated Fund Family.
Other Directorships Held: Chairman, President and Chief Executive Officer, Cunningham & Co., Inc. (strategic business consulting); Trustee Associate, Boston College.
Previous Positions: Director, Redgate Communications and EMC Corporation (computer storage systems); Chairman of the Board and Chief Executive Officer, Computer Consoles, Inc.; President and Chief Operating Officer, Wang Laboratories; Director, First National Bank of Boston; Director, Apollo Computer, Inc.
Qualifications: Business management and director experience. |
Maureen Lally-Green
Birth Date: July 5, 1949
Trustee
Began serving: August 2009 | Principal Occupations: Director or Trustee of the Federated Fund Family; Director, Office of Church Relations, Diocese of Pittsburgh; Adjunct Professor of Law, Duquesne University School of Law.
Other Directorships Held: Trustee, St. Francis University; Director, Ireland Institute of Pittsburgh; Director, UPMC Mercy Hospital; Regent, St. Vincent Seminary; Director, Epilepsy Foundation of Western and Central Pennsylvania; Director, Saint Thomas More Society, Allegheny County; Director, Carlow University.
Previous Position: Pennsylvania Superior Court Judge.
Qualifications: Legal and director experience. |
Annual Shareholder Report28
Name
Birth Date
Positions Held with Trust
Date Service Began | Principal Occupation(s) for Past Five Years,
Other Directorships Held, Previous Position(s) and Qualifications |
Peter E. Madden
Birth Date: March 16, 1942
Trustee
Began serving: November 1991 | Principal Occupation: Director or Trustee, and Chairman of the Board of Directors or Trustees, of the Federated Fund Family.
Other Directorship Held: Board of Overseers, Babson College.
Previous Positions: Representative, Commonwealth of Massachusetts General Court; President, Chief Operating Officer and Director, State Street Bank and Trust Company and State Street Corporation (retired); Director, VISA USA and VISA International; Chairman and Director, Massachusetts Bankers Association; Director, Depository Trust Corporation; Director, The Boston Stock Exchange.
Qualifications: Business management, mutual fund services and director experience. |
Charles F. Mansfield, Jr.
Birth Date: April 10, 1945
Trustee
Began serving: January 1999 | Principal Occupations: Director or Trustee and Chairman of the Audit Committee of the Federated Fund Family; Management Consultant.
Previous Positions: Chief Executive Officer, PBTC International Bank; Partner, Arthur Young & Company (now Ernst & Young LLP); Chief Financial Officer of Retail Banking Sector, Chase Manhattan Bank; Senior Vice President, HSBC Bank USA (formerly, Marine Midland Bank); Vice President, Citibank; Assistant Professor of Banking and Finance, Frank G. Zarb School of Business, Hofstra University; Executive Vice President, DVC Group, Inc. (marketing, communications and technology).
Qualifications: Banking, business management, public accounting and director experience. |
R. James Nicholson
Birth Date: February 4, 1938
Trustee
Began serving: January 2008 | Principal Occupations: Director or Trustee of the Federated Fund Family; Senior Counsel, Brownstein Hyatt Farber Schrek, P.C.; Former Secretary of the U.S. Dept. of Veterans Affairs; Former U.S. Ambassador to the Holy See; Former Chairman of the Republican National Committee.
Other Directorships Held: Director, Horatio Alger Association; Director, The Daniels Fund.
Previous Positions: Colonel, U.S. Army Reserve; Partner, Calkins, Kramer, Grimshaw and Harring, P.C.; General Counsel, Colorado Association of Housing and Building; Chairman and CEO, Nicholson Enterprises, Inc. (real estate holding company); Chairman and CEO, Renaissance Homes of Colorado.
Qualifications: Legal, government, business management and mutual fund director experience. |
Annual Shareholder Report29
Name
Birth Date
Positions Held with Trust
Date Service Began | Principal Occupation(s) for Past Five Years,
Other Directorships Held, Previous Position(s) and Qualifications |
Thomas M. O'Neill
Birth Date: June 14, 1951
Trustee
Began serving: October 2006 | Principal Occupations: Director or Trustee of the Federated Fund Family; Sole Proprietor, Navigator Management Company (investment and strategic consulting).
Other Directorships Held: Board of Overseers, Children's Hospital of Boston; Visiting Committee on Athletics, Harvard College.
Previous Positions: Chief Executive Officer and President, Managing Director and Chief Investment Officer, Fleet Investment Advisors; President and Chief Executive Officer, Aeltus Investment Management, Inc.; General Partner, Hellman, Jordan Management Co., Boston, MA; Chief Investment Officer, The Putnam Companies, Boston, MA; Credit Analyst and Lending Officer, Fleet Bank; Director and Consultant, EZE Castle Software (investment order management software); Director, Midway Pacific (lumber).
Qualifications: Business management, mutual fund, director and investment experience. |
John S. Walsh
Birth Date: November 28, 1957
Trustee
Began serving: January 1999 | Principal Occupations: Director or Trustee of the Federated Fund Family; President and Director, Heat Wagon, Inc. (manufacturer of construction temporary heaters); President and Director, Manufacturers Products, Inc. (distributor of portable construction heaters); President, Portable Heater Parts, a division of Manufacturers Products, Inc.
Previous Position: Vice President, Walsh & Kelly, Inc.
Qualifications: Business management and director experience. |
James F. Will
Birth Date: October 12, 1938
Trustee
Began serving: April 2006 | Principal Occupations: Director or Trustee of the Federated Fund Family; formerly, Vice Chancellor and President, Saint Vincent College.
Other Directorships Held: Trustee, Saint Vincent College; Director, Alleghany Corporation; Trustee, Wheeling Jesuit University; Director, Liberty Tire Recycling.
Previous Positions: Chairman, President and Chief Executive Officer, Armco, Inc.; President and Chief Executive Officer, Cyclops Industries; President and Chief Operating Officer, Kaiser Steel Corporation.
Qualifications: Business management, education and director experience. |
Annual Shareholder Report30
OFFICERS
Name
Birth Date
Address
Positions Held with Trust
Date Service Began | Principal Occupation(s) for Past Five Years
and Previous Position(s) |
John W. McGonigle
Birth Date: October 26, 1938
EXECUTIVE VICE PRESIDENT AND SECRETARY
Began serving: April 1984 | Principal Occupations: Executive Vice President and Secretary of the Federated Fund Family; Vice Chairman, Executive Vice President, Secretary and Director, Federated Investors, Inc.
Previous Positions: Trustee, Federated Investment Management Company and Federated Investment Counseling; Director, Federated Global Investment Management Corp., Federated Services Company and Federated Securities Corp. |
Richard A. Novak
Birth Date: December 25, 1963
TREASURER
Began serving: January 2006 | Principal Occupations: Principal Financial Officer and Treasurer of the Federated Fund Family; Senior Vice President, Federated Administrative Services; Financial and Operations Principal for Federated Securities Corp., Edgewood Services, Inc. and Southpointe Distribution Services, Inc.
Previous Positions: Controller of Federated Investors, Inc.; Vice President, Finance of Federated Services Company; held various financial management positions within The Mercy Hospital of Pittsburgh; Auditor, Arthur Andersen & Co. |
Brian P. Bouda
Birth Date: February 28, 1947
CHIEF COMPLIANCE OFFICER AND SENIOR VICE PRESIDENT
Began serving: August 2004 | Principal Occupations: Senior Vice President and Chief Compliance Officer of the Federated Fund Family; Vice President and Chief Compliance Officer of Federated Investors, Inc. and Chief Compliance Officer of its subsidiaries. Mr. Bouda joined Federated in 1999 and is a member of the American Bar Association and the State Bar Association of Wisconsin. |
Stephen F. Auth
Birth Date: September 3, 1956
450 Lexington Avenue
Suite 3700
New York, NY 10017-3943
CHIEF INVESTMENT OFFICER
Began serving: November 2002 | Principal Occupations: Mr. Auth is Chief Investment Officer of this Fund and various other Funds in the Federated Fund Family; Executive Vice President, Federated Investment Counseling, Federated Global Investment Management Corp. and Federated Equity Management Company of Pennsylvania.
Previous Positions: Executive Vice President, Federated Investment Management Company, and Passport Research, Ltd. (investment advisory subsidiary of Federated); Senior Vice President, Global Portfolio Management Services Division; Senior Vice President, Federated Investment Management Company and Passport Research, Ltd.; Senior Managing Director and Portfolio Manager, Prudential Investments. |
Lawrence Auriana
Birth Date: January 8, 1944
140 East 45th Street
New York, NY 10017
VICE PRESIDENT
Began serving: November 2001 | Principal Occupations: Lawrence Auriana is Vice President of the Trust. Mr. Auriana joined Federated in April 2001 as Co-Head of Investments/Federated Kaufmann. From August 1984 to April 2001, Mr. Auriana was President and Treasurer of Edgemont Asset Management Corp., and Chairman of the Board and Portfolio Manager to The Kaufmann Fund, Inc. (predecessor to the Federated Kaufmann Fund). Mr. Auriana earned a B.S. in economics from Fordham University and has been engaged in the securities business since 1965. |
Annual Shareholder Report31
Name
Birth Date
Address
Positions Held with Trust
Date Service Began | Principal Occupation(s) for Past Five Years
and Previous Position(s) |
Walter C. Bean
Birth Date: June 22, 1945
VICE PRESIDENT
Began serving: November 2006 | Principal Occupations: Walter C. Bean is Vice President of the Trust. Mr. Bean is a Senior Vice President, Senior Portfolio Manager and the Head of the Equity Income Management Team of the Fund's Adviser. Mr. Bean joined Federated in 2000. His previous associations included: various investment management and research positions with C.S. McKee & Company; First Chicago Investment Advisors; CIGNA Investment Advisors; and Mellon Bank. Mr. Bean earned a Bachelors Degree in Business Administration from Ohio University and an M.B.A. from the Pennsylvania State University. Mr. Bean has received the Chartered Financial Analyst designation and has 36 years of investment experience. |
Richard B. Fisher
Birth Date: May 17, 1923
VICE PRESIDENT
Began serving: APRIL 1984 | Principal Occupations: Vice Chairman or Vice President of some of the Funds in the Federated Fund Family; Vice Chairman, Federated Investors, Inc.; Chairman, Federated Securities Corp.
Previous Positions: President and Director or Trustee of some of the Funds in the Federated Fund Family; Executive Vice President, Federated Investors, Inc.; Director and Chief Executive Officer, Federated Securities Corp. |
Hans P. Utsch
Birth Date: July 3, 1936
140 East 45th Street
New York, NY 10017
VICE PRESIDENT
Began serving: November 2001 | Principal Occupations: Hans P. Utsch is Vice President of the Trust. Mr. Utsch joined Federated in April 2001 as Co-Head of Investments/Federated Kaufmann. From August 1984 to April 2001, Mr. Utsch was Chairman of the Board and Secretary of Edgemont Asset Management Corp., and President and Portfolio Manager to The Kaufmann Fund, Inc. (predecessor to the Federated Kaufmann Fund). Mr. Utsch graduated from Amherst College and holds an M.B.A. from Columbia University. He has been engaged in the securities business since 1962. |
Annual Shareholder Report32
Evaluation and Approval of Advisory Contract - May 2010
Federated Clover Small Value Fund (the “Fund”)
The Fund's Board reviewed the Fund's investment advisory contract at meetings held in May 2010. The Board's decision regarding the contract reflects the exercise of its business judgment on whether to continue the existing arrangements.
In this connection, the Federated funds' Board had previously appointed a Senior Officer, whose duties include specified responsibilities relating to the process by which advisory fees are to be charged to a Federated fund. The Senior Officer has the authority to retain consultants, experts, or staff as may be reasonably necessary to assist in the performance of his duties, reports directly to the Board, and may be terminated only with the approval of a majority of the independent members of the Board. The Senior Officer prepared and furnished to the Board an independent, written evaluation that covered topics discussed below. The Board considered that evaluation, along with other information, in deciding to approve the advisory contract.
During its review of the contract, the Board considered compensation and benefits received by the Adviser. This included the fees received for services provided to the Fund by other entities in the Federated organization and research services (if any) received by the Adviser from brokers that execute Federated fund trades, as well as advisory fees. The Board is also familiar with and considered judicial decisions concerning allegedly excessive investment advisory fees, which have indicated that the following factors may be relevant to an Adviser's fiduciary duty with respect to its receipt of compensation from a fund: the nature and quality of the services provided by the Adviser, including the performance of the fund; the Adviser's cost of providing the services; the extent to which the Adviser may realize “economies of scale” as a fund grows larger; any indirect benefits that may accrue to the Adviser and its affiliates as a result of the Adviser's relationship with a fund; performance and expenses of comparable funds; and the extent to which the independent Board members are fully informed about all facts the Board deems relevant bearing on the Adviser's services and fees. The Board further considered management fees (including any components thereof) charged to institutional and other clients of the Adviser for what might be viewed as like services, and the cost to the Adviser and its affiliates of supplying services pursuant to the management fee agreements, excluding any intra-corporate profit and profit margins of the Adviser and its affiliates for supplying such services. The Board was aware of these factors and was guided by them in its review of the Fund's advisory contract to the extent it considered them to be appropriate and relevant, as discussed further below.
Annual Shareholder Report33
The Board considered and weighed these circumstances in light of its substantial accumulated experience in governing the Fund and working with Federated on matters relating to the Federated funds, and was assisted in its deliberations by independent legal counsel. Throughout the year, the Board has requested and received substantial and detailed information about the Fund and the Federated organization that was in addition to the extensive materials that comprise and accompany the Senior Officer's evaluation. Federated provided much of this information at each regular meeting of the Board, and furnished additional reports in connection with the particular meeting at which the Board's formal review of the advisory contract occurred. Between regularly scheduled meetings, the Board also received information on particular matters as the need arose. Thus, the Board's consideration of the advisory contract included review of the Senior Officer's evaluation, accompanying data and additional reports covering such matters as: the Adviser's investment philosophy, revenue, profitability, personnel and processes; investment and operating strategies; the Fund's short- and long-term performance (in absolute terms, both on a gross basis and net of expenses, as well as in relationship to its particular investment program and certain competitor or “peer group” funds and/or other benchmarks, as appropriate), and comments on the reasons for performance; the Fund's investment objectives; the Fund's expenses (including the advisory fee itself and the overall expense structure of the Fund, both in absolute terms and relative to similar and/or competing funds, with due regard for contractual or voluntary expense limitations); the use and allocation of brokerage commissions derived from trading the Fund's portfolio securities (if any); and the nature, quality and extent of the advisory and other services provided to the Fund by the Adviser and its affiliates. The Board also considered the preferences and expectations of Fund shareholders and their relative sophistication; the continuing state of competition in the mutual fund industry and market practices; the range of comparable fees for similar funds in the mutual fund industry; the Fund's relationship to the Federated family of funds which include a comprehensive array of funds with different investment objectives, policies and strategies which are available for exchange without the incurrence of additional sales charges; compliance and audit reports concerning the Federated funds and the Federated companies that service them (including communications from regulatory agencies), as well as Federated's responses to any issues raised therein; and relevant developments in the mutual fund industry and how the Federated funds and/or Federated are responding to them. The Board's evaluation process is evolutionary. The criteria considered and the emphasis placed on relevant criteria change in recognition of changing circumstances in the mutual fund marketplace. With respect to the Fund's performance and expenses in particular, the Board has found the use of comparisons to other mutual funds with comparable investment programs to be relevant, given the high degree of competition in the mutual fund business. The Board focused on comparisons with other similar Annual Shareholder Report34
mutual funds more heavily than non-mutual fund products or services because it is believed that they are more relevant. For example, other mutual funds are the products most like the Fund, they are readily available to Fund shareholders as alternative investment vehicles, and they are the type of investment vehicle in fact chosen and maintained by the Fund's investors. The range of their fees and expenses therefore appears to be a generally reliable indication of what consumers have found to be reasonable in the precise marketplace in which the Fund competes. The Fund's ability to deliver competitive performance when compared to its peer group was a useful indicator of how the Adviser is executing the Fund's investment program, which in turn assisted the Board in reaching a conclusion that the nature, extent, and quality of the Adviser's investment management services were such as to warrant continuation of the advisory contract. In this regard, the Senior Officer has reviewed Federated's fees for providing advisory services to products outside the Federated family of funds (e.g., institutional and separate accounts). He concluded that mutual funds and institutional accounts are inherently different products. Those differences include, but are not limited to, different types of targeted investors; being subject to different laws and regulations; different legal structures; different average account sizes; different associated costs; different portfolio management techniques made necessary by different cash flows; and portfolio manager time spent in review of securities pricing. The Senior Officer did not consider these fee schedules to be determinative in judging the appropriateness of mutual fund advisory contracts.The Senior Officer reviewed reports compiled by Federated, using data supplied by independent fund ranking organizations, regarding the performance of, and fees charged by, other mutual funds, noting his view that comparisons to fund peer groups are relevant in judging the reasonableness of proposed fees.
For the periods covered by the report, the Fund's performance for the three-year and five-year periods was above the median of the relevant peer group, and the Fund's performance fell below the median of the relevant peer group for the one-year period. The Board discussed the Fund's performance with the Adviser and recognized the efforts being undertaken by the Adviser. The Board will continue to monitor these efforts and the performance of the Fund.
The Board also received financial information about Federated, including reports on the compensation and benefits Federated derived from its relationships with the Federated funds. These reports covered not only the fees under the advisory contracts, but also fees received by Federated's subsidiaries for providing other services to the Federated funds under separate contracts (e.g., for serving as the Federated funds' administrator). The reports also discussed any indirect benefit Federated may derive from its receipt of research services from brokers who execute Federated fund trades. In addition, the Board considered the fact that, in order for a fund to be competitive in the marketplace, Federated and its affiliates frequently waived fees and/or Annual Shareholder Report35
reimbursed expenses and have disclosed to fund investors and/or indicated to the Board their intention to do so in the future, where appropriate. Moreover, the Board receives regular reports regarding the institution or elimination of these voluntary waivers.Federated furnished reports, requested by the Senior Officer, that reported revenues on a fund-by-fund basis and made estimates of the allocation of expenses on a fund-by-fund basis, using allocation methodologies specified by the Senior Officer. The Senior Officer noted that, although they may apply consistent allocation processes, the inherent difficulties in allocating costs (and the unavoidable arbitrary aspects of that exercise) and the lack of consensus on how to allocate those costs may render such allocation reports unreliable. The allocation reports were considered in the analysis by the Board but were determined to be of limited use.
The Board and the Senior Officer also reviewed a report compiled by Federated comparing profitability information for Federated to other publicly held fund management companies. In this regard, the Senior Officer noted the limited availability of such information, but nonetheless concluded that Federated's profit margins did not appear to be excessive and the Board agreed.
The Senior Officer's evaluation also discussed the notion of possible realization of “economies of scale” as a fund grows larger. The Board considered in this regard that the Adviser has made significant and long-term investments in areas that support all of the Federated funds, such as personnel and processes for the portfolio management, compliance, and risk management functions; and systems technology; and that the benefits of these efforts (as well as any economies, should they exist) were likely to be enjoyed by the fund complex as a whole. Finally, the Board also noted the absence of any applicable regulatory or industry guidelines on this subject, which (as discussed in the Senior Officer's evaluation) is compounded by the lack of any common industry practice or general pattern with respect to structuring fund advisory fees with “breakpoints” that serve to reduce the fee as the fund attains a certain size. The Senior Officer did not recommend institution of breakpoints in pricing Federated's fund advisory services at this time.
It was noted in the materials for the Board meeting that for the period covered by the report, the Fund's investment advisory fee, after waivers and expense reimbursements, if any, was above the median of the relevant peer group. The Board reviewed the fees and other expenses of the Fund with the Adviser and was satisfied that the overall expense structure of the Fund remained competitive. The Board will continue to monitor advisory fees and other expenses borne by the Fund.
The Senior Officer's evaluation noted his belief that the information and observations contained in his evaluation supported a finding that the proposed management fees are reasonable, and that Federated appeared to provide appropriate administrative services to the Fund for the fees paid. Under these Annual Shareholder Report36
circumstances, no changes were recommended to, and no objection was raised to, the continuation of the Fund's advisory contract. The Board concluded that the nature, quality and scope of services provided the Fund by the Adviser and its affiliates were satisfactory.In its decision to continue an existing investment advisory contract, the Board was mindful of the potential disruptions of the Fund's operations and various risks, uncertainties and other effects that could occur as a result of a decision to terminate or not renew an advisory contract. In particular, the Board recognized that many shareholders have invested in the Fund on the strength of the Adviser's industry standing and reputation and with the expectation that the Adviser will have a continuing role in providing advisory services to the Fund. Thus, the Board's approval of the advisory contract reflected the fact that it is the shareholders who have effectively selected the Adviser by virtue of having invested in the Fund.
The Board based its decision to approve the advisory contract on the totality of the circumstances and relevant factors and with a view to past and future long-term considerations. Not all of the factors and considerations identified above were necessarily relevant to the Fund, nor did the Board consider any one of them to be determinative. With respect to the factors that were relevant, the Board's decision to approve the contract reflects its determination that Federated's performance and actions provided a satisfactory basis to support the decision to continue the existing arrangements.
Annual Shareholder Report37
Voting Proxies on Fund Portfolio Securities
A description of the policies and procedures that the Fund uses to determine how to vote proxies, if any, relating to securities held in the Fund's portfolio is available, without charge and upon request, by calling 1-800-341-7400. A report on “Form N-PX” of how the Fund voted any such proxies during the most recent 12-month period ended June 30 is available from Federated's website at FederatedInvestors.com. To access this information from the “Products” section of the website, click on the “Prospectuses and Regulatory Reports” link under “Related Information,” then select the appropriate link opposite the name of the Fund; or select the name of the Fund and from the Fund's page, click on the “Prospectuses and Regulatory Reports” link. Form N-PX filings are also available at the SEC's website at www.sec.gov.
Quarterly Portfolio Schedule
The Fund files with the SEC a complete schedule of its portfolio holdings, as of the close of the first and third quarters of its fiscal year, on “Form N-Q.” These filings are available on the SEC's website at www.sec.gov and may be reviewed and copied at the SEC's Public Reference Room in Washington, DC. (Call 1-800-SEC-0330 for information on the operation of the Public Reference Room.) You may also access this information from the “Products” section of Federated's website at FederatedInvestors.com by clicking on “Portfolio Holdings” under “Related Information,” then selecting the appropriate link opposite the name of the Fund; or select the name of the Fund and from the Fund's page, click on the “Portfolio Holdings” link.
Annual Shareholder Report38
Mutual funds are not bank deposits or obligations, are not guaranteed by any bank and are not insured or guaranteed by the U.S. government, the Federal Deposit Insurance Corporation, the Federal Reserve Board or any other government agency. Investment in mutual funds involves investment risk, including the possible loss of principal.
This Report is authorized for distribution to prospective investors only when preceded or accompanied by the Fund's Prospectus, which contains facts concerning its objective and policies, management fees, expenses and other information.
Federated Clover Small Value Fund
Federated Investors Funds
4000 Ericsson Drive
Warrendale, PA 15086-7561
Contact us at FederatedInvestors.com
or call 1-800-341-7400.
Federated Securities Corp., Distributor
Cusip 314172263
41199 (11/10)
Federated is a registered mark of Federated Investors, Inc.
2010 © Federated Investors, Inc.
Federated Clover Value Fund(Successor to the Touchstone Value Opportunities Fund Established 1991)
A Portfolio of Federated Equity Funds
ANNUAL SHAREHOLDER REPORTSeptember 30, 2010
Class A Shares
Class B Shares
Class C Shares
Class K Shares
(Effective December 31, 2010, the Fund's Class K Shares will be redesignated as Class R Shares)
FINANCIAL HIGHLIGHTS
SHAREHOLDER EXPENSE EXAMPLE
MANAGEMENT'S DISCUSSION OF FUND PERFORMANCE
PORTFOLIO OF INVESTMENTS SUMMARY TABLE
PORTFOLIO OF INVESTMENTS
STATEMENT OF ASSETS AND LIABILITIES
STATEMENT OF OPERATIONS
STATEMENT OF CHANGES IN NET ASSETS
NOTES TO FINANCIAL STATEMENTS
REPORT OF INDEPENDENT REGISTERED PUBLIC ACCOUNTING FIRM
BOARD OF TRUSTEES AND TRUST OFFICERS
EVALUATION AND APPROVAL OF ADVISORY CONTRACT
VOTING PROXIES ON FUND PORTFOLIO SECURITIES
QUARTERLY PORTFOLIO SCHEDULE
Financial Highlights - Class A Shares
(For a Share Outstanding Throughout Each Period)
| Year Ended September 30, | Period Ended
9/30/20071,3,4 |
| 2010 | 20091,2 | 20081,3 |
| Net Asset Value, Beginning of Period | $12.61 | $14.10 | $18.70 | $20.44 |
| Income From Investment Operations: | | | | |
| Net investment income | 0.085 | 0.185 | 0.19 | 0.10 |
| Net realized and unrealized gain (loss) on investments | 0.39 | (1.48) | (3.11) | 2.04 |
| TOTAL FROM INVESTMENT OPERATIONS | 0.47 | (1.30) | (2.92) | 2.14 |
| Less Distributions: | | | | |
| Distributions from net investment income | (0.08) | (0.19) | (0.18) | (0.13) |
| Distributions from net realized gain on investments | — | — | (1.50) | (3.75) |
| TOTAL DISTRIBUTIONS | (0.08) | (0.19) | (1.68) | (3.88) |
| Net Asset Value, End of Period | $13.00 | $12.61 | $14.10 | $18.70 |
| Total Return6 | 3.72% | (9.03)% | (17.01)% | 11.90% |
| Ratios to Average Net Assets: | | | | |
| Net expenses | 1.19%7 | 1.19%7 | 1.20% | 1.31%8 |
| Net investment income | 0.63% | 1.70% | 1.25% | 0.77%8 |
| Expense waiver/reimbursement9 | 0.21% | 0.19% | 0.48% | 0.00%8,10 |
| Supplemental Data: | | | | |
| Net assets, end of period (000 omitted) | $575,762 | $707,394 | $8,231 | $472 |
| Portfolio turnover | 76% | 73% | 96% | 62% |
| 1 | Touchstone Value Opportunities Fund (the “Predecessor Fund”) was reorganized into Federated Clover Value Fund (the “Fund”) as of the close of business on August 28, 2009. The Fund is the successor to the Predecessor Fund. The performance information and financial information presented incorporates the operations of the Predecessor Fund, which, as a result of the reorganization, are the Fund's operations. See Note 2 to the Financial Statements. |
| 2 | Beginning with the year ended September 30, 2009, the Fund was audited by KPMG LLP. The previous years were audited by another independent registered public accounting firm. |
| 3 | Due to the reorganization: (1) the number of outstanding shares of the Predecessor Fund decreased by a factor of 1.05; and (2) since the Predecessor Fund's total number of shares outstanding decreased, the net asset value increased. The reorganization did not affect the value of the Predecessor Fund's net assets of each shareholder's proportional ownership interest in those assets. Per share data has been restated, where applicable. |
| 4 | Reflects operations for the period from November 20, 2006 (commencement of operations) to September 30, 2007. |
| 5 | Per share numbers have been calculated using the average shares method. |
| 6 | Based on net asset value, which does not reflect the sales charge, redemption fee or contingent deferred sales charge, if applicable. Total returns for periods of less than one year are not annualized. |
| 7 | The net expense ratio is calculated without reduction for fees paid indirectly for expense offset arrangements. The net expense ratios are 1.19% and 1.19% for the years ended September 30, 2010 and 2009, respectively, after taking into account these expense reductions. |
| 8 | Computed on an annualized basis. |
| 9 | This expense decrease is reflected in both the net expense and the net investment income ratios shown above. |
| 10 | Represents less than 0.01%. |
See Notes which are an integral part of the Financial Statements
Annual Shareholder Report1
Financial Highlights - Class B Shares
(For a Share Outstanding Throughout Each Period)
| Year Ended
9/30/2010 | Period
Ended
9/30/20091 |
| Net Asset Value, Beginning of Period | $12.59 | $12.26 |
| Income From Investment Operations: | | |
| Net investment income (loss) | (0.01)2 | (0.00)2,3 |
| Net realized and unrealized gain on investments | 0.38 | 0.33 |
| TOTAL FROM INVESTMENT OPERATIONS | 0.37 | 0.33 |
| Less Distributions: | | |
| Distributions from net investment income | (0.00)3 | — |
| Net Asset Value, End of Period | $12.96 | $12.59 |
| Total Return4 | 2.96% | 2.69% |
| Ratios to Average Net Assets: | | |
| Net expenses | 1.92%5 | 1.92%5,6 |
| Net investment income (loss) | (0.11)% | (0.23)%6 |
| Expense waiver/reimbursement7 | 0.36% | 0.69%6 |
| Supplemental Data: | | |
| Net assets, end of period (000 omitted) | $57,625 | $79,164 |
| Portfolio turnover | 76% | 73%8 |
| 1 | Reflects operations for the period from August 29, 2009 (deemed the date of initial investment, pursuant to a reorganization that took place on August 28, 2009) to September 30, 2009. See Note 2 to the Financial Statements. |
| 2 | Per share numbers have been calculated using the average shares method. |
| 3 | Represents less than $0.01. |
| 4 | Based on net asset value, which does not reflect the sales charge, redemption fee or contingent deferred sales charge, if applicable. Total returns for periods of less than one year are not annualized. |
| 5 | The net expense ratio is calculated without reduction for fees paid indirectly for expense offset arrangements. The net expense ratios are 1.92% and 1.92% for the year ended September 30, 2010 and for the period ended September 30, 2009, respectively, after taking into account these expense reductions. |
| 6 | Computed on an annualized basis. |
| 7 | This expense decrease is reflected in both the net expense and the net investment income (loss) ratios shown above. |
| 8 | Portfolio turnover is calculated at the Fund level. Percentage indicated was calculated for the year ended September 30, 2009. |
See Notes which are an integral part of the Financial Statements
Annual Shareholder Report2
Financial Highlights - Class C Shares
(For a Share Outstanding Throughout Each Period)
| Year Ended September 30, | Period Ended
9/30/20071,3,4 |
| 2010 | 20091,2 | 20081,3 |
| Net Asset Value, Beginning of Period | $12.61 | $14.10 | $18.71 | $20.49 |
| Income From Investment Operations: | | | | |
| Net investment income (loss) | (0.01)5 | 0.095 | 0.12 | 0.05 |
| Net realized and unrealized gain (loss) on investments | 0.38 | (1.47) | (3.17) | 2.02 |
| TOTAL FROM INVESTMENT OPERATIONS | 0.37 | (1.38) | (3.05) | 2.07 |
| Less Distributions: | | | | |
| Distributions from net investment income | (0.00)6 | (0.11) | (0.06) | (0.10) |
| Distributions from net realized gain on investments | — | — | (1.50) | (3.75) |
| TOTAL DISTRIBUTIONS | (0.00)6 | (0.11) | (1.56) | (3.85) |
| Net Asset Value, End of Period | $12.98 | $12.61 | $14.10 | $18.71 |
| Total Return7 | 2.95% | (9.67)% | (17.62)% | 11.52% |
| Ratios to Average Net Assets: | | | | |
| Net expenses | 1.92%8 | 1.94%8 | 1.95% | 1.86%9 |
| Net investment income (loss) | (0.11)% | 0.84% | 0.55% | 0.20%9 |
| Expense waiver/reimbursement10 | 0.26% | 0.67% | 0.61% | 0.00%9,11 |
| Supplemental Data: | | | | |
| Net assets, end of period (000 omitted) | $38,708 | $39,007 | $3,865 | $423 |
| Portfolio turnover | 76% | 73% | 96% | 62% |
| 1 | Touchstone Value Opportunities Fund (the “Predecessor Fund”) was reorganized into Federated Clover Value Fund (the “Fund”) as of the close of business on August 28, 2009. The Fund is the successor to the Predecessor Fund. The performance information and financial information presented incorporates the operations of the Predecessor Fund, which, as a result of the reorganization, are the Fund's operations. See Note 2 to the Financial Statements. |
| 2 | Beginning with the year ended September 30, 2009, the Fund was audited by KPMG LLP. The previous years were audited by another independent registered public accounting firm. |
| 3 | Due to the reorganization: (1) the number of outstanding shares of the Predecessor Fund decreased by a factor of 1.05; and (2) since the Predecessor Fund's total number of shares outstanding decreased, the net asset value increased. The reorganization did not affect the value of the Predecessor Fund's net assets of each shareholder's proportional ownership interest in those assets. Per share data has been restated, where applicable. |
| 4 | Reflects operations for the period from November 20, 2006 (commencement of operations) to September 30, 2007. |
| 5 | Per share numbers have been calculated using the average shares method. |
| 6 | Represents less than $0.01. |
| 7 | Based on net asset value, which does not reflect the sales charge, redemption fee or contingent deferred sales charge, if applicable. Total returns for periods of less than one year are not annualized. |
| 8 | The net expense ratio is calculated without reduction for fees paid indirectly for expense offset arrangements. The net expense ratios are 1.92% and 1.94% for the years ended September 30, 2010 and 2009, respectively, after taking into account these expense reductions. |
| 9 | Computed on an annualized basis. |
| 10 | This expense decrease is reflected in both the net expense and the net investment income (loss) ratios shown above. |
| 11 | Represents less than 0.01%. |
See Notes which are an integral part of the Financial Statements
Annual Shareholder Report3
Financial Highlights - Class K Shares
(For a Share Outstanding Throughout Each Period)
| Year Ended
9/30/2010 | Period
Ended
9/30/20091 |
| Net Asset Value, Beginning of Period | $12.62 | $12.29 |
| Income From Investment Operations: | | |
| Net investment income | 0.022 | 0.002,3 |
| Net realized and unrealized gain on investments | 0.39 | 0.33 |
| TOTAL FROM INVESTMENT OPERATIONS | 0.41 | 0.33 |
| Less Distributions: | | |
| Distributions from net investment income | (0.02) | — |
| Net Asset Value, End of Period | $13.01 | $12.62 |
| Total Return4 | 3.22% | 2.69% |
| Ratios to Average Net Assets: | | |
| Net expenses | 1.67%5 | 1.67%5,6 |
| Net investment income | 0.14% | 0.04%6 |
| Expense waiver/reimbursement7 | 0.13% | 0.55%6 |
| Supplemental Data: | | |
| Net assets, end of period (000 omitted) | $14,733 | $12,462 |
| Portfolio turnover | 76% | 73%8 |
| 1 | Reflects operations for the period from August 29, 2009 (deemed the date of initial investment, pursuant to a reorganization that took place on August 28, 2009) to September 30, 2009. See Note 2 to the Financial Statements. |
| 2 | Per share numbers have been calculated using the average shares method. |
| 3 | Represents less than $0.01. |
| 4 | Based on net asset value. Total returns for periods of less than one year are not annualized. |
| 5 | The net expense ratio is calculated without reduction for fees paid indirectly for expense offset arrangements. The net expense ratios are 1.67% and 1.67% for the year ended September 30, 2010 and for the period ended September 30, 2009, respectively, after taking into account these expense reductions. |
| 6 | Computed on an annualized basis. |
| 7 | This expense decrease is reflected in both the net expense and the net investment income ratios shown above. |
| 8 | Portfolio turnover is calculated at the Fund level. Percentage indicated was calculated for the year ended September 30, 2009. |
See Notes which are an integral part of the Financial Statements
Annual Shareholder Report4
Shareholder Expense Example (unaudited)
As a shareholder of the Fund, you incur two types of costs: (1) transaction costs, including sales charges (loads) on purchase or redemption payments; and (2) ongoing costs, including management fees and to the extent applicable, distribution (12b-1) fees and/or shareholder services fees and other Fund expenses. This Example is intended to help you to understand your ongoing costs (in dollars) of investing in the Fund and to compare these costs with the ongoing costs of investing in other mutual funds. It is based on an investment of $1,000 invested at the beginning of the period and held for the entire period from April 1, 2010 to September 30, 2010.
ACTUAL EXPENSES
The first section of the table below provides information about actual account values and actual expenses. You may use the information in this section, together with the amount you invested, to estimate the expenses that you incurred over the period. Simply divide your account value by $1,000 (for example, an $8,600 account value divided by $1,000 = 8.6), then multiply the result by the number in the first section under the heading entitled “Expenses Paid During Period” to estimate the expenses attributable to your investment during this period.
HYPOTHETICAL EXAMPLE FOR COMPARISON PURPOSES
The second section of the table below provides information about hypothetical account values and hypothetical expenses based on the Fund's actual expense ratio and an assumed rate of return of 5% per year before expenses, which is not the Fund's actual return. Thus, you should not use the hypothetical account values and expenses to estimate the actual ending account balance or your expenses for the period. Rather, these figures are required to be provided to enable you to compare the ongoing costs of investing in the Fund with other funds. To do so, compare this 5% hypothetical example with the 5% hypothetical examples that appear in the shareholder reports of the other funds.
Annual Shareholder Report5
Please note that the expenses shown in the table are meant to highlight your ongoing costs only and do not reflect any transaction costs, such as sales charges (loads) on purchase or redemption payments. Therefore, the second section of the table is useful in comparing ongoing costs only, and will not help you determine the relative total costs of owning different funds. In addition, if these transaction costs were included, your costs would have been higher. | Beginning
Account Value
4/1/2010 | Ending
Account Value
9/30/2010 | Expenses Paid
During Period1 |
| Actual: | | | |
| Class A Shares | $1,000 | $943.50 | $5.80 |
| Class B Shares | $1,000 | $940.50 | $9.34 |
| Class C Shares | $1,000 | $940.60 | $9.34 |
| Class K Shares | $1,000 | $941.70 | $8.13 |
Hypothetical (assuming a 5% return
before expenses): | | | |
| Class A Shares | $1,000 | $1,019.10 | $6.02 |
| Class B Shares | $1,000 | $1,015.44 | $9.70 |
| Class C Shares | $1,000 | $1,015.44 | $9.70 |
| Class K Shares | $1,000 | $1,016.70 | $8.44 |
| 1 | Expenses are equal to the Fund's annualized net expense ratios, multiplied by the average account value over the period, multiplied by 183/365 (to reflect the one-half-year period). The annualized net expense ratios are as follows: |
| Class A Shares | 1.19% |
| Class B Shares | 1.92% |
| Class C Shares | 1.92% |
| Class K Shares | 1.67% |
Annual Shareholder Report6
Performance data quoted represents past performance which is no guarantee of future results. Investment return and principal value will fluctuate so that an investor's shares, when redeemed, may be worth more or less than their original cost. Mutual fund performance changes over time and current performance may be lower or higher than what is stated. For current to the most recent month-end performance and after-tax returns, visit FederatedInvestors.com or call 1-800-341-7400.
Management's Discussion of Fund
Performance (unaudited)
For the fiscal year ended September 30, 2010, the Fund produced a total return, based on net asset value, of 3.72% for Class A Shares, 2.96% for Class B Shares, 2.95% for Class C Shares and 3.22% for Class K Shares. Over the same period, the Russell 1000® Value Index (RU1V),1 a broad-based securities market index, returned 8.90%. The Fund's total return for the fiscal year reflected actual cash flows, transaction costs and other expenses which were not reflected in the total return of the RU1V.
The following discussion will focus on the performance of the Fund's
Class A Shares.
market overview
The Fund's fiscal year was characterized by see-saw market action driven by alternating waves of encouraging and dispiriting news flow. Reevaluations of the velocity and direction of interest rates, employment, housing, currencies and earnings kept investors paralyzed and largely on the sidelines; declining market volumes were a symptom of the apathetic mood. During this period, the broad market, as measured by the Standard & Poor's 500 Index (S&P 500),2 managed to return 10.16%. Despite lingering economic woes, the ever-forward-looking stock market took an optimistic turn in September, to finish the period firmly in positive territory.
| 1 | The Russell 1000® Value Index measures the performance of the 1,000 largest of the 3,000 largest U.S.-domiciled companies (based on total market capitalization) with lower price-to-book ratios and lower forecasted growth values. The index is unmanaged and, unlike the Fund, is not affected by cash flows. It is not possible to invest directly in an index. |
| 2 | The S&P 500 is an unmanaged capitalization-weighted index of 500 stocks designed to measure performance of the broad domestic economy through changes in the aggregate market value of 500 stocks representing all major industries. The index is unmanaged and, unlike the fund, not affected by cash flows. It is not possible to invest directly in an index. |
Annual Shareholder Report7
FUND PERFORMANCEThe Materials and Health Care sectors contributed positively to the Fund's performance for the reporting period. Stocks such as DuPont and Merck were notable contributors toward driving sector performance. Detracting from relative performance were the Industrials and Energy sectors. Stocks such as URS, Transocean and Exxon Mobil performed poorly. The lag in relative performance for the fiscal year is primarily attributable to disappointing stock selection across the majority of sectors.
POSITIONING AND STRATEGY
Historically, the Fund has enjoyed consistent success in the Energy sector. However, in the June quarter, the Fund suffered a setback due to its holdings in Transocean and Anadarko. Both firms had direct exposure to the New Horizon well disaster which was operated by British Petroleum, an event that was impossible to predict. Despite the setback, the Fund continued to seek opportunities in the Energy sector. Market volatility remained prominent during the fiscal year. As such, the Fund continued to favor companies with consistent cash flows, strong balance sheets and a propensity to return excess cash to shareholders in the form of dividends or share repurchases.
The Fund ended the fiscal year overweighted relative to the benchmark in Consumer Discretionary and Energy, while being underweighted in Financials and Industrials. The Fund's over- or underweights relative to its benchmark are driven not by economic forecasts but, rather, by the analysts' view of company-specific opportunities within each sector. While the Fund's managers remained aware of macroeconomic factors that affected fund performance, the investment approach focused instead on bottom-up, fundamental analysis that sought to construct a well-diversified, risk-controlled portfolio.3
| 3 | Diversification does not assure a profit nor protect against loss. Value stocks tend to have higher dividends and thus have a higher income-related component in their total return than growth stocks. Value stocks also may lag growth stocks in performance, particularly in late stages of a market advance. |
Annual Shareholder Report8
GROWTH OF A $10,000 INVESTMENT - CLASS A SHARES1
The graph below illustrates the hypothetical investment of $10,0002 in Federated Clover Value Fund (Class A Shares) (the “Fund”) from September 30, 2000 to September 30, 2010, compared to the Russell 1000® Value Index (RU1V)3 and the Russell 3000® Value Index (RU3V).3
| Average Annual Total Returns4 for the Period Ended 9/30/2010 | |
| 1 Year | -1.99% |
| 5 Years | -1.51% |
| 10 Years | 5.21% |
Performance data quoted represents past performance which is no guarantee of future results. Investment return and principal value will fluctuate so that an investor's shares, when redeemed, may be worth more or less than their original cost. Mutual fund performance changes over time and current performance may be lower or higher than what is stated. For current to the most recent month-end performance and after-tax returns, visit FederatedInvestors.com or call 1-800-341-7400. Returns shown do not reflect the deduction of taxes that a shareholder would pay on Fund distributions or the redemption of Fund shares. Mutual funds are not obligations of or guaranteed by any bank and are not federally insured. Total returns shown include the maximum sales charge of 5.50%.
Annual Shareholder Report9
| 1 | Federated Clover Value Fund is the successor to Touchstone Value Opportunities Fund, a portfolio of Touchstone Funds Group Trust, pursuant to a reorganization that took place as of the close of business on August 28, 2009. The Fund commenced operations on March 16, 2009, when the Fund became the successor to Clover Capital Multi Value Equity Common Fund, LLC, organized as a Delaware limited liability company only available to accredited investors. The Fund assumed the performance of the predecessor common fund. As a result of the reorganization on August 28, 2009, the Touchstone Value Opportunities Fund became the accounting survivor. Accordingly, the performance information presented above, for the periods prior to August 28, 2009, is historical information for the Class A Shares of the Touchstone Value Opportunities Fund. |
| 2 | Represents a hypothetical investment of $10,000 in the Fund after deducting the maximum sales charge of 5.50% ($10,000 investment minus $550 sales charge=$9,450). The Fund's performance assumes the reinvestment of dividends and distributions. The Russell 1000® Value Index and the Russell 3000® Value Index have been adjusted to reflect reinvestment of dividends on securities in the indexes. |
| 3 | The Russell 1000® Value Index and the Russell 3000® Value Index are not adjusted to reflect sales charges, expenses or other fees that the Securities and Exchange Commission (SEC) requires to be reflected in the Fund's performance. The Russell 3000® Value Index measures the performance of those Russell 3000® Index companies with lower price-to-book ratios and lower forecasted growth values. The stocks in this index are also members of either the Russell 1000® Value or the Russell 2000® Value indexes. The indexes are unmanaged, and unlike the Fund, are not affected by cash flows. It is not possible to invest directly in an index. |
| 4 | Total returns quoted reflect all applicable sales charges. |
Annual Shareholder Report10
GROWTH OF A $10,000 INVESTMENT - CLASS B SHARES1
The Fund's Class B Shares commenced operations on August 29, 2009. For the period prior to commencement of operations of Class B Shares, the performance information shown is for the Fund's Class A Shares, adjusted to reflect the expenses of Class B Shares. The graph below illustrates the hypothetical investment of $10,0002 in Federated Clover Value Fund (Class B Shares) (the “Fund”) from September 30, 2000 to September 30, 2010, compared to the Russell 1000® Value Index (RU1V)3 and the Russell 3000® Value Index (RU3V).3
| Average Annual Total Returns4 for the Period Ended 9/30/2010 | |
| 1 Year | -2.54% |
| 5 Years | -1.40% |
| 10 Years | 5.17% |
Performance data quoted represents past performance which is no guarantee of future results. Investment return and principal value will fluctuate so that an investor's shares, when redeemed, may be worth more or less than their original cost. Mutual fund performance changes over time and current performance may be lower or higher than what is stated. For current to the most recent month-end performance and after-tax returns, visit FederatedInvestors.com or call 1-800-341-7400. Returns shown do not reflect the deduction of taxes that a shareholder would pay on Fund distributions or the redemption of Fund shares. Mutual funds are not obligations of or guaranteed by any bank and are not federally insured. Total returns shown include the maximum contingent deferred sales charge of 5.50%, as applicable.
Annual Shareholder Report11
| 1 | Federated Clover Value Fund is the successor to Touchstone Value Opportunities Fund, a portfolio of Touchstone Funds Group Trust, pursuant to a reorganization that took place as of the close of business on August 28, 2009. The Fund commenced operations on March 16, 2009, when the Fund became the successor to Clover Capital Multi Value Equity Common Fund, LLC, organized as a Delaware limited liability company only available to accredited investors. The Fund assumed the performance of the predecessor common fund. As a result of the reorganization on August 28, 2009, the Touchstone Value Opportunities Fund became the accounting survivor. Accordingly, the performance information presented above, for the periods prior to August 28, 2009, is historical information for the Class A Shares of the Touchstone Value Opportunities Fund adjusted to reflect the expenses of Class B Shares. |
| 2 | Represents a hypothetical investment of $10,000 in the Fund. The maximum contingent deferred sales charge is 5.50% on any redemption less than one year from the purchase date. The Fund's performance assumes the reinvestment of all dividends and distributions. The Russell 1000® Value Index and the Russell 3000® Value Index have been adjusted to reflect reinvestment of dividends on securities in the indexes. |
| 3 | The Russell 1000® Value Index and the Russell 3000® Value Index are not adjusted to reflect sales charges, expenses or other fees that the SEC requires to be reflected in the Fund's performance. The Russell 3000® Value Index measures the performance of those Russell 3000® Index companies with lower price-to-book ratios and lower forecasted growth values. The stocks in this index are also members of either the Russell 1000® Value or the Russell 2000® Value indexes. The indexes are unmanaged, and unlike the Fund, are not affected by cash flows. It is not possible to invest directly in an index. |
| 4 | Total returns quoted reflect all applicable contingent deferred sales charges. |
Annual Shareholder Report12
GROWTH OF A $10,000 INVESTMENT - CLASS C SHARES1
The graph below illustrates the hypothetical investment of $10, 0002 in Federated Clover Value Fund (Class C Shares) (the “Fund”) from September 30, 2000 to September 30, 2010, compared to the Russell 1000® Value Index (RU1V)3 and the Russell 3000® Value Index (RU3V).3
| Average Annual Total Returns4 for the Period Ended 9/30/2010 | |
| 1 Year | 1.95% |
| 5 Years | -1.06% |
| 10 Years | 5.06% |
Performance data quoted represents past performance which is no guarantee of future results. Investment return and principal value will fluctuate so that an investor's shares, when redeemed, may be worth more or less than their original cost. Mutual fund performance changes over time and current performance may be lower or higher than what is stated. For current to the most recent month-end performance and after-tax returns, visit FederatedInvestors.com or call 1-800-341-7400. Returns shown do not reflect the deduction of taxes that a shareholder would pay on Fund distributions or the redemption of Fund shares. Mutual funds are not obligations of or guaranteed by any bank and are not federally insured. Total returns shown include the maximum contingent deferred sales charge of 1.00%, as applicable.
Annual Shareholder Report13
| 1 | Federated Clover Value Fund is the successor to Touchstone Value Opportunities Fund, a portfolio of Touchstone Funds Group Trust, pursuant to a reorganization that took place as of the close of business on August 28, 2009. The Fund commenced operations on March 16, 2009, when the Fund became the successor to Clover Capital Multi Value Equity Common Fund, LLC, organized as a Delaware limited liability company only available to accredited investors. The Fund assumed the performance of the predecessor common fund. As a result of the reorganization on August 28, 2009, the Touchstone Value Opportunities Fund became the accounting survivor. Accordingly, the performance information presented above, for the periods prior to August 28, 2009, is historical information for the Class C Shares of the Touchstone Value Opportunities Fund. |
| 2 | Represents a hypothetical investment of $10,000 in the Fund. A 1.00% contingent deferred sales charge would be applied on any redemption less than one year from the purchase date. The Fund's performance assumes the reinvestment of all dividends and distributions. The Russell 1000® Value Index and the Russell 3000® Value Index have been adjusted to reflect reinvestment of dividends on securities in the indexes. |
| 3 | The Russell 1000® Value Index and the Russell 3000® Value Index are not adjusted to reflect sales charges, expenses or other fees that the SEC requires to be reflected in the Fund's performance. The Russell 3000® Value Index measures the performance of those Russell 3000® Index companies with lower price-to-book ratios and lower forecasted growth values. The stocks in this index are also members of either the Russell 1000® Value or the Russell 2000® Value indexes. The indexes are unmanaged, and unlike the Fund, are not affected by cash flows. It is not possible to invest directly in an index. |
| 4 | Total returns quoted reflect all applicable contingent deferred sales charges. |
Annual Shareholder Report14
GROWTH OF A $10,000 INVESTMENT - CLASS K SHARES1
The Fund's Class K Shares commenced operations on August 29, 2009. For the period prior to commencement of operations of Class K Shares, the performance information shown is for the Fund's Class A Shares, adjusted to reflect the expenses of Class K Shares. The graph below illustrates the hypothetical investment of $10,0002 in Federated Clover Value Fund (Class K Shares) (the “Fund”) from September 30, 2000 to September 30, 2010, compared to the Russell 1000® Value Index (RU1V)³ and the Russell 3000® Value Index (RU3V).3
| Average Annual Total Returns for the Period Ended 9/30/2010 | |
| 1 Year | 3.22% |
| 5 Years | -0.86% |
| 10 Years | 5.30% |
Performance data quoted represents past performance which is no guarantee of future results. Investment return and principal value will fluctuate so that an investor's shares, when redeemed, may be worth more or less than their original cost. Mutual fund performance changes over time and current performance may be lower or higher than what is stated. For current to the most recent month-end performance and after-tax returns, visit FederatedInvestors.com or call 1-800-341-7400. Returns shown do not reflect the deduction of taxes that a shareholder would pay on Fund distributions or the redemption of Fund shares. Mutual funds are not obligations of or guaranteed by any bank and are not federally insured.
Annual Shareholder Report15
| 1 | Federated Clover Value Fund is the successor to Touchstone Value Opportunities Fund, a portfolio of Touchstone Funds Group Trust, pursuant to a reorganization that took place as of the close of business on August 28, 2009. The Fund commenced operations on March 16, 2009, when the Fund became the successor to Clover Capital Multi Value Equity Common Fund, LLC, organized as a Delaware limited liability company only available to accredited investors. The Fund assumed the performance of the predecessor common fund. As a result of the reorganization on August 28, 2009, the Touchstone Value Opportunities Fund became the accounting survivor. Accordingly, the performance information presented above, for the periods prior to August 28, 2009, is historical information for the Class A Shares of the Touchstone Value Opportunities Fund adjusted to reflect the expenses of Class K Shares. |
| 2 | Represents a hypothetical investment of $10,000 in the Fund. The Fund's performance assumes the reinvestment of all dividends and distributions. The Russell 1000® Value Index and the Russell 3000® Value Index have been adjusted to reflect reinvestment of dividends on securities in the indexes. |
| 3 | The Russell 1000® Value Index and the Russell 3000® Value Index are not adjusted to reflect sales charges, expenses or other fees that the SEC requires to be reflected in the Fund's performance. The Russell 3000® Value Index measures the performance of those Russell 3000® Index companies with lower price-to-book ratios and lower forecasted growth values. The stocks in this index are also members of either the Russell 1000® Value or the Russell 2000® Value indexes. The indexes are unmanaged, and unlike the Fund, are not affected by cash flows. It is not possible to invest directly in an index. |
Annual Shareholder Report16
Portfolio of Investments Summary Table (unaudited)
At September 30, 2010, the Fund's sector composition1 was as follows:
| Sector Composition | Percentage of
Total Net Assets |
| Financials | 23.8% |
| Energy | 13.1% |
| Health Care | 11.5% |
| Consumer Staples | 9.9% |
| Consumer Discretionary | 9.0% |
| Utilities | 6.6% |
| Industrials | 6.5% |
| Information Technology | 5.5% |
| Telecommunication Services | 3.8% |
| Materials | 3.2% |
| Other Security2 | 3.0% |
| Cash Equivalents3 | 4.7% |
| Other Assets and Liabilities — Net4 | (0.6)% |
| Total | 100.0% |
| 1 | Except for Other Security, Cash Equivalents and Other Assets and Liabilities, sector classifications are based upon, and individual portfolio securities are assigned to, the classifications of the Global Industry Classification Standard (GICS) except that the Adviser assigns a classification to securities not classified by the GICS and to securities for which the Adviser does not have access to the classification made by the GICS. |
| 2 | Other Security includes an Exchange-Traded Fund. |
| 3 | Cash Equivalents include any investments in money market mutual funds and/or overnight repurchase agreements. |
| 4 | Assets, other than investments in securities, less liabilities. See Statement of Assets and Liabilities. |
Annual Shareholder Report17
Portfolio of Investments
September 30, 2010
| Shares | | | Value |
| | COMMON STOCKS – 92.9% | |
| | Consumer Discretionary – 9.0% | |
| 303,200 | | Coach, Inc. | 13,025,472 |
| 199,367 | 1 | DIRECTV Group, Inc., Class A | 8,299,648 |
| 1,048,800 | 1 | Liberty Media Holding Corp. | 14,379,048 |
| 12,707,350 | 1 | Sirius XM Radio, Inc. | 15,248,820 |
| 380,618 | | Time Warner, Inc. | 11,665,942 |
| 357,090 | | Walt Disney Co. | 11,823,250 |
| | TOTAL | 74,442,180 |
| | Consumer Staples – 9.9% | |
| 212,050 | 1 | Energizer Holdings, Inc. | 14,256,121 |
| 355,265 | | H.J. Heinz Co. | 16,828,903 |
| 554,150 | | Kraft Foods, Inc., Class A | 17,101,069 |
| 146,602 | | Lorillard, Inc. | 11,773,607 |
| 190,740 | | Procter & Gamble Co. | 11,438,678 |
| 310,580 | | Walgreen Co. | 10,404,430 |
| | TOTAL | 81,802,808 |
| | Energy – 13.1% | |
| 311,570 | | Chevron Corp. | 25,252,748 |
| 1,462,200 | | El Paso Corp. | 18,102,036 |
| 331,450 | 1 | Forest Oil Corp. | 9,844,065 |
| 398,950 | | National-Oilwell, Inc. | 17,741,306 |
| 328,250 | 1 | Newfield Exploration Co. | 18,854,680 |
| 138,950 | | Schlumberger Ltd. | 8,560,710 |
| 104,600 | 1 | Whiting Petroleum Corp. | 9,990,346 |
| | TOTAL | 108,345,891 |
| | Financials – 23.8% | |
| 1,923,100 | | Bank of America Corp. | 25,211,841 |
| 387,067 | 1 | CIT Group, Inc. | 15,800,075 |
| 5,228,850 | 1 | Citigroup, Inc. | 20,392,515 |
| 325,250 | | Comerica, Inc. | 12,083,037 |
| 658,180 | | JPMorgan Chase & Co. | 25,056,913 |
| 329,850 | | MetLife, Inc. | 12,682,732 |
| 801,050 | | Progressive Corp., OH | 16,717,913 |
| 446,950 | | The Travelers Cos., Inc. | 23,286,095 |
| 1,159,030 | | U.S. Bancorp | 25,058,229 |
| 418,820 | | Wells Fargo & Co. | 10,524,947 |
Annual Shareholder Report18
| Shares | | | Value |
| 481,850 | | XL Group PLC | 10,436,871 |
| | TOTAL | 197,251,168 |
| | Health Care – 11.5% | |
| 470,750 | | Aetna, Inc. | 14,880,408 |
| 289,900 | 1 | Amgen, Inc. | 15,976,389 |
| 446,865 | | Merck & Co., Inc. | 16,449,101 |
| 1,676,195 | | Pfizer, Inc. | 28,780,268 |
| 560,150 | | UnitedHealth Group, Inc. | 19,666,866 |
| | TOTAL | 95,753,032 |
| | Industrials – 6.5% | |
| 825,750 | | General Electric Co. | 13,418,438 |
| 342,500 | | Honeywell International, Inc. | 15,049,450 |
| 256,755 | | Raytheon Co. | 11,736,271 |
| 457,900 | | Republic Services, Inc. | 13,961,371 |
| | TOTAL | 54,165,530 |
| | Information Technology – 5.5% | |
| 319,950 | 1 | BMC Software, Inc. | 12,951,576 |
| 513,005 | 1 | EMC Corp. | 10,419,132 |
| 386,900 | | Microsoft Corp. | 9,475,181 |
| 282,075 | | Qualcomm, Inc. | 12,727,224 |
| | TOTAL | 45,573,113 |
| | Materials – 3.2% | |
| 601,525 | | Du Pont (E.I.) de Nemours & Co. | 26,840,045 |
| | Telecommunication Services – 3.8% | |
| 777,355 | | AT&T, Inc. | 22,232,353 |
| 295,732 | | Verizon Communications, Inc. | 9,637,906 |
| | TOTAL | 31,870,259 |
| | Utilities – 6.6% | |
| 1,066,000 | | CMS Energy Corp. | 19,209,320 |
| 405,950 | | Wisconsin Energy Corp. | 23,463,910 |
| 536,800 | | Xcel Energy, Inc. | 12,330,296 |
| | TOTAL | 55,003,526 |
| | TOTAL COMMON STOCKS
(IDENTIFIED COST $716,624,908) | 771,047,552 |
| | EXCHANGE-TRADED FUND – 3.0% | |
| 422,750 | | iShares Russell 1000 Value Index Fund
(IDENTIFIED COST $24,921,535) | 24,938,022 |
Annual Shareholder Report19
| Shares | | | Value |
| | MUTUAL FUND – 4.7% | |
| 39,423,055 | 2,3 | Federated Prime Value Obligations Fund, Institutional Shares, 0.23%
(AT NET ASSET VALUE) | 39,423,055 |
| | TOTAL INVESTMENTS — 100.6%
(IDENTIFIED COST $780,969,498)4 | 835,408,629 |
| | OTHER ASSETS AND LIABILITIES - NET — (0.6)%5 | (5,299,708) |
| | TOTAL NET ASSETS — 100% | $830,108,921 |
| 1 | Non-income producing security. |
| 2 | Affiliated company. |
| 3 | 7-Day net yield. |
| 4 | The cost of investments for federal tax purposes amounts to $785,539,768. |
| 5 | Assets, other than investments in securities, less liabilities. See Statement of Assets and Liabilities. |
Note: The categories of investments are shown as a percentage of total net assets at September 30, 2010.
Various inputs are used in determining the value of the Fund's investments. These inputs are summarized in the three broad levels listed below:
Level 1 — quoted prices in active markets for identical securities
Level 2 — other significant observable inputs (including quoted prices for similar securities, interest rates, prepayment speeds, credit risk, etc.)
Level 3 — significant unobservable inputs (including the Fund's own assumptions in determining the fair value of investments)
The inputs or methodology used for valuing securities are not an indication of the risk associated with investing in those securities.
As of September 30, 2010, all the investments of the Fund utilized Level 1 inputs in valuing the Fund's assets carried at fair value.
See Notes which are an integral part of the Financial Statements
Annual Shareholder Report20
Statement of Assets and Liabilities
September 30, 2010
| Assets: | | |
| Total investments in securities, at value including $39,423,055 of investments in an affiliated issuer (Note 6) (identified cost $780,969,498) | | $835,408,629 |
| Cash | | 633 |
| Income receivable | | 989,371 |
| Receivable for investments sold | | 13,053,707 |
| Receivable for shares sold | | 675,522 |
| TOTAL ASSETS | | 850,127,862 |
| Liabilities: | | |
| Payable for investments purchased | $17,871,732 | |
| Payable for shares redeemed | 1,425,641 | |
| Payable for distribution services fee (Note 6) | 64,960 | |
| Payable for shareholder services fee (Note 6) | 228,248 | |
| Accrued expenses | 428,360 | |
| TOTAL LIABILITIES | | 20,018,941 |
| Net assets for 63,858,705 shares outstanding | | $830,108,921 |
| Net Assets Consist of: | | |
| Paid-in capital | | $1,330,656,726 |
| Net unrealized appreciation of investments | | 54,439,131 |
| Accumulated net realized loss on investments | | (555,081,782) |
| Undistributed net investment income | | 94,846 |
| TOTAL NET ASSETS | | $830,108,921 |
Annual Shareholder Report21
Statement of Assets and Liabilities — continued| Net Asset Value, Offering Price and Redemption Proceeds Per Share | | |
| Institutional Shares: | | |
| Net asset value per share ($143,281,088 ÷ 11,008,309 shares outstanding), no par value, unlimited shares authorized | | $13.02 |
| Offering price per share | | $13.02 |
| Redemption proceeds per share | | $13.02 |
| Class A Shares: | | |
| Net asset value per share ($575,761,735 ÷ 44,288,065 shares outstanding), no par value, unlimited shares authorized | | $13.00 |
| Offering price per share (100/94.50 of $13.00) | | $13.76 |
| Redemption proceeds per share | | $13.00 |
| Class B Shares: | | |
| Net asset value per share ($57,625,221 ÷ 4,447,073 shares outstanding), no par value, unlimited shares authorized | | $12.96 |
| Offering price per share | | $12.96 |
| Redemption proceeds per share (94.50/100 of $12.96) | | $12.25 |
| Class C Shares: | | |
| Net asset value per share ($38,708,039 ÷ 2,982,640 shares outstanding), no par value, unlimited shares authorized | | $12.98 |
| Offering price per share | | $12.98 |
| Redemption proceeds per share (99.00/100 of $12.98) | | $12.85 |
| Class K Shares: | | |
| Net asset value per share ($14,732,838 ÷ 1,132,618 shares outstanding), no par value, unlimited shares authorized | | $13.01 |
| Offering price per share | | $13.01 |
| Redemption proceeds per share | | $13.01 |
See Notes which are an integral part of the Financial Statements
Annual Shareholder Report22
Statement of Operations
Year Ended September 30, 2010
| Investment Income: | | | |
| Dividends (including $38,924 received from an affiliated issuer (Note 6) and net of foreign taxes withheld of $2,007) | | | $15,460,170 |
| Interest received from securities loaned | | | 938 |
| TOTAL INCOME | | | $15,461,108 |
| Expenses: | | | |
| Investment adviser fee (Note 6) | | $6,386,245 | |
| Administrative personnel and services fee (Note 6) | | 664,056 | |
| Custodian fees | | 39,807 | |
| Transfer and dividend disbursing agent fees and expenses — Institutional Shares | | 174,011 | |
| Transfer and dividend disbursing agent fees and expenses — Class A Shares | | 1,637,694 | |
| Transfer and dividend disbursing agent fees and expenses — Class B Shares | | 274,450 | |
| Transfer and dividend disbursing agent fees and expenses — Class C Shares | | 114,578 | |
| Transfer and dividend disbursing agent fees and expenses — Class K Shares | | 56,467 | |
| Directors'/Trustees' fees | | 3,419 | |
| Auditing fees | | 40,500 | |
| Legal fees | | 6,318 | |
| Portfolio accounting fees | | 163,450 | |
| Distribution services fee — Class B Shares (Note 6) | | 526,348 | |
| Distribution services fee — Class C Shares (Note 6) | | 294,310 | |
| Distribution services fee — Class K Shares (Note 6) | | 68,450 | |
| Shareholder services fee — Class A Shares (Note 6) | | 1,565,506 | |
| Shareholder services fee — Class B Shares (Note 6) | | 175,449 | |
| Shareholder services fee — Class C Shares (Note 6) | | 97,398 | |
| Account administration fee — Class A Shares | | 759 | |
| Account administration fee — Class C Shares | | 681 | |
| Share registration costs | | 82,419 | |
| Printing and postage | | 196,869 | |
| Insurance premiums | | 5,053 | |
| Miscellaneous | | 7,211 | |
| TOTAL EXPENSES | | 12,581,448 | |
Annual Shareholder Report23
Statement of Operations — continued| Waivers, Reimbursements and Reduction: | | | |
| Waiver/reimbursement of investment adviser fee (Note 6) | $(1,077,894) | | |
Waiver of administrative personnel and services
fee (Note 6) | (16,065) | | |
| Reimbursement of transfer and dividend disbursing agent fees and expenses — Class A Shares (Note 6) | (499,156) | | |
| Reimbursement of transfer and dividend disbursing agent fees and expenses — Class B Shares (Note 6) | (161,759) | | |
| Reimbursement of transfer and dividend disbursing agent fees and expenses — Class C Shares (Note 6) | (51,202) | | |
| Fees paid indirectly from directed brokerage arrangements (Note 7) | (32,683) | | |
| TOTAL WAIVERS, REIMBURSEMENTS AND REDUCTION | | $(1,838,759) | |
| Net expenses | | | $10,742,689 |
| Net investment income | | | 4,718,419 |
Realized and Unrealized Gain (Loss)
on Investments: | | | |
| Net realized loss on investments | | | (46,400,966) |
| Net change in unrealized depreciation of investments | | | 70,041,336 |
| Net realized and unrealized gain on investments | | | 23,640,370 |
| Change in net assets resulting from operations | | | $28,358,789 |
See Notes which are an integral part of the Financial Statements
Annual Shareholder Report24
Statement of Changes in Net Assets
| Year Ended September 30 | 2010 | 2009 |
| Increase (Decrease) in Net Assets | | |
| Operations: | | |
| Net investment income | $4,718,419 | $2,627,336 |
| Net realized loss on investments | (46,400,966) | (44,452,076) |
| Net change in unrealized appreciation/depreciation of investments | 70,041,336 | 15,196,239 |
| CHANGE IN NET ASSETS RESULTING FROM OPERATIONS | 28,358,789 | (26,628,501) |
| Distributions to Shareholders: | | |
| Distributions from net investment income | | |
| Institutional Shares | (983,451) | — |
| Class A Shares | (3,693,299) | (2,419,186) |
| Class B Shares | (17,614) | — |
| Class C Shares | (5,952) | (38,355) |
| Class K Shares | (17,516) | — |
| CHANGE IN NET ASSETS RESULTING FROM DISTRIBUTIONS TO SHAREHOLDERS | (4,717,832) | (2,457,541) |
| Share Transactions: | | |
| Proceeds from sale of shares | 255,144,806 | 68,273,280 |
| Exchange of Successor Fund shares in connection with the tax-free reorganization of Touchstone Value Opportunities Fund (Note 2) | — | 12,565,926 |
| Proceeds from shares issued in connection with the tax-free transfer of assets from Federated American Leaders Fund, Inc. (Note 2) | — | 679,733,197 |
| Net asset value of shares issued to shareholders in payment of distributions declared | 4,237,783 | 2,285,810 |
| Cost of shares redeemed | (302,975,211) | (64,567,685) |
| CHANGE IN NET ASSETS RESULTING FROM SHARE TRANSACTIONS | (43,592,622) | 698,290,528 |
| Change in net assets | (19,951,665) | 669,204,486 |
| Net Assets: | | |
| Beginning of period | 850,060,586 | 180,856,100 |
| End of period (including undistributed net investment income of $94,846 and $94,259, respectively) | $830,108,921 | $850,060,586 |
See Notes which are an integral part of the Financial Statements
Annual Shareholder Report25
Notes to Financial Statements
September 30, 2010
1. ORGANIZATION
Federated Equity Funds (the “Trust”) is registered under the Investment Company Act of 1940, as amended (the “Act”), as an open-end management investment company. The Trust consists of 12 diversified portfolios. The financial statements included herein are only those of Federated Clover Value Fund (the “Fund”). The financial statements of the other portfolios are presented separately. The assets of each portfolio are segregated and a shareholder's interest is limited to the portfolio in which shares are held. Each portfolio pays its own expenses. The Fund offers five classes of shares: Institutional Shares, Class A Shares, Class B Shares, Class C Shares and Class K Shares. All shares of the Fund have equal rights with respect to voting, except on class-specific matters. The financial highlights of the Institutional Shares are presented separately. The investment objective of the Fund is to seek capital appreciation.
2. reorganization
The Fund is the successor (“Successor Fund”) to Touchstone Value Opportunities Fund (the “Predecessor Fund”), a portfolio of Touchstone Funds Group Trust, pursuant to a reorganization that took place as of the close of business on August 28, 2009. On that date, Class A Shares, Class C Shares and Class Z Shares of the Predecessor Fund were exchanged for Class A Shares, Class C Shares and Class A Shares of the Fund, respectively. As a result of the reorganization on August 28, 2009, the Predecessor Fund became the accounting survivor. Accordingly, the performance information presented in the financial statements for the periods prior to August 28, 2009, is historical information of the Predecessor Fund.
On August 28, 2009, the Fund received a tax-free transfer of assets from Touchstone Value Opportunities Fund, as follows:
Shares of the
Fund Issued | Touchstone Value
Opportunities
Fund Net
Assets Received | Unrealized
Appreciation1 | Net Assets
of the Fund
Immediately
Prior to
Combination | Net Assets
of the Fund
Immediately
After
Combination |
| 13,258,411 | $162,851,244 | $2,221,563 | $12,565,926 | $175,417,170 |
| 1 | Unrealized appreciation is included in the Touchstone Value Opportunities Fund Net Assets Received amount shown above. |
On the date of the reorganization, the Successor Fund's net assets included $2,119,296 of net unrealized appreciation.
Annual Shareholder Report26
On September 18, 2009, the Fund received a tax-free transfer of assets from Federated American Leaders Fund, Inc., as follows:Shares of the
Fund Issued | Federated
American Leaders
Fund, Inc.
Net Assets
Received | Unrealized
Depreciation1 | Net Assets
of the Fund
Immediately
Prior to
Combination | Net Assets
of the Fund
Immediately
After
Combination |
| 52,783,178 | $679,733,197 | $(16,944,166) | $193,844,924 | $873,578,121 |
| 1 | Unrealized depreciation is included in the Federated American Leaders Fund, Inc. Net Assets Received amount shown above. |
3. SIGNIFICANT ACCOUNTING POLICIES
The following is a summary of significant accounting policies consistently followed by the Fund in the preparation of its financial statements. These policies are in conformity with U.S. generally accepted accounting principles (GAAP).
Investment Valuation
In calculating its net asset value (NAV), the Fund generally values investments as follows:
- Equity securities listed on an exchange or traded through a regulated market system are valued at their last reported sale price or official closing price in their principal exchange or market.
- Fixed-income securities acquired with remaining maturities greater than 60 days are fair valued using price evaluations provided by a pricing service approved by the Board of Trustees (the “Trustees”).
- Fixed-income securities acquired with remaining maturities of 60 days or less are valued at their cost (adjusted for the accretion of any discount or amortization of any premium).
- Shares of other mutual funds are valued based upon their reported NAVs.
- Derivative contracts listed on exchanges are valued at their reported settlement or closing price.
- Over-the-counter (OTC) derivative contracts are fair valued using price evaluations provided by a pricing service approved by the Trustees.
If the Fund cannot obtain a price or price evaluation from a pricing service for an investment, the Fund may attempt to value the investment based upon the mean of bid and asked quotations or fair value the investment based on price evaluations, from one or more dealers. If any price, quotation, price evaluation or other pricing source is not readily available when the NAV is calculated, the Fund uses the fair value of the investment determined in accordance with the procedures described below. There can be no assurance that the Fund could purchase or sell an investment at the price used to calculate the Fund's NAV.
Fair Valuation and Significant Events Procedures
The Trustees have authorized the use of pricing services to provide evaluations of the current fair value of certain investments for purposes of calculating the NAV. Factors considered by pricing services in evaluating an investment include the yields or prices of investments of comparable quality, coupon, maturity, call rights and other potential prepayments, terms and type, reported transactions, indications as to values from dealers and general market conditions. Some pricing services provide a single price evaluation reflecting the bid-side of the market for an investment (a “bid” evaluation). Other pricing services offer both bid evaluations and price evaluations indicative of a price between the prices bid and asked for the investment (a “mid” evaluation). The Fund normally uses bid evaluations for U.S. Treasury Annual Shareholder Report27
and Agency securities, mortgage-backed securities and municipal securities. The Fund normally uses mid evaluations for other types of fixed-income securities and OTC derivative contracts. In the event that market quotations and price evaluations are not available for an investment, the fair value of the investment is determined in accordance with procedures adopted by the Trustees.The Trustees also have adopted procedures requiring an investment to be priced at its fair value whenever the Adviser determines that a significant event affecting the value of the investment has occurred between the time as of which the price of the investment would otherwise be determined and the time as of which the NAV is computed. An event is considered significant if there is both an affirmative expectation that the investment's value will change in response to the event and a reasonable basis for quantifying the resulting change in value. Examples of significant events that may occur after the close of the principal market on which a security is traded, or after the time of a price evaluation provided by a pricing service or a dealer, include:
- With respect to securities traded in foreign markets, significant trends in U.S. equity markets or in the trading of foreign securities index futures or options contracts;
- With respect to price evaluations of fixed-income securities determined before the close of regular trading on the NYSE, actions by the Federal Reserve Open Market Committee and other significant trends in U.S. fixed-income markets;
- Political or other developments affecting the economy or markets in which an issuer conducts its operations or its securities are traded; and
- Announcements concerning matters such as acquisitions, recapitalizations, litigation developments, a natural disaster affecting the issuer's operations or regulatory changes or market developments affecting the issuer's industry.
The Trustees have approved the use of a pricing service to determine the fair value of equity securities traded principally in foreign markets when the Adviser determines that there has been a significant trend in the U.S. equity markets or in index futures trading. For other significant events, the Fund may seek to obtain more current quotations or price evaluations from alternative pricing sources. If a reliable alternative pricing source is not available, the Fund will determine the fair value of the investment using another method approved by the Trustees.
Investment Income, Gains and Losses, Expenses and Distributions
Investment transactions are accounted for on a trade-date basis. Realized gains and losses from investment transactions are recorded on an identified-cost basis. Interest income and expenses are accrued daily. Dividend income and distributions to shareholders are recorded on the ex-dividend date. Foreign dividends are recorded on the ex-dividend date or when the Fund is informed of the ex-dividend date. Distributions of net investment income are declared and paid quarterly. Non-cash dividends included in dividend income, if any, are recorded at fair value. Investment income, realized and unrealized gains and losses and certain fund-level expenses are allocated to each class based on relative average daily net assets, except that Institutional Shares, Class A Shares, Class B Shares, Class C Shares and Class K Shares may bear distribution services fees, shareholder services fees, account administration fees and certain transfer and dividend disbursing agent fees unique to those classes. Dividends are declared separately for each class. No class has preferential dividend rights; differences in per share dividend rates are generally due to differences in separate class expenses.
Annual Shareholder Report28
Premium and Discount AmortizationAll premiums and discounts on fixed-income securities are amortized/accreted for financial statement purposes.
Federal Taxes
It is the Fund's policy to comply with the Subchapter M provision of the Internal Revenue Code (the “Code”) and to distribute to shareholders each year substantially all of its income. Accordingly, no provision for federal income tax is necessary. As of and during the year ended September 30, 2010, the Fund did not have a liability for any uncertain tax positions. The Fund recognizes interest and penalties, if any, related to tax liabilities as income tax expense in the Statement of Operations. As of September 30, 2010, tax years 2009 and 2010 remain subject to examination by the Fund's major tax jurisdictions, which include the United States of America and the Commonwealth of Massachusetts.
The Fund may be subject to taxes imposed by governments of countries in which it invests. Such taxes are generally based on either income or gains earned or repatriated. The Fund accrues and applies such taxes to net investment income, net realized gains and net unrealized gains as income and/or gains are earned.
When-Issued and Delayed Delivery Transactions
The Fund may engage in when-issued or delayed delivery transactions. The Fund records when-issued securities on the trade date and maintains security positions such that sufficient liquid assets will be available to make payment for the securities purchased. Securities purchased on a when-issued or delayed delivery basis are marked to market daily and begin earning interest on the settlement date. Losses may occur on these transactions due to changes in market conditions or the failure of counterparties to perform under the contract.
Securities Lending
The Fund participates in a securities lending program providing for the lending of equity securities to qualified brokers. The Fund normally receives cash collateral for securities loaned that is invested in an affiliated money market fund or short-term securities including repurchase agreements. Collateral is maintained at a minimum level of 100% of the market value of investments loaned, plus interest, if applicable. In accordance with the Fund's securities lending agreement, the market value of securities on loan is determined each day at the close of business and any additional collateral required to cover the value of securities on loan is delivered to the Fund on the next business day. Earnings on collateral are allocated between the securities lending agent, as a fee for its services under the program, and the Fund, according to agreed-upon rates.
As of September 30, 2010, the Fund had no outstanding securities on loan.
Other
The preparation of financial statements in conformity with GAAP requires management to make estimates and assumptions that affect the amounts of assets, liabilities, expenses and revenues reported in the financial statements. Actual results could differ from those estimated.
Annual Shareholder Report29
4. SHARES OF BENEFICIAL INTERESTThe following tables summarize share activity:
| Year Ended
9/30/2010 | Period Ended
9/30/20091 |
| Institutional Shares: | Shares | Amount | Shares | Amount |
| Shares sold | 10,819,322 | $140,803,781 | 46,315 | $574,933 |
| Exchange of Successor Fund shares in connection with the tax-free reorganization of Touchstone Value Opportunities Fund | — | — | 908,665 | 11,171,864 |
| Shares issued to shareholders in payment of distributions declared | 68,883 | 890,995 | — | — |
| Shares redeemed | (832,524) | (10,844,272) | (2,352) | (28,168) |
| NET CHANGE RESULTING FROM INSTITUTIONAL SHARE TRANSACTIONS | 10,055,681 | $130,850,504 | 952,628 | $11,718,629 |
| Year Ended September 30 | 2010 | 2009 |
| Class A Shares: | Shares | Amount | Shares | Amount |
| Shares sold | 6,582,264 | $86,409,757 | 1,754,894 | $19,558,947 |
| Transfer in Class Z Shares2 | — | — | 12,596,617 | 182,078,468 |
| Exchange of Successor Fund shares in connection with the tax-free reorganization of Touchstone Value Opportunities Fund | — | — | 76,192 | 935,852 |
| Proceeds from shares issued in connection with the tax-free transfer of assets from Federated American Leaders Fund, Inc. | — | — | 42,830,686 | 551,659,234 |
| Shares issued to shareholders in payment of distributions declared | 254,581 | 3,307,126 | 16,760 | 179,185 |
| Adjustment of Predecessor Fund shares in connection with tax-free reorganization | — | — | (637,282) | — |
| Shares redeemed | (18,640,211) | (241,209,936) | (1,157,857) | (13,324,756) |
| NET CHANGE RESULTING FROM CLASS A SHARE TRANSACTIONS | (11,803,366) | $(151,493,053) | 55,480,010 | $741,086,930 |
Annual Shareholder Report30
| Year Ended
9/30/2010 | Period Ended
9/30/20091 |
| Class B Shares: | Shares | Amount | Shares | Amount |
| Shares sold | 689,586 | $9,058,000 | 112,935 | $1,393,248 |
| Exchange of Successor Fund shares in connection with the tax-free reorganization of Touchstone Value Opportunities Fund | — | — | 34,767 | 426,380 |
| Proceeds from shares issued in connection with the tax-free transfer of assets from Federated American Leaders Fund, Inc. | — | — | 6,195,909 | 79,679,394 |
| Shares issued to shareholders in payment of distributions declared | 1,283 | 16,924 | — | — |
| Shares redeemed | (2,532,334) | (32,653,736) | (55,073) | (694,836) |
| NET CHANGE RESULTING FROM CLASS B SHARE TRANSACTIONS | (1,841,465) | $(23,578,812) | 6,288,538 | $80,804,186 |
| Year Ended September 30 | 2010 | 2009 |
| Class C Shares: | Shares | Amount | Shares | Amount |
| Shares sold | 925,628 | $12,221,565 | 271,399 | $2,870,136 |
| Exchange of Successor Fund shares in connection with the tax-free reorganization of Touchstone Value Opportunities Fund | — | — | 2,358 | 28,964 |
| Proceeds from shares issued in connection with the tax-free transfer of assets from Federated American Leaders Fund, Inc. | — | — | 2,778,973 | 35,793,174 |
| Shares issued to shareholders in payment of distributions declared | 397 | 5,247 | 3,374 | 36,153 |
| Adjustment of Predecessor Fund shares in connection with tax-free reorganization | — | — | (16,484) | — |
| Shares redeemed | (1,037,233) | (13,476,171) | (233,730) | (2,456,544) |
| NET CHANGE RESULTING FROM CLASS C SHARE TRANSACTIONS | (111,208) | $(1,249,359) | 2,805,890 | $36,271,883 |
Annual Shareholder Report31
| Year Ended
9/30/2010 | Period Ended
9/30/20091 |
| Class K Shares: | Shares | Amount | Shares | Amount |
| Shares sold | 511,901 | $6,651,703 | 16,424 | $207,777 |
| Exchange of Successor Fund shares in connection with the tax-free reorganization of Touchstone Value Opportunities Fund | — | — | 233 | 2,866 |
| Proceeds from shares issued in connection with the tax-free transfer of assets from Federated American Leaders Fund, Inc. | — | — | 977,610 | 12,601,395 |
| Shares issued to shareholders in payment of distributions declared | 1,328 | 17,491 | — | — |
| Shares redeemed | (368,180) | (4,791,096) | (6,698) | (84,963) |
| NET CHANGE RESULTING FROM CLASS K SHARE TRANSACTIONS | 145,049 | $1,878,098 | 987,569 | $12,727,075 |
| Year Ended September 30 | 2010 | 2009 |
| Class Z Shares2 | Shares | Amount | Shares | Amount |
| Shares sold | — | $ — | 4,420,419 | $43,668,239 |
| Shares issued to shareholders in payment of distributions declared | — | — | 200,218 | 2,070,472 |
| Shares redeemed | — | — | (4,574,307) | (47,978,418) |
| NET CHANGE RESULTING FROM CLASS Z SHARE TRANSACTIONS | — | $ — | 46,330 | $(2,239,707) |
| FINAL REDEMPTION FROM CLASS Z SHARES2 | — | $ — | (12,596,617) | $(182,078,468) |
| NET CHANGE RESULTING FROM TOTAL FUND SHARE TRANSACTIONS | (3,555,309) | $(43,592,622) | 53,964,348 | $698,290,528 |
| 1 | Reflects operations for the period from August 29, 2009 (deemed the date of initial investment, pursuant to a reorganization that took place on August 28, 2009) to September 30, 2009. |
| 2 | At the close of business on August 28, 2009, Class Z Shares were reorganized into Class A Shares. |
5. FEDERAL TAX INFORMATION
The tax character of distributions as reported on the Statement of Changes in Net Assets for the years ended September 30, 2010 and 2009, was as follows:
| 2010 | 2009 |
| Ordinary income | $4,717,832 | $2,457,541 |
Annual Shareholder Report32
As of September 30, 2010, the components of distributable earnings on a tax basis were as follows:| Undistributed ordinary income | $94,846 |
| Net unrealized appreciation | $49,868,861 |
| Capital loss carryforwards and deferrals | $(550,511,512) |
The difference between book-basis and tax-basis net unrealized appreciation/depreciation is attributable to differing treatments for the deferral of losses on wash sales.
At September 30, 2010, the cost of investments for federal tax purposes was $785,539,768. The net unrealized appreciation of investments for federal tax purposes was $49,868,861. This consists of net unrealized appreciation from investments for those securities having an excess of value over cost of $71,321,483 and net unrealized depreciation from investments for those securities having an excess of cost over value of $21,452,622.
At September 30, 2010, the Fund had a capital loss carryforward of $511,037,861 which will reduce the Fund's taxable income arising from future net realized gains on investments, if any, to the extent permitted by the Code and thus will reduce the amount of distributions to shareholders which would otherwise be necessary to relieve the Fund of any liability for federal income tax. Pursuant to the Code, such capital loss carryforward will expire as follows:
| Expiration Year | Expiration Amount |
| 2015 | $342,110,357 |
| 2016 | $125,794,854 |
| 2017 | $30,314,241 |
| 2018 | $12,818,409 |
As a result of the tax-free transfer of assets from Touchstone Value Opportunities Fund and Federated American Leaders Fund, Inc., the use of certain capital loss carryforwards listed above may be limited.
Under current tax regulations, capital losses on securities transactions realized after October 31 may be deferred and treated as occurring on the first day of the following fiscal year. As of September 30, 2010, for federal income tax purposes, post October losses of $39,473,651 were deferred to October 1, 2010.
6. INVESTMENT ADVISER FEE AND OTHER TRANSACTIONS WITH AFFILIATES
Investment Adviser Fee
Federated Global Investment Management Corporation is the Fund's investment adviser (the “Adviser”). The advisory agreement between the Fund and the Adviser provides for an annual fee equal to 0.75% of the Fund's average daily net assets. Subject to the terms described in the Expense Limitation note, the Adviser may voluntarily choose to waive any portion of its fee. For the year ended September 30, 2010, the Adviser voluntarily waived $1,057,120 of its fee. In addition, for the year ended September 30, 2010, an affiliate of the Adviser reimbursed $712,117 of transfer and dividend disbursing agent fees and expenses.
Prior to close of business on August 28, 2009, the Predecessor Fund's investment adviser was Touchstone Advisors, Inc. After the close of business on August 28, 2009, the Predecessor Fund was reorganized into the Fund. The annual investment adviser fee did not change due to this reorganization.
Annual Shareholder Report33
Administrative FeeFederated Administrative Services (FAS), under the Administrative Services Agreement, provides the Fund with administrative personnel and services. The fee paid to FAS is based on the average aggregate daily net assets of certain Federated funds as specified below:
| Administrative Fee | Average Aggregate Daily Net Assets
of the Federated Funds |
| 0.150% | on the first $5 billion |
| 0.125% | on the next $5 billion |
| 0.100% | on the next $10 billion |
| 0.075% | on assets in excess of $20 billion |
The administrative fee received during any fiscal year shall be at least $150,000 per portfolio and $40,000 per each additional class of Shares. Subject to the terms described in the Expense Limitation note, FAS may voluntarily choose to waive any portion of its fee. For the year ended September 30, 2010, the net fee paid to FAS was 0.076% of average daily net assets of the Fund. FAS waived $16,065 of its fee.
Prior to close of business on August 28, 2009, Touchstone Advisors, Inc. provided administrative services to the Predecessor Fund.
Distribution Services Fee
The Fund has adopted a Distribution Plan (the “Plan”) pursuant to Rule 12b-1 under the Act. Under the terms of the Plan, the Fund will compensate Federated Securities Corp. (FSC), the principal distributor, from the daily net assets of the Fund's Class A Shares, Class B Shares, Class C Shares and Class K Shares to finance activities intended to result in the sale of these shares. The Plan provides that the Fund may incur distribution expenses at the following percentages of average daily net assets annually, to compensate FSC:
| Share Class Name | Percentage of Average Daily
Net Assets of Class |
| Class A Shares | 0.05% |
| Class B Shares | 0.75% |
| Class C Shares | 0.75% |
| Class K Shares | 0.50% |
Subject to the terms described in the Expense Limitation note, FSC may voluntarily choose to waive any portion of its fee. When FSC receives fees, it may pay some or all of them to financial intermediaries whose customers purchase shares. For the year ended September 30, 2010, FSC retained $33,091 of fees paid by the Fund. For the year ended September 30, 2010, the Fund's Class A Shares did not incur a distribution services fee; however, it may begin to incur this fee upon approval of the Trustees.
Prior to close of business on August 28, 2009, Touchstone Securities, Inc., was the principal distributor for the Predecessor Fund.
Annual Shareholder Report34
Sales ChargesFront-end sales charges and contingent deferred sales charges (CDSC) do not represent expenses of the Fund. They are deducted from the proceeds of sales of Fund shares prior to investment or from redemption proceeds prior to remittance, as applicable. For the year ended September 30, 2010, FSC retained $85,399 in sales charges from the sale of Class A Shares. FSC also retained $256 of CDSC relating to redemptions of Class A Shares and $807 relating to redemptions of Class C Shares.
Shareholder Services Fee
The Fund may pay fees (“Service Fees”) up to 0.25% of the average daily net assets of the Fund's Class A Shares, Class B Shares and Class C Shares to financial intermediaries or to Federated Shareholder Services Company (FSSC) for providing services to shareholders and maintaining shareholder accounts. Subject to the terms described in the Expense Limitation note, FSSC may voluntarily reimburse the Fund for Service Fees. For the year ended September 30, 2010, FSSC did not receive any fees paid by the Fund.
Prior to close of business on August 28, 2009, Touchstone Securities, Inc., received Service Fees from the Predecessor Fund.
Expense Limitation
Effective November 30, 2010, the Adviser and its affiliates (which may include FSC, FAS and FSSC) have voluntarily agreed to waive their fees and/or reimburse expenses so that the total annual fund operating expenses (as shown in the financial highlights) paid by the Fund's Institutional Shares, Class A Shares, Class B Shares, Class C Shares and Class K Shares (after the voluntary waivers and reimbursements) will not exceed 0.94%, 1.19%, 1.92%, 1.92% and 1.42% (the “Fee Limit”), respectively, through the later of (the “Termination Date”): (a) November 30, 2011; or (b) the date of the Fund's next effective Prospectus. While the Adviser and its affiliates currently do not anticipate terminating or increasing these arrangements prior to the Termination Date, these arrangements may only be terminated or the Fee Limit increased prior to the Termination Date with the agreement of the Trustees.
Interfund Transactions
During the year ended September 30, 2010, the Fund engaged in purchase and sale transactions with funds that have a common investment adviser (or affiliated investment advisers), common Directors/Trustees and/or common Officers. These purchase and sale transactions complied with Rule 17a-7 under the Act and amounted to $704,093 and $6,172,322, respectively.
General
Certain Officers and Trustees of the Fund are Officers and Directors or Trustees of the above companies.
Annual Shareholder Report35
Transactions with Affiliated CompaniesAffiliated holdings are mutual funds which are managed by the Adviser or an affiliate of the Adviser. The Adviser has agreed to reimburse the Fund for certain investment adviser fees as a result of transactions in other affiliated mutual funds. For the year ended September 30, 2010, the Adviser reimbursed $20,774. Transactions with the affiliated company during the year ended September 30, 2010, were as follows:
| Affiliate | Balance of
Shares Held
9/30/2009 | Purchases/
Additions | Sales/
Reductions | Balance of
Shares Held
9/30/2010 | Value | Dividend
Income |
| Federated Prime Value Obligations Fund, Institutional Shares | 5,264,453 | 314,363,867 | 280,205,265 | 39,423,055 | $39,423,055 | $38,924 |
7. EXPENSE Reduction
The Fund directs portfolio trades to a broker that in turn pays a portion of the Fund's operating expenses. For the year ended September 30, 2010, the Fund's expenses were reduced by $32,683 under these arrangements.
8. Investment TRANSACTIONS
Purchases and sales of investments, excluding long-term U.S. government securities and short-term obligations, for the year ended September 30, 2010, were as follows:
| Purchases | $622,472,880 |
| Sales | $693,501,343 |
9. LINE OF CREDIT
The Fund participates in a $100,000,000 unsecured, uncommitted revolving line of credit (LOC) agreement with PNC Bank. The LOC was made available for extraordinary or emergency purposes, primarily for financing redemption payments. Borrowings are charged interest at a rate offered to the Fund by PNC Bank at the time of the borrowing. As of September 30, 2010, there were no outstanding loans. During the year ended September 30, 2010, the Fund did not utilize the LOC.
10. INTERFUND LENDING
Pursuant to an Exemptive Order issued by the Securities and Exchange Commission, the Fund, along with other funds advised by subsidiaries of Federated Investors, Inc., may participate in an interfund lending program. This program provides an alternative credit facility allowing the Fund to borrow from other participating affiliated funds. As of September 30, 2010, there were no outstanding loans. During the year ended September 30, 2010, the program was not utilized.
11. Legal Proceedings
Since February, 2004, Federated Investors, Inc. and related entities (collectively, “Federated”), have been named as defendants in several lawsuits that are now pending in the United States District Court for the Western District of Pennsylvania. These lawsuits have been consolidated into a single action alleging excessive advisory fees involving one of the Federated-sponsored mutual funds (“Federated Funds”). Federated and its counsel have been defending this litigation. Additional lawsuits based upon similar allegations may be filed in the future. The Annual Shareholder Report36
potential impact of these lawsuits, all of which seek monetary damages, attorneys' fees and expenses, and future potential similar suits is uncertain. Although we do not believe that these lawsuits will have a material adverse effect on the Federated Funds, there can be no assurance that these suits, ongoing adverse publicity and/or other developments resulting from the allegations in these matters will not result in increased redemptions, or reduced sales, of shares of the Federated Funds or other adverse consequences for the Federated Funds.12. Subsequent events
Effective December 31, 2010, Class K Shares will be redesignated as Class R Shares.
Management has evaluated subsequent events through the date the financial statements were issued, and determined that no additional events have occurred that require disclosure.
13. FEDERAL TAX INFORMATION (UNAUDITED)
For the fiscal year ended September 30, 2010, 100.0% of total income distributions made by the Fund are qualifying dividends which may be subject to a maximum tax rate of 15%, as provided for by the Jobs and Growth Tax Relief Act of 2003. Complete information is reported in conjunction with the reporting of your distributions on Form 1099-DIV.
Of the ordinary income distributions made by the Fund during the year ended September 30, 2010, 100.0% qualify for the dividend received deduction available to corporate shareholders.
Annual Shareholder Report37
Report of Independent Registered Public Accounting Firm
TO THE BOARD OF TRUSTEES OF THE FEDERATED EQUITY FUNDS AND SHAREHOLDERS OF Federated clover value fund:
We have audited the accompanying statement of assets and liabilities, including the portfolio of investments, of the Federated Clover Value Fund (the “Fund”), a portfolio of Federated Equity Funds, as of September 30, 2010, and the related statement of operations for the year then ended, the statements of changes in net assets for each of the years or periods in the two-year period then ended and the financial highlights for each of the years or periods in the two-year period then ended. These financial statements and financial highlights are the responsibility of the Fund's management. Our responsibility is to express an opinion on these financial statements and financial highlights based on our audits. The financial highlights for the periods presented prior to October 1, 2008, were audited by other independent registered public accountants whose report thereon dated November 25, 2008, expressed an unqualified opinion on those statements.
We conducted our audits in accordance with the standards of the Public Company Accounting Oversight Board (United States). Those standards require that we plan and perform the audit to obtain reasonable assurance about whether the financial statements and financial highlights are free of material misstatement. An audit includes examining, on a test basis, evidence supporting the amounts and disclosures in the financial statements. Our procedures included confirmation of securities owned as of September 30, 2010, by correspondence with the custodian and brokers. An audit also includes assessing the accounting principles used and significant estimates made by management, as well as evaluating the overall financial statement presentation. We believe that our audits provide a reasonable basis for our opinion.
In our opinion, the financial statements and financial highlights referred to above present fairly, in all material respects, the financial position of the Federated Clover Value Fund as of September 30, 2010, and the results of its operations for the year then ended, the changes in its net assets for each of the years or periods in the two-year period then ended and the financial highlights for each of the years or periods in the two-year period then ended, in conformity with U.S. generally accepted accounting principles.
Boston, Massachusetts
November 22, 2010
Annual Shareholder Report38
Board of Trustees and Trust Officers
The Board of Trustees is responsible for managing the Trust's business affairs and for exercising all the Trust's powers except those reserved for the shareholders. The following tables give information about each Trustee and the senior officers of the Fund. Where required, the tables separately list Trustees who are “interested persons” of the Fund (i.e., “Interested” Trustees) and those who are not (i.e., “Independent” Trustees). Unless otherwise noted, the address of each person listed is Federated Investors Tower, 1001 Liberty Avenue, Pittsburgh, PA 15222. The address of all Independent Trustees listed is 4000 Ericsson Drive, Warrendale, PA 15086-7561; Attention: Mutual Fund Board. As of December 31, 2009, the Trust comprised 13 portfolio(s), and the Federated Fund Family consisted of 43 investment companies (comprising 145 portfolios). Unless otherwise noted, each Officer is elected annually. Unless otherwise noted, each Trustee oversees all portfolios in the Federated Fund Family and serves for an indefinite term. The Fund's Statement of Additional Information includes additional information about Trust Trustees and is available, without charge and upon request, by calling 1-800-341-7400.
Interested TRUSTEES Background
Name
Birth Date
Positions Held with Trust
Date Service Began | Principal Occupation(s) for Past Five Years,
Other Directorships Held and Previous Position(s) |
John F. Donahue*
Birth Date: July 28, 1924
Trustee
Began serving: April 1984 | Principal Occupations: Director or Trustee of the Federated Fund Family; Chairman and Director, Federated Investors, Inc.; Chairman of the Federated Fund Family's Executive Committee.
Previous Positions: Chairman of the Federated Fund Family; Trustee, Federated Investment Management Company; Chairman and Director, Federated Investment Counseling. |
J. Christopher Donahue*
Birth Date: April 11, 1949
PRESIDENT AND Trustee
Began serving: January 2000 | Principal Occupations: Principal Executive Officer and President of the Federated Fund Family; Director or Trustee of some of the Funds in the Federated Fund Family; President, Chief Executive Officer and Director, Federated Investors, Inc.; Chairman and Trustee, Federated Investment Management Company; Trustee, Federated Investment Counseling; Chairman and Director, Federated Global Investment Management Corp.; Chairman, Federated Equity Management Company of Pennsylvania and Passport Research, Ltd. (investment advisory subsidiary of Federated); Trustee, Federated Shareholder Services Company; Director, Federated Services Company.
Previous Positions: President, Federated Investment Counseling; President and Chief Executive Officer, Federated Investment Management Company, Federated Global Investment Management Corp. and Passport Research, Ltd. |
| * | Family relationships and reasons for “interested” status: John F. Donahue is the father of J. Christopher Donahue; both are “interested” due to their beneficial ownership of shares of Federated Investors, Inc. and the positions they hold with Federated and its subsidiaries. |
Annual Shareholder Report39
INDEPENDENT TRUSTEES Background
Name
Birth Date
Positions Held with Trust
Date Service Began | Principal Occupation(s) for Past Five Years,
Other Directorships Held, Previous Position(s) and Qualifications |
John T. Conroy, Jr., Ph.D.
Birth Date: June 23, 1937
Trustee
Began serving: November 1991 | Principal Occupations: Director or Trustee of the Federated Fund Family; Chairman of the Board, Investment Properties Corporation; Partner or Trustee in private real estate ventures in Southwest Florida; Assistant Professor in Theology, Blessed Edmund Rice School for Pastoral Ministry.
Previous Positions: President, Investment Properties Corporation; Senior Vice President, John R. Wood and Associates, Inc., Realtors; President, Naples Property Management, Inc. and Northgate Village Development Corporation.
Qualifications: Business management and director experience. |
Nicholas P. Constantakis, CPA
Birth Date: September 3, 1939
Trustee
Began serving: February 1998 | Principal Occupation: Director or Trustee of the Federated Fund Family.
Other Directorship Held: Director and Chairman of the Audit Committee, Michael Baker Corporation (architecture, engineering and construction services).
Previous Position: Partner, Andersen Worldwide SC.
Qualifications: Public accounting and director experience. |
John F. Cunningham
Birth Date: March 5, 1943
Trustee
Began serving: January 1999 | Principal Occupation: Director or Trustee of the Federated Fund Family.
Other Directorships Held: Chairman, President and Chief Executive Officer, Cunningham & Co., Inc. (strategic business consulting); Trustee Associate, Boston College.
Previous Positions: Director, Redgate Communications and EMC Corporation (computer storage systems); Chairman of the Board and Chief Executive Officer, Computer Consoles, Inc.; President and Chief Operating Officer, Wang Laboratories; Director, First National Bank of Boston; Director, Apollo Computer, Inc.
Qualifications: Business management and director experience. |
Maureen Lally-Green
Birth Date: July 5, 1949
Trustee
Began serving: August 2009 | Principal Occupations: Director or Trustee of the Federated Fund Family; Director, Office of Church Relations, Diocese of Pittsburgh; Adjunct Professor of Law, Duquesne University School of Law.
Other Directorships Held: Trustee, St. Francis University; Director, Ireland Institute of Pittsburgh; Director, UPMC Mercy Hospital; Regent, St. Vincent Seminary; Director, Epilepsy Foundation of Western and Central Pennsylvania; Director, Saint Thomas More Society, Allegheny County; Director, Carlow University.
Previous Position: Pennsylvania Superior Court Judge.
Qualifications: Legal and director experience. |
Annual Shareholder Report40
Name
Birth Date
Positions Held with Trust
Date Service Began | Principal Occupation(s) for Past Five Years,
Other Directorships Held, Previous Position(s) and Qualifications |
Peter E. Madden
Birth Date: March 16, 1942
Trustee
Began serving: November 1991 | Principal Occupation: Director or Trustee, and Chairman of the Board of Directors or Trustees, of the Federated Fund Family.
Other Directorship Held: Board of Overseers, Babson College.
Previous Positions: Representative, Commonwealth of Massachusetts General Court; President, Chief Operating Officer and Director, State Street Bank and Trust Company and State Street Corporation (retired); Director, VISA USA and VISA International; Chairman and Director, Massachusetts Bankers Association; Director, Depository Trust Corporation; Director, The Boston Stock Exchange.
Qualifications: Business management, mutual fund services and director experience. |
Charles F. Mansfield, Jr.
Birth Date: April 10, 1945
Trustee
Began serving: January 1999 | Principal Occupations: Director or Trustee and Chairman of the Audit Committee of the Federated Fund Family; Management Consultant.
Previous Positions: Chief Executive Officer, PBTC International Bank; Partner, Arthur Young & Company (now Ernst & Young LLP); Chief Financial Officer of Retail Banking Sector, Chase Manhattan Bank; Senior Vice President, HSBC Bank USA (formerly, Marine Midland Bank); Vice President, Citibank; Assistant Professor of Banking and Finance, Frank G. Zarb School of Business, Hofstra University; Executive Vice President, DVC Group, Inc. (marketing, communications and technology).
Qualifications: Banking, business management, public accounting and director experience. |
R. James Nicholson
Birth Date: February 4, 1938
Trustee
Began serving: January 2008 | Principal Occupations: Director or Trustee of the Federated Fund Family; Senior Counsel, Brownstein Hyatt Farber Schrek, P.C.; Former Secretary of the U.S. Dept. of Veterans Affairs; Former U.S. Ambassador to the Holy See; Former Chairman of the Republican National Committee.
Other Directorships Held: Director, Horatio Alger Association; Director, The Daniels Fund.
Previous Positions: Colonel, U.S. Army Reserve; Partner, Calkins, Kramer, Grimshaw and Harring, P.C.; General Counsel, Colorado Association of Housing and Building; Chairman and CEO, Nicholson Enterprises, Inc. (real estate holding company); Chairman and CEO, Renaissance Homes of Colorado.
Qualifications: Legal, government, business management and mutual fund director experience. |
Annual Shareholder Report41
Name
Birth Date
Positions Held with Trust
Date Service Began | Principal Occupation(s) for Past Five Years,
Other Directorships Held, Previous Position(s) and Qualifications |
Thomas M. O'Neill
Birth Date: June 14, 1951
Trustee
Began serving: October 2006 | Principal Occupations: Director or Trustee of the Federated Fund Family; Sole Proprietor, Navigator Management Company (investment and strategic consulting).
Other Directorships Held: Board of Overseers, Children's Hospital of Boston; Visiting Committee on Athletics, Harvard College.
Previous Positions: Chief Executive Officer and President, Managing Director and Chief Investment Officer, Fleet Investment Advisors; President and Chief Executive Officer, Aeltus Investment Management, Inc.; General Partner, Hellman, Jordan Management Co., Boston, MA; Chief Investment Officer, The Putnam Companies, Boston, MA; Credit Analyst and Lending Officer, Fleet Bank; Director and Consultant, EZE Castle Software (investment order management software); Director, Midway Pacific (lumber).
Qualifications: Business management, mutual fund, director and investment experience. |
John S. Walsh
Birth Date: November 28, 1957
Trustee
Began serving: January 1999 | Principal Occupations: Director or Trustee of the Federated Fund Family; President and Director, Heat Wagon, Inc. (manufacturer of construction temporary heaters); President and Director, Manufacturers Products, Inc. (distributor of portable construction heaters); President, Portable Heater Parts, a division of Manufacturers Products, Inc.
Previous Position: Vice President, Walsh & Kelly, Inc.
Qualifications: Business management and director experience. |
James F. Will
Birth Date: October 12, 1938
Trustee
Began serving: April 2006 | Principal Occupations: Director or Trustee of the Federated Fund Family; formerly, Vice Chancellor and President, Saint Vincent College.
Other Directorships Held: Trustee, Saint Vincent College; Director, Alleghany Corporation; Trustee, Wheeling Jesuit University; Director, Liberty Tire Recycling.
Previous Positions: Chairman, President and Chief Executive Officer, Armco, Inc.; President and Chief Executive Officer, Cyclops Industries; President and Chief Operating Officer, Kaiser Steel Corporation.
Qualifications: Business management, education and director experience. |
Annual Shareholder Report42
OFFICERS
Name
Birth Date
Address
Positions Held with Trust
Date Service Began | Principal Occupation(s) for Past Five Years
and Previous Position(s) |
John W. McGonigle
Birth Date: October 26, 1938
EXECUTIVE VICE PRESIDENT AND SECRETARY
Began serving: April 1984 | Principal Occupations: Executive Vice President and Secretary of the Federated Fund Family; Vice Chairman, Executive Vice President, Secretary and Director, Federated Investors, Inc.
Previous Positions: Trustee, Federated Investment Management Company and Federated Investment Counseling; Director, Federated Global Investment Management Corp., Federated Services Company and Federated Securities Corp. |
Richard A. Novak
Birth Date: December 25, 1963
TREASURER
Began serving: January 2006 | Principal Occupations: Principal Financial Officer and Treasurer of the Federated Fund Family; Senior Vice President, Federated Administrative Services; Financial and Operations Principal for Federated Securities Corp., Edgewood Services, Inc. and Southpointe Distribution Services, Inc.
Previous Positions: Controller of Federated Investors, Inc.; Vice President, Finance of Federated Services Company; held various financial management positions within The Mercy Hospital of Pittsburgh; Auditor, Arthur Andersen & Co. |
Brian P. Bouda
Birth Date: February 28, 1947
CHIEF COMPLIANCE OFFICER AND SENIOR VICE PRESIDENT
Began serving: August 2004 | Principal Occupations: Senior Vice President and Chief Compliance Officer of the Federated Fund Family; Vice President and Chief Compliance Officer of Federated Investors, Inc. and Chief Compliance Officer of its subsidiaries. Mr. Bouda joined Federated in 1999 and is a member of the American Bar Association and the State Bar Association of Wisconsin. |
Stephen F. Auth
Birth Date: September 3, 1956
450 Lexington Avenue
Suite 3700
New York, NY 10017-3943
CHIEF INVESTMENT OFFICER
Began serving: November 2002 | Principal Occupations: Mr. Auth is Chief Investment Officer of this Fund and various other Funds in the Federated Fund Family; Executive Vice President, Federated Investment Counseling, Federated Global Investment Management Corp. and Federated Equity Management Company of Pennsylvania.
Previous Positions: Executive Vice President, Federated Investment Management Company, and Passport Research, Ltd. (investment advisory subsidiary of Federated); Senior Vice President, Global Portfolio Management Services Division; Senior Vice President, Federated Investment Management Company and Passport Research, Ltd.; Senior Managing Director and Portfolio Manager, Prudential Investments. |
Lawrence Auriana
Birth Date: January 8, 1944
140 East 45th Street
New York, NY 10017
VICE PRESIDENT
Began serving: November 2001 | Principal Occupations: Lawrence Auriana is Vice President of the Trust. Mr. Auriana joined Federated in April 2001 as Co-Head of Investments/Federated Kaufmann. From August 1984 to April 2001, Mr. Auriana was President and Treasurer of Edgemont Asset Management Corp., and Chairman of the Board and Portfolio Manager to The Kaufmann Fund, Inc. (predecessor to the Federated Kaufmann Fund). Mr. Auriana earned a B.S. in economics from Fordham University and has been engaged in the securities business since 1965. |
Annual Shareholder Report43
Name
Birth Date
Address
Positions Held with Trust
Date Service Began | Principal Occupation(s) for Past Five Years
and Previous Position(s) |
Walter C. Bean
Birth Date: June 22, 1945
VICE PRESIDENT
Began serving: November 2006 | Principal Occupations: Walter C. Bean is Vice President of the Trust. Mr. Bean is a Senior Vice President, Senior Portfolio Manager and the Head of the Equity Income Management Team of the Fund's Adviser. Mr. Bean joined Federated in 2000. His previous associations included: various investment management and research positions with C.S. McKee & Company; First Chicago Investment Advisors; CIGNA Investment Advisors; and Mellon Bank. Mr. Bean earned a Bachelors Degree in Business Administration from Ohio University and an M.B.A. from the Pennsylvania State University. Mr. Bean has received the Chartered Financial Analyst designation and has 36 years of investment experience. |
Richard B. Fisher
Birth Date: May 17, 1923
VICE PRESIDENT
Began serving: April 1984 | Principal Occupations: Vice Chairman or Vice President of some of the Funds in the Federated Fund Family; Vice Chairman, Federated Investors, Inc.; Chairman, Federated Securities Corp.
Previous Positions: President and Director or Trustee of some of the Funds in the Federated Fund Family; Executive Vice President, Federated Investors, Inc.; Director and Chief Executive Officer, Federated Securities Corp. |
Hans P. Utsch
Birth Date: July 3, 1936
140 East 45th Street
New York, NY 10017
VICE PRESIDENT
Began serving: November 2001 | Principal Occupations: Hans P. Utsch is Vice President of the Trust. Mr. Utsch joined Federated in April 2001 as Co-Head of Investments/Federated Kaufmann. From August 1984 to April 2001, Mr. Utsch was Chairman of the Board and Secretary of Edgemont Asset Management Corp., and President and Portfolio Manager to The Kaufmann Fund, Inc. (predecessor to the Federated Kaufmann Fund). Mr. Utsch graduated from Amherst College and holds an M.B.A. from Columbia University. He has been engaged in the securities business since 1962. |
Annual Shareholder Report44
Evaluation and Approval of Advisory Contract - May 2010
Federated Clover Value Fund (the “Fund”)
The Fund's Board reviewed the Fund's investment advisory contract at meetings held in May 2010. The Board's decision regarding the contract reflects the exercise of its business judgment on whether to continue the existing arrangements.
In this connection, the Federated funds' Board had previously appointed a Senior Officer, whose duties include specified responsibilities relating to the process by which advisory fees are to be charged to a Federated fund. The Senior Officer has the authority to retain consultants, experts, or staff as may be reasonably necessary to assist in the performance of his duties, reports directly to the Board, and may be terminated only with the approval of a majority of the independent members of the Board. The Senior Officer prepared and furnished to the Board an independent, written evaluation that covered topics discussed below. The Board considered that evaluation, along with other information, in deciding to approve the advisory contract.
During its review of the contract, the Board considered compensation and benefits received by the Adviser. This included the fees received for services provided to the Fund by other entities in the Federated organization and research services (if any) received by the Adviser from brokers that execute Federated fund trades, as well as advisory fees. The Board is also familiar with and considered judicial decisions concerning allegedly excessive investment advisory fees, which have indicated that the following factors may be relevant to an Adviser's fiduciary duty with respect to its receipt of compensation from a fund: the nature and quality of the services provided by the Adviser, including the performance of the fund; the Adviser's cost of providing the services; the extent to which the Adviser may realize “economies of scale” as a fund grows larger; any indirect benefits that may accrue to the Adviser and its affiliates as a result of the Adviser's relationship with a fund; performance and expenses of comparable funds; and the extent to which the independent Board members are fully informed about all facts the Board deems relevant bearing on the Adviser's services and fees. The Board further considered management fees (including any components thereof) charged to institutional and other clients of the Adviser for what might be viewed as like services, and the cost to the Adviser and its affiliates of supplying services pursuant to the management fee agreements, excluding any intra-corporate profit and profit margins of the Adviser and its affiliates for supplying such services. The Board was aware of these factors and was guided by them in its review of the Fund's advisory contract to the extent it considered them to be appropriate and relevant, as discussed further below.
Annual Shareholder Report45
The Board considered and weighed these circumstances in light of its substantial accumulated experience in governing the Fund and working with Federated on matters relating to the Federated funds, and was assisted in its deliberations by independent legal counsel. Throughout the year, the Board has requested and received substantial and detailed information about the Fund and the Federated organization that was in addition to the extensive materials that comprise and accompany the Senior Officer's evaluation. Federated provided much of this information at each regular meeting of the Board, and furnished additional reports in connection with the particular meeting at which the Board's formal review of the advisory contract occurred. Between regularly scheduled meetings, the Board also received information on particular matters as the need arose. Thus, the Board's consideration of the advisory contract included review of the Senior Officer's evaluation, accompanying data and additional reports covering such matters as: the Adviser's investment philosophy, revenue, profitability, personnel and processes; investment and operating strategies; the Fund's short- and long-term performance (in absolute terms, both on a gross basis and net of expenses, as well as in relationship to its particular investment program and certain competitor or “peer group” funds and/or other benchmarks, as appropriate), and comments on the reasons for performance; the Fund's investment objectives; the Fund's expenses (including the advisory fee itself and the overall expense structure of the Fund, both in absolute terms and relative to similar and/or competing funds, with due regard for contractual or voluntary expense limitations); the use and allocation of brokerage commissions derived from trading the Fund's portfolio securities (if any); and the nature, quality and extent of the advisory and other services provided to the Fund by the Adviser and its affiliates. The Board also considered the preferences and expectations of Fund shareholders and their relative sophistication; the continuing state of competition in the mutual fund industry and market practices; the range of comparable fees for similar funds in the mutual fund industry; the Fund's relationship to the Federated family of funds which include a comprehensive array of funds with different investment objectives, policies and strategies which are available for exchange without the incurrence of additional sales charges; compliance and audit reports concerning the Federated funds and the Federated companies that service them (including communications from regulatory agencies), as well as Federated's responses to any issues raised therein; and relevant developments in the mutual fund industry and how the Federated funds and/or Federated are responding to them. The Board's evaluation process is evolutionary. The criteria considered and the emphasis placed on relevant criteria change in recognition of changing circumstances in the mutual fund marketplace. With respect to the Fund's performance and expenses in particular, the Board has found the use of comparisons to other mutual funds with comparable investment programs to be relevant, given the high degree of competition in the mutual fund business. The Board focused on comparisons with other similar Annual Shareholder Report46
mutual funds more heavily than non-mutual fund products or services because it is believed that they are more relevant. For example, other mutual funds are the products most like the Fund, they are readily available to Fund shareholders as alternative investment vehicles, and they are the type of investment vehicle in fact chosen and maintained by the Fund's investors. The range of their fees and expenses therefore appears to be a generally reliable indication of what consumers have found to be reasonable in the precise marketplace in which the Fund competes. The Fund's ability to deliver competitive performance when compared to its peer group was a useful indicator of how the Adviser is executing the Fund's investment program, which in turn assisted the Board in reaching a conclusion that the nature, extent, and quality of the Adviser's investment management services were such as to warrant continuation of the advisory contract. In this regard, the Senior Officer has reviewed Federated's fees for providing advisory services to products outside the Federated family of funds (e.g., institutional and separate accounts). He concluded that mutual funds and institutional accounts are inherently different products. Those differences include, but are not limited to, different types of targeted investors; being subject to different laws and regulations; different legal structures; different average account sizes; different associated costs; different portfolio management techniques made necessary by different cash flows; and portfolio manager time spent in review of securities pricing. The Senior Officer did not consider these fee schedules to be determinative in judging the appropriateness of mutual fund advisory contracts.The Senior Officer reviewed reports compiled by Federated, using data supplied by independent fund ranking organizations, regarding the performance of, and fees charged by, other mutual funds, noting his view that comparisons to fund peer groups are relevant in judging the reasonableness of proposed fees.
For the periods covered by the report, the Fund's performance for the three-year and five-year periods was above the median of the relevant peer group, and the Fund's performance fell below the median of the relevant peer group for the one-year period. The Board discussed the Fund's performance with the Adviser and recognized the efforts being undertaken by the Adviser. The Board will continue to monitor these efforts and the performance of the Fund.
The Board also received financial information about Federated, including reports on the compensation and benefits Federated derived from its relationships with the Federated funds. These reports covered not only the fees under the advisory contracts, but also fees received by Federated's subsidiaries for providing other services to the Federated funds under separate contracts (e.g., for serving as the Federated funds' administrator). The reports also discussed any indirect benefit Federated may derive from its receipt of research services from brokers who execute Federated fund trades. In addition, the Board considered the fact that, in order for a fund to be competitive in the marketplace, Federated and its affiliates frequently waived fees and/or Annual Shareholder Report47
reimbursed expenses and have disclosed to fund investors and/or indicated to the Board their intention to do so in the future, where appropriate. Moreover, the Board receives regular reports regarding the institution or elimination of these voluntary waivers.Federated furnished reports, requested by the Senior Officer, that reported revenues on a fund-by-fund basis and made estimates of the allocation of expenses on a fund-by-fund basis, using allocation methodologies specified by the Senior Officer. The Senior Officer noted that, although they may apply consistent allocation processes, the inherent difficulties in allocating costs (and the unavoidable arbitrary aspects of that exercise) and the lack of consensus on how to allocate those costs may render such allocation reports unreliable. The allocation reports were considered in the analysis by the Board but were determined to be of limited use.
The Board and the Senior Officer also reviewed a report compiled by Federated comparing profitability information for Federated to other publicly held fund management companies. In this regard, the Senior Officer noted the limited availability of such information, but nonetheless concluded that Federated's profit margins did not appear to be excessive and the Board agreed.
The Senior Officer's evaluation also discussed the notion of possible realization of “economies of scale” as a fund grows larger. The Board considered in this regard that the Adviser has made significant and long-term investments in areas that support all of the Federated funds, such as personnel and processes for the portfolio management, compliance, and risk management functions; and systems technology; and that the benefits of these efforts (as well as any economies, should they exist) were likely to be enjoyed by the fund complex as a whole. Finally, the Board also noted the absence of any applicable regulatory or industry guidelines on this subject, which (as discussed in the Senior Officer's evaluation) is compounded by the lack of any common industry practice or general pattern with respect to structuring fund advisory fees with “breakpoints” that serve to reduce the fee as the fund attains a certain size. The Senior Officer did not recommend institution of breakpoints in pricing Federated's fund advisory services at this time.
It was noted in the materials for the Board meeting that for the period covered by the report, the Fund's investment advisory fee, after waivers and expense reimbursements, if any, was above the median of the relevant peer group. The Board reviewed the fees and other expenses of the Fund with the Adviser and was satisfied that the overall expense structure of the Fund remained competitive. The Board will continue to monitor advisory fees and other expenses borne by the Fund.
The Senior Officer's evaluation noted his belief that the information and observations contained in his evaluation supported a finding that the proposed management fees are reasonable, and that Federated appeared to provide appropriate administrative services to the Fund for the fees paid. Under these Annual Shareholder Report48
circumstances, no changes were recommended to, and no objection was raised to, the continuation of the Fund's advisory contract. The Board concluded that the nature, quality and scope of services provided the Fund by the Adviser and its affiliates were satisfactory.In its decision to continue an existing investment advisory contract, the Board was mindful of the potential disruptions of the Fund's operations and various risks, uncertainties and other effects that could occur as a result of a decision to terminate or not renew an advisory contract. In particular, the Board recognized that many shareholders have invested in the Fund on the strength of the Adviser's industry standing and reputation and with the expectation that the Adviser will have a continuing role in providing advisory services to the Fund. Thus, the Board's approval of the advisory contract reflected the fact that it is the shareholders who have effectively selected the Adviser by virtue of having invested in the Fund.
The Board based its decision to approve the advisory contract on the totality of the circumstances and relevant factors and with a view to past and future long-term considerations. Not all of the factors and considerations identified above were necessarily relevant to the Fund, nor did the Board consider any one of them to be determinative. With respect to the factors that were relevant, the Board's decision to approve the contract reflects its determination that Federated's performance and actions provided a satisfactory basis to support the decision to continue the existing arrangements.
Annual Shareholder Report49
Voting Proxies on Fund Portfolio Securities
A description of the policies and procedures that the Fund uses to determine how to vote proxies, if any, relating to securities held in the Fund's portfolio is available, without charge and upon request, by calling 1-800-341-7400. A report on “Form N-PX” of how the Fund voted any such proxies during the most recent 12-month period ended June 30 is available from Federated's website at FederatedInvestors.com. To access this information from the “Products” section of the website, click on the “Prospectuses and Regulatory Reports” link under “Related Information,” then select the appropriate link opposite the name of the Fund; or select the name of the Fund and from the Fund's page, click on the “Prospectuses and Regulatory Reports” link. Form N-PX filings are also available at the SEC's website at www.sec.gov.
Quarterly Portfolio Schedule
The Fund files with the SEC a complete schedule of its portfolio holdings, as of the close of the first and third quarters of its fiscal year, on “Form N-Q.” These filings are available on the SEC's website at www.sec.gov and may be reviewed and copied at the SEC's Public Reference Room in Washington, DC. (Call 1-800-SEC-0330 for information on the operation of the Public Reference Room.) You may also access this information from the “Products” section of Federated's website at FederatedInvestors.com by clicking on “Portfolio Holdings” under “Related Information,” then selecting the appropriate link opposite the name of the Fund; or select the name of the Fund and from the Fund's page, click on the “Portfolio Holdings” link.
Annual Shareholder Report50
Mutual funds are not bank deposits or obligations, are not guaranteed by any bank and are not insured or guaranteed by the U.S. government, the Federal Deposit Insurance Corporation, the Federal Reserve Board or any other government agency. Investment in mutual funds involves investment risk, including the possible loss of principal.
This Report is authorized for distribution to prospective investors only when preceded or accompanied by the Fund's Prospectus, which contains facts concerning its objective and policies, management fees, expenses and other information.
Federated Clover Value Fund
Federated Investors Funds
4000 Ericsson Drive
Warrendale, PA 15086-7561
Contact us at FederatedInvestors.com
or call 1-800-341-7400.
Federated Securities Corp., Distributor
Cusip 314172255
Cusip 314172248
Cusip 314172230
Cusip 314172222
41200 (11/10)
Federated is a registered mark of Federated Investors, Inc.
2010 © Federated Investors, Inc.
Federated Clover Value Fund
A Portfolio of Federated Equity Funds
ANNUAL SHAREHOLDER REPORTSeptember 30, 2010
Institutional Shares
FINANCIAL HIGHLIGHTS
SHAREHOLDER EXPENSE EXAMPLE
MANAGEMENT'S DISCUSSION OF FUND PERFORMANCE
PORTFOLIO OF INVESTMENTS SUMMARY TABLE
PORTFOLIO OF INVESTMENTS
STATEMENT OF ASSETS AND LIABILITIES
STATEMENT OF OPERATIONS
STATEMENT OF CHANGES IN NET ASSETS
NOTES TO FINANCIAL STATEMENTS
REPORT OF INDEPENDENT REGISTERED PUBLIC ACCOUNTING FIRM
BOARD OF TRUSTEES AND TRUST OFFICERS
EVALUATION AND APPROVAL OF ADVISORY CONTRACT
VOTING PROXIES ON FUND PORTFOLIO SECURITIES
QUARTERLY PORTFOLIO SCHEDULE
Financial Highlights - Institutional Shares
(For a Share Outstanding Throughout Each Period)
| Year Ended
9/30/2010 | Period
Ended
9/30/20091 |
| Net Asset Value, Beginning of Period | $12.63 | $12.29 |
| Income From Investment Operations: | | |
| Net investment income | 0.112 | 0.012 |
| Net realized and unrealized gain on investments | 0.39 | 0.33 |
| TOTAL FROM INVESTMENT OPERATIONS | 0.50 | 0.34 |
| Less Distributions: | | |
| Distributions from net investment income | (0.11) | — |
| Net Asset Value, End of Period | $13.02 | $12.63 |
| Total Return3 | 4.00% | 2.77% |
| Ratios to Average Net Assets: | | |
| Net expenses | 0.94%4 | 0.94%4,5 |
| Net investment income | 0.87% | 0.54%5 |
| Expense waiver/reimbursement6 | 0.13% | 0.44%5 |
| Supplemental Data: | | |
| Net assets, end of period (000 omitted) | $143,281 | $12,033 |
| Portfolio turnover | 76% | 73%7 |
| 1 | Reflects operations for the period from August 29, 2009 (deemed the date of initial investment, pursuant to a reorganization that took place on August 28, 2009) to September 30, 2009. See Note 2 to the Financial Statements. |
| 2 | Per share numbers have been calculated using the average shares method. |
| 3 | Based on net asset value. Total returns for periods of less than one year are not annualized. |
| 4 | The net expense ratio is calculated without reduction for fees paid indirectly for expense offset arrangements. The net expense ratios are 0.93% and 0.94% for the year ended September 30, 2010 and for the period ended September 30, 2009, respectively, after taking into account these expense reductions. |
| 5 | Computed on an annualized basis. |
| 6 | This expense decrease is reflected in both the net expense and the net investment income ratios shown above. |
| 7 | Portfolio turnover is calculated at the Fund level. Percentage indicated was calculated for the year ended September 30, 2009. |
See Notes which are an integral part of the Financial Statements
Annual Shareholder Report1
Shareholder Expense Example (unaudited)
As a shareholder of the Fund, you incur ongoing costs, including management fees and to the extent applicable, distribution (12b-1) fees and/or shareholder services fees and other Fund expenses. This Example is intended to help you to understand your ongoing costs (in dollars) of investing in the Fund and to compare these costs with the ongoing costs of investing in other mutual funds. It is based on an investment of $1,000 invested at the beginning of the period and held for the entire period from April 1, 2010 to September 30, 2010.
The first section of the table below provides information about actual account values and actual expenses. You may use the information in this section, together with the amount you invested, to estimate the expenses that you incurred over the period. Simply divide your account value by $1,000 (for example, an $8,600 account value divided by $1,000 = 8.6), then multiply the result by the number in the first section under the heading entitled “Expenses Paid During Period” to estimate the expenses attributable to your investment during this period.
HYPOTHETICAL EXAMPLE FOR COMPARISON PURPOSES
The second section of the table below provides information about hypothetical account values and hypothetical expenses based on the Fund's actual expense ratio and an assumed rate of return of 5% per year before expenses, which is not the Fund's actual return. Thus, you should not use the hypothetical account values and expenses to estimate the actual ending account balance or your expenses for the period. Rather, these figures are required to be provided to enable you to compare the ongoing costs of investing in the Fund with other funds. To do so, compare this 5% hypothetical example with the 5% hypothetical examples that appear in the shareholder reports of the other funds.
Please note that the expenses shown in the table are meant to highlight your ongoing costs only. Therefore, the second section of the table is useful in comparing ongoing costs only, and will not help you determine the relative total costs of owning different funds.
| Beginning
Account Value
4/1/2010 | Ending
Account Value
9/30/2010 | Expenses Paid
During Period1 |
| Actual | $1,000 | $944.90 | $4.58 |
Hypothetical (assuming a 5% return
before expenses) | $1,000 | $1,020.36 | $4.76 |
| 1 | Expenses are equal to the Fund's annualized net expense ratio of 0.94%, multiplied by the average account value over the period, multiplied by 183/365 (to reflect the one-half-year period). |
Annual Shareholder Report2
Performance data quoted represents past performance which is no guarantee of future results. Investment return and principal value will fluctuate so that an investor's shares, when redeemed, may be worth more or less than their original cost. Mutual fund performance changes over time and current performance may be lower or higher than what is stated. For current to the most recent month-end performance and after-tax returns, visit FederatedInvestors.com or call 1-800-341-7400.
Management's Discussion of Fund
Performance (unaudited)
For the fiscal year ended September 30, 2010, the Fund produced a total return, based on net asset value, of 4.00%. Over the same period, the Russell 1000® Value Index (RU1V),1 a broad-based securities market index, returned 8.90%. The Fund's total return for the fiscal year reflected actual cash flows, transaction costs and other expenses which were not reflected in the total return of the RU1V.
market overview
The Fund's fiscal year was characterized by see-saw market action driven by alternating waves of encouraging and dispiriting news flow. Reevaluations of the velocity and direction of interest rates, employment, housing, currencies and earnings kept investors paralyzed and largely on the sidelines; declining market volumes were a symptom of the apathetic mood. During this period, the broad market, as measured by the Standard & Poor's 500 Index (S&P 500),2 managed to return 10.16%. Despite lingering economic woes, the ever-forward-looking stock market took an optimistic turn in September, to finish the period firmly in positive territory.
| 1 | The Russell 1000® Value Index measures the performance of the 1,000 largest of the 3,000 largest U.S.-domiciled companies (based on total market capitalization) with lower price-to-book ratios and lower forecasted growth values. The index is unmanaged and, unlike the fund, is not affected by cash flows. It is not possible to invest directly in an index. |
| 2 | The S&P 500 is an unmanaged, capitalization-weighted index of 500 stocks designed to measure performance of the broad domestic economy through changes in the aggregate market value of 500 stocks representing all major industries. The index is unmanaged and, unlike the fund, not affected by cash flows. It is not possible to invest directly in an index. |
Annual Shareholder Report3
FUND PERFORMANCE
The Materials and Health Care sectors contributed positively to the Fund's performance for the reporting period. Stocks such as DuPont and Merck were notable contributors toward driving sector performance. Detracting from relative performance were the Industrials and Energy sectors. Stocks such as URS, Transocean and Exxon Mobil performed poorly. The lag in relative performance for the fiscal year is primarily attributable to disappointing stock selection across the majority of sectors.
POSITIONING AND STRATEGY
Historically, the Fund has enjoyed consistent success in the Energy sector. However, in the June quarter, the Fund suffered a setback due to its holdings in Transocean and Anadarko. Both firms had direct exposure to the New Horizon well disaster which was operated by British Petroleum, an event that was impossible to predict. Despite the setback, the Fund continued to seek opportunities in the Energy sector. Market volatility remained prominent during the fiscal year. As such, the Fund continued to favor companies with consistent cash flows, strong balance sheets and a propensity to return excess cash to shareholders in the form of dividends or share repurchases.
The Fund ended the fiscal year overweighted relative to the benchmark in Consumer Discretionary and Energy, while being underweighted in Financials and Industrials. The Fund's over- or underweights relative to its benchmark are driven not by economic forecasts but, rather, by the analysts' view of company-specific opportunities within each sector. While the Fund's managers remained aware of macroeconomic factors that affected Fund performance, the investment approach focused instead on bottom-up, fundamental analysis that sought to construct a well-diversified, risk-controlled portfolio.3
| 3 | Diversification does not assure a profit nor protect against loss. Value stocks tend to have higher dividends and thus have a higher income-related component in their total return than growth stocks. Value stocks also may lag growth stocks in performance, particularly in late stages of a market advance. |
Annual Shareholder Report4
GROWTH OF A $10,000 INVESTMENT - institutional shares1
The Fund's Institutional Shares commenced operations on August 29, 2009. For the period prior to commencement of operations of Institutional Shares, the performance information shown is for the Fund's Class A Shares. The performance of Class A Shares has not been adjusted to reflect the expenses of the Institutional Shares since the Institutional Shares have a lower expense ratio than the expense ratio of the Class A Shares. The performance of Class A Shares has been adjusted to remove any voluntary waiver of Fund expenses related to the Class A Shares that may have occurred during the period prior to commencement of operations of the Institutional Shares. The graph below illustrates the hypothetical investment of $10,0002 in the Federated Clover Value Fund (Institutional Shares) (the “Fund”) from September 30, 2000 to September 30, 2010, compared to the Russell 1000® Value Index (RU1V)3 and the Russell 3000® Value Index (RU3V).3
| Average Annual Total Returns for the Period Ended 9/30/2010 | |
| 1 Year | 4.00% |
| 5 Years | -0.32% |
| 10 Years | 5.84% |
Performance data quoted represents past performance which is no guarantee of future results. Investment return and principal value will fluctuate so that an investor's shares, when redeemed, may be worth more or less than their original cost. Mutual fund performance changes over time and current performance may be lower or higher than what is stated. For current to the most recent month-end performance and after-tax returns, visit FederatedInvestors.com or call 1-800-341-7400. Returns shown do not reflect the deduction of taxes that a shareholder would pay on Fund distributions or the redemption of Fund shares. Mutual funds are not obligations of or guaranteed by any bank and are not federally insured.
Annual Shareholder Report5
| 1 | Federated Clover Value Fund is the successor to Touchstone Value Opportunities Fund, a portfolio of Touchstone Funds Group Trust, pursuant to a reorganization that took place as of the close of business on August 28, 2009. The Fund commenced operations on March 16, 2009, when the Fund became the successor to Clover Capital Multi Value Equity Common Fund, LLC, organized as a Delaware limited liability company only available to accredited investors. The Fund assumed the performance of the predecessor common fund. As a result of the reorganization on August 28, 2009, the Touchstone Value Opportunities Fund became the accounting survivor. Accordingly, the performance information presented above, for the periods prior to August 28, 2009, is historical information for the Class A Shares of the Touchstone Value Opportunities Fund. |
| 2 | Represents a hypothetical investment of $10,000 in the Fund. The Fund's performance assumes the reinvestment of all dividends and distributions. The Russell 1000® Value Index and the Russell 3000® Value Index have been adjusted to reflect reinvestment of dividends on securities in the indexes. |
| 3 | The Russell 1000® Value Index and Russell 3000® Value Index are not adjusted to reflect sales charges, expenses or other fees that the Securities and Exchange Commission (SEC) requires to be reflected in the Fund's performance. The Russell 3000® Value Index measures the performance of those Russell 3000® Index companies with lower price-to-book ratios and lower forecasted growth values. The stocks in this index are also members of either the Russell 1000® Value or the Russell 2000® Value indexes. The indexes are unmanaged, and unlike the Fund, are not affected by cash flows. It is not possible to invest directly in an index. |
Annual Shareholder Report6
Portfolio of Investments Summary Table (unaudited)
At September 30, 2010, the Fund's sector composition1 was as follows:
| Sector Composition | Percentage of
Total Net Assets |
| Financials | 23.8% |
| Energy | 13.1% |
| Health Care | 11.5% |
| Consumer Staples | 9.9% |
| Consumer Discretionary | 9.0% |
| Utilities | 6.6% |
| Industrials | 6.5% |
| Information Technology | 5.5% |
| Telecommunication Services | 3.8% |
| Materials | 3.2% |
| Other Security2 | 3.0% |
| Cash Equivalents3 | 4.7% |
| Other Assets and Liabilities — Net4 | (0.6)% |
| Total | 100.0% |
| 1 | Except for Other Security, Cash Equivalents and Other Assets and Liabilities, sector classifications are based upon, and individual portfolio securities are assigned to, the classifications of the Global Industry Classification Standard (GICS) except that the Adviser assigns a classification to securities not classified by the GICS and to securities for which the Adviser does not have access to the classification made by the GICS. |
| 2 | Other Security includes an Exchange-Traded Fund. |
| 3 | Cash Equivalents include any investments in money market mutual funds and/or overnight repurchase agreements. |
| 4 | Assets, other than investments in securities, less liabilities. See Statement of Assets and Liabilities. |
Annual Shareholder Report7
Portfolio of Investments
September 30, 2010
| Shares | | | Value |
| | COMMON STOCKS – 92.9% | |
| | Consumer Discretionary – 9.0% | |
| 303,200 | | Coach, Inc. | 13,025,472 |
| 199,367 | 1 | DIRECTV Group, Inc., Class A | 8,299,648 |
| 1,048,800 | 1 | Liberty Media Holding Corp. | 14,379,048 |
| 12,707,350 | 1 | Sirius XM Radio, Inc. | 15,248,820 |
| 380,618 | | Time Warner, Inc. | 11,665,942 |
| 357,090 | | Walt Disney Co. | 11,823,250 |
| | TOTAL | 74,442,180 |
| | Consumer Staples – 9.9% | |
| 212,050 | 1 | Energizer Holdings, Inc. | 14,256,121 |
| 355,265 | | H.J. Heinz Co. | 16,828,903 |
| 554,150 | | Kraft Foods, Inc., Class A | 17,101,069 |
| 146,602 | | Lorillard, Inc. | 11,773,607 |
| 190,740 | | Procter & Gamble Co. | 11,438,678 |
| 310,580 | | Walgreen Co. | 10,404,430 |
| | TOTAL | 81,802,808 |
| | Energy – 13.1% | |
| 311,570 | | Chevron Corp. | 25,252,748 |
| 1,462,200 | | El Paso Corp. | 18,102,036 |
| 331,450 | 1 | Forest Oil Corp. | 9,844,065 |
| 398,950 | | National-Oilwell, Inc. | 17,741,306 |
| 328,250 | 1 | Newfield Exploration Co. | 18,854,680 |
| 138,950 | | Schlumberger Ltd. | 8,560,710 |
| 104,600 | 1 | Whiting Petroleum Corp. | 9,990,346 |
| | TOTAL | 108,345,891 |
| | Financials – 23.8% | |
| 1,923,100 | | Bank of America Corp. | 25,211,841 |
| 387,067 | 1 | CIT Group, Inc. | 15,800,075 |
| 5,228,850 | 1 | Citigroup, Inc. | 20,392,515 |
| 325,250 | | Comerica, Inc. | 12,083,037 |
| 658,180 | | JPMorgan Chase & Co. | 25,056,913 |
| 329,850 | | MetLife, Inc. | 12,682,732 |
| 801,050 | | Progressive Corp., OH | 16,717,913 |
| 446,950 | | The Travelers Cos., Inc. | 23,286,095 |
| 1,159,030 | | U.S. Bancorp | 25,058,229 |
| 418,820 | | Wells Fargo & Co. | 10,524,947 |
Annual Shareholder Report8
| Shares | | | Value |
| 481,850 | | XL Group PLC | 10,436,871 |
| | TOTAL | 197,251,168 |
| | Health Care – 11.5% | |
| 470,750 | | Aetna, Inc. | 14,880,408 |
| 289,900 | 1 | Amgen, Inc. | 15,976,389 |
| 446,865 | | Merck & Co., Inc. | 16,449,101 |
| 1,676,195 | | Pfizer, Inc. | 28,780,268 |
| 560,150 | | UnitedHealth Group, Inc. | 19,666,866 |
| | TOTAL | 95,753,032 |
| | Industrials – 6.5% | |
| 825,750 | | General Electric Co. | 13,418,438 |
| 342,500 | | Honeywell International, Inc. | 15,049,450 |
| 256,755 | | Raytheon Co. | 11,736,271 |
| 457,900 | | Republic Services, Inc. | 13,961,371 |
| | TOTAL | 54,165,530 |
| | Information Technology – 5.5% | |
| 319,950 | 1 | BMC Software, Inc. | 12,951,576 |
| 513,005 | 1 | EMC Corp. | 10,419,132 |
| 386,900 | | Microsoft Corp. | 9,475,181 |
| 282,075 | | Qualcomm, Inc. | 12,727,224 |
| | TOTAL | 45,573,113 |
| | Materials – 3.2% | |
| 601,525 | | Du Pont (E.I.) de Nemours & Co. | 26,840,045 |
| | Telecommunication Services – 3.8% | |
| 777,355 | | AT&T, Inc. | 22,232,353 |
| 295,732 | | Verizon Communications, Inc. | 9,637,906 |
| | TOTAL | 31,870,259 |
| | Utilities – 6.6% | |
| 1,066,000 | | CMS Energy Corp. | 19,209,320 |
| 405,950 | | Wisconsin Energy Corp. | 23,463,910 |
| 536,800 | | Xcel Energy, Inc. | 12,330,296 |
| | TOTAL | 55,003,526 |
| | TOTAL COMMON STOCKS
(IDENTIFIED COST $716,624,908) | 771,047,552 |
| | EXCHANGE-TRADED FUND – 3.0% | |
| 422,750 | | iShares Russell 1000 Value Index Fund
(IDENTIFIED COST $24,921,535) | 24,938,022 |
Annual Shareholder Report9
| Shares | | | Value |
| | MUTUAL FUND – 4.7% | |
| 39,423,055 | 2,3 | Federated Prime Value Obligations Fund, Institutional Shares, 0.23%
(AT NET ASSET VALUE) | 39,423,055 |
| | TOTAL INVESTMENTS — 100.6%
(IDENTIFIED COST $780,969,498)4 | 835,408,629 |
| | OTHER ASSETS AND LIABILITIES - NET — (0.6)%5 | (5,299,708) |
| | TOTAL NET ASSETS — 100% | $830,108,921 |
| 1 | Non-income producing security. |
| 2 | Affiliated company. |
| 3 | 7-Day net yield. |
| 4 | The cost of investments for federal tax purposes amounts to $785,539,768. |
| 5 | Assets, other than investments in securities, less liabilities. See Statement of Assets and Liabilities. |
Note: The categories of investments are shown as a percentage of total net assets at September 30, 2010.
Various inputs are used in determining the value of the Fund's investments. These inputs are summarized in the three broad levels listed below:
Level 1 — quoted prices in active markets for identical securities
Level 2 — other significant observable inputs (including quoted prices for similar securities, interest rates, prepayment speeds, credit risk, etc.)
Level 3 — significant unobservable inputs (including the Fund's own assumptions in determining the fair value of investments)
The inputs or methodology used for valuing securities are not an indication of the risk associated with investing in those securities.
As of September 30, 2010, all the investments of the Fund utilized Level 1 inputs in valuing the Fund's assets carried at fair value.
See Notes which are an integral part of the Financial Statements
Annual Shareholder Report10
Statement of Assets and Liabilities
September 30, 2010
| Assets: | | |
| Total investments in securities, at value including $39,423,055 of investments in an affiliated issuer (Note 6) (identified cost $780,969,498) | | $835,408,629 |
| Cash | | 633 |
| Income receivable | | 989,371 |
| Receivable for investments sold | | 13,053,707 |
| Receivable for shares sold | | 675,522 |
| TOTAL ASSETS | | 850,127,862 |
| Liabilities: | | |
| Payable for investments purchased | $17,871,732 | |
| Payable for shares redeemed | 1,425,641 | |
| Payable for distribution services fee (Note 6) | 64,960 | |
| Payable for shareholder services fee (Note 6) | 228,248 | |
| Accrued expenses | 428,360 | |
| TOTAL LIABILITIES | | 20,018,941 |
| Net assets for 63,858,705 shares outstanding | | $830,108,921 |
| Net Assets Consist of: | | |
| Paid-in capital | | $1,330,656,726 |
| Net unrealized appreciation of investments | | 54,439,131 |
| Accumulated net realized loss on investments | | (555,081,782) |
| Undistributed net investment income | | 94,846 |
| TOTAL NET ASSETS | | $830,108,921 |
Annual Shareholder Report11
Statement of Assets and Liabilities — continued| Net Asset Value, Offering Price and Redemption Proceeds Per Share | | |
| Institutional Shares: | | |
| Net asset value per share ($143,281,088 ÷ 11,008,309 shares outstanding), no par value, unlimited shares authorized | | $13.02 |
| Offering price per share | | $13.02 |
| Redemption proceeds per share | | $13.02 |
| Class A Shares: | | |
| Net asset value per share ($575,761,735 ÷ 44,288,065 shares outstanding), no par value, unlimited shares authorized | | $13.00 |
| Offering price per share (100/94.50 of $13.00) | | $13.76 |
| Redemption proceeds per share | | $13.00 |
| Class B Shares: | | |
| Net asset value per share ($57,625,221 ÷ 4,447,073 shares outstanding), no par value, unlimited shares authorized | | $12.96 |
| Offering price per share | | $12.96 |
| Redemption proceeds per share (94.50/100 of $12.96) | | $12.25 |
| Class C Shares: | | |
| Net asset value per share ($38,708,039 ÷ 2,982,640 shares outstanding), no par value, unlimited shares authorized | | $12.98 |
| Offering price per share | | $12.98 |
| Redemption proceeds per share (99.00/100 of $12.98) | | $12.85 |
| Class K Shares: | | |
| Net asset value per share ($14,732,838 ÷ 1,132,618 shares outstanding), no par value, unlimited shares authorized | | $13.01 |
| Offering price per share | | $13.01 |
| Redemption proceeds per share | | $13.01 |
See Notes which are an integral part of the Financial Statements
Annual Shareholder Report12
Statement of Operations
Year Ended September 30, 2010
| Investment Income: | | | |
| Dividends (including $38,924 received from an affiliated issuer (Note 6) and net of foreign taxes withheld of $2,007) | | | $15,460,170 |
| Interest received from securities loaned | | | 938 |
| TOTAL INCOME | | | $15,461,108 |
| Expenses: | | | |
| Investment adviser fee (Note 6) | | $6,386,245 | |
| Administrative personnel and services fee (Note 6) | | 664,056 | |
| Custodian fees | | 39,807 | |
| Transfer and dividend disbursing agent fees and expenses — Institutional Shares | | 174,011 | |
| Transfer and dividend disbursing agent fees and expenses — Class A Shares | | 1,637,694 | |
| Transfer and dividend disbursing agent fees and expenses — Class B Shares | | 274,450 | |
| Transfer and dividend disbursing agent fees and expenses — Class C Shares | | 114,578 | |
| Transfer and dividend disbursing agent fees and expenses — Class K Shares | | 56,467 | |
| Directors'/Trustees' fees | | 3,419 | |
| Auditing fees | | 40,500 | |
| Legal fees | | 6,318 | |
| Portfolio accounting fees | | 163,450 | |
| Distribution services fee — Class B Shares (Note 6) | | 526,348 | |
| Distribution services fee — Class C Shares (Note 6) | | 294,310 | |
| Distribution services fee — Class K Shares (Note 6) | | 68,450 | |
| Shareholder services fee — Class A Shares (Note 6) | | 1,565,506 | |
| Shareholder services fee — Class B Shares (Note 6) | | 175,449 | |
| Shareholder services fee — Class C Shares (Note 6) | | 97,398 | |
| Account administration fee — Class A Shares | | 759 | |
| Account administration fee — Class C Shares | | 681 | |
| Share registration costs | | 82,419 | |
| Printing and postage | | 196,869 | |
| Insurance premiums | | 5,053 | |
| Miscellaneous | | 7,211 | |
| TOTAL EXPENSES | | 12,581,448 | |
Annual Shareholder Report13
Statement of Operations — continued| Waivers, Reimbursements and Reduction: | | | |
| Waiver/reimbursement of investment adviser fee (Note 6) | $(1,077,894) | | |
Waiver of administrative personnel and services
fee (Note 6) | (16,065) | | |
| Reimbursement of transfer and dividend disbursing agent fees and expenses — Class A Shares (Note 6) | (499,156) | | |
| Reimbursement of transfer and dividend disbursing agent fees and expenses — Class B Shares (Note 6) | (161,759) | | |
| Reimbursement of transfer and dividend disbursing agent fees and expenses — Class C Shares (Note 6) | (51,202) | | |
| Fees paid indirectly from directed brokerage arrangements (Note 7) | (32,683) | | |
| TOTAL WAIVERS, REIMBURSEMENTS AND REDUCTION | | $(1,838,759) | |
| Net expenses | | | $10,742,689 |
| Net investment income | | | 4,718,419 |
Realized and Unrealized Gain (Loss)
on Investments: | | | |
| Net realized loss on investments | | | (46,400,966) |
| Net change in unrealized depreciation of investments | | | 70,041,336 |
| Net realized and unrealized gain on investments | | | 23,640,370 |
| Change in net assets resulting from operations | | | $28,358,789 |
See Notes which are an integral part of the Financial Statements
Annual Shareholder Report14
Statement of Changes in Net Assets
| Year Ended September 30 | 2010 | 2009 |
| Increase (Decrease) in Net Assets | | |
| Operations: | | |
| Net investment income | $4,718,419 | $2,627,336 |
| Net realized loss on investments | (46,400,966) | (44,452,076) |
| Net change in unrealized appreciation/depreciation of investments | 70,041,336 | 15,196,239 |
| CHANGE IN NET ASSETS RESULTING FROM OPERATIONS | 28,358,789 | (26,628,501) |
| Distributions to Shareholders: | | |
| Distributions from net investment income | | |
| Institutional Shares | (983,451) | — |
| Class A Shares | (3,693,299) | (2,419,186) |
| Class B Shares | (17,614) | — |
| Class C Shares | (5,952) | (38,355) |
| Class K Shares | (17,516) | — |
| CHANGE IN NET ASSETS RESULTING FROM DISTRIBUTIONS TO SHAREHOLDERS | (4,717,832) | (2,457,541) |
| Share Transactions: | | |
| Proceeds from sale of shares | 255,144,806 | 68,273,280 |
| Exchange of Successor Fund shares in connection with the tax-free reorganization of Touchstone Value Opportunities Fund (Note 2) | — | 12,565,926 |
| Proceeds from shares issued in connection with the tax-free transfer of assets from Federated American Leaders Fund, Inc. (Note 2) | — | 679,733,197 |
| Net asset value of shares issued to shareholders in payment of distributions declared | 4,237,783 | 2,285,810 |
| Cost of shares redeemed | (302,975,211) | (64,567,685) |
| CHANGE IN NET ASSETS RESULTING FROM SHARE TRANSACTIONS | (43,592,622) | 698,290,528 |
| Change in net assets | (19,951,665) | 669,204,486 |
| Net Assets: | | |
| Beginning of period | 850,060,586 | 180,856,100 |
| End of period (including undistributed net investment income of $94,846 and $94,259, respectively) | $830,108,921 | $850,060,586 |
See Notes which are an integral part of the Financial Statements
Annual Shareholder Report15
Notes to Financial Statements
September 30, 2010
1. ORGANIZATION
Federated Equity Funds (the “Trust”) is registered under the Investment Company Act of 1940, as amended (the “Act”), as an open-end management investment company. The Trust consists of 12 diversified portfolios. The financial statements included herein are only those of Federated Clover Value Fund (the “Fund”). The financial statements of the other portfolios are presented separately. The assets of each portfolio are segregated and a shareholder's interest is limited to the portfolio in which shares are held. Each portfolio pays its own expenses. The Fund offers five classes of shares: Institutional Shares, Class A Shares, Class B Shares, Class C Shares and Class K Shares. All shares of the Fund have equal rights with respect to voting, except on class-specific matters. The financial highlights of the Class A Shares, Class B Shares, Class C Shares and Class K Shares are presented separately. The investment objective of the Fund is to seek capital appreciation.
2. reorganization
The Fund is the successor (Successor Fund) to Touchstone Value Opportunities Fund (the “Predecessor Fund”), a portfolio of Touchstone Funds Group Trust, pursuant to a reorganization that took place as of the close of business on August 28, 2009. On that date, Class A Shares, Class C Shares and Class Z Shares of the Predecessor Fund were exchanged for Class A Shares, Class C Shares and Class A Shares of the Fund, respectively. As a result of the reorganization on August 28, 2009, the Predecessor Fund became the accounting survivor. Accordingly, the performance information presented in the financial statements for the periods prior to August 28, 2009, is historical information of the Predecessor Fund.
On August 28, 2009, the Fund received a tax-free transfer of assets from Touchstone Value Opportunities Fund, as follows:
Shares of the
Fund Issued | Touchstone Value
Opportunities
Fund Net
Assets Received | Unrealized
Appreciation1 | Net Assets
of the Fund
Immediately
Prior to
Combination | Net Assets
of the Fund
Immediately
After
Combination |
| 13,258,411 | $162,851,244 | $2,221,563 | $12,565,926 | $175,417,170 |
| 1 | Unrealized appreciation is included in the Touchstone Value Opportunities Fund Net Assets Received amount shown above. |
On the date of the reorganization, the Successor Fund's net assets included $2,119,296 of net unrealized appreciation.
Annual Shareholder Report16
On September 18, 2009, the Fund received a tax-free transfer of assets from Federated American Leaders Fund, Inc., as follows:Shares of the
Fund Issued | Federated
American Leaders
Fund, Inc. Net
Assets Received | Unrealized
Depreciation1 | Net Assets
of the Fund
Immediately
Prior to
Combination | Net Assets
of the Fund
Immediately
After
Combination |
| 52,783,178 | $679,733,197 | $(16,944,166) | $193,844,924 | $873,578,121 |
| 1 | Unrealized depreciation is included in the Federated American Leaders Fund, Inc. Net Assets Received amount shown above. |
3. SIGNIFICANT ACCOUNTING POLICIES
The following is a summary of significant accounting policies consistently followed by the Fund in the preparation of its financial statements. These policies are in conformity with U.S. generally accepted accounting principles (GAAP).
Investment Valuation
In calculating its net asset value (NAV), the Fund generally values investments as follows:
- Equity securities listed on an exchange or traded through a regulated market system are valued at their last reported sale price or official closing price in their principal exchange or market.
- Fixed-income securities acquired with remaining maturities greater than 60 days are fair valued using price evaluations provided by a pricing service approved by the Board of Trustees (the “Trustees”).
- Fixed-income securities acquired with remaining maturities of 60 days or less are valued at their cost (adjusted for the accretion of any discount or amortization of any premium).
- Shares of other mutual funds are valued based upon their reported NAVs.
- Derivative contracts listed on exchanges are valued at their reported settlement or closing price.
- Over-the-counter (OTC) derivative contracts are fair valued using price evaluations provided by a pricing service approved by the Trustees.
If the Fund cannot obtain a price or price evaluation from a pricing service for an investment, the Fund may attempt to value the investment based upon the mean of bid and asked quotations or fair value the investment based on price evaluations, from one or more dealers. If any price, quotation, price evaluation or other pricing source is not readily available when the NAV is calculated, the Fund uses the fair value of the investment determined in accordance with the procedures described below. There can be no assurance that the Fund could purchase or sell an investment at the price used to calculate the Fund's NAV.
Fair Valuation and Significant Events Procedures
The Trustees have authorized the use of pricing services to provide evaluations of the current fair value of certain investments for purposes of calculating the NAV. Factors considered by pricing services in evaluating an investment include the yields or prices of investments of comparable quality, coupon, maturity, call rights and other potential prepayments, terms and type, reported transactions, indications as to values from dealers and general market conditions. Some pricing services provide a single price evaluation reflecting the bid-side of the market for an investment (a “bid” evaluation). Other pricing services offer both bid evaluations and price evaluations indicative of a price between the prices bid and asked for the investment (a “mid” evaluation). The Fund normally uses bid evaluations for U.S. Treasury Annual Shareholder Report17
and Agency securities, mortgage-backed securities and municipal securities. The Fund normally uses mid evaluations for other types of fixed-income securities and OTC derivative contracts. In the event that market quotations and price evaluations are not available for an investment, the fair value of the investment is determined in accordance with procedures adopted by the Trustees.The Trustees also have adopted procedures requiring an investment to be priced at its fair value whenever the Adviser determines that a significant event affecting the value of the investment has occurred between the time as of which the price of the investment would otherwise be determined and the time as of which the NAV is computed. An event is considered significant if there is both an affirmative expectation that the investment's value will change in response to the event and a reasonable basis for quantifying the resulting change in value. Examples of significant events that may occur after the close of the principal market on which a security is traded, or after the time of a price evaluation provided by a pricing service or a dealer, include:
- With respect to securities traded in foreign markets, significant trends in U.S. equity markets or in the trading of foreign securities index futures or options contracts;
- With respect to price evaluations of fixed-income securities determined before the close of regular trading on the NYSE, actions by the Federal Reserve Open Market Committee and other significant trends in U.S. fixed-income markets;
- Political or other developments affecting the economy or markets in which an issuer conducts its operations or its securities are traded; and
- Announcements concerning matters such as acquisitions, recapitalizations, litigation developments, a natural disaster affecting the issuer's operations or regulatory changes or market developments affecting the issuer's industry.
The Trustees have approved the use of a pricing service to determine the fair value of equity securities traded principally in foreign markets when the Adviser determines that there has been a significant trend in the U.S. equity markets or in index futures trading. For other significant events, the Fund may seek to obtain more current quotations or price evaluations from alternative pricing sources. If a reliable alternative pricing source is not available, the Fund will determine the fair value of the investment using another method approved by the Trustees.
Investment Income, Gains and Losses, Expenses and Distributions
Investment transactions are accounted for on a trade-date basis. Realized gains and losses from investment transactions are recorded on an identified-cost basis. Interest income and expenses are accrued daily. Dividend income and distributions to shareholders are recorded on the ex-dividend date. Foreign dividends are recorded on the ex-dividend date or when the Fund is informed of the ex-dividend date. Distributions of net investment income are declared and paid quarterly. Non-cash dividends included in dividend income, if any, are recorded at fair value. Investment income, realized and unrealized gains and losses and certain fund-level expenses are allocated to each class based on relative average daily net assets, except that Institutional Shares, Class A Shares, Class B Shares, Class C Shares and Class K Shares may bear distribution services fees, shareholder services fees, account administration fees and certain transfer and dividend disbursing agent fees unique to those classes. Dividends are declared separately for each class. No class has preferential dividend rights; differences in per share dividend rates are generally due to differences in separate class expenses.
Annual Shareholder Report18
Premium and Discount AmortizationAll premiums and discounts on fixed-income securities are amortized/accreted for financial statement purposes.
Federal Taxes
It is the Fund's policy to comply with the Subchapter M provision of the Internal Revenue Code (the “Code”) and to distribute to shareholders each year substantially all of its income. Accordingly, no provision for federal income tax is necessary. As of and during the year ended September 30, 2010, the Fund did not have a liability for any uncertain tax positions. The Fund recognizes interest and penalties, if any, related to tax liabilities as income tax expense in the Statement of Operations. As of September 30, 2010, tax years 2009 and 2010 remain subject to examination by the Fund's major tax jurisdictions, which include the United States of America and the Commonwealth of Massachusetts.
The Fund may be subject to taxes imposed by governments of countries in which it invests. Such taxes are generally based on either income or gains earned or repatriated. The Fund accrues and applies such taxes to net investment income, net realized gains and net unrealized gains as income and/or gains are earned.
When-Issued and Delayed Delivery Transactions
The Fund may engage in when-issued or delayed delivery transactions. The Fund records when-issued securities on the trade date and maintains security positions such that sufficient liquid assets will be available to make payment for the securities purchased. Securities purchased on a when-issued or delayed delivery basis are marked to market daily and begin earning interest on the settlement date. Losses may occur on these transactions due to changes in market conditions or the failure of counterparties to perform under the contract.
Securities Lending
The Fund participates in a securities lending program providing for the lending of equity securities to qualified brokers. The Fund normally receives cash collateral for securities loaned that is invested in an affiliated money market fund or short-term securities including repurchase agreements. Collateral is maintained at a minimum level of 100% of the market value of investments loaned, plus interest, if applicable. In accordance with the Fund's securities lending agreement, the market value of securities on loan is determined each day at the close of business and any additional collateral required to cover the value of securities on loan is delivered to the Fund on the next business day. Earnings on collateral are allocated between the securities lending agent, as a fee for its services under the program, and the Fund, according to agreed-upon rates.
As of September 30, 2010, the Fund had no outstanding securities on loan.
Other
The preparation of financial statements in conformity with GAAP requires management to make estimates and assumptions that affect the amounts of assets, liabilities, expenses and revenues reported in the financial statements. Actual results could differ from those estimated.
Annual Shareholder Report19
4. SHARES OF BENEFICIAL INTERESTThe following tables summarize share activity:
| Year Ended
9/30/2010 | Period Ended
9/30/20091 |
| Institutional Shares: | Shares | Amount | Shares | Amount |
| Shares sold | 10,819,322 | $140,803,781 | 46,315 | $574,933 |
| Exchange of Successor Fund shares in connection with the tax-free reorganization of Touchstone Value Opportunities Fund | — | — | 908,665 | 11,171,864 |
| Shares issued to shareholders in payment of distributions declared | 68,883 | 890,995 | — | — |
| Shares redeemed | (832,524) | (10,844,272) | (2,352) | (28,168) |
| NET CHANGE RESULTING FROM INSTITUTIONAL SHARE TRANSACTIONS | 10,055,681 | $130,850,504 | 952,628 | $11,718,629 |
| Year Ended September 30 | 2010 | 2009 |
| Class A Shares: | Shares | Amount | Shares | Amount |
| Shares sold | 6,582,264 | $86,409,757 | 1,754,894 | $19,558,947 |
| Transfer in Class Z Shares2 | — | — | 12,596,617 | 182,078,468 |
| Exchange of Successor Fund shares in connection with the tax-free reorganization of Touchstone Value Opportunities Fund | — | — | 76,192 | 935,852 |
| Proceeds from shares issued in connection with the tax-free transfer of assets from Federated American Leaders Fund, Inc. | — | — | 42,830,686 | 551,659,234 |
| Shares issued to shareholders in payment of distributions declared | 254,581 | 3,307,126 | 16,760 | 179,185 |
| Adjustment of Predecessor Fund shares in connection with tax-free reorganization | — | — | (637,282) | — |
| Shares redeemed | (18,640,211) | (241,209,936) | (1,157,857) | (13,324,756) |
| NET CHANGE RESULTING FROM CLASS A SHARE TRANSACTIONS | (11,803,366) | $(151,493,053) | 55,480,010 | $741,086,930 |
Annual Shareholder Report20
| Year Ended
9/30/2010 | Period Ended
9/30/20091 |
| Class B Shares: | Shares | Amount | Shares | Amount |
| Shares sold | 689,586 | $9,058,000 | 112,935 | $1,393,248 |
| Exchange of Successor Fund shares in connection with the tax-free reorganization of Touchstone Value Opportunities Fund | — | — | 34,767 | 426,380 |
| Proceeds from shares issued in connection with the tax-free transfer of assets from Federated American Leaders Fund, Inc. | — | — | 6,195,909 | 79,679,394 |
| Shares issued to shareholders in payment of distributions declared | 1,283 | 16,924 | — | — |
| Shares redeemed | (2,532,334) | (32,653,736) | (55,073) | (694,836) |
| NET CHANGE RESULTING FROM CLASS B SHARE TRANSACTIONS | (1,841,465) | $(23,578,812) | 6,288,538 | $80,804,186 |
| Year Ended September 30 | 2010 | 2009 |
| Class C Shares: | Shares | Amount | Shares | Amount |
| Shares sold | 925,628 | $12,221,565 | 271,399 | $2,870,136 |
| Exchange of Successor Fund shares in connection with the tax-free reorganization of Touchstone Value Opportunities Fund | — | — | 2,358 | 28,964 |
| Proceeds from shares issued in connection with the tax-free transfer of assets from Federated American Leaders Fund, Inc. | — | — | 2,778,973 | 35,793,174 |
| Shares issued to shareholders in payment of distributions declared | 397 | 5,247 | 3,374 | 36,153 |
| Adjustment of Predecessor Fund shares in connection with tax-free reorganization | — | — | (16,484) | — |
| Shares redeemed | (1,037,233) | (13,476,171) | (233,730) | (2,456,544) |
| NET CHANGE RESULTING FROM CLASS C SHARE TRANSACTIONS | (111,208) | $(1,249,359) | 2,805,890 | $36,271,883 |
Annual Shareholder Report21
| Year Ended
9/30/2010 | Period Ended
9/30/20091 |
| Class K Shares: | Shares | Amount | Shares | Amount |
| Shares sold | 511,901 | $6,651,703 | 16,424 | $207,777 |
| Exchange of Successor Fund shares in connection with the tax-free reorganization of Touchstone Value Opportunities Fund | — | — | 233 | 2,866 |
| Proceeds from shares issued in connection with the tax-free transfer of assets from Federated American Leaders Fund, Inc. | — | — | 977,610 | 12,601,395 |
| Shares issued to shareholders in payment of distributions declared | 1,328 | 17,491 | — | — |
| Shares redeemed | (368,180) | (4,791,096) | (6,698) | (84,963) |
| NET CHANGE RESULTING FROM CLASS K SHARE TRANSACTIONS | 145,049 | $1,878,098 | 987,569 | $12,727,075 |
| Year Ended September 30 | 2010 | 2009 |
| Class Z Shares2 | Shares | Amount | Shares | Amount |
| Shares sold | — | $ — | 4,420,419 | $43,668,239 |
| Shares issued to shareholders in payment of distributions declared | — | — | 200,218 | 2,070,472 |
| Shares redeemed | — | — | (4,574,307) | (47,978,418) |
| NET CHANGE RESULTING FROM CLASS Z SHARE TRANSACTIONS | — | $ — | 46,330 | $(2,239,707) |
| FINAL REDEMPTION FROM CLASS Z SHARES2 | — | $ — | (12,596,617) | $(182,078,468) |
| NET CHANGE RESULTING FROM TOTAL FUND SHARE TRANSACTIONS | (3,555,309) | $(43,592,622) | 53,964,348 | $698,290,528 |
| 1 | Reflects operations for the period from August 29, 2009 (deemed the date of initial investment, pursuant to a reorganization that took place on August 28, 2009) to September 30, 2009. |
| 2 | At the close of business on August 28, 2009, Class Z Shares were reorganized into Class A Shares. |
5. FEDERAL TAX INFORMATION
The tax character of distributions as reported on the Statement of Changes in Net Assets for the years ended September 30, 2010 and 2009, was as follows:
| 2010 | 2009 |
| Ordinary income | $4,717,832 | $2,457,541 |
Annual Shareholder Report22
As of September 30, 2010, the components of distributable earnings on a tax basis were as follows:| Undistributed ordinary income | $94,846 |
| Net unrealized appreciation | $49,868,861 |
| Capital loss carryforwards and deferrals | $(550,511,512) |
The difference between book-basis and tax-basis net unrealized appreciation/depreciation is attributable to differing treatments for the deferral of losses on wash sales.
At September 30, 2010, the cost of investments for federal tax purposes was $785,539,768. The net unrealized appreciation of investments for federal tax purposes was $49,868,861. This consists of net unrealized appreciation from investments for those securities having an excess of value over cost of $71,321,483 and net unrealized depreciation from investments for those securities having an excess of cost over value of $21,452,622.
At September 30, 2010, the Fund had a capital loss carryforward of $511,037,861 which will reduce the Fund's taxable income arising from future net realized gains on investments, if any, to the extent permitted by the Code and thus will reduce the amount of distributions to shareholders which would otherwise be necessary to relieve the Fund of any liability for federal income tax. Pursuant to the Code, such capital loss carryforward will expire as follows:
| Expiration Year | Expiration Amount |
| 2015 | $342,110,357 |
| 2016 | $125,794,854 |
| 2017 | $30,314,241 |
| 2018 | $12,818,409 |
As a result of the tax-free transfer of assets from Touchstone Value Opportunities Fund and Federated American Leaders Fund, Inc., the use of certain capital loss carryforwards listed above may be limited.
Under current tax regulations, capital losses on securities transactions realized after October 31 may be deferred and treated as occurring on the first day of the following fiscal year. As of September 30, 2010, for federal income tax purposes, post October losses of $39,473,651 were deferred to October 1, 2010.
6. INVESTMENT ADVISER FEE AND OTHER TRANSACTIONS WITH AFFILIATES
Investment Adviser Fee
Federated Global Investment Management Corporation is the Fund's investment adviser (the “Adviser”). The advisory agreement between the Fund and the Adviser provides for an annual fee equal to 0.75% of the Fund's average daily net assets. Subject to the terms described in the Expense Limitation note, the Adviser may voluntarily choose to waive any portion of its fee. For the year ended September 30, 2010, the Adviser voluntarily waived $1,057,120 of its fee. In addition, for the year ended September 30, 2010, an affiliate of the Adviser reimbursed $712,117 of transfer and dividend disbursing agent fees and expenses.
Prior to close of business on August 28, 2009, the Predecessor Fund's investment adviser was Touchstone Advisors, Inc. After the close of business on August 28, 2009, the Predecessor Fund was reorganized into the Fund. The annual investment adviser fee did not change due to this reorganization.
Annual Shareholder Report23
Administrative FeeFederated Administrative Services (FAS), under the Administrative Services Agreement, provides the Fund with administrative personnel and services. The fee paid to FAS is based on the average aggregate daily net assets of certain Federated funds as specified below:
| Administrative Fee | Average Aggregate Daily Net Assets
of the Federated Funds |
| 0.150% | on the first $5 billion |
| 0.125% | on the next $5 billion |
| 0.100% | on the next $10 billion |
| 0.075% | on assets in excess of $20 billion |
The administrative fee received during any fiscal year shall be at least $150,000 per portfolio and $40,000 per each additional class of Shares. Subject to the terms described in the Expense Limitation note, FAS may voluntarily choose to waive any portion of its fee. For the year ended September 30, 2010, the net fee paid to FAS was 0.076% of average daily net assets of the Fund. FAS waived $16,065 of its fee.
Prior to close of business on August 28, 2009, Touchstone Advisors, Inc. provided administrative services to the Predecessor Fund.
Distribution Services Fee
The Fund has adopted a Distribution Plan (the “Plan”) pursuant to Rule 12b-1 under the Act. Under the terms of the Plan, the Fund will compensate Federated Securities Corp. (FSC), the principal distributor, from the daily net assets of the Fund's Class A Shares, Class B Shares, Class C Shares and Class K Shares to finance activities intended to result in the sale of these shares. The Plan provides that the Fund may incur distribution expenses at the following percentages of average daily net assets annually, to compensate FSC:
| Share Class Name | Percentage of Average Daily
Net Assets of Class |
| Class A Shares | 0.05% |
| Class B Shares | 0.75% |
| Class C Shares | 0.75% |
| Class K Shares | 0.50% |
Subject to the terms described in the Expense Limitation note, FSC may voluntarily choose to waive any portion of its fee. When FSC receives fees, it may pay some or all of them to financial intermediaries whose customers purchase shares. For the year ended September 30, 2010, FSC retained $33,091 of fees paid by the Fund. For the year ended September 30, 2010, the Fund's Class A Shares did not incur a distribution services fee; however, it may begin to incur this fee upon approval of the Trustees.
Prior to close of business on August 28, 2009, Touchstone Securities, Inc., was the principal distributor for the Predecessor Fund.
Annual Shareholder Report24
Sales ChargesFront-end sales charges and contingent deferred sales charges (CDSC) do not represent expenses of the Fund. They are deducted from the proceeds of sales of Fund shares prior to investment or from redemption proceeds prior to remittance, as applicable. For the year ended September 30, 2010, FSC retained $85,399 in sales charges from the sale of Class A Shares. FSC also retained $256 of CDSC relating to redemptions of Class A Shares and $807 relating to redemptions of Class C Shares.
Shareholder Services Fee
The Fund may pay fees (“Service Fees”) up to 0.25% of the average daily net assets of the Fund's Class A Shares, Class B Shares and Class C Shares to financial intermediaries or to Federated Shareholder Services Company (FSSC) for providing services to shareholders and maintaining shareholder accounts. Subject to the terms described in the Expense Limitation note, FSSC may voluntarily reimburse the Fund for Service Fees. For the year ended September 30, 2010, FSSC did not receive any fees paid by the Fund.
Prior to close of business on August 28, 2009, Touchstone Securities, Inc., received Service Fees from the Predecessor Fund.
Expense Limitation
Effective November 30, 2010, the Adviser and its affiliates (which may include FSC, FAS and FSSC) have voluntarily agreed to waive their fees and/or reimburse expenses so that the total annual fund operating expenses (as shown in the financial highlights) paid by the Fund's Institutional Shares, Class A Shares, Class B Shares, Class C Shares and Class K Shares (after the voluntary waivers and reimbursements) will not exceed 0.94%, 1.19%, 1.92%, 1.92% and 1.42% (the “Fee Limit”), respectively, through the later of (the “Termination Date”): (a) November 30, 2011; or (b) the date of the Fund's next effective Prospectus. While the Adviser and its affiliates currently do not anticipate terminating or increasing these arrangements prior to the Termination Date, these arrangements may only be terminated or the Fee Limit increased prior to the Termination Date with the agreement of the Trustees.
Interfund Transactions
During the year ended September 30, 2010, the Fund engaged in purchase and sale transactions with funds that have a common investment adviser (or affiliated investment advisers), common Directors/Trustees and/or common Officers. These purchase and sale transactions complied with Rule 17a-7 under the Act and amounted to $704,093 and $6,172,322, respectively.
General
Certain Officers and Trustees of the Fund are Officers and Directors or Trustees of the above companies.
Annual Shareholder Report25
Transactions with Affiliated CompaniesAffiliated holdings are mutual funds which are managed by the Adviser or an affiliate of the Adviser. The Adviser has agreed to reimburse the Fund for certain investment adviser fees as a result of transactions in other affiliated mutual funds. For the year ended September 30, 2010, the Adviser reimbursed $20,774. Transactions with the affiliated company during the year ended September 30, 2010, were as follows:
| Affiliate | Balance of
Shares Held
9/30/2009 | Purchases/
Additions | Sales/
Reductions | Balance of
Shares Held
9/30/2010 | Value | Dividend
Income |
| Federated Prime Value Obligations Fund, Institutional Shares | 5,264,453 | 314,363,867 | 280,205,265 | 39,423,055 | $39,423,055 | $38,924 |
7. EXPENSE Reduction
The Fund directs portfolio trades to a broker that in turn pays a portion of the Fund's operating expenses. For the year ended September 30, 2010, the Fund's expenses were reduced by $32,683 under these arrangements.
8. Investment TRANSACTIONS
Purchases and sales of investments, excluding long-term U.S. government securities and short-term obligations, for the year ended September 30, 2010, were as follows:
| Purchases | $622,472,880 |
| Sales | $693,501,343 |
9. LINE OF CREDIT
The Fund participates in a $100,000,000 unsecured, uncommitted revolving line of credit (LOC) agreement with PNC Bank. The LOC was made available for extraordinary or emergency purposes, primarily for financing redemption payments. Borrowings are charged interest at a rate offered to the Fund by PNC Bank at the time of the borrowing. As of September 30, 2010, there were no outstanding loans. During the year ended September 30, 2010, the Fund did not utilize the LOC.
10. INTERFUND LENDING
Pursuant to an Exemptive Order issued by the Securities and Exchange Commission, the Fund, along with other funds advised by subsidiaries of Federated Investors, Inc., may participate in an interfund lending program. This program provides an alternative credit facility allowing the Fund to borrow from other participating affiliated funds. As of September 30, 2010, there were no outstanding loans. During the year ended September 30, 2010, the program was not utilized.
11. Legal Proceedings
Since February, 2004, Federated Investors, Inc. and related entities (collectively, “Federated”), have been named as defendants in several lawsuits that are now pending in the United States District Court for the Western District of Pennsylvania. These lawsuits have been consolidated into a single action alleging excessive advisory fees involving one of the Federated-sponsored mutual funds (“Federated Funds”). Federated and its counsel have been defending this litigation. Additional lawsuits based upon similar allegations may be filed in the future. The Annual Shareholder Report26
potential impact of these lawsuits, all of which seek monetary damages, attorneys' fees and expenses, and future potential similar suits is uncertain. Although we do not believe that these lawsuits will have a material adverse effect on the Federated Funds, there can be no assurance that these suits, ongoing adverse publicity and/or other developments resulting from the allegations in these matters will not result in increased redemptions, or reduced sales, of shares of the Federated Funds or other adverse consequences for the Federated Funds.12. Subsequent events
Effective December 31, 2010, Class K Shares will be redesignated as Class R Shares.
Management has evaluated subsequent events through the date the financial statements were issued, and determined that no additional events have occurred that require disclosure.
13. FEDERAL TAX INFORMATION (UNAUDITED)
For the fiscal year ended September 30, 2010, 100.0% of total income distributions made by the Fund are qualifying dividends which may be subject to a maximum tax rate of 15%, as provided for by the Jobs and Growth Tax Relief Act of 2003. Complete information is reported in conjunction with the reporting of your distributions on Form 1099-DIV.
Of the ordinary income distributions made by the Fund during the year ended September 30, 2010, 100.0% qualify for the dividend received deduction available to corporate shareholders.
Annual Shareholder Report27
Report of Independent Registered Public Accounting Firm
TO THE BOARD OF TRUSTEES OF THE FEDERATED EQUITY FUNDS AND SHAREHOLDERS OF Federated clover value fund:
We have audited the accompanying statement of assets and liabilities, including the portfolio of investments, of the Federated Clover Value Fund (the “Fund”), a portfolio of Federated Equity Funds, as of September 30, 2010, and the related statement of operations for the year then ended, the statements of changes in net assets for each of the years or periods in the two-year period then ended and the financial highlights for each of the years or periods in the two-year period then ended. These financial statements and financial highlights are the responsibility of the Fund's management. Our responsibility is to express an opinion on these financial statements and financial highlights based on our audits. The financial highlights for the periods presented prior to October 1, 2008, were audited by other independent registered public accountants whose report thereon dated November 25, 2008, expressed an unqualified opinion on those statements.
We conducted our audits in accordance with the standards of the Public Company Accounting Oversight Board (United States). Those standards require that we plan and perform the audit to obtain reasonable assurance about whether the financial statements and financial highlights are free of material misstatement. An audit includes examining, on a test basis, evidence supporting the amounts and disclosures in the financial statements. Our procedures included confirmation of securities owned as of September 30, 2010, by correspondence with the custodian and brokers. An audit also includes assessing the accounting principles used and significant estimates made by management, as well as evaluating the overall financial statement presentation. We believe that our audits provide a reasonable basis for our opinion.
In our opinion, the financial statements and financial highlights referred to above present fairly, in all material respects, the financial position of the Federated Clover Value Fund as of September 30, 2010, and the results of its operations for the year then ended, the changes in its net assets for each of the years or periods in the two-year period then ended and the financial highlights for each of the years or periods in the two-year period then ended, in conformity with U.S. generally accepted accounting principles.
Boston, Massachusetts
November 22, 2010
Annual Shareholder Report28
Board of Trustees and Trust Officers
The Board of Trustees is responsible for managing the Trust's business affairs and for exercising all the Trust's powers except those reserved for the shareholders. The following tables give information about each Trustee and the senior officers of the Fund. Where required, the tables separately list Trustees who are “interested persons” of the Fund (i.e., “Interested” Trustees) and those who are not (i.e., “Independent” Trustees). Unless otherwise noted, the address of each person listed is Federated Investors Tower, 1001 Liberty Avenue, Pittsburgh, PA 15222. The address of all Independent Trustees listed is 4000 Ericsson Drive, Warrendale, PA 15086-7561; Attention: Mutual Fund Board. As of December 31, 2009, the Trust comprised 13 portfolio(s), and the Federated Fund Family consisted of 43 investment companies (comprising 145 portfolios). Unless otherwise noted, each Officer is elected annually. Unless otherwise noted, each Trustee oversees all portfolios in the Federated Fund Family and serves for an indefinite term. The Fund's Statement of Additional Information includes additional information about Trust Trustees and is available, without charge and upon request, by calling 1-800-341-7400.
Interested TRUSTEES Background
Name
Birth Date
Positions Held with Trust
Date Service Began | Principal Occupation(s) for Past Five Years,
Other Directorships Held and Previous Position(s) |
John F. Donahue*
Birth Date: July 28, 1924
Trustee
Began serving: April 1984 | Principal Occupations: Director or Trustee of the Federated Fund Family; Chairman and Director, Federated Investors, Inc.; Chairman of the Federated Fund Family's Executive Committee.
Previous Positions: Chairman of the Federated Fund Family; Trustee, Federated Investment Management Company; Chairman and Director, Federated Investment Counseling. |
J. Christopher Donahue*
Birth Date: April 11, 1949
PRESIDENT AND Trustee
Began serving: January 2000 | Principal Occupations: Principal Executive Officer and President of the Federated Fund Family; Director or Trustee of some of the Funds in the Federated Fund Family; President, Chief Executive Officer and Director, Federated Investors, Inc.; Chairman and Trustee, Federated Investment Management Company; Trustee, Federated Investment Counseling; Chairman and Director, Federated Global Investment Management Corp.; Chairman, Federated Equity Management Company of Pennsylvania and Passport Research, Ltd. (investment advisory subsidiary of Federated); Trustee, Federated Shareholder Services Company; Director, Federated Services Company.
Previous Positions: President, Federated Investment Counseling; President and Chief Executive Officer, Federated Investment Management Company, Federated Global Investment Management Corp. and Passport Research, Ltd. |
| * | Family relationships and reasons for “interested” status: John F. Donahue is the father of J. Christopher Donahue; both are “interested” due to their beneficial ownership of shares of Federated Investors, Inc. and the positions they hold with Federated and its subsidiaries. |
Annual Shareholder Report29
INDEPENDENT TRUSTEES Background
Name
Birth Date
Positions Held with Trust
Date Service Began | Principal Occupation(s) for Past Five Years,
Other Directorships Held, Previous Position(s) and Qualifications |
John T. Conroy, Jr., Ph.D.
Birth Date: June 23, 1937
Trustee
Began serving: November 1991 | Principal Occupations: Director or Trustee of the Federated Fund Family; Chairman of the Board, Investment Properties Corporation; Partner or Trustee in private real estate ventures in Southwest Florida; Assistant Professor in Theology, Blessed Edmund Rice School for Pastoral Ministry.
Previous Positions: President, Investment Properties Corporation; Senior Vice President, John R. Wood and Associates, Inc., Realtors; President, Naples Property Management, Inc. and Northgate Village Development Corporation.
Qualifications: Business management and director experience. |
Nicholas P. Constantakis, CPA
Birth Date: September 3, 1939
Trustee
Began serving: February 1998 | Principal Occupation: Director or Trustee of the Federated Fund Family.
Other Directorship Held: Director and Chairman of the Audit Committee, Michael Baker Corporation (architecture, engineering and construction services).
Previous Position: Partner, Andersen Worldwide SC.
Qualifications: Public accounting and director experience. |
John F. Cunningham
Birth Date: March 5, 1943
Trustee
Began serving: January 1999 | Principal Occupation: Director or Trustee of the Federated Fund Family.
Other Directorships Held: Chairman, President and Chief Executive Officer, Cunningham & Co., Inc. (strategic business consulting); Trustee Associate, Boston College.
Previous Positions: Director, Redgate Communications and EMC Corporation (computer storage systems); Chairman of the Board and Chief Executive Officer, Computer Consoles, Inc.; President and Chief Operating Officer, Wang Laboratories; Director, First National Bank of Boston; Director, Apollo Computer, Inc.
Qualifications: Business management and director experience. |
Maureen Lally-Green
Birth Date: July 5, 1949
Trustee
Began serving: August 2009 | Principal Occupations: Director or Trustee of the Federated Fund Family; Director, Office of Church Relations, Diocese of Pittsburgh; Adjunct Professor of Law, Duquesne University School of Law.
Other Directorships Held: Trustee, St. Francis University; Director, Ireland Institute of Pittsburgh; Director, UPMC Mercy Hospital; Regent, St. Vincent Seminary; Director, Epilepsy Foundation of Western and Central Pennsylvania; Director, Saint Thomas More Society, Allegheny County; Director, Carlow University.
Previous Position: Pennsylvania Superior Court Judge.
Qualifications: Legal and director experience. |
Annual Shareholder Report30
Name
Birth Date
Positions Held with Trust
Date Service Began | Principal Occupation(s) for Past Five Years,
Other Directorships Held, Previous Position(s) and Qualifications |
Peter E. Madden
Birth Date: March 16, 1942
Trustee
Began serving: November 1991 | Principal Occupation: Director or Trustee, and Chairman of the Board of Directors or Trustees, of the Federated Fund Family.
Other Directorship Held: Board of Overseers, Babson College.
Previous Positions: Representative, Commonwealth of Massachusetts General Court; President, Chief Operating Officer and Director, State Street Bank and Trust Company and State Street Corporation (retired); Director, VISA USA and VISA International; Chairman and Director, Massachusetts Bankers Association; Director, Depository Trust Corporation; Director, The Boston Stock Exchange.
Qualifications: Business management, mutual fund services and director experience. |
Charles F. Mansfield, Jr.
Birth Date: April 10, 1945
Trustee
Began serving: January 1999 | Principal Occupations: Director or Trustee and Chairman of the Audit Committee of the Federated Fund Family; Management Consultant.
Previous Positions: Chief Executive Officer, PBTC International Bank; Partner, Arthur Young & Company (now Ernst & Young LLP); Chief Financial Officer of Retail Banking Sector, Chase Manhattan Bank; Senior Vice President, HSBC Bank USA (formerly, Marine Midland Bank); Vice President, Citibank; Assistant Professor of Banking and Finance, Frank G. Zarb School of Business, Hofstra University; Executive Vice President, DVC Group, Inc. (marketing, communications and technology).
Qualifications: Banking, business management, public accounting and director experience. |
R. James Nicholson
Birth Date: February 4, 1938
Trustee
Began serving: January 2008 | Principal Occupations: Director or Trustee of the Federated Fund Family; Senior Counsel, Brownstein Hyatt Farber Schrek, P.C.; Former Secretary of the U.S. Dept. of Veterans Affairs; Former U.S. Ambassador to the Holy See; Former Chairman of the Republican National Committee.
Other Directorships Held: Director, Horatio Alger Association; Director, The Daniels Fund.
Previous Positions: Colonel, U.S. Army Reserve; Partner, Calkins, Kramer, Grimshaw and Harring, P.C.; General Counsel, Colorado Association of Housing and Building; Chairman and CEO, Nicholson Enterprises, Inc. (real estate holding company); Chairman and CEO, Renaissance Homes of Colorado.
Qualifications: Legal, government, business management and mutual fund director experience. |
Annual Shareholder Report31
Name
Birth Date
Positions Held with Trust
Date Service Began | Principal Occupation(s) for Past Five Years,
Other Directorships Held, Previous Position(s) and Qualifications |
Thomas M. O'Neill
Birth Date: June 14, 1951
Trustee
Began serving: October 2006 | Principal Occupations: Director or Trustee of the Federated Fund Family; Sole Proprietor, Navigator Management Company (investment and strategic consulting).
Other Directorships Held: Board of Overseers, Children's Hospital of Boston; Visiting Committee on Athletics, Harvard College.
Previous Positions: Chief Executive Officer and President, Managing Director and Chief Investment Officer, Fleet Investment Advisors; President and Chief Executive Officer, Aeltus Investment Management, Inc.; General Partner, Hellman, Jordan Management Co., Boston, MA; Chief Investment Officer, The Putnam Companies, Boston, MA; Credit Analyst and Lending Officer, Fleet Bank; Director and Consultant, EZE Castle Software (investment order management software); Director, Midway Pacific (lumber).
Qualifications: Business management, mutual fund, director and investment experience. |
John S. Walsh
Birth Date: November 28, 1957
Trustee
Began serving: January 1999 | Principal Occupations: Director or Trustee of the Federated Fund Family; President and Director, Heat Wagon, Inc. (manufacturer of construction temporary heaters); President and Director, Manufacturers Products, Inc. (distributor of portable construction heaters); President, Portable Heater Parts, a division of Manufacturers Products, Inc.
Previous Position: Vice President, Walsh & Kelly, Inc.
Qualifications: Business management and director experience. |
James F. Will
Birth Date: October 12, 1938
Trustee
Began serving: April 2006 | Principal Occupations: Director or Trustee of the Federated Fund Family; formerly, Vice Chancellor and President, Saint Vincent College.
Other Directorships Held: Trustee, Saint Vincent College; Director, Alleghany Corporation; Trustee, Wheeling Jesuit University; Director, Liberty Tire Recycling.
Previous Positions: Chairman, President and Chief Executive Officer, Armco, Inc.; President and Chief Executive Officer, Cyclops Industries; President and Chief Operating Officer, Kaiser Steel Corporation.
Qualifications: Business management, education and director experience. |
Annual Shareholder Report32
OFFICERS
Name
Birth Date
Address
Positions Held with Trust
Date Service Began | Principal Occupation(s) for Past Five Years
and Previous Position(s) |
John W. McGonigle
Birth Date: October 26, 1938
EXECUTIVE VICE PRESIDENT AND SECRETARY
Began serving: April 1984 | Principal Occupations: Executive Vice President and Secretary of the Federated Fund Family; Vice Chairman, Executive Vice President, Secretary and Director, Federated Investors, Inc.
Previous Positions: Trustee, Federated Investment Management Company and Federated Investment Counseling; Director, Federated Global Investment Management Corp., Federated Services Company and Federated Securities Corp. |
Richard A. Novak
Birth Date: December 25, 1963
TREASURER
Began serving: January 2006 | Principal Occupations: Principal Financial Officer and Treasurer of the Federated Fund Family; Senior Vice President, Federated Administrative Services; Financial and Operations Principal for Federated Securities Corp., Edgewood Services, Inc. and Southpointe Distribution Services, Inc.
Previous Positions: Controller of Federated Investors, Inc.; Vice President, Finance of Federated Services Company; held various financial management positions within The Mercy Hospital of Pittsburgh; Auditor, Arthur Andersen & Co. |
Brian P. Bouda
Birth Date: February 28, 1947
CHIEF COMPLIANCE OFFICER AND SENIOR VICE PRESIDENT
Began serving: August 2004 | Principal Occupations: Senior Vice President and Chief Compliance Officer of the Federated Fund Family; Vice President and Chief Compliance Officer of Federated Investors, Inc. and Chief Compliance Officer of its subsidiaries. Mr. Bouda joined Federated in 1999 and is a member of the American Bar Association and the State Bar Association of Wisconsin. |
Stephen F. Auth
Birth Date: September 3, 1956
450 Lexington Avenue
Suite 3700
New York, NY 10017-3943
CHIEF INVESTMENT OFFICER
Began serving: November 2002 | Principal Occupations: Mr. Auth is Chief Investment Officer of this Fund and various other Funds in the Federated Fund Family; Executive Vice President, Federated Investment Counseling, Federated Global Investment Management Corp. and Federated Equity Management Company of Pennsylvania.
Previous Positions: Executive Vice President, Federated Investment Management Company, and Passport Research, Ltd. (investment advisory subsidiary of Federated); Senior Vice President, Global Portfolio Management Services Division; Senior Vice President, Federated Investment Management Company and Passport Research, Ltd.; Senior Managing Director and Portfolio Manager, Prudential Investments. |
Lawrence Auriana
Birth Date: January 8, 1944
140 East 45th Street
New York, NY 10017
VICE PRESIDENT
Began serving: November 2001 | Principal Occupations: Lawrence Auriana is Vice President of the Trust. Mr. Auriana joined Federated in April 2001 as Co-Head of Investments/Federated Kaufmann. From August 1984 to April 2001, Mr. Auriana was President and Treasurer of Edgemont Asset Management Corp., and Chairman of the Board and Portfolio Manager to The Kaufmann Fund, Inc. (predecessor to the Federated Kaufmann Fund). Mr. Auriana earned a B.S. in economics from Fordham University and has been engaged in the securities business since 1965. |
Annual Shareholder Report33
Name
Birth Date
Address
Positions Held with Trust
Date Service Began | Principal Occupation(s) for Past Five Years
and Previous Position(s) |
Walter C. Bean
Birth Date: June 22, 1945
VICE PRESIDENT
Began serving: November 2006 | Principal Occupations: Walter C. Bean is Vice President of the Trust. Mr. Bean is a Senior Vice President, Senior Portfolio Manager and the Head of the Equity Income Management Team of the Fund's Adviser. Mr. Bean joined Federated in 2000. His previous associations included: various investment management and research positions with C.S. McKee & Company; First Chicago Investment Advisors; CIGNA Investment Advisors; and Mellon Bank. Mr. Bean earned a Bachelors Degree in Business Administration from Ohio University and an M.B.A. from the Pennsylvania State University. Mr. Bean has received the Chartered Financial Analyst designation and has 36 years of investment experience. |
Richard B. Fisher
Birth Date: May 17, 1923
VICE PRESIDENT
Began serving: April 1984
| Principal Occupations: Vice Chairman or Vice President of some of the Funds in the Federated Fund Family; Vice Chairman, Federated Investors, Inc.; Chairman, Federated Securities Corp.
Previous Positions: President and Director or Trustee of some of the Funds in the Federated Fund Family; Executive Vice President, Federated Investors, Inc.; Director and Chief Executive Officer, Federated Securities Corp. |
Hans P. Utsch
Birth Date: July 3, 1936
140 East 45th Street
New York, NY 10017
VICE PRESIDENT
Began serving: November 2001 | Principal Occupations: Hans P. Utsch is Vice President of the Trust. Mr. Utsch joined Federated in April 2001 as Co-Head of Investments/Federated Kaufmann. From August 1984 to April 2001, Mr. Utsch was Chairman of the Board and Secretary of Edgemont Asset Management Corp., and President and Portfolio Manager to The Kaufmann Fund, Inc. (predecessor to the Federated Kaufmann Fund). Mr. Utsch graduated from Amherst College and holds an M.B.A. from Columbia University. He has been engaged in the securities business since 1962. |
Annual Shareholder Report34
Evaluation and Approval of Advisory Contract - May 2010
Federated Clover Value Fund (the “Fund”)
The Fund's Board reviewed the Fund's investment advisory contract at meetings held in May 2010. The Board's decision regarding the contract reflects the exercise of its business judgment on whether to continue the existing arrangements.
In this connection, the Federated funds' Board had previously appointed a Senior Officer, whose duties include specified responsibilities relating to the process by which advisory fees are to be charged to a Federated fund. The Senior Officer has the authority to retain consultants, experts, or staff as may be reasonably necessary to assist in the performance of his duties, reports directly to the Board, and may be terminated only with the approval of a majority of the independent members of the Board. The Senior Officer prepared and furnished to the Board an independent, written evaluation that covered topics discussed below. The Board considered that evaluation, along with other information, in deciding to approve the advisory contract.
During its review of the contract, the Board considered compensation and benefits received by the Adviser. This included the fees received for services provided to the Fund by other entities in the Federated organization and research services (if any) received by the Adviser from brokers that execute Federated fund trades, as well as advisory fees. The Board is also familiar with and considered judicial decisions concerning allegedly excessive investment advisory fees, which have indicated that the following factors may be relevant to an Adviser's fiduciary duty with respect to its receipt of compensation from a fund: the nature and quality of the services provided by the Adviser, including the performance of the fund; the Adviser's cost of providing the services; the extent to which the Adviser may realize “economies of scale” as a fund grows larger; any indirect benefits that may accrue to the Adviser and its affiliates as a result of the Adviser's relationship with a fund; performance and expenses of comparable funds; and the extent to which the independent Board members are fully informed about all facts the Board deems relevant bearing on the Adviser's services and fees. The Board further considered management fees (including any components thereof) charged to institutional and other clients of the Adviser for what might be viewed as like services, and the cost to the Adviser and its affiliates of supplying services pursuant to the management fee agreements, excluding any intra-corporate profit and profit margins of the Adviser and its affiliates for supplying such services. The Board was aware of these factors and was guided by them in its review of the Fund's advisory contract to the extent it considered them to be appropriate and relevant, as discussed further below.
Annual Shareholder Report35
The Board considered and weighed these circumstances in light of its substantial accumulated experience in governing the Fund and working with Federated on matters relating to the Federated funds, and was assisted in its deliberations by independent legal counsel. Throughout the year, the Board has requested and received substantial and detailed information about the Fund and the Federated organization that was in addition to the extensive materials that comprise and accompany the Senior Officer's evaluation. Federated provided much of this information at each regular meeting of the Board, and furnished additional reports in connection with the particular meeting at which the Board's formal review of the advisory contract occurred. Between regularly scheduled meetings, the Board also received information on particular matters as the need arose. Thus, the Board's consideration of the advisory contract included review of the Senior Officer's evaluation, accompanying data and additional reports covering such matters as: the Adviser's investment philosophy, revenue, profitability, personnel and processes; investment and operating strategies; the Fund's short- and long-term performance (in absolute terms, both on a gross basis and net of expenses, as well as in relationship to its particular investment program and certain competitor or “peer group” funds and/or other benchmarks, as appropriate), and comments on the reasons for performance; the Fund's investment objectives; the Fund's expenses (including the advisory fee itself and the overall expense structure of the Fund, both in absolute terms and relative to similar and/or competing funds, with due regard for contractual or voluntary expense limitations); the use and allocation of brokerage commissions derived from trading the Fund's portfolio securities (if any); and the nature, quality and extent of the advisory and other services provided to the Fund by the Adviser and its affiliates. The Board also considered the preferences and expectations of Fund shareholders and their relative sophistication; the continuing state of competition in the mutual fund industry and market practices; the range of comparable fees for similar funds in the mutual fund industry; the Fund's relationship to the Federated family of funds which include a comprehensive array of funds with different investment objectives, policies and strategies which are available for exchange without the incurrence of additional sales charges; compliance and audit reports concerning the Federated funds and the Federated companies that service them (including communications from regulatory agencies), as well as Federated's responses to any issues raised therein; and relevant developments in the mutual fund industry and how the Federated funds and/or Federated are responding to them. The Board's evaluation process is evolutionary. The criteria considered and the emphasis placed on relevant criteria change in recognition of changing circumstances in the mutual fund marketplace. With respect to the Fund's performance and expenses in particular, the Board has found the use of comparisons to other mutual funds with comparable investment programs to be relevant, given the high degree of competition in the mutual fund business. The Board focused on comparisons with other similar Annual Shareholder Report36
mutual funds more heavily than non-mutual fund products or services because it is believed that they are more relevant. For example, other mutual funds are the products most like the Fund, they are readily available to Fund shareholders as alternative investment vehicles, and they are the type of investment vehicle in fact chosen and maintained by the Fund's investors. The range of their fees and expenses therefore appears to be a generally reliable indication of what consumers have found to be reasonable in the precise marketplace in which the Fund competes. The Fund's ability to deliver competitive performance when compared to its peer group was a useful indicator of how the Adviser is executing the Fund's investment program, which in turn assisted the Board in reaching a conclusion that the nature, extent, and quality of the Adviser's investment management services were such as to warrant continuation of the advisory contract. In this regard, the Senior Officer has reviewed Federated's fees for providing advisory services to products outside the Federated family of funds (e.g., institutional and separate accounts). He concluded that mutual funds and institutional accounts are inherently different products. Those differences include, but are not limited to, different types of targeted investors; being subject to different laws and regulations; different legal structures; different average account sizes; different associated costs; different portfolio management techniques made necessary by different cash flows; and portfolio manager time spent in review of securities pricing. The Senior Officer did not consider these fee schedules to be determinative in judging the appropriateness of mutual fund advisory contracts.The Senior Officer reviewed reports compiled by Federated, using data supplied by independent fund ranking organizations, regarding the performance of, and fees charged by, other mutual funds, noting his view that comparisons to fund peer groups are relevant in judging the reasonableness of proposed fees.
For the periods covered by the report, the Fund's performance for the three-year and five-year periods was above the median of the relevant peer group, and the Fund's performance fell below the median of the relevant peer group for the one-year period. The Board discussed the Fund's performance with the Adviser and recognized the efforts being undertaken by the Adviser. The Board will continue to monitor these efforts and the performance of the Fund.
The Board also received financial information about Federated, including reports on the compensation and benefits Federated derived from its relationships with the Federated funds. These reports covered not only the fees under the advisory contracts, but also fees received by Federated's subsidiaries for providing other services to the Federated funds under separate contracts (e.g., for serving as the Federated funds' administrator). The reports also discussed any indirect benefit Federated may derive from its receipt of research services from brokers who execute Federated fund trades. In addition, the Board considered the fact that, in order for a fund to be competitive in the marketplace, Federated and its affiliates frequently waived fees and/or Annual Shareholder Report37
reimbursed expenses and have disclosed to fund investors and/or indicated to the Board their intention to do so in the future, where appropriate. Moreover, the Board receives regular reports regarding the institution or elimination of these voluntary waivers.Federated furnished reports, requested by the Senior Officer, that reported revenues on a fund-by-fund basis and made estimates of the allocation of expenses on a fund-by-fund basis, using allocation methodologies specified by the Senior Officer. The Senior Officer noted that, although they may apply consistent allocation processes, the inherent difficulties in allocating costs (and the unavoidable arbitrary aspects of that exercise) and the lack of consensus on how to allocate those costs may render such allocation reports unreliable. The allocation reports were considered in the analysis by the Board but were determined to be of limited use.
The Board and the Senior Officer also reviewed a report compiled by Federated comparing profitability information for Federated to other publicly held fund management companies. In this regard, the Senior Officer noted the limited availability of such information, but nonetheless concluded that Federated's profit margins did not appear to be excessive and the Board agreed.
The Senior Officer's evaluation also discussed the notion of possible realization of “economies of scale” as a fund grows larger. The Board considered in this regard that the Adviser has made significant and long-term investments in areas that support all of the Federated funds, such as personnel and processes for the portfolio management, compliance, and risk management functions; and systems technology; and that the benefits of these efforts (as well as any economies, should they exist) were likely to be enjoyed by the fund complex as a whole. Finally, the Board also noted the absence of any applicable regulatory or industry guidelines on this subject, which (as discussed in the Senior Officer's evaluation) is compounded by the lack of any common industry practice or general pattern with respect to structuring fund advisory fees with “breakpoints” that serve to reduce the fee as the fund attains a certain size. The Senior Officer did not recommend institution of breakpoints in pricing Federated's fund advisory services at this time.
It was noted in the materials for the Board meeting that for the period covered by the report, the Fund's investment advisory fee, after waivers and expense reimbursements, if any, was above the median of the relevant peer group. The Board reviewed the fees and other expenses of the Fund with the Adviser and was satisfied that the overall expense structure of the Fund remained competitive. The Board will continue to monitor advisory fees and other expenses borne by the Fund.
The Senior Officer's evaluation noted his belief that the information and observations contained in his evaluation supported a finding that the proposed management fees are reasonable, and that Federated appeared to provide appropriate administrative services to the Fund for the fees paid. Under these Annual Shareholder Report38
circumstances, no changes were recommended to, and no objection was raised to, the continuation of the Fund's advisory contract. The Board concluded that the nature, quality and scope of services provided the Fund by the Adviser and its affiliates were satisfactory.In its decision to continue an existing investment advisory contract, the Board was mindful of the potential disruptions of the Fund's operations and various risks, uncertainties and other effects that could occur as a result of a decision to terminate or not renew an advisory contract. In particular, the Board recognized that many shareholders have invested in the Fund on the strength of the Adviser's industry standing and reputation and with the expectation that the Adviser will have a continuing role in providing advisory services to the Fund. Thus, the Board's approval of the advisory contract reflected the fact that it is the shareholders who have effectively selected the Adviser by virtue of having invested in the Fund.
The Board based its decision to approve the advisory contract on the totality of the circumstances and relevant factors and with a view to past and future long-term considerations. Not all of the factors and considerations identified above were necessarily relevant to the Fund, nor did the Board consider any one of them to be determinative. With respect to the factors that were relevant, the Board's decision to approve the contract reflects its determination that Federated's performance and actions provided a satisfactory basis to support the decision to continue the existing arrangements.
Annual Shareholder Report39
Voting Proxies on Fund Portfolio Securities
A description of the policies and procedures that the Fund uses to determine how to vote proxies, if any, relating to securities held in the Fund's portfolio is available, without charge and upon request, by calling 1-800-341-7400. A report on “Form N-PX” of how the Fund voted any such proxies during the most recent 12-month period ended June 30 is available from Federated's website at FederatedInvestors.com. To access this information from the “Products” section of the website, click on the “Prospectuses and Regulatory Reports” link under “Related Information,” then select the appropriate link opposite the name of the Fund; or select the name of the Fund and from the Fund's page, click on the “Prospectuses and Regulatory Reports” link. Form N-PX filings are also available at the SEC's website at www.sec.gov.
Quarterly Portfolio Schedule
The Fund files with the SEC a complete schedule of its portfolio holdings, as of the close of the first and third quarters of its fiscal year, on “Form N-Q.” These filings are available on the SEC's website at www.sec.gov and may be reviewed and copied at the SEC's Public Reference Room in Washington, DC. (Call 1-800-SEC-0330 for information on the operation of the Public Reference Room.) You may also access this information from the “Products” section of Federated's website at FederatedInvestors.com by clicking on “Portfolio Holdings” under “Related Information,” then selecting the appropriate link opposite the name of the Fund; or select the name of the Fund and from the Fund's page, click on the “Portfolio Holdings” link.
Annual Shareholder Report40
Notes
41
Notes42
Notes43
Notes44
Notes45
Notes46
Mutual funds are not bank deposits or obligations, are not guaranteed by any bank and are not insured or guaranteed by the U.S. government, the Federal Deposit Insurance Corporation, the Federal Reserve Board or any other government agency. Investment in mutual funds involves investment risk, including the possible loss of principal.
This Report is authorized for distribution to prospective investors only when preceded or accompanied by the Fund's Prospectus, which contains facts concerning its objective and policies, management fees, expenses and other information.
Federated Clover Value Fund
Federated Investors Funds
4000 Ericsson Drive
Warrendale, PA 15086-7561
Contact us at FederatedInvestors.com
or call 1-800-341-7400.
Federated Securities Corp., Distributor
Cusip 314172214
41201 (11/10)
Federated is a registered mark of Federated Investors, Inc.
2010 © Federated Investors, Inc.
Federated Prudent Bear Fund(Successor to the Prudent Bear Fund Established 1995)
A Portfolio of Federated Equity Funds
ANNUAL SHAREHOLDER REPORTSeptember 30, 2010
Class A Shares
Class C Shares
FINANCIAL HIGHLIGHTS
SHAREHOLDER EXPENSE EXAMPLE
MANAGEMENT'S DISCUSSION OF FUND PERFORMANCE
PORTFOLIO OF INVESTMENTS SUMMARY TABLES
PORTFOLIO OF INVESTMENTS
STATEMENT OF ASSETS AND LIABILITIES
STATEMENT OF OPERATIONS
STATEMENT OF CHANGES IN NET ASSETS
NOTES TO FINANCIAL STATEMENTS
REPORT OF INDEPENDENT REGISTERED PUBLIC ACCOUNTING FIRM
BOARD OF TRUSTEES AND TRUST OFFICERS
EVALUATION AND APPROVAL OF ADVISORY CONTRACT
VOTING PROXIES ON FUND PORTFOLIO SECURITIES
QUARTERLY PORTFOLIO SCHEDULE
Financial Highlights - Class A Shares
(For a Share Outstanding Throughout Each Period)
| Year Ended September 30 | 2010 | 20091 | 2008 | 2007 | 2006 |
| Net Asset Value, Beginning of Period | $5.74 | $6.82 | $5.96 | $5.84 | $5.47 |
| Income From Investment Operations: | | | | | |
| Net investment income (loss) | (0.12)2 | (0.15)2 | 0.05 | 0.19 | 0.15 |
Net realized and unrealized gain (loss) on investments, short sales, futures contracts
and foreign currency transactions | (0.53) | 0.41 | 1.00 | 0.12 | 0.28 |
| TOTAL FROM INVESTMENT OPERATIONS | (0.65) | 0.26 | 1.05 | 0.31 | 0.43 |
| Less Distributions: | | | | | |
| Distributions from net investment income | — | — | (0.19) | (0.19) | (0.06) |
Distributions from net realized gain on investments, short sales, futures contracts
and foreign currency transactions | — | (1.33) | — | — | — |
| Return of capital3 | — | (0.01) | — | — | — |
| TOTAL DISTRIBUTIONS | — | (1.34) | (0.19) | (0.19) | (0.06) |
| Redemption Fees | — | — | 0.004 | 0.004 | 0.004 |
| Net Asset Value, End of Period | $5.09 | $5.74 | $6.82 | $5.96 | $5.84 |
| Total Return5 | (11.32)% | 0.06% | 17.98% | 5.49% | 7.92% |
| Ratios to Average Net Assets: | | | | | |
| Net expenses | 2.42%6 | 2.84%6 | 2.56%6 | 2.33%6 | 2.49% |
| Net expenses excluding dividends and other expenses related to short sales | 1.72%6 | 1.73%6 | 1.72%6 | 1.76%6 | 1.77% |
| Net investment income (loss) | (2.31)% | (2.18)% | 0.80% | 3.31% | 2.60% |
| Expense waiver/reimbursement7 | 0.01% | 0.03% | 0.04% | 0.03% | — |
| Supplemental Data: | | | | | |
| Net assets, end of period (000 omitted) | $1,212,331 | $1,079,143 | $1,054,341 | $747,610 | $650,305 |
| Portfolio turnover | 379% | 392% | 277% | 119% | 104% |
| 1 | Prudent Bear Fund (the “Predecessor Fund”) was reorganized into Federated Prudent Bear Fund (the “Fund”) as of the close of business on December 5, 2008. Prior to the reorganization, the Fund had no investment operations. The Fund is the successor to the Predecessor Fund. The performance information and financial information presented incorporates the operations of the Predeccesor Fund, which, as a result of the reorganization, are the Fund's operations. Beginning with the year ended September 30, 2009, the Fund was audited by KPMG LLP. The previous years were audited by another independent registered public accounting firm. |
| 2 | Per share numbers have been calculated using the average shares method. |
| 3 | Represents a return of capital for federal income tax purposes. |
| 4 | Represents less than $0.01. |
| 5 | Based on net asset value, which does not reflect the sales charge, redemption fee or contingent deferred sales charge, if applicable. |
| 6 | The net expense ratios are calculated without reduction for fees paid indirectly for expense offset arrangements. The net expense ratios are 2.42%, 2.82%, 2.52% and 2.30%, after taking into account these expense reductions for the years ended September 30, 2010, 2009, 2008 and 2007, respectively. The net expense ratios excluding dividends and other expenses related to short sales are also calculated without reduction for these fees paid indirectly for expense offset arrangements. |
| 7 | This expense decrease is reflected in both the net expense and the net investment income (loss) ratios shown above. |
See Notes which are an integral part of the Financial Statements
Annual Shareholder Report1
Financial Highlights - Class C Shares
(For a Share Outstanding Throughout Each Period)
| Year Ended September 30 | 2010 | 20091 | 2008 | 2007 | 2006 |
| Net Asset Value, Beginning of Period | $5.40 | $6.52 | $5.72 | $5.62 | $5.29 |
| Income From Investment Operations: | | | | | |
| Net investment income (loss) | (0.15)2 | (0.19)2 | 0.01 | 0.14 | 0.11 |
Net realized and unrealized gain (loss) on investments, short sales, futures contracts
and foreign currency transactions | (0.50) | 0.41 | 0.96 | 0.11 | 0.26 |
| TOTAL FROM INVESTMENT OPERATIONS | (0.65) | 0.22 | 0.97 | 0.25 | 0.37 |
| Less Distributions: | | | | | |
| Distributions from net investment income | — | — | (0.17) | (0.15) | (0.04) |
Distributions from net realized gain on investments, short sales, futures contracts
and foreign currency transactions | — | (1.33) | — | — | — |
| Return of capital3 | — | (0.01) | — | — | — |
| TOTAL DISTRIBUTIONS | — | (1.34) | (0.17) | (0.15) | (0.04) |
| Redemption Fees | — | — | 0.004 | 0.004 | 0.004 |
| Net Asset Value, End of Period | $4.75 | $5.40 | $6.52 | $5.72 | $5.62 |
| Total Return5 | (12.04)% | (0.65)% | 17.13% | 4.61% | 7.14% |
| Ratios to Average Net Assets: | | | | | |
| Net expenses | 3.17%6 | 3.61%6 | 3.31%6 | 3.08%6 | 3.24% |
| Net expenses excluding dividends and other expenses related to short sales | 2.48%6 | 2.46%6 | 2.47%6 | 2.51%6 | 2.52% |
| Net investment income (loss) | (3.04)% | (3.03)% | 0.09% | 2.56% | 1.85% |
| Expense waiver/reimbursement7 | 0.01% | 0.03% | 0.04% | 0.03% | — |
| Supplemental Data: | | | | | |
| Net assets, end of period (000 omitted) | $197,495 | $96,518 | $65,831 | $45,173 | $31,283 |
| Portfolio turnover | 379% | 392% | 277% | 119% | 104% |
| 1 | The Predecessor Fund was reorganized into the Fund as of the close of business on December 5, 2008. Prior to the reorganization, the Fund had no investment operations. The Fund is the successor to the Predecessor Fund. The performance information and financial information presented incorporates the operations of the Predeccesor Fund, which, as a result of the reorganization, are the Fund's operations. Beginning with the year ended September 30, 2009, the Fund was audited by KPMG LLP. The previous years were audited by another independent registered public accounting firm. |
| 2 | Per share numbers have been calculated using the average shares method. |
| 3 | Represents a return of capital for federal income tax purposes. |
| 4 | Represents less than $0.01. |
| 5 | Based on net asset value, which does not reflect the sales charge, redemption fee or contingent deferred sales charge, if applicable. |
| 6 | The net expense ratios are calculated without reduction for fees paid indirectly for expense offset arrangements. The net expense ratios are 3.17%, 3.59%, 3.27% and 3.05%, after taking into account these expense reductions for the years ended September 30, 2010, 2009, 2008 and 2007, respectively. The net expense ratios excluding dividends and other expenses related to short sales are also calculated without reduction for these fees paid indirectly for expense offset arrangements. |
| 7 | This expense decrease is reflected in both the net expense and the net investment income (loss) ratios shown above. |
See Notes which are an integral part of the Financial Statements
Annual Shareholder Report2
Shareholder Expense Example (unaudited)
As a shareholder of the Fund, you incur two types of costs: (1) transaction costs, including sales charges (loads) on purchase or redemption payments; and (2) ongoing costs, including management fees and to the extent applicable, distribution (12b-1) fees and/or shareholder services fees and other Fund expenses. This Example is intended to help you to understand your ongoing costs (in dollars) of investing in the Fund and to compare these costs with the ongoing costs of investing in other mutual funds. It is based on an investment of $1,000 invested at the beginning of the period and held for the entire period from April 1, 2010 to September 30, 2010.
ACTUAL EXPENSES
The first section of the table below provides information about actual account values and actual expenses. You may use the information in this section, together with the amount you invested, to estimate the expenses that you incurred over the period. Simply divide your account value by $1,000 (for example, an $8,600 account value divided by $1,000 = 8.6), then multiply the result by the number in the first section under the heading entitled “Expenses Paid During Period” to estimate the expenses attributable to your investment during this period.
HYPOTHETICAL EXAMPLE FOR COMPARISON PURPOSES
The second section of the table below provides information about hypothetical account values and hypothetical expenses based on the Fund's actual expense ratio and an assumed rate of return of 5% per year before expenses, which is not the Fund's actual return. Thus, you should not use the hypothetical account values and expenses to estimate the actual ending account balance or your expenses for the period. Rather, these figures are required to be provided to enable you to compare the ongoing costs of investing in the Fund with other funds. To do so, compare this 5% hypothetical example with the 5% hypothetical examples that appear in the shareholder reports of the other funds.
Annual Shareholder Report3
Please note that the expenses shown in the table are meant to highlight your ongoing costs only and do not reflect any transaction costs, such as sales charges (loads) on purchase or redemption payments. Therefore, the second section of the table is useful in comparing ongoing costs only, and will not help you determine the relative total costs of owning different funds. In addition, if these transaction costs were included, your costs would have been higher. | Beginning
Account Value
4/1/2010 | Ending
Account Value
9/30/2010 | Expenses Paid
During Period1 |
| Actual: | | | |
| Class A Shares | $1,000 | $998.00 | $11.72 |
| Class C Shares | $1,000 | $993.70 | $15.44 |
Hypothetical (assuming a 5% return
before expenses): | | | |
| Class A Shares | $1,000 | $1,013.34 | $11.81 |
| Class C Shares | $1,000 | $1,009.58 | $15.57 |
| 1 | Expenses are equal to the Fund's annualized net expense ratios, multiplied by the average account value over the period, multiplied by 183/365 (to reflect the one-half-year period). The annualized net expense ratios are as follows: |
| Class A Shares | 2.34% |
| Class C Shares | 3.09% |
Annual Shareholder Report4
Performance data quoted represents past performance which is no guarantee of future results. Investment return and principal value will fluctuate so that an investor's shares, when redeemed, may be worth more or less than their original cost. Mutual fund performance changes over time and current performance may be lower or higher than what is stated. For current to the most recent month-end performance and after-tax returns, visit FederatedInvestors.com or call 1-800-341-7400.
Management's Discussion of Fund Performance (unaudited)
The Fund's total return, based on net asset value, for the fiscal year ended September 30, 2010, was -11.32% for Class A Shares and -12.04% for Class C Shares. The total return of the Standard & Poor's 500 Index (S&P 500),1 a broad-based securities market index, was 10.16% for the same period. The total return for the Fund's market benchmark, the S&P 500 Inverse Daily Index,2 was -12.02% for the same period. The Fund's total return for the fiscal year reflected actual cash flows, transaction costs and other expenses which were not reflected in the total return of the S&P 500.
The following discussion will focus on the performance of the Fund's Class A Shares.
MARKET OVERVIEW
The fiscal year encompassed another extraordinary period of uncertainty and volatility for U.S. and global financial markets. U.S. stocks began the reporting period adding to 2009's big gains. From the early October 2009 low to the April 2010 trading high, the S&P 500 rose 19.6%. At that point the S&P 500 had rallied 82.9% off of the March 2009 market low, while the Standard & Poor's 400 Mid-Cap Index3 had gained 114.3%. But the rapidly expanding Greek debt crisis brought one of history's great stock market advances to an abrupt halt. From the April 2010 high to the July trading low, the S&P 500 declined 17.1%, before the market again reversed course to post the strongest September gain in 70 years. All in all, it remained an unstable and exceptionally challenging market environment.
| 1 | The S&P 500 is a broad-based market index that measures the performance of the broad domestic economy through changes in the aggregate market value of 500 stocks representing all major industries. The Index is unmanaged and investments cannot be made in an index. |
| 2 | The S&P 500 Inverse Daily Index is designed to provide the inverse performance of the S&P 500, representing a short position in the index. |
| 3 | The S&P 400 Mid-Cap Index is an unmanaged capitalization weighted index of common stocks representing all major industries in the mid-range of the U.S. stock market. |
Annual Shareholder Report5
FUND PERFORMANCEThe Fund's underperformance versus the total return of the S&P 500 index (the Fund outperformed its benchmark, the S&P 500 Inverse Daily Index) for the reporting period was due to several factors. For one, most stocks outperformed the S&P 500 index. Many stocks and sectors - including those commonly shorted - have enjoyed spectacular gains. In general, individual company stock selection - albeit long or short - has been a difficult proposition for participants throughout the marketplace. It has been especially grueling on the short-side, and stock picking was not successful for the Fund during the reporting period. Performance was also negatively impacted by the extraordinarily uncertain policy backdrop and resulting erratic swings in market sentiment and prices.
The reporting period was particularly challenging with regard to the mercurial global macro backdrop. Coming into the reporting period, it was the Fund managers' view that 2010 was a “bubble year.” They believed that the unprecedented fiscal and monetary policy responses to the 2008 collapse of the mortgage/Wall Street finance bubble had unleashed potentially more expansive bubbles throughout global government finance and beyond. Such a backdrop creates great uncertainty, with bi-polar market outcome possibilities: The bubble might, as they tend to do, gather momentum - or it could burst. Acute systemic fragilities seemed to ensure that a faltering bubble had the potential to foment the rapid return of financial and economic crisis. At the same time, intractable structural vulnerabilities could elicit the type of extreme policy responses conducive to inflating bubbles.
It is the Fund managers' investment philosophy to increase short exposure when the market environment is favorable for shorting and to reduce short positions when the environment is unfavorable.4 And especially during such an unsettled period, the Fund managers will not veer away from their mandate of providing a reliable hedge against a market decline. In the end, it was just a very challenging 12-month period, as the Fund managers worked to gauge the relative risks and rewards in an unsettled marketplace and to determine whether to maintain a cautious stance or instead to implement a more opportunistic approach to managing the Fund's short exposure.
| 4 | The Fund regularly makes short sales of securities, which involves unlimited risk including the possibility that losses may exceed the original amount invested. The Fund may also use options and futures contracts, which have risks associated with unlimited losses of the underlying holdings due to unanticipated market movements and failure to correctly predict the direction of securities prices, interest rates and currency exchanges rates. However, a mutual fund investor's risk is limited to the amount of investment in a mutual fund. The Fund may also hold restricted securities purchased through private placements. Such securities may be difficult to sell without experiencing delays or additional costs. Please see the Prospectus for further details. Considering the increased risks, the Fund may not be suitable for all investors. |
Annual Shareholder Report6
Positioning and StrategyThe Fund began the reporting period cautiously positioned, as it had been since implementing major changes to portfolio positions in the fourth quarter of 2008. With a generally unfavorable risk versus reward backdrop for shorting individual company stocks, the majority of the Fund's short exposure was maintained in liquid sector and market index instruments. The stock market rallied into the end of 2009, but storm clouds were brewing.
Greece credit default swap (CDS) prices doubled in a matter of weeks to more than 400 basis points by late January 2010. U.S. and global equities performed poorly in January, and it appeared to the Fund managers that a more favorable environment for shorting might be at hand. Yet the market reversed abruptly. The S&P 500 rallied almost 17% from the early February low to the trading high on April 26, in what developed into a “short squeeze” and excruciating rally for those positioned bearishly.
In late April, right in the midst of a highly speculative equities rally, the situation took a decisive turn for the worse in Greek and periphery European debt markets. After trading at about two percent in early November 2009, Greece's two-year borrowing costs surged to 16 percent. At such yields, Greece's heavy debt load was unmanageable. The Greek crisis threw the CDS marketplace into disarray, as the unthinkable scenario of a string of sovereign defaults became a real possibility. Almost overnight, contagion effects spread to Portugal, Ireland, Spain, Italy and beyond to the global risk market more generally. Market sentiment had flip-flopped, with participants becoming anything but confident that global policymakers had things under control.
Beginning in late April, the Fund managers moved decisively to implement a more opportunistic stance. Put options were purchased to gain more exposure to a broader stock market decline. Individual company short positions were increased, with an emphasis on stocks expected to be susceptible to tightened financial conditions and a weaker-than-expected U.S. economy. Overall short exposure was increased to the highest level since 2008.
As the Fund managers had anticipated, a broadening European debt crisis did lead to tighter financial conditions here at home. Global participants were poorly positioned for an abrupt change in the market environment. In particular, a dislocation in European debt and CDS markets, faltering confidence in the euro and a surging dollar fomented a bout of de-risking and de-leveraging in the markets. In the United States, rising risk premiums, a tightening in the corporate debt market and sinking equity prices battered confidence. The tepid U.S. economic recovery stalled.
Annual Shareholder Report7
While equities remained on the defensive through the end of August, general financial conditions were again loosening. With the Federal Reserve contemplating additional quantitative easing, Treasury and market yields were collapsing. Risk premiums throughout the marketplace were contracting. Corporate debt issuance was booming, with record sales of junk bonds. Jumps in merger and acquisition activity and stock buyback announcements were also indicative of a loose financial backdrop. And, importantly, a significant weakening of the U.S. dollar was providing a “reflationary” boost to global risk markets.The Fund managers reacted to the loosening of financial conditions by implementing a more cautious strategy. Overall short exposure was reduced. The equity put positions, purchased at the onset of the Greek crisis, were sold. The allocation to individual company and sector short positions was reduced on the view that liquid S&P 500 futures again provided a more appealing risk versus reward dynamic, in what the Fund managers viewed as an increasingly risky backdrop for shorting. These moves helped mitigate loses during the big September market rally.
It is fundamental to the Fund managers' investment philosophy to remain flexible, tactical and disciplined with respect to managing Fund short exposure. Micro company research and analysis on the short side remained especially challenging for much of the reporting period, although stock selection for the Fund's long investments in resources stocks did benefit performance. And Fund performance again benefited from the other two “prongs” of the Fund managers' philosophy: diligent “top-down” macro analysis and disciplined risk-based portfolio management.
Annual Shareholder Report8
GROWTH OF A $10,000 INVESTMENT - CLASS A SHARES1The graph below illustrates the hypothetical investment of $10,0002 in the Federated Prudent Bear Fund (Class A Shares) (the “Fund”) from September 30, 2000 to September 30, 2010, compared to the Standard & Poor's 500 Index (S&P 500)3 and the S&P 500 Inverse Daily Index
(S&P 500 Inverse).3
| Average Annual Total Returns4 for the Period Ended 9/30/2010 | |
| 1 Year | -16.14% |
| 5 Years | 2.40% |
| 10 Years | 6.61% |
Performance data quoted represents past performance which is no guarantee of future results. Investment return and principal value will fluctuate so that an investor's shares, when redeemed, may be worth more or less than their original cost. Mutual fund performance changes over time and current performance may be lower or higher than what is stated. For current to the most recent month-end performance and after-tax returns, visit FederatedInvestors.com or call 1-800-341-7400. Returns shown do not reflect the deduction of taxes that a shareholder would pay on Fund distributions or the redemption of Fund shares. Mutual funds are not obligations of or guaranteed by any bank and are not federally insured. Total returns shown include the maximum sales charge of 5.50%.
| 1 | Federated Prudent Bear Fund is the successor to Prudent Bear Fund pursuant to a reorganization that took place on December 5, 2008. The information presented above, for the periods prior to December 5, 2008, is historical information for the No Load Shares of the Prudent Bear Fund. |
| 2 | Represents a hypothetical investment of $10,000 in the Fund after deducting the maximum sales charge of 5.50% ($10,000 investment minus $550 sales charge = $9,450). The Fund's performance assumes the reinvestment of all dividends and distributions. The S&P 500 and the S&P 500 Inverse have been adjusted to reflect reinvestment of dividends on securities in the indexes. |
| 3 | The S&P 500 and the S&P 500 Inverse are not adjusted to reflect taxes, sales charges, expenses or other fees that the Securities and Exchange Commission (SEC) requires to be reflected in the Fund's performance. The S&P 500 and the S&P 500 Inverse are unmanaged and, unlike the Fund, are not affected by cash flows. It is not possible to invest directly in an index. |
| 4 | Total returns quoted reflect all applicable sales charges. |
Annual Shareholder Report9
GROWTH OF A $10,000 INVESTMENT - CLASS C SHARES1
The graph below illustrates the hypothetical investment of $10,0002 in the Federated Prudent Bear Fund (Class C Shares) (the “Fund”) from September 30, 2000 to September 30, 2010, compared to the Standard & Poor's 500 Index (S&P 500)3and the S&P 500 Inverse Daily Index (S&P 500 Inverse).3
| Average Annual Total Returns4 for the Period Ended 9/30/2010 | |
| 1 Year | -12.92% |
| 5 Years | 2.79% |
| 10 Years | 6.39% |
Performance data quoted represents past performance which is no guarantee of future results. Investment return and principal value will fluctuate so that an investor's shares, when redeemed, may be worth more or less than their original cost. Mutual fund performance changes over time and current performance may be lower or higher than what is stated. For current to the most recent month-end performance and after-tax returns, visit FederatedInvestors.com or call 1-800-341-7400. Returns shown do not reflect the deduction of taxes that a shareholder would pay on Fund distributions or the redemption of Fund shares. Mutual funds are not obligations of or guaranteed by any bank and are not federally insured. Total returns shown include the maximum contingent deferred sales charge of 1.00%, as applicable.
| 1 | Federated Prudent Bear Fund is the successor to Prudent Bear Fund pursuant to a reorganization that took place on December 5, 2008. The information presented above, for the periods prior to December 5, 2008, is historical information for the Class C Shares of the Prudent Bear Fund. |
| 2 | Represents a hypothetical investment of $10,000 in the Fund. A 1.00% contingent deferred sales charge would be applied on any redemption less than one year from the purchase date. The Fund's performance assumes the reinvestment of all dividends and distributions. The S&P 500 and S&P 500 Inverse have been adjusted to reflect reinvestment of dividends on securities in the indexes. |
| 3 | The S&P 500 and the S&P 500 Inverse are not adjusted to reflect taxes, sales charges, expenses or other fees that the SEC requires to be reflected in the Fund's performance. The S&P 500 and the S&P 500 Inverse are unmanaged and, unlike the Fund, are not affected by cash flows. It is not possible to invest directly in an index. |
| 4 | Total returns quoted reflect all applicable contingent deferred sales charges. |
Annual Shareholder Report10
Portfolio of Investments Summary Tables (unaudited)
At September 30, 2010, the Fund's portfolio composition was as follows:
| Percentage of
Total Net Assets |
| Securities Sold Short | (22.9)% |
| Derivative Contracts — Short (notional value)1 | (53.9)% |
| U.S. Treasury Securities | 53.7% |
| U.S. Treasury Securities Held as Collateral for Securities Sold Short | 32.1% |
| Common Stock | 7.1% |
| Other Securities2,3 | 0.0% |
| Cash Equivalents4 | 6.5% |
| Adjustment for Derivative Contracts (notional value)1 | 52.1% |
| Collateral on Deposit for Securities Sold Short | 26.3% |
| Other Assets and Liabilities — Net5 | (1.0)% |
| TOTAL | 100.0% |
| 1 | Derivative contracts may consist of futures, forwards, options and swaps. More complete information regarding the Fund's direct investments in derivative contracts, including unrealized appreciation (depreciation), value and notional values or amounts of such contracts, can be found in the table at the end of the Portfolio of Investments included in this Report. |
| 2 | Other Securities include warrants and purchased put options. |
| 3 | Represents less than 0.1%. |
| 4 | Cash Equivalents include any investments in money market mutual funds and/or overnight repurchase agreements. |
| 5 | Assets, other than investments in securities, securities sold short, derivative contracts and collateral on deposit for securities sold short, less liabilities. See Statement of Assets and Liabilities. |
Annual Shareholder Report11
At September 30, 2010, the Fund's sector composition6 for its short positions was as follows:| Sector Composition | Percentage of
Total Securities
Sold Short7 |
| Broad Equity Index | 70.2% |
| Consumer Staples | 6.8% |
| Health Care | 6.5% |
| Consumer Discretionary | 6.4% |
| Information Technology | 5.4% |
| Industrials | 2.8% |
| Financials | 0.7% |
| Materials | 0.7% |
| Other8 | 0.5% |
| TOTAL | 100.0% |
| 6 | Sector classifications are based upon, and individual portfolio securities are assigned to, the classifications of the Global Industry Classification Standard (GICS) except that the adviser assigns a classification to securities not classified by the GICS and to securities for which the adviser does not have access to the classification made by the GICS. |
| 7 | Includes any short positions on futures contracts. |
| 8 | Other includes exchange-traded funds. |
Annual Shareholder Report12
Portfolio of Investments
September 30, 2010
| Shares, Principal Amount or Units Held | | | Value |
| | COMMON STOCKS – 7.1% | |
| | Energy – 0.3% | |
| 675,000 | 1 | Bankers Petroleum Ltd. | 5,333,609 |
| | Materials – 6.8% | |
| 3,500,000 | 1 | Abacus Mining & Exploration Corp. | 646,321 |
| 77,400 | | Agnico Eagle Mines Ltd. | 5,497,722 |
| 1,900,000 | 1 | Ampella Mining Ltd. | 4,798,526 |
| 1,282,000 | 1 | Antares Minerals, Inc. | 5,295,461 |
| 75,000 | | Barrick Gold Corp. | 3,471,750 |
| 30,430 | 1 | Bassari Resources Ltd. | 7,348 |
| 3,000,000 | 1 | Benton Resources Corp. | 1,982,700 |
| 1,000,000 | 1 | Callinan Mines Ltd. | 1,798,037 |
| 2,975,000 | 1 | Centamin Egypt Ltd. | 8,153,854 |
| 137,300 | | Cia de Minas Buenaventura SA, Class B, ADR | 6,203,214 |
| 175,000 | 1 | Corvus Gold, Inc. | 144,572 |
| 549,998 | 1 | East Asia Minerals Corp. | 2,945,368 |
| 150,000 | 1,2,3 | East Asia Minerals Corp. | 803,285 |
| 950,000 | 1,2,3 | Evolving Gold Corp. | 784,819 |
| 1,900,000 | 1 | Fortuna Silver Mines, Inc. | 5,909,223 |
| 530,000 | 1,2,3 | Fortuna Silver Mines, Inc. | 1,648,362 |
| 1,750,000 | 1 | Franconia Minerals Corp. | 918,457 |
| 112,100 | | Goldcorp, Inc., Class A | 4,878,592 |
| 175,000 | 1 | Golden Predator Corp. | 115,658 |
| 200,000 | 1 | Gryphon Minerals, Ltd. | 280,248 |
| 230,925 | 1 | Imperial Metals Corp. | 5,130,669 |
| 350,000 | 1 | International Tower Hill Mines Ltd. | 2,194,091 |
| 538,000 | 1 | Kirkland Lake Gold, Inc. | 4,533,444 |
| 1,441,500 | 1 | Lake Shore Gold Corp. | 5,043,639 |
| 1,500,000 | 1,4 | MacArthur Minerals Ltd. | 2,551,268 |
| 2,800,000 | 1 | Magma Metals Ltd. | 1,739,759 |
| 1,000,000 | 1 | Mansfield Minerals, Inc. | 1,623,093 |
| 885,000 | 1 | Medusa Mining Ltd. | 4,151,123 |
| 2,500,000 | 1 | Minera Andes, Inc. | 3,960,540 |
| 300,000 | 1 | Mountain Province Diamonds, Inc. | 1,352,901 |
| 72,600 | | Newmont Mining Corp. | 4,560,006 |
Annual Shareholder Report13
| Shares, Principal Amount or Units Held | | | Value |
| 655,000 | 1 | Osisko Exploration Ltd. | 9,326,222 |
| 2,000,000 | 1 | Perseus Mining Ltd. | 5,567,239 |
| 153,000 | 1 | Radius Gold, Inc. | 104,092 |
| 39,100 | | Randgold Resources Ltd., ADR | 3,967,086 |
| 1,000,000 | 1 | Richfield Ventures Corp. | 2,721,353 |
| 1,800,000 | 1 | Rockgate Capital Corp. | 1,329,574 |
| 63,500 | | Royal Gold, Inc. | 3,164,840 |
| 350,002 | 1 | Silver Wheaton Corp. | 9,320,709 |
| 800,000 | 1 | Trevali Resources Corp. | 1,088,541 |
| 477,000 | | Yamana Gold, Inc. | 5,437,800 |
| | TOTAL | 135,151,506 |
| | TOTAL COMMON STOCKS
(IDENTIFIED COST $93,297,822) | 140,485,115 |
| | WARRANTS – 0.0% | |
| | Industrials – 0.0% | |
| 105,990 | 1 | Aura Systems, Inc., Warrants | 39 |
| | Materials – 0.0% | |
| 43,500 | 1 | Chesapeake Gold Corp., Warrants | 116,034 |
| 1,050,000 | 1 | EMC Metals Corp., Warrants | 5,627 |
| 262,500 | 1 | Golden Predator Corp., Warrants | 0 |
| 412,500 | 1 | Kootenay Gold, Inc., Warrants | 55,582 |
| 250,000 | 1 | Kootenay Gold, Inc., Warrants | 147 |
| 15,625 | 1 | Pan American Silver Corp., Warrants | 145,041 |
| 56,472 | 1 | Pan American Silver Corp., Warrants | 435,792 |
| | TOTAL | 758,223 |
| | TOTAL WARRANTS
(IDENTIFIED COST $585,824) | 758,262 |
| | Purchased PUT Options – 0.0% | |
| 6,000 | 1 | iShares Barclays 20+ Year Treasury Bond Fund, Price $95, Expiration Date 12/18/2010 (IDENTIFIED COST $1,636,800) | 318,000 |
| | U.S. Treasury – 85.8%;5 | |
| | U.S. Treasury Bills – 85.8% | |
| $125,000,000 | | United States Treasury Bill, 0.09%, 10/7/2010 | 124,997,400 |
| 175,000,000 | 6 | United States Treasury Bill, 0.115%, 10/21/2010 | 174,987,243 |
| 108,000,000 | | United States Treasury Bill, 0.08%, 10/28/2010 | 107,988,660 |
| 439,000,000 | | United States Treasury Bill, 0.135%, 11/4/2010 | 438,945,564 |
| 466,000,000 | 6 | United States Treasury Bill, 0.145%, 11/12/2010 | 465,931,358 |
Annual Shareholder Report14
| Shares, Principal Amount or Units Held | | | Value |
| $250,000,000 | | United States Treasury Bill, 0.13%, 11/26/2010 | 249,942,650 |
| 150,000,000 | | United States Treasury Bill, 0.135%, 12/9/2010 | 149,961,900 |
| | TOTAL U.S. TREASURY
(IDENTIFIED COST $1,712,728,739) | 1,712,754,775 |
| | MUTUAL FUND – 6.5% | |
| 128,957,391 | 4,7 | Federated U.S. Treasury Cash Reserves, Institutional Shares, 0.00% (AT NET ASSET VALUE) | 128,957,391 |
| | TOTAL INVESTMENTS — 99.4%
(IDENTIFIED COST $1,937,206,576)8 | 1,983,273,543 |
| | OTHER ASSETS AND LIABILITIES - NET — 0.6%9 | 12,463,695 |
| | TOTAL NET ASSETS — 100% | $1,995,737,238 |
SCHEDULE OF SECURITIES SOLD SHORT
| Shares | | | Value |
| 100,000 | | Abercrombie & Fitch Co., Class A | $3,932,000 |
| 140,000 | | Advanced Micro Devices, Inc. | 995,400 |
| 60,000 | | Agilent Technologies, Inc. | 2,002,200 |
| 95,000 | | Altera Corp. | 2,865,200 |
| 345,000 | | AmerisourceBergen Corp. | 10,577,700 |
| 790,000 | | Amex Financial Select Standard & Poor Depository Receipt | 11,336,500 |
| 80,000 | | Amphenol Corp., Class A | 3,918,400 |
| 75,000 | | Analog Devices, Inc. | 2,353,500 |
| 95,000 | | ASML Holding N.V., ADR | 2,824,350 |
| 250,000 | | Au Optronics Corp., Class ADR, ADR | 2,615,000 |
| 35,000 | | Autoliv, Inc. | 2,286,550 |
| 133,000 | | Bard C.R., Inc. | 10,830,190 |
| 85,000 | | Baxter International, Inc. | 4,055,350 |
| 55,000 | | BorgWarner, Inc. | 2,894,100 |
| 292,000 | | Campbell Soup Co. | 10,439,000 |
| 155,000 | | Colgate-Palmolive Co. | 11,913,300 |
| 985,000 | | ConAgra Foods, Inc. | 21,610,900 |
| 130,000 | | Corning, Inc. | 2,376,400 |
| 90,000 | | DeVRY, Inc. | 4,428,900 |
| 160,000 | | Dick's Sporting Goods, Inc. | 4,486,400 |
| 80,000 | | Education Management Corp. | 1,174,400 |
| 45,000 | | EMC Corp. | 913,950 |
Annual Shareholder Report15
| Shares | | | Value |
| 160,000 | | Estee Lauder Cos., Inc., Class A | $10,116,800 |
| 340,000 | | Express Scripts, Inc., Class A | 16,558,000 |
| 150,000 | | Fairchild Semiconductor International, Inc., Class A | 1,410,000 |
| 390,000 | | Flextronics International Ltd. | 2,355,600 |
| 355,000 | | Genuine Parts Co. | 15,829,450 |
| 160,000 | | Hanesbrands, Inc. | 4,137,600 |
| 53,000 | | Intuitive Surgical, Inc. | 15,038,220 |
| 130,000 | | Jabil Circuit, Inc. | 1,873,300 |
| 30,000 | | Juniper Networks, Inc. | 910,500 |
| 410,000 | | Kellogg Co. | 20,709,100 |
| 70,000 | | KLA-Tencor Corp. | 2,466,100 |
| 125,000 | | Kraft Foods, Inc., Class A | 3,857,500 |
| 205,000 | | L-3 Communications Holdings, Inc. | 14,815,350 |
| 55,000 | | Lam Research Corp. | 2,301,750 |
| 163,000 | | LG Display Co. Ltd., ADR | 2,842,720 |
| 485,000 | | Lowe's Cos., Inc. | 10,810,650 |
| 50,000 | | Marvell Technology Group Ltd. | 875,500 |
| 185,000 | | Maxim Integrated Products, Inc. | 3,424,350 |
| 165,000 | | McKesson HBOC, Inc. | 10,193,700 |
| 405,000 | | Medco Health Solutions, Inc. | 21,084,300 |
| 27,000 | | Microchip Technology, Inc. | 849,150 |
| 160,000 | | Molex, Inc. | 3,348,800 |
| 770,000 | | Nokia Oyj, Class A, ADR | 7,723,100 |
| 57,000 | | Nordson Corp. | 4,200,330 |
| 90,000 | | Novellus Systems, Inc. | 2,392,200 |
| 130,000 | | ON Semiconductor Corp. | 937,300 |
| 145,000 | | Owens Corning, Inc. | 3,716,350 |
| 340,000 | | Procter & Gamble Co. | 20,389,800 |
| 75,000 | | Sanmina-SCI Corp. | 906,000 |
| 135,000 | | Sherwin-Williams Co. | 10,143,900 |
| 175,000 | | SPDR S&P Retail ETF | 7,313,250 |
| 780,000 | | Staples, Inc. | 16,317,600 |
| 410,000 | | Starbucks Corp. | 10,487,800 |
| 330,000 | | STMicroelectronics N.V., ADR | 2,517,900 |
| 215,000 | | Stryker Corp. | 10,760,750 |
| 140,000 | | Telefonaktiebolaget LM Ericsson, ADR | 1,535,800 |
| 200,000 | | Teradyne, Inc. | 2,228,000 |
| 50,000 | | Texas Instruments, Inc. | 1,357,000 |
| 45,000 | | TRW Automotive Holdings Corp. | 1,870,200 |
| 320,000 | | Urban Outfitters, Inc. | 10,060,800 |
| 65,000 | | Visa, Inc., Class A | 4,826,900 |
Annual Shareholder Report16
| Shares | | | Value |
| 570,000 | | Waste Management, Inc. | $20,371,800 |
| 685,000 | | Western Union Co. | 12,103,950 |
| 125,000 | | Whirlpool Corp. | 10,120,000 |
| 125,000 | | Whole Foods Market, Inc. | 4,638,750 |
| 110,000 | | Xilinx, Inc. | 2,927,100 |
| | TOTAL SECURITIES SOLD SHORT
(PROCEEDS $433,800,398) | $456,484,710 |
At September 30, 2010, the Fund had the following outstanding futures contracts:
| Description | Number of
Contracts | Notional Value | Expiration Date | Unrealized
Depreciation |
| 1NASDAQ 100 Index Short Futures | 300 | $59,865,000 | December 2010 | $(3,617,700) |
| 1Russell 2000 Mini Index Short Futures | 950 | $64,077,500 | December 2010 | $(4,016,125) |
| 1S&P 500 Index Short Futures | 3,350 | $951,986,250 | December 2010 | $(29,238,267) |
| UNREALIZED DEPRECIATION ON FUTURES CONTRACTS | $(36,872,092) |
At September 30, 2010, the Fund had the following outstanding foreign exchange contracts:
| Settlement Date | Foreign
Currency
Units to
Deliver/Receive | In
Exchange
For | Unrealized
Appreciation/
(Depreciation) |
| Contracts Purchased: |
| 10/4/2010 | 1,707,606 Canadian Dollar | $1,657,066 | $2,577 |
| Contracts Sold: |
| 10/1/2010 | 91,000 Canadian Dollar | $87,999 | $(445) |
| 10/4/2010 | 3,858,885 Canadian Dollar | $3,744,672 | $(5,823) |
| NET UNREALIZED DEPRECIATION ON FOREIGN EXCHANGE CONTRACTS | $(3,691) |
Net Unrealized Appreciation/Depreciation on Futures Contracts, Foreign Exchange Contracts and Value of Securities Sold Short are included in “Other Assets and Liabilities — Net.”
| 1 | Non-income producing security. |
| 2 | Denotes a restricted security that either: (a) cannot be offered for public sale without first being registered, or being able to take advantage of an exemption from registration, under the Securities Act of 1933; or (b) is subject to a contractual restriction on public sales. At September 30, 2010, these restricted securities amounted to $3,236,466, which represented 0.2% of total net assets. |
| 3 | Denotes a restricted security that may be resold without restriction to “qualified institutional buyers” as defined in Rule 144A under the Securities Act of 1933 and that the Fund has determined to be liquid under criteria established by the Fund's Board of Trustees (the “Trustees”). At September 30, 2010, these liquid restricted securities amounted to $3,236,466, which represented 0.2% of total net assets. |
| 4 | Affiliated companies. |
| 5 | Discount rate at time of purchase. |
| 6 | Pledged as collateral to ensure the Fund is able to satisfy the obligations of its outstanding futures contracts. |
| 7 | 7-Day net yield. |
Annual Shareholder Report17
| 8 | The cost of investments for federal tax purposes amounts to $1,950,589,091. |
| 9 | Assets, other than investments in securities, less liabilities. See Statement of Assets and Liabilities. |
Note: The categories of investments are shown as a percentage of total net assets at September 30, 2010.
Various inputs are used in determining the value of the Fund's investments. These inputs are summarized in the three broad levels listed below:
Level 1 — quoted prices in active markets for identical securities
Level 2 — other significant observable inputs (including quoted prices for similar securities, interest rates, prepayment speeds, credit risk, etc.)
Level 3 — significant unobservable inputs (including the Fund's own assumptions in determining the fair value of investments)
The inputs or methodology used for valuing securities are not an indication of the risk associated with investing in those securities.
The following is a summary of the inputs used, as of September 30, 2010, in valuing the Fund's assets carried at fair value:
| Valuation Inputs | | | | |
| Level 1 -
Quoted
Prices and
Investments in
Mutual Funds | Level 2 -
Other
Significant
Observable
Inputs | Level 3 -
Significant
Unobservable
Inputs | Total |
| Equity Securities: | | | | |
| Common Stocks | | | | |
| Domestic | $7,724,846 | $ — | $ — | $7,724,846 |
| International | 116,216,025 | 16,544,244 | — | 132,760,269 |
| Warrants | — | 758,262 | — | 758,262 |
| Purchased Put Options | 318,000 | — | — | 318,000 |
| Debt Securities: | | | | |
| U.S. Treasury | — | 1,712,754,775 | — | 1,712,754,775 |
| Mutual Fund | 128,957,391 | — | — | 128,957,391 |
| TOTAL SECURITIES | $253,216,262 | $1,730,057,281 | $ — | $1,983,273,543 |
| OTHER FINANCIAL INSTRUMENTS* | $(493,360,493) | $ — | $ — | $(493,360,493) |
| * | Other financial instruments include securities sold short, futures contracts and foreign exchange contracts. |
The following acronym is used throughout this portfolio:
| ADR | — American Depositary Receipt |
See Notes which are an integral part of the Financial Statements
Annual Shareholder Report18
Statement of Assets and Liabilities
September 30, 2010
| Assets: | | |
| Total investments in securities, at value including $131,508,659 of investments in affiliated issuers (Note 5) (identified cost $1,937,206,576) | | $1,983,273,543 |
| Cash denominated in foreign currencies (identified cost $13,051) | | 13,068 |
| Deposit at broker for short sales | | 524,071,034 |
| Income receivable | | 154,059 |
| Receivable for investments sold | | 9,413,628 |
| Receivable for shares sold | | 15,100,939 |
| Receivable for foreign exchange contracts | | 2,577 |
| Receivable for daily variation margin | | 4,001,130 |
| TOTAL ASSETS | | 2,536,029,978 |
| Liabilities: | | |
| Securities sold short, at value (proceeds $433,800,398) | $456,484,710 | |
| Dividends payable on short positions | 630,788 | |
| Payable for investments purchased | 74,467,232 | |
| Payable for shares redeemed | 7,633,019 | |
| Payable for foreign exchange contracts | 6,268 | |
| Payable for distribution services fee (Note 5) | 171,314 | |
| Payable for shareholder services fee (Note 5) | 570,688 | |
| Accrued expenses | 328,721 | |
| TOTAL LIABILITIES | | 540,292,740 |
| Net assets for 394,245,242 shares outstanding | | $1,995,737,238 |
| Net Assets Consist of: | | |
| Paid-in capital | | $2,358,674,562 |
| Net unrealized depreciation of investments, short sales, futures contracts and translation of assets and liabilities in foreign currency | | (13,489,946) |
| Accumulated net realized loss on investments, short sales, futures contracts and foreign currency transactions | | (342,009,723) |
| Distributions in excess of net investment income/Accumulated net investment income (loss) | | (7,437,655) |
| TOTAL NET ASSETS | | $1,995,737,238 |
Annual Shareholder Report19
Statement of Assets and Liabilities — continued| Net Asset Value, Offering Price and Redemption Proceeds Per Share | | |
| Class A Shares: | | |
| Net asset value per share ($1,212,330,811 ÷ 238,133,836 shares outstanding), no par value, unlimited shares authorized | | $5.09 |
| Offering price per share (100/94.50 of $5.09) | | $5.39 |
| Redemption proceeds per share | | $5.09 |
| Class C Shares: | | |
| Net asset value per share ($197,495,170 ÷ 41,550,065 shares outstanding), no par value, unlimited shares authorized | | $4.75 |
| Offering price per share | | $4.75 |
| Redemption proceeds per share (99.00/100 of $4.75) | | $4.70 |
| Institutional Shares: | | |
| Net asset value per share ($585,911,257 ÷ 114,561,341 shares outstanding), no par value, unlimited shares authorized | | $5.11 |
| Offering price per share | | $5.11 |
| Redemption proceeds per share | | $5.11 |
See Notes which are an integral part of the Financial Statements
Annual Shareholder Report20
Statement of Operations
Year Ended September 30, 2010
| Investment Income: | | | |
| Dividends (including $4,781 received from affiliated issuers (Note 5) and net of foreign taxes withheld of $36,134) | | | $319,129 |
| Interest | | | 1,670,347 |
| TOTAL INCOME | | | 1,989,476 |
| Expenses: | | | |
| Investment adviser fee (Note 5) | | $21,031,852 | |
| Administrative personnel and services fee (Note 5) | | 1,312,782 | |
| Custodian fees | | 67,216 | |
| Transfer and dividend disbursing agent fees and expenses | | 1,844,695 | |
| Directors'/Trustees' fees | | 10,575 | |
| Auditing fees | | 38,450 | |
| Legal fees | | 4,700 | |
| Portfolio accounting fees | | 180,058 | |
| Distribution services fee — Class C Shares (Note 5) | | 1,093,783 | |
| Shareholder services fee — Class A Shares (Note 5) | | 3,157,642 | |
| Shareholder services fee — Class C Shares (Note 5) | | 361,284 | |
| Share registration costs | | 240,922 | |
| Printing and postage | | 198,237 | |
| Insurance premiums | | 6,650 | |
| Dividends and other expenses related to short sales | | 11,671,850 | |
| Miscellaneous | | 4,002 | |
| TOTAL EXPENSES | | 41,224,698 | |
Annual Shareholder Report21
Statement of Operations — continued| Reimbursement, Waiver and Reduction: | | | |
| Reimbursement of investment adviser fee (Note 5) | $(85,019) | | |
| Waiver of administrative personnel and services fee (Note 5) | (32,363) | | |
| Fees paid indirectly from directed brokerage arrangements (Note 6) | (51,700) | | |
| TOTAL REIMBURSEMENT, WAIVER AND REDUCTION | | $(169,082) | |
| Net expenses | | | $41,055,616 |
| Net investment income (loss) | | | (39,066,140) |
| Realized and Unrealized Gain (Loss) on Investments, Short Sales, Futures Contracts and Foreign Currency Transactions: | | | |
| Net realized gain on investments and foreign currency transactions (includes realized loss of $6,088,008 on sales of investments in affiliated issuers (Note 5)) | | | 26,447,254 |
| Net realized loss on short sales | | | (228,869,021) |
| Net realized loss on futures contracts | | | (49,810,033) |
| Net change in unrealized appreciation of investments and translation of assets and liabilities in foreign currency | | | 40,014,117 |
| Net change in unrealized depreciation of short sales | | | 55,190,490 |
| Net change in unrealized depreciation of futures contracts | | | (34,748,895) |
| Net realized and unrealized loss on investments, short sales, futures contracts and foreign currency transactions | | | (191,776,088) |
| Change in net assets resulting from operations | | | $(230,842,228) |
See Notes which are an integral part of the Financial Statements
Annual Shareholder Report22
Statement of Changes in Net Assets
| Year Ended September 30 | 2010 | 2009 |
| Increase (Decrease) in Net Assets | | |
| Operations: | | |
| Net investment income (loss) | $(39,066,140) | $(25,301,822) |
| Net realized gain (loss) on investments, short sales, futures contracts and foreign currency transactions | (252,231,800) | 124,885,764 |
| Net change in unrealized appreciation/depreciation of investments, short sales, futures contracts and translation of assets and liabilities in foreign currency | 60,455,712 | (90,489,372) |
| CHANGE IN NET ASSETS RESULTING FROM OPERATIONS | (230,842,228) | 9,094,570 |
| Distributions to Shareholders: | | |
| Distributions from net realized gain on investments, short sales, futures contracts and foreign currency transactions | | |
| Class A Shares | — | (173,510,350) |
| Class C Shares | — | (10,042,019) |
| Return of capital | | |
| Class A Shares | — | (1,818,702) |
| Class C Shares | — | (105,258) |
| CHANGE IN NET ASSETS RESULTING FROM DISTRIBUTIONS TO SHAREHOLDERS | — | (185,476,329) |
| Share Transactions: | | |
| Proceeds from sale of shares | 2,460,332,069 | 1,467,215,872 |
| Net asset value of shares issued to shareholders in payment of distributions declared | — | 169,504,332 |
| Cost of shares redeemed | (1,508,145,275) | (1,306,118,568) |
| CHANGE IN NET ASSETS RESULTING FROM SHARE TRANSACTIONS | 952,186,794 | 330,601,636 |
| Change in net assets | 721,344,566 | 154,219,877 |
| Net Assets: | | |
| Beginning of period | 1,274,392,672 | 1,120,172,795 |
| End of period (including distributions in excess of net investment income/accumulated net investment income (loss) of $(7,437,655) for the year ended September 30, 2010 and distributions in excess of net investment income of $(2,433,255) for the year ended September 30, 2009) | $1,995,737,238 | $1,274,392,672 |
See Notes which are an integral part of the Financial Statements
Annual Shareholder Report23
Notes to Financial Statements
September 30, 2010
1. ORGANIZATION
Federated Equity Funds (the “Trust”), is registered under the Investment Company Act of 1940, as amended (the “Act”), as a diversified, open-end management investment company. The Trust consists of 12 portfolios. The financial statements included herein are only those of the Federated Prudent Bear Fund (the “Fund”). The financial statements of the other portfolios are presented separately. The assets of each portfolio are segregated and a shareholder's interest is limited to the portfolio in which shares are held. Each portfolio pays its own expenses. The Fund offers three classes of shares: Class A Shares, Class C Shares and Institutional Shares. All shares of the Fund have equal rights with respect to voting, except on class-specific matters. The financial highlights of the Institutional Shares are presented separately. The investment objective of the Fund is to seek capital appreciation.
Prudent Bear Fund (the “Predecessor Fund”) was reorganized into the Fund as of the close of business on December 5, 2008. Prior to the reorganization, the Fund had no investment operations.
The Fund commenced offering Institutional Shares on December 8, 2008.
2. SIGNIFICANT ACCOUNTING POLICIES
The following is a summary of significant accounting policies consistently followed by the Fund in the preparation of its financial statements. These policies are in conformity with U.S. generally accepted accounting principles (GAAP).
Investment Valuation
In calculating its net asset value (NAV), the Fund generally values investments as follows:
- Equity securities including shares of exchange-traded funds listed on an exchange or traded through a regulated market system are valued at their last reported sale price or official closing price in their principal exchange or market.
- Fixed-income securities acquired with remaining maturities greater than 60 days are fair valued using price evaluations provided by a pricing service approved by the Trustees.
- Fixed-income securities acquired with remaining maturities of 60 days or less are valued at their cost (adjusted for the accretion of any discount or amortization of any premium).
- Shares of other mutual funds are valued based upon their reported NAVs.
- Derivative contracts listed on exchanges are valued at their reported settlement or closing price.
- Over-the-counter (OTC) derivative contracts are fair valued using price evaluations provided by a pricing service approved by the Trustees.
If the Fund cannot obtain a price or price evaluation from a pricing service for an investment, the Fund may attempt to value the investment based upon the mean of bid and asked quotations or fair value the investment based on price evaluations, from one or more dealers. If any price, quotation, price evaluation or other pricing source is not readily available when the NAV is calculated, the Fund uses the fair value of the investment determined in accordance with the procedures described below. There can be no assurance that the Fund could purchase or sell an investment at the price used to calculate the Fund's NAV.
Annual Shareholder Report24
Fair Valuation and Significant Events ProceduresThe Trustees have authorized the use of pricing services to provide evaluations of the current fair value of certain investments for purposes of calculating the NAV. Factors considered by pricing services in evaluating an investment include the yields or prices of investments of comparable quality, coupon, maturity, call rights and other potential prepayments, terms and type, reported transactions, indications as to values from dealers and general market conditions. Some pricing services provide a single price evaluation reflecting the bid-side of the market for an investment (a “bid” evaluation). Other pricing services offer both bid evaluations and price evaluations indicative of a price between the prices bid and asked for the investment (a “mid” evaluation). The Fund normally uses bid evaluations for U.S. Treasury and Agency securities, mortgage-backed securities and municipal securities. The Fund normally uses mid evaluations for other types of fixed-income securities and OTC derivative contracts. In the event that market quotations and price evaluations are not available for an investment, the fair value of the investment is determined in accordance with procedures adopted by the Trustees.
The Trustees also have adopted procedures requiring an investment to be priced at its fair value whenever the Adviser determines that a significant event affecting the value of the investment has occurred between the time as of which the price of the investment would otherwise be determined and the time as of which the NAV is computed. An event is considered significant if there is both an affirmative expectation that the investment's value will change in response to the event and a reasonable basis for quantifying the resulting change in value. Examples of significant events that may occur after the close of the principal market on which a security is traded, or after the time of a price evaluation provided by a pricing service or a dealer, include:
- With respect to securities traded in foreign markets, significant trends in U.S. equity markets or in the trading of foreign securities index futures or options contracts;
- With respect to price evaluations of fixed-income securities determined before the close of regular trading on the NYSE, actions by the Federal Reserve Open Market Committee and other significant trends in U.S. fixed-income markets;
- Political or other developments affecting the economy or markets in which an issuer conducts its operations or its securities are traded; and
- Announcements concerning matters such as acquisitions, recapitalizations, litigation developments, a natural disaster affecting the issuer's operations or regulatory changes or market developments affecting the issuer's industry.
The Trustees have approved the use of a pricing service to determine the fair value of equity securities traded principally in foreign markets when the Adviser determines that there has been a significant trend in the U.S. equity markets or in index futures trading. For other significant events, the Fund may seek to obtain more current quotations or price evaluations from alternative pricing sources. If a reliable alternative pricing source is not available, the Fund will determine the fair value of the investment using another method approved by the Trustees.
Repurchase Agreements
It is the policy of the Fund to require the other party to a repurchase agreement to transfer to the Fund's custodian or sub-custodian eligible securities or cash with a market value (after transaction costs) at least equal to the repurchase price to be paid under the repurchase agreement. The eligible securities are transferred to accounts with the custodian or sub-custodian in which the Fund holds a “securities entitlement” and exercises “control” as those terms are defined in the Uniform Commercial Code. The Fund has established procedures for Annual Shareholder Report25
monitoring the market value of the transferred securities and requiring the transfer of additional eligible securities if necessary to equal at least the repurchase price. These procedures also allow the other party to require securities to be transferred from the account to the extent that their market value exceeds the repurchase price or in exchange for other eligible securities of equivalent market value.The insolvency of the other party or other failure to repurchase the securities may delay the disposition of the underlying securities or cause the Fund to receive less than the full repurchase price. Under the terms of the repurchase agreement, any amounts received by the Fund in excess of the repurchase price and related transaction costs must be remitted to the other party.
The Fund may enter into repurchase agreements in which eligible securities are transferred into joint trading accounts maintained by the custodian or sub-custodian for investment companies and other clients advised by the Fund's Adviser and its affiliates. The Fund will participate on a pro rata basis with the other investment companies and clients in its share of the securities transferred under such repurchase agreements and in its share of proceeds from any repurchase or other disposition of such securities.
Investment Income, Gains and Losses, Expenses and Distributions
Investment transactions are accounted for on a trade-date basis. Realized gains and losses from investment transactions are recorded on an identified-cost basis. Interest income and expenses are accrued daily. Dividend income and distributions to shareholders are recorded on the ex-dividend date. Foreign dividends are recorded on the ex-dividend date or when the Fund is informed of the ex-dividend date. Distributions of net investment income, if any, are declared and paid annually. Non-cash dividends included in dividend income, if any, are recorded at fair value. Investment income, realized and unrealized gains and losses and certain fund-level expenses are allocated to each class based on relative average daily net assets, except that each class may bear certain expenses unique to that class such as distribution services and shareholder services fees. Dividends are declared separately for each class. No class has preferential dividend rights; differences in per share dividend rates are generally due to differences in separate class expenses.
Premium and Discount Amortization
All premiums and discounts on fixed-income securities are amortized/accreted for financial statement purposes.
Federal Taxes
It is the Fund's policy to comply with the Subchapter M provision of the Internal Revenue Code (the “Code”) and to distribute to shareholders each year substantially all of its income. Accordingly, no provision for federal income tax is necessary. As of and during the year ended September 30, 2010, the Fund did not have a liability for any uncertain tax positions. The Fund recognizes interest and penalties, if any, related to tax liabilities as income tax expense in the Statement of Operations. As of September 30, 2010, the following tax years remain subject to examination by the Fund's major tax jurisdictions, which include the United States of America (2007 through 2010) and the state of Maryland (2007 and 2008) and the Commonwealth of Massachusetts (2009 and 2010).
The Fund may be subject to taxes imposed by governments of countries in which it invests. Such taxes are generally based on either income or gains earned or repatriated. The Fund accrues and applies such taxes to net investment income, net realized gains and net unrealized gains as income and/or gains are earned.
Annual Shareholder Report26
When-Issued and Delayed Delivery TransactionsThe Fund may engage in when-issued or delayed delivery transactions. The Fund records when-issued securities on the trade date and maintains security positions such that sufficient liquid assets will be available to make payment for the securities purchased. Securities purchased on a when-issued or delayed delivery basis are marked to market daily and begin earning interest on the settlement date. Losses may occur on these transactions due to changes in market conditions or the failure of counterparties to perform under the contract.
Futures Contracts
The Fund purchases and sells financial futures contracts to manage cash flows, enhance yield, manage duration and to potentially reduce transaction costs. Upon entering into a financial futures contract with a broker, the Fund is required to deposit in a segregated account a specified amount of cash or U.S. government securities. Futures contracts are valued daily and unrealized gains or losses are recorded in a “variation margin” account. Daily, the Fund receives from or pays to the broker a specified amount of cash based upon changes in the variation margin account. When a contract is closed, the Fund recognizes a realized gain or loss. Futures contracts have market risks, including the risk that the change in the value of the contract may not correlate with the changes in the value of the underlying securities. There is minimal counterparty risk to the Fund since futures are exchange traded and the exchange's clearinghouse, as counterparty to all exchange-traded futures, guarantees the futures against default.
Futures contracts outstanding at period end are listed after the Fund's Portfolio of Investments.
Foreign Exchange Contracts
The Fund may enter into foreign exchange contracts for the delayed delivery of securities or foreign currency exchange transactions. The Fund may enter into foreign exchange contracts to protect assets against adverse changes in foreign currency exchange rates or exchange control regulations. Purchased contracts are used to acquire exposure to foreign currencies, whereas contracts to sell are used to hedge the Fund's securities against currency fluctuations. Risks may arise upon entering into these transactions from the potential inability of counterparties to meet the terms of their commitments and from unanticipated movements in security prices or foreign exchange rates. The foreign exchange contracts are adjusted by the daily exchange rate of the underlying currency and any gains or losses are recorded for financial statement purposes as unrealized until the settlement date.
Foreign exchange contracts outstanding at period end are listed after the Fund's Portfolio of Investments.
Foreign Currency Translation
The accounting records of the Fund are maintained in U.S. dollars. All assets and liabilities denominated in foreign currencies (FCs) are translated into U.S. dollars based on the rates of exchange of such currencies against U.S. dollars on the date of valuation. Purchases and sales of securities, income and expenses are translated at the rate of exchange quoted on the respective date that such transactions are recorded. The Fund does not isolate that portion of the results of operations resulting from changes in foreign exchange rates on investments from the fluctuations arising from changes in market prices of securities held. Such fluctuations are included with the net realized and unrealized gain or loss from investments.
Annual Shareholder Report27
Reported net realized foreign exchange gains or losses arise from sales of portfolio securities, sales and maturities of short-term securities, sales of FCs, currency gains or losses realized between the trade and settlement dates on securities transactions, the difference between the amounts of dividends, interest and foreign withholding taxes recorded on the Fund's books and the U.S. dollar equivalent of the amounts actually received or paid. Net unrealized foreign exchange gains and losses arise from changes in the value of assets and liabilities other than investments in securities at fiscal year end, resulting from changes in the exchange rate.Short Sales
The Fund may sell a security short in an effort to take advantage of an anticipated decline the price of the security. In a short sale, the Fund sells a security it does not own, and must borrow the security in order to deliver it at completion of the sale. The Fund then has an obligation to replace the borrowed security. While the security is borrowed, the proceeds from the sale are deposited with the lender (Prime Broker). The Prime Broker charges a fee for this service. The Fund may be required to pay interest and/or the equivalent of any dividend payments paid by the security to the Prime Broker. If the Fund can buy the security back at a lower price than it sold for, a gain is realized. If the Fund has to buy the security back at a higher price, a loss is realized. For the year ended September 30, 2010, the Fund had a net realized loss on short sales of $228,869,021.
Restricted Securities
The Fund may purchase securities which are considered restricted. Restricted securities are securities that either: (a) cannot be offered for public sale without first being registered, or being able to take advantage of an exemption from registration, under the Securities Act of 1933; or (b) are subject to contractual restrictions on public sales. In some cases, when a security cannot be offered for public sale without first being registered, the issuer of the restricted security has agreed to register such securities for resale, at the issuer's expense, either upon demand by the Fund or in connection with another registered offering of the securities. Many such restricted securities may be resold in the secondary market in transactions exempt from registration. Restricted securities may be determined to be liquid under criteria established by the Trustees. The Fund will not incur any registration costs upon such resales. The Fund's restricted securities are valued at the price provided by dealers in the secondary market or, if no market prices are available, at the fair value as determined in accordance with procedures established by and under the general supervision of the Trustees.
Annual Shareholder Report28
Additional Disclosure Related to Derivative Instruments| Fair Value of Derivative Instruments |
| Asset | Liability |
| Statement of
Assets and
Liabilities
Location | Fair
Value | Statement of
Assets and
Liabilities
Location | Fair
Value |
Derivatives not accounted
for as hedging instruments
under ASC Topic 815 | | | | |
| Foreign exchange contracts | Receivable for foreign
exchange contracts | $2,577 | Payable for foreign
exchange contracts | $6,268 |
| Equity contracts | Receivable for daily
variation margin | $(36,872,092)* | — | — |
Total derivatives not
accounted for as hedging instruments under
ASC Topic 815 | | $(36,869,515) | | $6,268 |
| * | Includes cumulative depreciation of futures contracts as reported in the footnotes to the Portfolio of Investments. Only the current day's variation margin is reported within the Statement of Assets and Liabilities. |
The Effect of Derivative Instruments on the Statement of Operations for the Year Ended September 30, 2010
| Amount of Realized Gain or (Loss) on Derivatives Recognized in Income |
| Futures | Forward
Currency
Contracts | Options
Purchased | Total |
| Equity contracts | $(49,810,033) | $452 | $5,980,216 | $(43,829,365) |
| Change in Unrealized Appreciation or (Depreciation) on Derivatives Recognized in Income |
| Futures | Forward
Currency
Contracts | Options
Purchased | Total |
| Equity contracts | $(34,748,895) | $(3,691) | $(1,127,665) | $(35,880,251) |
Other
The preparation of financial statements in conformity with GAAP requires management to make estimates and assumptions that affect the amounts of assets, liabilities, expenses and revenues reported in the financial statements. Actual results could differ from those estimated.
Annual Shareholder Report29
3. SHARES OF BENEFICIAL INTERESTThe following tables summarize share activity:
| Year Ended September 30 | 2010 | 2009 |
| Class A Shares: | Shares | Amount | Shares | Amount |
| Shares sold | 285,968,180 | $1,554,891,804 | 181,643,280 | $1,239,068,201 |
| Shares issued to shareholders in payment of distributions declared | — | — | 22,521,701 | 159,903,968 |
| Shares redeemed | (235,697,656) | (1,245,584,477) | (170,901,800) | (1,222,208,200) |
NET CHANGE RESULTING
FROM CLASS A SHARE TRANSACTIONS | 50,270,524 | $309,307,327 | 33,263,181 | $176,763,969 |
| Year Ended September 30 | 2010 | 2009 |
| Class C Shares: | Shares | Amount | Shares | Amount |
| Shares sold | 33,642,033 | $170,008,422 | 15,576,712 | $95,640,248 |
| Shares issued to shareholders in payment of distributions declared | — | — | 1,428,625 | 9,600,364 |
| Shares redeemed | (9,951,764) | (49,491,557) | (9,234,650) | (63,425,320) |
NET CHANGE RESULTING
FROM CLASS C SHARE TRANSACTIONS | 23,690,269 | $120,516,865 | 7,770,687 | $41,815,292 |
| Year Ended
9/30/2010 | Period Ended
9/30/20091 |
| Institutional Shares: | Shares | Amount | Shares | Amount |
| Shares sold | 137,773,705 | $735,431,843 | 20,490,104 | $132,507,423 |
| Shares redeemed | (40,353,512) | (213,069,241) | (3,348,956) | (20,485,048) |
NET CHANGE RESULTING
FROM INSTITUTIONAL SHARE TRANSACTIONS | 97,420,193 | $522,362,602 | 17,141,148 | $112,022,375 |
NET CHANGE RESULTING
FROM TOTAL FUND SHARE TRANSACTIONS | 171,380,986 | $952,186,794 | 58,175,016 | $330,601,636 |
| 1 | Reflects operations for the period from December 8, 2008 (date of initial investment) to September 30, 2009. |
4. FEDERAL TAX INFORMATION
The timing and character of income and capital gain distributions are determined in accordance with income tax regulations, which may differ from GAAP. These differences are due in part to differing treatments for foreign currency transactions, dividends paid on short positions, passive foreign investment company adjustments and net operating loss.
Annual Shareholder Report30
For the year ended September 30, 2010, permanent differences identified and reclassified among the components of net assets were as follows:| Increase (Decrease) |
| Paid-In Capital | Undistributed
Net Investment
Income (Loss) | Accumulated
Net Realized
Gain (Loss) |
| $(28,820,952) | $34,061,740 | $(5,240,788) |
Net investment income (loss), net realized gains (losses) and net assets were not affected by this reclassification.
The tax character of distributions as reported on the Statement of Changes in Net Assets for the years ended September 30, 2010 and 2009, was as follows:
| 2010 | 2009 |
| Ordinary income1 | $ — | $121,757,399 |
| Long-term capital gains | $ — | $61,794,970 |
| Return of capital | $ — | $1,923,960 |
| 1 | For tax purposes, short-term capital gain distributions are considered ordinary income distributions. |
As of September 30, 2010, the components of distributable earnings on a tax basis were as follows:
| Net unrealized appreciation | $1,870,571 |
| Capital loss carryforwards and deferrals | $(364,807,895) |
The difference between book-basis and tax-basis net unrealized appreciation/depreciation is attributable in part to differing treatments for the deferral of losses on wash sales and the realization for tax purposes of unrealized gains on investments in passive foreign investment companies.
At September 30, 2010, the cost of investments for federal tax purposes was $1,950,589,091. The net unrealized appreciation of investments for federal tax purposes excluding any unrealized appreciation/depreciation resulting from changes in foreign currency exchange rates, outstanding foreign currency commitments, short sales and futures contracts was $32,684,452. This consists of net unrealized appreciation from investments for those securities having an excess of value over cost of $45,539,722 and net unrealized depreciation from investments for those securities having an excess of cost over value of $12,855,270.
At September 30, 2010, the Fund had a capital loss carryforward of $68,635,173 which will reduce the Fund's taxable income arising from future net realized gains on investments, if any, to the extent permitted by the Code and thus will reduce the amount of distributions to shareholders which would otherwise be necessary to relieve the Fund of any liability for federal income tax. Pursuant to the Code, such capital loss carryforward will expire in 2018.
Under current tax regulations, capital losses on securities transactions and foreign currency losses realized after October 31 may be deferred and treated as occurring on the first day of the following fiscal year. As of September 30, 2010, for federal income tax purposes, post-October losses of $296,108,293 on capital losses on security transactions and $64,429 on foreign currency losses were deferred to October 1, 2010.
Annual Shareholder Report31
5. INVESTMENT ADVISER FEE AND OTHER TRANSACTIONS WITH AFFILIATESInvestment Adviser Fee
Federated Equity Management Company of Pennsylvania is the Fund's investment adviser (the “Adviser”). The advisory agreement between the Fund and the Adviser provides for an annual fee equal to 1.25% of the Fund's average daily net assets. The Adviser may voluntarily choose to waive any portion of its fee. The Adviser can modify or terminate this voluntary waiver at any time at its sole discretion.
Prior to the close of business on December 5, 2008, the Predecessor Fund's investment adviser was David W. Tice & Associates, LLC. After the close of business on December 5, 2008, the Predecessor Fund was reorganized into the Fund. The annual rate did not change due to this reorganization.
Administrative Fee
Federated Administrative Services (FAS), under the Administrative Services Agreement, provides the Fund with administrative personnel and services. The fee paid to FAS is based on the average aggregate daily net assets of certain Federated funds as specified below:
| Administrative Fee | Average Aggregate Daily Net Assets
of the Federated Funds |
| 0.150% | on the first $5 billion |
| 0.125% | on the next $5 billion |
| 0.100% | on the next $10 billion |
| 0.075% | on assets in excess of $20 billion |
The administrative fee received during any fiscal year shall be at least $150,000 per portfolio and $40,000 per each additional class of Shares. FAS may voluntarily choose to waive any portion of its fee. FAS can modify or terminate this voluntary waiver at any time at its sole discretion. For the year ended September 30, 2010, FAS waived $32,363 of its fee. The net fee paid to FAS was 0.076% of average daily net assets of the Fund.
Prior to the close of business on December 5, 2008, U.S. Bancorp Fund Services, LLC provided administrative services to the Predecessor Fund.
Distribution Services Fee
The Fund has adopted a Distribution Plan (the “Plan”) pursuant to Rule 12b-1 under the Act. Under the terms of the Plan, the Fund will compensate Federated Securities Corp. (FSC), the principal distributor, from the daily net assets of the Fund's Class A Shares and Class C Shares to finance activities intended to result in the sale of these shares. The Plan provides that the Fund may incur distribution expenses at the following percentages of average daily net assets annually, to compensate FSC:
| Share Class Name | Percentage of Average Daily
Net Assets of Class |
| Class A Shares | 0.05% |
| Class C Shares | 0.75% |
Annual Shareholder Report32
FSC may voluntarily choose to waive any portion of its fee. FSC can modify or terminate this voluntary waiver at any time at its sole discretion. When FSC receives fees, it may pay some or all of them to financial intermediaries whose customers purchase shares. For the year ended September 30, 2010, FSC retained $834,910 of fees paid by the Fund. For the year ended September 30, 2010, the Fund's Class A Shares did not incur a distribution services fee; however, it may begin to incur this fee upon approval of the Trustees.
Prior to the close of business on December 5, 2008, Quasar Distributors, LLC was the principal distributor for the Predecessor Fund. The Predecessor Fund adopted a Service and Distribution Plan pursuant to Rule 12b-1 under the Act. The Predecessor Fund's plan authorized payments by the Fund in connection with the distribution of its shares at an annual rate of up to 0.25% of the Fund's average daily net assets for the Class A Shares and 1.00% for the Class C Shares.
Sales Charges
Front-end sales charges and contingent deferred sales charges (CDSC) do not represent expenses of the Fund. They are deducted from the proceeds of sales of Fund shares prior to investment or from redemption proceeds prior to remittance, as applicable. For the year ended September 30, 2010, FSC retained $321,476 in sales charges from the sale of Class A Shares. FSC also retained $2,977 of CDSC relating to redemptions of Class A Shares and $68,503 relating to redemptions of Class C Shares.
Shareholder Services Fee
The Fund may pay fees (“Service Fees”) up to 0.25% of the average daily net assets of the Fund's Class A Shares and Class C Shares to financial intermediaries or to Federated Shareholder Services Company (FSSC) for providing services to shareholders and maintaining shareholder accounts. FSSC may voluntarily reimburse the Fund for Service Fees. This voluntary reimbursement can be modified or terminated at any time. For the year ended September 30, 2010, FSSC received $157,349 of fees paid by the Fund.
Prior to the close of business on December 5, 2008, the Predecessor Fund did not charge a shareholder services fee.
General
Certain Officers and Trustees of the Fund are Officers and Directors or Trustees of the above companies.
Annual Shareholder Report33
Transactions with Affiliated Companies and Affiliated Holdings
An affiliated company is a company in which the Fund has ownership of at least 5% of the voting shares. Transactions with affiliated companies during the year ended September 30, 2010, were as follows:
| Affiliates | Balance of
Shares Held
9/30/2009 | Purchases/
Additions | Sales/
Reductions | Balance of
Shares Held
9/30/2010 | Value | Dividend
Income |
| *Ascot Resources Ltd. | 1,500,000 | 1,500,000 | 3,000,000 | — | $ — | $ — |
| *Ascot Resources Ltd. | 1,140,000 | — | 1,140,000 | — | $ — | $ — |
| *Ascot Resources Ltd. | 360,000 | — | 360,000 | — | $ — | $ — |
| *Kootenay Gold, Inc. | 825,000 | — | 825,000 | — | $ — | $ — |
| *Kootenay Gold, Inc. | 500,000 | — | 500,000 | — | $ — | $ — |
| *Kootenay Gold, Inc. | 1,000,000 | 1,325,000 | 2,325,000 | — | $ — | $ — |
| MacArthur Minerals Ltd. | 1,500,000 | — | — | 1,500,000 | $2,551,268 | $ — |
TOTAL OF AFFILIATED
COMPANIES | 6,825,000 | 2,825,000 | 8,150,000 | 1,500,000 | $2,551,268 | $ — |
| * | At September 30, 2010, the Fund no longer has ownership of at least 5% of the voting shares. |
Affiliated holdings are mutual funds which are managed by the Adviser or an affiliate of the Adviser. The Adviser has agreed to reimburse the Fund for certain investment adviser fees as a result of transactions in other affiliated mutual funds. For the year ended September 30, 2010, the Adviser reimbursed $85,019. Transactions with the affiliated company during the year ended September 30, 2010, were as follows:
| Affiliate | Balance of
Shares Held
9/30/2009 | Purchases/
Additions | Sales/
Reductions | Balance of
Shares Held
9/30/2010 | Value | Dividend
Income |
Federated U.S.
Treasury Cash
Reserves,
Institutional Shares | 123,052,804 | 2,177,358,079 | 2,171,453,492 | 128,957,391 | $128,957,391 | $4,781 |
6. EXPENSE Reduction
The Fund directs portfolio trades to a broker that in turn pays a portion of the Fund's operating expenses. For the year ended September 30, 2010, the Fund's expenses were reduced by $51,700 under these arrangements.
7. Investment TRANSACTIONS
Purchases and sales of investments, excluding long-term U.S. government securities and short-term obligations for the year ended September 30, 2010, were as follows:
| Purchases | $3,087,102,932 |
| Sales | $2,761,649,851 |
Annual Shareholder Report34
8. LINE OF CREDIT
The Fund participates in a $100,000,000 unsecured, uncommitted revolving line of credit (LOC) agreement with PNC Bank. The LOC was made available for extraordinary or emergency purposes, primarily for financing redemption payments. Borrowings are charged interest at a rate offered to the Fund by PNC Bank at the time of the borrowing. As of September 30, 2010, there were no outstanding loans. During the year ended September 30, 2010, the Fund did not utilize the LOC.
9. INTERFUND LENDING
Pursuant to an Exemptive Order issued by the Securities and Exchange Commission, the Fund, along with other funds advised by subsidiaries of Federated Investors, Inc., may participate in an interfund lending program. This program provides an alternative credit facility allowing the Fund to borrow from other participating affiliated funds. As of September 30, 2010, there were no outstanding loans. During the year ended September 30, 2010, the program was not utilized.
10. Legal Proceedings
Since February, 2004, Federated Investors, Inc. and related entities (collectively, “Federated”), have been named as defendants in several lawsuits that are now pending in the United States District Court for the Western District of Pennsylvania. These lawsuits have been consolidated into a single action alleging excessive advisory fees involving one of the Federated-sponsored mutual funds (“Federated Funds”). Federated and its counsel have been defending this litigation. Additional lawsuits based upon similar allegations may be filed in the future. The potential impact of these lawsuits, all of which seek monetary damages, attorneys' fees and expenses, and future potential similar suits is uncertain. Although we do not believe that these lawsuits will have a material adverse effect on the Federated Funds, there can be no assurance that these suits, ongoing adverse publicity and/or other developments resulting from the allegations in these matters will not result in increased redemptions, or reduced sales, of shares of the Federated Funds or other adverse consequences for the Federated Funds.
11. Subsequent events
Management has evaluated subsequent events through the date the financial statements were issued, and determined that no events have occurred that require additional disclosure.
Annual Shareholder Report35
Report of Independent Registered Public Accounting Firm
TO THE BOARD OF TRUSTEES OF THE FEDERATED EQUITY FUNDS AND SHAREHOLDERS OF Federated Prudent bear fund
We have audited the accompanying statement of assets and liabilities, including the portfolio of investments, of Federated Prudent Bear Fund (the “Fund”), a portfolio of Federated Equity Funds, as of September 30, 2010, and the related statement of operations for the year then ended, the statements of changes in net assets for each of the years or periods in the two-year period then ended, and the financial highlights for each of the years or periods in the two-year period then ended. These financial statements and financial highlights are the responsibility of the Fund's management. Our responsibility is to express an opinion on these financial statements and financial highlights based on our audits. The financial highlights for the periods presented prior to October 1, 2008, were audited by other independent registered public accountants whose report thereon dated November 13, 2008, expressed an unqualified opinion on those statements.
We conducted our audits in accordance with the standards of the Public Company Accounting Oversight Board (United States). Those standards require that we plan and perform the audit to obtain reasonable assurance about whether the financial statements and financial highlights are free of material misstatement. An audit includes examining, on a test basis, evidence supporting the amounts and disclosures in the financial statements. Our procedures included confirmation of securities owned as of September 30, 2010, by correspondence with the custodian, transfer agent and brokers, or by other appropriate auditing procedures. An audit also includes assessing the accounting principles used and significant estimates made by management, as well as evaluating the overall financial statement presentation. We believe that our audits provide a reasonable basis for our opinion.
In our opinion, the financial statements and financial highlights referred to above present fairly, in all material respects, the financial position of the Federated Prudent Bear Fund as of September 30, 2010, and the results of its operations for the year then ended, the changes in its net assets for each of the years or periods in the two-year period then ended, and the financial highlights for each of the years or periods in the two-year period then ended, in conformity with U.S. generally accepted accounting principles.
Boston, Massachusetts
November 22, 2010
Annual Shareholder Report36
Board of Trustees and Trust Officers
The Board of Trustees is responsible for managing the Trust's business affairs and for exercising all the Trust's powers except those reserved for the shareholders. The following tables give information about each Trustee and the senior officers of the Fund. Where required, the tables separately list Trustees who are “interested persons” of the Fund (i.e., “Interested” Trustees) and those who are not (i.e., “Independent” Trustees). Unless otherwise noted, the address of each person listed is Federated Investors Tower, 1001 Liberty Avenue, Pittsburgh, PA 15222. The address of all Independent Trustees listed is 4000 Ericsson Drive, Warrendale, PA 15086-7561; Attention: Mutual Fund Board. As of December 31, 2009, the Trust comprised 13 portfolio(s), and the Federated Fund Family consisted of 43 investment companies (comprising 145 portfolios). Unless otherwise noted, each Officer is elected annually. Unless otherwise noted, each Trustee oversees all portfolios in the Federated Fund Family and serves for an indefinite term. The Fund's Statement of Additional Information includes additional information about Trust Trustees and is available, without charge and upon request, by calling 1-800-341-7400.
Interested TRUSTEES Background
Name
Birth Date
Positions Held with Trust
Date Service Began | Principal Occupation(s) for Past Five Years,
Other Directorships Held and Previous Position(s) |
John F. Donahue*
Birth Date: July 28, 1924
Trustee
Began serving: April 1984 | Principal Occupations: Director or Trustee of the Federated Fund Family; Chairman and Director, Federated Investors, Inc.; Chairman of the Federated Fund Family's Executive Committee.
Previous Positions: Chairman of the Federated Fund Family; Trustee, Federated Investment Management Company; Chairman and Director, Federated Investment Counseling. |
J. Christopher Donahue*
Birth Date: April 11, 1949
President and Trustee
Began serving: August 2000 | Principal Occupations: Principal Executive Officer and President of the Federated Fund Family; Director or Trustee of some of the Funds in the Federated Fund Family; President, Chief Executive Officer and Director, Federated Investors, Inc.; Chairman and Trustee, Federated Investment Management Company; Trustee, Federated Investment Counseling; Chairman and Director, Federated Global Investment Management Corp.; Chairman, Federated Equity Management Company of Pennsylvania and Passport Research, Ltd. (investment advisory subsidiary of Federated); Trustee, Federated Shareholder Services Company; Director, Federated Services Company.
Previous Positions: President, Federated Investment Counseling; President and Chief Executive Officer, Federated Investment Management Company, Federated Global Investment Management Corp. and Passport Research, Ltd. |
| * | Family relationships and reasons for “interested” status: John F. Donahue is the father of J. Christopher Donahue; both are “interested” due to their beneficial ownership of shares of Federated Investors, Inc. and the positions they hold with Federated and its subsidiaries. |
Annual Shareholder Report37
INDEPENDENT TRUSTEES Background
Name
Birth Date
Positions Held with Trust
Date Service Began | Principal Occupation(s) for Past Five Years,
Other Directorships Held, Previous Position(s) and Qualifications |
John T. Conroy, Jr., Ph.D.
Birth Date: June 23, 1937
Trustee
Began serving: November 1991 | Principal Occupations: Director or Trustee of the Federated Fund Family; Chairman of the Board, Investment Properties Corporation; Partner or Trustee in private real estate ventures in Southwest Florida; Assistant Professor in Theology, Blessed Edmund Rice School for Pastoral Ministry.
Previous Positions: President, Investment Properties Corporation; Senior Vice President, John R. Wood and Associates, Inc., Realtors; President, Naples Property Management, Inc. and Northgate Village Development Corporation.
Qualifications: Business management and director experience. |
Nicholas P. Constantakis, CPA
Birth Date: September 3, 1939
Trustee
Began serving: February 1998 | Principal Occupation: Director or Trustee of the Federated Fund Family.
Other Directorship Held: Director and Chairman of the Audit Committee, Michael Baker Corporation (architecture, engineering and construction services).
Previous Position: Partner, Andersen Worldwide SC.
Qualifications: Public accounting and director experience. |
John F. Cunningham
Birth Date: March 5, 1943
Trustee
Began serving: January 1999 | Principal Occupation: Director or Trustee of the Federated Fund Family.
Other Directorships Held: Chairman, President and Chief Executive Officer, Cunningham & Co., Inc. (strategic business consulting); Trustee Associate, Boston College.
Previous Positions: Director, Redgate Communications and EMC Corporation (computer storage systems); Chairman of the Board and Chief Executive Officer, Computer Consoles, Inc.; President and Chief Operating Officer, Wang Laboratories; Director, First National Bank of Boston; Director, Apollo Computer, Inc.
Qualifications: Business management and director experience. |
Maureen Lally-Green
Birth Date: July 5, 1949
Trustee
Began serving: August 2009 | Principal Occupations: Director or Trustee of the Federated Fund Family; Director, Office of Church Relations, Diocese of Pittsburgh; Adjunct Professor of Law, Duquesne University School of Law.
Other Directorships Held: Trustee, St. Francis University; Director, Ireland Institute of Pittsburgh; Director, UPMC Mercy Hospital; Regent, St. Vincent Seminary; Director, Epilepsy Foundation of Western and Central Pennsylvania; Director, Saint Thomas More Society, Allegheny County; Director, Carlow University.
Previous Position: Pennsylvania Superior Court Judge.
Qualifications: Legal and director experience. |
Annual Shareholder Report38
Name
Birth Date
Positions Held with Trust
Date Service Began | Principal Occupation(s) for Past Five Years,
Other Directorships Held, Previous Position(s) and Qualifications |
Peter E. Madden
Birth Date: March 16, 1942
Trustee
Began serving: November 1991 | Principal Occupation: Director or Trustee, and Chairman of the Board of Directors or Trustees, of the Federated Fund Family.
Other Directorship Held: Board of Overseers, Babson College.
Previous Positions: Representative, Commonwealth of Massachusetts General Court; President, Chief Operating Officer and Director, State Street Bank and Trust Company and State Street Corporation (retired); Director, VISA USA and VISA International; Chairman and Director, Massachusetts Bankers Association; Director, Depository Trust Corporation; Director, The Boston Stock Exchange.
Qualifications: Business management, mutual fund services and director experience. |
Charles F. Mansfield, Jr.
Birth Date: April 10, 1945
Trustee
Began serving: January 1999 | Principal Occupations: Director or Trustee and Chairman of the Audit Committee of the Federated Fund Family; Management Consultant.
Previous Positions: Chief Executive Officer, PBTC International Bank; Partner, Arthur Young & Company (now Ernst & Young LLP); Chief Financial Officer of Retail Banking Sector, Chase Manhattan Bank; Senior Vice President, HSBC Bank USA (formerly, Marine Midland Bank); Vice President, Citibank; Assistant Professor of Banking and Finance, Frank G. Zarb School of Business, Hofstra University; Executive Vice President, DVC Group, Inc. (marketing, communications and technology).
Qualifications: Banking, business management, public accounting and director experience. |
R. James Nicholson
Birth Date: February 4, 1938
Trustee
Began serving: January 2008 | Principal Occupations: Director or Trustee of the Federated Fund Family; Senior Counsel, Brownstein Hyatt Farber Schrek, P.C.; Former Secretary of the U.S. Dept. of Veterans Affairs; Former U.S. Ambassador to the Holy See; Former Chairman of the Republican National Committee.
Other Directorships Held: Director, Horatio Alger Association; Director, The Daniels Fund.
Previous Positions: Colonel, U.S. Army Reserve; Partner, Calkins, Kramer, Grimshaw and Harring, P.C.; General Counsel, Colorado Association of Housing and Building; Chairman and CEO, Nicholson Enterprises, Inc. (real estate holding company); Chairman and CEO, Renaissance Homes of Colorado.
Qualifications: Legal, government, business management and mutual fund director experience. |
Annual Shareholder Report39
Name
Birth Date
Positions Held with Trust
Date Service Began | Principal Occupation(s) for Past Five Years,
Other Directorships Held, Previous Position(s) and Qualifications |
Thomas M. O'Neill
Birth Date: June 14, 1951
Trustee
Began serving: October 2006 | Principal Occupations: Director or Trustee of the Federated Fund Family; Sole Proprietor, Navigator Management Company (investment and strategic consulting).
Other Directorships Held: Board of Overseers, Children's Hospital of Boston; Visiting Committee on Athletics, Harvard College.
Previous Positions: Chief Executive Officer and President, Managing Director and Chief Investment Officer, Fleet Investment Advisors; President and Chief Executive Officer, Aeltus Investment Management, Inc.; General Partner, Hellman, Jordan Management Co., Boston, MA; Chief Investment Officer, The Putnam Companies, Boston, MA; Credit Analyst and Lending Officer, Fleet Bank; Director and Consultant, EZE Castle Software (investment order management software); Director, Midway Pacific (lumber).
Qualifications: Business management, mutual fund, director and investment experience. |
John S. Walsh
Birth Date: November 28, 1957
Trustee
Began serving: January 1999 | Principal Occupations: Director or Trustee of the Federated Fund Family; President and Director, Heat Wagon, Inc. (manufacturer of construction temporary heaters); President and Director, Manufacturers Products, Inc. (distributor of portable construction heaters); President, Portable Heater Parts, a division of Manufacturers Products, Inc.
Previous Position: Vice President, Walsh & Kelly, Inc.
Qualifications: Business management and director experience. |
James F. Will
Birth Date: October 12, 1938
Trustee
Began serving: April 2006 | Principal Occupations: Director or Trustee of the Federated Fund Family; formerly, Vice Chancellor and President, Saint Vincent College.
Other Directorships Held: Trustee, Saint Vincent College; Director, Alleghany Corporation; Trustee, Wheeling Jesuit University; Director, Liberty Tire Recycling.
Previous Positions: Chairman, President and Chief Executive Officer, Armco, Inc.; President and Chief Executive Officer, Cyclops Industries; President and Chief Operating Officer, Kaiser Steel Corporation.
Qualifications: Business management, education and director experience. |
Annual Shareholder Report40
OFFICERS
Name
Birth Date
Address
Positions Held with Trust
Date Service Began | Principal Occupation(s) for Past Five Years
and Previous Position(s) |
John W. McGonigle
Birth Date: October 26, 1938
Executive Vice President and Secretary
Began serving: April 1984 | Principal Occupations: Executive Vice President and Secretary of the Federated Fund Family; Vice Chairman, Executive Vice President, Secretary and Director, Federated Investors, Inc.
Previous Positions: Trustee, Federated Investment Management Company and Federated Investment Counseling; Director, Federated Global Investment Management Corp., Federated Services Company and Federated Securities Corp. |
Richard A. Novak
Birth Date: December 25, 1963
Treasurer
Began serving: January 2006 | Principal Occupations: Principal Financial Officer and Treasurer of the Federated Fund Family; Senior Vice President, Federated Administrative Services; Financial and Operations Principal for Federated Securities Corp., Edgewood Services, Inc. and Southpointe Distribution Services, Inc.
Previous Positions: Controller of Federated Investors, Inc.; Vice President, Finance of Federated Services Company; held various financial management positions within The Mercy Hospital of Pittsburgh; Auditor, Arthur Andersen & Co. |
Brian P. Bouda
Birth Date: February 28, 1947
Chief Compliance Officer and Senior Vice President
Began serving: August 2004 | Principal Occupations: Senior Vice President and Chief Compliance Officer of the Federated Fund Family; Vice President and Chief Compliance Officer of Federated Investors, Inc. and Chief Compliance Officer of its subsidiaries. Mr. Bouda joined Federated in 1999 and is a member of the American Bar Association and the State Bar Association of Wisconsin. |
Stephen F. Auth
Birth Date: September 3, 1956
450 Lexington Avenue
Suite 3700
New York, NY 10017-3943
CHIEF INVESTMENT OFFICER
Began serving: November 2002 | Principal Occupations: Mr. Auth is Chief Investment Officer of this Fund and various other Funds in the Federated Fund Family; Executive Vice President, Federated Investment Counseling, Federated Global Investment Management Corp. and Federated Equity Management Company of Pennsylvania.
Previous Positions: Executive Vice President, Federated Investment Management Company, and Passport Research, Ltd. (investment advisory subsidiary of Federated); Senior Vice President, Global Portfolio Management Services Division; Senior Vice President, Federated Investment Management Company and Passport Research, Ltd.; Senior Managing Director and Portfolio Manager, Prudential Investments. |
Lawrence Auriana
Birth Date: January 8, 1944
140 East 45th Street
New York, NY 10017
VICE PRESIDENT
Began serving: November 2001 | Principal Occupations: Lawrence Auriana is Vice President of the Trust. Mr. Auriana joined Federated in April 2001 as Co-Head of Investments/Federated Kaufmann. From August 1984 to April 2001, Mr. Auriana was President and Treasurer of Edgemont Asset Management Corp., and Chairman of the Board and Portfolio Manager to The Kaufmann Fund, Inc. (predecessor to the Federated Kaufmann Fund). Mr. Auriana earned a B.S. in economics from Fordham University and has been engaged in the securities business since 1965. |
Annual Shareholder Report41
Name
Birth Date
Address
Positions Held with Trust
Date Service Began | Principal Occupation(s) for Past Five Years
and Previous Position(s) |
Walter C. Bean
Birth Date: June 22, 1945
VICE PRESIDENT
Began serving: November 2006 | Principal Occupations: Walter C. Bean is Vice President of the Trust. Mr. Bean is a Senior Vice President, Senior Portfolio Manager and the Head of the Equity Income Management Team of the Fund's Adviser. Mr. Bean joined Federated in 2000. His previous associations included: various investment management and research positions with C.S. McKee & Company; First Chicago Investment Advisors; CIGNA Investment Advisors; and Mellon Bank. Mr. Bean earned a Bachelors Degree in Business Administration from Ohio University and an M.B.A. from the Pennsylvania State University. Mr. Bean has received the Chartered Financial Analyst designation and has 41 years of investment experience. |
Richard B. Fisher
Birth Date: May 17, 1923
Vice President
Began serving: April 1984 | Principal Occupations: Vice Chairman or Vice President of some of the Funds in the Federated Fund Family; Vice Chairman, Federated Investors, Inc.; Chairman, Federated Securities Corp.
Previous Positions: President and Director or Trustee of some of the Funds in the Federated Fund Family; Executive Vice President, Federated Investors, Inc.; Director and Chief Executive Officer, Federated Securities Corp. |
Hans P. Utsch
Birth Date: July 3, 1936
140 East 45th Street
New York, NY 10017
VICE PRESIDENT
Began serving: November 2001 | Principal Occupations: Hans P. Utsch is Vice President of the Trust. Mr. Utsch joined Federated in April 2001 as Co-Head of Investments/Federated Kaufmann. From August 1984 to April 2001, Mr. Utsch was Chairman of the Board and Secretary of Edgemont Asset Management Corp., and President and Portfolio Manager to The Kaufmann Fund, Inc. (predecessor to the Federated Kaufmann Fund). Mr. Utsch graduated from Amherst College and holds an M.B.A. from Columbia University. He has been engaged in the securities business since 1962. |
Annual Shareholder Report42
Evaluation and Approval of Advisory Contract - May 2010
Federated Prudent Bear Fund (the “Fund”)
The Fund's Board reviewed the Fund's investment advisory contract at meetings held in May 2010. The Board's decision regarding the contract reflects the exercise of its business judgment on whether to continue the existing arrangements.
In this connection, the Federated funds' Board had previously appointed a Senior Officer, whose duties include specified responsibilities relating to the process by which advisory fees are to be charged to a Federated fund. The Senior Officer has the authority to retain consultants, experts, or staff as may be reasonably necessary to assist in the performance of his duties, reports directly to the Board, and may be terminated only with the approval of a majority of the independent members of the Board. The Senior Officer prepared and furnished to the Board an independent, written evaluation that covered topics discussed below. The Board considered that evaluation, along with other information, in deciding to approve the advisory contract.
During its review of the contract, the Board considered compensation and benefits received by the Adviser. This included the fees received for services provided to the Fund by other entities in the Federated organization and research services (if any) received by the Adviser from brokers that execute Federated fund trades, as well as advisory fees. The Board is also familiar with and considered judicial decisions concerning allegedly excessive investment advisory fees, which have indicated that the following factors may be relevant to an Adviser's fiduciary duty with respect to its receipt of compensation from a fund: the nature and quality of the services provided by the Adviser, including the performance of the fund; the Adviser's cost of providing the services; the extent to which the Adviser may realize “economies of scale” as a fund grows larger; any indirect benefits that may accrue to the Adviser and its affiliates as a result of the Adviser's relationship with a fund; performance and expenses of comparable funds; and the extent to which the independent Board members are fully informed about all facts the Board deems relevant bearing on the Adviser's services and fees. The Board further considered management fees (including any components thereof) charged to institutional and other clients of the Adviser for what might be viewed as like services, and the cost to the Adviser and its affiliates of supplying services pursuant to the management fee agreements, excluding any intra-corporate profit and profit margins of the Adviser and its affiliates for supplying such services. The Board was aware of these factors and was guided by them in its review of the Fund's advisory contract to the extent it considered them to be appropriate and relevant, as discussed further below.
Annual Shareholder Report43
The Board considered and weighed these circumstances in light of its substantial accumulated experience in governing the Fund and working with Federated on matters relating to the Federated funds, and was assisted in its deliberations by independent legal counsel. Throughout the year, the Board has requested and received substantial and detailed information about the Fund and the Federated organization that was in addition to the extensive materials that comprise and accompany the Senior Officer's evaluation. Federated provided much of this information at each regular meeting of the Board, and furnished additional reports in connection with the particular meeting at which the Board's formal review of the advisory contract occurred. Between regularly scheduled meetings, the Board also received information on particular matters as the need arose. Thus, the Board's consideration of the advisory contract included review of the Senior Officer's evaluation, accompanying data and additional reports covering such matters as: the Adviser's investment philosophy, revenue, profitability, personnel and processes; investment and operating strategies; the Fund's short- and long-term performance (in absolute terms, both on a gross basis and net of expenses, as well as in relationship to its particular investment program and certain competitor or “peer group” funds and/or other benchmarks, as appropriate), and comments on the reasons for performance; the Fund's investment objectives; the Fund's expenses (including the advisory fee itself and the overall expense structure of the Fund, both in absolute terms and relative to similar and/or competing funds, with due regard for contractual or voluntary expense limitations); the use and allocation of brokerage commissions derived from trading the Fund's portfolio securities (if any); and the nature, quality and extent of the advisory and other services provided to the Fund by the Adviser and its affiliates. The Board also considered the preferences and expectations of Fund shareholders and their relative sophistication; the continuing state of competition in the mutual fund industry and market practices; the range of comparable fees for similar funds in the mutual fund industry; the Fund's relationship to the Federated family of funds which include a comprehensive array of funds with different investment objectives, policies and strategies which are available for exchange without the incurrence of additional sales charges; compliance and audit reports concerning the Federated funds and the Federated companies that service them (including communications from regulatory agencies), as well as Federated's responses to any issues raised therein; and relevant developments in the mutual fund industry and how the Federated funds and/or Federated are responding to them. The Board's evaluation process is evolutionary. The criteria considered and the emphasis placed on relevant criteria change in recognition of changing circumstances in the mutual fund marketplace. With respect to the Fund's performance and expenses in particular, the Board has found the use of comparisons to other mutual funds with comparable investment programs to be relevant, given the high degree of competition in the mutual fund business. The Board focused on comparisons with other similar Annual Shareholder Report44
mutual funds more heavily than non-mutual fund products or services because it is believed that they are more relevant. For example, other mutual funds are the products most like the Fund, they are readily available to Fund shareholders as alternative investment vehicles, and they are the type of investment vehicle in fact chosen and maintained by the Fund's investors. The range of their fees and expenses therefore appears to be a generally reliable indication of what consumers have found to be reasonable in the precise marketplace in which the Fund competes. The Fund's ability to deliver competitive performance when compared to its peer group was a useful indicator of how the Adviser is executing the Fund's investment program, which in turn assisted the Board in reaching a conclusion that the nature, extent, and quality of the Adviser's investment management services were such as to warrant continuation of the advisory contract. In this regard, the Senior Officer has reviewed Federated's fees for providing advisory services to products outside the Federated family of funds (e.g., institutional and separate accounts). He concluded that mutual funds and institutional accounts are inherently different products. Those differences include, but are not limited to, different types of targeted investors; being subject to different laws and regulations; different legal structures; different average account sizes; different associated costs; different portfolio management techniques made necessary by different cash flows; and portfolio manager time spent in review of securities pricing. The Senior Officer did not consider these fee schedules to be determinative in judging the appropriateness of mutual fund advisory contracts.The Senior Officer reviewed reports compiled by Federated, using data supplied by independent fund ranking organizations, regarding the performance of, and fees charged by, other mutual funds, noting his view that comparisons to fund peer groups are relevant in judging the reasonableness of proposed fees.
For the one-year, three-year and five-year periods covered by the report, the Fund's performance was above the median of the relevant peer group.
The Board also received financial information about Federated, including reports on the compensation and benefits Federated derived from its relationships with the Federated funds. These reports covered not only the fees under the advisory contracts, but also fees received by Federated's subsidiaries for providing other services to the Federated funds under separate contracts (e.g., for serving as the Federated funds' administrator). The reports also discussed any indirect benefit Federated may derive from its receipt of research services from brokers who execute Federated fund trades. In addition, the Board considered the fact that, in order for a fund to be competitive in the marketplace, Federated and its affiliates frequently waived fees and/or reimbursed expenses and have disclosed to fund investors and/or indicated to the Board their intention to do so in the future, where appropriate. Moreover, the Board receives regular reports regarding the institution or elimination of these voluntary waivers.
Annual Shareholder Report45
Federated furnished reports, requested by the Senior Officer, that reported revenues on a fund-by-fund basis and made estimates of the allocation of expenses on a fund-by-fund basis, using allocation methodologies specified by the Senior Officer. The Senior Officer noted that, although they may apply consistent allocation processes, the inherent difficulties in allocating costs (and the unavoidable arbitrary aspects of that exercise) and the lack of consensus on how to allocate those costs may render such allocation reports unreliable. The allocation reports were considered in the analysis by the Board but were determined to be of limited use.The Board and the Senior Officer also reviewed a report compiled by Federated comparing profitability information for Federated to other publicly held fund management companies. In this regard, the Senior Officer noted the limited availability of such information, but nonetheless concluded that Federated's profit margins did not appear to be excessive and the Board agreed.
The Senior Officer's evaluation also discussed the notion of possible realization of “economies of scale” as a fund grows larger. The Board considered in this regard that the Adviser has made significant and long-term investments in areas that support all of the Federated funds, such as personnel and processes for the portfolio management, compliance, and risk management functions; and systems technology; and that the benefits of these efforts (as well as any economies, should they exist) were likely to be enjoyed by the fund complex as a whole. Finally, the Board also noted the absence of any applicable regulatory or industry guidelines on this subject, which (as discussed in the Senior Officer's evaluation) is compounded by the lack of any common industry practice or general pattern with respect to structuring fund advisory fees with “breakpoints” that serve to reduce the fee as the fund attains a certain size. The Senior Officer did not recommend institution of breakpoints in pricing Federated's fund advisory services at this time.
It was noted in the materials for the Board meeting that for the period covered by the report, the Fund's investment advisory fee, after waivers and expense reimbursements, if any, was above the median of the relevant peer group. The Board reviewed the fees and other expenses of the Fund with the Adviser and was satisfied that the overall expense structure of the Fund remained competitive. The Board will continue to monitor advisory fees and other expenses borne by the Fund.
The Senior Officer's evaluation noted his belief that the information and observations contained in his evaluation supported a finding that the proposed management fees are reasonable, and that Federated appeared to provide appropriate administrative services to the Fund for the fees paid. Under these circumstances, no changes were recommended to, and no objection was raised to, the continuation of the Fund's advisory contract. The Board concluded that the nature, quality and scope of services provided the Fund by the Adviser and its affiliates were satisfactory.
Annual Shareholder Report46
In its decision to continue an existing investment advisory contract, the Board was mindful of the potential disruptions of the Fund's operations and various risks, uncertainties and other effects that could occur as a result of a decision to terminate or not renew an advisory contract. In particular, the Board recognized that many shareholders have invested in the Fund on the strength of the Adviser's industry standing and reputation and with the expectation that the Adviser will have a continuing role in providing advisory services to the Fund. Thus, the Board's approval of the advisory contract reflected the fact that it is the shareholders who have effectively selected the Adviser by virtue of having invested in the Fund.The Board based its decision to approve the advisory contract on the totality of the circumstances and relevant factors and with a view to past and future long-term considerations. Not all of the factors and considerations identified above were necessarily relevant to the Fund, nor did the Board consider any one of them to be determinative. With respect to the factors that were relevant, the Board's decision to approve the contract reflects its determination that Federated's performance and actions provided a satisfactory basis to support the decision to continue the existing arrangements.
Annual Shareholder Report47
Voting Proxies on Fund Portfolio Securities
A description of the policies and procedures that the Fund uses to determine how to vote proxies, if any, relating to securities held in the Fund's portfolio is available, without charge and upon request, by calling 1-800-341-7400. A report on “Form N-PX” of how the Fund voted any such proxies during the most recent 12-month period ended June 30 is available from Federated's website at FederatedInvestors.com. To access this information from the “Products” section of the website, click on the “Prospectuses and Regulatory Reports” link under “Related Information,” then select the appropriate link opposite the name of the Fund; or select the name of the Fund and from the Fund's page, click on the “Prospectuses and Regulatory Reports” link. Form N-PX filings are also available at the SEC's website at www.sec.gov.
Quarterly Portfolio Schedule
The Fund files with the SEC a complete schedule of its portfolio holdings, as of the close of the first and third quarters of its fiscal year, on “Form N-Q.” These filings are available on the SEC's website at www.sec.gov and may be reviewed and copied at the SEC's Public Reference Room in Washington, DC. (Call 1-800-SEC-0330 for information on the operation of the Public Reference Room.) You may also access this information from the “Products” section of Federated's website at FederatedInvestors.com by clicking on “Portfolio Holdings” under “Related Information,” then selecting the appropriate link opposite the name of the Fund; or select the name of the Fund and from the Fund's page, click on the “Portfolio Holdings” link.
Annual Shareholder Report48
Mutual funds are not bank deposits or obligations, are not guaranteed by any bank and are not insured or guaranteed by the U.S. government, the Federal Deposit Insurance Corporation, the Federal Reserve Board or any other government agency. Investment in mutual funds involves investment risk, including the possible loss of principal.
This Report is authorized for distribution to prospective investors only when preceded or accompanied by the Fund's Prospectus, which contains facts concerning its objective and policies, management fees, expenses and other information.
Federated Prudent Bear Fund
Federated Investors Funds
4000 Ericsson Drive
Warrendale, PA 15086-7561
Contact us at FederatedInvestors.com
or call 1-800-341-7400.
Federated Securities Corp., Distributor
Cusip 314172354
Cusip 314172347
41202 (11/10)
Federated is a registered mark of Federated Investors, Inc.
2010 © Federated Investors, Inc.
Federated Prudent Bear Fund
A Portfolio of Federated Equity Funds
ANNUAL SHAREHOLDER REPORTSeptember 30, 2010
Institutional Shares
FINANCIAL HIGHLIGHTS
SHAREHOLDER EXPENSE EXAMPLE
MANAGEMENT'S DISCUSSION OF FUND PERFORMANCE
PORTFOLIO OF INVESTMENTS SUMMARY TABLES
PORTFOLIO OF INVESTMENTS
STATEMENT OF ASSETS AND LIABILITIES
STATEMENT OF OPERATIONS
STATEMENT OF CHANGES IN NET ASSETS
NOTES TO FINANCIAL STATEMENTS
REPORT OF INDEPENDENT REGISTERED PUBLIC ACCOUNTING FIRM
BOARD OF TRUSTEES AND TRUST OFFICERS
EVALUATION AND APPROVAL OF ADVISORY CONTRACT
VOTING PROXIES ON FUND PORTFOLIO SECURITIES
QUARTERLY PORTFOLIO SCHEDULE
Financial Highlights - Institutional Shares
(For a Share Outstanding Throughout Each Period)
| Year
Ended
9/30/2010 | Period
Ended
9/30/20091 |
| Net Asset Value, Beginning of Period | $5.76 | $6.91 |
| Income From Investment Operations: | | |
| Net investment income (loss) | (0.11)2 | (0.13)2 |
| Net realized and unrealized loss on investments, short sales, futures contracts and foreign currency transactions | (0.54) | (1.02) |
| TOTAL FROM INVESTMENT OPERATIONS | (0.65) | (1.15) |
| Net Asset Value, End of Period | $5.11 | $5.76 |
| Total Return3 | (11.28)% | (16.64)% |
| Ratios to Average Net Assets: | | |
| Net expenses | 2.14%5 | 2.73%4,5 |
| Net expenses excluding dividends and other expenses related to short sales | 1.49%5 | 1.50%4,5 |
| Net investment income (loss) | (2.00)% | (2.59)%4 |
| Expense waiver/reimbursement6 | 0.01% | 0.02%4 |
| Supplemental Data: | | |
| Net assets, end of period (000 omitted) | $585,911 | $98,732 |
| Portfolio turnover | 379% | 392%7 |
| 1 | Reflects operations for the period from December 8, 2008 (date of initial investment) to September 30, 2009. |
| 2 | Per share numbers have been calculated using the average shares method. |
| 3 | Based on net asset value. Total returns for periods of less than one year are not annualized. |
| 4 | Computed on an annualized basis. |
| 5 | The net expense ratios are calculated without reduction for fees paid indirectly for expense offset arrangements. The net expense ratios are 2.14% and 2.72%, after taking into account these expense reductions for the year ended September 30, 2010, and the period ended September 30, 2009, respectively. The net expense ratios excluding dividends and other expenses related to short sales are also calculated without reduction for these fees paid indirectly for expense offset arrangements. |
| 6 | This expense decrease is reflected in both the net expense and the net investment income (loss) ratios shown above. |
| 7 | Portfolio turnover is calculated at the Fund level. Percentage indicated was calculated for the year ended September 30, 2009. |
See Notes which are an integral part of the Financial Statements
Annual Shareholder Report1
Shareholder Expense Example (unaudited)
As a shareholder of the Fund, you incur ongoing costs, including management fees and to the extent applicable, distribution (12b-1) fees and/or shareholder services fees and other Fund expenses. This Example is intended to help you to understand your ongoing costs (in dollars) of investing in the Fund and to compare these costs with the ongoing costs of investing in other mutual funds. It is based on an investment of $1,000 invested at the beginning of the period and held for the entire period from April 1, 2010 to September 30, 2010.
ACTUAL EXPENSES
The first section of the table below provides information about actual account values and actual expenses. You may use the information in this section, together with the amount you invested, to estimate the expenses that you incurred over the period. Simply divide your account value by $1,000 (for example, an $8,600 account value divided by $1,000 = 8.6), then multiply the result by the number in the first section under the heading entitled “Expenses Paid During Period” to estimate the expenses attributable to your investment during this period.
HYPOTHETICAL EXAMPLE FOR COMPARISON PURPOSES
The second section of the table below provides information about hypothetical account values and hypothetical expenses based on the Fund's actual expense ratio and an assumed rate of return of 5% per year before expenses, which is not the Fund's actual return. Thus, you should not use the hypothetical account values and expenses to estimate the actual ending account balance or your expenses for the period. Rather, these figures are required to be provided to enable you to compare the ongoing costs of investing in the Fund with other funds. To do so, compare this 5% hypothetical example with the 5% hypothetical examples that appear in the shareholder reports of the other funds.
Please note that the expenses shown in the table are meant to highlight your ongoing costs only. Therefore, the second section of the table is useful in comparing ongoing costs only, and will not help you determine the relative total costs of owning different funds.
| Beginning
Account Value
4/1/2010 | Ending
Account Value
9/30/2010 | Expenses Paid
During Period1 |
| Actual | $1,000 | $998.00 | $10.47 |
Hypothetical (assuming a 5% return
before expenses) | $1,000 | $1,014.59 | $10.56 |
| 1 | Expenses are equal to the Fund's annualized net expense ratio of 2.09%, multiplied by the average account value over the period, multiplied by 183/365 (to reflect the one-half-year period). |
Annual Shareholder Report2
Performance data quoted represents past performance which is no guarantee of future results. Investment return and principal value will fluctuate so that an investor's shares, when redeemed, may be worth more or less than their original cost. Mutual fund performance changes over time and current performance may be lower or higher than what is stated. For current to the most recent month-end performance and after-tax returns, visit FederatedInvestors.com or call 1-800-341-7400.
Management's Discussion of Fund Performance (unaudited)
The Fund's total return, based on net asset value, for the fiscal year ended September 30, 2010, was -11.28% for the Fund's Institutional Shares. The total return of the Standard & Poor's 500 Index (S&P 500),1 a broad-based securities market index, was 10.16% for the same period. The total return for the Fund's market benchmark, the S&P 500 Inverse Daily Index,2 was - -12.02% for the same period. The Fund's total return for the fiscal year reflected actual cash flows, transaction costs and other expenses which were not reflected in the total return of the S&P 500.
MARKET OVERVIEW
The fiscal year encompassed another extraordinary period of uncertainty and volatility for U.S. and global financial markets. U.S. stocks began the reporting period adding to 2009's big gains. From the early October 2009 low to the April 2010 trading high, the S&P 500 rose 19.6%. At that point, the S&P 500 had rallied 82.9% off of the March 2009 market low, while the Standard & Poor's 400 Mid-Cap Index3 had gained 114.3%. But the rapidly expanding Greek debt crisis brought one of history's great stock market advances to an abrupt halt. From the April 2010 high to the July trading low, the S&P 500 declined 17.1%, before the market again reversed course to post the strongest September gain in 70 years. All in all, it remained an unstable and exceptionally challenging market environment.
| 1 | The S&P 500 is a broad-based market index that measures the performance of the broad domestic economy through changes in the aggregate market value of 500 stocks representing all major industries. The index is unmanaged, and investments cannot be made in an index. |
| 2 | The S&P 500 Inverse Daily Index is designed to provide the inverse performance of the S&P 500 Index, representing a short position in the index. |
| 3 | The S&P 400 Mid-Cap Index is an unmanaged capitalization weighted index of common stocks representing all major industries in the mid-range of the U.S. stock market. |
Annual Shareholder Report3
FUND PERFORMANCEThe Fund's underperformance versus the total return of the S&P 500 index (the Fund outperformed its benchmark the S&P 500 Inverse Daily Index) for the reporting period was due to several factors. For one, most stocks outperformed the S&P 500 index. Many stocks and sectors - including those commonly shorted - have enjoyed spectacular gains. In general, individual company stock selection - albeit long or short - has been a difficult proposition for participants throughout the marketplace. It has been especially grueling on the short-side, and stock picking was not successful for the Fund during the reporting period. Performance was also negatively impacted by the extraordinarily uncertain policy backdrop and resulting erratic swings in market sentiment and prices.
The reporting period was particularly challenging with regard to the mercurial global macro backdrop. Coming into the reporting period, it was the Fund managers' view that 2010 was a “bubble year.” They believed that the unprecedented fiscal and monetary policy responses to the 2008 collapse of the mortgage/Wall Street finance bubble had unleashed potentially more expansive bubbles throughout global government finance and beyond. Such a backdrop creates great uncertainty, with bi-polar market outcome possibilities: The bubble might, as they tend to do, gather momentum - or it could burst. Acute systemic fragilities seemed to ensure that a faltering bubble had the potential to foment the rapid return of financial and economic crisis. At the same time, intractable structural vulnerabilities could elicit the type of extreme policy responses conducive to inflating bubbles.
It is the Fund managers' investment philosophy to increase short exposure when the market environment is favorable for shorting and to reduce short positions when the environment is unfavorable.4 And especially during such an unsettled period, the Fund managers will not veer away from their mandate of providing a reliable hedge against a market decline. In the end, it was just a very challenging 12-month period, as the Fund managers worked to gauge the relative risks and rewards in an unsettled marketplace and to determine whether to maintain a cautious stance or instead to implement a more opportunistic approach to managing the Fund's short exposure.
| 4 | The Fund regularly makes short sales of securities, which involves unlimited risk including the possibility that losses may exceed the original amount invested. The Fund may also use options and future contracts, which have risks associated with unlimited losses of the underlying holdings due to unanticipated market movements and failure to correctly predict the direction of securities prices, interest rates and currency exchanges rates. However, a mutual fund investor's risk is limited to the amount of investment in a mutual fund. The Fund may also hold restricted securities purchased through private placements. Such securities may be difficult to sell without experiencing delays or additional costs. Please see the Prospectus for further details. Considering the increased risks, the Fund may not be suitable for all investors. |
Annual Shareholder Report4
Positioning and StrategyThe Fund began the reporting period cautiously positioned, as it had been since implementing major changes to portfolio positions in the fourth quarter of 2008. With a generally unfavorable risk versus reward backdrop for shorting individual company stocks, the majority of the Fund's short exposure was maintained in liquid sector and market index instruments. The stock market rallied into the end of 2009, but storm clouds were brewing.
Greece credit default swap (CDS) prices doubled in a matter of weeks to more than 400 basis points by late January 2010. U.S. and global equities performed poorly in January, and it appeared to the Fund managers that a more favorable environment for shorting might be at hand. Yet the market reversed abruptly. The S&P 500 rallied almost 17% from the early February low to the trading high on April 26, in what developed into a “short squeeze” and excruciating rally for those positioned bearishly.
In late April, right in the midst of a highly speculative equities rally, the situation took a decisive turn for the worse in Greek and periphery European debt markets. After trading at about two percent in early November 2009, Greece's two-year borrowing costs surged to 16 percent. At such yields, Greece's heavy debt load was unmanageable. The Greek crisis threw the CDS marketplace into disarray, as the unthinkable scenario of a string of sovereign defaults became a real possibility. Almost overnight, contagion effects spread to Portugal, Ireland, Spain, Italy and beyond to the global risk market more generally. Market sentiment had flip-flopped, with participants becoming anything but confident that global policymakers had things under control.
Beginning in late April, the Fund managers moved decisively to implement a more opportunistic stance. Put options were purchased to gain more exposure to a broader stock market decline. Individual company short positions were increased, with an emphasis on stocks expected to be susceptible to tightened financial conditions and a weaker-than-expected U.S. economy. Overall short exposure was increased to the highest level since 2008.
As the Fund managers had anticipated, a broadening European debt crisis did lead to tighter financial conditions here at home. Global participants were poorly positioned for an abrupt change in the market environment. In particular, a dislocation in European debt and CDS markets, faltering confidence in the euro and a surging dollar fomented a bout of de-risking and de-leveraging in the markets. In the United States, rising risk premiums, a tightening in the corporate debt market and sinking equity prices battered confidence. The tepid U.S. economic recovery stalled.
Annual Shareholder Report5
While equities remained on the defensive through the end of August, general financial conditions were again loosening. With the Federal Reserve contemplating additional quantitative easing, Treasury and market yields were collapsing. Risk premiums throughout the marketplace were contracting. Corporate debt issuance was booming, with record sales of junk bonds. Jumps in merger and acquisition activity and stock buyback announcements were also indicative of a loose financial backdrop. And, importantly, a significant weakening of the U.S. dollar was providing a “reflationary” boost to global risk markets.The Fund managers reacted to the loosening of financial conditions by implementing a more cautious strategy. Overall short exposure was reduced. The equity put positions, purchased at the onset of the Greek crisis, were sold. The allocation to individual company and sector short positions was reduced on the view that liquid S&P 500 futures again provided a more appealing risk versus reward dynamic, in what the Fund managers viewed as an increasingly risky backdrop for shorting. These moves helped mitigate loses during the big September market rally.
It is fundamental to the Fund managers' investment philosophy to remain flexible, tactical and disciplined with respect to managing Fund short exposure. Micro company research and analysis on the short side remained especially challenging for much of the reporting period, although stock selection for the Fund's long investments in resources stocks did benefit performance. And Fund performance again benefited from the other two “prongs” of the Fund managers' philosophy: diligent “top-down” macro analysis and disciplined risk-based portfolio management.
Annual Shareholder Report6
GROWTH OF A $10,000 INVESTMENT - Institutional shares1The graph below illustrates the hypothetical investment of $10,0002 in the Federated Prudent Bear Fund (Institutional Shares) (the “Fund”) from September 30, 2000 to September 30, 2010, compared to the Standard & Poor's 500 Index (S&P 500)3 and the S&P 500 Inverse Daily Index
(S&P 500 Inverse).3
| Average Annual Total Returns for the Period Ended 9/30/2010 | |
| 1 Year | -11.28% |
| 5 Years | 3.65% |
| 10 Years | 7.26% |
Performance data quoted represents past performance which is no guarantee of future results. Investment return and principal value will fluctuate so that an investor's shares, when redeemed, may be worth more or less than their original cost. Mutual fund performance changes over time and current performance may be lower or higher than what is stated. For current to the most recent month-end performance and after-tax returns, visit FederatedInvestors.com or call 1-800-341-7400. Returns shown do not reflect the deduction of taxes that a shareholder would pay on Fund distributions or the redemption of Fund shares. Mutual funds are not obligations of or guaranteed by any bank and are not federally insured.
| 1 | Federated Prudent Bear Fund is the successor to Prudent Bear Fund pursuant to a reorganization that took place on December 5, 2008. The information presented above, for the periods prior to December 5, 2008, is historical information for the No Load Shares of the Prudent Bear Fund. |
| 2 | The Fund's performance assumes the reinvestment of all dividends and distributions. The S&P 500 and the S&P 500 Inverse have been adjusted to reflect reinvestment of dividends on securities in the indexes. |
| 3 | The S&P 500 and the S&P 500 Inverse are not adjusted to reflect taxes, sales charges, expenses or other fees that the Securities and Exchange Commission requires to be reflected in the Fund's performance. The S&P 500 and the S&P 500 Inverse are unmanaged and, unlike the Fund, are not affected by cash flows. It is not possible to invest directly in an index. |
Annual Shareholder Report7
Portfolio of Investments Summary Tables (unaudited)
At September 30, 2010, the Fund's portfolio composition was as follows:
| Percentage of
Total Net Assets |
| Securities Sold Short | (22.9)% |
| Derivative Contracts — Short (notional value)1 | (53.9)% |
| U.S. Treasury Securities | 53.7% |
| U.S. Treasury Securities Held as Collateral for Securities Sold Short | 32.1% |
| Common Stock | 7.1% |
| Other Securities2,3 | 0.0% |
| Cash Equivalents4 | 6.5% |
| Adjustment for Derivative Contracts (notional value)1 | 52.1% |
| Collateral on Deposit for Securities Sold Short | 26.3% |
| Other Assets and Liabilities — Net5 | (1.0)% |
| TOTAL | 100.0% |
| 1 | Derivative contracts may consist of futures, forwards, options and swaps. More complete information regarding the Fund's direct investments in derivative contracts, including unrealized appreciation (depreciation), value and notional values or amounts of such contracts, can be found in the table at the end of the Portfolio of Investments included in this Report. |
| 2 | Other Securities include warrants and purchased put options. |
| 3 | Represents less than 0.1%. |
| 4 | Cash Equivalents include any investments in money market mutual funds and/or overnight repurchase agreements. |
| 5 | Assets, other than investments in securities, securities sold short, derivative contracts and collateral on deposit for securities sold short, less liabilities. See Statement of Assets and Liabilities. |
Annual Shareholder Report8
At September 30, 2010, the Fund's sector composition6 for its short positions was as follows:| Sector Composition | Percentage of
Total Securities
Sold Short7 |
| Broad Equity Index | 70.2% |
| Consumer Staples | 6.8% |
| Health Care | 6.5% |
| Consumer Discretionary | 6.4% |
| Information Technology | 5.4% |
| Industrials | 2.8% |
| Financials | 0.7% |
| Materials | 0.7% |
| Other8 | 0.5% |
| TOTAL | 100.0% |
| 6 | Sector classifications are based upon, and individual portfolio securities are assigned to, the classifications of the Global Industry Classification Standard (GICS) except that the adviser assigns a classification to securities not classified by the GICS and to securities for which the adviser does not have access to the classification made by the GICS. |
| 7 | Includes any short positions on futures contracts. |
| 8 | Other includes exchange-traded funds. |
Annual Shareholder Report9
Portfolio of Investments
September 30, 2010
| Shares, Principal Amount or Units Held | | | Value |
| | COMMON STOCKS – 7.1% | |
| | Energy – 0.3% | |
| 675,000 | 1 | Bankers Petroleum Ltd. | 5,333,609 |
| | Materials – 6.8% | |
| 3,500,000 | 1 | Abacus Mining & Exploration Corp. | 646,321 |
| 77,400 | | Agnico Eagle Mines Ltd. | 5,497,722 |
| 1,900,000 | 1 | Ampella Mining Ltd. | 4,798,526 |
| 1,282,000 | 1 | Antares Minerals, Inc. | 5,295,461 |
| 75,000 | | Barrick Gold Corp. | 3,471,750 |
| 30,430 | 1 | Bassari Resources Ltd. | 7,348 |
| 3,000,000 | 1 | Benton Resources Corp. | 1,982,700 |
| 1,000,000 | 1 | Callinan Mines Ltd. | 1,798,037 |
| 2,975,000 | 1 | Centamin Egypt Ltd. | 8,153,854 |
| 137,300 | | Cia de Minas Buenaventura SA, Class B, ADR | 6,203,214 |
| 175,000 | 1 | Corvus Gold, Inc. | 144,572 |
| 549,998 | 1 | East Asia Minerals Corp. | 2,945,368 |
| 150,000 | 1,2,3 | East Asia Minerals Corp. | 803,285 |
| 950,000 | 1,2,3 | Evolving Gold Corp. | 784,819 |
| 1,900,000 | 1 | Fortuna Silver Mines, Inc. | 5,909,223 |
| 530,000 | 1,2,3 | Fortuna Silver Mines, Inc. | 1,648,362 |
| 1,750,000 | 1 | Franconia Minerals Corp. | 918,457 |
| 112,100 | | Goldcorp, Inc., Class A | 4,878,592 |
| 175,000 | 1 | Golden Predator Corp. | 115,658 |
| 200,000 | 1 | Gryphon Minerals, Ltd. | 280,248 |
| 230,925 | 1 | Imperial Metals Corp. | 5,130,669 |
| 350,000 | 1 | International Tower Hill Mines Ltd. | 2,194,091 |
| 538,000 | 1 | Kirkland Lake Gold, Inc. | 4,533,444 |
| 1,441,500 | 1 | Lake Shore Gold Corp. | 5,043,639 |
| 1,500,000 | 1,4 | MacArthur Minerals Ltd. | 2,551,268 |
| 2,800,000 | 1 | Magma Metals Ltd. | 1,739,759 |
| 1,000,000 | 1 | Mansfield Minerals, Inc. | 1,623,093 |
| 885,000 | 1 | Medusa Mining Ltd. | 4,151,123 |
| 2,500,000 | 1 | Minera Andes, Inc. | 3,960,540 |
| 300,000 | 1 | Mountain Province Diamonds, Inc. | 1,352,901 |
| 72,600 | | Newmont Mining Corp. | 4,560,006 |
Annual Shareholder Report10
| Shares, Principal Amount or Units Held | | | Value |
| 655,000 | 1 | Osisko Exploration Ltd. | 9,326,222 |
| 2,000,000 | 1 | Perseus Mining Ltd. | 5,567,239 |
| 153,000 | 1 | Radius Gold, Inc. | 104,092 |
| 39,100 | | Randgold Resources Ltd., ADR | 3,967,086 |
| 1,000,000 | 1 | Richfield Ventures Corp. | 2,721,353 |
| 1,800,000 | 1 | Rockgate Capital Corp. | 1,329,574 |
| 63,500 | | Royal Gold, Inc. | 3,164,840 |
| 350,002 | 1 | Silver Wheaton Corp. | 9,320,709 |
| 800,000 | 1 | Trevali Resources Corp. | 1,088,541 |
| 477,000 | | Yamana Gold, Inc. | 5,437,800 |
| | TOTAL | 135,151,506 |
| | TOTAL COMMON STOCKS
(IDENTIFIED COST $93,297,822) | 140,485,115 |
| | WARRANTS – 0.0% | |
| | Industrials – 0.0% | |
| 105,990 | 1 | Aura Systems, Inc., Warrants | 39 |
| | Materials – 0.0% | |
| 43,500 | 1 | Chesapeake Gold Corp., Warrants | 116,034 |
| 1,050,000 | 1 | EMC Metals Corp., Warrants | 5,627 |
| 262,500 | 1 | Golden Predator Corp., Warrants | 0 |
| 412,500 | 1 | Kootenay Gold, Inc., Warrants | 55,582 |
| 250,000 | 1 | Kootenay Gold, Inc., Warrants | 147 |
| 15,625 | 1 | Pan American Silver Corp., Warrants | 145,041 |
| 56,472 | 1 | Pan American Silver Corp., Warrants | 435,792 |
| | TOTAL | 758,223 |
| | TOTAL WARRANTS
(IDENTIFIED COST $585,824) | 758,262 |
| | Purchased PUT Options – 0.0% | |
| 6,000 | 1 | iShares Barclays 20+ Year Treasury Bond Fund, Price $95, Expiration Date 12/18/2010 (IDENTIFIED COST $1,636,800) | 318,000 |
| | U.S. Treasury – 85.8%;5 | |
| | U.S. Treasury Bills – 85.8% | |
| $125,000,000 | | United States Treasury Bill, 0.09%, 10/7/2010 | 124,997,400 |
| 175,000,000 | 6 | United States Treasury Bill, 0.115%, 10/21/2010 | 174,987,243 |
| 108,000,000 | | United States Treasury Bill, 0.08%, 10/28/2010 | 107,988,660 |
| 439,000,000 | | United States Treasury Bill, 0.135%, 11/4/2010 | 438,945,564 |
| 466,000,000 | 6 | United States Treasury Bill, 0.145%, 11/12/2010 | 465,931,358 |
Annual Shareholder Report11
| Shares, Principal Amount or Units Held | | | Value |
| $250,000,000 | | United States Treasury Bill, 0.13%, 11/26/2010 | 249,942,650 |
| 150,000,000 | | United States Treasury Bill, 0.135%, 12/9/2010 | 149,961,900 |
| | TOTAL U.S. TREASURY
(IDENTIFIED COST $1,712,728,739) | 1,712,754,775 |
| | MUTUAL FUND – 6.5% | |
| 128,957,391 | 4,7 | Federated U.S. Treasury Cash Reserves, Institutional Shares, 0.00% (AT NET ASSET VALUE) | 128,957,391 |
| | TOTAL INVESTMENTS — 99.4%
(IDENTIFIED COST $1,937,206,576)8 | 1,983,273,543 |
| | OTHER ASSETS AND LIABILITIES - NET — 0.6%9 | 12,463,695 |
| | TOTAL NET ASSETS — 100% | $1,995,737,238 |
SCHEDULE OF SECURITIES SOLD SHORT
| Shares | | | Value |
| 100,000 | | Abercrombie & Fitch Co., Class A | $3,932,000 |
| 140,000 | | Advanced Micro Devices, Inc. | 995,400 |
| 60,000 | | Agilent Technologies, Inc. | 2,002,200 |
| 95,000 | | Altera Corp. | 2,865,200 |
| 345,000 | | AmerisourceBergen Corp. | 10,577,700 |
| 790,000 | | Amex Financial Select Standard & Poor Depository Receipt | 11,336,500 |
| 80,000 | | Amphenol Corp., Class A | 3,918,400 |
| 75,000 | | Analog Devices, Inc. | 2,353,500 |
| 95,000 | | ASML Holding N.V., ADR | 2,824,350 |
| 250,000 | | Au Optronics Corp., Class ADR, ADR | 2,615,000 |
| 35,000 | | Autoliv, Inc. | 2,286,550 |
| 133,000 | | Bard C.R., Inc. | 10,830,190 |
| 85,000 | | Baxter International, Inc. | 4,055,350 |
| 55,000 | | BorgWarner, Inc. | 2,894,100 |
| 292,000 | | Campbell Soup Co. | 10,439,000 |
| 155,000 | | Colgate-Palmolive Co. | 11,913,300 |
| 985,000 | | ConAgra Foods, Inc. | 21,610,900 |
| 130,000 | | Corning, Inc. | 2,376,400 |
| 90,000 | | DeVRY, Inc. | 4,428,900 |
| 160,000 | | Dick's Sporting Goods, Inc. | 4,486,400 |
| 80,000 | | Education Management Corp. | 1,174,400 |
| 45,000 | | EMC Corp. | 913,950 |
Annual Shareholder Report12
| Shares | | | Value |
| 160,000 | | Estee Lauder Cos., Inc., Class A | $10,116,800 |
| 340,000 | | Express Scripts, Inc., Class A | 16,558,000 |
| 150,000 | | Fairchild Semiconductor International, Inc., Class A | 1,410,000 |
| 390,000 | | Flextronics International Ltd. | 2,355,600 |
| 355,000 | | Genuine Parts Co. | 15,829,450 |
| 160,000 | | Hanesbrands, Inc. | 4,137,600 |
| 53,000 | | Intuitive Surgical, Inc. | 15,038,220 |
| 130,000 | | Jabil Circuit, Inc. | 1,873,300 |
| 30,000 | | Juniper Networks, Inc. | 910,500 |
| 410,000 | | Kellogg Co. | 20,709,100 |
| 70,000 | | KLA-Tencor Corp. | 2,466,100 |
| 125,000 | | Kraft Foods, Inc., Class A | 3,857,500 |
| 205,000 | | L-3 Communications Holdings, Inc. | 14,815,350 |
| 55,000 | | Lam Research Corp. | 2,301,750 |
| 163,000 | | LG Display Co. Ltd., ADR | 2,842,720 |
| 485,000 | | Lowe's Cos., Inc. | 10,810,650 |
| 50,000 | | Marvell Technology Group Ltd. | 875,500 |
| 185,000 | | Maxim Integrated Products, Inc. | 3,424,350 |
| 165,000 | | McKesson HBOC, Inc. | 10,193,700 |
| 405,000 | | Medco Health Solutions, Inc. | 21,084,300 |
| 27,000 | | Microchip Technology, Inc. | 849,150 |
| 160,000 | | Molex, Inc. | 3,348,800 |
| 770,000 | | Nokia Oyj, Class A, ADR | 7,723,100 |
| 57,000 | | Nordson Corp. | 4,200,330 |
| 90,000 | | Novellus Systems, Inc. | 2,392,200 |
| 130,000 | | ON Semiconductor Corp. | 937,300 |
| 145,000 | | Owens Corning, Inc. | 3,716,350 |
| 340,000 | | Procter & Gamble Co. | 20,389,800 |
| 75,000 | | Sanmina-SCI Corp. | 906,000 |
| 135,000 | | Sherwin-Williams Co. | 10,143,900 |
| 175,000 | | SPDR S&P Retail ETF | 7,313,250 |
| 780,000 | | Staples, Inc. | 16,317,600 |
| 410,000 | | Starbucks Corp. | 10,487,800 |
| 330,000 | | STMicroelectronics N.V., ADR | 2,517,900 |
| 215,000 | | Stryker Corp. | 10,760,750 |
| 140,000 | | Telefonaktiebolaget LM Ericsson, ADR | 1,535,800 |
| 200,000 | | Teradyne, Inc. | 2,228,000 |
| 50,000 | | Texas Instruments, Inc. | 1,357,000 |
| 45,000 | | TRW Automotive Holdings Corp. | 1,870,200 |
| 320,000 | | Urban Outfitters, Inc. | 10,060,800 |
| 65,000 | | Visa, Inc., Class A | 4,826,900 |
Annual Shareholder Report13
| Shares | | | Value |
| 570,000 | | Waste Management, Inc. | $20,371,800 |
| 685,000 | | Western Union Co. | 12,103,950 |
| 125,000 | | Whirlpool Corp. | 10,120,000 |
| 125,000 | | Whole Foods Market, Inc. | 4,638,750 |
| 110,000 | | Xilinx, Inc. | 2,927,100 |
| | TOTAL SECURITIES SOLD SHORT
(PROCEEDS $433,800,398) | $456,484,710 |
At September 30, 2010, the Fund had the following outstanding futures contracts:
| Description | Number of
Contracts | Notional Value | Expiration Date | Unrealized
Depreciation |
| 1NASDAQ 100 Index Short Futures | 300 | $59,865,000 | December 2010 | $(3,617,700) |
| 1Russell 2000 Mini Index Short Futures | 950 | $64,077,500 | December 2010 | $(4,016,125) |
| 1S&P 500 Index Short Futures | 3,350 | $951,986,250 | December 2010 | $(29,238,267) |
| UNREALIZED DEPRECIATION ON FUTURES CONTRACTS | $(36,872,092) |
At September 30, 2010, the Fund had the following outstanding foreign exchange contracts:
| Settlement Date | Foreign
Currency
Units to
Deliver/Receive | In
Exchange
For | Unrealized
Appreciation/
(Depreciation) |
| Contracts Purchased: |
| 10/4/2010 | 1,707,606 Canadian Dollar | $1,657,066 | $2,577 |
| Contracts Sold: |
| 10/1/2010 | 91,000 Canadian Dollar | $87,999 | $(445) |
| 10/4/2010 | 3,858,885 Canadian Dollar | $3,744,672 | $(5,823) |
| NET UNREALIZED DEPRECIATION ON FOREIGN EXCHANGE CONTRACTS | $(3,691) |
Net Unrealized Appreciation/Depreciation on Futures Contracts, Foreign Exchange Contracts and Value of Securities Sold Short are included in “Other Assets and Liabilities — Net.”
| 1 | Non-income producing security. |
| 2 | Denotes a restricted security that either: (a) cannot be offered for public sale without first being registered, or being able to take advantage of an exemption from registration, under the Securities Act of 1933; or (b) is subject to a contractual restriction on public sales. At September 30, 2010, these restricted securities amounted to $3,236,466, which represented 0.2% of total net assets. |
| 3 | Denotes a restricted security that may be resold without restriction to “qualified institutional buyers” as defined in Rule 144A under the Securities Act of 1933 and that the Fund has determined to be liquid under criteria established by the Fund's Board of Trustees (the “Trustees”). At September 30, 2010, these liquid restricted securities amounted to $3,236,466, which represented 0.2% of total net assets. |
| 4 | Affiliated companies. |
| 5 | Discount rate at time of purchase. |
| 6 | Pledged as collateral to ensure the Fund is able to satisfy the obligations of its outstanding futures contracts. |
| 7 | 7-Day net yield. |
Annual Shareholder Report14
| 8 | The cost of investments for federal tax purposes amounts to $1,950,589,091. |
| 9 | Assets, other than investments in securities, less liabilities. See Statement of Assets and Liabilities. |
Note: The categories of investments are shown as a percentage of total net assets at September 30, 2010.
Various inputs are used in determining the value of the Fund's investments. These inputs are summarized in the three broad levels listed below:
Level 1 — quoted prices in active markets for identical securities
Level 2 — other significant observable inputs (including quoted prices for similar securities, interest rates, prepayment speeds, credit risk, etc.)
Level 3 — significant unobservable inputs (including the Fund's own assumptions in determining the fair value of investments)
The inputs or methodology used for valuing securities are not an indication of the risk associated with investing in those securities.
The following is a summary of the inputs used, as of September 30, 2010, in valuing the Fund's assets carried at fair value:
| Valuation Inputs | | | | |
| Level 1 -
Quoted
Prices and
Investments in
Mutual Funds | Level 2 -
Other
Significant
Observable
Inputs | Level 3 -
Significant
Unobservable
Inputs | Total |
| Equity Securities: | | | | |
| Common Stocks | | | | |
| Domestic | $7,724,846 | $ — | $ — | $7,724,846 |
| International | 116,216,025 | 16,544,244 | — | 132,760,269 |
| Warrants | — | 758,262 | — | 758,262 |
| Purchased Put Options | 318,000 | — | — | 318,000 |
| Debt Securities: | | | | |
| U.S. Treasury | — | 1,712,754,775 | — | 1,712,754,775 |
| Mutual Fund | 128,957,391 | — | — | 128,957,391 |
| TOTAL SECURITIES | $253,216,262 | $1,730,057,281 | $ — | $1,983,273,543 |
| OTHER FINANCIAL INSTRUMENTS* | $(493,360,493) | $ — | $ — | $(493,360,493) |
| * | Other financial instruments include securities sold short, futures contracts and foreign exchange contracts. |
The following acronym is used throughout this portfolio:
| ADR | — American Depositary Receipt |
See Notes which are an integral part of the Financial Statements
Annual Shareholder Report15
Statement of Assets and Liabilities
September 30, 2010
| Assets: | | |
| Total investments in securities, at value including $131,508,659 of investments in affiliated issuers (Note 5) (identified cost $1,937,206,576) | | $1,983,273,543 |
| Cash denominated in foreign currencies (identified cost $13,051) | | 13,068 |
| Deposit at broker for short sales | | 524,071,034 |
| Income receivable | | 154,059 |
| Receivable for investments sold | | 9,413,628 |
| Receivable for shares sold | | 15,100,939 |
| Receivable for foreign exchange contracts | | 2,577 |
| Receivable for daily variation margin | | 4,001,130 |
| TOTAL ASSETS | | 2,536,029,978 |
| Liabilities: | | |
| Securities sold short, at value (proceeds $433,800,398) | $456,484,710 | |
| Dividends payable on short positions | 630,788 | |
| Payable for investments purchased | 74,467,232 | |
| Payable for shares redeemed | 7,633,019 | |
| Payable for foreign exchange contracts | 6,268 | |
| Payable for distribution services fee (Note 5) | 171,314 | |
| Payable for shareholder services fee (Note 5) | 570,688 | |
| Accrued expenses | 328,721 | |
| TOTAL LIABILITIES | | 540,292,740 |
| Net assets for 394,245,242 shares outstanding | | $1,995,737,238 |
| Net Assets Consist of: | | |
| Paid-in capital | | $2,358,674,562 |
| Net unrealized depreciation of investments, short sales, futures contracts and translation of assets and liabilities in foreign currency | | (13,489,946) |
| Accumulated net realized loss on investments, short sales, futures contracts and foreign currency transactions | | (342,009,723) |
| Distributions in excess of net investment income/Accumulated net investment income (loss) | | (7,437,655) |
| TOTAL NET ASSETS | | $1,995,737,238 |
Annual Shareholder Report16
Statement of Assets and Liabilities — continued| Net Asset Value, Offering Price and Redemption Proceeds Per Share | | |
| Class A Shares: | | |
| Net asset value per share ($1,212,330,811 ÷ 238,133,836 shares outstanding), no par value, unlimited shares authorized | | $5.09 |
| Offering price per share (100/94.50 of $5.09) | | $5.39 |
| Redemption proceeds per share | | $5.09 |
| Class C Shares: | | |
| Net asset value per share ($197,495,170 ÷ 41,550,065 shares outstanding), no par value, unlimited shares authorized | | $4.75 |
| Offering price per share | | $4.75 |
| Redemption proceeds per share (99.00/100 of $4.75) | | $4.70 |
| Institutional Shares: | | |
| Net asset value per share ($585,911,257 ÷ 114,561,341 shares outstanding), no par value, unlimited shares authorized | | $5.11 |
| Offering price per share | | $5.11 |
| Redemption proceeds per share | | $5.11 |
See Notes which are an integral part of the Financial Statements
Annual Shareholder Report17
Statement of Operations
Year Ended September 30, 2010
| Investment Income: | | | |
| Dividends (including $4,781 received from affiliated issuers (Note 5) and net of foreign taxes withheld of $36,134) | | | $319,129 |
| Interest | | | 1,670,347 |
| TOTAL INCOME | | | 1,989,476 |
| Expenses: | | | |
| Investment adviser fee (Note 5) | | $21,031,852 | |
| Administrative personnel and services fee (Note 5) | | 1,312,782 | |
| Custodian fees | | 67,216 | |
| Transfer and dividend disbursing agent fees and expenses | | 1,844,695 | |
| Directors'/Trustees' fees | | 10,575 | |
| Auditing fees | | 38,450 | |
| Legal fees | | 4,700 | |
| Portfolio accounting fees | | 180,058 | |
| Distribution services fee — Class C Shares (Note 5) | | 1,093,783 | |
| Shareholder services fee — Class A Shares (Note 5) | | 3,157,642 | |
| Shareholder services fee — Class C Shares (Note 5) | | 361,284 | |
| Share registration costs | | 240,922 | |
| Printing and postage | | 198,237 | |
| Insurance premiums | | 6,650 | |
| Dividends and other expenses related to short sales | | 11,671,850 | |
| Miscellaneous | | 4,002 | |
| TOTAL EXPENSES | | 41,224,698 | |
Annual Shareholder Report18
Statement of Operations — continued| Reimbursement, Waiver and Reduction: | | | |
| Reimbursement of investment adviser fee (Note 5) | $(85,019) | | |
| Waiver of administrative personnel and services fee (Note 5) | (32,363) | | |
| Fees paid indirectly from directed brokerage arrangements (Note 6) | (51,700) | | |
| TOTAL REIMBURSEMENT, WAIVER AND REDUCTION | | $(169,082) | |
| Net expenses | | | $41,055,616 |
| Net investment income (loss) | | | (39,066,140) |
| Realized and Unrealized Gain (Loss) on Investments, Short Sales, Futures Contracts and Foreign Currency Transactions: | | | |
| Net realized gain on investments and foreign currency transactions (includes realized loss of $6,088,008 on sales of investments in affiliated issuers (Note 5)) | | | 26,447,254 |
| Net realized loss on short sales | | | (228,869,021) |
| Net realized loss on futures contracts | | | (49,810,033) |
| Net change in unrealized appreciation of investments and translation of assets and liabilities in foreign currency | | | 40,014,117 |
| Net change in unrealized depreciation of short sales | | | 55,190,490 |
| Net change in unrealized depreciation of futures contracts | | | (34,748,895) |
| Net realized and unrealized loss on investments, short sales, futures contracts and foreign currency transactions | | | (191,776,088) |
| Change in net assets resulting from operations | | | $(230,842,228) |
See Notes which are an integral part of the Financial Statements
Annual Shareholder Report19
Statement of Changes in Net Assets
| Year Ended September 30 | 2010 | 2009 |
| Increase (Decrease) in Net Assets | | |
| Operations: | | |
| Net investment income (loss) | $(39,066,140) | $(25,301,822) |
| Net realized gain (loss) on investments, short sales, futures contracts and foreign currency transactions | (252,231,800) | 124,885,764 |
| Net change in unrealized appreciation/depreciation of investments, short sales, futures contracts and translation of assets and liabilities in foreign currency | 60,455,712 | (90,489,372) |
| CHANGE IN NET ASSETS RESULTING FROM OPERATIONS | (230,842,228) | 9,094,570 |
| Distributions to Shareholders: | | |
| Distributions from net realized gain on investments, short sales, futures contracts and foreign currency transactions | | |
| Class A Shares | — | (173,510,350) |
| Class C Shares | — | (10,042,019) |
| Return of capital | | |
| Class A Shares | — | (1,818,702) |
| Class C Shares | — | (105,258) |
| CHANGE IN NET ASSETS RESULTING FROM DISTRIBUTIONS TO SHAREHOLDERS | — | (185,476,329) |
| Share Transactions: | | |
| Proceeds from sale of shares | 2,460,332,069 | 1,467,215,872 |
| Net asset value of shares issued to shareholders in payment of distributions declared | — | 169,504,332 |
| Cost of shares redeemed | (1,508,145,275) | (1,306,118,568) |
| CHANGE IN NET ASSETS RESULTING FROM SHARE TRANSACTIONS | 952,186,794 | 330,601,636 |
| Change in net assets | 721,344,566 | 154,219,877 |
| Net Assets: | | |
| Beginning of period | 1,274,392,672 | 1,120,172,795 |
| End of period (including distributions in excess of net investment income/accumulated net investment income (loss) of $(7,437,655) for the year ended September 30, 2010 and distributions in excess of net investment income of $(2,433,255) for the year ended September 30, 2009) | $1,995,737,238 | $1,274,392,672 |
See Notes which are an integral part of the Financial Statements
Annual Shareholder Report20
Notes to Financial Statements
September 30, 2010
1. ORGANIZATION
Federated Equity Funds (the “Trust”), is registered under the Investment Company Act of 1940, as amended (the “Act”), as a diversified, open-end management investment company. The Trust consists of 12 portfolios. The financial statements included herein are only those of the Federated Prudent Bear Fund (the “Fund”). The financial statements of the other portfolios are presented separately. The assets of each portfolio are segregated and a shareholder's interest is limited to the portfolio in which shares are held. Each portfolio pays its own expenses. The Fund offers three classes of shares: Class A Shares, Class C Shares and Institutional Shares. All shares of the Fund have equal rights with respect to voting, except on class-specific matters. The financial highlights of the Class A Shares and Class C Shares are presented separately. The investment objective of the Fund is to seek capital appreciation.
Prudent Bear Fund (the “Predecessor Fund”) was reorganized into the Fund as of the close of business on December 5, 2008. Prior to the reorganization, the Fund had no investment operations.
The Fund commenced offering Institutional Shares on December 8, 2008.
2. SIGNIFICANT ACCOUNTING POLICIES
The following is a summary of significant accounting policies consistently followed by the Fund in the preparation of its financial statements. These policies are in conformity with U.S. generally accepted accounting principles (GAAP).
Investment Valuation
In calculating its net asset value (NAV), the Fund generally values investments as follows:
- Equity securities including shares of exchange-traded funds listed on an exchange or traded through a regulated market system are valued at their last reported sale price or official closing price in their principal exchange or market.
- Fixed-income securities acquired with remaining maturities greater than 60 days are fair valued using price evaluations provided by a pricing service approved by the Trustees.
- Fixed-income securities acquired with remaining maturities of 60 days or less are valued at their cost (adjusted for the accretion of any discount or amortization of any premium).
- Shares of other mutual funds are valued based upon their reported NAVs.
- Derivative contracts listed on exchanges are valued at their reported settlement or closing price.
- Over-the-counter (OTC) derivative contracts are fair valued using price evaluations provided by a pricing service approved by the Trustees.
If the Fund cannot obtain a price or price evaluation from a pricing service for an investment, the Fund may attempt to value the investment based upon the mean of bid and asked quotations or fair value the investment based on price evaluations, from one or more dealers. If any price, quotation, price evaluation or other pricing source is not readily available when the NAV is calculated, the Fund uses the fair value of the investment determined in accordance with the procedures described below. There can be no assurance that the Fund could purchase or sell an investment at the price used to calculate the Fund's NAV.
Annual Shareholder Report21
Fair Valuation and Significant Events ProceduresThe Trustees have authorized the use of pricing services to provide evaluations of the current fair value of certain investments for purposes of calculating the NAV. Factors considered by pricing services in evaluating an investment include the yields or prices of investments of comparable quality, coupon, maturity, call rights and other potential prepayments, terms and type, reported transactions, indications as to values from dealers and general market conditions. Some pricing services provide a single price evaluation reflecting the bid-side of the market for an investment (a “bid” evaluation). Other pricing services offer both bid evaluations and price evaluations indicative of a price between the prices bid and asked for the investment (a “mid” evaluation). The Fund normally uses bid evaluations for U.S. Treasury and Agency securities, mortgage-backed securities and municipal securities. The Fund normally uses mid evaluations for other types of fixed-income securities and OTC derivative contracts. In the event that market quotations and price evaluations are not available for an investment, the fair value of the investment is determined in accordance with procedures adopted by the Trustees.
The Trustees also have adopted procedures requiring an investment to be priced at its fair value whenever the Adviser determines that a significant event affecting the value of the investment has occurred between the time as of which the price of the investment would otherwise be determined and the time as of which the NAV is computed. An event is considered significant if there is both an affirmative expectation that the investment's value will change in response to the event and a reasonable basis for quantifying the resulting change in value. Examples of significant events that may occur after the close of the principal market on which a security is traded, or after the time of a price evaluation provided by a pricing service or a dealer, include:
- With respect to securities traded in foreign markets, significant trends in U.S. equity markets or in the trading of foreign securities index futures or options contracts;
- With respect to price evaluations of fixed-income securities determined before the close of regular trading on the NYSE, actions by the Federal Reserve Open Market Committee and other significant trends in U.S. fixed-income markets;
- Political or other developments affecting the economy or markets in which an issuer conducts its operations or its securities are traded; and
- Announcements concerning matters such as acquisitions, recapitalizations, litigation developments, a natural disaster affecting the issuer's operations or regulatory changes or market developments affecting the issuer's industry.
The Trustees have approved the use of a pricing service to determine the fair value of equity securities traded principally in foreign markets when the Adviser determines that there has been a significant trend in the U.S. equity markets or in index futures trading. For other significant events, the Fund may seek to obtain more current quotations or price evaluations from alternative pricing sources. If a reliable alternative pricing source is not available, the Fund will determine the fair value of the investment using another method approved by the Trustees.
Repurchase Agreements
It is the policy of the Fund to require the other party to a repurchase agreement to transfer to the Fund's custodian or sub-custodian eligible securities or cash with a market value (after transaction costs) at least equal to the repurchase price to be paid under the repurchase agreement. The eligible securities are transferred to accounts with the custodian or sub-custodian in which the Fund holds a “securities entitlement” and exercises “control” as those terms are defined in the Uniform Commercial Code. The Fund has established procedures for Annual Shareholder Report22
monitoring the market value of the transferred securities and requiring the transfer of additional eligible securities if necessary to equal at least the repurchase price. These procedures also allow the other party to require securities to be transferred from the account to the extent that their market value exceeds the repurchase price or in exchange for other eligible securities of equivalent market value.The insolvency of the other party or other failure to repurchase the securities may delay the disposition of the underlying securities or cause the Fund to receive less than the full repurchase price. Under the terms of the repurchase agreement, any amounts received by the Fund in excess of the repurchase price and related transaction costs must be remitted to the other party.
The Fund may enter into repurchase agreements in which eligible securities are transferred into joint trading accounts maintained by the custodian or sub-custodian for investment companies and other clients advised by the Fund's Adviser and its affiliates. The Fund will participate on a pro rata basis with the other investment companies and clients in its share of the securities transferred under such repurchase agreements and in its share of proceeds from any repurchase or other disposition of such securities.
Investment Income, Gains and Losses, Expenses and Distributions
Investment transactions are accounted for on a trade-date basis. Realized gains and losses from investment transactions are recorded on an identified-cost basis. Interest income and expenses are accrued daily. Dividend income and distributions to shareholders are recorded on the ex-dividend date. Foreign dividends are recorded on the ex-dividend date or when the Fund is informed of the ex-dividend date. Distributions of net investment income, if any, are declared and paid annually. Non-cash dividends included in dividend income, if any, are recorded at fair value. Investment income, realized and unrealized gains and losses and certain fund-level expenses are allocated to each class based on relative average daily net assets, except that each class may bear certain expenses unique to that class such as distribution services and shareholder services fees. Dividends are declared separately for each class. No class has preferential dividend rights; differences in per share dividend rates are generally due to differences in separate class expenses.
Premium and Discount Amortization
All premiums and discounts on fixed-income securities are amortized/accreted for financial statement purposes.
Federal Taxes
It is the Fund's policy to comply with the Subchapter M provision of the Internal Revenue Code (the “Code”) and to distribute to shareholders each year substantially all of its income. Accordingly, no provision for federal income tax is necessary. As of and during the year ended September 30, 2010, the Fund did not have a liability for any uncertain tax positions. The Fund recognizes interest and penalties, if any, related to tax liabilities as income tax expense in the Statement of Operations. As of September 30, 2010, the following tax years remain subject to examination by the Fund's major tax jurisdictions, which include the United States of America (2007 through 2010) and the state of Maryland (2007 and 2008) and the Commonwealth of Massachusetts (2009 and 2010).
The Fund may be subject to taxes imposed by governments of countries in which it invests. Such taxes are generally based on either income or gains earned or repatriated. The Fund accrues and applies such taxes to net investment income, net realized gains and net unrealized gains as income and/or gains are earned.
Annual Shareholder Report23
When-Issued and Delayed Delivery TransactionsThe Fund may engage in when-issued or delayed delivery transactions. The Fund records when-issued securities on the trade date and maintains security positions such that sufficient liquid assets will be available to make payment for the securities purchased. Securities purchased on a when-issued or delayed delivery basis are marked to market daily and begin earning interest on the settlement date. Losses may occur on these transactions due to changes in market conditions or the failure of counterparties to perform under the contract.
Futures Contracts
The Fund purchases and sells financial futures contracts to manage cash flows, enhance yield, manage duration and to potentially reduce transaction costs. Upon entering into a financial futures contract with a broker, the Fund is required to deposit in a segregated account a specified amount of cash or U.S. government securities. Futures contracts are valued daily and unrealized gains or losses are recorded in a “variation margin” account. Daily, the Fund receives from or pays to the broker a specified amount of cash based upon changes in the variation margin account. When a contract is closed, the Fund recognizes a realized gain or loss. Futures contracts have market risks, including the risk that the change in the value of the contract may not correlate with the changes in the value of the underlying securities. There is minimal counterparty risk to the Fund since futures are exchange traded and the exchange's clearinghouse, as counterparty to all exchange-traded futures, guarantees the futures against default.
Futures contracts outstanding at period end are listed after the Fund's Portfolio of Investments.
Foreign Exchange Contracts
The Fund may enter into foreign exchange contracts for the delayed delivery of securities or foreign currency exchange transactions. The Fund may enter into foreign exchange contracts to protect assets against adverse changes in foreign currency exchange rates or exchange control regulations. Purchased contracts are used to acquire exposure to foreign currencies, whereas contracts to sell are used to hedge the Fund's securities against currency fluctuations. Risks may arise upon entering into these transactions from the potential inability of counterparties to meet the terms of their commitments and from unanticipated movements in security prices or foreign exchange rates. The foreign exchange contracts are adjusted by the daily exchange rate of the underlying currency and any gains or losses are recorded for financial statement purposes as unrealized until the settlement date.
Foreign exchange contracts outstanding at period end are listed after the Fund's Portfolio of Investments.
Foreign Currency Translation
The accounting records of the Fund are maintained in U.S. dollars. All assets and liabilities denominated in foreign currencies (FCs) are translated into U.S. dollars based on the rates of exchange of such currencies against U.S. dollars on the date of valuation. Purchases and sales of securities, income and expenses are translated at the rate of exchange quoted on the respective date that such transactions are recorded. The Fund does not isolate that portion of the results of operations resulting from changes in foreign exchange rates on investments from the fluctuations arising from changes in market prices of securities held. Such fluctuations are included with the net realized and unrealized gain or loss from investments.
Annual Shareholder Report24
Reported net realized foreign exchange gains or losses arise from sales of portfolio securities, sales and maturities of short-term securities, sales of FCs, currency gains or losses realized between the trade and settlement dates on securities transactions, the difference between the amounts of dividends, interest and foreign withholding taxes recorded on the Fund's books and the U.S. dollar equivalent of the amounts actually received or paid. Net unrealized foreign exchange gains and losses arise from changes in the value of assets and liabilities other than investments in securities at fiscal year end, resulting from changes in the exchange rate.Short Sales
The Fund may sell a security short in an effort to take advantage of an anticipated decline the price of the security. In a short sale, the Fund sells a security it does not own, and must borrow the security in order to deliver it at completion of the sale. The Fund then has an obligation to replace the borrowed security. While the security is borrowed, the proceeds from the sale are deposited with the lender (Prime Broker). The Prime Broker charges a fee for this service. The Fund may be required to pay interest and/or the equivalent of any dividend payments paid by the security to the Prime Broker. If the Fund can buy the security back at a lower price than it sold for, a gain is realized. If the Fund has to buy the security back at a higher price, a loss is realized. For the year ended September 30, 2010, the Fund had a net realized loss on short sales of $228,869,021.
Restricted Securities
The Fund may purchase securities which are considered restricted. Restricted securities are securities that either: (a) cannot be offered for public sale without first being registered, or being able to take advantage of an exemption from registration, under the Securities Act of 1933; or (b) are subject to contractual restrictions on public sales. In some cases, when a security cannot be offered for public sale without first being registered, the issuer of the restricted security has agreed to register such securities for resale, at the issuer's expense, either upon demand by the Fund or in connection with another registered offering of the securities. Many such restricted securities may be resold in the secondary market in transactions exempt from registration. Restricted securities may be determined to be liquid under criteria established by the Trustees. The Fund will not incur any registration costs upon such resales. The Fund's restricted securities are valued at the price provided by dealers in the secondary market or, if no market prices are available, at the fair value as determined in accordance with procedures established by and under the general supervision of the Trustees.
Annual Shareholder Report25
Additional Disclosure Related to Derivative Instruments| Fair Value of Derivative Instruments |
| Asset | Liability |
| Statement of
Assets and
Liabilities
Location | Fair
Value | Statement of
Assets and
Liabilities
Location | Fair
Value |
Derivatives not accounted
for as hedging instruments
under ASC Topic 815 | | | | |
| Foreign exchange contracts | Receivable for foreign
exchange contracts | $2,577 | Payable for foreign
exchange contracts | $6,268 |
| Equity contracts | Receivable for daily
variation margin | $(36,872,092)* | — | — |
Total derivatives not
accounted for as hedging instruments under
ASC Topic 815 | | $(36,869,515) | | $6,268 |
| * | Includes cumulative depreciation of futures contracts as reported in the footnotes to the Portfolio of Investments. Only the current day's variation margin is reported within the Statement of Assets and Liabilities. |
The Effect of Derivative Instruments on the Statement of Operations for the Year Ended September 30, 2010
| Amount of Realized Gain or (Loss) on Derivatives Recognized in Income |
| Futures | Forward
Currency
Contracts | Options
Purchased | Total |
| Equity contracts | $(49,810,033) | $452 | $5,980,216 | $(43,829,365) |
| Change in Unrealized Appreciation or (Depreciation) on Derivatives Recognized in Income |
| Futures | Forward
Currency
Contracts | Options
Purchased | Total |
| Equity contracts | $(34,748,895) | $(3,691) | $(1,127,665) | $(35,880,251) |
Other
The preparation of financial statements in conformity with GAAP requires management to make estimates and assumptions that affect the amounts of assets, liabilities, expenses and revenues reported in the financial statements. Actual results could differ from those estimated.
Annual Shareholder Report26
3. SHARES OF BENEFICIAL INTERESTThe following tables summarize share activity:
| Year Ended September 30 | 2010 | 2009 |
| Class A Shares: | Shares | Amount | Shares | Amount |
| Shares sold | 285,968,180 | $1,554,891,804 | 181,643,280 | $1,239,068,201 |
| Shares issued to shareholders in payment of distributions declared | — | — | 22,521,701 | 159,903,968 |
| Shares redeemed | (235,697,656) | (1,245,584,477) | (170,901,800) | (1,222,208,200) |
NET CHANGE RESULTING
FROM CLASS A SHARE TRANSACTIONS | 50,270,524 | $309,307,327 | 33,263,181 | $176,763,969 |
| Year Ended September 30 | 2010 | 2009 |
| Class C Shares: | Shares | Amount | Shares | Amount |
| Shares sold | 33,642,033 | $170,008,422 | 15,576,712 | $95,640,248 |
| Shares issued to shareholders in payment of distributions declared | — | — | 1,428,625 | 9,600,364 |
| Shares redeemed | (9,951,764) | (49,491,557) | (9,234,650) | (63,425,320) |
NET CHANGE RESULTING
FROM CLASS C SHARE TRANSACTIONS | 23,690,269 | $120,516,865 | 7,770,687 | $41,815,292 |
| Year Ended
9/30/2010 | Period Ended
9/30/20091 |
| Institutional Shares: | Shares | Amount | Shares | Amount |
| Shares sold | 137,773,705 | $735,431,843 | 20,490,104 | $132,507,423 |
| Shares redeemed | (40,353,512) | (213,069,241) | (3,348,956) | (20,485,048) |
NET CHANGE RESULTING
FROM INSTITUTIONAL SHARE TRANSACTIONS | 97,420,193 | $522,362,602 | 17,141,148 | $112,022,375 |
NET CHANGE RESULTING
FROM TOTAL FUND SHARE TRANSACTIONS | 171,380,986 | $952,186,794 | 58,175,016 | $330,601,636 |
| 1 | Reflects operations for the period from December 8, 2008 (date of initial investment) to September 30, 2009. |
4. FEDERAL TAX INFORMATION
The timing and character of income and capital gain distributions are determined in accordance with income tax regulations, which may differ from GAAP. These differences are due in part to differing treatments for foreign currency transactions, dividends paid on short positions, passive foreign investment company adjustments and net operating loss.
Annual Shareholder Report27
For the year ended September 30, 2010, permanent differences identified and reclassified among the components of net assets were as follows:| Increase (Decrease) |
| Paid-In Capital | Undistributed
Net Investment
Income (Loss) | Accumulated
Net Realized
Gain (Loss) |
| $(28,820,952) | $34,061,740 | $(5,240,788) |
Net investment income (loss), net realized gains (losses) and net assets were not affected by this reclassification.
The tax character of distributions as reported on the Statement of Changes in Net Assets for the years ended September 30, 2010 and 2009, was as follows:
| 2010 | 2009 |
| Ordinary income1 | $ — | $121,757,399 |
| Long-term capital gains | $ — | $61,794,970 |
| Return of capital | $ — | $1,923,960 |
| 1 | For tax purposes, short-term capital gain distributions are considered ordinary income distributions. |
As of September 30, 2010, the components of distributable earnings on a tax basis were as follows:
| Net unrealized appreciation | $1,870,571 |
| Capital loss carryforwards and deferrals | $(364,807,895) |
The difference between book-basis and tax-basis net unrealized appreciation/depreciation is attributable in part to differing treatments for the deferral of losses on wash sales and the realization for tax purposes of unrealized gains on investments in passive foreign investment companies.
At September 30, 2010, the cost of investments for federal tax purposes was $1,950,589,091. The net unrealized appreciation of investments for federal tax purposes excluding any unrealized appreciation/depreciation resulting from changes in foreign currency exchange rates, outstanding foreign currency commitments, short sales and futures contracts was $32,684,452. This consists of net unrealized appreciation from investments for those securities having an excess of value over cost of $45,539,722 and net unrealized depreciation from investments for those securities having an excess of cost over value of $12,855,270.
At September 30, 2010, the Fund had a capital loss carryforward of $68,635,173 which will reduce the Fund's taxable income arising from future net realized gains on investments, if any, to the extent permitted by the Code and thus will reduce the amount of distributions to shareholders which would otherwise be necessary to relieve the Fund of any liability for federal income tax. Pursuant to the Code, such capital loss carryforward will expire in 2018.
Under current tax regulations, capital losses on securities transactions and foreign currency losses realized after October 31 may be deferred and treated as occurring on the first day of the following fiscal year. As of September 30, 2010, for federal income tax purposes, post-October losses of $296,108,293 on capital losses on security transactions and $64,429 on foreign currency losses were deferred to October 1, 2010.
Annual Shareholder Report28
5. INVESTMENT ADVISER FEE AND OTHER TRANSACTIONS WITH AFFILIATESInvestment Adviser Fee
Federated Equity Management Company of Pennsylvania is the Fund's investment adviser (the “Adviser”). The advisory agreement between the Fund and the Adviser provides for an annual fee equal to 1.25% of the Fund's average daily net assets. The Adviser may voluntarily choose to waive any portion of its fee. The Adviser can modify or terminate this voluntary waiver at any time at its sole discretion.
Prior to the close of business on December 5, 2008, the Predecessor Fund's investment adviser was David W. Tice & Associates, LLC. After the close of business on December 5, 2008, the Predecessor Fund was reorganized into the Fund. The annual rate did not change due to this reorganization.
Administrative Fee
Federated Administrative Services (FAS), under the Administrative Services Agreement, provides the Fund with administrative personnel and services. The fee paid to FAS is based on the average aggregate daily net assets of certain Federated funds as specified below:
| Administrative Fee | Average Aggregate Daily Net Assets
of the Federated Funds |
| 0.150% | on the first $5 billion |
| 0.125% | on the next $5 billion |
| 0.100% | on the next $10 billion |
| 0.075% | on assets in excess of $20 billion |
The administrative fee received during any fiscal year shall be at least $150,000 per portfolio and $40,000 per each additional class of Shares. FAS may voluntarily choose to waive any portion of its fee. FAS can modify or terminate this voluntary waiver at any time at its sole discretion. For the year ended September 30, 2010, FAS waived $32,363 of its fee. The net fee paid to FAS was 0.076% of average daily net assets of the Fund.
Prior to the close of business on December 5, 2008, U.S. Bancorp Fund Services, LLC provided administrative services to the Predecessor Fund.
Distribution Services Fee
The Fund has adopted a Distribution Plan (the “Plan”) pursuant to Rule 12b-1 under the Act. Under the terms of the Plan, the Fund will compensate Federated Securities Corp. (FSC), the principal distributor, from the daily net assets of the Fund's Class A Shares and Class C Shares to finance activities intended to result in the sale of these shares. The Plan provides that the Fund may incur distribution expenses at the following percentages of average daily net assets annually, to compensate FSC:
| Share Class Name | Percentage of Average Daily
Net Assets of Class |
| Class A Shares | 0.05% |
| Class C Shares | 0.75% |
Annual Shareholder Report29
FSC may voluntarily choose to waive any portion of its fee. FSC can modify or terminate this voluntary waiver at any time at its sole discretion. When FSC receives fees, it may pay some or all of them to financial intermediaries whose customers purchase shares. For the year ended September 30, 2010, FSC retained $834,910 of fees paid by the Fund. For the year ended September 30, 2010, the Fund's Class A Shares did not incur a distribution services fee; however, it may begin to incur this fee upon approval of the Trustees.
Prior to the close of business on December 5, 2008, Quasar Distributors, LLC was the principal distributor for the Predecessor Fund. The Predecessor Fund adopted a Service and Distribution Plan pursuant to Rule 12b-1 under the Act. The Predecessor Fund's plan authorized payments by the Fund in connection with the distribution of its shares at an annual rate of up to 0.25% of the Fund's average daily net assets for the Class A Shares and 1.00% for the Class C Shares.
Sales Charges
Front-end sales charges and contingent deferred sales charges (CDSC) do not represent expenses of the Fund. They are deducted from the proceeds of sales of Fund shares prior to investment or from redemption proceeds prior to remittance, as applicable. For the year ended September 30, 2010, FSC retained $321,476 in sales charges from the sale of Class A Shares. FSC also retained $2,977 of CDSC relating to redemptions of Class A Shares and $68,503 relating to redemptions of Class C Shares.
Shareholder Services Fee
The Fund may pay fees (“Service Fees”) up to 0.25% of the average daily net assets of the Fund's Class A Shares and Class C Shares to financial intermediaries or to Federated Shareholder Services Company (FSSC) for providing services to shareholders and maintaining shareholder accounts. FSSC may voluntarily reimburse the Fund for Service Fees. This voluntary reimbursement can be modified or terminated at any time. For the year ended September 30, 2010, FSSC received $157,349 of fees paid by the Fund.
Prior to the close of business on December 5, 2008, the Predecessor Fund did not charge a shareholder services fee.
General
Certain Officers and Trustees of the Fund are Officers and Directors or Trustees of the above companies.
Annual Shareholder Report30
Transactions with Affiliated Companies and Affiliated Holdings
An affiliated company is a company in which the Fund has ownership of at least 5% of the voting shares. Transactions with affiliated companies during the year ended September 30, 2010, were as follows:
| Affiliates | Balance of
Shares Held
9/30/2009 | Purchases/
Additions | Sales/
Reductions | Balance of
Shares Held
9/30/2010 | Value | Dividend
Income |
| *Ascot Resources Ltd. | 1,500,000 | 1,500,000 | 3,000,000 | — | $ — | $ — |
| *Ascot Resources Ltd. | 1,140,000 | — | 1,140,000 | — | $ — | $ — |
| *Ascot Resources Ltd. | 360,000 | — | 360,000 | — | $ — | $ — |
| *Kootenay Gold, Inc. | 825,000 | — | 825,000 | — | $ — | $ — |
| *Kootenay Gold, Inc. | 500,000 | — | 500,000 | — | $ — | $ — |
| *Kootenay Gold, Inc. | 1,000,000 | 1,325,000 | 2,325,000 | — | $ — | $ — |
| MacArthur Minerals Ltd. | 1,500,000 | — | — | 1,500,000 | $2,551,268 | $ — |
TOTAL OF AFFILIATED
COMPANIES | 6,825,000 | 2,825,000 | 8,150,000 | 1,500,000 | $2,551,268 | $ — |
| * | At September 30, 2010, the Fund no longer has ownership of at least 5% of the voting shares. |
Affiliated holdings are mutual funds which are managed by the Adviser or an affiliate of the Adviser. The Adviser has agreed to reimburse the Fund for certain investment adviser fees as a result of transactions in other affiliated mutual funds. For the year ended September 30, 2010, the Adviser reimbursed $85,019. Transactions with the affiliated company during the year ended September 30, 2010, were as follows:
| Affiliate | Balance of
Shares Held
9/30/2009 | Purchases/
Additions | Sales/
Reductions | Balance of
Shares Held
9/30/2010 | Value | Dividend
Income |
Federated U.S.
Treasury Cash
Reserves,
Institutional Shares | 123,052,804 | 2,177,358,079 | 2,171,453,492 | 128,957,391 | $128,957,391 | $4,781 |
6. EXPENSE Reduction
The Fund directs portfolio trades to a broker that in turn pays a portion of the Fund's operating expenses. For the year ended September 30, 2010, the Fund's expenses were reduced by $51,700 under these arrangements.
7. Investment TRANSACTIONS
Purchases and sales of investments, excluding long-term U.S. government securities and short-term obligations for the year ended September 30, 2010, were as follows:
| Purchases | $3,087,102,932 |
| Sales | $2,761,649,851 |
Annual Shareholder Report31
8. LINE OF CREDIT
The Fund participates in a $100,000,000 unsecured, uncommitted revolving line of credit (LOC) agreement with PNC Bank. The LOC was made available for extraordinary or emergency purposes, primarily for financing redemption payments. Borrowings are charged interest at a rate offered to the Fund by PNC Bank at the time of the borrowing. As of September 30, 2010, there were no outstanding loans. During the year ended September 30, 2010, the Fund did not utilize the LOC.
9. INTERFUND LENDING
Pursuant to an Exemptive Order issued by the Securities and Exchange Commission, the Fund, along with other funds advised by subsidiaries of Federated Investors, Inc., may participate in an interfund lending program. This program provides an alternative credit facility allowing the Fund to borrow from other participating affiliated funds. As of September 30, 2010, there were no outstanding loans. During the year ended September 30, 2010, the program was not utilized.
10. Legal Proceedings
Since February, 2004, Federated Investors, Inc. and related entities (collectively, “Federated”), have been named as defendants in several lawsuits that are now pending in the United States District Court for the Western District of Pennsylvania. These lawsuits have been consolidated into a single action alleging excessive advisory fees involving one of the Federated-sponsored mutual funds (“Federated Funds”). Federated and its counsel have been defending this litigation. Additional lawsuits based upon similar allegations may be filed in the future. The potential impact of these lawsuits, all of which seek monetary damages, attorneys' fees and expenses, and future potential similar suits is uncertain. Although we do not believe that these lawsuits will have a material adverse effect on the Federated Funds, there can be no assurance that these suits, ongoing adverse publicity and/or other developments resulting from the allegations in these matters will not result in increased redemptions, or reduced sales, of shares of the Federated Funds or other adverse consequences for the Federated Funds.
11. Subsequent events
Management has evaluated subsequent events through the date the financial statements were issued, and determined that no events have occurred that require additional disclosure.
Annual Shareholder Report32
Report of Independent Registered Public Accounting Firm
TO THE BOARD OF TRUSTEES OF THE FEDERATED EQUITY FUNDS AND SHAREHOLDERS OF Federated Prudent bear fund
We have audited the accompanying statement of assets and liabilities, including the portfolio of investments, of Federated Prudent Bear Fund (the “Fund”), a portfolio of Federated Equity Funds, as of September 30, 2010, and the related statement of operations for the year then ended, the statements of changes in net assets for each of the years or periods in the two-year period then ended, and the financial highlights for each of the years or periods in the two-year period then ended. These financial statements and financial highlights are the responsibility of the Fund's management. Our responsibility is to express an opinion on these financial statements and financial highlights based on our audits. The financial highlights for the periods presented prior to October 1, 2008, were audited by other independent registered public accountants whose report thereon dated November 13, 2008, expressed an unqualified opinion on those statements.
We conducted our audits in accordance with the standards of the Public Company Accounting Oversight Board (United States). Those standards require that we plan and perform the audit to obtain reasonable assurance about whether the financial statements and financial highlights are free of material misstatement. An audit includes examining, on a test basis, evidence supporting the amounts and disclosures in the financial statements. Our procedures included confirmation of securities owned as of September 30, 2010, by correspondence with the custodian, transfer agent and brokers, or by other appropriate auditing procedures. An audit also includes assessing the accounting principles used and significant estimates made by management, as well as evaluating the overall financial statement presentation. We believe that our audits provide a reasonable basis for our opinion.
In our opinion, the financial statements and financial highlights referred to above present fairly, in all material respects, the financial position of the Federated Prudent Bear Fund as of September 30, 2010, and the results of its operations for the year then ended, the changes in its net assets for each of the years or periods in the two-year period then ended, and the financial highlights for each of the years or periods in the two-year period then ended, in conformity with U.S. generally accepted accounting principles.
Boston, Massachusetts
November 22, 2010
Annual Shareholder Report33
Board of Trustees and Trust Officers
The Board of Trustees is responsible for managing the Trust's business affairs and for exercising all the Trust's powers except those reserved for the shareholders. The following tables give information about each Trustee and the senior officers of the Fund. Where required, the tables separately list Trustees who are “interested persons” of the Fund (i.e., “Interested” Trustees) and those who are not (i.e., “Independent” Trustees). Unless otherwise noted, the address of each person listed is Federated Investors Tower, 1001 Liberty Avenue, Pittsburgh, PA 15222. The address of all Independent Trustees listed is 4000 Ericsson Drive, Warrendale, PA 15086-7561; Attention: Mutual Fund Board. As of December 31, 2009, the Trust comprised 13 portfolio(s), and the Federated Fund Family consisted of 43 investment companies (comprising 145 portfolios). Unless otherwise noted, each Officer is elected annually. Unless otherwise noted, each Trustee oversees all portfolios in the Federated Fund Family and serves for an indefinite term. The Fund's Statement of Additional Information includes additional information about Trust Trustees and is available, without charge and upon request, by calling 1-800-341-7400.
Interested TRUSTEES Background
Name
Birth Date
Positions Held with Trust
Date Service Began | Principal Occupation(s) for Past Five Years,
Other Directorships Held and Previous Position(s) |
John F. Donahue*
Birth Date: July 28, 1924
Trustee
Began serving: April 1984 | Principal Occupations: Director or Trustee of the Federated Fund Family; Chairman and Director, Federated Investors, Inc.; Chairman of the Federated Fund Family's Executive Committee.
Previous Positions: Chairman of the Federated Fund Family; Trustee, Federated Investment Management Company; Chairman and Director, Federated Investment Counseling. |
J. Christopher Donahue*
Birth Date: April 11, 1949
President and Trustee
Began serving: August 2000 | Principal Occupations: Principal Executive Officer and President of the Federated Fund Family; Director or Trustee of some of the Funds in the Federated Fund Family; President, Chief Executive Officer and Director, Federated Investors, Inc.; Chairman and Trustee, Federated Investment Management Company; Trustee, Federated Investment Counseling; Chairman and Director, Federated Global Investment Management Corp.; Chairman, Federated Equity Management Company of Pennsylvania and Passport Research, Ltd. (investment advisory subsidiary of Federated); Trustee, Federated Shareholder Services Company; Director, Federated Services Company.
Previous Positions: President, Federated Investment Counseling; President and Chief Executive Officer, Federated Investment Management Company, Federated Global Investment Management Corp. and Passport Research, Ltd. |
| * | Family relationships and reasons for “interested” status: John F. Donahue is the father of J. Christopher Donahue; both are “interested” due to their beneficial ownership of shares of Federated Investors, Inc. and the positions they hold with Federated and its subsidiaries. |
Annual Shareholder Report34
INDEPENDENT TRUSTEES Background
Name
Birth Date
Positions Held with Trust
Date Service Began | Principal Occupation(s) for Past Five Years,
Other Directorships Held, Previous Position(s) and Qualifications |
John T. Conroy, Jr., Ph.D.
Birth Date: June 23, 1937
Trustee
Began serving: November 1991 | Principal Occupations: Director or Trustee of the Federated Fund Family; Chairman of the Board, Investment Properties Corporation; Partner or Trustee in private real estate ventures in Southwest Florida; Assistant Professor in Theology, Blessed Edmund Rice School for Pastoral Ministry.
Previous Positions: President, Investment Properties Corporation; Senior Vice President, John R. Wood and Associates, Inc., Realtors; President, Naples Property Management, Inc. and Northgate Village Development Corporation.
Qualifications: Business management and director experience. |
Nicholas P. Constantakis, CPA
Birth Date: September 3, 1939
Trustee
Began serving: February 1998 | Principal Occupation: Director or Trustee of the Federated Fund Family.
Other Directorship Held: Director and Chairman of the Audit Committee, Michael Baker Corporation (architecture, engineering and construction services).
Previous Position: Partner, Andersen Worldwide SC.
Qualifications: Public accounting and director experience. |
John F. Cunningham
Birth Date: March 5, 1943
Trustee
Began serving: January 1999 | Principal Occupation: Director or Trustee of the Federated Fund Family.
Other Directorships Held: Chairman, President and Chief Executive Officer, Cunningham & Co., Inc. (strategic business consulting); Trustee Associate, Boston College.
Previous Positions: Director, Redgate Communications and EMC Corporation (computer storage systems); Chairman of the Board and Chief Executive Officer, Computer Consoles, Inc.; President and Chief Operating Officer, Wang Laboratories; Director, First National Bank of Boston; Director, Apollo Computer, Inc.
Qualifications: Business management and director experience. |
Maureen Lally-Green
Birth Date: July 5, 1949
Trustee
Began serving: August 2009 | Principal Occupations: Director or Trustee of the Federated Fund Family; Director, Office of Church Relations, Diocese of Pittsburgh; Adjunct Professor of Law, Duquesne University School of Law.
Other Directorships Held: Trustee, St. Francis University; Director, Ireland Institute of Pittsburgh; Director, UPMC Mercy Hospital; Regent, St. Vincent Seminary; Director, Epilepsy Foundation of Western and Central Pennsylvania; Director, Saint Thomas More Society, Allegheny County; Director, Carlow University.
Previous Position: Pennsylvania Superior Court Judge.
Qualifications: Legal and director experience. |
Annual Shareholder Report35
Name
Birth Date
Positions Held with Trust
Date Service Began | Principal Occupation(s) for Past Five Years,
Other Directorships Held, Previous Position(s) and Qualifications |
Peter E. Madden
Birth Date: March 16, 1942
Trustee
Began serving: October 1991 | Principal Occupation: Director or Trustee, and Chairman of the Board of Directors or Trustees, of the Federated Fund Family.
Other Directorship Held: Board of Overseers, Babson College.
Previous Positions: Representative, Commonwealth of Massachusetts General Court; President, Chief Operating Officer and Director, State Street Bank and Trust Company and State Street Corporation (retired); Director, VISA USA and VISA International; Chairman and Director, Massachusetts Bankers Association; Director, Depository Trust Corporation; Director, The Boston Stock Exchange.
Qualifications: Business management, mutual fund services and director experience. |
Charles F. Mansfield, Jr.
Birth Date: April 10, 1945
Trustee
Began serving: January 1999 | Principal Occupations: Director or Trustee and Chairman of the Audit Committee of the Federated Fund Family; Management Consultant.
Previous Positions: Chief Executive Officer, PBTC International Bank; Partner, Arthur Young & Company (now Ernst & Young LLP); Chief Financial Officer of Retail Banking Sector, Chase Manhattan Bank; Senior Vice President, HSBC Bank USA (formerly, Marine Midland Bank); Vice President, Citibank; Assistant Professor of Banking and Finance, Frank G. Zarb School of Business, Hofstra University; Executive Vice President, DVC Group, Inc. (marketing, communications and technology).
Qualifications: Banking, business management, public accounting and director experience. |
R. James Nicholson
Birth Date: February 4, 1938
Trustee
Began serving: January 2008 | Principal Occupations: Director or Trustee of the Federated Fund Family; Senior Counsel, Brownstein Hyatt Farber Schrek, P.C.; Former Secretary of the U.S. Dept. of Veterans Affairs; Former U.S. Ambassador to the Holy See; Former Chairman of the Republican National Committee.
Other Directorships Held: Director, Horatio Alger Association; Director, The Daniels Fund.
Previous Positions: Colonel, U.S. Army Reserve; Partner, Calkins, Kramer, Grimshaw and Harring, P.C.; General Counsel, Colorado Association of Housing and Building; Chairman and CEO, Nicholson Enterprises, Inc. (real estate holding company); Chairman and CEO, Renaissance Homes of Colorado.
Qualifications: Legal, government, business management and mutual fund director experience. |
Annual Shareholder Report36
Name
Birth Date
Positions Held with Trust
Date Service Began | Principal Occupation(s) for Past Five Years,
Other Directorships Held, Previous Position(s) and Qualifications |
Thomas M. O'Neill
Birth Date: June 14, 1951
Trustee
Began serving: October 2006 | Principal Occupations: Director or Trustee of the Federated Fund Family; Sole Proprietor, Navigator Management Company (investment and strategic consulting).
Other Directorships Held: Board of Overseers, Children's Hospital of Boston; Visiting Committee on Athletics, Harvard College.
Previous Positions: Chief Executive Officer and President, Managing Director and Chief Investment Officer, Fleet Investment Advisors; President and Chief Executive Officer, Aeltus Investment Management, Inc.; General Partner, Hellman, Jordan Management Co., Boston, MA; Chief Investment Officer, The Putnam Companies, Boston, MA; Credit Analyst and Lending Officer, Fleet Bank; Director and Consultant, EZE Castle Software (investment order management software); Director, Midway Pacific (lumber).
Qualifications: Business management, mutual fund, director and investment experience. |
John S. Walsh
Birth Date: November 28, 1957
Trustee
Began serving: January 1999 | Principal Occupations: Director or Trustee of the Federated Fund Family; President and Director, Heat Wagon, Inc. (manufacturer of construction temporary heaters); President and Director, Manufacturers Products, Inc. (distributor of portable construction heaters); President, Portable Heater Parts, a division of Manufacturers Products, Inc.
Previous Position: Vice President, Walsh & Kelly, Inc.
Qualifications: Business management and director experience. |
James F. Will
Birth Date: October 12, 1938
Trustee
Began serving: April 2006 | Principal Occupations: Director or Trustee of the Federated Fund Family; formerly, Vice Chancellor and President, Saint Vincent College.
Other Directorships Held: Trustee, Saint Vincent College; Director, Alleghany Corporation; Trustee, Wheeling Jesuit University; Director, Liberty Tire Recycling.
Previous Positions: Chairman, President and Chief Executive Officer, Armco, Inc.; President and Chief Executive Officer, Cyclops Industries; President and Chief Operating Officer, Kaiser Steel Corporation.
Qualifications: Business management, education and director experience. |
Annual Shareholder Report37
OFFICERS
Name
Birth Date
Address
Positions Held with Trust
Date Service Began | Principal Occupation(s) for Past Five Years
and Previous Position(s) |
John W. McGonigle
Birth Date: October 26, 1938
Executive Vice President and Secretary
Began serving: April 1984 | Principal Occupations: Executive Vice President and Secretary of the Federated Fund Family; Vice Chairman, Executive Vice President, Secretary and Director, Federated Investors, Inc.
Previous Positions: Trustee, Federated Investment Management Company and Federated Investment Counseling; Director, Federated Global Investment Management Corp., Federated Services Company and Federated Securities Corp. |
Richard A. Novak
Birth Date: December 25, 1963
Treasurer
Began serving: January 2006 | Principal Occupations: Principal Financial Officer and Treasurer of the Federated Fund Family; Senior Vice President, Federated Administrative Services; Financial and Operations Principal for Federated Securities Corp., Edgewood Services, Inc. and Southpointe Distribution Services, Inc.
Previous Positions: Controller of Federated Investors, Inc.; Vice President, Finance of Federated Services Company; held various financial management positions within The Mercy Hospital of Pittsburgh; Auditor, Arthur Andersen & Co. |
Brian P. Bouda
Birth Date: February 28, 1947
Chief Compliance Officer and Senior Vice President
Began serving: August 2004 | Principal Occupations: Senior Vice President and Chief Compliance Officer of the Federated Fund Family; Vice President and Chief Compliance Officer of Federated Investors, Inc. and Chief Compliance Officer of its subsidiaries. Mr. Bouda joined Federated in 1999 and is a member of the American Bar Association and the State Bar Association of Wisconsin. |
Stephen F. Auth
Birth Date: September 3, 1956
450 Lexington Avenue
Suite 3700
New York, NY 10017-3943
CHIEF INVESTMENT OFFICER
Began serving: November 2002 | Principal Occupations: Mr. Auth is Chief Investment Officer of this Fund and various other Funds in the Federated Fund Family; Executive Vice President, Federated Investment Counseling, Federated Global Investment Management Corp. and Federated Equity Management Company of Pennsylvania.
Previous Positions: Executive Vice President, Federated Investment Management Company, and Passport Research, Ltd. (investment advisory subsidiary of Federated); Senior Vice President, Global Portfolio Management Services Division; Senior Vice President, Federated Investment Management Company and Passport Research, Ltd.; Senior Managing Director and Portfolio Manager, Prudential Investments. |
Lawrence Auriana
Birth Date: January 8, 1944
140 East 45th Street
New York, NY 10017
VICE PRESIDENT
Began serving: November 2001 | Principal Occupations: Lawrence Auriana is Vice President of the Trust. Mr. Auriana joined Federated in April 2001 as Co-Head of Investments/Federated Kaufmann. From August 1984 to April 2001, Mr. Auriana was President and Treasurer of Edgemont Asset Management Corp., and Chairman of the Board and Portfolio Manager to The Kaufmann Fund, Inc. (predecessor to the Federated Kaufmann Fund). Mr. Auriana earned a B.S. in economics from Fordham University and has been engaged in the securities business since 1965. |
Annual Shareholder Report38
Name
Birth Date
Address
Positions Held with Trust
Date Service Began | Principal Occupation(s) for Past Five Years
and Previous Position(s) |
Walter C. Bean
Birth Date: June 22, 1945
VICE PRESIDENT
Began serving: November 2006 | Principal Occupations: Walter C. Bean is Vice President of the Trust. Mr. Bean is a Senior Vice President, Senior Portfolio Manager and the Head of the Equity Income Management Team of the Fund's Adviser. Mr. Bean joined Federated in 2000. His previous associations included: various investment management and research positions with C.S. McKee & Company; First Chicago Investment Advisors; CIGNA Investment Advisors; and Mellon Bank. Mr. Bean earned a Bachelors Degree in Business Administration from Ohio University and an M.B.A. from the Pennsylvania State University. Mr. Bean has received the Chartered Financial Analyst designation and has 41 years of investment experience. |
Richard B. Fisher
Birth Date: May 17, 1923
Vice President
Began serving: April 1984 | Principal Occupations: Vice Chairman or Vice President of some of the Funds in the Federated Fund Family; Vice Chairman, Federated Investors, Inc.; Chairman, Federated Securities Corp.
Previous Positions: President and Director or Trustee of some of the Funds in the Federated Fund Family; Executive Vice President, Federated Investors, Inc.; Director and Chief Executive Officer, Federated Securities Corp. |
Hans P. Utsch
Birth Date: July 3, 1936
140 East 45th Street
New York, NY 10017
VICE PRESIDENT
Began serving: November 2001 | Principal Occupations: Hans P. Utsch is Vice President of the Trust. Mr. Utsch joined Federated in April 2001 as Co-Head of Investments/Federated Kaufmann. From August 1984 to April 2001, Mr. Utsch was Chairman of the Board and Secretary of Edgemont Asset Management Corp., and President and Portfolio Manager to The Kaufmann Fund, Inc. (predecessor to the Federated Kaufmann Fund). Mr. Utsch graduated from Amherst College and holds an M.B.A. from Columbia University. He has been engaged in the securities business since 1962. |
Annual Shareholder Report39
Evaluation and Approval of Advisory Contract - May 2010
Federated Prudent Bear Fund (the “Fund”)
The Fund's Board reviewed the Fund's investment advisory contract at meetings held in May 2010. The Board's decision regarding the contract reflects the exercise of its business judgment on whether to continue the existing arrangements.
In this connection, the Federated funds' Board had previously appointed a Senior Officer, whose duties include specified responsibilities relating to the process by which advisory fees are to be charged to a Federated fund. The Senior Officer has the authority to retain consultants, experts, or staff as may be reasonably necessary to assist in the performance of his duties, reports directly to the Board, and may be terminated only with the approval of a majority of the independent members of the Board. The Senior Officer prepared and furnished to the Board an independent, written evaluation that covered topics discussed below. The Board considered that evaluation, along with other information, in deciding to approve the advisory contract.
During its review of the contract, the Board considered compensation and benefits received by the Adviser. This included the fees received for services provided to the Fund by other entities in the Federated organization and research services (if any) received by the Adviser from brokers that execute Federated fund trades, as well as advisory fees. The Board is also familiar with and considered judicial decisions concerning allegedly excessive investment advisory fees, which have indicated that the following factors may be relevant to an Adviser's fiduciary duty with respect to its receipt of compensation from a fund: the nature and quality of the services provided by the Adviser, including the performance of the fund; the Adviser's cost of providing the services; the extent to which the Adviser may realize “economies of scale” as a fund grows larger; any indirect benefits that may accrue to the Adviser and its affiliates as a result of the Adviser's relationship with a fund; performance and expenses of comparable funds; and the extent to which the independent Board members are fully informed about all facts the Board deems relevant bearing on the Adviser's services and fees. The Board further considered management fees (including any components thereof) charged to institutional and other clients of the Adviser for what might be viewed as like services, and the cost to the Adviser and its affiliates of supplying services pursuant to the management fee agreements, excluding any intra-corporate profit and profit margins of the Adviser and its affiliates for supplying such services. The Board was aware of these factors and was guided by them in its review of the Fund's advisory contract to the extent it considered them to be appropriate and relevant, as discussed further below.
Annual Shareholder Report40
The Board considered and weighed these circumstances in light of its substantial accumulated experience in governing the Fund and working with Federated on matters relating to the Federated funds, and was assisted in its deliberations by independent legal counsel. Throughout the year, the Board has requested and received substantial and detailed information about the Fund and the Federated organization that was in addition to the extensive materials that comprise and accompany the Senior Officer's evaluation. Federated provided much of this information at each regular meeting of the Board, and furnished additional reports in connection with the particular meeting at which the Board's formal review of the advisory contract occurred. Between regularly scheduled meetings, the Board also received information on particular matters as the need arose. Thus, the Board's consideration of the advisory contract included review of the Senior Officer's evaluation, accompanying data and additional reports covering such matters as: the Adviser's investment philosophy, revenue, profitability, personnel and processes; investment and operating strategies; the Fund's short- and long-term performance (in absolute terms, both on a gross basis and net of expenses, as well as in relationship to its particular investment program and certain competitor or “peer group” funds and/or other benchmarks, as appropriate), and comments on the reasons for performance; the Fund's investment objectives; the Fund's expenses (including the advisory fee itself and the overall expense structure of the Fund, both in absolute terms and relative to similar and/or competing funds, with due regard for contractual or voluntary expense limitations); the use and allocation of brokerage commissions derived from trading the Fund's portfolio securities (if any); and the nature, quality and extent of the advisory and other services provided to the Fund by the Adviser and its affiliates. The Board also considered the preferences and expectations of Fund shareholders and their relative sophistication; the continuing state of competition in the mutual fund industry and market practices; the range of comparable fees for similar funds in the mutual fund industry; the Fund's relationship to the Federated family of funds which include a comprehensive array of funds with different investment objectives, policies and strategies which are available for exchange without the incurrence of additional sales charges; compliance and audit reports concerning the Federated funds and the Federated companies that service them (including communications from regulatory agencies), as well as Federated's responses to any issues raised therein; and relevant developments in the mutual fund industry and how the Federated funds and/or Federated are responding to them. The Board's evaluation process is evolutionary. The criteria considered and the emphasis placed on relevant criteria change in recognition of changing circumstances in the mutual fund marketplace. With respect to the Fund's performance and expenses in particular, the Board has found the use of comparisons to other mutual funds with comparable investment programs to be relevant, given the high degree of competition in the mutual fund business. The Board focused on comparisons with other similar Annual Shareholder Report41
mutual funds more heavily than non-mutual fund products or services because it is believed that they are more relevant. For example, other mutual funds are the products most like the Fund, they are readily available to Fund shareholders as alternative investment vehicles, and they are the type of investment vehicle in fact chosen and maintained by the Fund's investors. The range of their fees and expenses therefore appears to be a generally reliable indication of what consumers have found to be reasonable in the precise marketplace in which the Fund competes. The Fund's ability to deliver competitive performance when compared to its peer group was a useful indicator of how the Adviser is executing the Fund's investment program, which in turn assisted the Board in reaching a conclusion that the nature, extent, and quality of the Adviser's investment management services were such as to warrant continuation of the advisory contract. In this regard, the Senior Officer has reviewed Federated's fees for providing advisory services to products outside the Federated family of funds (e.g., institutional and separate accounts). He concluded that mutual funds and institutional accounts are inherently different products. Those differences include, but are not limited to, different types of targeted investors; being subject to different laws and regulations; different legal structures; different average account sizes; different associated costs; different portfolio management techniques made necessary by different cash flows; and portfolio manager time spent in review of securities pricing. The Senior Officer did not consider these fee schedules to be determinative in judging the appropriateness of mutual fund advisory contracts.The Senior Officer reviewed reports compiled by Federated, using data supplied by independent fund ranking organizations, regarding the performance of, and fees charged by, other mutual funds, noting his view that comparisons to fund peer groups are relevant in judging the reasonableness of proposed fees.
For the one-year, three-year and five-year periods covered by the report, the Fund's performance was above the median of the relevant peer group.
The Board also received financial information about Federated, including reports on the compensation and benefits Federated derived from its relationships with the Federated funds. These reports covered not only the fees under the advisory contracts, but also fees received by Federated's subsidiaries for providing other services to the Federated funds under separate contracts (e.g., for serving as the Federated funds' administrator). The reports also discussed any indirect benefit Federated may derive from its receipt of research services from brokers who execute Federated fund trades. In addition, the Board considered the fact that, in order for a fund to be competitive in the marketplace, Federated and its affiliates frequently waived fees and/or reimbursed expenses and have disclosed to fund investors and/or indicated to the Board their intention to do so in the future, where appropriate. Moreover, the Board receives regular reports regarding the institution or elimination of these voluntary waivers.
Annual Shareholder Report42
Federated furnished reports, requested by the Senior Officer, that reported revenues on a fund-by-fund basis and made estimates of the allocation of expenses on a fund-by-fund basis, using allocation methodologies specified by the Senior Officer. The Senior Officer noted that, although they may apply consistent allocation processes, the inherent difficulties in allocating costs (and the unavoidable arbitrary aspects of that exercise) and the lack of consensus on how to allocate those costs may render such allocation reports unreliable. The allocation reports were considered in the analysis by the Board but were determined to be of limited use.The Board and the Senior Officer also reviewed a report compiled by Federated comparing profitability information for Federated to other publicly held fund management companies. In this regard, the Senior Officer noted the limited availability of such information, but nonetheless concluded that Federated's profit margins did not appear to be excessive and the Board agreed.
The Senior Officer's evaluation also discussed the notion of possible realization of “economies of scale” as a fund grows larger. The Board considered in this regard that the Adviser has made significant and long-term investments in areas that support all of the Federated funds, such as personnel and processes for the portfolio management, compliance, and risk management functions; and systems technology; and that the benefits of these efforts (as well as any economies, should they exist) were likely to be enjoyed by the fund complex as a whole. Finally, the Board also noted the absence of any applicable regulatory or industry guidelines on this subject, which (as discussed in the Senior Officer's evaluation) is compounded by the lack of any common industry practice or general pattern with respect to structuring fund advisory fees with “breakpoints” that serve to reduce the fee as the fund attains a certain size. The Senior Officer did not recommend institution of breakpoints in pricing Federated's fund advisory services at this time.
It was noted in the materials for the Board meeting that for the period covered by the report, the Fund's investment advisory fee, after waivers and expense reimbursements, if any, was above the median of the relevant peer group. The Board reviewed the fees and other expenses of the Fund with the Adviser and was satisfied that the overall expense structure of the Fund remained competitive. The Board will continue to monitor advisory fees and other expenses borne by the Fund.
The Senior Officer's evaluation noted his belief that the information and observations contained in his evaluation supported a finding that the proposed management fees are reasonable, and that Federated appeared to provide appropriate administrative services to the Fund for the fees paid. Under these circumstances, no changes were recommended to, and no objection was raised to, the continuation of the Fund's advisory contract. The Board concluded that the nature, quality and scope of services provided the Fund by the Adviser and its affiliates were satisfactory.
Annual Shareholder Report43
In its decision to continue an existing investment advisory contract, the Board was mindful of the potential disruptions of the Fund's operations and various risks, uncertainties and other effects that could occur as a result of a decision to terminate or not renew an advisory contract. In particular, the Board recognized that many shareholders have invested in the Fund on the strength of the Adviser's industry standing and reputation and with the expectation that the Adviser will have a continuing role in providing advisory services to the Fund. Thus, the Board's approval of the advisory contract reflected the fact that it is the shareholders who have effectively selected the Adviser by virtue of having invested in the Fund.The Board based its decision to approve the advisory contract on the totality of the circumstances and relevant factors and with a view to past and future long-term considerations. Not all of the factors and considerations identified above were necessarily relevant to the Fund, nor did the Board consider any one of them to be determinative. With respect to the factors that were relevant, the Board's decision to approve the contract reflects its determination that Federated's performance and actions provided a satisfactory basis to support the decision to continue the existing arrangements.
Annual Shareholder Report44
Voting Proxies on Fund Portfolio Securities
A description of the policies and procedures that the Fund uses to determine how to vote proxies, if any, relating to securities held in the Fund's portfolio is available, without charge and upon request, by calling 1-800-341-7400. A report on “Form N-PX” of how the Fund voted any such proxies during the most recent 12-month period ended June 30 is available from Federated's website at FederatedInvestors.com. To access this information from the “Products” section of the website, click on the “Prospectuses and Regulatory Reports” link under “Related Information,” then select the appropriate link opposite the name of the Fund; or select the name of the Fund and from the Fund's page, click on the “Prospectuses and Regulatory Reports” link. Form N-PX filings are also available at the SEC's website at www.sec.gov.
Quarterly Portfolio Schedule
The Fund files with the SEC a complete schedule of its portfolio holdings, as of the close of the first and third quarters of its fiscal year, on “Form N-Q.” These filings are available on the SEC's website at www.sec.gov and may be reviewed and copied at the SEC's Public Reference Room in Washington, DC. (Call 1-800-SEC-0330 for information on the operation of the Public Reference Room.) You may also access this information from the “Products” section of Federated's website at FederatedInvestors.com by clicking on “Portfolio Holdings” under “Related Information,” then selecting the appropriate link opposite the name of the Fund; or select the name of the Fund and from the Fund's page, click on the “Portfolio Holdings” link.
Annual Shareholder Report45
Mutual funds are not bank deposits or obligations, are not guaranteed by any bank and are not insured or guaranteed by the U.S. government, the Federal Deposit Insurance Corporation, the Federal Reserve Board or any other government agency. Investment in mutual funds involves investment risk, including the possible loss of principal.
This Report is authorized for distribution to prospective investors only when preceded or accompanied by the Fund's Prospectus, which contains facts concerning its objective and policies, management fees, expenses and other information.
Federated Prudent Bear Fund
Federated Investors Funds
4000 Ericsson Drive
Warrendale, PA 15086-7561
Contact us at FederatedInvestors.com
or call 1-800-341-7400.
Federated Securities Corp., Distributor
Cusip 314172339
41203 (11/10)
Federated is a registered mark of Federated Investors, Inc.
2010 © Federated Investors, Inc.
Item 2. Code of Ethics
(a) As of the end of the period covered by this report, the registrant has adopted a code of ethics (the "Section 406 Standards for Investment Companies - Ethical Standards for Principal Executive and Financial Officers") that applies to the registrant's Principal Executive Officer and Principal Financial Officer; the registrant's Principal Financial Officer also serves as the Principal Accounting Officer.
(c) Not Applicable
(d) Not Applicable
(e) Not Applicable
(f)(3) The registrant hereby undertakes to provide any person, without charge, upon request, a copy of the code of ethics. To request a copy of the code of ethics, contact the registrant at 1-800-341-7400, and ask for a copy of the Section 406 Standards for Investment Companies - Ethical Standards for Principal Executive and Financial Officers.
Item 3. Audit Committee Financial Expert
The registrant's Board has determined that each of the following members of the Board's Audit Committee is an “audit committee financial expert,” and is "independent," for purposes of this Item: Nicholas P. Constantakis, Charles F. Mansfield, Jr. and Thomas M. O’Neill.
Item 4. Principal Accountant Fees and Services
(a) Audit Fees billed to the registrant for the two most recent fiscal years:
Fiscal year ended 2010 - $379,900
Fiscal year ended 2009 - $375,500
(b) Audit-Related Fees billed to the registrant for the two most recent fiscal years:
Fiscal year ended 2010 - $7,510
Fiscal year ended 2009 - $0
Audit Committee Meetings and audit procedures in connection with fund reorganization.
Amount requiring approval of the registrant’s audit committee pursuant to paragraph (c)(7)(ii) of Rule 2-01 of Regulation S-X, $7,289 and $5,000 respectively. Fiscal year ended 2010- Audit consent fees related to N-14 merger filing and new share class prospectus. Fiscal year ended 2009- Audit consent fees related to N-14 merger filing.
(c) Tax Fees billed to the registrant for the two most recent fiscal years:
Fiscal year ended 2010 - $0
Fiscal year ended 2009 - $0
Amount requiring approval of the registrant’s audit committee pursuant to paragraph (c)(7)(ii) of Rule 2-01 of Regulation S-X, $0 and $0 respectively.
(d) All Other Fees billed to the registrant for the two most recent fiscal years:
Fiscal year ended 2010 - $0
Fiscal year ended 2009 - $0
Amount requiring approval of the registrant’s audit committee pursuant to paragraph (c)(7)(ii) of Rule 2-01 of Regulation S-X, $118,702 and $74,431 respectively. Fiscal year ended 2010- Fees related to technical assistance and valuation matters for fund acquisitions and service fees for analysis of potential Passive Foreign Investment Company holdings. Fiscal year ended 2009 - Discussion on accounting related to REMICs, fees related to technical assistance and valuation matters for various fund acquisitions, and fees related to PFIC analyses.
(e)(1) Audit Committee Policies regarding Pre-approval of Services.
The Audit Committee is required to pre-approve audit and non-audit services performed by the independent auditor in order to assure that the provision of such services do not impair the auditor’s independence. Unless a type of service to be provided by the independent auditor has received general pre-approval, it will require specific pre-approval by the Audit Committee. Any proposed services exceeding pre-approved cost levels will require specific pre-approval by the Audit Committee.
Certain services have the general pre-approval of the Audit Committee. The term of the general pre-approval is 12 months from the date of pre-approval, unless the Audit Committee specifically provides for a different period. The Audit Committee will annually review the services that may be provided by the independent auditor without obtaining specific pre-approval from the Audit Committee and may grant general pre-approval for such services. The Audit Committee will revise the list of general pre-approved services from time to time, based on subsequent determinations. The Audit Committee will not delegate its responsibilities to pre-approve services performed by the independent auditor to management.
The Audit Committee has delegated pre-approval authority to its Chairman. The Chairman will report any pre-approval decisions to the Audit Committee at its next scheduled meeting. The Committee will designate another member with such pre-approval authority when the Chairman is unavailable.
AUDIT SERVICES
The annual Audit services engagement terms and fees will be subject to the specific pre-approval of the Audit Committee. The Audit Committee must approve any changes in terms, conditions and fees resulting from changes in audit scope, registered investment company (RIC) structure or other matters.
In addition to the annual Audit services engagement specifically approved by the Audit Committee, the Audit Committee may grant general pre-approval for other Audit Services, which are those services that only the independent auditor reasonably can provide. The Audit Committee has pre-approved certain Audit services, all other Audit services must be specifically pre-approved by the Audit Committee.
AUDIT-RELATED SERVICES
Audit-related services are assurance and related services that are reasonably related to the performance of the audit or review of the Company’s financial statements or that are traditionally performed by the independent auditor. The Audit Committee believes that the provision of Audit-related services does not impair the independence of the auditor, and has pre-approved certain Audit-related services, all other Audit-related services must be specifically pre-approved by the Audit Committee.
TAX SERVICES
The Audit Committee believes that the independent auditor can provide Tax services to the Company such as tax compliance, tax planning and tax advice without impairing the auditor’s independence. However, the Audit Committee will not permit the retention of the independent auditor in connection with a transaction initially recommended by the independent auditor, the purpose of which may be tax avoidance and the tax treatment of which may not be supported in the Internal Revenue Code and related regulations. The Audit Committee has pre-approved certain Tax services, all Tax services involving large and complex transactions must be specifically pre-approved by the Audit Committee.
ALL OTHER SERVICES
With respect to the provision of services other than audit, review or attest services the pre-approval requirement is waived if:
| (1) | The aggregate amount of all such services provided constitutes no more than five percent of the total amount of revenues paid by the registrant, the registrant’s adviser (not including any sub-adviser whose role is primarily portfolio management and is subcontracted with or overseen by another investment adviser), and any entity controlling, controlled by, or under common control with the investment adviser that provides ongoing services to the registrant to its accountant during the fiscal year in which the services are provided; |
| (2) | Such services were not recognized by the registrant, the registrant’s adviser (not including any sub-adviser whose role is primarily portfolio management and is subcontracted with or overseen by another investment adviser), and any entity controlling, controlled by, or under common control with the investment adviser that provides ongoing services to the registrant at the time of the engagement to be non-audit services; and |
| (3) | Such services are promptly brought to the attention of the Audit Committee of the issuer and approved prior to the completion of the audit by the Audit Committee or by one or more members of the Audit Committee who are members of the board of directors to whom authority to grant such approvals has been delegated by the Audit Committee. |
The Audit Committee may grant general pre-approval to those permissible non-audit services classified as All Other services that it believes are routine and recurring services, and would not impair the independence of the auditor.
The SEC’s rules and relevant guidance should be consulted to determine the precise definitions of prohibited non-audit services and the applicability of exceptions to certain of the prohibitions.
PRE-APPROVAL FEE LEVELS
Pre-approval fee levels for all services to be provided by the independent auditor will be established annually by the Audit Committee. Any proposed services exceeding these levels will require specific pre-approval by the Audit Committee.
PROCEDURES
Requests or applications to provide services that require specific approval by the Audit Committee will be submitted to the Audit Committee by both the independent auditor and the Principal Accounting Officer and/or Internal Auditor, and must include a joint statement as to whether, in their view, the request or application is consistent with the SEC’s rules on auditor independence.
(e)(2) Percentage of services identified in items 4(b) through 4(d) that were approved by the registrants audit committee pursuant to paragraph (c)(7)(i)(C) of Rule 2-01 of Regulation S-X:
4(b)
Fiscal year ended 2010 – 0%
Fiscal year ended 2009 - 0%
Percentage of services provided to the registrants investment adviser and any entity controlling, controlled by, or under common control with the investment adviser that provides ongoing services to the registrant that were approved by the registrants audit committee pursuant to paragraph (c)(7)(i)(C) of Rule 2-01 of Regulation S-X, 0% and 0% respectively.
4(c)
Fiscal year ended 2010 – 0%
Fiscal year ended 2009 – 0%
Percentage of services provided to the registrants investment adviser and any entity controlling, controlled by, or under common control with the investment adviser that provides ongoing services to the registrant that were approved by the registrants audit committee pursuant to paragraph (c)(7)(i)(C) of Rule 2-01 of Regulation S-X, 0% and 0% respectively.
4(d)
Fiscal year ended 2010 – 0%
Fiscal year ended 2009 – 0%
Percentage of services provided to the registrants investment adviser and any entity controlling, controlled by, or under common control with the investment adviser that provides ongoing services to the registrant that were approved by the registrants audit committee pursuant to paragraph (c)(7)(i)(C) of Rule 2-01 of Regulation S-X, 0% and 0% respectively.
| (g) | Non-Audit Fees billed to the registrant, the registrant’s investment adviser, and certain entities controlling, controlled by or under common control with the investment adviser: |
Fiscal year ended 2010 - $663,073
Fiscal year ended 2009 - $195,666
(h) The registrant’s Audit Committee has considered that the provision of non-audit services that were rendered to the registrant’s adviser (not including any sub-adviser whose role is primarily portfolio management and is subcontracted with or overseen by another investment adviser), and any entity controlling, controlled by, or under common control with the investment adviser that provides ongoing services to the registrant that were not pre-approved pursuant to paragraph (c)(7)(ii) of Rule 2-01 of Regulation S-X is compatible with maintaining the principal accountant’s independence.
Item 5. Audit Committee of Listed Registrants
Not Applicable
Item 6. Schedule of Investments
Not Applicable
| Item 7. | Disclosure of Proxy Voting Policies and Procedures for Closed-End Management Investment Companies |
| Item 8. | Portfolio Managers of Closed-End Management Investment Companies |
| Item 9. | Purchases of Equity Securities by Closed-End Management Investment Company and Affiliated Purchasers |
Item 10. Submission of Matters to a Vote of Security Holders
Not Applicable
Item 11. Controls and Procedures
(a) The registrant’s President and Treasurer have concluded that the
registrant’s disclosure controls and procedures (as defined in rule 30a-3(c) under the Act) are effective in design and operation and are sufficient to form the basis of the certifications required by Rule 30a-(2) under the Act, based on their evaluation of these disclosure controls and procedures within 90 days of the filing date of this report on Form N-CSR.
(b) There were no changes in the registrant’s internal control over financial reporting (as defined in rule 30a-3(d) under the Act) during the last fiscal quarter that have materially affected, or are reasonably likely to materially affect, the registrant’s internal control over financial reporting.
Item 12. Exhibits
SIGNATURES
Pursuant to the requirements of the Securities Exchange Act of 1934 and the Investment Company Act of 1940, the registrant has duly caused this report to be signed on its behalf by the undersigned, thereunto duly authorized.
| Registrant | Federated Equity Funds |
| | |
| By | /S/ Richard A. Novak |
| | Richard A. Novak, Principal Financial Officer |
| Date | November 18, 2010 |
| | |
| | |
| Pursuant to the requirements of the Securities Exchange Act of 1934 and the Investment Company Act of 1940, this report has been signed below by the following persons on behalf of the registrant and in the capacities and on the dates indicated. |
| | |
| | |
| By | /S/ J. Christopher Donahue |
| | J. Christopher Donahue, Principal Executive Officer |
| Date | November 18, 2010 |
| | |
| | |
| By | /S/ Richard A. Novak |
| | Richard A. Novak, Principal Financial Officer |
| Date | November 18, 2010 |