United States
Securities and Exchange Commission
Washington, D.C. 20549
Form N-CSR
Certified Shareholder Report of Registered Management Investment Companies
811-4017
(Investment Company Act File Number)
Federated Equity Funds
_______________________________________________________________
(Exact Name of Registrant as Specified in Charter)
Federated Investors Funds
4000 Ericsson Drive
Warrendale, Pennsylvania 15086-7561
(Address of Principal Executive Offices)
(412) 288-1900
(Registrant's Telephone Number)
John W. McGonigle, Esquire
Federated Investors Tower
1001 Liberty Avenue
Pittsburgh, Pennsylvania 15222-3779
(Name and Address of Agent for Service)
(Notices should be sent to the Agent for Service)
Date of Fiscal Year End: 11/30/2010
Date of Reporting Period: 11/30/2010
Item 1. Reports to Stockholders
Federated InterContinental FundSuccessor to the Rochdale Atlas Portfolio Established 1998
A Portfolio of Federated Equity Funds
ANNUAL SHAREHOLDER REPORTNovember 30, 2010
Class A Shares
Class B Shares
Class C Shares
Class K Shares
(Effective December 31, 2010, the Fund's Class K Shares will be redesignated as Class R Shares)
FINANCIAL HIGHLIGHTS
SHAREHOLDER EXPENSE EXAMPLE
MANAGEMENT'S DISCUSSION OF FUND PERFORMANCE
PORTFOLIO OF INVESTMENTS SUMMARY TABLES
PORTFOLIO OF INVESTMENTS
STATEMENT OF ASSETS AND LIABILITIES
STATEMENT OF OPERATIONS
STATEMENT OF CHANGES IN NET ASSETS
NOTES TO FINANCIAL STATEMENTS
REPORT OF INDEPENDENT REGISTERED PUBLIC ACCOUNTING FIRM
BOARD OF TRUSTEES AND TRUST OFFICERS
EVALUATION AND APPROVAL OF ADVISORY CONTRACT
VOTING PROXIES ON FUND PORTFOLIO SECURITIES
QUARTERLY PORTFOLIO SCHEDULE
Financial Highlights – Class A Shares
(For a Share Outstanding Throughout Each Period)
| Year Ended
November 30, | Period
Ended
11/30/20071,2 | Year Ended
December 31, |
| 2010 | 2009 | 2008 | 2006 | 2005 |
Net Asset Value,
Beginning of Period | $43.37 | $31.59 | $70.32 | $56.98 | $43.69 | $36.32 |
Income From
Investment Operations: | | | | | | |
| Net investment income | 0.333 | 0.413 | 1.343 | 0.933 | 0.72 | 0.38 |
| Net realized and unrealized gain (loss) on investments, futures contracts and foreign currency transactions | 2.94 | 13.22 | (37.24) | 12.41 | 13.78 | 7.27 |
TOTAL FROM
INVESTMENT
OPERATIONS | 3.27 | 13.63 | (35.90) | 13.34 | 14.50 | 7.65 |
| Less Distributions: | | | | | | |
| Distributions from net investment income | (0.97) | (1.87) | (0.47) | — | (0.65) | (0.28) |
| Distributions from net realized gain on investments and foreign currency transactions | — | — | (2.36) | — | (0.57) | — |
| TOTAL DISTRIBUTIONS | (0.97) | (1.87) | (2.83) | — | (1.22) | (0.28) |
| Redemption Fees | 0.004 | 0.004 | 0.004 | 0.004 | 0.01 | 0.00 |
Regulatory
Settlement Proceeds | 0.015 | 0.026 | — | — | — | — |
Net Asset Value,
End of Period | $45.68 | $43.37 | $31.59 | $70.32 | $56.98 | $43.69 |
| Total Return7 | 7.69%5 | 45.34%6 | (53.15)% | 23.41% | 33.26% | 21.07 |
Ratios to Average
Net Assets: | | | | | | |
| Net expenses | 1.48%8 | 1.50% | 1.50% | 1.63%9 | 1.70% | 1.65% |
| Net investment income | 0.78% | 1.17% | 2.45% | 1.45%9 | 1.38% | 1.15% |
| Expense waiver/reimbursement10 | 0.10% | 0.13% | 0.08% | 0.06%9 | — | — |
| Supplemental Data: | | | | | | |
| Net assets, end of period (000 omitted) | $503,104 | $467,912 | $382,447 | $519,855 | $273,595 | $135,097 |
| Portfolio turnover | 71% | 121% | 65% | 28% | 56% | 39% |
Annual Shareholder Report
1
| 1 | The Fund changed its fiscal year end from December 31 to November 30. |
| 2 | Beginning with the period ended November 30, 2007, the Fund was audited by KPMG LLP. The previous years were audited by another independent registered public accounting firm. |
| 3 | Per share numbers have been calculated using the average shares method. |
| 4 | Represents less than $0.01. |
| 5 | During the year ended November 30, 2010, the Fund received a regulatory settlement from an unaffiliated third party, which had an impact of 0.05% on the total return. |
| 6 | During the year ended November 30, 2009, the Fund received a regulatory settlement from an unaffiliated third party, which had an impact of 0.07% on the total return. |
| 7 | Based on net asset value, which does not reflect the sales charge, redemption fee or contingent deferred sales charge, if applicable. Total returns for periods of less than one year are not annualized. |
| 8 | The net expense ratio is calculated without reduction for expense offset arrangements. The net expense ratio is 1.48% for the year ended November 30, 2010, after taking into account this expense reduction. |
| 9 | Computed on an annualized basis. |
| 10 | This expense decrease is reflected in both the net expense and the net investment income ratios shown above. |
See Notes which are an integral part of the Financial Statements
Annual Shareholder Report2
Financial Highlights – Class B Shares
(For a Share Outstanding Throughout Each Period)
| Year Ended November 30, | Period Ended
11/30/20071 |
| 2010 | 2009 | 2008 |
| Net Asset Value, Beginning of Period | $43.19 | $31.32 | $70.20 | $65.15 |
| Income From Investment Operations: | | | | |
| Net investment income (loss) | 0.002 | 0.172 | 1.022 | (0.10)2 |
| Net realized and unrealized gain (loss) on investments, futures contracts and foreign currency transactions | 2.91 | 13.14 | (37.14) | 5.15 |
| TOTAL FROM INVESTMENT OPERATIONS | 2.91 | 13.31 | (36.12) | 5.05 |
| Less Distributions: | | | | |
| Distributions from net investment income | (0.66) | (1.46) | (0.40) | — |
| Distributions from net realized gain on investments and foreign currency transactions | — | — | (2.36) | — |
| TOTAL DISTRIBUTIONS | (0.66) | (1.46) | (2.76) | — |
| Redemption Fees | 0.003 | 0.003 | 0.003 | — |
| Regulatory Settlement Proceeds | 0.014 | 0.025 | — | — |
| Net Asset Value, End of Period | $45.45 | $43.19 | $31.32 | $70.20 |
| Total Return6 | 6.84%4 | 44.21%5 | (53.51)% | 7.75% |
| Ratios to Average Net Assets: | | | | |
| Net expenses | 2.27%7 | 2.29% | 2.29% | 2.30%9 |
| Net investment income (loss) | 0.00%8 | 0.49% | 1.89% | (0.53)%9 |
| Expense waiver/reimbursement10 | 0.18% | 0.19% | 0.12% | 0.21%9 |
| Supplemental Data: | | | | |
| Net assets, end of period (000 omitted) | $17,381 | $20,886 | $17,344 | $11,299 |
| Portfolio turnover | 71% | 121% | 65% | 28%11 |
| 1 | Reflects operations for the period from August 25, 2007 (start of performance) to November 30, 2007. |
| 2 | Per share numbers have been calculated using the average shares method. |
| 3 | Represents less than $0.01. |
| 4 | During the year ended November 30, 2010, the Fund received a regulatory settlement from an unaffiliated third party, which had an impact of 0.05% on the total return. |
| 5 | During the year ended November 30, 2009, the Fund received a regulatory settlement from an unaffiliated third party, which had an impact of 0.10% on the total return. |
| 6 | Based on net asset value, which does not reflect the sales charge, redemption fee or contingent deferred sales charge, if applicable. Total returns for periods of less than one year are not annualized. |
| 7 | The net expense ratio is calculated without reduction for expense offset arrangements. The net expense ratio is 2.27% for the year ended November 30, 2010, after taking into account this expense reduction. |
| 8 | Represents less than 0.01%. |
| 9 | Computed on an annualized basis. |
| 10 | This expense decrease is reflected in both the net expense and the net investment income (loss) ratios shown above. |
| 11 | Portfolio turnover is calculated at the Fund level. Percentage indicated was calculated for the period from January 1, 2007 to November 30, 2007. |
See Notes which are an integral part of the Financial Statements
Annual Shareholder Report3
Financial Highlights – Class C Shares
(For a Share Outstanding Throughout Each Period)
| Year Ended November 30, | Period Ended
11/30/20071 |
| 2010 | 2009 | 2008 |
| Net Asset Value, Beginning of Period | $43.09 | $31.31 | $70.19 | $65.15 |
| Income From Investment Operations: | | | | |
| Net investment income (loss) | (0.00)2 | 0.182 | 1.012 | (0.09)2 |
| Net realized and unrealized gain (loss) on investments, futures contracts and foreign currency transactions | 2.90 | 13.10 | (37.11) | 5.13 |
| TOTAL FROM INVESTMENT OPERATIONS | 2.90 | 13.28 | (36.10) | 5.04 |
| Less Distributions: | | | | |
| Distributions from net investment income | (0.66) | (1.52) | (0.42) | — |
| Distributions from net realized gain on investments and foreign currency transactions | — | — | (2.36) | — |
| TOTAL DISTRIBUTIONS | (0.66) | (1.52) | (2.78) | — |
| Redemption Fees | 0.003 | 0.003 | 0.003 | — |
| Regulatory Settlement Proceeds | 0.014 | 0.025 | — | — |
| Net Asset Value, End of Period | $45.34 | $43.09 | $31.31 | $70.19 |
| Total Return6 | 6.84%4 | 44.20%5 | (53.51)% | 7.74% |
| Ratios to Average Net Assets: | | | | |
| Net expenses | 2.27%7 | 2.27% | 2.28% | 2.29%8 |
| Net investment income (loss) | (0.01)% | 0.51% | 1.89% | (0.47)%8 |
| Expense waiver/reimbursement9 | 0.10% | 0.11% | 0.10% | 0.23%8 |
| Supplemental Data: | | | | |
| Net assets, end of period (000 omitted) | $64,512 | $69,582 | $59,407 | $29,920 |
| Portfolio turnover | 71% | 121% | 65% | 28%10 |
| 1 | Reflects operations for the period from August 25, 2007 (start of performance) to November 30, 2007. |
| 2 | Per share numbers have been calculated using the average shares method. |
| 3 | Represents less than $0.01. |
| 4 | During the year ended November 30, 2010, the Fund received a regulatory settlement from an unaffiliated third party, which had an impact of 0.02% on the total return. |
| 5 | During the year ended November 30, 2009, the Fund received a regulatory settlement from an unaffiliated third party, which had an impact of 0.07% on the total return. |
| 6 | Based on net asset value, which does not reflect the sales charge, redemption fee or contingent deferred sales charge, if applicable. Total returns for periods of less than one year are not annualized. |
| 7 | The net expense ratio is calculated without reduction for expense offset arrangements. The net expense ratio is 2.27% for the year ended November 30, 2010, after taking into account this expense reduction. |
| 8 | Computed on an annualized basis. |
| 9 | This expense decrease is reflected in both the net expense and the net investment income (loss) ratios shown above. |
| 10 | Portfolio turnover is calculated at the Fund level. Percentage indicated was calculated for the period from January 1, 2007 to November 30, 2007. |
See Notes which are an integral part of the Financial Statements
Annual Shareholder Report4
Financial Highlights – Class K Shares
(For a Share Outstanding Throughout Each Period)
| Year Ended November 30, | Period Ended
11/30/20071 |
| 2010 | 2009 | 2008 |
| Net Asset Value, Beginning of Period | $42.91 | $31.45 | $70.24 | $65.15 |
| Income From Investment Operations: | | | | |
| Net investment income (loss) | 0.242 | (0.09) 2 | 0.732 | (0.07)2 |
| Net realized and unrealized gain (loss) on investments, futures contracts and foreign currency transactions | 2.80 | 13.47 | (36.77) | 5.16 |
| TOTAL FROM INVESTMENT OPERATIONS | 3.04 | 13.38 | (36.04) | 5.09 |
| Less Distributions: | | | | |
| Distributions from net investment income | (0.94) | (1.92) | (0.39) | — |
| Distributions from net realized gain on investments and foreign currency transactions | — | — | (2.36) | — |
| TOTAL DISTRIBUTIONS | (0.94) | (1.92) | (2.75) | — |
| Redemption Fees | 0.003 | 0.003 | 0.003 | — |
| Regulatory Settlement Proceeds | 0.014 | 0.003,5 | — | — |
| Net Asset Value, End of Period | $45.02 | $42.91 | $31.45 | $70.24 |
| Total Return6 | 7.22%4 | 44.73% | (53.35)% | 7.81% |
| Ratios to Average Net Assets: | | | | |
| Net expenses | 1.91%7 | 1.91% | 1.95% | 1.95%8 |
| Net investment income (loss) | 0.56% | (0.22)% | 2.08% | (0.40)%8 |
| Expense waiver/reimbursement9 | 0.09% | 0.07% | 0.08% | 0.17%8 |
| Supplemental Data: | | | | |
| Net assets, end of period (000 omitted) | $33,189 | $5,262 | $231 | $22 |
| Portfolio turnover | 71% | 121% | 65% | 28%10 |
| 1 | Reflects operations for the period from August 25, 2007 (start of performance) to November 30, 2007. |
| 2 | Per share numbers have been calculated using the average shares method. |
| 3 | Represents less than $0.01. |
| 4 | During the year ended November 30, 2010, the Fund received a regulatory settlement from an unaffiliated third party, which had an impact of 0.02% on the total return. |
| 5 | During the year ended November 30, 2009, the Fund received a regulatory settlement from an unaffiliated third party, which did not have any impact on the total return. |
| 6 | Based on net asset value. Total returns for periods of less than one year are not annualized. |
| 7 | The net expense ratio is calculated without reduction for expense offset arrangements. The net expense ratio is 1.91% for the year ended November 30, 2010, after taking into account this expense reduction. |
| 8 | Computed on an annualized basis. |
| 9 | This expense decrease is reflected in both the net expense and the net investment income (loss) ratios shown above. |
| 10 | Portfolio turnover is calculated at the Fund level. Percentage indicated was calculated for the period from January 1, 2007 to November 30, 2007. |
See Notes which are an integral part of the Financial Statements
Annual Shareholder Report5
Shareholder Expense Example (unaudited)
As a shareholder of the Fund, you incur two types of costs: (1) transaction costs, including sales charges (“loads”) on purchase or redemption payments and redemption/exchanges fees; and (2) ongoing costs, including management fees and to the extent applicable, distribution (12b-1) fees and/or shareholder services fees and other Fund expenses. This Example is intended to help you to understand your ongoing costs (in dollars) of investing in the Fund and to compare these costs with the ongoing costs of investing in other mutual funds. It is based on an investment of $1,000 invested at the beginning of the period and held for the entire period from June 1, 2010 to November 30, 2010.
ACTUAL EXPENSES
The first section of the table below provides information about actual account values and actual expenses. You may use the information in this section, together with the amount you invested, to estimate the expenses that you incurred over the period. Simply divide your account value by $1,000 (for example, an $8,600 account value divided by $1,000 = 8.6), then multiply the result by the number in the first section under the heading entitled “Expenses Paid During Period” to estimate the expenses attributable to your investment during this period.
HYPOTHETICAL EXAMPLE FOR COMPARISON PURPOSES
The second section of the table below provides information about hypothetical account values and hypothetical expenses based on the Fund's actual expense ratio and an assumed rate of return of 5% per year before expenses, which is not the Fund's actual return. Thus, you should not use the hypothetical account values and expenses to estimate the actual ending account balance or your expenses for the period. Rather, these figures are required to be provided to enable you to compare the ongoing costs of investing in the Fund with other funds. To do so, compare this 5% hypothetical example with the 5% hypothetical examples that appear in the shareholder reports of the other funds.
Annual Shareholder Report
6
Please note that the expenses shown in the table are meant to highlight your ongoing costs only and do not reflect any transaction costs, such as sales charges (loads) on purchase or redemption payments or redemption/exchange fees. Therefore, the second section of the table is useful in comparing ongoing costs only, and will not help you determine the relative total costs of owning different funds. In addition, if these transaction costs were included, your costs would have been higher. | Beginning
Account Value
6/1/2010 | Ending
Account Value
11/30/2010 | Expenses Paid
During Period1 |
| Actual: | | | |
| Class A Shares | $1,000 | $1,175.80 | $8.13 |
| Class B Shares | $1,000 | $1,171.40 | $12.36 |
| Class C Shares | $1,000 | $1,171.00 | $12.57 |
| Class K Shares | $1,000 | $1,173.30 | $10.41 |
Hypothetical (assuming a 5% return
before expenses): | | | |
| Class A Shares | $1,000 | $1,017.60 | $7.54 |
| Class B Shares | $1,000 | $1,013.69 | $11.46 |
| Class C Shares | $1,000 | $1,013.49 | $11.66 |
| Class K Shares | $1,000 | $1,015.49 | $9.65 |
| 1 | Expenses are equal to the Fund's annualized net expense ratios, multiplied by the average account value over the period, multiplied by 183/365 (to reflect the one-half-year period). The annualized net expense ratios are as follows: |
| Class A Shares | 1.49% |
| Class B Shares | 2.27% |
| Class C Shares | 2.31% |
| Class K Shares | 1.91% |
Annual Shareholder Report7
Performance data quoted represents past performance which is no guarantee of future results. Investment return and principal value will fluctuate so that an investor's shares, when redeemed, may be worth more or less than their original cost. Mutual fund performance changes over time and current performance may be lower or higher than what is stated. For current to the most recent month-end performance and after-tax returns, visit FederatedInvestors.com or call 1-800-341-7400.
Management's Discussion of Fund Performance (unaudited)
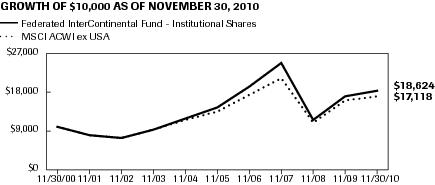
The Fund's total return, based on net asset value for the 12-month reporting period ended November 30, 2010, was 7.69%, 6.84%, 6.84% and 7.22% for the Class A Shares, Class B Shares, Class C Shares and Class K Shares, respectively. The Fund's benchmark, the Morgan Stanley Capital International All Country World ex USA Index (MSCI ACWI ex USA),1 returned 5.26% over the same period. The Fund's total return for the most recently completed fiscal year reflected actual cash flows, transaction costs and other expenses which were not reflected in the total return of the MSCI ACWI ex USA.
The following discussion will focus on the performance of the Fund's Class A Shares.
MARKET OVERVIEW
The reporting period was characterized by an uneven global recovery.2 Investors discovered true divergences between debtor and creditor countries. Fiscal stimulus packages that had once provided tailwinds for the global economic recovery became headwinds for some in the form of deficit cutting measures. Traditional economic classifications of developed markets (less risk) and emerging markets (more risk) became murky and economic boundaries began to be redefined by countries with austerity measures (e.g., Greece, United Kingdom) and those with structural growth policies (e.g., China, Brazil). Generally, countries with higher debt burdens were associated with slower economic growth prospects (more risk) and countries which had managed their fiscal balance sheets more prudently were associated with higher growth prospects (less risk).
| 1 | The MSCI ACWI (All Country World Index) ex USA is a free float-adjusted market capitalization weighted index that is designed to measure the equity market performance of developed and emerging markets. As of November 2010, the MSCI ACWI ex USA consisted of 44 country indices comprising 23 developed and 21 emerging market country indices. The developed market country indices included are: Australia, Austria, Belgium, Canada, Denmark, Finland, France, Germany, Greece, Hong Kong, Ireland, Israel, Italy, Japan, Netherlands, New Zealand, Norway, Portugal, Singapore, Spain, Sweden, Switzerland and the United Kingdom. The emerging market country indices included are: Brazil, Chile, China, Colombia, Czech Republic, Egypt, Hungary, India, Indonesia, Korea, Malaysia, Mexico, Morocco, Peru, Philippines, Poland, Russia, South Africa, Taiwan, Thailand and Turkey. The index is unmanaged and, unlike the fund, is not affected by cash flows. It is not possible to invest directly in an index. |
| 2 | International investing involves special risks including currency risk, increased volatility, political risks and differences in auditing and other financial standards. Prices of emerging market securities can be significantly more volatile than the prices of securities in developed countries. Currency risk and political risks are accentuated in emerging markets. |
Annual Shareholder Report8
This uneven recovery caused a wide divergence of returns between strong countries with economic growth, and corporate profits, versus weak countries plagued by sovereign risks. Nowhere was this more evident than in the Eurozone, where initially all markets dropped on concerns that the sovereign debt crisis clouding the peripheral countries (Greece, Spain and Portugal) would spread throughout the region. While risks still remain, multiple support measures have been put in place over the past year, the most important being the €440 billion (US$ 583 billion) European Financial Stability Facility which is to be replaced with a permanent European Stability Mechanism (ESM) in 2013. Currently, Eurozone 2010 GDP growth expectations are about 1.7%, which is much better than at the beginning of the year when a below trend growth rate of 1.3% was forecast. The main driver of the better 2010 results in the Eurozone was due to Germany, a key European creditor and exporting country. Germany real Gross Domestic Product expanded at an estimated 3.6%, twice the rate forecast in January, as emerging markets and industrial demand for German goods accelerated throughout the year.
While many developed European countries dealt with necessary austerity measures, developing Asia and Latin America experienced a stronger-than-expected recovery. These robust growth economies further highlighted the tug of war between developed debt-ridden countries versus cash-rich fiscally sound countries. Although the sharp recovery in the first half of 2010 moderated in the second half, booming China and Brazil remained supportive of both global growth and Asian and Latin American regional growth, respectively.
The risk of a global currency war has been rising throughout the year as countries look to improve their fiscal positions by increasing their export ratios. While the euro dropped in sympathy with sovereign debt fears, the Japanese yen surged to a fifteen-year high versus the dollar. In a move aimed to support its export-reliant economy, the Bank of Japan intervened by selling yen and committing that the government would initiate a new round of fiscal stimulus and quantitative easing. The U.S. followed suit in November with a commitment from the Federal Reserve to repurchase $600 billion in Treasuries and reinvest up to $300 billion. Other countries pursued aggressive foreign currency reserve accumulation, deployed taxes (e.g., Brazil, Thailand) or limited capital controls (e.g., Korea) in an effort to stem rapid currency appreciation.
Annual Shareholder Report
9
For the second year in a row, for the 12-month reporting period ended November 30, 2010, the MSCI Emerging Markets Index3 outperformed with a return of 15.3% compared to a return of 1.1% for the MSCI EAFE4 and 9.8% for MSCI USA.5 Among the top emerging market performers for the year were Chile, up 51.5%; Turkey, up 41.9%; Indonesia, up 36.6% and Malaysia, up 30.4%. As we highlighted there was strong divergence amongst European countries with Sweden and Denmark up 20.5% and 14.6% respectively, while Greece, Spain and Ireland posted negative returns of (49.1%), (30.3%) and (24.2%), respectively. The divergence in the Eurozone weighed on German returns which managed to post a small increase of 2.6%. In Asia, there were also strong positive returns in Hong Kong, up 25.0%; Singapore, up 22.6% and Japan, up 8.1%.FUND Performance
Country allocation remained the primary driver of performance for the reporting period, as it consistently has been over the past five reporting periods. German shares, which represented the Fund's largest overweight allocation positively impacted performance as better than expected growth translated to strong market returns with key exporters BASF and Siemens positively impacting performance.
| 3 | The MSCI Emerging Markets Index is a free float-adjusted market capitalization index that is designed to measure equity market performance of emerging markets. As of November 2010, the MSCI Emerging Markets Index consisted of the following 21 emerging market country indices: Brazil, Chile, China, Colombia, Czech Republic, Egypt, Hungary, India, Indonesia, Korea, Malaysia, Mexico, Morocco, Peru, Philippines, Poland, Russia, South Africa, Taiwan, Thailand and Turkey. The index is unmanaged and, unlike the fund, is not affected by cash flows. It is not possible to invest directly in an index. |
| 4 | The MSCI EAFE Index (Europe, Australasia, Far East) is a free float-adjusted market capitalization index that is designed to measure the equity market performance of developed markets, excluding the US & Canada. As of May 27, 2010 the MSCI EAFE Index consisted of the following 22 developed market country indices: Australia, Austria, Belgium, Denmark, Finland, France, Germany, Greece, Hong Kong, Ireland, Israel, Italy, Japan, the Netherlands, New Zealand, Norway, Portugal, Singapore, Spain, Sweden, Switzerland and the United Kingdom. |
| 5 | The MSCI USA Index is a free float adjusted market capitalization index that is designed to measure large and mid-cap U.S. equity market performance. The MSCI USA Index is member of the MSCI international equity index series and represents the U.S. equity portion of the global benchmark MSCI ACWI (All Country World Index). The index is unmanaged and, unlike the fund, is not affected by cash flows. It is not possible to invest directly in an index. |
Annual Shareholder Report
10
An overweight in Chile contributed positively to the Fund's performance as MSCI Chile Index6 was the top performing market in the Fund's country universe, up 51.5%. This strong Latin American economy achieved a declining unemployment rate, stronger domestic demand and improving credit conditions, despite a record magnitude earthquake in February. Although sovereign debt fears dominated other key economies in 2010, Chile, like many developing economies that we monitor, had made great strides over the last decade to reform its government, build sound institutions, balance its budget, etc. and as a result the Latin American country developed into a lower risk economy. Generally, investments in other emerging markets such as Chile's Latin America neighbor, Mexico, helped performance due to their strong link to the recovering U.S. industrial economy, stabilizing domestic demand and expectations for a global cyclical recovery. The economy of South Korea, another key overweight for the fund, accelerated more than expected, along with other Asian economies, into a robust expansionary phase as the global recovery spurred demand for manufactured goods and automobiles, which benefited our holdings in Hyundai Heavy Industries and Hyundai Motors.The Funds weakest performing country on a relative basis was Italy which negatively contributed to performance. Research indicated Italy stood apart from its peripheral neighbors as it is better situated to manage its debt going forward due to both a strong export sector and a large domestic investor base. However, investor concerns of Eurozone contagion outweighed Italy's relatively positive strengths.
| 6 | MSCI country indexes are constructed by identifying every listed security in the market. Securities are free float adjusted, classified in accordance with the Global Industry Classification Standard (GICS®), and screened by size, liquidity and minimum free float. |
Annual Shareholder Report11
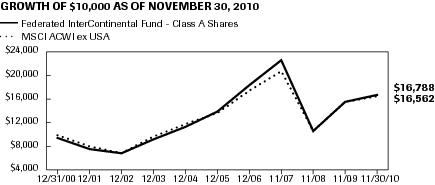
GROWTH OF A $10,000 INVESTMENT - CLASS A SHARES
The graph below illustrates the hypothetical investment of $10,0001,2 in Federated InterContinental Fund (Class A Shares) (the “Fund”) from December 31, 2000 to November 30, 2010, compared to the Morgan Stanley Capital International All Country World ex USA Index (MSCI ACWI ex USA).3
| Average Annual Total Returns4 for the Period Ended 11/30/2010 | |
| 1 Year | 1.77% |
| 5 Years | 3.44% |
| 10 Years | 5.71% |
Performance data quoted represents past performance which is no guarantee of future results. Investment return and principal value will fluctuate so that an investor's shares, when redeemed, may be worth more or less than their original cost. Mutual fund performance changes over time and current performance may be lower or higher than what is stated. For current to the most recent month-end performance and after-tax returns, visit FederatedInvestors.com or call 1-800-341-7400. Returns shown do not reflect the deduction of taxes that a shareholder would pay on Fund distributions or the redemption of Fund shares. Mutual funds are not obligations of or guaranteed by any bank and are not federally insured. Total returns shown include the maximum sales charge of 5.50%.
| 1 | Federated InterContinental Fund is the successor to Rochdale Atlas Portfolio pursuant to a reorganization that took place on August 24, 2007. The information presented above, for the periods prior to August 24, 2007, is historical information for Rochdale Atlas Portfolio. The fiscal year end of Rochdale Atlas Portfolio was December 31. |
| 2 | Represents a hypothetical investment of $10,000 in the Fund after deducting the maximum sales charge of 5.50% ($10,000 investment minus $550 sales charge = $9,450). The Fund's performance assumes the reinvestment of all dividends and distributions. The MSCI ACWI ex USA has been adjusted to reflect reinvestment of dividends on securities in the index. |
| 3 | The MSCI ACWI ex USA is not adjusted to reflect sales charges, expenses or other fees that the Securities and Exchange Commission (SEC) requires to be reflected in the Fund's performance. The index is unmanaged and, unlike the Fund, is not affected by cash flows. It is not possible to invest directly in an index. |
| 4 | Total returns quoted reflect all applicable sales charges. |
Annual Shareholder Report12
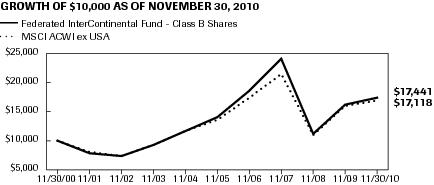
GROWTH OF A $10,000 INVESTMENT - CLASS B SHARES
The graph below illustrates the hypothetical investment of $10,0001,2 in Federated InterContinental Fund (Class B Shares) (the “Fund”) from November 30, 2000 to November 30, 2010, compared to the Morgan Stanley Capital International All Country World ex USA Index (MSCI ACWI ex USA).3
| Average Annual Total Returns4 for the Period Ended 11/30/2010 | |
| 1 Year | 1.34% |
| 5 Years | 3.54% |
| 10 Years | 5.72% |
Performance data quoted represents past performance which is no guarantee of future results. Investment return and principal value will fluctuate so that an investor's shares, when redeemed, may be worth more or less than their original cost. Mutual fund performance changes over time and current performance may be lower or higher than what is stated. For current to the most recent month-end performance and after-tax returns, visit FederatedInvestors.com or call 1-800-341-7400. Returns shown do not reflect the deduction of taxes that a shareholder would pay on Fund distributions or the redemption of Fund shares. Mutual funds are not obligations of or guaranteed by any bank and are not federally insured. Total returns shown include the maximum contingent deferred sales charge of 5.50%, as applicable.
| 1 | Represents a hypothetical investment of $10,000 in the Fund. The maximum contingent deferred sales charge is 5.50% on any redemption less than one year from the purchase date. The Fund's performance assumes the reinvestment of all dividends and distributions. The MSCI ACWI ex USA has been adjusted to reflect reinvestment of dividends on securities in the index. |
| 2 | The Fund's Class B Shares commenced operations on August 25, 2007. The Fund offers four other classes of shares: Institutional Shares, Class A Shares, Class C Shares and Class K Shares. For the period prior to the commencement of operations of Class B Shares, the performance information shown is for the Fund's Class A Shares, adjusted to reflect the expenses of Class B Shares. |
| 3 | The MSCI ACWI ex USA is not adjusted to reflect sales charges, expenses or other fees that the SEC requires to be reflected in the Fund's performance. The index is unmanaged and, unlike the Fund, is not affected by cash flows. It is not possible to invest directly in an index. |
| 4 | Total returns quoted reflect all applicable contingent deferred sales charges. |
Annual Shareholder Report13
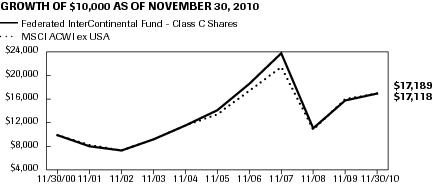
GROWTH OF A $10,000 INVESTMENT - CLASS C SHARES
The graph below illustrates the hypothetical investment of $10,0001,2 in Federated InterContinental Fund (Class C Shares) (the “Fund”) from November 30, 2000 to November 30, 2010, compared to the Morgan Stanley Capital International All Country World ex USA Index (MSCI ACWI ex USA).3
| Average Annual Total Returns4 for the Period Ended 11/30/2010 | |
| 1 Year | 5.84% |
| 5 Years | 3.88% |
| 10 Years | 5.57% |
Performance data quoted represents past performance which is no guarantee of future results. Investment return and principal value will fluctuate so that an investor's shares, when redeemed, may be worth more or less than their original cost. Mutual fund performance changes over time and current performance may be lower or higher than what is stated. For current to the most recent month-end performance and after-tax returns, visit FederatedInvestors.com or call 1-800-341-7400. Returns shown do not reflect the deduction of taxes that a shareholder would pay on Fund distributions or the redemption of Fund shares. Mutual funds are not obligations of or guaranteed by any bank and are not federally insured. Total returns shown include the maximum contingent deferred sales charge of 1.00%, as applicable.
| 1 | Represents a hypothetical investment of $10,000 in the Fund. A 1.00% contingent deferred sales charge would be applied in any redemption less than one year from the purchase date. The Fund's performance assumes the reinvestment of all dividends and distributions. The MSCI ACWI ex USA has been adjusted to reflect reinvestment of dividends on securities in the index. |
| 2 | The Fund's Class C Shares commenced operations on August 25, 2007. The Fund offers four other classes of shares: Institutional Shares, Class A Shares, Class B Shares and Class K Shares. For the period prior to the commencement of operations of Class C Shares, the performance information shown is for the Fund's Class A Shares, adjusted to reflect the expenses of Class C Shares. |
| 3 | The MSCI ACWI ex USA is not adjusted to reflect sales charges, expenses or other fees that the SEC requires to be reflected in the Fund's performance. The index is unmanaged and, unlike the Fund, is not affected by cash flows. It is not possible to invest directly in an index. |
| 4 | Total returns quoted reflect all applicable contingent deferred sales charges. |
Annual Shareholder Report14
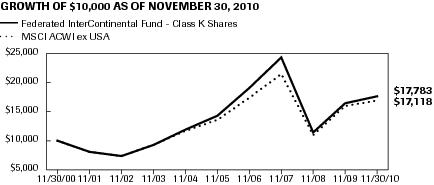
GROWTH OF A $10,000 INVESTMENT - CLASS K SHARES
The graph below illustrates the hypothetical investment of $10,0001,2 in Federated InterContinental Fund (Class K Shares) (the “Fund”) from November 30, 2000 to November 30, 2010, compared to the Morgan Stanley Capital International All Country World ex USA Index (MSCI ACWI ex USA).3
| Average Annual Total Returns for the Period Ended 11/30/2010 | |
| 1 Year | 7.22% |
| 5 Years | 4.24% |
| 10 Years | 5.93% |
Performance data quoted represents past performance which is no guarantee of future results. Investment return and principal value will fluctuate so that an investor's shares, when redeemed, may be worth more or less than their original cost. Mutual fund performance changes over time and current performance may be lower or higher than what is stated. For current to the most recent month-end performance and after-tax returns, visit FederatedInvestors.com or call 1-800-341-7400. Returns shown do not reflect the deduction of taxes that a shareholder would pay on Fund distributions or the redemption of Fund shares. Mutual funds are not obligations of or guaranteed by any bank and are not federally insured.
| 1 | Represents a hypothetical investment of $10,000 in the Fund. The Fund's performance assumes the reinvestment of all dividends and distributions. The MSCI ACWI ex USA has been adjusted to reflect reinvestment of dividends on securities in the index. |
| 2 | The Fund's Class K Shares commenced operations on August 25, 2007. The Fund offers four other classes of shares: Institutional Shares, Class A Shares, Class B Shares and Class C Shares. For the period prior to the commencement of operations of Class K Shares, the performance information shown is for the Fund's Class A Shares, adjusted to reflect the expenses of Class K Shares. |
| 3 | The MSCI ACWI ex USA is not adjusted to reflect sales charges, expenses or other fees that the SEC requires to be reflected in the Fund's performance. The index is unmanaged and, unlike the Fund, is not affected by cash flows. It is not possible to invest directly in an index. |
Annual Shareholder Report15
Portfolio of Investments Summary
Tables (unaudited)
At November 30, 2010, the Fund's portfolio composition1 was as follows:
| Country | Percentage of
Total Net Assets |
| Germany | 19.3% |
| Denmark | 13.1% |
| South Korea | 12.0% |
| Norway | 11.5% |
| Taiwan | 9.3% |
| Mexico | 9.0% |
| Japan | 6.7% |
| Brazil | 6.6% |
| China | 4.5% |
| Austria | 3.8% |
| Indonesia | 2.7% |
| U.S. Treasury Security | 0.2% |
| Securities Lending Collateral2 | 6.4% |
| Cash Equivalents3 | 1.7% |
| Derivative Contracts4 | (0.1)% |
| Other Assets and Liabilities — Net5 | (6.7)% |
| TOTAL | 100.0% |
| 1 | Country allocations are based primarily on the country in which a company is incorporated. However, the Fund's Adviser may allocate a company to a country based on other factors such as location of the company's principal office, the location of the principal trading market for the company's securities or the country where a majority of the company's revenues are derived. |
| 2 | Cash collateral received from lending portfolio securities which is invested in short-term investments such as repurchase agreements or money market mutual funds. |
| 3 | Cash Equivalents include any investments in money market mutual funds and/or overnight repurchase agreements other than those representing securities lending collateral. |
| 4 | Based upon net unrealized appreciation (depreciation) or value of the derivative contracts as applicable. Derivative contracts may consist of futures, forwards, options and swaps. The impact of a derivative contract on the Fund's performance may be larger than its unrealized appreciation (depreciation) or value may indicate. In many cases, the notional value or amount of a derivative contract may provide a better indication of the contract's significance to the portfolio. More complete information regarding the Fund's direct investments in derivative contracts, including unrealized appreciation (depreciation), value and notional values or amounts of such contracts, can be found in the table at the end of the Portfolio of Investments included in this report. |
| 5 | Assets, other than investments in securities and derivative contracts, less liabilities. See Statement of Assets and Liabilities. |
Annual Shareholder Report
16
At November 30, 2010, the Fund's sector classification composition6 was as follows:| Sector Classification | Percentage of
Total Net Assets |
| Financials | 18.5% |
| Industrials | 14.6% |
| Materials | 14.3% |
| Energy | 11.1% |
| Information Technology | 9.3% |
| Consumer Discretionary | 7.9% |
| Consumer Staples | 7.7% |
| Telecommunication Services | 7.2% |
| Health Care | 6.7% |
| Utilities | 1.2% |
| U.S. Treasury Security | 0.2% |
| Securities Lending Collateral2 | 6.4% |
| Cash Equivalents3 | 1.7% |
| Derivative Contracts4 | (0.1)% |
| Other Assets and Liabilities — Net5 | (6.7)% |
| TOTAL | 100.0% |
| 6 | Except for Securities Lending Collateral, Derivative Contracts, Cash Equivalents and Other Assets and Liabilities, sector classifications are based upon, and individual securities assigned to, the classifications of the Global Industry Classification Standard (GICS) except that the Adviser assigns a classification to securities not classified by the GICS and to securities for which the Adviser does not have access to the classification made by the GICS. |
Annual Shareholder Report17
Portfolio of Investments
November 30, 2010
Shares or
Principal
Amount | | | Value in
U.S. Dollars |
| | COMMON STOCKS – 98.5% | |
| | Austria – 3.8% | |
| 411,854 | | Erste Group Bank AG | 16,110,391 |
| 45,000 | | OMV AG | 1,512,294 |
| 132,000 | | Raiffeisen Bank International AG | 6,489,604 |
| 144,831 | | Vienna Insurance Group | 6,731,267 |
| | TOTAL | 30,843,556 |
| | Brazil – 6.6% | |
| 317,501 | 1 | Banco Bradesco SA, ADR | 6,369,070 |
| 149,000 | | Banco Do Brasil SA | 2,859,034 |
| 22,300 | 1 | Companhia de Bebidas das Americas (AmBev), ADR | 3,024,772 |
| 40,300 | 1,2 | Companhia de Saneamento Basico do Estado de Sao Paulo, Class ADR | 1,819,545 |
| 235,515 | 1 | Companhia Energetica de Minas Gerais, ADR | 4,022,596 |
| 347,600 | 1 | Companhia Siderurgica Nacional SA, ADR | 5,439,940 |
| 200,000 | 1 | Gol — Linhas Aereas Inteligentes SA, ADR | 3,234,000 |
| 209,393 | | Itau Unibanco Holding SA, ADR | 4,885,139 |
| 178,000 | 1 | Petroleo Brasileiro SA, ADR, Common | 5,211,840 |
| 147,380 | 1 | Petroleo Brasileiro SA, ADR, Preference | 4,781,007 |
| 138,600 | 1 | Tele Norte Leste Participacoes SA, ADR | 1,952,874 |
| 317,720 | 1 | Vale SA, ADR | 10,065,370 |
| | TOTAL | 53,665,187 |
| | China – 4.5% | |
| 360,000 | | Beijing Enterprises | 2,269,384 |
| 1,700,000 | | Belle International Holdings | 3,126,296 |
| 1,739,200 | | CNOOC Ltd. | 3,771,765 |
| 3,500,000 | | China Construction Bank | 3,168,665 |
| 245,000 | 2 | China Construction Bank, Rights | 81,403 |
| 481,500 | | China Mobile Ltd. | 4,799,436 |
| 1,800,000 | | China Oilfield Services Ltd. | 3,282,379 |
| 2,120,000 | | Dongfeng Motor Corp. | 4,040,643 |
| 3,220,000 | | Industrial & Commercial Bank of China | 2,504,643 |
| 144,900 | 2 | Industrial and Commercial Bank of China, Ltd., Rights | 47,584 |
| 3,500,000 | | Jiangsu Expressway, Class H | 3,790,679 |
| 230,000 | | Ping An Insurance (Group) Co. of China Ltd. | 2,679,103 |
Annual Shareholder Report18
Shares or
Principal
Amount | | | Value in
U.S. Dollars |
| 135,500 | | Tencent Holdings Ltd. | 2,994,398 |
| | TOTAL | 36,556,378 |
| | Denmark – 13.1% | |
| 1,078 | | AP Moller-Maersk A/S | 8,727,780 |
| 87,000 | | Carlsberg A/S, Class B | 8,211,907 |
| 31,300 | | Coloplast AS, Class B | 4,164,503 |
| 432,600 | | DSV, De Sammensluttede Vognmad AS | 8,520,688 |
| 158,800 | | Danisco A/S | 12,129,547 |
| 592,300 | | Danske Bank A/S | 14,688,491 |
| 17,000 | | FLS Industries AS, Class B | 1,397,386 |
| 390,000 | 2 | GN Store Nord AS | 3,232,935 |
| 391,700 | 1 | H. Lundbeck AS | 6,783,969 |
| 47,800 | 1 | NKT Holding A/S | 2,126,054 |
| 550,000 | | Nordea Bank AB | 5,478,220 |
| 237,200 | | Novo Nordisk, Class B | 23,463,267 |
| 17,300 | | Novozymes A/S, Class B | 2,258,100 |
| 54,000 | | Royal Unibrew A/S | 2,835,349 |
| 120,500 | | Sydbank AS | 2,958,909 |
| | TOTAL | 106,977,105 |
| | Germany – 19.3% | |
| 109,100 | | Allianz SE | 11,966,664 |
| 193,000 | | BASF SE | 14,405,116 |
| 59,000 | | Bayer AG | 4,284,930 |
| 180,000 | 1 | Commerzbank AG, Frankfurt | 1,310,772 |
| 55,000 | | Continental AG | 4,270,002 |
| 154,000 | | Daimler AG | 9,969,003 |
| 119,050 | | Deutsche Bank AG | 5,655,132 |
| 137,000 | | Deutsche Lufthansa AG | 2,915,571 |
| 815,000 | | Deutsche Telekom AG, Class REG | 10,437,352 |
| 81,800 | | E.On AG | 2,347,121 |
| 73,000 | | Fresenius SE | 6,254,955 |
| 77,500 | | GEA Group AG | 1,863,092 |
| 85,600 | | Hochtief AG | 6,339,004 |
| 31,100 | | Linde AG | 4,343,745 |
| 41,000 | | MAN SE | 4,817,481 |
| 78,000 | | MTU Aero Engines GmbH | 4,546,033 |
| 75,500 | | Metro AG | 5,415,636 |
Annual Shareholder Report19
Shares or
Principal
Amount | | | Value in
U.S. Dollars |
| 80,300 | | Muenchener Rueckversicherungs-Gesellschaft AG | 11,152,980 |
| 16,809 | | Puma AG Rudolf Dassler Sport | 4,995,445 |
| 54,000 | | SAP AG | 2,519,205 |
| 214,100 | | Siemens AG | 23,425,256 |
| 120,000 | | Suedzucker AG | 2,565,467 |
| 43,000 | | Vossloh AG | 4,856,007 |
| 14,200 | | Wacker Chemie AG | 2,433,066 |
| 64,200 | | Wincor Nixdorf AG | 4,745,086 |
| | TOTAL | 157,834,121 |
| | Indonesia – 2.7% | |
| 9,800,000 | | PT Adaro Energy | 2,522,139 |
| 510,000 | | PT Astra International | 2,929,931 |
| 2,500,000 | | PT Bank Central Asia | 1,674,231 |
| 2,200,000 | | PT Bank Mandiri | 1,558,557 |
| 3,000,000 | | PT Bank Negara Indonesia | 1,344,919 |
| 1,300,000 | | PT Bank Rakyat Indonesia | 1,510,959 |
| 2,400,000 | | PT Indofood Sukses Makmur | 1,215,409 |
| 4,900,000 | 2 | PT International Nickel Indonesia Tbk (INCO) | 2,427,215 |
| 22,000 | | PT Telekomunikasi Indonesia, Class CS, ADR | 791,780 |
| 1,110,000 | | PT Unilever Indonesia Tbk | 1,843,038 |
| 920,000 | | PT United Tractors | 2,342,262 |
| 3,500,000 | | Perusahaan Gas Negara PT | 1,665,929 |
| | TOTAL | 21,826,369 |
| | Japan – 6.7% | |
| 185,000 | | Ajinomoto Co., Inc. | 1,825,905 |
| 1,020,000 | | Asahi Kasei Corp. | 6,069,542 |
| 30,000 | | Astellas Pharma, Inc. | 1,075,397 |
| 600,000 | | Cosmo Oil Co. Ltd. | 1,699,128 |
| 140,000 | | Daiichi Sankyo Co. Ltd. | 3,029,514 |
| 230,000 | 2 | Jx Holdings, Inc. | 1,423,587 |
| 730,000 | | Kaneka Corp. | 4,352,611 |
| 470,000 | | Mitsubishi Chemical Holdings Corp. | 2,701,278 |
| 340,000 | | Mitsubishi Electric Corp. | 3,367,905 |
| 720,000 | | Mitsui Chemicals, Inc. | 2,202,414 |
| 1,150,000 | | NEC Corp. | 3,174,214 |
| 400,000 | | Nomura Holdings, Inc. | 2,303,740 |
| 535,000 | | Sumitomo Electric Industries | 6,999,940 |
Annual Shareholder Report20
Shares or
Principal
Amount | | | Value in
U.S. Dollars |
| 52,000 | | Takeda Pharmaceutical Co. Ltd. | 2,417,015 |
| 840,000 | | Tokuyama Corp. | 4,155,335 |
| 320,000 | | Toray Industries, Inc. | 1,785,638 |
| 500,000 | | Toshiba Corp. | 2,604,851 |
| 1,350,000 | | Ube Industries | 3,435,894 |
| | TOTAL | 54,623,908 |
| | Mexico – 9.0% | |
| 398,000 | 1 | America Movil SAB de CV, Class L, ADR | 22,471,080 |
| 133,000 | | Fomento Economico Mexicano, SA de CV, ADR | 7,521,150 |
| 29,900 | | Grupo Aeroportuario del Sureste SAB de CV, Class B, ADR | 1,546,129 |
| 303,800 | | Grupo Bimbo SA de CV, Class A | 2,469,918 |
| 1,130,000 | | Grupo Financiero Banorte SA de CV | 4,899,427 |
| 650,000 | | Grupo Financiero Inbursa, SA de CV, Class O | 2,822,419 |
| 485,000 | | Grupo Modelo S.A. de CV, Class C | 2,847,571 |
| 294,000 | | Grupo Televisa SA, GDR | 6,850,200 |
| 84,000 | | Industrias Penoles SA | 2,613,961 |
| 350,000 | | Mexichem SA de CV | 1,195,963 |
| 2,175,000 | 2 | Nuevo Grupo Mexico SA, Class B | 7,388,502 |
| 3,880,000 | | Wal-Mart de Mexico SAB de CV | 10,961,400 |
| | TOTAL | 73,587,720 |
| | Norway – 11.5% | |
| 473,700 | | Acergy SA | 9,424,741 |
| 218,000 | | Aker Solutions ASA | 3,224,925 |
| 795,866 | | Den Norske Bank A/S | 9,736,461 |
| 204,300 | | Fred Olsen Energy ASA | 7,580,308 |
| 250,200 | 1 | Frontline Ltd. | 6,548,705 |
| 2,178,600 | | Golden Ocean Group Ltd. | 2,945,807 |
| 170,000 | 2 | Petroleum Geo-Services ASA | 2,063,326 |
| 133,000 | | SeaDrill Ltd. | 4,072,019 |
| 807,443 | | Statoil ASA | 15,999,908 |
| 226,000 | 1,2 | Subsea 7 Inc. | 4,740,241 |
| 156,600 | | TGS Nopec Geophysical Co. ASA | 2,677,096 |
| 868,400 | | Telenor ASA | 12,482,997 |
| 264,500 | | Yara International ASA | 12,589,967 |
| | TOTAL | 94,086,501 |
| | South Korea – 12.0% | |
| 145,400 | | Daewoo Shipbuilding & Marine Engineering Co. Ltd. | 3,724,668 |
Annual Shareholder Report21
Shares or
Principal
Amount | | | Value in
U.S. Dollars |
| 95,000 | | Dongkuk Steel Mill | 2,335,260 |
| 47,000 | | Hana Financial Holdings | 1,540,452 |
| 139,700 | | Hanwha Chemical | 3,825,664 |
| 17,200 | | Hyundai Heavy | 5,511,299 |
| 59,300 | | Hyundai Motor Co. | 8,822,883 |
| 15,800 | | Inchon Iron & Steel | 1,499,051 |
| 60,000 | | Industrial Bank of Korea | 838,365 |
| 70,000 | | KB Financial Group, Inc. | 3,266,345 |
| 202,900 | 1 | KT Corp., ADR | 4,126,986 |
| 135,000 | 2 | Kia Motors Corp. | 5,699,715 |
| 9,129 | | LG Chemical Ltd. | 3,055,073 |
| 20,000 | | LG Corp. | 1,409,350 |
| 44,900 | | LG Electronics, Inc. | 3,988,873 |
| 35,750 | | POSCO, ADR | 3,519,230 |
| 31,600 | | SK Energy Co. Ltd. | 4,510,782 |
| 30,800 | | Samsung Electro-Mechanics Co. | 3,320,683 |
| 26,750 | | Samsung Electronics Co. | 19,057,702 |
| 22,000 | | Samsung Engineering Co. Ltd. | 3,519,924 |
| 115,000 | | Samsung Heavy Industries | 3,293,083 |
| 30,600 | | Samsung SDI Co. Ltd. | 4,368,035 |
| 55,000 | | Shinhan Financial Group Co. Ltd. | 2,120,493 |
| 130,700 | | Woongjin Coway Co. Ltd. | 4,729,054 |
| | TOTAL | 98,082,970 |
| | Taiwan, Province of China – 9.3% | |
| 10,300,000 | 2 | CMC Magnetics Corp. | 2,551,136 |
| 5,170,000 | | Cathay Financial Holding Co. Ltd. | 7,810,334 |
| 2,000,000 | | China Steel Corp. | 2,056,918 |
| 3,984,400 | | Chinatrust Financial Holding Co. Ltd. | 2,398,548 |
| 800,000 | | Chunghwa Telecom Co. Ltd. | 1,942,098 |
| 1,610,000 | | Coretronic Corp. | 2,297,548 |
| 1,734,000 | | Far Eastern New Century Corp. | 2,562,674 |
| 1,050,000 | | Formosa Chem & Fibre | 3,110,473 |
| 1,895,000 | | Formosa Petrochemical Corp. | 5,246,879 |
| 1,090,000 | | Formosa Plastic Corp. | 3,243,271 |
| 1,580,000 | | Gigabyte Technology Co. Ltd. | 1,567,949 |
| 5,243,000 | | Inventec Co. Ltd. | 2,691,805 |
| 2,620,000 | | Mega Financial Holding Co. Ltd. | 1,740,507 |
Annual Shareholder Report22
Shares or
Principal
Amount | | | Value in
U.S. Dollars |
| 4,000,000 | | Micro-Star International Co. | 2,086,443 |
| 1,910,000 | | Nan Ya Plastic | 4,254,540 |
| 5,425,200 | | Pou Chen Corp. | 4,992,270 |
| 3,480,000 | | Siliconware Precision Industries Co. | 3,624,703 |
| 3,725,000 | | Taiwan Semiconductor Manufacturing Co. | 7,747,560 |
| 15,900,000 | | United Microelectronics Corp. | 7,876,323 |
| 6,300,000 | | Vanguard International Semiconductor Corp. | 2,583,449 |
| 4,500,000 | | Wan Hai Lines Ltd. | 3,351,103 |
| | TOTAL | 75,736,531 |
| | TOTAL COMMON STOCKS
(IDENTIFIED COST $682,357,556) | 803,820,346 |
| | U.S. Treasury – 0.2% | |
| $1,200,000 | 3 | United States Treasury Bill, 0.18%, 2/10/2011
(IDENTIFIED COST $1,199,640) | 1,199,663 |
| | MUTUAL FUND – 1.7% | |
| 13,894,270 | 4,5 | Federated Prime Value Obligations Fund, Institutional Shares, 0.21%
(AT NET ASSET VALUE) | 13,894,270 |
| | REPURCHASE AGREEMENT – 6.4% | |
| $52,456,000 | | Interest in $5,635,000,000 joint repurchase agreement 0.25%, dated 11/30/2010 under which Bank of America, N.A. will repurchase securities provided as collateral for $5,635,039,132 on 12/1/2010. The securities provided as collateral at the end of the period were U.S. Government Agency securities with various maturities to 12/1/2038 and the market value of those underlying securities was $5,747,739,915 (purchased with proceeds from securities lending collateral). (AT COST) | 52,456,000 |
| | TOTAL INVESTMENTS — 106.8%
(IDENTIFIED COST $749,907,466)6 | 871,370,279 |
| | OTHER ASSETS AND LIABILITIES - NET — (6.8)%7 | (55,502,651) |
| | TOTAL NET ASSETS — 100% | $815,867,628 |
At November 30, 2010, the Fund had the following outstanding futures contract:
| Description | Number of
Contracts | Notional Value | Expiration Date | Unrealized
Appreciation |
| 2Dax Index Long Futures | 7 | $1,172,850 | December 2010 | $108,299 |
Annual Shareholder Report
23
At November 30, 2010, the Fund had the following outstanding foreign exchange contracts:| Settlement Date | Foreign Currency
Units to Deliver/Receive | In Exchange For | Unrealized
Appreciation/
(Depreciation) |
| Contracts Purchased: | | | |
| 12/1/2010 | 2,889,691,276 Indonesian Rupiah | $320,649 | $(781) |
| 2/22/2011 | 21,500,000 New Zealand Dollar | $16,602,300 | $(719,892) |
| 2/24/2011 | 126,210,440 Swedish Krona | $17,931,440 | $(33,972) |
| Contracts Sold: | | | |
| 2/7/2011 | 47,891,485,000 South Korean Won | $41,000,000 | $(172,184) |
| 2/24/2011 | 31,366,700 Euro | $41,049,287 | $348,063 |
| NET UNREALIZED DEPRECIATION ON FOREIGN EXCHANGE CONTRACTS | $(578,766) |
Net Unrealized Appreciation/Depreciation on Futures Contracts and Foreign Exchange Contracts is included in “Other Assets and Liabilities — Net.”
| 1 | All or a portion of these securities are temporarily on loan to unaffiliated broker/dealers. |
| 2 | Non-income producing security. |
| 3 | Pledged as collateral to ensure the Fund is able to satisfy the obligations of its outstanding futures contract. |
| 4 | Affiliated company. |
| 5 | 7-Day net yield. |
| 6 | The cost of investments for federal tax purposes amounts to $749,907,390. |
| 7 | Assets, other than investments in securities, less liabilities. See Statement of Assets and Liabilities. |
Note: The categories of investments are shown as a percentage of total net assets at November 30, 2010.
Various inputs are used in determining the value of the Fund's investments. These inputs are summarized in the three broad levels listed below:
Level 1 — quoted prices in active markets for identical securities
Level 2 — other significant observable inputs (including quoted prices for similar securities, interest rates, prepayment speeds, credit risk, etc.)
Level 3 — significant unobservable inputs (including the Fund's own assumptions in determining the fair value of investments)
The inputs or methodology used for valuing securities are not an indication of the risk associated with investing in those securities.
Annual Shareholder Report
24
The following is a summary of the inputs used, as of November 30, 2010, in valuing the Fund's assets carried at fair value:| Valuation Inputs | | | | |
| Level 1 —
Quoted
Prices and
Investments in
Mutual Funds | Level 2 —
Other
Significant
Observable
Inputs | Level 3 —
Significant
Unobservable
Inputs | Total |
| Equity Securities: | | | | |
| Common Stock | | | | |
| International | $803,772,762* | $47,584 | $ — | $803,820,346 |
| U.S. Treasury | — | 1,199,663 | — | 1,199,663 |
| Mutual Fund | 13,894,270 | — | — | 13,894,270 |
| Repurchase Agreement | — | 52,456,000 | — | 52,456,000 |
| TOTAL SECURITIES | $817,667,032 | $53,703,247 | $ — | $871,370,279 |
| OTHER FINANCIAL INSTRUMENTS** | $107,518 | $(577,985) | $ — | $(470,467) |
| * | Includes $210,013,600 of securities transferred from Level 2 to Level 1 because quoted prices on equity securities traded principally in foreign markets were utilized to value securities for which fair value factors were previously applied to account for significant post market close activity. |
| ** | Other financial instruments include futures contracts and foreign exchange contracts. |
Following is a reconciliation of assets in which significant unobservable inputs (Level 3) were used in determining fair value:
| Investments in
Equity Securities |
| Balance as of December 1, 2009 | $2,510,058 |
| Realized gain/loss | 62,114 |
| Change in unrealized appreciation/depreciation | (420,522) |
| Net purchases (sales) | (2,151,650) |
| Balance as of November 30, 2010 | $ — |
| The total change in unrealized appreciation (depreciation) attributable to investments still held at November 30, 2010. | $ — |
The following acronyms are used throughout this portfolio:
| ADR | — American Depositary Receipt |
| GDR | — Global Depository Receipt |
See Notes which are an integral part of the Financial Statements
Annual Shareholder Report25
Statement of Assets and Liabilities
November 30, 2010
| Assets: | | |
| Total investments in securities, at value including $50,319,850 of securities loaned and $13,894,270 of investments in an affiliated issuer (Note 5) (identified cost $749,907,466) | | $871,370,279 |
| Cash denominated in foreign currencies (identified cost $1,316,800) | | 1,305,448 |
| Income receivable | | 851,631 |
| Receivable for investments sold | | 1,533,061 |
| Receivable for shares sold | | 1,465,111 |
| Receivable for foreign exchange contracts | | 348,063 |
| Other assets | | 29,498 |
| TOTAL ASSETS | | 876,903,091 |
| Liabilities: | | |
| Payable for investments purchased | $5,933,018 | |
| Payable for shares redeemed | 1,203,613 | |
| Payable for foreign exchange contracts | 926,829 | |
| Payable for daily variation margin | 4,824 | |
| Payable for collateral due to broker for securities lending | 52,456,000 | |
| Payable for Directors'/Trustees' fees | 670 | |
| Payable for distribution services fee (Note 5) | 65,341 | |
| Payable for shareholder services fee (Note 5) | 157,645 | |
| Accrued expenses | 287,523 | |
| TOTAL LIABILITIES | | 61,035,463 |
| Net assets for 17,877,147 shares outstanding | | $815,867,628 |
| Net Assets Consist of: | | |
| Paid-in capital | | $1,083,948,555 |
| Net unrealized appreciation of investments, futures contracts and translation of assets and liabilities in foreign currency | | 120,998,110 |
| Accumulated net realized loss on investments, futures contracts and foreign currency transactions | | (394,089,542) |
| Undistributed net investment income | | 5,010,505 |
| TOTAL NET ASSETS | | $815,867,628 |
Annual Shareholder Report26
Statement of Assets and Liabilities — continued| Net Asset Value, Offering Price and Redemption Proceeds Per Share | | |
| Class A Shares: | | |
| Net asset value per share ($503,104,277 ÷ 11,014,688 shares outstanding), no par value, unlimited shares authorized | | $45.68 |
| Offering price per share (100/94.50 of $45.68) | | $48.34 |
| Redemption proceeds per share (98.00/100 of $45.68) | | $44.77 |
| Class B Shares: | | |
| Net asset value per share ($17,380,768 ÷ 382,436 shares outstanding), no par value, unlimited shares authorized | | $45.45 |
| Offering price per share | | $45.45 |
| Redemption proceeds per share (92.50/100 of $45.45) | | $42.04 |
| Class C Shares: | | |
| Net asset value per share ($64,511,660 ÷ 1,422,780 shares outstanding), no par value, unlimited shares authorized | | $45.34 |
| Offering price per share | | $45.34 |
| Redemption proceeds per share (97.00/100 of $45.34) | | $43.98 |
| Institutional Shares: | | |
| Net asset value per share ($197,681,831 ÷ 4,320,087 shares outstanding), no par value, unlimited shares authorized | | $45.76 |
| Offering price per share | | $45.76 |
| Redemption proceeds per share (98.00/100 of $45.76) | | $44.84 |
| Class K Shares: | | |
| Net asset value per share ($33,189,092 ÷ 737,156 shares outstanding), no par value, unlimited shares authorized | | $45.02 |
| Offering price per share | | $45.02 |
| Redemption proceeds per share (98.00/100 of $45.02) | | $44.12 |
See Notes which are an integral part of the Financial Statements
Annual Shareholder Report27
Statement of Operations
Year Ended November 30, 2010
| Investment Income: | | | |
| Dividends (including $11,602 received from an affiliated issuer (Note 5) and net of foreign taxes withheld of $2,538,856) | | | $16,218,778 |
| Interest (including income on securities loaned of $749,714) | | | 765,191 |
| TOTAL INCOME | | | 16,983,969 |
| Expenses: | | | |
| Investment adviser fee (Note 5) | | $7,517,525 | |
| Administrative personnel and services fee (Note 5) | | 587,052 | |
| Custodian fees | | 567,009 | |
| Transfer and dividend disbursing agent fees and expenses — Class A Shares | | 642,911 | |
| Transfer and dividend disbursing agent fees and expenses — Class B Shares | | 48,254 | |
| Transfer and dividend disbursing agent fees and expenses — Class C Shares | | 115,216 | |
| Transfer and dividend disbursing agent fees and expenses — Institutional Shares | | 115,011 | |
| Transfer and dividend disbursing agent fees and expenses — Class K Shares | | 60,119 | |
| Directors'/Trustees' fees | | 2,159 | |
| Auditing fees | | 24,548 | |
| Legal fees | | 7,849 | |
| Portfolio accounting fees | | 93,108 | |
| Distribution services fee — Class B Shares (Note 5) | | 140,845 | |
| Distribution services fee — Class C Shares (Note 5) | | 496,975 | |
| Distribution services fee — Class K Shares (Note 5) | | 99,836 | |
| Shareholder services fee — Class A Shares (Note 5) | | 1,185,547 | |
| Shareholder services fee — Class B Shares (Note 5) | | 46,948 | |
| Shareholder services fee — Class C Shares (Note 5) | | 165,531 | |
| Account administration fee — Class A Shares | | 11,050 | |
| Account administration fee — Class C Shares | | 127 | |
| Share registration costs | | 90,545 | |
| Printing and postage | | 93,922 | |
| Insurance premiums | | 5,536 | |
| Miscellaneous | | 9,126 | |
| TOTAL EXPENSES | | 12,126,749 | |
Annual Shareholder Report28
Statement of Operations — continued| Waivers, Reimbursements and Reduction: | | | |
| Waiver/reimbursement of investment adviser fee (Note 5) | $(673,061) | | |
| Waiver of administrative personnel and services fee (Note 5) | (14,968) | | |
| Waiver of distribution services fee — Class K Shares (Note 5) | (230) | | |
| Reimbursement of transfer and dividend disbursing agent fees and expenses — Class A Shares (Note 5) | (20,380) | | |
| Reimbursement of transfer and dividend disbursing agent fees and expenses — Class B Shares (Note 5) | (15,977) | | |
| Reimbursement of transfer and dividend disbursing agent fees and expenses — Class C Shares (Note 5) | (1,859) | | |
| Reimbursement of transfer and dividend disbursing agent fees and expenses — Institutional Shares (Note 5) | (25,306) | | |
| Fees paid indirectly from directed brokerage arrangements (Note 6) | (9,031) | | |
TOTAL WAIVERS, REIMBURSEMENTS
AND REDUCTION | | $(760,812) | |
| Net expenses | | | $11,365,937 |
| Net investment income | | | 5,618,032 |
| Realized and Unrealized Gain on Investments, Futures Contracts and Foreign Currency Transactions: | | | |
| Net realized gain on investments and foreign currency transactions | | | 51,353,038 |
| Net realized loss on futures contracts | | | (119,681) |
| Net change in unrealized appreciation of investments and translation of assets and liabilities in foreign currency | | | 3,220,876 |
| Net change in unrealized appreciation of futures contracts | | | 108,299 |
| Net realized and unrealized gain on investments, futures contracts and foreign currency transactions | | | 54,562,532 |
| Change in net assets resulting from operations | | | $60,180,564 |
See Notes which are an integral part of the Financial Statements
Annual Shareholder Report29
Statement of Changes in Net Assets
| Year Ended November 30 | 2010 | 2009 |
| Increase (Decrease) in Net Assets | | |
| Operations: | | |
| Net investment income | $5,618,032 | $6,371,894 |
| Net realized gain (loss) on investments, futures contracts and foreign currency transactions | 51,233,357 | (238,064,230) |
| Net change in unrealized appreciation/depreciation of investments, futures contracts and translation of assets and liabilities in foreign currency | 3,329,175 | 436,414,780 |
| CHANGE IN NET ASSETS RESULTING FROM OPERATIONS | 60,180,564 | 204,722,444 |
| Distributions to Shareholders: | | |
| Distributions from net investment income | | |
| Class A Shares | (10,589,846) | (21,080,579) |
| Class B Shares | (317,293) | (792,905) |
| Class C Shares | (1,079,965) | (2,864,185) |
| Institutional Shares | (3,320,073) | (5,632,429) |
| Class K Shares | (119,708) | (14,097) |
| CHANGE IN NET ASSETS RESULTING FROM DISTRIBUTIONS TO SHAREHOLDERS | (15,426,885) | (30,384,195) |
| Share Transactions: | | |
| Proceeds from sale of shares | 295,540,247 | 204,726,052 |
| Net asset value of shares issued to shareholders in payment of distributions declared | 11,800,228 | 22,454,486 |
| Cost of shares redeemed | (233,772,799) | (249,504,020) |
| CHANGE IN NET ASSETS RESULTING FROM SHARE TRANSACTIONS | 73,567,676 | (22,323,482) |
| Redemption Fees | 17,967 | 31,055 |
| Regulatory Settlement Proceeds: | | |
| Net increase from regulatory settlement (Note 11) | 209,151 | 325,322 |
| Change in net assets | 118,548,473 | 152,371,144 |
| Net Assets: | | |
| Beginning of period | 697,319,155 | 544,948,011 |
| End of period (including undistributed net investment income of $5,010,505 and $7,025,884, respectively) | $815,867,628 | $697,319,155 |
See Notes which are an integral part of the Financial Statements
Annual Shareholder Report30
Notes to Financial Statements
November 30, 2010
1. ORGANIZATION
Federated Equity Funds (the “Trust”) is registered under the Investment Company Act of 1940, as amended (the “Act”), as an open-end management investment company. The Trust consists of 12 portfolios. The financial statements included herein are only those of Federated InterContinental Fund (the “Fund”). The financial statements of the other portfolios are presented separately. The assets of each portfolio are segregated and a shareholder's interest is limited to the portfolio in which shares are held. Each portfolio pays its own expenses. The Fund offers five classes of shares: Class A Shares, Class B Shares, Class C Shares, Institutional Shares and Class K Shares. All shares of the Fund have equal rights with respect to voting, except on class-specific matters. The financial highlights of the Institutional Shares are presented separately. The investment objective of the Fund is to seek long-term capital appreciation.
2. SIGNIFICANT ACCOUNTING POLICIES
The following is a summary of significant accounting policies consistently followed by the Fund in the preparation of its financial statements. These policies are in conformity with U.S. generally accepted accounting principles (GAAP).
Investment Valuation
In calculating its net asset value (NAV), the Fund generally values investments as follows:
- Equity securities listed on an exchange or traded through a regulated market system are valued at their last reported sale price or official closing price in their principal exchange or market.
- Shares of other mutual funds are valued based upon their reported NAVs.
- Fixed-income securities acquired with remaining maturities greater than 60 days are fair valued using price evaluations provided by a pricing service approved by the Board of Trustees (the “Trustees”).
- Fixed-income securities acquired with remaining maturities of 60 days or less are valued at their cost (adjusted for the accretion of any discount or amortization of any premium).
- Derivative contracts listed on exchanges are valued at their reported settlement or closing price.
- Over-the-counter (OTC) derivative contracts are fair valued using price evaluations provided by a pricing service approved by the Trustees.
If the Fund cannot obtain a price or price evaluation from a pricing service for an investment, the Fund may attempt to value the investment based upon the mean of bid and asked quotations or fair value the investment based on price evaluations, from one or more dealers. If any price, quotation, price evaluation or other pricing source is not readily available when the NAV is calculated, the Fund uses the fair value of the investment determined in accordance with the procedures described below. There can be no assurance that the Fund could purchase or sell an investment at the price used to calculate the Fund's NAV.
Fair Valuation and Significant Events Procedures
The Trustees have authorized the use of pricing services to provide evaluations of the current fair value of certain investments for purposes of calculating the NAV. Factors considered by pricing services in evaluating an investment include the yields or prices of investments of comparable quality, coupon, maturity, call rights and other potential prepayments, terms and Annual Shareholder Report
31
type, reported transactions, indications as to values from dealers and general market conditions. Some pricing services provide a single price evaluation reflecting the bid-side of the market for an investment (a “bid” evaluation). Other pricing services offer both bid evaluations and price evaluations indicative of a price between the prices bid and asked for the investment (a “mid” evaluation). The Fund normally uses bid evaluations for U.S. Treasury and Agency securities, mortgage-backed securities and municipal securities. The Fund normally uses mid evaluations for other types of fixed-income securities and OTC derivative contracts. In the event that market quotations and price evaluations are not available for an investment, the fair value of the investment is determined in accordance with procedures adopted by the Trustees.The Trustees also have adopted procedures requiring an investment to be priced at its fair value whenever the Adviser determines that a significant event affecting the value of the investment has occurred between the time as of which the price of the investment would otherwise be determined and the time as of which the NAV is computed. An event is considered significant if there is both an affirmative expectation that the investment's value will change in response to the event and a reasonable basis for quantifying the resulting change in value. Examples of significant events that may occur after the close of the principal market on which a security is traded, or after the time of a price evaluation provided by a pricing service or a dealer, include:
- With respect to securities traded in foreign markets, significant trends in U.S. equity markets or in the trading of foreign securities index futures or options contracts;
- With respect to price evaluations of fixed-income securities determined before the close of regular trading on the NYSE, actions by the Federal Reserve Open Market Committee and other significant trends in U.S. fixed-income markets;
- Political or other developments affecting the economy or markets in which an issuer conducts its operations or its securities are traded; and
- Announcements concerning matters such as acquisitions, recapitalizations, litigation developments, a natural disaster affecting the issuer's operations or regulatory changes or market developments affecting the issuer's industry.
The Trustees have approved the use of a pricing service to determine the fair value of equity securities traded principally in foreign markets when the Adviser determines that there has been a significant trend in the U.S. equity markets or in index futures trading. For other significant events, the Fund may seek to obtain more current quotations or price evaluations from alternative pricing sources. If a reliable alternative pricing source is not available, the Fund will determine the fair value of the investment using another method approved by the Trustees.
Repurchase Agreements
It is the policy of the Fund to require the other party to a repurchase agreement to transfer to the Fund's custodian or sub-custodian eligible securities or cash with a market value (after transaction costs) at least equal to the repurchase price to be paid under the repurchase agreement. The eligible securities are transferred to accounts with the custodian or sub-custodian in which the Fund holds a “securities entitlement” and exercises “control” as those terms are defined in the Uniform Commercial Code. The Fund has established procedures for monitoring the market value of the transferred securities and requiring the transfer of additional eligible securities if necessary to equal at least the repurchase price. These procedures also allow the other party to require securities to be transferred from the account to the extent that their market value exceeds the repurchase price or in exchange for other eligible securities of equivalent market value.
Annual Shareholder Report
32
The insolvency of the other party or other failure to repurchase the securities may delay the disposition of the underlying securities or cause the Fund to receive less than the full repurchase price. Under the terms of the repurchase agreement, any amounts received by the Fund in excess of the repurchase price and related transaction costs must be remitted to the other party.The Fund may enter into repurchase agreements in which eligible securities are transferred into joint trading accounts maintained by the custodian or sub-custodian for investment companies and other clients advised by the Fund's Adviser and its affiliates. The Fund will participate on a pro rata basis with the other investment companies and clients in its share of the securities transferred under such repurchase agreements and in its share of proceeds from any repurchase or other disposition of such securities.
Investment Income, Gains and Losses, Expenses and Distributions
Investment transactions are accounted for on a trade-date basis. Realized gains and losses from investment transactions are recorded on an identified-cost basis. Interest income and expenses are accrued daily. Dividend income and distributions to shareholders are recorded on the ex-dividend date. Foreign dividends are recorded on the ex-dividend date or when the Fund is informed of the ex-dividend date. Distributions of net investment income are declared and paid annually. Non-cash dividends included in dividend income, if any, are recorded at fair value. Investment income, realized and unrealized gains and losses and certain fund-level expenses are allocated to each class based on relative average daily net assets, except that Class A Shares, Class B Shares, Class C Shares, Institutional Shares and Class K Shares may bear distribution services fees, shareholder services fees, account administration fees and certain transfer and dividend disbursing agent fees unique to those classes. Dividends are declared separately for each class. No class has preferential dividend rights; differences in per share dividend rates are generally due to differences in separate class expenses.
Premium and Discount Amortization
All premiums and discounts on fixed-income securities are amortized/accreted for financial statement purposes.
Federal Taxes
It is the Fund's policy to comply with the Subchapter M provision of the Internal Revenue Code (the “Code”) and to distribute to shareholders each year substantially all of its income. Accordingly, no provision for federal income tax is necessary. As of and during the year ended November 30, 2010, the Fund did not have a liability for any uncertain tax positions. The Fund recognizes interest and penalties, if any, related to tax liabilities as income tax expense in the Statement of Operations. As of November 30, 2010, tax years 2007 through 2010 remain subject to examination by the Fund's major tax jurisdictions, which include the United States of America and the Commonwealth of Massachusetts.
The Fund may be subject to taxes imposed by governments of countries in which it invests. Such taxes are generally based on either income or gains earned or repatriated. The Fund accrues and applies such taxes to net investment income, net realized gains and net unrealized gains as income and/or gains are earned.
Annual Shareholder Report
33
When-Issued and Delayed Delivery TransactionsThe Fund may engage in when-issued or delayed delivery transactions. The Fund records when-issued securities on the trade date and maintains security positions such that sufficient liquid assets will be available to make payment for the securities purchased. Securities purchased on a when-issued or delayed delivery basis are marked to market daily and begin earning interest on the settlement date. Losses may occur on these transactions due to changes in market conditions or the failure of counterparties to perform under the contract.
Foreign Exchange Contracts
The Fund may enter into foreign exchange contracts for the delayed delivery of securities or foreign currency exchange transactions. The Fund may enter into foreign exchange contracts to protect assets against adverse changes in foreign currency exchange rates or exchange control regulations. Purchased contracts are used to acquire exposure to foreign currencies, whereas, contracts to sell are used to hedge the Fund's securities against currency fluctuations. Risks may arise upon entering into these transactions from the potential inability of counterparties to meet the terms of their commitments and from unanticipated movements in security prices or foreign exchange rates. The foreign exchange contracts are adjusted by the daily exchange rate of the underlying currency and any gains or losses are recorded for financial statement purposes as unrealized until the settlement date.
Foreign exchange contracts outstanding at period end are listed after the Fund's Portfolio of Investments.
Foreign Currency Translation
The accounting records of the Fund are maintained in U.S. dollars. All assets and liabilities denominated in foreign currencies (FCs) are translated into U.S. dollars based on the rates of exchange of such currencies against U.S. dollars on the date of valuation. Purchases and sales of securities, income and expenses are translated at the rate of exchange quoted on the respective date that such transactions are recorded. The Fund does not isolate that portion of the results of operations resulting from changes in foreign exchange rates on investments from the fluctuations arising from changes in market prices of securities held. Such fluctuations are included with the net realized and unrealized gain or loss from investments.
Reported net realized foreign exchange gains or losses arise from sales of portfolio securities, sales and maturities of short-term securities, sales of FCs, currency gains or losses realized between the trade and settlement dates on securities transactions, the difference between the amounts of dividends, interest and foreign withholding taxes recorded on the Fund's books, and the U.S. dollar equivalent of the amounts actually received or paid. Net unrealized foreign exchange gains and losses arise from changes in the value of assets and liabilities other than investments in securities at fiscal year end, resulting from changes in the exchange rate.
Restricted Securities
The Fund may purchase securities which are considered restricted. Restricted securities are securities that either: (a) cannot be offered for public sale without first being registered, or being able to take advantage of an exemption from registration, under the Securities Act of 1933; or (b) are subject to contractual restrictions on public sales. In some cases, when a security cannot be offered for public sale without first being registered, the issuer of the restricted security has agreed to register such securities for resale, at the issuer's expense, either upon demand by the Fund or in connection with another registered offering of the securities. Many such restricted securities may be resold in the secondary market in Annual Shareholder Report
34
transactions exempt from registration. Restricted securities may be determined to be liquid under criteria established by the Trustees. The Fund will not incur any registration costs upon such resales. The Fund's restricted securities are valued at the price provided by dealers in the secondary market or, if no market prices are available, at the fair value as determined in accordance with procedures established by and under the general supervision of the Trustees.Securities Lending
The Fund participates in a securities lending program providing for the lending of equity securities to qualified brokers. The Fund normally receives cash collateral for securities loaned that is invested in an affiliated money market fund or in short-term securities including repurchase agreements. Collateral is maintained at a minimum level of 100% of the market value of investments loaned, plus interest, if applicable. Earnings on collateral are allocated between the securities lending agent, as a fee for its services under the program, and the Fund, according to agreed-upon rates.
As of November 30, 2010, securities subject to this type of arrangement and related collateral were as follows:
Market Value of
Securities Loaned | Market Value
of Collateral |
| $50,319,850 | $52,456,000 |
Additional Disclosure Related to Derivative Instruments
| Fair Value of Derivative Instruments |
| Asset | Liability |
| Statement of
Assets and
Liabilities
Location | Fair
Value | Statement of
Assets and
Liabilities
Location | Fair
Value |
| Derivatives not accounted for as hedging instruments under ASC Topic 815 | | | | |
| Equity contracts | | | Payable for daily variation margin | $108,299* |
| Foreign exchange contracts | Receivable for foreign exchange contracts | $348,063 | Payable for foreign exchange contracts | $926,829 |
| Total derivatives not accounted for as hedging instruments under ASC Topic 815 | | $348,063 | | $1,035,128 |
| * | Includes cumulative appreciation/depreciation of futures contracts as reported in the footnotes to the Portfolio of Investments. Only the current day's variation margin is reported within the Statement of Assets and Liabilities. |
Annual Shareholder Report35
The Effect of Derivative Instruments on the Statement of Operations for the Year Ended November 30, 2010
| Amount of Realized Gain or (Loss) on Derivatives Recognized in Income |
| Futures | Forward
Currency
Contracts | Total |
| Equity contracts | $(119,681) | $ — | $(119,681) |
| Foreign exchange contracts | — | (78,999) | $(78,999) |
| TOTAL | $(119,681) | $(78,999) | $(198,680) |
| Change in Unrealized Appreciation or (Depreciation) on Derivatives Recognized in Income |
| Futures | Forward
Currency
Contracts | Total |
| Equity contracts | $108,299 | $ — | $108,299 |
| Foreign exchange contracts | — | (4,084,309) | (4,084,309) |
| TOTAL | $108,299 | $(4,084,309) | $(3,976,010) |
Other
The preparation of financial statements in conformity with GAAP requires management to make estimates and assumptions that affect the amounts of assets, liabilities, expenses and revenues reported in the financial statements. Actual results could differ from those estimated.
3. SHARES OF BENEFICIAL INTEREST
The following tables summarize share activity:
| Year Ended November 30 | 2010 | 2009 |
| Class A Shares: | Shares | Amount | Shares | Amount |
| Shares sold | 3,522,078 | $151,185,690 | 3,820,782 | $139,658,423 |
| Shares issued to shareholders in payment of distributions declared | 224,368 | 9,674,750 | 580,687 | 18,506,501 |
| Shares redeemed | (3,521,711) | (150,663,309) | (5,719,151) | (184,148,240) |
NET CHANGE RESULTING
FROM CLASS A
SHARE TRANSACTIONS | 224,735 | $10,197,131 | (1,317,682) | $(25,983,316) |
| Year Ended November 30 | 2010 | 2009 |
| Class B Shares: | Shares | Amount | Shares | Amount |
| Shares sold | 55,656 | $2,414,919 | 78,149 | $2,806,300 |
| Shares issued to shareholders in payment of distributions declared | 6,410 | 277,062 | 21,519 | 687,748 |
| Shares redeemed | (163,273) | (6,944,956) | (169,805) | (5,678,959) |
NET CHANGE RESULTING
FROM CLASS B
SHARE TRANSACTIONS | (101,207) | $(4,252,975) | (70,137) | $(2,184,911) |
Annual Shareholder Report36
| Year Ended November 30 | 2010 | 2009 |
| Class C Shares: | Shares | Amount | Shares | Amount |
| Shares sold | 304,948 | $13,070,298 | 461,611 | $15,710,774 |
| Shares issued to shareholders in payment of distributions declared | 21,303 | 918,583 | 71,040 | 2,265,479 |
| Shares redeemed | (518,154) | (22,087,885) | (815,500) | (27,278,265) |
NET CHANGE RESULTING
FROM CLASS C
SHARE TRANSACTIONS | (191,903) | $(8,099,004) | (282,849) | $(9,302,012) |
| Year Ended November 30 | 2010 | 2009 |
| Institutional Shares: | Shares | Amount | Shares | Amount |
| Shares sold | 2,369,341 | $98,058,051 | 1,319,466 | $42,320,293 |
| Shares issued to shareholders in payment of distributions declared | 18,810 | 810,124 | 30,829 | 980,660 |
| Shares redeemed | (1,147,060) | (49,907,072) | (970,979) | (32,079,867) |
NET CHANGE RESULTING
FROM INSTITUTIONAL
SHARE TRANSACTIONS | 1,241,091 | $48,961,103 | 379,316 | $11,221,086 |
| Year Ended November 30 | 2010 | 2009 |
| Class K Shares: | Shares | Amount | Shares | Amount |
| Shares sold | 710,198 | $30,811,289 | 123,127 | $4,230,262 |
| Shares issued to shareholders in payment of distributions declared | 2,806 | 119,709 | 445 | 14,098 |
| Shares redeemed | (98,491) | (4,169,577) | (8,269) | (318,689) |
NET CHANGE RESULTING
FROM CLASS K
SHARE TRANSACTIONS | 614,513 | $26,761,421 | 115,303 | $3,925,671 |
NET CHANGE RESULTING
FROM TOTAL FUND
SHARE TRANSACTIONS | 1,787,229 | $73,567,676 | (1,176,049) | $(22,323,482) |
Redemption Fees
The Fund imposes a 2.00% redemption fee to shareholders of the Fund's Class A Shares, Class B Shares, Class C Shares, Institutional Shares and Class K Shares who redeem shares held for 30 days or less. Shares acquired by reinvestment of dividends or distributions of the Fund, or purchased pursuant to the Systematic Investment Program or withdrawn pursuant to the Systematic Withdrawal Program, will not be subject to the redemption fee. All redemption fees are recorded by the Fund as additions to paid-in capital. For the year ended November 30, 2010, the redemption fees for Class A Shares, Class B Shares, Class C Shares, Institutional Shares and Class K Shares amounted to $11,367, $439, $1,561, $4,106 and $494, respectively. For the year ended November 30, 2009, the redemption fees for Class A Shares, Class B Shares, Class C Shares, Institutional Shares and Class K Shares amounted to $20,856, $1,014, $3,486, $5,641 and $58, respectively.
Annual Shareholder Report
37
4. FEDERAL TAX INFORMATIONThe timing and character of income and capital gain distributions are determined in accordance with income tax regulations, which may differ from GAAP. These differences are due in part to differing treatments for foreign currency transactions, gains on investments in passive foreign investment companies, regulatory settlement proceeds and discount accretion/premium amortization on debt securities.
For the year ended November 30, 2010, permanent differences identified and reclassified among the components of net assets were as follows:
| Increase (Decrease) |
| Paid-In Capital | Undistributed
Net Investment
Income (Loss) | Accumulated
Net Realized
Gain (Loss) |
| $(209,151) | $7,793,474 | $(7,584,323) |
Net investment income (loss), net realized gains (losses) and net assets were not affected by this reclassification.
The tax character of distributions as reported on the Statement of Changes in Net Assets for the years ended November 30, 2010 and 2009, was as follows:
| 2010 | 2009 |
| Ordinary income | $15,426,885 | $30,384,195 |
As of November 30, 2010, the components of distributable earnings on a tax basis were as follows:
| Undistributed ordinary income | $5,010,505 |
| Net unrealized appreciation | $121,576,172 |
| Capital loss carryforwards | $(394,667,604) |
The difference between book-basis and tax-basis net unrealized appreciation/depreciation is attributable to differing treatments for discount accretion/premium amortization on debt securities.
At November 30, 2010, the cost of investments for federal tax purposes was $749,907,390. The net unrealized appreciation of investments for federal tax purposes excluding any unrealized appreciation/depreciation resulting from changes in foreign currency exchange rates, outstanding foreign currency commitments and futures contracts was $121,462,889. This consists of net unrealized appreciation from investments for those securities having an excess of value over cost of $137,403,597 and net unrealized depreciation from investments for those securities having an excess of cost over value of $15,940,708.
Annual Shareholder Report
38
At November 30, 2010, the Fund had a capital loss carryforward of $394,667,604 which will reduce the Fund's taxable income arising from future net realized gains on investments, if any, to the extent permitted by the Code and thus will reduce the amount of distributions to shareholders which would otherwise be necessary to relieve the Fund of any liability for federal income tax. Pursuant to the Code, such capital loss carryforward will expire as follows:| Expiration Year | Expiration Amount |
| 2016 | $144,184,959 |
| 2017 | $250,482,645 |
The Fund used capital loss carryforwards of $43,070,972 to offset taxable capital gains realized during the year ended November 30, 2010.
5. INVESTMENT ADVISER FEE AND OTHER TRANSACTIONS WITH AFFILIATES
Investment Adviser Fee
Federated Global Investment Management Corp. is the Fund's investment adviser (the “Adviser”). The advisory agreement between the Fund and the Adviser provides for an annual fee equal to 1.00% of the Fund's average daily net assets. Subject to the terms described in the Expense Limitation note, the Adviser may voluntarily choose to waive any portion of its fee. For the year ended November 30, 2010, the Adviser voluntarily waived $646,411 of its fee and an affiliate of the Adviser reimbursed $63,522 of transfer and dividend disbursing agent fees and expenses.
Administrative Fee
Federated Administrative Services (FAS), under the Administrative Services Agreement, provides the Fund with administrative personnel and services. The fee paid to FAS is based on the average aggregate daily net assets of certain Federated funds as specified below:
| Administrative Fee | Average Aggregate Daily Net Assets
of the Federated Funds |
| 0.150% | on the first $5 billion |
| 0.125% | on the next $5 billion |
| 0.100% | on the next $10 billion |
| 0.075% | on assets in excess of $20 billion |
The administrative fee received during any fiscal year shall be at least $150,000 per portfolio and $40,000 per each additional class of Shares. Subject to the terms described in the Expense Limitation note, FAS may voluntarily choose to waive any portion of its fee. For the year ended November 30, 2010, the net fee paid to FAS was 0.076% of average daily net assets of the Fund. FAS waived $14,968 of its fee.
Annual Shareholder Report
39
Distribution Services FeeThe Fund has adopted a Distribution Plan (the “Plan”) pursuant to Rule 12b-1 under the Act. Under the terms of the Plan, the Fund will compensate Federated Securities Corp. (FSC), the principal distributor, from the daily net assets of the Fund's Class A Shares, Class B Shares, Class C Shares and Class K Shares to finance activities intended to result in the sale of these shares. The Plan provides that the Fund may incur distribution expenses at the following percentages of average daily net assets annually, to compensate FSC:
| Share Class Name | Percentage of Average Daily
Net Assets of Class |
| Class A Shares | 0.05% |
| Class B Shares | 0.75% |
| Class C Shares | 0.75% |
| Class K Shares | 0.50% |
Subject to the terms described in the Expense Limitation note, FSC may voluntarily choose to waive any portion of its fee. For the year ended November 30, 2010, FSC voluntarily waived $230 of its fee. When FSC receives fees, it may pay some or all of them to financial intermediaries whose customers purchase shares. For the year ended November 30, 2010, FSC retained $60,944 of fees paid by the Fund. For the year ended November 30, 2010, the Fund's Class A Shares did not incur a distribution services fee; however, it may begin to incur this fee upon approval of the Trustees.
Sales Charges
Front-end sales charges and contingent deferred sales charges (CDSC) do not represent expenses of the Fund. They are deducted from the proceeds of sales of Fund shares prior to investment or from redemption proceeds prior to remittance, as applicable. For the year ended November 30, 2010, FSC retained $23,249 in sales charges from the sale of Class A Shares. FSC also retained $409 of CDSC relating to redemptions of Class C Shares.
Shareholder Services Fee
The Fund may pay fees (“Service Fees”) up to 0.25% of the average daily net assets of the Fund's Class A Shares, Class B Shares and Class C Shares to financial intermediaries or to Federated Shareholder Services Company (FSSC) for providing services to shareholders and maintaining shareholder accounts. Financial intermediaries may include a company affiliated with management of Federated Investors, Inc. A financial intermediary affiliated with management of Federated Investors, Inc. received $17,032 of Service Fees for the year ended November 30, 2010. Subject to the terms described in the Expense Limitation note, FSSC may voluntarily reimburse the Fund for Service Fees. For the year ended November 30, 2010, FSSC did not receive any fees paid by the Fund.
Expense Limitation
The Adviser and its affiliates (which may include FSC, FAS and FSSC) have voluntarily agreed to waive their fees and/or reimburse expenses so that the total annual fund operating expenses (as shown in the financial highlights) paid by the Fund's Class A Shares, Class B Shares, Class C Shares, Institutional Shares and Class K Shares (after the voluntary waivers and/or reimbursements) will not exceed 1.48%, 2.27%, 2.27%, 1.17% and 1.67% (the “Fee Limit”), respectively, through the later of (the “Termination Date”): (a) January 31, 2012; or Annual Shareholder Report
40
(b) the date of the Fund's next effective Prospectus. While the Adviser and its affiliates currently do not anticipate terminating or increasing these arrangements prior to the Termination Date, these arrangements may only be terminated or the Fee Limit increased prior to the Termination Date with the agreement of the Trustees.General
Certain Officers and Trustees of the Fund are Officers and Directors or Trustees of the above companies.
Transactions Involving Affiliated Holdings
Affiliated holdings are mutual funds which are managed by the Adviser or an affiliate of the Adviser. The Adviser has agreed to reimburse the Fund for certain investment adviser fees as a result of transactions in other affiliated mutual funds. For the year ended November 30, 2010, the Adviser reimbursed $26,650. Transactions involving the affiliated holdings during the year ended November 30, 2010, were as follows:
| Affiliate | Balance of
Shares Held
11/30/2009 | Purchases/
Additions | Sales/
Reductions | Balance of
Shares Held
11/30/2010 | Value | Dividend
Income |
| Federated Prime Value Obligations Fund, Institutional Shares | 35,499,520 | 206,724,156 | 228,329,406 | 13,894,270 | $13,894,270 | $11,602 |
6. EXPENSE REDUCTION
The Fund directs portfolio trades to a broker that in turn pays a portion of the Fund's operating expenses. For the year ended November 30, 2010, the Fund's expenses were reduced by $9,031 under these arrangements.
7. Investment TRANSACTIONS
Purchases and sales of investments, excluding long-term U.S. government securities and short-term obligations, for the year ended November 30, 2010, were as follows:
| Purchases | $596,620,902 |
| Sales | $523,817,547 |
8. CONCENTRATION OF RISK
The Fund invests in securities of non-U.S. issuers. Political or economic developments may have an effect on the liquidity and volatility of portfolio securities and currency holdings.
9. LINE OF CREDIT
The Fund participates in a $100,000,000 unsecured, uncommitted revolving line of credit (LOC) agreement with PNC Bank. The LOC was made available for extraordinary or emergency purposes, primarily for financing redemption payments. Borrowings are charged interest at a rate offered to the Fund by PNC Bank at the time of the borrowing. As of November 30, 2010, there were no outstanding loans. During the year ended November 30, 2010, the Fund did not utilize the LOC.
Annual Shareholder Report
41
10. INTERFUND LENDINGPursuant to an Exemptive Order issued by the Securities and Exchange Commission (SEC), the Fund, along with other funds advised by subsidiaries of Federated Investors, Inc., may participate in an interfund lending program. This program provides an alternative credit facility allowing the Fund to borrow from other participating affiliated funds. As of November 30, 2010, there were no outstanding loans. During the year ended November 30, 2010, the program was not utilized.
11. REGULATORY SETTLEMENT PROCEEDS
The Fund received $209,151 for the year ended November 30, 2010 and $325,322 for the year ended November 30, 2009 in settlement of administrative proceedings against other unaffiliated third parties involving findings by the SEC of market timing and/or late trading of mutual funds. The settlements are recorded as an increase to paid-in capital in the accompanying financial statements.
12. Legal Proceedings
Since February, 2004, Federated Investors, Inc. and related entities (collectively, “Federated”), have been named as defendants in several lawsuits that are now pending in the United States District Court for the Western District of Pennsylvania. These lawsuits have been consolidated into a single action alleging excessive advisory fees involving one of the Federated-sponsored mutual funds (“Federated Funds”). Federated and its counsel have been defending this litigation. Additional lawsuits based upon similar allegations may be filed in the future. The potential impact of these lawsuits, all of which seek monetary damages, attorneys' fees and expenses, and future potential similar suits is uncertain. Although we do not believe that these lawsuits will have a material adverse effect on the Federated Funds, there can be no assurance that these suits, ongoing adverse publicity and/or other developments resulting from the allegations in these matters will not result in increased redemptions, or reduced sales, of shares of the Federated Funds or other adverse consequences for the Federated Funds.
13. Subsequent events
Effective December 31, 2010, Class K Shares will be redesignated to Class R Shares.
Effective January 31, 2011 (the “Effective Date”), the Fund will no longer charge a redemption fee. Accordingly, no shares of the Fund redeemed after the Effective Date will be assessed a redemption fee regardless of when such shares were purchased.
Management has evaluated subsequent events through the date the financial statements were issued, and determined that no additional events have occurred that require disclosure.
14. FEDERAL TAX INFORMATION (UNAUDITED)
For the fiscal year ended November 30, 2010, 77.53% of total ordinary income distributions made by the Fund are qualifying dividends which may be subject to a maximum tax rate of 15%, as provided for by the Jobs and Growth Tax Relief Act of 2003. Complete information is reported in conjunction with the reporting of your distributions on Form 1099-DIV.
To the extent the Fund meets the requirements of Section 853 of the Internal Revenue Code of 1986, as amended, the Fund will pass through to its shareholders credits for foreign taxes paid.
For the fiscal year ended November 30, 2010, the Fund derived $17,826,891 of gross income from foreign sources and paid foreign taxes of $2,538,856.
Annual Shareholder Report42
Report of Independent Registered Public Accounting Firm
TO THE BOARD OF TRUSTEES OF THE FEDERATED EQUITY FUNDS AND SHAREHOLDERS OF Federated Intercontinental fund:
We have audited the accompanying statement of assets and liabilities, including the portfolio of investments, of the Federated InterContinental Fund (the “Fund”), a portfolio of Federated Equity Funds, as of November 30, 2010, and the related statement of operations for the year then ended, the statements of changes in net assets for each of the years in the two-year period then ended, and the financial highlights for each of the years or periods in the four-year period then ended. These financial statements and financial highlights are the responsibility of the Fund's management. Our responsibility is to express an opinion on these financial statements and financial highlights based on our audits. The financial highlights for the periods presented prior to January 1, 2007, were audited by other independent registered public accountants whose report thereon dated February 26, 2007, expressed an unqualified opinion on those statements.
We conducted our audits in accordance with the standards of the Public Company Accounting Oversight Board (United States). Those standards require that we plan and perform the audit to obtain reasonable assurance about whether the financial statements and financial highlights are free of material misstatement. An audit includes examining, on a test basis, evidence supporting the amounts and disclosures in the financial statements. Our procedures included confirmation of securities owned as of November 30, 2010 by correspondence with the custodian, transfer agent and brokers, or by other appropriate auditing procedures. An audit also includes assessing the accounting principles used and significant estimates made by management, as well as evaluating the overall financial statement presentation. We believe that our audits provide a reasonable basis for our opinion.
In our opinion, the financial statements and financial highlights referred to above present fairly, in all material respects, the financial position of the Federated InterContinental Fund as of November 30, 2010 and the results of its operations for the year then ended, the changes in its net assets for each of the years in the two-year period then ended, and the financial highlights for each of the years or periods in the four-year period then ended, in conformity with U.S. generally accepted accounting principles.
Boston, Massachusetts
January 25, 2011
Annual Shareholder Report43
Board of Trustees and Trust Officers
The Board of Trustees is responsible for managing the Trust business affairs and for exercising all the Trust powers except those reserved for the shareholders. The following tables give information about each Trustee and the senior officers of the Fund. Where required, the tables separately list Trustees who are “interested persons” of the Fund (i.e., “Interested” Trustees) and those who are not (i.e., “Independent” Trustees). Unless otherwise noted, the address of each person listed is Federated Investors Tower, 1001 Liberty Avenue, Pittsburgh, PA 15222. The address of all Independent Trustees listed is 4000 Ericsson Drive, Warrendale, PA 15086-7561; Attention: Mutual Fund Board. As of December 31, 2010, the Trust comprised thirteen portfolio(s), and the Federated Fund Family consisted of 43 investment companies (comprising 136 portfolios). Unless otherwise noted, each Officer is elected annually. Unless otherwise noted, each Trustee oversees all portfolios in the Federated Fund Family and serves for an indefinite term. The Fund's Statement of Additional Information includes additional information about Trust Trustees and is available, without charge and upon request, by calling 1-800-341-7400.
Interested Trustees Background
Name
Birth Date
Positions Held with Trust
Date Service Began | Principal Occupation(s) for Past Five Years,
Other Directorships Held and Previous Position(s) |
John F. Donahue*
Birth Date: July 28, 1924
Trustee
Began serving: April 1984 | Principal Occupations: Director or Trustee of the Federated Fund Family; Chairman and Director, Federated Investors, Inc.; Chairman of the Federated Fund Family's Executive Committee.
Previous Positions: Chairman of the Federated Fund Family; Trustee, Federated Investment Management Company; Chairman and Director, Federated Investment Counseling. |
J. Christopher Donahue*
Birth Date: April 11, 1949
PRESIDENT AND Trustee
Began serving: January 2000 | Principal Occupations: Principal Executive Officer and President of the Federated Fund Family; Director or Trustee of some of the Funds in the Federated Fund Family; President, Chief Executive Officer and Director, Federated Investors, Inc.; Chairman and Trustee, Federated Investment Management Company; Trustee, Federated Investment Counseling; Chairman and Director, Federated Global Investment Management Corp.; Chairman, Federated Equity Management Company of Pennsylvania and Passport Research, Ltd. (investment advisory subsidiary of Federated); Trustee, Federated Shareholder Services Company; Director, Federated Services Company.
Previous Positions: President, Federated Investment Counseling; President and Chief Executive Officer, Federated Investment Management Company, Federated Global Investment Management Corp. and Passport Research, Ltd. |
| * | Family relationships and reasons for “interested” status: John F. Donahue is the father of J. Christopher Donahue; both are “interested” due to their beneficial ownership of shares of Federated Investors, Inc. and the positions they hold with Federated and its subsidiaries. |
Annual Shareholder Report44
INDEPENDENT Trustees Background
Name
Birth Date
Positions Held with Trust
Date Service Began | Principal Occupation(s) for Past Five Years,
Other Directorships Held, Previous Position(s) and Qualifications |
Nicholas P. Constantakis, CPA
Birth Date: September 3, 1939
Trustee
Began serving: February 1998 | Principal Occupation: Director or Trustee of the Federated Fund Family.
Other Directorship Held: Director and Chairman of the Audit Committee, Michael Baker Corporation (architecture, engineering and construction services).
Previous Position: Partner, Andersen Worldwide SC.
Qualifications: Public accounting and director experience. |
John F. Cunningham
Birth Date: March 5, 1943
Trustee
Began serving: January 1999 | Principal Occupation: Director or Trustee of the Federated Fund Family.
Other Directorships Held: Chairman, President and Chief Executive Officer, Cunningham & Co., Inc. (strategic business consulting); Trustee Associate, Boston College.
Previous Positions: Director, Redgate Communications and EMC Corporation (computer storage systems); Chairman of the Board and Chief Executive Officer, Computer Consoles, Inc.; President and Chief Operating Officer, Wang Laboratories; Director, First National Bank of Boston; Director, Apollo Computer, Inc.
Qualifications: Business management and director experience. |
Maureen Lally-Green
Birth Date: July 5, 1949
Trustee
Began serving: August 2009 | Principal Occupations: Director or Trustee of the Federated Fund Family; Director, Office of Church Relations, Diocese of Pittsburgh; Adjunct Professor of Law, Duquesne University School of Law.
Other Directorships Held: Director, Auberle; Trustee, St. Francis University; Director, Ireland Institute of Pittsburgh; Director, UPMC Mercy Hospital; Regent, St. Vincent Seminary; Director, Epilepsy Foundation of Western and Central Pennsylvania; Director, Saint Thomas More Society, Allegheny County; Director, Carlow University.
Previous Position: Pennsylvania Superior Court Judge.
Qualifications: Legal and director experience. |
Peter E. Madden
Birth Date: March 16, 1942
Trustee
Began serving: November 1991 | Principal Occupation: Director or Trustee, and Chairman of the Board of Directors or Trustees, of the Federated Fund Family.
Previous Positions: Representative, Commonwealth of Massachusetts General Court; President, Chief Operating Officer and Director, State Street Bank and Trust Company and State Street Corporation (retired); Director, VISA USA and VISA International; Chairman and Director, Massachusetts Bankers Association; Director, Depository Trust Corporation; Director, The Boston Stock Exchange.
Qualifications: Business management, mutual fund services and director experience. |
Annual Shareholder Report45
Name
Birth Date
Positions Held with Trust
Date Service Began | Principal Occupation(s) for Past Five Years,
Other Directorships Held, Previous Position(s) and Qualifications |
Charles F. Mansfield, Jr.
Birth Date: April 10, 1945
Trustee
Began serving: January 1999 | Principal Occupations: Director or Trustee and Chairman of the Audit Committee of the Federated Fund Family; Management Consultant.
Previous Positions: Chief Executive Officer, PBTC International Bank; Partner, Arthur Young & Company (now Ernst & Young LLP); Chief Financial Officer of Retail Banking Sector, Chase Manhattan Bank; Senior Vice President, HSBC Bank USA (formerly, Marine Midland Bank); Vice President, Citibank; Assistant Professor of Banking and Finance, Frank G. Zarb School of Business, Hofstra University; Executive Vice President, DVC Group, Inc. (marketing, communications and technology).
Qualifications: Banking, business management and director experience. |
R. James Nicholson
Birth Date: February 4, 1938
Trustee
Began serving: January 2008 | Principal Occupations: Director or Trustee of the Federated Fund Family; Senior Counsel, Brownstein Hyatt Farber Schrek, P.C.; Former Secretary of the U.S. Dept. of Veterans Affairs; Former U.S. Ambassador to the Holy See; Former Chairman of the Republican National Committee.
Other Directorships Held: Director, Horatio Alger Association; Director, The Daniels Fund.
Previous Positions: Colonel, U.S. Army Reserve; Partner, Calkins, Kramer, Grimshaw and Harring, P.C.; General Counsel, Colorado Association of Housing and Building; Chairman and CEO, Nicholson Enterprises, Inc. (real estate holding company); Chairman and CEO, Renaissance Homes of Colorado.
Qualifications: Legal, government, business management and director experience. |
Thomas M. O'Neill
Birth Date: June 14, 1951
Trustee
Began serving: October 2006 | Principal Occupations: Director or Trustee of the Federated Fund Family; Sole Proprietor, Navigator Management Company (investment and strategic consulting).
Other Directorships Held: Board of Overseers, Children's Hospital of Boston; Visiting Committee on Athletics, Harvard College.
Previous Positions: Chief Executive Officer and President, Managing Director and Chief Investment Officer, Fleet Investment Advisors; President and Chief Executive Officer, Aeltus Investment Management, Inc.; General Partner, Hellman, Jordan Management Co., Boston, MA; Chief Investment Officer, The Putnam Companies, Boston, MA; Credit Analyst and Lending Officer, Fleet Bank; Director and Consultant, EZE Castle Software (investment order management software); Director, Midway Pacific (lumber).
Qualifications: Business management, mutual fund, director and investment experience. |
Annual Shareholder Report46
Name
Birth Date
Positions Held with Trust
Date Service Began | Principal Occupation(s) for Past Five Years,
Other Directorships Held, Previous Position(s) and Qualifications |
John S. Walsh
Birth Date: November 28, 1957
Trustee
Began serving: January 1999 | Principal Occupations: Director or Trustee of the Federated Fund Family; President and Director, Heat Wagon, Inc. (manufacturer of construction temporary heaters); President and Director, Manufacturers Products, Inc. (distributor of portable construction heaters); President, Portable Heater Parts, a division of Manufacturers Products, Inc.
Previous Position: Vice President, Walsh & Kelly, Inc.
Qualifications: Business management and director experience. |
James F. Will
Birth Date: October 12, 1938
Trustee
Began serving: April 2006 | Principal Occupations: Director or Trustee of the Federated Fund Family; formerly, Vice Chancellor and President, Saint Vincent College.
Other Directorships Held: Trustee, Saint Vincent College; Director, Alleghany Corporation; Trustee, Wheeling Jesuit University; Director, Liberty Tire Recycling.
Previous Positions: Chairman, President and Chief Executive Officer, Armco, Inc.; President and Chief Executive Officer, Cyclops Industries; President and Chief Operating Officer, Kaiser Steel Corporation.
Qualifications: Business management, education and director experience. |
OFFICERS
Name
Birth Date
Address
Positions Held with Trust
Date Service Began | Principal Occupation(s) for Past Five Years
and Previous Position(s) |
John W. McGonigle
Birth Date: October 26, 1938
EXECUTIVE VICE PRESIDENT AND SECRETARY
Began serving: April 1984 | Principal Occupations: Executive Vice President and Secretary of the Federated Fund Family; Vice Chairman, Executive Vice President, Secretary and Director, Federated Investors, Inc.
Previous Positions: Trustee, Federated Investment Management Company and Federated Investment Counseling; Director, Federated Global Investment Management Corp., Federated Services Company and Federated Securities Corp. |
Richard A. Novak
Birth Date: December 25, 1963
TREASURER
Began serving: January 2006 | Principal Occupations: Principal Financial Officer and Treasurer of the Federated Fund Family; Senior Vice President, Federated Administrative Services; Financial and Operations Principal for Federated Securities Corp., Edgewood Services, Inc. and Southpointe Distribution Services, Inc.
Previous Positions: Controller of Federated Investors, Inc.; Vice President, Finance of Federated Services Company; held various financial management positions within The Mercy Hospital of Pittsburgh; Auditor, Arthur Andersen & Co. |
Annual Shareholder Report47
Name
Birth Date
Address
Positions Held with Trust
Date Service Began | Principal Occupation(s) for Past Five Years
and Previous Position(s) |
Richard B. Fisher
Birth Date: May 17, 1923
VICE PRESIDENT
Began serving: April 1984 | Principal Occupations: Vice Chairman or Vice President of some of the Funds in the Federated Fund Family; Vice Chairman, Federated Investors, Inc.; Chairman, Federated Securities Corp.
Previous Positions: President and Director or Trustee of some of the Funds in the Federated Fund Family; Executive Vice President, Federated Investors, Inc.; Director and Chief Executive Officer, Federated Securities Corp. |
Brian P. Bouda
Birth Date: February 28, 1947
CHIEF COMPLIANCE OFFICER AND SENIOR VICE PRESIDENT
Began serving: August 2004 | Principal Occupations: Senior Vice President and Chief Compliance Officer of the Federated Fund Family; Vice President and Chief Compliance Officer of Federated Investors, Inc. and Chief Compliance Officer of its subsidiaries. Mr. Bouda joined Federated in 1999 and is a member of the American Bar Association and the State Bar Association of Wisconsin. |
Stephen F. Auth
Birth Date: September 3, 1956
450 Lexington Avenue
Suite 3700
New York, NY 10017-3943
CHIEF INVESTMENT OFFICER
Began serving: November 2002 | Principal Occupations: Mr. Auth is Chief Investment Officer of this Fund and various other Funds in the Federated Fund Family; Executive Vice President, Federated Investment Counseling, Federated Global Investment Management Corp. and Federated Equity Management Company of Pennsylvania.
Previous Positions: Executive Vice President, Federated Investment Management Company, and Passport Research, Ltd. (investment advisory subsidiary of Federated); Senior Vice President, Global Portfolio Management Services Division; Senior Vice President, Federated Investment Management Company and Passport Research, Ltd.; Senior Managing Director and Portfolio Manager, Prudential Investments. |
Lawrence Auriana
Birth Date: January 8, 1944
140 East 45th Street
New York, NY 10017
VICE PRESIDENT
Began serving: November 2001 | Principal Occupations: Lawrence Auriana is Vice President of the Trust. Mr. Auriana joined Federated in April 2001 as Co-Head of Investments/Federated Kaufmann. From August 1984 to April 2001, Mr. Auriana was President and Treasurer of Edgemont Asset Management Corp., and Chairman of the Board and Portfolio Manager to The Kaufmann Fund, Inc. (predecessor to the Federated Kaufmann Fund). Mr. Auriana earned a B.S. in economics from Fordham University and has been engaged in the securities business since 1965. |
Walter C. Bean
Birth Date: June 22, 1945
VICE PRESIDENT
Began serving: November 2006 | Principal Occupations: Walter C. Bean has been the Fund's Portfolio Manager since inception. Walter C. Bean is Vice President of the Trust. Mr. Bean is a Senior Vice President, Senior Portfolio Manager and the Head of the Equity Income Management Team of the Fund's Adviser. Mr. Bean joined Federated in 2000. His previous associations included: various investment management and research positions with C.S. McKee & Company, First Chicago Investment Advisors, CIGNA Investment Advisors and Mellon Bank. Mr. Bean earned a Bachelors Degree in Business Administration from Ohio University and an M.B.A. from the Pennsylvania State University. Mr. Bean has received the Chartered Financial Analyst designation and has 40 years of investment experience. |
Annual Shareholder Report48
Name
Birth Date
Address
Positions Held with Trust
Date Service Began | Principal Occupation(s) for Past Five Years
and Previous Position(s) |
Hans P. Utsch
Birth Date: July 3, 1936
140 East 45th Street
New York, NY 10017
VICE PRESIDENT
Began serving: November 2001 | Principal Occupations: Hans P. Utsch is Vice President of the Trust. Mr. Utsch joined Federated in April 2001 as Co-Head of Investments/Federated Kaufmann. From August 1984 to April 2001, Mr. Utsch was Chairman of the Board and Secretary of Edgemont Asset Management Corp., and President and Portfolio Manager to The Kaufmann Fund, Inc. (predecessor to the Federated Kaufmann Fund). Mr. Utsch graduated from Amherst College and holds an M.B.A. from Columbia University. He has been engaged in the securities business since 1962. |
Annual Shareholder Report49
Evaluation and Approval of Advisory Contract – May 2010
Federated InterContinental Fund (the “Fund”)
The Fund's Board reviewed the Fund's investment advisory contract at meetings held in May 2010. The Board's decision regarding the contract reflects the exercise of its business judgment on whether to continue the existing arrangements.
In this connection, the Federated funds' Board had previously appointed a Senior Officer, whose duties include specified responsibilities relating to the process by which advisory fees are to be charged to a Federated fund. The Senior Officer has the authority to retain consultants, experts, or staff as may be reasonably necessary to assist in the performance of his duties, reports directly to the Board, and may be terminated only with the approval of a majority of the independent members of the Board. The Senior Officer prepared and furnished to the Board an independent, written evaluation that covered topics discussed below. The Board considered that evaluation, along with other information, in deciding to approve the advisory contract.
During its review of the contract, the Board considered compensation and benefits received by the Adviser. This included the fees received for services provided to the Fund by other entities in the Federated organization and research services (if any) received by the Adviser from brokers that execute Federated fund trades, as well as advisory fees. The Board is also familiar with and considered judicial decisions concerning allegedly excessive investment advisory fees, which have indicated that the following factors may be relevant to an Adviser's fiduciary duty with respect to its receipt of compensation from a fund: the nature and quality of the services provided by the Adviser, including the performance of the fund; the Adviser's cost of providing the services; the extent to which the Adviser may realize “economies of scale” as a fund grows larger; any indirect benefits that may accrue to the Adviser and its affiliates as a result of the Adviser's relationship with a fund; performance and expenses of comparable funds; and the extent to which the independent Board members are fully informed about all facts the Board deems relevant bearing on the Adviser's services and fees. The Board further considered management fees (including any components thereof) charged to institutional and other clients of the Adviser for what might be viewed as like services, and the cost to the Adviser and its affiliates of supplying services pursuant to the management fee agreements, excluding any intra-corporate profit and profit margins of the Adviser and its affiliates for supplying such services. The Board was aware of these factors and was guided by them in its review of the Fund's advisory contract to the extent it considered them to be appropriate and relevant, as discussed further below.
Annual Shareholder Report
50
The Board considered and weighed these circumstances in light of its substantial accumulated experience in governing the Fund and working with Federated on matters relating to the Federated funds, and was assisted in its deliberations by independent legal counsel. Throughout the year, the Board has requested and received substantial and detailed information about the Fund and the Federated organization that was in addition to the extensive materials that comprise and accompany the Senior Officer's evaluation. Federated provided much of this information at each regular meeting of the Board, and furnished additional reports in connection with the particular meeting at which the Board's formal review of the advisory contract occurred. Between regularly scheduled meetings, the Board also received information on particular matters as the need arose. Thus, the Board's consideration of the advisory contract included review of the Senior Officer's evaluation, accompanying data and additional reports covering such matters as: the Adviser's investment philosophy, revenue, profitability, personnel and processes; investment and operating strategies; the Fund's short- and long-term performance (in absolute terms, both on a gross basis and net of expenses, as well as in relationship to its particular investment program and certain competitor or “peer group” funds and/or other benchmarks, as appropriate), and comments on the reasons for performance; the Fund's investment objectives; the Fund's expenses (including the advisory fee itself and the overall expense structure of the Fund, both in absolute terms and relative to similar and/or competing funds, with due regard for contractual or voluntary expense limitations); the use and allocation of brokerage commissions derived from trading the Fund's portfolio securities (if any); and the nature, quality and extent of the advisory and other services provided to the Fund by the Adviser and its affiliates. The Board also considered the preferences and expectations of Fund shareholders and their relative sophistication; the continuing state of competition in the mutual fund industry and market practices; the range of comparable fees for similar funds in the mutual fund industry; the Fund's relationship to the Federated family of funds which include a comprehensive array of funds with different investment objectives, policies and strategies which are available for exchange without the incurrence of additional sales charges; compliance and audit reports concerning the Federated funds and the Federated companies that service them (including communications from regulatory agencies), as well as Federated's responses to any issues raised therein; and relevant developments in the mutual fund industry and how the Federated funds and/or Federated are responding to them. The Board's evaluation process is evolutionary. The criteria considered and the emphasis placed on relevant criteria change in recognition of changing circumstances in the mutual fund marketplace.With respect to the Fund's performance and expenses in particular, the Board has found the use of comparisons to other mutual funds with comparable investment programs to be relevant, given the high degree of competition in the mutual fund business. The Board focused on comparisons with other similar Annual Shareholder Report
51
mutual funds more heavily than non-mutual fund products or services because it is believed that they are more relevant. For example, other mutual funds are the products most like the Fund, they are readily available to Fund shareholders as alternative investment vehicles, and they are the type of investment vehicle in fact chosen and maintained by the Fund's investors. The range of their fees and expenses therefore appears to be a generally reliable indication of what consumers have found to be reasonable in the precise marketplace in which the Fund competes. The Fund's ability to deliver competitive performance when compared to its peer group was a useful indicator of how the Adviser is executing the Fund's investment program, which in turn assisted the Board in reaching a conclusion that the nature, extent, and quality of the Adviser's investment management services were such as to warrant continuation of the advisory contract. In this regard, the Senior Officer has reviewed Federated's fees for providing advisory services to products outside the Federated family of funds (e.g., institutional and separate accounts). He concluded that mutual funds and institutional accounts are inherently different products. Those differences include, but are not limited to, different types of targeted investors; being subject to different laws and regulations; different legal structures; different average account sizes; different associated costs; different portfolio management techniques made necessary by different cash flows; and portfolio manager time spent in review of securities pricing. The Senior Officer did not consider these fee schedules to be determinative in judging the appropriateness of mutual fund advisory contracts.The Senior Officer reviewed reports compiled by Federated, using data supplied by independent fund ranking organizations, regarding the performance of, and fees charged by, other mutual funds, noting his view that comparisons to fund peer groups are relevant in judging the reasonableness of proposed fees.
For the one-year, three-year and five-year periods covered by the report, the Fund's performance was above the median of the relevant peer group.
The Board also received financial information about Federated, including reports on the compensation and benefits Federated derived from its relationships with the Federated funds. These reports covered not only the fees under the advisory contracts, but also fees received by Federated's subsidiaries for providing other services to the Federated funds under separate contracts (e.g., for serving as the Federated funds' administrator). The reports also discussed any indirect benefit Federated may derive from its receipt of research services from brokers who execute Federated fund trades. In addition, the Board considered the fact that, in order for a fund to be competitive in the marketplace, Federated and its affiliates frequently waived fees and/or reimbursed expenses and have disclosed to fund investors and/or indicated to the Board their intention to do so in the future, where appropriate. Moreover, the Board receives regular reports regarding the institution or elimination of these voluntary waivers.
Annual Shareholder Report
52
Federated furnished reports, requested by the Senior Officer, that reported revenues on a fund-by-fund basis and made estimates of the allocation of expenses on a fund-by-fund basis, using allocation methodologies specified by the Senior Officer. The Senior Officer noted that, although they may apply consistent allocation processes, the inherent difficulties in allocating costs (and the unavoidable arbitrary aspects of that exercise) and the lack of consensus on how to allocate those costs may render such allocation reports unreliable. The allocation reports were considered in the analysis by the Board but were determined to be of limited use.The Board and the Senior Officer also reviewed a report compiled by Federated comparing profitability information for Federated to other publicly held fund management companies. In this regard, the Senior Officer noted the limited availability of such information, but nonetheless concluded that Federated's profit margins did not appear to be excessive and the Board agreed.
The Senior Officer's evaluation also discussed the notion of possible realization of “economies of scale” as a fund grows larger. The Board considered in this regard that the Adviser has made significant and long-term investments in areas that support all of the Federated funds, such as personnel and processes for the portfolio management, compliance, and risk management functions; and systems technology; and that the benefits of these efforts (as well as any economies, should they exist) were likely to be enjoyed by the fund complex as a whole. Finally, the Board also noted the absence of any applicable regulatory or industry guidelines on this subject, which (as discussed in the Senior Officer's evaluation) is compounded by the lack of any common industry practice or general pattern with respect to structuring fund advisory fees with “breakpoints” that serve to reduce the fee as the fund attains a certain size. The Senior Officer did not recommend institution of breakpoints in pricing Federated's fund advisory services at this time.
It was noted in the materials for the Board meeting that for the period covered by the report, the Fund's investment advisory fee, after waivers and expense reimbursements, if any, was above the median of the relevant peer group. The Board reviewed the fees and other expenses of the Fund with the Adviser and was satisfied that the overall expense structure of the Fund remained competitive. The Board will continue to monitor advisory fees and other expenses borne by the Fund.
The Senior Officer's evaluation noted his belief that the information and observations contained in his evaluation supported a finding that the proposed management fees are reasonable, and that Federated appeared to provide appropriate administrative services to the Fund for the fees paid. Under these circumstances, no changes were recommended to, and no objection was raised to, the continuation of the Fund's advisory contract. The Board concluded that the nature, quality and scope of services provided the Fund by the Adviser and its affiliates were satisfactory.
Annual Shareholder Report
53
In its decision to continue an existing investment advisory contract, the Board was mindful of the potential disruptions of the Fund's operations and various risks, uncertainties and other effects that could occur as a result of a decision to terminate or not renew an advisory contract. In particular, the Board recognized that many shareholders have invested in the Fund on the strength of the Adviser's industry standing and reputation and with the expectation that the Adviser will have a continuing role in providing advisory services to the Fund. Thus, the Board's approval of the advisory contract reflected the fact that it is the shareholders who have effectively selected the Adviser by virtue of having invested in the Fund.The Board based its decision to approve the advisory contract on the totality of the circumstances and relevant factors and with a view to past and future long-term considerations. Not all of the factors and considerations identified above were necessarily relevant to the Fund, nor did the Board consider any one of them to be determinative. With respect to the factors that were relevant, the Board's decision to approve the contract reflects its determination that Federated's performance and actions provided a satisfactory basis to support the decision to continue the existing arrangements.
Annual Shareholder Report54
Voting Proxies on Fund Portfolio Securities
A description of the policies and procedures that the Fund uses to determine how to vote proxies, if any, relating to securities held in the Fund's portfolio is available, without charge and upon request, by calling 1-800-341-7400. A report on “Form N-PX” of how the Fund voted any such proxies during the most recent 12-month period ended June 30 is available from Federated's website at FederatedInvestors.com. To access this information from the “Products” section of the website, click on the “Prospectuses and Regulatory Reports” link under “Related Information,” then select the appropriate link opposite the name of the Fund; or select the name of the Fund and from the Fund's page, click on the “Prospectuses and Regulatory Reports” link. Form N-PX filings are also available at the SEC's website at www.sec.gov.
Quarterly Portfolio Schedule
The Fund files with the SEC a complete schedule of its portfolio holdings, as of the close of the first and third quarters of its fiscal year, on “Form N-Q.” These filings are available on the SEC's website at www.sec.gov and may be reviewed and copied at the SEC's Public Reference Room in Washington, DC. (Call 1-800-SEC-0330 for information on the operation of the Public Reference Room.) You may also access this information from the “Products” section of Federated's website at FederatedInvestors.com by clicking on “Portfolio Holdings” under “Related Information,” then selecting the appropriate link opposite the name of the Fund; or select the name of the Fund and from the Fund's page, click on the “Portfolio Holdings” link.
Annual Shareholder Report55
Mutual funds are not bank deposits or obligations, are not guaranteed by any bank and are not insured or guaranteed by the U.S. government, the Federal Deposit Insurance Corporation, the Federal Reserve Board or any other government agency. Investment in mutual funds involves investment risk, including the possible loss of principal.
This Report is authorized for distribution to prospective investors only when preceded or accompanied by the Fund's Prospectus, which contains facts concerning its objective and policies, management fees, expenses and other information.
Federated InterContinental Fund
Federated Investors Funds
4000 Ericsson Drive
Warrendale, PA 15086-7561
Contact us at FederatedInvestors.com
or call 1-800-341-7400.
Federated Securities Corp., Distributor
Cusip 314172511
Cusip 314172495
Cusip 314172487
Cusip 314172479
37865 (1/11)
Federated is a registered mark of Federated Investors, Inc.
2011 ©Federated Investors, Inc.
Federated InterContinental Fund
A Portfolio of Federated Equity Funds
ANNUAL SHAREHOLDER REPORTNovember 30, 2010
Institutional Shares
FINANCIAL HIGHLIGHTS
SHAREHOLDER EXPENSE EXAMPLE
MANAGEMENT'S DISCUSSION OF FUND PERFORMANCE
PORTFOLIO OF INVESTMENTS SUMMARY TABLES
PORTFOLIO OF INVESTMENTS
STATEMENT OF ASSETS AND LIABILITIES
STATEMENT OF OPERATIONS
STATEMENT OF CHANGES IN NET ASSETS
NOTES TO FINANCIAL STATEMENTS
REPORT OF INDEPENDENT REGISTERED PUBLIC ACCOUNTING FIRM
BOARD OF TRUSTEES AND TRUST OFFICERS
EVALUATION AND APPROVAL OF ADVISORY CONTRACT
VOTING PROXIES ON FUND PORTFOLIO SECURITIES
QUARTERLY PORTFOLIO SCHEDULE
Financial Highlights – Institutional Shares
(For a Share Outstanding Throughout Each Period)
| Year Ended November 30, | Period
Ended
11/30/20071 |
| 2010 | 2009 | 2008 |
| Net Asset Value, Beginning of Period | $43.42 | $31.68 | $70.36 | $65.15 |
| Income From Investment Operations: | | | | |
| Net investment income | 0.462 | 0.572 | 1.672 | 0.122 |
| Net realized and unrealized gain (loss) on investments, futures contracts and foreign currency transactions | 2.95 | 13.18 | (37.46) | 5.09 |
TOTAL FROM
INVESTMENT OPERATIONS | 3.41 | 13.75 | (35.79) | 5.21 |
| Less Distributions: | | | | |
| Distributions from net investment income | (1.08) | (2.03) | (0.53) | — |
| Distributions from net realized gain on investments and foreign currency transactions | — | — | (2.36) | — |
| TOTAL DISTRIBUTIONS | (1.08) | (2.03) | (2.89) | — |
| Redemption Fees | 0.003 | 0.003 | 0.003 | — |
| Regulatory Settlement Proceeds | 0.014 | 0.025 | — | — |
| Net Asset Value, End of Period | $45.76 | $43.42 | $31.68 | $70.36 |
| Total Return6 | 8.03%4 | 45.80%5 | (53.00)% | 8.00% |
| Ratios to Average Net Assets: | | | | |
| Net expenses | 1.16%7 | 1.18% | 1.20% | 1.20%8 |
| Net investment income | 1.06% | 1.62% | 3.12% | 0.64%8 |
| Expense waiver/reimbursement9 | 0.11% | 0.11% | 0.08% | 0.23%8 |
| Supplemental Data: | | | | |
| Net assets, end of period (000 omitted) | $197,682 | $133,677 | $85,520 | $29,062 |
| Portfolio turnover | 71% | 121% | 65% | 28%10 |
| 1 | Reflects operations for the period from August 25, 2007 (start of performance) to November 30, 2007. |
| 2 | Per share numbers have been calculated using the average shares method. |
| 3 | Represents less than $0.01. |
| 4 | During the year ended November 30, 2010, the Fund received a regulatory settlement from an unaffiliated third party, which had an impact of 0.02% on the total return. |
| 5 | During the year ended November 30, 2009, the Fund received a regulatory settlement from an unaffiliated third party, which had an impact of 0.10% on the total return. |
| 6 | Based on net asset value. Total returns for periods of less than one year are not annualized. |
| 7 | The net expense ratio is calculated without reduction for expense offset arrangements. The net expense ratio is 1.16% for the year ended November 30, 2010, after taking into account this expense reduction. |
| 8 | Computed on an annualized basis. |
| 9 | This expense decrease is reflected in both the net expense and the net investment income ratios shown above. |
| 10 | Portfolio turnover is calculated at the Fund level. Percentage indicated was calculated for the period from January 1, 2007 to November 30, 2007. |
See Notes which are an integral part of the Financial Statements
Annual Shareholder Report1
Shareholder Expense Example (unaudited)
As a shareholder of the Fund, you incur two types of costs: (1) transaction costs, including redemption/exchange fees; and (2) ongoing costs, including management fees and to the extent applicable, distribution (12b-1) fees and/or shareholder services fees and other Fund expenses. This Example is intended to help you to understand your ongoing costs (in dollars) of investing in the Fund and to compare these costs with the ongoing costs of investing in other mutual funds. It is based on an investment of $1,000 invested at the beginning of the period and held for the entire period from June 1, 2010 to November 30, 2010.
ACTUAL EXPENSES
The first section of the table below provides information about actual account values and actual expenses. You may use the information in this section, together with the amount you invested, to estimate the expenses that you incurred over the period. Simply divide your account value by $1,000 (for example, an $8,600 account value divided by $1,000 = 8.6), then multiply the result by the number in the first section under the heading entitled “Expenses Paid During Period” to estimate the expenses attributable to your investment during this period.
HYPOTHETICAL EXAMPLE FOR COMPARISON PURPOSES
The second section of the table below provides information about hypothetical account values and hypothetical expenses based on the Fund's actual expense ratio and an assumed rate of return of 5% per year before expenses, which is not the Fund's actual return. Thus, you should not use the hypothetical account values and expenses to estimate the actual ending account balance or your expenses for the period. Rather, these figures are required to be provided to enable you to compare the ongoing costs of investing in the Fund with other funds. To do so, compare this 5% hypothetical example with the 5% hypothetical examples that appear in the shareholder reports of the other funds.
Please note that the expenses shown in the table are meant to highlight your ongoing costs only and do not reflect any transaction costs, such as redemption/exchange fees. Therefore, the second section of the table is useful in comparing ongoing costs only, and will not help you determine the relative total costs of owning different funds. In addition, if these transaction costs were included, your costs would have been higher.
| Beginning
Account Value
6/1/2010 | Ending
Account Value
11/30/2010 | Expenses Paid
During Period1 |
| Actual | $1,000 | $1,177.90 | $6.33 |
Hypothetical (assuming a 5% return
before expenses) | $1,000 | $1,019.25 | $5.87 |
| 1 | Expenses are equal to the Fund's annualized net expense ratio of 1.16%, multiplied by the average account value over the period, multiplied by 183/365 (to reflect the one-half-year period). |
Annual Shareholder Report2
Performance data quoted represents past performance which is no guarantee of future results. Investment return and principal value will fluctuate so that an investor's shares, when redeemed, may be worth more or less than their original cost. Mutual fund performance changes over time and current performance may be lower or higher than what is stated. For current to the most recent month-end performance and after-tax returns, visit FederatedInvestors.com or call 1-800-341-7400.
Management's Discussion of Fund Performance (unaudited)
The Fund's total return, based on net asset value for the 12-month reporting period ended November 30, 2010, was 8.03% for the Institutional Share Class. The Fund's benchmark, the Morgan Stanley Capital International All Country World ex USA Index (MSCI ACWI ex USA),1 returned 5.26% over the same period. The Fund's total return for the most recently completed fiscal year reflected actual cash flows, transaction costs and other expenses which were not reflected in the total return of the MSCI ACWI ex USA.
MARKET OVERVIEW
The reporting period was characterized by an uneven global recovery.2 Investors discovered true divergences between debtor and creditor countries. Fiscal stimulus packages that had once provided tailwinds for the global economic recovery became headwinds for some in the form of deficit cutting measures. Traditional economic classifications of developed markets (less risk) and emerging markets (more risk) became murky and economic boundaries began to be redefined by countries with austerity measures (e.g. Greece, United Kingdom) and those with structural growth policies (e.g. China, Brazil). Generally, countries with higher debt burdens were associated with slower economic growth prospects (more risk) and countries which had managed their fiscal balance sheets more prudently were associated with higher growth prospects (less risk).
| 1 | The MSCI ACWI (All Country World Index) ex USA is a free float-adjusted market capitalization weighted index that is designed to measure the equity market performance of developed and emerging markets. As of November 2010, the MSCI ACWI ex USA consisted of 44 country indices comprising 23 developed and 21 emerging market country indices. The developed market country indices included are: Australia, Austria, Belgium, Canada, Denmark, Finland, France, Germany, Greece, Hong Kong, Ireland, Israel, Italy, Japan, Netherlands, New Zealand, Norway, Portugal, Singapore, Spain, Sweden, Switzerland and the United Kingdom. The emerging market country indices included are: Brazil, Chile, China, Colombia, Czech Republic, Egypt, Hungary, India, Indonesia, Korea, Malaysia, Mexico, Morocco, Peru, Philippines, Poland, Russia, South Africa, Taiwan, Thailand and Turkey. The index is unmanaged and, unlike the fund, is not affected by cash flows. It is not possible to invest directly in an index. |
| 2 | International investing involves special risks including currency risk, increased volatility, political risks and differences in auditing and other financial standards. Prices of emerging market securities can be significantly more volatile than the prices of securities in developed countries. Currency risk and political risks are accentuated in emerging markets. |
Annual Shareholder Report
3
This uneven recovery caused a wide divergence of returns between strong countries with economic growth, and corporate profits, versus weak countries plagued by sovereign risks. Nowhere was this more evident than in the Eurozone, where initially all markets dropped on concerns that the sovereign debt crisis clouding the peripheral countries (Greece, Spain and Portugal) would spread throughout the region. While risks still remain, multiple support measures have been put in place over the past year, the most important being the €440 billion (US$ 583 billion) European Financial Stability Facility which is to be replaced with a permanent European Stability Mechanism (ESM) in 2013. Currently, Eurozone 2010 GDP growth expectations are about 1.7%, which is much better than at the beginning of the year when a below trend growth rate of 1.3% was forecast. The main driver of the better 2010 results in the Eurozone was due to Germany, a key European creditor and exporting country. Germany real Gross Domestic Product expanded at an estimated 3.6%, twice the rate forecast in January, as emerging markets and industrial demand for German goods accelerated throughout the year.While many developed European countries dealt with necessary austerity measures, developing Asia and Latin America experienced a stronger-than-expected recovery. These robust growth economies further highlighted the tug of war between developed debt-ridden countries versus cash-rich fiscally sound countries. Although the sharp recovery in the first half of 2010 moderated in the second half, booming China and Brazil remained supportive of both global growth and Asian and Latin American regional growth, respectively.
The risk of a global currency war has been rising throughout the year as countries look to improve their fiscal positions by increasing their export ratios. While the euro dropped in sympathy with sovereign debt fears, the Japanese yen surged to a fifteen-year high versus the dollar. In a move aimed to support its export-reliant economy, the Bank of Japan intervened by selling yen and committing that the government would initiate a new round of fiscal stimulus and quantitative easing. The U.S. followed suit in November with a commitment from the Federal Reserve to repurchase $600 billion in Treasuries and reinvest up to $300 billion. Other countries pursued aggressive foreign currency reserve accumulation, deployed taxes (e.g. Brazil, Thailand) or limited capital controls (e.g. Korea) in an effort to stem rapid currency appreciation.
Annual Shareholder Report
4
For the second year in a row, for the 12-month reporting period ended November 30, 2010, the MSCI Emerging Markets Index3 outperformed with a return of 15.3% compared to a return of 1.1% for the MSCI EAFE4 and 9.8% for MSCI USA.5 Among the top emerging market performers for the year were Chile, up 51.5%; Turkey, up 41.9%; Indonesia, up 36.6% and Malaysia, up 30.4%. As we highlighted there was strong divergence amongst European countries with Sweden and Denmark up 20.5% and 14.6% respectively, while Greece, Spain and Ireland posted negative returns of (49.1%), (30.3%) and (24.2%), respectively. The divergence in the Eurozone weighed on German returns which managed to post a small increase of 2.6%. In Asia, there were also strong positive returns in Hong Kong, up 25.0%; Singapore, up 22.6% and Japan, up 8.1%.FUND Performance
Country allocation remained the primary driver of performance for the reporting period, as it consistently has been over the past five reporting periods. German shares, which represented the Fund's largest overweight allocation positively impacted performance as better than expected growth translated to strong market returns with key exporters BASF and Siemens positively impacting performance.
| 3 | The MSCI Emerging Markets Index is a free float-adjusted market capitalization index that is designed to measure equity market performance of emerging markets. As of November 2010, the MSCI Emerging Markets Index consisted of the following 21 emerging market country indices: Brazil, Chile, China, Colombia, Czech Republic, Egypt, Hungary, India, Indonesia, Korea, Malaysia, Mexico, Morocco, Peru, Philippines, Poland, Russia, South Africa, Taiwan, Thailand and Turkey. The index is unmanaged and, unlike the fund, is not affected by cash flows. It is not possible to invest directly in an index. |
| 4 | The MSCI EAFE Index (Europe, Australasia, Far East) is a free float-adjusted market capitalization index that is designed to measure the equity market performance of developed markets, excluding the US & Canada. As of May 27, 2010 the MSCI EAFE Index consisted of the following 22 developed market country indices: Australia, Austria, Belgium, Denmark, Finland, France, Germany, Greece, Hong Kong, Ireland, Israel, Italy, Japan, the Netherlands, New Zealand, Norway, Portugal, Singapore, Spain, Sweden, Switzerland and the United Kingdom. |
| 5 | The MSCI USA Index is a free float adjusted market capitalization index that is designed to measure large and mid-cap U.S. equity market performance. The MSCI USA Index is member of the MSCI international equity index series and represents the U.S. equity portion of the global benchmark MSCI ACWI (All Country World Index). The index is unmanaged and, unlike the fund, is not affected by cash flows. It is not possible to invest directly in an index. |
Annual Shareholder Report
5
An overweight in Chile contributed positively to the Fund's performance as MSCI Chile Index6 was the top performing market in the Fund's country universe, up 51.5%. This strong Latin American economy achieved a declining unemployment rate, stronger domestic demand and improving credit conditions, despite a record magnitude earthquake in February. Although sovereign debt fears dominated other key economies in 2010, Chile, like many developing economies that we monitor, had made great strides over the last decade to reform its government, build sound institutions, balance its budget, etc. and as a result the Latin American country developed into a lower risk economy. Generally, investments in other emerging markets such as Chile's Latin America neighbor, Mexico, helped performance due to their strong link to the recovering U.S. industrial economy, stabilizing domestic demand and expectations for a global cyclical recovery. The economy of South Korea, another key overweight for the fund, accelerated more than expected, along with other Asian economies, into a robust expansionary phase as the global recovery spurred demand for manufactured goods and automobiles, which benefited our holdings in Hyundai Heavy Industries and Hyundai Motors.The Funds weakest performing country on a relative basis was Italy which negatively contributed to performance. Research indicated Italy stood apart from its peripheral neighbors as it is better situated to manage its debt going forward due to both a strong export sector and a large domestic investor base. However, investor concerns of Eurozone contagion outweighed Italy's relatively positive strengths.
| 6 | MSCI country indexes are constructed by identifying every listed security in the market. Securities are free float adjusted, classified in accordance with the Global Industry Classification Standard (GICS®), and screened by size, liquidity and minimum free float. |
Annual Shareholder Report6
GROWTH OF A $10,000 INVESTMENT - INSTITUTIONAL SHARES
The graph below illustrates the hypothetical investment of $10,0001,2 in Federated InterContinental Fund (Institutional Shares) (the “Fund”) from November 30, 2000 to November 30, 2010, compared to the Morgan Stanley Capital International All Country World ex USA Index (MSCI ACWI ex USA).3
| Average Annual Total Returns for the Period Ended 11/30/2010 | |
| 1 Year | 8.03% |
| 5 Years | 4.83% |
| 10 Years | 6.42% |
Performance data quoted represents past performance which is no guarantee of future results. Investment return and principal value will fluctuate so that an investor's shares, when redeemed, may be worth more or less than their original cost. Mutual fund performance changes over time and current performance may be lower or higher than what is stated. For current to the most recent month-end performance and after-tax returns, visit FederatedInvestors.com or call 1-800-341-7400. Returns shown do not reflect the deduction of taxes that a shareholder would pay on Fund distributions or the redemption of Fund shares. Mutual funds are not obligations of or guaranteed by any bank and are not federally insured.
Annual Shareholder Report
7
| 1 | Represents a hypothetical investment of $10,000 in the Fund. The Fund's performance assumes the reinvestment of all dividends and distributions. The MSCI ACWI ex USA has been adjusted to reflect reinvestment of dividends on securities in the index. |
| 2 | The Fund's Institutional Shares commenced operations on August 25, 2007. The Fund offers four other classes of shares: Class A Shares, Class B Shares, Class C Shares and Class K Shares. For the period prior to the commencement of operations of Institutional Shares, the performance information shown is for the Fund's Class A Shares. The performance of the Class A Shares has not been adjusted to reflect the expenses of the Institutional Shares since the Institutional Shares have a lower expense ratio than the expense ratio of the Class A Shares. The performance of the Class A Shares has been adjusted to remove any voluntary waiver of Fund expenses related to the Class A Shares that may have occurred during the period prior to the commencement of operations of the Institutional Shares. |
| 3 | The MSCI ACWI ex USA is not adjusted to reflect sales charges, expenses or other fees that the Securities and Exchange Commission requires to be reflected in the Fund's performance. The index is unmanaged and, unlike the Fund, is not affected by cash flows. It is not possible to invest directly in an index. |
Annual Shareholder Report8
Portfolio of Investments Summary
Tables (unaudited)
At November 30, 2010, the Fund's portfolio composition1 was as follows:
| Country | Percentage of
Total Net Assets |
| Germany | 19.3% |
| Denmark | 13.1% |
| South Korea | 12.0% |
| Norway | 11.5% |
| Taiwan | 9.3% |
| Mexico | 9.0% |
| Japan | 6.7% |
| Brazil | 6.6% |
| China | 4.5% |
| Austria | 3.8% |
| Indonesia | 2.7% |
| U.S. Treasury Security | 0.2% |
| Securities Lending Collateral2 | 6.4% |
| Cash Equivalents3 | 1.7% |
| Derivative Contracts4 | (0.1)% |
| Other Assets and Liabilities — Net5 | (6.7)% |
| TOTAL | 100.0% |
| 1 | Country allocations are based primarily on the country in which a company is incorporated. However, the Fund's Adviser may allocate a company to a country based on other factors such as location of the company's principal office, the location of the principal trading market for the company's securities or the country where a majority of the company's revenues are derived. |
| 2 | Cash collateral received from lending portfolio securities which is invested in short-term investments such as repurchase agreements or money market mutual funds. |
| 3 | Cash Equivalents include any investments in money market mutual funds and/or overnight repurchase agreements other than those representing securities lending collateral. |
| 4 | Based upon net unrealized appreciation (depreciation) or value of the derivative contracts as applicable. Derivative contracts may consist of futures, forwards, options and swaps. The impact of a derivative contract on the Fund's performance may be larger than its unrealized appreciation (depreciation) or value may indicate. In many cases, the notional value or amount of a derivative contract may provide a better indication of the contract's significance to the portfolio. More complete information regarding the Fund's direct investments in derivative contracts, including unrealized appreciation (depreciation), value and notional values or amounts of such contracts, can be found in the table at the end of the Portfolio of Investments included in this report. |
| 5 | Assets, other than investments in securities and derivative contracts, less liabilities. See Statement of Assets and Liabilities. |
Annual Shareholder Report
9
At November 30, 2010, the Fund's sector classification composition6 was as follows:| Sector Classification | Percentage of
Total Net Assets |
| Financials | 18.5% |
| Industrials | 14.6% |
| Materials | 14.3% |
| Energy | 11.1% |
| Information Technology | 9.3% |
| Consumer Discretionary | 7.9% |
| Consumer Staples | 7.7% |
| Telecommunication Services | 7.2% |
| Health Care | 6.7% |
| Utilities | 1.2% |
| U.S. Treasury Security | 0.2% |
| Securities Lending Collateral2 | 6.4% |
| Cash Equivalents3 | 1.7% |
| Derivative Contracts4 | (0.1)% |
| Other Assets and Liabilities — Net5 | (6.7)% |
| TOTAL | 100.0% |
| 6 | Except for Securities Lending Collateral, Derivative Contracts, Cash Equivalents and Other Assets and Liabilities, sector classifications are based upon, and individual securities assigned to, the classifications of the Global Industry Classification Standard (GICS) except that the Adviser assigns a classification to securities not classified by the GICS and to securities for which the Adviser does not have access to the classification made by the GICS. |
Annual Shareholder Report10
Portfolio of Investments
November 30, 2010
Shares or
Principal
Amount | | | Value in
U.S. Dollars |
| | COMMON STOCKS – 98.5% | |
| | Austria – 3.8% | |
| 411,854 | | Erste Group Bank AG | 16,110,391 |
| 45,000 | | OMV AG | 1,512,294 |
| 132,000 | | Raiffeisen Bank International AG | 6,489,604 |
| 144,831 | | Vienna Insurance Group | 6,731,267 |
| | TOTAL | 30,843,556 |
| | Brazil – 6.6% | |
| 317,501 | 1 | Banco Bradesco SA, ADR | 6,369,070 |
| 149,000 | | Banco Do Brasil SA | 2,859,034 |
| 22,300 | 1 | Companhia de Bebidas das Americas (AmBev), ADR | 3,024,772 |
| 40,300 | 1,2 | Companhia de Saneamento Basico do Estado de Sao Paulo, Class ADR | 1,819,545 |
| 235,515 | 1 | Companhia Energetica de Minas Gerais, ADR | 4,022,596 |
| 347,600 | 1 | Companhia Siderurgica Nacional SA, ADR | 5,439,940 |
| 200,000 | 1 | Gol — Linhas Aereas Inteligentes SA, ADR | 3,234,000 |
| 209,393 | | Itau Unibanco Holding SA, ADR | 4,885,139 |
| 178,000 | 1 | Petroleo Brasileiro SA, ADR, Common | 5,211,840 |
| 147,380 | 1 | Petroleo Brasileiro SA, ADR, Preference | 4,781,007 |
| 138,600 | 1 | Tele Norte Leste Participacoes SA, ADR | 1,952,874 |
| 317,720 | 1 | Vale SA, ADR | 10,065,370 |
| | TOTAL | 53,665,187 |
| | China – 4.5% | |
| 360,000 | | Beijing Enterprises | 2,269,384 |
| 1,700,000 | | Belle International Holdings | 3,126,296 |
| 1,739,200 | | CNOOC Ltd. | 3,771,765 |
| 3,500,000 | | China Construction Bank | 3,168,665 |
| 245,000 | 2 | China Construction Bank, Rights | 81,403 |
| 481,500 | | China Mobile Ltd. | 4,799,436 |
| 1,800,000 | | China Oilfield Services Ltd. | 3,282,379 |
| 2,120,000 | | Dongfeng Motor Corp. | 4,040,643 |
| 3,220,000 | | Industrial & Commercial Bank of China | 2,504,643 |
| 144,900 | 2 | Industrial and Commercial Bank of China, Ltd., Rights | 47,584 |
| 3,500,000 | | Jiangsu Expressway, Class H | 3,790,679 |
| 230,000 | | Ping An Insurance (Group) Co. of China Ltd. | 2,679,103 |
Annual Shareholder Report11
Shares or
Principal
Amount | | | Value in
U.S. Dollars |
| 135,500 | | Tencent Holdings Ltd. | 2,994,398 |
| | TOTAL | 36,556,378 |
| | Denmark – 13.1% | |
| 1,078 | | AP Moller-Maersk A/S | 8,727,780 |
| 87,000 | | Carlsberg A/S, Class B | 8,211,907 |
| 31,300 | | Coloplast AS, Class B | 4,164,503 |
| 432,600 | | DSV, De Sammensluttede Vognmad AS | 8,520,688 |
| 158,800 | | Danisco A/S | 12,129,547 |
| 592,300 | | Danske Bank A/S | 14,688,491 |
| 17,000 | | FLS Industries AS, Class B | 1,397,386 |
| 390,000 | 2 | GN Store Nord AS | 3,232,935 |
| 391,700 | 1 | H. Lundbeck AS | 6,783,969 |
| 47,800 | 1 | NKT Holding A/S | 2,126,054 |
| 550,000 | | Nordea Bank AB | 5,478,220 |
| 237,200 | | Novo Nordisk, Class B | 23,463,267 |
| 17,300 | | Novozymes A/S, Class B | 2,258,100 |
| 54,000 | | Royal Unibrew A/S | 2,835,349 |
| 120,500 | | Sydbank AS | 2,958,909 |
| | TOTAL | 106,977,105 |
| | Germany – 19.3% | |
| 109,100 | | Allianz SE | 11,966,664 |
| 193,000 | | BASF SE | 14,405,116 |
| 59,000 | | Bayer AG | 4,284,930 |
| 180,000 | 1 | Commerzbank AG, Frankfurt | 1,310,772 |
| 55,000 | | Continental AG | 4,270,002 |
| 154,000 | | Daimler AG | 9,969,003 |
| 119,050 | | Deutsche Bank AG | 5,655,132 |
| 137,000 | | Deutsche Lufthansa AG | 2,915,571 |
| 815,000 | | Deutsche Telekom AG, Class REG | 10,437,352 |
| 81,800 | | E.On AG | 2,347,121 |
| 73,000 | | Fresenius SE | 6,254,955 |
| 77,500 | | GEA Group AG | 1,863,092 |
| 85,600 | | Hochtief AG | 6,339,004 |
| 31,100 | | Linde AG | 4,343,745 |
| 41,000 | | MAN SE | 4,817,481 |
| 78,000 | | MTU Aero Engines GmbH | 4,546,033 |
| 75,500 | | Metro AG | 5,415,636 |
Annual Shareholder Report12
Shares or
Principal
Amount | | | Value in
U.S. Dollars |
| 80,300 | | Muenchener Rueckversicherungs-Gesellschaft AG | 11,152,980 |
| 16,809 | | Puma AG Rudolf Dassler Sport | 4,995,445 |
| 54,000 | | SAP AG | 2,519,205 |
| 214,100 | | Siemens AG | 23,425,256 |
| 120,000 | | Suedzucker AG | 2,565,467 |
| 43,000 | | Vossloh AG | 4,856,007 |
| 14,200 | | Wacker Chemie AG | 2,433,066 |
| 64,200 | | Wincor Nixdorf AG | 4,745,086 |
| | TOTAL | 157,834,121 |
| | Indonesia – 2.7% | |
| 9,800,000 | | PT Adaro Energy | 2,522,139 |
| 510,000 | | PT Astra International | 2,929,931 |
| 2,500,000 | | PT Bank Central Asia | 1,674,231 |
| 2,200,000 | | PT Bank Mandiri | 1,558,557 |
| 3,000,000 | | PT Bank Negara Indonesia | 1,344,919 |
| 1,300,000 | | PT Bank Rakyat Indonesia | 1,510,959 |
| 2,400,000 | | PT Indofood Sukses Makmur | 1,215,409 |
| 4,900,000 | 2 | PT International Nickel Indonesia Tbk (INCO) | 2,427,215 |
| 22,000 | | PT Telekomunikasi Indonesia, Class CS, ADR | 791,780 |
| 1,110,000 | | PT Unilever Indonesia Tbk | 1,843,038 |
| 920,000 | | PT United Tractors | 2,342,262 |
| 3,500,000 | | Perusahaan Gas Negara PT | 1,665,929 |
| | TOTAL | 21,826,369 |
| | Japan – 6.7% | |
| 185,000 | | Ajinomoto Co., Inc. | 1,825,905 |
| 1,020,000 | | Asahi Kasei Corp. | 6,069,542 |
| 30,000 | | Astellas Pharma, Inc. | 1,075,397 |
| 600,000 | | Cosmo Oil Co. Ltd. | 1,699,128 |
| 140,000 | | Daiichi Sankyo Co. Ltd. | 3,029,514 |
| 230,000 | 2 | Jx Holdings, Inc. | 1,423,587 |
| 730,000 | | Kaneka Corp. | 4,352,611 |
| 470,000 | | Mitsubishi Chemical Holdings Corp. | 2,701,278 |
| 340,000 | | Mitsubishi Electric Corp. | 3,367,905 |
| 720,000 | | Mitsui Chemicals, Inc. | 2,202,414 |
| 1,150,000 | | NEC Corp. | 3,174,214 |
| 400,000 | | Nomura Holdings, Inc. | 2,303,740 |
| 535,000 | | Sumitomo Electric Industries | 6,999,940 |
Annual Shareholder Report13
Shares or
Principal
Amount | | | Value in
U.S. Dollars |
| 52,000 | | Takeda Pharmaceutical Co. Ltd. | 2,417,015 |
| 840,000 | | Tokuyama Corp. | 4,155,335 |
| 320,000 | | Toray Industries, Inc. | 1,785,638 |
| 500,000 | | Toshiba Corp. | 2,604,851 |
| 1,350,000 | | Ube Industries | 3,435,894 |
| | TOTAL | 54,623,908 |
| | Mexico – 9.0% | |
| 398,000 | 1 | America Movil SAB de CV, Class L, ADR | 22,471,080 |
| 133,000 | | Fomento Economico Mexicano, SA de CV, ADR | 7,521,150 |
| 29,900 | | Grupo Aeroportuario del Sureste SAB de CV, Class B, ADR | 1,546,129 |
| 303,800 | | Grupo Bimbo SA de CV, Class A | 2,469,918 |
| 1,130,000 | | Grupo Financiero Banorte SA de CV | 4,899,427 |
| 650,000 | | Grupo Financiero Inbursa, SA de CV, Class O | 2,822,419 |
| 485,000 | | Grupo Modelo S.A. de CV, Class C | 2,847,571 |
| 294,000 | | Grupo Televisa SA, GDR | 6,850,200 |
| 84,000 | | Industrias Penoles SA | 2,613,961 |
| 350,000 | | Mexichem SA de CV | 1,195,963 |
| 2,175,000 | 2 | Nuevo Grupo Mexico SA, Class B | 7,388,502 |
| 3,880,000 | | Wal-Mart de Mexico SAB de CV | 10,961,400 |
| | TOTAL | 73,587,720 |
| | Norway – 11.5% | |
| 473,700 | | Acergy SA | 9,424,741 |
| 218,000 | | Aker Solutions ASA | 3,224,925 |
| 795,866 | | Den Norske Bank A/S | 9,736,461 |
| 204,300 | | Fred Olsen Energy ASA | 7,580,308 |
| 250,200 | 1 | Frontline Ltd. | 6,548,705 |
| 2,178,600 | | Golden Ocean Group Ltd. | 2,945,807 |
| 170,000 | 2 | Petroleum Geo-Services ASA | 2,063,326 |
| 133,000 | | SeaDrill Ltd. | 4,072,019 |
| 807,443 | | Statoil ASA | 15,999,908 |
| 226,000 | 1,2 | Subsea 7 Inc. | 4,740,241 |
| 156,600 | | TGS Nopec Geophysical Co. ASA | 2,677,096 |
| 868,400 | | Telenor ASA | 12,482,997 |
| 264,500 | | Yara International ASA | 12,589,967 |
| | TOTAL | 94,086,501 |
| | South Korea – 12.0% | |
| 145,400 | | Daewoo Shipbuilding & Marine Engineering Co. Ltd. | 3,724,668 |
Annual Shareholder Report14
Shares or
Principal
Amount | | | Value in
U.S. Dollars |
| 95,000 | | Dongkuk Steel Mill | 2,335,260 |
| 47,000 | | Hana Financial Holdings | 1,540,452 |
| 139,700 | | Hanwha Chemical | 3,825,664 |
| 17,200 | | Hyundai Heavy | 5,511,299 |
| 59,300 | | Hyundai Motor Co. | 8,822,883 |
| 15,800 | | Inchon Iron & Steel | 1,499,051 |
| 60,000 | | Industrial Bank of Korea | 838,365 |
| 70,000 | | KB Financial Group, Inc. | 3,266,345 |
| 202,900 | 1 | KT Corp., ADR | 4,126,986 |
| 135,000 | 2 | Kia Motors Corp. | 5,699,715 |
| 9,129 | | LG Chemical Ltd. | 3,055,073 |
| 20,000 | | LG Corp. | 1,409,350 |
| 44,900 | | LG Electronics, Inc. | 3,988,873 |
| 35,750 | | POSCO, ADR | 3,519,230 |
| 31,600 | | SK Energy Co. Ltd. | 4,510,782 |
| 30,800 | | Samsung Electro-Mechanics Co. | 3,320,683 |
| 26,750 | | Samsung Electronics Co. | 19,057,702 |
| 22,000 | | Samsung Engineering Co. Ltd. | 3,519,924 |
| 115,000 | | Samsung Heavy Industries | 3,293,083 |
| 30,600 | | Samsung SDI Co. Ltd. | 4,368,035 |
| 55,000 | | Shinhan Financial Group Co. Ltd. | 2,120,493 |
| 130,700 | | Woongjin Coway Co. Ltd. | 4,729,054 |
| | TOTAL | 98,082,970 |
| | Taiwan, Province of China – 9.3% | |
| 10,300,000 | 2 | CMC Magnetics Corp. | 2,551,136 |
| 5,170,000 | | Cathay Financial Holding Co. Ltd. | 7,810,334 |
| 2,000,000 | | China Steel Corp. | 2,056,918 |
| 3,984,400 | | Chinatrust Financial Holding Co. Ltd. | 2,398,548 |
| 800,000 | | Chunghwa Telecom Co. Ltd. | 1,942,098 |
| 1,610,000 | | Coretronic Corp. | 2,297,548 |
| 1,734,000 | | Far Eastern New Century Corp. | 2,562,674 |
| 1,050,000 | | Formosa Chem & Fibre | 3,110,473 |
| 1,895,000 | | Formosa Petrochemical Corp. | 5,246,879 |
| 1,090,000 | | Formosa Plastic Corp. | 3,243,271 |
| 1,580,000 | | Gigabyte Technology Co. Ltd. | 1,567,949 |
| 5,243,000 | | Inventec Co. Ltd. | 2,691,805 |
| 2,620,000 | | Mega Financial Holding Co. Ltd. | 1,740,507 |
Annual Shareholder Report15
Shares or
Principal
Amount | | | Value in
U.S. Dollars |
| 4,000,000 | | Micro-Star International Co. | 2,086,443 |
| 1,910,000 | | Nan Ya Plastic | 4,254,540 |
| 5,425,200 | | Pou Chen Corp. | 4,992,270 |
| 3,480,000 | | Siliconware Precision Industries Co. | 3,624,703 |
| 3,725,000 | | Taiwan Semiconductor Manufacturing Co. | 7,747,560 |
| 15,900,000 | | United Microelectronics Corp. | 7,876,323 |
| 6,300,000 | | Vanguard International Semiconductor Corp. | 2,583,449 |
| 4,500,000 | | Wan Hai Lines Ltd. | 3,351,103 |
| | TOTAL | 75,736,531 |
| | TOTAL COMMON STOCKS
(IDENTIFIED COST $682,357,556) | 803,820,346 |
| | U.S. Treasury – 0.2% | |
| $1,200,000 | 3 | United States Treasury Bill, 0.18%, 2/10/2011
(IDENTIFIED COST $1,199,640) | 1,199,663 |
| | MUTUAL FUND – 1.7% | |
| 13,894,270 | 4,5 | Federated Prime Value Obligations Fund, Institutional Shares, 0.21%
(AT NET ASSET VALUE) | 13,894,270 |
| | REPURCHASE AGREEMENT – 6.4% | |
| $52,456,000 | | Interest in $5,635,000,000 joint repurchase agreement 0.25%, dated 11/30/2010 under which Bank of America, N.A. will repurchase securities provided as collateral for $5,635,039,132 on 12/1/2010. The securities provided as collateral at the end of the period were U.S. Government Agency securities with various maturities to 12/1/2038 and the market value of those underlying securities was $5,747,739,915 (purchased with proceeds from securities lending collateral). (AT COST) | 52,456,000 |
| | TOTAL INVESTMENTS — 106.8%
(IDENTIFIED COST $749,907,466)6 | 871,370,279 |
| | OTHER ASSETS AND LIABILITIES - NET — (6.8)%7 | (55,502,651) |
| | TOTAL NET ASSETS — 100% | $815,867,628 |
At November 30, 2010, the Fund had the following outstanding futures contract:
| Description | Number of
Contracts | Notional Value | Expiration Date | Unrealized
Appreciation |
| 2Dax Index Long Futures | 7 | $1,172,850 | December 2010 | $108,299 |
Annual Shareholder Report
16
At November 30, 2010, the Fund had the following outstanding foreign exchange contracts:| Settlement Date | Foreign Currency
Units to Deliver/Receive | In Exchange For | Unrealized
Appreciation/
(Depreciation) |
| Contracts Purchased: | | | |
| 12/1/2010 | 2,889,691,276 Indonesian Rupiah | $320,649 | $(781) |
| 2/22/2011 | 21,500,000 New Zealand Dollar | $16,602,300 | $(719,892) |
| 2/24/2011 | 126,210,440 Swedish Krona | $17,931,440 | $(33,972) |
| Contracts Sold: | | | |
| 2/7/2011 | 47,891,485,000 South Korean Won | $41,000,000 | $(172,184) |
| 2/24/2011 | 31,366,700 Euro | $41,049,287 | $348,063 |
| NET UNREALIZED DEPRECIATION ON FOREIGN EXCHANGE CONTRACTS | $(578,766) |
Net Unrealized Appreciation/Depreciation on Futures Contracts and Foreign Exchange Contracts is included in “Other Assets and Liabilities — Net.”
| 1 | All or a portion of these securities are temporarily on loan to unaffiliated broker/dealers. |
| 2 | Non-income producing security. |
| 3 | Pledged as collateral to ensure the Fund is able to satisfy the obligations of its outstanding futures contract. |
| 4 | Affiliated company. |
| 5 | 7-Day net yield. |
| 6 | The cost of investments for federal tax purposes amounts to $749,907,390. |
| 7 | Assets, other than investments in securities, less liabilities. See Statement of Assets and Liabilities. |
Note: The categories of investments are shown as a percentage of total net assets at November 30, 2010.
Various inputs are used in determining the value of the Fund's investments. These inputs are summarized in the three broad levels listed below:
Level 1 — quoted prices in active markets for identical securities
Level 2 — other significant observable inputs (including quoted prices for similar securities, interest rates, prepayment speeds, credit risk, etc.)
Level 3 — significant unobservable inputs (including the Fund's own assumptions in determining the fair value of investments)
The inputs or methodology used for valuing securities are not an indication of the risk associated with investing in those securities.
Annual Shareholder Report
17
The following is a summary of the inputs used, as of November 30, 2010, in valuing the Fund's assets carried at fair value:| Valuation Inputs | | | | |
| Level 1 —
Quoted
Prices and
Investments in
Mutual Funds | Level 2 —
Other
Significant
Observable
Inputs | Level 3 —
Significant
Unobservable
Inputs | Total |
| Equity Securities: | | | | |
| Common Stock | | | | |
| International | $803,772,762* | $47,584 | $ — | $803,820,346 |
| U.S. Treasury | — | 1,199,663 | — | 1,199,663 |
| Mutual Fund | 13,894,270 | — | — | 13,894,270 |
| Repurchase Agreement | — | 52,456,000 | — | 52,456,000 |
| TOTAL SECURITIES | $817,667,032 | $53,703,247 | $ — | $871,370,279 |
| OTHER FINANCIAL INSTRUMENTS** | $107,518 | $(577,985) | $ — | $(470,467) |
| * | Includes $210,013,600 of securities transferred from Level 2 to Level 1 because quoted prices on equity securities traded principally in foreign markets were utilized to value securities for which fair value factors were previously applied to account for significant post market close activity. |
| ** | Other financial instruments include futures contracts and foreign exchange contracts. |
Following is a reconciliation of assets in which significant unobservable inputs (Level 3) were used in determining fair value:
| Investments in
Equity Securities |
| Balance as of December 1, 2009 | $2,510,058 |
| Realized gain/loss | 62,114 |
| Change in unrealized appreciation/depreciation | (420,522) |
| Net purchases (sales) | (2,151,650) |
| Balance as of November 30, 2010 | $ — |
| The total change in unrealized appreciation (depreciation) attributable to investments still held at November 30, 2010. | $ — |
The following acronyms are used throughout this portfolio:
| ADR | — American Depositary Receipt |
| GDR | — Global Depository Receipt |
See Notes which are an integral part of the Financial Statements
Annual Shareholder Report18
Statement of Assets and Liabilities
November 30, 2010
| Assets: | | |
| Total investments in securities, at value including $50,319,850 of securities loaned and $13,894,270 of investments in an affiliated issuer (Note 5) (identified cost $749,907,466) | | $871,370,279 |
| Cash denominated in foreign currencies (identified cost $1,316,800) | | 1,305,448 |
| Income receivable | | 851,631 |
| Receivable for investments sold | | 1,533,061 |
| Receivable for shares sold | | 1,465,111 |
| Receivable for foreign exchange contracts | | 348,063 |
| Other assets | | 29,498 |
| TOTAL ASSETS | | 876,903,091 |
| Liabilities: | | |
| Payable for investments purchased | $5,933,018 | |
| Payable for shares redeemed | 1,203,613 | |
| Payable for foreign exchange contracts | 926,829 | |
| Payable for daily variation margin | 4,824 | |
| Payable for collateral due to broker for securities lending | 52,456,000 | |
| Payable for Directors'/Trustees' fees | 670 | |
| Payable for distribution services fee (Note 5) | 65,341 | |
| Payable for shareholder services fee (Note 5) | 157,645 | |
| Accrued expenses | 287,523 | |
| TOTAL LIABILITIES | | 61,035,463 |
| Net assets for 17,877,147 shares outstanding | | $815,867,628 |
| Net Assets Consist of: | | |
| Paid-in capital | | $1,083,948,555 |
| Net unrealized appreciation of investments, futures contracts and translation of assets and liabilities in foreign currency | | 120,998,110 |
| Accumulated net realized loss on investments, futures contracts and foreign currency transactions | | (394,089,542) |
| Undistributed net investment income | | 5,010,505 |
| TOTAL NET ASSETS | | $815,867,628 |
Annual Shareholder Report19
Statement of Assets and Liabilities — continued| Net Asset Value, Offering Price and Redemption Proceeds Per Share | | |
| Class A Shares: | | |
| Net asset value per share ($503,104,277 ÷ 11,014,688 shares outstanding), no par value, unlimited shares authorized | | $45.68 |
| Offering price per share (100/94.50 of $45.68) | | $48.34 |
| Redemption proceeds per share (98.00/100 of $45.68) | | $44.77 |
| Class B Shares: | | |
| Net asset value per share ($17,380,768 ÷ 382,436 shares outstanding), no par value, unlimited shares authorized | | $45.45 |
| Offering price per share | | $45.45 |
| Redemption proceeds per share (92.50/100 of $45.45) | | $42.04 |
| Class C Shares: | | |
| Net asset value per share ($64,511,660 ÷ 1,422,780 shares outstanding), no par value, unlimited shares authorized | | $45.34 |
| Offering price per share | | $45.34 |
| Redemption proceeds per share (97.00/100 of $45.34) | | $43.98 |
| Institutional Shares: | | |
| Net asset value per share ($197,681,831 ÷ 4,320,087 shares outstanding), no par value, unlimited shares authorized | | $45.76 |
| Offering price per share | | $45.76 |
| Redemption proceeds per share (98.00/100 of $45.76) | | $44.84 |
| Class K Shares: | | |
| Net asset value per share ($33,189,092 ÷ 737,156 shares outstanding), no par value, unlimited shares authorized | | $45.02 |
| Offering price per share | | $45.02 |
| Redemption proceeds per share (98.00/100 of $45.02) | | $44.12 |
See Notes which are an integral part of the Financial Statements
Annual Shareholder Report20
Statement of Operations
Year Ended November 30, 2010
| Investment Income: | | | |
| Dividends (including $11,602 received from an affiliated issuer (Note 5) and net of foreign taxes withheld of $2,538,856) | | | $16,218,778 |
| Interest (including income on securities loaned of $749,714) | | | 765,191 |
| TOTAL INCOME | | | 16,983,969 |
| Expenses: | | | |
| Investment adviser fee (Note 5) | | $7,517,525 | |
| Administrative personnel and services fee (Note 5) | | 587,052 | |
| Custodian fees | | 567,009 | |
| Transfer and dividend disbursing agent fees and expenses — Class A Shares | | 642,911 | |
| Transfer and dividend disbursing agent fees and expenses — Class B Shares | | 48,254 | |
| Transfer and dividend disbursing agent fees and expenses — Class C Shares | | 115,216 | |
| Transfer and dividend disbursing agent fees and expenses — Institutional Shares | | 115,011 | |
| Transfer and dividend disbursing agent fees and expenses — Class K Shares | | 60,119 | |
| Directors'/Trustees' fees | | 2,159 | |
| Auditing fees | | 24,548 | |
| Legal fees | | 7,849 | |
| Portfolio accounting fees | | 93,108 | |
| Distribution services fee — Class B Shares (Note 5) | | 140,845 | |
| Distribution services fee — Class C Shares (Note 5) | | 496,975 | |
| Distribution services fee — Class K Shares (Note 5) | | 99,836 | |
| Shareholder services fee — Class A Shares (Note 5) | | 1,185,547 | |
| Shareholder services fee — Class B Shares (Note 5) | | 46,948 | |
| Shareholder services fee — Class C Shares (Note 5) | | 165,531 | |
| Account administration fee — Class A Shares | | 11,050 | |
| Account administration fee — Class C Shares | | 127 | |
| Share registration costs | | 90,545 | |
| Printing and postage | | 93,922 | |
| Insurance premiums | | 5,536 | |
| Miscellaneous | | 9,126 | |
| TOTAL EXPENSES | | 12,126,749 | |
Annual Shareholder Report21
Statement of Operations — continued| Waivers, Reimbursements and Reduction: | | | |
| Waiver/reimbursement of investment adviser fee (Note 5) | $(673,061) | | |
| Waiver of administrative personnel and services fee (Note 5) | (14,968) | | |
| Waiver of distribution services fee — Class K Shares (Note 5) | (230) | | |
| Reimbursement of transfer and dividend disbursing agent fees and expenses — Class A Shares (Note 5) | (20,380) | | |
| Reimbursement of transfer and dividend disbursing agent fees and expenses — Class B Shares (Note 5) | (15,977) | | |
| Reimbursement of transfer and dividend disbursing agent fees and expenses — Class C Shares (Note 5) | (1,859) | | |
| Reimbursement of transfer and dividend disbursing agent fees and expenses — Institutional Shares (Note 5) | (25,306) | | |
| Fees paid indirectly from directed brokerage arrangements (Note 6) | (9,031) | | |
TOTAL WAIVERS, REIMBURSEMENTS
AND REDUCTION | | $(760,812) | |
| Net expenses | | | $11,365,937 |
| Net investment income | | | 5,618,032 |
| Realized and Unrealized Gain on Investments, Futures Contracts and Foreign Currency Transactions: | | | |
| Net realized gain on investments and foreign currency transactions | | | 51,353,038 |
| Net realized loss on futures contracts | | | (119,681) |
| Net change in unrealized appreciation of investments and translation of assets and liabilities in foreign currency | | | 3,220,876 |
| Net change in unrealized appreciation of futures contracts | | | 108,299 |
| Net realized and unrealized gain on investments, futures contracts and foreign currency transactions | | | 54,562,532 |
| Change in net assets resulting from operations | | | $60,180,564 |
See Notes which are an integral part of the Financial Statements
Annual Shareholder Report22
Statement of Changes in Net Assets
| Year Ended November 30 | 2010 | 2009 |
| Increase (Decrease) in Net Assets | | |
| Operations: | | |
| Net investment income | $5,618,032 | $6,371,894 |
| Net realized gain (loss) on investments, futures contracts and foreign currency transactions | 51,233,357 | (238,064,230) |
| Net change in unrealized appreciation/depreciation of investments, futures contracts and translation of assets and liabilities in foreign currency | 3,329,175 | 436,414,780 |
| CHANGE IN NET ASSETS RESULTING FROM OPERATIONS | 60,180,564 | 204,722,444 |
| Distributions to Shareholders: | | |
| Distributions from net investment income | | |
| Class A Shares | (10,589,846) | (21,080,579) |
| Class B Shares | (317,293) | (792,905) |
| Class C Shares | (1,079,965) | (2,864,185) |
| Institutional Shares | (3,320,073) | (5,632,429) |
| Class K Shares | (119,708) | (14,097) |
| CHANGE IN NET ASSETS RESULTING FROM DISTRIBUTIONS TO SHAREHOLDERS | (15,426,885) | (30,384,195) |
| Share Transactions: | | |
| Proceeds from sale of shares | 295,540,247 | 204,726,052 |
| Net asset value of shares issued to shareholders in payment of distributions declared | 11,800,228 | 22,454,486 |
| Cost of shares redeemed | (233,772,799) | (249,504,020) |
| CHANGE IN NET ASSETS RESULTING FROM SHARE TRANSACTIONS | 73,567,676 | (22,323,482) |
| Redemption Fees | 17,967 | 31,055 |
| Regulatory Settlement Proceeds: | | |
| Net increase from regulatory settlement (Note 11) | 209,151 | 325,322 |
| Change in net assets | 118,548,473 | 152,371,144 |
| Net Assets: | | |
| Beginning of period | 697,319,155 | 544,948,011 |
| End of period (including undistributed net investment income of $5,010,505 and $7,025,884, respectively) | $815,867,628 | $697,319,155 |
See Notes which are an integral part of the Financial Statements
Annual Shareholder Report23
Notes to Financial Statements
November 30, 2010
1. ORGANIZATION
Federated Equity Funds (the “Trust”) is registered under the Investment Company Act of 1940, as amended (the “Act”), as an open-end management investment company. The Trust consists of 12 portfolios. The financial statements included herein are only those of Federated InterContinental Fund (the “Fund”). The financial statements of the other portfolios are presented separately. The assets of each portfolio are segregated and a shareholder's interest is limited to the portfolio in which shares are held. Each portfolio pays its own expenses. The Fund offers five classes of shares: Class A Shares, Class B Shares, Class C Shares, Institutional Shares and Class K Shares. All shares of the Fund have equal rights with respect to voting, except on class-specific matters. The financial highlights of the Class A Shares, Class B Shares, Class C Shares and Class K Shares are presented separately. The investment objective of the Fund is to seek long-term capital appreciation.
2. SIGNIFICANT ACCOUNTING POLICIES
The following is a summary of significant accounting policies consistently followed by the Fund in the preparation of its financial statements. These policies are in conformity with U.S. generally accepted accounting principles (GAAP).
Investment Valuation
In calculating its net asset value (NAV), the Fund generally values investments as follows:
- Equity securities listed on an exchange or traded through a regulated market system are valued at their last reported sale price or official closing price in their principal exchange or market.
- Shares of other mutual funds are valued based upon their reported NAVs.
- Fixed-income securities acquired with remaining maturities greater than 60 days are fair valued using price evaluations provided by a pricing service approved by the Board of Trustees (the “Trustees”).
- Fixed-income securities acquired with remaining maturities of 60 days or less are valued at their cost (adjusted for the accretion of any discount or amortization of any premium).
- Derivative contracts listed on exchanges are valued at their reported settlement or closing price.
- Over-the-counter (OTC) derivative contracts are fair valued using price evaluations provided by a pricing service approved by the Trustees.
If the Fund cannot obtain a price or price evaluation from a pricing service for an investment, the Fund may attempt to value the investment based upon the mean of bid and asked quotations or fair value the investment based on price evaluations, from one or more dealers. If any price, quotation, price evaluation or other pricing source is not readily available when the NAV is calculated, the Fund uses the fair value of the investment determined in accordance with the procedures described below. There can be no assurance that the Fund could purchase or sell an investment at the price used to calculate the Fund's NAV.
Fair Valuation and Significant Events Procedures
The Trustees have authorized the use of pricing services to provide evaluations of the current fair value of certain investments for purposes of calculating the NAV. Factors considered by pricing services in evaluating an investment include the yields or prices of investments of comparable quality, coupon, maturity, call rights and other potential prepayments, terms and Annual Shareholder Report
24
type, reported transactions, indications as to values from dealers and general market conditions. Some pricing services provide a single price evaluation reflecting the bid-side of the market for an investment (a “bid” evaluation). Other pricing services offer both bid evaluations and price evaluations indicative of a price between the prices bid and asked for the investment (a “mid” evaluation). The Fund normally uses bid evaluations for U.S. Treasury and Agency securities, mortgage-backed securities and municipal securities. The Fund normally uses mid evaluations for other types of fixed-income securities and OTC derivative contracts. In the event that market quotations and price evaluations are not available for an investment, the fair value of the investment is determined in accordance with procedures adopted by the Trustees.The Trustees also have adopted procedures requiring an investment to be priced at its fair value whenever the Adviser determines that a significant event affecting the value of the investment has occurred between the time as of which the price of the investment would otherwise be determined and the time as of which the NAV is computed. An event is considered significant if there is both an affirmative expectation that the investment's value will change in response to the event and a reasonable basis for quantifying the resulting change in value. Examples of significant events that may occur after the close of the principal market on which a security is traded, or after the time of a price evaluation provided by a pricing service or a dealer, include:
- With respect to securities traded in foreign markets, significant trends in U.S. equity markets or in the trading of foreign securities index futures or options contracts;
- With respect to price evaluations of fixed-income securities determined before the close of regular trading on the NYSE, actions by the Federal Reserve Open Market Committee and other significant trends in U.S. fixed-income markets;
- Political or other developments affecting the economy or markets in which an issuer conducts its operations or its securities are traded; and
- Announcements concerning matters such as acquisitions, recapitalizations, litigation developments, a natural disaster affecting the issuer's operations or regulatory changes or market developments affecting the issuer's industry.
The Trustees have approved the use of a pricing service to determine the fair value of equity securities traded principally in foreign markets when the Adviser determines that there has been a significant trend in the U.S. equity markets or in index futures trading. For other significant events, the Fund may seek to obtain more current quotations or price evaluations from alternative pricing sources. If a reliable alternative pricing source is not available, the Fund will determine the fair value of the investment using another method approved by the Trustees.
Repurchase Agreements
It is the policy of the Fund to require the other party to a repurchase agreement to transfer to the Fund's custodian or sub-custodian eligible securities or cash with a market value (after transaction costs) at least equal to the repurchase price to be paid under the repurchase agreement. The eligible securities are transferred to accounts with the custodian or sub-custodian in which the Fund holds a “securities entitlement” and exercises “control” as those terms are defined in the Uniform Commercial Code. The Fund has established procedures for monitoring the market value of the transferred securities and requiring the transfer of additional eligible securities if necessary to equal at least the repurchase price. These procedures also allow the other party to require securities to be transferred from the account to the extent that their market value exceeds the repurchase price or in exchange for other eligible securities of equivalent market value.
Annual Shareholder Report
25
The insolvency of the other party or other failure to repurchase the securities may delay the disposition of the underlying securities or cause the Fund to receive less than the full repurchase price. Under the terms of the repurchase agreement, any amounts received by the Fund in excess of the repurchase price and related transaction costs must be remitted to the other party.The Fund may enter into repurchase agreements in which eligible securities are transferred into joint trading accounts maintained by the custodian or sub-custodian for investment companies and other clients advised by the Fund's Adviser and its affiliates. The Fund will participate on a pro rata basis with the other investment companies and clients in its share of the securities transferred under such repurchase agreements and in its share of proceeds from any repurchase or other disposition of such securities.
Investment Income, Gains and Losses, Expenses and Distributions
Investment transactions are accounted for on a trade-date basis. Realized gains and losses from investment transactions are recorded on an identified-cost basis. Interest income and expenses are accrued daily. Dividend income and distributions to shareholders are recorded on the ex-dividend date. Foreign dividends are recorded on the ex-dividend date or when the Fund is informed of the ex-dividend date. Distributions of net investment income are declared and paid annually. Non-cash dividends included in dividend income, if any, are recorded at fair value. Investment income, realized and unrealized gains and losses and certain fund-level expenses are allocated to each class based on relative average daily net assets, except that Class A Shares, Class B Shares, Class C Shares, Institutional Shares and Class K Shares may bear distribution services fees, shareholder services fees, account administration fees and certain transfer and dividend disbursing agent fees unique to those classes. Dividends are declared separately for each class. No class has preferential dividend rights; differences in per share dividend rates are generally due to differences in separate class expenses.
Premium and Discount Amortization
All premiums and discounts on fixed-income securities are amortized/accreted for financial statement purposes.
Federal Taxes
It is the Fund's policy to comply with the Subchapter M provision of the Internal Revenue Code (the “Code”) and to distribute to shareholders each year substantially all of its income. Accordingly, no provision for federal income tax is necessary. As of and during the year ended November 30, 2010, the Fund did not have a liability for any uncertain tax positions. The Fund recognizes interest and penalties, if any, related to tax liabilities as income tax expense in the Statement of Operations. As of November 30, 2010, tax years 2007 through 2010 remain subject to examination by the Fund's major tax jurisdictions, which include the United States of America and the Commonwealth of Massachusetts.
The Fund may be subject to taxes imposed by governments of countries in which it invests. Such taxes are generally based on either income or gains earned or repatriated. The Fund accrues and applies such taxes to net investment income, net realized gains and net unrealized gains as income and/or gains are earned.
Annual Shareholder Report
26
When-Issued and Delayed Delivery TransactionsThe Fund may engage in when-issued or delayed delivery transactions. The Fund records when-issued securities on the trade date and maintains security positions such that sufficient liquid assets will be available to make payment for the securities purchased. Securities purchased on a when-issued or delayed delivery basis are marked to market daily and begin earning interest on the settlement date. Losses may occur on these transactions due to changes in market conditions or the failure of counterparties to perform under the contract.
Foreign Exchange Contracts
The Fund may enter into foreign exchange contracts for the delayed delivery of securities or foreign currency exchange transactions. The Fund may enter into foreign exchange contracts to protect assets against adverse changes in foreign currency exchange rates or exchange control regulations. Purchased contracts are used to acquire exposure to foreign currencies, whereas, contracts to sell are used to hedge the Fund's securities against currency fluctuations. Risks may arise upon entering into these transactions from the potential inability of counterparties to meet the terms of their commitments and from unanticipated movements in security prices or foreign exchange rates. The foreign exchange contracts are adjusted by the daily exchange rate of the underlying currency and any gains or losses are recorded for financial statement purposes as unrealized until the settlement date.
Foreign exchange contracts outstanding at period end are listed after the Fund's Portfolio of Investments.
Foreign Currency Translation
The accounting records of the Fund are maintained in U.S. dollars. All assets and liabilities denominated in foreign currencies (FCs) are translated into U.S. dollars based on the rates of exchange of such currencies against U.S. dollars on the date of valuation. Purchases and sales of securities, income and expenses are translated at the rate of exchange quoted on the respective date that such transactions are recorded. The Fund does not isolate that portion of the results of operations resulting from changes in foreign exchange rates on investments from the fluctuations arising from changes in market prices of securities held. Such fluctuations are included with the net realized and unrealized gain or loss from investments.
Reported net realized foreign exchange gains or losses arise from sales of portfolio securities, sales and maturities of short-term securities, sales of FCs, currency gains or losses realized between the trade and settlement dates on securities transactions, the difference between the amounts of dividends, interest and foreign withholding taxes recorded on the Fund's books, and the U.S. dollar equivalent of the amounts actually received or paid. Net unrealized foreign exchange gains and losses arise from changes in the value of assets and liabilities other than investments in securities at fiscal year end, resulting from changes in the exchange rate.
Restricted Securities
The Fund may purchase securities which are considered restricted. Restricted securities are securities that either: (a) cannot be offered for public sale without first being registered, or being able to take advantage of an exemption from registration, under the Securities Act of 1933; or (b) are subject to contractual restrictions on public sales. In some cases, when a security cannot be offered for public sale without first being registered, the issuer of the restricted security has agreed to register such securities for resale, at the issuer's expense, either upon demand by the Fund or in connection with another registered offering of the securities. Many such restricted securities may be resold in the secondary market in Annual Shareholder Report
27
transactions exempt from registration. Restricted securities may be determined to be liquid under criteria established by the Trustees. The Fund will not incur any registration costs upon such resales. The Fund's restricted securities are valued at the price provided by dealers in the secondary market or, if no market prices are available, at the fair value as determined in accordance with procedures established by and under the general supervision of the Trustees.Securities Lending
The Fund participates in a securities lending program providing for the lending of equity securities to qualified brokers. The Fund normally receives cash collateral for securities loaned that is invested in an affiliated money market fund or in short-term securities including repurchase agreements. Collateral is maintained at a minimum level of 100% of the market value of investments loaned, plus interest, if applicable. Earnings on collateral are allocated between the securities lending agent, as a fee for its services under the program, and the Fund, according to agreed-upon rates.
As of November 30, 2010, securities subject to this type of arrangement and related collateral were as follows:
Market Value of
Securities Loaned | Market Value
of Collateral |
| $50,319,850 | $52,456,000 |
Additional Disclosure Related to Derivative Instruments
| Fair Value of Derivative Instruments |
| Asset | Liability |
| Statement of
Assets and
Liabilities
Location | Fair
Value | Statement of
Assets and
Liabilities
Location | Fair
Value |
| Derivatives not accounted for as hedging instruments under ASC Topic 815 | | | | |
| Equity contracts | | | Payable for daily variation margin | $108,299* |
| Foreign exchange contracts | Receivable for foreign exchange contracts | $348,063 | Payable for foreign exchange contracts | $926,829 |
| Total derivatives not accounted for as hedging instruments under ASC Topic 815 | | $348,063 | | $1,035,128 |
| * | Includes cumulative appreciation/depreciation of futures contracts as reported in the footnotes to the Portfolio of Investments. Only the current day's variation margin is reported within the Statement of Assets and Liabilities. |
Annual Shareholder Report28
The Effect of Derivative Instruments on the Statement of Operations for the Year Ended November 30, 2010
| Amount of Realized Gain or (Loss) on Derivatives Recognized in Income |
| Futures | Forward
Currency
Contracts | Total |
| Equity contracts | $(119,681) | $ — | $(119,681) |
| Foreign exchange contracts | — | (78,999) | $(78,999) |
| TOTAL | $(119,681) | $(78,999) | $(198,680) |
| Change in Unrealized Appreciation or (Depreciation) on Derivatives Recognized in Income |
| Futures | Forward
Currency
Contracts | Total |
| Equity contracts | $108,299 | $ — | $108,299 |
| Foreign exchange contracts | — | (4,084,309) | (4,084,309) |
| TOTAL | $108,299 | $(4,084,309) | $(3,976,010) |
Other
The preparation of financial statements in conformity with GAAP requires management to make estimates and assumptions that affect the amounts of assets, liabilities, expenses and revenues reported in the financial statements. Actual results could differ from those estimated.
3. SHARES OF BENEFICIAL INTEREST
The following tables summarize share activity:
| Year Ended November 30 | 2010 | 2009 |
| Class A Shares: | Shares | Amount | Shares | Amount |
| Shares sold | 3,522,078 | $151,185,690 | 3,820,782 | $139,658,423 |
| Shares issued to shareholders in payment of distributions declared | 224,368 | 9,674,750 | 580,687 | 18,506,501 |
| Shares redeemed | (3,521,711) | (150,663,309) | (5,719,151) | (184,148,240) |
NET CHANGE RESULTING
FROM CLASS A
SHARE TRANSACTIONS | 224,735 | $10,197,131 | (1,317,682) | $(25,983,316) |
| Year Ended November 30 | 2010 | 2009 |
| Class B Shares: | Shares | Amount | Shares | Amount |
| Shares sold | 55,656 | $2,414,919 | 78,149 | $2,806,300 |
| Shares issued to shareholders in payment of distributions declared | 6,410 | 277,062 | 21,519 | 687,748 |
| Shares redeemed | (163,273) | (6,944,956) | (169,805) | (5,678,959) |
NET CHANGE RESULTING
FROM CLASS B
SHARE TRANSACTIONS | (101,207) | $(4,252,975) | (70,137) | $(2,184,911) |
Annual Shareholder Report29
| Year Ended November 30 | 2010 | 2009 |
| Class C Shares: | Shares | Amount | Shares | Amount |
| Shares sold | 304,948 | $13,070,298 | 461,611 | $15,710,774 |
| Shares issued to shareholders in payment of distributions declared | 21,303 | 918,583 | 71,040 | 2,265,479 |
| Shares redeemed | (518,154) | (22,087,885) | (815,500) | (27,278,265) |
NET CHANGE RESULTING
FROM CLASS C
SHARE TRANSACTIONS | (191,903) | $(8,099,004) | (282,849) | $(9,302,012) |
| Year Ended November 30 | 2010 | 2009 |
| Institutional Shares: | Shares | Amount | Shares | Amount |
| Shares sold | 2,369,341 | $98,058,051 | 1,319,466 | $42,320,293 |
| Shares issued to shareholders in payment of distributions declared | 18,810 | 810,124 | 30,829 | 980,660 |
| Shares redeemed | (1,147,060) | (49,907,072) | (970,979) | (32,079,867) |
NET CHANGE RESULTING
FROM INSTITUTIONAL
SHARE TRANSACTIONS | 1,241,091 | $48,961,103 | 379,316 | $11,221,086 |
| Year Ended November 30 | 2010 | 2009 |
| Class K Shares: | Shares | Amount | Shares | Amount |
| Shares sold | 710,198 | $30,811,289 | 123,127 | $4,230,262 |
| Shares issued to shareholders in payment of distributions declared | 2,806 | 119,709 | 445 | 14,098 |
| Shares redeemed | (98,491) | (4,169,577) | (8,269) | (318,689) |
NET CHANGE RESULTING
FROM CLASS K
SHARE TRANSACTIONS | 614,513 | $26,761,421 | 115,303 | $3,925,671 |
NET CHANGE RESULTING
FROM TOTAL FUND
SHARE TRANSACTIONS | 1,787,229 | $73,567,676 | (1,176,049) | $(22,323,482) |
Redemption Fees
The Fund imposes a 2.00% redemption fee to shareholders of the Fund's Class A Shares, Class B Shares, Class C Shares, Institutional Shares and Class K Shares who redeem shares held for 30 days or less. Shares acquired by reinvestment of dividends or distributions of the Fund, or purchased pursuant to the Systematic Investment Program or withdrawn pursuant to the Systematic Withdrawal Program, will not be subject to the redemption fee. All redemption fees are recorded by the Fund as additions to paid-in capital. For the year ended November 30, 2010, the redemption fees for Class A Shares, Class B Shares, Class C Shares, Institutional Shares and Class K Shares amounted to $11,367, $439, $1,561, $4,106 and $494, respectively. For the year ended November 30, 2009, the redemption fees for Class A Shares, Class B Shares, Class C Shares, Institutional Shares and Class K Shares amounted to $20,856, $1,014, $3,486, $5,641 and $58, respectively.
Annual Shareholder Report
30
4. FEDERAL TAX INFORMATIONThe timing and character of income and capital gain distributions are determined in accordance with income tax regulations, which may differ from GAAP. These differences are due in part to differing treatments for foreign currency transactions, gains on investments in passive foreign investment companies, regulatory settlement proceeds and discount accretion/premium amortization on debt securities.
For the year ended November 30, 2010, permanent differences identified and reclassified among the components of net assets were as follows:
| Increase (Decrease) |
| Paid-In Capital | Undistributed
Net Investment
Income (Loss) | Accumulated
Net Realized
Gain (Loss) |
| $(209,151) | $7,793,474 | $(7,584,323) |
Net investment income (loss), net realized gains (losses) and net assets were not affected by this reclassification.
The tax character of distributions as reported on the Statement of Changes in Net Assets for the years ended November 30, 2010 and 2009, was as follows:
| 2010 | 2009 |
| Ordinary income | $15,426,885 | $30,384,195 |
As of November 30, 2010, the components of distributable earnings on a tax basis were as follows:
| Undistributed ordinary income | $5,010,505 |
| Net unrealized appreciation | $121,576,172 |
| Capital loss carryforwards | $(394,667,604) |
The difference between book-basis and tax-basis net unrealized appreciation/depreciation is attributable to differing treatments for discount accretion/premium amortization on debt securities.
At November 30, 2010, the cost of investments for federal tax purposes was $749,907,390. The net unrealized appreciation of investments for federal tax purposes excluding any unrealized appreciation/depreciation resulting from changes in foreign currency exchange rates, outstanding foreign currency commitments and futures contracts was $121,462,889. This consists of net unrealized appreciation from investments for those securities having an excess of value over cost of $137,403,597 and net unrealized depreciation from investments for those securities having an excess of cost over value of $15,940,708.
Annual Shareholder Report
31
At November 30, 2010, the Fund had a capital loss carryforward of $394,667,604 which will reduce the Fund's taxable income arising from future net realized gains on investments, if any, to the extent permitted by the Code and thus will reduce the amount of distributions to shareholders which would otherwise be necessary to relieve the Fund of any liability for federal income tax. Pursuant to the Code, such capital loss carryforward will expire as follows:| Expiration Year | Expiration Amount |
| 2016 | $144,184,959 |
| 2017 | $250,482,645 |
The Fund used capital loss carryforwards of $43,070,972 to offset taxable capital gains realized during the year ended November 30, 2010.
5. INVESTMENT ADVISER FEE AND OTHER TRANSACTIONS WITH AFFILIATES
Investment Adviser Fee
Federated Global Investment Management Corp. is the Fund's investment adviser (the “Adviser”). The advisory agreement between the Fund and the Adviser provides for an annual fee equal to 1.00% of the Fund's average daily net assets. Subject to the terms described in the Expense Limitation note, the Adviser may voluntarily choose to waive any portion of its fee. For the year ended November 30, 2010, the Adviser voluntarily waived $646,411 of its fee and an affiliate of the Adviser reimbursed $63,522 of transfer and dividend disbursing agent fees and expenses.
Administrative Fee
Federated Administrative Services (FAS), under the Administrative Services Agreement, provides the Fund with administrative personnel and services. The fee paid to FAS is based on the average aggregate daily net assets of certain Federated funds as specified below:
| Administrative Fee | Average Aggregate Daily Net Assets
of the Federated Funds |
| 0.150% | on the first $5 billion |
| 0.125% | on the next $5 billion |
| 0.100% | on the next $10 billion |
| 0.075% | on assets in excess of $20 billion |
The administrative fee received during any fiscal year shall be at least $150,000 per portfolio and $40,000 per each additional class of Shares. Subject to the terms described in the Expense Limitation note, FAS may voluntarily choose to waive any portion of its fee. For the year ended November 30, 2010, the net fee paid to FAS was 0.076% of average daily net assets of the Fund. FAS waived $14,968 of its fee.
Annual Shareholder Report
32
Distribution Services FeeThe Fund has adopted a Distribution Plan (the “Plan”) pursuant to Rule 12b-1 under the Act. Under the terms of the Plan, the Fund will compensate Federated Securities Corp. (FSC), the principal distributor, from the daily net assets of the Fund's Class A Shares, Class B Shares, Class C Shares and Class K Shares to finance activities intended to result in the sale of these shares. The Plan provides that the Fund may incur distribution expenses at the following percentages of average daily net assets annually, to compensate FSC:
| Share Class Name | Percentage of Average Daily
Net Assets of Class |
| Class A Shares | 0.05% |
| Class B Shares | 0.75% |
| Class C Shares | 0.75% |
| Class K Shares | 0.50% |
Subject to the terms described in the Expense Limitation note, FSC may voluntarily choose to waive any portion of its fee. For the year ended November 30, 2010, FSC voluntarily waived $230 of its fee. When FSC receives fees, it may pay some or all of them to financial intermediaries whose customers purchase shares. For the year ended November 30, 2010, FSC retained $60,944 of fees paid by the Fund. For the year ended November 30, 2010, the Fund's Class A Shares did not incur a distribution services fee; however, it may begin to incur this fee upon approval of the Trustees.
Sales Charges
Front-end sales charges and contingent deferred sales charges (CDSC) do not represent expenses of the Fund. They are deducted from the proceeds of sales of Fund shares prior to investment or from redemption proceeds prior to remittance, as applicable. For the year ended November 30, 2010, FSC retained $23,249 in sales charges from the sale of Class A Shares. FSC also retained $409 of CDSC relating to redemptions of Class C Shares.
Shareholder Services Fee
The Fund may pay fees (“Service Fees”) up to 0.25% of the average daily net assets of the Fund's Class A Shares, Class B Shares and Class C Shares to financial intermediaries or to Federated Shareholder Services Company (FSSC) for providing services to shareholders and maintaining shareholder accounts. Financial intermediaries may include a company affiliated with management of Federated Investors, Inc. A financial intermediary affiliated with management of Federated Investors, Inc. received $17,032 of Service Fees for the year ended November 30, 2010. Subject to the terms described in the Expense Limitation note, FSSC may voluntarily reimburse the Fund for Service Fees. For the year ended November 30, 2010, FSSC did not receive any fees paid by the Fund.
Expense Limitation
The Adviser and its affiliates (which may include FSC, FAS and FSSC) have voluntarily agreed to waive their fees and/or reimburse expenses so that the total annual fund operating expenses (as shown in the financial highlights) paid by the Fund's Class A Shares, Class B Shares, Class C Shares, Institutional Shares and Class K Shares (after the voluntary waivers and/or reimbursements) will not exceed 1.48%, 2.27%, 2.27%, 1.17% and 1.67% (the “Fee Limit”), respectively, through the later of (the “Termination Date”): (a) January 31, 2012; or Annual Shareholder Report
33
(b) the date of the Fund's next effective Prospectus. While the Adviser and its affiliates currently do not anticipate terminating or increasing these arrangements prior to the Termination Date, these arrangements may only be terminated or the Fee Limit increased prior to the Termination Date with the agreement of the Trustees.General
Certain Officers and Trustees of the Fund are Officers and Directors or Trustees of the above companies.
Transactions Involving Affiliated Holdings
Affiliated holdings are mutual funds which are managed by the Adviser or an affiliate of the Adviser. The Adviser has agreed to reimburse the Fund for certain investment adviser fees as a result of transactions in other affiliated mutual funds. For the year ended November 30, 2010, the Adviser reimbursed $26,650. Transactions involving the affiliated holdings during the year ended November 30, 2010, were as follows:
| Affiliate | Balance of
Shares Held
11/30/2009 | Purchases/
Additions | Sales/
Reductions | Balance of
Shares Held
11/30/2010 | Value | Dividend
Income |
| Federated Prime Value Obligations Fund, Institutional Shares | 35,499,520 | 206,724,156 | 228,329,406 | 13,894,270 | $13,894,270 | $11,602 |
6. EXPENSE REDUCTION
The Fund directs portfolio trades to a broker that in turn pays a portion of the Fund's operating expenses. For the year ended November 30, 2010, the Fund's expenses were reduced by $9,031 under these arrangements.
7. Investment TRANSACTIONS
Purchases and sales of investments, excluding long-term U.S. government securities and short-term obligations, for the year ended November 30, 2010, were as follows:
| Purchases | $596,620,902 |
| Sales | $523,817,547 |
8. CONCENTRATION OF RISK
The Fund invests in securities of non-U.S. issuers. Political or economic developments may have an effect on the liquidity and volatility of portfolio securities and currency holdings.
9. LINE OF CREDIT
The Fund participates in a $100,000,000 unsecured, uncommitted revolving line of credit (LOC) agreement with PNC Bank. The LOC was made available for extraordinary or emergency purposes, primarily for financing redemption payments. Borrowings are charged interest at a rate offered to the Fund by PNC Bank at the time of the borrowing. As of November 30, 2010, there were no outstanding loans. During the year ended November 30, 2010, the Fund did not utilize the LOC.
Annual Shareholder Report
34
10. INTERFUND LENDINGPursuant to an Exemptive Order issued by the Securities and Exchange Commission (SEC), the Fund, along with other funds advised by subsidiaries of Federated Investors, Inc., may participate in an interfund lending program. This program provides an alternative credit facility allowing the Fund to borrow from other participating affiliated funds. As of November 30, 2010, there were no outstanding loans. During the year ended November 30, 2010, the program was not utilized.
11. REGULATORY SETTLEMENT PROCEEDS
The Fund received $209,151 for the year ended November 30, 2010 and $325,322 for the year ended November 30, 2009 in settlement of administrative proceedings against other unaffiliated third parties involving findings by the SEC of market timing and/or late trading of mutual funds. The settlements are recorded as an increase to paid-in capital in the accompanying financial statements.
12. Legal Proceedings
Since February, 2004, Federated Investors, Inc. and related entities (collectively, “Federated”), have been named as defendants in several lawsuits that are now pending in the United States District Court for the Western District of Pennsylvania. These lawsuits have been consolidated into a single action alleging excessive advisory fees involving one of the Federated-sponsored mutual funds (“Federated Funds”). Federated and its counsel have been defending this litigation. Additional lawsuits based upon similar allegations may be filed in the future. The potential impact of these lawsuits, all of which seek monetary damages, attorneys' fees and expenses, and future potential similar suits is uncertain. Although we do not believe that these lawsuits will have a material adverse effect on the Federated Funds, there can be no assurance that these suits, ongoing adverse publicity and/or other developments resulting from the allegations in these matters will not result in increased redemptions, or reduced sales, of shares of the Federated Funds or other adverse consequences for the Federated Funds.
13. Subsequent events
Effective December 31, 2010, Class K Shares will be redesignated to Class R Shares.
Effective January 31, 2011 (the “Effective Date”), the Fund will no longer charge a redemption fee. Accordingly, no shares of the Fund redeemed after the Effective Date will be assessed a redemption fee regardless of when such shares were purchased.
Management has evaluated subsequent events through the date the financial statements were issued, and determined that no additional events have occurred that require disclosure.
14. FEDERAL TAX INFORMATION (UNAUDITED)
For the fiscal year ended November 30, 2010, 77.53% of total ordinary income distributions made by the Fund are qualifying dividends which may be subject to a maximum tax rate of 15%, as provided for by the Jobs and Growth Tax Relief Act of 2003. Complete information is reported in conjunction with the reporting of your distributions on Form 1099-DIV.
To the extent the Fund meets the requirements of Section 853 of the Internal Revenue Code of 1986, as amended, the Fund will pass through to its shareholders credits for foreign taxes paid.
For the fiscal year ended November 30, 2010, the Fund derived $17,826,891 of gross income from foreign sources and paid foreign taxes of $2,538,856.
Annual Shareholder Report35
Report of Independent Registered Public Accounting Firm
TO THE BOARD OF TRUSTEES OF THE FEDERATED EQUITY FUNDS AND SHAREHOLDERS OF Federated Intercontinental fund:
We have audited the accompanying statement of assets and liabilities, including the portfolio of investments, of the Federated InterContinental Fund (the “Fund”), a portfolio of Federated Equity Funds, as of November 30, 2010, and the related statement of operations for the year then ended, the statements of changes in net assets for each of the years in the two-year period then ended, and the financial highlights for each of the years or periods in the four-year period then ended. These financial statements and financial highlights are the responsibility of the Fund's management. Our responsibility is to express an opinion on these financial statements and financial highlights based on our audits. The financial highlights for the periods presented prior to January 1, 2007, were audited by other independent registered public accountants whose report thereon dated February 26, 2007, expressed an unqualified opinion on those statements.
We conducted our audits in accordance with the standards of the Public Company Accounting Oversight Board (United States). Those standards require that we plan and perform the audit to obtain reasonable assurance about whether the financial statements and financial highlights are free of material misstatement. An audit includes examining, on a test basis, evidence supporting the amounts and disclosures in the financial statements. Our procedures included confirmation of securities owned as of November 30, 2010 by correspondence with the custodian, transfer agent and brokers, or by other appropriate auditing procedures. An audit also includes assessing the accounting principles used and significant estimates made by management, as well as evaluating the overall financial statement presentation. We believe that our audits provide a reasonable basis for our opinion.
In our opinion, the financial statements and financial highlights referred to above present fairly, in all material respects, the financial position of the Federated InterContinental Fund as of November 30, 2010 and the results of its operations for the year then ended, the changes in its net assets for each of the years in the two-year period then ended, and the financial highlights for each of the years or periods in the four-year period then ended, in conformity with U.S. generally accepted accounting principles.
Boston, Massachusetts
January 25, 2011
Annual Shareholder Report36
Board of Trustees and Trust Officers
The Board of Trustees is responsible for managing the Trust's business affairs and for exercising all the Trust's powers except those reserved for the shareholders. The following tables give information about each Trustee and the senior officers of the Fund. Where required, the tables separately list Trustees who are “interested persons” of the Fund (i.e., “Interested” Trustees) and those who are not (i.e., “Independent” Trustees). Unless otherwise noted, the address of each person listed is Federated Investors Tower, 1001 Liberty Avenue, Pittsburgh, PA 15222. The address of all Independent Trustees listed is 4000 Ericsson Drive, Warrendale, PA 15086-7561; Attention: Mutual Fund Board. As of December 31, 2010, the Trust comprised thirteen portfolio(s), and the Federated Fund Family consisted of 43 investment companies (comprising 136 portfolios). Unless otherwise noted, each Officer is elected annually. Unless otherwise noted, each Trustee oversees all portfolios in the Federated Fund Family and serves for an indefinite term. The Fund's Statement of Additional Information includes additional information about Trust Trustees and is available, without charge and upon request, by calling 1-800-341-7400.
Interested Trustees Background
Name
Birth Date
Positions Held with Trust
Date Service Began | Principal Occupation(s) for Past Five Years,
Other Directorships Held and Previous Position(s) |
John F. Donahue*
Birth Date: July 28, 1924
Trustee
Began serving: April 1984 | Principal Occupations: Director or Trustee of the Federated Fund Family; Chairman and Director, Federated Investors, Inc.; Chairman of the Federated Fund Family's Executive Committee.
Previous Positions: Chairman of the Federated Fund Family; Trustee, Federated Investment Management Company; Chairman and Director, Federated Investment Counseling. |
J. Christopher Donahue*
Birth Date: April 11, 1949
PRESIDENT AND Trustee
Began serving: January 2000 | Principal Occupations: Principal Executive Officer and President of the Federated Fund Family; Director or Trustee of some of the Funds in the Federated Fund Family; President, Chief Executive Officer and Director, Federated Investors, Inc.; Chairman and Trustee, Federated Investment Management Company; Trustee, Federated Investment Counseling; Chairman and Director, Federated Global Investment Management Corp.; Chairman, Federated Equity Management Company of Pennsylvania and Passport Research, Ltd. (investment advisory subsidiary of Federated); Trustee, Federated Shareholder Services Company; Director, Federated Services Company.
Previous Positions: President, Federated Investment Counseling; President and Chief Executive Officer, Federated Investment Management Company, Federated Global Investment Management Corp. and Passport Research, Ltd. |
| * | Family relationships and reasons for “interested” status: John F. Donahue is the father of J. Christopher Donahue; both are “interested” due to their beneficial ownership of shares of Federated Investors, Inc. and the positions they hold with Federated and its subsidiaries. |
Annual Shareholder Report37
Interested Trustees Background
Name
Birth Date
Positions Held with Trust
Date Service Began | Principal Occupation(s) for Past Five Years,
Other Directorships Held and Previous Position(s) |
Nicholas P. Constantakis, CPA
Birth Date: September 3, 1939
Trustee
Began serving: February 1998 | Principal Occupation: Director or Trustee of the Federated Fund Family.
Other Directorship Held: Director and Chairman of the Audit Committee, Michael Baker Corporation (architecture, engineering and construction services).
Previous Position: Partner, Andersen Worldwide SC.
Qualifications: Public accounting and director experience. |
John F. Cunningham
Birth Date: March 5, 1943
Trustee
Began serving: January 1999 | Principal Occupation: Director or Trustee of the Federated Fund Family.
Other Directorships Held: Chairman, President and Chief Executive Officer, Cunningham & Co., Inc. (strategic business consulting); Trustee Associate, Boston College.
Previous Positions: Director, Redgate Communications and EMC Corporation (computer storage systems); Chairman of the Board and Chief Executive Officer, Computer Consoles, Inc.; President and Chief Operating Officer, Wang Laboratories; Director, First National Bank of Boston; Director, Apollo Computer, Inc.
Qualifications: Business management and director experience. |
Maureen Lally-Green
Birth Date: July 5, 1949
Trustee
Began serving: August 2009 | Principal Occupations: Director or Trustee of the Federated Fund Family; Director, Office of Church Relations, Diocese of Pittsburgh; Adjunct Professor of Law, Duquesne University School of Law.
Other Directorships Held: Director, Auberle; Trustee, St. Francis University; Director, Ireland Institute of Pittsburgh; Director, UPMC Mercy Hospital; Regent, St. Vincent Seminary; Director, Epilepsy Foundation of Western and Central Pennsylvania; Director, Saint Thomas More Society, Allegheny County; Director, Carlow University.
Previous Position: Pennsylvania Superior Court Judge.
Qualifications: Legal and director experience. |
Peter E. Madden
Birth Date: March 16, 1942
Trustee
Began serving: November 1991 | Principal Occupation: Director or Trustee, and Chairman of the Board of Directors or Trustees, of the Federated Fund Family.
Previous Positions: Representative, Commonwealth of Massachusetts General Court; President, Chief Operating Officer and Director, State Street Bank and Trust Company and State Street Corporation (retired); Director, VISA USA and VISA International; Chairman and Director, Massachusetts Bankers Association; Director, Depository Trust Corporation; Director, The Boston Stock Exchange.
Qualifications: Business management, mutual fund services and director experience. |
Annual Shareholder Report38
Name
Birth Date
Positions Held with Trust
Date Service Began | Principal Occupation(s) for Past Five Years,
Other Directorships Held and Previous Position(s) |
Charles F. Mansfield, Jr.
Birth Date: April 10, 1945
Trustee
Began serving: January 1999 | Principal Occupations: Director or Trustee and Chairman of the Audit Committee of the Federated Fund Family; Management Consultant.
Previous Positions: Chief Executive Officer, PBTC International Bank; Partner, Arthur Young & Company (now Ernst & Young LLP); Chief Financial Officer of Retail Banking Sector, Chase Manhattan Bank; Senior Vice President, HSBC Bank USA (formerly, Marine Midland Bank); Vice President, Citibank; Assistant Professor of Banking and Finance, Frank G. Zarb School of Business, Hofstra University; Executive Vice President, DVC Group, Inc. (marketing, communications and technology).
Qualifications: Banking, business management and director experience. |
R. James Nicholson
Birth Date: February 4, 1938
Trustee
Began serving: January 2008 | Principal Occupations: Director or Trustee of the Federated Fund Family; Senior Counsel, Brownstein Hyatt Farber Schrek, P.C.; Former Secretary of the U.S. Dept. of Veterans Affairs; Former U.S. Ambassador to the Holy See; Former Chairman of the Republican National Committee.
Other Directorships Held: Director, Horatio Alger Association; Director, The Daniels Fund.
Previous Positions: Colonel, U.S. Army Reserve; Partner, Calkins, Kramer, Grimshaw and Harring, P.C.; General Counsel, Colorado Association of Housing and Building; Chairman and CEO, Nicholson Enterprises, Inc. (real estate holding company); Chairman and CEO, Renaissance Homes of Colorado.
Qualifications: Legal, government, business management and director experience. |
Thomas M. O'Neill
Birth Date: June 14, 1951
Trustee
Began serving: October 2006 | Principal Occupations: Director or Trustee of the Federated Fund Family; Sole Proprietor, Navigator Management Company (investment and strategic consulting).
Other Directorships Held: Board of Overseers, Children's Hospital of Boston; Visiting Committee on Athletics, Harvard College.
Previous Positions: Chief Executive Officer and President, Managing Director and Chief Investment Officer, Fleet Investment Advisors; President and Chief Executive Officer, Aeltus Investment Management, Inc.; General Partner, Hellman, Jordan Management Co., Boston, MA; Chief Investment Officer, The Putnam Companies, Boston, MA; Credit Analyst and Lending Officer, Fleet Bank; Director and Consultant, EZE Castle Software (investment order management software); Director, Midway Pacific (lumber).
Qualifications: Business management, mutual fund, director and investment experience. |
Annual Shareholder Report39
Name
Birth Date
Positions Held with Trust
Date Service Began | Principal Occupation(s) for Past Five Years,
Other Directorships Held and Previous Position(s) |
John S. Walsh
Birth Date: November 28, 1957
Trustee
Began serving: January 1999 | Principal Occupations: Director or Trustee of the Federated Fund Family; President and Director, Heat Wagon, Inc. (manufacturer of construction temporary heaters); President and Director, Manufacturers Products, Inc. (distributor of portable construction heaters); President, Portable Heater Parts, a division of Manufacturers Products, Inc.
Previous Position: Vice President, Walsh & Kelly, Inc.
Qualifications: Business management and director experience. |
James F. Will
Birth Date: October 12, 1938
Trustee
Began serving: April 2006 | Principal Occupations: Director or Trustee of the Federated Fund Family; formerly, Vice Chancellor and President, Saint Vincent College.
Other Directorships Held: Trustee, Saint Vincent College; Director, Alleghany Corporation; Trustee, Wheeling Jesuit University; Director, Liberty Tire Recycling.
Previous Positions: Chairman, President and Chief Executive Officer, Armco, Inc.; President and Chief Executive Officer, Cyclops Industries; President and Chief Operating Officer, Kaiser Steel Corporation.
Qualifications: Business management, education and director experience. |
OFFICERS
Name
Birth Date
Address
Positions Held with Trust
Date Service Began | Principal Occupation(s) for Past Five Years
and Previous Position(s) |
John W. McGonigle
Birth Date: October 26, 1938
EXECUTIVE VICE PRESIDENT AND SECRETARY
Began serving: April 1984 | Principal Occupations: Executive Vice President and Secretary of the Federated Fund Family; Vice Chairman, Executive Vice President, Secretary and Director, Federated Investors, Inc.
Previous Positions: Trustee, Federated Investment Management Company and Federated Investment Counseling; Director, Federated Global Investment Management Corp., Federated Services Company and Federated Securities Corp. |
Richard A. Novak
Birth Date: December 25, 1963
TREASURER
Began serving: January 2006 | Principal Occupations: Principal Financial Officer and Treasurer of the Federated Fund Family; Senior Vice President, Federated Administrative Services; Financial and Operations Principal for Federated Securities Corp., Edgewood Services, Inc. and Southpointe Distribution Services, Inc.
Previous Positions: Controller of Federated Investors, Inc.; Vice President, Finance of Federated Services Company; held various financial management positions within The Mercy Hospital of Pittsburgh; Auditor, Arthur Andersen & Co. |
Annual Shareholder Report40
Name
Birth Date
Address
Positions Held with Trust
Date Service Began | Principal Occupation(s) for Past Five Years
and Previous Position(s) |
Richard B. Fisher
Birth Date: May 17, 1923
VICE PRESIDENT
Began serving: April 1984 | Principal Occupations: Vice Chairman or Vice President of some of the Funds in the Federated Fund Family; Vice Chairman, Federated Investors, Inc.; Chairman, Federated Securities Corp.
Previous Positions: President and Director or Trustee of some of the Funds in the Federated Fund Family; Executive Vice President, Federated Investors, Inc.; Director and Chief Executive Officer, Federated Securities Corp. |
Brian P. Bouda
Birth Date: February 28, 1947
CHIEF COMPLIANCE OFFICER AND SENIOR VICE PRESIDENT
Began serving: August 2004 | Principal Occupations: Senior Vice President and Chief Compliance Officer of the Federated Fund Family; Vice President and Chief Compliance Officer of Federated Investors, Inc. and Chief Compliance Officer of its subsidiaries. Mr. Bouda joined Federated in 1999 and is a member of the American Bar Association and the State Bar Association of Wisconsin. |
Stephen F. Auth
Birth Date: September 3, 1956
450 Lexington Avenue
Suite 3700
New York, NY 10017-3943
CHIEF INVESTMENT OFFICER
Began serving: November 2002 | Principal Occupations: Mr. Auth is Chief Investment Officer of this Fund and various other Funds in the Federated Fund Family; Executive Vice President, Federated Investment Counseling, Federated Global Investment Management Corp. and Federated Equity Management Company of Pennsylvania.
Previous Positions: Executive Vice President, Federated Investment Management Company, and Passport Research, Ltd. (investment advisory subsidiary of Federated); Senior Vice President, Global Portfolio Management Services Division; Senior Vice President, Federated Investment Management Company and Passport Research, Ltd.; Senior Managing Director and Portfolio Manager, Prudential Investments. |
Lawrence Auriana
Birth Date: January 8, 1944
140 East 45th Street
New York, NY 10017
VICE PRESIDENT
Began serving: November 2001 | Principal Occupations: Lawrence Auriana is Vice President of the Trust. Mr. Auriana joined Federated in April 2001 as Co-Head of Investments/Federated Kaufmann. From August 1984 to April 2001, Mr. Auriana was President and Treasurer of Edgemont Asset Management Corp., and Chairman of the Board and Portfolio Manager to The Kaufmann Fund, Inc. (predecessor to the Federated Kaufmann Fund). Mr. Auriana earned a B.S. in economics from Fordham University and has been engaged in the securities business since 1965. |
Walter C. Bean
Birth Date: June 22, 1945
VICE PRESIDENT
Began serving: November 2006 | Principal Occupations: Walter C. Bean is Vice President of the Trust. Mr. Bean is a Senior Vice President, Senior Portfolio Manager and the Head of the Equity Income Management Team of the Fund's Adviser. Mr. Bean joined Federated in 2000. His previous associations included: various investment management and research positions with C.S. McKee & Company; First Chicago Investment Advisors; CIGNA Investment Advisors; and Mellon Bank. Mr. Bean earned a Bachelors Degree in Business Administration from Ohio University and an M.B.A. from the Pennsylvania State University. Mr. Bean has received the Chartered Financial Analyst designation and has 40 years of investment experience. |
Annual Shareholder Report41
Name
Birth Date
Address
Positions Held with Trust
Date Service Began | Principal Occupation(s) for Past Five Years
and Previous Position(s) |
Hans P. Utsch
Birth Date: July 3, 1936
140 East 45th Street
New York, NY 10017
VICE PRESIDENT
Began serving: November 2001 | Principal Occupations: Hans P. Utsch is Vice President of the Trust. Mr. Utsch joined Federated in April 2001 as Co-Head of Investments/Federated Kaufmann. From August 1984 to April 2001, Mr. Utsch was Chairman of the Board and Secretary of Edgemont Asset Management Corp., and President and Portfolio Manager to The Kaufmann Fund, Inc. (predecessor to the Federated Kaufmann Fund). Mr. Utsch graduated from Amherst College and holds an M.B.A. from Columbia University. He has been engaged in the securities business since 1962. |
Annual Shareholder Report42
Evaluation and Approval of Advisory Contract – May 2010
Federated InterContinental Fund (the “Fund”)
The Fund's Board reviewed the Fund's investment advisory contract at meetings held in May 2010. The Board's decision regarding the contract reflects the exercise of its business judgment on whether to continue the existing arrangements.
In this connection, the Federated funds' Board had previously appointed a Senior Officer, whose duties include specified responsibilities relating to the process by which advisory fees are to be charged to a Federated fund. The Senior Officer has the authority to retain consultants, experts, or staff as may be reasonably necessary to assist in the performance of his duties, reports directly to the Board, and may be terminated only with the approval of a majority of the independent members of the Board. The Senior Officer prepared and furnished to the Board an independent, written evaluation that covered topics discussed below. The Board considered that evaluation, along with other information, in deciding to approve the advisory contract.
During its review of the contract, the Board considered compensation and benefits received by the Adviser. This included the fees received for services provided to the Fund by other entities in the Federated organization and research services (if any) received by the Adviser from brokers that execute Federated fund trades, as well as advisory fees. The Board is also familiar with and considered judicial decisions concerning allegedly excessive investment advisory fees, which have indicated that the following factors may be relevant to an Adviser's fiduciary duty with respect to its receipt of compensation from a fund: the nature and quality of the services provided by the Adviser, including the performance of the fund; the Adviser's cost of providing the services; the extent to which the Adviser may realize “economies of scale” as a fund grows larger; any indirect benefits that may accrue to the Adviser and its affiliates as a result of the Adviser's relationship with a fund; performance and expenses of comparable funds; and the extent to which the independent Board members are fully informed about all facts the Board deems relevant bearing on the Adviser's services and fees. The Board further considered management fees (including any components thereof) charged to institutional and other clients of the Adviser for what might be viewed as like services, and the cost to the Adviser and its affiliates of supplying services pursuant to the management fee agreements, excluding any intra-corporate profit and profit margins of the Adviser and its affiliates for supplying such services. The Board was aware of these factors and was guided by them in its review of the Fund's advisory contract to the extent it considered them to be appropriate and relevant, as discussed further below.
Annual Shareholder Report
43
The Board considered and weighed these circumstances in light of its substantial accumulated experience in governing the Fund and working with Federated on matters relating to the Federated funds, and was assisted in its deliberations by independent legal counsel. Throughout the year, the Board has requested and received substantial and detailed information about the Fund and the Federated organization that was in addition to the extensive materials that comprise and accompany the Senior Officer's evaluation. Federated provided much of this information at each regular meeting of the Board, and furnished additional reports in connection with the particular meeting at which the Board's formal review of the advisory contract occurred. Between regularly scheduled meetings, the Board also received information on particular matters as the need arose. Thus, the Board's consideration of the advisory contract included review of the Senior Officer's evaluation, accompanying data and additional reports covering such matters as: the Adviser's investment philosophy, revenue, profitability, personnel and processes; investment and operating strategies; the Fund's short- and long-term performance (in absolute terms, both on a gross basis and net of expenses, as well as in relationship to its particular investment program and certain competitor or “peer group” funds and/or other benchmarks, as appropriate), and comments on the reasons for performance; the Fund's investment objectives; the Fund's expenses (including the advisory fee itself and the overall expense structure of the Fund, both in absolute terms and relative to similar and/or competing funds, with due regard for contractual or voluntary expense limitations); the use and allocation of brokerage commissions derived from trading the Fund's portfolio securities (if any); and the nature, quality and extent of the advisory and other services provided to the Fund by the Adviser and its affiliates. The Board also considered the preferences and expectations of Fund shareholders and their relative sophistication; the continuing state of competition in the mutual fund industry and market practices; the range of comparable fees for similar funds in the mutual fund industry; the Fund's relationship to the Federated family of funds which include a comprehensive array of funds with different investment objectives, policies and strategies which are available for exchange without the incurrence of additional sales charges; compliance and audit reports concerning the Federated funds and the Federated companies that service them (including communications from regulatory agencies), as well as Federated's responses to any issues raised therein; and relevant developments in the mutual fund industry and how the Federated funds and/or Federated are responding to them. The Board's evaluation process is evolutionary. The criteria considered and the emphasis placed on relevant criteria change in recognition of changing circumstances in the mutual fund marketplace.With respect to the Fund's performance and expenses in particular, the Board has found the use of comparisons to other mutual funds with comparable investment programs to be relevant, given the high degree of competition in the mutual fund business. The Board focused on comparisons with other similar Annual Shareholder Report
44
mutual funds more heavily than non-mutual fund products or services because it is believed that they are more relevant. For example, other mutual funds are the products most like the Fund, they are readily available to Fund shareholders as alternative investment vehicles, and they are the type of investment vehicle in fact chosen and maintained by the Fund's investors. The range of their fees and expenses therefore appears to be a generally reliable indication of what consumers have found to be reasonable in the precise marketplace in which the Fund competes. The Fund's ability to deliver competitive performance when compared to its peer group was a useful indicator of how the Adviser is executing the Fund's investment program, which in turn assisted the Board in reaching a conclusion that the nature, extent, and quality of the Adviser's investment management services were such as to warrant continuation of the advisory contract. In this regard, the Senior Officer has reviewed Federated's fees for providing advisory services to products outside the Federated family of funds (e.g., institutional and separate accounts). He concluded that mutual funds and institutional accounts are inherently different products. Those differences include, but are not limited to, different types of targeted investors; being subject to different laws and regulations; different legal structures; different average account sizes; different associated costs; different portfolio management techniques made necessary by different cash flows; and portfolio manager time spent in review of securities pricing. The Senior Officer did not consider these fee schedules to be determinative in judging the appropriateness of mutual fund advisory contracts.The Senior Officer reviewed reports compiled by Federated, using data supplied by independent fund ranking organizations, regarding the performance of, and fees charged by, other mutual funds, noting his view that comparisons to fund peer groups are relevant in judging the reasonableness of proposed fees.
For the one-year, three-year and five-year periods covered by the report, the Fund's performance was above the median of the relevant peer group.
The Board also received financial information about Federated, including reports on the compensation and benefits Federated derived from its relationships with the Federated funds. These reports covered not only the fees under the advisory contracts, but also fees received by Federated's subsidiaries for providing other services to the Federated funds under separate contracts (e.g., for serving as the Federated funds' administrator). The reports also discussed any indirect benefit Federated may derive from its receipt of research services from brokers who execute Federated fund trades. In addition, the Board considered the fact that, in order for a fund to be competitive in the marketplace, Federated and its affiliates frequently waived fees and/or reimbursed expenses and have disclosed to fund investors and/or indicated to the Board their intention to do so in the future, where appropriate. Moreover, the Board receives regular reports regarding the institution or elimination of these voluntary waivers.
Annual Shareholder Report
45
Federated furnished reports, requested by the Senior Officer, that reported revenues on a fund-by-fund basis and made estimates of the allocation of expenses on a fund-by-fund basis, using allocation methodologies specified by the Senior Officer. The Senior Officer noted that, although they may apply consistent allocation processes, the inherent difficulties in allocating costs (and the unavoidable arbitrary aspects of that exercise) and the lack of consensus on how to allocate those costs may render such allocation reports unreliable. The allocation reports were considered in the analysis by the Board but were determined to be of limited use.The Board and the Senior Officer also reviewed a report compiled by Federated comparing profitability information for Federated to other publicly held fund management companies. In this regard, the Senior Officer noted the limited availability of such information, but nonetheless concluded that Federated's profit margins did not appear to be excessive and the Board agreed.
The Senior Officer's evaluation also discussed the notion of possible realization of “economies of scale” as a fund grows larger. The Board considered in this regard that the Adviser has made significant and long-term investments in areas that support all of the Federated funds, such as personnel and processes for the portfolio management, compliance, and risk management functions; and systems technology; and that the benefits of these efforts (as well as any economies, should they exist) were likely to be enjoyed by the fund complex as a whole. Finally, the Board also noted the absence of any applicable regulatory or industry guidelines on this subject, which (as discussed in the Senior Officer's evaluation) is compounded by the lack of any common industry practice or general pattern with respect to structuring fund advisory fees with “breakpoints” that serve to reduce the fee as the fund attains a certain size. The Senior Officer did not recommend institution of breakpoints in pricing Federated's fund advisory services at this time.
It was noted in the materials for the Board meeting that for the period covered by the report, the Fund's investment advisory fee, after waivers and expense reimbursements, if any, was above the median of the relevant peer group. The Board reviewed the fees and other expenses of the Fund with the Adviser and was satisfied that the overall expense structure of the Fund remained competitive. The Board will continue to monitor advisory fees and other expenses borne by the Fund.
The Senior Officer's evaluation noted his belief that the information and observations contained in his evaluation supported a finding that the proposed management fees are reasonable, and that Federated appeared to provide appropriate administrative services to the Fund for the fees paid. Under these circumstances, no changes were recommended to, and no objection was raised to, the continuation of the Fund's advisory contract. The Board concluded that the nature, quality and scope of services provided the Fund by the Adviser and its affiliates were satisfactory.
Annual Shareholder Report
46
In its decision to continue an existing investment advisory contract, the Board was mindful of the potential disruptions of the Fund's operations and various risks, uncertainties and other effects that could occur as a result of a decision to terminate or not renew an advisory contract. In particular, the Board recognized that many shareholders have invested in the Fund on the strength of the Adviser's industry standing and reputation and with the expectation that the Adviser will have a continuing role in providing advisory services to the Fund. Thus, the Board's approval of the advisory contract reflected the fact that it is the shareholders who have effectively selected the Adviser by virtue of having invested in the Fund.The Board based its decision to approve the advisory contract on the totality of the circumstances and relevant factors and with a view to past and future long-term considerations. Not all of the factors and considerations identified above were necessarily relevant to the Fund, nor did the Board consider any one of them to be determinative. With respect to the factors that were relevant, the Board's decision to approve the contract reflects its determination that Federated's performance and actions provided a satisfactory basis to support the decision to continue the existing arrangements.
Annual Shareholder Report47
Voting Proxies on Fund Portfolio Securities
A description of the policies and procedures that the Fund uses to determine how to vote proxies, if any, relating to securities held in the Fund's portfolio is available, without charge and upon request, by calling 1-800-341-7400. A report on “Form N-PX” of how the Fund voted any such proxies during the most recent 12-month period ended June 30 is available from Federated's website at FederatedInvestors.com. To access this information from the “Products” section of the website, click on the “Prospectuses and Regulatory Reports” link under “Related Information,” then select the appropriate link opposite the name of the Fund; or select the name of the Fund and from the Fund's page, click on the “Prospectuses and Regulatory Reports” link. Form N-PX filings are also available at the SEC's website at www.sec.gov.
Quarterly Portfolio Schedule
The Fund files with the SEC a complete schedule of its portfolio holdings, as of the close of the first and third quarters of its fiscal year, on “Form N-Q.” These filings are available on the SEC's website at www.sec.gov and may be reviewed and copied at the SEC's Public Reference Room in Washington, DC. (Call 1-800-SEC-0330 for information on the operation of the Public Reference Room.) You may also access this information from the “Products” section of Federated's website at FederatedInvestors.com by clicking on “Portfolio Holdings” under “Related Information,” then selecting the appropriate link opposite the name of the Fund; or select the name of the Fund and from the Fund's page, click on the “Portfolio Holdings” link.
Annual Shareholder Report48
Mutual funds are not bank deposits or obligations, are not guaranteed by any bank and are not insured or guaranteed by the U.S. government, the Federal Deposit Insurance Corporation, the Federal Reserve Board or any other government agency. Investment in mutual funds involves investment risk, including the possible loss of principal.
This Report is authorized for distribution to prospective investors only when preceded or accompanied by the Fund's Prospectus, which contains facts concerning its objective and policies, management fees, expenses and other information.
Federated InterContinental Fund
Federated Investors Funds
4000 Ericsson Drive
Warrendale, PA 15086-7561
Contact us at FederatedInvestors.com
or call 1-800-341-7400.
Federated Securities Corp., Distributor
Cusip 314172461
37869 (1/11)
Federated is a registered mark of Federated Investors, Inc.
2011 ©Federated Investors, Inc.
Federated International Strategic Value Dividend FundEstablished 2008
(formerly, Federated International Strategic Value Fund)
A Portfolio of Federated Equity Funds
ANNUAL SHAREHOLDER REPORTNovember 30, 2010
Class A Shares
Class C Shares
FINANCIAL HIGHLIGHTS
SHAREHOLDER EXPENSE EXAMPLE
MANAGEMENT'S DISCUSSION OF FUND PERFORMANCE
PORTFOLIO OF INVESTMENTS SUMMARY TABLES
PORTFOLIO OF INVESTMENTS
STATEMENT OF ASSETS AND LIABILITIES
STATEMENT OF OPERATIONS
STATEMENT OF CHANGES IN NET ASSETS
NOTES TO FINANCIAL STATEMENTS
REPORT OF INDEPENDENT REGISTERED PUBLIC ACCOUNTING FIRM
BOARD OF TRUSTEES AND TRUST OFFICERS
EVALUATION AND APPROVAL OF ADVISORY CONTRACT
VOTING PROXIES ON FUND PORTFOLIO SECURITIES
QUARTERLY PORTFOLIO SCHEDULE
Financial Highlights – Class A Shares
(For a Share Outstanding Throughout Each Period)
| Year Ended November 30, | Period
Ended
11/30/20081 |
| 2010 | 2009 |
| Net Asset Value, Beginning of Period | $3.64 | $3.05 | $5.00 |
| Income From Investment Operations: | | | |
| Net investment income | 0.172 | 0.082 | 0.072 |
| Net realized and unrealized gain (loss) on investments and foreign currency transactions | (0.20) | 0.68 | (2.00) |
| TOTAL FROM INVESTMENT OPERATIONS | (0.03) | 0.76 | (1.93) |
| Less Distributions: | | | |
| Distributions from net investment income | (0.14) | (0.17) | (0.02) |
| Redemption Fees | 0.003 | 0.003 | — |
| Net Asset Value, End of Period | $3.47 | $3.64 | $3.05 |
| Total Return4 | (0.68)% | 25.86% | (38.78)% |
| Ratios to Average Net Assets: | | | |
| Net expenses | 1.00%5 | 0.99% | 0.46%6 |
| Net investment income | 4.90% | 2.38% | 3.96%6 |
| Expense waiver/reimbursement7 | 2.56% | 9.84% | 52.69%6 |
| Supplemental Data: | | | |
| Net assets, end of period (000 omitted) | $19,060 | $1,083 | $11 |
| Portfolio turnover | 23% | 31% | 22% |
| 1 | Reflects operations for the period from June 4, 2008 (date of initial investment) to November 30, 2008. |
| 2 | Per share numbers have been calculated using the average shares method. |
| 3 | Represents less than $0.01. |
| 4 | Based on net asset value, which does not reflect the sales charge, redemption fee or contingent deferred sales charge, if applicable. Total returns for periods of less than one year are not annualized. |
| 5 | The net expense ratio is calculated without reduction for expense offset arrangements. The net expense ratio is 1.00% for the period ended November 30, 2010 after taking into account this expense reduction. |
| 6 | Computed on an annualized basis. |
| 7 | This expense decrease is reflected in both the net expense and the net investment income ratios shown above. |
See Notes which are an integral part of the Financial Statements
Annual Shareholder Report1
Financial Highlights – Class C Shares
(For a Share Outstanding Throughout Each Period)
| Year Ended November 30, | Period
Ended
11/30/20081 |
| 2010 | 2009 |
| Net Asset Value, Beginning of Period | $3.63 | $3.05 | $5.00 |
| Income From Investment Operations: | | | |
| Net investment income | 0.132 | 0.092 | 0.072 |
| Net realized and unrealized gain (loss) on investments and foreign currency transactions | (0.19) | 0.63 | (2.00) |
| TOTAL FROM INVESTMENT OPERATIONS | (0.06) | 0.72 | (1.93) |
| Less Distributions: | | | |
| Distributions from net investment income | (0.11) | (0.14) | (0.02) |
| Redemption Fees | 0.003 | 0.003 | — |
| Net Asset Value, End of Period | $3.46 | $3.63 | $3.05 |
| Total Return4 | (1.43)% | 24.33% | (38.77)% |
| Ratios to Average Net Assets: | | | |
| Net expenses | 1.74%5 | 1.75% | 1.23%6 |
| Net investment income | 3.72% | 2.82% | 3.29%6 |
| Expense waiver/reimbursement7 | 3.01% | 10.38% | 52.36%6 |
| Supplemental Data: | | | |
| Net assets, end of period (000 omitted) | $3,022 | $1,241 | $08 |
| Portfolio turnover | 23% | 31% | 22% |
| 1 | Reflects operations for the period from June 4, 2008 (date of initial investment) to November 30, 2008. |
| 2 | Per share numbers have been calculated using the average shares method. |
| 3 | Represents less than $0.01. |
| 4 | Based on net asset value, which does not reflect the sales charge, redemption fee or contingent deferred sales charge, if applicable. Total returns for periods of less than one year are not annualized. |
| 5 | The net expense ratio is calculated without reduction for expense offset arrangements. The net expense ratio is 1.74% for the period ended November 30, 2010 after taking into account this expense reduction. |
| 6 | Computed on an annualized basis. |
| 7 | This expense decrease is reflected in both the net expense and the net investment income ratios shown above. |
| 8 | Represents less than $1,000. |
See Notes which are an integral part of the Financial Statements
Annual Shareholder Report2
Shareholder Expense Example (unaudited)
As a shareholder of the Fund, you incur two types of costs: (1) transaction costs, including sales charges (loads) on purchase or redemption payments and redemption/exchange fees; and (2) ongoing costs, including management fees and to the extent applicable, distribution (12b-1) fees and/or shareholder services fees and other Fund expenses. This Example is intended to help you to understand your ongoing costs (in dollars) of investing in the Fund and to compare these costs with the ongoing costs of investing in other mutual funds. It is based on an investment of $1,000 invested at the beginning of the period and held for the entire period from June 1, 2010 to November 30, 2010.
ACTUAL EXPENSES
The first section of the table below provides information about actual account values and actual expenses. You may use the information in this section, together with the amount you invested, to estimate the expenses that you incurred over the period. Simply divide your account value by $1,000 (for example, an $8,600 account value divided by $1,000 = 8.6), then multiply the result by the number in the first section under the heading entitled “Expenses Paid During Period” to estimate the expenses attributable to your investment during this period.
HYPOTHETICAL EXAMPLE FOR COMPARISON PURPOSES
The second section of the table below provides information about hypothetical account values and hypothetical expenses based on the Fund's actual expense ratio and an assumed rate of return of 5% per year before expenses, which is not the Fund's actual return. Thus, you should not use the hypothetical account values and expenses to estimate the actual ending account balance or your expenses for the period. Rather, these figures are required to be provided to enable you to compare the ongoing costs of investing in the Fund with other funds. To do so, compare this 5% hypothetical example with the 5% hypothetical examples that appear in the shareholder reports of the other funds.
Annual Shareholder Report
3
Please note that the expenses shown in the table are meant to highlight your ongoing costs only and do not reflect any transaction costs, such as sales charges (loads) on purchase or redemption payments, or redemption/exchange fees. Therefore, the second section of the table is useful in comparing ongoing costs only, and will not help you determine the relative total costs of owning different funds. In addition, if these transaction costs were included, your costs would have been higher. | Beginning
Account Value
6/1/2010 | Ending
Account Value
11/30/2010 | Expenses Paid
During Period1 |
| Actual: | | | |
| Class A Shares | $1,000 | $1,126.80 | $5.33 |
| Class C Shares | $1,000 | $1,123.00 | $9.26 |
Hypothetical (assuming a 5% return
before expenses): | | | |
| Class A Shares | $1,000 | $1,020.05 | $5.06 |
| Class C Shares | $1,000 | $1,016.34 | $8.80 |
| 1 | Expenses are equal to the Fund's annualized net expense ratios, multiplied by the average account value over the period, multiplied by 183/365 (to reflect the one-half-year period). The annualized net expense ratios are as follows: |
| Class A Shares | 1.00% |
| Class C Shares | 1.74% |
Annual Shareholder Report4
Performance data quoted represents past performance which is no guarantee of future results. Investment return and principal value will fluctuate so that an investor's shares, when redeemed, may be worth more or less than their original cost. Mutual fund performance changes over time and current performance may be lower or higher than what is stated. For current to the most recent month-end performance and after-tax returns, visit FederatedInvestors.com or call 1-800-341-7400.
Management's Discussion of Fund Performance
The Fund's total return for the fiscal year ended November 30, 2010, based on net asset value, was -0.68% for Class A Shares and -1.43% for Class C Shares. The total return of the MSCI EAFE High Dividend Yield Index1 (Benchmark) was -4.79% for the same period. The Fund's total return for the fiscal year reflected actual cash flows, transaction costs and other expenses, which were not reflected in the total return of the Benchmark.
The following discussion will focus on the performance of the Fund's Class A Shares.
Market Overview
The fiscal year was a choppy environment for global equity stocks as investors attempted to navigate through a muted economic and financial recovery. The onset of the fiscal year ushered in expectations of a broadening global recovery, aided by a factory sector that began to rebuild inventories, a consumer who appeared to be loosening his grip on his wallet and a labor market that appeared on the verge of expanding again. While choppy economic reports in January and February offered setbacks, March brought clearer signs of a broad recovery that was gaining some steam.
Much of this optimism came undone as economic news first fueled, then tempered, a rally in global equities. Where the first quarter offered support, the second quarter was downright abysmal. May's fears of spreading sovereign contagion in Europe were supplanted with June's fears of a potential double dip. The stock markets pulled off June's lows, not so much on any significant improvement in economic fundamentals but on what was shaping up as another solid quarter for corporate earnings and guidance. If anything, the economic news was worse than expected, manufacturing appeared to slow and employment data still reflected businesses' hesitancy to hire.
| 1 | The MSCI EAFE High Dividend Yield Index is a free float-adjusted market capitalization index designed to measure the performance of securities that offer a meaningfully higher than average dividend yield in the developed markets comprising the MSCI EAFE Index. Investments cannot be made directly in an index. |
Annual Shareholder Report5
The third quarter proved to be no less volatile. Europe's sovereign debt crisis appeared to be easing, with both bank and sovereign-debt spreads easing. Major equity indexes posted their best September – typically a difficult month – in seven decades, following their worst August in nine years. Overall, however, the bulk of news coming out of most reports was indicative of sub-par growth for this stage of recovery and the still-soft economic data was simply strong enough to ease fears of a double dip.
We ended the fiscal year with the S&P 500 Index2 posting its best October in seven years and the MSCI EAFE,3 its best in four. The rally, which built off September's strong gains, defied not only what seasonally are two of the weakest trading months of the year but also much of the underlying economic data. We closed out the fiscal year, with a notable retracement in overseas markets; the European Union can't seem to shake its sovereign debt woes despite a new bailout package for Ireland and other member countries. An inflationary spike in China has prompted fears that the Asian giant may act to curtail growth and cool global growth. While year-end reports suggested the economy's summer slowdown was a soft patch and not something worse, i.e., the precursor to a double-dip recession, they hardly reflected a global economy that was firing on all cylinders.
Fund Performance
With our investments in the dividend-producing segment of the market and our low beta4 of 0.84, the Fund's short-term performance generally does not move in lock-step with broad market indicators. Performance in fiscal year 2010 was no exception, as investors first dismissed the merits of a dividend-based style, and then embraced them.5
| 2 | The S&P 500 Index is an unmanaged capitalization-weighted index of 500 stocks designed to measure the performance of the broad domestic economy through changes in the aggregate market value of 500 stocks representing all major industries. Investments cannot be made in an index. |
| 3 | The MSCI EAFE Index is an unmanaged market capitalization index comprising 22 of the 48 countries in the MSCI universe and representing the developed world outside of North America. Investments cannot be made in an index. |
| 4 | Beta is a measure of the volatility, or systematic risk, of a security or portfolio in comparison to the market as a whole. A beta of less than one means that the security will be less volatile than the market. A beta of greater than one indicates that the security's price will be more volatile than the market. The beta is since inception 6/4/2008 through 11/30/2010 versus the MSCI EAFE. |
| 5 | There are no guarantees that dividend-paying stocks will continue to pay dividends. In addition, dividend paying stocks may not experience the same capital appreciation potential as non-dividend paying stocks. |
Annual Shareholder Report
6
From a country perspective, the Fund gained most notably from investing in Canada, Mexico, and Brazil, countries not represented in the benchmark.6 Fund holdings within Canada that did particularly well included Telus Corp. and Riocan REIT, with returns of 51.18% and 30.21% respectively. Kimberly Clark de Mexico advanced 53.53% and our holdings within Brazil produced an average 45.68% total return. The Fund benefited further from an underweight position in Spain, a country that declined by 28.14% in the benchmark.From a sector perspective, the leading contributor to outperformance was an overweight position coupled with positive stock selection within Consumer Staples, the highest returning sector in the period. In addition to the aforementioned Kimberly Clark de Mexico, we saw tobacco names, Cia Souza Cruz and British American Tobacco, each post compelling returns of 26% or higher. The Fund benefited further from positive stock selection within Financials and Telecomm Services. Where financial stocks within the benchmark declined by 10.25%, our holdings, in contrast, advanced by 1.35%. Similarly, our Telecomm Services holdings outperformed those in the benchmark by 7.01% in the period.
In contrast, poor stock selection within Germany was the leading contributor to underperformance. Laggards here included electric utility holdings, E.On AG and RWE AG, which posted returns of -17.87% and -18.16% respectively. Our lack of exposure to Hong Kong and Sweden also contributed negatively as the countries posted returns of 25.23% and 15.12% respectively. From a sector perspective, the primary contributors to underperformance were a lack of exposure to the Industrials and Materials sectors, which advanced 11.98% and 14.14%, respectively, in the Benchmark.
Regardless of market preferences, we continued our focus on companies that offer high yield and the potential for dividend growth over time. To this end, the Fund finished the period with a weighted median 6.11% yield.7 This compares to a 5.28% yield for the Benchmark.
| 6 | International investing special risks including currency risk, political risks and differences in auditing and other financial standards. |
| 7 | A weighted median dividend yield is a weighted average of the dividends of all the stocks in a portfolio. As of November 30, 2010, the 30-Day SEC yield was 3.88% for Class A Shares. In the absence of temporary expense waivers or reimbursements the 30-Day SEC yield would have been 0.73%. The weighted median yield is 6.11%. |
Annual Shareholder Report7
GROWTH OF A $10,000 INVESTMENT – CLASS A SHARES
The graph below illustrates the hypothetical investment of $10,0001 in Federated International Strategic Value Dividend Fund (Class A Shares) (the “Fund”) from June 4, 2008 (start of performance) to November 30, 2010, compared to the MSCI EAFE High Dividend Yield Index (MSCI HDY)2 and the Morningstar Foreign Large Value Funds Category Average (MFLVFCA).2
| Average Annual Total Returns3 for the Period Ended 11/30/2010 | |
| 1 Year | -6.10% |
| Start of Performance (6/4/2008) | -12.18% |
Performance data quoted represents past performance which is no guarantee of future results. Investment return and principal value will fluctuate so that an investor's shares, when redeemed, may be worth more or less than their original cost. Mutual fund performance changes over time and current performance may be lower or higher than what is stated. For current to the most recent month-end performance and after-tax returns, visit FederatedInvestors.com or call 1-800-341-7400. Returns shown do not reflect the deduction of taxes that a shareholder would pay on Fund distributions or the redemption of Fund shares. Mutual funds are not obligations of or guaranteed by any bank and are not federally insured. Total returns shown include the maximum sales charge of 5.50%.
Annual Shareholder Report
8
| 1 | Represents a hypothetical investment of $10,000 in the Fund after deducting the maximum sales charge of 5.50% ($10,000 investment minus $550 sales charge = $9,450). The Fund's performance assumes the reinvestment of all dividends and distributions. The MSCI HDY and the MFLVFCA have been adjusted to reflect reinvestment of dividends on securities in the index and average. |
| 2 | The MSCI HDY and the MFLVFCA are not adjusted to reflect sales charges, expenses or other fees that the Securities and Exchange Commission (SEC) requires to be reflected in the Fund's performance. The MSCI HDY represents the components of the MSCI Europe, Australasia and Far East Index (MSCI EAFE), is a free float-adjusted market capitalization index that is designed to measure the equity market performance of developed markets, excluding the US & Canada. As of May 27, 2010 the MSCI EAFE Index consisted of the following 22 developed market country indices: Australia, Austria, Belgium, Denmark, Finland, France, Germany, Greece, Hong Kong, Ireland, Israel, Italy, Japan, the Netherlands, New Zealand, Norway, Portugal, Singapore, Spain, Sweden, Switzerland, and the United Kingdom. The MSCI HDY, however, only includes securities which have a dividend yield that is at least 30% higher than its relative parent index, the MSCI EAFE. Only securities with a reasonable payout and a non-negative, five-year DPS growth rate are eligible for inclusion in the MSCI HDY. The MFLVFCA includes foreign large-value portfolios that invest mainly in big international stocks that are less expensive or growing more slowly than other large cap stocks. Most of these portfolios divide their assets among a dozen or more developed markets, including Japan, Britain, France and Germany. These portfolios primarily invest in stocks that have market caps in the top 70% of each economically integrated market (such as Europe or Asia ex-Japan). Value is defined based on low valuations (low-price ratios and high-dividend yields) and slow growth (low growth rates for earnings, sales, book value and cash flow). These portfolios typically will have less than 20% of assets invested in U.S. stocks. The index is unmanaged and, unlike the Fund, is not affected by cash flows. It is not possible to invest directly in an index or an average. |
| | Copyright 2009 Morningstar, Inc. All Rights Reserved. The information contained herein: (1) is proprietary to Morningstar and/or its content providers; (2) may not be copied or distributed; and (3) is not warranted to be accurate, complete or timely. Neither Morningstar nor its content providers are responsible for any damages or losses arising from any use of this information. Past performance is no guarantee of future results. |
| 3 | Total returns quoted reflect all applicable sales charges. |
Annual Shareholder Report9
GROWTH OF A $10,000 INVESTMENT – CLASS C SHARES
The graph below illustrates the hypothetical investment of $10,0001 in Federated International Strategic Value Dividend Fund (Class C Shares) (the “Fund”) from June 4, 2008 (start of performance) to November 30, 2010, compared to the MSCI EAFE High Dividend Yield Index (MSCI HDY)2 and the Morningstar Foreign Large Value Funds Category Average (MFLVFCA).2
| Average Annual Total Returns3 for the Period Ended 11/30/2010 | |
| 1 Year | -2.39% |
| Start of Performance (6/4/2008) | -10.88% |
Performance data quoted represents past performance which is no guarantee of future results. Investment return and principal value will fluctuate so that an investor's shares, when redeemed, may be worth more or less than their original cost. Mutual fund performance changes over time and current performance may be lower or higher than what is stated. For current to the most recent month-end performance and after-tax returns, visit FederatedInvestors.com or call 1-800-341-7400. Returns shown do not reflect the deduction of taxes that a shareholder would pay on Fund distributions or the redemption of Fund shares. Mutual funds are not obligations of or guaranteed by any bank and are not federally insured. Total returns shown include the maximum contingent deferred sales charge of 1.00%, as applicable.
Annual Shareholder Report
10
| 1 | Represents a hypothetical investment of $10,000 in the Fund. A 1.00% contingent deferred sales charge would be applied on any redemption less than one year from the purchase date. The Fund's performance assumes the reinvestment of all dividends and distributions. The MSCI HDY and the MFLVFCA have been adjusted to reflect reinvestment of dividends on securities in the index and average. |
| 2 | The MSCI HDY and the MFLVFCA are not adjusted to reflect sales charges, expenses or other fees that the Securities and Exchange Commission (SEC) requires to be reflected in the Fund's performance. The MSCI HDY represents the components of the MSCI Europe, Australasia and Far East Index (MSCI EAFE), is a free float-adjusted market capitalization index that is designed to measure the equity market performance of developed markets, excluding the US & Canada. As of May 27, 2010 the MSCI EAFE Index consisted of the following 22 developed market country indices: Australia, Austria, Belgium, Denmark, Finland, France, Germany, Greece, Hong Kong, Ireland, Israel, Italy, Japan, the Netherlands, New Zealand, Norway, Portugal, Singapore, Spain, Sweden, Switzerland, and the United Kingdom. The MSCI HDY, however, only includes securities which have a dividend yield that is at least 30% higher than its relative parent index, the MSCI EAFE. Only securities with a reasonable payout and a non-negative, five-year DPS growth rate are eligible for inclusion in the MSCI HDY. The MFLVFCA includes foreign large-value portfolios that invest mainly in big international stocks that are less expensive or growing more slowly than other large cap stocks. Most of these portfolios divide their assets among a dozen or more developed markets, including Japan, Britain, France and Germany. These portfolios primarily invest in stocks that have market caps in the top 70% of each economically integrated market (such as Europe or Asia ex-Japan). Value is defined based on low valuations (low-price ratios and high-dividend yields) and slow growth (low growth rates for earnings, sales, book value and cash flow). These portfolios typically will have less than 20% of assets invested in U.S. stocks. The index is unmanaged and, unlike the Fund, is not affected by cash flows. It is not possible to invest directly in an index or an average. |
| | Copyright 2009 Morningstar, Inc. All Rights Reserved. The information contained herein: (1) is proprietary to Morningstar and/or its content providers; (2) may not be copied or distributed; and (3) is not warranted to be accurate, complete or timely. Neither Morningstar nor its content providers are responsible for any damages or losses arising from any use of this information. Past performance is no guarantee of future results. |
| 3 | Total returns quoted reflect all applicable contingent deferred sales charges. |
Annual Shareholder Report11
Portfolio of Investments Summary Tables (unaudited)
At November 30, 2010, the Fund's portfolio composition1 was as follows:
| Country | Percentage of
Total Net Assets |
| United Kingdom | 30.1% |
| France | 13.4% |
| Australia | 13.1% |
| Canada | 10.2% |
| Spain | 5.7% |
| Singapore | 5.1% |
| Brazil | 3.0% |
| Belgium | 2.8% |
| Italy | 2.8% |
| Netherlands | 2.5% |
| Germany | 2.1% |
| Portugal | 1.8% |
| Norway | 1.7% |
| Taiwan | 1.1% |
| Austria | 1.0% |
| Japan | 0.9% |
| Switzerland | 0.9% |
| Cash Equivalents2 | 0.4% |
| Other Assets and Liabilities — Net3 | 1.4% |
| TOTAL | 100.0% |
| 1 | Country allocations are based primarily on the country in which a company is incorporated. However, the Fund's adviser may allocate a company to a country based on other factors such as location of the company's principal office, the location of the principal trading market for the company's securities or the country where a majority of the company's revenues are derived. |
| 2 | Cash Equivalents include any investments in money market mutual funds and/or overnight repurchase agreements. |
| 3 | Assets, other than investments in securities, less liabilities. See Statement of Assets and Liabilities. |
Annual Shareholder Report
12
At November 30, 2010, the Fund's sector classification composition4 was as follows:| Sector Classification | Percentage of
Total Net Assets |
| Telecommunication Services | 21.2% |
| Consumer Staples | 15.8% |
| Financials | 15.6% |
| Energy | 14.1% |
| Utilities | 13.3% |
| Health Care | 8.2% |
| Consumer Discretionary | 6.3% |
| Information Technology | 3.7% |
| Cash Equivalents2 | 0.4% |
| Other Assets and Liabilities — Net3 | 1.4% |
| TOTAL | 100.0% |
| 4 | Except for Cash Equivalents and Other Assets and Liabilities, sector classifications are based upon, and individual securities assigned to, the classifications of the Global Industry Classification Standard (GICS) except that the Adviser assigns a classification to securities not classified by the GICS and to securities for which the Adviser does not have access to the classification made by the GICS. |
Annual Shareholder Report13
Portfolio of Investments
November 30, 2010
| Shares | | | Value in
U.S. Dollars |
| | COMMON STOCKS – 98.2% | |
| | Banks – 8.5% | |
| 7,000 | | Australia & New Zealand Banking Group, Melbourne | 152,037 |
| 22,900 | | Banco Do Brasil SA | 439,409 |
| 55,700 | | Banco Santander, SA | 527,800 |
| 6,700 | | Bank of Montreal | 392,908 |
| 28,000 | | DBS Group Holdings Ltd. | 296,891 |
| 41,000 | | National Australia Bank Ltd., Melbourne | 921,550 |
| 15,000 | | Westpac Banking Corp. Ltd., Sydney | 307,247 |
| | TOTAL | 3,037,842 |
| | Energy – 14.1% | |
| 31,400 | | Crescent Point Energy Corp. | 1,268,480 |
| 9,100 | | ENI SpA | 183,090 |
| 32,280 | | Repsol YPF SA | 778,522 |
| 33,883 | | Royal Dutch Shell PLC, Class A | 1,020,336 |
| 31,205 | | Statoil ASA | 618,343 |
| 23,912 | | Total SA | 1,158,220 |
| | TOTAL | 5,026,991 |
| | Food & Staples Retailing – 2.1% | |
| 192,500 | | Metcash Ltd. | 769,412 |
| | Food, Beverage & Tobacco – 13.6% | |
| 18,215 | | British American Tobacco PLC | 660,289 |
| 17,210 | | Coca-Cola Amatil Ltd. | 183,763 |
| 17,211 | | Diageo PLC | 306,258 |
| 142,485 | | Foster's Group Ltd. | 771,631 |
| 299,552 | | Goodman Fielder Ltd. | 394,791 |
| 21,355 | | Imperial Tobacco Group PLC | 626,466 |
| 14,300 | | SABMiller PLC | 452,421 |
| 64,700 | | Tate & Lyle | 513,252 |
| 34,649 | | Unilever PLC | 957,710 |
| | TOTAL | 4,866,581 |
| | Health Care Equipment & Services – 0.9% | |
| 27,060 | | Sonic Healthcare Ltd. | 306,057 |
| | Insurance – 3.7% | |
| 1,675 | | Muenchener Rueckversicherungs-Gesellschaft AG | 232,643 |
| 7,100 | | QBE Insurance Group Ltd. | 114,534 |
Annual Shareholder Report14
| Shares | | | Value in
U.S. Dollars |
| 363,700 | | Royal & Sun Alliance Insurance Group PLC | 679,426 |
| 1,400 | | Zurich Financial Services AG | 311,483 |
| | TOTAL | 1,338,086 |
| | Media – 6.4% | |
| 8,900 | | Pearson PLC | 128,191 |
| 22,600 | | Shaw Communications, Inc., Class B | 452,859 |
| 157,000 | | Singapore Press Holdings Ltd. | 498,224 |
| 36,066 | | Vivendi SA | 879,897 |
| 15,738 | | Wolters Kluwer NV | 311,946 |
| | TOTAL | 2,271,117 |
| | Pharmaceuticals, Biotechnology & Life Sciences – 7.4% | |
| 11,927 | | AstraZeneca PLC | 555,721 |
| 9,400 | | Eisai Co. Ltd. | 323,367 |
| 45,543 | | GlaxoSmithKline PLC | 858,579 |
| 14,953 | | Sanofi-Aventis | 904,106 |
| | TOTAL | 2,641,773 |
| | Real Estate – 3.3% | |
| 56,600 | | RioCan Real Estate Investment Trust | 1,188,735 |
| | Software & Services – 1.2% | |
| 32,300 | | Redecard SA | 421,034 |
| | Technology Hardware & Equipment – 2.5% | |
| 10,351 | | Neopost SA | 912,850 |
| | Telecommunication Services – 21.2% | |
| 19,048 | | Belgacom | 644,464 |
| 793,300 | 1 | Cable & Wireless Communications PLC | 550,953 |
| 164,818 | | Chunghwa Telecom Co. Ltd. | 400,116 |
| 40,502 | | Deutsche Telekom AG, Class REG | 518,692 |
| 41,842 | | Koninklijke KPN NV | 596,629 |
| 6,175 | | Mobistar SA | 359,413 |
| 51,775 | | Portugal Telecom SGPS SA | 657,482 |
| 201,385 | | Singapore Telecom Ltd. | 472,824 |
| 272,000 | | StarHub Ltd. | 541,796 |
| 7,700 | | TELUS Corp. | 335,138 |
| 33,735 | | Telefonica SA | 717,714 |
| 26,250 | | Telekom Austria AG | 364,590 |
| 277,515 | | Telstra Corp. Ltd. | 747,455 |
Annual Shareholder Report15
| Shares | | | Value in
U.S. Dollars |
| 262,325 | | Vodafone Group PLC | 655,913 |
| | TOTAL | 7,563,179 |
| | Utilities – 13.3% | |
| 58,075 | | A2A SpA | 74,404 |
| 8,630 | | CPFL Energia SA | 199,820 |
| 28,161 | | GDF Suez | 933,965 |
| 139,667 | | National Grid PLC | 1,233,951 |
| 52,700 | | Scottish & Southern Energy PLC | 918,088 |
| 182,100 | | Terna SpA | 746,354 |
| 69,270 | | United Utilities Group PLC | 642,705 |
| | TOTAL | 4,749,287 |
| | TOTAL COMMON STOCKS
(IDENTIFIED COST $36,333,521) | 35,092,944 |
| | MUTUAL FUND – 0.4% | |
| 134,360 | 2,3 | Federated Prime Value Obligations Fund, Institutional Shares, 0.21%
(AT NET ASSET VALUE) | 134,360 |
| | TOTAL INVESTMENTS — 98.6%
(IDENTIFIED COST $36,467,881)4 | 35,227,304 |
| | OTHER ASSETS AND LIABILITIES - NET — 1.4%5 | 499,094 |
| | TOTAL NET ASSETS — 100% | $35,726,398 |
| 1 | Non-income producing security. |
| 2 | Affiliated company. |
| 3 | 7-Day net yield. |
| 4 | Also represents cost for federal tax purposes. |
| 5 | Assets, other than investments in securities, less liabilities. See Statement of Assets and Liabilities. |
Note: The categories of investments are shown as a percentage of total net assets at November 30, 2010.
Various inputs are used in determining the value of the Fund's investments. These inputs are summarized in the three broad levels listed below:
Level 1 — quoted prices in active markets for identical securities
Level 2 — other significant observable inputs (including quoted prices for similar securities, interest rates, prepayment speeds, credit risk, etc.)
Level 3 — significant unobservable inputs (including the Fund's own assumptions in determining the fair value of investments)
The inputs or methodology used for valuing securities are not an indication of the risk associated with investing in those securities.
As of November 30, 2010, all investments of the Fund utilized Level 1 inputs in valuing the Fund's assets carried at fair value.
See Notes which are an integral part of the Financial Statements
Annual Shareholder Report16
Statement of Assets and Liabilities
November 30, 2010
| Assets: | | |
| Total investments in securities, at value including $134,360 of investments in an affiliated issuer (Note 5) (identified cost $36,467,881) | | $35,227,304 |
| Cash denominated in foreign currencies (identified cost $301,063) | | 296,696 |
| Income receivable | | 128,520 |
| Receivable for shares sold | | 153,054 |
| TOTAL ASSETS | | 35,805,574 |
| Liabilities: | | |
| Payable for shares redeemed | $10,251 | |
| Payable for custodian fees | 4,595 | |
| Payable for transfer and dividend disbursing agent fees and expenses | 7,878 | |
| Payable for Directors'/Trustees' fees | 101 | |
| Payable for auditing fees | 28,000 | |
| Payable for portfolio accounting fees | 10,681 | |
| Payable for distribution services fee (Note 5) | 1,915 | |
| Payable for shareholder services fee (Note 5) | 4,853 | |
| Payable for share registration costs | 2,420 | |
| Payable for printing and postage | 1,297 | |
| Payable for insurance premiums | 4,321 | |
| Accrued expenses | 2,864 | |
| TOTAL LIABILITIES | | 79,176 |
| Net assets for 10,307,168 shares outstanding | | $35,726,398 |
| Net Assets Consist of: | | |
| Paid-in capital | | $36,816,634 |
| Net unrealized depreciation of investments and translation of assets and liabilities in foreign currency | | (1,247,199) |
| Accumulated net realized gain on investments and foreign currency transactions | | 50,002 |
| Undistributed net investment income | | 106,961 |
| TOTAL NET ASSETS | | $35,726,398 |
Annual Shareholder Report17
Statement of Assets and Liabilities — continued| Net Asset Value, Offering Price and Redemption Proceeds Per Share | | |
| Class A Shares: | | |
| Net asset value per share ($19,059,734 ÷ 5,500,270 shares outstanding), no par value, unlimited shares authorized | | $3.47 |
| Offering price per share (100/94.50 of $3.47) | | $3.67 |
| Redemption proceeds per share (98.00/100 of $3.47) | | $3.40 |
| Class C Shares: | | |
| Net asset value per share ($3,022,467 ÷ 873,725 shares outstanding), no par value, unlimited shares authorized | | $3.46 |
| Offering price per share | | $3.46 |
| Redemption proceeds per share (97.00/100 of $3.46) | | $3.36 |
| Institutional Shares: | | |
| Net asset value per share ($13,644,197 ÷ 3,933,173 shares outstanding), no par value, unlimited shares authorized | | $3.47 |
| Offering price per share | | $3.47 |
| Redemption proceeds per share (98.00/100 of $3.47) | | $3.40 |
See Notes which are an integral part of the Financial Statements
Annual Shareholder Report18
Statement of Operations
Year Ended November 30, 2010
| Investment Income: | | | |
| Dividends (including $1,008 received from an affiliated issuer (Note 5) and net of foreign taxes withheld of $96,659) | | | $981,064 |
| Expenses: | | | |
| Investment adviser fee (Note 5) | | $131,382 | |
| Administrative personnel and services fee (Note 5) | | 230,000 | |
| Custodian fees | | 26,832 | |
| Transfer and dividend disbursing agent fees and expenses | | 50,814 | |
| Directors'/Trustees' fees | | 777 | |
| Auditing fees | | 28,048 | |
| Legal fees | | 5,308 | |
| Portfolio accounting fees | | 75,202 | |
| Distribution services fee — Class C Shares (Note 5) | | 16,575 | |
| Shareholder services fee — Class A Shares (Note 5) | | 7,960 | |
| Shareholder services fee — Class C Shares (Note 5) | | 5,262 | |
| Share registration costs | | 56,253 | |
| Printing and postage | | 32,342 | |
| Insurance premiums | | 4,300 | |
| Miscellaneous | | 7,525 | |
| TOTAL EXPENSES | | 678,580 | |
Annual Shareholder Report19
Statement of Operations — continued| Waivers, Reimbursements and Reduction: | | | |
| Waiver/reimbursement of investment adviser fee (Note 5) | $(131,382) | | |
| Waiver of administrative personnel and services fee (Note 5) | (44,825) | | |
| Reimbursement of shareholder services fee — Class A Shares (Note 5) | (215) | | |
| Reimbursement of other operating expenses (Note 5) | (340,336) | | |
| Fees paid indirectly from directed brokerage arrangements (Note 6) | (370) | | |
| TOTAL WAIVERS, REIMBURSEMENTS AND REDUCTION | | $(517,128) | |
| Net expenses | | | $161,452 |
| Net investment income | | | 819,612 |
| Realized and Unrealized Gain (Loss) on Investments and Foreign Currency Transactions: | | | |
| Net realized gain on investments and foreign currency transactions | | | 14,543 |
| Net change in unrealized appreciation of investments and translation of assets and liabilities in foreign currency | | | (2,359,503) |
| Net realized and unrealized loss on investments and foreign currency transactions | | | (2,344,960) |
| Change in net assets resulting from operations | | | $(1,525,348) |
See Notes which are an integral part of the Financial Statements
Annual Shareholder Report20
Statement of Changes in Net Assets
| Year Ended November 30 | 2010 | 2009 |
| Increase (Decrease) in Net Assets | | |
| Operations: | | |
| Net investment income | $819,612 | $178,239 |
| Net realized gain on investments and foreign currency transactions | 14,543 | 76,576 |
| Net change in unrealized appreciation/depreciation of investments and translation of assets and liabilities in foreign currency | (2,359,503) | 1,384,767 |
| CHANGE IN NET ASSETS RESULTING FROM OPERATIONS | (1,525,348) | 1,639,582 |
| Distributions to Shareholders: | | |
| Distributions from net investment income | | |
| Class A Shares | (89,198) | (8,101) |
| Class C Shares | (71,042) | (14,482) |
| Institutional Shares | (520,132) | (97,130) |
| CHANGE IN NET ASSETS RESULTING FROM DISTRIBUTIONS TO SHAREHOLDERS | (680,372) | (119,713) |
| Share Transactions: | | |
| Proceeds from sale of shares | 28,372,228 | 8,659,040 |
| Net asset value of shares issued to shareholders in payment of distributions declared | 647,027 | 85,984 |
| Cost of shares redeemed | (2,003,880) | (142,223) |
| CHANGE IN NET ASSETS RESULTING FROM SHARE TRANSACTIONS | 27,015,375 | 8,602,801 |
| Redemption Fees | 338 | 689 |
| Change in net assets | 24,809,993 | 10,123,359 |
| Net Assets: | | |
| Beginning of period | 10,916,405 | 793,046 |
| End of period (including undistributed net investment income of $106,961 and $47,911, respectively) | $35,726,398 | $10,916,405 |
See Notes which are an integral part of the Financial Statements
Annual Shareholder Report21
Notes to Financial Statements
November 30, 2010
1. ORGANIZATION
Federated Equity Funds (the “Trust”) is registered under the Investment Company Act of 1940, as amended (the “Act”), as an open-end management investment company. The Trust consists of 12 diversifed portfolios. The financial statements included herein are only those of Federated International Strategic Value Dividend Fund (formerly, Federated International Strategic Value Fund) (the “Fund”), a diversified portfolio. The financial statements of the other portfolios are presented separately. The assets of each portfolio are segregated and a shareholder's interest is limited to the portfolio in which shares are held. Each portfolio pays its own expenses. The Fund offers three classes of shares: Class A Shares, Class C Shares and Institutional Shares. All shares of the Fund have equal rights with respect to voting, except on class-specific matters. The financial highlights of the Institutional Shares are presented separately. The investment objective of the Fund is to provide income and long-term capital appreciation.
2. SIGNIFICANT ACCOUNTING POLICIES
The following is a summary of significant accounting policies consistently followed by the Fund in the preparation of its financial statements. These policies are in conformity with U.S. generally accepted accounting principles (GAAP).
Investment Valuation
In calculating its net asset value (NAV), the Fund generally values investments as follows:
- Equity securities listed on an exchange or traded through a regulated market system are valued at their last reported sale price or official closing price in their principal exchange or market.
- Shares of other mutual funds are valued based upon their reported NAVs.
- Fixed-income securities acquired with remaining maturities greater than 60 days are fair valued using price evaluations provided by a pricing service approved by the Board of Trustees (the “Trustees”).
- Fixed-income securities acquired with remaining maturities of 60 days or less are valued at their cost (adjusted for the accretion of any discount or amortization of any premium).
- Derivative contracts listed on exchanges are valued at their reported settlement or closing price.
- Over-the-counter (OTC) derivative contracts are fair valued using price evaluations provided by a pricing service approved by the Trustees.
If the Fund cannot obtain a price or price evaluation from a pricing service for an investment, the Fund may attempt to value the investment based upon the mean of bid and asked quotations or fair value the investment based on price evaluations, from one or more dealers. If any price, quotation, price evaluation or other pricing source is not readily available when the NAV is calculated, the Fund uses the fair value of the investment determined in accordance with the procedures described below. There can be no assurance that the Fund could purchase or sell an investment at the price used to calculate the Fund's NAV.
Annual Shareholder Report
22
Fair Valuation and Significant Events ProceduresThe Trustees have authorized the use of pricing services to provide evaluations of the current fair value of certain investments for purposes of calculating the NAV. Factors considered by pricing services in evaluating an investment include the yields or prices of investments of comparable quality, coupon, maturity, call rights and other potential prepayments, terms and type, reported transactions, indications as to values from dealers and general market conditions. Some pricing services provide a single price evaluation reflecting the bid-side of the market for an investment (a “bid” evaluation). Other pricing services offer both bid evaluations and price evaluations indicative of a price between the prices bid and asked for the investment (a “mid” evaluation). The Fund normally uses bid evaluations for U.S. Treasury and Agency securities and mortgage-backed securities. The Fund normally uses mid evaluations for other types of fixed-income securities and OTC derivative contracts. In the event that market quotations and price evaluations are not available for an investment, the fair value of the investment is determined in accordance with procedures adopted by the Trustees.
The Trustees also have adopted procedures requiring an investment to be priced at its fair value whenever the Adviser determines that a significant event affecting the value of the investment has occurred between the time as of which the price of the investment would otherwise be determined and the time as of which the NAV is computed. An event is considered significant if there is both an affirmative expectation that the investment's value will change in response to the event and a reasonable basis for quantifying the resulting change in value. Examples of significant events that may occur after the close of the principal market on which a security is traded, or after the time of a price evaluation provided by a pricing service or a dealer, include:
- With respect to securities traded in foreign markets, significant trends in U.S. equity markets or in the trading of foreign securities index futures or options contracts;
- With respect to price evaluations of fixed-income securities determined before the close of regular trading on the NYSE, actions by the Federal Reserve Open Market Committee and other significant trends in U.S. fixed-income markets;
- Political or other developments affecting the economy or markets in which an issuer conducts its operations or its securities are traded; and
- Announcements concerning matters such as acquisitions, recapitalizations, litigation developments, a natural disaster affecting the issuer's operations or regulatory changes or market developments affecting the issuer's industry.
The Trustees have approved the use of a pricing service to determine the fair value of equity securities traded principally in foreign markets when the Adviser determines that there has been a significant trend in the U.S. equity markets or in index futures trading. For other significant events, the Fund may seek to obtain more current quotations or price evaluations from alternative pricing sources. If a reliable alternative pricing source is not available, the Fund will determine the fair value of the investment using another method approved by the Trustees.
Annual Shareholder Report
23
Repurchase AgreementsIt is the policy of the Fund to require the other party to a repurchase agreement to transfer to the Fund's custodian or sub-custodian eligible securities or cash with a market value (after transaction costs) at least equal to the repurchase price to be paid under the repurchase agreement. The eligible securities are transferred to accounts with the custodian or sub-custodian in which the Fund holds a “securities entitlement” and exercises “control” as those terms are defined in the Uniform Commercial Code. The Fund has established procedures for monitoring the market value of the transferred securities and requiring the transfer of additional eligible securities if necessary to equal at least the repurchase price. These procedures also allow the other party to require securities to be transferred from the account to the extent that their market value exceeds the repurchase price or in exchange for other eligible securities of equivalent market value.
The insolvency of the other party or other failure to repurchase the securities may delay the disposition of the underlying securities or cause the Fund to receive less than the full repurchase price. Under the terms of the repurchase agreement, any amounts received by the Fund in excess of the repurchase price and related transaction costs must be remitted to the other party.
The Fund may enter into repurchase agreements in which eligible securities are transferred into joint trading accounts maintained by the custodian or sub-custodian for investment companies and other clients advised by the Fund's Adviser and its affiliates. The Fund will participate on a pro rata basis with the other investment companies and clients in its share of the securities transferred under such repurchase agreements and in its share of proceeds from any repurchase or other disposition of such securities.
Investment Income, Gains and Losses, Expenses and Distributions
Investment transactions are accounted for on a trade-date basis. Realized gains and losses from investment transactions are recorded on an identified-cost basis. Interest income and expenses are accrued daily. Dividend income and distributions to shareholders are recorded on the ex-dividend date. Foreign dividends are recorded on the ex-dividend date or when the Fund is informed of the ex-dividend date. Distributions of net investment income are declared and paid quarterly. Non-cash dividends included in dividend income, if any, are recorded at fair value. Investment income, realized and unrealized gains and losses, and certain fund-level expenses are allocated to each class based on relative average daily net assets, except that each class may bear certain expenses unique to that class such as distribution services and shareholder services fees. Dividends are declared separately for each class. No class has preferential dividend rights; differences in per share dividend rates are generally due to differences in separate class expenses.
Premium and Discount Amortization
All premiums and discounts on fixed-income securities are amortized/accreted for financial statement purposes.
Federal Taxes
It is the Fund's policy to comply with the Subchapter M provision of the Internal Revenue Code (the “Code”) and to distribute to shareholders each year substantially all of its income. Accordingly, no provision for federal income tax is necessary. As of and during the year ended November 30, 2010, the Fund did not have a liability for any uncertain tax positions. The Fund Annual Shareholder Report
24
recognizes interest and penalties, if any, related to tax liabilities as income tax expense in the Statement of Operations. As of November 30, 2010, tax years 2008 through 2010 remain subject to examination by the Fund's major tax jurisdictions, which include the United States of America and the Commonwealth of Massachusetts.The Fund may be subject to taxes imposed by governments of countries in which it invests. Such taxes are generally based on either income or gains earned or repatriated. The Fund accrues and applies such taxes to net investment income, net realized gains and net unrealized gains as income and/or gains are earned.
When-Issued and Delayed Delivery Transactions
The Fund may engage in when-issued or delayed delivery transactions. The Fund records when-issued securities on the trade date and maintains security positions such that sufficient liquid assets will be available to make payment for the securities purchased. Securities purchased on a when-issued or delayed delivery basis are marked to market daily and begin earning interest on the settlement date. Losses may occur on these transactions due to changes in market conditions or the failure of counterparties to perform under the contract.
Foreign Exchange Contracts
The Fund may enter into foreign exchange contracts for the delayed delivery of securities or foreign currency exchange transactions. The Fund may enter into foreign exchange contracts to protect assets against adverse changes in foreign currency exchange rates or exchange control regulations. Purchased contracts are used to acquire exposure to foreign currencies, whereas, contracts to sell are used to hedge the Fund's securities against currency fluctuations. Risks may arise upon entering into these transactions from the potential inability of counterparties to meet the terms of their commitments and from unanticipated movements in security prices or foreign exchange rates. The foreign exchange contracts are adjusted by the daily exchange rate of the underlying currency and any gains or losses are recorded for financial statement purposes as unrealized until the settlement date.
At November 30, 2010, the Fund had no outstanding foreign exchange contracts.
Foreign Currency Translation
The accounting records of the Fund are maintained in U.S. dollars. All assets and liabilities denominated in foreign currencies (FCs) are translated into U.S. dollars based on the rates of exchange of such currencies against U.S. dollars on the date of valuation. Purchases and sales of securities, income and expenses are translated at the rate of exchange quoted on the respective date that such transactions are recorded. The Fund does not isolate that portion of the results of operations resulting from changes in foreign exchange rates on investments from the fluctuations arising from changes in market prices of securities held. Such fluctuations are included with the net realized and unrealized gain or loss from investments.
Reported net realized foreign exchange gains or losses arise from sales of portfolio securities, sales and maturities of short-term securities, sales of FCs, currency gains or losses realized between the trade and settlement dates on securities transactions, the difference between the amounts of dividends, interest and foreign withholding taxes recorded on the Fund's books, and the U.S. dollar equivalent of the amounts actually received or paid. Net unrealized foreign exchange gains and losses arise from changes in the value of assets and liabilities other than investments in securities at fiscal year end, resulting from changes in the exchange rate.
Annual Shareholder Report
25
Additional Disclosure Related to Derivative InstrumentsThe Effect of Derivative Instruments on the Statement of Operations for the Year Ended November 30, 2010
| Amount of Realized Gain or (Loss) on Derivatives Recognized in Income |
| Forward
Currency
Contracts |
| Foreign exchange contracts | $4,449 |
| Change in Unrealized Appreciation or (Depreciation) on Derivatives Recognized in Income |
| Forward
Currency
Contracts |
| Foreign exchange contracts | $(882) |
Other
The preparation of financial statements in conformity with GAAP requires management to make estimates and assumptions that affect the amounts of assets, liabilities, expenses and revenues reported in the financial statements. Actual results could differ from those estimated.
3. SHARES OF BENEFICIAL INTEREST
The following tables summarize share activity:
| Year Ended November 30 | 2010 | 2009 |
| Class A Shares: | Shares | Amount | Shares | Amount |
| Shares sold | 5,312,764 | $19,769,085 | 315,677 | $1,083,361 |
| Shares issued to shareholders in payment of distributions declared | 25,281 | 86,562 | 2,595 | 8,098 |
| Shares redeemed | (135,574) | (469,779) | (24,195) | (81,799) |
NET CHANGE RESULTING
FROM CLASS A SHARE TRANSACTIONS | 5,202,471 | $19,385,868 | 294,077 | $1,009,660 |
| Year Ended November 30 | 2010 | 2009 |
| Class C Shares: | Shares | Amount | Shares | Amount |
| Shares sold | 833,485 | $3,017,987 | 347,362 | $1,103,148 |
| Shares issued to shareholders in payment of distributions declared | 20,665 | 70,136 | 4,597 | 14,479 |
| Shares redeemed | (322,191) | (1,162,934) | (10,213) | (34,431) |
NET CHANGE RESULTING
FROM CLASS C SHARE TRANSACTIONS | 531,959 | $1,925,189 | 341,746 | $1,083,196 |
Annual Shareholder Report26
| Year Ended November 30 | 2010 | 2009 |
| Institutional Shares: | Shares | Amount | Shares | Amount |
| Shares sold | 1,534,052 | $5,585,156 | 2,088,603 | $6,472,531 |
| Shares issued to shareholders in payment of distributions declared | 143,340 | 490,329 | 20,201 | 63,407 |
| Shares redeemed | (101,658) | (371,167) | (7,575) | (25,993) |
NET CHANGE RESULTING
FROM INSTITUTIONAL
SHARE TRANSACTIONS | 1,575,734 | $5,704,318 | 2,101,229 | $6,509,945 |
NET CHANGE RESULTING
FROM TOTAL FUND
SHARE TRANSACTIONS | 7,310,164 | $27,015,375 | 2,737,052 | $8,602,801 |
Redemption Fees
The Fund imposes a 2.00% redemption fee to shareholders of the Fund's Class A Shares, Class C Shares and Institutional Shares who redeem shares held for 30 days or less. Shares acquired by reinvestment of dividends or distributions of the Fund, or purchased pursuant to the Systematic Investment Program or withdrawn pursuant to the Systematic Withdrawal Program, will not be subject to the redemption fee. All redemption fees are recorded by the Fund as additions to paid-in capital. For the year ended November 30, 2010, the redemption fees for Class A Shares, Class C Shares and Institutional Shares amounted to $41, $50 and $247, respectively. For the year ended November 30, 2009, the redemption fees for Class A Shares, Class C Shares and Institutional Shares amounted to $45, $83 and $561, respectively.
4. FEDERAL TAX INFORMATION
The timing and character of income and capital gain distributions are determined in accordance with income tax regulations, which may differ from GAAP. These differences are due to differing treatments for foreign currency transactions.
For the year ended November 30, 2010, permanent differences identified and reclassified among the components of net assets were as follows:
| Increase (Decrease) |
Undistributed
Net Investment
Income (Loss) | | Accumulated
Net Realized
Gain (Loss) |
| $(80,190) | | $80,190 |
Net investment income (loss), net realized gains (losses), and net assets were not affected by this reclassification.
The tax character of distributions as reported on the Statement of Changes in Net Assets for the years ended November 30, 2010 and 2009, was as follows:
| 2010 | 2009 |
| Ordinary income | $680,372 | $119,713 |
Annual Shareholder Report
27
As of November 30, 2010, the components of distributable earnings on a tax basis were as follows:| Undistributed ordinary income1 | $120,680 |
| Undistributed long-term capital gain | $36,283 |
| Net unrealized depreciation | $(1,247,199) |
| 1 | For tax purposes, short-term capital gains are treated as ordinary income for distribution purposes. |
At November 30, 2010, the cost of investments for federal tax purposes was $36,467,881. The net unrealized depreciation of investments for federal tax purposes excluding any unrealized appreciation resulting from changes in foreign currency exchange rates was $1,240,577. This consists of net unrealized appreciation from investments for those securities having an excess of value over cost of $792,311 and net unrealized depreciation from investments for those securities having an excess of cost over value of $2,032,888.
The Fund used capital loss carryforwards of $44,731 to offset taxable capital gains realized during the year ended November 30, 2010.
5. INVESTMENT ADVISER FEE AND OTHER TRANSACTIONS WITH AFFILIATES
Investment Adviser Fee
Federated Equity Management Company of Pennsylvania is the Fund's investment adviser (the “Adviser”). The advisory agreement between the Fund and the Adviser provides for an annual fee equal to 0.75% of the Fund's average daily net assets. Subject to the terms described in the Expense Limitation note, the Adviser may voluntarily choose to waive any portion of its fee and/or reimburse certain operating expenses of the Fund. For the year ended November 30, 2010, the Adviser voluntarily waived $130,811 of its fee and voluntarily reimbursed $340,336 of other operating expenses.
Administrative Fee
Federated Administrative Services (FAS), under the Administrative Services Agreement, provides the Fund with administrative personnel and services. The fee paid to FAS is based on the average aggregate daily net assets of certain Federated funds as specified below:
| Administrative Fee | Average Aggregate Daily Net Assets
of the Federated Funds |
| 0.150% | on the first $5 billion |
| 0.125% | on the next $5 billion |
| 0.100% | on the next $10 billion |
| 0.075% | on assets in excess of $20 billion |
The administrative fee received during any fiscal year shall be at least $150,000 per portfolio and $40,000 per each additional class of Shares. Subject to the terms described in the Expense Limitation note, FAS may voluntarily choose to waive any portion of its fee. For the year ended November 30, 2010, FAS waived $44,825 of its fee. The net fee paid to FAS was 1.057% of average daily net assets of the Fund. The Fund is currently being charged the minimum administrative fee; therefore the fee as a percentage of average daily net assets is greater than the amounts presented in the chart above.
Annual Shareholder Report
28
Distribution Services FeeThe Fund has adopted a Distribution Plan (the “Plan”) pursuant to Rule 12b-1 under the Act. Under the terms of the Plan, the Fund will compensate Federated Securities Corp. (FSC), the principal distributor, from the daily net assets of the Fund's Class A Shares and Class C Shares to finance activities intended to result in the sale of these shares. The Plan provides that the Fund may incur distribution expenses at the following percentages of average daily net assets annually, to compensate FSC:
| Share Class Name | Percentage of Average Daily
Net Assets of Class |
| Class A Shares | 0.05% |
| Class C Shares | 0.75% |
Subject to the terms described in the Expense Limitation note, FSC may voluntarily choose to waive any portion of its fee. When FSC receives fees, it may pay some or all of them to financial intermediaries whose customers purchase shares. For the year ended November 30, 2010, FSC retained $5,208 of fees paid by the Fund. For the year ended November 30, 2010, the Fund's Class A Shares did not incur a distribution services fee; however, it may begin to incur this fee upon approval of the Trustees.
Sales Charges
Front-end sales charges and contingent deferred sales charges (CDSC) do not represent expenses of the Fund. They are deducted from the proceeds of sales of Fund shares prior to investment or from redemption proceeds prior to remittance, as applicable. For the year ended November 30, 2010, FSC retained $8,583 in sales charges from the sale of Class A Shares. FSC also retained $1,523 of CDSC relating to redemptions of Class C Shares.
Shareholder Services Fee
The Fund may pay fees (“Service Fees”) up to 0.25% of the average daily net assets of the Fund's Class A Shares and Class C Shares to financial intermediaries or to Federated Shareholder Services Company (FSSC) for providing services to shareholders and maintaining shareholder accounts. Subject to the terms described in the Expense Limitation note, FSSC may voluntarily reimburse the Fund for Service Fees. For the year ended November 30, 2010, FSSC voluntarily reimbursed $215 of Service Fees. For the year ended November 30, 2010, FSSC did not receive any fees paid by the Fund.
Expense Limitation
The Adviser and its affiliates (which may include FSC, FAS and FSSC) have voluntarily agreed to waive their fees and/or reimburse expenses so that the total annual fund operating expenses (as shown in the financial highlights) paid by the Fund's Class A Shares, Class C Shares and Institutional Shares (after the voluntary waivers and reimbursements) will not exceed 1.00%, 1.75% and 0.75% (the “Fee Limit”), respectively, through the later of (the “Termination Date”): (a) January 31, 2012; or (b) the date of the Fund's next effective Prospectus. While the Adviser and its affiliates currently do not anticipate terminating or increasing these arrangements prior to the Termination Date, these arrangements may only be terminated or the Fee Limit increased prior to the Termination Date with the agreement of the Trustees.
Annual Shareholder Report
29
GeneralCertain Officers and Trustees of the Fund are Officers and Directors or Trustees of the above companies.
Transactions Involving Affiliated Holdings
Affiliated holdings are mutual funds which are managed by the Adviser or an affiliate of the Adviser. The Adviser has agreed to reimburse the Fund for certain investment adviser fees as a result of transactions in other affiliated mutual funds. For the year ended November 30, 2010, the Adviser reimbursed $571. Transactions involving affiliated holdings during the year ended November 30, 2010, were as follows:
| Affiliate | Balance of
Shares Held
11/30/2009 | Purchases/
Additions | Sales/
Reductions | Balance of
Shares Held
11/30/2010 | Value | Dividend
Income |
| Federated Prime Value Obligations Fund, Institutional Shares | 225,244 | 24,703,070 | 24,793,954 | 134,360 | $134,360 | $1,008 |
6. EXPENSE Reduction
The Fund directs portfolio trades to a broker that in turn pays a portion of the Fund's operating expenses. For the year ended November 30, 2010, the Fund's expenses were reduced by $370 under these arrangements.
7. Investment TRANSACTIONS
Purchases and sales of investments, excluding long-term U.S. government securities and short-term obligations, for the year ended November 30, 2010, were as follows:
| Purchases | $30,459,384 |
| Sales | $3,921,268 |
8. CONCENTRATION OF RISK
The Fund invests in securities of non-U.S. issuers. Political or economic developments may have an effect on the liquidity and volatility of portfolio securities and currency holdings.
9. LINE OF CREDIT
The Fund participates in a $100,000,000 unsecured, uncommitted revolving line of credit (LOC) agreement with PNC Bank. The LOC was made available for extraordinary or emergency purposes, primarily for financing redemption payments. Borrowings are charged interest at a rate offered to the Fund by PNC Bank at the time of the borrowing. As of November 30, 2010, there were no outstanding loans. During the year ended November 30, 2010, the Fund did not utilize the LOC.
10. INTERFUND LENDING
Pursuant to an Exemptive Order issued by the Securities and Exchange Commission, the Fund, along with other funds advised by subsidiaries of Federated Investors, Inc., may participate in an interfund lending program. This program provides an alternative credit facility allowing the Fund to borrow from other participating affiliated funds. As of November 30, 2010, there were no outstanding loans. During the year ended November 30, 2010, the program was not utilized.
Annual Shareholder Report
30
11. Legal ProceedingsSince February, 2004, Federated Investors, Inc. and related entities (collectively, “Federated”), have been named as defendants in several lawsuits that are now pending in the United States District Court for the Western District of Pennsylvania. These lawsuits have been consolidated into a single action alleging excessive advisory fees involving one of the Federated-sponsored mutual funds (“Federated Funds”). Federated and its counsel have been defending this litigation. Additional lawsuits based upon similar allegations may be filed in the future. The potential impact of these lawsuits, all of which seek monetary damages, attorneys' fees and expenses, and future potential similar suits is uncertain. Although we do not believe that these lawsuits will have a material adverse effect on the Federated Funds, there can be no assurance that these suits, ongoing adverse publicity and/or other developments resulting from the allegations in these matters will not result in increased redemptions, or reduced sales, of shares of the Federated Funds or other adverse consequences for the Federated Funds.
12. Subsequent events
Effective January 31, 2011 (the “Effective Date”), the Fund will no longer charge a redemption fee. Accordingly, no shares of the Fund redeemed after the Effective Date will be assessed a redemption fee regardless of when such shares were purchased.
Management has evaluated subsequent events through the date the financial statements were issued, and determined that no additional events have occurred that require disclosure.
13. FEDERAL TAX INFORMATION (UNAUDITED)
For the fiscal year ended November 30, 2010, 100% of total ordinary income distributions made by the Fund are qualifying dividends which may be subject to a maximum tax rate of 15%, as provided for by the Jobs and Growth Tax Relief Act of 2003. Complete information is reported in conjunction with the reporting of your distributions on Form 1099-DIV.
If the Fund meets the requirements of Section 853 of the Internal Revenue Code of 1986, as amended, the Fund will pass through to its shareholders credits for foreign taxes paid.
For the fiscal year ended November 30, 2010, the Fund derived $1,076,717 of gross income from foreign sources and paid foreign taxes of $96,475.
Annual Shareholder Report31
Report of Independent Registered Public Accounting Firm
TO THE BOARD OF TRUSTEES OF THE FEDERATED EQUITY FUNDS AND SHAREHOLDERS OF Federated InternATIONAL STRATEGIC VALUE Dividend fund:
We have audited the accompanying statement of assets and liabilities, including the portfolio of investments, of the Federated International Strategic Value Dividend Fund (the “Fund”), a portfolio of Federated Equity Funds, as of November 30, 2010, and the related statement of operations for the year then ended, the statements of changes in net assets for each of the years in the two-year period then ended, and the financial highlights for each of the years or periods in the three-year period then ended. These financial statements and financial highlights are the responsibility of the Fund's management. Our responsibility is to express an opinion on these financial statements and financial highlights based on our audits.
We conducted our audits in accordance with the standards of the Public Company Accounting Oversight Board (United States). Those standards require that we plan and perform the audit to obtain reasonable assurance about whether the financial statements and financial highlights are free of material misstatement. An audit includes examining, on a test basis, evidence supporting the amounts and disclosures in the financial statements. Our procedures included confirmation of securities owned as of November 30, 2010 by correspondence with the custodian and transfer agent. An audit also includes assessing the accounting principles used and significant estimates made by management, as well as evaluating the overall financial statement presentation. We believe that our audits provide a reasonable basis for our opinion.
In our opinion, the financial statements and financial highlights referred to above present fairly, in all material respects, the financial position of the Federated International Strategic Value Dividend Fund as of November 30, 2010 and the results of its operations for the year then ended, the changes in its net assets for each of the years in the two-year period then ended, and the financial highlights for each of the years or periods in the three-year period then ended, in conformity with U.S. generally accepted accounting principles.
Boston, Massachusetts
January 25, 2011
Annual Shareholder Report32
Board of Trustees and Trust Officers
The Board of Trustees is responsible for managing the Trust's business affairs and for exercising all the Trust's powers except those reserved for the shareholders. The following tables give information about each Trustee and the senior officers of the Fund. Where required, the tables separately list Trustees who are “interested persons” of the Fund (i.e., “Interested” Trustees) and those who are not (i.e., “Independent” Trustees). Unless otherwise noted, the address of each person listed is Federated Investors Tower, 1001 Liberty Avenue, Pittsburgh, PA 15222. The address of all Independent Trustees listed is 4000 Ericsson Drive, Warrendale, PA 15086-7561; Attention: Mutual Fund Board. As of December 31, 2010, the Trust comprised 13 portfolio(s), and the Federated Fund Family consisted of 43 investment companies (comprising 136 portfolios). Unless otherwise noted, each Officer is elected annually. Unless otherwise noted, each Trustee oversees all portfolios in the Federated Fund Family and serves for an indefinite term. The Fund's Statement of Additional Information includes additional information about Trust Trustees and is available, without charge and upon request, by calling 1-800-341-7400.
Interested Trustees Background
Name
Birth Date
Positions Held with Trust
Date Service Began | Principal Occupation(s) for Past Five Years,
Other Directorships Held and Previous Position(s) |
John F. Donahue*
Birth Date: July 28, 1924
Trustee
Began serving: April 1984 | Principal Occupations: Director or Trustee of the Federated Fund Family; Chairman and Director, Federated Investors, Inc.; Chairman of the Federated Fund Family's Executive Committee.
Previous Positions: Chairman of the Federated Fund Family; Trustee, Federated Investment Management Company; Chairman and Director, Federated Investment Counseling. |
J. Christopher Donahue*
Birth Date: April 11, 1949
President Trustee
Began serving: January 2000 | Principal Occupations: Principal Executive Officer and President of the Federated Fund Family; Director or Trustee of some of the Funds in the Federated Fund Family; President, Chief Executive Officer and Director, Federated Investors, Inc.; Chairman and Trustee, Federated Investment Management Company; Trustee, Federated Investment Counseling; Chairman and Director, Federated Global Investment Management Corp.; Chairman, Federated Equity Management Company of Pennsylvania and Passport Research, Ltd. (investment advisory subsidiary of Federated); Trustee, Federated Shareholder Services Company; Director, Federated Services Company.
Previous Positions: President, Federated Investment Counseling; President and Chief Executive Officer, Federated Investment Management Company, Federated Global Investment Management Corp. and Passport Research, Ltd. |
| * | Family relationships and reasons for “interested” status: John F. Donahue is the father of J. Christopher Donahue; both are “interested” due to their beneficial ownership of shares of Federated Investors, Inc. and the positions they hold with Federated and its subsidiaries. |
Annual Shareholder Report33
INDEPENDENT Trustees Background
Name
Birth Date
Positions Held with Trust
Date Service Began | Principal Occupation(s) for Past Five Years,
Other Directorships Held, Previous Position(s) and Qualifications |
Nicholas P. Constantakis, CPA
Birth Date: September 3, 1939
Trustee
Began serving: February 1998 | Principal Occupation: Director or Trustee of the Federated Fund Family.
Other Directorship Held: Director and Chairman of the Audit Committee, Michael Baker Corporation (architecture, engineering and construction services).
Previous Position: Partner, Andersen Worldwide SC.
Qualifications: Public accounting and director experience. |
John F. Cunningham
Birth Date: March 5, 1943
Trustee
Began serving: January 1999 | Principal Occupation: Director or Trustee of the Federated Fund Family.
Other Directorships Held: Chairman, President and Chief Executive Officer, Cunningham & Co., Inc. (strategic business consulting); Trustee Associate, Boston College.
Previous Positions: Director, Redgate Communications and EMC Corporation (computer storage systems); Chairman of the Board and Chief Executive Officer, Computer Consoles, Inc.; President and Chief Operating Officer, Wang Laboratories; Director, First National Bank of Boston; Director, Apollo Computer, Inc.
Qualifications: Business management and director experience. |
Maureen Lally-Green
Birth Date: July 5, 1949
Trustee
Began serving: August 2009 | Principal Occupations: Director or Trustee of the Federated Fund Family; Director, Office of Church Relations, Diocese of Pittsburgh; Adjunct Professor of Law, Duquesne University School of Law.
Other Directorships Held: Director, Auberle; Trustee, St. Francis University; Director, Ireland Institute of Pittsburgh; Director, UPMC Mercy Hospital; Regent, St. Vincent Seminary; Director, Epilepsy Foundation of Western and Central Pennsylvania; Director, Saint Thomas More Society, Allegheny County; Director, Carlow University.
Previous Position: Pennsylvania Superior Court Judge.
Qualifications: Legal and director experience. |
Peter E. Madden
Birth Date: March 16, 1942
Trustee
Began serving: November 1991 | Principal Occupation: Director or Trustee, and Chairman of the Board of Directors or Trustees, of the Federated Fund Family.
Previous Positions: Representative, Commonwealth of Massachusetts General Court; President, Chief Operating Officer and Director, State Street Bank and Trust Company and State Street Corporation (retired); Director, VISA USA and VISA International; Chairman and Director, Massachusetts Bankers Association; Director, Depository Trust Corporation; Director, The Boston Stock Exchange.
Qualifications: Business management, mutual fund services and director experience. |
Annual Shareholder Report34
Name
Birth Date
Positions Held with Trust
Date Service Began | Principal Occupation(s) for Past Five Years,
Other Directorships Held, Previous Position(s) and Qualifications |
Charles F. Mansfield, Jr.
Birth Date: April 10, 1945
Trustee
Began serving: January 1999 | Principal Occupations: Director or Trustee and Chairman of the Audit Committee of the Federated Fund Family; Management Consultant.
Previous Positions: Chief Executive Officer, PBTC International Bank; Partner, Arthur Young & Company (now Ernst & Young LLP); Chief Financial Officer of Retail Banking Sector, Chase Manhattan Bank; Senior Vice President, HSBC Bank USA (formerly, Marine Midland Bank); Vice President, Citibank; Assistant Professor of Banking and Finance, Frank G. Zarb School of Business, Hofstra University; Executive Vice President, DVC Group, Inc. (marketing, communications and technology).
Qualifications: Banking, business management and director experience. |
R. James Nicholson
Birth Date: February 4, 1938
Trustee
Began serving: January 2008 | Principal Occupations: Director or Trustee of the Federated Fund Family; Senior Counsel, Brownstein Hyatt Farber Schrek, P.C.; Former Secretary of the U.S. Dept. of Veterans Affairs; Former U.S. Ambassador to the Holy See; Former Chairman of the Republican National Committee.
Other Directorships Held: Director, Horatio Alger Association; Director, The Daniels Fund.
Previous Positions: Colonel, U.S. Army Reserve; Partner, Calkins, Kramer, Grimshaw and Harring, P.C.; General Counsel, Colorado Association of Housing and Building; Chairman and CEO, Nicholson Enterprises, Inc. (real estate holding company); Chairman and CEO, Renaissance Homes of Colorado.
Qualifications: Legal, government, business management and director experience. |
Thomas M. O'Neill
Birth Date: June 14, 1951
Trustee
Began serving: October 2006 | Principal Occupations: Director or Trustee of the Federated Fund Family; Sole Proprietor, Navigator Management Company (investment and strategic consulting).
Other Directorships Held: Board of Overseers, Children's Hospital of Boston; Visiting Committee on Athletics, Harvard College.
Previous Positions: Chief Executive Officer and President, Managing Director and Chief Investment Officer, Fleet Investment Advisors; President and Chief Executive Officer, Aeltus Investment Management, Inc.; General Partner, Hellman, Jordan Management Co., Boston, MA; Chief Investment Officer, The Putnam Companies, Boston, MA; Credit Analyst and Lending Officer, Fleet Bank; Director and Consultant, EZE Castle Software (investment order management software); Director, Midway Pacific (lumber).
Qualifications: Business management, mutual fund, director and investment experience. |
Annual Shareholder Report35
Name
Birth Date
Positions Held with Trust
Date Service Began | Principal Occupation(s) for Past Five Years,
Other Directorships Held, Previous Position(s) and Qualifications |
John S. Walsh
Birth Date: November 28, 1957
Trustee
Began serving: January 1999 | Principal Occupations: Director or Trustee of the Federated Fund Family; President and Director, Heat Wagon, Inc. (manufacturer of construction temporary heaters); President and Director, Manufacturers Products, Inc. (distributor of portable construction heaters); President, Portable Heater Parts, a division of Manufacturers Products, Inc.
Previous Position: Vice President, Walsh & Kelly, Inc.
Qualifications: Business management and director experience. |
James F. Will
Birth Date: October 12, 1938
Trustee
Began serving: April 2006 | Principal Occupations: Director or Trustee of the Federated Fund Family; formerly, Vice Chancellor and President, Saint Vincent College.
Other Directorships Held: Trustee, Saint Vincent College; Director, Alleghany Corporation; Trustee, Wheeling Jesuit University; Director, Liberty Tire Recycling.
Previous Positions: Chairman, President and Chief Executive Officer, Armco, Inc.; President and Chief Executive Officer, Cyclops Industries; President and Chief Operating Officer, Kaiser Steel Corporation.
Qualifications: Business management, education and director experience. |
OFFICERS
Name
Birth Date
Address
Positions Held with Trust
Date Service Began | Principal Occupation(s) for Past Five Years
and Previous Position(s) |
John W. McGonigle
Birth Date: October 26, 1938
Executive Vice President and Secretary
Began serving: April 1984 | Principal Occupations: Executive Vice President and Secretary of the Federated Fund Family; Vice Chairman, Executive Vice President, Secretary and Director, Federated Investors, Inc.
Previous Positions: Trustee, Federated Investment Management Company and Federated Investment Counseling; Director, Federated Global Investment Management Corp., Federated Services Company and Federated Securities Corp. |
Richard A. Novak
Birth Date: December 25, 1963
Treasurer
Began serving: January 2006 | Principal Occupations: Principal Financial Officer and Treasurer of the Federated Fund Family; Senior Vice President, Federated Administrative Services; Financial and Operations Principal for Federated Securities Corp., Edgewood Services, Inc. and Southpointe Distribution Services, Inc.
Previous Positions: Controller of Federated Investors, Inc.; Vice President, Finance of Federated Services Company; held various financial management positions within The Mercy Hospital of Pittsburgh; Auditor, Arthur Andersen & Co. |
Annual Shareholder Report36
Name
Birth Date
Address
Positions Held with Trust
Date Service Began | Principal Occupation(s) for Past Five Years
and Previous Position(s) |
Richard B. Fisher
Birth Date: May 17, 1923
Vice President
Began serving: April 1984 | Principal Occupations: Vice Chairman or Vice President of some of the Funds in the Federated Fund Family; Vice Chairman, Federated Investors, Inc.; Chairman, Federated Securities Corp.
Previous Positions: President and Director or Trustee of some of the Funds in the Federated Fund Family; Executive Vice President, Federated Investors, Inc.; Director and Chief Executive Officer, Federated Securities Corp. |
Brian P. Bouda
Birth Date: February 28, 1947
Senior Vice President and Chief Compliance Officer
Began serving: August 2004 | Principal Occupations: Senior Vice President and Chief Compliance Officer of the Federated Fund Family; Vice President and Chief Compliance Officer of Federated Investors, Inc. and Chief Compliance Officer of its subsidiaries. Mr. Bouda joined Federated in 1999 and is a member of the American Bar Association and the State Bar Association of Wisconsin. |
Stephen F. Auth
Birth Date: September 3, 1956
450 Lexington Avenue
Suite 3700
New York, NY 10017-3943
CHIEF INVESTMENT OFFICER
Began serving: November 2002 | Principal Occupations: Mr. Auth is Chief Investment Officer of this Fund and various other Funds in the Federated Fund Family; Executive Vice President, Federated Investment Counseling, Federated Global Investment Management Corp. and Federated Equity Management Company of Pennsylvania.
Previous Positions: Executive Vice President, Federated Investment Management Company, and Passport Research, Ltd. (investment advisory subsidiary of Federated); Senior Vice President, Global Portfolio Management Services Division; Senior Vice President, Federated Investment Management Company and Passport Research, Ltd.; Senior Managing Director and Portfolio Manager, Prudential Investments. |
Lawrence Auriana
Birth Date: January 8, 1944
140 East 45th Street
New York, NY 10017
VICE PRESIDENT
Began serving: November 2001 | Principal Occupations: Lawrence Auriana is Vice President of the Trust. Mr. Auriana joined Federated in April 2001 as Co-Head of Investments/Federated Kaufmann. From August 1984 to April 2001, Mr. Auriana was President and Treasurer of Edgemont Asset Management Corp., and Chairman of the Board and Portfolio Manager to The Kaufmann Fund, Inc. (predecessor to the Federated Kaufmann Fund). Mr. Auriana earned a B.S. in economics from Fordham University and has been engaged in the securities business since 1965. |
Walter C. Bean
Birth Date: June 22, 1945
VICE PRESIDENT
Began serving: November 2006 | Principal Occupations: Walter C. Bean has been the Fund's Portfolio Manager since inception. Walter C. Bean is Vice President of the Trust. Mr. Bean is a Senior Vice President, Senior Portfolio Manager and the Head of the Equity Income Management Team of the Fund's Adviser. Mr. Bean joined Federated in 2000. His previous associations included: various investment management and research positions with C.S. McKee & Company, First Chicago Investment Advisors, CIGNA Investment Advisors and Mellon Bank. Mr. Bean earned a Bachelors Degree in Business Administration from Ohio University and an M.B.A. from the Pennsylvania State University. Mr. Bean has received the Chartered Financial Analyst designation and has 41 years of investment experience. |
Annual Shareholder Report37
Name
Birth Date
Address
Positions Held with Trust
Date Service Began | Principal Occupation(s) for Past Five Years
and Previous Position(s) |
Hans P. Utsch
Birth Date: July 3, 1936
140 East 45th Street
New York, NY 10017
VICE PRESIDENT
Began serving: November 2001 | Principal Occupations: Hans P. Utsch is Vice President of the Trust. Mr. Utsch joined Federated in April 2001 as Co-Head of Investments/Federated Kaufmann. From August 1984 to April 2001, Mr. Utsch was Chairman of the Board and Secretary of Edgemont Asset Management Corp., and President and Portfolio Manager to The Kaufmann Fund, Inc. (predecessor to the Federated Kaufmann Fund). Mr. Utsch graduated from Amherst College and holds an M.B.A. from Columbia University. He has been engaged in the securities business since 1962. |
Annual Shareholder Report38
Evaluation and Approval of Advisory Contract – May 2010
Federated International Strategic Value Dividend Fund (the “Fund”)
The Fund's Board reviewed the Fund's investment advisory contract at meetings held in May 2010. The Board's decision regarding the contract reflects the exercise of its business judgment on whether to continue the existing arrangements.
In this connection, the Federated funds' Board had previously appointed a Senior Officer, whose duties include specified responsibilities relating to the process by which advisory fees are to be charged to a Federated fund. The Senior Officer has the authority to retain consultants, experts, or staff as may be reasonably necessary to assist in the performance of his duties, reports directly to the Board, and may be terminated only with the approval of a majority of the independent members of the Board. The Senior Officer prepared and furnished to the Board an independent, written evaluation that covered topics discussed below. The Board considered that evaluation, along with other information, in deciding to approve the advisory contract.
During its review of the contract, the Board considered compensation and benefits received by the Adviser. This included the fees received for services provided to the Fund by other entities in the Federated organization and research services (if any) received by the Adviser from brokers that execute Federated fund trades, as well as advisory fees. The Board is also familiar with and considered judicial decisions concerning allegedly excessive investment advisory fees, which have indicated that the following factors may be relevant to an Adviser's fiduciary duty with respect to its receipt of compensation from a fund: the nature and quality of the services provided by the Adviser, including the performance of the fund; the Adviser's cost of providing the services; the extent to which the Adviser may realize “economies of scale” as a fund grows larger; any indirect benefits that may accrue to the Adviser and its affiliates as a result of the Adviser's relationship with a fund; performance and expenses of comparable funds; and the extent to which the independent Board members are fully informed about all facts the Board deems relevant bearing on the Adviser's services and fees. The Board further considered management fees (including any components thereof) charged to institutional and other clients of the Adviser for what might be viewed as like services, and the cost to the Adviser and its affiliates of supplying services pursuant to the management fee agreements, excluding any intra-corporate profit and profit margins of the Adviser and its affiliates for supplying such services. The Board was aware of these factors and was guided by them in its review of the Fund's advisory contract to the extent it considered them to be appropriate and relevant, as discussed further below.
Annual Shareholder Report
39
The Board considered and weighed these circumstances in light of its substantial accumulated experience in governing the Fund and working with Federated on matters relating to the Federated funds, and was assisted in its deliberations by independent legal counsel. Throughout the year, the Board has requested and received substantial and detailed information about the Fund and the Federated organization that was in addition to the extensive materials that comprise and accompany the Senior Officer's evaluation. Federated provided much of this information at each regular meeting of the Board, and furnished additional reports in connection with the particular meeting at which the Board's formal review of the advisory contract occurred. Between regularly scheduled meetings, the Board also received information on particular matters as the need arose. Thus, the Board's consideration of the advisory contract included review of the Senior Officer's evaluation, accompanying data and additional reports covering such matters as: the Adviser's investment philosophy, revenue, profitability, personnel and processes; investment and operating strategies; the Fund's short- and long-term performance (in absolute terms, both on a gross basis and net of expenses, as well as in relationship to its particular investment program and certain competitor or “peer group” funds and/or other benchmarks, as appropriate), and comments on the reasons for performance; the Fund's investment objectives; the Fund's expenses (including the advisory fee itself and the overall expense structure of the Fund, both in absolute terms and relative to similar and/or competing funds, with due regard for contractual or voluntary expense limitations); the use and allocation of brokerage commissions derived from trading the Fund's portfolio securities (if any); and the nature, quality and extent of the advisory and other services provided to the Fund by the Adviser and its affiliates. The Board also considered the preferences and expectations of Fund shareholders and their relative sophistication; the continuing state of competition in the mutual fund industry and market practices; the range of comparable fees for similar funds in the mutual fund industry; the Fund's relationship to the Federated family of funds which include a comprehensive array of funds with different investment objectives, policies and strategies which are available for exchange without the incurrence of additional sales charges; compliance and audit reports concerning the Federated funds and the Federated companies that service them (including communications from regulatory agencies), as well as Federated's responses to any issues raised therein; and relevant developments in the mutual fund industry and how the Federated funds and/or Federated are responding to them. The Board's evaluation process is evolutionary. The criteria considered and the emphasis placed on relevant criteria change in recognition of changing circumstances in the mutual fund marketplace.With respect to the Fund's performance and expenses in particular, the Board has found the use of comparisons to other mutual funds with comparable investment programs to be relevant, given the high degree of competition in the mutual fund business. The Board focused on comparisons with other similar Annual Shareholder Report
40
mutual funds more heavily than non-mutual fund products or services because it is believed that they are more relevant. For example, other mutual funds are the products most like the Fund, they are readily available to Fund shareholders as alternative investment vehicles, and they are the type of investment vehicle in fact chosen and maintained by the Fund's investors. The range of their fees and expenses therefore appears to be a generally reliable indication of what consumers have found to be reasonable in the precise marketplace in which the Fund competes. The Fund's ability to deliver competitive performance when compared to its peer group was a useful indicator of how the Adviser is executing the Fund's investment program, which in turn assisted the Board in reaching a conclusion that the nature, extent, and quality of the Adviser's investment management services were such as to warrant continuation of the advisory contract. In this regard, the Senior Officer has reviewed Federated's fees for providing advisory services to products outside the Federated family of funds (e.g., institutional and separate accounts). He concluded that mutual funds and institutional accounts are inherently different products. Those differences include, but are not limited to, different types of targeted investors; being subject to different laws and regulations; different legal structures; different average account sizes; different associated costs; different portfolio management techniques made necessary by different cash flows; and portfolio manager time spent in review of securities pricing. The Senior Officer did not consider these fee schedules to be determinative in judging the appropriateness of mutual fund advisory contracts.The Senior Officer reviewed reports compiled by Federated, using data supplied by independent fund ranking organizations, regarding the performance of, and fees charged by, other mutual funds, noting his view that comparisons to fund peer groups are relevant in judging the reasonableness of proposed fees.
The Fund's performance fell below the median of the relevant peer group for the one-year period covered by the report. The Board discussed the Fund's performance with the Adviser and recognized the efforts being undertaken by the Adviser. The Board will continue to monitor these efforts and the performance of the Fund.
The Board also received financial information about Federated, including reports on the compensation and benefits Federated derived from its relationships with the Federated funds. These reports covered not only the fees under the advisory contracts, but also fees received by Federated's subsidiaries for providing other services to the Federated funds under separate contracts (e.g., for serving as the Federated funds' administrator). The reports also discussed any indirect benefit Federated may derive from its receipt of research services from brokers who execute Federated fund trades. In addition, the Board considered the fact that, in order for a fund to be competitive in the marketplace, Federated and its affiliates frequently waived fees and/or Annual Shareholder Report
41
reimbursed expenses and have disclosed to fund investors and/or indicated to the Board their intention to do so in the future, where appropriate. Moreover, the Board receives regular reports regarding the institution or elimination of these voluntary waivers.Federated furnished reports, requested by the Senior Officer, that reported revenues on a fund-by-fund basis and made estimates of the allocation of expenses on a fund-by-fund basis, using allocation methodologies specified by the Senior Officer. The Senior Officer noted that, although they may apply consistent allocation processes, the inherent difficulties in allocating costs (and the unavoidable arbitrary aspects of that exercise) and the lack of consensus on how to allocate those costs may render such allocation reports unreliable. The allocation reports were considered in the analysis by the Board but were determined to be of limited use.
The Board and the Senior Officer also reviewed a report compiled by Federated comparing profitability information for Federated to other publicly held fund management companies. In this regard, the Senior Officer noted the limited availability of such information, but nonetheless concluded that Federated's profit margins did not appear to be excessive and the Board agreed.
The Senior Officer's evaluation also discussed the notion of possible realization of “economies of scale” as a fund grows larger. The Board considered in this regard that the Adviser has made significant and long-term investments in areas that support all of the Federated funds, such as personnel and processes for the portfolio management, compliance, and risk management functions; and systems technology; and that the benefits of these efforts (as well as any economies, should they exist) were likely to be enjoyed by the fund complex as a whole. Finally, the Board also noted the absence of any applicable regulatory or industry guidelines on this subject, which (as discussed in the Senior Officer's evaluation) is compounded by the lack of any common industry practice or general pattern with respect to structuring fund advisory fees with “breakpoints” that serve to reduce the fee as the fund attains a certain size. The Senior Officer did not recommend institution of breakpoints in pricing Federated's fund advisory services at this time.
It was noted in the materials for the Board meeting that for the period covered by the report, the Fund's investment advisory fee was waived in its entirety. The Board reviewed the contractual fee rate and other expenses of the Fund with the Adviser and was satisfied that the overall expense structure of the Fund remained competitive.
The Senior Officer's evaluation noted his belief that the information and observations contained in his evaluation supported a finding that the proposed management fees are reasonable, and that Federated appeared to provide appropriate administrative services to the Fund for the fees paid. Under these Annual Shareholder Report
42
circumstances, no changes were recommended to, and no objection was raised to, the continuation of the Fund's advisory contract. The Board concluded that the nature, quality and scope of services provided the Fund by the Adviser and its affiliates were satisfactory.In its decision to continue an existing investment advisory contract, the Board was mindful of the potential disruptions of the Fund's operations and various risks, uncertainties and other effects that could occur as a result of a decision to terminate or not renew an advisory contract. In particular, the Board recognized that many shareholders have invested in the Fund on the strength of the Adviser's industry standing and reputation and with the expectation that the Adviser will have a continuing role in providing advisory services to the Fund. Thus, the Board's approval of the advisory contract reflected the fact that it is the shareholders who have effectively selected the Adviser by virtue of having invested in the Fund.
The Board based its decision to approve the advisory contract on the totality of the circumstances and relevant factors and with a view to past and future long-term considerations. Not all of the factors and considerations identified above were necessarily relevant to the Fund, nor did the Board consider any one of them to be determinative. With respect to the factors that were relevant, the Board's decision to approve the contract reflects its determination that Federated's performance and actions provided a satisfactory basis to support the decision to continue the existing arrangements.
Annual Shareholder Report43
Voting Proxies on Fund Portfolio Securities
A description of the policies and procedures that the Fund uses to determine how to vote proxies, if any, relating to securities held in the Fund's portfolio is available, without charge and upon request, by calling 1-800-341-7400. A report on “Form N-PX” of how the Fund voted any such proxies during the most recent 12-month period ended June 30 is available from Federated's website at FederatedInvestors.com. To access this information from the “Products” section of the website, click on the “Prospectuses and Regulatory Reports” link under “Related Information,” then select the appropriate link opposite the name of the Fund; or select the name of the Fund and from the Fund's page, click on the “Prospectuses and Regulatory Reports” link. Form N-PX filings are also available at the SEC's website at www.sec.gov.
Quarterly Portfolio Schedule
The Fund files with the SEC a complete schedule of its portfolio holdings, as of the close of the first and third quarters of its fiscal year, on “Form N-Q.” These filings are available on the SEC's website at www.sec.gov and may be reviewed and copied at the SEC's Public Reference Room in Washington, DC. (Call 1-800-SEC-0330 for information on the operation of the Public Reference Room.) You may also access this information from the “Products” section of Federated's website at FederatedInvestors.com by clicking on “Portfolio Holdings” under “Related Information,” then selecting the appropriate link opposite the name of the Fund; or select the name of the Fund and from the Fund's page, click on the “Portfolio Holdings” link.
Annual Shareholder Report44
Mutual funds are not bank deposits or obligations, are not guaranteed by any bank and are not insured or guaranteed by the U.S. government, the Federal Deposit Insurance Corporation, the Federal Reserve Board or any other government agency. Investment in mutual funds involves investment risk, including the possible loss of principal.
This Report is authorized for distribution to prospective investors only when preceded or accompanied by the Fund's Prospectus, which contains facts concerning its objective and policies, management fees, expenses and other information.
Federated International Strategic Value Dividend Fund
Federated Investors Funds
4000 Ericsson Drive
Warrendale, PA 15086-7561
Contact us at FederatedInvestors.com
or call 1-800-341-7400.
Federated Securities Corp., Distributor
Cusip 314172388
Cusip 314172370
39834 (1/11)
Federated is a registered mark of Federated Investors, Inc.
2011 ©Federated Investors, Inc.
Federated International Strategic Value Dividend Fund
(formerly, Federated International Strategic Value Fund)
A Portfolio of Federated Equity Funds
ANNUAL SHAREHOLDER REPORTNovember 30, 2010
Institutional Shares
FINANCIAL HIGHLIGHTS
SHAREHOLDER EXPENSE EXAMPLE
MANAGEMENT'S DISCUSSION OF FUND PERFORMANCE
PORTFOLIO OF INVESTMENTS SUMMARY TABLES
PORTFOLIO OF INVESTMENTS
STATEMENT OF ASSETS AND LIABILITIES
STATEMENT OF OPERATIONS
STATEMENT OF CHANGES IN NET ASSETS
NOTES TO FINANCIAL STATEMENTS
REPORT OF INDEPENDENT REGISTERED PUBLIC ACCOUNTING FIRM
BOARD OF TRUSTEES AND TRUST OFFICERS
EVALUATION AND APPROVAL OF ADVISORY CONTRACT
VOTING PROXIES ON FUND PORTFOLIO SECURITIES
QUARTERLY PORTFOLIO SCHEDULE
Financial Highlights – Institutional Shares
(For a Share Outstanding Throughout Each Period)
| Year Ended November 30, | Period
Ended
11/30/20081 |
| 2010 | 2009 |
| Net Asset Value, Beginning of Period | $3.64 | $3.05 | $5.00 |
| Income From Investment Operations: | | | |
| Net investment income | 0.172 | 0.112 | 0.092 |
| Net realized and unrealized gain (loss) on investments and foreign currency transactions | (0.19) | 0.65 | (2.02) |
| TOTAL FROM INVESTMENT OPERATIONS | (0.02) | 0.76 | (1.93) |
| Less Distributions: | | | |
| Distributions from net investment income | (0.15) | (0.17) | (0.02) |
| Redemption Fees | 0.003 | 0.003 | — |
| Net Asset Value, End of Period | $3.47 | $3.64 | $3.05 |
| Total Return4 | (0.47)% | 25.97% | (38.77)% |
| Ratios to Average Net Assets: | | | |
| Net expenses | 0.75%5 | 0.74% | 0.18%6 |
| Net investment income | 4.80% | 3.28% | 4.55%6 |
| Expense waiver/reimbursement7 | 3.05% | 10.72% | 52.61%6 |
| Supplemental Data: | | | |
| Net assets, end of period (000 omitted) | $13,644 | $8,592 | $782 |
| Portfolio turnover | 23% | 31% | 22% |
| 1 | Reflects operations for the period from June 4, 2008 (date of initial investment) to November 30, 2008. |
| 2 | Per share numbers have been calculated using the average shares method. |
| 3 | Represents less than $0.01. |
| 4 | Based on net asset value, which does not reflect the sales charge, redemption fee or contingent deferred sales charge, if applicable. Total returns for periods of less than one year are not annualized. |
| 5 | The net expense ratio is calculated without reduction for expense offset arrangements. The net expense ratio is 0.75% for the period ended November 30, 2010 after taking into account this expense reduction. |
| 6 | Computed on an annualized basis. |
| 7 | This expense decrease is reflected in both the net expense and the net investment income ratios shown above. |
See Notes which are an integral part of the Financial Statements
Annual Shareholder Report1
Shareholder Expense Example (unaudited)
As a shareholder of the Fund, you incur two types of costs: (1) transaction costs, including redemption/exchange fees; and (2) ongoing costs, including management fees and to the extent applicable, distribution (12b-1) fees and/or shareholder services fees and other Fund expenses. This Example is intended to help you to understand your ongoing costs (in dollars) of investing in the Fund and to compare these costs with the ongoing costs of investing in other mutual funds. It is based on an investment of $1,000 invested at the beginning of the period and held for the entire period from June 1, 2010 to November 30, 2010.
ACTUAL EXPENSES
The first section of the table below provides information about actual account values and actual expenses. You may use the information in this section, together with the amount you invested, to estimate the expenses that you incurred over the period. Simply divide your account value by $1,000 (for example, an $8,600 account value divided by $1,000 = 8.6), then multiply the result by the number in the first section under the heading entitled “Expenses Paid During Period” to estimate the expenses attributable to your investment during this period.
HYPOTHETICAL EXAMPLE FOR COMPARISON PURPOSES
The second section of the table below provides information about hypothetical account values and hypothetical expenses based on the Fund's actual expense ratio and an assumed rate of return of 5% per year before expenses, which is not the Fund's actual return. Thus, you should not use the hypothetical account values and expenses to estimate the actual ending account balance or your expenses for the period. Rather, these figures are required to be provided to enable you to compare the ongoing costs of investing in the Fund with other funds. To do so, compare this 5% hypothetical example with the 5% hypothetical examples that appear in the shareholder reports of the other funds.
Annual Shareholder Report
2
Please note that the expenses shown in the table are meant to highlight your ongoing costs only and do not reflect any transaction costs, such as redemption/exchange fees. Therefore, the second section of the table is useful in comparing ongoing costs only, and will not help you determine the relative total costs of owning different funds. In addition, if these transaction costs were included, your costs would have been higher. | Beginning
Account Value
6/1/2010 | Ending
Account Value
11/30/2010 | Expenses Paid
During Period1 |
| Actual | $1,000 | $1,128.00 | $4.00 |
Hypothetical (assuming a 5% return
before expenses) | $1,000 | $1,021.31 | $3.80 |
| 1 | Expenses are equal to the Fund's annualized net expense ratio of 0.75%, multiplied by the average account value over the period, multiplied by 183/365 (to reflect the one-half-year period). |
.
Annual Shareholder Report3
Performance data quoted represents past performance which is no guarantee of future results. Investment return and principal value will fluctuate so that an investor's shares, when redeemed, may be worth more or less than their original cost. Mutual fund performance changes over time and current performance may be lower or higher than what is stated. For current to the most recent month-end performance and after-tax returns, visit FederatedInvestors.com or call 1-800-341-7400.
Management's Discussion of Fund Performance
The Fund's total return for the fiscal year ended November 30, 2010, was -0.47%. The total return of the MSCI EAFE High Dividend Yield Index1 was -4.79% for the same period. The Fund's total return for the fiscal year reflected actual cash flows, transaction costs and other expenses, which were not reflected in the total return of the benchmarks.
Market Overview
The fiscal year was a choppy environment for global equity stocks as investors attempted to navigate through a muted economic and financial recovery. The onset of the fiscal year ushered in expectations of a broadening global recovery, aided by a factory sector that began to rebuild inventories, a consumer who appeared to be loosening his grip on his wallet and a labor market that appeared on the verge of expanding again. While choppy economic reports in January and February offered setbacks, March brought clearer signs of a broad recovery that was gaining some steam.
Much of this optimism came undone as economic news first fueled, then tempered, a rally in global equities. Where the first quarter offered support, the second quarter was downright abysmal. May's fears of spreading sovereign contagion in Europe were supplanted with June's fears of a potential double dip. The stock markets pulled off June's lows, not so much on any significant improvement in economic fundamentals but on what was shaping up as another solid quarter for corporate earnings and guidance. If anything, the economic news was worse than expected, manufacturing appeared to slow and employment data still reflected businesses' hesitancy to hire.
| 1 | The MSCI EAFE High Dividend Yield Index is a free float-adjusted market capitalization index designed to measure the performance of securities that offer a meaningfully higher than average dividend yield in the developed markets comprising the MSCI EAFE Index. Investments cannot be made directly in an index. |
Annual Shareholder Report4
The third quarter proved to be no less volatile. Europe's sovereign debt crisis appeared to be easing, with both bank and sovereign-debt spreads easing. Major equity indexes posted their best September – typically a difficult month – in seven decades, following their worst August in nine years. Overall, however, the bulk of news coming out of most reports was indicative of sub-par growth for this stage of recovery and the still-soft economic data was simply strong enough to ease fears of a double dip.
We ended the fiscal year with the S&P 500 Index2 posting its best October in seven years and the MSCI EAFE3 its best in four. The rally, which built off September's strong gains, defied not only what seasonally are two of the weakest trading months of the year but also much of the underlying economic data. We closed out the fiscal year, with a notable retracement in overseas markets; the European Union can't seem to shake its sovereign debt woes despite a new bailout package for Ireland and other member countries. An inflationary spike in China has prompted fears that the Asian giant may act to curtail growth and cool global growth. While year-end reports suggested the economy's summer slowdown was a soft patch and not something worse, i.e., the precursor to a double-dip recession, they hardly reflected a global economy that was firing on all cylinders.
Fund Performance
With our investments in the dividend-producing segment of the market and our low beta4 of 0.84, the Fund's short-term performance generally does not move in lock-step with broad market indicators. Performance in fiscal year 2010 was no exception, as investors first dismissed the merits of a dividend-based style, and then embraced them.5
| 2 | The S&P 500 Index is an unmanaged capitalization-weighted index of 500 stocks designed to measure the performance of the broad domestic economy through changes in the aggregate market value of 500 stocks representing all major industries. Investments cannot be made in an index. |
| 3 | The MSCI EAFE Index is an unmanaged market capitalization index comprising 22 of the 48 countries in the MSCI universe and representing the developed world outside of North America. Investments cannot be made in an index. |
| 4 | Beta is a measure of the volatility, or systematic risk, of a security or portfolio in comparison to the market as a whole. A beta of less than one means that the security will be less volatile than the market. A beta of greater than one indicates that the security's price will be more volatile than the market. The beta is since inception 6/4/2008 through 11/30/2010 versus the MSCI EAFE. |
| 5 | There are no guarantees that dividend-paying stocks will continue to pay dividends. In addition, dividend paying stocks may not experience the same capital appreciation potential as non-dividend paying stocks. |
Annual Shareholder Report5
From a country perspective, the Fund gained most notably from investing in Canada, Mexico, and Brazil, countries not represented in the benchmark.6 Fund holdings within Canada that did particularly well included Telus Corp. and Riocan REIT, with returns of 51.18% and 30.21% respectively. Kimberly Clark de Mexico advanced 53.53% and our holdings within Brazil produced an average 45.68% total return. The Fund benefited further from an underweight position in Spain, a country that declined by 28.14% in the benchmark.
From a sector perspective, the leading contributor to outperformance was an overweight position coupled with positive stock selection within Consumer Staples, the highest returning sector in the period. In addition to the aforementioned Kimberly Clark de Mexico, we saw tobacco names, Cia Souza Cruz and British American Tobacco, each post compelling returns of 26% or higher. The Fund benefited further from positive stock selection within Financials and Telecomm Services. Where financial stocks within the benchmark declined by 10.25%, our holdings, in contrast, advanced by 1.35%. Similarly, our Telecomm Services holdings outperformed those in the benchmark by 7.01% in the period.
In contrast, poor stock selection within Germany was the leading contributor to underperformance. Laggards here included electric utility holdings, E.On AG and RWE AG, which posted returns of -17.87% and -18.16% respectively. Our lack of exposure to Hong Kong and Sweden also contributed negatively as the countries posted returns of 25.23% and 15.12% respectively. From a sector perspective, the primary contributors to underperformance were a lack of exposure to the Industrials and Materials sectors, which advanced 11.98% and 14.14%, respectively, in the Benchmark.
Regardless of market preferences, we continued our focus on companies that offer high yield and the potential for dividend growth over time. To this end, the Fund finished the period with a weighted median 6.11% yield.7 This compares to a 5.28% yield for the Benchmark.
| 6 | International investing special risks including currency risk, political risks and differences in auditing and other financial standards. |
| 7 | A weighted median dividend yield is a weighted average of the dividends of all the stocks in a portfolio. As of November 30, 2010, the 30-Day SEC yield was 4.52% for Institutional Shares. In the absence of temporary expense waivers or reimbursements the 30-Day SEC yield would have been 1.38%. The weighted median yield is 6.11%. |
Annual Shareholder Report6
GROWTH OF A $10,000 INVESTMENT – INSTITUTIONAL SHARES
The graph below illustrates the hypothetical investment of $10,0001 in Federated International Strategic Value Dividend Fund (Institutional Shares) (the “Fund”) from June 4, 2008 (start of performance) to November 30, 2010, compared to the MSCI EAFE High Dividend Yield Index (MSCI HDY)2 and the Morningstar Foreign Large Value Funds Category Average (MFLVFCA).2
| Average Annual Total Returns for the Period Ended 11/30/2010 | |
| 1 Year | -0.47% |
| Start of Performance (6/4/2008) | -10.06% |
Performance data quoted represents past performance which is no guarantee of future results. Investment return and principal value will fluctuate so that an investor's shares, when redeemed, may be worth more or less than their original cost. Mutual fund performance changes over time and current performance may be lower or higher than what is stated. For current to the most recent month-end performance and after-tax returns, visit FederatedInvestors.com or call 1-800-341-7400. Returns shown do not reflect the deduction of taxes that a shareholder would pay on Fund distributions or the redemption of Fund shares. Mutual funds are not obligations of or guaranteed by any bank and are not federally insured.
Annual Shareholder Report
7
| 1 | Represents a hypothetical investment of $10,000 in the Fund. The Fund's performance assumes the reinvestment of all dividends and distributions. The MSCI HDY and the MFLVFCA have been adjusted to reflect reinvestment of dividends on securities in the index and average. |
| 2 | The MSCI HDY and the MFLVFCA are not adjusted to reflect sales charges, expenses or other fees that the Securities and Exchange Commission (SEC) requires to be reflected in the Fund's performance. The MSCI HDY represents the components of the MSCI Europe, Australasia and Far East Index (MSCI EAFE), is a free float-adjusted market capitalization index that is designed to measure the equity market performance of developed markets, excluding the US & Canada. As of May 27, 2010 the MSCI EAFE Index consisted of the following 22 developed market country indices: Australia, Austria, Belgium, Denmark, Finland, France, Germany, Greece, Hong Kong, Ireland, Israel, Italy, Japan, the Netherlands, New Zealand, Norway, Portugal, Singapore, Spain, Sweden, Switzerland, and the United Kingdom. The MSCI HDY, however, only includes securities which have a dividend yield that is at least 30% higher than its relative parent index, the MSCI EAFE. Only securities with a reasonable payout and a non-negative, five-year DPS growth rate are eligible for inclusion in the MSCI HDY. The MFLVFCA includes foreign large-value portfolios that invest mainly in big international stocks that are less expensive or growing more slowly than other large cap stocks. Most of these portfolios divide their assets among a dozen or more developed markets, including Japan, Britain, France and Germany. These portfolios primarily invest in stocks that have market caps in the top 70% of each economically integrated market (such as Europe or Asia ex-Japan). Value is defined based on low valuations (low-price ratios and high-dividend yields) and slow growth (low growth rates for earnings, sales, book value and cash flow). These portfolios typically will have less than 20% of assets invested in U.S. stocks. The index is unmanaged and, unlike the Fund, is not affected by cash flows. It is not possible to invest directly in an index or an average. |
| | Copyright 2009 Morningstar, Inc. All Rights Reserved. The information contained herein: (1) is proprietary to Morningstar and/or its content providers; (2) may not be copied or distributed; and (3) is not warranted to be accurate, complete or timely. Neither Morningstar nor its content providers are responsible for any damages or losses arising from any use of this information. Past performance is no guarantee of future results. |
Annual Shareholder Report8
Portfolio of Investments Summary Tables (unaudited)
At November 30, 2010, the Fund's portfolio composition1 was as follows:
| Country | Percentage of
Total Net Assets |
| United Kingdom | 30.1% |
| France | 13.4% |
| Australia | 13.1% |
| Canada | 10.2% |
| Spain | 5.7% |
| Singapore | 5.1% |
| Brazil | 3.0% |
| Belgium | 2.8% |
| Italy | 2.8% |
| Netherlands | 2.5% |
| Germany | 2.1% |
| Portugal | 1.8% |
| Norway | 1.7% |
| Taiwan | 1.1% |
| Austria | 1.0% |
| Japan | 0.9% |
| Switzerland | 0.9% |
| Cash Equivalents2 | 0.4% |
| Other Assets and Liabilities — Net3 | 1.4% |
| TOTAL | 100.0% |
| 1 | Country allocations are based primarily on the country in which a company is incorporated. However, the Fund's adviser may allocate a company to a country based on other factors such as location of the company's principal office, the location of the principal trading market for the company's securities or the country where a majority of the company's revenues are derived. |
| 2 | Cash Equivalents include any investments in money market mutual funds and/or overnight repurchase agreements. |
| 3 | Assets, other than investments in securities, less liabilities. See Statement of Assets and Liabilities. |
Annual Shareholder Report
9
At November 30, 2010, the Fund's sector classification composition4 was as follows:| Sector Classification | Percentage of
Total Net Assets |
| Telecommunication Services | 21.2% |
| Consumer Staples | 15.8% |
| Financials | 15.6% |
| Energy | 14.1% |
| Utilities | 13.3% |
| Health Care | 8.2% |
| Consumer Discretionary | 6.3% |
| Information Technology | 3.7% |
| Cash Equivalents2 | 0.4% |
| Other Assets and Liabilities — Net3 | 1.4% |
| TOTAL | 100.0% |
| 4 | Except for Cash Equivalents and Other Assets and Liabilities, sector classifications are based upon, and individual securities assigned to, the classifications of the Global Industry Classification Standard (GICS) except that the Adviser assigns a classification to securities not classified by the GICS and to securities for which the Adviser does not have access to the classification made by the GICS. |
Annual Shareholder Report10
Portfolio of Investments
November 30, 2010
| Shares | | | Value in
U.S. Dollars |
| | COMMON STOCKS – 98.2% | |
| | Banks – 8.5% | |
| 7,000 | | Australia & New Zealand Banking Group, Melbourne | 152,037 |
| 22,900 | | Banco Do Brasil SA | 439,409 |
| 55,700 | | Banco Santander, SA | 527,800 |
| 6,700 | | Bank of Montreal | 392,908 |
| 28,000 | | DBS Group Holdings Ltd. | 296,891 |
| 41,000 | | National Australia Bank Ltd., Melbourne | 921,550 |
| 15,000 | | Westpac Banking Corp. Ltd., Sydney | 307,247 |
| | TOTAL | 3,037,842 |
| | Energy – 14.1% | |
| 31,400 | | Crescent Point Energy Corp. | 1,268,480 |
| 9,100 | | ENI SpA | 183,090 |
| 32,280 | | Repsol YPF SA | 778,522 |
| 33,883 | | Royal Dutch Shell PLC, Class A | 1,020,336 |
| 31,205 | | Statoil ASA | 618,343 |
| 23,912 | | Total SA | 1,158,220 |
| | TOTAL | 5,026,991 |
| | Food & Staples Retailing – 2.1% | |
| 192,500 | | Metcash Ltd. | 769,412 |
| | Food, Beverage & Tobacco – 13.6% | |
| 18,215 | | British American Tobacco PLC | 660,289 |
| 17,210 | | Coca-Cola Amatil Ltd. | 183,763 |
| 17,211 | | Diageo PLC | 306,258 |
| 142,485 | | Foster's Group Ltd. | 771,631 |
| 299,552 | | Goodman Fielder Ltd. | 394,791 |
| 21,355 | | Imperial Tobacco Group PLC | 626,466 |
| 14,300 | | SABMiller PLC | 452,421 |
| 64,700 | | Tate & Lyle | 513,252 |
| 34,649 | | Unilever PLC | 957,710 |
| | TOTAL | 4,866,581 |
| | Health Care Equipment & Services – 0.9% | |
| 27,060 | | Sonic Healthcare Ltd. | 306,057 |
| | Insurance – 3.7% | |
| 1,675 | | Muenchener Rueckversicherungs-Gesellschaft AG | 232,643 |
| 7,100 | | QBE Insurance Group Ltd. | 114,534 |
Annual Shareholder Report11
| Shares | | | Value in
U.S. Dollars |
| 363,700 | | Royal & Sun Alliance Insurance Group PLC | 679,426 |
| 1,400 | | Zurich Financial Services AG | 311,483 |
| | TOTAL | 1,338,086 |
| | Media – 6.4% | |
| 8,900 | | Pearson PLC | 128,191 |
| 22,600 | | Shaw Communications, Inc., Class B | 452,859 |
| 157,000 | | Singapore Press Holdings Ltd. | 498,224 |
| 36,066 | | Vivendi SA | 879,897 |
| 15,738 | | Wolters Kluwer NV | 311,946 |
| | TOTAL | 2,271,117 |
| | Pharmaceuticals, Biotechnology & Life Sciences – 7.4% | |
| 11,927 | | AstraZeneca PLC | 555,721 |
| 9,400 | | Eisai Co. Ltd. | 323,367 |
| 45,543 | | GlaxoSmithKline PLC | 858,579 |
| 14,953 | | Sanofi-Aventis | 904,106 |
| | TOTAL | 2,641,773 |
| | Real Estate – 3.3% | |
| 56,600 | | RioCan Real Estate Investment Trust | 1,188,735 |
| | Software & Services – 1.2% | |
| 32,300 | | Redecard SA | 421,034 |
| | Technology Hardware & Equipment – 2.5% | |
| 10,351 | | Neopost SA | 912,850 |
| | Telecommunication Services – 21.2% | |
| 19,048 | | Belgacom | 644,464 |
| 793,300 | 1 | Cable & Wireless Communications PLC | 550,953 |
| 164,818 | | Chunghwa Telecom Co. Ltd. | 400,116 |
| 40,502 | | Deutsche Telekom AG, Class REG | 518,692 |
| 41,842 | | Koninklijke KPN NV | 596,629 |
| 6,175 | | Mobistar SA | 359,413 |
| 51,775 | | Portugal Telecom SGPS SA | 657,482 |
| 201,385 | | Singapore Telecom Ltd. | 472,824 |
| 272,000 | | StarHub Ltd. | 541,796 |
| 7,700 | | TELUS Corp. | 335,138 |
| 33,735 | | Telefonica SA | 717,714 |
| 26,250 | | Telekom Austria AG | 364,590 |
| 277,515 | | Telstra Corp. Ltd. | 747,455 |
Annual Shareholder Report12
| Shares | | | Value in
U.S. Dollars |
| 262,325 | | Vodafone Group PLC | 655,913 |
| | TOTAL | 7,563,179 |
| | Utilities – 13.3% | |
| 58,075 | | A2A SpA | 74,404 |
| 8,630 | | CPFL Energia SA | 199,820 |
| 28,161 | | GDF Suez | 933,965 |
| 139,667 | | National Grid PLC | 1,233,951 |
| 52,700 | | Scottish & Southern Energy PLC | 918,088 |
| 182,100 | | Terna SpA | 746,354 |
| 69,270 | | United Utilities Group PLC | 642,705 |
| | TOTAL | 4,749,287 |
| | TOTAL COMMON STOCKS
(IDENTIFIED COST $36,333,521) | 35,092,944 |
| | MUTUAL FUND – 0.4% | |
| 134,360 | 2,3 | Federated Prime Value Obligations Fund, Institutional Shares, 0.21%
(AT NET ASSET VALUE) | 134,360 |
| | TOTAL INVESTMENTS — 98.6%
(IDENTIFIED COST $36,467,881)4 | 35,227,304 |
| | OTHER ASSETS AND LIABILITIES - NET — 1.4%5 | 499,094 |
| | TOTAL NET ASSETS — 100% | $35,726,398 |
| 1 | Non-income producing security. |
| 2 | Affiliated company. |
| 3 | 7-Day net yield. |
| 4 | Also represents cost for federal tax purposes. |
| 5 | Assets, other than investments in securities, less liabilities. See Statement of Assets and Liabilities. |
Note: The categories of investments are shown as a percentage of total net assets at November 30, 2010.
Various inputs are used in determining the value of the Fund's investments. These inputs are summarized in the three broad levels listed below:
Level 1 — quoted prices in active markets for identical securities
Level 2 — other significant observable inputs (including quoted prices for similar securities, interest rates, prepayment speeds, credit risk, etc.)
Level 3 — significant unobservable inputs (including the Fund's own assumptions in determining the fair value of investments)
The inputs or methodology used for valuing securities are not an indication of the risk associated with investing in those securities.
As of November 30, 2010, all investments of the Fund utilized Level 1 inputs in valuing the Fund's assets carried at fair value.
See Notes which are an integral part of the Financial Statements
Annual Shareholder Report13
Statement of Assets and Liabilities
November 30, 2010
| Assets: | | |
| Total investments in securities, at value including $134,360 of investments in an affiliated issuer (Note 5) (identified cost $36,467,881) | | $35,227,304 |
| Cash denominated in foreign currencies (identified cost $301,063) | | 296,696 |
| Income receivable | | 128,520 |
| Receivable for shares sold | | 153,054 |
| TOTAL ASSETS | | 35,805,574 |
| Liabilities: | | |
| Payable for shares redeemed | $10,251 | |
| Payable for custodian fees | 4,595 | |
| Payable for transfer and dividend disbursing agent fees and expenses | 7,878 | |
| Payable for Directors'/Trustees' fees | 101 | |
| Payable for auditing fees | 28,000 | |
| Payable for portfolio accounting fees | 10,681 | |
| Payable for distribution services fee (Note 5) | 1,915 | |
| Payable for shareholder services fee (Note 5) | 4,853 | |
| Payable for share registration costs | 2,420 | |
| Payable for printing and postage | 1,297 | |
| Payable for insurance premiums | 4,321 | |
| Accrued expenses | 2,864 | |
| TOTAL LIABILITIES | | 79,176 |
| Net assets for 10,307,168 shares outstanding | | $35,726,398 |
| Net Assets Consist of: | | |
| Paid-in capital | | $36,816,634 |
| Net unrealized depreciation of investments and translation of assets and liabilities in foreign currency | | (1,247,199) |
| Accumulated net realized gain on investments and foreign currency transactions | | 50,002 |
| Undistributed net investment income | | 106,961 |
| TOTAL NET ASSETS | | $35,726,398 |
Annual Shareholder Report14
Statement of Assets and Liabilities — continued| Net Asset Value, Offering Price and Redemption Proceeds Per Share | | |
| Class A Shares: | | |
| Net asset value per share ($19,059,734 ÷ 5,500,270 shares outstanding), no par value, unlimited shares authorized | | $3.47 |
| Offering price per share (100/94.50 of $3.47) | | $3.67 |
| Redemption proceeds per share (98.00/100 of $3.47) | | $3.40 |
| Class C Shares: | | |
| Net asset value per share ($3,022,467 ÷ 873,725 shares outstanding), no par value, unlimited shares authorized | | $3.46 |
| Offering price per share | | $3.46 |
| Redemption proceeds per share (97.00/100 of $3.46) | | $3.36 |
| Institutional Shares: | | |
| Net asset value per share ($13,644,197 ÷ 3,933,173 shares outstanding), no par value, unlimited shares authorized | | $3.47 |
| Offering price per share | | $3.47 |
| Redemption proceeds per share (98.00/100 of $3.47) | | $3.40 |
See Notes which are an integral part of the Financial Statements
Annual Shareholder Report15
Statement of Operations
Year Ended November 30, 2010
| Investment Income: | | | |
| Dividends (including $1,008 received from an affiliated issuer (Note 5) and net of foreign taxes withheld of $96,659) | | | $981,064 |
| Expenses: | | | |
| Investment adviser fee (Note 5) | | $131,382 | |
| Administrative personnel and services fee (Note 5) | | 230,000 | |
| Custodian fees | | 26,832 | |
| Transfer and dividend disbursing agent fees and expenses | | 50,814 | |
| Directors'/Trustees' fees | | 777 | |
| Auditing fees | | 28,048 | |
| Legal fees | | 5,308 | |
| Portfolio accounting fees | | 75,202 | |
| Distribution services fee — Class C Shares (Note 5) | | 16,575 | |
| Shareholder services fee — Class A Shares (Note 5) | | 7,960 | |
| Shareholder services fee — Class C Shares (Note 5) | | 5,262 | |
| Share registration costs | | 56,253 | |
| Printing and postage | | 32,342 | |
| Insurance premiums | | 4,300 | |
| Miscellaneous | | 7,525 | |
| TOTAL EXPENSES | | 678,580 | |
Annual Shareholder Report16
Statement of Operations — continued| Waivers, Reimbursements and Reduction: | | | |
| Waiver/reimbursement of investment adviser fee (Note 5) | $(131,382) | | |
| Waiver of administrative personnel and services fee (Note 5) | (44,825) | | |
| Reimbursement of shareholder services fee — Class A Shares (Note 5) | (215) | | |
| Reimbursement of other operating expenses (Note 5) | (340,336) | | |
| Fees paid indirectly from directed brokerage arrangements (Note 6) | (370) | | |
| TOTAL WAIVERS, REIMBURSEMENTS AND REDUCTION | | $(517,128) | |
| Net expenses | | | $161,452 |
| Net investment income | | | 819,612 |
| Realized and Unrealized Gain (Loss) on Investments and Foreign Currency Transactions: | | | |
| Net realized gain on investments and foreign currency transactions | | | 14,543 |
| Net change in unrealized appreciation of investments and translation of assets and liabilities in foreign currency | | | (2,359,503) |
| Net realized and unrealized loss on investments and foreign currency transactions | | | (2,344,960) |
| Change in net assets resulting from operations | | | $(1,525,348) |
See Notes which are an integral part of the Financial Statements
Annual Shareholder Report17
Statement of Changes in Net Assets
| Year Ended November 30 | 2010 | 2009 |
| Increase (Decrease) in Net Assets | | |
| Operations: | | |
| Net investment income | $819,612 | $178,239 |
| Net realized gain on investments and foreign currency transactions | 14,543 | 76,576 |
| Net change in unrealized appreciation/depreciation of investments and translation of assets and liabilities in foreign currency | (2,359,503) | 1,384,767 |
| CHANGE IN NET ASSETS RESULTING FROM OPERATIONS | (1,525,348) | 1,639,582 |
| Distributions to Shareholders: | | |
| Distributions from net investment income | | |
| Class A Shares | (89,198) | (8,101) |
| Class C Shares | (71,042) | (14,482) |
| Institutional Shares | (520,132) | (97,130) |
| CHANGE IN NET ASSETS RESULTING FROM DISTRIBUTIONS TO SHAREHOLDERS | (680,372) | (119,713) |
| Share Transactions: | | |
| Proceeds from sale of shares | 28,372,228 | 8,659,040 |
| Net asset value of shares issued to shareholders in payment of distributions declared | 647,027 | 85,984 |
| Cost of shares redeemed | (2,003,880) | (142,223) |
| CHANGE IN NET ASSETS RESULTING FROM SHARE TRANSACTIONS | 27,015,375 | 8,602,801 |
| Redemption Fees | 338 | 689 |
| Change in net assets | 24,809,993 | 10,123,359 |
| Net Assets: | | |
| Beginning of period | 10,916,405 | 793,046 |
| End of period (including undistributed net investment income of $106,961 and $47,911, respectively) | $35,726,398 | $10,916,405 |
See Notes which are an integral part of the Financial Statements
Annual Shareholder Report18
Notes to Financial Statements
November 30, 2010
1. ORGANIZATION
Federated Equity Funds (the “Trust”) is registered under the Investment Company Act of 1940, as amended (the “Act”), as an open-end management investment company. The Trust consists of 12 diversifed portfolios. The financial statements included herein are only those of Federated International Strategic Value Dividend Fund (formerly, Federated International Strategic Value Fund) (the “Fund”), a diversified portfolio. The financial statements of the other portfolios are presented separately. The assets of each portfolio are segregated and a shareholder's interest is limited to the portfolio in which shares are held. Each portfolio pays its own expenses. The Fund offers three classes of shares: Class A Shares, Class C Shares and Institutional Shares. All shares of the Fund have equal rights with respect to voting, except on class-specific matters.The financial highlights of the Class A Shares and Class C Shares are presented separately. The investment objective of the Fund is to provide income and long-term capital appreciation.
2. SIGNIFICANT ACCOUNTING POLICIES
The following is a summary of significant accounting policies consistently followed by the Fund in the preparation of its financial statements. These policies are in conformity with U.S. generally accepted accounting principles (GAAP).
Investment Valuation
In calculating its net asset value (NAV), the Fund generally values investments as follows:
- Equity securities listed on an exchange or traded through a regulated market system are valued at their last reported sale price or official closing price in their principal exchange or market.
- Shares of other mutual funds are valued based upon their reported NAVs.
- Fixed-income securities acquired with remaining maturities greater than 60 days are fair valued using price evaluations provided by a pricing service approved by the Board of Trustees (the “Trustees”).
- Fixed-income securities acquired with remaining maturities of 60 days or less are valued at their cost (adjusted for the accretion of any discount or amortization of any premium).
- Derivative contracts listed on exchanges are valued at their reported settlement or closing price.
- Over-the-counter (OTC) derivative contracts are fair valued using price evaluations provided by a pricing service approved by the Trustees.
If the Fund cannot obtain a price or price evaluation from a pricing service for an investment, the Fund may attempt to value the investment based upon the mean of bid and asked quotations or fair value the investment based on price evaluations, from one or more dealers. If any price, quotation, price evaluation or other pricing source is not readily available when the NAV is calculated, the Fund uses the fair value of the investment determined in accordance with the procedures described below. There can be no assurance that the Fund could purchase or sell an investment at the price used to calculate the Fund's NAV.
Annual Shareholder Report
19
Fair Valuation and Significant Events ProceduresThe Trustees have authorized the use of pricing services to provide evaluations of the current fair value of certain investments for purposes of calculating the NAV. Factors considered by pricing services in evaluating an investment include the yields or prices of investments of comparable quality, coupon, maturity, call rights and other potential prepayments, terms and type, reported transactions, indications as to values from dealers and general market conditions. Some pricing services provide a single price evaluation reflecting the bid-side of the market for an investment (a “bid” evaluation). Other pricing services offer both bid evaluations and price evaluations indicative of a price between the prices bid and asked for the investment (a “mid” evaluation). The Fund normally uses bid evaluations for U.S. Treasury and Agency securities and mortgage-backed securities. The Fund normally uses mid evaluations for other types of fixed-income securities and OTC derivative contracts. In the event that market quotations and price evaluations are not available for an investment, the fair value of the investment is determined in accordance with procedures adopted by the Trustees.
The Trustees also have adopted procedures requiring an investment to be priced at its fair value whenever the Adviser determines that a significant event affecting the value of the investment has occurred between the time as of which the price of the investment would otherwise be determined and the time as of which the NAV is computed. An event is considered significant if there is both an affirmative expectation that the investment's value will change in response to the event and a reasonable basis for quantifying the resulting change in value. Examples of significant events that may occur after the close of the principal market on which a security is traded, or after the time of a price evaluation provided by a pricing service or a dealer, include:
- With respect to securities traded in foreign markets, significant trends in U.S. equity markets or in the trading of foreign securities index futures or options contracts;
- With respect to price evaluations of fixed-income securities determined before the close of regular trading on the NYSE, actions by the Federal Reserve Open Market Committee and other significant trends in U.S. fixed-income markets;
- Political or other developments affecting the economy or markets in which an issuer conducts its operations or its securities are traded; and
- Announcements concerning matters such as acquisitions, recapitalizations, litigation developments, a natural disaster affecting the issuer's operations or regulatory changes or market developments affecting the issuer's industry.
The Trustees have approved the use of a pricing service to determine the fair value of equity securities traded principally in foreign markets when the Adviser determines that there has been a significant trend in the U.S. equity markets or in index futures trading. For other significant events, the Fund may seek to obtain more current quotations or price evaluations from alternative pricing sources. If a reliable alternative pricing source is not available, the Fund will determine the fair value of the investment using another method approved by the Trustees.
Annual Shareholder Report
20
Repurchase AgreementsIt is the policy of the Fund to require the other party to a repurchase agreement to transfer to the Fund's custodian or sub-custodian eligible securities or cash with a market value (after transaction costs) at least equal to the repurchase price to be paid under the repurchase agreement. The eligible securities are transferred to accounts with the custodian or sub-custodian in which the Fund holds a “securities entitlement” and exercises “control” as those terms are defined in the Uniform Commercial Code. The Fund has established procedures for monitoring the market value of the transferred securities and requiring the transfer of additional eligible securities if necessary to equal at least the repurchase price. These procedures also allow the other party to require securities to be transferred from the account to the extent that their market value exceeds the repurchase price or in exchange for other eligible securities of equivalent market value.
The insolvency of the other party or other failure to repurchase the securities may delay the disposition of the underlying securities or cause the Fund to receive less than the full repurchase price. Under the terms of the repurchase agreement, any amounts received by the Fund in excess of the repurchase price and related transaction costs must be remitted to the other party.
The Fund may enter into repurchase agreements in which eligible securities are transferred into joint trading accounts maintained by the custodian or sub-custodian for investment companies and other clients advised by the Fund's Adviser and its affiliates. The Fund will participate on a pro rata basis with the other investment companies and clients in its share of the securities transferred under such repurchase agreements and in its share of proceeds from any repurchase or other disposition of such securities.
Investment Income, Gains and Losses, Expenses and Distributions
Investment transactions are accounted for on a trade-date basis. Realized gains and losses from investment transactions are recorded on an identified-cost basis. Interest income and expenses are accrued daily. Dividend income and distributions to shareholders are recorded on the ex-dividend date. Foreign dividends are recorded on the ex-dividend date or when the Fund is informed of the ex-dividend date. Distributions of net investment income are declared and paid quarterly. Non-cash dividends included in dividend income, if any, are recorded at fair value. Investment income, realized and unrealized gains and losses, and certain fund-level expenses are allocated to each class based on relative average daily net assets, except that each class may bear certain expenses unique to that class such as distribution services and shareholder services fees. Dividends are declared separately for each class. No class has preferential dividend rights; differences in per share dividend rates are generally due to differences in separate class expenses.
Premium and Discount Amortization
All premiums and discounts on fixed-income securities are amortized/accreted for financial statement purposes.
Federal Taxes
It is the Fund's policy to comply with the Subchapter M provision of the Internal Revenue Code (the “Code”) and to distribute to shareholders each year substantially all of its income. Accordingly, no provision for federal income tax is necessary. As of and during the year ended November 30, 2010, the Fund did not have a liability for any uncertain tax positions. The Fund Annual Shareholder Report
21
recognizes interest and penalties, if any, related to tax liabilities as income tax expense in the Statement of Operations. As of November 30, 2010, tax years 2008 through 2010 remain subject to examination by the Fund's major tax jurisdictions, which include the United States of America and the Commonwealth of Massachusetts.The Fund may be subject to taxes imposed by governments of countries in which it invests. Such taxes are generally based on either income or gains earned or repatriated. The Fund accrues and applies such taxes to net investment income, net realized gains and net unrealized gains as income and/or gains are earned.
When-Issued and Delayed Delivery Transactions
The Fund may engage in when-issued or delayed delivery transactions. The Fund records when-issued securities on the trade date and maintains security positions such that sufficient liquid assets will be available to make payment for the securities purchased. Securities purchased on a when-issued or delayed delivery basis are marked to market daily and begin earning interest on the settlement date. Losses may occur on these transactions due to changes in market conditions or the failure of counterparties to perform under the contract.
Foreign Exchange Contracts
The Fund may enter into foreign exchange contracts for the delayed delivery of securities or foreign currency exchange transactions. The Fund may enter into foreign exchange contracts to protect assets against adverse changes in foreign currency exchange rates or exchange control regulations. Purchased contracts are used to acquire exposure to foreign currencies, whereas, contracts to sell are used to hedge the Fund's securities against currency fluctuations. Risks may arise upon entering into these transactions from the potential inability of counterparties to meet the terms of their commitments and from unanticipated movements in security prices or foreign exchange rates. The foreign exchange contracts are adjusted by the daily exchange rate of the underlying currency and any gains or losses are recorded for financial statement purposes as unrealized until the settlement date.
At November 30, 2010, the Fund had no outstanding foreign exchange contracts.
Foreign Currency Translation
The accounting records of the Fund are maintained in U.S. dollars. All assets and liabilities denominated in foreign currencies (FCs) are translated into U.S. dollars based on the rates of exchange of such currencies against U.S. dollars on the date of valuation. Purchases and sales of securities, income and expenses are translated at the rate of exchange quoted on the respective date that such transactions are recorded. The Fund does not isolate that portion of the results of operations resulting from changes in foreign exchange rates on investments from the fluctuations arising from changes in market prices of securities held. Such fluctuations are included with the net realized and unrealized gain or loss from investments.
Reported net realized foreign exchange gains or losses arise from sales of portfolio securities, sales and maturities of short-term securities, sales of FCs, currency gains or losses realized between the trade and settlement dates on securities transactions, the difference between the amounts of dividends, interest and foreign withholding taxes recorded on the Fund's books, and the U.S. dollar equivalent of the amounts actually received or paid. Net unrealized foreign exchange gains and losses arise from changes in the value of assets and liabilities other than investments in securities at fiscal year end, resulting from changes in the exchange rate.
Annual Shareholder Report
22
Additional Disclosure Related to Derivative InstrumentsThe Effect of Derivative Instruments on the Statement of Operations for the Year Ended November 30, 2010
| Amount of Realized Gain or (Loss) on Derivatives Recognized in Income |
| Forward
Currency
Contracts |
| Foreign exchange contracts | $4,449 |
| Change in Unrealized Appreciation or (Depreciation) on Derivatives Recognized in Income |
| Forward
Currency
Contracts |
| Foreign exchange contracts | $(882) |
Other
The preparation of financial statements in conformity with GAAP requires management to make estimates and assumptions that affect the amounts of assets, liabilities, expenses and revenues reported in the financial statements. Actual results could differ from those estimated.
3. SHARES OF BENEFICIAL INTEREST
The following tables summarize share activity:
| Year Ended November 30 | 2010 | 2009 |
| Class A Shares: | Shares | Amount | Shares | Amount |
| Shares sold | 5,312,764 | $19,769,085 | 315,677 | $1,083,361 |
| Shares issued to shareholders in payment of distributions declared | 25,281 | 86,562 | 2,595 | 8,098 |
| Shares redeemed | (135,574) | (469,779) | (24,195) | (81,799) |
NET CHANGE RESULTING
FROM CLASS A SHARE TRANSACTIONS | 5,202,471 | $19,385,868 | 294,077 | $1,009,660 |
| Year Ended November 30 | 2010 | 2009 |
| Class C Shares: | Shares | Amount | Shares | Amount |
| Shares sold | 833,485 | $3,017,987 | 347,362 | $1,103,148 |
| Shares issued to shareholders in payment of distributions declared | 20,665 | 70,136 | 4,597 | 14,479 |
| Shares redeemed | (322,191) | (1,162,934) | (10,213) | (34,431) |
NET CHANGE RESULTING
FROM CLASS C SHARE TRANSACTIONS | 531,959 | $1,925,189 | 341,746 | $1,083,196 |
Annual Shareholder Report23
| Year Ended November 30 | 2010 | 2009 |
| Institutional Shares: | Shares | Amount | Shares | Amount |
| Shares sold | 1,534,052 | $5,585,156 | 2,088,603 | $6,472,531 |
| Shares issued to shareholders in payment of distributions declared | 143,340 | 490,329 | 20,201 | 63,407 |
| Shares redeemed | (101,658) | (371,167) | (7,575) | (25,993) |
NET CHANGE RESULTING
FROM INSTITUTIONAL
SHARE TRANSACTIONS | 1,575,734 | $5,704,318 | 2,101,229 | $6,509,945 |
NET CHANGE RESULTING
FROM TOTAL FUND
SHARE TRANSACTIONS | 7,310,164 | $27,015,375 | 2,737,052 | $8,602,801 |
Redemption Fees
The Fund imposes a 2.00% redemption fee to shareholders of the Fund's Class A Shares, Class C Shares and Institutional Shares who redeem shares held for 30 days or less. Shares acquired by reinvestment of dividends or distributions of the Fund, or purchased pursuant to the Systematic Investment Program or withdrawn pursuant to the Systematic Withdrawal Program, will not be subject to the redemption fee. All redemption fees are recorded by the Fund as additions to paid-in capital. For the year ended November 30, 2010, the redemption fees for Class A Shares, Class C Shares and Institutional Shares amounted to $41, $50 and $247, respectively. For the year ended November 30, 2009, the redemption fees for Class A Shares, Class C Shares and Institutional Shares amounted to $45, $83 and $561, respectively.
4. FEDERAL TAX INFORMATION
The timing and character of income and capital gain distributions are determined in accordance with income tax regulations, which may differ from GAAP. These differences are due to differing treatments for foreign currency transactions.
For the year ended November 30, 2010, permanent differences identified and reclassified among the components of net assets were as follows:
| Increase (Decrease) |
Undistributed
Net Investment
Income (Loss) | | Accumulated
Net Realized
Gain (Loss) |
| $(80,190) | | $80,190 |
Net investment income (loss), net realized gains (losses), and net assets were not affected by this reclassification.
The tax character of distributions as reported on the Statement of Changes in Net Assets for the years ended November 30, 2010 and 2009, was as follows:
| 2010 | 2009 |
| Ordinary income | $680,372 | $119,713 |
Annual Shareholder Report
24
As of November 30, 2010, the components of distributable earnings on a tax basis were as follows:| Undistributed ordinary income1 | $120,680 |
| Undistributed long-term capital gain | $36,283 |
| Net unrealized depreciation | $(1,247,199) |
| 1 | For tax purposes, short-term capital gains are treated as ordinary income for distribution purposes. |
At November 30, 2010, the cost of investments for federal tax purposes was $36,467,881. The net unrealized depreciation of investments for federal tax purposes excluding any unrealized appreciation resulting from changes in foreign currency exchange rates was $1,240,577. This consists of net unrealized appreciation from investments for those securities having an excess of value over cost of $792,311 and net unrealized depreciation from investments for those securities having an excess of cost over value of $2,032,888.
The Fund used capital loss carryforwards of $44,731 to offset taxable capital gains realized during the year ended November 30, 2010.
5. INVESTMENT ADVISER FEE AND OTHER TRANSACTIONS WITH AFFILIATES
Investment Adviser Fee
Federated Equity Management Company of Pennsylvania is the Fund's investment adviser (the “Adviser”). The advisory agreement between the Fund and the Adviser provides for an annual fee equal to 0.75% of the Fund's average daily net assets. Subject to the terms described in the Expense Limitation note, the Adviser may voluntarily choose to waive any portion of its fee and/or reimburse certain operating expenses of the Fund. For the year ended November 30, 2010, the Adviser voluntarily waived $130,811 of its fee and voluntarily reimbursed $340,336 of other operating expenses.
Administrative Fee
Federated Administrative Services (FAS), under the Administrative Services Agreement, provides the Fund with administrative personnel and services. The fee paid to FAS is based on the average aggregate daily net assets of certain Federated funds as specified below:
| Administrative Fee | Average Aggregate Daily Net Assets
of the Federated Funds |
| 0.150% | on the first $5 billion |
| 0.125% | on the next $5 billion |
| 0.100% | on the next $10 billion |
| 0.075% | on assets in excess of $20 billion |
The administrative fee received during any fiscal year shall be at least $150,000 per portfolio and $40,000 per each additional class of Shares. Subject to the terms described in the Expense Limitation note, FAS may voluntarily choose to waive any portion of its fee. For the year ended November 30, 2010, FAS waived $44,825 of its fee. The net fee paid to FAS was 1.057% of average daily net assets of the Fund. The Fund is currently being charged the minimum administrative fee; therefore the fee as a percentage of average daily net assets is greater than the amounts presented in the chart above.
Annual Shareholder Report
25
Distribution Services FeeThe Fund has adopted a Distribution Plan (the “Plan”) pursuant to Rule 12b-1 under the Act. Under the terms of the Plan, the Fund will compensate Federated Securities Corp. (FSC), the principal distributor, from the daily net assets of the Fund's Class A Shares and Class C Shares to finance activities intended to result in the sale of these shares. The Plan provides that the Fund may incur distribution expenses at the following percentages of average daily net assets annually, to compensate FSC:
| Share Class Name | Percentage of Average Daily
Net Assets of Class |
| Class A Shares | 0.05% |
| Class C Shares | 0.75% |
Subject to the terms described in the Expense Limitation note, FSC may voluntarily choose to waive any portion of its fee. When FSC receives fees, it may pay some or all of them to financial intermediaries whose customers purchase shares. For the year ended November 30, 2010, FSC retained $5,208 of fees paid by the Fund. For the year ended November 30, 2010, the Fund's Class A Shares did not incur a distribution services fee; however, it may begin to incur this fee upon approval of the Trustees.
Sales Charges
Front-end sales charges and contingent deferred sales charges (CDSC) do not represent expenses of the Fund. They are deducted from the proceeds of sales of Fund shares prior to investment or from redemption proceeds prior to remittance, as applicable. For the year ended November 30, 2010, FSC retained $8,583 in sales charges from the sale of Class A Shares. FSC also retained $1,523 of CDSC relating to redemptions of Class C Shares.
Shareholder Services Fee
The Fund may pay fees (“Service Fees”) up to 0.25% of the average daily net assets of the Fund's Class A Shares and Class C Shares to financial intermediaries or to Federated Shareholder Services Company (FSSC) for providing services to shareholders and maintaining shareholder accounts. Subject to the terms described in the Expense Limitation note, FSSC may voluntarily reimburse the Fund for Service Fees. For the year ended November 30, 2010, FSSC voluntarily reimbursed $215 of Service Fees. For the year ended November 30, 2010, FSSC did not receive any fees paid by the Fund.
Expense Limitation
The Adviser and its affiliates (which may include FSC, FAS and FSSC) have voluntarily agreed to waive their fees and/or reimburse expenses so that the total annual fund operating expenses (as shown in the financial highlights) paid by the Fund's Class A Shares, Class C Shares and Institutional Shares (after the voluntary waivers and reimbursements) will not exceed 1.00%, 1.75% and 0.75% (the “Fee Limit”), respectively, through the later of (the “Termination Date”): (a) January 31, 2012; or (b) the date of the Fund's next effective Prospectus. While the Adviser and its affiliates currently do not anticipate terminating or increasing these arrangements prior to the Termination Date, these arrangements may only be terminated or the Fee Limit increased prior to the Termination Date with the agreement of the Trustees.
Annual Shareholder Report
26
GeneralCertain Officers and Trustees of the Fund are Officers and Directors or Trustees of the above companies.
Transactions Involving Affiliated Holdings
Affiliated holdings are mutual funds which are managed by the Adviser or an affiliate of the Adviser. The Adviser has agreed to reimburse the Fund for certain investment adviser fees as a result of transactions in other affiliated mutual funds. For the year ended November 30, 2010, the Adviser reimbursed $571. Transactions involving affiliated holdings during the year ended November 30, 2010, were as follows:
| Affiliate | Balance of
Shares Held
11/30/2009 | Purchases/
Additions | Sales/
Reductions | Balance of
Shares Held
11/30/2010 | Value | Dividend
Income |
| Federated Prime Value Obligations Fund, Institutional Shares | 225,244 | 24,703,070 | 24,793,954 | 134,360 | $134,360 | $1,008 |
6. EXPENSE Reduction
The Fund directs portfolio trades to a broker that in turn pays a portion of the Fund's operating expenses. For the year ended November 30, 2010, the Fund's expenses were reduced by $370 under these arrangements.
7. Investment TRANSACTIONS
Purchases and sales of investments, excluding long-term U.S. government securities and short-term obligations, for the year ended November 30, 2010, were as follows:
| Purchases | $30,459,384 |
| Sales | $3,921,268 |
8. CONCENTRATION OF RISK
The Fund invests in securities of non-U.S. issuers. Political or economic developments may have an effect on the liquidity and volatility of portfolio securities and currency holdings.
9. LINE OF CREDIT
The Fund participates in a $100,000,000 unsecured, uncommitted revolving line of credit (LOC) agreement with PNC Bank. The LOC was made available for extraordinary or emergency purposes, primarily for financing redemption payments. Borrowings are charged interest at a rate offered to the Fund by PNC Bank at the time of the borrowing. As of November 30, 2010, there were no outstanding loans. During the year ended November 30, 2010, the Fund did not utilize the LOC.
10. INTERFUND LENDING
Pursuant to an Exemptive Order issued by the Securities and Exchange Commission, the Fund, along with other funds advised by subsidiaries of Federated Investors, Inc., may participate in an interfund lending program. This program provides an alternative credit facility allowing the Fund to borrow from other participating affiliated funds. As of November 30, 2010, there were no outstanding loans. During the year ended November 30, 2010, the program was not utilized.
Annual Shareholder Report
27
11. Legal ProceedingsSince February, 2004, Federated Investors, Inc. and related entities (collectively, “Federated”), have been named as defendants in several lawsuits that are now pending in the United States District Court for the Western District of Pennsylvania. These lawsuits have been consolidated into a single action alleging excessive advisory fees involving one of the Federated-sponsored mutual funds (“Federated Funds”). Federated and its counsel have been defending this litigation. Additional lawsuits based upon similar allegations may be filed in the future. The potential impact of these lawsuits, all of which seek monetary damages, attorneys' fees and expenses, and future potential similar suits is uncertain. Although we do not believe that these lawsuits will have a material adverse effect on the Federated Funds, there can be no assurance that these suits, ongoing adverse publicity and/or other developments resulting from the allegations in these matters will not result in increased redemptions, or reduced sales, of shares of the Federated Funds or other adverse consequences for the Federated Funds.
12. Subsequent events
Effective January 31, 2011 (the “Effective Date”), the Fund will no longer charge a redemption fee. Accordingly, no shares of the Fund redeemed after the Effective Date will be assessed a redemption fee regardless of when such shares were purchased.
Management has evaluated subsequent events through the date the financial statements were issued, and determined that no additional events have occurred that require disclosure.
13. FEDERAL TAX INFORMATION (UNAUDITED)
For the fiscal year ended November 30, 2010, 100% of total ordinary income distributions made by the Fund are qualifying dividends which may be subject to a maximum tax rate of 15%, as provided for by the Jobs and Growth Tax Relief Act of 2003. Complete information is reported in conjunction with the reporting of your distributions on Form 1099-DIV.
If the Fund meets the requirements of Section 853 of the Internal Revenue Code of 1986, as amended, the Fund will pass through to its shareholders credits for foreign taxes paid.
For the fiscal year ended November 30, 2010, the Fund derived $1,076,717 of gross income from foreign sources and paid foreign taxes of $96,475.
Annual Shareholder Report28
Report of Independent Registered Public Accounting Firm
TO THE BOARD OF TRUSTEES OF THE FEDERATED EQUITY FUNDS AND SHAREHOLDERS OF Federated InternATIONAL STRATEGIC VALUE Dividend fund:
We have audited the accompanying statement of assets and liabilities, including the portfolio of investments, of the Federated International Strategic Value Dividend Fund (the “Fund”), a portfolio of Federated Equity Funds, as of November 30, 2010, and the related statement of operations for the year then ended, the statements of changes in net assets for each of the years in the two-year period then ended, and the financial highlights for each of the years or periods in the three-year period then ended. These financial statements and financial highlights are the responsibility of the Fund's management. Our responsibility is to express an opinion on these financial statements and financial highlights based on our audits.
We conducted our audits in accordance with the standards of the Public Company Accounting Oversight Board (United States). Those standards require that we plan and perform the audit to obtain reasonable assurance about whether the financial statements and financial highlights are free of material misstatement. An audit includes examining, on a test basis, evidence supporting the amounts and disclosures in the financial statements. Our procedures included confirmation of securities owned as of November 30, 2010 by correspondence with the custodian and transfer agent. An audit also includes assessing the accounting principles used and significant estimates made by management, as well as evaluating the overall financial statement presentation. We believe that our audits provide a reasonable basis for our opinion.
In our opinion, the financial statements and financial highlights referred to above present fairly, in all material respects, the financial position of the Federated International Strategic Value Dividend Fund as of November 30, 2010 and the results of its operations for the year then ended, the changes in its net assets for each of the years in the two-year period then ended, and the financial highlights for each of the years or periods in the three-year period then ended, in conformity with U.S. generally accepted accounting principles.
Boston, Massachusetts
January 25, 2011
Annual Shareholder Report29
Board of Trustees and Trust Officers
The Board of Trustees is responsible for managing the Trust's business affairs and for exercising all the Trust's powers except those reserved for the shareholders. The following tables give information about each Trustee and the senior officers of the Fund. Where required, the tables separately list Trustees who are “interested persons” of the Fund (i.e., “Interested” Trustees) and those who are not (i.e., “Independent” Trustees). Unless otherwise noted, the address of each person listed is Federated Investors Tower, 1001 Liberty Avenue, Pittsburgh, PA 15222. The address of all Independent Trustees listed is 4000 Ericsson Drive, Warrendale, PA 15086-7561; Attention: Mutual Fund Board. As of December 31, 2010, the Trust comprised 13 portfolio(s), and the Federated Fund Family consisted of 43 investment companies (comprising 136 portfolios). Unless otherwise noted, each Officer is elected annually. Unless otherwise noted, each Trustee oversees all portfolios in the Federated Fund Family and serves for an indefinite term. The Fund's Statement of Additional Information includes additional information about Trust Trustees and is available, without charge and upon request, by calling 1-800-341-7400.
Interested Trustees Background
Name
Birth Date
Positions Held with Trust
Date Service Began | Principal Occupation(s) for Past Five Years,
Other Directorships Held and Previous Position(s) |
John F. Donahue*
Birth Date: July 28, 1924
Trustee
Began serving: April 1984 | Principal Occupations: Director or Trustee of the Federated Fund Family; Chairman and Director, Federated Investors, Inc.; Chairman of the Federated Fund Family's Executive Committee.
Previous Positions: Chairman of the Federated Fund Family; Trustee, Federated Investment Management Company; Chairman and Director, Federated Investment Counseling. |
J. Christopher Donahue*
Birth Date: April 11, 1949
President and Trustee
Began serving: January 2000 | Principal Occupations: Principal Executive Officer and President of the Federated Fund Family; Director or Trustee of some of the Funds in the Federated Fund Family; President, Chief Executive Officer and Director, Federated Investors, Inc.; Chairman and Trustee, Federated Investment Management Company; Trustee, Federated Investment Counseling; Chairman and Director, Federated Global Investment Management Corp.; Chairman, Federated Equity Management Company of Pennsylvania and Passport Research, Ltd. (investment advisory subsidiary of Federated); Trustee, Federated Shareholder Services Company; Director, Federated Services Company.
Previous Positions: President, Federated Investment Counseling; President and Chief Executive Officer, Federated Investment Management Company, Federated Global Investment Management Corp. and Passport Research, Ltd. |
| * | Family relationships and reasons for “interested” status: John F. Donahue is the father of J. Christopher Donahue; both are “interested” due to their beneficial ownership of shares of Federated Investors, Inc. and the positions they hold with Federated and its subsidiaries. |
Annual Shareholder Report30
Interested Trustees Background
Name
Birth Date
Positions Held with Trust
Date Service Began | Principal Occupation(s) for Past Five Years,
Other Directorships Held and Previous Position(s) |
Nicholas P. Constantakis, CPA
Birth Date: September 3, 1939
Trustee
Began serving: February 1998 | Principal Occupation: Director or Trustee of the Federated Fund Family.
Other Directorship Held: Director and Chairman of the Audit Committee, Michael Baker Corporation (architecture, engineering and construction services).
Previous Position: Partner, Andersen Worldwide SC.
Qualifications: Public accounting and director experience. |
John F. Cunningham
Birth Date: March 5, 1943
Trustee
Began serving: January 1999 | Principal Occupation: Director or Trustee of the Federated Fund Family.
Other Directorships Held: Chairman, President and Chief Executive Officer, Cunningham & Co., Inc. (strategic business consulting); Trustee Associate, Boston College.
Previous Positions: Director, Redgate Communications and EMC Corporation (computer storage systems); Chairman of the Board and Chief Executive Officer, Computer Consoles, Inc.; President and Chief Operating Officer, Wang Laboratories; Director, First National Bank of Boston; Director, Apollo Computer, Inc.
Qualifications: Business management and director experience. |
Maureen Lally-Green
Birth Date: July 5, 1949
Trustee
Began serving: August 2009 | Principal Occupations: Director or Trustee of the Federated Fund Family; Director, Office of Church Relations, Diocese of Pittsburgh; Adjunct Professor of Law, Duquesne University School of Law.
Other Directorships Held: Director, Auberle; Trustee, St. Francis University; Director, Ireland Institute of Pittsburgh; Director, UPMC Mercy Hospital; Regent, St. Vincent Seminary; Director, Epilepsy Foundation of Western and Central Pennsylvania; Director, Saint Thomas More Society, Allegheny County; Director, Carlow University.
Previous Position: Pennsylvania Superior Court Judge.
Qualifications: Legal and director experience. |
Peter E. Madden
Birth Date: March 16, 1942
Trustee
Began serving: November 1991 | Principal Occupation: Director or Trustee, and Chairman of the Board of Directors or Trustees, of the Federated Fund Family.
Previous Positions: Representative, Commonwealth of Massachusetts General Court; President, Chief Operating Officer and Director, State Street Bank and Trust Company and State Street Corporation (retired); Director, VISA USA and VISA International; Chairman and Director, Massachusetts Bankers Association; Director, Depository Trust Corporation; Director, The Boston Stock Exchange.
Qualifications: Business management, mutual fund services and director experience. |
Annual Shareholder Report31
Name
Birth Date
Positions Held with Trust
Date Service Began | Principal Occupation(s) for Past Five Years,
Other Directorships Held and Previous Position(s) |
Charles F. Mansfield, Jr.
Birth Date: April 10, 1945
Trustee
Began serving: January 1999 | Principal Occupations: Director or Trustee and Chairman of the Audit Committee of the Federated Fund Family; Management Consultant.
Previous Positions: Chief Executive Officer, PBTC International Bank; Partner, Arthur Young & Company (now Ernst & Young LLP); Chief Financial Officer of Retail Banking Sector, Chase Manhattan Bank; Senior Vice President, HSBC Bank USA (formerly, Marine Midland Bank); Vice President, Citibank; Assistant Professor of Banking and Finance, Frank G. Zarb School of Business, Hofstra University; Executive Vice President, DVC Group, Inc. (marketing, communications and technology).
Qualifications: Banking, business management and director experience. |
R. James Nicholson
Birth Date: February 4, 1938
Trustee
Began serving: January 2008 | Principal Occupations: Director or Trustee of the Federated Fund Family; Senior Counsel, Brownstein Hyatt Farber Schrek, P.C.; Former Secretary of the U.S. Dept. of Veterans Affairs; Former U.S. Ambassador to the Holy See; Former Chairman of the Republican National Committee.
Other Directorships Held: Director, Horatio Alger Association; Director, The Daniels Fund.
Previous Positions: Colonel, U.S. Army Reserve; Partner, Calkins, Kramer, Grimshaw and Harring, P.C.; General Counsel, Colorado Association of Housing and Building; Chairman and CEO, Nicholson Enterprises, Inc. (real estate holding company); Chairman and CEO, Renaissance Homes of Colorado.
Qualifications: Legal, government, business management and director experience. |
Thomas M. O'Neill
Birth Date: June 14, 1951
Trustee
Began serving: October 2006 | Principal Occupations: Director or Trustee of the Federated Fund Family; Sole Proprietor, Navigator Management Company (investment and strategic consulting).
Other Directorships Held: Board of Overseers, Children's Hospital of Boston; Visiting Committee on Athletics, Harvard College.
Previous Positions: Chief Executive Officer and President, Managing Director and Chief Investment Officer, Fleet Investment Advisors; President and Chief Executive Officer, Aeltus Investment Management, Inc.; General Partner, Hellman, Jordan Management Co., Boston, MA; Chief Investment Officer, The Putnam Companies, Boston, MA; Credit Analyst and Lending Officer, Fleet Bank; Director and Consultant, EZE Castle Software (investment order management software); Director, Midway Pacific (lumber).
Qualifications: Business management, mutual fund, director and investment experience. |
Annual Shareholder Report32
Name
Birth Date
Positions Held with Trust
Date Service Began | Principal Occupation(s) for Past Five Years,
Other Directorships Held and Previous Position(s) |
John S. Walsh
Birth Date: November 28, 1957
Trustee
Began serving: January 1999 | Principal Occupations: Director or Trustee of the Federated Fund Family; President and Director, Heat Wagon, Inc. (manufacturer of construction temporary heaters); President and Director, Manufacturers Products, Inc. (distributor of portable construction heaters); President, Portable Heater Parts, a division of Manufacturers Products, Inc.
Previous Position: Vice President, Walsh & Kelly, Inc.
Qualifications: Business management and director experience. |
James F. Will
Birth Date: October 12, 1938
Trustee
Began serving: April 2006 | Principal Occupations: Director or Trustee of the Federated Fund Family; formerly, Vice Chancellor and President, Saint Vincent College.
Other Directorships Held: Trustee, Saint Vincent College; Director, Alleghany Corporation; Trustee, Wheeling Jesuit University; Director, Liberty Tire Recycling.
Previous Positions: Chairman, President and Chief Executive Officer, Armco, Inc.; President and Chief Executive Officer, Cyclops Industries; President and Chief Operating Officer, Kaiser Steel Corporation.
Qualifications: Business management, education and director experience. |
OFFICERS
Name
Birth Date
Address
Positions Held with Trust
Date Service Began | Principal Occupation(s) for Past Five Years
and Previous Position(s) |
John W. McGonigle
Birth Date: October 26, 1938
Executive Vice President and Secretary
Began serving: April 1984 | Principal Occupations: Executive Vice President and Secretary of the Federated Fund Family; Vice Chairman, Executive Vice President, Secretary and Director, Federated Investors, Inc.
Previous Positions: Trustee, Federated Investment Management Company and Federated Investment Counseling; Director, Federated Global Investment Management Corp., Federated Services Company and Federated Securities Corp. |
Richard A. Novak
Birth Date: December 25, 1963
Treasurer
Began serving: January 2006 | Principal Occupations: Principal Financial Officer and Treasurer of the Federated Fund Family; Senior Vice President, Federated Administrative Services; Financial and Operations Principal for Federated Securities Corp., Edgewood Services, Inc. and Southpointe Distribution Services, Inc.
Previous Positions: Controller of Federated Investors, Inc.; Vice President, Finance of Federated Services Company; held various financial management positions within The Mercy Hospital of Pittsburgh; Auditor, Arthur Andersen & Co. |
Annual Shareholder Report33
Name
Birth Date
Address
Positions Held with Trust
Date Service Began | Principal Occupation(s) for Past Five Years
and Previous Position(s) |
Richard B. Fisher
Birth Date: May 17, 1923
Vice President
Began serving: April 1984 | Principal Occupations: Vice Chairman or Vice President of some of the Funds in the Federated Fund Family; Vice Chairman, Federated Investors, Inc.; Chairman, Federated Securities Corp.
Previous Positions: President and Director or Trustee of some of the Funds in the Federated Fund Family; Executive Vice President, Federated Investors, Inc.; Director and Chief Executive Officer, Federated Securities Corp. |
Brian P. Bouda
Birth Date: February 28, 1947
Senior Vice President and Chief Compliance Officer
Began serving: August 2004 | Principal Occupations: Senior Vice President and Chief Compliance Officer of the Federated Fund Family; Vice President and Chief Compliance Officer of Federated Investors, Inc. and Chief Compliance Officer of its subsidiaries. Mr. Bouda joined Federated in 1999 and is a member of the American Bar Association and the State Bar Association of Wisconsin. |
Stephen F. Auth
Birth Date: September 3, 1956
450 Lexington Avenue
Suite 3700
New York, NY 10017-3943
CHIEF INVESTMENT OFFICER
Began serving: November 2002 | Principal Occupations: Mr. Auth is Chief Investment Officer of this Fund and various other Funds in the Federated Fund Family; Executive Vice President, Federated Investment Counseling, Federated Global Investment Management Corp. and Federated Equity Management Company of Pennsylvania.
Previous Positions: Executive Vice President, Federated Investment Management Company, and Passport Research, Ltd. (investment advisory subsidiary of Federated); Senior Vice President, Global Portfolio Management Services Division; Senior Vice President, Federated Investment Management Company and Passport Research, Ltd.; Senior Managing Director and Portfolio Manager, Prudential Investments. |
Lawrence Auriana
Birth Date: January 8, 1944
140 East 45th Street
New York, NY 10017
VICE PRESIDENT
Began serving: November 2001 | Principal Occupations: Lawrence Auriana is Vice President of the Trust. Mr. Auriana joined Federated in April 2001 as Co-Head of Investments/Federated Kaufmann. From August 1984 to April 2001, Mr. Auriana was President and Treasurer of Edgemont Asset Management Corp., and Chairman of the Board and Portfolio Manager to The Kaufmann Fund, Inc. (predecessor to the Federated Kaufmann Fund). Mr. Auriana earned a B.S. in economics from Fordham University and has been engaged in the securities business since 1965. |
Walter C. Bean
Birth Date: June 22, 1945
VICE PRESIDENT
Began serving: November 2006 | Principal Occupations: Walter C. Bean has been the Fund's Portfolio Manager since inception. Walter C. Bean is Vice President of the Trust. Mr. Bean is a Senior Vice President, Senior Portfolio Manager and the Head of the Equity Income Management Team of the Fund's Adviser. Mr. Bean joined Federated in 2000. His previous associations included: various investment management and research positions with C.S. McKee & Company, First Chicago Investment Advisors, CIGNA Investment Advisors and Mellon Bank. Mr. Bean earned a Bachelors Degree in Business Administration from Ohio University and an M.B.A. from the Pennsylvania State University. Mr. Bean has received the Chartered Financial Analyst designation and has 41 years of investment experience. |
Annual Shareholder Report34
Name
Birth Date
Address
Positions Held with Trust
Date Service Began | Principal Occupation(s) for Past Five Years
and Previous Position(s) |
Hans P. Utsch
Birth Date: July 3, 1936
140 East 45th Street
New York, NY 10017
VICE PRESIDENT
Began serving: November 2001 | Principal Occupations: Hans P. Utsch is Vice President of the Trust. Mr. Utsch joined Federated in April 2001 as Co-Head of Investments/Federated Kaufmann. From August 1984 to April 2001, Mr. Utsch was Chairman of the Board and Secretary of Edgemont Asset Management Corp., and President and Portfolio Manager to The Kaufmann Fund, Inc. (predecessor to the Federated Kaufmann Fund). Mr. Utsch graduated from Amherst College and holds an M.B.A. from Columbia University. He has been engaged in the securities business since 1962. |
Annual Shareholder Report35
Evaluation and Approval of Advisory Contract – May 2010
Federated International Strategic Value Dividend Fund (the “Fund”)
The Fund's Board reviewed the Fund's investment advisory contract at meetings held in May 2010. The Board's decision regarding the contract reflects the exercise of its business judgment on whether to continue the existing arrangements.
In this connection, the Federated funds' Board had previously appointed a Senior Officer, whose duties include specified responsibilities relating to the process by which advisory fees are to be charged to a Federated fund. The Senior Officer has the authority to retain consultants, experts, or staff as may be reasonably necessary to assist in the performance of his duties, reports directly to the Board, and may be terminated only with the approval of a majority of the independent members of the Board. The Senior Officer prepared and furnished to the Board an independent, written evaluation that covered topics discussed below. The Board considered that evaluation, along with other information, in deciding to approve the advisory contract.
During its review of the contract, the Board considered compensation and benefits received by the Adviser. This included the fees received for services provided to the Fund by other entities in the Federated organization and research services (if any) received by the Adviser from brokers that execute Federated fund trades, as well as advisory fees. The Board is also familiar with and considered judicial decisions concerning allegedly excessive investment advisory fees, which have indicated that the following factors may be relevant to an Adviser's fiduciary duty with respect to its receipt of compensation from a fund: the nature and quality of the services provided by the Adviser, including the performance of the fund; the Adviser's cost of providing the services; the extent to which the Adviser may realize “economies of scale” as a fund grows larger; any indirect benefits that may accrue to the Adviser and its affiliates as a result of the Adviser's relationship with a fund; performance and expenses of comparable funds; and the extent to which the independent Board members are fully informed about all facts the Board deems relevant bearing on the Adviser's services and fees. The Board further considered management fees (including any components thereof) charged to institutional and other clients of the Adviser for what might be viewed as like services, and the cost to the Adviser and its affiliates of supplying services pursuant to the management fee agreements, excluding any intra-corporate profit and profit margins of the Adviser and its affiliates for supplying such services. The Board was aware of these factors and was guided by them in its review of the Fund's advisory contract to the extent it considered them to be appropriate and relevant, as discussed further below.
Annual Shareholder Report
36
The Board considered and weighed these circumstances in light of its substantial accumulated experience in governing the Fund and working with Federated on matters relating to the Federated funds, and was assisted in its deliberations by independent legal counsel. Throughout the year, the Board has requested and received substantial and detailed information about the Fund and the Federated organization that was in addition to the extensive materials that comprise and accompany the Senior Officer's evaluation. Federated provided much of this information at each regular meeting of the Board, and furnished additional reports in connection with the particular meeting at which the Board's formal review of the advisory contract occurred. Between regularly scheduled meetings, the Board also received information on particular matters as the need arose. Thus, the Board's consideration of the advisory contract included review of the Senior Officer's evaluation, accompanying data and additional reports covering such matters as: the Adviser's investment philosophy, revenue, profitability, personnel and processes; investment and operating strategies; the Fund's short- and long-term performance (in absolute terms, both on a gross basis and net of expenses, as well as in relationship to its particular investment program and certain competitor or “peer group” funds and/or other benchmarks, as appropriate), and comments on the reasons for performance; the Fund's investment objectives; the Fund's expenses (including the advisory fee itself and the overall expense structure of the Fund, both in absolute terms and relative to similar and/or competing funds, with due regard for contractual or voluntary expense limitations); the use and allocation of brokerage commissions derived from trading the Fund's portfolio securities (if any); and the nature, quality and extent of the advisory and other services provided to the Fund by the Adviser and its affiliates. The Board also considered the preferences and expectations of Fund shareholders and their relative sophistication; the continuing state of competition in the mutual fund industry and market practices; the range of comparable fees for similar funds in the mutual fund industry; the Fund's relationship to the Federated family of funds which include a comprehensive array of funds with different investment objectives, policies and strategies which are available for exchange without the incurrence of additional sales charges; compliance and audit reports concerning the Federated funds and the Federated companies that service them (including communications from regulatory agencies), as well as Federated's responses to any issues raised therein; and relevant developments in the mutual fund industry and how the Federated funds and/or Federated are responding to them. The Board's evaluation process is evolutionary. The criteria considered and the emphasis placed on relevant criteria change in recognition of changing circumstances in the mutual fund marketplace.With respect to the Fund's performance and expenses in particular, the Board has found the use of comparisons to other mutual funds with comparable investment programs to be relevant, given the high degree of competition in the mutual fund business. The Board focused on comparisons with other similar Annual Shareholder Report
37
mutual funds more heavily than non-mutual fund products or services because it is believed that they are more relevant. For example, other mutual funds are the products most like the Fund, they are readily available to Fund shareholders as alternative investment vehicles, and they are the type of investment vehicle in fact chosen and maintained by the Fund's investors. The range of their fees and expenses therefore appears to be a generally reliable indication of what consumers have found to be reasonable in the precise marketplace in which the Fund competes. The Fund's ability to deliver competitive performance when compared to its peer group was a useful indicator of how the Adviser is executing the Fund's investment program, which in turn assisted the Board in reaching a conclusion that the nature, extent, and quality of the Adviser's investment management services were such as to warrant continuation of the advisory contract. In this regard, the Senior Officer has reviewed Federated's fees for providing advisory services to products outside the Federated family of funds (e.g., institutional and separate accounts). He concluded that mutual funds and institutional accounts are inherently different products. Those differences include, but are not limited to, different types of targeted investors; being subject to different laws and regulations; different legal structures; different average account sizes; different associated costs; different portfolio management techniques made necessary by different cash flows; and portfolio manager time spent in review of securities pricing. The Senior Officer did not consider these fee schedules to be determinative in judging the appropriateness of mutual fund advisory contracts.The Senior Officer reviewed reports compiled by Federated, using data supplied by independent fund ranking organizations, regarding the performance of, and fees charged by, other mutual funds, noting his view that comparisons to fund peer groups are relevant in judging the reasonableness of proposed fees.
The Fund's performance fell below the median of the relevant peer group for the one-year period covered by the report. The Board discussed the Fund's performance with the Adviser and recognized the efforts being undertaken by the Adviser. The Board will continue to monitor these efforts and the performance of the Fund.
The Board also received financial information about Federated, including reports on the compensation and benefits Federated derived from its relationships with the Federated funds. These reports covered not only the fees under the advisory contracts, but also fees received by Federated's subsidiaries for providing other services to the Federated funds under separate contracts (e.g., for serving as the Federated funds' administrator). The reports also discussed any indirect benefit Federated may derive from its receipt of research services from brokers who execute Federated fund trades. In addition, the Board considered the fact that, in order for a fund to be competitive in the marketplace, Federated and its affiliates frequently waived fees and/or Annual Shareholder Report
38
reimbursed expenses and have disclosed to fund investors and/or indicated to the Board their intention to do so in the future, where appropriate. Moreover, the Board receives regular reports regarding the institution or elimination of these voluntary waivers.Federated furnished reports, requested by the Senior Officer, that reported revenues on a fund-by-fund basis and made estimates of the allocation of expenses on a fund-by-fund basis, using allocation methodologies specified by the Senior Officer. The Senior Officer noted that, although they may apply consistent allocation processes, the inherent difficulties in allocating costs (and the unavoidable arbitrary aspects of that exercise) and the lack of consensus on how to allocate those costs may render such allocation reports unreliable. The allocation reports were considered in the analysis by the Board but were determined to be of limited use.
The Board and the Senior Officer also reviewed a report compiled by Federated comparing profitability information for Federated to other publicly held fund management companies. In this regard, the Senior Officer noted the limited availability of such information, but nonetheless concluded that Federated's profit margins did not appear to be excessive and the Board agreed.
The Senior Officer's evaluation also discussed the notion of possible realization of “economies of scale” as a fund grows larger. The Board considered in this regard that the Adviser has made significant and long-term investments in areas that support all of the Federated funds, such as personnel and processes for the portfolio management, compliance, and risk management functions; and systems technology; and that the benefits of these efforts (as well as any economies, should they exist) were likely to be enjoyed by the fund complex as a whole. Finally, the Board also noted the absence of any applicable regulatory or industry guidelines on this subject, which (as discussed in the Senior Officer's evaluation) is compounded by the lack of any common industry practice or general pattern with respect to structuring fund advisory fees with “breakpoints” that serve to reduce the fee as the fund attains a certain size. The Senior Officer did not recommend institution of breakpoints in pricing Federated's fund advisory services at this time.
It was noted in the materials for the Board meeting that for the period covered by the report, the Fund's investment advisory fee was waived in its entirety. The Board reviewed the contractual fee rate and other expenses of the Fund with the Adviser and was satisfied that the overall expense structure of the Fund remained competitive.
The Senior Officer's evaluation noted his belief that the information and observations contained in his evaluation supported a finding that the proposed management fees are reasonable, and that Federated appeared to provide appropriate administrative services to the Fund for the fees paid. Under these Annual Shareholder Report
39
circumstances, no changes were recommended to, and no objection was raised to, the continuation of the Fund's advisory contract. The Board concluded that the nature, quality and scope of services provided the Fund by the Adviser and its affiliates were satisfactory.In its decision to continue an existing investment advisory contract, the Board was mindful of the potential disruptions of the Fund's operations and various risks, uncertainties and other effects that could occur as a result of a decision to terminate or not renew an advisory contract. In particular, the Board recognized that many shareholders have invested in the Fund on the strength of the Adviser's industry standing and reputation and with the expectation that the Adviser will have a continuing role in providing advisory services to the Fund. Thus, the Board's approval of the advisory contract reflected the fact that it is the shareholders who have effectively selected the Adviser by virtue of having invested in the Fund.
The Board based its decision to approve the advisory contract on the totality of the circumstances and relevant factors and with a view to past and future long-term considerations. Not all of the factors and considerations identified above were necessarily relevant to the Fund, nor did the Board consider any one of them to be determinative. With respect to the factors that were relevant, the Board's decision to approve the contract reflects its determination that Federated's performance and actions provided a satisfactory basis to support the decision to continue the existing arrangements.
Annual Shareholder Report40
Voting Proxies on Fund Portfolio Securities
A description of the policies and procedures that the Fund uses to determine how to vote proxies, if any, relating to securities held in the Fund's portfolio is available, without charge and upon request, by calling 1-800-341-7400. A report on “Form N-PX” of how the Fund voted any such proxies during the most recent 12-month period ended June 30 is available from Federated's website at FederatedInvestors.com. To access this information from the “Products” section of the website, click on the “Prospectuses and Regulatory Reports” link under “Related Information,” then select the appropriate link opposite the name of the Fund; or select the name of the Fund and from the Fund's page, click on the “Prospectuses and Regulatory Reports” link. Form N-PX filings are also available at the SEC's website at www.sec.gov.
Quarterly Portfolio Schedule
The Fund files with the SEC a complete schedule of its portfolio holdings, as of the close of the first and third quarters of its fiscal year, on “Form N-Q.” These filings are available on the SEC's website at www.sec.gov and may be reviewed and copied at the SEC's Public Reference Room in Washington, DC. (Call 1-800-SEC-0330 for information on the operation of the Public Reference Room.) You may also access this information from the “Products” section of Federated's website at FederatedInvestors.com by clicking on “Portfolio Holdings” under “Related Information,” then selecting the appropriate link opposite the name of the Fund; or select the name of the Fund and from the Fund's page, click on the “Portfolio Holdings” link.
Annual Shareholder Report41
Mutual funds are not bank deposits or obligations, are not guaranteed by any bank and are not insured or guaranteed by the U.S. government, the Federal Deposit Insurance Corporation, the Federal Reserve Board or any other government agency. Investment in mutual funds involves investment risk, including the possible loss of principal.
This Report is authorized for distribution to prospective investors only when preceded or accompanied by the Fund's Prospectus, which contains facts concerning its objective and policies, management fees, expenses and other information.
Federated International Strategic Value Dividend Fund
Federated Investors Funds
4000 Ericsson Drive
Warrendale, PA 15086-7561
Contact us at FederatedInvestors.com
or call 1-800-341-7400.
Federated Securities Corp., Distributor
Cusip 314172362
39835 (1/11)
Federated is a registered mark of Federated Investors, Inc.
2011 ©Federated Investors, Inc.
Item 2. Code of Ethics
(a) As of the end of the period covered by this report, the registrant has adopted a code of ethics (the "Section 406 Standards for Investment Companies - Ethical Standards for Principal Executive and Financial Officers") that applies to the registrant's Principal Executive Officer and Principal Financial Officer; the registrant's Principal Financial Officer also serves as the Principal Accounting Officer.
(c) Not Applicable
(d) Not Applicable
(e) Not Applicable
(f)(3) The registrant hereby undertakes to provide any person, without charge, upon request, a copy of the code of ethics. To request a copy of the code of ethics, contact the registrant at 1-800-341-7400, and ask for a copy of the Section 406 Standards for Investment Companies - Ethical Standards for Principal Executive and Financial Officers.
Item 3. Audit Committee Financial Expert
The registrant's Board has determined that each of the following members of the Board's Audit Committee is an “audit committee financial expert,” and is "independent," for purposes of this Item: Nicholas P. Constantakis, Charles F. Mansfield, Jr. and Thomas M. O’Neill.
Item 4. Principal Accountant Fees and Services
(a) Audit Fees billed to the registrant for the two most recent fiscal years:
Fiscal year ended 2010 - $349,500
Fiscal year ended 2009 - $405,900
(b) Audit-Related Fees billed to the registrant for the two most recent fiscal years:
Fiscal year ended 2010 - $483
Fiscal year ended 2009 - $7,124
Fiscal year ended 2010- Audit Committee Meetings. Fiscal year ended 2009- Audit procedures in connection with fund reorganization and audit committee meeting.
Amount requiring approval of the registrant’s audit committee pursuant to paragraph (c)(7)(ii) of Rule 2-01 of Regulation S-X, $4,067 and $0 respectively. Fiscal year ended 2010- Audit consent fees for N-14 merger documents.
(c) Tax Fees billed to the registrant for the two most recent fiscal years:
Fiscal year ended 2010 - $0
Fiscal year ended 2009 - $0
Amount requiring approval of the registrant’s audit committee pursuant to paragraph (c)(7)(ii) of Rule 2-01 of Regulation S-X, $0 and $0 respectively.
(d) All Other Fees billed to the registrant for the two most recent fiscal years:
Fiscal year ended 2010 - $0
Fiscal year ended 2009 - $0
Amount requiring approval of the registrant’s audit committee pursuant to paragraph (c)(7)(ii) of Rule 2-01 of Regulation S-X, $32,356 and $148,257 respectively. Fiscal year ended 2010- Service fee for analysis of potential Passive Foreign Investment Company holdings. Fiscal year ended 2009- Fees related to technical assistance and valuation matters for various fund acquisitions and service fee for analysis of potential Passive Foreign Investment Company holdings.
(e)(1) Audit Committee Policies regarding Pre-approval of Services.
The Audit Committee is required to pre-approve audit and non-audit services performed by the independent auditor in order to assure that the provision of such services do not impair the auditor’s independence. Unless a type of service to be provided by the independent auditor has received general pre-approval, it will require specific pre-approval by the Audit Committee. Any proposed services exceeding pre-approved cost levels will require specific pre-approval by the Audit Committee.
Certain services have the general pre-approval of the Audit Committee. The term of the general pre-approval is 12 months from the date of pre-approval, unless the Audit Committee specifically provides for a different period. The Audit Committee will annually review the services that may be provided by the independent auditor without obtaining specific pre-approval from the Audit Committee and may grant general pre-approval for such services. The Audit Committee will revise the list of general pre-approved services from time to time, based on subsequent determinations. The Audit Committee will not delegate its responsibilities to pre-approve services performed by the independent auditor to management.
The Audit Committee has delegated pre-approval authority to its Chairman. The Chairman will report any pre-approval decisions to the Audit Committee at its next scheduled meeting. The Committee will designate another member with such pre-approval authority when the Chairman is unavailable.
AUDIT SERVICES
The annual Audit services engagement terms and fees will be subject to the specific pre-approval of the Audit Committee. The Audit Committee must approve any changes in terms, conditions and fees resulting from changes in audit scope, registered investment company (RIC) structure or other matters.
In addition to the annual Audit services engagement specifically approved by the Audit Committee, the Audit Committee may grant general pre-approval for other Audit Services, which are those services that only the independent auditor reasonably can provide. The Audit Committee has pre-approved certain Audit services, all other Audit services must be specifically pre-approved by the Audit Committee.
AUDIT-RELATED SERVICES
Audit-related services are assurance and related services that are reasonably related to the performance of the audit or review of the Company’s financial statements or that are traditionally performed by the independent auditor. The Audit Committee believes that the provision of Audit-related services does not impair the independence of the auditor, and has pre-approved certain Audit-related services, all other Audit-related services must be specifically pre-approved by the Audit Committee.
TAX SERVICES
The Audit Committee believes that the independent auditor can provide Tax services to the Company such as tax compliance, tax planning and tax advice without impairing the auditor’s independence. However, the Audit Committee will not permit the retention of the independent auditor in connection with a transaction initially recommended by the independent auditor, the purpose of which may be tax avoidance and the tax treatment of which may not be supported in the Internal Revenue Code and related regulations. The Audit Committee has pre-approved certain Tax services, all Tax services involving large and complex transactions must be specifically pre-approved by the Audit Committee.
ALL OTHER SERVICES
With respect to the provision of services other than audit, review or attest services the pre-approval requirement is waived if:
| (1) | The aggregate amount of all such services provided constitutes no more than five percent of the total amount of revenues paid by the registrant, the registrant’s adviser (not including any sub-adviser whose role is primarily portfolio management and is subcontracted with or overseen by another investment adviser), and any entity controlling, controlled by, or under common control with the investment adviser that provides ongoing services to the registrant to its accountant during the fiscal year in which the services are provided; |
| (2) | Such services were not recognized by the registrant, the registrant’s adviser (not including any sub-adviser whose role is primarily portfolio management and is subcontracted with or overseen by another investment adviser), and any entity controlling, controlled by, or under common control with the investment adviser that provides ongoing services to the registrant at the time of the engagement to be non-audit services; and |
| (3) | Such services are promptly brought to the attention of the Audit Committee of the issuer and approved prior to the completion of the audit by the Audit Committee or by one or more members of the Audit Committee who are members of the board of directors to whom authority to grant such approvals has been delegated by the Audit Committee. |
The Audit Committee may grant general pre-approval to those permissible non-audit services classified as All Other services that it believes are routine and recurring services, and would not impair the independence of the auditor.
The SEC’s rules and relevant guidance should be consulted to determine the precise definitions of prohibited non-audit services and the applicability of exceptions to certain of the prohibitions.
PRE-APPROVAL FEE LEVELS
Pre-approval fee levels for all services to be provided by the independent auditor will be established annually by the Audit Committee. Any proposed services exceeding these levels will require specific pre-approval by the Audit Committee.
PROCEDURES
Requests or applications to provide services that require specific approval by the Audit Committee will be submitted to the Audit Committee by both the independent auditor and the Principal Accounting Officer and/or Internal Auditor, and must include a joint statement as to whether, in their view, the request or application is consistent with the SEC’s rules on auditor independence.
(e)(2) Percentage of services identified in items 4(b) through 4(d) that were approved by the registrants audit committee pursuant to paragraph (c)(7)(i)(C) of Rule 2-01 of Regulation S-X:
4(b)
Fiscal year ended 2010 – 0%
Fiscal year ended 2009 - 0%
Percentage of services provided to the registrants investment adviser and any entity controlling, controlled by, or under common control with the investment adviser that provides ongoing services to the registrant that were approved by the registrants audit committee pursuant to paragraph (c)(7)(i)(C) of Rule 2-01 of Regulation S-X, 0% and 0% respectively.
4(c)
Fiscal year ended 2010 – 0%
Fiscal year ended 2009 – 0%
Percentage of services provided to the registrants investment adviser and any entity controlling, controlled by, or under common control with the investment adviser that provides ongoing services to the registrant that were approved by the registrants audit committee pursuant to paragraph (c)(7)(i)(C) of Rule 2-01 of Regulation S-X, 0% and 0% respectively.
4(d)
Fiscal year ended 2010 – 0%
Fiscal year ended 2009 – 0%
Percentage of services provided to the registrants investment adviser and any entity controlling, controlled by, or under common control with the investment adviser that provides ongoing services to the registrant that were approved by the registrants audit committee pursuant to paragraph (c)(7)(i)(C) of Rule 2-01 of Regulation S-X, 0% and 0% respectively.
| (g) | Non-Audit Fees billed to the registrant, the registrant’s investment adviser, and certain entities controlling, controlled by or under common control with the investment adviser: |
Fiscal year ended 2010 - $566,440
Fiscal year ended 2009 - $336,493
(h) The registrant’s Audit Committee has considered that the provision of non-audit services that were rendered to the registrant’s adviser (not including any sub-adviser whose role is primarily portfolio management and is subcontracted with or overseen by another investment adviser), and any entity controlling, controlled by, or under common control with the investment adviser that provides ongoing services to the registrant that were not pre-approved pursuant to paragraph (c)(7)(ii) of Rule 2-01 of Regulation S-X is compatible with maintaining the principal accountant’s independence.
Item 5. Audit Committee of Listed Registrants
Not Applicable
Item 6. Schedule of Investments
Not Applicable
| Item 7. | Disclosure of Proxy Voting Policies and Procedures for Closed-End Management Investment Companies |
| Item 8. | Portfolio Managers of Closed-End Management Investment Companies |
| Item 9. | Purchases of Equity Securities by Closed-End Management Investment Company and Affiliated Purchasers |
Item 10. Submission of Matters to a Vote of Security Holders
Not Applicable
Item 11. Controls and Procedures
(a) The registrant’s President and Treasurer have concluded that the
registrant’s disclosure controls and procedures (as defined in rule 30a-3(c) under the Act) are effective in design and operation and are sufficient to form the basis of the certifications required by Rule 30a-(2) under the Act, based on their evaluation of these disclosure controls and procedures within 90 days of the filing date of this report on Form N-CSR.
(b) There were no changes in the registrant’s internal control over financial reporting (as defined in rule 30a-3(d) under the Act) during the last fiscal quarter that have materially affected, or are reasonably likely to materially affect, the registrant’s internal control over financial reporting.
Item 12. Exhibits
SIGNATURES
Pursuant to the requirements of the Securities Exchange Act of 1934 and the Investment Company Act of 1940, the registrant has duly caused this report to be signed on its behalf by the undersigned, thereunto duly authorized.
Registrant Federated Equity Funds
By /S/ Richard A. Novak
Richard A. Novak, Principal Financial Officer
Date ___January 24, 2011____
Pursuant to the requirements of the Securities Exchange Act of 1934 and the Investment Company Act of 1940, this report has been signed below by the following persons on behalf of the registrant and in the capacities and on the dates indicated.
By /S/ J. Christopher Donahue
J. Christopher Donahue, Principal Executive Officer
Date ___January 25, 2011____
By /S/ Richard A. Novak
Richard A. Novak, Principal Financial Officer
Date ___January 24, 2011____