United States
Securities and Exchange Commission
Washington, D.C. 20549
Form N-CSR
Certified Shareholder Report of Registered Management Investment Companies
811-4017
(Investment Company Act File Number)
Federated Equity Funds
_______________________________________________________________
(Exact Name of Registrant as Specified in Charter)
Federated Investors Funds
4000 Ericsson Drive
Warrendale, Pennsylvania 15086-7561
(Address of Principal Executive Offices)
(412) 288-1900
(Registrant's Telephone Number)
John W. McGonigle, Esquire
Federated Investors Tower
1001 Liberty Avenue
Pittsburgh, Pennsylvania 15222-3779
(Name and Address of Agent for Service)
(Notices should be sent to the Agent for Service)
Date of Fiscal Year End: 10/31/2011
Date of Reporting Period: 10/31/2011
Item 1. Reports to Stockholders
 | | Annual Shareholder Report |
| | October 31, 2011 |
|
| Share Class | Ticker |
| A | FEDEX |
| B | CPABX |
| C | CPACX |
| R* | CPAKX |
| Institutional | CPAIX |
*formerly, Class K Shares
Federated Capital Appreciation Fund
Fund Established 1977
A Portfolio of Federated Equity Funds
Dear Valued Shareholder,
I am pleased to present the Annual Shareholder Report for your fund covering the period from November 1, 2010 through October 31, 2011. This report includes Management's Discussion of Fund Performance, a complete listing of your fund's holdings, performance information and financial statements along with other important fund information.
In addition, our website, FederatedInvestors.com, offers easy access to Federated resources that include timely fund updates, economic and market insights from our investment strategists, and financial planning tools. We invite you to register to take full advantage of its capabilities.
Thank you for investing with Federated. I hope you find this information useful and look forward to keeping you informed.
Sincerely,
J. Christopher Donahue, President
Not FDIC Insured  May Lose Value No Bank Guarantee
CONTENTS
Management's Discussion of Fund Performance (unaudited)
The Fund's total return, based on net asset value, for the fiscal year ended October 31, 2011, was -0.76% for the Class A Shares, -1.57% for the Class B Shares, -1.57% for the Class C Shares, -0.97% for the Class R Shares and -0.47% for the Institutional Shares. The total return of the Standard and Poor's 500 Index (S&P 500),1 the Fund's benchmark, was 8.09% for the same period. The Fund's total return for the fiscal year reflected actual cash flows, transaction costs and other expenses which were not reflected in the total return of the S&P 500.
MARKET OVERVIEW
Stocks, as measured by the S&P 500, had a strong 12-month period. While volatile, equity market performance during the fiscal year was dominated by the market's preference for an interesting combination of cyclically leveraged and high dividend paying stocks. Energy and Utilities were the strongest performing sectors within the S&P 500 rising 19.2% and 14.7%, respectively. Consumer Discretionary (up 12.7%), and Consumer Staples (up 11.3%) were also strong performers within the S&P 500.
The biggest investment issues during the reporting period were the continued, albeit somewhat lumpy, strength in domestic equity markets after unprecedented fiscal and monetary stimuli and a sharp increase in general uncertainty brought about by the European sovereign debt crisis. The latter point was often cited as the key reason for the very high levels of stock correlation and concurrent volatility.
FUND PERFORMANCE
The Fund underperformed the S&P 500. Approximately 70% of the relative underperformance was driven by stock selection. The Fund's relative performance was constrained by conservative stock selection within most sectors, relative to the S&P 500. This was particularly true during the very strong rally seen during October 2011, as the market was able to look past the European debt crisis and projections for much slower global growth.
Annual Shareholder Report
The weakest relative returns were in the Information Technology, Energy and Consumer Discretionary sectors. Favorable stock selection within the Industrials and Telecom Services sectors provided some positive performance during the period.Largest negative contributors were Arch Coal, Cisco Systems, Lear Corp, BMC Software and Wells Fargo. Top five positive contributors to returns were Chevron, Apple Computer, Humana, Exxon Mobil and Caterpillar.
| 1 | The S&P 500 Index is an unmanaged, capitalization-weighted index of 500 stocks designed to measure performance of the broad domestic economy through changes in the aggregate market value of 500 stocks representing all major industries. The index is unmanaged and, unlike the Fund, is not affected by cash flows. The investment cannot be made directly in an index. |
Annual Shareholder ReportFUND PERFORMANCE AND GROWTH OF A $10,000 INVESTMENT
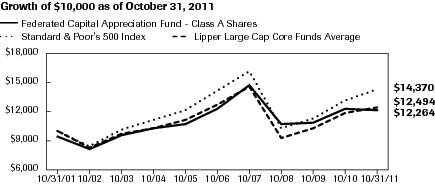
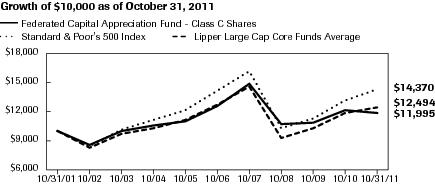
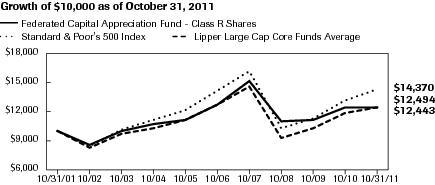
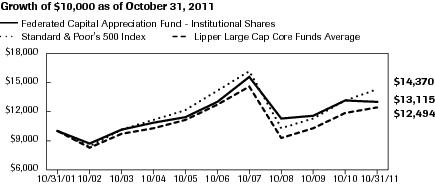
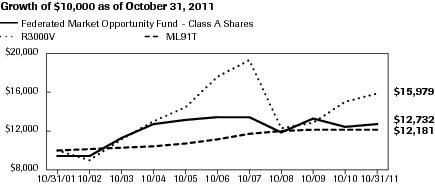
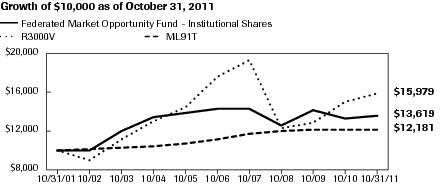
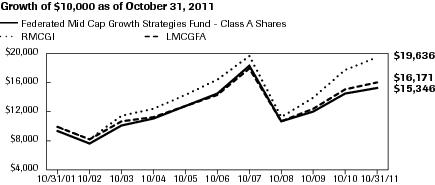
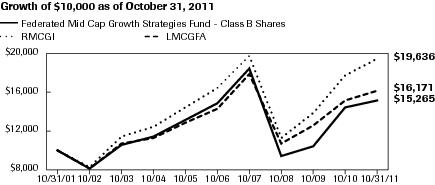
The Average Annual Total Return table below shows returns for each class averaged over the stated periods. The graphs below illustrate the hypothetical investment of $10,0001 in the Federated Capital Appreciation Fund (the “Fund”) from October 31, 2001 to October 31, 2011, compared to the Standard & Poor's 500 Index (S&P 500)2 and the Lipper Large-Cap Core Funds Average (LLCCFA).2
Average Annual Total Returns for the Period Ended 10/31/2011
(returns reflect all applicable sales charges and contingent deferred sales charges as specified below in footnote #1)
| Share Class | 1 Year | 5 Years | 10 Years |
| Class A Shares | -6.24% | -1.33% | 2.06% |
| Class B Shares | -6.98% | -1.30% | 1.99% |
| Class C Shares | -2.56% | -1.00% | 1.84% |
| Class R Shares3 | -0.97% | -0.61% | 2.21% |
| Institutional Shares3 | -0.47% | 0.00% | 2.75% |
Performance data quoted represents past performance which is no guarantee of future results. Investment return and principal value will fluctuate so that an investor's shares, when redeemed, may be worth more or less than their original cost. Mutual fund performance changes over time and current performance may be lower or higher than what is stated. For current to the most recent month-end performance and after-tax returns, visit FederatedInvestors.com or call 1-800-341-7400. Returns shown do not reflect the deduction of taxes that a shareholder would pay on Fund distributions or the redemption of Fund shares. Mutual funds are not obligations of or guaranteed by any bank and are not federally insured.
Annual Shareholder Report
Growth of a $10,000 Investment – CLASS A SHARES| Federated Capital Appreciation Fund - Class A Shares | C000026725 | Standard & Poor's 500 Index | Lipper Large Cap Core Funds Average |
| 10/31/2001 | 9,450 | 10,000 | 10,000 |
| 10/31/2002 | 8,212 | 8,490 | 8,328 |
| 10/31/2003 | 9,598 | 10,255 | 9,770 |
| 10/31/2004 | 10,267 | 11,221 | 10,320 |
| 10/31/2005 | 10,803 | 12,200 | 11,181 |
| 10/31/2006 | 12,394 | 14,195 | 12,772 |
| 10/31/2007 | 14,845 | 16,261 | 14,632 |
| 10/31/2008 | 10,734 | 10,392 | 9,345 |
| 10/31/2009 | 10,917 | 11,410 | 10,359 |
| 10/31/2010 | 12,359 | 13,294 | 11,856 |
| 10/31/2011 | 12,264 | 14,370 | 12,494 |
41 graphic description end -->
- Total returns shown include the maximum sales charge of 5.50% ($10,000 investment minus $550 sales charge = $9,450).
Growth of a $10,000 Investment – CLASS B SHARES
| Federated Capital Appreciation Fund - Class B Shares | C000026726 | Standard & Poor's 500 Index | Lipper Large Cap Core Funds Average |
| 10/31/2001 | 10,000 | 10,000 | 10,000 |
| 10/31/2002 | 8,624 | 8,490 | 8,328 |
| 10/31/2003 | 10,003 | 10,255 | 9,770 |
| 10/31/2004 | 10,622 | 11,221 | 10,320 |
| 10/31/2005 | 11,087 | 12,200 | 11,181 |
| 10/31/2006 | 12,621 | 14,195 | 12,772 |
| 10/31/2007 | 14,996 | 16,261 | 14,632 |
| 10/31/2008 | 10,753 | 10,392 | 9,345 |
| 10/31/2009 | 10,296 | 11,410 | 10,359 |
| 10/31/2010 | 12,272 | 13,294 | 11,856 |
| 10/31/2011 | 12,178 | 14,370 | 12,494 |
41 graphic description end -->
- Total returns shown include the maximum contingent deferred sales charge of 5.50%, as applicable.
Annual Shareholder Report
Growth of a $10,000 Investment – CLASS C SHARES| Federated Capital Appreciation Fund - Class C Shares | C000026727 | Standard & Poor's 500 Index | Lipper Large Cap Core Funds Average |
| 10/31/2001 | 10,000 | 10,000 | 10,000 |
| 10/31/2002 | 8,627 | 8,490 | 8,328 |
| 10/31/2003 | 10,003 | 10,255 | 9,770 |
| 10/31/2004 | 10,622 | 11,221 | 10,320 |
| 10/31/2005 | 11,084 | 12,200 | 11,181 |
| 10/31/2006 | 12,614 | 14,195 | 12,772 |
| 10/31/2007 | 14,996 | 16,261 | 14,632 |
| 10/31/2008 | 10,756 | 10,392 | 9,345 |
| 10/31/2009 | 10,852 | 11,410 | 10,359 |
| 10/31/2010 | 12,186 | 13,294 | 11,856 |
| 10/31/2011 | 11,995 | 14,370 | 12,494 |
41 graphic description end -->
- Total returns shown include the maximum contingent deferred sales charge of 1.00%, as applicable.
Growth of a $10,000 Investment – CLASS R SHARES3
| Federated Capital Appreciation Fund - Class R Shares | C000026728 | Standard & Poor's 500 Index | Lipper Large Cap Core Funds Average |
| 10/31/2001 | 10,000 | 10,000 | 10,000 |
| 10/31/2002 | 8,647 | 8,490 | 8,328 |
| 10/31/2003 | 10,070 | 10,255 | 9,770 |
| 10/31/2004 | 10,724 | 11,221 | 10,320 |
| 10/31/2005 | 11,231 | 12,200 | 11,181 |
| 10/31/2006 | 12,828 | 14,195 | 12,772 |
| 10/31/2007 | 15,299 | 16,261 | 14,632 |
| 10/31/2008 | 11,007 | 10,392 | 9,345 |
| 10/31/2009 | 11,150 | 11,410 | 10,359 |
| 10/31/2010 | 12,566 | 13,294 | 11,856 |
| 10/31/2011 | 12,443 | 14,370 | 12,494 |
41 graphic description end -->
Annual Shareholder Report
Growth of a $10,000 Investment – INSTITUTIONAL SHARES3| Federated Capital Appreciation Fund - Institutional Shares | C000060702 | Standard & Poor's 500 Index | Lipper Large Cap Core Funds Average |
| 10/31/2001 | 10,000 | 10,000 | 10,000 |
| 10/31/2002 | 8,690 | 8,490 | 8,328 |
| 10/31/2003 | 10,157 | 10,255 | 9,770 |
| 10/31/2004 | 10,865 | 11,221 | 10,320 |
| 10/31/2005 | 11,431 | 12,200 | 11,181 |
| 10/31/2006 | 13,116 | 14,195 | 12,772 |
| 10/31/2007 | 15,709 | 16,261 | 14,632 |
| 10/31/2008 | 11,380 | 10,392 | 9,345 |
| 10/31/2009 | 11,604 | 11,410 | 10,359 |
| 10/31/2010 | 13,177 | 13,294 | 11,856 |
| 10/31/2011 | 13,115 | 14,370 | 12,494 |
41 graphic description end -->
| 1 | Represents a hypothetical investment of $10,000 in the Fund after deducting applicable sales charges: For Class A Shares, the maximum sales charge of 5.50% ($10,000 investment minus $550 sales charge = $9,450); for Class B Shares, the maximum contingent deferred sales charge is 5.50% on any redemption less than one year from the purchase date and the ending value does not reflect a contingent deferred sales charge on any redemption over seven years from the purchase date; for Class C Shares, the maximum contingent deferred sales charge is 1.00% on any redemption less than one year from the purchase date. The Fund's performance assumes the reinvestment of all dividends and distributions. The S&P 500 and LLCCFA have been adjusted to reflect reinvestment of dividends on securities in the index and average. |
| 2 | The S&P 500 is not adjusted to reflect sales loads, expenses or other fees that the Securities and Exchange Commission (SEC) requires to be reflected in the Fund's performance. The LLCCFA represents the average of the total returns reported by all of the mutual funds designated by Lipper, Inc. as falling into the category indicated, and is not adjusted to reflect sales charges. Total returns of the LLCCFA are reported net of expenses or other fees that the SEC requires to be reflected in a fund's performance. The S&P 500 is unmanaged and, unlike the Fund, is not affected by cash flows. It is not possible to invest in an index or average. |
| 3 | The Fund's Institutional Shares and Class R Shares commenced operations on December 31, 2007 and April 8, 2003, respectively. For the period prior to the commencement of operations of the Institutional Shares, the performance information shown is for the Fund's Class A Shares. The performance of the Class A Shares has not been adjusted to reflect the expenses of the Institutional Shares since the Institutional Shares have a lower expense ratio than the expense ratio of the Class A Shares. The performance of Class A Shares has been adjusted to remove any voluntary waiver of Fund expenses that may have occurred during the period prior to the commencement of operations of the Institutional Shares. For the period prior to commencement of operations of the Class R Shares, the performance information shown is for the Fund's Class A Shares, adjusted to reflect the expense of the Class R Shares. |
Annual Shareholder Report Portfolio of Investments Summary Table (unaudited)
At October 31, 2011, the Fund's sector composition1 was as follows:
| Sector Composition | Percentage of
Total Net Assets |
| Information Technology | 20.0% |
| Financials | 13.3% |
| Energy | 12.3% |
| Health Care | 11.7% |
| Consumer Staples | 11.3% |
| Consumer Discretionary | 10.5% |
| Industrials | 8.9% |
| Utilities | 4.2% |
| Materials | 3.2% |
| Telecommunication Services | 2.9% |
| Cash Equivalents2 | 3.3% |
| Other Assets and Liabilities — Net3 | (1.6)% |
| TOTAL | 100.0% |
| 1 | Except for Cash Equivalents and Other Assets and Liabilities, sector classifications are based upon, and individual portfolio securities are assigned to, the classifications of the Global Industry Classification Standard (GICS) except that the Adviser assigns a classification to securities not classified by the GICS and to securities for which the Adviser does not have access to the classification made by the GICS. |
| 2 | Cash Equivalents include any investments in money market mutual funds and/or overnight repurchase agreements. |
| 3 | Assets, other than investments in securities, less liabilities. See Statement of Assets and Liabilities. |
Annual Shareholder Report Portfolio of Investments
October 31, 2011
| Shares | | | Value |
| | COMMON STOCKS – 98.3% | |
| | Consumer Discretionary – 10.5% | |
| 55,300 | 1 | Amazon.com, Inc. | 11,807,103 |
| 192,300 | 1 | DIRECTV Group, Inc., Class A | 8,741,958 |
| 414,101 | 1 | Discovery Communications, Inc. | 17,996,830 |
| 463,800 | | Expedia, Inc. | 12,179,388 |
| 287,100 | 1 | Las Vegas Sands Corp. | 13,479,345 |
| 461,800 | | Macy's, Inc. | 14,098,754 |
| 644,000 | | Mattel, Inc. | 18,186,560 |
| 161,672 | | McDonald's Corp. | 15,011,245 |
| | TOTAL | 111,501,183 |
| | Consumer Staples – 11.3% | |
| 428,000 | | Altria Group, Inc. | 11,791,400 |
| 297,300 | | CVS Caremark Corp. | 10,791,990 |
| 409,700 | | ConAgra Foods, Inc. | 10,377,701 |
| 204,600 | | Kimberly-Clark Corp. | 14,262,666 |
| 280,713 | | Nestle S.A. | 16,244,785 |
| 242,500 | | Procter & Gamble Co. | 15,517,575 |
| 457,300 | | Reynolds American, Inc. | 17,688,364 |
| 181,244 | | The Coca-Cola Co. | 12,382,590 |
| 189,200 | | Wal-Mart Stores, Inc. | 10,731,424 |
| | TOTAL | 119,788,495 |
| | Energy – 12.3% | |
| 327,593 | | Chevron Corp. | 34,413,645 |
| 347,128 | | ConocoPhillips | 24,177,465 |
| 97,800 | | Diamond Offshore Drilling, Inc. | 6,409,812 |
| 279,300 | | Exxon Mobil Corp. | 21,810,537 |
| 678,400 | | Marathon Oil Corp. | 17,658,752 |
| 211,900 | | National-Oilwell, Inc. | 15,114,827 |
| 152,100 | | Schlumberger Ltd. | 11,174,787 |
| | TOTAL | 130,759,825 |
| | Financials – 13.3% | |
| 590,500 | | Annaly Capital Management, Inc. | 9,949,925 |
| 264,000 | | Citigroup, Inc. | 8,339,760 |
| 531,300 | | Discover Financial Services | 12,517,428 |
| 620,200 | | Fifth Third Bancorp | 7,448,602 |
| 59,900 | | Goldman Sachs Group, Inc. | 6,562,045 |
Annual Shareholder Report| Shares | | | Value |
| 456,855 | | J.P. Morgan Chase & Co. | 15,880,280 |
| 404,600 | | Marsh & McLennan Cos., Inc. | 12,388,852 |
| 482,870 | | MetLife, Inc. | 16,977,709 |
| 236,400 | | PNC Financial Services Group | 12,697,044 |
| 173,900 | | Simon Property Group, Inc. | 22,335,716 |
| 627,774 | | Wells Fargo & Co. | 16,265,624 |
| | TOTAL | 141,362,985 |
| | Health Care – 11.7% | |
| 149,300 | | Allergan, Inc. | 12,559,116 |
| 165,362 | | Amgen, Inc. | 9,470,282 |
| 276,100 | | Cardinal Health, Inc. | 12,222,947 |
| 174,600 | 1 | Celgene Corp. | 11,319,318 |
| 121,600 | 1 | Express Scripts, Inc., Class A | 5,560,768 |
| 240,800 | | Humana, Inc. | 20,441,512 |
| 83,230 | | Johnson & Johnson | 5,359,179 |
| 322,600 | | Merck & Co., Inc. | 11,129,700 |
| 794,000 | | Pfizer, Inc. | 15,292,440 |
| 146,200 | 1 | Pharmasset, Inc. | 10,292,480 |
| 225,200 | | UnitedHealth Group, Inc. | 10,807,348 |
| | TOTAL | 124,455,090 |
| | Industrials – 8.9% | |
| 1,523,819 | | General Electric Co. | 25,463,016 |
| 234,607 | | Honeywell International, Inc. | 12,293,407 |
| 151,700 | | Parker-Hannifin Corp. | 12,371,135 |
| 267,200 | | Raytheon Co. | 11,807,568 |
| 161,320 | | Union Pacific Corp. | 16,062,632 |
| 213,610 | | United Technologies Corp. | 16,657,308 |
| | TOTAL | 94,655,066 |
| | Information Technology – 20.0% | |
| 219,157 | | Accenture PLC | 13,206,401 |
| 88,500 | 1 | Apple, Inc. | 35,823,030 |
| 267,700 | 1 | BMC Software, Inc. | 9,305,252 |
| 248,700 | 1 | Broadcom Corp. | 8,975,583 |
| 639,960 | 1 | EMC Corp. | 15,685,420 |
| 24,800 | 1 | Google, Inc. | 14,697,472 |
| 195,600 | | KLA-Tencor Corp. | 9,210,804 |
| 1,092,931 | | Microsoft Corp. | 29,104,752 |
| 208,454 | | Motorola, Inc. | 9,778,577 |
Annual Shareholder Report| Shares | | | Value |
| 167,800 | 1 | NetApp, Inc. | 6,873,088 |
| 405,100 | 1 | ON Semiconductor Corp. | 3,066,607 |
| 606,382 | | Oracle Corp. | 19,871,138 |
| 225,200 | | Qualcomm, Inc. | 11,620,320 |
| 884,683 | 1 | Symantec Corp. | 15,048,458 |
| 707,000 | 1 | Teradyne, Inc. | 10,124,240 |
| | TOTAL | 212,391,142 |
| | Materials – 3.2% | |
| 98,800 | | Agrium, Inc. | 8,130,252 |
| 19,400 | | CF Industries Holdings, Inc. | 3,148,038 |
| 108,600 | | Eastman Chemical Co. | 4,266,894 |
| 138,784 | | Mosaic Co./The | 8,127,191 |
| 145,200 | | Newmont Mining Corp. | 9,703,716 |
| | TOTAL | 33,376,091 |
| | Telecommunication Services – 2.9% | |
| 331,341 | | AT&T, Inc. | 9,711,605 |
| 567,834 | | Verizon Communications, Inc. | 20,998,501 |
| | TOTAL | 30,710,106 |
| | Utilities – 4.2% | |
| 737,200 | | CMS Energy Corp. | 15,348,504 |
| 339,000 | | FirstEnergy Corp. | 15,241,440 |
| 431,200 | | Wisconsin Energy Corp. | 13,983,816 |
| | TOTAL | 44,573,760 |
| | TOTAL COMMON STOCKS
(IDENTIFIED COST $971,896,657) | 1,043,573,743 |
| | MUTUAL FUND – 3.3% | |
| 34,771,413 | 2,3 | Federated Prime Value Obligations Fund, Institutional Shares, 0.18%
(AT NET ASSET VALUE) | 34,771,413 |
| | TOTAL INVESTMENTS — 101.6%
(IDENTIFIED COST $1,006,668,070)4 | 1,078,345,156 |
| | OTHER ASSETS AND LIABILITIES - NET — (1.6)%5 | (16,981,760) |
| | TOTAL NET ASSETS — 100% | $1,061,363,396 |
| 1 | Non-income producing security. |
| 2 | Affiliated holding. |
| 3 | 7-Day net yield. |
| 4 | The cost of investments for federal tax purposes amounts to $1,015,896,096. |
| 5 | Assets, other than investments in securities, less liabilities. See Statement of Assets and Liabilities. |
Note: The categories of investments are shown as a percentage of total net assets at October 31, 2011.
Annual Shareholder ReportVarious inputs are used in determining the value of the Fund's investments. These inputs are summarized in the three broad levels listed below:
Level 1 — quoted prices in active markets for identical securities, including investment companies with daily net asset values, if applicable.
Level 2 — other significant observable inputs (including quoted prices for similar securities, interest rates, prepayment speeds, credit risk, etc.). Also includes securities valued at amortized cost.
Level 3 — significant unobservable inputs (including the Fund's own assumptions in determining the fair value of investments).
The inputs or methodology used for valuing securities are not an indication of the risk associated with investing in those securities.
The following is a summary of the inputs used, as of October 31, 2011, in valuing the Fund's assets carried at fair value:
| Valuation Inputs | | | | |
| Level 1 —
Quoted
Prices and
Investments in
Mutual Funds | Level 2 —
Other
Significant
Observable
Inputs | Level 3 —
Significant
Unobservable
Inputs | Total |
| Equity Securities: | | | | |
| Common Stocks | | | | |
| Domestic | $1,008,023,919 | $ — | $ — | $1,008,023,919 |
| International | 19,305,039 | 16,244,785 | — | 35,549,824 |
| Mutual Fund | 34,771,413 | — | — | 34,771,413 |
| TOTAL SECURITIES | $1,062,100,371 | $16,244,785 | $ — | $1,078,345,156 |
See Notes which are an integral part of the Financial Statements
Annual Shareholder Report Financial Highlights – Class A Shares
(For a Share Outstanding Throughout Each Period)
| Year Ended October 31 | 2011 | 2010 | 2009 | 2008 | 2007 |
| Net Asset Value, Beginning of Period | $18.13 | $16.13 | $16.03 | $28.14 | $27.91 |
| Income From Investment Operations: | | | | | |
| Net investment income | 0.111 | 0.101 | 0.171 | 0.181 | 0.151 |
Net realized and unrealized gain
(loss) on investments and foreign
currency transactions | (0.24) | 2.02 | 0.09 | (6.60) | 4.62 |
| TOTAL FROM INVESTMENT OPERATIONS | (0.13) | 2.12 | 0.26 | (6.42) | 4.77 |
| Less Distributions: | | | | | |
| Distributions from net investment income | (0.11) | (0.12) | (0.16) | (0.15) | (0.18) |
Distributions from net realized
gain on investments and foreign
currency transactions | — | — | — | (5.54) | (4.36) |
| TOTAL DISTRIBUTIONS | (0.11) | (0.12) | (0.16) | (5.69) | (4.54) |
| Net Asset Value, End of Period | $17.89 | $18.13 | $16.13 | $16.03 | $28.14 |
| Total Return2 | (0.76)% | 13.20% | 1.71% | (27.70)% | 19.78% |
| Ratios to Average Net Assets: | | | | | |
| Net expenses | 1.24%3 | 1.24%3 | 1.23%3 | 1.25%3 | 1.23%3 |
| Net investment income | 0.58% | 0.58% | 1.11% | 0.88% | 0.59% |
| Expense waiver/reimbursement4 | 0.07% | 0.04% | 0.08% | 0.01% | 0.01% |
| Supplemental Data: | | | | | |
| Net assets, end of period (000 omitted) | $784,928 | $865,886 | $943,922 | $939,280 | $1,433,917 |
| Portfolio turnover | 175% | 245% | 254% | 252% | 165% |
| 1 | Per share numbers have been calculated using the average shares method. |
| 2 | Based on net asset value, which does not reflect the sales charge, redemption fee or contingent deferred sales charge, if applicable. |
| 3 | The net expense ratio is calculated without reduction for expense offset arrangements. The net expense ratios are 1.24%, 1.23%, 1.22%, 1.24% and 1.22% for the years ended October 31, 2011, 2010, 2009, 2008 and 2007, respectively, after taking into account these expense reductions. |
| 4 | This expense decrease is reflected in both the net expense and the net investment income ratios shown above. |
See Notes which are an integral part of the Financial Statements
Annual Shareholder Report Financial Highlights – Class B Shares
(For a Share Outstanding Throughout Each Period)
| Year Ended October 31 | 2011 | 2010 | 2009 | 2008 | 2007 |
| Net Asset Value, Beginning of Period | $17.20 | $15.32 | $15.24 | $27.07 | $27.03 |
| Income From Investment Operations: | | | | | |
| Net investment income (loss) | (0.05)1 | (0.04)1 | 0.041 | 0.021 | (0.05)1 |
Net realized and unrealized gain
(loss) on investments and foreign
currency transactions | (0.22) | 1.92 | 0.08 | (6.31) | 4.45 |
| TOTAL FROM INVESTMENT OPERATIONS | (0.27) | 1.88 | 0.12 | (6.29) | 4.40 |
| Less Distributions: | | | | | |
| Distributions from net investment income | — | — | (0.04) | — | — |
Distributions from net realized
gain on investments and foreign
currency transactions | — | — | — | (5.54) | (4.36) |
| TOTAL DISTRIBUTIONS | — | — | (0.04) | (5.54) | (4.36) |
| Net Asset Value, End of Period | $16.93 | $17.20 | $15.32 | $15.24 | $27.07 |
| Total Return2 | (1.57)% | 12.27% | 0.83% | (28.29)% | 18.82% |
| Ratios to Average Net Assets: | | | | | |
| Net expenses | 2.10%3 | 2.10%3 | 2.10%3 | 2.05%3 | 2.03%3 |
| Net investment income (loss) | (0.28)% | (0.27)% | 0.31% | 0.10% | (0.22)% |
| Expense waiver/reimbursement4 | 0.04% | 0.01% | 0.02% | 0.01% | 0.01% |
| Supplemental Data: | | | | | |
| Net assets, end of period (000 omitted) | $64,708 | $116,426 | $163,827 | $221,131 | $423,377 |
| Portfolio turnover | 175% | 245% | 254% | 252% | 165% |
| 1 | Per share numbers have been calculated using the average shares method. |
| 2 | Based on net asset value, which does not reflect the sales charge, redemption fee or contingent deferred sales charge, if applicable. |
| 3 | The net expense ratio is calculated without reduction for expense offset arrangements. The net expense ratios are 2.10%, 2.09%, 2.09%, 2.04% and 2.02% for the years ended October 31, 2011, 2010, 2009, 2008 and 2007, respectively, after taking into account these expense reductions. |
| 4 | This expense decrease is reflected in both the net expense and the net investment income (loss) ratios shown above. |
See Notes which are an integral part of the Financial Statements
Annual Shareholder Report Financial Highlights – Class C Shares
(For a Share Outstanding Throughout Each Period)
| Year Ended October 31 | 2011 | 2010 | 2009 | 2008 | 2007 |
| Net Asset Value, Beginning of Period | $17.17 | $15.29 | $15.23 | $27.05 | $27.00 |
| Income From Investment Operations: | | | | | |
| Net investment income (loss) | (0.04)1 | (0.04)1 | 0.041 | 0.021 | (0.05)1 |
Net realized and unrealized gain
(loss) on investments and foreign
currency transactions | (0.23) | 1.92 | 0.09 | (6.30) | 4.46 |
| TOTAL FROM INVESTMENT OPERATIONS | (0.27) | 1.88 | 0.13 | (6.28) | 4.41 |
| Less Distributions: | | | | | |
| Distributions from net investment income | — | — | (0.07) | — | — |
Distributions from net realized
gain on investments and foreign
currency transactions | — | — | — | (5.54) | (4.36) |
| TOTAL DISTRIBUTIONS | — | — | (0.07) | (5.54) | (4.36) |
| Net Asset Value, End of Period | $16.90 | $17.17 | $15.29 | $15.23 | $27.05 |
| Total Return2 | (1.57)% | 12.30% | 0.89% | (28.27)% | 18.89% |
| Ratios to Average Net Assets: | | | | | |
| Net expenses | 2.06%3 | 2.06%3 | 2.06%3 | 2.03%3 | 2.01%3 |
| Net investment income (loss) | (0.24)% | (0.23)% | 0.30% | 0.11% | (0.20)% |
| Expense waiver/reimbursement4 | 0.02% | 0.01% | 0.02% | 0.01% | 0.01% |
| Supplemental Data: | | | | | |
| Net assets, end of period (000 omitted) | $64,550 | $77,045 | $83,060 | $88,572 | $144,473 |
| Portfolio turnover | 175% | 245% | 254% | 252% | 165% |
| 1 | Per share numbers have been calculated using the average shares method. |
| 2 | Based on net asset value, which does not reflect the sales charge, redemption fee or contingent deferred sales charge, if applicable. |
| 3 | The net expense ratio is calculated without reduction for expense offset arrangements. The net expense ratios are 2.06%, 2.05%, 2.05%, 2.02% and 2.00% for the years ended October 31, 2011, 2010, 2009, 2008 and 2007, respectively, after taking into account these expense reductions. |
| 4 | This expense decrease is reflected in both the net expense and the net investment income (loss) ratios shown above. |
See Notes which are an integral part of the Financial Statements
Annual Shareholder Report Financial Highlights – Class R Shares
(For a Share Outstanding Throughout Each Period)
| Year Ended October 31 | 2011 | 2010 | 2009 | 2008 | 2007 |
| Net Asset Value, Beginning of Period | $17.93 | $15.94 | $15.90 | $27.98 | $27.80 |
| Income From Investment Operations: | | | | | |
| Net investment income | 0.071 | 0.021 | 0.111 | 0.071 | 0.031 |
Net realized and unrealized gain
(loss) on investments and foreign
currency transactions | (0.24) | 2.00 | 0.08 | (6.55) | 4.61 |
| TOTAL FROM INVESTMENT OPERATIONS | (0.17) | 2.02 | 0.19 | (6.48) | 4.64 |
| Less Distributions: | | | | | |
| Distributions from net investment income | (0.04) | (0.03) | (0.15) | (0.06) | (0.10) |
Distributions from net realized
gain on investments and foreign
currency transactions | — | — | — | (5.54) | (4.36) |
| TOTAL DISTRIBUTIONS | (0.04) | (0.03) | (0.15) | (5.60) | (4.46) |
| Net Asset Value, End of Period | $17.72 | $17.93 | $15.94 | $15.90 | $27.98 |
| Total Return2 | (0.97)% | 12.70% | 1.30% | (28.05)% | 19.26% |
| Ratios to Average Net Assets: | | | | | |
| Net expenses | 1.47%3 | 1.69%3 | 1.71%3 | 1.70%3 | 1.68%3 |
| Net investment income | 0.36% | 0.14% | 0.78% | 0.33% | 0.11% |
| Expense waiver/reimbursement4 | 0.24% | 0.01% | 0.02% | 0.01% | 0.01% |
| Supplemental Data: | | | | | |
| Net assets, end of period (000 omitted) | $28,461 | $22,290 | $21,994 | $39,155 | $19,768 |
| Portfolio turnover | 175% | 245% | 254% | 252% | 165% |
| 1 | Per share numbers have been calculated using the average shares method. |
| 2 | Based on net asset value. |
| 3 | The net expense ratio is calculated without reduction for expense offset arrangements. The net expense ratios are 1.47%, 1.68%, 1.70%, 1.69% and 1.67% for the years ended October 31, 2011, 2010, 2009, 2008 and 2007, respectively, after taking into account these expense reductions. |
| 4 | This expense decrease is reflected in both the net expense and the net investment income ratios shown above. |
See Notes which are an integral part of the Financial Statements
Annual Shareholder Report Financial Highlights – Institutional Shares
(For a Share Outstanding Throughout Each Period)
| Year Ended October 31, | Period Ended
10/31/20081 |
| 2011 | 2010 | 2009 |
| Net Asset Value, Beginning of Period | $18.15 | $16.14 | $16.06 | $21.34 |
| Income From Investment Operations: | | | | |
| Net investment income | 0.162 | 0.152 | 0.182 | 0.152 |
| Net realized and unrealized gain (loss) on investments and foreign currency transactions | (0.24) | 2.03 | 0.11 | (5.43) |
| TOTAL FROM INVESTMENT OPERATIONS | (0.08) | 2.18 | 0.29 | (5.28) |
| Less Distributions: | | | | |
| Distributions from net investment income | (0.16) | (0.17) | (0.21) | — |
| Net Asset Value, End of Period | $17.91 | $18.15 | $16.14 | $16.06 |
| Total Return3 | (0.47)% | 13.55% | 1.97% | (24.74)% |
| Ratios to Average Net Assets: | | | | |
| Net expenses | 0.98%4 | 0.95%4 | 0.96%4 | 0.96%4,5 |
| Net investment income | 0.85% | 0.89% | 1.22% | 0.93%5 |
| Expense waiver/reimbursement6 | 0.02% | 0.01% | 0.03% | 0.02%5 |
| Supplemental Data: | | | | |
| Net assets, end of period (000 omitted) | $118,716 | $168,884 | $211,470 | $75,775 |
| Portfolio turnover | 175% | 245% | 254% | 252%7 |
| 1 | Reflects operations for the period from December 31, 2007 (date of initial investment) to October 31, 2008. |
| 2 | Per share numbers have been calculated using the average shares method. |
| 3 | Based on net asset value. Total returns for periods of less than one year are not annualized. |
| 4 | The net expense ratio is calculated without reduction for expense offset arrangements. The net expense ratios are 0.98%, 0.94%, 0.95% and 0.94% for the years ended October 31, 2011, 2010 and 2009, and the period ended October 31, 2008, respectively, after taking into account these expense reductions. |
| 5 | Computed on an annualized basis. |
| 6 | This expense decrease is reflected in both the net expense and the net investment income ratios shown above. |
| 7 | Portfolio turnover is calculated at the Fund level. Percentage indicated was calculated for the year ended October 31, 2008. |
See Notes which are an integral part of the Financial Statements
Annual Shareholder Report Statement of Assets and Liabilities
October 31, 2011
| Assets: | | |
| Total investments in securities, at value including $34,771,413 of investments in an affiliated holding (Note 5) (identified cost $1,006,668,070) | | $1,078,345,156 |
| Cash | | 337 |
| Income receivable | | 1,745,693 |
| Receivable for investments sold | | 5,895,819 |
| Receivable for shares sold | | 936,497 |
| TOTAL ASSETS | | 1,086,923,502 |
| Liabilities: | | |
| Payable for investments purchased | $21,875,301 | |
| Payable for shares redeemed | 2,588,163 | |
| Payable for Directors'/Trustees' fees | 2,967 | |
| Payable for distribution services fee (Note 5) | 86,893 | |
| Payable for shareholder services fee (Note 5) | 430,818 | |
| Accrued expenses | 575,964 | |
| TOTAL LIABILITIES | | 25,560,106 |
| Net assets for 59,742,507 shares outstanding | | $1,061,363,396 |
| Net Assets Consist of: | | |
| Paid-in capital | | $1,105,697,041 |
| Net unrealized appreciation of investments and translation of assets and liabilities in foreign currency | | 71,681,947 |
| Accumulated net realized loss on investments and foreign currency transactions | | (121,581,818) |
| Undistributed net investment income | | 5,566,226 |
| TOTAL NET ASSETS | | $1,061,363,396 |
Annual Shareholder ReportStatement of Assets and Liabilities — continued| Net Asset Value, Offering Price and Redemption Proceeds Per Share | | |
| Class A Shares: | | |
Net asset value per share ($784,928,232 ÷ 43,865,019 shares outstanding),
no par value, unlimited shares authorized | | $17.89 |
| Offering price per share (100/94.50 of $17.89) | | $18.93 |
| Redemption proceeds per share | | $17.89 |
| Class B Shares: | | |
Net asset value per share ($64,707,851 ÷ 3,823,091 shares outstanding),
no par value, unlimited shares authorized | | $16.93 |
| Offering price per share | | $16.93 |
| Redemption proceeds per share (94.50/100 of $16.93) | | $16.00 |
| Class C Shares: | | |
Net asset value per share ($64,549,965 ÷ 3,819,309 shares outstanding),
no par value, unlimited shares authorized | | $16.90 |
| Offering price per share | | $16.90 |
| Redemption proceeds per share (99.00/100 of $16.90) | | $16.73 |
| Class R Shares: | | |
Net asset value per share ($28,461,475 ÷ 1,606,413 shares outstanding),
no par value, unlimited shares authorized | | $17.72 |
| Offering price per share | | $17.72 |
| Redemption proceeds per share | | $17.72 |
| Institutional Shares: | | |
Net asset value per share ($118,715,873 ÷ 6,628,675 shares outstanding),
no par value, unlimited shares authorized | | $17.91 |
| Offering price per share | | $17.91 |
| Redemption proceeds per share | | $17.91 |
See Notes which are an integral part of the Financial Statements
Annual Shareholder Report Statement of Operations
Year Ended October 31, 2011
| Investment Income: | | | |
| Dividends (including $52,644 received from an affiliated holding (Note 5) and net of foreign taxes withheld of $180,727) | | | $21,821,314 |
| Expenses: | | | |
| Investment adviser fee (Note 5) | | $8,979,740 | |
| Administrative fee (Note 5) | | 935,303 | |
| Custodian fees | | 63,821 | |
| Transfer and dividend disbursing agent fees and expenses (Note 2) | | 2,198,094 | |
| Directors'/Trustees' fees | | 15,529 | |
| Auditing fees | | 28,548 | |
| Legal fees | | 5,941 | |
| Portfolio accounting fees | | 188,155 | |
| Distribution services fee (Note 5) | | 1,392,303 | |
| Shareholder services fee (Note 5) | | 2,519,737 | |
| Account administration fee (Note 2) | | 17,128 | |
| Share registration costs | | 87,018 | |
| Printing and postage | | 174,032 | |
| Insurance premiums | | 6,657 | |
| Miscellaneous | | 9,601 | |
| TOTAL EXPENSES | | 16,621,607 | |
| Waivers, Reimbursements and Reduction: | | | |
| Waiver/reimbursement of investment adviser fee (Note 5) | $(100,826) | | |
| Waiver of administrative fee (Note 5) | (24,158) | | |
| Waiver of distribution services fee (Note 5) | (61,857) | | |
| Reimbursement of transfer and dividend disbursing agent fees and expenses (Note 2) and (Note 5) | (471,747) | | |
| Fees paid indirectly from directed brokerage arrangements (Note 6) | (59,649) | | |
| TOTAL WAIVERS, REIMBURSEMENTS AND REDUCTION | | (718,237) | |
| Net expenses | | | 15,903,370 |
| Net investment income | | | 5,917,944 |
| Realized and Unrealized Gain (Loss) on Investments and Foreign Currency Transactions: | | | |
| Net realized gain on investments and foreign currency transactions | | | 98,051,399 |
| Net change in unrealized appreciation of investments and translation of assets and liabilities in foreign currency | | | (110,625,929) |
| Net realized and unrealized loss on investments and foreign currency transactions | | | (12,574,530) |
| Change in net assets resulting from operations | | | $(6,656,586) |
See Notes which are an integral part of the Financial Statements
Annual Shareholder Report Statement of Changes in Net Assets
| Year Ended October 31 | 2011 | 2010 |
| Increase (Decrease) in Net Assets | | |
| Operations: | | |
| Net investment income | $5,917,944 | $6,603,538 |
| Net realized gain on investments and foreign currency transactions | 98,051,399 | 172,122,508 |
| Net change in unrealized appreciation/depreciation of investments and translation of assets and liabilities in foreign currency | (110,625,929) | (17,753,994) |
| CHANGE IN NET ASSETS RESULTING FROM OPERATIONS | (6,656,586) | 160,972,052 |
| Distributions to Shareholders: | | |
| Distributions from net investment income | | |
| Class A Shares | (5,067,934) | (7,037,863) |
| Class R Shares | (46,090) | (44,650) |
| Institutional Shares | (1,517,759) | (2,145,146) |
| CHANGE IN NET ASSETS RESULTING FROM DISTRIBUTIONS TO SHAREHOLDERS | (6,631,783) | (9,227,659) |
| Share Transactions: | | |
| Proceeds from sale of shares | 170,731,406 | 240,378,961 |
| Proceeds from shares issued in connection with the tax-free transfer of assets from Equitrust Series Fund, Inc., Blue Chip Portfolio | 45,934,321 | — |
| Proceeds from shares issued in connection with the tax-free transfer of assets from Equitrust Series Fund, Inc., Value Growth Portfolio | 62,700,801 | — |
| Proceeds from shares issued in connection with the tax-free transfer of assets from Trustco Common Trust Fund | — | 54,788,921 |
| Net asset value of shares issued to shareholders in payment of distributions declared | 4,919,430 | 6,861,503 |
| Cost of shares redeemed | (460,166,012) | (627,515,190) |
| CHANGE IN NET ASSETS RESULTING FROM SHARE TRANSACTIONS | (175,880,054) | (325,485,805) |
| Change in net assets | (189,168,423) | (173,741,412) |
| Net Assets: | | |
| Beginning of period | 1,250,531,819 | 1,424,273,231 |
| End of period (including undistributed net investment income of $5,566,226 and $6,626,694, respectively) | $1,061,363,396 | $1,250,531,819 |
See Notes which are an integral part of the Financial Statements
Annual Shareholder Report Notes to Financial Statements
October 31, 2011
1. ORGANIZATION
Federated Equity Funds (the “Trust”) is registered under the Investment Company Act of 1940, as amended (the “Act”), as an open-end management investment company. The Trust consists of 13 portfolios. The financial statements included herein are only those of Federated Capital Appreciation Fund (the “Fund”), a diversified portfolio. The financial statements of the other portfolios are presented separately. The assets of each portfolio are segregated and a shareholder's interest is limited to the portfolio in which shares are held. Each portfolio pays its own expenses. The Fund offers five classes of shares: Class A Shares, Class B Shares, Class C Shares, Class R Shares and Institutional Shares. All shares of the Fund have equal rights with respect to voting, except on class-specific matters. The investment objective of the Fund is to provide capital appreciation.
On July 15, 2011, the Fund acquired all of the net assets of EquiTrust Series Fund Inc., Blue Chip Portfolio and EquiTrust Series Fund Inc., Value Growth Portfolio (the “Acquired Funds”), open-end investment companies, in a tax-free reorganization in exchange for shares of the Fund, pursuant to a plan of reorganization approved by the Acquired Funds' shareholders on July 15, 2011. The purpose of the transaction was to combine three portfolios with comparable investment objectives and strategies. For financial reporting purposes, assets received and shares issued by the Fund were recorded at fair value; however, the cost basis of the investments received from the Acquired Funds was carried forward to align ongoing reporting of the Fund's realized and unrealized gains and losses with amounts distributable to shareholders for tax purposes.
Assuming the acquisition had been completed on November 1, 2010, the beginning of the annual reporting period of the Fund, the Fund's pro forma results of operations for the year ended October 31, 2011, are as follows:
| Net investment income (loss)* | $6,688,461 |
| Net realized and unrealized loss on investments | $(820,269) |
| Net increase in net assets resulting from operations | $5,868,192 |
| * | Net investment income includes $13,847 of pro forma additional expenses. |
Because the combined investment portfolios have been managed as a single integrated portfolio since the acquisition was completed, it is not practicable to separate the amounts of revenue and earnings of the Acquired Funds that has been included in the Fund's Statement of Operations as of October 31, 2011.
For every one share of EquiTrust Series Fund Inc., Blue Chip Portfolio Class A Shares exchanged, a shareholder received 2.145 shares of Federated Capital Appreciation Fund Class A Shares.
For every one share of EquiTrust Series Fund Inc., Blue Chip Portfolio Class B Shares exchanged, a shareholder received 2.143 shares of Federated Capital Appreciation Fund Class A Shares.
For every one share of EquiTrust Series Fund Inc., Blue Chip Portfolio Class I Shares exchanged, a shareholder received 2.160 shares of Federated Capital Appreciation Fund Institutional Shares.
Annual Shareholder Report
For every one share of EquiTrust Series Fund Inc., Value Growth Portfolio Class A Shares or Class B Shares exchanged, a shareholder received 0.801 shares of Federated Capital Appreciation Fund Class A Shares.For every one share of EquiTrust Series Fund Inc., Value Growth Portfolio Class I Shares exchanged, a shareholder received 0.810 shares of Federated Capital Appreciation Fund Institutional Shares.
On July 15, 2011, the Fund received assets from Equitrust Series Fund, Inc., Blue Chip Portfolio as a result of a tax-free reorganization, as follows:
Shares of the
Fund Issued | Equitrust
Series Fund, Inc.,
Blue Chip Portfolio
Net Assets
Received | Unrealized
Appreciation1 | Net Assets
of the Fund
Immediately
Prior to
Combination | Net Assets
of the Fund
Immediately
After
Combination2 |
| 2,398,660 | $45,934,321 | $16,560,900 | $1,140,815,602 | $1,249,450,724 |
| 1 | Unrealized Appreciation is included in the Equitrust Series Fund, Inc. Net Assets Received amount shown above. |
| 2 | Net Assets of the Fund Immediately After Combination includes the net assests received from EquiTrust Series Fund, Inc., Value Growth Portfolio, which also reorganized into the Fund on July 15, 2011. |
On July 15, 2011, the Fund received assets from Equitrust Series Fund, Inc., Value Growth Portfolio as a result of a tax-free reorganization, as follows:
Shares of the
Fund Issued | Equitrust
Series Fund, Inc.,
Value Growth
Portfolio
Net Assets
Received | Unrealized
Appreciation1 | Net Assets
of the Fund
Immediately
Prior to
Combination | Net Assets
of the Fund
Immediately
After
Combination2 |
| 3,274,169 | $62,700,801 | $2,500,605 | $1,140,815,602 | $1,249,450,724 |
| 1 | Unrealized Appreciation is included in the Equitrust Series Fund, Inc. Net Assets Received amount shown above. |
| 2 | Net Assets of the Fund Immediately After Combination includes the net assests received from EquiTrust Series Fund, Inc., Blue Chip Portfolio, which also reorganized into the Fund on July 15, 2011. |
On March 19, 2010, the Fund received assets from Trustco Common Trust Fund as a result of a tax-free reorganization, as follows:1
Shares of the
Fund Issued | Trustco
Common
Trust Fund
Net Assets
Received | Unrealized
Appreciation2 | Net Assets
of the Fund
Immediately
Prior to
Combination | Net Assets
of the Fund
Immediately
After
Combination |
| 3,088,440 | $54,788,921 | $14,241,729 | $1,477,686,550 | $1,532,475,471 |
| 1 | Additional performance information is not included due to the relative size of the transaction. |
| 2 | Unrealized Appreciation is included in the Trustco Common Trust Fund Net Assets Received amount shown above. |
Annual Shareholder Report2. SIGNIFICANT ACCOUNTING POLICIES
The following is a summary of significant accounting policies consistently followed by the Fund in the preparation of its financial statements. These policies are in conformity with U.S. generally accepted accounting principles (GAAP).
Investment Valuation
In calculating its net asset value (NAV), the Fund generally values investments as follows:
- Equity securities listed on an exchange or traded through a regulated market system are valued at their last reported sale price or official closing price in their principal exchange or market.
- Shares of other mutual funds are valued based upon their reported NAVs.
- Derivative contracts listed on exchanges are valued at their reported settlement or closing price.
- Over-the-counter (OTC) derivative contracts are fair valued using price evaluations provided by a pricing service approved by the Board of Trustees (the “Trustees”).
- Fixed-income securities acquired with remaining maturities greater than 60 days are fair valued using price evaluations provided by a pricing service approved by the Trustees.
- Fixed-income securities acquired with remaining maturities of 60 days or less are valued at their cost (adjusted for the accretion of any discount or amortization of any premium), which approximates market value.
- For securities that are fair valued in accordance with procedures established by and under the general supervision of the Trustees, certain factors may be considered such as: the purchase price of the security, information obtained by contacting the issuer, analysis of the issuer's financial statements or other available documents, fundamental analytical data, the nature and duration of restrictions on disposition, the movement of the market in which the security is normally traded and public trading in similar securities of the issuer or comparable issuers.
If the Fund cannot obtain a price or price evaluation from a pricing service for an investment, the Fund may attempt to value the investment based upon the mean of bid and asked quotations or fair value the investment based on price evaluations, from one or more dealers. If any price, quotation, price evaluation or other pricing source is not readily available when the NAV is calculated, the Fund uses the fair value of the investment determined in accordance with the procedures described below. There can be no assurance that the Fund could purchase or sell an investment at the price used to calculate the Fund's NAV.
Fair Valuation and Significant Events Procedures
The Trustees have authorized the use of pricing services to provide evaluations of the current fair value of certain investments for purposes of calculating the NAV. Factors considered by pricing services in evaluating an investment include the yields or prices of investments of comparable quality, coupon, maturity, call rights and other potential prepayments, terms and type, reported transactions, indications as to values from dealers and general market conditions. Some pricing services provide a single price evaluation reflecting the bid-side of the market for an investment (a “bid” evaluation). Other pricing services offer both bid evaluations and price evaluations indicative of a price between the prices bid and asked for the investment (a “mid” evaluation). The Fund normally uses bid evaluations for U.S. Treasury and Agency securities and mortgage-backed securities. The Fund normally uses mid evaluations for other types of fixed-income securities and OTC derivative contracts. In the event that market quotations and price evaluations are not available for an investment, the fair value of the investment is determined in accordance with procedures adopted by the Trustees.
Annual Shareholder Report
The Trustees also have adopted procedures requiring an investment to be priced at its fair value whenever the Adviser determines that a significant event affecting the value of the investment has occurred between the time as of which the price of the investment would otherwise be determined and the time as of which the NAV is computed. An event is considered significant if there is both an affirmative expectation that the investment's value will change in response to the event and a reasonable basis for quantifying the resulting change in value. Examples of significant events that may occur after the close of the principal market on which a security is traded, or after the time of a price evaluation provided by a pricing service or a dealer, include:- With respect to securities traded in foreign markets, significant trends in U.S. equity markets or in the trading of foreign securities index futures or options contracts;
- With respect to price evaluations of fixed-income securities determined before the close of regular trading on the NYSE, actions by the Federal Reserve Open Market Committee and other significant trends in U.S. fixed-income markets;
- Political or other developments affecting the economy or markets in which an issuer conducts its operations or its securities are traded; and
- Announcements concerning matters such as acquisitions, recapitalizations, litigation developments, a natural disaster affecting the issuer's operations or regulatory changes or market developments affecting the issuer's industry.
The Trustees have approved the use of a pricing service to determine the fair value of equity securities traded principally in foreign markets when the Adviser determines that there has been a significant trend in the U.S. equity markets or in index futures trading. For other significant events, the Fund may seek to obtain more current quotations or price evaluations from alternative pricing sources. If a reliable alternative pricing source is not available, the Fund will determine the fair value of the investment using another method approved by the Trustees.
Repurchase Agreements
The Fund may invest in repurchase agreements for short-term liquidity purposes. It is the policy of the Fund to require the other party to a repurchase agreement to transfer to the Fund's custodian or sub-custodian eligible securities or cash with a market value (after transaction costs) at least equal to the repurchase price to be paid under the repurchase agreement. The eligible securities are transferred to accounts with the custodian or sub-custodian in which the Fund holds a “securities entitlement” and exercises “control” as those terms are defined in the Uniform Commercial Code. The Fund has established procedures for monitoring the market value of the transferred securities and requiring the transfer of additional eligible securities if necessary to equal at least the repurchase price. These procedures also allow the other party to require securities to be transferred from the account to the extent that their market value exceeds the repurchase price or in exchange for other eligible securities of equivalent market value.
The insolvency of the other party or other failure to repurchase the securities may delay the disposition of the underlying securities or cause the Fund to receive less than the full repurchase price. Under the terms of the repurchase agreement, any amounts received by the Fund in excess of the repurchase price and related transaction costs must be remitted to the other party.
Annual Shareholder Report
The Fund may enter into repurchase agreements in which eligible securities are transferred into joint trading accounts maintained by the custodian or sub-custodian for investment companies and other clients advised by the Fund's Adviser and its affiliates. The Fund will participate on a pro rata basis with the other investment companies and clients in its share of the securities transferred under such repurchase agreements and in its share of proceeds from any repurchase or other disposition of such securities.Investment Income, Gains and Losses, Expenses and Distributions
Investment transactions are accounted for on a trade-date basis. Realized gains and losses from investment transactions are recorded on an identified-cost basis. Interest income and expenses are accrued daily. Dividend income and distributions to shareholders are recorded on the ex-dividend date. Foreign dividends are recorded on the ex-dividend date or when the Fund is informed of the ex-dividend date. Distributions of net investment income are declared and paid annually. Non-cash dividends included in dividend income, if any, are recorded at fair value. Investment income, realized and unrealized gains and losses, and certain fund-level expenses are allocated to each class based on relative average daily net assets, except that Class A Shares, Class B Shares, Class C Shares, Class R Shares and Institutional Shares may bear distribution services fees, shareholder services fees, account administration fees and certain transfer and dividend disbursing agent fees unique to those classes. For the year ended October 31, 2011, transfer and dividend disbursing agent fees and account administration fees for the Fund were as follows:
| Transfer and
Dividend
Disbursing
Agent Fees
Incurred | Transfer and
Dividend
Disbursing
Agent Fees
Reimbursed | Account
Administration
Fees Incurred |
| Class A Shares | $1,526,451 | $(435,162) | $14,250 |
| Class B Shares | 242,915 | (20,170) | — |
| Class C Shares | 153,637 | (4,740) | 2,878 |
| Class R Shares | 90,334 | — | — |
| Institutional Shares | 184,757 | (11,675) | — |
| TOTAL | $2,198,094 | $(471,747) | $17,128 |
Dividends are declared separately for each class. No class has preferential dividend rights; differences in per share dividend rates are generally due to differences in separate class expenses.
Premium and Discount Amortization
All premiums and discounts on fixed-income securities are amortized/accreted using the effective interest rate method.
Federal Taxes
It is the Fund's policy to comply with the Subchapter M provision of the Internal Revenue Code (the “Code”) and to distribute to shareholders each year substantially all of its income. Accordingly, no provision for federal income tax is necessary. As of and during the year ended October 31, 2011, the Fund did not have a liability for any uncertain tax positions. The Fund Annual Shareholder Report
recognizes interest and penalties, if any, related to tax liabilities as income tax expense in the Statement of Operations. As of October 31, 2011, tax years 2008 through 2011 remain subject to examination by the Fund's major tax jurisdictions, which include the United States of America and the Commonwealth of Massachusetts.The Fund may be subject to taxes imposed by governments of countries in which it invests. Such taxes are generally based on either income or gains earned or repatriated. The Fund accrues and applies such taxes to net investment income, net realized gains and net unrealized gains as income and/or gains are earned.
When-Issued and Delayed Delivery Transactions
The Fund may engage in when-issued or delayed delivery transactions. The Fund records when-issued securities on the trade date and maintains security positions such that sufficient liquid assets will be available to make payment for the securities purchased. Securities purchased on a when-issued or delayed delivery basis are marked to market daily and begin earning interest on the settlement date. Losses may occur on these transactions due to changes in market conditions or the failure of counterparties to perform under the contract.
Foreign Exchange Contracts
The Fund enters into foreign exchange contracts for the delayed delivery of securities or foreign currency exchange transactions. The Fund enters into foreign exchange contracts to protect assets against adverse changes in foreign currency exchange rates or exchange control regulations. Purchased contracts are used to acquire exposure to foreign currencies, whereas, contracts to sell are used to hedge the Fund's securities against currency fluctuations. Risks may arise upon entering into these transactions from the potential inability of counterparties to meet the terms of their commitments and from unanticipated movements in security prices or foreign exchange rates. The foreign exchange contracts are adjusted by the daily exchange rate of the underlying currency and any gains or losses are recorded for financial statement purposes as unrealized until the settlement date.
At October 31, 2011, the Fund had no outstanding foreign exchange contracts.
The average value at settlement date payable and receivable of foreign exchange contracts purchased and sold by the Fund throughout the period was $101 and $165, respectively. This is based on the contracts held as of each month-end throughout the fiscal period.
Foreign Currency Translation
The accounting records of the Fund are maintained in U.S. dollars. All assets and liabilities denominated in foreign currencies (FCs) are translated into U.S. dollars based on the rates of exchange of such currencies against U.S. dollars on the date of valuation. Purchases and sales of securities, income and expenses are translated at the rate of exchange quoted on the respective date that such transactions are recorded. The Fund does not isolate that portion of the results of operations resulting from changes in foreign exchange rates on investments from the fluctuations arising from changes in market prices of securities held. Such fluctuations are included with the net realized and unrealized gain or loss from investments.
Annual Shareholder Report
Reported net realized foreign exchange gains or losses arise from sales of portfolio securities, sales and maturities of short-term securities, sales of FCs, currency gains or losses realized between the trade and settlement dates on securities transactions, the difference between the amounts of dividends, interest and foreign withholding taxes recorded on the Fund's books, and the U.S. dollar equivalent of the amounts actually received or paid. Net unrealized foreign exchange gains and losses arise from changes in the value of assets and liabilities other than investments in securities at fiscal year end, resulting from changes in the exchange rate.Additional Disclosure Related to Derivative Instruments
The Effect of Derivative Instruments on the Statement of Operations for the Year Ended October 31, 2011
| Amount of Realized Gain or (Loss) on Derivatives Recognized in Income |
| Forward
Currency
Contracts |
| Foreign exchange contracts | $2,602 |
Other
The preparation of financial statements in conformity with GAAP requires management to make estimates and assumptions that affect the amounts of assets, liabilities, expenses and revenues reported in the financial statements. Actual results could differ from those estimated.
3. SHARES OF BENEFICIAL INTEREST
The following tables summarize share activity:
| Year Ended October 31 | 2011 | 2010 |
| Class A Shares: | Shares | Amount | Shares | Amount |
| Shares sold | 6,348,935 | $118,719,508 | 8,064,581 | $137,093,950 |
| Proceeds from shares issued in connection with the tax-free transfer of assets from Equitrust Series Fund, Inc., Blue Chip Portfolio | 1,717,167 | 32,883,740 | — | — |
| Proceeds from shares issued in connection with the tax-free transfer of assets from Equitrust Series Fund, Inc., Value Growth Portfolio | 2,627,334 | 50,314,097 | — | — |
| Shares issued to shareholders in payment of distributions declared | 236,902 | 4,503,506 | 364,200 | 6,256,955 |
| Shares redeemed | (14,816,248) | (276,732,168) | (19,194,448) | (330,068,869) |
NET CHANGE RESULTING FROM
CLASS A SHARE TRANSACTIONS | (3,885,910) | $(70,311,317) | (10,765,667) | $(186,717,964) |
Annual Shareholder Report| Year Ended October 31 | 2011 | 2010 |
| Class B Shares: | Shares | Amount | Shares | Amount |
| Shares sold | 239,736 | $4,307,221 | 415,396 | $6,799,834 |
| Shares redeemed | (3,184,584) | (56,582,380) | (4,338,378) | (69,876,150) |
NET CHANGE RESULTING FROM
CLASS B SHARE TRANSACTIONS | (2,944,848) | $(52,275,159) | (3,922,982) | $(63,076,316) |
| Year Ended October 31 | 2011 | 2010 |
| Class C Shares: | Shares | Amount | Shares | Amount |
| Shares sold | 643,711 | $11,449,334 | 719,474 | $11,658,783 |
| Shares redeemed | (1,311,476) | (23,150,602) | (1,664,915) | (26,865,133) |
NET CHANGE RESULTING FROM
CLASS C SHARE TRANSACTIONS | (667,765) | $(11,701,268) | (945,441) | $(15,206,350) |
| Year Ended October 31 | 2011 | 2010 |
| Class R Shares: | Shares | Amount | Shares | Amount |
| Shares sold | 911,364 | $17,186,429 | 532,752 | $8,990,787 |
| Shares issued to shareholders in payment of distributions declared | 2,219 | 41,834 | 2,395 | 40,835 |
| Shares redeemed | (550,444) | (10,056,912) | (672,091) | (11,322,489) |
NET CHANGE RESULTING FROM
CLASS R SHARE TRANSACTIONS | 363,139 | $7,171,351 | (136,944) | $(2,290,867) |
| Year Ended October 31 | 2011 | 2010 |
| Institutional Shares: | Shares | Amount | Shares | Amount |
| Shares sold | 1,008,664 | $19,068,914 | 4,377,902 | $75,835,607 |
| Proceeds from shares issued in connection with the tax-free transfer of assets from Equitrust Series Fund, Inc., Blue Chip Portfolio | 681,493 | 13,050,581 | — | — |
| Proceeds from shares issued in connection with the tax-free transfer of assets from Equitrust Series Fund, Inc., Value Growth Portfolio | 646,835 | 12,386,704 | — | — |
| Proceeds from shares issued in connection with the tax-free transfer of assets from Trustco Common Trust Fund | — | — | 3,088,440 | 54,788,921 |
| Shares issued to shareholders in payment of distributions declared | 19,710 | 374,090 | 32,850 | 563,713 |
| Shares redeemed | (5,030,797) | (93,643,950) | (11,295,867) | (189,382,549) |
| NET CHANGE RESULTING FROM INSTITUTIONAL SHARE TRANSACTIONS | (2,674,095) | $(48,763,661) | (3,796,675) | $(58,194,308) |
NET CHANGE RESULTING FROM
TOTAL FUND SHARE TRANSACTIONS | (9,809,479) | $(175,880,054) | (19,567,709) | $(325,485,805) |
Annual Shareholder Report4. FEDERAL TAX INFORMATION
The timing and character of income and capital gain distributions are determined in accordance with income tax regulations, which may differ from GAAP. These differences are due in part to differing treatments for capital loss carryforwards acquired through mergers and regulatory settlement proceeds.
For the year ended October 31, 2011, permanent differences identified and reclassified among the components of net assets were as follows:
| Increase (Decrease) |
| Paid-In Capital | Undistributed
Net Investment
Income (Loss) | Accumulated
Net Realized
Gain (Loss) |
| $629,813 | $(346,629) | $(283,184) |
Net investment income (loss), net realized gains (losses), and net assets were not affected by this reclassification.
The tax character of distributions as reported on the Statement of Changes in Net Assets for the years ended October 31, 2011 and 2010, was as follows:
| 2011 | 2010 |
| Ordinary income | $6,631,783 | $9,227,659 |
As of October 31, 2011, the components of distributable earnings on a tax basis were as follows:
| Undistributed ordinary income | $5,566,226 |
| Net unrealized appreciation | $62,453,921 |
| Capital loss carryforwards | $(112,353,792) |
The difference between book-basis and tax-basis net unrealized appreciation/depreciation is attributable to differing treatments for the deferral of losses on wash sales.
At October 31, 2011, the cost of investments for federal tax purposes was $1,015,896,096. The net unrealized appreciation of investments for federal tax purposes excluding any unrealized appreciation resulting from changes in foreign currency exchange rates was $62,449,060. This consists of net unrealized appreciation from investments for those securities having an excess of value over cost of $94,320,002 and net unrealized depreciation from investments for those securities having an excess of cost over value of $31,870,942.
At October 31, 2011, the Fund had a capital loss carryforward of $112,353,792 which will reduce the Fund's taxable income arising from future net realized gains on investments, if any, to the extent permitted by the Code and thus will reduce the amount of distributions to shareholders which would otherwise be necessary to relieve the Fund of any liability for federal income tax. Pursuant to the Code, such capital loss carryforward will expire as follows:
| Expiration Year | Expiration Amount |
| 2012 | $442,199 |
| 2017 | $111,911,593 |
Annual Shareholder ReportUnder the recently enacted Regulated Investment Company Modernization Act of 2010, the Fund will be permitted to carry forward capital losses incurred in taxable years beginning after December 22, 2010, for an unlimited period. However, any losses incurred during those future years will be required to be utilized prior to the losses incurred in pre-enactment tax years. As a result of this ordering rule, pre-enactment capital loss carryforwards may be more likely to expire unused. Additionally, post-enactment capital losses that are carried forward will retain their character as either short-term or long-term capital losses rather than being considered all short-term as under previous law.
As a result of the tax-free transfer of assets from fund mergers, the use of certain capital loss carryforwards listed above may be limited.
The Fund used capital loss carryforwards of $95,668,841 to offset taxable capital gains realized during the year ended October 31, 2011.
5. INVESTMENT ADVISER FEE AND OTHER TRANSACTIONS WITH AFFILIATES
Investment Adviser Fee
Federated Equity Management Company of Pennsylvania is the Fund's investment adviser (the “Adviser”). The advisory agreement between the Fund and the Adviser provides for an annual fee equal to 0.75% of the Fund's average daily net assets. Subject to the terms described in the Expense Limitation note, the Adviser may voluntarily choose to waive any portion of its fee. For the year ended October 31, 2011, the Adviser voluntarily waived $65,808 of its fee. In addition, for the year ended October 31, 2011, an affiliate of the Adviser reimbursed $471,747 of transfer and dividend disbursing agent fees and expenses.
Administrative Fee
Federated Administrative Services (FAS), under the Administrative Services Agreement, provides the Fund with administrative personnel and services. The fee paid to FAS is based on the average aggregate daily net assets of certain Federated funds as specified below:
| Administrative Fee | Average Aggregate Daily Net Assets
of the Federated Funds |
| 0.150% | on the first $5 billion |
| 0.125% | on the next $5 billion |
| 0.100% | on the next $10 billion |
| 0.075% | on assets in excess of $20 billion |
The administrative fee received during any fiscal year shall be at least $150,000 per portfolio and $40,000 per each additional class of Shares. Subject to the terms described in the Expense Limitation note, FAS may voluntarily choose to waive any portion of its fee. For the year ended October 31, 2011, the net fee paid to FAS was 0.076% of average daily net assets of the Fund. FAS waived $24,158 of its fee.
Annual Shareholder Report
Distribution Services Fee
The Fund has adopted a Distribution Plan (the “Plan”) pursuant to Rule 12b-1 under the Act. Under the terms of the Plan, the Fund will compensate Federated Securities Corp. (FSC), the principal distributor, from the daily net assets of the Fund's Class A Shares, Class B Shares, Class C Shares and Class R Shares to finance activities intended to result in the sale of these shares. The Plan provides that the Fund may incur distribution expenses at the following percentages of average daily net assets annually, to compensate FSC:
| Share Class Name | Percentage of Average Daily
Net Assets of Class |
| Class A Shares | 0.05% |
| Class B Shares | 0.75% |
| Class C Shares | 0.75% |
| Class R Shares | 0.50% |
Subject to the terms described in the Expense Limitation note, FSC may voluntarily choose to waive any portion of its fee. For the year ended October 31, 2011, distribution services fees for the Fund were as follows:
| Distribution
Services
Fees Incurred | Distribution
Services
Fees Waived |
| Class B Shares | $701,173 | $ — |
| Class C Shares | 558,509 | — |
| Class R Shares | 132,621 | (61,857) |
| TOTAL | $1,392,303 | $(61,857) |
When FSC receives fees, it may pay some or all of them to financial intermediaries whose customers purchase shares. For the year ended October 31, 2011, FSC retained $71,792 of fees paid by the Fund. For the year ended October 31, 2011, the Fund's Class A Shares did not incur a distribution services fee; however, it may begin to incur this fee upon approval of the Trustees.
Sales Charges
Front-end sales charges and contingent deferred sales charges (CDSC) do not represent expenses of the Fund. They are deducted from the proceeds of sales of Fund shares prior to investment or from redemption proceeds prior to remittance, as applicable. For the year ended October 31, 2011, FSC retained $46,625 in sales charges from the sale of Class A Shares. FSC also retained $7,500 of CDSC relating to redemptions of Class A Shares, $17,195 relating to redemptions of Class B Shares and $1,889 relating to redemptions of Class C Shares.
Annual Shareholder Report
Shareholder Services Fee
The Fund may pay fees (“Service Fees”) up to 0.25% of the average daily net assets of the Fund's Class A Shares, Class B Shares and Class C Shares to financial intermediaries or to Federated Shareholder Services Company (FSSC) for providing services to shareholders and maintaining shareholder accounts. Subject to the terms described in the Expense Limitation note, FSSC may voluntarily reimburse the Fund for Service Fees. For the year ended October 31, 2011, Service Fees for the Fund were as follows:
| Service
Fees
Incurred |
| Class A Shares | $2,104,765 |
| Class B Shares | 233,724 |
| Class C Shares | 181,248 |
| TOTAL | $2,519,737 |
For the year ended October 31, 2011, FSSC did not receive any fees paid by the Fund.
Expense Limitation
The Adviser and its affiliates (which may include FSC, FAS and FSSC) have voluntarily agreed to waive their fees and/or reimburse expenses so that the total annual fund operating expenses (as shown in the financial highlights) paid by the Fund's Class A Shares, Class B Shares, Class C Shares, Class R Shares and Institutional Shares (after the voluntary waivers and reimbursements) will not exceed 1.24%, 2.10%, 2.06%,1.46% and 0.98% (the “Fee Limit”), respectively, up to but not including the later of (the “Termination Date”): (a) January 1, 2013; or (b) the date of the Fund's next effective Prospectus. While the Adviser and its affiliates currently do not anticipate terminating or increasing these arrangements prior to the Termination Date, these arrangements may only be terminated or the Fee Limit increased prior to the Termination Date with the agreement of the Trustees.
Interfund Transactions
During the year ended October 31, 2011, the Fund engaged in purchase and sale transactions with funds that have a common investment adviser (or affiliated investment advisers), common Directors/Trustees, and/or common Officers. These purchase and sale transactions complied with Rule 17a-7 under the Act and amounted to $9,228,968 and $2,553,943, respectively.
General
Certain Officers and Trustees of the Fund are Officers and Directors or Trustees of the above companies.
Annual Shareholder Report
Transactions Involving Affiliated Holdings
Affiliated holdings are mutual funds which are managed by the Adviser or an affiliate of the Adviser. The Adviser has agreed to reimburse the Fund for certain investment adviser fees as a result of transactions in other affiliated mutual funds. For the year ended October 31, 2011, the Adviser reimbursed $35,018. Transactions involving the affiliated holding during the year ended October 31, 2011, were as follows:
| Federated Prime
Value Obligations Fund,
Institutional Shares |
| Balance of Shares Held 10/31/2010 | 34,145,464 |
| Purchases/Additions | 589,214,594 |
| Sales/Reductions | 588,588,645 |
| Balance of Shares Held 10/31/2011 | 34,771,413 |
| Value | $34,771,413 |
| Dividend Income | $52,644 |
6. EXPENSE Reduction
The Fund directs portfolio trades to a broker that in turn pays a portion of the Fund's operating expenses. For the year ended October 31, 2011, the Fund's expenses were reduced by $59,649 under these arrangements.
7. Investment TRANSACTIONS
Purchases and sales of investments, excluding long-term U.S. government securities and short-term obligations, for the year ended October 31, 2011, were as follows:
| Purchases | $2,038,042,325 |
| Sales | $2,286,899,690 |
8. LINE OF CREDIT
The Fund participates in a $100,000,000 unsecured, uncommitted revolving line of credit (LOC) agreement with PNC Bank. The LOC was made available for extraordinary or emergency purposes, primarily for financing redemption payments. Borrowings are charged interest at a rate offered to the Fund by PNC Bank at the time of the borrowing. As of October 31, 2011, there were no outstanding loans. During the year ended October 31, 2011, the Fund did not utilize the LOC.
Annual Shareholder Report
9. INTERFUND LENDINGPursuant to an Exemptive Order issued by the Securities and Exchange Commission, the Fund, along with other funds advised by subsidiaries of Federated Investors, Inc., may participate in an interfund lending program. This program provides an alternative credit facility allowing the Fund to borrow from other participating affiliated funds. As of October 31, 2011, there were no outstanding loans. During the year ended October 31, 2011, the program was not utilized.
10. RECENT ACCOUNTING PRONOUNCEMENTS
In April 2011, the Financial Accounting Standards Board (FASB) released Accounting Standards Update (ASU) No. 2011-03, “Reconsideration of Effective Control for Repurchase Agreements.” This ASU amends FASB Accounting Standards Codification (ASC) Topic 860, “Transfers and Servicing”; specifically the criteria required to determine whether a repurchase agreement and similar agreements should be accounted for as sales of financial assets or secured borrowings with commitments. This ASU is effective for fiscal years and interim periods beginning after December 15, 2011. At this time, management is evaluating the implications of adopting ASU No. 2011-03 and its impact on the Fund's financial statements and the accompanying notes, net assets and results of operations.
In addition, in May 2011, FASB released ASU No. 2011-04, “Amendments to Achieve Common Fair Value Measurement and Disclosure Requirements in U.S. GAAP and IFRSs.” This ASU amends FASB ASC Topic 820, “Fair Value Measurement,” to establish common requirements for measuring fair value and for disclosing information about fair value measurements in accordance with GAAP. This ASU is effective for fiscal years and interim periods beginning after December 15, 2011. At this time, management is evaluating the implications of adopting ASU No. 2011-04 and its impact on the Fund's financial statements and the accompanying notes.
11. FEDERAL TAX INFORMATION (UNAUDITED)
For the fiscal year ended October 31, 2011, 100% of total ordinary dividends paid by the Fund are qualifying dividends which may be subject to a maximum tax rate of 15%, as provided for by the Jobs and Growth Tax Relief Act of 2003. Complete information is reported in conjunction with the reporting of your distributions on Form 1099-DIV.
Of the ordinary income distributions made by the Fund during the year ended October 31, 2011, 100% qualify for the dividend received deduction available to corporate shareholders.
Annual Shareholder Report Report of Independent Registered Public Accounting Firm
TO THE BOARD OF TRUSTEES OF THE FEDERATED EQUITY FUNDS AND SHAREHOLDERS OF Federated Capital Appreciation fund:
We have audited the accompanying statement of assets and liabilities, including the portfolio of investments, of Federated Capital Appreciation Fund (the “Fund”), a portfolio of Federated Equity Funds, as of October 31, 2011, and the related statement of operations for the year then ended, the statements of changes in net assets for each of the years in the two-year period then ended, and the financial highlights for each of the years in the five-year period then ended. These financial statements and financial highlights are the responsibility of the Fund's management. Our responsibility is to express an opinion on these financial statements and financial highlights based on our audits.
We conducted our audits in accordance with the standards of the Public Company Accounting Oversight Board (United States). Those standards require that we plan and perform the audit to obtain reasonable assurance about whether the financial statements and financial highlights are free of material misstatement. An audit includes examining, on a test basis, evidence supporting the amounts and disclosures in the financial statements. Our procedures included confirmation of securities owned as of October 31, 2011, by correspondence with the custodian, transfer agent and brokers, or by other appropriate auditing procedures. An audit also includes assessing the accounting principles used and significant estimates made by management, as well as evaluating the overall financial statement presentation. We believe that our audits provide a reasonable basis for our opinion.
In our opinion, the financial statements and financial highlights referred to above present fairly, in all material respects, the financial position of the Federated Capital Appreciation Fund as of October 31, 2011, and the results of its operations for the year then ended, the changes in its net assets for each of the years in the two-year period then ended, and the financial highlights for each of the years in the five-year period then ended, in conformity with U.S. generally accepted accounting principles.
Boston, Massachusetts
December 23, 2011
Annual Shareholder Report Shareholder Expense Example (unaudited)
As a shareholder of the Fund, you incur two types of costs: (1) transaction costs, including sales charges (loads) on purchase or redemption payments; and (2) ongoing costs, including management fees and to the extent applicable, distribution (12b-1) fees and/or shareholder services fees and other Fund expenses. This Example is intended to help you to understand your ongoing costs (in dollars) of investing in the Fund and to compare these costs with the ongoing costs of investing in other mutual funds. It is based on an investment of $1,000 invested at the beginning of the period and held for the entire period from May 1, 2011 to October 31, 2011.
ACTUAL EXPENSES
The first section of the table below provides information about actual account values and actual expenses. You may use the information in this section, together with the amount you invested, to estimate the expenses that you incurred over the period. Simply divide your account value by $1,000 (for example, an $8,600 account value divided by $1,000 = 8.6), then multiply the result by the number in the first section under the heading entitled “Expenses Paid During Period” to estimate the expenses attributable to your investment during this period.
HYPOTHETICAL EXAMPLE FOR COMPARISON PURPOSES
The second section of the table below provides information about hypothetical account values and hypothetical expenses based on the Fund's actual expense ratio and an assumed rate of return of 5% per year before expenses, which is not the Fund's actual return. Thus, you should not use the hypothetical account values and expenses to estimate the actual ending account balance or your expenses for the period. Rather, these figures are required to be provided to enable you to compare the ongoing costs of investing in the Fund with other funds. To do so, compare this 5% hypothetical example with the 5% hypothetical examples that appear in the shareholder reports of the other funds.
Annual Shareholder Report
Please note that the expenses shown in the table are meant to highlight your ongoing costs only and do not reflect any transaction costs, such as sales charges (loads) on purchase or redemption payments. Therefore, the second section of the table is useful in comparing ongoing costs only, and will not help you determine the relative total costs of owning different funds. In addition, if these transaction costs were included, your costs would have been higher. | Beginning
Account Value
5/1/2011 | Ending
Account Value
10/31/2011 | Expenses Paid
During Period1 |
| Actual: | | | |
| Class A Shares | $1,000 | $895.40 | $5.92 |
| Class B Shares | $1,000 | $892.00 | $10.01 |
| Class C Shares | $1,000 | $891.80 | $9.82 |
| Class R Shares | $1,000 | $894.50 | $6.97 |
| Institutional Shares | $1,000 | $896.40 | $4.68 |
Hypothetical (assuming a 5% return
before expenses): | | | |
| Class A Shares | $1,000 | $1,018.95 | $6.31 |
| Class B Shares | $1,000 | $1,014.62 | $10.66 |
| Class C Shares | $1,000 | $1,014.82 | $10.46 |
| Class R Shares | $1,000 | $1,017.85 | $7.43 |
| Institutional Shares | $1,000 | $1,020.27 | $4.99 |
| 1 | Expenses are equal to the Fund's annualized net expense ratios, multiplied by the average account value over the period, multiplied by 184/365 (to reflect the one-half-year period). The annualized net expense ratios are as follows: |
| Class A Shares | 1.24% |
| Class B Shares | 2.10% |
| Class C Shares | 2.06% |
| Class R Shares | 1.46% |
| Institutional Shares | 0.98% |
Annual Shareholder Report Board of Trustees and Trust Officers
The Board of Trustees is responsible for managing the Trust's business affairs and for exercising all the Trust's powers except those reserved for the shareholders. The following tables give information about each Trustee and the senior officers of the Fund. Where required, the tables separately list Trustees who are “interested persons” of the Fund (i.e., “Interested” Trustees) and those who are not (i.e., “Independent” Trustees). Unless otherwise noted, the address of each person listed is Federated Investors Tower, 1001 Liberty Avenue, Pittsburgh, PA 15222. The address of all Independent Trustees listed is 4000 Ericsson Drive, Warrendale, PA 15086-7561; Attention: Mutual Fund Board. As of December 31, 2010, the Trust comprised 13 portfolio(s), and the Federated Fund Family consisted of 43 investment companies (comprising 136 portfolios). Unless otherwise noted, each Officer is elected annually. Unless otherwise noted, each Trustee oversees all portfolios in the Federated Fund Family and serves for an indefinite term. The Fund's Statement of Additional Information includes additional information about Trust Trustees and is available, without charge and upon request, by calling 1-800-341-7400.
Interested TRUSTEES Background
Name
Birth Date
Positions Held with Trust
Date Service Began | Principal Occupation(s) for Past Five Years,
Other Directorships Held and Previous Position(s) |
John F. Donahue*
Birth Date: July 28, 1924
Trustee
Began serving: April 1984 | Principal Occupations: Director or Trustee of the Federated Fund Family; Chairman and Director, Federated Investors, Inc.; Chairman of the Federated Fund Family's Executive Committee.
Previous Positions: Chairman of the Federated Fund Family; Trustee, Federated Investment Management Company; Chairman and Director, Federated Investment Counseling. |
J. Christopher Donahue*
Birth Date: April 11, 1949
President and Trustee
Began serving: January 2000 | Principal Occupations: Principal Executive Officer and President of the Federated Fund Family; Director or Trustee of some of the Funds in the Federated Fund Family; President, Chief Executive Officer and Director, Federated Investors, Inc.; Chairman and Trustee, Federated Investment Management Company; Trustee, Federated Investment Counseling; Chairman and Director, Federated Global Investment Management Corp.; Chairman, Federated Equity Management Company of Pennsylvania and Passport Research, Ltd. (investment advisory subsidiary of Federated); Trustee, Federated Shareholder Services Company; Director, Federated Services Company.
Previous Positions: President, Federated Investment Counseling; President and Chief Executive Officer, Federated Investment Management Company, Federated Global Investment Management Corp. and Passport Research, Ltd. |
| * | Family relationships and reasons for “interested” status: John F. Donahue is the father of J. Christopher Donahue; both are “interested” due to their beneficial ownership of shares of Federated Investors, Inc. and the positions they hold with Federated and its subsidiaries. |
Annual Shareholder ReportINDEPENDENT TRUSTEES Background
Name
Birth Date
Positions Held with Trust
Date Service Began | Principal Occupation(s) for Past Five Years,
Other Directorships Held, Previous Position(s) and Qualifications |
Nicholas P. Constantakis, CPA
Birth Date: September 3, 1939
Trustee
Began serving: February 1998 | Principal Occupation: Director or Trustee of the Federated Fund Family.
Other Directorship Held: Director and Chairman of the Audit Committee, Michael Baker Corporation (architecture, engineering and construction services).
Previous Position: Partner, Andersen Worldwide SC.
Qualifications: Public accounting and director experience. |
John F. Cunningham
Birth Date: March 5, 1943
Trustee
Began serving: January 1999 | Principal Occupation: Director or Trustee of the Federated Fund Family.
Other Directorships Held: Chairman, President and Chief Executive Officer, Cunningham & Co., Inc. (strategic business consulting); Trustee Associate, Boston College.
Previous Positions: Director, Redgate Communications and EMC Corporation (computer storage systems); Chairman of the Board and Chief Executive Officer, Computer Consoles, Inc.; President and Chief Operating Officer, Wang Laboratories; Director, First National Bank of Boston; Director, Apollo Computer, Inc.
Qualifications: Business management and director experience. |
Maureen Lally-Green
Birth Date: July 5, 1949
Trustee
Began serving: August 2009 | Principal Occupations: Director or Trustee of the Federated Fund Family; Director, Office of Church Relations, Diocese of Pittsburgh; Adjunct Professor of Law, Duquesne University School of Law.
Other Directorships Held: Director, Auberle; Trustee, St. Francis University; Director, Ireland Institute of Pittsburgh; Director, UPMC Mercy Hospital; Regent, St. Vincent Seminary; Director, Epilepsy Foundation of Western and Central Pennsylvania; Director, Saint Thomas More Society, Allegheny County.
Previous Position: Pennsylvania Superior Court Judge.
Qualifications: Legal and director experience. |
Peter E. Madden
Birth Date: March 16, 1942
Trustee
Began serving: November 1991 | Principal Occupation: Director or Trustee, and Chairman of the Board of Directors or Trustees, of the Federated Fund Family.
Previous Positions: Representative, Commonwealth of Massachusetts General Court; President, Chief Operating Officer and Director, State Street Bank and Trust Company and State Street Corporation (retired); Director, VISA USA and VISA International; Chairman and Director, Massachusetts Bankers Association; Director, Depository Trust Corporation; Director, The Boston Stock Exchange.
Qualifications: Business management, mutual fund services and director experience. |
Annual Shareholder ReportName
Birth Date
Positions Held with Trust
Date Service Began | Principal Occupation(s) for Past Five Years,
Other Directorships Held, Previous Position(s) and Qualifications |
Charles F. Mansfield, Jr.
Birth Date: April 10, 1945
Trustee
Began serving: January 1999 | Principal Occupations: Director or Trustee and Chairman of the Audit Committee of the Federated Fund Family; Management Consultant.
Previous Positions: Chief Executive Officer, PBTC International Bank; Partner, Arthur Young & Company (now Ernst & Young LLP); Chief Financial Officer of Retail Banking Sector, Chase Manhattan Bank; Senior Vice President, HSBC Bank USA (formerly Marine Midland Bank); Vice President, Citibank; Assistant Professor of Banking and Finance, Frank G. Zarb School of Business, Hofstra University; Executive Vice President, DVC Group, Inc. (marketing, communications and technology).
Qualifications: Banking, business management, education and director experience. |
R. James Nicholson
Birth Date: February 4, 1938
Trustee
Began serving: March 2008 | Principal Occupations: Director or Trustee of the Federated Fund Family; Senior Counsel, Brownstein Hyatt Farber Schrek, P.C.; Former Secretary of the U.S. Dept. of Veterans Affairs; Former U.S. Ambassador to the Holy See; Former Chairman of the Republican National Committee.
Other Directorships Held: Director, Horatio Alger Association; Director, The Daniels Fund, both charitable nonprofit organizations.
Previous Positions: Colonel, U.S. Army Reserve; Partner, Calkins, Kramer, Grimshaw and Harring, P.C.; General Counsel, Colorado Association of Housing and Building; Chairman and CEO, Nicholson Enterprises, Inc. (real estate holding company); Chairman and CEO, Renaissance Homes of Colorado.
Qualifications: Legal, government, business management and director experience. |
Thomas M. O'Neill
Birth Date: June 14, 1951
Trustee
Began serving: October 2006 | Principal Occupations: Director or Trustee of the Federated Fund Family; Sole Proprietor, Navigator Management Company (investment and strategic consulting).
Other Directorships Held: Board of Overseers, Children's Hospital of Boston; Visiting Committee on Athletics, Harvard College; Board of Directors, Medicines for Humanity.
Previous Positions: Chief Executive Officer and President, Managing Director and Chief Investment Officer, Fleet Investment Advisors; President and Chief Executive Officer, Aeltus Investment Management, Inc.; General Partner, Hellman, Jordan Management Co., Boston, MA; Chief Investment Officer, The Putnam Companies, Boston, MA; Credit Analyst and Lending Officer, Fleet Bank; Director and Consultant, EZE Castle Software (investment order management software); Director, Midway Pacific (lumber).
Qualifications: Business management, mutual fund, director and investment experience. |
Annual Shareholder ReportName
Birth Date
Positions Held with Trust
Date Service Began | Principal Occupation(s) for Past Five Years,
Other Directorships Held, Previous Position(s) and Qualifications |
John S. Walsh
Birth Date: November 28, 1957
Trustee
Began serving: January 1999 | Principal Occupations: Director or Trustee of the Federated Fund Family; President and Director, Heat Wagon, Inc. (manufacturer of construction temporary heaters); President and Director, Manufacturers Products, Inc. (distributor of portable construction heaters); President, Portable Heater Parts, a division of Manufacturers Products, Inc.
Previous Position: Vice President, Walsh & Kelly, Inc.
Qualifications: Business management and director experience. |
James F. Will
Birth Date: October 12, 1938
Trustee
Began serving: April 2006 | Principal Occupations: Director or Trustee of the Federated Fund Family; formerly, Vice Chancellor and President, Saint Vincent College.
Other Directorships Held: Trustee, Saint Vincent College; Director, Alleghany Corporation; Trustee, Wheeling Jesuit University; Director, Liberty Tire Recycling.
Previous Positions: Chairman, President and Chief Executive Officer, Armco, Inc.; President and Chief Executive Officer, Cyclops Industries; President and Chief Operating Officer, Kaiser Steel Corporation.
Qualifications: Business management, education and director experience. |
OFFICERS
Name
Birth Date
Address
Positions Held with Trust
Date Service Began | Principal Occupation(s) for Past Five Years
and Previous Position(s) |
John W. McGonigle
Birth Date: October 26, 1938
EXECUTIVE VICE PRESIDENT AND SECRETARY
Began serving: April 1984 | Principal Occupations: Executive Vice President and Secretary of the Federated Fund Family; Vice Chairman, Executive Vice President, Secretary and Director, Federated Investors, Inc.
Previous Positions: Trustee, Federated Investment Management Company and Federated Investment Counseling; Director, Federated Global Investment Management Corp., Federated Services Company and Federated Securities Corp. |
Richard A. Novak
Birth Date: December 25, 1963
TREASURER
Began serving: January 2006 | Principal Occupations: Principal Financial Officer and Treasurer of the Federated Fund Family; Senior Vice President, Federated Administrative Services; Financial and Operations Principal for Federated Securities Corp., Edgewood Services, Inc. and Southpointe Distribution Services, Inc.
Previous Positions: Controller of Federated Investors, Inc.; Vice President, Finance of Federated Services Company; held various financial management positions within The Mercy Hospital of Pittsburgh; Auditor, Arthur Andersen & Co. |
Annual Shareholder ReportName
Birth Date
Address
Positions Held with Trust
Date Service Began | Principal Occupation(s) for Past Five Years
and Previous Position(s) |
Richard B. Fisher
Birth Date: May 17, 1923
VICE PRESIDENT
Began serving: April 1984 | Principal Occupations: Vice Chairman or Vice President of some of the Funds in the Federated Fund Family; Vice Chairman, Federated Investors, Inc.; Chairman, Federated Securities Corp.
Previous Positions: President and Director or Trustee of some of the Funds in the Federated Fund Family; Executive Vice President, Federated Investors, Inc.; Director and Chief Executive Officer, Federated Securities Corp. |
Brian P. Bouda
Birth Date: February 28, 1947
CHIEF COMPLIANCE OFFICER AND SENIOR VICE PRESIDENT
Began serving: August 2004 | Principal Occupations: Senior Vice President and Chief Compliance Officer of the Federated Fund Family; Vice President and Chief Compliance Officer of Federated Investors, Inc. and Chief Compliance Officer of its subsidiaries. Mr. Bouda joined Federated in 1999 and is a member of the American Bar Association and the State Bar Association of Wisconsin. |
Stephen F. Auth
Birth Date: September 3, 1956
450 Lexington Avenue
Suite 3700
New York, NY 10017-3943
CHIEF INVESTMENT OFFICER
Began serving: November 2002 | Principal Occupations: Mr. Auth is Chief Investment Officer of this Fund and various other Funds in the Federated Fund Family; Executive Vice President, Federated Investment Counseling, Federated Global Investment Management Corp. and Federated Equity Management Company of Pennsylvania.
Previous Positions: Executive Vice President, Federated Investment Management Company, and Passport Research, Ltd. (investment advisory subsidiary of Federated); Senior Vice President, Global Portfolio Management Services Division; Senior Vice President, Federated Investment Management Company and Passport Research, Ltd.; Senior Managing Director and Portfolio Manager, Prudential Investments. |
James E. Grefenstette
Birth Date: November 7, 1962
Vice President
Began serving: February 2011 | Principal Occupations: James E. Grefenstette has been the Fund's Senior Portfolio Manager since April 2011. He is Vice President of the Fund's Adviser. Mr. Grefenstette joined Federated in December 2009. Previously, he served as founder and managing partner of Blazer Investment Advisers from April 2008 until December 2009, and as founder and managing partner of Aspirante Capital Management, a long/short hedge fund, from August 2006 until September 2007. Prior to that, Mr. Grefenstette worked at Federated as Portfolio Manager of the Fund from 1994 until June 2006 and as Senior Vice President of the Fund's Adviser from January 2000 until July 2006. He also served as Vice President and Assistant Vice President of the Fund's Adviser from 1994 until 1999. Mr. Grefenstette has received the Chartered Financial Analyst designation; he received his M.S. in Industrial Administration from Carnegie Mellon University and his BSBA from Georgetown University. |
Annual Shareholder Report Evaluation and Approval of Advisory Contract – May 2011
Federated Capital appreciation fund (the “Fund”)
The Fund's Board reviewed the Fund's investment advisory contract at meetings held in May 2011. The Board's decision regarding the contract reflects the exercise of its business judgment on whether to continue the existing arrangements.
In this connection, the Federated Funds' Board had previously appointed a Senior Officer, whose duties include specified responsibilities relating to the process by which advisory fees are to be charged to a Federated fund. The Senior Officer has the authority to retain consultants, experts, or staff as may be reasonably necessary to assist in the performance of his duties, reports directly to the Board, and may be terminated only with the approval of a majority of the independent members of the Board. The Senior Officer prepared and furnished to the Board an independent, written evaluation that covered topics discussed below (the “Evaluation”). The Board considered that Evaluation, along with other information, in deciding to approve the advisory contract.
During its review of the contract, the Board considered compensation and benefits received by the Adviser. This included the fees received for services provided to the Fund by other entities in the Federated organization and research services (if any) received by the Adviser from brokers that execute Federated fund trades, as well as advisory fees. The Board is also familiar with and considered judicial decisions concerning allegedly excessive investment advisory fees, which have indicated that the following factors may be relevant to an Adviser's fiduciary duty with respect to its receipt of compensation from a fund: the nature and quality of the services provided by the Adviser, including the performance of the fund; the Adviser's cost of providing the services; the extent to which the Adviser may realize “economies of scale” as a fund grows larger; any indirect benefits that may accrue to the Adviser and its affiliates as a result of the Adviser's relationship with a fund; performance and expenses of comparable funds; and the extent to which the independent Board members are fully informed about all facts the Board deems relevant bearing on the Adviser's services and fees. The Board further considered management fees (including any components thereof) charged to institutional and other clients of the Adviser for what might be viewed as like services, and the cost to the Adviser and its affiliates of supplying services pursuant to the management fee agreements, excluding any intra-corporate profit and profit margins of the Adviser and its affiliates for supplying such services. The Board was aware of these factors and was guided by them in its review of the Fund's advisory contract to the extent it considered them to be appropriate and relevant, as discussed further below.
Annual Shareholder Report
The Board considered and weighed these circumstances in light of its substantial accumulated experience in governing the Fund and working with Federated on matters relating to the Federated funds, and was assisted in its deliberations by independent legal counsel. Throughout the year, the Board has requested and received substantial and detailed information about the Fund and the Federated organization that was in addition to the extensive materials that comprise and accompany the Senior Officer's Evaluation. Federated provided much of this information at each regular meeting of the Board, and furnished additional information in connection with the particular meeting at which the Board's formal review of the advisory contract occurred. Between regularly scheduled meetings, the Board also received information on particular matters as the need arose. Thus, the Board's consideration of the advisory contract included review of the Senior Officer's Evaluation, accompanying data and additional information covering such matters as: the Adviser's investment philosophy, revenue, profitability, personnel and processes; investment and operating strategies; the Fund's short- and long-term performance (in absolute terms, both on a gross basis and net of expenses, as well as in relationship to its particular investment program and certain competitor or “peer group” funds and/or other benchmarks, as appropriate), and comments on the reasons for performance; the Fund's investment objectives; the Fund's expenses (including the advisory fee itself and the overall expense structure of the Fund, both in absolute terms and relative to similar and/or competing funds, with due regard for contractual or voluntary expense limitations); the use and allocation of brokerage commissions derived from trading the Fund's portfolio securities (if any); and the nature, quality and extent of the advisory and other services provided to the Fund by the Adviser and its affiliates. The Board also considered the preferences and expectations of Fund shareholders and their relative sophistication; the continuing state of competition in the mutual fund industry and market practices; the range of comparable fees for similar funds in the mutual fund industry; the Fund's relationship to the Federated family of funds which include a comprehensive array of funds with different investment objectives, policies and strategies which are available for exchange without the incurrence of additional sales charges; compliance and audit reports concerning the Federated funds and the Federated companies that service them (including communications from regulatory agencies), as well as Federated's responses to any issues raised therein; and relevant developments in the mutual fund industry and how the Federated funds and/or Federated are responding to them. The Board's evaluation process is evolutionary. The criteria considered and the emphasis placed on relevant criteria change in recognition of changing circumstances in the mutual fund marketplace.With respect to the Fund's performance and expenses in particular, the Board has found the use of comparisons to other mutual funds with comparable investment programs to be relevant, given the high degree of competition in the mutual fund business. The Board focused on comparisons with other similar Annual Shareholder Report
mutual funds more heavily than non-mutual fund products or services because it is believed that they are more relevant. For example, other mutual funds are the products most like the Fund, they are readily available to Fund shareholders as alternative investment vehicles, and they are the type of investment vehicle in fact chosen and maintained by the Fund's investors. The range of their fees and expenses therefore appears to be a generally reliable indication of what consumers have found to be reasonable in the precise marketplace in which the Fund competes. The Fund's ability to deliver competitive performance when compared to its peer group was a useful indicator of how the Adviser is executing the Fund's investment program, which in turn assisted the Board in reaching a conclusion that the nature, extent, and quality of the Adviser's investment management services were such as to warrant continuation of the advisory contract. In this regard, the Senior Officer has reviewed Federated's fees for providing advisory services to products outside the Federated family of funds (e.g., institutional and separate accounts). He concluded that mutual funds and institutional accounts are inherently different products. Those differences include, but are not limited to, different types of targeted investors; being subject to different laws and regulations; different legal structures; different average account sizes; different associated costs; different portfolio management techniques made necessary by different cash flows; and portfolio manager time spent in review of securities pricing. The Senior Officer did not consider these fee schedules to be determinative in judging the appropriateness of mutual fund advisory contracts.The Senior Officer reviewed information compiled by Federated, using data supplied by independent fund ranking organizations, regarding the performance of, and fees charged by, other mutual funds, noting his view that comparisons to fund peer groups are relevant in judging the reasonableness of proposed fees.
For the periods covered by the Evaluation, the Fund's performance for the three and five-year period was above the median of the relevant peer group, and the Fund's performance fell below the median of the relevant peer group for the one-year period. The Board discussed the Fund's performance with the Adviser and recognized the efforts being undertaken by the Adviser. The Board will continue to monitor these efforts and the performance of the Fund.
The Board also received financial information about Federated, including information regarding the compensation and benefits Federated derived from its relationships with the Federated funds. This information covered not only the fees under the advisory contracts, but also fees received by Federated's subsidiaries for providing other services to the Federated funds under separate contracts (e.g., for serving as the Federated funds' administrator). The information also detailed any indirect benefit Federated may derive from its receipt of research services from brokers who execute Federated fund trades. In addition, the Board considered the fact that, in order for a fund to be competitive in the marketplace, Federated and its affiliates frequently waived fees Annual Shareholder Report
and/or reimbursed expenses and have disclosed to fund investors and/or indicated to the Board their intention to do so in the future, where appropriate. Moreover, the Board receives regular reporting as to the institution or elimination of these voluntary waivers.Federated furnished information, requested by the Senior Officer, that reported revenues on a fund-by-fund basis and made estimates of the allocation of expenses on a fund-by-fund basis, using allocation methodologies specified by the Senior Officer. The Senior Officer noted that, although they may apply consistent allocation processes, the inherent difficulties in allocating costs (and the unavoidable arbitrary aspects of that exercise) and the lack of consensus on how to allocate those costs may render such allocation information unreliable. The allocation information was considered in the analysis by the Board but was determined to be of limited use.
The Board and the Senior Officer also reviewed information compiled by Federated comparing profitability information for Federated to other publicly held fund management companies. In this regard, the Senior Officer noted the limited availability of such information, but nonetheless concluded that Federated's profit margins did not appear to be excessive and the Board agreed.
The Senior Officer's Evaluation also discussed the notion of possible realization of “economies of scale” as a fund grows larger. The Board considered in this regard that the Adviser has made significant and long-term investments in areas that support all of the Federated funds, such as personnel and processes for the portfolio management, compliance, internal audit, and risk management functions; and systems technology; and that the benefits of these efforts (as well as any economies, should they exist) were likely to be enjoyed by the fund complex as a whole. Finally, the Board also noted the absence of any applicable regulatory or industry guidelines on this subject, which (as discussed in the Senior Officer's Evaluation) is compounded by the lack of any common industry practice or general pattern with respect to structuring fund advisory fees with “breakpoints” that serve to reduce the fee as the fund attains a certain size. The Senior Officer did not recommend institution of breakpoints in pricing Federated's fund advisory services at this time.
It was noted in the materials for the Board meeting that for the period covered by the Evaluation, the Fund's investment advisory fee, after waivers and expense reimbursements, if any, was above the median of the relevant peer group. The Board reviewed the fees and other expenses of the Fund with the Adviser and was satisfied that the overall expense structure of the Fund remained competitive. The Board will continue to monitor advisory fees and other expenses borne by the Fund.
The Senior Officer noted that, considering the totality of the circumstances, and all of the factors referenced within his Evaluation, he had concluded that, subject to comments and recommendations made within his Evaluation, his observations and the information accompanying the Evaluation supported a finding by the Board that the management fees for each of the funds are Annual Shareholder Report
reasonable and that Federated appeared to provide appropriate administrative services to the Fund for the fees paid. Under these circumstances, no changes were recommended to, and no objection was raised to, the continuation of the Fund's advisory contract. The Board concluded that the nature, quality and scope of services provided the Fund by the Adviser and its affiliates were satisfactory.In its decision to continue an existing investment advisory contract, the Board was mindful of the potential disruptions of the Fund's operations and various risks, uncertainties and other effects that could occur as a result of a decision to terminate or not renew an advisory contract. In particular, the Board recognized that many shareholders have invested in the Fund on the strength of the Adviser's industry standing and reputation and with the expectation that the Adviser will have a continuing role in providing advisory services to the Fund. Thus, the Board's approval of the advisory contract reflected the fact that it is the shareholders who have effectively selected the Adviser by virtue of having invested in the Fund.
The Board based its decision to approve the advisory contract on the totality of the circumstances and relevant factors and with a view to past and future long-term considerations. Not all of the factors and considerations identified above were necessarily relevant to the Fund, nor did the Board consider any one of them to be determinative. With respect to the factors that were relevant, the Board's decision to approve the contract reflects its determination that Federated's performance and actions provided a satisfactory basis to support the decision to continue the existing arrangements.
Annual Shareholder Report Voting Proxies on Fund Portfolio Securities
A description of the policies and procedures that the Fund uses to determine how to vote proxies, if any, relating to securities held in the Fund's portfolio is available, without charge and upon request, by calling 1-800-341-7400. A report on “Form N-PX” of how the Fund voted any such proxies during the most recent 12-month period ended June 30 is available from Federated's website at FederatedInvestors.com. To access this information from the home page, select “All” under “Asset Classes.” Select a fund name and share class, if applicable, to go to the Fund Overview page. On the Fund Overview page, select the “Documents” tab. At the bottom of that page, select “Proxy Voting Record Report (Form N-PX).” Form N-PX filings are also available at the SEC's website at www.sec.gov.
Quarterly Portfolio Schedule
The Fund files with the SEC a complete schedule of its portfolio holdings, as of the close of the first and third quarters of its fiscal year, on “Form N-Q.” These filings are available on the SEC's website at www.sec.gov and may be reviewed and copied at the SEC's Public Reference Room in Washington, DC. (Call 1-800-SEC-0330 for information on the operation of the Public Reference Room.) You may also access this information from the “Products” section of Federated's website at FederatedInvestors.com. From the home page, select “All” under “Asset Classes.” Select a fund name and share class, if applicable, to go to the Fund Overview page. On the Fund Overview page, select the “Documents” tab. At the bottom of that page, select “Form N-Q.”
Annual Shareholder Report
Notes [Page Intentionally Left Blank]
Notes [Page Intentionally Left Blank]
Notes [Page Intentionally Left Blank]
Notes [Page Intentionally Left Blank]
Notes [Page Intentionally Left Blank]Mutual funds are not bank deposits or obligations, are not guaranteed by any bank and are not insured or guaranteed by the U.S. government, the Federal Deposit Insurance Corporation, the Federal Reserve Board or any other government agency. Investment in mutual funds involves investment risk, including the possible loss of principal.
This Report is authorized for distribution to prospective investors only when preceded or accompanied by the Fund's Prospectus, which contains facts concerning its objective and policies, management fees, expenses and other information.
Federated Capital Appreciation Fund
Federated Investors Funds
4000 Ericsson Drive
Warrendale, PA 15086-7561
Contact us at FederatedInvestors.com
or call 1-800-341-7400.
Federated Securities Corp., Distributor
Cusip 314172701
Cusip 314172800
Cusip 314172883
Cusip 314172594
Cusip 314172396
G01649-04 (12/11)
Federated is a registered trademark of Federated Investors, Inc.
2011 © Federated Investors, Inc.
| | Annual Shareholder Report |
| | October 31, 2011 |
|
| Share Class | Ticker |
| A | KAUAX |
| B | KAUBX |
| C | KAUCX |
Federated Kaufmann Fund
Fund Established 2001
A Portfolio of Federated Equity Funds
Management's Discussion of Fund Performance
Portfolio of Investments Summary Table
Portfolio of Investments
Financial Highlights
Statement of Assets and Liabilities
Statement of Operations
Statement of Changes in Net Assets
Notes to Financial Statements
Report of Independent Registered Public Accounting Firm
Shareholder Expense Example
Board of Trustees and Trust Officers
Evaluation and Approval of Advisory Contract
Voting Proxies on Fund Portfolio Securities
Quarterly Portfolio Schedule
Management's Discussion of Fund Performance
The Fund's total return, based upon net asset value, for the 12-month reporting period ended October 31, 2011, was -6.07%, -6.40% and -6.53%, for the Class A, B and C Shares, respectively. The Russell Midcap® Growth Index (RMCG),1 the Fund's broad-based securities market index, had a total return of 10.08% for same period. The Fund's total return for the fiscal year reflects actual cash flows, transaction costs and other expenses which are not reflected in the total return of the RMCG.
The following discussion will focus on the performance of the Fund's Class A Shares.
Market Conditions
The stock market, as a whole, posted very strong returns during the first half of the fiscal year but then retreated into negative return territory during the second half of the reporting period. The equity markets returned to positive returns with a powerful rally during the final month of the Fund's fiscal year, October of 2011. The Standard and Poor's 500 Index (S&P 500)2 bottomed in September of 2011 and finished the fiscal year up 8.09%. Overall, large-cap stocks performed best, followed by mid-caps and then small-caps. In terms of style, growth stocks outperformed value stocks across large-, mid- and small-cap stock groupings.
Economic growth in Europe began to slow, especially in the highly indebted countries of Greece, Italy, Portugal, Ireland, Spain and others. Credit spreads widened substantially on speculation that those governments would not be able to support their level of indebtedness in a slowing economic environment without significant support from the European Central Bank. Politics have dominated much of the European debate. However, even after numerous meetings between bankers and politicians, and the resignation of several prime ministers, credible plans for a bailout remained elusive.
Unfortunately, political uncertainty was not limited to Europe; the President and the U.S. Congress generated a highly contentious standoff regarding the debt ceiling debate. This uncertainty prompted Standard and Poor's to downgrade the long-term credit rating of the U.S. one notch down from AAA. Additionally, during June of 2011, the Federal Reserve's second quantitative easing program, known as QE2, ended.
The European debt crisis, political uncertainty, and weaker economic indicators during the last six months of the reporting period clearly increased volatility and negatively affected the global equity markets.
Annual Shareholder Report
1
Fund PerformanceThe Fund underperformed the RMCG over the reporting period. Key factors affecting the Fund performance over the reporting period include the following:
International holdings: The Fund maintained exposure to growth companies outside of the U.S., particularly in Brazil, China, India and others. Both developed and emerging international markets significantly underperformed the U.S. markets and accounted for nearly one-half of our underperformance, based upon performance attribution data.3
Stock selection: The eight worst contributing holdings during the period accounted for a substantial portion of underperformance. Specifically: Hypermarcas (-64%); Lee & Man Paper Manufacturing (-49%); Warner Chilcott (-25%); Camelot Information Systems (-77%); Huabao International (-57%); STR Holdings (-66%); Examworks (-38%) and HCA Holdings (-34%).
Companies that were strong performers and contributed most to the Fund returns during the period were: Cetip (+33%); Cubist Pharmaceuticals (+62%); Restoque Comercio (97%); Alkermes Plc (+51%); Cia Hering (+40%) and NXP Semiconductor (36%).
Sector weightings: substantially less exposure to Consumer Discretionary and Energy sectors relative to the RMCG hurt performance. Finally, an overweight in the Financial sector also hurt the Fund's performance.
Macroeconomic events, previously mentioned, also pushed stock correlations substantially higher, meaning many stocks moved in the same direction, up or down, simultaneously. This made stock selection more difficult because stocks reacted similarly to both good and bad news headlines more than company fundamentals.
The Fund was nearly fully invested during the reporting period with a cash position which averaged less than 1.5%.
| 1 | The Russell Midcap® Growth Index: Measures the performance of the mid-cap growth segment of the U.S. equity universe. It includes those Russell Midcap Index companies with higher price-to-book ratios and higher forecasted growth values. |
| 2 | The Standard and Poor's 500 Index is an unmanaged, capitalization-weighted index of 500 stocks designed to measure performance of the broad domestic economy through changes in the aggregate market value of 500 stocks representing all major industries. It is not possible to invest directly in an index. |
| 3 | International investing involves special risks including currency risk, increased volatility, political risks and differences in auditing and other financial standards. Prices of emerging markets securities can be significantly more volatile than the prices of securities in developed countries and currency risk and political risks are accentuated in emerging markets. |
Annual Shareholder Report2
FUND PERFORMANCE AND GROWTH OF A $10,000 INVESTMENT
The Average Annual Total Return table below shows returns for each class averaged over the stated periods. The graphs below illustrate the hypothetical investment of $10,0001 in the Federated Kaufmann Fund (the “Fund”) from October 31, 1996 to October 31, 2011, compared to the Russell Midcap® Growth Index (RMCG)2 and the Lipper Multi-Cap Growth Funds Category (LMCGC).2
Average Annual Total Returns for the Period Ended 10/31/2011
(returns reflect all applicable sales charges and contingent deferred sales charges as specified below in footnote #1)
| Share Class | 6-Month
(Cumulative) | 1-Year | 3-Years | 5-Years | 10-Years | 15-Years |
| Class A Shares | -21.06% | -11.23% | 7.15% | -0.74% | 5.50% | 6.59% |
| Class B Shares | -21.14% | -11.55% | 7.50% | -0.44% | 5.65% | 6.70% |
| Class C Shares | -17.38% | -7.47% | 8.67% | -0.11% | 5.54% | 6.44% |
| Russell Midcap Growth Index | -10.22% | 10.08% | 19.96% | 3.46% | 6.98% | 6.94% |
| Lipper Multi-Cap Growth Funds Category | -10.10% | 6.23% | 14.88% | 2.02% | 4.46% | 5.73% |
Performance data quoted represents past performance which is no guarantee of future results. Investment return and principal value will fluctuate so that an investor's shares, when redeemed, may be worth more or less than their original cost. Mutual fund performance changes over time and current performance may be lower or higher than what is stated. For current to the most recent month-end performance and after-tax returns, visit FederatedInvestors.com or call 1-800-341-7400. Returns shown do not reflect the deduction of taxes that a shareholder would pay on Fund distributions or the redemption of Fund shares. Mutual funds are not obligations of or guaranteed by any bank and are not federally insured.
Annual Shareholder Report
3
Growth of a $10,000 Investment – CLASS A SHARES| Federated Kaufmann Fund - Class A Shares | C000026729 | RMCG | LMCGC |
| 10/31/1996 | 9,450 | 10,000 | 10,000 |
| 10/31/1997 | 10,892 | 12,461 | 12,494 |
| 10/31/1998 | 9,495 | 12,764 | 13,424 |
| 10/31/1999 | 10,523 | 17,572 | 20,252 |
| 10/31/2000 | 15,923 | 24,367 | 26,735 |
| 10/31/2001 | 14,411 | 13,943 | 17,217 |
| 10/31/2002 | 13,128 | 11,487 | 14,096 |
| 10/31/2003 | 18,172 | 16,001 | 18,492 |
| 10/31/2004 | 19,124 | 17,403 | 19,548 |
| 10/31/2005 | 21,811 | 20,172 | 22,130 |
| 10/31/2006 | 25,532 | 23,099 | 24,709 |
| 10/31/2007 | 33,465 | 27,654 | 31,036 |
| 10/31/2008 | 20,004 | 15,860 | 18,417 |
| 10/31/2009 | 22,157 | 19,425 | 21,618 |
| 10/31/2010 | 27,720 | 24,870 | 26,210 |
| 10/31/2011 | 26,039 | 27,378 | 27,842 |
41 graphic description end -->
- Total returns shown include the maximum sales charge of 5.50% ($10,000 investment minus $550 sales charge = $9,450).
Growth of a $10,000 Investment – CLASS b SHARES
| Federated Kaufmann Fund - Class B Shares | C000026730 | RMCG | LMCGC |
| 10/31/1996 | 10,000 | 10,000 | 10,000 |
| 10/31/1997 | 11,469 | 12,461 | 12,494 |
| 10/31/1998 | 9,947 | 12,764 | 13,424 |
| 10/31/1999 | 10,970 | 17,572 | 20,252 |
| 10/31/2000 | 16,518 | 24,367 | 26,735 |
| 10/31/2001 | 14,878 | 13,943 | 17,217 |
| 10/31/2002 | 13,510 | 11,487 | 14,096 |
| 10/31/2003 | 18,576 | 16,001 | 18,492 |
| 10/31/2004 | 19,445 | 17,403 | 19,548 |
| 10/31/2005 | 22,156 | 20,172 | 22,130 |
| 10/31/2006 | 25,937 | 23,099 | 24,709 |
| 10/31/2007 | 33,995 | 27,654 | 31,036 |
| 10/31/2008 | 20,321 | 15,860 | 18,417 |
| 10/31/2009 | 22,508 | 19,425 | 21,618 |
| 10/31/2010 | 28,159 | 24,870 | 26,210 |
| 10/31/2011 | 26,451 | 27,378 | 27,842 |
41 graphic description end -->
- Total returns shown include the maximum contingent deferred sales charge of 5.50%, as applicable.
Annual Shareholder Report4
Growth of a $10,000 Investment – CLASS c SHARES
| Federated Kaufmann Fund - Class C Shares | C000026731 | RMCG | LMCGC |
| 10/31/1996 | 10,000 | 10,000 | 10,000 |
| 10/31/1997 | 11,469 | 12,461 | 12,494 |
| 10/31/1998 | 9,947 | 12,764 | 13,424 |
| 10/31/1999 | 10,970 | 17,572 | 20,252 |
| 10/31/2000 | 16,518 | 24,367 | 26,735 |
| 10/31/2001 | 14,878 | 13,943 | 17,217 |
| 10/31/2002 | 13,510 | 11,487 | 14,096 |
| 10/31/2003 | 18,576 | 16,001 | 18,492 |
| 10/31/2004 | 19,444 | 17,403 | 19,548 |
| 10/31/2005 | 22,063 | 20,172 | 22,130 |
| 10/31/2006 | 25,662 | 23,099 | 24,709 |
| 10/31/2007 | 33,476 | 27,654 | 31,036 |
| 10/31/2008 | 19,884 | 15,860 | 18,417 |
| 10/31/2009 | 21,972 | 19,425 | 21,618 |
| 10/31/2010 | 27,300 | 24,870 | 26,210 |
| 10/31/2011 | 25,517 | 27,378 | 27,842 |
41 graphic description end -->
- Total returns shown include the maximum contingent deferred sales charge of 1.00%, as applicable.
| 1 | Represents a hypothetical investment of $10,000 in the Fund after deducting applicable sales charges: For Class A Shares, the maximum sales charge of 5.50% ($10,000 investment minus $550 sales charge = $9,450); for Class B Shares, the maximum contingent deferred sales charge is 5.50% on any redemption less than one year from the purchase date; for Class C Shares, the maximum contingent deferred sales charge is 1.00% on any redemption less than one year from the purchase date. The Fund's performance assumes the reinvestment of all dividends and distributions. The Russell Midcap Growth Index (RMCG) and the Lipper Multi-Cap Growth Funds Category (LMCGC) have been adjusted to reflect reinvestment of all dividends on securities in the index and the average. The Fund is a successor to the Kaufmann Fund, Inc. (Kaufmann Fund) pursuant to a reorganization that took place on April 23, 2001. Prior to that date, the Fund had no investment operations. Accordingly, the performance information provided is historical information of the Kaufmann Fund, but has been adjusted to reflect the expenses applicable to the Fund's Class A Shares, Class B Shares and Class C Shares, respectively. |
| 2 | The RMCG is not adjusted to reflect sales charges, expenses or other fees that the Securities and Exchange Commission requires to be reflected in the Fund's performance. The RMCG measures the performance of those Russell Midcap companies with higher price-to-book ratios and higher forecasted growth values. The stocks are also members of the Russell 1000 Growth Index. The LMCGC is an equal dollar-weighted index of the largest mutual funds within the mid-cap growth classification, as defined by Lipper, Inc. The LMCGC does not reflect sales charges and is adjusted for the reinvestment of capital gains and income dividends. The RMCG is unmanaged and, unlike the Fund, is not affected by cash flows. Investments cannot be made in an index and an average. |
Annual Shareholder Report5
Portfolio of Investments Summary Table (unaudited)
At October 31, 2011, the Fund's sector composition1 was as follows:
| Sector Composition | Percentage of
Total Net Assets |
| Information Technology | 22.4% |
| Industrials | 19.4% |
| Health Care | 19.3% |
| Consumer Discretionary | 13.7% |
| Financials | 14.2% |
| Materials | 6.1% |
| Energy | 1.5% |
| Consumer Staples | 1.2% |
| Telecommunication Services | 0.8% |
| Utilities | 0.7% |
| Securities Lending Collateral2 | 7.7% |
| Cash Equivalents3 | 1.2% |
| Other Assets and Liabilities — Net4 | (8.2)% |
| TOTAL | 100.0% |
| 1 | Except for Securities Lending Collateral, Cash Equivalents and Other Assets and Liabilities, sector classifications are based upon, and individual portfolio securities are assigned to, the classifications of the Global Industry Classification System (GICS), except that the Adviser assigns a classification to securities not classified by the GICS and to securities for which the Adviser does not have access to the classification made by the GICS. |
| 2 | Cash collateral received from lending portfolio securities, which is invested in short-term investments such as repurchase agreements or money market mutual funds. |
| 3 | Cash Equivalents include any investments in money market mutual funds and/or overnight repurchase agreements other than those representing securities lending collateral. |
| 4 | Assets, other than investments in securities, less liabilities. See Statement of Assets and Liabilities. |
Annual Shareholder Report6
Portfolio of Investments
October 31, 2011
Shares or
Principal
Amount | | | Value |
| | COMMON STOCKS – 98.7% | |
| | Consumer Discretionary – 13.7% | |
| 710,000 | | Abercrombie & Fitch Co., Class A | 52,824,000 |
| 1,363,857 | | Bharat Forge Ltd. | 8,347,363 |
| 1,637,606 | | Cia Hering | 36,579,894 |
| 22,230,000 | 1 | Genting Singapore PLC | 30,354,987 |
| 13,150,000 | 1 | L'Occitane International SA | 28,855,067 |
| 1,217,800 | 1 | Las Vegas Sands Corp. | 57,175,710 |
| 1,800,000 | 1,2 | Melco PBL Entertainment (Macau) Ltd., ADR | 20,646,000 |
| 1,815,249 | | National CineMedia, Inc. | 21,964,513 |
| 140,000 | 1 | O'Reilly Automotive, Inc. | 10,647,000 |
| 987,917 | 1 | Penn National Gaming, Inc. | 35,565,012 |
| 22,570,741 | 1 | Prada Holding SpA | 108,654,663 |
| 33,600 | 1 | Priceline.com, Inc. | 17,059,392 |
| 350,000 | | Ralph Lauren Corp. | 55,576,500 |
| 3,698,035 | 1,3 | Restoque Comercio e Confeccoes de Roupas SA | 58,157,058 |
| 60,991,468 | 1 | Samsonite International SA | 99,745,937 |
| 700,000 | 1,2 | Shutterfly, Inc. | 29,169,000 |
| 300,000 | 1,2 | SodaStream International Ltd. | 10,224,000 |
| 250,000 | | Starbucks Corp. | 10,585,000 |
| 390,000 | 2 | Starwood Hotels & Resorts Worldwide, Inc. | 19,542,900 |
| 595,000 | 1,2 | Vera Bradley, Inc. | 26,953,500 |
| 208,000 | | Wynn Resorts Ltd. | 27,622,400 |
| 1,860,897 | 1,2 | Yoox SpA | 26,575,546 |
| | TOTAL | 792,825,442 |
| | Consumer Staples – 1.2% | |
| 2,599,180 | | Almacenes Exito SA | 33,429,968 |
| 925,000 | 1 | Darling International, Inc. | 12,968,500 |
| 300,000 | 1,2 | TreeHouse Foods, Inc. | 18,402,000 |
| 398,820 | | United Breweries Co., Inc. | 3,391,116 |
| | TOTAL | 68,191,584 |
| | Energy – 1.5% | |
| 3,476,400 | 1 | Coal India Ltd. | 23,501,385 |
| 295,000 | 1 | Concho Resources, Inc. | 27,942,400 |
| 626,847 | 1,2 | Dresser-Rand Group, Inc. | 30,339,395 |
Annual Shareholder Report7
Shares or
Principal
Amount | | | Value |
| 74,800 | | National-Oilwell, Inc. | 5,335,484 |
| | TOTAL | 87,118,664 |
| | Financials – 14.2% | |
| 322,129 | | BlackRock, Inc. | 50,828,735 |
| 21,640,000 | 3 | CETIP SA | 298,726,155 |
| 11,438,000 | 1,4,5 | CITIC Securities Co., Ltd. | 22,791,196 |
| 13,600,000 | | Chimera Investment Corp. | 40,936,000 |
| 1 | 1,4,6 | FA Private Equity Fund IV LP | 821,287 |
| 7,358,613 | | Fibra Uno Administracion SA | 13,527,877 |
| 6,000,000 | | Housing Development Finance Corp. Ltd. | 84,106,717 |
| 1 | 1,4,6 | Infrastructure Fund | 0 |
| 2,301,814 | | J.P. Morgan Chase & Co. | 80,011,055 |
| 2,329,516 | | LPS Brasil Cons De Imoveis | 42,076,064 |
| 1,614,587 | | Multiplan Empreendimentos Imobiliarios SA | 32,651,927 |
| 23,142,407 | | PT Bank Central Asia | 20,925,655 |
| 1 | 4,6 | Peachtree Leadscope LLC, Class A and B | 0 |
| 1 | 1,4,6 | Peachtree Leadscope LLC, Class C | 3,250,000 |
| 587,492 | | Power Finance Corp. | 1,795,420 |
| 2,747,400 | | Wells Fargo & Co. | 71,185,134 |
| 1,635,000 | | Willis Group Holdings PLC | 59,366,850 |
| | TOTAL | 823,000,072 |
| | Health Care – 18.7% | |
| 5,818,897 | 1,3 | Alkermes, Inc. | 101,772,509 |
| 495,000 | 2 | Allergan, Inc. | 41,639,400 |
| 1,487,712 | 1,2 | Allscripts Healthcare Solutions, Inc. | 28,489,685 |
| 1,000,000 | 1 | Amarin Corporation PLC., ADR | 9,400,000 |
| 3,324,525 | | Amil Participacoes SA | 33,635,437 |
| 1 | 4,6 | Apollo Investment Fund V | 4,106,516 |
| 2,516,000 | 1 | Biocon Ltd. | 18,212,007 |
| 400,000 | 1 | Biogen Idec, Inc. | 46,544,000 |
| 1,000,000 | 1 | Boston Scientific Corp. | 5,890,000 |
| 31,189,620 | 1 | CFR Pharmaceuticals SA | 7,296,389 |
| 351,900 | 1,4,5 | CFR Pharmaceuticals SA, ADR | 8,315,397 |
| 185,980 | 1 | Chindex International, Inc. | 2,066,238 |
| 625,000 | 1,3,4 | Conceptus, Inc. | 7,200,000 |
| 386,174 | 1,3,4,5 | Conceptus, Inc. | 4,448,724 |
| 714,286 | 1,3,4 | Conceptus, Inc. | 8,228,575 |
Annual Shareholder Report8
Shares or
Principal
Amount | | | Value |
| 3,653,165 | 1 | Corcept Therapeutics, Inc. | 11,580,533 |
| 500,000 | 1,4,6 | Cortek, Inc. | 0 |
| 4,250,000 | 1,2,3 | Cubist Pharmaceuticals, Inc. | 160,692,500 |
| 1 | 4,6 | Denovo Ventures I LP | 1,068,278 |
| 3,717,624 | 1,2,3 | Dexcom, Inc. | 36,395,539 |
| 126,065 | 1,3 | Dexcom, Inc. | 1,234,176 |
| 865,520 | | Dishman Pharmaceuticals & Chemicals Ltd. | 922,438 |
| 15,200,000 | 1,3 | Dyax Corp. | 20,520,000 |
| 109,505 | 1 | Edwards Lifesciences Corp. | 8,258,867 |
| 3,000,000 | 1,2,3 | ExamWorks Group, Inc. | 31,650,000 |
| 2,800,000 | 1,2 | Express Scripts, Inc., Class A | 128,044,000 |
| 1,834,871 | 1,2,3 | Insulet Corp. | 29,945,095 |
| 1 | 4,6 | Latin Healthcare Fund | 335,009 |
| 2,600,000 | 1 | Nektar Therapeutics | 14,092,000 |
| 1 | 4,6 | Peachtree Velquest | 247,191 |
| 5,246,193 | 1,3 | Progenics Pharmaceuticals, Inc. | 34,467,488 |
| 5,400,000 | 1,2,3 | Protalix Biotherapeutics, Inc. | 32,994,000 |
| 213,251 | 1 | Regeneron Pharmaceuticals, Inc. | 11,792,780 |
| 2,998,043 | 1,3 | Repligen Corp. | 10,283,287 |
| 843,785 | 1 | Salix Pharmaceuticals Ltd. | 28,903,855 |
| 3,075,000 | 1,2 | Seattle Genetics, Inc. | 67,650,000 |
| 1,000,000 | | Shandong Weigao Group Medical Polymer Co., Ltd. | 1,032,237 |
| 274 | 1,3,6 | Soteira, Inc. | 0 |
| 358,728 | 1 | Threshold Pharmaceuticals, Inc. | 573,965 |
| 7,048,500 | 1,2,3 | Vical, Inc. | 21,075,015 |
| 1,180,949 | 1,2 | Vivus, Inc. | 11,136,349 |
| 2,438,615 | 1 | Warner Chilcott PLC | 44,187,704 |
| 712,300 | 1 | Watson Pharmaceuticals, Inc. | 47,838,068 |
| | TOTAL | 1,084,165,251 |
| | Industrials – 19.4% | |
| 435,000 | | 3M Co. | 34,373,700 |
| 497,351 | | Aggreko PLC | 13,598,198 |
| 1,250,000 | | CLARCOR, Inc. | 60,600,000 |
| 343,000 | | Caterpillar, Inc. | 32,399,780 |
| 700,000 | 1 | CoStar Group, Inc. | 43,071,000 |
| 1,007,626 | 2 | Cummins, Inc. | 100,188,253 |
| 1,300,000 | 2 | Danaher Corp. | 62,855,000 |
Annual Shareholder Report9
Shares or
Principal
Amount | | | Value |
| 2,300,000 | | Expeditors International Washington, Inc. | 104,880,000 |
| 1,100,000 | | FedEx Corp. | 90,013,000 |
| 320,800 | 1 | IHS, Inc., Class A | 26,943,992 |
| 900,000 | 1 | Kansas City Southern Industries, Inc. | 56,853,000 |
| 158,200 | | Kuehne & Nagel International AG | 19,583,741 |
| 642,000 | | Localiza Rent A Car SA | 9,703,760 |
| 503,995 | | MSC Industrial Direct Co. | 34,276,700 |
| 4,704,116 | | Max India Ltd. | 18,385,387 |
| 200,000 | | Norfolk Southern Corp. | 14,798,000 |
| 2,775,000 | 1 | Owens Corning, Inc. | 78,754,500 |
| 530,000 | | Precision Castparts Corp. | 86,469,500 |
| 485,000 | 1 | RPX Corp. | 7,546,600 |
| 300,000 | | Rockwell Collins | 16,749,000 |
| 600,000 | 1 | Teledyne Technologies, Inc. | 32,682,000 |
| 400,000 | | Trinity Industries, Inc. | 10,908,000 |
| 385,000 | 2 | Union Pacific Corp. | 38,334,450 |
| 875,000 | 2 | United Technologies Corp. | 68,232,500 |
| 1,772,120 | 1 | Verisk Analytics, Inc. | 62,290,018 |
| | TOTAL | 1,124,490,079 |
| | Information Technology – 22.4% | |
| 7,000,000 | | Amadeus IT Holding SA | 131,386,397 |
| 382,618 | 1 | Apple, Inc. | 154,876,114 |
| 4,250,000 | 1 | Atmel Corp. | 44,880,000 |
| 1,575,000 | | Avago Technologies Ltd. | 53,187,750 |
| 600,000 | 1 | Check Point Software Technologies Ltd. | 34,578,000 |
| 500,000 | 1 | Citrix Systems, Inc. | 36,415,000 |
| 2,950,000 | 1 | Comverse Technology, Inc. | 20,325,500 |
| 635,000 | 1 | Cypress Semiconductor Corp. | 12,134,850 |
| 2,625,000 | 1,2 | EMC Corp. | 64,338,750 |
| 750,000 | 1,2 | eBay, Inc. | 23,872,500 |
| 1,059,322 | 4,6 | Expand Networks Ltd. | 0 |
| 450,000 | 1 | First Solar, Inc. | 22,396,500 |
| 262,000 | 1 | Google, Inc. | 155,271,680 |
| 1,000,000 | 1 | LivePerson, Inc. | 12,590,000 |
| 535,432 | 1,4,5 | Mail.RU Group Ltd., Series 144A, GDR | 18,445,632 |
| 117,000 | 1 | Mellanox Technologies Ltd. | 3,786,120 |
| 3,806,875 | 1 | Microsemi Corp. | 70,274,913 |
Annual Shareholder Report10
Shares or
Principal
Amount | | | Value |
| 2,000,000 | 1 | NCR Corp. | 38,080,000 |
| 2,100,000 | 1 | NIC, Inc. | 29,001,000 |
| 3,244,176 | 1,2 | NXP Semiconductors NV | 58,297,843 |
| 335,000 | 1 | NetApp, Inc. | 13,721,600 |
| 1,700,000 | 1 | ON Semiconductor Corp. | 12,869,000 |
| 1 | 4,6 | Peachtree Open Networks | 0 |
| 1,300,000 | | Qualcomm, Inc. | 67,080,000 |
| 615,000 | 1 | RADWARE Ltd. | 16,260,600 |
| 849,173 | 1 | RDA Microelectronics, Inc., ADR | 6,878,301 |
| 1,413,683 | 1 | Riverbed Technology, Inc. | 38,989,377 |
| 180,000 | 1 | Salesforce.com, Inc. | 23,970,600 |
| 3,751,199 | 3,4,6 | Sensable Technologies, Inc. | 0 |
| 1,770,000 | 1,2 | STR Holdings, Inc. | 15,133,500 |
| 2,964,645 | 1,3 | TNS, Inc. | 57,899,517 |
| 728,412 | | Totvs SA | 12,091,762 |
| 310,000 | 1 | VMware, Inc., Class A | 30,302,500 |
| 580,550 | 1,2 | VistaPrint Ltd. | 20,272,806 |
| | TOTAL | 1,299,608,112 |
| | Materials – 6.1% | |
| 250,000 | | Allegheny Technologies, Inc. | 11,600,000 |
| 708,250 | | BASF SE | 51,473,349 |
| 1,560,000 | | Eastman Chemical Co. | 61,292,400 |
| 3,511,300 | 1 | Greatview Aseptic Packaging Company Ltd. | 1,290,928 |
| 34,631,057 | | Huabao International Holdings Ltd. | 21,989,433 |
| 72,789,906 | | Lee & Man Paper Manufacturing Ltd. | 29,333,541 |
| 46,781,387 | 1 | Mongolian Mining Corp. | 40,793,221 |
| 141,500 | | Mosaic Co./The | 8,286,240 |
| 325,000 | | Potash Corp. of Saskatchewan, Inc. | 15,382,250 |
| 510,000 | | Praxair, Inc. | 51,851,700 |
| 1,000,000 | 2 | Sociedad Quimica Y Minera de Chile, ADR | 58,500,000 |
| | TOTAL | 351,793,062 |
| | Telecommunication Services – 0.8% | |
| 2,654,130 | 1 | TW Telecom, Inc. | 49,101,405 |
Annual Shareholder Report11
Shares or
Principal
Amount | | | Value |
| | Utilities – 0.7% | |
| 582,400 | | ITC Holdings Corp. | 42,328,832 |
| | TOTAL COMMON STOCKS
(IDENTIFIED COST $4,630,186,528) | 5,722,622,503 |
| | WARRANTS – 0.1% | |
| | Health Care – 0.1% | |
| 1,500,000 | 1 | Advancis Pharmaceutical Corp., 4/12/2012 | 0 |
| 382,897 | 1 | Alexza Pharmaceuticals, Inc., 10/5/2012 | 514,575 |
| 157,125 | 1 | Clinical Data, Inc., 5/25/2012 | 0 |
| 797,358 | 1 | Corcept Therapeutics, Inc., 4/21/2013 | 760,201 |
| 242,091 | 1 | Cyclacel Pharmaceuticals, Inc., 2/17/2014 | 1,630 |
| 857,143 | 1 | Cyclacel Pharmaceuticals, Inc., 4/28/2013 | 38,917 |
| 2,750,000 | 1 | Dynavax Technologies Corp., 4/16/2015 | 5,875,375 |
| 1,042,038 | 1 | Favrille, Inc., 11/7/2012 | 0 |
| 27,781 | 1 | IntelliPharmaCeutics International, Inc., 11/14/2011 | 0 |
| 1,713,798 | 1 | Threshold Pharmaceuticals, Inc., 10/5/2014 | 1,270,610 |
| | TOTAL WARRANTS
(IDENTIFIED COST $1,055,552) | 8,461,308 |
| | Preferred Stocks – 0.0% | |
| | Health Care – 0.0% | |
| 446,816 | 1,4,6 | Cortek, Inc., Conv. Pfd., Series D2 | 0 |
| 1,515,152 | 1,4,6 | Cortex, Inc., Pfd., Series D | 0 |
| 958,744 | 3,6 | Soteira, Inc., Pfd. | 0 |
| | TOTAL | 0 |
| | Information Technology – 0.0% | |
| 679,348 | 1,4,6 | Multiplex, Inc., Pfd., Series C | 0 |
| | TOTAL PREFERRED STOCKS
(IDENTIFIED COST $8,588,631) | 0 |
| | Corporate Bonds – 0.5% | |
| | Health Care – 0.5% | |
| $14,630,000 | 3 | Insulet Corp., Conv. Bond, 3.75%, 6/15/2016 | 13,803,829 |
| 12,670,000 | 3 | Insulet Corp., Conv. Bond, 5.375%, 6/15/2013 | 13,892,909 |
| | TOTAL CORPORATE BONDS
(IDENTIFIED COST $27,300,000) | 27,696,738 |
Annual Shareholder Report12
Shares or
Principal
Amount | | | Value |
| | MUTUAL FUND – 8.9% | |
| 511,911,319 | 3,7,8 | Federated Prime Value Obligations Fund, Institutional Shares, 0.18%
(AT NET ASSET VALUE) | 511,911,319 |
| | TOTAL INVESTMENTS — 108.2%
(IDENTIFIED COST $5,179,042,030)9 | 6,270,691,868 |
| | OTHER ASSETS AND LIABILITIES - NET — (8.2)%10 | (473,600,948) |
| | TOTAL NET ASSETS — 100% | $5,797,090,920 |
At October 31, 2011, the Fund had the following outstanding foreign exchange contracts:
| Settlement Date | Foreign
Currency
Units to Deliver | In
Exchange
For | Unrealized
Depreciation |
| Contracts Purchased: | | |
| 11/3/2011 | 759,953 Brazilian Real | $447,373 | $(4,729) |
| 11/3/2011 | 15,509 Brazilian Real | $9,130 | $(97) |
UNREALIZED DEPRECIATION ON
FOREIGN EXCHANGE CONTRACTS | | | $(4,826) |
Unrealized Depreciation on Foreign Exchange Contracts is included in “Other Assets and Liabilities — Net.”
| 1 | Non-income producing security. |
| 2 | All or a portion of these securities are temporarily on loan to unaffiliated broker/dealers. |
| 3 | Affiliated holdings. |
| 4 | Denotes a restricted security that either: (a) cannot be offered for public sale without first being registered, or being able to take advantage of an exemption from registration, under the Securities Act of 1933; or (b) is subject to a contractual restriction on public sales. At October 31, 2011, these restricted securities amounted to $79,257,805, which represented 1.4% of total net assets. |
| 5 | Denotes a restricted security that may be resold without restriction to “qualified institutional buyers” as defined in Rule 144A under the Securities Act of 1933 and that the Fund has determined to be liquid under criteria established by the Fund's Board of Trustees (the “Trustees”). At October 31, 2011, these liquid restricted securities amounted to $54,000,949, which represented 0.9% of total net assets. |
| 6 | Market quotations and price evaluations are not available. Fair value determined in accordance with procedures established by and under the general supervision of the Trustees. |
| 7 | 7-Day net yield. |
| 8 | All or a portion of this security is held as collateral for securities lending. |
| 9 | The cost of investments for federal tax purposes amounts to $5,219,872,701. |
| 10 | Assets, other than investments in securities, less liabilities. See Statement of Assets and Liabilities. |
Note: The categories of investments are shown as a percentage of total net assets at October 31, 2011.
Annual Shareholder Report
13
Various inputs are used in determining the value of the Fund's investments. These inputs are summarized in the three broad levels listed below:Level 1 — quoted prices in active markets for identical securities, including investment companies with daily net asset values, if applicable.
Level 2 — other significant observable inputs (including quoted prices for similar securities, interest rates, prepayment speeds, credit risk, etc.). Also includes securities valued at amortized cost.
Level 3 — significant unobservable inputs (including the Fund's own assumptions in determining the fair value of investments).
The inputs or methodology used for valuing securities are not an indication of the risk associated with investing in those securities.
The following is a summary of the inputs used, as of October 31, 2011, in valuing the Fund's assets carried at fair value:
| Valuation Inputs | | | | |
| Level 1 —
Quoted
Prices and
Investments in
Mutual Funds | Level 2 —
Other
Significant
Observable
Inputs | Level 3 —
Significant
Unobservable
Inputs | Total |
| Equity Securities: | | | | |
| Common Stocks | | | | |
| Domestic | $3,788,370,240 | $ — | $9,828,281 | $3,798,198,521 |
| International | 1,114,427,228 | 809,996,7541 | — | 1,924,423,982 |
| Preferred Stocks | | | | |
| Domestic | — | — | 0 | 0 |
| Debt Securities: | | | | |
| Corporate Bonds | — | 27,696,738 | — | 27,696,738 |
| Warrants | — | 8,461,308 | — | 8,461,308 |
| Mutual Fund | 511,911,319 | — | — | 511,911,319 |
| TOTAL SECURITIES | $5,414,708,787 | $846,154,800 | $9,828,281 | $6,270,691,868 |
| OTHER FINANCIAL INSTRUMENTS2 | $(4,826) | $ — | $ — | $(4,826) |
| 1 | Includes $40,574,712 of a security transferred from Level 1 to Level 2 because fair value factors were applied to the equity security traded principally in foreign markets to account for significant post market close activity. Transfer shown represents the value of the security at the beginning of the period. |
| 2 | Other financial instruments include foreign exchange contracts. |
Annual Shareholder Report
14
Following is a reconciliation of assets in which significant unobservable inputs (Level 3) were used in determining fair value: | Investments
in Common
Stock —
Domestic
Securities | Investments
in Common
Stock —
International
Securities | Investments
in Preferred
Stock —
Domestic
Securities |
| Balance as of November 1, 2010 | $11,113,453 | $493,814 | $616,987 |
| Realized gain (loss) | (10,880,985) | 318,661 | (19,666,662) |
| Change in unrealized appreciation (depreciation) | 9,550,253 | (493,814) | 19,049,675 |
| Purchases | 130,000 | — | — |
| (Sales) | (84,440) | (318,661) | — |
| Balance as of October 31, 2011 | $9,828,281 | $ — | $0 |
| The total change in unrealized appreciation (depreciation) included in the Statement of Operations attributable to investments still held at October 31, 2011 | $(1,330,732) | $ — | $(616,987) |
The following acronyms are used throughout this portfolio:
| ADR | — American Depositary Receipt |
| GDR | — Global Depository Receipt |
| LP | — Limited Partnership |
See Notes which are an integral part of the Financial Statements
Annual Shareholder Report15
Financial Highlights – Class A Shares
(For a Share Outstanding Throughout Each Period)
| Year Ended October 31 | 2011 | 2010 | 2009 | 2008 | 2007 |
Net Asset Value,
Beginning of Period | $5.27 | $4.22 | $3.80 | $7.03 | $6.08 |
Income From
Investment Operations: | | | | | |
| Net investment income (loss) | (0.05)1 | 0.021 | (0.00)1,2 | (0.03)1 | (0.04)1 |
| Net realized and unrealized gain (loss) on investments, written options, futures contracts, short sales and foreign currency transactions | (0.27) | 1.04 | 0.42 | (2.57) | 1.73 |
| TOTAL FROM INVESTMENT OPERATIONS | (0.32) | 1.06 | 0.42 | (2.60) | 1.69 |
| Less Distributions: | | | | | |
| Distributions from net investment income | (0.03) | (0.01) | — | — | — |
| Distributions from net realized gain on investments and foreign currency transactions | (0.00)2 | — | — | (0.63) | (0.74) |
| TOTAL DISTRIBUTIONS | (0.03) | (0.01) | — | (0.63) | (0.74) |
| Net Asset Value, End of Period | $4.92 | $5.27 | $4.22 | $3.80 | $7.03 |
| Total Return3 | (6.07)% | 25.11% | 11.05% | (40.38)% | 31.07% |
| Ratios to Average Net Assets: | | | | | |
| Net expenses | 1.95%4 | 1.95%4 | 1.95%4 | 1.95%4 | 1.95%4 |
| Net expenses excluding dividends and other expenses related to short sales | 1.95%4 | 1.95%4 | 1.95%4 | 1.95%4 | 1.95%4 |
| Net investment income (loss) | (0.99)% | 0.39% | (0.12)% | (0.56)% | (0.63)% |
| Expense waiver/reimbursement5 | 0.29% | 0.28% | 0.27% | 0.23% | 0.22% |
| Supplemental Data: | | | | | |
| Net assets, end of period (000 omitted) | $1,999,940 | $2,469,094 | $2,153,443 | $2,158,140 | $3,730,840 |
| Portfolio turnover | 64% | 54% | 91% | 78% | 49% |
| 1 | Per share numbers have been calculated using the average shares method. |
| 2 | Represents less than $0.01. |
| 3 | Based on net asset value, which does not reflect the sales charge, redemption fee or contingent deferred sales charge, if applicable. |
| 4 | The net expense ratio is calculated without reduction for fees paid indirectly for expense offset arrangements. The net expense ratios are 1.95%, 1.95%, 1.95%, 1.95% and 1.95% after taking into account these expense reductions for the years ended October 31, 2011, 2010, 2009, 2008 and 2007, respectively. The net expense ratios excluding dividends and other expenses related to short sales are also calculated without reduction for these fees paid indirectly for expense offset arrangements. |
| 5 | This expense decrease is reflected in both the net expense and the net investment income (loss) ratios shown above. |
See Notes which are an integral part of the Financial Statements
Annual Shareholder Report16
Financial Highlights – Class B Shares
(For a Share Outstanding Throughout Each Period)
| Year Ended October 31 | 2011 | 2010 | 2009 | 2008 | 2007 |
| Net Asset Value, Beginning of Period | $4.96 | $4.00 | $3.62 | $6.75 | $5.89 |
| Income From Investment Operations: | | | | | |
| Net investment income (loss) | (0.08)1 | (0.01)1 | (0.02)1 | (0.06)1 | (0.07)1 |
| Net realized and unrealized gain (loss) on investments, written options, futures contracts, short sales and foreign currency transactions | (0.24) | 0.97 | 0.40 | (2.44) | 1.67 |
| TOTAL FROM INVESTMENT OPERATIONS | (0.32) | 0.96 | 0.38 | (2.50) | 1.60 |
| Less Distributions: | | | | | |
| Distributions from net investment income | (0.00)2 | — | — | — | — |
| Distributions from net realized gain on investments and foreign currency transactions | (0.00)2 | — | — | (0.63) | (0.74) |
| TOTAL DISTRIBUTIONS | (0.00)2 | — | — | (0.63) | (0.74) |
| Net Asset Value, End of Period | $4.64 | $4.96 | $4.00 | $3.62 | $6.75 |
| Total Return3 | (6.40)% | 24.00% | 10.50% | (40.60)% | 30.45% |
| Ratios to Average Net Assets: | | | | | |
| Net expenses | 2.50%4 | 2.50%4 | 2.50%4 | 2.50%4 | 2.50%4 |
| Net expenses excluding dividends and other expenses related to short sales | 2.50%4 | 2.50%4 | 2.50%4 | 2.50%4 | 2.50%4 |
| Net investment income (loss) | (1.53)% | (0.27)% | (0.67)% | (1.11)% | (1.18)% |
| Expense waiver/reimbursement5 | 0.24% | 0.23% | 0.22% | 0.19% | 0.18% |
| Supplemental Data: | | | | | |
| Net assets, end of period (000 omitted) | $301,469 | $473,934 | $562,618 | $651,474 | $1,362,195 |
| Portfolio turnover | 64% | 54% | 91% | 78% | 49% |
| 1 | Per share numbers have been calculated using the average shares method. |
| 2 | Represents less than $0.01. |
| 3 | Based on net asset value, which does not reflect the sales charge, redemption fee or contingent deferred sales charge, if applicable. |
| 4 | The net expense ratio is calculated without reduction for fees paid indirectly for expense offset arrangements. The net expense ratios are 2.50%, 2.50%, 2.50%, 2.50% and 2.50% after taking into account these expense reductions for the years ended October 31, 2011, 2010, 2009, 2008 and 2007, respectively. The net expense ratios excluding dividends and other expenses related to short sales are also calculated without reduction for these fees paid indirectly for expense offset arrangements. |
| 5 | This expense decrease is reflected in both the net expense and the net investment income (loss) ratios shown above. |
See Notes which are an integral part of the Financial Statements
Annual Shareholder Report17
Financial Highlights – Class C Shares
(For a Share Outstanding Throughout Each Period)
| Year Ended October 31 | 2011 | 2010 | 2009 | 2008 | 2007 |
| Net Asset Value, Beginning of Period | $4.97 | $4.00 | $3.62 | $6.75 | $5.89 |
| Income From Investment Operations: | | | | | |
| Net investment income (loss) | (0.08)1 | (0.01)1 | (0.02)1 | (0.06)1 | (0.07)1 |
| Net realized and unrealized gain (loss) on investments, written options, futures contracts, short sales and foreign currency transactions | (0.24) | 0.98 | 0.40 | (2.44) | 1.67 |
| TOTAL FROM INVESTMENT OPERATIONS | (0.32) | 0.97 | 0.38 | (2.50) | 1.60 |
| Less Distributions: | | | | | |
| Distributions from net investment income | (0.01) | — | — | — | — |
| Distributions from net realized gain on investments and foreign currency transactions | (0.00)2 | — | — | (0.63) | (0.74) |
| TOTAL DISTRIBUTIONS | (0.01) | — | — | (0.63) | (0.74) |
| Net Asset Value, End of Period | $4.64 | $4.97 | $4.00 | $3.62 | $6.75 |
| Total Return3 | (6.53)% | 24.25% | 10.50% | (40.60)% | 30.45% |
| Ratios to Average Net Assets: | | | | | |
| Net expenses | 2.50%4 | 2.50%4 | 2.50%4 | 2.50%4 | 2.50%4 |
| Net expenses excluding dividends and other expenses related to short sales | 2.50%4 | 2.50%4 | 2.50%4 | 2.50%4 | 2.50%4 |
| Net investment income (loss) | (1.53)% | (0.19)% | (0.67)% | (1.11)% | (1.18)% |
| Expense waiver/reimbursement5 | 0.24% | 0.23% | 0.22% | 0.19% | 0.18% |
| Supplemental Data: | | | | | |
| Net assets, end of period (000 omitted) | $494,457 | $680,501 | $656,086 | $707,980 | $1,246,604 |
| Portfolio turnover | 64% | 54% | 91% | 78% | 49% |
| 1 | Per share numbers have been calculated using the average shares method. |
| 2 | Represents less than $0.01. |
| 3 | Based on net asset value, which does not reflect the sales charge, redemption fee or contingent deferred sales charge, if applicable. |
| 4 | The net expense ratio is calculated without reduction for fees paid indirectly for expense offset arrangements. The net expense ratios are 2.50%, 2.50%, 2.50%, 2.50% and 2.50% after taking into account these expense reductions for the years ended October 31, 2011, 2010, 2009, 2008 and 2007, respectively. The net expense ratios excluding dividends and other expenses related to short sales are also calculated without reduction for these fees paid indirectly for expense offset arrangements. |
| 5 | This expense decrease is reflected in both the net expense and the net investment income (loss) ratios shown above. |
See Notes which are an integral part of the Financial Statements
Annual Shareholder Report18
Statement of Assets and Liabilities
October 31, 2011
| Assets: | | |
| Total investments in securities, at value including $417,336,141 of securities loaned and $1,455,297,695 of investments in affiliated holdings (Note 5) (identified cost $5,179,042,030) | | $6,270,691,868 |
| Cash | | 46,626 |
| Cash denominated in foreign currencies (identified cost $27,051,711) | | 27,081,040 |
| Income receivable | | 1,439,019 |
| Receivable for investments sold | | 54,724,417 |
| Receivable for shares sold | | 2,966,156 |
| TOTAL ASSETS | | 6,356,949,126 |
| Liabilities: | | |
| Payable to adviser (Note 5) | $1,872 | |
| Payable for investments purchased | 95,832,444 | |
| Payable for shares redeemed | 12,719,404 | |
| Unrealized depreciation on foreign exchange contracts | 4,826 | |
| Payable for collateral due to broker for securities lending | 443,574,449 | |
| Payable for capital gains taxes withheld | 1,251,666 | |
| Payable for Directors'/Trustees' fees | 4,406 | |
| Payable for distribution services fee (Note 5) | 939,308 | |
| Payable for shareholder services fee (Note 5) | 2,810,753 | |
| Accrued expenses | 2,719,078 | |
| TOTAL LIABILITIES | | 559,858,206 |
| Net assets for 1,187,057,229 shares outstanding | | $5,797,090,920 |
| Net Assets Consist of: | | |
| Paid-in capital | | $4,637,754,339 |
| Net unrealized appreciation of investments and translation of assets and liabilities in foreign currency | | 1,091,464,875 |
| Accumulated net realized gain on investments, futures contracts, written options and foreign currency transactions | | 67,871,706 |
| TOTAL NET ASSETS | | $5,797,090,920 |
Annual Shareholder Report19
Statement of Assets and Liabilities — continued| Net Asset Value, Offering Price and Redemption Proceeds Per Share | | |
| Class A Shares: | | |
| Net asset value per share ($1,999,939,919 ÷ 406,264,232 shares outstanding), no par value, unlimited shares authorized | | $4.92 |
| Offering price per share (100/94.50 of $4.92) | | $5.21 |
| Redemption proceeds per share | | $4.92 |
| Class B Shares: | | |
| Net asset value per share ($301,468,796 ÷ 64,967,410 shares outstanding), no par value, unlimited shares authorized | | $4.64 |
| Offering price per share | | $4.64 |
| Redemption proceeds per share (94.50/100 of $4.64) | | $4.38 |
| Class C Shares: | | |
| Net asset value per share ($494,456,897 ÷ 106,588,582 shares outstanding), no par value, unlimited shares authorized | | $4.64 |
| Offering price per share | | $4.64 |
| Redemption proceeds per share (99/100 of $4.64) | | $4.59 |
| Class R Shares: | | |
| Net asset value per share ($3,001,225,308 ÷ 609,237,005 shares outstanding), no par value, unlimited shares authorized | | $4.93 |
| Offering price per share | | $4.93 |
| Redemption proceeds per share (99.80/100 of $4.93) | | $4.92 |
See Notes which are an integral part of the Financial Statements
Annual Shareholder Report20
Statement of Operations
Year Ended October 31, 2011
| Investment Income: | | | |
| Dividends (including $4,596,221 received from affiliated holdings (Note 5)) | | | $59,344,861 |
| Interest (including $1,399,956 received from affiliated holdings (Note 5) and income on securities loaned of $5,446,032) | | | 7,026,472 |
| TOTAL INCOME | | | 66,371,333 |
| Expenses: | | | |
| Investment adviser fee (Note 5) | | $97,739,359 | |
| Administrative fee (Note 5) | | 5,358,022 | |
| Custodian fees | | 4,077,593 | |
| Transfer and dividend disbursing agent fees and expenses (Note 2) | | 11,112,992 | |
| Directors'/Trustees' fees | | 60,294 | |
| Auditing fees | | 36,624 | |
| Legal fees | | 4,609 | |
| Portfolio accounting fees | | 208,735 | |
| Distribution services fee (Note 5) | | 31,007,015 | |
| Shareholder services fee (Note 5) | | 17,022,357 | |
| Account administration fee (Note 2) | | 49,135 | |
| Share registration costs | | 93,991 | |
| Printing and postage | | 543,942 | |
| Insurance premiums | | 18,872 | |
| Miscellaneous | | 75,844 | |
| TOTAL EXPENSES | | 167,409,384 | |
Annual Shareholder Report21
Statement of Operations — continued| Waivers, Reimbursements and Reduction: | | | |
| Waiver/reimbursement of investment adviser fee (Note 5) | $(10,288,354) | | |
| Waiver of administrative fee (Note 5) | (138,398) | | |
| Waiver of distribution services fee (Note 5) | (16,933,234) | | |
| Reimbursement of shareholder services fee (Note 5) | (322,861) | | |
| Fees paid indirectly from directed brokerage arrangements (Note 6) | (65,729) | | |
| TOTAL WAIVERS, REIMBURSEMENTS AND REDUCTION | | $(27,748,576) | |
| Net expenses | | | $139,660,808 |
| Net investment income (loss) | | | (73,289,475) |
| Realized and Unrealized Gain (Loss) on Investments and Foreign Currency Transactions: | | | |
| Net realized gain on investments and foreign currency (including realized gain of $195,253,848 on sale of investments in affiliated holdings (Note 5)) | | | 845,883,977 |
| Net change in unrealized appreciation of investments and translation of assets and liabilities in foreign currency | | | (1,116,013,448) |
| Net realized and unrealized loss on investments and foreign currency transactions | | | (270,129,471) |
| Change in net assets resulting from operations | | | $(343,418,946) |
See Notes which are an integral part of the Financial Statements
Annual Shareholder Report22
Statement of Changes in Net Assets
| Year Ended October 31 | 2011 | 2010 |
| Increase (Decrease) in Net Assets | | |
| Operations: | | |
| Net investment income (loss) | $(73,289,475) | $19,701,396 |
| Net realized gain on investments and foreign currency transactions | 845,883,977 | 253,892,900 |
| Net change in unrealized appreciation/depreciation of investments and translation of assets and liabilities in foreign currency | (1,116,013,448) | 1,256,013,974 |
| CHANGE IN NET ASSETS RESULTING FROM OPERATIONS | (343,418,946) | 1,529,608,270 |
| Distributions to Shareholders: | | |
| Distributions from net investment income | | |
| Class A Shares | (15,556,814) | (4,293,307) |
| Class B Shares | (253,171) | — |
| Class C Shares | (803,794) | — |
| Class R Shares | (22,840,571) | (6,296,827) |
| Distributions from net realized gain on investments | | |
| Class A Shares | (19,173) | — |
| Class B Shares | (312) | — |
| Class C Shares | (991) | — |
| Class R Shares | (28,151) | — |
| CHANGE IN NET ASSETS RESULTING FROM DISTRIBUTIONS TO SHAREHOLDERS | (39,502,977) | (10,590,134) |
| Share Transactions: | | |
| Proceeds from sale of shares | 763,905,692 | 758,063,276 |
| Net asset value of shares issued to shareholders in payment of distributions declared | 36,595,371 | 9,822,517 |
| Cost of shares redeemed | (1,865,805,782) | (1,582,655,103) |
| CHANGE IN NET ASSETS RESULTING FROM SHARE TRANSACTIONS | (1,065,304,719) | (814,769,310) |
| Change in net assets | (1,448,226,642) | 704,248,826 |
| Net Assets: | | |
| Beginning of period | 7,245,317,562 | 6,541,068,736 |
| End of period (including undistributed net investment income of $0 and $10,346,338, respectively) | $5,797,090,920 | $7,245,317,562 |
See Notes which are an integral part of the Financial Statements
Annual Shareholder Report23
Notes to Financial Statements
October 31, 2011
1. ORGANIZATION
Federated Equity Funds (the “Trust”) is registered under the Investment Company Act of 1940, as amended (the “Act”), as an open-end management investment company. The Trust consists of 13 portfolios. The financial statements included herein are only those of Federated Kaufmann Fund (the “Fund”), a diversified portfolio. The financial statements of the other portfolios are presented separately. The assets of each portfolio are segregated and a shareholder's interest is limited to the portfolio in which shares are held. Each portfolio pays its own expenses. The Fund offers four classes of shares: Class A Shares, Class B Shares, Class C Shares and Class R Shares. All shares of the Fund have equal rights with respect to voting, except on class-specific matters. The financial highlights of the Class R Shares are presented separately. The investment objective of the Fund is to provide capital appreciation.
2. SIGNIFICANT ACCOUNTING POLICIES
The following is a summary of significant accounting policies consistently followed by the Fund in the preparation of its financial statements. These policies are in conformity with U.S. generally accepted accounting principles (GAAP).
Investment Valuation
In calculating its net asset value (NAV), the Fund generally values investments as follows:
- Equity securities listed on an exchange or traded through a regulated market system are valued at their last reported sale price or official closing price in their principal exchange or market.
- Shares of other mutual funds are valued based upon their reported NAVs.
- Fixed-income securities acquired with remaining maturities greater than 60 days are fair valued using price evaluations provided by a pricing service approved by the Trustees.
- Fixed-income securities acquired with remaining maturities of 60 days or less are valued at their cost (adjusted for the accretion of any discount or amortization of any premium), which approximates market value.
- Derivative contracts listed on exchanges are valued at their reported settlement or closing price.
- Over-the-counter (OTC) derivative contracts are fair valued using price evaluations provided by a pricing service approved by the Trustees.
- For securities that are fair valued in accordance with procedures established by and under the general supervision of the Trustees, certain factors may be considered such as: the purchase price of the security, information obtained by contacting the issuer, analysis of the issuer's financial statements or other available documents, fundamental analytical data, the nature and duration of restrictions on disposition, the movement of the market in which the security is normally traded and public trading in similar securities of the issuer or comparable issuers.
If the Fund cannot obtain a price or price evaluation from a pricing service for an investment, the Fund may attempt to value the investment based upon the mean of bid and asked quotations or fair value the investment based on price evaluations from one or more dealers. If any price, quotation, price evaluation or other pricing source is not readily available when the NAV is calculated, the Fund uses the fair value of the investment determined in accordance with the procedures described below. There can be no assurance that the Fund could purchase or sell an investment at the price used to calculate the Fund's NAV.
Annual Shareholder Report
24
Fair Valuation and Significant Events ProceduresThe Trustees have authorized the use of pricing services to provide evaluations of the current fair value of certain investments for purposes of calculating the NAV. Factors considered by pricing services in evaluating an investment include the yields or prices of investments of comparable quality, coupon, maturity, call rights and other potential prepayments, terms and type, reported transactions, indications as to values from dealers and general market conditions. Some pricing services provide a single price evaluation reflecting the bid-side of the market for an investment (a “bid” evaluation). Other pricing services offer both bid evaluations and price evaluations indicative of a price between the prices bid and asked for the investment (a “mid” evaluation). The Fund normally uses bid evaluations for U.S. Treasury and Agency securities. The Fund normally uses mid evaluations for other types of fixed-income securities and OTC derivative contracts. In the event that market quotations and price evaluations are not available for an investment, the fair value of the investment is determined in accordance with procedures adopted by the Trustees.
The Trustees also have adopted procedures requiring an investment to be priced at its fair value whenever the Adviser determines that a significant event affecting the value of the investment has occurred between the time as of which the price of the investment would otherwise be determined and the time as of which the NAV is computed. An event is considered significant if there is both an affirmative expectation that the investment's value will change in response to the event and a reasonable basis for quantifying the resulting change in value. Examples of significant events that may occur after the close of the principal market on which a security is traded, or after the time of a price evaluation provided by a pricing service or a dealer, include:
- With respect to securities traded in foreign markets, significant trends in U.S. equity markets or in the trading of foreign securities index futures or options contracts;
- With respect to price evaluations of fixed-income securities determined before the close of regular trading on the NYSE, actions by the Federal Reserve Open Market Committee and other significant trends in U.S. fixed-income markets;
- Political or other developments affecting the economy or markets in which an issuer conducts its operations or its securities are traded; and
- Announcements concerning matters such as acquisitions, recapitalizations, litigation developments, a natural disaster affecting the issuer's operations or regulatory changes or market developments affecting the issuer's industry.
The Trustees have approved the use of a pricing service to determine the fair value of equity securities traded principally in foreign markets when the Adviser determines that there has been a significant trend in the U.S. equity markets or in index futures trading. For other significant events, the Fund may seek to obtain more current quotations or price evaluations from alternative pricing sources. If a reliable alternative pricing source is not available, the Fund will determine the fair value of the investment using another method approved by the Trustees.
Repurchase Agreements
The Fund may invest in repurchase agreements for short-term liquidity purposes. It is the policy of the Fund to require the other party to a repurchase agreement to transfer to the Fund's custodian or sub-custodian eligible securities or cash with a market value (after transaction costs) at least equal to the repurchase price to be paid under the repurchase agreement. The eligible securities are transferred to accounts with the custodian or sub-custodian in which the Fund holds a “securities entitlement” and exercises “control” as those terms are defined in the Uniform Commercial Code. The Fund has established procedures for Annual Shareholder Report
25
monitoring the market value of the transferred securities and requiring the transfer of additional eligible securities if necessary to equal at least the repurchase price. These procedures also allow the other party to require securities to be transferred from the account to the extent that their market value exceeds the repurchase price or in exchange for other eligible securities of equivalent market value.The insolvency of the other party or other failure to repurchase the securities may delay the disposition of the underlying securities or cause the Fund to receive less than the full repurchase price. Under the terms of the repurchase agreement, any amounts received by the Fund in excess of the repurchase price and related transaction costs must be remitted to the other party.
The Fund may enter into repurchase agreements in which eligible securities are transferred into joint trading accounts maintained by the custodian or sub-custodian for investment companies and other clients advised by the Fund's Adviser and its affiliates. The Fund will participate on a pro rata basis with the other investment companies and clients in its share of the securities transferred under such repurchase agreements and in its share of proceeds from any repurchase or other disposition of such securities.
Investment Income, Gains and Losses, Expenses and Distributions
Investment transactions are accounted for on a trade-date basis. Realized gains and losses from investment transactions are recorded on an identified-cost basis. Interest income and expenses are accrued daily. Dividend income and distributions to shareholders are recorded on the ex-dividend date. Foreign dividends are recorded on the ex-dividend date or when the Fund is informed of the ex-dividend date. Distributions of net investment income, if any, are declared and paid annually. Non-cash dividends included in dividend income, if any, are recorded at fair value. Investment income, realized and unrealized gains and losses, and certain fund-level expenses are allocated to each class based on relative average daily net assets, except that Class A Shares, Class B Shares, Class C Shares and Class R Shares may bear distribution services fees, shareholder services fees, account administration fees and certain transfer and dividend disbursing agent fees unique to those classes. For the year ended October 31, 2011, transfer and dividend disbursing agent fees and account administration fees for the Fund were as follows:
| Transfer and
Dividend
Disbursing
Agent Fees
Incurred | Account
Administration
Fees Incurred |
| Class A Shares | $3,728,189 | $32,637 |
| Class B Shares | 641,161 | — |
| Class C Shares | 988,061 | 2,662 |
| Class R Shares | 5,755,581 | 13,836 |
| TOTAL | $11,112,992 | $49,135 |
Dividends are declared separately for each class. No class has preferential dividend rights; differences in per share dividend rates are generally due to differences in separate class expenses.
Annual Shareholder Report
26
Premium and Discount AmortizationAll premiums and discounts on fixed-income securities are amortized/accreted using the effective interest rate method.
Federal Taxes
It is the Fund's policy to comply with the Subchapter M provision of the Internal Revenue Code and to distribute to shareholders each year substantially all of its income. Accordingly, no provision for federal income tax is necessary. As of and during the year ended October 31, 2011, the Fund did not have a liability for any uncertain tax positions. The Fund recognizes interest and penalties, if any, related to tax liabilities as income tax expense in the Statement of Operations. As of October 31, 2011, tax years 2008 through 2011 remain subject to examination by the Fund's major tax jurisdictions, which include the United States of America and the Commonwealth of Massachusetts.
The Fund may be subject to taxes imposed by governments of countries in which it invests. Such taxes are generally based on either income or gains earned or repatriated. The Fund accrues and applies such taxes to net investment income, net realized gains and net unrealized gains as income and/or gains are earned.
When-Issued and Delayed Delivery Transactions
The Fund may engage in when-issued or delayed delivery transactions. The Fund records when-issued securities on the trade date and maintains security positions such that sufficient liquid assets will be available to make payment for the securities purchased. Securities purchased on a when-issued or delayed delivery basis are marked to market daily and begin earning interest on the settlement date. Losses may occur on these transactions due to changes in market conditions or the failure of counterparties to perform under the contract.
Foreign Exchange Contracts
The Fund enters into foreign exchange contracts for the delayed delivery of securities or foreign currency exchange transactions. The Fund enters into foreign exchange contracts to protect assets against adverse changes in foreign currency exchange rates or exchange control regulations. Purchased contracts are used to acquire exposure to foreign currencies, whereas, contracts to sell are used to hedge the Fund's securities against currency fluctuations. Risks may arise upon entering into these transactions from the potential inability of counterparties to meet the terms of their commitments and from unanticipated movements in security prices or foreign exchange rates. The foreign exchange contracts are adjusted by the daily exchange rate of the underlying currency and any gains or losses are recorded for financial statement purposes as unrealized until the settlement date.
Foreign exchange contracts outstanding at period end are listed after the Fund's Portfolio of Investments.
The average value at settlement date payable and receivable of foreign exchange contracts purchased and sold by the Fund throughout the period was $17,937 and $8,281, respectively. This is based on the contracts held as of each month-end throughout the fiscal period.
Foreign Currency Translation
The accounting records of the Fund are maintained in U.S. dollars. All assets and liabilities denominated in foreign currencies (FCs) are translated into U.S. dollars based on the rates of exchange of such currencies against U.S. dollars on the date of valuation. Purchases and sales of securities, income and expenses are translated at the rate of exchange quoted on the Annual Shareholder Report
27
respective date that such transactions are recorded. The Fund does not isolate that portion of the results of operations resulting from changes in foreign exchange rates on investments from the fluctuations arising from changes in market prices of securities held. Such fluctuations are included with the net realized and unrealized gain or loss from investments.Reported net realized foreign exchange gains or losses arise from sales of portfolio securities, sales and maturities of short-term securities, sales of FCs, currency gains or losses realized between the trade and settlement dates on securities transactions, the difference between the amounts of dividends, interest and foreign withholding taxes recorded on the Fund's books, and the U.S. dollar equivalent of the amounts actually received or paid. Net unrealized foreign exchange gains and losses arise from changes in the value of assets and liabilities other than investments in securities at fiscal year end, resulting from changes in the exchange rate.
Securities Lending
The Fund participates in a securities lending program providing for the lending of equity securities to qualified brokers. The Fund normally receives cash collateral for securities loaned that is invested in an affiliated money market fund or in short-term securities including repurchase agreements. Collateral is maintained at a minimum level of 100% of the market value of investments loaned, plus interest, if applicable. Earnings on collateral are allocated between the securities lending agent, as a fee for its services under the program, and the Fund, according to agreed-upon rates.
As of October 31, 2011, securities subject to this type of arrangement and related collateral were as follows:
Market Value of
Securities Loaned | Market Value
of Collateral |
| $417,336,141 | $443,574,449 |
Short Sales
In a short sale, the Find sells a security it does not own in anticipation of a decline in the fair market value of the security. When the Fund sells a security short, it must borrow the security in order to deliver it at the completion of the sale. A gain, limited to the price at which the Fund sold the security short, or a loss, unlimited in size, will be recognized upon the termination of the short sale.
The Fund has an obligation to replace the borrowed security (e.g., to purchase the security at a future date and deliver it to the lender of the security). While the security is borrowed, the proceeds from the sale are deposited with the lender (“Prime Broker”). The Fund may incur two types of expenses from short sales: borrowing expenses and dividend expenses. Borrowing expenses may occur because the Fund may be obligated to pay fees to the Prime Broker on borrowed securities. This fee is normally based upon the market value of the borrowed security and is dependent upon the availablity of the security. Dividend expenses may occur because the Fund has to pay the Prime Broker the equivalent of any dividends earned on the borrowed security.
Restricted Securities
The Fund may purchase securities which are considered restricted. Restricted securities are securities that either: (a) cannot be offered for public sale without first being registered, or being able to take advantage of an exemption from registration, under the Securities Act of 1933; or (b) are subject to contractual restrictions on public sales. In some cases, when a Annual Shareholder Report
28
security cannot be offered for public sale without first being registered, the issuer of the restricted security has agreed to register such securities for resale, at the issuer's expense, either upon demand by the Fund or in connection with another registered offering of the securities. Many such restricted securities may be resold in the secondary market in transactions exempt from registration. Restricted securities may be determined to be liquid under criteria established by the Trustees. The Fund will not incur any registration costs upon such resales. The Fund's restricted securities are valued at the price provided by dealers in the secondary market or, if no market prices are available, at the fair value as determined in accordance with procedures established by and under the general supervision of the Trustees.Additional information on restricted securities, excluding securities purchased under Rule 144A, if applicable, that have been deemed liquid by the Trustees, held at October 31, 2011, is as follows:
| Security | Acquisition Date | Cost | Market Value |
| Apollo Investment Fund V | 5/18/2001 | $0 | $4,106,516 |
| Conceptus, Inc. | 8/11/2005 | $4,500,000 | $7,200,000 |
| Conceptus, Inc. | 4/10/2001 | $5,000,000 | $8,228,575 |
| Cortek, Inc. | 2/29/2000 | $0 | $0 |
| Cortek, Inc., Conv. Pfd., Series D2 | 3/31/2003 | $0 | $0 |
| Cortex, Inc., Pfd., Series D | 6/18/2001 | $0 | $0 |
| Denovo Ventures I LP | 3/9/2000 | $2,888,396 | $1,068,278 |
| Expand Networks Ltd. | 9/22/2000 | $2,500,000 | $0 |
| FA Private Equity Fund IV LP | 3/4/2002 | $439,044 | $821,287 |
| Infrastructure Fund | 8/11/2000 | $404,496 | $0 |
| Latin Healthcare Fund | 11/28/2000 | $0 | $335,009 |
| Multiplex, Inc., Pfd., Series C | 2/22/2001 | $5,000,001 | $0 |
| Peachtree Leadscope LLC, Class A and B | 6/30/2000 | $712,054 | $0 |
| Peachtree Leadscope LLC, Class C | 4/30/2002 | $3,000,000 | $3,250,000 |
| Peachtree Open Networks | 10/5/2000 | $892,599 | $0 |
| Peachtree Velquest | 9/14/2000 | $494,382 | $247,191 |
| Sensable Technologies, Inc. | 10/15/2004 | $0 | $0 |
Annual Shareholder Report29
Additional Disclosure Related to Derivative Instruments
| Fair Value of Derivative Instruments |
| | | Liability |
| | | Statement of
Assets and
Liabilities
Location | Fair
Value |
| Derivatives not accounted for as hedging instruments under ASC Topic 815 | | | |
| Foreign exchange contracts | | | Unrealized depreciation on foreign exchange contracts | $4,826 |
The Effect of Derivative Instruments on the Statement of Operations for the Year Ended October 31, 2011
| Amount of Realized Gain or (Loss) on Derivatives Recognized in Income |
| Forward
Currency
Contracts |
| Foreign exchange contracts | $(1,347,453) |
| Change in Unrealized Appreciation or (Depreciation) on Derivatives Recognized in Income |
| Forward
Currency
Contracts |
| Foreign exchange contracts | $48,699 |
Other
The preparation of financial statements in conformity with GAAP requires management to make estimates and assumptions that affect the amounts of assets, liabilities, expenses and revenues reported in the financial statements. Actual results could differ from those estimated.
3. SHARES OF BENEFICIAL INTEREST
The following tables summarize share activity:
| Year Ended October 31 | 2011 | 2010 |
| Class A Shares: | Shares | Amount | Shares | Amount |
| Shares sold | 98,824,715 | $516,747,402 | 108,384,912 | $510,485,496 |
| Shares issued to shareholders in payment of distributions declared | 2,507,026 | 13,688,361 | 801,053 | 3,756,940 |
| Shares redeemed | (163,851,163) | (870,540,365) | (150,272,322) | (709,884,481) |
NET CHANGE RESULTING FROM
CLASS A SHARE TRANSACTIONS | (62,519,422) | $(340,104,602) | (41,086,357) | $(195,642,045) |
Annual Shareholder Report30
| Year Ended October 31 | 2011 | 2010 |
| Class B Shares: | Shares | Amount | Shares | Amount |
| Shares sold | 3,793,204 | $19,214,651 | 4,936,393 | $22,093,225 |
| Shares issued to shareholders in payment of distributions declared | 44,017 | 227,570 | — | — |
| Shares redeemed | (34,331,522) | (172,846,233) | (50,285,191) | (223,072,532) |
NET CHANGE RESULTING FROM
CLASS B SHARE TRANSACTIONS | (30,494,301) | $(153,404,012) | (45,348,798) | $(200,979,307) |
| Year Ended October 31 | 2011 | 2010 |
| Class C Shares: | Shares | Amount | Shares | Amount |
| Shares sold | 9,418,288 | $47,966,563 | 13,712,395 | $61,221,439 |
| Shares issued to shareholders in payment of distributions declared | 122,226 | 631,908 | — | — |
| Shares redeemed | (39,974,916) | (201,008,903) | (40,828,794) | (182,157,622) |
NET CHANGE RESULTING FROM
CLASS C SHARE TRANSACTIONS | (30,434,402) | $(152,410,432) | (27,116,399) | $(120,936,183) |
| Year Ended October 31 | 2011 | 2010 |
| Class R Shares: | Shares | Amount | Shares | Amount |
| Shares sold | 33,245,133 | $179,977,076 | 34,634,870 | $164,263,116 |
| Shares issued to shareholders in payment of distributions declared | 4,030,627 | 22,047,532 | 1,293,247 | 6,065,577 |
| Shares redeemed | (115,185,739) | (621,410,281) | (98,552,433) | (467,540,468) |
NET CHANGE RESULTING FROM
CLASS R SHARE TRANSACTIONS | (77,909,979) | $(419,385,673) | (62,624,316) | $(297,211,775) |
NET CHANGE RESULTING FROM
TOTAL FUND SHARE TRANSACTIONS | (201,358,104) | $(1,065,304,719) | (176,175,870) | $(814,769,310) |
Redemption Fee
The Fund's Class R Shares impose a redemption fee of 0.20% on the redemption price of the Fund's Class R Shares redeemed, if such shares were purchased after February 1, 1985. The redemption fee is applied to the Fund's Class R Shares expenses for providing redemption services, including, but not limited to: transfer agent fees; postage; printing; telephone; and related employment costs. Any excess fee proceeds are added to the Fund's assets. Shares acquired through employer-sponsored retirement plans will not be subject to the redemption fee. However, if shares are purchased for a retirement plan account through a broker, financial institution or other intermediary maintaining an omnibus account for the shares, the waiver may not apply. In addition, this waiver does not apply to individual retirement accounts, such as Traditional, Roth and SEP-IRAs. For the years ended October 31, 2011 and October 31, 2010, redemption fees of $39,177 and $55,592, were imposed to cover the cost of redemptions.
Annual Shareholder Report
31
4. FEDERAL TAX INFORMATIONThe timing and character of income and capital gain distributions are determined in accordance with income tax regulations, which may differ from GAAP. These differences are due to differing treatments for foreign currency transactions, passive foreign investment company gains and losses, partnership adjustments, reclassification for regulatory settlement proceeds, discount accretion/premium amortization on debt securities and net operating losses.
For the year ended October 31, 2011, permanent differences identified and reclassified among the components of net assets were as follows:
| Increase (Decrease) |
| Paid-In Capital | Undistributed
Net Investment
Income (Loss) | Accumulated
Net Realized
Gain (Loss) |
| $(71,386,316) | $102,397,487 | $(31,011,171) |
Net investment income (loss), net realized gains (losses) and net assets were not affected by this reclassification.
The tax character of distributions as reported on the Statement of Changes in Net Assets for the years ended October 31, 2011 and 2010, was as follows:
| 2011 | 2010 |
| Ordinary income | $39,454,350 | $10,590,134 |
| Long-term capital gains | $48,627 | $ — |
As of October 31, 2011, the components of distributable earnings on a tax basis were as follows:
| Undistributed capital gains | $109,954,043 |
| Net unrealized appreciation | $1,049,382,538 |
The difference between book-basis and tax-basis net unrealized appreciation/depreciation is attributable to differing treatments for the deferral of losses on wash sales and partnership adjustments.
At October 31, 2011, the cost of investments for federal tax purposes was $5,219,872,701. The net unrealized appreciation of investments for federal tax purposes excluding any unrealized appreciation/depreciation resulting from changes in foreign currency exchange rates and outstanding foreign currency commitments was $1,050,819,167. This consists of net unrealized appreciation from investments for those securities having an excess of value over cost of $1,299,595,863 and net unrealized depreciation from investments for those securities having an excess of cost over value of $248,776,696.
The Fund used capital loss carryforwards of $704,260,190 to offset taxable capital gains realized during the year ended October 31, 2011.
Annual Shareholder Report
32
5. INVESTMENT ADVISER FEE AND OTHER TRANSACTIONS WITH AFFILIATESInvestment Adviser Fee
Federated Equity Management Company of Pennsylvania is the Fund's investment adviser (the “Adviser”). The advisory agreement between the Fund and the Adviser provides for an annual fee equal to 1.425% of the Fund's average daily net assets. Pursuant to the settlement of certain litigation the Adviser has agreed, for a period continuing until June 30, 2022, to waive its investment advisory fee so that such fee will not exceed 1.275%. Also as part of the settlement agreement, effective July 1, 2012 and continuing until June 30, 2022, the Adviser has agreed to further waive the advisory fee by an additional 0.02%, 0.04%, 0.06% or 0.07% if the Fund's net assets exceed eight, nine, ten or twelve billion dollars, respectively. Subject to the terms described in the Expense Limitation note, the Adviser may voluntarily choose to waive any portion of its fee. For the year ended October 31, 2011, the Adviser voluntarily waived $9,866,985 of its fee.
Certain of the Fund's assets are managed by Federated Global Investment Management Corp. (the “Sub-Adviser”). Under the terms of a sub-advisory agreement between the Adviser and the Sub-Adviser, the Sub-Adviser receives an allocable portion of the Fund's adviser fee. The fee is paid by the Adviser out of its resources and is not an incremental Fund expense. For the year ended October 31, 2011, the Sub-Adviser earned a fee of $80,592,103.
Administrative Fee
Federated Administrative Services (FAS), under the Administrative Services Agreement, provides the Fund with administrative personnel and services. The fee paid to FAS is based on the average aggregate daily net assets of certain Federated funds as specified below:
| Administrative Fee | Average Aggregate Daily Net Assets
of the Federated Funds |
| 0.150% | on the first $5 billion |
| 0.125% | on the next $5 billion |
| 0.100% | on the next $10 billion |
| 0.075% | on assets in excess of $20 billion |
The administrative fee received during any fiscal year shall be at least $150,000 per portfolio and $40,000 per each additional class of Shares. Subject to the terms described in the Expense Limitation note, FAS may voluntarily choose to waive any portion of its fee. For the year ended October 31, 2011, the net fee paid to FAS was 0.076% of average daily net assets of the Fund. FAS waived $138,398 of its fee.
Annual Shareholder Report
33
Distribution Services Fee
The Fund has adopted a Distribution Plan (the “Plan”) pursuant to Rule 12b-1 under the Act. Under the terms of the Plan, the Fund will compensate Federated Securities Corp. (FSC), the principal distributor, from the daily net assets of the Fund's Class A Shares, Class B Shares, Class C Shares and Class R Shares to finance activities intended to result in the sale of these shares. The Plan provides that the Fund may incur distribution expenses at the following percentages of average daily net assets annually, to compensate FSC:
| Share Class Name | Percentage of Average Daily
Net Assets of Class |
| Class A Shares | 0.25% |
| Class B Shares | 0.75% |
| Class C Shares | 0.75% |
| Class R Shares | 0.50% |
Subject to the terms described in the Expense Limitation note, FSC may voluntarily choose to waive any portion of its fee. For the year ended October 31, 2011, distribution services fees for the Fund were as follows:
| Distribution Services
Fees Incurred | Distribution Services
Fees Waived |
| Class A Shares | $5,854,477 | $(3,005,236) |
| Class B Shares | 3,035,838 | — |
| Class C Shares | 4,665,100 | (483,536) |
| Class R Shares | 17,451,600 | (13,444,462) |
| TOTAL | $31,007,015 | $(16,933,234) |
When FSC receives fees, it may pay some or all of them to financial intermediaries whose customers purchase shares. For the year ended October 31, 2011, FSC retained $5,270,581 of fees paid by the Fund.
Sales Charges
Front-end sales charges and contingent deferred sales charges (CDSC) do not represent expenses of the Fund. They are deducted from the proceeds of sales of Fund shares prior to investment or from redemption proceeds prior to remittance, as applicable. For the year ended October 31, 2011, FSC retained $139,419 in sales charges from the sale of Class A Shares. FSC also retained $2,550 of CDSC relating to redemptions of Class A Shares, $64,397 relating to redemption of Class B Shares and $6,470 relating to redemptions of Class C Shares.
Annual Shareholder Report
34
Shareholder Services Fee
The Fund may pay fees (“Service Fees”) up to 0.25% of the average daily net assets of the Fund's Class A Shares, Class B Shares, Class C Shares and Class R Shares to financial intermediaries or to Federated Shareholder Services Company (FSSC) for providing services to shareholders and maintaining shareholder accounts. Financial intermediaries may include a company affiliated with management of Federated Investors, Inc. A financial intermediary affiliated with management of Federated Investors, Inc. received $17,617 of Service Fees for the year ended October 31, 2011. Subject to the terms described in the Expense Limitation note, FSSC may voluntarily reimburse the Fund for Service Fees. For the year ended October 31, 2011, Service Fees for the Fund were as follows:
| Service
Fees
Incurred | Service
Fees
Reimbursed |
| Class A Shares | $5,782,608 | $ — |
| Class B Shares | 1,011,946 | (322,861) |
| Class C Shares | 1,538,590 | — |
| Class R Shares | 8,689,213 | — |
| TOTAL | $17,022,357 | $(322,861) |
For the year ended October 31, 2011, FSSC received $5,001,577 of fees paid by the Fund.
Commitments and Contingencies
In the course of pursuing its investment objective, the Fund sometimes invests in limited partnerships and limited liability companies. These entities often require the Fund to commit to a total dollar amount to be invested. The actual investments are usually made in installments over a period of time. At October 31, 2011, the Fund had total commitments to limited partnerships and limited liability companies of $35,173,400; of this amount, $34,044,996 was actually invested by the Fund leaving the Fund contingently liable for additional investments of $1,128,404.
Expense Limitation
The Adviser and its affiliates (which may include FSC, FAS and FSSC) have voluntarily agreed to waive their fees and/or reimburse expenses so that the total annual fund operating expenses (as shown in the financial highlights, excluding dividends and other expenses related to short sales) paid by the Fund's Class A Shares, Class B Shares, Class C Shares and Class R Shares (after the voluntary waivers and/or reimbursements) will not exceed 1.95%, 2.50%, 2.50% and 1.95% (the “Fee Limit”), respectively, up to but not including the later of (the “Termination Date”): (a) January 1, 2013; or (b) the date of the Fund's next effective Prospectus. While the Adviser and its affiliates currently do not anticipate terminating or increasing these arrangements prior to the Termination Date, these arrangements may only be terminated or the Fee Limit increased prior to the Termination Date with the agreement of the Trustees.
Interfund Transactions
During the year ended October 31, 2011, the Fund engaged in purchase and sale transactions with funds that have a common investment adviser (or affiliated investment advisers), common Directors/Trustees and/or common Officers. These purchase and sale transactions complied with Rule 17a-7 under the Act and amounted to $3,708,509 and $28,367,096, respectively.
Annual Shareholder Report
35
GeneralCertain Officers and Trustees of the Fund are Officers and Directors or Trustees of the above companies.
Transactions Involving Affiliated Companies and Affiliated Holdings
An affiliated company is a company in which the Fund has ownership of at least 5% of the voting shares. Transactions with affiliated companies during the year ended October 31, 2011, were as follows:
| Affiliates | Balance of
Shares Held
10/31/2010 | Purchases/
Additions | Sales/
Reductions | Balance of
Shares Held
10/31/2011 | Value | Dividend/
Interest
Income |
| Alkermes, Inc. | 9,722,273 | 5,818,897 | 9,722,273 | 5,818,897 | $101,772,509 | $ — |
| *Auxilium Pharmaceuticals, Inc. | 3,093,592 | — | 3,093,592 | — | — | — |
| *Brasil Brokers Participacoes | 9,858,127 | — | 9,858,127 | — | — | 514,048 |
| *Cbeyond Communications, Inc. | 1,771,638 | — | 1,771,638 | — | — | — |
| CETIP SA | 22,772,799 | 2,381,201 | 3,514,000 | 21,640,000 | 298,726,155 | 2,392,688 |
| *Conceptus, Inc. | 3,634,700 | — | 3,634,700 | — | — | — |
| Conceptus, Inc. | 625,000 | — | — | 625,000 | 7,200,000 | — |
| Conceptus, Inc. | 714,286 | — | — | 714,286 | 8,228,575 | — |
| Conceptus, Inc. | 600,000 | — | 213,826 | 386,174 | 4,448,724 | — |
| Cubist Pharmaceuticals, Inc. | 7,008,000 | — | 2,758,000 | 4,250,000 | 160,692,500 | — |
| Dexcom, Inc. | 4,916,800 | — | 1,199,176 | 3,717,624 | 36,395,539 | — |
| Dexcom, Inc. | 126,065 | — | — | 126,065 | 1,234,176 | — |
| Dyax Corp. | 12,850,000 | 2,350,000 | — | 15,200,000 | 20,520,000 | — |
| *Endologix, Inc. | 5,198,050 | — | 5,198,050 | — | — | — |
| *Endologix, Inc. | 3,555,556 | — | 3,555,556 | — | — | — |
| ExamWorks Group Inc. | 2,227,383 | 772,617 | — | 3,000,000 | 31,650,000 | — |
| Insulet Corp. | 2,672,070 | 144,100 | 981,299 | 1,834,871 | 29,945,095 | — |
| Insulet Corp., Conv. Bond, 5.375, 6/15/2013 | 27,670,000 | — | 15,000,000 | 12,670,000 | 13,892,909 | 1,214,033 |
| Insulet Corp., Conv. Bond, 3.75, 6/15/2016 | — | 14,630,000 | — | 14,630,000 | 13,803,829 | 185,923 |
| Progenics Pharmaceuticals, Inc. | 5,246,193 | — | — | 5,246,193 | 34,467,488 | — |
| Protalix Biotherapeutics, Inc. | 3,000,000 | 2,400,000 | — | 5,400,000 | 32,994,000 | — |
| Repligen Corp. | 2,998,043 | — | — | 2,998,043 | 10,283,287 | — |
| Restoque Comercio e Confeccoes de Roupas SA | 11,570,138 | — | 7,872,103 | 3,698,035 | 58,157,058 | 2,085,571 |
Annual Shareholder Report36
| Affiliates | Balance of
Shares Held
10/31/2010 | Purchases/
Additions | Sales/
Reductions | Balance of
Shares Held
10/31/2011 | Value | Dividend/
Interest
Income |
| Sensable Technologies, Inc. | 3,751,199 | — | — | 3,751,199 | — | — |
| Soteira, Inc. | 274 | — | — | 274 | — | — |
| Soteira, Inc. Pfd. | 958,744 | — | — | 958,744 | — | — |
| TNS, Inc. | 2,964,645 | — | — | 2,964,645 | 57,899,517 | — |
| Vical, Inc. | 9,330,475 | — | 2,281,975 | 7,048,500 | 21,075,015 | — |
TOTAL OF AFFILIATED
COMPANIES | 158,836,050 | 28,496,815 | 70,654,315 | 116,678,550 | $943,386,376 | $6,392,263 |
* At October 31, 2011, the Fund no longer has ownership of at least 5% of the voting shares.
Affiliated holdings are mutual funds which are managed by the Adviser or an affiliate of the Adviser. The Adviser has agreed to reimburse the Fund for certain investment adviser fees as a result of transactions in other affiliated mutual funds. For the year ended October 31, 2011, the Adviser reimbursed $421,369. Transactions involving the affiliated holding during the year ended October 31, 2011, were as follows:
| Federated
Prime Value
Obligations Fund,
Institutional Shares |
| Balance of Shares Held 10/31/2010 | 119,963,791 |
| Purchases/Additions | 4,252,483,876 |
| Sales/Reductions | 3,860,536,348 |
| Balance of Shares Held 10/31/2011 | 511,911,319 |
| Value | $511,911,319 |
| Dividend Income | $117,962 |
6. EXPENSE Reduction
The Fund directs portfolio trades to a broker that in turn pays a portion of the Fund's operating expenses. For the year ended October 31, 2011, the Fund's expenses were reduced by $65,729 under these arrangements.
7. Investment TRANSACTIONS
Purchases and sales of investments, excluding long-term U.S. government securities and short-term obligations, for the year ended October 31, 2011, were as follows:
| Purchases | $4,335,569,440 |
| Sales | $5,498,771,674 |
8. CONCENTRATION OF RISK
The Fund invests in securities of non-U.S. issuers. Political or economic developments may have an effect on the liquidity and volatility of portfolio securities and currency holdings.
Annual Shareholder Report
37
At October 31, 2011, the diversification of countries was as follows:| Country | Percentage of
Net Assets |
| United States | 66.1% |
| Brazil | 9.0% |
| Ireland | 3.6% |
| India | 2.7% |
| Italy | 2.3% |
| Spain | 2.3% |
| Luxembourg | 2.2% |
| Netherlands | 1.4% |
| Chile | 1.3% |
| Cayman Islands | 1.2% |
| Israel | 1.1% |
| Germany | 0.9% |
| Singapore | 0.9% |
| Colombia | 0.6% |
| Hong Kong | 0.5% |
| Isle of Man | 0.5% |
| Bermuda | 0.4% |
| China | 0.4% |
| Indonesia | 0.4% |
| United Kingdom | 0.4% |
| British Virgin Islands | 0.3% |
| Canada | 0.3% |
| Switzerland | 0.3% |
| Mexico | 0.2% |
9. LINE OF CREDIT
The Fund participates in a $100,000,000 unsecured, uncommitted revolving line of credit (LOC) agreement with PNC Bank. The LOC was made available for extraordinary or emergency purposes, primarily for financing redemption payments. Borrowings are charged interest at a rate offered to the Fund by PNC Bank at the time of the borrowing. As of October 31, 2011, there were no outstanding loans. During the year ended October 31, 2011, the Fund did not utilize the LOC.
10. INTERFUND LENDING
Pursuant to an Exemptive Order issued by the Securities and Exchange Commission, the Fund, along with other funds advised by subsidiaries of Federated Investors, Inc., may participate in an interfund lending program. This program provides an alternative credit facility allowing the Fund to borrow from other participating affiliated funds. As of October 31, 2011, there were no outstanding loans. During the year ended October 31, 2011, the program was not utilized.
Annual Shareholder Report
38
11. Legal ProceedingsSince February 2004, Federated Investors, Inc. and related entities (collectively, “Federated”), had been named as defendants in several lawsuits in the United States District Court for the Western District of Pennsylvania. These lawsuits have been consolidated into a single action alleging excessive advisory fees involving the Fund. Without admitting the validity of any claim, in April 2011, Federated reached a final settlement to resolve this lawsuit resulting in no material adverse effect on Federated or the Fund.
12. RECENT ACCOUNTING PRONOUNCEMENTS
In April 2011, the Financial Accounting Standards Board (FASB) released Accounting Standards Update (ASU) No. 2011-03, “Reconsideration of Effective Control for Repurchase Agreements.” This ASU amends FASB Accounting Standards Codification (ASC) Topic 860, “Transfers and Servicing”; specifically the criteria required to determine whether a repurchase agreement and similar agreements should be accounted for as sales of financial assets or secured borrowings with commitments. This ASU is effective for fiscal years and interim periods beginning after December 15, 2011. At this time, management is evaluating the implications of adopting ASU No. 2011-03 and its impact on the Fund's financial statements and the accompanying notes, net assets and results of operations.
In addition, in May 2011, FASB released ASU No. 2011-04, “Amendments to Achieve Common Fair Value Measurement and Disclosure Requirements in U.S. GAAP and IFRSs.” This ASU amends FASB ASC Topic 820, “Fair Value Measurement,” to establish common requirements for measuring fair value and for disclosing information about fair value measurements in accordance with GAAP. This ASU is effective for fiscal years and interim periods beginning after December 15, 2011. At this time, management is evaluating the implications of adopting ASU No. 2011-04 and its impact on the Fund's financial statements and the accompanying notes.
13. FEDERAL TAX INFORMATION (UNAUDITED)
For the year ended October 31, 2011, the amount of long-term capital gains designated by the Fund was $48,627.
For the fiscal year ended October 31, 2011, 100% of total ordinary income distributions made by the Fund are qualifying dividends which may be subject to a maximum tax rate of 15%, as provided for by the Jobs and Growth Tax Relief Act of 2003. Complete information is reported in conjunction with the reporting of your distributions on Form 1099-DIV.
Of the ordinary income distributions made by the Fund during the year ended October 31, 2011, 97.0% qualify for the dividend received deduction available to corporate shareholders.
Annual Shareholder Report39
Report of Independent Registered Public Accounting Firm
TO THE BOARD OF Trustees OF Federated Equity Funds AND SHAREHOLDERS OF Federated Kaufmann Fund, CLASS A, CLASS B AND CLASS C SHARES:
We have audited the accompanying statement of assets and liabilities of Federated Kaufmann Fund (the “Fund”) (one of the portfolios constituting Federated Equity Funds), including the portfolio of investments, as of October 31, 2011, and the related statement of operations for the year then ended, the statement of changes in net assets for each of the two years in the period then ended, and the financial highlights of the Class A Shares, Class B Shares and Class C Shares for each of the five years in the period then ended. These financial statements and financial highlights are the responsibility of the Fund's management. Our responsibility is to express an opinion on these financial statements and financial highlights based on our audits.
We conducted our audits in accordance with standards of the Public Company Accounting Oversight Board (United States). Those standards require that we plan and perform the audit to obtain reasonable assurance about whether the financial statements and financial highlights are free of material misstatement. We were not engaged to perform an audit of the Fund's internal control over financial reporting. Our audits included consideration of internal control over financial reporting as a basis for designing audit procedures that are appropriate in the circumstances, but not for the purpose of expressing an opinion on the effectiveness of the Fund's internal control over financial reporting. Accordingly, we express no such opinion. An audit also includes examining, on a test basis, evidence supporting the amounts and disclosures in the financial statements and financial highlights, assessing the accounting principles used and significant estimates made by management, and evaluating the overall financial statement presentation. Our procedures included confirmation of securities owned as of October 31, 2011, by correspondence with the custodian and others or by other appropriate auditing procedures where replies from others were not received. We believe that our audits provide a reasonable basis for our opinion.
In our opinion, the financial statements and financial highlights referred to above present fairly, in all material respects, the financial position of Federated Kaufmann Fund, a portfolio of Federated Equity Funds, at October 31, 2011, the results of its operations for the year then ended, the changes in its net assets for each of the two years in the period then ended, and the financial highlights of the Class A Shares, Class B Shares and Class C Shares for each of the five years in the period then ended, in conformity with U.S. generally accepted accounting principles.
Boston, Massachusetts
December 23, 2011
Annual Shareholder Report40
Shareholder Expense Example (unaudited)
As a shareholder of the Fund, you incur two types of costs: (1) transaction costs, including sales charges (loads) on purchase or redemption payments; and (2) ongoing costs, including management fees and to the extent applicable, distribution (12b-1) fees and/or shareholder services fees and other Fund expenses. This Example is intended to help you to understand your ongoing costs (in dollars) of investing in the Fund and to compare these costs with the ongoing costs of investing in other mutual funds. It is based on an investment of $1,000 invested at the beginning of the period and held for the entire period from May 1, 2011 to October 31, 2011.
ACTUAL EXPENSES
The first section of the table below provides information about actual account values and actual expenses. You may use the information in this section, together with the amount you invested, to estimate the expenses that you incurred over the period. Simply divide your account value by $1,000 (for example, an $8,600 account value divided by $1,000 = 8.6), then multiply the result by the number in the first section under the heading entitled “Expenses Paid During Period” to estimate the expenses attributable to your investment during this period.
HYPOTHETICAL EXAMPLE FOR COMPARISON PURPOSES
The second section of the table below provides information about hypothetical account values and hypothetical expenses based on the Fund's actual expense ratio and an assumed rate of return of 5% per year before expenses, which is not the Fund's actual return. Thus, you should not use the hypothetical account values and expenses to estimate the actual ending account balance or your expenses for the period. Rather, these figures are required to be provided to enable you to compare the ongoing costs of investing in the Fund with other funds. To do so, compare this 5% hypothetical example with the 5% hypothetical examples that appear in the shareholder reports of the other funds.
Annual Shareholder Report
41
Please note that the expenses shown in the table are meant to highlight your ongoing costs only and do not reflect any transaction costs, such as sales charges (loads) on purchase or redemption payments. Therefore, the second section of the table is useful in comparing ongoing costs only, and will not help you determine the relative total costs of owning different funds. In addition, if these transaction costs were included, your costs would have been higher. | Beginning
Account Value
5/1/2011 | Ending
Account Value
10/31/2011 | Expenses Paid
During Period1 |
| Actual: | | | |
| Class A Shares | $1,000 | $835.30 | $9.02 |
| Class B Shares | $1,000 | $834.50 | $11.56 |
| Class C Shares | $1,000 | $834.50 | $11.56 |
Hypothetical (assuming a 5% return
before expenses): | | | |
| Class A Shares | $1,000 | $1,015.38 | $9.91 |
| Class B Shares | $1,000 | $1,012.60 | $12.68 |
| Class C Shares | $1,000 | $1,012.60 | $12.68 |
| 1 | Expenses are equal to the Fund's annualized net expense ratios, multiplied by the average account value over the period, multiplied by 184/365 (to reflect the one-half-year period). The annualized net expense ratios are as follows: |
| Class A Shares | 1.95% |
| Class B Shares | 2.50% |
| Class C Shares | 2.50% |
Annual Shareholder Report42
Board of Trustees and Trust Officers
The Board of Trustees is responsible for managing the Trust business affairs and for exercising all the Trust powers except those reserved for the shareholders. The following tables give information about each Trustee and the senior officers of the Fund. Where required, the tables separately list Trustees who are “interested persons” of the Fund (i.e., “Interested” Trustees) and those who are not (i.e., “Independent” Trustees). Unless otherwise noted, the address of each person listed is Federated Investors Tower, 1001 Liberty Avenue, Pittsburgh, PA 15222. The address of all Independent Trustees listed is 4000 Ericsson Drive, Warrendale, PA 15086-7561; Attention: Mutual Fund Board. As of December 31, 2010, the Trust comprised 13 portfolio(s), and the Federated Fund Family consisted of 43 investment companies (comprising 136 portfolios). Unless otherwise noted, each Officer is elected annually. Unless otherwise noted, each Trustee oversees all portfolios in the Federated Fund Family and serves for an indefinite term. The Fund's Statement of Additional Information includes additional information about Trust Trustees and is available, without charge and upon request, by calling 1-800-341-7400.
Interested TRUSTEES Background
Name
Birth Date
Positions Held with Trust
Date Service Began | Principal Occupation(s) for Past Five Years,
Other Directorships Held and Previous Position(s) |
John F. Donahue*
Birth Date: July 28, 1924
Trustee
Began serving: April 1984 | Principal Occupations: Director or Trustee of the Federated Fund Family; Chairman and Director, Federated Investors, Inc.; Chairman of the Federated Fund Family's Executive Committee.
Previous Positions: Chairman of the Federated Fund Family; Trustee, Federated Investment Management Company; Chairman and Director, Federated Investment Counseling. |
J. Christopher Donahue*
Birth Date: April 11, 1949
President and Trustee
Began serving: January 2000 | Principal Occupations: Principal Executive Officer and President of the Federated Fund Family; Director or Trustee of some of the Funds in the Federated Fund Family; President, Chief Executive Officer and Director, Federated Investors, Inc.; Chairman and Trustee, Federated Investment Management Company; Trustee, Federated Investment Counseling; Chairman and Director, Federated Global Investment Management Corp.; Chairman, Federated Equity Management Company of Pennsylvania and Passport Research, Ltd. (investment advisory subsidiary of Federated); Trustee, Federated Shareholder Services Company; Director, Federated Services Company.
Previous Positions: President, Federated Investment Counseling; President and Chief Executive Officer, Federated Investment Management Company, Federated Global Investment Management Corp. and Passport Research, Ltd. |
| * | Family relationships and reasons for “interested” status: John F. Donahue is the father of J. Christopher Donahue; both are “interested” due to their beneficial ownership of shares of Federated Investors, Inc. and the positions they hold with Federated and its subsidiaries. |
Annual Shareholder Report43
INDEPENDENT TRUSTEES Background
Name
Birth Date
Positions Held with Trust
Date Service Began | Principal Occupation(s) for Past Five Years,
Other Directorships Held, Previous Position(s) and Qualifications |
Nicholas P. Constantakis, CPA
Birth Date: September 3, 1939
Trustee
Began serving: February 1998 | Principal Occupation: Director or Trustee of the Federated Fund Family.
Other Directorship Held: Director and Chairman of the Audit Committee, Michael Baker Corporation (architecture, engineering and construction services).
Previous Position: Partner, Andersen Worldwide SC.
Qualifications: Public accounting and director experience. |
John F. Cunningham
Birth Date: March 5, 1943
Trustee
Began serving: January 1999 | Principal Occupation: Director or Trustee of the Federated Fund Family.
Other Directorships Held: Chairman, President and Chief Executive Officer, Cunningham & Co., Inc. (strategic business consulting); Trustee Associate, Boston College.
Previous Positions: Director, Redgate Communications and EMC Corporation (computer storage systems); Chairman of the Board and Chief Executive Officer, Computer Consoles, Inc.; President and Chief Operating Officer, Wang Laboratories; Director, First National Bank of Boston; Director, Apollo Computer, Inc.
Qualifications: Business management and director experience. |
Maureen Lally-Green
Birth Date: July 5, 1949
Trustee
Began serving: August 2009 | Principal Occupations: Director or Trustee of the Federated Fund Family; Director, Office of Church Relations, Diocese of Pittsburgh; Adjunct Professor of Law, Duquesne University School of Law.
Other Directorships Held: Director, Auberle; Trustee, St. Francis University; Director, Ireland Institute of Pittsburgh; Director, UPMC Mercy Hospital; Regent, St. Vincent Seminary; Director, Epilepsy Foundation of Western and Central Pennsylvania; Director, Saint Thomas More Society, Allegheny County.
Previous Position: Pennsylvania Superior Court Judge.
Qualifications: Legal and director experience. |
Peter E. Madden
Birth Date: March 16, 1942
Trustee
Began serving: November 1991 | Principal Occupation: Director or Trustee, and Chairman of the Board of Directors or Trustees, of the Federated Fund Family.
Previous Positions: Representative, Commonwealth of Massachusetts General Court; President, Chief Operating Officer and Director, State Street Bank and Trust Company and State Street Corporation (retired); Director, VISA USA and VISA International; Chairman and Director, Massachusetts Bankers Association; Director, Depository Trust Corporation; Director, The Boston Stock Exchange.
Qualifications: Business management, mutual fund services and director experience. |
Annual Shareholder Report44
Name
Birth Date
Positions Held with Trust
Date Service Began | Principal Occupation(s) for Past Five Years,
Other Directorships Held, Previous Position(s) and Qualifications |
Charles F. Mansfield, Jr.
Birth Date: April 10, 1945
Trustee
Began serving: January 1999 | Principal Occupations: Director or Trustee and Chairman of the Audit Committee of the Federated Fund Family; Management Consultant.
Previous Positions: Chief Executive Officer, PBTC International Bank; Partner, Arthur Young & Company (now Ernst & Young LLP); Chief Financial Officer of Retail Banking Sector, Chase Manhattan Bank; Senior Vice President, HSBC Bank USA (formerly Marine Midland Bank); Vice President, Citibank; Assistant Professor of Banking and Finance, Frank G. Zarb School of Business, Hofstra University; Executive Vice President, DVC Group, Inc. (marketing, communications and technology).
Qualifications: Banking, business management, education and director experience. |
R. James Nicholson
Birth Date: February 4, 1938
Trustee
Began serving: January 2008 | Principal Occupations: Director or Trustee of the Federated Fund Family; Senior Counsel, Brownstein Hyatt Farber Schrek, P.C.; Former Secretary of the U.S. Dept. of Veterans Affairs; Former U.S. Ambassador to the Holy See; Former Chairman of the Republican National Committee.
Other Directorships Held: Director, Horatio Alger Association; Director, The Daniels Fund, both charitable nonprofit organizations.
Previous Positions: Colonel, U.S. Army Reserve; Partner, Calkins, Kramer, Grimshaw and Harring, P.C.; General Counsel, Colorado Association of Housing and Building; Chairman and CEO, Nicholson Enterprises, Inc. (real estate holding company); Chairman and CEO, Renaissance Homes of Colorado.
Qualifications: Legal, government, business management and director experience. |
Thomas M. O'Neill
Birth Date: June 14, 1951
Trustee
Began serving: October 2006 | Principal Occupations: Director or Trustee of the Federated Fund Family; Sole Proprietor, Navigator Management Company (investment and strategic consulting).
Other Directorships Held: Board of Overseers, Children's Hospital of Boston; Visiting Committee on Athletics, Harvard College; Board of Directors, Medicines for Humanity.
Previous Positions: Chief Executive Officer and President, Managing Director and Chief Investment Officer, Fleet Investment Advisors; President and Chief Executive Officer, Aeltus Investment Management, Inc.; General Partner, Hellman, Jordan Management Co., Boston, MA; Chief Investment Officer, The Putnam Companies, Boston, MA; Credit Analyst and Lending Officer, Fleet Bank; Director and Consultant, EZE Castle Software (investment order management software); Director, Midway Pacific (lumber).
Qualifications: Business management, mutual fund, director and investment experience. |
Annual Shareholder Report45
Name
Birth Date
Positions Held with Trust
Date Service Began | Principal Occupation(s) for Past Five Years,
Other Directorships Held, Previous Position(s) and Qualifications |
John S. Walsh
Birth Date: November 28, 1957
Trustee
Began serving: January 1999 | Principal Occupations: Director or Trustee of the Federated Fund Family; President and Director, Heat Wagon, Inc. (manufacturer of construction temporary heaters); President and Director, Manufacturers Products, Inc. (distributor of portable construction heaters); President, Portable Heater Parts, a division of Manufacturers Products, Inc.
Previous Position: Vice President, Walsh & Kelly, Inc.
Qualifications: Business management and director experience. |
James F. Will
Birth Date: October 12, 1938
Trustee
Began serving: April 2006 | Principal Occupations: Director or Trustee of the Federated Fund Family; formerly, Vice Chancellor and President, Saint Vincent College.
Other Directorships Held: Trustee, Saint Vincent College; Director, Alleghany Corporation; Trustee, Wheeling Jesuit University; Director, Liberty Tire Recycling.
Previous Positions: Chairman, President and Chief Executive Officer, Armco, Inc.; President and Chief Executive Officer, Cyclops Industries; President and Chief Operating Officer, Kaiser Steel Corporation.
Qualifications: Business management, education and director experience. |
OFFICERS
Name
Birth Date
Address
Positions Held with Trust
Date Service Began | Principal Occupation(s) for Past Five Years
and Previous Position(s) |
John W. McGonigle
Birth Date: October 26, 1938
EXECUTIVE VICE PRESIDENT AND SECRETARY
Began serving: April 1984 | Principal Occupations: Executive Vice President and Secretary of the Federated Fund Family; Vice Chairman, Executive Vice President, Secretary and Director, Federated Investors, Inc.
Previous Positions: Trustee, Federated Investment Management Company and Federated Investment Counseling; Director, Federated Global Investment Management Corp., Federated Services Company and Federated Securities Corp. |
Richard A. Novak
Birth Date: December 25, 1963
Treasurer
Began serving: January 2006 | Principal Occupations: Principal Financial Officer and Treasurer of the Federated Fund Family; Senior Vice President, Federated Administrative Services; Financial and Operations Principal for Federated Securities Corp., Edgewood Services, Inc. and Southpointe Distribution Services, Inc.
Previous Positions: Controller of Federated Investors, Inc.; Vice President, Finance of Federated Services Company; held various financial management positions within The Mercy Hospital of Pittsburgh; Auditor, Arthur Andersen & Co. |
Annual Shareholder Report46
Name
Birth Date
Address
Positions Held with Trust
Date Service Began | Principal Occupation(s) for Past Five Years
and Previous Position(s) |
Richard B. Fisher
Birth Date: May 17, 1923
Vice President
Began serving: April 1984 | Principal Occupations: Vice Chairman or Vice President of some of the Funds in the Federated Fund Family; Vice Chairman, Federated Investors, Inc.; Chairman, Federated Securities Corp.
Previous Positions: President and Director or Trustee of some of the Funds in the Federated Fund Family; Executive Vice President, Federated Investors, Inc.; Director and Chief Executive Officer, Federated Securities Corp. |
Brian P. Bouda
Birth Date: February 28, 1947
CHIEF COMPLIANCE OFFICER AND SENIOR VICE PRESIDENT
Began serving: August 2004 | Principal Occupations: Senior Vice President and Chief Compliance Officer of the Federated Fund Family; Vice President and Chief Compliance Officer of Federated Investors, Inc. and Chief Compliance Officer of its subsidiaries. Mr. Bouda joined Federated in 1999 and is a member of the American Bar Association and the State Bar Association of Wisconsin. |
Stephen F. Auth
Birth Date: September 3, 1956
450 Lexington Avenue
Suite 3700
New York, NY 10017-3943
CHIEF INVESTMENT OFFICER
Began serving: November 2002 | Principal Occupations: Mr. Auth is Chief Investment Officer of this Fund and various other Funds in the Federated Fund Family; Executive Vice President, Federated Investment Counseling, Federated Global Investment Management Corp. and Federated Equity Management Company of Pennsylvania.
Previous Positions: Executive Vice President, Federated Investment Management Company, and Passport Research, Ltd. (investment advisory subsidiary of Federated); Senior Vice President, Global Portfolio Management Services Division; Senior Vice President, Federated Investment Management Company and Passport Research, Ltd.; Senior Managing Director and Portfolio Manager, Prudential Investments. |
Lawrence Auriana
Birth Date: January 8, 1944
140 East 45th Street
New York, NY 10017
VICE PRESIDENT
Began serving: November 2001 | Principal Occupations: Lawrence Auriana has been the Fund's Portfolio Manager since February 1986. He is Vice President of the Trust. Mr. Auriana joined Federated in April 2001 as Co-Head of Investments/Federated Kaufmann. From August 1984 to April 2001, Mr. Auriana was President and Treasurer of Edgemont Asset Management Corp., and Chairman of the Board and Portfolio Manager to The Kaufmann Fund, Inc. (predecessor to the Federated Kaufmann Fund). Mr. Auriana earned a B.S. in economics from Fordham University and has been engaged in the securities business since 1965. |
Hans P. Utsch
Birth Date: July 3, 1936
VICE PRESIDENT
Began serving: November 2001 | Principal Occupations: Hans P. Utsch has been the Fund's Portfolio Manager since February 1986. He is Vice President of the Trust. Mr. Utsch joined Federated in April 2001 as Co-Head of Investments/Federated Kaufmann. From August 1984 to April 2001, Mr. Utsch was Chairman of the Board and Secretary of Edgemont Asset Management Corp., and President and Portfolio Manager to The Kaufmann Fund, Inc. (predecessor to the Federated Kaufmann Fund). Mr. Utsch graduated from Amherst College and holds an M.B.A. from Columbia University. He has been engaged in the securities business since 1962. |
Annual Shareholder Report47
Evaluation and Approval of Advisory Contract – May 2011
Federated kaufmann fund (the “Fund”)
The Fund's Board reviewed the Fund's investment advisory and subadvisory contracts at meetings held in May 2011. The Board's decision regarding these contracts reflects the exercise of its business judgment on whether to continue the existing arrangements.
In this connection, the Federated Funds' Board had previously appointed a Senior Officer, whose duties include specified responsibilities relating to the process by which advisory fees are to be charged to a Federated fund. The Senior Officer has the authority to retain consultants, experts, or staff as may be reasonably necessary to assist in the performance of his duties, reports directly to the Board, and may be terminated only with the approval of a majority of the independent members of the Board. The Senior Officer prepared and furnished to the Board an independent, written evaluation that covered topics discussed below (the “Evaluation”). The Board considered that Evaluation, along with other information, in deciding to approve the advisory and subadvisory contracts.
During its review of these contracts, the Board considered compensation and benefits received by the Adviser and subadviser. This included the fees received for services provided to the Fund by other entities in the Federated organization and research services (if any) received by the Adviser from brokers that execute Federated fund trades, as well as advisory fees. The Board is also familiar with and considered judicial decisions concerning allegedly excessive investment advisory fees, which have indicated that the following factors may be relevant to an Adviser's fiduciary duty with respect to its receipt of compensation from a fund: the nature and quality of the services provided by the Adviser, including the performance of the fund; the Adviser's cost of providing the services; the extent to which the Adviser may realize “economies of scale” as a fund grows larger; any indirect benefits that may accrue to the Adviser and its affiliates as a result of the Adviser's relationship with a fund; performance and expenses of comparable funds; and the extent to which the independent Board members are fully informed about all facts the Board deems relevant bearing on the Adviser's services and fees. The Board further considered management fees (including any components thereof) charged to institutional and other clients of the Adviser and subadviser for what might be viewed as like services, and the cost to the Adviser and its affiliates of supplying services pursuant to the management fee agreements, excluding any intra-corporate profit and profit margins of the Adviser and its affiliates for supplying such services. The Board was aware of these factors and was guided by them in its review of the Fund's advisory and subadvisory contracts to the extent it considered them to be appropriate and relevant, as discussed further below.
Annual Shareholder Report
48
The Board considered and weighed these circumstances in light of its substantial accumulated experience in governing the Fund and working with Federated on matters relating to the Federated funds, and was assisted in its deliberations by independent legal counsel. Throughout the year, the Board has requested and received substantial and detailed information about the Fund and the Federated organization that was in addition to the extensive materials that comprise and accompany the Senior Officer's Evaluation. Federated provided much of this information at each regular meeting of the Board, and furnished additional information in connection with the particular meeting at which the Board's formal review of the advisory and subadvisory contracts occurred. Between regularly scheduled meetings, the Board also received information on particular matters as the need arose. Thus, the Board's consideration of the advisory and subadvisory contracts included review of the Senior Officer's Evaluation, accompanying data and additional information covering such matters as: the Adviser's and subadviser's investment philosophy, revenue, profitability, personnel and processes; investment and operating strategies; the Fund's short- and long-term performance (in absolute terms, both on a gross basis and net of expenses, as well as in relationship to its particular investment program and certain competitor or “peer group” funds and/or other benchmarks, as appropriate), and comments on the reasons for performance; the Fund's investment objectives; the Fund's expenses (including the advisory fee itself and the overall expense structure of the Fund, both in absolute terms and relative to similar and/or competing funds, with due regard for contractual or voluntary expense limitations); the use and allocation of brokerage commissions derived from trading the Fund's portfolio securities (if any); and the nature, quality and extent of the advisory and other services provided to the Fund by the Adviser and its affiliates. The Board also considered the preferences and expectations of Fund shareholders and their relative sophistication; the continuing state of competition in the mutual fund industry and market practices; the range of comparable fees for similar funds in the mutual fund industry; the Fund's relationship to the Federated family of funds which include a comprehensive array of funds with different investment objectives, policies and strategies which are available for exchange without the incurrence of additional sales charges; compliance and audit reports concerning the Federated funds and the Federated companies that service them (including communications from regulatory agencies), as well as Federated's responses to any issues raised therein; and relevant developments in the mutual fund industry and how the Federated funds and/or Federated are responding to them. The Board also considered that the longevity and experience of the Fund's portfolio management team and their unique approach to investing may limit the utility of comparisons to other equity mutual funds. The Board's evaluation process is evolutionary. The criteria considered and the emphasis placed on relevant criteria change in recognition of changing circumstances in the mutual fund marketplace.Annual Shareholder Report
49
With respect to the Fund's performance and expenses in particular, the Board has found the use of comparisons to other mutual funds with comparable investment programs to be relevant, given the high degree of competition in the mutual fund business. The Board focused on comparisons with other similar mutual funds more heavily than non-mutual fund products or services because it is believed that they are more relevant. For example, other mutual funds are the products most like the Fund, they are readily available to Fund shareholders as alternative investment vehicles, and they are the type of investment vehicle in fact chosen and maintained by the Fund's investors. The range of their fees and expenses therefore appears to be a generally reliable indication of what consumers have found to be reasonable in the precise marketplace in which the Fund competes. The Fund's ability to deliver competitive performance when compared to its peer group was a useful indicator of how the Adviser is executing the Fund's investment program, which in turn assisted the Board in reaching a conclusion that the nature, extent, and quality of the Adviser's investment management services were such as to warrant continuation of the advisory contract. In this regard, the Senior Officer has reviewed Federated's fees for providing advisory services to products outside the Federated family of funds (e.g., institutional and separate accounts). He concluded that mutual funds and institutional accounts are inherently different products. Those differences include, but are not limited to, different types of targeted investors; being subject to different laws and regulations; different legal structures; different average account sizes; different associated costs; different portfolio management techniques made necessary by different cash flows; and portfolio manager time spent in review of securities pricing. The Senior Officer did not consider these fee schedules to be determinative in judging the appropriateness of mutual fund advisory contracts.The Senior Officer reviewed information compiled by Federated, using data supplied by independent fund ranking organizations, regarding the performance of, and fees charged by, other mutual funds, noting his view that comparisons to fund peer groups are relevant in judging the reasonableness of proposed fees.
The Fund's performance fell below the median of the relevant peer group for the one-year, three-year and five-year periods covered by the Evaluation. The Board discussed the Fund's performance with the Adviser and recognized the efforts being undertaken by the Adviser. The Board will continue to monitor these efforts and the performance of the Fund.
The Board also received financial information about Federated, including information regarding the compensation and benefits Federated derived from its relationships with the Federated funds. This information covered not only the fees under the advisory contracts, but also fees received by Federated's subsidiaries for providing other services to the Federated funds under separate contracts (e.g., for serving as the Federated funds' administrator). The information also detailed any indirect benefit Federated may derive from its receipt of research services from brokers who execute Federated fund trades. In Annual Shareholder Report
50
addition, the Board considered the fact that, in order for a fund to be competitive in the marketplace, Federated and its affiliates frequently waived fees and/or reimbursed expenses and have disclosed to fund investors and/or indicated to the Board their intention to do so in the future, where appropriate. Moreover, the Board receives regular reporting as to the institution or elimination of these voluntary waivers.Federated furnished information, requested by the Senior Officer, that reported revenues on a fund-by-fund basis and made estimates of the allocation of expenses on a fund-by-fund basis, using allocation methodologies specified by the Senior Officer. The Senior Officer noted that, although they may apply consistent allocation processes, the inherent difficulties in allocating costs (and the unavoidable arbitrary aspects of that exercise) and the lack of consensus on how to allocate those costs may render such allocation information unreliable. The allocation information was considered in the analysis by the Board but was determined to be of limited use.
The Board and the Senior Officer also reviewed information compiled by Federated comparing profitability information for Federated to other publicly held fund management companies. In this regard, the Senior Officer noted the limited availability of such information, but nonetheless concluded that Federated's profit margins did not appear to be excessive and the Board agreed.
The Senior Officer's Evaluation also discussed the notion of possible realization of “economies of scale” as a fund grows larger. The Board considered in this regard that the Adviser has made significant and long-term investments in areas that support all of the Federated funds, such as personnel and processes for the portfolio management, compliance, internal audit, and risk management functions; and systems technology; and that the benefits of these efforts (as well as any economies, should they exist) were likely to be enjoyed by the fund complex as a whole. Finally, the Board also noted the absence of any applicable regulatory or industry guidelines on this subject, which (as discussed in the Senior Officer's Evaluation) is compounded by the lack of any common industry practice or general pattern with respect to structuring fund advisory fees with “breakpoints” that serve to reduce the fee as the fund attains a certain size. The Senior Officer did not recommend institution of breakpoints in pricing Federated's fund advisory services at this time. In this regard, the Senior Officer's Evaluation noted that the Board is aware that the Fund is a relatively more expensive fund for the Adviser to manage than other Federated equity funds and that the Fund has for long periods in the past been significantly and consistently above median in its investment performance. The Board agreed to monitor future developments and review changes in industry practices or competitive initiatives.
In connection with its discussion of the Senior Officer's Evaluation, the Board reviewed and discussed substantial other data which related to the Fund, including reports of an independent, third-party service provider which give further explanation of the relative performance of the Fund. The Board also Annual Shareholder Report
51
considered and discussed oral and written information requested of and provided by representatives of Federated's senior management describing and analyzing both relative and absolute performance of the Fund over its operating history, the uniqueness of its investment style and the quality and consistency of the Fund's investment management process and investment professionals.The Board also considered that on April 28, 2011, the adviser reached a final settlement to resolve the consolidated cases involving the fees being charged to the Federated Kaufmann Fund.
It was noted in the materials for the Board meeting that for the period covered by the Evaluation, the Fund's investment advisory fee, after waivers and expense reimbursements, if any, was above the median of the relevant peer group. The Board reviewed the fees and other expenses of the Fund with the Adviser and was satisfied that the overall expense structure of the Fund remained competitive. The Board will continue to monitor advisory fees and other expenses borne by the Fund.
The Senior Officer noted that, considering the totality of the circumstances, and all of the factors referenced within his Evaluation, he had concluded that, subject to comments and recommendations made within his Evaluation, his observations and the information accompanying the Evaluation supported a finding by the Board that the management fees for each of the funds are reasonable and that Federated appeared to provide appropriate administrative services to the Fund for the fees paid. Under these circumstances, no changes were recommended to, and no objection was raised to, the continuation of the Fund's advisory and subadvisory contracts. The Board concluded that the nature, quality and scope of services provided the Fund by the Adviser and its affiliates were satisfactory.
In its decision to continue an existing investment advisory contract, the Board was mindful of the potential disruptions of the Fund's operations and various risks, uncertainties and other effects that could occur as a result of a decision to terminate or not renew an advisory contract. In particular, the Board recognized that many shareholders have invested in the Fund on the strength of the Adviser's industry standing and reputation and with the expectation that the Adviser will have a continuing role in providing advisory services to the Fund. Thus, the Board's approval of the advisory contract reflected the fact that it is the shareholders who have effectively selected the Adviser by virtue of having invested in the Fund.
The Board based its decision to approve the advisory and subadvisory contracts on the totality of the circumstances and relevant factors and with a view to past and future long-term considerations. Not all of the factors and considerations identified above were necessarily relevant to the Fund, nor did the Board consider any one of them to be determinative. With respect to the factors that were relevant, the Board's decision to approve the contract reflects its determination that Federated's performance and actions provided a satisfactory basis to support the decision to continue the existing arrangements.
Annual Shareholder Report52
Voting Proxies on Fund Portfolio Securities
A description of the policies and procedures that the Fund uses to determine how to vote proxies, if any, relating to securities held in the Fund's portfolio is available, without charge and upon request, by calling 1-800-341-7400. A report on “Form N-PX” of how the Fund voted any such proxies during the most recent 12-month period ended June 30 is available from Federated's website at FederatedInvestors.com. To access this information from the home page, select “All” under “Asset Classes.” Select a fund name and share class, if applicable, to go to the Fund Overview page. On the Fund Overview page, select the “Documents” tab. At the bottom of that page, select “Proxy Voting Record Report (Form N-PX).” Form N-PX filings are also available at the SEC's website at www.sec.gov.
Quarterly Portfolio Schedule
The Fund files with the SEC a complete schedule of its portfolio holdings, as of the close of the first and third quarters of its fiscal year, on “Form N-Q.” These filings are available on the SEC's website at www.sec.gov and may be reviewed and copied at the SEC's Public Reference Room in Washington, DC. (Call 1-800-SEC-0330 for information on the operation of the Public Reference Room.) You may also access this information from the “Products” section of Federated's website at FederatedInvestors.com. From the home page, select “All” under “Asset Classes.” Select a fund name and share class, if applicable, to go to the Fund Overview page. On the Fund Overview page, select the “Documents” tab. At the bottom of that page, select “Form N-Q.”
Annual Shareholder Report53
Mutual funds are not bank deposits or obligations, are not guaranteed by any bank and are not insured or guaranteed by the U.S. government, the Federal Deposit Insurance Corporation, the Federal Reserve Board or any other government agency. Investment in mutual funds involves investment risk, including the possible loss of principal.
This Report is authorized for distribution to prospective investors only when preceded or accompanied by the Fund's Prospectus, which contains facts concerning its objective and policies, management fees, expenses and other information.
Federated Kaufmann Fund
Federated Investors Funds
4000 Ericsson Drive
Warrendale, PA 15086-7561
Contact us at FederatedInvestors.com
or call 1-800-341-7400.
Federated Securities Corp., Distributor
Cusip 314172677
Cusip 314172669
Cusip 314172651
26396 (12/11)
Federated is a registered trademark of Federated Investors, Inc.
2011 © Federated Investors, Inc.
| | Annual Shareholder Report |
| | October 31, 2011 |
|
*formerly, Class K Shares
Federated Kaufmann Fund
Fund Established 2001
A Portfolio of Federated Equity Funds
Management's Discussion of Fund Performance
Portfolio of Investments Summary Table
Portfolio of Investments
Financial Highlights
Statement of Assets and Liabilities
Statement of Operations
Statement of Changes in Net Assets
Notes to Financial Statements
Report of Independent Registered Public Accounting Firm
Shareholder Expense Example
Board of Trustees and Trust Officers
Evaluation and Approval of Advisory Contract
Voting Proxies on Fund Portfolio Securities
Quarterly Portfolio Schedule
Management's Discussion of Fund Performance
The Fund's total return, based upon net asset value, for the 12-month reporting period ended October 31, 2011, was -5.88% for the Fund's Class R shares. The Russell Midcap® Growth Index (RMCG),1 the Fund's broad-based securities market index, had a total return of 10.08% for same period. The Fund's total return for the fiscal year reflects actual cash flows, transaction costs and other expenses which are not reflected in the total return of the RMCG.
Market Conditions
The stock market, as a whole, posted very strong returns during the first half of the fiscal year but then retreated into negative return territory during the second half of the reporting period. The equity markets returned to positive returns with a powerful rally during the final month of the Fund's fiscal year, October of 2011. The Standard and Poor's 500 Index (S&P 500)2 bottomed in September of 2011 and finished the fiscal year up 8.09%. Overall, large-cap stocks performed best, followed by mid-caps and then small-caps. In terms of style, growth stocks outperformed value stocks across large-, mid- and small-cap stock groupings.
Economic growth in Europe began to slow, especially in the highly indebted countries of Greece, Italy, Portugal, Ireland, Spain, and others. Credit spreads widened substantially on speculation that those governments would not be able to support their level of indebtedness in a slowing economic environment without significant support from the European Central Bank. Politics have dominated much of the European debate. However, even after numerous meetings between bankers and politicians, and the resignation of several prime ministers, credible plans for a bailout remained elusive.
Unfortunately, political uncertainty was not limited to Europe; the President and the U.S. Congress generated a highly contentious standoff regarding the debt ceiling debate. This uncertainty prompted Standard and Poor's to downgrade the long-term credit rating of the U.S. one notch down from AAA. Additionally, during June of 2011, the Federal Reserve's second quantitative easing program, known as QE2, ended.
The European debt crisis, political uncertainty, and weaker economic indicators during the last six months of the reporting period clearly increased volatility and negatively affected the global equity markets.
Annual Shareholder Report
1
Fund PerformanceThe Fund underperformed the RMCG over the reporting period. Key factors affecting the Fund performance over the reporting period include the following:
International holdings: The Fund maintained exposure to growth companies outside of the U.S., particularly in Brazil, China, India, and others. Both developed and emerging international markets significantly underperformed the U.S. markets and accounted for nearly one-half of our underperformance, based upon performance attribution data.3
Stock selection: The eight worst contributing holdings during the period accounted for a substantial portion of underperformance. Specifically: Hypermarcas (-64%); Lee & Man Paper Manufacturing (-49%); Warner Chilcott (-25%); Camelot Information Systems (-77%); Huabao International (-57%); STR Holdings (-66%); Examworks (-38%) and HCA Holdings (-34%).
Companies that were strong performers and contributed most to the Fund returns during the period were: Cetip (+33%); Cubist Pharmaceuticals (+62%); Restoque Comercio (97%); Alkermes Plc (+51%); Cia Hering (+40%) and NXP Semiconductor (36%).
Sector weightings: Substantially less exposure to Consumer Discretionary and Energy sectors relative to the RMCG hurt performance. Finally, an overweight in the Financial sector also hurt the Fund's performance.
Macroeconomic events, previously mentioned, also pushed stock correlations substantially higher, meaning many stocks moved in the same direction, up or down, simultaneously. This made stock selection more difficult because stocks reacted similarly to both good and bad news headlines more than company fundamentals.
The Fund was nearly fully invested during the reporting period with a cash position which averaged less than 1.5%.
| 1 | The Russell Midcap Growth Index measures the performance of the mid-cap growth segment of the U.S. equity universe. It includes those Russell Midcap Index companies with higher price-to-book ratios and higher forecasted growth values. |
| 2 | The Standard and Poor's 500 Index is an unmanaged, capitalization-weighted index of 500 stocks designed to measure performance of the broad domestic economy through changes in the aggregate market value of 500 stocks representing all major industries. It is not possible to invest directly in an index. |
| 3 | International investing involves special risks including currency risk, increased volatility, political risks and differences in auditing and other financial standards. Prices of emerging markets securities can be significantly more volatile than the prices of securities in developed countries and currency risk and political risk are accentuated in emerging markets. |
Annual Shareholder Report2
FUND PERFORMANCE AND GROWTH OF A $10,000 INVESTMENT
The Average Annual Total Return table below shows returns for each class averaged over the stated periods. The graphs below illustrate the hypothetical investment of $10,0001 in the Federated Kaufmann Fund (the “Fund”) from October 31, 1996 to October 31, 2011, compared to the Russell Midcap Growth Index (RMCG)2 and the Lipper Multi-Cap Growth Funds Category (LMCGC).2
Average Annual Total Returns for the Period Ended 10/31/2011
| Share Class | 6-Month
(Cumulative) | 1 Year | 3 Years | 5 Years | 10 Years | 15 Years |
| Class R Shares | -16.47% | -6.07% | 9.19% | 0.39% | 6.09% | 7.08% |
| Russell Midcap Growth Index | -10.22% | 10.08% | 19.96% | 3.46% | 6.98% | 6.94% |
| Lipper Multi-Cap Growth Funds Category | -10.10% | 6.23% | 14.88% | 2.02% | 4.46% | 5.73% |
Performance data quoted represents past performance which is no guarantee of future results. Investment return and principal value will fluctuate so that an investor's shares, when redeemed, may be worth more or less than their original cost. Mutual fund performance changes over time and current performance may be lower or higher than what is stated. For current to the most recent month-end performance and after-tax returns, visit FederatedInvestors.com or call 1-800-341-7400. Returns shown do not reflect the deduction of taxes that a shareholder would pay on Fund distributions or the redemption of Fund shares. Mutual funds are not obligations of or guaranteed by any bank and are not federally insured.
Annual Shareholder Report
3
Growth of a $10,000 Investment – class R shares| Federated Kaufmann Fund - Class R Shares | C000026732 | Russell Mid-Cap Growth Index | Lipper Multi-Cap Growth Funds Category |
| 10/31/1996 | 10,000 | 10,000 | 10,000 |
| 10/31/1997 | 11,557 | 12,461 | 12,494 |
| 10/31/1998 | 10,103 | 12,764 | 13,424 |
| 10/31/1999 | 11,229 | 17,572 | 20,252 |
| 10/31/2000 | 17,037 | 24,367 | 26,735 |
| 10/31/2001 | 15,440 | 13,943 | 17,217 |
| 10/31/2002 | 14,063 | 11,487 | 14,096 |
| 10/31/2003 | 19,466 | 16,001 | 18,492 |
| 10/31/2004 | 20,485 | 17,403 | 19,548 |
| 10/31/2005 | 23,404 | 20,172 | 22,130 |
| 10/31/2006 | 27,294 | 23,099 | 24,709 |
| 10/31/2007 | 35,774 | 27,654 | 31,036 |
| 10/31/2008 | 21,381 | 15,860 | 18,417 |
| 10/31/2009 | 23,739 | 19,425 | 21,618 |
| 10/31/2010 | 29,628 | 24,870 | 26,210 |
| 10/31/2011 | 27,886 | 27,378 | 27,842 |
41 graphic description end -->
| 1 | Represents a hypothetical investment of $10,000 in the Fund. The ending value of the Fund reflects a 0.20% redemption fee. The Fund's performance assumes the reinvestment of all dividends and distributions. The Russell Midcap Growth Index (RMCG) and the Lipper Multi-Cap Growth Funds Category (LMCGC) have been adjusted to reflect reinvestment of all dividends on securities in the index and average. |
| 2 | The RMCG is not adjusted to reflect sales charges, expenses or other fees that the Securities and Exchange Commission requires to be reflected in the Fund's performance. The RMCG measures the performance of those Russell Midcap companies with higher price-to-book ratios and higher forecasted growth values. The stocks are also members of the Russell 1000 Growth Index. The LMCGC is an equal dollar-weighted index of the largest mutual funds within the mid-cap growth classification, as defined by Lipper, Inc. The LMCGC does not reflect sales charges and is adjusted for the reinvestment of capital gains and income dividends. The RMCG is unmanaged and, unlike the Fund, is not affected by cash flows. Investments cannot be made in an index or an average. |
Annual Shareholder Report4
Portfolio of Investments Summary Table (unaudited)
At October 31, 2011, the Fund's sector composition1 was as follows:
| Sector Composition | Percentage of
Total Net Assets |
| Information Technology | 22.4% |
| Industrials | 19.4% |
| Health Care | 19.3% |
| Consumer Discretionary | 13.7% |
| Financials | 14.2% |
| Materials | 6.1% |
| Energy | 1.5% |
| Consumer Staples | 1.2% |
| Telecommunication Services | 0.8% |
| Utilities | 0.7% |
| Securities Lending Collateral2 | 7.7% |
| Cash Equivalents3 | 1.2% |
| Other Assets and Liabilities — Net4 | (8.2)% |
| TOTAL | 100.0% |
| 1 | Except for Securities Lending Collateral, Cash Equivalents and Other Assets and Liabilities, sector classifications are based upon, and individual portfolio securities are assigned to, the classifications of the Global Industry Classification System (GICS), except that the Adviser assigns a classification to securities not classified by the GICS and to securities for which the Adviser does not have access to the classification made by the GICS. |
| 2 | Cash collateral received from lending portfolio securities, which is invested in short-term investments such as repurchase agreements or money market mutual funds. |
| 3 | Cash Equivalents include any investments in money market mutual funds and/or overnight repurchase agreements other than those representing securities lending collateral. |
| 4 | Assets, other than investments in securities, less liabilities. See Statement of Assets and Liabilities. |
Annual Shareholder Report5
Portfolio of Investments
October 31, 2011
Shares or
Principal
Amount | | | Value |
| | COMMON STOCKS – 98.7% | |
| | Consumer Discretionary – 13.7% | |
| 710,000 | | Abercrombie & Fitch Co., Class A | 52,824,000 |
| 1,363,857 | | Bharat Forge Ltd. | 8,347,363 |
| 1,637,606 | | Cia Hering | 36,579,894 |
| 22,230,000 | 1 | Genting Singapore PLC | 30,354,987 |
| 13,150,000 | 1 | L'Occitane International SA | 28,855,067 |
| 1,217,800 | 1 | Las Vegas Sands Corp. | 57,175,710 |
| 1,800,000 | 1,2 | Melco PBL Entertainment (Macau) Ltd., ADR | 20,646,000 |
| 1,815,249 | | National CineMedia, Inc. | 21,964,513 |
| 140,000 | 1 | O'Reilly Automotive, Inc. | 10,647,000 |
| 987,917 | 1 | Penn National Gaming, Inc. | 35,565,012 |
| 22,570,741 | 1 | Prada Holding SpA | 108,654,663 |
| 33,600 | 1 | Priceline.com, Inc. | 17,059,392 |
| 350,000 | | Ralph Lauren Corp. | 55,576,500 |
| 3,698,035 | 1,3 | Restoque Comercio e Confeccoes de Roupas SA | 58,157,058 |
| 60,991,468 | 1 | Samsonite International SA | 99,745,937 |
| 700,000 | 1,2 | Shutterfly, Inc. | 29,169,000 |
| 300,000 | 1,2 | SodaStream International Ltd. | 10,224,000 |
| 250,000 | | Starbucks Corp. | 10,585,000 |
| 390,000 | 2 | Starwood Hotels & Resorts Worldwide, Inc. | 19,542,900 |
| 595,000 | 1,2 | Vera Bradley, Inc. | 26,953,500 |
| 208,000 | | Wynn Resorts Ltd. | 27,622,400 |
| 1,860,897 | 1,2 | Yoox SpA | 26,575,546 |
| | TOTAL | 792,825,442 |
| | Consumer Staples – 1.2% | |
| 2,599,180 | | Almacenes Exito SA | 33,429,968 |
| 925,000 | 1 | Darling International, Inc. | 12,968,500 |
| 300,000 | 1,2 | TreeHouse Foods, Inc. | 18,402,000 |
| 398,820 | | United Breweries Co., Inc. | 3,391,116 |
| | TOTAL | 68,191,584 |
| | Energy – 1.5% | |
| 3,476,400 | 1 | Coal India Ltd. | 23,501,385 |
| 295,000 | 1 | Concho Resources, Inc. | 27,942,400 |
| 626,847 | 1,2 | Dresser-Rand Group, Inc. | 30,339,395 |
Annual Shareholder Report6
Shares or
Principal
Amount | | | Value |
| 74,800 | | National-Oilwell, Inc. | 5,335,484 |
| | TOTAL | 87,118,664 |
| | Financials – 14.2% | |
| 322,129 | | BlackRock, Inc. | 50,828,735 |
| 21,640,000 | 3 | CETIP SA | 298,726,155 |
| 11,438,000 | 1,4,5 | CITIC Securities Co., Ltd. | 22,791,196 |
| 13,600,000 | | Chimera Investment Corp. | 40,936,000 |
| 1 | 1,4,6 | FA Private Equity Fund IV LP | 821,287 |
| 7,358,613 | | Fibra Uno Administracion SA | 13,527,877 |
| 6,000,000 | | Housing Development Finance Corp. Ltd. | 84,106,717 |
| 1 | 1,4,6 | Infrastructure Fund | 0 |
| 2,301,814 | | J.P. Morgan Chase & Co. | 80,011,055 |
| 2,329,516 | | LPS Brasil Cons De Imoveis | 42,076,064 |
| 1,614,587 | | Multiplan Empreendimentos Imobiliarios SA | 32,651,927 |
| 23,142,407 | | PT Bank Central Asia | 20,925,655 |
| 1 | 4,6 | Peachtree Leadscope LLC, Class A and B | 0 |
| 1 | 1,4,6 | Peachtree Leadscope LLC, Class C | 3,250,000 |
| 587,492 | | Power Finance Corp. | 1,795,420 |
| 2,747,400 | | Wells Fargo & Co. | 71,185,134 |
| 1,635,000 | | Willis Group Holdings PLC | 59,366,850 |
| | TOTAL | 823,000,072 |
| | Health Care – 18.7% | |
| 5,818,897 | 1,3 | Alkermes, Inc. | 101,772,509 |
| 495,000 | 2 | Allergan, Inc. | 41,639,400 |
| 1,487,712 | 1,2 | Allscripts Healthcare Solutions, Inc. | 28,489,685 |
| 1,000,000 | 1 | Amarin Corporation PLC., ADR | 9,400,000 |
| 3,324,525 | | Amil Participacoes SA | 33,635,437 |
| 1 | 4,6 | Apollo Investment Fund V | 4,106,516 |
| 2,516,000 | 1 | Biocon Ltd. | 18,212,007 |
| 400,000 | 1 | Biogen Idec, Inc. | 46,544,000 |
| 1,000,000 | 1 | Boston Scientific Corp. | 5,890,000 |
| 31,189,620 | 1 | CFR Pharmaceuticals SA | 7,296,389 |
| 351,900 | 1,4,5 | CFR Pharmaceuticals SA, ADR | 8,315,397 |
| 185,980 | 1 | Chindex International, Inc. | 2,066,238 |
| 625,000 | 1,3,4 | Conceptus, Inc. | 7,200,000 |
| 386,174 | 1,3,4,5 | Conceptus, Inc. | 4,448,724 |
| 714,286 | 1,3,4 | Conceptus, Inc. | 8,228,575 |
Annual Shareholder Report7
Shares or
Principal
Amount | | | Value |
| 3,653,165 | 1 | Corcept Therapeutics, Inc. | 11,580,533 |
| 500,000 | 1,4,6 | Cortek, Inc. | 0 |
| 4,250,000 | 1,2,3 | Cubist Pharmaceuticals, Inc. | 160,692,500 |
| 1 | 4,6 | Denovo Ventures I LP | 1,068,278 |
| 3,717,624 | 1,2,3 | Dexcom, Inc. | 36,395,539 |
| 126,065 | 1,3 | Dexcom, Inc. | 1,234,176 |
| 865,520 | | Dishman Pharmaceuticals & Chemicals Ltd. | 922,438 |
| 15,200,000 | 1,3 | Dyax Corp. | 20,520,000 |
| 109,505 | 1 | Edwards Lifesciences Corp. | 8,258,867 |
| 3,000,000 | 1,2,3 | ExamWorks Group, Inc. | 31,650,000 |
| 2,800,000 | 1,2 | Express Scripts, Inc., Class A | 128,044,000 |
| 1,834,871 | 1,2,3 | Insulet Corp. | 29,945,095 |
| 1 | 4,6 | Latin Healthcare Fund | 335,009 |
| 2,600,000 | 1 | Nektar Therapeutics | 14,092,000 |
| 1 | 4,6 | Peachtree Velquest | 247,191 |
| 5,246,193 | 1,3 | Progenics Pharmaceuticals, Inc. | 34,467,488 |
| 5,400,000 | 1,2,3 | Protalix Biotherapeutics, Inc. | 32,994,000 |
| 213,251 | 1 | Regeneron Pharmaceuticals, Inc. | 11,792,780 |
| 2,998,043 | 1,3 | Repligen Corp. | 10,283,287 |
| 843,785 | 1 | Salix Pharmaceuticals Ltd. | 28,903,855 |
| 3,075,000 | 1,2 | Seattle Genetics, Inc. | 67,650,000 |
| 1,000,000 | | Shandong Weigao Group Medical Polymer Co., Ltd. | 1,032,237 |
| 274 | 1,3,6 | Soteira, Inc. | 0 |
| 358,728 | 1 | Threshold Pharmaceuticals, Inc. | 573,965 |
| 7,048,500 | 1,2,3 | Vical, Inc. | 21,075,015 |
| 1,180,949 | 1,2 | Vivus, Inc. | 11,136,349 |
| 2,438,615 | 1 | Warner Chilcott PLC | 44,187,704 |
| 712,300 | 1 | Watson Pharmaceuticals, Inc. | 47,838,068 |
| | TOTAL | 1,084,165,251 |
| | Industrials – 19.4% | |
| 435,000 | | 3M Co. | 34,373,700 |
| 497,351 | | Aggreko PLC | 13,598,198 |
| 1,250,000 | | CLARCOR, Inc. | 60,600,000 |
| 343,000 | | Caterpillar, Inc. | 32,399,780 |
| 700,000 | 1 | CoStar Group, Inc. | 43,071,000 |
| 1,007,626 | 2 | Cummins, Inc. | 100,188,253 |
| 1,300,000 | 2 | Danaher Corp. | 62,855,000 |
Annual Shareholder Report8
Shares or
Principal
Amount | | | Value |
| 2,300,000 | | Expeditors International Washington, Inc. | 104,880,000 |
| 1,100,000 | | FedEx Corp. | 90,013,000 |
| 320,800 | 1 | IHS, Inc., Class A | 26,943,992 |
| 900,000 | 1 | Kansas City Southern Industries, Inc. | 56,853,000 |
| 158,200 | | Kuehne & Nagel International AG | 19,583,741 |
| 642,000 | | Localiza Rent A Car SA | 9,703,760 |
| 503,995 | | MSC Industrial Direct Co. | 34,276,700 |
| 4,704,116 | | Max India Ltd. | 18,385,387 |
| 200,000 | | Norfolk Southern Corp. | 14,798,000 |
| 2,775,000 | 1 | Owens Corning, Inc. | 78,754,500 |
| 530,000 | | Precision Castparts Corp. | 86,469,500 |
| 485,000 | 1 | RPX Corp. | 7,546,600 |
| 300,000 | | Rockwell Collins | 16,749,000 |
| 600,000 | 1 | Teledyne Technologies, Inc. | 32,682,000 |
| 400,000 | | Trinity Industries, Inc. | 10,908,000 |
| 385,000 | 2 | Union Pacific Corp. | 38,334,450 |
| 875,000 | 2 | United Technologies Corp. | 68,232,500 |
| 1,772,120 | 1 | Verisk Analytics, Inc. | 62,290,018 |
| | TOTAL | 1,124,490,079 |
| | Information Technology – 22.4% | |
| 7,000,000 | | Amadeus IT Holding SA | 131,386,397 |
| 382,618 | 1 | Apple, Inc. | 154,876,114 |
| 4,250,000 | 1 | Atmel Corp. | 44,880,000 |
| 1,575,000 | | Avago Technologies Ltd. | 53,187,750 |
| 600,000 | 1 | Check Point Software Technologies Ltd. | 34,578,000 |
| 500,000 | 1 | Citrix Systems, Inc. | 36,415,000 |
| 2,950,000 | 1 | Comverse Technology, Inc. | 20,325,500 |
| 635,000 | 1 | Cypress Semiconductor Corp. | 12,134,850 |
| 2,625,000 | 1,2 | EMC Corp. | 64,338,750 |
| 750,000 | 1,2 | eBay, Inc. | 23,872,500 |
| 1,059,322 | 4,6 | Expand Networks Ltd. | 0 |
| 450,000 | 1 | First Solar, Inc. | 22,396,500 |
| 262,000 | 1 | Google, Inc. | 155,271,680 |
| 1,000,000 | 1 | LivePerson, Inc. | 12,590,000 |
| 535,432 | 1,4,5 | Mail.RU Group Ltd., Series 144A, GDR | 18,445,632 |
| 117,000 | 1 | Mellanox Technologies Ltd. | 3,786,120 |
| 3,806,875 | 1 | Microsemi Corp. | 70,274,913 |
Annual Shareholder Report9
Shares or
Principal
Amount | | | Value |
| 2,000,000 | 1 | NCR Corp. | 38,080,000 |
| 2,100,000 | 1 | NIC, Inc. | 29,001,000 |
| 3,244,176 | 1,2 | NXP Semiconductors NV | 58,297,843 |
| 335,000 | 1 | NetApp, Inc. | 13,721,600 |
| 1,700,000 | 1 | ON Semiconductor Corp. | 12,869,000 |
| 1 | 4,6 | Peachtree Open Networks | 0 |
| 1,300,000 | | Qualcomm, Inc. | 67,080,000 |
| 615,000 | 1 | RADWARE Ltd. | 16,260,600 |
| 849,173 | 1 | RDA Microelectronics, Inc., ADR | 6,878,301 |
| 1,413,683 | 1 | Riverbed Technology, Inc. | 38,989,377 |
| 180,000 | 1 | Salesforce.com, Inc. | 23,970,600 |
| 3,751,199 | 3,4,6 | Sensable Technologies, Inc. | 0 |
| 1,770,000 | 1,2 | STR Holdings, Inc. | 15,133,500 |
| 2,964,645 | 1,3 | TNS, Inc. | 57,899,517 |
| 728,412 | | Totvs SA | 12,091,762 |
| 310,000 | 1 | VMware, Inc., Class A | 30,302,500 |
| 580,550 | 1,2 | VistaPrint Ltd. | 20,272,806 |
| | TOTAL | 1,299,608,112 |
| | Materials – 6.1% | |
| 250,000 | | Allegheny Technologies, Inc. | 11,600,000 |
| 708,250 | | BASF SE | 51,473,349 |
| 1,560,000 | | Eastman Chemical Co. | 61,292,400 |
| 3,511,300 | 1 | Greatview Aseptic Packaging Company Ltd. | 1,290,928 |
| 34,631,057 | | Huabao International Holdings Ltd. | 21,989,433 |
| 72,789,906 | | Lee & Man Paper Manufacturing Ltd. | 29,333,541 |
| 46,781,387 | 1 | Mongolian Mining Corp. | 40,793,221 |
| 141,500 | | Mosaic Co./The | 8,286,240 |
| 325,000 | | Potash Corp. of Saskatchewan, Inc. | 15,382,250 |
| 510,000 | | Praxair, Inc. | 51,851,700 |
| 1,000,000 | 2 | Sociedad Quimica Y Minera de Chile, ADR | 58,500,000 |
| | TOTAL | 351,793,062 |
| | Telecommunication Services – 0.8% | |
| 2,654,130 | 1 | TW Telecom, Inc. | 49,101,405 |
Annual Shareholder Report10
Shares or
Principal
Amount | | | Value |
| | Utilities – 0.7% | |
| 582,400 | | ITC Holdings Corp. | 42,328,832 |
| | TOTAL COMMON STOCKS
(IDENTIFIED COST $4,630,186,528) | 5,722,622,503 |
| | WARRANTS – 0.1% | |
| | Health Care – 0.1% | |
| 1,500,000 | 1 | Advancis Pharmaceutical Corp., 4/12/2012 | 0 |
| 382,897 | 1 | Alexza Pharmaceuticals, Inc., 10/5/2012 | 514,575 |
| 157,125 | 1 | Clinical Data, Inc., 5/25/2012 | 0 |
| 797,358 | 1 | Corcept Therapeutics, Inc., 4/21/2013 | 760,201 |
| 242,091 | 1 | Cyclacel Pharmaceuticals, Inc., 2/17/2014 | 1,630 |
| 857,143 | 1 | Cyclacel Pharmaceuticals, Inc., 4/28/2013 | 38,917 |
| 2,750,000 | 1 | Dynavax Technologies Corp., 4/16/2015 | 5,875,375 |
| 1,042,038 | 1 | Favrille, Inc., 11/7/2012 | 0 |
| 27,781 | 1 | IntelliPharmaCeutics International, Inc., 11/14/2011 | 0 |
| 1,713,798 | 1 | Threshold Pharmaceuticals, Inc., 10/5/2014 | 1,270,610 |
| | TOTAL WARRANTS
(IDENTIFIED COST $1,055,552) | 8,461,308 |
| | Preferred Stocks – 0.0% | |
| | Health Care – 0.0% | |
| 446,816 | 1,4,6 | Cortek, Inc., Conv. Pfd., Series D2 | 0 |
| 1,515,152 | 1,4,6 | Cortex, Inc., Pfd., Series D | 0 |
| 958,744 | 3,6 | Soteira, Inc., Pfd. | 0 |
| | TOTAL | 0 |
| | Information Technology – 0.0% | |
| 679,348 | 1,4,6 | Multiplex, Inc., Pfd., Series C | 0 |
| | TOTAL PREFERRED STOCKS
(IDENTIFIED COST $8,588,631) | 0 |
| | Corporate Bonds – 0.5% | |
| | Health Care – 0.5% | |
| $14,630,000 | 3 | Insulet Corp., Conv. Bond, 3.75%, 6/15/2016 | 13,803,829 |
| 12,670,000 | 3 | Insulet Corp., Conv. Bond, 5.375%, 6/15/2013 | 13,892,909 |
| | TOTAL CORPORATE BONDS
(IDENTIFIED COST $27,300,000) | 27,696,738 |
Annual Shareholder Report11
Shares or
Principal
Amount | | | Value |
| | MUTUAL FUND – 8.9% | |
| 511,911,319 | 3,7,8 | Federated Prime Value Obligations Fund, Institutional Shares, 0.18%
(AT NET ASSET VALUE) | 511,911,319 |
| | TOTAL INVESTMENTS — 108.2%
(IDENTIFIED COST $5,179,042,030)9 | 6,270,691,868 |
| | OTHER ASSETS AND LIABILITIES - NET — (8.2)%10 | (473,600,948) |
| | TOTAL NET ASSETS — 100% | $5,797,090,920 |
At October 31, 2011, the Fund had the following outstanding foreign exchange contracts:
| Settlement Date | Foreign
Currency
Units to Deliver | In
Exchange
For | Unrealized
Depreciation |
| Contracts Purchased: | | |
| 11/3/2011 | 759,953 Brazilian Real | $447,373 | $(4,729) |
| 11/3/2011 | 15,509 Brazilian Real | $9,130 | $(97) |
UNREALIZED DEPRECIATION ON
FOREIGN EXCHANGE CONTRACTS | | | $(4,826) |
Unrealized Depreciation on Foreign Exchange Contracts is included in “Other Assets and Liabilities — Net.”
| 1 | Non-income producing security. |
| 2 | All or a portion of these securities are temporarily on loan to unaffiliated broker/dealers. |
| 3 | Affiliated holdings. |
| 4 | Denotes a restricted security that either: (a) cannot be offered for public sale without first being registered, or being able to take advantage of an exemption from registration, under the Securities Act of 1933; or (b) is subject to a contractual restriction on public sales. At October 31, 2011, these restricted securities amounted to $79,257,805, which represented 1.4% of total net assets. |
| 5 | Denotes a restricted security that may be resold without restriction to “qualified institutional buyers” as defined in Rule 144A under the Securities Act of 1933 and that the Fund has determined to be liquid under criteria established by the Fund's Board of Trustees (the “Trustees”). At October 31, 2011, these liquid restricted securities amounted to $54,000,949, which represented 0.9% of total net assets. |
| 6 | Market quotations and price evaluations are not available. Fair value determined in accordance with procedures established by and under the general supervision of the Trustees. |
| 7 | 7-Day net yield. |
| 8 | All or a portion of this security is held as collateral for securities lending. |
| 9 | The cost of investments for federal tax purposes amounts to $5,219,872,701. |
| 10 | Assets, other than investments in securities, less liabilities. See Statement of Assets and Liabilities. |
Note: The categories of investments are shown as a percentage of total net assets at October 31, 2011.
Annual Shareholder Report
12
Various inputs are used in determining the value of the Fund's investments. These inputs are summarized in the three broad levels listed below:Level 1 — quoted prices in active markets for identical securities, including investment companies with daily net asset values, if applicable.
Level 2 — other significant observable inputs (including quoted prices for similar securities, interest rates, prepayment speeds, credit risk, etc.). Also includes securities valued at amortized cost.
Level 3 — significant unobservable inputs (including the Fund's own assumptions in determining the fair value of investments).
The inputs or methodology used for valuing securities are not an indication of the risk associated with investing in those securities.
The following is a summary of the inputs used, as of October 31, 2011, in valuing the Fund's assets carried at fair value:
| Valuation Inputs | | | | |
| Level 1 —
Quoted
Prices and
Investments in
Mutual Funds | Level 2 —
Other
Significant
Observable
Inputs | Level 3 —
Significant
Unobservable
Inputs | Total |
| Equity Securities: | | | | |
| Common Stocks | | | | |
| Domestic | $3,788,370,240 | $ — | $9,828,281 | $3,798,198,521 |
| International | 1,114,427,228 | 809,996,7541 | — | 1,924,423,982 |
| Preferred Stocks | | | | |
| Domestic | — | — | 0 | 0 |
| Debt Securities: | | | | |
| Corporate Bonds | — | 27,696,738 | — | 27,696,738 |
| Warrants | — | 8,461,308 | — | 8,461,308 |
| Mutual Fund | 511,911,319 | — | — | 511,911,319 |
| TOTAL SECURITIES | $5,414,708,787 | $846,154,800 | $9,828,281 | $6,270,691,868 |
| OTHER FINANCIAL INSTRUMENTS2 | $(4,826) | $ — | $ — | $(4,826) |
| 1 | Includes $40,574,712 of a security transferred from Level 1 to Level 2 because fair value factors were applied to the equity security traded principally in foreign markets to account for significant post market close activity. Transfer shown represents the value of the security at the beginning of the period. |
| 2 | Other financial instruments include foreign exchange contracts. |
Annual Shareholder Report
13
Following is a reconciliation of assets in which significant unobservable inputs (Level 3) were used in determining fair value: | Investments
in Common
Stock —
Domestic
Securities | Investments
in Common
Stock —
International
Securities | Investments
in Preferred
Stock —
Domestic
Securities |
| Balance as of November 1, 2010 | $11,113,453 | $493,814 | $616,987 |
| Realized gain (loss) | (10,880,985) | 318,661 | (19,666,662) |
| Change in unrealized appreciation (depreciation) | 9,550,253 | (493,814) | 19,049,675 |
| Purchases | 130,000 | — | — |
| (Sales) | (84,440) | (318,661) | — |
| Balance as of October 31, 2011 | $9,828,281 | $ — | $0 |
| The total change in unrealized appreciation (depreciation) included in the Statement of Operations attributable to investments still held at October 31, 2011 | $(1,330,732) | $ — | $(616,987) |
The following acronyms are used throughout this portfolio:
| ADR | — American Depositary Receipt |
| GDR | — Global Depository Receipt |
| LP | — Limited Partnership |
See Notes which are an integral part of the Financial Statements
Annual Shareholder Report14
Financial Highlights – Class R Shares
(For a Share Outstanding Throughout Each Period)
| Year Ended October 31 | 2011 | 2010 | 2009 | 2008 | 2007 |
| Net Asset Value, Beginning of Period | $5.27 | $4.23 | $3.81 | $7.03 | $6.08 |
| Income From Investment Operations: | | | | | |
| Net investment income (loss) | (0.05)1 | 0.021 | (0.00)1,2 | (0.03)1 | (0.04)1 |
| Net realized and unrealized gain (loss) on investments, written options, futures contracts, short sales and foreign currency transactions | (0.26) | 1.03 | 0.42 | (2.56) | 1.73 |
| TOTAL FROM INVESTMENT OPERATIONS | (0.31) | 1.05 | 0.42 | (2.59) | 1.69 |
| Less Distributions: | | | | | |
| Distributions from net investment income | (0.03) | (0.01) | — | — | — |
| Distributions from net realized gain on investments and foreign currency transactions | (0.00)2 | — | — | (0.63) | (0.74) |
| TOTAL DISTRIBUTIONS | (0.03) | (0.01) | — | (0.63) | (0.74) |
| Net Asset Value, End of Period | $4.93 | $5.27 | $4.23 | $3.81 | $7.03 |
| Total Return3 | (5.88)% | 24.81% | 11.02% | (40.23)% | 31.07% |
| Ratios to Average Net Assets: | | | | | |
| Net expenses | 1.95%4 | 1.95%4 | 1.95%4 | 1.95%4 | 1.95%4 |
| Net expenses excluding dividends and other expenses related to short sales | 1.95%4 | 1.95%4 | 1.95%4 | 1.95%4 | 1.95%4 |
| Net investment income (loss) | (0.99)% | 0.39% | (0.12)% | (0.56)% | (0.63)% |
| Expense waiver/reimbursement5 | 0.54% | 0.54% | 0.53% | 0.49% | 0.48% |
| Supplemental Data: | | | | | |
| Net assets, end of period (000 omitted) | $3,001,225 | $3,621,789 | $3,168,922 | $3,051,697 | $5,432,110 |
| Portfolio turnover | 64% | 54% | 91% | 78% | 49% |
| 1 | Per share numbers have been calculated using the average shares method. |
| 2 | Represents less than $0.01. |
| 3 | Based on net asset value, which does not reflect the sales charge, redemption fee or contingent deferred sales charge, if applicable. |
| 4 | The net expense ratio is calculated without reduction for fees paid indirectly for expense offset arrangements. The net expense ratios are 1.95%, 1.95%, 1.95%, 1.95% and 1.95% after taking into account these expense reductions for the years ended October 31, 2011, 2010, 2009, 2008 and 2007, respectively. The net expenses ratios excluding dividends and other expenses related to short sales are also calculated without reduction for these fees paid indirectly for expense offset arrangements. |
| 5 | This expense decrease is reflected in both the net expense and the net investment income (loss) ratios shown above. |
See Notes which are an integral part of the Financial Statements
Annual Shareholder Report15
Statement of Assets and Liabilities
October 31, 2011
| Assets: | | |
| Total investments in securities, at value including $417,336,141 of securities loaned and $1,455,297,695 of investments in affiliated holdings (Note 5) (identified cost $5,179,042,030) | | $6,270,691,868 |
| Cash | | 46,626 |
| Cash denominated in foreign currencies (identified cost $27,051,711) | | 27,081,040 |
| Income receivable | | 1,439,019 |
| Receivable for investments sold | | 54,724,417 |
| Receivable for shares sold | | 2,966,156 |
| TOTAL ASSETS | | 6,356,949,126 |
| Liabilities: | | |
| Payable to adviser (Note 5) | $1,872 | |
| Payable for investments purchased | 95,832,444 | |
| Payable for shares redeemed | 12,719,404 | |
| Unrealized depreciation on foreign exchange contracts | 4,826 | |
| Payable for collateral due to broker for securities lending | 443,574,449 | |
| Payable for capital gains taxes withheld | 1,251,666 | |
| Payable for Directors'/Trustees' fees | 4,406 | |
| Payable for distribution services fee (Note 5) | 939,308 | |
| Payable for shareholder services fee (Note 5) | 2,810,753 | |
| Accrued expenses | 2,719,078 | |
| TOTAL LIABILITIES | | 559,858,206 |
| Net assets for 1,187,057,229 shares outstanding | | $5,797,090,920 |
| Net Assets Consist of: | | |
| Paid-in capital | | $4,637,754,339 |
| Net unrealized appreciation of investments and translation of assets and liabilities in foreign currency | | 1,091,464,875 |
| Accumulated net realized gain on investments, futures contracts, written options and foreign currency transactions | | 67,871,706 |
| TOTAL NET ASSETS | | $5,797,090,920 |
Annual Shareholder Report16
Statement of Assets and Liabilities — continued| Net Asset Value, Offering Price and Redemption Proceeds Per Share | | |
| Class A Shares: | | |
| Net asset value per share ($1,999,939,919 ÷ 406,264,232 shares outstanding), no par value, unlimited shares authorized | | $4.92 |
| Offering price per share (100/94.50 of $4.92) | | $5.21 |
| Redemption proceeds per share | | $4.92 |
| Class B Shares: | | |
| Net asset value per share ($301,468,796 ÷ 64,967,410 shares outstanding), no par value, unlimited shares authorized | | $4.64 |
| Offering price per share | | $4.64 |
| Redemption proceeds per share (94.50/100 of $4.64) | | $4.38 |
| Class C Shares: | | |
| Net asset value per share ($494,456,897 ÷ 106,588,582 shares outstanding), no par value, unlimited shares authorized | | $4.64 |
| Offering price per share | | $4.64 |
| Redemption proceeds per share (99/100 of $4.64) | | $4.59 |
| Class R Shares: | | |
| Net asset value per share ($3,001,225,308 ÷ 609,237,005 shares outstanding), no par value, unlimited shares authorized | | $4.93 |
| Offering price per share | | $4.93 |
| Redemption proceeds per share (99.80/100 of $4.93) | | $4.92 |
See Notes which are an integral part of the Financial Statements
Annual Shareholder Report17
Statement of Operations
Year Ended October 31, 2011
| Investment Income: | | | |
| Dividends (including $4,596,221 received from affiliated holdings (Note 5)) | | | $59,344,861 |
| Interest (including $1,399,956 received from affiliated holdings (Note 5) and income on securities loaned of $5,446,032) | | | 7,026,472 |
| TOTAL INCOME | | | 66,371,333 |
| Expenses: | | | |
| Investment adviser fee (Note 5) | | $97,739,359 | |
| Administrative fee (Note 5) | | 5,358,022 | |
| Custodian fees | | 4,077,593 | |
| Transfer and dividend disbursing agent fees and expenses (Note 2) | | 11,112,992 | |
| Directors'/Trustees' fees | | 60,294 | |
| Auditing fees | | 36,624 | |
| Legal fees | | 4,609 | |
| Portfolio accounting fees | | 208,735 | |
| Distribution services fee (Note 5) | | 31,007,015 | |
| Shareholder services fee (Note 5) | | 17,022,357 | |
| Account administration fee (Note 2) | | 49,135 | |
| Share registration costs | | 93,991 | |
| Printing and postage | | 543,942 | |
| Insurance premiums | | 18,872 | |
| Miscellaneous | | 75,844 | |
| TOTAL EXPENSES | | 167,409,384 | |
Annual Shareholder Report18
Statement of Operations — continued| Waivers, Reimbursements and Reduction: | | | |
| Waiver/reimbursement of investment adviser fee (Note 5) | $(10,288,354) | | |
| Waiver of administrative fee (Note 5) | (138,398) | | |
| Waiver of distribution services fee (Note 5) | (16,933,234) | | |
| Reimbursement of shareholder services fee (Note 5) | (322,861) | | |
| Fees paid indirectly from directed brokerage arrangements (Note 6) | (65,729) | | |
| TOTAL WAIVERS, REIMBURSEMENTS AND REDUCTION | | $(27,748,576) | |
| Net expenses | | | $139,660,808 |
| Net investment income (loss) | | | (73,289,475) |
| Realized and Unrealized Gain (Loss) on Investments and Foreign Currency Transactions: | | | |
| Net realized gain on investments and foreign currency (including realized gain of $195,253,848 on sale of investments in affiliated holdings (Note 5)) | | | 845,883,977 |
| Net change in unrealized appreciation of investments and translation of assets and liabilities in foreign currency | | | (1,116,013,448) |
| Net realized and unrealized loss on investments and foreign currency transactions | | | (270,129,471) |
| Change in net assets resulting from operations | | | $(343,418,946) |
See Notes which are an integral part of the Financial Statements
Annual Shareholder Report19
Statement of Changes in Net Assets
| Year Ended October 31 | 2011 | 2010 |
| Increase (Decrease) in Net Assets | | |
| Operations: | | |
| Net investment income (loss) | $(73,289,475) | $19,701,396 |
| Net realized gain on investments and foreign currency transactions | 845,883,977 | 253,892,900 |
| Net change in unrealized appreciation/depreciation of investments and translation of assets and liabilities in foreign currency | (1,116,013,448) | 1,256,013,974 |
| CHANGE IN NET ASSETS RESULTING FROM OPERATIONS | (343,418,946) | 1,529,608,270 |
| Distributions to Shareholders: | | |
| Distributions from net investment income | | |
| Class A Shares | (15,556,814) | (4,293,307) |
| Class B Shares | (253,171) | — |
| Class C Shares | (803,794) | — |
| Class R Shares | (22,840,571) | (6,296,827) |
| Distributions from net realized gain on investments | | |
| Class A Shares | (19,173) | — |
| Class B Shares | (312) | — |
| Class C Shares | (991) | — |
| Class R Shares | (28,151) | — |
| CHANGE IN NET ASSETS RESULTING FROM DISTRIBUTIONS TO SHAREHOLDERS | (39,502,977) | (10,590,134) |
| Share Transactions: | | |
| Proceeds from sale of shares | 763,905,692 | 758,063,276 |
| Net asset value of shares issued to shareholders in payment of distributions declared | 36,595,371 | 9,822,517 |
| Cost of shares redeemed | (1,865,805,782) | (1,582,655,103) |
| CHANGE IN NET ASSETS RESULTING FROM SHARE TRANSACTIONS | (1,065,304,719) | (814,769,310) |
| Change in net assets | (1,448,226,642) | 704,248,826 |
| Net Assets: | | |
| Beginning of period | 7,245,317,562 | 6,541,068,736 |
| End of period (including undistributed net investment income of $0 and $10,346,338, respectively) | $5,797,090,920 | $7,245,317,562 |
See Notes which are an integral part of the Financial Statements
Annual Shareholder Report20
Notes to Financial Statements
October 31, 2011
1. ORGANIZATION
Federated Equity Funds (the “Trust”) is registered under the Investment Company Act of 1940, as amended (the “Act”), as an open-end management investment company. The Trust consists of 13 portfolios. The financial statements included herein are only those of Federated Kaufmann Fund (the “Fund”), a diversified portfolio. The financial statements of the other portfolios are presented separately. The assets of each portfolio are segregated and a shareholder's interest is limited to the portfolio in which shares are held. Each portfolio pays its own expenses. The Fund offers four classes of shares: Class A Shares, Class B Shares, Class C Shares and Class R Shares. All shares of the Fund have equal rights with respect to voting, except on class-specific matters. The financial highlights of the Class A Shares, Class B Shares and Class C Shares are presented separately. The investment objective of the Fund is to provide capital appreciation.
2. SIGNIFICANT ACCOUNTING POLICIES
The following is a summary of significant accounting policies consistently followed by the Fund in the preparation of its financial statements. These policies are in conformity with U.S. generally accepted accounting principles (GAAP).
Investment Valuation
In calculating its net asset value (NAV), the Fund generally values investments as follows:
- Equity securities listed on an exchange or traded through a regulated market system are valued at their last reported sale price or official closing price in their principal exchange or market.
- Shares of other mutual funds are valued based upon their reported NAVs.
- Fixed-income securities acquired with remaining maturities greater than 60 days are fair valued using price evaluations provided by a pricing service approved by the Trustees.
- Fixed-income securities acquired with remaining maturities of 60 days or less are valued at their cost (adjusted for the accretion of any discount or amortization of any premium), which approximates market value.
- Derivative contracts listed on exchanges are valued at their reported settlement or closing price.
- Over-the-counter (OTC) derivative contracts are fair valued using price evaluations provided by a pricing service approved by the Trustees.
- For securities that are fair valued in accordance with procedures established by and under the general supervision of the Trustees, certain factors may be considered such as: the purchase price of the security, information obtained by contacting the issuer, analysis of the issuer's financial statements or other available documents, fundamental analytical data, the nature and duration of restrictions on disposition, the movement of the market in which the security is normally traded and public trading in similar securities of the issuer or comparable issuers.
Annual Shareholder Report
21
If the Fund cannot obtain a price or price evaluation from a pricing service for an investment, the Fund may attempt to value the investment based upon the mean of bid and asked quotations or fair value the investment based on price evaluations from one or more dealers. If any price, quotation, price evaluation or other pricing source is not readily available when the NAV is calculated, the Fund uses the fair value of the investment determined in accordance with the procedures described below. There can be no assurance that the Fund could purchase or sell an investment at the price used to calculate the Fund's NAV.Fair Valuation and Significant Events Procedures
The Trustees have authorized the use of pricing services to provide evaluations of the current fair value of certain investments for purposes of calculating the NAV. Factors considered by pricing services in evaluating an investment include the yields or prices of investments of comparable quality, coupon, maturity, call rights and other potential prepayments, terms and type, reported transactions, indications as to values from dealers and general market conditions. Some pricing services provide a single price evaluation reflecting the bid-side of the market for an investment (a “bid” evaluation). Other pricing services offer both bid evaluations and price evaluations indicative of a price between the prices bid and asked for the investment (a “mid” evaluation). The Fund normally uses bid evaluations for U.S. Treasury and Agency securities. The Fund normally uses mid evaluations for other types of fixed-income securities and OTC derivative contracts. In the event that market quotations and price evaluations are not available for an investment, the fair value of the investment is determined in accordance with procedures adopted by the Trustees.
The Trustees also have adopted procedures requiring an investment to be priced at its fair value whenever the Adviser determines that a significant event affecting the value of the investment has occurred between the time as of which the price of the investment would otherwise be determined and the time as of which the NAV is computed. An event is considered significant if there is both an affirmative expectation that the investment's value will change in response to the event and a reasonable basis for quantifying the resulting change in value. Examples of significant events that may occur after the close of the principal market on which a security is traded, or after the time of a price evaluation provided by a pricing service or a dealer, include:
- With respect to securities traded in foreign markets, significant trends in U.S. equity markets or in the trading of foreign securities index futures or options contracts;
- With respect to price evaluations of fixed-income securities determined before the close of regular trading on the NYSE, actions by the Federal Reserve Open Market Committee and other significant trends in U.S. fixed-income markets;
- Political or other developments affecting the economy or markets in which an issuer conducts its operations or its securities are traded; and
- Announcements concerning matters such as acquisitions, recapitalizations, litigation developments, a natural disaster affecting the issuer's operations or regulatory changes or market developments affecting the issuer's industry.
The Trustees have approved the use of a pricing service to determine the fair value of equity securities traded principally in foreign markets when the Adviser determines that there has been a significant trend in the U.S. equity markets or in index futures trading. For other significant events, the Fund may seek to obtain more current quotations or price evaluations from alternative pricing sources. If a reliable alternative pricing source is not available, the Fund will determine the fair value of the investment using another method approved by the Trustees.
Annual Shareholder Report
22
Repurchase AgreementsThe Fund may invest in repurchase agreements for short-term liquidity purposes. It is the policy of the Fund to require the other party to a repurchase agreement to transfer to the Fund's custodian or sub-custodian eligible securities or cash with a market value (after transaction costs) at least equal to the repurchase price to be paid under the repurchase agreement. The eligible securities are transferred to accounts with the custodian or sub-custodian in which the Fund holds a “securities entitlement” and exercises “control” as those terms are defined in the Uniform Commercial Code. The Fund has established procedures for monitoring the market value of the transferred securities and requiring the transfer of additional eligible securities if necessary to equal at least the repurchase price. These procedures also allow the other party to require securities to be transferred from the account to the extent that their market value exceeds the repurchase price or in exchange for other eligible securities of equivalent market value.
The insolvency of the other party or other failure to repurchase the securities may delay the disposition of the underlying securities or cause the Fund to receive less than the full repurchase price. Under the terms of the repurchase agreement, any amounts received by the Fund in excess of the repurchase price and related transaction costs must be remitted to the other party.
The Fund may enter into repurchase agreements in which eligible securities are transferred into joint trading accounts maintained by the custodian or sub-custodian for investment companies and other clients advised by the Fund's Adviser and its affiliates. The Fund will participate on a pro rata basis with the other investment companies and clients in its share of the securities transferred under such repurchase agreements and in its share of proceeds from any repurchase or other disposition of such securities.
Investment Income, Gains and Losses, Expenses and Distributions
Investment transactions are accounted for on a trade-date basis. Realized gains and losses from investment transactions are recorded on an identified-cost basis. Interest income and expenses are accrued daily. Dividend income and distributions to shareholders are recorded on the ex-dividend date. Foreign dividends are recorded on the ex-dividend date or when the Fund is informed of the ex-dividend date. Distributions of net investment income, if any, are declared and paid annually. Non-cash dividends included in dividend income, if any, are recorded at fair value. Investment income, realized and unrealized gains and losses, and certain fund-level expenses are allocated to each class based on relative average daily net assets, except that Class A Shares, Class B Shares, Class C Shares and Class R Shares may bear distribution services fees, shareholder services fees, account administration fees and certain transfer and dividend disbursing agent fees unique to those classes. For the year ended October 31, 2011, transfer and dividend disbursing agent fees and account administration fees for the Fund were as follows:
| Transfer and
Dividend
Disbursing
Agent Fees
Incurred | Account
Administration
Fees Incurred |
| Class A Shares | $3,728,189 | $32,637 |
| Class B Shares | 641,161 | — |
| Class C Shares | 988,061 | 2,662 |
Annual Shareholder Report23
| Transfer and
Dividend
Disbursing
Agent Fees
Incurred | Account
Administration
Fees Incurred |
| Class R Shares | 5,755,581 | 13,836 |
| TOTAL | $11,112,992 | $49,135 |
Dividends are declared separately for each class. No class has preferential dividend rights; differences in per share dividend rates are generally due to differences in separate class expenses.
Premium and Discount Amortization
All premiums and discounts on fixed-income securities are amortized/accreted using the effective interest rate method.
Federal Taxes
It is the Fund's policy to comply with the Subchapter M provision of the Internal Revenue Code and to distribute to shareholders each year substantially all of its income. Accordingly, no provision for federal income tax is necessary. As of and during the year ended October 31, 2011, the Fund did not have a liability for any uncertain tax positions. The Fund recognizes interest and penalties, if any, related to tax liabilities as income tax expense in the Statement of Operations. As of October 31, 2011, tax years 2008 through 2011 remain subject to examination by the Fund's major tax jurisdictions, which include the United States of America and the Commonwealth of Massachusetts.
The Fund may be subject to taxes imposed by governments of countries in which it invests. Such taxes are generally based on either income or gains earned or repatriated. The Fund accrues and applies such taxes to net investment income, net realized gains and net unrealized gains as income and/or gains are earned.
When-Issued and Delayed Delivery Transactions
The Fund may engage in when-issued or delayed delivery transactions. The Fund records when-issued securities on the trade date and maintains security positions such that sufficient liquid assets will be available to make payment for the securities purchased. Securities purchased on a when-issued or delayed delivery basis are marked to market daily and begin earning interest on the settlement date. Losses may occur on these transactions due to changes in market conditions or the failure of counterparties to perform under the contract.
Foreign Exchange Contracts
The Fund enters into foreign exchange contracts for the delayed delivery of securities or foreign currency exchange transactions. The Fund enters into foreign exchange contracts to protect assets against adverse changes in foreign currency exchange rates or exchange control regulations. Purchased contracts are used to acquire exposure to foreign currencies, whereas, contracts to sell are used to hedge the Fund's securities against currency fluctuations. Risks may arise upon entering into these transactions from the potential inability of counterparties to meet the terms of their commitments and from unanticipated movements in security prices or foreign exchange rates. The foreign exchange contracts are adjusted by the daily exchange rate of the underlying currency and any gains or losses are recorded for financial statement purposes as unrealized until the settlement date.
Annual Shareholder Report
24
Foreign exchange contracts outstanding at period end are listed after the Fund's Portfolio of Investments.The average value at settlement date payable and receivable of foreign exchange contracts purchased and sold by the Fund throughout the period was $17,937 and $8,281, respectively. This is based on the contracts held as of each month-end throughout the fiscal period.
Foreign Currency Translation
The accounting records of the Fund are maintained in U.S. dollars. All assets and liabilities denominated in foreign currencies (FCs) are translated into U.S. dollars based on the rates of exchange of such currencies against U.S. dollars on the date of valuation. Purchases and sales of securities, income and expenses are translated at the rate of exchange quoted on the respective date that such transactions are recorded. The Fund does not isolate that portion of the results of operations resulting from changes in foreign exchange rates on investments from the fluctuations arising from changes in market prices of securities held. Such fluctuations are included with the net realized and unrealized gain or loss from investments.
Reported net realized foreign exchange gains or losses arise from sales of portfolio securities, sales and maturities of short-term securities, sales of FCs, currency gains or losses realized between the trade and settlement dates on securities transactions, the difference between the amounts of dividends, interest and foreign withholding taxes recorded on the Fund's books, and the U.S. dollar equivalent of the amounts actually received or paid. Net unrealized foreign exchange gains and losses arise from changes in the value of assets and liabilities other than investments in securities at fiscal year end, resulting from changes in the exchange rate.
Securities Lending
The Fund participates in a securities lending program providing for the lending of equity securities to qualified brokers. The Fund normally receives cash collateral for securities loaned that is invested in an affiliated money market fund or in short-term securities including repurchase agreements. Collateral is maintained at a minimum level of 100% of the market value of investments loaned, plus interest, if applicable. Earnings on collateral are allocated between the securities lending agent, as a fee for its services under the program, and the Fund, according to agreed-upon rates.
As of October 31, 2011, securities subject to this type of arrangement and related collateral were as follows:
Market Value of
Securities Loaned | Market Value
of Collateral |
| $417,336,141 | $443,574,449 |
Short Sales
In a short sale, the Find sells a security it does not own in anticipation of a decline in the fair market value of the security. When the Fund sells a security short, it must borrow the security in order to deliver it at the completion of the sale. A gain, limited to the price at which the Fund sold the security short, or a loss, unlimited in size, will be recognized upon the termination of the short sale.
Annual Shareholder Report
25
The Fund has an obligation to replace the borrowed security (e.g., to purchase the security at a future date and deliver it to the lender of the security). While the security is borrowed, the proceeds from the sale are deposited with the lender (“Prime Broker”). The Fund may incur two types of expenses from short sales: borrowing expenses and dividend expenses. Borrowing expenses may occur because the Fund may be obligated to pay fees to the Prime Broker on borrowed securities. This fee is normally based upon the market value of the borrowed security and is dependent upon the availablity of the security. Dividend expenses may occur because the Fund has to pay the Prime Broker the equivalent of any dividends earned on the borrowed security.Restricted Securities
The Fund may purchase securities which are considered restricted. Restricted securities are securities that either: (a) cannot be offered for public sale without first being registered, or being able to take advantage of an exemption from registration, under the Securities Act of 1933; or (b) are subject to contractual restrictions on public sales. In some cases, when a security cannot be offered for public sale without first being registered, the issuer of the restricted security has agreed to register such securities for resale, at the issuer's expense, either upon demand by the Fund or in connection with another registered offering of the securities. Many such restricted securities may be resold in the secondary market in transactions exempt from registration. Restricted securities may be determined to be liquid under criteria established by the Trustees. The Fund will not incur any registration costs upon such resales. The Fund's restricted securities are valued at the price provided by dealers in the secondary market or, if no market prices are available, at the fair value as determined in accordance with procedures established by and under the general supervision of the Trustees.
Additional information on restricted securities, excluding securities purchased under Rule 144A, if applicable, that have been deemed liquid by the Trustees, held at October 31, 2011, is as follows:
| Security | Acquisition Date | Cost | Market Value |
| Apollo Investment Fund V | 5/18/2001 | $0 | $4,106,516 |
| Conceptus, Inc. | 8/11/2005 | $4,500,000 | $7,200,000 |
| Conceptus, Inc. | 4/10/2001 | $5,000,000 | $8,228,575 |
| Cortek, Inc. | 2/29/2000 | $0 | $0 |
| Cortek, Inc., Conv. Pfd., Series D2 | 3/31/2003 | $0 | $0 |
| Cortex, Inc., Pfd., Series D | 6/18/2001 | $0 | $0 |
| Denovo Ventures I LP | 3/9/2000 | $2,888,396 | $1,068,278 |
| Expand Networks Ltd. | 9/22/2000 | $2,500,000 | $0 |
| FA Private Equity Fund IV LP | 3/4/2002 | $439,044 | $821,287 |
| Infrastructure Fund | 8/11/2000 | $404,496 | $0 |
| Latin Healthcare Fund | 11/28/2000 | $0 | $335,009 |
| Multiplex, Inc., Pfd., Series C | 2/22/2001 | $5,000,001 | $0 |
| Peachtree Leadscope LLC, Class A and B | 6/30/2000 | $712,054 | $0 |
| Peachtree Leadscope LLC, Class C | 4/30/2002 | $3,000,000 | $3,250,000 |
| Peachtree Open Networks | 10/5/2000 | $892,599 | $0 |
| Peachtree Velquest | 9/14/2000 | $494,382 | $247,191 |
| Sensable Technologies, Inc. | 10/15/2004 | $0 | $0 |
Annual Shareholder Report26
Additional Disclosure Related to Derivative Instruments
| Fair Value of Derivative Instruments |
| | | Liability |
| | | Statement of
Assets and
Liabilities
Location | Fair
Value |
| Derivatives not accounted for as hedging instruments under ASC Topic 815 | | | |
| Foreign exchange contracts | | | Unrealized depreciation on foreign exchange contracts | $4,826 |
The Effect of Derivative Instruments on the Statement of Operations for the Year Ended October 31, 2011
| Amount of Realized Gain or (Loss) on Derivatives Recognized in Income |
| Forward
Currency
Contracts |
| Foreign exchange contracts | $(1,347,453) |
| Change in Unrealized Appreciation or (Depreciation) on Derivatives Recognized in Income |
| Forward
Currency
Contracts |
| Foreign exchange contracts | $48,699 |
Other
The preparation of financial statements in conformity with GAAP requires management to make estimates and assumptions that affect the amounts of assets, liabilities, expenses and revenues reported in the financial statements. Actual results could differ from those estimated.
3. SHARES OF BENEFICIAL INTEREST
The following tables summarize share activity:
| Year Ended October 31 | 2011 | 2010 |
| Class A Shares: | Shares | Amount | Shares | Amount |
| Shares sold | 98,824,715 | $516,747,402 | 108,384,912 | $510,485,496 |
| Shares issued to shareholders in payment of distributions declared | 2,507,026 | 13,688,361 | 801,053 | 3,756,940 |
| Shares redeemed | (163,851,163) | (870,540,365) | (150,272,322) | (709,884,481) |
NET CHANGE RESULTING FROM
CLASS A SHARE TRANSACTIONS | (62,519,422) | $(340,104,602) | (41,086,357) | $(195,642,045) |
Annual Shareholder Report27
| Year Ended October 31 | 2011 | 2010 |
| Class B Shares: | Shares | Amount | Shares | Amount |
| Shares sold | 3,793,204 | $19,214,651 | 4,936,393 | $22,093,225 |
| Shares issued to shareholders in payment of distributions declared | 44,017 | 227,570 | — | — |
| Shares redeemed | (34,331,522) | (172,846,233) | (50,285,191) | (223,072,532) |
NET CHANGE RESULTING FROM
CLASS B SHARE TRANSACTIONS | (30,494,301) | $(153,404,012) | (45,348,798) | $(200,979,307) |
| Year Ended October 31 | 2011 | 2010 |
| Class C Shares: | Shares | Amount | Shares | Amount |
| Shares sold | 9,418,288 | $47,966,563 | 13,712,395 | $61,221,439 |
| Shares issued to shareholders in payment of distributions declared | 122,226 | 631,908 | — | — |
| Shares redeemed | (39,974,916) | (201,008,903) | (40,828,794) | (182,157,622) |
NET CHANGE RESULTING FROM
CLASS C SHARE TRANSACTIONS | (30,434,402) | $(152,410,432) | (27,116,399) | $(120,936,183) |
| Year Ended October 31 | 2011 | 2010 |
| Class R Shares: | Shares | Amount | Shares | Amount |
| Shares sold | 33,245,133 | $179,977,076 | 34,634,870 | $164,263,116 |
| Shares issued to shareholders in payment of distributions declared | 4,030,627 | 22,047,532 | 1,293,247 | 6,065,577 |
| Shares redeemed | (115,185,739) | (621,410,281) | (98,552,433) | (467,540,468) |
NET CHANGE RESULTING FROM
CLASS R SHARE TRANSACTIONS | (77,909,979) | $(419,385,673) | (62,624,316) | $(297,211,775) |
NET CHANGE RESULTING FROM
TOTAL FUND SHARE TRANSACTIONS | (201,358,104) | $(1,065,304,719) | (176,175,870) | $(814,769,310) |
Redemption Fee
The Fund's Class R Shares impose a redemption fee of 0.20% on the redemption price of the Fund's Class R Shares redeemed, if such shares were purchased after February 1, 1985. The redemption fee is applied to the Fund's Class R Shares expenses for providing redemption services, including, but not limited to: transfer agent fees; postage; printing; telephone; and related employment costs. Any excess fee proceeds are added to the Fund's assets. Shares acquired through employer-sponsored retirement plans will not be subject to the redemption fee. However, if shares are purchased for a retirement plan account through a broker, financial institution or other intermediary maintaining an omnibus account for the shares, the waiver may not apply. In addition, this waiver does not apply to individual retirement accounts, such as Traditional, Roth and SEP-IRAs. For the years ended October 31, 2011 and October 31, 2010, redemption fees of $39,177 and $55,592, were imposed to cover the cost of redemptions.
Annual Shareholder Report
28
4. FEDERAL TAX INFORMATIONThe timing and character of income and capital gain distributions are determined in accordance with income tax regulations, which may differ from GAAP. These differences are due to differing treatments for foreign currency transactions, passive foreign investment company gains and losses, partnership adjustments, reclassification for regulatory settlement proceeds, discount accretion/premium amortization on debt securities and net operating losses.
For the year ended October 31, 2011, permanent differences identified and reclassified among the components of net assets were as follows:
| Increase (Decrease) |
| Paid-In Capital | Undistributed
Net Investment
Income (Loss) | Accumulated
Net Realized
Gain (Loss) |
| $(71,386,316) | $102,397,487 | $(31,011,171) |
Net investment income (loss), net realized gains (losses) and net assets were not affected by this reclassification.
The tax character of distributions as reported on the Statement of Changes in Net Assets for the years ended October 31, 2011 and 2010, was as follows:
| 2011 | 2010 |
| Ordinary income | $39,454,350 | $10,590,134 |
| Long-term capital gains | $48,627 | $ — |
As of October 31, 2011, the components of distributable earnings on a tax basis were as follows:
| Undistributed capital gains | $109,954,043 |
| Net unrealized appreciation | $1,049,382,538 |
The difference between book-basis and tax-basis net unrealized appreciation/depreciation is attributable to differing treatments for the deferral of losses on wash sales and partnership adjustments.
At October 31, 2011, the cost of investments for federal tax purposes was $5,219,872,701. The net unrealized appreciation of investments for federal tax purposes excluding any unrealized appreciation/depreciation resulting from changes in foreign currency exchange rates and outstanding foreign currency commitments was $1,050,819,167. This consists of net unrealized appreciation from investments for those securities having an excess of value over cost of $1,299,595,863 and net unrealized depreciation from investments for those securities having an excess of cost over value of $248,776,696.
The Fund used capital loss carryforwards of $704,260,190 to offset taxable capital gains realized during the year ended October 31, 2011.
Annual Shareholder Report
29
5. INVESTMENT ADVISER FEE AND OTHER TRANSACTIONS WITH AFFILIATESInvestment Adviser Fee
Federated Equity Management Company of Pennsylvania is the Fund's investment adviser (the “Adviser”). The advisory agreement between the Fund and the Adviser provides for an annual fee equal to 1.425% of the Fund's average daily net assets. Pursuant to the settlement of certain litigation the Adviser has agreed, for a period continuing until June 30, 2022, to waive its investment advisory fee so that such fee will not exceed 1.275%. Also as part of the settlement agreement, effective July 1, 2012 and continuing until June 30, 2022, the Adviser has agreed to further waive the advisory fee by an additional 0.02%, 0.04%, 0.06% or 0.07% if the Fund's net assets exceed eight, nine, ten or twelve billion dollars, respectively. Subject to the terms described in the Expense Limitation note, the Adviser may voluntarily choose to waive any portion of its fee. For the year ended October 31, 2011, the Adviser voluntarily waived $9,866,985 of its fee.
Certain of the Fund's assets are managed by Federated Global Investment Management Corp. (the “Sub-Adviser”). Under the terms of a sub-advisory agreement between the Adviser and the Sub-Adviser, the Sub-Adviser receives an allocable portion of the Fund's adviser fee. The fee is paid by the Adviser out of its resources and is not an incremental Fund expense. For the year ended October 31, 2011, the Sub-Adviser earned a fee of $80,592,103.
Administrative Fee
Federated Administrative Services (FAS), under the Administrative Services Agreement, provides the Fund with administrative personnel and services. The fee paid to FAS is based on the average aggregate daily net assets of certain Federated funds as specified below:
| Administrative Fee | Average Aggregate Daily Net Assets
of the Federated Funds |
| 0.150% | on the first $5 billion |
| 0.125% | on the next $5 billion |
| 0.100% | on the next $10 billion |
| 0.075% | on assets in excess of $20 billion |
The administrative fee received during any fiscal year shall be at least $150,000 per portfolio and $40,000 per each additional class of Shares. Subject to the terms described in the Expense Limitation note, FAS may voluntarily choose to waive any portion of its fee. For the year ended October 31, 2011, the net fee paid to FAS was 0.076% of average daily net assets of the Fund. FAS waived $138,398 of its fee.
Annual Shareholder Report
30
Distribution Services Fee
The Fund has adopted a Distribution Plan (the “Plan”) pursuant to Rule 12b-1 under the Act. Under the terms of the Plan, the Fund will compensate Federated Securities Corp. (FSC), the principal distributor, from the daily net assets of the Fund's Class A Shares, Class B Shares, Class C Shares and Class R Shares to finance activities intended to result in the sale of these shares. The Plan provides that the Fund may incur distribution expenses at the following percentages of average daily net assets annually, to compensate FSC:
| Share Class Name | Percentage of Average Daily
Net Assets of Class |
| Class A Shares | 0.25% |
| Class B Shares | 0.75% |
| Class C Shares | 0.75% |
| Class R Shares | 0.50% |
Subject to the terms described in the Expense Limitation note, FSC may voluntarily choose to waive any portion of its fee. For the year ended October 31, 2011, distribution services fees for the Fund were as follows:
| Distribution Services
Fees Incurred | Distribution Services
Fees Waived |
| Class A Shares | $5,854,477 | $(3,005,236) |
| Class B Shares | 3,035,838 | — |
| Class C Shares | 4,665,100 | (483,536) |
| Class R Shares | 17,451,600 | (13,444,462) |
| TOTAL | $31,007,015 | $(16,933,234) |
When FSC receives fees, it may pay some or all of them to financial intermediaries whose customers purchase shares. For the year ended October 31, 2011, FSC retained $5,270,581 of fees paid by the Fund.
Sales Charges
Front-end sales charges and contingent deferred sales charges (CDSC) do not represent expenses of the Fund. They are deducted from the proceeds of sales of Fund shares prior to investment or from redemption proceeds prior to remittance, as applicable. For the year ended October 31, 2011, FSC retained $139,419 in sales charges from the sale of Class A Shares. FSC also retained $2,550 of CDSC relating to redemptions of Class A Shares, $64,397 relating to redemption of Class B Shares and $6,470 relating to redemptions of Class C Shares.
Annual Shareholder Report
31
Shareholder Services Fee
The Fund may pay fees (“Service Fees”) up to 0.25% of the average daily net assets of the Fund's Class A Shares, Class B Shares, Class C Shares and Class R Shares to financial intermediaries or to Federated Shareholder Services Company (FSSC) for providing services to shareholders and maintaining shareholder accounts. Financial intermediaries may include a company affiliated with management of Federated Investors, Inc. A financial intermediary affiliated with management of Federated Investors, Inc. received $17,617 of Service Fees for the year ended October 31, 2011. Subject to the terms described in the Expense Limitation note, FSSC may voluntarily reimburse the Fund for Service Fees. For the year ended October 31, 2011, Service Fees for the Fund were as follows:
| Service
Fees
Incurred | Service
Fees
Reimbursed |
| Class A Shares | $5,782,608 | $ — |
| Class B Shares | 1,011,946 | (322,861) |
| Class C Shares | 1,538,590 | — |
| Class R Shares | 8,689,213 | — |
| TOTAL | $17,022,357 | $(322,861) |
For the year ended October 31, 2011, FSSC received $5,001,577 of fees paid by the Fund.
Commitments and Contingencies
In the course of pursuing its investment objective, the Fund sometimes invests in limited partnerships and limited liability companies. These entities often require the Fund to commit to a total dollar amount to be invested. The actual investments are usually made in installments over a period of time. At October 31, 2011, the Fund had total commitments to limited partnerships and limited liability companies of $35,173,400; of this amount, $34,044,996 was actually invested by the Fund leaving the Fund contingently liable for additional investments of $1,128,404.
Expense Limitation
The Adviser and its affiliates (which may include FSC, FAS and FSSC) have voluntarily agreed to waive their fees and/or reimburse expenses so that the total annual fund operating expenses (as shown in the financial highlights, excluding dividends and other expenses related to short sales) paid by the Fund's Class A Shares, Class B Shares, Class C Shares and Class R Shares (after the voluntary waivers and/or reimbursements) will not exceed 1.95%, 2.50%, 2.50% and 1.95% (the “Fee Limit”), respectively, up to but not including the later of (the “Termination Date”): (a) January 1, 2013; or (b) the date of the Fund's next effective Prospectus. While the Adviser and its affiliates currently do not anticipate terminating or increasing these arrangements prior to the Termination Date, these arrangements may only be terminated or the Fee Limit increased prior to the Termination Date with the agreement of the Trustees.
Interfund Transactions
During the year ended October 31, 2011, the Fund engaged in purchase and sale transactions with funds that have a common investment adviser (or affiliated investment advisers), common Directors/Trustees and/or common Officers. These purchase and sale transactions complied with Rule 17a-7 under the Act and amounted to $3,708,509 and $28,367,096, respectively.
Annual Shareholder Report
32
GeneralCertain Officers and Trustees of the Fund are Officers and Directors or Trustees of the above companies.
Transactions Involving Affiliated Companies and Affiliated Holdings
An affiliated company is a company in which the Fund has ownership of at least 5% of the voting shares. Transactions with affiliated companies during the year ended October 31, 2011, were as follows:
| Affiliates | Balance of
Shares Held
10/31/2010 | Purchases/
Additions | Sales/
Reductions | Balance of
Shares Held
10/31/2011 | Value | Dividend/
Interest
Income |
| Alkermes, Inc. | 9,722,273 | 5,818,897 | 9,722,273 | 5,818,897 | $101,772,509 | $ — |
| *Auxilium Pharmaceuticals, Inc. | 3,093,592 | — | 3,093,592 | — | — | — |
| *Brasil Brokers Participacoes | 9,858,127 | — | 9,858,127 | — | — | 514,048 |
| *Cbeyond Communications, Inc. | 1,771,638 | — | 1,771,638 | — | — | — |
| CETIP SA | 22,772,799 | 2,381,201 | 3,514,000 | 21,640,000 | 298,726,155 | 2,392,688 |
| *Conceptus, Inc. | 3,634,700 | — | 3,634,700 | — | — | — |
| Conceptus, Inc. | 625,000 | — | — | 625,000 | 7,200,000 | — |
| Conceptus, Inc. | 714,286 | — | — | 714,286 | 8,228,575 | — |
| Conceptus, Inc. | 600,000 | — | 213,826 | 386,174 | 4,448,724 | — |
| Cubist Pharmaceuticals, Inc. | 7,008,000 | — | 2,758,000 | 4,250,000 | 160,692,500 | — |
| Dexcom, Inc. | 4,916,800 | — | 1,199,176 | 3,717,624 | 36,395,539 | — |
| Dexcom, Inc. | 126,065 | — | — | 126,065 | 1,234,176 | — |
| Dyax Corp. | 12,850,000 | 2,350,000 | — | 15,200,000 | 20,520,000 | — |
| *Endologix, Inc. | 5,198,050 | — | 5,198,050 | — | — | — |
| *Endologix, Inc. | 3,555,556 | — | 3,555,556 | — | — | — |
| ExamWorks Group Inc. | 2,227,383 | 772,617 | — | 3,000,000 | 31,650,000 | — |
| Insulet Corp. | 2,672,070 | 144,100 | 981,299 | 1,834,871 | 29,945,095 | — |
| Insulet Corp., Conv. Bond, 5.375, 6/15/2013 | 27,670,000 | — | 15,000,000 | 12,670,000 | 13,892,909 | 1,214,033 |
| Insulet Corp., Conv. Bond, 3.75, 6/15/2016 | — | 14,630,000 | — | 14,630,000 | 13,803,829 | 185,923 |
| Progenics Pharmaceuticals, Inc. | 5,246,193 | — | — | 5,246,193 | 34,467,488 | — |
| Protalix Biotherapeutics, Inc. | 3,000,000 | 2,400,000 | — | 5,400,000 | 32,994,000 | — |
| Repligen Corp. | 2,998,043 | — | — | 2,998,043 | 10,283,287 | — |
| Restoque Comercio e Confeccoes de Roupas SA | 11,570,138 | — | 7,872,103 | 3,698,035 | 58,157,058 | 2,085,571 |
Annual Shareholder Report33
| Affiliates | Balance of
Shares Held
10/31/2010 | Purchases/
Additions | Sales/
Reductions | Balance of
Shares Held
10/31/2011 | Value | Dividend/
Interest
Income |
| Sensable Technologies, Inc. | 3,751,199 | — | — | 3,751,199 | — | — |
| Soteira, Inc. | 274 | — | — | 274 | — | — |
| Soteira, Inc. Pfd. | 958,744 | — | — | 958,744 | — | — |
| TNS, Inc. | 2,964,645 | — | — | 2,964,645 | 57,899,517 | — |
| Vical, Inc. | 9,330,475 | — | 2,281,975 | 7,048,500 | 21,075,015 | — |
TOTAL OF AFFILIATED
COMPANIES | 158,836,050 | 28,496,815 | 70,654,315 | 116,678,550 | $943,386,376 | $6,392,263 |
* At October 31, 2011, the Fund no longer has ownership of at least 5% of the voting shares.
Affiliated holdings are mutual funds which are managed by the Adviser or an affiliate of the Adviser. The Adviser has agreed to reimburse the Fund for certain investment adviser fees as a result of transactions in other affiliated mutual funds. For the year ended October 31, 2011, the Adviser reimbursed $421,369. Transactions involving the affiliated holding during the year ended October 31, 2011, were as follows:
| Federated
Prime Value
Obligations Fund,
Institutional Shares |
| Balance of Shares Held 10/31/2010 | 119,963,791 |
| Purchases/Additions | 4,252,483,876 |
| Sales/Reductions | 3,860,536,348 |
| Balance of Shares Held 10/31/2011 | 511,911,319 |
| Value | $511,911,319 |
| Dividend Income | $117,962 |
6. EXPENSE Reduction
The Fund directs portfolio trades to a broker that in turn pays a portion of the Fund's operating expenses. For the year ended October 31, 2011, the Fund's expenses were reduced by $65,729 under these arrangements.
7. Investment TRANSACTIONS
Purchases and sales of investments, excluding long-term U.S. government securities and short-term obligations, for the year ended October 31, 2011, were as follows:
| Purchases | $4,335,569,440 |
| Sales | $5,498,771,674 |
8. CONCENTRATION OF RISK
The Fund invests in securities of non-U.S. issuers. Political or economic developments may have an effect on the liquidity and volatility of portfolio securities and currency holdings.
Annual Shareholder Report
34
At October 31, 2011, the diversification of countries was as follows:| Country | Percentage of
Net Assets |
| United States | 66.1% |
| Brazil | 9.0% |
| Ireland | 3.6% |
| India | 2.7% |
| Italy | 2.3% |
| Spain | 2.3% |
| Luxembourg | 2.2% |
| Netherlands | 1.4% |
| Chile | 1.3% |
| Cayman Islands | 1.2% |
| Israel | 1.1% |
| Germany | 0.9% |
| Singapore | 0.9% |
| Colombia | 0.6% |
| Hong Kong | 0.5% |
| Isle of Man | 0.5% |
| Bermuda | 0.4% |
| China | 0.4% |
| Indonesia | 0.4% |
| United Kingdom | 0.4% |
| British Virgin Islands | 0.3% |
| Canada | 0.3% |
| Switzerland | 0.3% |
| Mexico | 0.2% |
9. LINE OF CREDIT
The Fund participates in a $100,000,000 unsecured, uncommitted revolving line of credit (LOC) agreement with PNC Bank. The LOC was made available for extraordinary or emergency purposes, primarily for financing redemption payments. Borrowings are charged interest at a rate offered to the Fund by PNC Bank at the time of the borrowing. As of October 31, 2011, there were no outstanding loans. During the year ended October 31, 2011, the Fund did not utilize the LOC.
10. INTERFUND LENDING
Pursuant to an Exemptive Order issued by the Securities and Exchange Commission, the Fund, along with other funds advised by subsidiaries of Federated Investors, Inc., may participate in an interfund lending program. This program provides an alternative credit facility allowing the Fund to borrow from other participating affiliated funds. As of October 31, 2011, there were no outstanding loans. During the year ended October 31, 2011, the program was not utilized.
Annual Shareholder Report
35
11. Legal ProceedingsSince February 2004, Federated Investors, Inc. and related entities (collectively, “Federated”), had been named as defendants in several lawsuits in the United States District Court for the Western District of Pennsylvania. These lawsuits have been consolidated into a single action alleging excessive advisory fees involving the Fund. Without admitting the validity of any claim, in April 2011, Federated reached a final settlement to resolve this lawsuit resulting in no material adverse effect on Federated or the Fund.
12. RECENT ACCOUNTING PRONOUNCEMENTS
In April 2011, the Financial Accounting Standards Board (FASB) released Accounting Standards Update (ASU) No. 2011-03, “Reconsideration of Effective Control for Repurchase Agreements.” This ASU amends FASB Accounting Standards Codification (ASC) Topic 860, “Transfers and Servicing”; specifically the criteria required to determine whether a repurchase agreement and similar agreements should be accounted for as sales of financial assets or secured borrowings with commitments. This ASU is effective for fiscal years and interim periods beginning after December 15, 2011. At this time, management is evaluating the implications of adopting ASU No. 2011-03 and its impact on the Fund's financial statements and the accompanying notes, net assets and results of operations.
In addition, in May 2011, FASB released ASU No. 2011-04, “Amendments to Achieve Common Fair Value Measurement and Disclosure Requirements in U.S. GAAP and IFRSs.” This ASU amends FASB ASC Topic 820, “Fair Value Measurement,” to establish common requirements for measuring fair value and for disclosing information about fair value measurements in accordance with GAAP. This ASU is effective for fiscal years and interim periods beginning after December 15, 2011. At this time, management is evaluating the implications of adopting ASU No. 2011-04 and its impact on the Fund's financial statements and the accompanying notes.
13. FEDERAL TAX INFORMATION (UNAUDITED)
For the year ended October 31, 2011, the amount of long-term capital gains designated by the Fund was $48,627.
For the fiscal year ended October 31, 2011, 100% of total ordinary income distributions made by the Fund are qualifying dividends which may be subject to a maximum tax rate of 15%, as provided for by the Jobs and Growth Tax Relief Act of 2003. Complete information is reported in conjunction with the reporting of your distributions on Form 1099-DIV.
Of the ordinary income distributions made by the Fund during the year ended October 31, 2011, 97.0% qualify for the dividend received deduction available to corporate shareholders.
Annual Shareholder Report36
Report of Independent Registered Public Accounting Firm
TO THE BOARD OF Trustees OF Federated Equity Funds AND SHAREHOLDERS OF Federated Kaufmann Fund, CLASS R:
We have audited the accompanying statement of assets and liabilities of Federated Kaufmann Fund (the “Fund”) (one of the portfolios constituting Federated Equity Funds), including the portfolio of investments, as of October 31, 2011, and the related statement of operations for the year then ended, the statement of changes in net assets for each of the two years in the period then ended, and the financial highlights of the Class R Shares for each of the five years in the period then ended. These financial statements and financial highlights are the responsibility of the Fund's management. Our responsibility is to express an opinion on these financial statements and financial highlights based on our audits.
We conducted our audits in accordance with standards of the Public Company Accounting Oversight Board (United States). Those standards require that we plan and perform the audit to obtain reasonable assurance about whether the financial statements and financial highlights are free of material misstatement. We were not engaged to perform an audit of the Fund's internal control over financial reporting. Our audits included consideration of internal control over financial reporting as a basis for designing audit procedures that are appropriate in the circumstances, but not for the purpose of expressing an opinion on the effectiveness of the Fund's internal control over financial reporting. Accordingly, we express no such opinion. An audit also includes examining, on a test basis, evidence supporting the amounts and disclosures in the financial statements and financial highlights, assessing the accounting principles used and significant estimates made by management, and evaluating the overall financial statement presentation. Our procedures included confirmation of securities owned as of October 31, 2011, by correspondence with the custodian and others or by other appropriate auditing procedures where replies from others were not received. We believe that our audits provide a reasonable basis for our opinion.
In our opinion, the financial statements and financial highlights referred to above present fairly, in all material respects, the financial position of Federated Kaufmann Fund, a portfolio of Federated Equity Funds, at October 31, 2011, the results of its operations for the year then ended, the changes in its net assets for each of the two years in the period then ended, and the financial highlights of the Class R Shares for each of the five years in the period then ended, in conformity with U.S. generally accepted accounting principles.
Boston, Massachusetts
December 23, 2011
Annual Shareholder Report37
Shareholder Expense Example (unaudited)
As a shareholder of the Fund, you incur two types of costs: (1) transaction costs, including sales charges (loads) on purchase or redemption payments and redemption/exchange fees; and (2) ongoing costs, including management fees and to the extent applicable, distribution (12b-1) fees and/or shareholder services fees and other Fund expenses. This Example is intended to help you to understand your ongoing costs (in dollars) of investing in the Fund and to compare these costs with the ongoing costs of investing in other mutual funds. It is based on an investment of $1,000 invested at the beginning of the period and held for the entire period from May 1, 2011 to October 31, 2011.
ACTUAL EXPENSES
The first section of the table below provides information about actual account values and actual expenses. You may use the information in this section, together with the amount you invested, to estimate the expenses that you incurred over the period. Simply divide your account value by $1,000 (for example, an $8,600 account value divided by $1,000 = 8.6), then multiply the result by the number in the first section under the heading entitled “Expenses Paid During Period” to estimate the expenses attributable to your investment during this period.
HYPOTHETICAL EXAMPLE FOR COMPARISON PURPOSES
The second section of the table below provides information about hypothetical account values and hypothetical expenses based on the Fund's actual expense ratio and an assumed rate of return of 5% per year before expenses, which is not the Fund's actual return. Thus, you should not use the hypothetical account values and expenses to estimate the actual ending account balance or your expenses for the period. Rather, these figures are required to be provided to enable you to compare the ongoing costs of investing in the Fund with other funds. To do so, compare this 5% hypothetical example with the 5% hypothetical examples that appear in the shareholder reports of the other funds.
Annual Shareholder Report
38
Please note that the expenses shown in the table are meant to highlight your ongoing costs only and do not reflect any transaction costs, such as sales charges (loads) on purchase or redemption payments, or redemption/exchange fees. Therefore, the second section of the table is useful in comparing ongoing costs only, and will not help you determine the relative total costs of owning different funds. In addition, if these transaction costs were included, your costs would have been higher. | Beginning
Account Value
5/1/2011 | Ending
Account Value
10/31/2011 | Expenses Paid
During Period1 |
| Actual | $1,000 | $837.00 | $9.03 |
Hypothetical (assuming a 5% return
before expenses) | $1,000 | $1,015.38 | $9.91 |
| 1 | Expenses are equal to the Fund's annualized net expense ratio of 1.95%, multiplied by the average account value over the period, multiplied by 184/365 (to reflect the one-half-year period). |
Annual Shareholder Report39
Board of Trustees and Trust Officers
The Board of Trustees is responsible for managing the Trust business affairs and for exercising all the Trust powers except those reserved for the shareholders. The following tables give information about each Trustee and the senior officers of the Fund. Where required, the tables separately list Trustees who are “interested persons” of the Fund (i.e., “Interested” Trustees) and those who are not (i.e., “Independent” Trustees). Unless otherwise noted, the address of each person listed is Federated Investors Tower, 1001 Liberty Avenue, Pittsburgh, PA 15222. The address of all Independent Trustees listed is 4000 Ericsson Drive, Warrendale, PA 15086-7561; Attention: Mutual Fund Board. As of December 31, 2010, the Trust comprised 13 portfolio(s), and the Federated Fund Family consisted of 43 investment companies (comprising 136 portfolios). Unless otherwise noted, each Officer is elected annually. Unless otherwise noted, each Trustee oversees all portfolios in the Federated Fund Family and serves for an indefinite term. The Fund's Statement of Additional Information includes additional information about Trust Trustees and is available, without charge and upon request, by calling 1-800-341-7400.
Interested TRUSTEES Background
Name
Birth Date
Positions Held with Trust
Date Service Began | Principal Occupation(s) for Past Five Years,
Other Directorships Held and Previous Position(s) |
John F. Donahue*
Birth Date: July 28, 1924
Trustee
Began serving: April 1984 | Principal Occupations: Director or Trustee of the Federated Fund Family; Chairman and Director, Federated Investors, Inc.; Chairman of the Federated Fund Family's Executive Committee.
Previous Positions: Chairman of the Federated Fund Family; Trustee, Federated Investment Management Company; Chairman and Director, Federated Investment Counseling. |
J. Christopher Donahue*
Birth Date: April 11, 1949
President and Trustee
Began serving: January 2000 | Principal Occupations: Principal Executive Officer and President of the Federated Fund Family; Director or Trustee of some of the Funds in the Federated Fund Family; President, Chief Executive Officer and Director, Federated Investors, Inc.; Chairman and Trustee, Federated Investment Management Company; Trustee, Federated Investment Counseling; Chairman and Director, Federated Global Investment Management Corp.; Chairman, Federated Equity Management Company of Pennsylvania and Passport Research, Ltd. (investment advisory subsidiary of Federated); Trustee, Federated Shareholder Services Company; Director, Federated Services Company.
Previous Positions: President, Federated Investment Counseling; President and Chief Executive Officer, Federated Investment Management Company, Federated Global Investment Management Corp. and Passport Research, Ltd. |
| * | Family relationships and reasons for “interested” status: John F. Donahue is the father of J. Christopher Donahue; both are “interested” due to their beneficial ownership of shares of Federated Investors, Inc. and the positions they hold with Federated and its subsidiaries. |
Annual Shareholder Report40
INDEPENDENT TRUSTEES Background
Name
Birth Date
Positions Held with Trust
Date Service Began | Principal Occupation(s) for Past Five Years,
Other Directorships Held, Previous Position(s) and Qualifications |
Nicholas P. Constantakis, CPA
Birth Date: September 3, 1939
Trustee
Began serving: February 1998 | Principal Occupation: Director or Trustee of the Federated Fund Family.
Other Directorship Held: Director and Chairman of the Audit Committee, Michael Baker Corporation (architecture, engineering and construction services).
Previous Position: Partner, Andersen Worldwide SC.
Qualifications: Public accounting and director experience. |
John F. Cunningham
Birth Date: March 5, 1943
Trustee
Began serving: January 1999 | Principal Occupation: Director or Trustee of the Federated Fund Family.
Other Directorships Held: Chairman, President and Chief Executive Officer, Cunningham & Co., Inc. (strategic business consulting); Trustee Associate, Boston College.
Previous Positions: Director, Redgate Communications and EMC Corporation (computer storage systems); Chairman of the Board and Chief Executive Officer, Computer Consoles, Inc.; President and Chief Operating Officer, Wang Laboratories; Director, First National Bank of Boston; Director, Apollo Computer, Inc.
Qualifications: Business management and director experience. |
Maureen Lally-Green
Birth Date: July 5, 1949
Trustee
Began serving: August 2009 | Principal Occupations: Director or Trustee of the Federated Fund Family; Director, Office of Church Relations, Diocese of Pittsburgh; Adjunct Professor of Law, Duquesne University School of Law.
Other Directorships Held: Director, Auberle; Trustee, St. Francis University; Director, Ireland Institute of Pittsburgh; Director, UPMC Mercy Hospital; Regent, St. Vincent Seminary; Director, Epilepsy Foundation of Western and Central Pennsylvania; Director, Saint Thomas More Society, Allegheny County.
Previous Position: Pennsylvania Superior Court Judge.
Qualifications: Legal and director experience. |
Peter E. Madden
Birth Date: March 16, 1942
Trustee
Began serving: November 1991 | Principal Occupation: Director or Trustee, and Chairman of the Board of Directors or Trustees, of the Federated Fund Family.
Previous Positions: Representative, Commonwealth of Massachusetts General Court; President, Chief Operating Officer and Director, State Street Bank and Trust Company and State Street Corporation (retired); Director, VISA USA and VISA International; Chairman and Director, Massachusetts Bankers Association; Director, Depository Trust Corporation; Director, The Boston Stock Exchange.
Qualifications: Business management, mutual fund services and director experience. |
Annual Shareholder Report41
Name
Birth Date
Positions Held with Trust
Date Service Began | Principal Occupation(s) for Past Five Years,
Other Directorships Held, Previous Position(s) and Qualifications |
Charles F. Mansfield, Jr.
Birth Date: April 10, 1945
Trustee
Began serving: January 1999 | Principal Occupations: Director or Trustee and Chairman of the Audit Committee of the Federated Fund Family; Management Consultant.
Previous Positions: Chief Executive Officer, PBTC International Bank; Partner, Arthur Young & Company (now Ernst & Young LLP); Chief Financial Officer of Retail Banking Sector, Chase Manhattan Bank; Senior Vice President, HSBC Bank USA (formerly Marine Midland Bank); Vice President, Citibank; Assistant Professor of Banking and Finance, Frank G. Zarb School of Business, Hofstra University; Executive Vice President, DVC Group, Inc. (marketing, communications and technology).
Qualifications: Banking, business management, education and director experience. |
R. James Nicholson
Birth Date: February 4, 1938
Trustee
Began serving: January 2008 | Principal Occupations: Director or Trustee of the Federated Fund Family; Senior Counsel, Brownstein Hyatt Farber Schrek, P.C.; Former Secretary of the U.S. Dept. of Veterans Affairs; Former U.S. Ambassador to the Holy See; Former Chairman of the Republican National Committee.
Other Directorships Held: Director, Horatio Alger Association; Director, The Daniels Fund, both charitable nonprofit organizations.
Previous Positions: Colonel, U.S. Army Reserve; Partner, Calkins, Kramer, Grimshaw and Harring, P.C.; General Counsel, Colorado Association of Housing and Building; Chairman and CEO, Nicholson Enterprises, Inc. (real estate holding company); Chairman and CEO, Renaissance Homes of Colorado.
Qualifications: Legal, government, business management and director experience. |
Thomas M. O'Neill
Birth Date: June 14, 1951
Trustee
Began serving: October 2006 | Principal Occupations: Director or Trustee of the Federated Fund Family; Sole Proprietor, Navigator Management Company (investment and strategic consulting).
Other Directorships Held: Board of Overseers, Children's Hospital of Boston; Visiting Committee on Athletics, Harvard College; Board of Directors, Medicines for Humanity.
Previous Positions: Chief Executive Officer and President, Managing Director and Chief Investment Officer, Fleet Investment Advisors; President and Chief Executive Officer, Aeltus Investment Management, Inc.; General Partner, Hellman, Jordan Management Co., Boston, MA; Chief Investment Officer, The Putnam Companies, Boston, MA; Credit Analyst and Lending Officer, Fleet Bank; Director and Consultant, EZE Castle Software (investment order management software); Director, Midway Pacific (lumber).
Qualifications: Business management, mutual fund, director and investment experience. |
Annual Shareholder Report42
Name
Birth Date
Positions Held with Trust
Date Service Began | Principal Occupation(s) for Past Five Years,
Other Directorships Held, Previous Position(s) and Qualifications |
John S. Walsh
Birth Date: November 28, 1957
Trustee
Began serving: January 1999 | Principal Occupations: Director or Trustee of the Federated Fund Family; President and Director, Heat Wagon, Inc. (manufacturer of construction temporary heaters); President and Director, Manufacturers Products, Inc. (distributor of portable construction heaters); President, Portable Heater Parts, a division of Manufacturers Products, Inc.
Previous Position: Vice President, Walsh & Kelly, Inc.
Qualifications: Business management and director experience. |
James F. Will
Birth Date: October 12, 1938
Trustee
Began serving: April 2006 | Principal Occupations: Director or Trustee of the Federated Fund Family; formerly, Vice Chancellor and President, Saint Vincent College.
Other Directorships Held: Trustee, Saint Vincent College; Director, Alleghany Corporation; Trustee, Wheeling Jesuit University; Director, Liberty Tire Recycling.
Previous Positions: Chairman, President and Chief Executive Officer, Armco, Inc.; President and Chief Executive Officer, Cyclops Industries; President and Chief Operating Officer, Kaiser Steel Corporation.
Qualifications: Business management, education and director experience. |
OFFICERS
Name
Birth Date
Address
Positions Held with Trust
Date Service Began | Principal Occupation(s) for Past Five Years
and Previous Position(s) |
John W. McGonigle
Birth Date: October 26, 1938
EXECUTIVE VICE PRESIDENT AND SECRETARY
Began serving: April 1984 | Principal Occupations: Executive Vice President and Secretary of the Federated Fund Family; Vice Chairman, Executive Vice President, Secretary and Director, Federated Investors, Inc.
Previous Positions: Trustee, Federated Investment Management Company and Federated Investment Counseling; Director, Federated Global Investment Management Corp., Federated Services Company and Federated Securities Corp. |
Richard A. Novak
Birth Date: December 25, 1963
Treasurer
Began serving: January 2006 | Principal Occupations: Principal Financial Officer and Treasurer of the Federated Fund Family; Senior Vice President, Federated Administrative Services; Financial and Operations Principal for Federated Securities Corp., Edgewood Services, Inc. and Southpointe Distribution Services, Inc.
Previous Positions: Controller of Federated Investors, Inc.; Vice President, Finance of Federated Services Company; held various financial management positions within The Mercy Hospital of Pittsburgh; Auditor, Arthur Andersen & Co. |
Annual Shareholder Report43
Name
Birth Date
Address
Positions Held with Trust
Date Service Began | Principal Occupation(s) for Past Five Years
and Previous Position(s) |
Richard B. Fisher
Birth Date: May 17, 1923
Vice President
Began serving: April 1984 | Principal Occupations: Vice Chairman or Vice President of some of the Funds in the Federated Fund Family; Vice Chairman, Federated Investors, Inc.; Chairman, Federated Securities Corp.
Previous Positions: President and Director or Trustee of some of the Funds in the Federated Fund Family; Executive Vice President, Federated Investors, Inc.; Director and Chief Executive Officer, Federated Securities Corp. |
Brian P. Bouda
Birth Date: February 28, 1947
CHIEF COMPLIANCE OFFICER AND SENIOR VICE PRESIDENT
Began serving: August 2004 | Principal Occupations: Senior Vice President and Chief Compliance Officer of the Federated Fund Family; Vice President and Chief Compliance Officer of Federated Investors, Inc. and Chief Compliance Officer of its subsidiaries. Mr. Bouda joined Federated in 1999 and is a member of the American Bar Association and the State Bar Association of Wisconsin. |
Stephen F. Auth
Birth Date: September 3, 1956
450 Lexington Avenue
Suite 3700
New York, NY 10017-3943
CHIEF INVESTMENT OFFICER
Began serving: November 2002 | Principal Occupations: Mr. Auth is Chief Investment Officer of this Fund and various other Funds in the Federated Fund Family; Executive Vice President, Federated Investment Counseling, Federated Global Investment Management Corp. and Federated Equity Management Company of Pennsylvania.
Previous Positions: Executive Vice President, Federated Investment Management Company, and Passport Research, Ltd. (investment advisory subsidiary of Federated); Senior Vice President, Global Portfolio Management Services Division; Senior Vice President, Federated Investment Management Company and Passport Research, Ltd.; Senior Managing Director and Portfolio Manager, Prudential Investments. |
Lawrence Auriana
Birth Date: January 8, 1944
140 East 45th Street
New York, NY 10017
VICE PRESIDENT
Began serving: November 2001 | Principal Occupations: Lawrence Auriana has been the Fund's Portfolio Manager since February 1986. He is Vice President of the Trust. Mr. Auriana joined Federated in April 2001 as Co-Head of Investments/Federated Kaufmann. From August 1984 to April 2001, Mr. Auriana was President and Treasurer of Edgemont Asset Management Corp., and Chairman of the Board and Portfolio Manager to The Kaufmann Fund, Inc. (predecessor to the Federated Kaufmann Fund). Mr. Auriana earned a B.S. in economics from Fordham University and has been engaged in the securities business since 1965. |
Hans P. Utsch
Birth Date: July 3, 1936
VICE PRESIDENT
Began serving: November 2001 | Principal Occupations: Hans P. Utsch has been the Fund's Portfolio Manager since February 1986. He is Vice President of the Trust. Mr. Utsch joined Federated in April 2001 as Co-Head of Investments/Federated Kaufmann. From August 1984 to April 2001, Mr. Utsch was Chairman of the Board and Secretary of Edgemont Asset Management Corp., and President and Portfolio Manager to The Kaufmann Fund, Inc. (predecessor to the Federated Kaufmann Fund). Mr. Utsch graduated from Amherst College and holds an M.B.A. from Columbia University. He has been engaged in the securities business since 1962. |
Annual Shareholder Report44
Evaluation and Approval of Advisory Contract – May 2011
Federated kaufmann fund (the “Fund”)
The Fund's Board reviewed the Fund's investment advisory and subadvisory contracts at meetings held in May 2011. The Board's decision regarding these contracts reflects the exercise of its business judgment on whether to continue the existing arrangements.
In this connection, the Federated Funds' Board had previously appointed a Senior Officer, whose duties include specified responsibilities relating to the process by which advisory fees are to be charged to a Federated fund. The Senior Officer has the authority to retain consultants, experts, or staff as may be reasonably necessary to assist in the performance of his duties, reports directly to the Board, and may be terminated only with the approval of a majority of the independent members of the Board. The Senior Officer prepared and furnished to the Board an independent, written evaluation that covered topics discussed below (the “Evaluation”). The Board considered that Evaluation, along with other information, in deciding to approve the advisory and subadvisory contracts.
During its review of these contracts, the Board considered compensation and benefits received by the Adviser and subadviser. This included the fees received for services provided to the Fund by other entities in the Federated organization and research services (if any) received by the Adviser from brokers that execute Federated fund trades, as well as advisory fees. The Board is also familiar with and considered judicial decisions concerning allegedly excessive investment advisory fees, which have indicated that the following factors may be relevant to an Adviser's fiduciary duty with respect to its receipt of compensation from a fund: the nature and quality of the services provided by the Adviser, including the performance of the fund; the Adviser's cost of providing the services; the extent to which the Adviser may realize “economies of scale” as a fund grows larger; any indirect benefits that may accrue to the Adviser and its affiliates as a result of the Adviser's relationship with a fund; performance and expenses of comparable funds; and the extent to which the independent Board members are fully informed about all facts the Board deems relevant bearing on the Adviser's services and fees. The Board further considered management fees (including any components thereof) charged to institutional and other clients of the Adviser and subadviser for what might be viewed as like services, and the cost to the Adviser and its affiliates of supplying services pursuant to the management fee agreements, excluding any intra-corporate profit and profit margins of the Adviser and its affiliates for supplying such services. The Board was aware of these factors and was guided by them in its review of the Fund's advisory and subadvisory contracts to the extent it considered them to be appropriate and relevant, as discussed further below.
Annual Shareholder Report
45
The Board considered and weighed these circumstances in light of its substantial accumulated experience in governing the Fund and working with Federated on matters relating to the Federated funds, and was assisted in its deliberations by independent legal counsel. Throughout the year, the Board has requested and received substantial and detailed information about the Fund and the Federated organization that was in addition to the extensive materials that comprise and accompany the Senior Officer's Evaluation. Federated provided much of this information at each regular meeting of the Board, and furnished additional information in connection with the particular meeting at which the Board's formal review of the advisory and subadvisory contracts occurred. Between regularly scheduled meetings, the Board also received information on particular matters as the need arose. Thus, the Board's consideration of the advisory and subadvisory contracts included review of the Senior Officer's Evaluation, accompanying data and additional information covering such matters as: the Adviser's and subadviser's investment philosophy, revenue, profitability, personnel and processes; investment and operating strategies; the Fund's short- and long-term performance (in absolute terms, both on a gross basis and net of expenses, as well as in relationship to its particular investment program and certain competitor or “peer group” funds and/or other benchmarks, as appropriate), and comments on the reasons for performance; the Fund's investment objectives; the Fund's expenses (including the advisory fee itself and the overall expense structure of the Fund, both in absolute terms and relative to similar and/or competing funds, with due regard for contractual or voluntary expense limitations); the use and allocation of brokerage commissions derived from trading the Fund's portfolio securities (if any); and the nature, quality and extent of the advisory and other services provided to the Fund by the Adviser and its affiliates. The Board also considered the preferences and expectations of Fund shareholders and their relative sophistication; the continuing state of competition in the mutual fund industry and market practices; the range of comparable fees for similar funds in the mutual fund industry; the Fund's relationship to the Federated family of funds which include a comprehensive array of funds with different investment objectives, policies and strategies which are available for exchange without the incurrence of additional sales charges; compliance and audit reports concerning the Federated funds and the Federated companies that service them (including communications from regulatory agencies), as well as Federated's responses to any issues raised therein; and relevant developments in the mutual fund industry and how the Federated funds and/or Federated are responding to them. The Board also considered that the longevity and experience of the Fund's portfolio management team and their unique approach to investing may limit the utility of comparisons to other equity mutual funds. The Board's evaluation process is evolutionary. The criteria considered and the emphasis placed on relevant criteria change in recognition of changing circumstances in the mutual fund marketplace.Annual Shareholder Report
46
With respect to the Fund's performance and expenses in particular, the Board has found the use of comparisons to other mutual funds with comparable investment programs to be relevant, given the high degree of competition in the mutual fund business. The Board focused on comparisons with other similar mutual funds more heavily than non-mutual fund products or services because it is believed that they are more relevant. For example, other mutual funds are the products most like the Fund, they are readily available to Fund shareholders as alternative investment vehicles, and they are the type of investment vehicle in fact chosen and maintained by the Fund's investors. The range of their fees and expenses therefore appears to be a generally reliable indication of what consumers have found to be reasonable in the precise marketplace in which the Fund competes. The Fund's ability to deliver competitive performance when compared to its peer group was a useful indicator of how the Adviser is executing the Fund's investment program, which in turn assisted the Board in reaching a conclusion that the nature, extent, and quality of the Adviser's investment management services were such as to warrant continuation of the advisory contract. In this regard, the Senior Officer has reviewed Federated's fees for providing advisory services to products outside the Federated family of funds (e.g., institutional and separate accounts). He concluded that mutual funds and institutional accounts are inherently different products. Those differences include, but are not limited to, different types of targeted investors; being subject to different laws and regulations; different legal structures; different average account sizes; different associated costs; different portfolio management techniques made necessary by different cash flows; and portfolio manager time spent in review of securities pricing. The Senior Officer did not consider these fee schedules to be determinative in judging the appropriateness of mutual fund advisory contracts.The Senior Officer reviewed information compiled by Federated, using data supplied by independent fund ranking organizations, regarding the performance of, and fees charged by, other mutual funds, noting his view that comparisons to fund peer groups are relevant in judging the reasonableness of proposed fees.
The Fund's performance fell below the median of the relevant peer group for the one-year, three-year and five-year periods covered by the Evaluation. The Board discussed the Fund's performance with the Adviser and recognized the efforts being undertaken by the Adviser. The Board will continue to monitor these efforts and the performance of the Fund.
The Board also received financial information about Federated, including information regarding the compensation and benefits Federated derived from its relationships with the Federated funds. This information covered not only the fees under the advisory contracts, but also fees received by Federated's subsidiaries for providing other services to the Federated funds under separate contracts (e.g., for serving as the Federated funds' administrator). The information also detailed any indirect benefit Federated may derive from its receipt of research services from brokers who execute Federated fund trades. In Annual Shareholder Report
47
addition, the Board considered the fact that, in order for a fund to be competitive in the marketplace, Federated and its affiliates frequently waived fees and/or reimbursed expenses and have disclosed to fund investors and/or indicated to the Board their intention to do so in the future, where appropriate. Moreover, the Board receives regular reporting as to the institution or elimination of these voluntary waivers.Federated furnished information, requested by the Senior Officer, that reported revenues on a fund-by-fund basis and made estimates of the allocation of expenses on a fund-by-fund basis, using allocation methodologies specified by the Senior Officer. The Senior Officer noted that, although they may apply consistent allocation processes, the inherent difficulties in allocating costs (and the unavoidable arbitrary aspects of that exercise) and the lack of consensus on how to allocate those costs may render such allocation information unreliable. The allocation information was considered in the analysis by the Board but was determined to be of limited use.
The Board and the Senior Officer also reviewed information compiled by Federated comparing profitability information for Federated to other publicly held fund management companies. In this regard, the Senior Officer noted the limited availability of such information, but nonetheless concluded that Federated's profit margins did not appear to be excessive and the Board agreed.
The Senior Officer's Evaluation also discussed the notion of possible realization of “economies of scale” as a fund grows larger. The Board considered in this regard that the Adviser has made significant and long-term investments in areas that support all of the Federated funds, such as personnel and processes for the portfolio management, compliance, internal audit, and risk management functions; and systems technology; and that the benefits of these efforts (as well as any economies, should they exist) were likely to be enjoyed by the fund complex as a whole. Finally, the Board also noted the absence of any applicable regulatory or industry guidelines on this subject, which (as discussed in the Senior Officer's Evaluation) is compounded by the lack of any common industry practice or general pattern with respect to structuring fund advisory fees with “breakpoints” that serve to reduce the fee as the fund attains a certain size. The Senior Officer did not recommend institution of breakpoints in pricing Federated's fund advisory services at this time. In this regard, the Senior Officer's Evaluation noted that the Board is aware that the Fund is a relatively more expensive fund for the Adviser to manage than other Federated equity funds and that the Fund has for long periods in the past been significantly and consistently above median in its investment performance. The Board agreed to monitor future developments and review changes in industry practices or competitive initiatives.
In connection with its discussion of the Senior Officer's Evaluation, the Board reviewed and discussed substantial other data which related to the Fund, including reports of an independent, third-party service provider which give further explanation of the relative performance of the Fund. The Board also Annual Shareholder Report
48
considered and discussed oral and written information requested of and provided by representatives of Federated's senior management describing and analyzing both relative and absolute performance of the Fund over its operating history, the uniqueness of its investment style and the quality and consistency of the Fund's investment management process and investment professionals.The Board also considered that on April 28, 2011, the adviser reached a final settlement to resolve the consolidated cases involving the fees being charged to the Federated Kaufmann Fund.
It was noted in the materials for the Board meeting that for the period covered by the Evaluation, the Fund's investment advisory fee, after waivers and expense reimbursements, if any, was above the median of the relevant peer group. The Board reviewed the fees and other expenses of the Fund with the Adviser and was satisfied that the overall expense structure of the Fund remained competitive. The Board will continue to monitor advisory fees and other expenses borne by the Fund.
The Senior Officer noted that, considering the totality of the circumstances, and all of the factors referenced within his Evaluation, he had concluded that, subject to comments and recommendations made within his Evaluation, his observations and the information accompanying the Evaluation supported a finding by the Board that the management fees for each of the funds are reasonable and that Federated appeared to provide appropriate administrative services to the Fund for the fees paid. Under these circumstances, no changes were recommended to, and no objection was raised to, the continuation of the Fund's advisory and subadvisory contracts. The Board concluded that the nature, quality and scope of services provided the Fund by the Adviser and its affiliates were satisfactory.
In its decision to continue an existing investment advisory contract, the Board was mindful of the potential disruptions of the Fund's operations and various risks, uncertainties and other effects that could occur as a result of a decision to terminate or not renew an advisory contract. In particular, the Board recognized that many shareholders have invested in the Fund on the strength of the Adviser's industry standing and reputation and with the expectation that the Adviser will have a continuing role in providing advisory services to the Fund. Thus, the Board's approval of the advisory contract reflected the fact that it is the shareholders who have effectively selected the Adviser by virtue of having invested in the Fund.
The Board based its decision to approve the advisory and subadvisory contracts on the totality of the circumstances and relevant factors and with a view to past and future long-term considerations. Not all of the factors and considerations identified above were necessarily relevant to the Fund, nor did the Board consider any one of them to be determinative. With respect to the factors that were relevant, the Board's decision to approve the contract reflects its determination that Federated's performance and actions provided a satisfactory basis to support the decision to continue the existing arrangements.
Annual Shareholder Report49
Voting Proxies on Fund Portfolio Securities
A description of the policies and procedures that the Fund uses to determine how to vote proxies, if any, relating to securities held in the Fund's portfolio is available, without charge and upon request, by calling 1-800-341-7400. A report on “Form N-PX” of how the Fund voted any such proxies during the most recent 12-month period ended June 30 is available from Federated's website at FederatedInvestors.com. To access this information from the home page, select “All” under “Asset Classes.” Select a fund name and share class, if applicable, to go to the Fund Overview page. On the Fund Overview page, select the “Documents” tab. At the bottom of that page, select “Proxy Voting Record Report (Form N-PX).” Form N-PX filings are also available at the SEC's website at www.sec.gov.
Quarterly Portfolio Schedule
The Fund files with the SEC a complete schedule of its portfolio holdings, as of the close of the first and third quarters of its fiscal year, on “Form N-Q.” These filings are available on the SEC's website at www.sec.gov and may be reviewed and copied at the SEC's Public Reference Room in Washington, DC. (Call 1-800-SEC-0330 for information on the operation of the Public Reference Room.) You may also access this information from the “Products” section of Federated's website at FederatedInvestors.com. From the home page, select “All” under “Asset Classes.” Select a fund name and share class, if applicable, to go to the Fund Overview page. On the Fund Overview page, select the “Documents” tab. At the bottom of that page, select “Form N-Q.”
Annual Shareholder Report50
Mutual funds are not bank deposits or obligations, are not guaranteed by any bank and are not insured or guaranteed by the U.S. government, the Federal Deposit Insurance Corporation, the Federal Reserve Board or any other government agency. Investment in mutual funds involves investment risk, including the possible loss of principal.
This Report is authorized for distribution to prospective investors only when preceded or accompanied by the Fund's Prospectus, which contains facts concerning its objective and policies, management fees, expenses and other information.
Federated Kaufmann Fund
Federated Investors Funds
4000 Ericsson Drive
Warrendale, PA 15086-7561
Contact us at FederatedInvestors.com
or call 1-800-341-7400.
Federated Securities Corp., Distributor
Cusip 314172644
26851 (12/11)
Federated is a registered trademark of Federated Investors, Inc.
2011 © Federated Investors, Inc.
| | Annual Shareholder Report |
| | October 31, 2011 |
|
| Share Class | Ticker |
| A | KLCAX |
| C | KLCCX |
| R* | KLCKX |
| Institutional | KLCIX |
*formerly, Class K Shares
Federated Kaufmann Large Cap Fund
Fund Established 2007
A Portfolio of Federated Equity Funds
Management's Discussion of Fund Performance
Portfolio of Investments Summary Table
Portfolio of Investments
Financial Highlights
Statement of Assets and Liabilities
Statement of Operations
Statement of Changes in Net Assets
Notes to Financial Statements
Report of Independent Registered Public Accounting Firm
Shareholder Expense Example
Board of Trustees and Trust Officers
Evaluation and Approval of Advisory Contract
Voting Proxies on Fund Portfolio Securities
Quarterly Portfolio Schedule
Management's Discussion of Fund Performance (unaudited)
The Fund's total return, based upon net asset value, for the 12-month reporting period ended October 31, 2011, was 5.63%, 4.74%, 5.20% and 5.89% for the Class A, C, R and Institutional Shares, respectively. The Russell 1000® Growth Index (R1000G),1 the Fund's broad-based securities market index, had a total return of 9.92% for same period. The Fund's total return for the fiscal year reflects actual cash flows, transaction costs and other expenses which are not reflected in the total return of the R1000G.
The following discussion will focus on the performance of the Fund's Institutional Shares.
Market Conditions
The stock market, as a whole, posted very strong returns during the first half of the fiscal year but then retreated into negative return territory during the second half of the reporting period. The equity markets returned to positive returns with a powerful rally during the final month of the Fund's fiscal year, October. The Standard and Poor's 500 Index (S&P 500)2 bottomed in September and finished the fiscal year up 8.09%. Overall, large-cap stocks performed best, followed by mid-caps and then small-caps. In terms of style, growth stocks outperformed value stocks across large-, mid-, and small-cap stock groupings.
Economic growth in Europe began to slow, especially in the highly indebted countries of Greece, Italy, Portugal, Ireland, Spain and others. Credit spreads widened substantially on speculation that those governments would not be able to support their level of indebtedness in a slowing economic environment without significant support from the European Central Bank. Politics have dominated much of the European debate. However, even after numerous meetings between bankers and politicians, and the resignation of several prime ministers, credible plans for a bailout remain elusive.
Unfortunately, political uncertainty was not limited to Europe; the President and the U.S. Congress generated a highly contentious standoff regarding the debt ceiling debate. This uncertainty prompted Standard and Poor's to downgrade the long-term credit rating of the United States one notch down from AAA. Additionally, during June 2011, the Federal Reserve's second quantitative easing program, known as QE2, ended.
The European debt crisis, political uncertainty, and weaker economic indicators during the last six months of the reporting period clearly increased volatility and negatively affected the global equity markets.
Annual Shareholder Report
1
Fund PerformanceThe Fund underperformed the R1000G over the reporting period. Key factors affecting the Fund's performance over the reporting period include the following:
International holdings: The Fund maintained exposure to growth companies outside of the United States, particularly in Brazil, China, India and Canada. Both developed and emerging international markets significantly underperformed the U.S. markets. Although stock selection was relatively good in these markets, the exposure to international markets accounted for a substantial portion of the Fund's underperformance, relative to the R1000G.3
Stock selection: The nine worst contributing holdings during the period accounted for a substantial portion of underperformance. Specifically, these holdings were: Hypermarcas (-43%); Central European Media (-52%); Goldman Sachs (-31%); Cisco Systems (-34%); Nintendo (-29%); Mylan Labs (-22%); United Continental Holdings (-33%); Warner Chilcott (-25%); and Best Buy (-32%).
Companies that were strong performers and contributed most to the Fund's returns during the period were: NXP Semiconductor (+36%); Arcos Dorados Holdings (+33%); Linkedin Corp (+72%); Apple (+35%); Cetip (+16%); Kuehne & Nagel (+40%); Bristol Myers Squibb (+23%); and O'Reilly Automotive (+28%).
Sector weightings: Substantially less exposure to Consumer Staples and Energy sectors relative to the R1000G also hurt performance. Finally, an overweight in the Financial sector also hurt our performance.
Macroeconomic events, previously mentioned, also pushed stock correlations substantially higher, meaning many stocks moved in the same direction, up or down, simultaneously. This made stock selection more difficult because stocks reacted similarly to both good and bad news headlines more than company fundamentals.
The Fund was nearly fully invested during the period with a cash position which averaged less than 3.0%.
| 1 | The Russell 1000® Growth Index measures the performance of those Russell 1000 companies with higher price-to-book ratios and higher forecasted growth values. |
| 2 | The Standard and Poor's 500 Index is an unmanaged capitalization-weighted index of 500 stocks designed to measure performance of the broad domestic economy through changes in the aggregate market value of 500 stocks representing all major industries. It is not possible to invest directly in an index. |
| 3 | International investing involves special risks including currency risk, increased volatility, political risks and differences in auditing and other financial standards. |
Annual Shareholder Report2
FUND PERFORMANCE AND GROWTH OF A $10,000 INVESTMENT
The Average Annual Total Return table below shows returns for each class averaged over the stated periods. The graphs below illustrate the hypothetical investment of $10,0001 in the Federated Kaufmann Large Cap Fund (the “Fund”) from December 5, 2007 (start of performance) to October 31, 2011, compared to the Russell 1000 Growth Index (R1000G)2 and the Lipper Large Cap Growth Funds Index (LLCGFI).2
Average Annual Total Returns for the Period Ended 10/31/2011
(returns reflect all applicable sales charges and contingent deferred sales charges as specified below in footnote #1)
| Share Class | 1 Year | Start of
Performance* |
| Class A Shares | -0.15% | 1.37% |
| Class C Shares | 3.74% | 2.04% |
| Class R Shares | 5.20% | 2.43% |
| Institutional Shares | 5.89% | 3.12% |
| * | The Fund's Class A Shares, Class C Shares, Class R Shares and Institutional Shares start of performance date was December 5, 2007. |
Performance data quoted represents past performance which is no guarantee of future results. Investment return and principal value will fluctuate so that an investor's shares, when redeemed, may be worth more or less than their original cost. Mutual fund performance changes over time and current performance may be lower or higher than what is stated. For current to the most recent month-end performance and after-tax returns, visit FederatedInvestors.com or call 1-800-341-7400. Returns shown do not reflect the deduction of taxes that a shareholder would pay on Fund distributions or the redemption of Fund shares. Mutual funds are not obligations of or guaranteed by any bank and are not federally insured.
Annual Shareholder Report
3
Growth of a $10,000 Investment – CLASS A SHARES| Federated Kaufmann Large Cap Fund - Class A Shares | C000055072 | R1000G | LLCGFI |
| 12/5/2007 | 9,450 | 10,000 | 10,000 |
| 10/31/2008 | 6,502 | 6,516 | 6,337 |
| 10/31/2009 | 8,246 | 7,656 | 7,408 |
| 10/31/2010 | 9,981 | 9,161 | 8,761 |
| 10/31/2011 | 10,543 | 10,069 | 9,317 |
41 graphic description end -->
- Total returns shown include the maximum sales charge of 5.50% ($10,000 investment minus $550 sales charge = $9,450).
Growth of a $10,000 Investment – CLASS C SHARES
| Federated Kaufmann Large Cap Fund - Class C Shares | C000055073 | R1000G | LLCGFI |
| 12/5/2007 | 10,000 | 10,000 | 10,000 |
| 10/31/2008 | 6,850 | 6,516 | 6,337 |
| 10/31/2009 | 8,610 | 7,656 | 7,408 |
| 10/31/2010 | 10,330 | 9,161 | 8,761 |
| 10/31/2011 | 10,820 | 10,069 | 9,317 |
41 graphic description end -->
- Total returns shown include the maximum contingent deferred sales charge of 1.00%, as applicable.
Annual Shareholder Report4
Growth of a $10,000 Investment – CLASS R SHARES
| Federated Kaufmann Large Cap Fund - Class R Shares | C000055074 | R1000G | LLCGFI |
| 12/5/2007 | 10,000 | 10,000 | 10,000 |
| 10/31/2008 | 6,870 | 6,516 | 6,337 |
| 10/31/2009 | 8,664 | 7,656 | 7,408 |
| 10/31/2010 | 10,442 | 9,161 | 8,761 |
| 10/31/2011 | 10,984 | 10,069 | 9,317 |
41 graphic description end -->
Growth of a $10,000 Investment – Institutional Shares
| Federated Kaufmann Large Cap Fund - Institutional Shares | C000055075 | R1000G | LLCGFI |
| 12/5/2007 | 10,000 | 10,000 | 10,000 |
| 10/31/2008 | 6,900 | 6,516 | 6,337 |
| 10/31/2009 | 8,772 | 7,656 | 7,408 |
| 10/31/2010 | 10,648 | 9,161 | 8,761 |
| 10/31/2011 | 11,275 | 10,069 | 9,317 |
41 graphic description end -->
| 1 | Represents a hypothetical investment of $10,000 in the Fund after deducting applicable sales charges: For Class A Shares, the maximum sales charge of 5.50% ($10,000 investment minus $550 sales charge = $9,450); for Class C Shares, a 1.00% contingent deferred sales charge would be applied to on any redemption less than one year from the purchase date. The Fund's performance assumes the reinvestment of all dividends and distributions. The R1000G and the LLCGFI have been adjusted to reflect the reinvestment of dividends on securities in the R1000G and the funds in the LLCGFI. |
| 2 | The R1000G is not adjusted to reflect expenses or other fees that the Securities and Exchange Commission requires to be reflected in the Fund's performance. The LLCGFI represents the composite performance of the 30 largest funds by assets in the Lipper Large Cap Growth category, and is not adjusted to reflect any sales charges. The R1000G in unmanaged and, unlike the Fund, is not affected by cash flows. It is not possible to invest directly in an index. |
Annual Shareholder Report5
Portfolio of Investments Summary Table (unaudited)
At October 31, 2011, the Fund's sector composition1 was as follows:
| Sector Composition | Percentage of
Total Net Assets |
| Information Technology | 27.5% |
| Consumer Discretionary | 20.0% |
| Industrials | 15.1% |
| Health Care | 12.7% |
| Financials | 10.2% |
| Energy | 6.1% |
| Materials | 6.1% |
| Consumer Staples | 0.2% |
| Cash Equivalents2 | 0.7% |
| Other Assets and Liabilities — Net3 | 1.4% |
| TOTAL | 100.0% |
| 1 | Except for Cash Equivalents and Other Assets and Liabilities, sector classifications are based upon, and individual portfolio securities are assigned to, the classifications of the Global Industry Classification Standard (GICS) except that the Adviser assigns a classification to securities not classified by the GICS and to securities for which the Adviser does not have access to the classification made by the GICS. |
| 2 | Cash Equivalents include any investments in money market mutual funds and/or overnight repurchase agreements. |
| 3 | Assets, other than investments in securities, less liabilities. See Statement of Assets and Liabilities. |
Annual Shareholder Report6
Portfolio of Investments
October 31, 2011
| Shares | | | Value |
| | COMMON STOCKS – 97.9% | |
| | Consumer Discretionary – 20.0% | |
| 452,024 | 1 | Central European Media Enterprises Ltd., Class A | 4,990,345 |
| 2,910,300 | 1 | Genting Singapore PLC | 3,974,004 |
| 119,700 | | Kohl's Corp. | 6,345,297 |
| 187,260 | 1 | Las Vegas Sands Corp. | 8,791,857 |
| 354,200 | 1 | Melco PBL Entertainment (Macau) Ltd., ADR | 4,062,674 |
| 107,000 | 1 | O'Reilly Automotive, Inc. | 8,137,350 |
| 1,878,000 | 1 | Prada Holding SpA | 9,040,619 |
| 163,970 | | Starbucks Corp. | 6,942,490 |
| 119,000 | | Target Corp. | 6,515,250 |
| 39,500 | | Wynn Resorts Ltd. | 5,245,600 |
| | TOTAL | 64,045,486 |
| | Consumer Staples – 0.2% | |
| 540,000 | 1 | Sun Art Retail Group, Ltd. | 691,981 |
| | Energy – 6.1% | |
| 170,000 | | Canadian Natural Resources Ltd. | 6,009,500 |
| 77,300 | | Pioneer Natural Resources, Inc. | 6,485,470 |
| 92,800 | | Schlumberger Ltd. | 6,818,016 |
| | TOTAL | 19,312,986 |
| | Financials – 10.2% | |
| 40,680 | | BlackRock, Inc. | 6,418,897 |
| 153,700 | | Capital One Financial Corp. | 7,017,942 |
| 51,585 | | Goldman Sachs Group, Inc. | 5,651,137 |
| 207,600 | | J.P. Morgan Chase & Co. | 7,216,176 |
| 242,300 | | Wells Fargo & Co. | 6,277,993 |
| | TOTAL | 32,582,145 |
| | Health Care – 12.7% | |
| 67,700 | 1 | Biogen Idec, Inc. | 7,877,572 |
| 219,000 | | Bristol-Myers Squibb Co. | 6,918,210 |
| 92,000 | 1 | Edwards Lifesciences Corp. | 6,938,640 |
| 155,000 | 1 | Express Scripts, Inc., Class A | 7,088,150 |
| 306,600 | 1 | Warner Chilcott PLC | 5,555,592 |
| 91,940 | 1 | Watson Pharmaceuticals, Inc. | 6,174,690 |
| | TOTAL | 40,552,854 |
Annual Shareholder Report7
| Shares | | | Value |
| | Industrials – 15.1% | |
| 92,900 | | Cummins, Inc. | 9,237,047 |
| 146,100 | | Expeditors International Washington, Inc. | 6,662,160 |
| 81,200 | | FedEx Corp. | 6,644,596 |
| 51,900 | | Kuehne & Nagel International AG | 6,424,754 |
| 267,804 | 1 | Owens Corning, Inc. | 7,600,278 |
| 34,200 | | Precision Castparts Corp. | 5,579,730 |
| 318,600 | 1 | United Continental Holdings, Inc. | 6,155,352 |
| | TOTAL | 48,303,917 |
| | Information Technology – 27.5% | |
| 410,000 | | Amadeus IT Holding SA | 7,695,489 |
| 27,425 | 1 | Apple, Inc. | 11,101,092 |
| 105,800 | 1 | Citrix Systems, Inc. | 7,705,414 |
| 266,144 | 1 | EMC Corp. | 6,523,189 |
| 14,850 | 1 | Google, Inc. | 8,800,704 |
| 173,000 | | Intel Corp. | 4,245,420 |
| 121,329 | 1,2,3 | Mail.RU Group Ltd., Series 144A, GDR | 4,179,784 |
| 13,600 | | Mastercard, Inc. | 4,722,464 |
| 151,300 | | Microsoft Corp. | 4,029,119 |
| 495,600 | 1 | NXP Semiconductors NV | 8,905,932 |
| 200,000 | | Oracle Corp. | 6,554,000 |
| 146,700 | | Qualcomm, Inc. | 7,569,720 |
| 62,650 | | Visa, Inc., Class A | 5,842,739 |
| | TOTAL | 87,875,066 |
| | Materials – 6.1% | |
| 118,200 | | BASF SE | 8,590,399 |
| 5,600,000 | 1 | Mongolian Mining Corp. | 4,883,182 |
| 99,370 | | Syngenta AG, ADR | 6,068,526 |
| | TOTAL | 19,542,107 |
| | TOTAL COMMON STOCKS
(IDENTIFIED COST $292,209,169) | 312,906,542 |
| | MUTUAL FUND – 0.7% | |
| 2,168,171 | 4,5 | Federated Prime Value Obligations Fund, Institutional Shares, 0.18%
(AT NET ASSET VALUE) | 2,168,171 |
| | TOTAL INVESTMENTS — 98.6%
(IDENTIFIED COST $294,377,340)6 | 315,074,713 |
| | OTHER ASSETS AND LIABILITIES - NET — 1.4%7 | 4,478,852 |
| | TOTAL NET ASSETS — 100% | $319,553,565 |
Annual Shareholder Report
8
| 1 | Non-income producing security. |
| 2 | Denotes a restricted security that either: (a) cannot be offered for public sale without first being registered, or being able to take advantage of an exemption from registration, under the Securities Act of 1933; or (b) is subject to a contractual restriction on public sales. At October 31, 2011, this restricted security amounted to $4,179,784, which represented 1.3% of total net assets. |
| 3 | Denotes a restricted security that may be resold without restriction to “qualified institutional buyers” as defined in Rule 144A under the Securities Act of 1933 and that the Fund has determined to be liquid under criteria established by the Fund's Board of Trustees (the “Trustees”). At October 31, 2011, this liquid restricted security amounted to $4,179,784, which represented 1.3% of total net assets. |
| 4 | Affiliated holding. |
| 5 | 7-Day net yield. |
| 6 | The cost of investments for federal tax purposes amounts to $297,261,583. |
| 7 | Assets, other than investments in securities, less liabilities. See Statement of Assets and Liabilities. |
Note: The categories of investments are shown as a percentage of total net assets at October 31, 2011.
Various inputs are used in determining the value of the Fund's investments. These inputs are summarized in the three broad levels listed below:
Level 1 — quoted prices in active markets for identical securities, including investment companies with daily net asset values, if applicable.
Level 2 — other significant observable inputs (including quoted prices for similar securities, interest rates, prepayment speeds, credit risk, etc.). Also includes securities valued at amortized cost.
Level 3 — significant unobservable inputs (including the Fund's own assumptions in determining the fair value of investments).
The inputs or methodology used for valuing securities are not an indication of the risk associated with investing in those securities.
The following is a summary of the inputs used, as of October 31, 2011, in valuing the Fund's assets carried at fair value:
| Valuation Inputs | | | | |
| Level 1 —
Quoted
Prices and
Investments in
Mutual Funds | Level 2 —
Other
Significant
Observable
Inputs | Level 3 —
Significant
Unobservable
Inputs | Total |
| Equity Securities: | | | | |
| Common Stock | | | | |
| Domestic | $225,015,744 | $ — | $ — | $225,015,744 |
| International | 42,410,585 | 45,480,2131 | — | 87,890,798 |
| Mutual Fund | 2,168,171 | — | — | 2,168,171 |
| TOTAL SECURITIES | $269,594,500 | $45,480,213 | $ — | $315,074,713 |
| 1 | Includes $3,663,625 of securities transferred from Level 1 to Level 2 because fair value factors were applied to equity securities traded principally in foreign markets to account for significant post market close activity. |
The following acronyms are used throughout this portfolio:
| ADR | — American Depositary Receipt |
| GDR | — Global Depositary Receipt |
See Notes which are an integral part of the Financial Statements
Annual Shareholder Report9
Financial Highlights – Class A Shares
(For a Share Outstanding Throughout Each Period)
| Year Ended October 31, | Period
Ended
10/31/20081 |
| 2011 | 2010 | 2009 |
| Net Asset Value, Beginning of Period | $10.53 | $8.69 | $6.88 | $10.00 |
| Income From Investment Operations: | | | | |
| Net investment income (loss) | (0.04)2 | 0.092 | 0.052 | 0.032 |
| Net realized and unrealized gain (loss) on investments and foreign currency transactions | 0.63 | 1.75 | 1.78 | (3.15) |
| TOTAL FROM INVESTMENT OPERATIONS | 0.59 | 1.84 | 1.83 | (3.12) |
| Less Distributions: | | | | |
| Distributions from net investment income | (0.05) | (0.00)3 | (0.02) | — |
| Distributions from net realized gain on investments and foreign currency transactions | (0.00)3 | — | — | — |
| TOTAL DISTRIBUTIONS | (0.05) | (0.00)3 | (0.02) | — |
| Net Asset Value, End of Period | $11.07 | $10.53 | $8.69 | $6.88 |
| Total Return4 | 5.63% | 21.18% | 26.68% | (31.20)% |
| Ratios to Average Net Assets: | | | | |
| Net expenses | 1.50%5 | 1.50%5 | 1.50%5 | 1.50%6 |
| Net investment income (loss) | (0.37)% | 0.94% | 0.67% | 0.37%6 |
| Expense waiver/reimbursement7 | 0.56% | 0.75% | 1.26% | 1.88%6 |
| Supplemental Data: | | | | |
| Net assets, end of period (000 omitted) | $140,128 | $89,815 | $60,203 | $31,156 |
| Portfolio turnover | 128% | 69% | 170% | 70% |
| 1 | Reflects operations for the period from December 5, 2007 (date of initial investment) to October 31, 2008. |
| 2 | Per share numbers have been calculated using the average shares method. |
| 3 | Represents less than $0.01. |
| 4 | Based on net asset value, which does not reflect the sales charge, redemption fee or contingent deferred sales charge, if applicable. Total returns for periods of less than one year are not annualized. |
| 5 | The net expense ratios are calculated without reduction for fees paid indirectly for expense offset arrangements. The net expense ratios are 1.50%, 1.49% and 1.50% for the years ended October 31, 2011, 2010 and 2009, respectively, after taking into account these expense reductions. |
| 6 | Computed on an annualized basis. |
| 7 | This expense decrease is reflected in both the net expense and the net investment income (loss) ratios shown above. |
See Notes which are an integral part of the Financial Statements
Annual Shareholder Report10
Financial Highlights – Class C Shares
(For a Share Outstanding Throughout Each Period)
| Year Ended October 31, | Period
Ended
10/31/20081 |
| 2011 | 2010 | 2009 |
| Net Asset Value, Beginning of Period | $10.33 | $8.60 | $6.85 | $10.00 |
| Income From Investment Operations: | | | | |
| Net investment income (loss) | (0.13)2 | 0.012 | (0.01)2 | (0.04)2 |
| Net realized and unrealized gain (loss) on investments and foreign currency transactions | 0.62 | 1.72 | 1.76 | (3.11) |
| TOTAL FROM INVESTMENT OPERATIONS | 0.49 | 1.73 | 1.75 | (3.15) |
| Net Asset Value, End of Period | $10.82 | $10.33 | $8.60 | $6.85 |
| Total Return3 | 4.74% | 20.12% | 25.55% | (31.50)% |
| Ratios to Average Net Assets: | | | | |
| Net expenses | 2.33%4 | 2.34%4 | 2.32%4 | 2.33%5 |
| Net investment income (loss) | (1.20)% | 0.14% | (0.12)% | (0.46)%5 |
| Expense waiver/reimbursement6 | 0.48% | 0.68% | 1.19% | 1.82%5 |
| Supplemental Data: | | | | |
| Net assets, end of period (000 omitted) | $69,810 | $47,002 | $32,721 | $16,307 |
| Portfolio turnover | 128% | 69% | 170% | 70% |
| 1 | Reflects operations for the period from December 5, 2007 (date of initial investment) to October 31, 2008. |
| 2 | Per share numbers have been calculated using the average shares method. |
| 3 | Based on net asset value, which does not reflect the sales charge, redemption fee or contingent deferred sales charge, if applicable. Total returns for periods of less than one year are not annualized. |
| 4 | The net expense ratios are calculated without reduction for fees paid indirectly for expense offset arrangements. The net expense ratios are 2.33%, 2.33% and 2.31% for the years ended October 31, 2011, 2010 and 2009, respectively, after taking into account these expense reductions. |
| 5 | Computed on an annualized basis. |
| 6 | This expense decrease is reflected in both the net expense and the net investment income (loss) ratios shown above. |
See Notes which are an integral part of the Financial Statements
Annual Shareholder Report11
Financial Highlights – Class R Shares
(For a Share Outstanding Throughout Each Period)
| Year Ended October 31, | Period
Ended
10/31/20081 |
| 2011 | 2010 | 2009 |
| Net Asset Value, Beginning of Period | $10.40 | $8.63 | $6.87 | $10.00 |
| Income From Investment Operations: | | | | |
| Net investment income (loss) | (0.07)2 | 0.082 | 0.012 | (0.01)2 |
| Net realized and unrealized gain (loss) on investments and foreign currency transactions | 0.61 | 1.69 | 1.78 | (3.12) |
| TOTAL FROM INVESTMENT OPERATIONS | 0.54 | 1.77 | 1.79 | (3.13) |
| Less Distributions: | | | | |
| Distributions from net investment income | (0.03) | — | (0.03) | — |
| Distributions from net realized gain on investments and foreign currency transactions | (0.00)3 | — | — | — |
| TOTAL DISTRIBUTIONS | (0.03) | — | (0.03) | — |
| Net Asset Value, End of Period | $10.91 | $10.40 | $8.63 | $6.87 |
| Total Return4 | 5.20% | 20.51% | 26.12% | (31.30)% |
| Ratios to Average Net Assets: | | | | |
| Net expenses | 1.95%5 | 1.95%5 | 1.95%5 | 1.95%6 |
| Net investment income (loss) | (0.65)% | 0.88% | 0.06% | (0.08)%6 |
| Expense waiver/reimbursement7 | 0.55% | 0.71% | 1.14% | 1.88%6 |
| Supplemental Data: | | | | |
| Net assets, end of period (000 omitted) | $16,393 | $1,901 | $332 | $2 |
| Portfolio turnover | 128% | 69% | 170% | 70% |
| 1 | Reflects operations for the period from December 5, 2007 (date of initial investment) to October 31, 2008. |
| 2 | Per share numbers have been calculated using the average shares method. |
| 3 | Represents less than $0.01. |
| 4 | Based on net asset value. Total returns for periods of less than one year are not annualized. |
| 5 | The net expense ratios are calculated without reduction for fees paid indirectly for expense offset arrangements. The net expense ratios are 1.95%, 1.94% and 1.95% for the years ended October 31, 2011, 2010 and 2009, respectively, after taking into account these expense reductions. |
| 6 | Computed on an annualized basis. |
| 7 | This expense decrease is reflected in both the net expense and the net investment income (loss) ratios shown above. |
See Notes which are an integral part of the Financial Statements
Annual Shareholder Report12
Financial Highlights – Institutional Shares
(For a Share Outstanding Throughout Each Period)
| Year Ended October 31, | Period
Ended
10/31/20081 |
| 2011 | 2010 | 2009 |
| Net Asset Value, Beginning of Period | $10.58 | $8.73 | $6.90 | $10.00 |
| Income From Investment Operations: | | | | |
| Net investment income (loss) | (0.01)2 | 0.162 | 0.072 | 0.052 |
| Net realized and unrealized gain (loss) on investments and foreign currency transactions | 0.63 | 1.70 | 1.79 | (3.15) |
| TOTAL FROM INVESTMENT OPERATIONS | 0.62 | 1.86 | 1.86 | (3.10) |
| Less Distributions: | | | | |
| Distributions from net investment income | (0.07) | (0.01) | (0.03) | — |
| Distributions from net realized gain on investments and foreign currency transactions | (0.00)3 | — | — | — |
| TOTAL DISTRIBUTIONS | (0.07) | (0.01) | (0.03) | — |
| Net Asset Value, End of Period | $11.13 | $10.58 | $8.73 | $6.90 |
| Total Return4 | 5.89% | 21.38% | 27.13% | (31.00)% |
| Ratios to Average Net Assets: | | | | |
| Net expenses | 1.25%5 | 1.25%5 | 1.25%5 | 1.25%6 |
| Net investment income (loss) | (0.10)% | 1.62% | 0.95% | 0.62%6 |
| Expense waiver/reimbursement7 | 0.51% | 0.68% | 1.18% | 1.88%6 |
| Supplemental Data: | | | | |
| Net assets, end of period (000 omitted) | $93,222 | $54,905 | $15,931 | $2,446 |
| Portfolio turnover | 128% | 69% | 170% | 70% |
| 1 | Reflects operations for the period from December 5, 2007 (date of initial investment) to October 31, 2008. |
| 2 | Per share numbers have been calculated using the average shares method. |
| 3 | Represents less than $0.01. |
| 4 | Based on net asset value. Total returns for periods of less than one year are not annualized. |
| 5 | The net expense ratios are calculated without reduction for fees paid indirectly for expense offset arrangements. The net expense ratios are 1.25%, 1.24% and 1.25% for the years ended October 31, 2011, 2010 and 2009, respectively, after taking into account these expense reductions. |
| 6 | Computed on an annualized basis. |
| 7 | This expense decrease is reflected in both the net expense and the net investment income (loss) ratios shown above. |
See Notes which are an integral part of the Financial Statements
Annual Shareholder Report13
Statement of Assets and Liabilities
October 31, 2011
| Assets: | | |
| Total investments in securities, at value including $2,168,171 of investments in an affiliated holding (Note 5) (identified cost $294,377,340) | | $315,074,713 |
| Cash denominated in foreign currencies (identified cost $131) | | 131 |
| Income receivable | | 162,518 |
| Receivable for investments sold | | 6,096,169 |
| Receivable for shares sold | | 882,782 |
| Other assets | | 10,772 |
| TOTAL ASSETS | | 322,227,085 |
| Liabilities: | | |
| Payable for investments purchased | $1,715,357 | |
| Payable for shares redeemed | 621,731 | |
| Payable for transfer and dividend disbursing agent fees and expenses | 72,150 | |
| Payable for distribution services fee (Note 5) | 47,285 | |
| Payable for shareholder services fee (Note 5) | 97,801 | |
| Accrued expenses | 119,196 | |
| TOTAL LIABILITIES | | 2,673,520 |
| Net assets for 28,989,398 shares outstanding | | $319,553,565 |
| Net Assets Consist of: | | |
| Paid-in capital | | $289,024,965 |
| Net unrealized appreciation of investments and translation of assets and liabilities in foreign currency | | 20,696,604 |
| Accumulated net realized gain on investments and foreign currency transactions | | 9,831,996 |
| TOTAL NET ASSETS | | $319,553,565 |
Annual Shareholder Report14
Statement of Assets and Liabilities — continued| Net Asset Value, Offering Price and Redemption Proceeds Per Share | | |
| Class A Shares: | | |
| Net asset value per share ($140,128,281 ÷ 12,660,061 shares outstanding), no par value, unlimited shares authorized | | $11.07 |
| Offering price per share (100/94.50 of $11.07) | | $11.71 |
| Redemption proceeds per share | | $11.07 |
| Class C Shares: | | |
| Net asset value per share ($69,810,219 ÷ 6,449,261 shares outstanding), no par value, unlimited shares authorized | | $10.82 |
| Offering price per share | | $10.82 |
| Redemption proceeds per share (99.00/100 of $10.82) | | $10.71 |
| Class R Shares: | | |
| Net asset value per share ($16,393,319 ÷ 1,503,218 shares outstanding), no par value, unlimited shares authorized | | $10.91 |
| Offering price per share | | $10.91 |
| Redemption proceeds per share | | $10.91 |
| Institutional Shares: | | |
| Net asset value per share ($93,221,746 ÷ 8,376,858 shares outstanding), no par value, unlimited shares authorized | | $11.13 |
| Offering price per share | | $11.13 |
| Redemption proceeds per share | | $11.13 |
See Notes which are an integral part of the Financial Statements
Annual Shareholder Report15
Statement of Operations
Year Ended October 31, 2011
| Investment Income: | | | |
| Dividends (including $14,034 received from an affiliated holding (Note 5) and net of foreign taxes withheld of $89,964) | | | $3,194,261 |
| Interest | | | 123,409 |
| TOTAL INCOME | | | 3,317,670 |
| Expenses: | | | |
| Investment adviser fee (Note 5) | | $4,140,666 | |
| Administrative fee (Note 5) | | 270,000 | |
| Custodian fees | | 110,613 | |
Transfer and dividend disbursing agent fees and
expenses (Note 2) | | 362,031 | |
| Directors'/Trustees' fees | | 2,441 | |
| Auditing fees | | 49,737 | |
| Legal fees | | 6,185 | |
| Portfolio accounting fees | | 121,541 | |
| Distribution services fee (Note 5) | | 521,198 | |
| Shareholder services fee (Note 5) | | 507,303 | |
| Account administration fee (Note 2) | | 4,388 | |
| Share registration costs | | 110,185 | |
| Printing and postage | | 65,837 | |
| Insurance premiums | | 4,460 | |
| Miscellaneous | | 3,422 | |
| TOTAL EXPENSES | | 6,280,007 | |
Annual Shareholder Report16
Statement of Operations — continued| Waivers, Reimbursements and Reduction: | | | |
| Waiver/reimbursement of investment adviser fee (Note 5) | $(1,351,740) | | |
| Waiver of administrative fee (Note 5) | (48,875) | | |
| Waiver of distribution services fee (Note 5) | (3,432) | | |
| Reimbursement of shareholder services fee (Note 5) | (325) | | |
| Reimbursement of transfer and dividend disbursing agent fees and expenses (Note 2) and (Note 5) | (132,978) | | |
Fees paid indirectly from directed brokerage
arrangements (Note 6) | (227) | | |
| TOTAL WAIVERS, REIMBURSEMENTS AND REDUCTION | | $(1,537,577) | |
| Net expenses | | | $4,742,430 |
| Net investment income (loss) | | | (1,424,760) |
| Realized and Unrealized Gain (Loss) on Investments and Foreign Currency Transactions: | | | |
| Net realized gain on investments and foreign currency transactions (net of foreign taxes withheld of $5,322) | | | 16,936,568 |
| Net change in unrealized appreciation of investments and translation of assets and liabilities in foreign currency | | | (8,583,489) |
| Net realized and unrealized gain on investments and foreign currency transactions | | | 8,353,079 |
| Change in net assets resulting from operations | | | $6,928,319 |
See Notes which are an integral part of the Financial Statements
Annual Shareholder Report17
Statement of Changes in Net Assets
| Year Ended October 31 | 2011 | 2010 |
| Increase (Decrease) in Net Assets | | |
| Operations: | | |
| Net investment income (loss) | $(1,424,760) | $1,298,748 |
| Net realized gain on investments and foreign currency transactions | 16,936,568 | 2,885,944 |
| Net change in unrealized appreciation/depreciation of investments and translation of assets and liabilities in foreign currency | (8,583,489) | 22,305,970 |
| CHANGE IN NET ASSETS RESULTING FROM OPERATIONS | 6,928,319 | 26,490,662 |
| Distributions to Shareholders: | | |
| Distributions from net investment income | | |
| Class A Shares | (535,880) | (5,325) |
| Class R Shares | (6,861) | — |
| Institutional Shares | (401,071) | (30,127) |
| Distributions from net realized gain on investments | | |
| Class A Shares | (230) | — |
| Class R Shares | (3) | — |
| Institutional Shares | (173) | — |
| CHANGE IN NET ASSETS RESULTING FROM DISTRIBUTIONS TO SHAREHOLDERS | (944,218) | (35,452) |
| Share Transactions: | | |
| Proceeds from sale of shares | 227,200,879 | 119,491,384 |
| Net asset value of shares issued to shareholders in payment of distributions declared | 837,341 | 34,528 |
| Cost of shares redeemed | (108,091,891) | (61,544,163) |
| CHANGE IN NET ASSETS RESULTING FROM SHARE TRANSACTIONS | 119,946,329 | 57,981,749 |
| Change in net assets | 125,930,430 | 84,436,959 |
| Net Assets: | | |
| Beginning of period | 193,623,135 | 109,186,176 |
| End of period (including undistributed net investment income of $0 and $943,812, respectively) | $319,553,565 | $193,623,135 |
See Notes which are an integral part of the Financial Statements
Annual Shareholder Report18
Notes to Financial Statements
October 31, 2011
1. ORGANIZATION
Federated Equity Funds (the “Trust”) is registered under the Investment Company Act of 1940, as amended (the “Act”), as an open-end management investment company. The Trust consists of 13 portfolios. The financial statements included herein are only those of Federated Kaufmann Large Cap Fund (the “Fund”), a diversified portfolio. The financial statements of the other portfolios are presented separately. The assets of each portfolio are segregated and a shareholder's interest is limited to the portfolio in which shares are held. Each portfolio pays its own expenses. The Fund offers four classes of shares: Class A Shares, Class C Shares, Class R Shares and Institutional Shares. All shares of the Fund have equal rights with respect to voting, except on class-specific matters. The investment objective of the Fund is to provide capital appreciation.
2. SIGNIFICANT ACCOUNTING POLICIES
The following is a summary of significant accounting policies consistently followed by the Fund in the preparation of its financial statements. These policies are in conformity with U.S. generally accepted accounting principles (GAAP).
Investment Valuation
In calculating its net asset value (NAV), the Fund generally values investments as follows:
- Equity securities listed on an exchange or traded through a regulated market system are valued at their last reported sale price or official closing price in their principal exchange or market.
- Fixed-income securities acquired with remaining maturities greater than 60 days are fair valued using price evaluations provided by a pricing service approved by the Trustees.
- Fixed-income securities acquired with remaining maturities of 60 days or less are valued at their cost (adjusted for the accretion of any discount or amortization of any premium), which approximates market value.
- Shares of other mutual funds are valued based upon their reported NAVs.
- Derivative contracts listed on exchanges are valued at their reported settlement or closing price.
- Over-the-counter (OTC) derivative contracts are fair valued using price evaluations provided by a pricing service approved by the Trustees.
- For securities that are fair valued in accordance with procedures established by and under the general supervision of the Trustees, certain factors may be considered such as: the purchase price of the security, information obtained by contacting the issuer, analysis of the issuer's financial statements or other available documents, fundamental analytical data, the nature and duration of restrictions on disposition, the movement of the market in which the security is normally traded and public trading in similar securities of the issuer or comparable issuers.
If the Fund cannot obtain a price or price evaluation from a pricing service for an investment, the Fund may attempt to value the investment based upon the mean of bid and asked quotations or fair value the investment based on price evaluations, from one or more dealers. If any price, quotation, price evaluation or other pricing source is not readily available when the NAV is calculated, the Fund uses the fair value of the investment determined in accordance with the procedures described below. There can be no assurance that the Fund could purchase or sell an investment at the price used to calculate the Fund's NAV.
Annual Shareholder Report
19
Fair Valuation and Significant Events ProceduresThe Trustees have authorized the use of pricing services to provide evaluations of the current fair value of certain investments for purposes of calculating the NAV. Factors considered by pricing services in evaluating an investment include the yields or prices of investments of comparable quality, coupon, maturity, call rights and other potential prepayments, terms and type, reported transactions, indications as to values from dealers and general market conditions. Some pricing services provide a single price evaluation reflecting the bid-side of the market for an investment (a “bid” evaluation). Other pricing services offer both bid evaluations and price evaluations indicative of a price between the prices bid and asked for the investment (a “mid” evaluation). The Fund normally uses bid evaluations for U.S. Treasury and Agency securities and mortgage-backed securities. The Fund normally uses mid evaluations for other types of fixed-income securities and OTC derivative contracts. In the event that market quotations and price evaluations are not available for an investment, the fair value of the investment is determined in accordance with procedures adopted by the Trustees.
The Trustees also have adopted procedures requiring an investment to be priced at its fair value whenever the Adviser determines that a significant event affecting the value of the investment has occurred between the time as of which the price of the investment would otherwise be determined and the time as of which the NAV is computed. An event is considered significant if there is both an affirmative expectation that the investment's value will change in response to the event and a reasonable basis for quantifying the resulting change in value. Examples of significant events that may occur after the close of the principal market on which a security is traded, or after the time of a price evaluation provided by a pricing service or a dealer, include:
- With respect to securities traded in foreign markets, significant trends in U.S. equity markets or in the trading of foreign securities index futures or options contracts;
- With respect to price evaluations of fixed-income securities determined before the close of regular trading on the NYSE, actions by the Federal Reserve Open Market Committee and other significant trends in U.S. fixed-income markets;
- Political or other developments affecting the economy or markets in which an issuer conducts its operations or its securities are traded; and
- Announcements concerning matters such as acquisitions, recapitalizations, litigation developments, a natural disaster affecting the issuer's operations or regulatory changes or market developments affecting the issuer's industry.
The Trustees have approved the use of a pricing service to determine the fair value of equity securities traded principally in foreign markets when the Adviser determines that there has been a significant trend in the U.S. equity markets or in index futures trading. For other significant events, the Fund may seek to obtain more current quotations or price evaluations from alternative pricing sources. If a reliable alternative pricing source is not available, the Fund will determine the fair value of the investment using another method approved by the Trustees.
Repurchase Agreements
The Fund may invest in repurchase agreements for short-term liquidity purposes. It is the policy of the Fund to require the other party to a repurchase agreement to transfer to the Fund's custodian or sub-custodian eligible securities or cash with a market value (after transaction costs) at least equal to the repurchase price to be paid under the repurchase agreement. The eligible securities are transferred to accounts with the custodian or sub-custodian in which the Fund holds a “securities entitlement” and exercises “control” as those terms are defined in the Uniform Commercial Code. The Fund has established procedures for Annual Shareholder Report
20
monitoring the market value of the transferred securities and requiring the transfer of additional eligible securities if necessary to equal at least the repurchase price. These procedures also allow the other party to require securities to be transferred from the account to the extent that their market value exceeds the repurchase price or in exchange for other eligible securities of equivalent market value.The insolvency of the other party or other failure to repurchase the securities may delay the disposition of the underlying securities or cause the Fund to receive less than the full repurchase price. Under the terms of the repurchase agreement, any amounts received by the Fund in excess of the repurchase price and related transaction costs must be remitted to the other party.
The Fund may enter into repurchase agreements in which eligible securities are transferred into joint trading accounts maintained by the custodian or sub-custodian for investment companies and other clients advised by the Fund's Adviser and its affiliates. The Fund will participate on a pro rata basis with the other investment companies and clients in its share of the securities transferred under such repurchase agreements and in its share of proceeds from any repurchase or other disposition of such securities.
Investment Income, Gains and Losses, Expenses and Distributions
Investment transactions are accounted for on a trade-date basis. Realized gains and losses from investment transactions are recorded on an identified-cost basis. Interest income and expenses are accrued daily. Dividend income and distributions to shareholders are recorded on the ex-dividend date. Foreign dividends are recorded on the ex-dividend date or when the Fund is informed of the ex-dividend date. Distributions of net investment income, if any, are declared and paid annually. Non-cash dividends included in dividend income, if any, are recorded at fair value. Investment income, realized and unrealized gains and losses, and certain fund-level expenses are allocated to each class based on relative average daily net assets, except that Class A Shares, Class C Shares, Class R Shares and Institutional Shares may bear distribution services fees, shareholder services fees, account administration fees and certain transfer and dividend disbursing agent fees unique to those classes. For the year ended October 31, 2011, transfer and dividend disbursing agent fees and account administration fees for the Fund were as follows:
| Transfer and
Dividend
Disbursing
Agent Fees
Incurred | Transfer and
Dividend
Disbursing
Agent Fees
Reimbursed | Account
Administration
Fees Incurred |
| Class A Shares | $184,962 | $(107,278) | $4,025 |
| Class C Shares | 89,024 | — | 363 |
| Class R Shares | 18,044 | — | — |
| Institutional Shares | 70,001 | (25,700) | — |
| TOTAL | $362,031 | $(132,978) | $4,388 |
Dividends are declared separately for each class. No class has preferential dividend rights; differences in per share dividend rates are generally due to differences in separate class expenses.
Annual Shareholder Report
21
Premium and Discount AmortizationAll premiums and discounts on fixed-income securities are amortized/accreted using the effective interest rate method.
Federal Taxes
It is the Fund's policy to comply with the Subchapter M provision of the Internal Revenue Code and to distribute to shareholders each year substantially all of its income. Accordingly, no provision for federal income tax is necessary. As of and during the year ended October 31, 2011, the Fund did not have a liability for any uncertain tax positions. The Fund recognizes interest and penalties, if any, related to tax liabilities as income tax expense in the Statement of Operations. As of October 31, 2011, tax years 2008 through 2011 remain subject to examination by the Fund's major tax jurisdictions, which include the United States of America and the Commonwealth of Massachusetts.
The Fund may be subject to taxes imposed by governments of countries in which it invests. Such taxes are generally based on either income or gains earned or repatriated. The Fund accrues and applies such taxes to net investment income, net realized gains and net unrealized gains as income and/or gains are earned.
When-Issued and Delayed Delivery Transactions
The Fund may engage in when-issued or delayed delivery transactions. The Fund records when-issued securities on the trade date and maintains security positions such that sufficient liquid assets will be available to make payment for the securities purchased. Securities purchased on a when-issued or delayed delivery basis are marked to market daily and begin earning interest on the settlement date. Losses may occur on these transactions due to changes in market conditions or the failure of counterparties to perform under the contract.
Restricted Securities
The Fund may purchase securities which are considered restricted. Restricted securities are securities that either: (a) cannot be offered for public sale without first being registered, or being able to take advantage of an exemption from registration, under the Securities Act of 1933; or (b) are subject to contractual restrictions on public sales. In some cases, when a security cannot be offered for public sale without first being registered, the issuer of the restricted security has agreed to register such securities for resale, at the issuer's expense, either upon demand by the Fund or in connection with another registered offering of the securities. Many such restricted securities may be resold in the secondary market in transactions exempt from registration. Restricted securities may be determined to be liquid under criteria established by the Trustees. The Fund will not incur any registration costs upon such resales. The Fund's restricted securities are valued at the price provided by dealers in the secondary market or, if no market prices are available, at the fair value as determined in accordance with procedures established by and under the general supervision of the Trustees.
Foreign Exchange Contracts
The Fund enters into foreign exchange contracts for the delayed delivery of securities or foreign currency exchange transactions. The Fund enters into foreign exchange contracts to protect assets against adverse changes in foreign currency exchange rates or exchange control regulations. Purchased contracts are used to acquire exposure to foreign currencies, whereas, contracts to sell are used to hedge the Fund's securities against currency fluctuations. Risks may arise upon entering into these transactions from the potential inability Annual Shareholder Report
22
of counterparties to meet the terms of their commitments and from unanticipated movements in security prices or foreign exchange rates. The foreign exchange contracts are adjusted by the daily exchange rate of the underlying currency and any gains or losses are recorded for financial statement purposes as unrealized until the settlement date.At October 31, 2011, the Fund had no outstanding foreign exchange contracts.
Foreign Currency Translation
The accounting records of the Fund are maintained in U.S. dollars. All assets and liabilities denominated in foreign currencies (FCs) are translated into U.S. dollars based on the rates of exchange of such currencies against U.S. dollars on the date of valuation. Purchases and sales of securities, income and expenses are translated at the rate of exchange quoted on the respective date that such transactions are recorded. The Fund does not isolate that portion of the results of operations resulting from changes in foreign exchange rates on investments from the fluctuations arising from changes in market prices of securities held. Such fluctuations are included with the net realized and unrealized gain or loss from investments.
Reported net realized foreign exchange gains or losses arise from sales of portfolio securities, sales and maturities of short-term securities, sales of FCs, currency gains or losses realized between the trade and settlement dates on securities transactions, the difference between the amounts of dividends, interest and foreign withholding taxes recorded on the Fund's books, and the U.S. dollar equivalent of the amounts actually received or paid. Net unrealized foreign exchange gains and losses arise from changes in the value of assets and liabilities other than investments in securities at fiscal year end, resulting from changes in the exchange rate.
Additional Disclosure Related to Derivative Instruments
The Effect of Derivative Instruments on the Statement of Operations for the Year Ended October 31, 2011
| Amount of Realized Gain or (Loss) on Derivatives Recognized in Income |
| Forward
Currency
Contracts |
| Foreign exchange contracts | $(52,479) |
| Change in Unrealized Appreciation or (Depreciation) on Derivatives Recognized in Income |
| Forward
Currency
Contracts |
| Foreign exchange contracts | $3,028 |
Other
The preparation of financial statements in conformity with GAAP requires management to make estimates and assumptions that affect the amounts of assets, liabilities, expenses and revenues reported in the financial statements. Actual results could differ from those estimated.
Annual Shareholder Report
23
3. SHARES OF BENEFICIAL INTERESTThe following tables summarize share activity:
| Year Ended October 31 | 2011 | 2010 |
| Class A Shares: | Shares | Amount | Shares | Amount |
| Shares sold | 10,669,802 | $119,261,751 | 6,460,025 | $62,410,665 |
| Shares issued to shareholders in payment of distributions declared | 44,303 | 497,523 | 491 | 4,583 |
| Shares redeemed | (6,585,333) | (72,988,781) | (4,854,801) | (46,090,785) |
NET CHANGE RESULTING FROM
CLASS A SHARE TRANSACTIONS | 4,128,772 | $46,770,493 | 1,605,715 | $16,324,463 |
| Year Ended October 31 | 2011 | 2010 |
| Class C Shares: | Shares | Amount | Shares | Amount |
| Shares sold | 3,339,989 | $37,039,734 | 2,020,654 | $19,133,840 |
| Shares redeemed | (1,439,791) | (15,675,897) | (1,275,313) | (11,931,163) |
NET CHANGE RESULTING FROM
CLASS C SHARE TRANSACTIONS | 1,900,198 | $21,363,837 | 745,341 | $7,202,677 |
| Year Ended October 31 | 2011 | 2010 |
| Class R Shares: | Shares | Amount | Shares | Amount |
| Shares sold | 1,573,657 | $17,644,634 | 190,327 | $1,822,904 |
| Shares issued to shareholders in payment of distributions declared | 618 | 6,864 | — | — |
| Shares redeemed | (253,821) | (2,723,526) | (46,086) | (446,273) |
NET CHANGE RESULTING FROM
CLASS R SHARE TRANSACTIONS | 1,320,454 | $14,927,972 | 144,241 | $1,376,631 |
| Year Ended October 31 | 2011 | 2010 |
| Institutional Shares: | Shares | Amount | Shares | Amount |
| Shares sold | 4,683,381 | $53,254,760 | 3,684,820 | $36,123,975 |
| Shares issued to shareholders in payment of distributions declared | 29,543 | 332,954 | 3,199 | 29,945 |
| Shares redeemed | (1,526,565) | (16,703,687) | (323,202) | (3,075,942) |
NET CHANGE RESULTING FROM
INSTITUTIONAL SHARE TRANSACTIONS | 3,186,359 | $36,884,027 | 3,364,817 | $33,077,978 |
NET CHANGE RESULTING FROM
TOTAL FUND SHARE TRANSACTIONS | 10,535,783 | $119,946,329 | 5,860,114 | $57,981,749 |
Annual Shareholder Report
24
4. FEDERAL TAX INFORMATIONThe timing and character of income and capital gain distributions are determined in accordance with income tax regulations, which may differ from GAAP. These differences are primarily due to differing treatments for foreign currency transactions, net operating losses and discount accretion/premium amortization on debt securities.
For the year ended October 31, 2011, permanent differences identified and reclassified among the components of net assets were as follows:
| Increase (Decrease) |
| Paid-In Capital | Undistributed
Net Investment
Income (Loss) | Accumulated
Net Realized
Gain (Loss) |
| $(1,150,034) | $1,424,760 | $(274,726) |
Net investment income (loss), net realized gains (losses) and net assets were not affected by this reclassification.
The tax character of distributions as reported on the Statement of Changes in Net Assets for the years ended October 31, 2011 and 2010, was as follows:
| 2011 | 2010 |
| Ordinary income | $943,812 | $35,452 |
| Long-term capital gains | $406 | $ — |
As of October 31, 2011, the components of distributable earnings on a tax basis were as follows:
| Undistributed long-term capital gains | $12,716,239 |
| Net unrealized appreciation | $17,812,361 |
The difference between book-basis and tax-basis net unrealized appreciation/depreciation is attributable to the deferral of losses on wash sales.
At October 31, 2011, the cost of investments for federal tax purposes was $297,261,583. The net unrealized appreciation of investments for federal tax purposes excluding any unrealized appreciation/depreciation resulting from changes in foreign currency exchange rates was $17,813,130. This consists of net unrealized appreciation from investments for those securities having an excess of value over cost of $30,180,700 and net unrealized depreciation from investments for those securities having an excess of cost over value of $12,367,570.
The Fund used capital loss carryforwards of $6,012,777 to offset taxable capital gains realized during the year ended October 31, 2011.
Annual Shareholder Report
25
5. INVESTMENT ADVISER FEE AND OTHER TRANSACTIONS WITH AFFILIATESInvestment Adviser Fee
Federated Equity Management Company of Pennsylvania is the Fund's investment adviser (the “Adviser”). The advisory agreement between the Fund and the Adviser provides for an annual fee equal to 1.425% of the Fund's average daily net assets. Subject to the terms described in the Expense Limitation note, the Adviser may voluntarily choose to waive any portion of its fee and/or reimburse certain operating expenses of the Fund. For the year ended October 31, 2011, the Adviser voluntarily waived $1,342,119 of its fee. In addition, an affiliate of the Adviser reimbursed $132,978 of transfer and dividend disbursing agent fees and expenses.
Certain of the Fund's assets are managed by Federated Global Investment Management Corp. (the “Sub-Adviser”). Under the terms of a sub-advisory agreement between the Adviser and the Sub-Adviser, the Sub-Adviser receives an allocable portion of the Fund's adviser fee. The fee is paid by the Adviser out of its resources and is not an incremental Fund expense. For the year ended October 31, 2011, the Sub-Adviser earned a fee of $3,414,233.
Administrative Fee
Federated Administrative Services (FAS), under the Administrative Services Agreement, provides the Fund with administrative personnel and services. The fee paid to FAS is based on the average aggregate daily net assets of certain Federated funds as specified below:
| Administrative Fee | Average Aggregate Daily Net Assets
of the Federated Funds |
| 0.150% | on the first $5 billion |
| 0.125% | on the next $5 billion |
| 0.100% | on the next $10 billion |
| 0.075% | on assets in excess of $20 billion |
The administrative fee received during any fiscal year shall be at least $150,000 per portfolio and $40,000 per each additional class of Shares. Subject to the terms described in the Expense Limitation note, FAS may voluntarily choose to waive any portion of its fee. For the year ended October 31, 2011, the net fee paid to FAS was 0.076% of average daily net assets of the Fund. FAS waived $48,875 of its fee.
Distribution Services Fee
The Fund has adopted a Distribution Plan (the “Plan”) pursuant to Rule 12b-1 under the Act. Under the terms of the Plan, the Fund will compensate Federated Securities Corp. (FSC), the principal distributor, from the daily net assets of the Fund's Class A Shares, Class C Shares and Class R Shares to finance activities intended to result in the sale of these shares. The Plan provides that the Fund may incur distribution expenses at the following percentages of average daily net assets annually, to compensate FSC:
| Share Class Name | Percentage of Average Daily
Net Assets of Class |
| Class A Shares | 0.25% |
| Class C Shares | 0.75% |
| Class R Shares | 0.50% |
Annual Shareholder Report
26
Subject to the terms described in the Expense Limitation note, FSC may voluntarily choose to waive any portion of its fee. For the year ended October 31, 2011, distribution services fees for the Fund were as follows: | Distribution
Services
Fees Incurred | Distribution
Services
Fees Waived |
| Class C Shares | $491,674 | $ — |
| Class R Shares | 29,524 | (3,432) |
| TOTAL | $521,198 | $(3,432) |
When FSC receives fees, it may pay some or all of them to financial intermediaries whose customers purchase shares. For the year ended October 31, 2011, FSC retained $158,741 of fees paid by the Fund. For the year ended October 31, 2011, the Fund's Class A Shares did not incur a distribution services fee; however, it may begin to incur this fee upon approval of the Trustees.
Sales Charges
Front-end sales charges and contingent deferred sales charges (CDSC) do not represent expenses of the Fund. They are deducted from the proceeds of sales of Fund shares prior to investment or from redemption proceeds prior to remittance, as applicable. For the year ended October 31, 2011, FSC retained $80,614 in sales charges from the sale of Class A Shares. FSC also retained $3,510 of CDSC relating to redemptions of Class C Shares.
Shareholder Services Fee
The Fund may pay fees (“Service Fees”) up to 0.25% of the average daily net assets of the Fund's Class A Shares and Class C Shares to financial intermediaries or to Federated Shareholder Services Company (FSSC) for providing services to shareholders and maintaining shareholder accounts. Subject to the terms described in the Expense Limitation note, FSSC may voluntarily reimburse the Fund for Service Fees. For the year ended October 31, 2011, Service Fees for the Fund were as follows:
| Service
Fees
Incurred | Service
Fees
Reimbursed |
| Class A Shares | $343,775 | $(325) |
| Class C Shares | 163,528 | — |
| TOTAL | $507,303 | $(325) |
For the year ended October 31, 2011, FSSC did not receive any fees paid by the Fund.
Annual Shareholder Report
27
Expense LimitationThe Adviser and its affiliates (which may include FSC, FAS and FSSC) have voluntarily agreed to waive their fees and/or reimburse expenses so that the total annual fund operating expenses (as shown in the financial highlights) paid by the Fund's Class A Shares, Class C Shares, Class R Shares and Institutional Shares (after the voluntary waivers and/or reimbursements) will not exceed 1.50%, 2.34%, 1.95% and 1.25% (the “Fee Limit”), respectively, up to but not including the later of (the “Termination Date”): (a) January 1, 2013; or (b) the date of the Fund's next effective Prospectus. While the Adviser and its affiliates currently do not anticipate terminating or increasing these arrangements prior to the Termination Date, these arrangements may only be terminated or the Fee Limit increased prior to the Termination Date with the agreement of the Trustees.
Interfund Transactions
During the year ended October 31, 2011, the Fund engaged in purchase and sale transactions with funds that have a common investment adviser (or affiliated investment advisers), common Directors/Trustees, and/or common Officers. These purchase and sale transactions complied with Rule 17a-7 under the Act and amounted to $2,550,408 and $0, respectively.
General
Certain Officers and Trustees of the Fund are Officers and Directors or Trustees of the above companies.
Transactions Involving Affiliated Holdings
Affiliated holdings are mutual funds which are managed by the Adviser or an affiliate of the Adviser. The Adviser has agreed to reimburse the Fund for certain investment adviser fees as a result of transactions in other affiliated mutual funds. For the year ended October 31, 2011, the Adviser reimbursed $9,621. Transactions involving the affiliated holding during the year ended October 31, 2011, were as follows:
| Federated Prime Value
Obligations Fund,
Institutional Shares |
| Balance of Shares Held 10/31/2010 | 10,960,532 |
| Purchases/Additions | 229,734,443 |
| Sales/Reductions | 238,526,804 |
| Balance of Shares Held 10/31/2011 | 2,168,171 |
| Value | $2,168,171 |
| Dividend Income | $14,034 |
6. EXPENSE Reduction
The Fund directs portfolio trades to a broker that in turn pays a portion of the Fund's operating expenses. For the year ended October 31, 2011, the Fund's expenses were reduced by $227 under these arrangements.
Annual Shareholder Report
28
7. Investment TRANSACTIONSPurchases and sales of investments, excluding long-term U.S. government securities and short-term obligations, for the year ended October 31, 2011, were as follows:
| Purchases | $481,000,262 |
| Sales | $359,977,041 |
8. CONCENTRATION OF RISK
The Fund invests in securities of non-U.S. issuers. Political or economic developments may have an effect on the liquidity and volatility of portfolio securities and currency holdings.
9. LINE OF CREDIT
The Fund participates in a $100,000,000 unsecured, uncommitted revolving line of credit (LOC) agreement with PNC Bank. The LOC was made available for extraordinary or emergency purposes, primarily for financing redemption payments. Borrowings are charged interest at a rate offered to the Fund by PNC Bank at the time of the borrowing. As of October 31, 2011, there were no outstanding loans. During the year ended October 31, 2011, the Fund did not utilize the LOC.
10. INTERFUND LENDING
Pursuant to an Exemptive Order issued by the Securities and Exchange Commission, the Fund, along with other funds advised by subsidiaries of Federated Investors, Inc., may participate in an interfund lending program. This program provides an alternative credit facility allowing the Fund to borrow from other participating affiliated funds. As of October 31, 2011, there were no outstanding loans. During the year ended October 31, 2011, the program was not utilized.
11. RECENT ACCOUNTING PRONOUNCEMENTS
In April 2011, the Financial Accounting Standards Board (FASB) released Accounting Standards Update (ASU) No. 2011-03, “Reconsideration of Effective Control for Repurchase Agreements.” This ASU amends FASB Accounting Standards Codification (ASC) Topic 860, “Transfers and Servicing”; specifically the criteria required to determine whether a repurchase agreement and similar agreements should be accounted for as sales of financial assets or secured borrowings with commitments. This ASU is effective for fiscal years and interim periods beginning after December 15, 2011. At this time, management is evaluating the implications of adopting ASU No. 2011-03 and its impact on the Fund's financial statements and the accompanying notes, net assets and results of operations.
In addition, in May 2011, FASB released ASU No. 2011-04, “Amendments to Achieve Common Fair Value Measurement and Disclosure Requirements in U.S. GAAP and IFRSs.” This ASU amends FASB ASC Topic 820, “Fair Value Measurement,” to establish common requirements for measuring fair value and for disclosing information about fair value measurements in accordance with GAAP. This ASU is effective for fiscal years and interim periods beginning after December 15, 2011. At this time, management is evaluating the implications of adopting ASU No. 2011-04 and its impact on the Fund's financial statements and the accompanying notes.
Annual Shareholder Report
29
12. FEDERAL TAX INFORMATION (UNAUDITED)For the year ended October 31, 2011, the amount of long-term capital gains designated by the Fund was $406.
For the fiscal year ended October 31, 2011, 100.0% of total ordinary income distributions made by the Fund are qualifying dividends which may be subject to a maximum tax rate of 15%, as provided for by the Jobs and Growth Tax Relief Act of 2003. Complete information is reported in conjunction with the reporting of your distributions on Form 1099-DIV.
Of the ordinary income distributions made by the Fund during the year ended October 31, 2011, 100.0% qualify for the dividend received deduction available to corporate shareholders.
Annual Shareholder Report30
Report of Independent Registered Public Accounting Firm
TO THE BOARD OF Trustees OF Federated Equity Funds AND SHAREHOLDERS OF Federated Kaufmann Large Cap Fund:
We have audited the accompanying statement of assets and liabilities of Federated Kaufmann Large Cap Fund (the “Fund”) (one of the portfolios constituting Federated Equity Funds), including the portfolio of investments, as of October 31, 2011, and the related statement of operations for the year then ended, the statement of changes in net assets for each of the two years in the period then ended, and the financial highlights for each of the periods indicated therein. These financial statements and financial highlights are the responsibility of the Fund's management. Our responsibility is to express an opinion on these financial statements and financial highlights based on our audits.
We conducted our audits in accordance with standards of the Public Company Accounting Oversight Board (United States). Those standards require that we plan and perform the audit to obtain reasonable assurance about whether the financial statements and financial highlights are free of material misstatement. We were not engaged to perform an audit of the Fund's internal control over financial reporting. Our audits included consideration of internal control over financial reporting as a basis for designing audit procedures that are appropriate in the circumstances, but not for the purpose of expressing an opinion on the effectiveness of the Fund's internal control over financial reporting. Accordingly, we express no such opinion. An audit also includes examining, on a test basis, evidence supporting the amounts and disclosures in the financial statements and financial highlights, assessing the accounting principles used and significant estimates made by management, and evaluating the overall financial statement presentation. Our procedures included confirmation of securities owned as of October 31, 2011, by correspondence with the custodian and others or by other appropriate auditing procedures where replies from others were not received. We believe that our audits provide a reasonable basis for our opinion.
In our opinion, the financial statements and financial highlights referred to above present fairly, in all material respects, the financial position of the Federated Kaufmann Large Cap Fund, a portfolio of Federated Equity Funds, at October 31, 2011, the results of its operations for the year then ended, the changes in its net assets for each of the two years in the period then ended, and the financial highlights for each of the periods indicated therein, in conformity with U.S. generally accepted accounting principles.
Boston, Massachusetts
December 23, 2011
Annual Shareholder Report31
Shareholder Expense Example (unaudited)
As a shareholder of the Fund, you incur two types of costs: (1) transaction costs, including sales charges (loads) on purchase or redemption payments; and (2) ongoing costs, including management fees and to the extent applicable, distribution (12b-1) fees and/or shareholder services fees and other Fund expenses. This Example is intended to help you to understand your ongoing costs (in dollars) of investing in the Fund and to compare these costs with the ongoing costs of investing in other mutual funds. It is based on an investment of $1,000 invested at the beginning of the period and held for the entire period from May 1, 2011 to October 31, 2011.
ACTUAL EXPENSES
The first section of the table below provides information about actual account values and actual expenses. You may use the information in this section, together with the amount you invested, to estimate the expenses that you incurred over the period. Simply divide your account value by $1,000 (for example, an $8,600 account value divided by $1,000 = 8.6), then multiply the result by the number in the first section under the heading entitled “Expenses Paid During Period” to estimate the expenses attributable to your investment during this period.
HYPOTHETICAL EXAMPLE FOR COMPARISON PURPOSES
The second section of the table below provides information about hypothetical account values and hypothetical expenses based on the Fund's actual expense ratio and an assumed rate of return of 5% per year before expenses, which is not the Fund's actual return. Thus, you should not use the hypothetical account values and expenses to estimate the actual ending account balance or your expenses for the period. Rather, these figures are required to be provided to enable you to compare the ongoing costs of investing in the Fund with other funds. To do so, compare this 5% hypothetical example with the 5% hypothetical examples that appear in the shareholder reports of the other funds.
Annual Shareholder Report
32
Please note that the expenses shown in the table are meant to highlight your ongoing costs only and do not reflect any transaction costs, such as sales charges (loads) on purchase or redemption payments. Therefore, the second section of the table is useful in comparing ongoing costs only, and will not help you determine the relative total costs of owning different funds. In addition, if these transaction costs were included, your costs would have been higher. | Beginning
Account Value
5/1/2011 | Ending
Account Value
10/31/2011 | Expenses Paid
During Period1 |
| Actual: | | | |
| Class A Shares | $1,000 | $916.40 | $7.25 |
| Class C Shares | $1,000 | $912.30 | $11.28 |
| Class R Shares | $1,000 | $914.50 | $9.41 |
| Institutional Shares | $1,000 | $917.60 | $6.04 |
Hypothetical (assuming a 5% return
before expenses): | | | |
| Class A Shares | $1,000 | $1,017.64 | $7.63 |
| Class C Shares | $1,000 | $1,013.41 | $11.88 |
| Class R Shares | $1,000 | $1,015.38 | $9.91 |
| Institutional Shares | $1,000 | $1,018.90 | $6.36 |
| 1 | Expenses are equal to the Fund's annualized net expense ratios, multiplied by the average account value over the period, multiplied by 184/365 (to reflect the one-half-year period). The annualized net expense ratios are as follows: |
| Class A Shares | 1.50% |
| Class C Shares | 2.34% |
| Class R Shares | 1.95% |
| Institutional Shares | 1.25% |
Annual Shareholder Report33
Board of Trustees and Trust Officers
The Board of Trustees is responsible for managing the Trust's business affairs and for exercising all the Trust's powers except those reserved for the shareholders. The following tables give information about each Trustee and the senior officers of the Fund. Where required, the tables separately list Trustees who are “interested persons” of the Fund (i.e., “Interested” Trustees) and those who are not (i.e., “Independent” Trustees). Unless otherwise noted, the address of each person listed is Federated Investors Tower, 1001 Liberty Avenue, Pittsburgh, PA 15222. The address of all Independent Trustees listed is 4000 Ericsson Drive, Warrendale, PA 15086-7561; Attention: Mutual Fund Board. As of December 31, 2010, the Trust comprised 13 portfolio(s), and the Federated Fund Family consisted of 43 investment companies (comprising 136 portfolios). Unless otherwise noted, each Officer is elected annually. Unless otherwise noted, each Trustee oversees all portfolios in the Federated Fund Family and serves for an indefinite term. The Fund's Statement of Additional Information includes additional information about Trust Trustees and is available, without charge and upon request, by calling 1-800-341-7400.
Interested Trustees Background
Name
Birth Date
Positions Held with Trust
Date Service Began | Principal Occupation(s) for Past Five Years,
Other Directorships Held and Previous Position(s) |
John F. Donahue*
Birth Date: July 28, 1924
Trustee
Began serving: April 1984 | Principal Occupations: Director or Trustee of the Federated Fund Family; Chairman and Director, Federated Investors, Inc.; Chairman of the Federated Fund Family's Executive Committee.
Previous Positions: Chairman of the Federated Fund Family; Trustee, Federated Investment Management Company; Chairman and Director, Federated Investment Counseling. |
J. Christopher Donahue*
Birth Date: April 11, 1949
President and Trustee
Began serving: January 2000 | Principal Occupations: Principal Executive Officer and President of the Federated Fund Family; Director or Trustee of some of the Funds in the Federated Fund Family; President, Chief Executive Officer and Director, Federated Investors, Inc.; Chairman and Trustee, Federated Investment Management Company; Trustee, Federated Investment Counseling; Chairman and Director, Federated Global Investment Management Corp.; Chairman, Federated Equity Management Company of Pennsylvania and Passport Research, Ltd. (investment advisory subsidiary of Federated); Trustee, Federated Shareholder Services Company; Director, Federated Services Company.
Previous Positions: President, Federated Investment Counseling; President and Chief Executive Officer, Federated Investment Management Company, Federated Global Investment Management Corp. and Passport Research, Ltd. |
| * | Family relationships and reasons for “interested” status: John F. Donahue is the father of J. Christopher Donahue; both are “interested” due to their beneficial ownership of shares of Federated Investors, Inc. and the positions they hold with Federated and its subsidiaries. |
Annual Shareholder Report34
INDEPENDENT Trustees Background
Name
Birth Date
Positions Held with Trust
Date Service Began | Principal Occupation(s) for Past Five Years,
Other Directorships Held, Previous Position(s) and Qualifications |
Nicholas P. Constantakis, CPA
Birth Date: September 3, 1939
Trustee
Began serving: February 1998 | Principal Occupation: Director or Trustee of the Federated Fund Family.
Other Directorship Held: Director and Chairman of the Audit Committee, Michael Baker Corporation (architecture, engineering and construction services).
Previous Position: Partner, Andersen Worldwide SC.
Qualifications: Public accounting and director experience. |
John F. Cunningham
Birth Date: March 5, 1943
Trustee
Began serving: January 1999 | Principal Occupation: Director or Trustee of the Federated Fund Family.
Other Directorships Held: Chairman, President and Chief Executive Officer, Cunningham & Co., Inc. (strategic business consulting); Trustee Associate, Boston College.
Previous Positions: Director, Redgate Communications and EMC Corporation (computer storage systems); Chairman of the Board and Chief Executive Officer, Computer Consoles, Inc.; President and Chief Operating Officer, Wang Laboratories; Director, First National Bank of Boston; Director, Apollo Computer, Inc.
Qualifications: Business management and director experience. |
Maureen Lally-Green
Birth Date: July 5, 1949
Trustee
Began serving: August 2009 | Principal Occupations: Director or Trustee of the Federated Fund Family; Director, Office of Church Relations, Diocese of Pittsburgh; Adjunct Professor of Law, Duquesne University School of Law.
Other Directorships Held: Director, Auberle; Trustee, St. Francis University; Director, Ireland Institute of Pittsburgh; Director, UPMC Mercy Hospital; Regent, St. Vincent Seminary; Director, Epilepsy Foundation of Western and Central Pennsylvania; Director, Saint Thomas More Society, Allegheny County.
Previous Position: Pennsylvania Superior Court Judge.
Qualifications: Legal and director experience. |
Peter E. Madden
Birth Date: March 16, 1942
Trustee
Began serving: November 1991 | Principal Occupation: Director or Trustee, and Chairman of the Board of Directors or Trustees, of the Federated Fund Family.
Previous Positions: Representative, Commonwealth of Massachusetts General Court; President, Chief Operating Officer and Director, State Street Bank and Trust Company and State Street Corporation (retired); Director, VISA USA and VISA International; Chairman and Director, Massachusetts Bankers Association; Director, Depository Trust Corporation; Director, The Boston Stock Exchange.
Qualifications: Business management, mutual fund services and director experience. |
Annual Shareholder Report35
Name
Birth Date
Positions Held with Trust
Date Service Began | Principal Occupation(s) for Past Five Years,
Other Directorships Held, Previous Position(s) and Qualifications |
Charles F. Mansfield, Jr.
Birth Date: April 10, 1945
Trustee
Began serving: January 1999 | Principal Occupations: Director or Trustee and Chairman of the Audit Committee of the Federated Fund Family; Management Consultant.
Previous Positions: Chief Executive Officer, PBTC International Bank; Partner, Arthur Young & Company (now Ernst & Young LLP); Chief Financial Officer of Retail Banking Sector, Chase Manhattan Bank; Senior Vice President, HSBC Bank USA (formerly Marine Midland Bank); Vice President, Citibank; Assistant Professor of Banking and Finance, Frank G. Zarb School of Business, Hofstra University; Executive Vice President, DVC Group, Inc. (marketing, communications and technology).
Qualifications: Banking, business management, education and director experience. |
R. James Nicholson
Birth Date: February 4, 1938
Trustee
Began serving: January 2008 | Principal Occupations: Director or Trustee of the Federated Fund Family; Senior Counsel, Brownstein Hyatt Farber Schrek, P.C.; Former Secretary of the U.S. Dept. of Veterans Affairs; Former U.S. Ambassador to the Holy See; Former Chairman of the Republican National Committee.
Other Directorships Held: Director, Horatio Alger Association; Director, The Daniels Fund, both charitable nonprofit organizations.
Previous Positions: Colonel, U.S. Army Reserve; Partner, Calkins, Kramer, Grimshaw and Harring, P.C.; General Counsel, Colorado Association of Housing and Building; Chairman and CEO, Nicholson Enterprises, Inc. (real estate holding company); Chairman and CEO, Renaissance Homes of Colorado.
Qualifications: Legal, government, business management and director experience. |
Thomas M. O'Neill
Birth Date: June 14, 1951
Trustee
Began serving: October 2006 | Principal Occupations: Director or Trustee of the Federated Fund Family; Sole Proprietor, Navigator Management Company (investment and strategic consulting).
Other Directorships Held: Board of Overseers, Children's Hospital of Boston; Visiting Committee on Athletics, Harvard College; Board of Directors, Medicines for Humanity.
Previous Positions: Chief Executive Officer and President, Managing Director and Chief Investment Officer, Fleet Investment Advisors; President and Chief Executive Officer, Aeltus Investment Management, Inc.; General Partner, Hellman, Jordan Management Co., Boston, MA; Chief Investment Officer, The Putnam Companies, Boston, MA; Credit Analyst and Lending Officer, Fleet Bank; Director and Consultant, EZE Castle Software (investment order management software); Director, Midway Pacific (lumber).
Qualifications: Business management, mutual fund, director and investment experience. |
Annual Shareholder Report36
Name
Birth Date
Positions Held with Trust
Date Service Began | Principal Occupation(s) for Past Five Years,
Other Directorships Held, Previous Position(s) and Qualifications |
John S. Walsh
Birth Date: November 28, 1957
Trustee
Began serving: January 1999 | Principal Occupations: Director or Trustee of the Federated Fund Family; President and Director, Heat Wagon, Inc. (manufacturer of construction temporary heaters); President and Director, Manufacturers Products, Inc. (distributor of portable construction heaters); President, Portable Heater Parts, a division of Manufacturers Products, Inc.
Previous Position: Vice President, Walsh & Kelly, Inc.
Qualifications: Business management and director experience. |
James F. Will
Birth Date: October 12, 1938
Trustee
Began serving: April 2006 | Principal Occupations: Director or Trustee of the Federated Fund Family; formerly, Vice Chancellor and President, Saint Vincent College.
Other Directorships Held: Trustee, Saint Vincent College; Director, Alleghany Corporation; Trustee, Wheeling Jesuit University; Director, Liberty Tire Recycling.
Previous Positions: Chairman, President and Chief Executive Officer, Armco, Inc.; President and Chief Executive Officer, Cyclops Industries; President and Chief Operating Officer, Kaiser Steel Corporation.
Qualifications: Business management, education and director experience. |
OFFICERS
Name
Birth Date
Address
Positions Held with Trust
Date Service Began | Principal Occupation(s) for Past Five Years
and Previous Position(s) |
John W. McGonigle
Birth Date: October 26, 1938
EXECUTIVE VICE PRESIDENT AND SECRETARY
Began serving: April 1984 | Principal Occupations: Executive Vice President and Secretary of the Federated Fund Family; Vice Chairman, Executive Vice President, Secretary and Director, Federated Investors, Inc.
Previous Positions: Trustee, Federated Investment Management Company and Federated Investment Counseling; Director, Federated Global Investment Management Corp., Federated Services Company and Federated Securities Corp. |
Richard A. Novak
Birth Date: December 25, 1963
TREASURER
Began serving: January 2006 | Principal Occupations: Principal Financial Officer and Treasurer of the Federated Fund Family; Senior Vice President, Federated Administrative Services; Financial and Operations Principal for Federated Securities Corp., Edgewood Services, Inc. and Southpointe Distribution Services, Inc.
Previous Positions: Controller of Federated Investors, Inc.; Vice President, Finance of Federated Services Company; held various financial management positions within The Mercy Hospital of Pittsburgh; Auditor, Arthur Andersen & Co. |
Annual Shareholder Report37
Name
Birth Date
Address
Positions Held with Trust
Date Service Began | Principal Occupation(s) for Past Five Years
and Previous Position(s) |
Richard B. Fisher
Birth Date: May 17, 1923
VICE PRESIDENT
Began serving: April 1984 | Principal Occupations: Vice Chairman or Vice President of some of the Funds in the Federated Fund Family; Vice Chairman, Federated Investors, Inc.; Chairman, Federated Securities Corp.
Previous Positions: President and Director or Trustee of some of the Funds in the Federated Fund Family; Executive Vice President, Federated Investors, Inc.; Director and Chief Executive Officer, Federated Securities Corp. |
Brian P. Bouda
Birth Date: February 28, 1947
CHIEF COMPLIANCE OFFICER AND SENIOR VICE PRESIDENT
Began serving: August 2004 | Principal Occupations: Senior Vice President and Chief Compliance Officer of the Federated Fund Family; Vice President and Chief Compliance Officer of Federated Investors, Inc. and Chief Compliance Officer of its subsidiaries. Mr. Bouda joined Federated in 1999 and is a member of the American Bar Association and the State Bar Association of Wisconsin. |
Stephen F. Auth
Birth Date: September 3, 1956
450 Lexington Avenue
Suite 3700
New York, NY 10017-3943
CHIEF INVESTMENT OFFICER
Began serving: November 2002 | Principal Occupations: Mr. Auth is Chief Investment Officer of this Fund and various other Funds in the Federated Fund Family; Executive Vice President, Federated Investment Counseling, Federated Global Investment Management Corp. and Federated Equity Management Company of Pennsylvania.
Previous Positions: Executive Vice President, Federated Investment Management Company, and Passport Research, Ltd. (investment advisory subsidiary of Federated); Senior Vice President, Global Portfolio Management Services Division; Senior Vice President, Federated Investment Management Company and Passport Research, Ltd.; Senior Managing Director and Portfolio Manager, Prudential Investments. |
Lawrence Auriana
Birth Date: January 8, 1944
140 East 45th Street
New York, NY 10017
VICE PRESIDENT
Began serving: November 2001 | Principal Occupations: Lawrence Auriana has been the Fund's Portfolio Manager since December 2007. He is Vice President of the Trust. Mr. Auriana joined Federated in April 2001 as Co-Head of Investments/Federated Kaufmann. From August 1984 to April 2001, Mr. Auriana was President and Treasurer of Edgemont Asset Management Corp., and Chairman of the Board and Portfolio Manager to The Kaufmann Fund, Inc. (predecessor to the Federated Kaufmann Fund). Mr. Auriana earned a B.S. in economics from Fordham University and has been engaged in the securities business since 1965. |
Hans P. Utsch
Birth Date: July 3, 1936
VICE PRESIDENT
Began serving: November 2001 | Principal Occupations: Hans P. Utsch has been the Fund's Portfolio Manager since December 2007. He is Vice President of the Trust. Mr. Utsch joined Federated in April 2001 as Co-Head of Investments/Federated Kaufmann. From August 1984 to April 2001, Mr. Utsch was Chairman of the Board and Secretary of Edgemont Asset Management Corp., and President and Portfolio Manager to The Kaufmann Fund, Inc. (predecessor to the Federated Kaufmann Fund). Mr. Utsch graduated from Amherst College and holds an M.B.A. from Columbia University. He has been engaged in the securities business since 1962. |
Annual Shareholder Report38
Evaluation and Approval of Advisory Contract – May 2011
Federated kaufmann LARGE CAP fund (the “Fund”)
The Fund's Board reviewed the Fund's investment advisory and subadvisory contracts at meetings held in May 2011. The Board's decision regarding these contracts reflects the exercise of its business judgment on whether to continue the existing arrangements.
In this connection, the Federated Funds' Board had previously appointed a Senior Officer, whose duties include specified responsibilities relating to the process by which advisory fees are to be charged to a Federated fund. The Senior Officer has the authority to retain consultants, experts, or staff as may be reasonably necessary to assist in the performance of his duties, reports directly to the Board, and may be terminated only with the approval of a majority of the independent members of the Board. The Senior Officer prepared and furnished to the Board an independent, written evaluation that covered topics discussed below (the “Evaluation”). The Board considered that Evaluation, along with other information, in deciding to approve the advisory and subadvisory contracts.
During its review of these contracts, the Board considered compensation and benefits received by the Adviser and subadviser. This included the fees received for services provided to the Fund by other entities in the Federated organization and research services (if any) received by the Adviser from brokers that execute Federated fund trades, as well as advisory fees. The Board is also familiar with and considered judicial decisions concerning allegedly excessive investment advisory fees, which have indicated that the following factors may be relevant to an Adviser's fiduciary duty with respect to its receipt of compensation from a fund: the nature and quality of the services provided by the Adviser, including the performance of the fund; the Adviser's cost of providing the services; the extent to which the Adviser may realize “economies of scale” as a fund grows larger; any indirect benefits that may accrue to the Adviser and its affiliates as a result of the Adviser's relationship with a fund; performance and expenses of comparable funds; and the extent to which the independent Board members are fully informed about all facts the Board deems relevant bearing on the Adviser's services and fees. The Board further considered management fees (including any components thereof) charged to institutional and other clients of the Adviser and subadviser for what might be viewed as like services, and the cost to the Adviser and its affiliates of supplying services pursuant to the management fee agreements, excluding any intra-corporate profit and profit margins of the Adviser and its affiliates for supplying such services. The Board was aware of these factors and was guided by them in its review of the Fund's advisory and subadvisory contracts to the extent it considered them to be appropriate and relevant, as discussed further below.
Annual Shareholder Report
39
The Board considered and weighed these circumstances in light of its substantial accumulated experience in governing the Fund and working with Federated on matters relating to the Federated funds, and was assisted in its deliberations by independent legal counsel. Throughout the year, the Board has requested and received substantial and detailed information about the Fund and the Federated organization that was in addition to the extensive materials that comprise and accompany the Senior Officer's Evaluation. Federated provided much of this information at each regular meeting of the Board, and furnished additional information in connection with the particular meeting at which the Board's formal review of the advisory and subadvisory contracts occurred. Between regularly scheduled meetings, the Board also received information on particular matters as the need arose. Thus, the Board's consideration of the advisory and subadvisory contracts included review of the Senior Officer's Evaluation, accompanying data and additional information covering such matters as: the Adviser's and subadviser's investment philosophy, revenue, profitability, personnel and processes; investment and operating strategies; the Fund's short- and long-term performance (in absolute terms, both on a gross basis and net of expenses, as well as in relationship to its particular investment program and certain competitor or “peer group” funds and/or other benchmarks, as appropriate), and comments on the reasons for performance; the Fund's investment objectives; the Fund's expenses (including the advisory fee itself and the overall expense structure of the Fund, both in absolute terms and relative to similar and/or competing funds, with due regard for contractual or voluntary expense limitations); the use and allocation of brokerage commissions derived from trading the Fund's portfolio securities (if any); and the nature, quality and extent of the advisory and other services provided to the Fund by the Adviser and its affiliates. The Board also considered the preferences and expectations of Fund shareholders and their relative sophistication; the continuing state of competition in the mutual fund industry and market practices; the range of comparable fees for similar funds in the mutual fund industry; the Fund's relationship to the Federated family of funds which include a comprehensive array of funds with different investment objectives, policies and strategies which are available for exchange without the incurrence of additional sales charges; compliance and audit reports concerning the Federated funds and the Federated companies that service them (including communications from regulatory agencies), as well as Federated's responses to any issues raised therein; and relevant developments in the mutual fund industry and how the Federated funds and/or Federated are responding to them. The Board also considered that the longevity and experience of the Fund's portfolio management team and their unique approach to investing may limit the utility of comparisons to other equity mutual funds. The Board's evaluation process is evolutionary. The criteria considered and the emphasis placed on relevant criteria change in recognition of changing circumstances in the mutual fund marketplace.Annual Shareholder Report
40
With respect to the Fund's performance and expenses in particular, the Board has found the use of comparisons to other mutual funds with comparable investment programs to be relevant, given the high degree of competition in the mutual fund business. The Board focused on comparisons with other similar mutual funds more heavily than non-mutual fund products or services because it is believed that they are more relevant. For example, other mutual funds are the products most like the Fund, they are readily available to Fund shareholders as alternative investment vehicles, and they are the type of investment vehicle in fact chosen and maintained by the Fund's investors. The range of their fees and expenses therefore appears to be a generally reliable indication of what consumers have found to be reasonable in the precise marketplace in which the Fund competes. The Fund's ability to deliver competitive performance when compared to its peer group was a useful indicator of how the Adviser is executing the Fund's investment program, which in turn assisted the Board in reaching a conclusion that the nature, extent, and quality of the Adviser's investment management services were such as to warrant continuation of the advisory contract. In this regard, the Senior Officer has reviewed Federated's fees for providing advisory services to products outside the Federated family of funds (e.g., institutional and separate accounts). He concluded that mutual funds and institutional accounts are inherently different products. Those differences include, but are not limited to, different types of targeted investors; being subject to different laws and regulations; different legal structures; different average account sizes; different associated costs; different portfolio management techniques made necessary by different cash flows; and portfolio manager time spent in review of securities pricing. The Senior Officer did not consider these fee schedules to be determinative in judging the appropriateness of mutual fund advisory contracts.The Senior Officer reviewed information compiled by Federated, using data supplied by independent fund ranking organizations, regarding the performance of, and fees charged by, other mutual funds, noting his view that comparisons to fund peer groups are relevant in judging the reasonableness of proposed fees.
For both the one- and three-year periods covered by the Evaluation, the Fund's performance was above the median of the relevant peer group.
The Board also received financial information about Federated, including information regarding the compensation and benefits Federated derived from its relationships with the Federated funds. This information covered not only the fees under the advisory contracts, but also fees received by Federated's subsidiaries for providing other services to the Federated funds under separate contracts (e.g., for serving as the Federated funds' administrator). The information also detailed any indirect benefit Federated may derive from its receipt of research services from brokers who execute Federated fund trades. In addition, the Board considered the fact that, in order for a fund to be competitive in the marketplace, Federated and its affiliates frequently waived fees Annual Shareholder Report
41
and/or reimbursed expenses and have disclosed to fund investors and/or indicated to the Board their intention to do so in the future, where appropriate. Moreover, the Board receives regular reporting as to the institution or elimination of these voluntary waivers.Federated furnished information, requested by the Senior Officer, that reported revenues on a fund-by-fund basis and made estimates of the allocation of expenses on a fund-by-fund basis, using allocation methodologies specified by the Senior Officer. The Senior Officer noted that, although they may apply consistent allocation processes, the inherent difficulties in allocating costs (and the unavoidable arbitrary aspects of that exercise) and the lack of consensus on how to allocate those costs may render such allocation information unreliable. The allocation information was considered in the analysis by the Board but was determined to be of limited use.
The Board and the Senior Officer also reviewed information compiled by Federated comparing profitability information for Federated to other publicly held fund management companies. In this regard, the Senior Officer noted the limited availability of such information, but nonetheless concluded that Federated's profit margins did not appear to be excessive and the Board agreed.
The Senior Officer's Evaluation also discussed the notion of possible realization of “economies of scale” as a fund grows larger. The Board considered in this regard that the Adviser has made significant and long-term investments in areas that support all of the Federated funds, such as personnel and processes for the portfolio management, compliance, internal audit, and risk management functions; and systems technology; and that the benefits of these efforts (as well as any economies, should they exist) were likely to be enjoyed by the fund complex as a whole. Finally, the Board also noted the absence of any applicable regulatory or industry guidelines on this subject, which (as discussed in the Senior Officer's Evaluation) is compounded by the lack of any common industry practice or general pattern with respect to structuring fund advisory fees with “breakpoints” that serve to reduce the fee as the fund attains a certain size. The Senior Officer did not recommend institution of breakpoints in pricing Federated's fund advisory services at this time.
It was noted in the materials for the Board meeting that for the period covered by the Evaluation, the Fund's investment advisory fee, after waivers and expense reimbursements, if any, was above the median of the relevant peer group. The Board reviewed the fees and other expenses of the Fund with the Adviser and was satisfied that the overall expense structure of the Fund remained competitive. The Board will continue to monitor advisory fees and other expenses borne by the Fund.
The Senior Officer noted that, considering the totality of the circumstances, and all of the factors referenced within his Evaluation, he had concluded that, subject to comments and recommendations made within his Evaluation, his observations and the information accompanying the Evaluation supported a finding by the Board that the management fees for each of the funds are Annual Shareholder Report
42
reasonable and that Federated appeared to provide appropriate administrative services to the Fund for the fees paid. Under these circumstances, no changes were recommended to, and no objection was raised to, the continuation of the Fund's advisory and subadvisory contracts. The Board concluded that the nature, quality and scope of services provided the Fund by the Adviser and its affiliates were satisfactory.In its decision to continue an existing investment advisory contract, the Board was mindful of the potential disruptions of the Fund's operations and various risks, uncertainties and other effects that could occur as a result of a decision to terminate or not renew an advisory contract. In particular, the Board recognized that many shareholders have invested in the Fund on the strength of the Adviser's industry standing and reputation and with the expectation that the Adviser will have a continuing role in providing advisory services to the Fund. Thus, the Board's approval of the advisory contract reflected the fact that it is the shareholders who have effectively selected the Adviser by virtue of having invested in the Fund.
The Board based its decision to approve the advisory and subadvisory contracts on the totality of the circumstances and relevant factors and with a view to past and future long-term considerations. Not all of the factors and considerations identified above were necessarily relevant to the Fund, nor did the Board consider any one of them to be determinative. With respect to the factors that were relevant, the Board's decision to approve the contract reflects its determination that Federated's performance and actions provided a satisfactory basis to support the decision to continue the existing arrangements.
Annual Shareholder Report43
Voting Proxies on Fund Portfolio Securities
A description of the policies and procedures that the Fund uses to determine how to vote proxies, if any, relating to securities held in the Fund's portfolio is available, without charge and upon request, by calling 1-800-341-7400. A report on “Form N-PX” of how the Fund voted any such proxies during the most recent 12-month period ended June 30 is available from Federated's website at FederatedInvestors.com. To access this information from the home page, select “All” under “Asset Classes.” Select a fund name and share class, if applicable, to go to the Fund Overview page. On the Fund Overview page, select the “Documents” tab. At the bottom of that page, select “Proxy Voting Record Report (Form N-PX).” Form N-PX filings are also available at the SEC's website at www.sec.gov.
Quarterly Portfolio Schedule
The Fund files with the SEC a complete schedule of its portfolio holdings, as of the close of the first and third quarters of its fiscal year, on “Form N-Q.” These filings are available on the SEC's website at www.sec.gov and may be reviewed and copied at the SEC's Public Reference Room in Washington, DC. (Call 1-800-SEC-0330 for information on the operation of the Public Reference Room.) You may also access this information from the “Products” section of Federated's website at FederatedInvestors.com. From the home page, select “All” under “Asset Classes.” Select a fund name and share class, if applicable, to go to the Fund Overview page. On the Fund Overview page, select the “Documents” tab. At the bottom of that page, select “Form N-Q.”
Annual Shareholder Report44
Notes [Page Intentionally Left Blank]
Notes [Page Intentionally Left Blank]
Notes [Page Intentionally Left Blank]
Notes [Page Intentionally Left Blank]
Notes [Page Intentionally Left Blank]
Notes [Page Intentionally Left Blank]
Mutual funds are not bank deposits or obligations, are not guaranteed by any bank and are not insured or guaranteed by the U.S. government, the Federal Deposit Insurance Corporation, the Federal Reserve Board or any other government agency. Investment in mutual funds involves investment risk, including the possible loss of principal.
This Report is authorized for distribution to prospective investors only when preceded or accompanied by the Fund's Prospectus, which contains facts concerning its objective and policies, management fees, expenses and other information.
Federated Kaufmann Large Cap Fund
Federated Investors Funds
4000 Ericsson Drive
Warrendale, PA 15086-7561
Contact us at FederatedInvestors.com
or call 1-800-341-7400.
Federated Securities Corp., Distributor
Cusip 314172446
Cusip 314172438
Cusip 314172420
Cusip 314172412
39667 (12/11)
Federated is a registered trademark of Federated Investors, Inc.
2011 © Federated Investors, Inc.
| | Annual Shareholder Report |
| | October 31, 2011 |
|
| Share Class | Ticker |
| A | FKASX |
| B | FKBSX |
| C | FKCSX |
| R* | FKKSX |
*formerly, Class K Shares
Federated Kaufmann Small Cap Fund
Fund Established 2002
A Portfolio of Federated Equity Funds
Management's Discussion of Fund Performance
Portfolio of Investments Summary Table
Portfolio of Investments
Financial Highlights
Statement of Assets and Liabilities
Statement of Operations
Statement of Changes in Net Assets
Notes to Financial Statements
Report of Independent Registered Public Accounting Firm
Shareholder Expense Example
Board of Trustees and Trust Officers
Evaluation and Approval of Advisory Contract
Voting Proxies on Fund Portfolio Securities
Quarterly Portfolio Schedule
Management's Discussion of Fund Performance (unaudited)
The Fund's total return, based upon net asset value, for the 12-month reporting period ended October 31, 2011, was -4.60%, -5.14%, -5.14% and -4.60% for the Class A, B, C and R shares, respectively. The Russell 2000® Growth Index (R2000G),1 the Fund's broad-based securities market index, had a total return of 9.84% for same period. The Fund's total return for the fiscal year reflects actual cash flows, transaction costs and other expenses which are not reflected in the total return of the R2000G.
The following discussion will focus on the performance of the Fund's Class A Shares.
Market Conditions
The stock market, as a whole, posted very strong returns during the first half of the fiscal year but then retreated into negative return territory during the second half of the reporting period. The equity markets returned to positive returns with a powerful rally during the final month of the Fund's fiscal year, October. The Standard and Poor's 500 Index (S&P 500)2 bottomed in September and finished the year up 8.09%. Overall, large-cap stocks performed best, followed by mid-caps and then small-caps. In terms of style, growth stocks outperformed value stocks across large-, mid-, and small-cap stock groupings.
Economic growth in Europe began to slow, especially in the highly indebted countries of Greece, Italy, Portugal, Ireland, Spain, and others. Credit spreads widened substantially on speculation that those governments would not be able to support their level of indebtedness in a slowing economic environment without significant support from the European Central Bank. Politics have dominated much of the European debate. However, even after numerous meetings between bankers and politicians, and the resignation of several prime ministers, credible plans for a bailout remain elusive.
Unfortunately, political uncertainty was not limited to Europe; the President and the U.S. Congress generated a highly contentious standoff regarding the debt ceiling debate. This uncertainty prompted Standard and Poor's to downgrade the long-term credit rating of the United States one notch down from AAA. Additionally, during June 2011, the Federal Reserve's second quantitative easing program, known as QE2, ended.
The European debt crisis, political uncertainty, and weaker economic indicators during the last six months of the reporting period clearly increased volatility and negatively affected the global equity markets.
Annual Shareholder Report
1
Fund PerformanceThe Fund underperformed the R2000G over the reporting period. Key factors affecting the Fund performance over the reporting period include the following:
International holdings: The Fund maintained exposure to growth companies outside of the United States, particularly in Brazil, China, India and Israel. Both developed and emerging international markets significantly underperformed the U.S. markets and accounted for a significant percentage of our underperformance, relative to the R2000G.3
Stock selection: The ten worst contributing holdings during the period accounted for a substantial portion of underperformance. Specifically, these holding were: US Airways Group (-51%); Central European Media (-52%); Satcon Technology (-74%); hhgregg (-56%); Warner Chilcott (-25%); Hisoft Technology (-53%); Camelot Information Systems (-80%); Rural Electrification Corp (-50%); Mecox Lane (-89%); and Radware (-25%).
Companies that were strong performers and contributed most to the Fund returns during the period were: Lululemon Athletica (+155%); Cetip (+10%); Cubist Pharmaceuticals (+62%); Dynavax Technologies (+49%); Commvault Systems (+47%); Broadsoft (+283%); Anadys Pharmaceuticals (+153%); Seattle Genetics (+34%); and Chipotle Mexican Grill (+50%).
Sector weightings: Substantially less exposure to Consumer Staples and Energy sectors relative to the R2000G also hurt performance.
Macroeconomic events, previously mentioned, also pushed stock correlations substantially higher, meaning many stocks moved in the same direction, up or down, simultaneously. This made stock selection more difficult because stocks reacted similarly to both good and bad news headlines more than company fundamentals.
The Fund was nearly fully invested during the period with a cash position which averaged less than 1.0%.
| 1 | The Russell 2000® Growth Index measures the performance of those Russell 2000 companies with higher price-to-book ratios and higher forecasted growth values. |
| 2 | The S&P 500 Index is an unmanaged, capitalization-weighted index of 500 stocks designed to measure performance of the broad domestic economy through changes in the aggregate market value of 500 stocks representing all major industries. It is not possible to invest directly in an index. |
| 3 | International investing involves special risks including currency risk, increased volatility, political risks, and differences in auditing and other financial standards. |
Annual Shareholder Report2
FUND PERFORMANCE AND GROWTH OF A $10,000 INVESTMENT
The Average Annual Total Return table below shows returns for each class averaged over the stated periods. The graphs below illustrate the hypothetical investment of $10,0001 in the Federated Kaufmann Small Cap Fund (the “Fund”) from December 18, 2002 (start of performance) to October 31, 2011, for Class A Shares, Class B Shares and Class C Shares and from November 1, 2005 (start of performance) to October 31, 2011, for Class R Shares, compared to the Russell 2000 Growth Index (R2000G)2 and the Lipper Small-Cap Growth Funds Average (LSCGFA).2
Average Annual Total Returns for the Period Ended 10/31/2011
(returns reflect all applicable sales charges and contingent deferred sales charges as specified below in footnote #1)
| Share Class | 1 Year | 5 Years | Start of
Performance* |
| Class A Shares | -9.85% | -0.52% | 11.34% |
| Class B Shares | -10.36% | -0.32% | 11.52% |
| Class C Shares | -6.09% | 0.05% | 11.47% |
| Class R Shares | -4.60% | 0.61% | 3.68% |
| * | The Fund's Class A Shares, Class B Shares and Class C Shares start of performance date was December 18, 2002. The Fund's Class R Shares start of performance date was November 1, 2005. |
Performance data quoted represents past performance which is no guarantee of future results. Investment return and principal value will fluctuate so that an investor's shares, when redeemed, may be worth more or less than their original cost. Mutual fund performance changes over time and current performance may be lower or higher than what is stated. For current to the most recent month-end performance and after-tax returns, visit FederatedInvestors.com or call 1-800-341-7400. Returns shown do not reflect the deduction of taxes that a shareholder would pay on Fund distributions or the redemption of Fund shares. Mutual funds are not obligations of or guaranteed by any bank and are not federally insured.
Annual Shareholder Report
3
Growth of a $10,000 Investment – CLASS A SHARES| Federated Kaufmann Small Cap Fund - Class A Shares | C000026733 | R2000G | LSCGFA |
| 12/18/2002 | 9,450 | 10,000 | 10,000 |
| 10/31/2003 | 16,131 | 14,299 | 13,171 |
| 10/31/2004 | 18,505 | 15,089 | 13,554 |
| 10/31/2005 | 20,871 | 16,735 | 15,175 |
| 10/31/2006 | 25,150 | 19,592 | 17,121 |
| 10/31/2007 | 30,412 | 22,869 | 20,600 |
| 10/31/2008 | 16,943 | 14,209 | 11,948 |
| 10/31/2009 | 19,910 | 15,820 | 13,515 |
| 10/31/2010 | 27,176 | 20,355 | 17,261 |
| 10/31/2011 | 25,926 | 22,358 | 18,823 |
41 graphic description end -->
- Total returns shown include the maximum sales charge of 5.50% ($10,000 investment minus $550 sales charge = $9,450).
Growth of a $10,000 INVESTMENT – CLASS B SHARES
| Federated Kaufmann Small Cap Fund - Class B Shares | C000026734 | R2000G | LSCGFA |
| 12/18/2002 | 10,000 | 10,000 | 10,000 |
| 10/31/2003 | 17,040 | 14,299 | 13,171 |
| 10/31/2004 | 19,441 | 15,089 | 13,554 |
| 10/31/2005 | 21,807 | 16,735 | 15,175 |
| 10/31/2006 | 26,131 | 19,592 | 17,121 |
| 10/31/2007 | 31,423 | 22,869 | 20,600 |
| 10/31/2008 | 17,406 | 14,209 | 11,948 |
| 10/31/2009 | 20,341 | 15,820 | 13,515 |
| 10/31/2010 | 27,618 | 20,355 | 17,261 |
| 10/31/2011 | 26,316 | 22,358 | 18,823 |
41 graphic description end -->
- Total returns shown include the maximum contingent deferred sales charge of 5.50%, as applicable.
Annual Shareholder Report4
Growth of a $10,000 INVESTMENT – CLASS C SHARES
| Federated Kaufmann Small Cap Fund - Class C Shares | C000026735 | R2000G | LSCGFA |
| 12/18/2002 | 10,000 | 10,000 | 10,000 |
| 10/31/2003 | 17,030 | 14,299 | 13,171 |
| 10/31/2004 | 19,441 | 15,089 | 13,554 |
| 10/31/2005 | 21,807 | 16,735 | 15,175 |
| 10/31/2006 | 26,131 | 19,592 | 17,121 |
| 10/31/2007 | 31,423 | 22,869 | 20,600 |
| 10/31/2008 | 17,406 | 14,209 | 11,948 |
| 10/31/2009 | 20,341 | 15,820 | 13,515 |
| 10/31/2010 | 27,618 | 20,355 | 17,261 |
| 10/31/2011 | 26,198 | 22,358 | 18,823 |
41 graphic description end -->
- Total returns shown include the maximum contingent deferred sales charge of 1.00%, as applicable.
Growth of a $10,000 INVESTMENT – CLASS R SHARES
| Federated Kaufmann Small Cap Fund - Class R Shares | C000026736 | R2000G | LSCGFA |
| 11/1/2005 | 10,000 | 10,000 | 10,000 |
| 10/31/2006 | 12,050 | 11,771 | 10,942 |
| 10/31/2007 | 14,571 | 13,740 | 13,165 |
| 10/31/2008 | 8,118 | 8,537 | 7,636 |
| 10/31/2009 | 9,539 | 9,505 | 8,638 |
| 10/31/2010 | 13,018 | 12,230 | 11,031 |
| 10/31/2011 | 12,420 | 13,434 | 12,030 |
41 graphic description end -->
| 1 | Represents a hypothetical investment of $10,000 in the Fund after deducting the applicable sales charges: For Class A Shares, the maximum sales charge of 5.50% ($10,000 investment minus $550 sales charge = $9,450); for Class B Shares, the maximum contingent deferred sales charge is 5.50% on any redemption less than one year from the purchase date; for Class C Shares, a 1.00% contingent deferred sales charge would be applied on any redemption less than one year from the purchase date. The Fund's performance assumes the reinvestment of all dividends and distributions. The R2000G and the LSCGFA have been adjusted to reflect reinvestment of dividends on securities in the index and the average. |
| 2 | The R2000G is not adjusted to reflect sales charges, expenses or other fees that the Securities and Exchange Commission (SEC) requires to be reflected in the Fund's performance. The LSCGFA represents the average of the total returns reported by all of the mutual funds designated by Lipper, Inc. as falling in the respective category indicated, and is not adjusted to reflect any sales charges. However, these total returns are reported net of expenses or other fees that the SEC requires to be reflected in a fund's performance. The 2000G measures the performance of those Russell 2000 companies with higher price-to-book ratios and higher forecasted growth values. The index is unmanaged and, unlike the Fund, is not affected by cash flows. It is not possible to invest directly in an index. |
Annual Shareholder Report5
Portfolio of Investments Summary Table (unaudited)
At October 31, 2011, the Fund's sector composition1 was as follows:
| Sector Composition | Percentage of
Total Net Assets |
| Health Care | 25.9% |
| Information Technology | 24.1% |
| Consumer Discretionary | 21.2% |
| Industrials | 17.2% |
| Financials | 6.8% |
| Materials | 1.7% |
| Energy | 1.6% |
| Telecommunication Services | 0.8% |
| Consumer Staples | 0.4% |
| Utilities | 0.4% |
| Securities Lending Collateral2 | 12.1% |
| Other Assets and Liabilities — Net3 | (12.2)% |
| TOTAL | 100.0% |
| 1 | Except for Securities Lending Collateral and Other Assets and Liabilities, sector classifications are based upon, and individual portfolio securities are assigned to, the classifications of the Global Industry Classification Standard (GICS) except that the Adviser assigns a classification to securities not classified by the GICS and to securities for which the Adviser does not have access to the classification made by the GICS. |
| 2 | Cash collateral received from lending portfolio securities which is invested in short-term investments such as repurchase agreements or money market mutual funds. |
| 3 | Assets, other than investments in securities, less liabilities. See Statement of Assets and Liabilities. |
Annual Shareholder Report6
Portfolio of Investments
October 31, 2011
| Shares | | | Value |
| | COMMON STOCKS – 99.9% | |
| | Consumer Discretionary – 21.2% | |
| 90,706 | 1 | ASOS PLC | 2,262,621 |
| 431,835 | 1 | Ambow Education Holding Ltd., ADR | 2,893,295 |
| 1,040,700 | 1 | Arezzo Industria e Comercio SA | 13,760,019 |
| 1,289,192 | 1,2 | Central European Media Enterprises Ltd., Class A | 14,232,680 |
| 43,210 | 1 | China Education Alliance, Inc. | 81,667 |
| 287,057 | | Cia Hering | 6,412,113 |
| 190,707 | | Ctrip.com International Ltd., ADR | 6,648,046 |
| 360,000 | 1 | Dick's Sporting Goods, Inc. | 14,072,400 |
| 105,564 | 1,2 | Dunkin' Brands Group, Inc. | 3,072,968 |
| 435,566 | 1 | Gordmans Stores, Inc. | 6,089,213 |
| 2,481,053 | 1 | International Meal Co. Holdings SA | 16,402,103 |
| 242,400 | 1 | LJ International, Inc. | 661,752 |
| 378,400 | 1,2 | Lululemon Athletica, Inc. | 21,372,032 |
| 638,102 | 1,2 | Mecox Lane Ltd., ADR | 1,180,489 |
| 606,700 | 1,2 | Melco PBL Entertainment (Macau) Ltd., ADR | 6,958,849 |
| 19,176,645 | | NagaCorp Limited | 4,764,274 |
| 207,207 | | National CineMedia, Inc. | 2,507,205 |
| 415,000 | 1,2 | Orient-Express Hotel Ltd. | 3,539,950 |
| 154,570 | 1 | Penn National Gaming, Inc. | 5,564,520 |
| 1,273,124 | 1 | Salvatore Ferragamo Italia SpA | 20,454,299 |
| 5,445,037 | 1 | Samsonite International SA | 8,904,857 |
| 116,300 | 1 | Shutterfly, Inc. | 4,846,221 |
| 80,199 | 1,2 | SodaStream International Ltd. | 2,733,182 |
| 83,100 | 1 | Ulta Salon Cosmetics & Fragrance, Inc. | 5,591,799 |
| 485,000 | 1,2,3 | Universal Travel Group | 1,343,450 |
| 125,300 | 1,2 | Vera Bradley, Inc. | 5,676,090 |
| 182,174 | 1 | Vitamin Shoppe Industries, Inc. | 6,869,781 |
| 841,500 | 1 | Yoox SpA | 12,017,495 |
| | TOTAL | 200,913,370 |
| | Consumer Staples – 0.4% | |
| 164,500 | 1 | Darling International, Inc. | 2,306,290 |
| 2,129,273 | 1 | Triveni Engineering & Industries Ltd. | 1,731,578 |
| | TOTAL | 4,037,868 |
| | Energy – 1.6% | |
| 56,600 | 1 | Dresser-Rand Group, Inc. | 2,739,440 |
Annual Shareholder Report7
| Shares | | | Value |
| 1,931,540 | 1 | Syntroleum Corp. | 1,622,494 |
| 193,200 | 2 | Vermilion Energy, Inc. | 9,102,254 |
| 100,000 | 1,2 | Western Refining, Inc. | 1,598,000 |
| | TOTAL | 15,062,188 |
| | Financials – 6.8% | |
| 101,500 | 1 | Affiliated Managers Group | 9,399,915 |
| 210,000 | 2 | BankUnited, Inc. | 4,575,900 |
| 462,963 | 1,2 | China Housing & Land Development, Inc. | 523,148 |
| 25,493 | 1,4,5 | China Housing & Land Development, Inc. | 28,807 |
| 1,343,445 | | Fibra Uno Administracion SA | 2,469,753 |
| 367,730 | | LPS Brasil Cons De Imoveis, Rights | 6,641,994 |
| 9,354,200 | | Manappuram Finance Ltd. | 11,407,895 |
| 230,189 | 1,2 | Netspend Holdings, Inc. | 1,323,587 |
| 93,000 | | New York Community Bancorp, Inc. | 1,237,830 |
| 4,251,000 | 1 | Popular, Inc. | 7,906,860 |
| 714,000 | | Power Finance Corp. | 2,182,037 |
| 207,630 | | STAG Industrial, Inc. | 2,229,946 |
| 320,800 | | Summit Hotel Properties, Inc. | 2,588,856 |
| 779,000 | 1 | Walker & Dunlop, Inc. | 9,893,300 |
| 55,200 | | Willis Group Holdings PLC | 2,004,312 |
| 545,852 | | Xinyuan Real Estate Co. Ltd, ADR | 1,015,285 |
| | TOTAL | 65,429,425 |
| | Health Care – 25.7% | |
| 235,700 | 1 | 3SBio, Inc., ADR | 2,712,907 |
| 631,000 | 1,2 | Achillion Pharmaceuticals, Inc. | 4,000,540 |
| 253,000 | 1,3,4,5 | Adaltis, Inc. | 0 |
| 59,000 | 1,3,4,5 | Adaltis, Inc. | 0 |
| 641,543 | 1,3,5 | Adaltis, Inc. | 0 |
| 285,000 | 1 | Alkermes, Inc. | 4,984,650 |
| 330,038 | 1 | Allscripts Healthcare Solutions, Inc. | 6,320,228 |
| 765,200 | 1 | Amarin Corporation PLC, ADR | 7,192,880 |
| 104,700 | | Amil Participacoes SA | 1,059,288 |
| 199,896 | 1 | Ardea Biosciences, Inc. | 3,979,929 |
| 723,600 | | Aurobindo Pharma Ltd. | 1,887,780 |
| 818,100 | | Biocon Ltd. | 5,921,797 |
| 5,546,400 | 1 | CFR Pharmaceuticals SA | 1,297,505 |
| 62,580 | 1,4,5 | CFR Pharmaceuticals SA, ADR | 1,478,768 |
| 2,163,806 | 1,6 | Catalyst Pharmaceutical Partners, Inc. | 2,271,996 |
Annual Shareholder Report8
| Shares | | | Value |
| 1,172,408 | 1,2 | Conceptus, Inc. | 13,506,140 |
| 346,120 | 1 | Corcept Therapeutics, Inc. | 1,097,203 |
| 227,300 | 1 | Corcept Therapeutics, Inc. | 720,541 |
| 834,200 | 1,2 | Cubist Pharmaceuticals, Inc. | 31,541,102 |
| 423,584 | 1 | Dexcom, Inc. | 4,146,887 |
| 330,500 | | Dishman Pharmaceuticals & Chemicals Ltd. | 352,234 |
| 1,969,600 | 1 | Dyax Corp. | 2,658,960 |
| 13,905,776 | 1,6 | Dynavax Technologies Corp. | 37,823,711 |
| 87,356 | 1 | ePocrates, Inc. | 759,997 |
| 375,000 | 1,2 | ExamWorks Group, Inc. | 3,956,250 |
| 48,200 | 1 | Fluidigm Corp. | 672,872 |
| 860,000 | 1 | Inhibitex, Inc. | 3,345,400 |
| 318,991 | 1,2 | Insulet Corp. | 5,205,933 |
| 556,000 | 1 | Nektar Therapeutics | 3,013,520 |
| 1,787,300 | 1,6 | Progenics Pharmaceuticals, Inc. | 11,742,561 |
| 1,441,567 | 1,2 | Protalix Biotherapeutics, Inc. | 8,807,974 |
| 71,437 | 1 | Regeneron Pharmaceuticals, Inc. | 3,950,466 |
| 657,500 | 1 | Repligen Corp. | 2,255,225 |
| 337,983 | 1 | Sagent Pharmaceuticals, Inc. | 8,635,466 |
| 113,000 | 1 | Salix Pharmaceuticals Ltd. | 3,870,815 |
| 710,600 | 1,2 | Seattle Genetics, Inc. | 15,633,200 |
| 306,500 | | Strides Arcolab Ltd. | 2,466,715 |
| 576,945 | 1 | Threshold Pharmaceuticals, Inc. | 923,112 |
| 201,500 | 1 | Tianyin Pharmaceutical Co., Inc. | 229,710 |
| 235,700 | 1,3 | Valera Pharmaceuticals, Inc. | 0 |
| 235,700 | 1,3 | Valera Pharmaceuticals, Inc. | 0 |
| 1,409,420 | 1,2 | Vical, Inc. | 4,214,166 |
| 552,200 | 1,2 | Vivus, Inc. | 5,207,246 |
| 739,869 | 1 | Warner Chilcott PLC | 13,406,426 |
| 107,000 | 1 | Watson Pharmaceuticals, Inc. | 7,186,120 |
| 1,932,200 | 1,2 | YM Biosciences, Inc. | 3,419,994 |
| | TOTAL | 243,858,214 |
| | Industrials – 17.2% | |
| 488,900 | 1,2 | Air Lease Corp. | 10,917,137 |
| 25,377,821 | | Aramex PJSC | 12,421,809 |
| 285,000 | 1 | Atlas Air Worldwide Holdings, Inc. | 10,978,200 |
| 303,580 | | CLARCOR, Inc. | 14,717,559 |
| 259,475 | | Chicago Bridge & Iron Co., NV | 9,491,598 |
Annual Shareholder Report9
| Shares | | | Value |
| 135,600 | 1 | CoStar Group, Inc. | 8,343,468 |
| 53,400 | 1 | IHS, Inc., Class A | 4,485,066 |
| 1,652,379 | 1,6 | Innovative Solutions and Support, Inc. | 7,865,324 |
| 100,000 | | Kaman Corp., Class A | 3,325,000 |
| 193,200 | | MSC Industrial Direct Co. | 13,139,532 |
| 733,023 | | Max India Ltd. | 2,864,920 |
| 299,893 | 1 | Old Dominion Freight Lines, Inc. | 10,967,087 |
| 499,905 | 1 | Owens Corning, Inc. | 14,187,304 |
| 139,000 | 1 | RPX Corp. | 2,162,840 |
| 3,130,468 | 1,2 | Satcon Technology Corp. | 3,318,296 |
| 249,800 | 1 | Teledyne Technologies, Inc. | 13,606,606 |
| 232,000 | | Trinity Industries, Inc. | 6,326,640 |
| 2,384,400 | 1,2 | US Airways Group, Inc. | 13,757,988 |
| | TOTAL | 162,876,374 |
| | Information Technology – 24.1% | |
| 645,000 | | Amadeus IT Holding SA | 12,106,318 |
| 193,200 | 1,2 | BroadSoft, Inc. | 6,955,200 |
| 522,731 | 1,2 | Camelot Information Systems, Inc., ADR | 1,704,103 |
| 100,000 | 1 | Cavium Networks, Inc. | 3,269,000 |
| 2,173,800 | 1,6 | Cinedigm Digital Cinema Corp. | 2,956,368 |
| 767,000 | 1,6 | Cinedigm Digital Cinema Corp. | 1,012,440 |
| 411,680 | 1 | Commvault Systems, Inc. | 17,529,336 |
| 570,000 | 1,2 | Constant Contact, Inc. | 11,536,800 |
| 158,996 | 1 | Convio, Inc. | 1,524,772 |
| 241,991 | 1,2 | Entropic Communications, Inc. | 1,408,387 |
| 880,900 | 1 | Envestnet, Inc. | 10,253,676 |
| 318,580 | 1 | Fabrinet | 3,950,392 |
| 919,400 | 1 | Gilat Satellite Networks | 3,567,272 |
| 293,348 | 1,2 | hiSoft Technology International Ltd., ADR | 3,631,648 |
| 291,561 | 1 | InterXion Holding NV | 4,000,217 |
| 342,023 | 1 | Intralinks Holdings, Inc. | 2,972,180 |
| 257,223 | 1,2 | iSoftStone Holdings Ltd., ADR | 2,757,431 |
| 205,000 | 1 | JDA Software Group, Inc. | 6,533,350 |
| 127,328 | 1 | KVH Industries, Inc. | 937,134 |
| 686,200 | 1 | Kenexa Corp. | 15,693,394 |
| 197,847 | 1 | LivePerson, Inc. | 2,490,894 |
| 18,800 | 1 | Mellanox Technologies Ltd. | 608,368 |
| 469,636 | 1 | Microsemi Corp. | 8,669,481 |
Annual Shareholder Report10
| Shares | | | Value |
| 1,941,900 | 1,2,6 | Mindspeed Technologies, Inc. | 10,796,964 |
| 367,000 | 1 | NIC, Inc. | 5,068,270 |
| 1,155,749 | 1 | Nova Measuring Instruments Ltd. | 8,402,295 |
| 446,600 | 1,2 | OCZ Technology Group, Inc. | 3,157,462 |
| 551,772 | 1 | Orbotech Ltd. | 5,876,372 |
| 339,466 | 1 | Parametric Technology Corp. | 7,071,077 |
| 136,200 | 1 | Qlik Technologies, Inc. | 3,891,234 |
| 477,438 | 1 | RADWARE Ltd. | 12,623,461 |
| 140,361 | 1 | RDA Microelectronics, Inc., ADR | 1,136,924 |
| 417,134 | 1 | Riverbed Technology, Inc. | 11,504,556 |
| 96,600 | 1,2 | Rubicon Technology, Inc. | 1,006,572 |
| 204,500 | 1,2 | STR Holdings, Inc. | 1,748,475 |
| 270,800 | 1 | SeaChange International, Inc. | 2,285,552 |
| 36,907 | 1 | Spire Corp. | 46,134 |
| 121,500 | 1 | Synchronoss Technologies, Inc. | 3,652,290 |
| 130,980 | | Syntel, Inc. | 6,404,922 |
| 145,300 | 1 | TNS, Inc. | 2,837,709 |
| 120,000 | 1 | Tangoe, Inc. | 1,614,000 |
| 682,527 | 1 | Telecity Group PLC | 6,542,607 |
| 94,918 | | Totvs SA | 1,575,655 |
| 110,769 | 1 | Velti Ltd. | 932,675 |
| 96,799 | 1,2 | VistaPrint Ltd. | 3,380,221 |
| 1,761,800 | 1 | WebMediaBrands, Inc. | 1,106,058 |
| | TOTAL | 228,729,646 |
| | Materials – 1.7% | |
| 303,022 | | Eastman Chemical Co. | 11,905,734 |
| 6,669,920 | 1 | Greatview Aseptic Packaging Company Ltd. | 2,452,193 |
| 2,363,800 | | Huabao International Holdings Ltd.. | 1,500,925 |
| | TOTAL | 15,858,852 |
| | Telecommunication Services – 0.8% | |
| 417,456 | 1 | TW Telecom, Inc. | 7,722,936 |
| | Utilities – 0.4% | |
| 58,047 | | ITC Holdings Corp. | 4,218,856 |
| | TOTAL COMMON STOCKS
(IDENTIFIED COST $866,501,269) | 948,707,729 |
| | WARRANTS – 0.2% | |
| | Consumer Discretionary – 0.0% | |
| 160,372 | 1 | Point Therapeutics, Inc., Warrants | 0 |
Annual Shareholder Report11
| Shares | | | Value |
| | Energy – 0.0% | |
| 966,936 | 1 | Syntroleum Corp., Warrants | 249,856 |
| | Financials – 0.0% | |
| 138,889 | 1 | China Housing & Land Development, Inc., Warrants | 63 |
| | Health Care – 0.2% | |
| 224,540 | 1,3,5 | Adaltis, Inc., Warrants | 0 |
| 131,950 | 1 | Anadys Pharmaceuticals, Inc., Warrants | 362,711 |
| 20,850 | 1 | Clinical Data, Inc., Warrants | 0 |
| 121,142 | 1 | Corcept Therapeutics, Inc., Warrants | 115,497 |
| 144,960 | 1 | Cortex Pharmaceuticals, Inc., Warrants | 0 |
| 446,014 | 1,6 | Dynavax Technologies Corp., Warrants | 952,909 |
| 201,055 | 1 | Medicure, Inc., Warrants | 0 |
| 257,688 | 1 | Threshold Pharmaceuticals, Inc., Warrants | 191,050 |
| | TOTAL | 1,622,167 |
| | TOTAL WARRANTS
(IDENTIFIED COST $175,031) | 1,872,086 |
| | MUTUAL FUND – 12.1% | |
| 114,511,100 | 6,7,8 | Federated Prime Value Obligations Fund, Institutional Shares, 0.18%
(AT NET ASSET VALUE) | 114,511,100 |
| | TOTAL INVESTMENTS — 112.2%
(IDENTIFIED COST $981,187,400)9 | 1,065,090,915 |
| | OTHER ASSETS AND LIABILITIES - NET — (12.2)%10 | (115,877,052) |
| | TOTAL NET ASSETS — 100% | $949,213,863 |
| 1 | Non-income producing security. |
| 2 | All or a portion of these securities are temporarily on loan to unaffiliated broker/dealers. |
| 3 | Market quotations and price evaluations are not available. Fair value determined in accordance with procedures established by and under the general supervision of the Fund's Board of Trustees (the “Trustees”). |
| 4 | Denotes a restricted security that either: (a) cannot be offered for public sale without first being registered, or being able to take advantage of an exemption from registration, under the Securities Act of 1933; or (b) is subject to a contractual restriction on public sales. At October 31, 2011, these restricted securities amounted to $1,507,575, which represented 0.2% of total net assets. |
| 5 | Denotes a restricted security that may be resold without restriction to “qualified institutional buyers” as defined in Rule 144A under the Securities Act of 1933 and that the Fund has determined to be liquid under criteria established by the Trustees. At October 31, 2011, these liquid restricted securities amounted to $1,507,575, which represented 0.2% of total net assets. |
| 6 | Affiliated holdings. |
| 7 | 7-Day net yield. |
| 8 | All or a portion of this security is held as collateral for securities lending. |
| 9 | The cost of investments for federal tax purposes amounts to $985,735,160. |
Annual Shareholder Report12
| 10 | Assets, other than investments in securities, less liabilities. See Statement of Assets and Liabilities. A significant portion of this balance represents loans to unaffiliated qualified brokers for securities lending. The Fund receives cash from the broker as collateral for the loaned securities and reinvests the collateral in certain short-term securities such as repurchase agreements or money market mutual funds. |
Note: The categories of investments are shown as a percentage of total net assets at October 31, 2011.
Various inputs are used in determining the value of the Fund's investments. These inputs are summarized in the three broad levels listed below:
Level 1 — quoted prices in active markets for identical securities, including investment companies with daily net asset values, if applicable.
Level 2 — other significant observable inputs (including quoted prices for similar securities, interest rates, prepayment speeds, credit risk, etc.). Also includes securities valued at amortized cost.
Level 3 — significant unobservable inputs (including the Fund's own assumptions in determining the fair value of investments).
The inputs or methodology used for valuing securities are not an indication of the risk associated with investing in those securities.
The following is a summary of the inputs used, as of October 31, 2011, in valuing the Fund's assets carried at fair value:
| Valuation Inputs |
| Level 1 —
Quoted
Prices and
Investments in
Mutual Funds | Level 2 —
Other
Significant
Observable
Inputs | Level 3 —
Significant
Unobservable
Inputs | Total |
| Equity Securities: | | | | |
| Common Stocks | | | | |
| Domestic | $630,586,271 | $ — | $ — | $630,586,271 |
| International | 204,969,717 | 111,808,291 | 1,343,4501 | 318,121,458 |
| Warrants | — | 1,872,086 | — | 1,872,086 |
| Mutual Fund | 114,511,100 | — | — | 114,511,100 |
| TOTAL SECURITIES | $950,067,088 | $113,680,377 | $1,343,450 | $1,065,090,915 |
| 1 | Includes $3,276,000 of a security transferred from Level 1 to Level 3 because the security ceased trading during the period and fair value was determined using valuation techniques utilizing unobservable market data due to observable market data being unavailable. Transfer shown represents the value of the security at the beginning of the period. |
Annual Shareholder Report
13
Following is a reconciliation of assets in which significant unobservable inputs (Level 3) were used in determining fair value: | Investments in
Equity Securities |
| Balance as of November 1, 2010 | $0 |
| Realized gain (loss) | (453,117) |
| Change in unrealized appreciation (depreciation) | (911,278) |
| (Sales) | (568,155) |
| Transfers into Level 31 | 3,276,000 |
| Balance as of October 31, 2011 | $1,343,450 |
| The total change in unrealized appreciation (depreciation) included in the Statement of Operations attributable to investments still held at October 31, 2011. | $(911,278) |
| 1 | Transferred from Level 1 to Level 3 because the security ceased trading during the period and fair value was determined using valuation techniques utilizing unobservable market data due to observable market data being unavailable. Transfer shown represents the value of the security at the beginning of the period. |
The following acronym is used throughout this portfolio:
| ADR | — American Depositary Receipt |
See Notes which are an integral part of the Financial Statements
Annual Shareholder Report14
Financial Highlights – Class A Shares
(For a Share Outstanding Throughout Each Period)
| Year Ended October 31 | 2011 | 2010 | 2009 | 2008 | 2007 |
| Net Asset Value, Beginning of Period | $24.36 | $17.85 | $15.19 | $28.16 | $24.45 |
| Income From Investment Operations: | | | | | |
| Net investment income (loss) | (0.29)1 | (0.05)1 | (0.09)1 | (0.17)1 | (0.30)1 |
| Net realized and unrealized gain (loss) on investments, short sales and foreign currency transactions | (0.83) | 6.56 | 2.75 | (11.95) | 5.19 |
| TOTAL FROM INVESTMENT OPERATIONS | (1.12) | 6.51 | 2.66 | (12.12) | 4.89 |
| Less Distributions: | | | | | |
| Distributions from net realized gain on investments, short sales and foreign currency transactions | — | — | — | (0.85) | (1.18) |
| Net Asset Value, End of Period | $23.24 | $24.36 | $17.85 | $15.19 | $28.16 |
| Total Return2 | (4.60)% | 36.47% | 17.51% | (44.29)% | 20.92% |
| Ratios to Average Net Assets: | | | | | |
| Net expenses | 1.95% | 1.95% | 1.95%3 | 1.95%3 | 1.95% |
| Net expenses excluding dividends and other expenses related to short sales | 1.95% | 1.95% | — | — | — |
| Net investment income (loss) | (1.15)% | (0.24)% | (0.58)% | (0.77)% | (1.15)% |
| Expense waiver/reimbursement4 | 0.36% | 0.36% | 0.38% | 0.28% | 0.24% |
| Supplemental Data: | | | | | |
| Net assets, end of period (000 omitted) | $687,567 | $919,029 | $709,757 | $543,187 | $967,496 |
| Portfolio turnover | 55% | 68% | 90% | 58% | 46% |
| 1 | Per share numbers have been calculated using the average shares method. |
| 2 | Based on net asset value, which does not reflect the sales charge, redemption fee or contingent deferred sales charge, if applicable. |
| 3 | The net expense ratio is calculated without reduction for expense offset arrangements. The net expense ratios are 1.95% and 1.95% for the years ended October 31, 2009 and 2008, respectively, after taking into account these expense reductions. |
| 4 | This expense decrease is reflected in both the net expense and the net investment income (loss) ratios shown above. |
See Notes which are an integral part of the Financial Statements
Annual Shareholder Report15
Financial Highlights – Class B Shares
(For a Share Outstanding Throughout Each Period)
| Year Ended October 31 | 2011 | 2010 | 2009 | 2008 | 2007 |
| Net Asset Value, Beginning of Period | $23.34 | $17.19 | $14.71 | $27.45 | $23.99 |
| Income From Investment Operations: | | | | | |
| Net investment income (loss) | (0.41)1 | (0.16)1 | (0.17)1 | (0.29)1 | (0.43)1 |
| Net realized and unrealized gain (loss) on investments, short sales and foreign currency transactions | (0.79) | 6.31 | 2.65 | (11.60) | 5.07 |
| TOTAL FROM INVESTMENT OPERATIONS | (1.20) | 6.15 | 2.48 | (11.89) | 4.64 |
| Less Distributions: | | | | | |
| Distributions from net realized gain on investments, short sales and foreign currency transactions | — | — | — | (0.85) | (1.18) |
| Net Asset Value, End of Period | $22.14 | $23.34 | $17.19 | $14.71 | $27.45 |
| Total Return2 | (5.14)% | 35.78% | 16.86% | (44.61)% | 20.25% |
| Ratios to Average Net Assets: | | | | | |
| Net expenses | 2.50% | 2.50% | 2.50%3 | 2.50%3 | 2.50% |
| Net expenses excluding dividends and other expenses related to short sales | 2.50% | 2.50% | — | — | — |
| Net investment income (loss) | (1.69)% | (0.82)% | (1.11)% | (1.35)% | (1.70)% |
| Expense waiver/reimbursement4 | 0.32% | 0.33% | 0.36% | 0.28% | 0.23% |
| Supplemental Data: | | | | | |
| Net assets, end of period (000 omitted) | $61,010 | $82,726 | $76,876 | $78,150 | $177,325 |
| Portfolio turnover | 55% | 68% | 90% | 58% | 46% |
| 1 | Per share numbers have been calculated using the average shares method. |
| 2 | Based on net asset value, which does not reflect the sales charge, redemption fee or contingent deferred sales charge, if applicable. |
| 3 | The net expense ratio is calculated without reduction for expense offset arrangements. The net expense ratios are 2.50% and 2.50% for the years ended October 31, 2009 and 2008, respectively, after taking into account these expense reductions. |
| 4 | This expense decrease is reflected in both the net expense and the net investment income (loss) ratios shown above. |
See Notes which are an integral part of the Financial Statements
Annual Shareholder Report16
Financial Highlights – Class C Shares
(For a Share Outstanding Throughout Each Period)
| Year Ended October 31 | 2011 | 2010 | 2009 | 2008 | 2007 |
| Net Asset Value, Beginning of Period | $23.34 | $17.19 | $14.71 | $27.45 | $23.99 |
| Income From Investment Operations: | | | | | |
| Net investment income (loss) | (0.41)1 | (0.16)1 | (0.17)1 | (0.29)1 | (0.43)1 |
| Net realized and unrealized gain (loss) on investments, short sales and foreign currency transactions | (0.79) | 6.31 | 2.65 | (11.60) | 5.07 |
| TOTAL FROM INVESTMENT OPERATIONS | (1.20) | 6.15 | 2.48 | (11.89) | 4.64 |
| Less Distributions: | | | | | |
| Distributions from net realized gain on investments, short sales and foreign currency transactions | — | — | — | (0.85) | (1.18) |
| Net Asset Value, End of Period | $22.14 | $23.34 | $17.19 | $14.71 | $27.45 |
| Total Return2 | (5.14)% | 35.78% | 16.86% | (44.61)% | 20.25% |
| Ratios to Average Net Assets: | | | | | |
| Net expenses | 2.50% | 2.50% | 2.50%3 | 2.50%3 | 2.50% |
| Net expenses excluding dividends and other expenses related to short sales | 2.50% | 2.50% | — | — | — |
| Net investment income (loss) | (1.68)% | (0.80)% | (1.12)% | (1.34)% | (1.70)% |
| Expense waiver/reimbursement4 | 0.28% | 0.29% | 0.34% | 0.28% | 0.23% |
| Supplemental Data: | | | | | |
| Net assets, end of period (000 omitted) | $172,922 | $208,270 | $175,955 | $175,301 | $358,085 |
| Portfolio turnover | 55% | 68% | 90% | 58% | 46% |
| 1 | Per share numbers have been calculated using the average shares method. |
| 2 | Based on net asset value, which does not reflect the sales charge, redemption fee or contingent deferred sales charge, if applicable. |
| 3 | The net expense ratio is calculated without reduction for expense offset arrangements. The net expense ratios are 2.50% and 2.50% for the years ended October 31, 2009 and 2008, respectively, after taking into account these expense reductions. |
| 4 | This expense decrease is reflected in both the net expense and the net investment income (loss) ratios shown above. |
See Notes which are an integral part of the Financial Statements
Annual Shareholder Report17
Financial Highlights – Class R Shares
(For a Share Outstanding Throughout Each Period)
| Year Ended October 31 | 2011 | 2010 | 2009 | 2008 | 2007 |
| Net Asset Value, Beginning of Period | $24.36 | $17.85 | $15.19 | $28.16 | $24.45 |
| Income From Investment Operations: | | | | | |
| Net investment income (loss) | (0.29)1 | (0.04)1 | (0.09)1 | (0.16)1 | (0.29)1 |
| Net realized and unrealized gain (loss) on investments, short sales and foreign currency transactions | (0.83) | 6.55 | 2.75 | (11.96) | 5.18 |
| TOTAL FROM INVESTMENT OPERATIONS | (1.12) | 6.51 | 2.66 | (12.12) | 4.89 |
| Less Distributions: | | | | | |
| Distributions from net realized gain on investments, short sales and foreign currency transactions | — | — | — | (0.85) | (1.18) |
| Net Asset Value, End of Period | $23.24 | $24.36 | $17.85 | $15.19 | $28.16 |
| Total Return2 | (4.60)% | 36.47% | 17.51% | (44.29)% | 20.92% |
| Ratios to Average Net Assets: | | | | | |
| Net expenses | 1.95% | 1.95% | 1.95%3 | 1.95%3 | 1.95% |
| Net expenses excluding dividends and other expenses related to short sales | 1.95% | 1.95% | — | — | — |
| Net investment income (loss) | (1.14)% | (0.21)% | (0.58)% | (0.73)% | (1.15)% |
| Expense waiver/reimbursement4 | 0.45% | 0.45% | 0.49% | 0.46% | 0.44% |
| Supplemental Data: | | | | | |
| Net assets, end of period (000 omitted) | $27,715 | $35,515 | $25,955 | $17,665 | $20,440 |
| Portfolio turnover | 55% | 68% | 90% | 58% | 46% |
| 1 | Per share numbers have been calculated using the average shares method. |
| 2 | Based on net asset value. |
| 3 | The net expense ratio is calculated without reduction for expense offset arrangements. The net expense ratios are 1.95% and 1.95% for the years ended October 31, 2009 and 2008, respectively, after taking into account these expense reductions. |
| 4 | This expense decrease is reflected in both the net expense and the net investment income (loss) ratios shown above. |
See Notes which are an integral part of the Financial Statements
Annual Shareholder Report18
Statement of Assets and Liabilities
October 31, 2011
| Assets: | | |
| Total investments in securities, at value including $105,249,599 of securities loaned and $189,933,373 of investments in affiliated holdings (Note 5) (identified cost $981,187,400) | | $1,065,090,915 |
| Cash denominated in foreign currencies (identified cost $106,618) | | 106,319 |
| Income receivable | | 31,336 |
| Receivable for investments sold | | 3,916,455 |
| Receivable for shares sold | | 902,215 |
| Other assets | | 1,578 |
| TOTAL ASSETS | | 1,070,048,818 |
| Liabilities: | | |
| Payable for investments purchased | $875,110 | |
| Payable for shares redeemed | 3,107,118 | |
| Bank overdraft | 1,040,991 | |
| Payable for collateral due to broker for securities lending | 114,511,100 | |
| Payable for distribution services fee (Note 5) | 258,900 | |
| Payable for shareholder services fee (Note 5) | 360,817 | |
| Accrued expenses | 680,919 | |
| TOTAL LIABILITIES | | 120,834,955 |
| Net assets for 41,350,464 shares outstanding | | $949,213,863 |
| Net Assets Consist of: | | |
| Paid-in capital | | $802,533,178 |
| Net unrealized appreciation of investments and translation of assets and liabilities in foreign currency | | 83,903,649 |
| Accumulated net realized gain on investments, written options and foreign currency transactions | | 62,777,036 |
| TOTAL NET ASSETS | | $949,213,863 |
Annual Shareholder Report19
Statement of Assets and Liabilities — continued| Net Asset Value, Offering Price and Redemption Proceeds Per Share | | |
| Class A Shares: | | |
| Net asset value per share ($687,566,715 ÷ 29,590,608 shares outstanding), no par value, unlimited shares authorized | | $23.24 |
| Offering price per share (100/94.50 of $23.24) | | $24.59 |
| Redemption proceeds per share | | $23.24 |
| Class B Shares: | | |
| Net asset value per share ($61,010,115 ÷ 2,756,066 shares outstanding), no par value, unlimited shares authorized | | $22.14 |
| Offering price per share | | $22.14 |
| Redemption proceeds per share (94.50/100 of $22.14) | | $20.92 |
| Class C Shares: | | |
| Net asset value per share ($172,922,472 ÷ 7,811,269 shares outstanding), no par value, unlimited shares authorized | | $22.14 |
| Offering price per share | | $22.14 |
| Redemption proceeds per share (99.00/100 of $22.14) | | $21.92 |
| Class R Shares: | | |
| Net asset value per share ($27,714,561 ÷ 1,192,521 shares outstanding), no par value, unlimited shares authorized | | $23.24 |
| Offering price per share | | $23.24 |
| Redemption proceeds per share | | $23.24 |
See Notes which are an integral part of the Financial Statements
Annual Shareholder Report20
Statement of Operations
Year Ended October 31, 2011
| Investment Income: | | | |
| Dividends (including $11,056 received from affiliated holdings (Note 5) and net of foreign taxes withheld of $215,309) | | | $6,070,812 |
| Interest (including income on securities loaned of $3,249,267) | | | 3,787,777 |
| TOTAL INCOME | | | 9,858,589 |
| Expenses: | | | |
| Investment adviser fee (Note 5) | | $17,281,304 | |
| Administrative fee (Note 5) | | 947,350 | |
| Custodian fees | | 634,886 | |
| Transfer and dividend disbursing agent fees and expenses (Note 2) | | 2,584,420 | |
| Directors'/Trustees' fees | | 10,158 | |
| Auditing fees | | 36,624 | |
| Legal fees | | 5,891 | |
| Portfolio accounting fees | | 193,993 | |
| Distribution services fee (Note 5) | | 4,558,392 | |
| Shareholder services fee (Note 5) | | 2,905,707 | |
| Account administration fee (Note 2) | | 19,776 | |
| Share registration costs | | 84,609 | |
| Printing and postage | | 196,500 | |
| Insurance premiums | | 6,421 | |
| Miscellaneous | | 9,312 | |
| Interest expense | | 1,679 | |
| TOTAL EXPENSES | | 29,477,022 | |
Annual Shareholder Report21
Statement of Operations — continued| Waivers and Reimbursements: | | | |
| Waiver/reimbursement of investment adviser fee (Note 5) | $(1,822,772) | | |
| Waiver of administrative fee (Note 5) | (24,468) | | |
| Waiver of distribution services fee (Note 5) | (531,916) | | |
| Reimbursement of shareholder services fee (Note 5) | (2,591) | | |
| Reimbursement of transfer and dividend disbursing agent fees and expenses (Note 2) and (Note 5) | (1,807,834) | | |
| TOTAL WAIVERS AND REIMBURSEMENTS | | $(4,189,581) | |
| Net expenses | | | $25,287,441 |
| Net investment income (loss) | | | (15,428,852) |
| Realized and Unrealized Gain (Loss) on Investments and Foreign Currency Transactions: | | | |
| Net realized gain on investments and foreign currency transactions | | | 113,695,968 |
| Net change in unrealized appreciation of investments and translation of assets and liabilities in foreign currency | | | (139,675,910) |
| Net realized and unrealized loss on investments and foreign currency transactions | | | (25,979,942) |
| Change in net assets resulting from operations | | | $(41,408,794) |
See Notes which are an integral part of the Financial Statements
Annual Shareholder Report22
Statement of Changes in Net Assets
| Year Ended October 31 | 2011 | 2010 |
| Increase (Decrease) in Net Assets | | |
| Operations: | | |
| Net investment income (loss) | $(15,428,852) | $(4,183,279) |
| Net realized gain on investments, foreign currency transactions and short sales | 113,695,968 | 105,228,581 |
| Net change in unrealized appreciation/depreciation of investments and translation of assets and liabilities in foreign currency | (139,675,910) | 239,872,150 |
| CHANGE IN NET ASSETS RESULTING FROM OPERATIONS | (41,408,794) | 340,917,452 |
| Share Transactions: | | |
| Proceeds from sale of shares | 243,224,995 | 261,249,601 |
| Cost of shares redeemed | (498,142,291) | (345,169,712) |
| CHANGE IN NET ASSETS RESULTING FROM SHARE TRANSACTIONS | (254,917,296) | (83,920,111) |
| Change in net assets | (296,326,090) | 256,997,341 |
| Net Assets: | | |
| Beginning of period | 1,245,539,953 | 988,542,612 |
| End of period (including accumulated net investment income (loss) of $0 and $(1,918,642), respectively) | $949,213,863 | $1,245,539,953 |
See Notes which are an integral part of the Financial Statements
Annual Shareholder Report23
Notes to Financial Statements
October 31, 2011
1. ORGANIZATION
Federated Equity Funds (the “Trust”) is registered under the Investment Company Act of 1940, as amended (the “Act”), as an open-end management investment company. The Trust consists of 13 portfolios. The financial statements included herein are only those of Federated Kaufmann Small Cap Fund (the “Fund”), a diversified portfolio. The financial statements of the other portfolios are presented separately. The assets of each portfolio are segregated and a shareholder's interest is limited to the portfolio in which shares are held. Each portfolio pays its own expenses. The Fund offers four classes of shares: Class A Shares, Class B Shares, Class C Shares and Class R Shares. All shares of the Fund have equal rights with respect to voting, except on class-specific matters. The investment objective of the Fund is capital appreciation.
2. SIGNIFICANT ACCOUNTING POLICIES
The following is a summary of significant accounting policies consistently followed by the Fund in the preparation of its financial statements. These policies are in conformity with U.S. generally accepted accounting principles (GAAP).
Investment Valuation
In calculating its net asset value (NAV), the Fund generally values investments as follows:
- Equity securities listed on an exchange or traded through a regulated market system are valued at their last reported sale price or official closing price in their principal exchange or market.
- Shares of other mutual funds are valued based upon their reported NAVs.
- Fixed-income securities acquired with remaining maturities greater than 60 days are fair valued using price evaluations provided by a pricing service approved by the Trustees.
- Fixed-income securities acquired with remaining maturities of 60 days or less are valued at their cost (adjusted for the accretion of any discount or amortization of any premium), which approximates market value.
- Derivative contracts listed on exchanges are valued at their reported settlement or closing price.
- Over-the-counter (OTC) derivative contracts are fair valued using price evaluations provided by a pricing service approved by the Trustees.
- For securities that are fair valued in accordance with procedures established by and under the general supervision of the Trustees, certain factors may be considered such as: the purchase price of the security, information obtained by contacting the issuer, analysis of the issuer's financial statements or other available documents, fundamental analytical data, the nature and duration of restrictions on disposition, the movement of the market in which the security is normally traded and public trading in similar securities of the issuer or comparable issuers.
If the Fund cannot obtain a price or price evaluation from a pricing service for an investment, the Fund may attempt to value the investment based upon the mean of bid and asked quotations or fair value the investment based on price evaluations, from one or more dealers. If any price, quotation, price evaluation or other pricing source is not readily available when the NAV is calculated, the Fund uses the fair value of the investment determined in accordance with the procedures described below. There can be no assurance that the Fund could purchase or sell an investment at the price used to calculate the Fund's NAV.
Annual Shareholder Report
24
Fair Valuation and Significant Events ProceduresThe Trustees have authorized the use of pricing services to provide evaluations of the current fair value of certain investments for purposes of calculating the NAV. Factors considered by pricing services in evaluating an investment include the yields or prices of investments of comparable quality, coupon, maturity, call rights and other potential prepayments, terms and type, reported transactions, indications as to values from dealers and general market conditions. Some pricing services provide a single price evaluation reflecting the bid-side of the market for an investment (a “bid” evaluation). Other pricing services offer both bid evaluations and price evaluations indicative of a price between the prices bid and asked for the investment (a “mid” evaluation). The Fund normally uses bid evaluations for U.S. Treasury and Agency securities and mortgage-backed securities. The Fund normally uses mid evaluations for other types of fixed-income securities and OTC derivative contracts. In the event that market quotations and price evaluations are not available for an investment, the fair value of the investment is determined in accordance with procedures adopted by the Trustees.
The Trustees also have adopted procedures requiring an investment to be priced at its fair value whenever the Adviser determines that a significant event affecting the value of the investment has occurred between the time as of which the price of the investment would otherwise be determined and the time as of which the NAV is computed. An event is considered significant if there is both an affirmative expectation that the investment's value will change in response to the event and a reasonable basis for quantifying the resulting change in value. Examples of significant events that may occur after the close of the principal market on which a security is traded, or after the time of a price evaluation provided by a pricing service or a dealer, include:
- With respect to securities traded in foreign markets, significant trends in U.S. equity markets or in the trading of foreign securities index futures or options contracts;
- With respect to price evaluations of fixed-income securities determined before the close of regular trading on the NYSE, actions by the Federal Reserve Open Market Committee and other significant trends in U.S. fixed-income markets;
- Political or other developments affecting the economy or markets in which an issuer conducts its operations or its securities are traded; and
- Announcements concerning matters such as acquisitions, recapitalizations, litigation developments, a natural disaster affecting the issuer's operations or regulatory changes or market developments affecting the issuer's industry.
The Trustees have approved the use of a pricing service to determine the fair value of equity securities traded principally in foreign markets when the Adviser determines that there has been a significant trend in the U.S. equity markets or in index futures trading. For other significant events, the Fund may seek to obtain more current quotations or price evaluations from alternative pricing sources. If a reliable alternative pricing source is not available, the Fund will determine the fair value of the investment using another method approved by the Trustees.
Repurchase Agreements
The Fund may invest in repurchase agreements for short-term liquidity purposes. It is the policy of the Fund to require the other party to a repurchase agreement to transfer to the Fund's custodian or sub-custodian eligible securities or cash with a market value (after transaction costs) at least equal to the repurchase price to be paid under the repurchase agreement. The eligible securities are transferred to accounts with the custodian or sub-custodian in which the Fund holds a “securities entitlement” and exercises “control” as those terms are defined in the Uniform Commercial Code. The Fund has established procedures for Annual Shareholder Report
25
monitoring the market value of the transferred securities and requiring the transfer of additional eligible securities if necessary to equal at least the repurchase price. These procedures also allow the other party to require securities to be transferred from the account to the extent that their market value exceeds the repurchase price or in exchange for other eligible securities of equivalent market value.The insolvency of the other party or other failure to repurchase the securities may delay the disposition of the underlying securities or cause the Fund to receive less than the full repurchase price. Under the terms of the repurchase agreement, any amounts received by the Fund in excess of the repurchase price and related transaction costs must be remitted to the other party.
The Fund may enter into repurchase agreements in which eligible securities are transferred into joint trading accounts maintained by the custodian or sub-custodian for investment companies and other clients advised by the Fund's Adviser and its affiliates. The Fund will participate on a pro rata basis with the other investment companies and clients in its share of the securities transferred under such repurchase agreements and in its share of proceeds from any repurchase or other disposition of such securities.
Investment Income, Gains and Losses, Expenses and Distributions
Investment transactions are accounted for on a trade-date basis. Realized gains and losses from investment transactions are recorded on an identified-cost basis. Interest income and expenses are accrued daily. Dividend income and distributions to shareholders are recorded on the ex-dividend date. Foreign dividends are recorded on the ex-dividend date or when the Fund is informed of the ex-dividend date. Distributions of net investment income, if any, are declared and paid annually. Non-cash dividends included in dividend income, if any, are recorded at fair value. Investment income, realized and unrealized gains and losses, and certain fund-level expenses are allocated to each class based on relative average daily net assets, except that Class A Shares, Class B Shares, Class C Shares and Class R Shares may bear distribution services fees, shareholder services fees, account administration fees and certain transfer and dividend disbursing agent fees unique to those classes. For the year ended October 31, 2011, transfer and dividend disbursing agent fees and account administration fees for the Fund were as follows:
| Transfer and
Dividend
Disbursing
Agent Fees
Incurred | Transfer and
Dividend
Disbursing
Agent Fees
Reimbursed | Account
Administration
Fees Incurred |
| Class A Shares | $1,912,353 | $(1,407,563) | $19,297 |
| Class B Shares | 176,199 | (131,184) | — |
| Class C Shares | 388,101 | (269,087) | 479 |
| Class R Shares | 107,767 | — | — |
| TOTAL | $2,584,420 | $(1,807,834) | $19,776 |
Dividends are declared separately for each class. No class has preferential dividend rights; differences in per share dividend rates are generally due to differences in separate class expenses.
Annual Shareholder Report
26
Premium and Discount AmortizationAll premiums and discounts on fixed-income securities are amortized/accreted using the effective interest rate method.
Federal Taxes
It is the Fund's policy to comply with the Subchapter M provision of the Internal Revenue Code and to distribute to shareholders each year substantially all of its income. Accordingly, no provision for federal income tax is necessary. As of and during the year ended October 31, 2011, the Fund did not have a liability for any uncertain tax positions. The Fund recognizes interest and penalties, if any, related to tax liabilities as income tax expense in the Statement of Operations. As of October 31, 2011, tax years 2008 through 2011 remain subject to examination by the Fund's major tax jurisdictions, which include the United States of America and the Commonwealth of Massachusetts.
The Fund may be subject to taxes imposed by governments of countries in which it invests. Such taxes are generally based on either income or gains earned or repatriated. The Fund accrues and applies such taxes to net investment income, net realized gains and net unrealized gains as income and/or gains are earned.
When-Issued and Delayed Delivery Transactions
The Fund may engage in when-issued or delayed delivery transactions. The Fund records when-issued securities on the trade date and maintains security positions such that sufficient liquid assets will be available to make payment for the securities purchased. Securities purchased on a when-issued or delayed delivery basis are marked to market daily and begin earning interest on the settlement date. Losses may occur on these transactions due to changes in market conditions or the failure of counterparties to perform under the contract.
Foreign Exchange Contracts
The Fund enters into foreign exchange contracts for the delayed delivery of securities or foreign currency exchange transactions. The Fund enters into foreign exchange contracts to protect assets against adverse changes in foreign currency exchange rates or exchange control regulations. Purchased contracts are used to acquire exposure to foreign currencies, whereas, contracts to sell are used to hedge the Fund's securities against currency fluctuations. Risks may arise upon entering into these transactions from the potential inability of counterparties to meet the terms of their commitments and from unanticipated movements in security prices or foreign exchange rates. The foreign exchange contracts are adjusted by the daily exchange rate of the underlying currency and any gains or losses are recorded for financial statement purposes as unrealized until the settlement date.
At October 31, 2011, the Fund had no outstanding foreign exchange contracts.
The average value at settlement date payable and receivable of foreign exchange contracts purchased and sold by the Fund throughout the period was $2,801 and $1,098, respectively. This is based on the contracts held as of each month-end throughout the fiscal period.
Foreign Currency Translation
The accounting records of the Fund are maintained in U.S. dollars. All assets and liabilities denominated in foreign currencies (FCs) are translated into U.S. dollars based on the rates of exchange of such currencies against U.S. dollars on the date of valuation. Purchases and sales of securities, income and expenses are translated at the rate of exchange quoted on the Annual Shareholder Report
27
respective date that such transactions are recorded. The Fund does not isolate that portion of the results of operations resulting from changes in foreign exchange rates on investments from the fluctuations arising from changes in market prices of securities held. Such fluctuations are included with the net realized and unrealized gain or loss from investments.Reported net realized foreign exchange gains or losses arise from sales of portfolio securities, sales and maturities of short-term securities, sales of FCs, currency gains or losses realized between the trade and settlement dates on securities transactions, the difference between the amounts of dividends, interest and foreign withholding taxes recorded on the Fund's books, and the U.S. dollar equivalent of the amounts actually received or paid. Net unrealized foreign exchange gains and losses arise from changes in the value of assets and liabilities other than investments in securities at fiscal year end, resulting from changes in the exchange rate.
Additional Disclosure Related to Derivative Instruments
The Effect of Derivative Instruments on the Statement of Operations for the Year Ended October 31, 2011
| Amount of Realized Gain or (Loss) on Derivatives Recognized in Income |
| Forward
Currency
Contracts |
| Foreign exchange contracts | $130,770 |
| Change in Unrealized Appreciation or (Depreciation) on Derivatives Recognized in Income |
| Forward
Currency
Contracts |
| Foreign exchange contracts | $(232) |
Securities Lending
The Fund participates in a securities lending program providing for the lending of equity securities to qualified brokers. The Fund normally receives cash collateral for securities loaned that is invested in an affiliated money market fund or in short-term securities including repurchase agreements. Collateral is maintained at a minimum level of 100% of the market value of investments loaned, plus interest, if applicable. Earnings on collateral are allocated between the securities lending agent, as a fee for its services under the program, and the Fund, according to agreed-upon rates.
As of October 31, 2011, securities subject to this type of arrangement and related collateral were as follows:
Market Value of
Securities Loaned | Market Value
of Collateral |
| $105,249,599 | $114,511,100 |
Annual Shareholder Report28
Restricted Securities
The Fund may purchase securities which are considered restricted. Restricted securities are securities that either: (a) cannot be offered for public sale without first being registered, or being able to take advantage of an exemption from registration, under the Securities Act of 1933; or (b) are subject to contractual restrictions on public sales. In some cases, when a security cannot be offered for public sale without first being registered, the issuer of the restricted security has agreed to register such securities for resale, at the issuer's expense, either upon demand by the Fund or in connection with another registered offering of the securities. Many such restricted securities may be resold in the secondary market in transactions exempt from registration. Restricted securities may be determined to be liquid under criteria established by the Trustees. The Fund will not incur any registration costs upon such resales. The Fund's restricted securities are valued at the price provided by dealers in the secondary market or, if no market prices are available, at the fair value as determined in accordance with procedures established by and under the general supervision of the Trustees.
Other
The preparation of financial statements in conformity with GAAP requires management to make estimates and assumptions that affect the amounts of assets, liabilities, expenses and revenues reported in the financial statements. Actual results could differ from those estimated.
3. SHARES OF BENEFICIAL INTEREST
The following tables summarize share activity:
| Year Ended October 31 | 2011 | 2010 |
| Class A Shares: | Shares | Amount | Shares | Amount |
| Shares sold | 7,967,034 | $202,304,601 | 10,699,622 | $224,413,126 |
| Shares redeemed | (16,103,734) | (406,038,823) | (12,744,172) | (264,118,709) |
NET CHANGE RESULTING FROM
CLASS A SHARE TRANSACTIONS | (8,136,700) | $(203,734,222) | (2,044,550) | $(39,705,583) |
| Year Ended October 31 | 2011 | 2010 |
| Class B Shares: | Shares | Amount | Shares | Amount |
| Shares sold | 240,944 | $5,925,106 | 204,308 | $4,131,359 |
| Shares redeemed | (1,029,854) | (24,495,645) | (1,131,440) | (22,449,344) |
NET CHANGE RESULTING FROM
CLASS B SHARE TRANSACTIONS | (788,910) | $(18,570,539) | (927,132) | $(18,317,985) |
| Year Ended October 31 | 2011 | 2010 |
| Class C Shares: | Shares | Amount | Shares | Amount |
| Shares sold | 895,081 | $22,019,731 | 986,705 | $19,666,953 |
| Shares redeemed | (2,008,502) | (47,970,706) | (2,297,632) | (45,771,916) |
NET CHANGE RESULTING FROM
CLASS C SHARE TRANSACTIONS | (1,113,421) | $(25,950,975) | (1,310,927) | $(26,104,963) |
Annual Shareholder Report29
| Year Ended October 31 | 2011 | 2010 |
| Class R Shares: | Shares | Amount | Shares | Amount |
| Shares sold | 507,897 | $12,975,557 | 623,873 | $13,038,163 |
| Shares redeemed | (773,018) | (19,637,117) | (620,464) | (12,829,743) |
NET CHANGE RESULTING FROM
CLASS R SHARE TRANSACTIONS | (265,121) | $(6,661,560) | 3,409 | $208,420 |
| NET CHANGE RESULTING FROM TOTAL FUND SHARE TRANSACTIONS | (10,304,152) | $(254,917,296) | (4,279,200) | $(83,920,111) |
4. FEDERAL TAX INFORMATION
The timing and character of income and capital gain distributions are determined in accordance with income tax regulations, which may differ from GAAP. These differences are due to differing treatments for foreign currency transactions, passive foreign investment company adjustments, net operating losses and discount accretion/premium amortization on debt securities.
For the year ended October 31, 2011, permanent differences identified and reclassified among the components of net assets were as follows:
| Increase (Decrease) |
| Paid-In Capital | Undistributed
Net Investment
Income (Loss) | Accumulated
Net Realized
Gain (Loss) |
| $(13,920,818) | $17,347,494 | $(3,426,676) |
Net investment income (loss), net realized gains (losses), and net assets were not affected by this reclassification.
As of October 31, 2011, the components of distributable earnings on a tax basis were as follows:
| Undistributed capital gains | $67,324,796 |
| Net unrealized appreciation | $79,355,889 |
The difference between book-basis and tax-basis net unrealized appreciation/depreciation is attributable to differing treatments for the deferral of losses on wash sales.
At October 31, 2011, the cost of investments for federal tax purposes was $985,735,160. The net unrealized appreciation of investments for federal tax purposes excluding any unrealized depreciation resulting from changes in foreign currency exchange rates was $79,355,755. This consists of net unrealized appreciation from investments for those securities having an excess of value over cost of $212,164,173 and net unrealized depreciation from investments for those securities having an excess of cost over value of $132,808,418.
The Fund used capital loss carryforwards of $38,993,969 to offset taxable capital gains realized during the year ended October 31, 2011.
Annual Shareholder Report
30
5. INVESTMENT ADVISER FEE AND OTHER TRANSACTIONS WITH AFFILIATESInvestment Adviser Fee
Federated Equity Management Company of Pennsylvania is the Fund's investment adviser (the “Adviser”). The advisory agreement between the Fund and the Adviser provides for an annual fee equal to 1.425% of the Fund's average daily net assets. Subject to the terms described in the Expense Limitation note, the Adviser may voluntarily choose to waive any portion of its fee. For the year ended October 31, 2011, the Adviser voluntarily waived $1,728,410 of its fee. In addition, an affiliate of the Adviser reimbursed $1,807,834 of transfer and dividend disbursing agent fees and expenses.
Certain of the Fund's assets are managed by Federated Global Investment Management Corp. (the “Sub-Adviser”). Under the terms of a sub-advisory agreement between the Adviser and the Sub-Adviser, the Sub-Adviser receives an allocable portion of the Fund's adviser fee. The fee is paid by the Adviser out of its resources and is not an incremental Fund expense. For the year ended October 31, 2011, the Sub-Adviser earned a fee of $14,249,497.
Administrative Fee
Federated Administrative Services (FAS), under the Administrative Services Agreement, provides the Fund with administrative personnel and services. The fee paid to FAS is based on the average aggregate daily net assets of certain Federated funds as specified below:
| Administrative Fee | Average Aggregate Daily Net Assets
of the Federated Funds |
| 0.150% | on the first $5 billion |
| 0.125% | on the next $5 billion |
| 0.100% | on the next $10 billion |
| 0.075% | on assets in excess of $20 billion |
The administrative fee received during any fiscal year shall be at least $150,000 per portfolio and $40,000 per each additional class of Shares. Subject to the terms described in the Expense Limitation note, FAS may voluntarily choose to waive any portion of its fee. For the year ended October 31, 2011, the net fee paid to FAS was 0.076% of average daily net assets of the Fund. FAS waived $24,468 of its fee.
Annual Shareholder Report
31
Distribution Services Fee
The Fund has adopted a Distribution Plan (the “Plan”) pursuant to Rule 12b-1 under the Act. Under the terms of the Plan, the Fund will compensate Federated Securities Corp. (FSC), the principal distributor, from the daily net assets of the Fund's Class A Shares, Class B Shares, Class C Shares and Class R Shares to finance activities intended to result in the sale of these shares. The Plan provides that the Fund may incur distribution expenses at the following percentages of average daily net assets annually, to compensate FSC:
| Share Class Name | Percentage of Average Daily
Net Assets of Class |
| Class A Shares | 0.25% |
| Class B Shares | 0.75% |
| Class C Shares | 0.75% |
| Class R Shares | 0.50% |
Subject to the terms described in the Expense Limitation note, FSC may voluntarily choose to waive any portion of its fee. For the year ended October 31, 2011, distribution services fees for the Fund were as follows:
| Distribution Services
Fees Incurred | Distribution Services
Fees Waived |
| Class A Shares | $2,224,614 | $(426,401) |
| Class B Shares | 594,170 | — |
| Class C Shares | 1,564,000 | — |
| Class R Shares | 175,608 | (105,515) |
| TOTAL | $4,558,392 | $(531,916) |
When FSC receives fees, it may pay some or all of them to financial intermediaries whose customers purchase shares. For the year ended October 31, 2011, FSC retained $1,795,747 of fees paid by the Fund.
Sales Charges
Front-end sales charges and contingent deferred sales charges (CDSC) do not represent expenses of the Fund. They are deducted from the proceeds of sales of Fund shares prior to investment or from redemption proceeds prior to remittance, as applicable. For the year ended October 31, 2011, FSC retained $49,170 in sales charges from the sale of Class A Shares. FSC also retained $17,961 and $4,012 of CDSC relating to redemptions of Class B Shares and Class C Shares, respectively.
Annual Shareholder Report
32
Shareholder Services Fee
The Fund may pay fees (“Service Fees”) up to 0.25% of the average daily net assets of the Fund's Class A Shares, Class B Shares and Class C Shares to financial intermediaries or to Federated Shareholder Services Company (FSSC) for providing services to shareholders and maintaining shareholder accounts. Financial intermediaries may include a company affiliated with management of Federated Investors, Inc. A financial intermediary affiliated with management of Federated Investors, Inc. received $21,378 of Service Fees for the year ended October 31, 2011. Subject to the terms described in the Expense Limitation note, FSSC may voluntarily reimburse the Fund for Service Fees. For the year ended October 31, 2011, Service Fees for the Fund were as follows:
| Service
Fees Incurred | Service
Fees Reimbursed |
| Class A Shares | $2,186,795 | $ — |
| Class B Shares | 198,057 | (300) |
| Class C Shares | 520,855 | (2,291) |
| TOTAL | $2,905,707 | $(2,591) |
For the year ended October 31, 2011, FSSC did not receive any fees paid by the Fund.
Expense Limitation
The Adviser and its affiliates (which may include FSC, FAS and FSSC) have voluntarily agreed to waive their fees and/or reimburse expenses so that the total annual fund operating expenses (as shown in the financial highlights) paid by the Fund's Class A Shares, Class B Shares, Class C Shares and Class R Shares (after the voluntary waivers and/or reimbursements) will not exceed 1.95%, 2.50%, 2.50% and 1.95% (the “Fee Limit”), respectively, up to but not including the later of (the “Termination Date”): (a) January 1, 2013; or (b) the date of the Fund's next effective Prospectus. While the Adviser and its affiliates currently do not anticipate terminating or increasing these arrangements prior to the Termination Date, these arrangements may only be terminated or the Fee Limit increased prior to the Termination Date with the agreement of the Trustees.
Interfund Transactions
During the year ended October 31, 2011, the Fund engaged in purchase and sale transactions with funds that have a common investment adviser (or affiliated investment advisers), common Directors/Trustees, and/or common Officers. These purchase and sale transactions complied with Rule 17a-7 under the Act and amounted to $23,488,568 and $90,663, respectively.
General
Certain Officers and Trustees of the Fund are Officers and Directors or Trustees of the above companies.
Annual Shareholder Report
33
Transactions Involving Affiliated Companies and Affiliated Holdings
An affiliated company is a company in which the Fund has ownership of at least 5% of the voting shares. Transactions with affiliated companies during the year ended October 31, 2011, were as follows:
| Affiliates | Balance of
Shares Held
10/31/2010 | Purchases/
Additions | Sales/
Reductions | Balance of
Shares Held
10/31/2011 | Value |
| Catalyst Pharmaceutical Partners, Inc. | 1,832,350 | 403,356 | 71,900 | 2,163,806 | $2,271,996 |
| Cinedigm Digital Cinema Corp. | 2,103,508 | 146,492 | 76,200 | 2,173,800 | 2,956,368 |
| Cinedigm Digital Cinema Corp. | — | 767,000 | — | 767,000 | 1,012,440 |
| Dynavax Technologies Corp. | 13,520,000 | 785,776 | 400,000 | 13,905,776 | 37,823,711 |
| Dynavax Technologies Corp. | 446,014 | — | — | 446,014 | 952,909 |
| Innovative Solutions and Support, Inc. | 1,674,000 | 3,223 | 24,844 | 1,652,379 | 7,865,324 |
| Mindspeed Technologies, Inc. | 2,010,000 | — | 68,100 | 1,941,900 | 10,796,964 |
| Progenics Pharmaceuticals, Inc. | 814,055 | 1,035,945 | 62,700 | 1,787,300 | 11,742,561 |
TOTAL OF AFFILIATED
COMPANIES | 22,399,927 | 3,141,792 | 703,744 | 24,837,975 | $75,422,273 |
Affiliated holdings are mutual funds which are managed by the Adviser or an affiliate of the Adviser. The Adviser has agreed to reimburse the Fund for certain investment adviser fees as a result of transactions in other affiliated mutual funds. For the year ended October 31, 2011, the Adviser reimbursed $94,362. Transactions involving the affiliated holding during the year ended October 31, 2011, were as follows:
| Federated
Prime Value
Obligations Fund,
Institutional Shares |
| Balance of Shares Held 10/31/2010 | 70,942,009 |
| Purchases/Additions | 265,635,546 |
| Sales/Reductions | 222,066,455 |
| Balance of Shares Held 10/31/2011 | 114,511,100 |
| Value | $114,511,100 |
| Dividend Income | $11,056 |
Annual Shareholder Report34
6. Investment TRANSACTIONS
Purchases and sales of investments, excluding long-term U.S. government securities and short-term obligations, for the year ended October 31, 2011, were as follows:
| Purchases | $656,421,015 |
| Sales | $842,243,961 |
7. CONCENTRATION OF RISK
The Fund may invest a portion of its assets in securities of companies that are deemed by the Fund's management to be classified in similar business sectors. Economic developments may have an effect on the liquidity and volatility of the portfolio securities.
8. LINE OF CREDIT
The Fund participates in a $100,000,000 unsecured, uncommitted revolving line of credit (LOC) agreement with PNC Bank. The LOC was made available for extraordinary or emergency purposes, primarily for financing redemption payments. Borrowings are charged interest at a rate offered to the Fund by PNC Bank at the time of the borrowing. As of October 31, 2011, there were no outstanding loans. During the year ended October 31, 2011, the Fund did not utilize the LOC.
9. INTERFUND LENDING
Pursuant to an Exemptive Order issued by the Securities and Exchange Commission, the Fund, along with other funds advised by subsidiaries of Federated Investors, Inc., may participate in an interfund lending program. This program provides an alternative credit facility allowing the Fund to borrow from other participating affiliated funds. As of October 31, 2011, there were no outstanding loans. During the year ended October 31, 2011, the program was not utilized.
10. RECENT ACCOUNTING PRONOUNCEMENTS
In April 2011, the Financial Accounting Standards Board (FASB) released Accounting Standards Update (ASU) No. 2011-03, “Reconsideration of Effective Control for Repurchase Agreements.” This ASU amends FASB Accounting Standards Codification (ASC) Topic 860, “Transfers and Servicing”; specifically the criteria required to determine whether a repurchase agreement and similar agreements should be accounted for as sales of financial assets or secured borrowings with commitments. This ASU is effective for fiscal years and interim periods beginning after December 15, 2011. At this time, management is evaluating the implications of adopting ASU No. 2011-03 and its impact on the Fund's financial statements and the accompanying notes, net assets and results of operations.
In addition, in May 2011, FASB released ASU No. 2011-04, “Amendments to Achieve Common Fair Value Measurement and Disclosure Requirements in U.S. GAAP and IFRSs.” This ASU amends FASB ASC Topic 820, “Fair Value Measurement,” to establish common requirements for measuring fair value and for disclosing information about fair value measurements in accordance with GAAP. This ASU is effective for fiscal years and interim periods beginning after December 15, 2011. At this time, management is evaluating the implications of adopting ASU No. 2011-04 and its impact on the Fund's financial statements and the accompanying notes.
Annual Shareholder Report35
Report of Independent Registered Public Accounting Firm
TO THE BOARD OF Trustees OF Federated Equity Funds AND SHAREHOLDERS OF Federated Kaufmann Small Cap Fund:
We have audited the accompanying statement of assets and liabilities of Federated Kaufmann Small Cap Fund (the “Fund”) (one of the portfolios constituting Federated Equity Funds), including the portfolio of investments, as of October 31, 2011, and the related statement of operations for the year then ended, the statement of changes in net assets for each of the two years in the period then ended, and the financial highlights for each of the five years in the period then ended. These financial statements and financial highlights are the responsibility of the Fund's management. Our responsibility is to express an opinion on these financial statements and financial highlights based on our audits.
We conducted our audits in accordance with standards of the Public Company Accounting Oversight Board (United States). Those standards require that we plan and perform the audit to obtain reasonable assurance about whether the financial statements and financial highlights are free of material misstatement. We were not engaged to perform an audit of the Fund's internal control over financial reporting. Our audits included consideration of internal control over financial reporting as a basis for designing audit procedures that are appropriate in the circumstances, but not for the purpose of expressing an opinion on the effectiveness of the Fund's internal control over financial reporting. Accordingly, we express no such opinion. An audit also includes examining, on a test basis, evidence supporting the amounts and disclosures in the financial statements and financial highlights, assessing the accounting principles used and significant estimates made by management, and evaluating the overall financial statement presentation. Our procedures included confirmation of securities owned as of October 31, 2011, by correspondence with the custodian and others, or by other appropriate auditing procedures where replies from others were not received. We believe that our audits provide a reasonable basis for our opinion.
In our opinion, the financial statements and financial highlights referred to above present fairly, in all material respects, the financial position of Federated Kaufmann Small Cap Fund, a portfolio of Federated Equity Funds, at October 31, 2011, the results of its operations for the year then ended, the changes in its net assets for each of the two years in the period then ended, and the financial highlights for each of the five years in the period then ended, in conformity with U.S. generally accepted accounting principles.
Boston, Massachusetts
December 23, 2011
Annual Shareholder Report36
Shareholder Expense Example (unaudited)
As a shareholder of the Fund, you incur two types of costs: (1) transaction costs, including sales charges (loads) on purchase or redemption payments; and (2) ongoing costs, including management fees and to the extent applicable, distribution (12b-1) fees and/or shareholder services fees and other Fund expenses. This Example is intended to help you to understand your ongoing costs (in dollars) of investing in the Fund and to compare these costs with the ongoing costs of investing in other mutual funds. It is based on an investment of $1,000 invested at the beginning of the period and held for the entire period from May 1, 2011 to October 31, 2011.
ACTUAL EXPENSES
The first section of the table below provides information about actual account values and actual expenses. You may use the information in this section, together with the amount you invested, to estimate the expenses that you incurred over the period. Simply divide your account value by $1,000 (for example, an $8,600 account value divided by $1,000 = 8.6), then multiply the result by the number in the first section under the heading entitled “Expenses Paid During Period” to estimate the expenses attributable to your investment during this period.
HYPOTHETICAL EXAMPLE FOR COMPARISON PURPOSES
The second section of the table below provides information about hypothetical account values and hypothetical expenses based on the Fund's actual expense ratio and an assumed rate of return of 5% per year before expenses, which is not the Fund's actual return. Thus, you should not use the hypothetical account values and expenses to estimate the actual ending account balance or your expenses for the period. Rather, these figures are required to be provided to enable you to compare the ongoing costs of investing in the Fund with other funds. To do so, compare this 5% hypothetical example with the 5% hypothetical examples that appear in the shareholder reports of the other funds.
Annual Shareholder Report
37
Please note that the expenses shown in the table are meant to highlight your ongoing costs only and do not reflect any transaction costs, such as sales charges (loads) on purchase or redemption payments. Therefore, the second section of the table is useful in comparing ongoing costs only, and will not help you determine the relative total costs of owning different funds. In addition, if these transaction costs were included, your costs would have been higher. | Beginning
Account Value
5/1/2011 | Ending
Account Value
10/31/2011 | Expenses Paid
During Period1 |
| Actual: | | | |
| Class A Shares | $1,000 | $820.30 | $8.95 |
| Class B Shares | $1,000 | $817.90 | $11.46 |
| Class C Shares | $1,000 | $817.90 | $11.46 |
| Class R Shares | $1,000 | $820.00 | $8.95 |
Hypothetical (assuming a 5% return
before expenses): | | | |
| Class A Shares | $1,000 | $1,015.38 | $9.91 |
| Class B Shares | $1,000 | $1,012.60 | $12.68 |
| Class C Shares | $1,000 | $1,012.60 | $12.68 |
| Class R Shares | $1,000 | $1,015.38 | $9.91 |
| 1 | Expenses are equal to the Fund's annualized net expense ratios, multiplied by the average account value over the period, multiplied by 184/365 (to reflect the one-half-year period). The annualized net expense ratios are as follows: |
| Class A Shares | 1.95% |
| Class B Shares | 2.50% |
| Class C Shares | 2.50% |
| Class R Shares | 1.95% |
Annual Shareholder Report38
Board of Trustees and Trust Officers
The Board of Trustees is responsible for managing the Trust's business affairs and for exercising all the Trust's powers except those reserved for the shareholders. The following tables give information about each Trustee and the senior officers of the Fund. Where required, the tables separately list Trustees who are “interested persons” of the Fund (i.e., “Interested” Trustees) and those who are not (i.e., “Independent” Trustees). Unless otherwise noted, the address of each person listed is Federated Investors Tower, 1001 Liberty Avenue, Pittsburgh, PA 15222. The address of all Independent Trustees listed is 4000 Ericsson Drive, Warrendale, PA 15086-7561; Attention: Mutual Fund Board. As of December 31, 2010, the Trust comprised 13 portfolio(s), and the Federated Fund Family consisted of 43 investment companies (comprising 136 portfolios). Unless otherwise noted, each Officer is elected annually. Unless otherwise noted, each Trustee oversees all portfolios in the Federated Fund Family and serves for an indefinite term. The Fund's Statement of Additional Information includes additional information about Trust Trustees and is available, without charge and upon request, by calling 1-800-341-7400.
Interested Trustees Background
Name
Birth Date
Positions Held with Trust
Date Service Began | Principal Occupation(s) for Past Five Years,
Other Directorships Held and Previous Position(s) |
John F. Donahue*
Birth Date: July 28, 1924
Trustee
Began serving: April 1984 | Principal Occupations: Director or Trustee of the Federated Fund Family; Chairman and Director, Federated Investors, Inc.; Chairman of the Federated Fund Family's Executive Committee.
Previous Positions: Chairman of the Federated Fund Family; Trustee, Federated Investment Management Company; Chairman and Director, Federated Investment Counseling. |
J. Christopher Donahue*
Birth Date: April 11, 1949
President and Trustee
Began serving: January 2000 | Principal Occupations: Principal Executive Officer and President of the Federated Fund Family; Director or Trustee of some of the Funds in the Federated Fund Family; President, Chief Executive Officer and Director, Federated Investors, Inc.; Chairman and Trustee, Federated Investment Management Company; Trustee, Federated Investment Counseling; Chairman and Director, Federated Global Investment Management Corp.; Chairman, Federated Equity Management Company of Pennsylvania and Passport Research, Ltd. (investment advisory subsidiary of Federated); Trustee, Federated Shareholder Services Company; Director, Federated Services Company.
Previous Positions: President, Federated Investment Counseling; President and Chief Executive Officer, Federated Investment Management Company, Federated Global Investment Management Corp. and Passport Research, Ltd. |
| * | Family relationships and reasons for “interested” status: John F. Donahue is the father of J. Christopher Donahue; both are “interested” due to their beneficial ownership of shares of Federated Investors, Inc. and the positions they hold with Federated and its subsidiaries. |
Annual Shareholder Report39
INDEPENDENT Trustees Background
Name
Birth Date
Positions Held with Trust
Date Service Began | Principal Occupation(s) for Past Five Years,
Other Directorships Held, Previous Position(s) and Qualifications |
Nicholas P. Constantakis, CPA
Birth Date: September 3, 1939
Trustee
Began serving: February 1998 | Principal Occupation: Director or Trustee of the Federated Fund Family.
Other Directorship Held: Director and Chairman of the Audit Committee, Michael Baker Corporation (architecture, engineering and construction services).
Previous Position: Partner, Andersen Worldwide SC.
Qualifications: Public accounting and director experience. |
John F. Cunningham
Birth Date: March 5, 1943
Trustee
Began serving: January 1999 | Principal Occupation: Director or Trustee of the Federated Fund Family.
Other Directorships Held: Chairman, President and Chief Executive Officer, Cunningham & Co., Inc. (strategic business consulting); Trustee Associate, Boston College.
Previous Positions: Director, Redgate Communications and EMC Corporation (computer storage systems); Chairman of the Board and Chief Executive Officer, Computer Consoles, Inc.; President and Chief Operating Officer, Wang Laboratories; Director, First National Bank of Boston; Director, Apollo Computer, Inc.
Qualifications: Business management and director experience. |
Maureen Lally-Green
Birth Date: July 5, 1949
Trustee
Began serving: August 2009 | Principal Occupations: Director or Trustee of the Federated Fund Family; Director, Office of Church Relations, Diocese of Pittsburgh; Adjunct Professor of Law, Duquesne University School of Law.
Other Directorships Held: Director, Auberle; Trustee, St. Francis University; Director, Ireland Institute of Pittsburgh; Director, UPMC Mercy Hospital; Regent, St. Vincent Seminary; Director, Epilepsy Foundation of Western and Central Pennsylvania; Director, Saint Thomas More Society, Allegheny County.
Previous Position: Pennsylvania Superior Court Judge.
Qualifications: Legal and director experience. |
Peter E. Madden
Birth Date: March 16, 1942
Trustee
Began serving: November 1991 | Principal Occupation: Director or Trustee, and Chairman of the Board of Directors or Trustees, of the Federated Fund Family.
Previous Positions: Representative, Commonwealth of Massachusetts General Court; President, Chief Operating Officer and Director, State Street Bank and Trust Company and State Street Corporation (retired); Director, VISA USA and VISA International; Chairman and Director, Massachusetts Bankers Association; Director, Depository Trust Corporation; Director, The Boston Stock Exchange.
Qualifications: Business management, mutual fund services and director experience. |
Annual Shareholder Report40
Name
Birth Date
Positions Held with Trust
Date Service Began | Principal Occupation(s) for Past Five Years,
Other Directorships Held, Previous Position(s) and Qualifications |
Charles F. Mansfield, Jr.
Birth Date: April 10, 1945
Trustee
Began serving: January 1999 | Principal Occupations: Director or Trustee and Chairman of the Audit Committee of the Federated Fund Family; Management Consultant.
Previous Positions: Chief Executive Officer, PBTC International Bank; Partner, Arthur Young & Company (now Ernst & Young LLP); Chief Financial Officer of Retail Banking Sector, Chase Manhattan Bank; Senior Vice President, HSBC Bank USA (formerly Marine Midland Bank); Vice President, Citibank; Assistant Professor of Banking and Finance, Frank G. Zarb School of Business, Hofstra University; Executive Vice President, DVC Group, Inc. (marketing, communications and technology).
Qualifications: Banking, business management, education and director experience. |
R. James Nicholson
Birth Date: February 4, 1938
Trustee
Began serving: March 2008 | Principal Occupations: Director or Trustee of the Federated Fund Family; Senior Counsel, Brownstein Hyatt Farber Schrek, P.C.; Former Secretary of the U.S. Dept. of Veterans Affairs; Former U.S. Ambassador to the Holy See; Former Chairman of the Republican National Committee.
Other Directorships Held: Director, Horatio Alger Association; Director, The Daniels Fund, both charitable nonprofit organizations.
Previous Positions: Colonel, U.S. Army Reserve; Partner, Calkins, Kramer, Grimshaw and Harring, P.C.; General Counsel, Colorado Association of Housing and Building; Chairman and CEO, Nicholson Enterprises, Inc. (real estate holding company); Chairman and CEO, Renaissance Homes of Colorado.
Qualifications: Legal, government, business management and director experience. |
Thomas M. O'Neill
Birth Date: June 14, 1951
Trustee
Began serving: October 2006 | Principal Occupations: Director or Trustee of the Federated Fund Family; Sole Proprietor, Navigator Management Company (investment and strategic consulting).
Other Directorships Held: Board of Overseers, Children's Hospital of Boston; Visiting Committee on Athletics, Harvard College; Board of Directors, Medicines for Humanity.
Previous Positions: Chief Executive Officer and President, Managing Director and Chief Investment Officer, Fleet Investment Advisors; President and Chief Executive Officer, Aeltus Investment Management, Inc.; General Partner, Hellman, Jordan Management Co., Boston, MA; Chief Investment Officer, The Putnam Companies, Boston, MA; Credit Analyst and Lending Officer, Fleet Bank; Director and Consultant, EZE Castle Software (investment order management software); Director, Midway Pacific (lumber).
Qualifications: Business management, mutual fund, director and investment experience. |
Annual Shareholder Report41
Name
Birth Date
Positions Held with Trust
Date Service Began | Principal Occupation(s) for Past Five Years,
Other Directorships Held, Previous Position(s) and Qualifications |
John S. Walsh
Birth Date: November 28, 1957
Trustee
Began serving: January 1999 | Principal Occupations: Director or Trustee of the Federated Fund Family; President and Director, Heat Wagon, Inc. (manufacturer of construction temporary heaters); President and Director, Manufacturers Products, Inc. (distributor of portable construction heaters); President, Portable Heater Parts, a division of Manufacturers Products, Inc.
Previous Position: Vice President, Walsh & Kelly, Inc.
Qualifications: Business management and director experience. |
James F. Will
Birth Date: October 12, 1938
Trustee
Began serving: April 2006 | Principal Occupations: Director or Trustee of the Federated Fund Family; formerly, Vice Chancellor and President, Saint Vincent College.
Other Directorships Held: Trustee, Saint Vincent College; Director, Alleghany Corporation; Trustee, Wheeling Jesuit University; Director, Liberty Tire Recycling.
Previous Positions: Chairman, President and Chief Executive Officer, Armco, Inc.; President and Chief Executive Officer, Cyclops Industries; President and Chief Operating Officer, Kaiser Steel Corporation.
Qualifications: Business management, education and director experience. |
OFFICERS
Name
Birth Date
Address
Positions Held with Trust
Date Service Began | Principal Occupation(s) for Past Five Years
and Previous Position(s) |
John W. McGonigle
Birth Date: October 26, 1938
EXECUTIVE VICE PRESIDENT AND SECRETARY
Began serving: April 1984 | Principal Occupations: Executive Vice President and Secretary of the Federated Fund Family; Vice Chairman, Executive Vice President, Secretary and Director, Federated Investors, Inc.
Previous Positions: Trustee, Federated Investment Management Company and Federated Investment Counseling; Director, Federated Global Investment Management Corp., Federated Services Company and Federated Securities Corp. |
Richard A. Novak
Birth Date: December 25, 1963
TREASURER
Began serving: January 2006 | Principal Occupations: Principal Financial Officer and Treasurer of the Federated Fund Family; Senior Vice President, Federated Administrative Services; Financial and Operations Principal for Federated Securities Corp., Edgewood Services, Inc. and Southpointe Distribution Services, Inc.
Previous Positions: Controller of Federated Investors, Inc.; Vice President, Finance of Federated Services Company; held various financial management positions within The Mercy Hospital of Pittsburgh; Auditor, Arthur Andersen & Co. |
Annual Shareholder Report42
Name
Birth Date
Address
Positions Held with Trust
Date Service Began | Principal Occupation(s) for Past Five Years
and Previous Position(s) |
Richard B. Fisher
Birth Date: May 17, 1923
VICE PRESIDENT
Began serving: April 1984 | Principal Occupations: Vice Chairman or Vice President of some of the Funds in the Federated Fund Family; Vice Chairman, Federated Investors, Inc.; Chairman, Federated Securities Corp.
Previous Positions: President and Director or Trustee of some of the Funds in the Federated Fund Family; Executive Vice President, Federated Investors, Inc.; Director and Chief Executive Officer, Federated Securities Corp. |
Brian P. Bouda
Birth Date: February 28, 1947
CHIEF COMPLIANCE OFFICER AND SENIOR VICE PRESIDENT
Began serving: August 2004 | Principal Occupations: Senior Vice President and Chief Compliance Officer of the Federated Fund Family; Vice President and Chief Compliance Officer of Federated Investors, Inc. and Chief Compliance Officer of its subsidiaries. Mr. Bouda joined Federated in 1999 and is a member of the American Bar Association and the State Bar Association of Wisconsin. |
Stephen F. Auth
Birth Date: September 3, 1956
450 Lexington Avenue
Suite 3700
New York, NY 10017-3943
CHIEF INVESTMENT OFFICER
Began serving: November 2002 | Principal Occupations: Mr. Auth is Chief Investment Officer of this Fund and various other Funds in the Federated Fund Family; Executive Vice President, Federated Investment Counseling, Federated Global Investment Management Corp. and Federated Equity Management Company of Pennsylvania.
Previous Positions: Executive Vice President, Federated Investment Management Company, and Passport Research, Ltd. (investment advisory subsidiary of Federated); Senior Vice President, Global Portfolio Management Services Division; Senior Vice President, Federated Investment Management Company and Passport Research, Ltd.; Senior Managing Director and Portfolio Manager, Prudential Investments. |
Lawrence Auriana
Birth Date: January 8, 1944
140 East 45th Street
New York, NY 10017
VICE PRESIDENT
Began serving: November 2001 | Principal Occupations: Lawrence Auriana has been the Fund's Portfolio Manager since December 2002. He is Vice President of the Trust. Mr. Auriana joined Federated in April 2001 as Co-Head of Investments/Federated Kaufmann. From August 1984 to April 2001, Mr. Auriana was President and Treasurer of Edgemont Asset Management Corp., and Chairman of the Board and Portfolio Manager to The Kaufmann Fund, Inc. (predecessor to the Federated Kaufmann Fund). Mr. Auriana earned a B.S. in economics from Fordham University and has been engaged in the securities business since 1965. |
Hans P. Utsch
Birth Date: July 3, 1936
VICE PRESIDENT
Began serving: November 2001 | Principal Occupations: Hans P. Utsch has been the Fund's Portfolio Manager since December 2002. He is Vice President of the Trust. Mr. Utsch joined Federated in April 2001 as Co-Head of Investments/Federated Kaufmann. From August 1984 to April 2001, Mr. Utsch was Chairman of the Board and Secretary of Edgemont Asset Management Corp., and President and Portfolio Manager to The Kaufmann Fund, Inc. (predecessor to the Federated Kaufmann Fund). Mr. Utsch graduated from Amherst College and holds an M.B.A. from Columbia University. He has been engaged in the securities business since 1962. |
Annual Shareholder Report43
Evaluation and Approval of Advisory Contract – May 2011
Federated kaufmann small CAP fund (the “Fund”)
The Fund's Board reviewed the Fund's investment advisory and subadvisory contracts at meetings held in May 2011. The Board's decision regarding these contracts reflects the exercise of its business judgment on whether to continue the existing arrangements.
In this connection, the Federated Funds' Board had previously appointed a Senior Officer, whose duties include specified responsibilities relating to the process by which advisory fees are to be charged to a Federated fund. The Senior Officer has the authority to retain consultants, experts, or staff as may be reasonably necessary to assist in the performance of his duties, reports directly to the Board, and may be terminated only with the approval of a majority of the independent members of the Board. The Senior Officer prepared and furnished to the Board an independent, written evaluation that covered topics discussed below (the “Evaluation”). The Board considered that Evaluation, along with other information, in deciding to approve the advisory and subadvisory contracts.
During its review of these contracts, the Board considered compensation and benefits received by the Adviser and subadviser. This included the fees received for services provided to the Fund by other entities in the Federated organization and research services (if any) received by the Adviser from brokers that execute Federated fund trades, as well as advisory fees. The Board is also familiar with and considered judicial decisions concerning allegedly excessive investment advisory fees, which have indicated that the following factors may be relevant to an Adviser's fiduciary duty with respect to its receipt of compensation from a fund: the nature and quality of the services provided by the Adviser, including the performance of the fund; the Adviser's cost of providing the services; the extent to which the Adviser may realize “economies of scale” as a fund grows larger; any indirect benefits that may accrue to the Adviser and its affiliates as a result of the Adviser's relationship with a fund; performance and expenses of comparable funds; and the extent to which the independent Board members are fully informed about all facts the Board deems relevant bearing on the Adviser's services and fees. The Board further considered management fees (including any components thereof) charged to institutional and other clients of the Adviser and subadviser for what might be viewed as like services, and the cost to the Adviser and its affiliates of supplying services pursuant to the management fee agreements, excluding any intra-corporate profit and profit margins of the Adviser and its affiliates for supplying such services. The Board was aware of these factors and was guided by them in its review of the Fund's advisory and subadvisory contracts to the extent it considered them to be appropriate and relevant, as discussed further below.
Annual Shareholder Report
44
The Board considered and weighed these circumstances in light of its substantial accumulated experience in governing the Fund and working with Federated on matters relating to the Federated funds, and was assisted in its deliberations by independent legal counsel. Throughout the year, the Board has requested and received substantial and detailed information about the Fund and the Federated organization that was in addition to the extensive materials that comprise and accompany the Senior Officer's Evaluation. Federated provided much of this information at each regular meeting of the Board, and furnished additional information in connection with the particular meeting at which the Board's formal review of the advisory and subadvisory contracts occurred. Between regularly scheduled meetings, the Board also received information on particular matters as the need arose. Thus, the Board's consideration of the advisory and subadvisory contracts included review of the Senior Officer's Evaluation, accompanying data and additional information covering such matters as: the Adviser's and subadviser's investment philosophy, revenue, profitability, personnel and processes; investment and operating strategies; the Fund's short- and long-term performance (in absolute terms, both on a gross basis and net of expenses, as well as in relationship to its particular investment program and certain competitor or “peer group” funds and/or other benchmarks, as appropriate), and comments on the reasons for performance; the Fund's investment objectives; the Fund's expenses (including the advisory fee itself and the overall expense structure of the Fund, both in absolute terms and relative to similar and/or competing funds, with due regard for contractual or voluntary expense limitations); the use and allocation of brokerage commissions derived from trading the Fund's portfolio securities (if any); and the nature, quality and extent of the advisory and other services provided to the Fund by the Adviser and its affiliates. The Board also considered the preferences and expectations of Fund shareholders and their relative sophistication; the continuing state of competition in the mutual fund industry and market practices; the range of comparable fees for similar funds in the mutual fund industry; the Fund's relationship to the Federated family of funds which include a comprehensive array of funds with different investment objectives, policies and strategies which are available for exchange without the incurrence of additional sales charges; compliance and audit reports concerning the Federated funds and the Federated companies that service them (including communications from regulatory agencies), as well as Federated's responses to any issues raised therein; and relevant developments in the mutual fund industry and how the Federated funds and/or Federated are responding to them. The Board also considered that the longevity and experience of the Fund's portfolio management team and their unique approach to investing may limit the utility of comparisons to other equity mutual funds. The Board's evaluation process is evolutionary. The criteria considered and the emphasis placed on relevant criteria change in recognition of changing circumstances in the mutual fund marketplace.Annual Shareholder Report
45
With respect to the Fund's performance and expenses in particular, the Board has found the use of comparisons to other mutual funds with comparable investment programs to be relevant, given the high degree of competition in the mutual fund business. The Board focused on comparisons with other similar mutual funds more heavily than non-mutual fund products or services because it is believed that they are more relevant. For example, other mutual funds are the products most like the Fund, they are readily available to Fund shareholders as alternative investment vehicles, and they are the type of investment vehicle in fact chosen and maintained by the Fund's investors. The range of their fees and expenses therefore appears to be a generally reliable indication of what consumers have found to be reasonable in the precise marketplace in which the Fund competes. The Fund's ability to deliver competitive performance when compared to its peer group was a useful indicator of how the Adviser is executing the Fund's investment program, which in turn assisted the Board in reaching a conclusion that the nature, extent, and quality of the Adviser's investment management services were such as to warrant continuation of the advisory contract. In this regard, the Senior Officer has reviewed Federated's fees for providing advisory services to products outside the Federated family of funds (e.g., institutional and separate accounts). He concluded that mutual funds and institutional accounts are inherently different products. Those differences include, but are not limited to, different types of targeted investors; being subject to different laws and regulations; different legal structures; different average account sizes; different associated costs; different portfolio management techniques made necessary by different cash flows; and portfolio manager time spent in review of securities pricing. The Senior Officer did not consider these fee schedules to be determinative in judging the appropriateness of mutual fund advisory contracts.The Senior Officer reviewed information compiled by Federated, using data supplied by independent fund ranking organizations, regarding the performance of, and fees charged by, other mutual funds, noting his view that comparisons to fund peer groups are relevant in judging the reasonableness of proposed fees.
For the periods covered by the Evaluation, the Fund's performance for the one and five-year period was above the median of the relevant peer group, and the Fund's performance was at the median of the relevant peer group for the three-year period.
The Board also received financial information about Federated, including information regarding the compensation and benefits Federated derived from its relationships with the Federated funds. This information covered not only the fees under the advisory contracts, but also fees received by Federated's subsidiaries for providing other services to the Federated funds under separate contracts (e.g., for serving as the Federated funds' administrator). The information also detailed any indirect benefit Federated may derive from its receipt of research services from brokers who execute Federated fund trades. In addition, the Board considered the fact that, in order for a fund to be Annual Shareholder Report
46
competitive in the marketplace, Federated and its affiliates frequently waived fees and/or reimbursed expenses and have disclosed to fund investors and/or indicated to the Board their intention to do so in the future, where appropriate. Moreover, the Board receives regular reporting as to the institution or elimination of these voluntary waivers.Federated furnished information, requested by the Senior Officer, that reported revenues on a fund-by-fund basis and made estimates of the allocation of expenses on a fund-by-fund basis, using allocation methodologies specified by the Senior Officer. The Senior Officer noted that, although they may apply consistent allocation processes, the inherent difficulties in allocating costs (and the unavoidable arbitrary aspects of that exercise) and the lack of consensus on how to allocate those costs may render such allocation information unreliable. The allocation information was considered in the analysis by the Board but was determined to be of limited use.
The Board and the Senior Officer also reviewed information compiled by Federated comparing profitability information for Federated to other publicly held fund management companies. In this regard, the Senior Officer noted the limited availability of such information, but nonetheless concluded that Federated's profit margins did not appear to be excessive and the Board agreed.
The Senior Officer's Evaluation also discussed the notion of possible realization of “economies of scale” as a fund grows larger. The Board considered in this regard that the Adviser has made significant and long-term investments in areas that support all of the Federated funds, such as personnel and processes for the portfolio management, compliance, internal audit, and risk management functions; and systems technology; and that the benefits of these efforts (as well as any economies, should they exist) were likely to be enjoyed by the fund complex as a whole. Finally, the Board also noted the absence of any applicable regulatory or industry guidelines on this subject, which (as discussed in the Senior Officer's Evaluation) is compounded by the lack of any common industry practice or general pattern with respect to structuring fund advisory fees with “breakpoints” that serve to reduce the fee as the fund attains a certain size. The Senior Officer did not recommend institution of breakpoints in pricing Federated's fund advisory services at this time.
It was noted in the materials for the Board meeting that for the period covered by the Evaluation, the Fund's investment advisory fee, after waivers and expense reimbursements, if any, was above the median of the relevant peer group. The Board reviewed the fees and other expenses of the Fund with the Adviser and was satisfied that the overall expense structure of the Fund remained competitive. The Board will continue to monitor advisory fees and other expenses borne by the Fund.
The Senior Officer noted that, considering the totality of the circumstances, and all of the factors referenced within his Evaluation, he had concluded that, subject to comments and recommendations made within his Evaluation, his observations and the information accompanying the Evaluation supported a Annual Shareholder Report
47
finding by the Board that the management fees for each of the funds are reasonable and that Federated appeared to provide appropriate administrative services to the Fund for the fees paid. Under these circumstances, no changes were recommended to, and no objection was raised to, the continuation of the Fund's advisory and subadvisory contracts. The Board concluded that the nature, quality and scope of services provided the Fund by the Adviser and its affiliates were satisfactory.In its decision to continue an existing investment advisory contract, the Board was mindful of the potential disruptions of the Fund's operations and various risks, uncertainties and other effects that could occur as a result of a decision to terminate or not renew an advisory contract. In particular, the Board recognized that many shareholders have invested in the Fund on the strength of the Adviser's industry standing and reputation and with the expectation that the Adviser will have a continuing role in providing advisory services to the Fund. Thus, the Board's approval of the advisory contract reflected the fact that it is the shareholders who have effectively selected the Adviser by virtue of having invested in the Fund.
The Board based its decision to approve the advisory and subadvisory contracts on the totality of the circumstances and relevant factors and with a view to past and future long-term considerations. Not all of the factors and considerations identified above were necessarily relevant to the Fund, nor did the Board consider any one of them to be determinative. With respect to the factors that were relevant, the Board's decision to approve the contract reflects its determination that Federated's performance and actions provided a satisfactory basis to support the decision to continue the existing arrangements.
Annual Shareholder Report48
Voting Proxies on Fund Portfolio Securities
A description of the policies and procedures that the Fund uses to determine how to vote proxies, if any, relating to securities held in the Fund's portfolio is available, without charge and upon request, by calling 1-800-341-7400. A report on “Form N-PX” of how the Fund voted any such proxies during the most recent 12-month period ended June 30 is available from Federated's website at FederatedInvestors.com. To access this information from the home page, select “All” under “Asset Classes.” Select a fund name and share class, if applicable, to go to the Fund Overview page. On the Fund Overview page, select the “Documents” tab. At the bottom of that page, select “Proxy Voting Record Report (Form N-PX).” Form N-PX filings are also available at the SEC's website at www.sec.gov.
Quarterly Portfolio Schedule
The Fund files with the SEC a complete schedule of its portfolio holdings, as of the close of the first and third quarters of its fiscal year, on “Form N-Q.” These filings are available on the SEC's website at www.sec.gov and may be reviewed and copied at the SEC's Public Reference Room in Washington, DC. (Call 1-800-SEC-0330 for information on the operation of the Public Reference Room.) You may also access this information from the “Products” section of Federated's website at FederatedInvestors.com. From the home page, select “All” under “Asset Classes.” Select a fund name and share class, if applicable, to go to the Fund Overview page. On the Fund Overview page, select the “Documents” tab. At the bottom of that page, select “Form N-Q.”
Annual Shareholder Report49
Mutual funds are not bank deposits or obligations, are not guaranteed by any bank and are not insured or guaranteed by the U.S. government, the Federal Deposit Insurance Corporation, the Federal Reserve Board or any other government agency. Investment in mutual funds involves investment risk, including the possible loss of principal.
This Report is authorized for distribution to prospective investors only when preceded or accompanied by the Fund's Prospectus, which contains facts concerning its objective and policies, management fees, expenses and other information.
Federated Kaufmann Small Cap Fund
Federated Investors Funds
4000 Ericsson Drive
Warrendale, PA 15086-7561
Contact us at FederatedInvestors.com
or call 1-800-341-7400.
Federated Securities Corp., Distributor
Cusip 314172636
Cusip 314172628
Cusip 314172610
Cusip 314172537
29503 (12/11)
Federated is a registered trademark of Federated Investors, Inc.
2011 © Federated Investors, Inc.
| | Annual Shareholder Report |
| | October 31, 2011 |
|
| Share Class | Ticker |
| A | FMAXX |
| B | FMBBX |
| C | FMRCX |
| Institutional | FMIIX |
Federated Market Opportunity Fund
Fund Established 2000
A Portfolio of Federated Equity Funds
Dear Valued Shareholder,
I am pleased to present the Annual Shareholder Report for your fund covering the period from November 1, 2010 through October 31, 2011. This report includes Management's Discussion of Fund Performance, a complete listing of your fund's holdings, performance information and financial statements along with other important fund information.
In addition, our website, FederatedInvestors.com, offers easy access to Federated resources that include timely fund updates, economic and market insights from our investment strategists, and financial planning tools. We invite you to register to take full advantage of its capabilities.
Thank you for investing with Federated. I hope you find this information useful and look forward to keeping you informed.
Sincerely,
J. Christopher Donahue, President
Not FDIC Insured May Lose Value No Bank Guarantee
CONTENTS
Management's Discussion of Fund Performance (unaudited)
The Fund's total returns, based on net asset value, for the 12-month reporting period ended October 31, 2011 were 1.74%, 1.08%, 0.98% and 2.08%, for Class A Shares, Class B Shares, Class C Shares and Institutional Shares, respectively. The total return of the Bank of America Merrill Lynch 91-Day Treasury Bill Index (ML91T)1 was 0.13%. The Fund's total return reflected actual cash flows, transaction costs and other expenses which were not reflected in the total return of the ML91T.
MARKET OVERVIEW
It was a volatile but overall positive 12-month reporting period ended October 31, 2011 for the stock market. The S&P 500 Index2 ended the reporting period with a total return of 8.09%. Equity markets rallied strongly during the first six months of the Fund's fiscal year, at least partially due to accommodative monetary and fiscal policies, improving economic growth metrics, and generally strong corporate earnings growth. With this backdrop, the Energy sector was a major outperformer early in the reporting period.
The environment changed in May, with a reversal in commodities causing a pullback in the Energy and Materials sectors. The overall market backdrop turned more unsettled and volatile. Importantly to Fund Management, with global financial conditions beginning to tighten in the May and June period, it became our view that the risk versus reward backdrop had deteriorated for equities and other risk asset classes.
In July and August, heightened European debt strains and concerns with associated slowing growth in the U.S. and globally overwhelmed what had been quite optimistic expectations for equities. The markets were highly vulnerable when Standard and Poor's downgraded the U.S. Treasury debt rating, which further weighed on faltering market confidence in early August. As has been the case over the last few years, determined global policymakers rushed to support the markets. Stocks rallied strongly to close the reporting period in October. All sectors of the S&P 500 Index produced positive returns for the reporting period, except for Financials.
Precious metals3 also performed well during the fiscal year. Both gold and silver produced significant positive returns for the period. However commodities generally, as represented by the Thomson Reuters/Jefferies CRB Commodity Index,4 ended the fiscal year nearly flat after a strong first-half was offset by a weak and very volatile second-half.
Annual Shareholder Report
FUND PERFORMANCEThe Fund outperformed the ML91T and produced a positive return for the fiscal year. The Fund's return was primarily driven by equities and precious metals, with agricultural commodities and trade finance notes also contributing positively.
Within equities, the Fund was generally positioned well with respect to the major equity market moves during the reporting period. The Fund was positioned net long for the vast majority of the November to April rally and was positioned net short during the abrupt decline in August. The long equity positions produced significant gains, with Consumer Discretionary and Telecomm holdings producing the largest gains. Holdings in Financials and Materials were the only equity sectors producing losses. Positions with respect to shorting stocks, ETFs and index futures, and the purchase of put options, all produced losses for the fund since equities were generally higher in the reporting period.5 All of the individual short stock and short ETF losses occurred in the first two months of the fiscal year. The total effect of equities (long and short) produced a positive impact on the Fund's total return.
Precious metals had a significant positive impact on the Fund's return, as gold bullion continued to set record highs through the reporting period. The Fund's investment in agricultural commodities (through an ETF) and trade finance notes both had positive, but smaller, contributions to the Fund's total return. Fund Management reduced the Fund's commodity exposure significantly upon the May commodity reversal.
With respect to derivatives,6 in addition to the above mentioned losses on short equity index futures and equity put options, the Fund was negatively impacted by currency forward positions in the fiscal year. Currency forwards were primarily used for hedging international stock holdings.7 However, the Fund was positioned early in the reporting period for an increase in the U.S. dollar verses currencies of emerging or commodity-producing economies. All of those currency forward investments were closed out early in the fiscal year and produced gains in aggregate for the Fund.
Annual Shareholder Report
| 1 | The Bank of America Merrill Lynch 91-Day Treasury Bill Index measures the return on U.S. Treasury Bills maturing in 90 days. Indexes are unmanaged and it is not possible to invest directly in an index. |
| 2 | The S&P 500 Index is an unmanaged, capitalization-weighted index of 500 stocks designed to measure performance of the broad domestic economy through changes in the aggregate market value of 500 stocks representing all major industries. It is not possible to invest directly in an index. |
| 3 | Investments in gold and precious metals may be subject to additional risks. The Fund's investments in gold bullion may involve higher custody and transaction costs than investments in securities. |
| 4 | The Thomson Reuters/Jefferies CRB Commodity Index measures the overall direction of commodity sectors. The CRB was designed to isolate and reveal the directional movement of prices in overall commodity trades. |
| 5 | The Fund may make short sales of securities, which involves unlimited risk including the possibility that losses may exceed the original amount invested. |
| 6 | The fund's use of derivative instruments involves risks different from, or possibly greater than, the risks associated with investing directly in securities and other traditional instruments. |
| 7 | International investing involves special risks including currency risks, increased volatility, political risks and differences in audition and other financial standards. |
Annual Shareholder ReportFUND PERFORMANCE AND GROWTH OF A $10,000 INVESTMENT
The Average Annual Total Return table below shows returns for each class averaged over the stated periods. The graphs below illustrate the hypothetical investment of $10,0001 in the Federated Market Opportunity Fund (the “Fund”) from October 31, 2001 to October 31, 2011, compared to the Russell 3000 Value Index (R3000V)2 and the Merrill Lynch 91-DayTreasury Bill Index (ML91T).2
Average Annual Total Returns for the Period Ended 10/31/2011
(returns reflect all applicable sales charges and contingent deferred sales charges as specified below in footnote #1)
| Share Class | 1 Year | 5 Years | 10 Years |
| Class A Shares | -3.87% | -2.35% | 2.44% |
| Class B Shares | -4.33% | -2.32% | 2.41% |
| Class C Shares | 0.00% | -1.99% | 2.25% |
| Institutional Shares3 | 2.08% | -1.02% | 3.14% |
Performance data quoted represents past performance which is no guarantee of future results. Investment return and principal value will fluctuate so that an investor's shares, when redeemed, may be worth more or less than their original cost. Mutual fund performance changes over time and current performance may be lower or higher than what is stated. For current to the most recent month-end performance and after-tax returns, visit FederatedInvestors.com or call 1-800-341-7400. Returns shown do not reflect the deduction of taxes that a shareholder would pay on Fund distributions or the redemption of Fund shares. Mutual funds are not obligations of or guaranteed by any bank and are not federally insured.
Annual Shareholder Report
Growth of a $10,000 Investment – class a Shares| Federated Market Opportunity Fund - | Class A Shares | R3000V | ML91T |
| 10/31/2001 | 9,450 | 10,000 | 10,000 |
| 10/31/2002 | 9,503 | 9,055 | 10,188 |
| 10/31/2003 | 11,317 | 11,234 | 10,315 |
| 10/31/2004 | 12,708 | 12,989 | 10,434 |
| 10/31/2005 | 13,202 | 14,544 | 10,723 |
| 10/31/2006 | 13,551 | 17,683 | 11,218 |
| 10/31/2007 | 13,526 | 19,461 | 11,794 |
| 10/31/2008 | 11,879 | 12,393 | 12,115 |
| 10/31/2009 | 13,409 | 12,958 | 12,151 |
| 10/31/2010 | 12,514 | 15,083 | 12,166 |
| 10/31/2011 | 12,732 | 15,979 | 12,181 |
41 graphic description end -->
- Total returns shown include the maximum sales charge of 5.50% ($10,000 investment minus $550 sales charge = $9,450).
Growth of a $10,000 Investment – class B Shares
| Federated Market Opportunity Fund - | Class B Shares | R3000V | ML91T |
| 10/31/2001 | 10,000 | 10,000 | 10,000 |
| 10/31/2002 | 9,981 | 9,055 | 10,188 |
| 10/31/2003 | 11,793 | 11,234 | 10,315 |
| 10/31/2004 | 13,146 | 12,989 | 10,434 |
| 10/31/2005 | 13,561 | 14,544 | 10,723 |
| 10/31/2006 | 13,817 | 17,683 | 11,218 |
| 10/31/2007 | 13,685 | 19,462 | 11,794 |
| 10/31/2008 | 11,932 | 12,392 | 12,115 |
| 10/31/2009 | 13,366 | 12,957 | 12,151 |
| 10/31/2010 | 12,371 | 15,082 | 12,166 |
| 10/31/2011 | 12,505 | 15,979 | 12,181 |
41 graphic description end -->
- Total returns shown include the maximum contingent deferred sales charge of 5.50% as applicable.
Annual Shareholder ReportGrowth of a $10,000 Investment – class C Shares
| Federated Market Opportunity Fund - | Class C Shares | R3000V | ML91T |
| 10/31/2001 | 10,000 | 10,000 | 10,000 |
| 10/31/2002 | 9,980 | 9,055 | 10,188 |
| 10/31/2003 | 11,787 | 11,234 | 10,315 |
| 10/31/2004 | 13,148 | 12,989 | 10,434 |
| 10/31/2005 | 13,555 | 14,544 | 10,723 |
| 10/31/2006 | 13,814 | 17,683 | 11,218 |
| 10/31/2007 | 13,682 | 19,462 | 11,794 |
| 10/31/2008 | 11,934 | 12,392 | 12,115 |
| 10/31/2009 | 13,362 | 12,957 | 12,151 |
| 10/31/2010 | 12,376 | 15,082 | 12,166 |
| 10/31/2011 | 12,497 | 15,979 | 12,181 |
41 graphic description end -->
- Total returns shown include the maximum contingent deferred sales charge of 1.00% as applicable.
Growth of a $10,000 Investment – Institutional Shares3
| Federated Market Opportunity Fund - | Institutional Shares | R3000V | ML91T |
| 10/31/2001 | 10,000 | 10,000 | 10,000 |
| 10/31/2002 | 10,057 | 9,055 | 10,188 |
| 10/31/2003 | 11,976 | 11,234 | 10,315 |
| 10/31/2004 | 13,446 | 12,989 | 10,434 |
| 10/31/2005 | 13,967 | 14,544 | 10,723 |
| 10/31/2006 | 14,335 | 17,683 | 11,218 |
| 10/31/2007 | 14,324 | 19,461 | 11,794 |
| 10/31/2008 | 12,612 | 12,393 | 12,115 |
| 10/31/2009 | 14,267 | 12,958 | 12,151 |
| 10/31/2010 | 13,341 | 15,083 | 12,166 |
| 10/31/2011 | 13,619 | 15,979 | 12,181 |
41 graphic description end -->
Annual Shareholder Report
| 1 | Represents a hypothetical investment of $10,000 in the Fund after deducting applicable sales charges: For Class A Shares, the maximum sales charge of 5.50% ($10,000 investment minus $550 sales charge = $9,450); For Class B Shares, the maximum contingent deferred sales charge is 5.50% on any redemption less than one year from the purchase date; For Class C Shares, the maximum contingent deferred sales charge is 1.00% on any redemption less than one year from the purchase date. The Fund's performance assumes the reinvestment of all dividends and distributions. The R3000V and the ML91T have been adjusted to reflect reinvestment of dividends on securities in the indexes. |
| 2 | The R3000V measures the performance of those Russell 3000 Index companies with lower price-to-book ratios and lower forecasted growth values. The stocks in this index are also members of either the Russell 1000 Value or the Russell 2000 Value indexes. The ML91T is an index tracking short-term U.S. government securities. The R3000V and the ML91T are not adjusted to reflect sales charges, expenses or other fees that the Securities and Exchange Commission (SEC) requires to be reflected in the Fund's performance. The indexes are unmanaged and, unlike the Fund, are not affected by cash flows. It is not possible to invest in an index. |
| 3 | The Fund's Institutional Shares commenced operations on June 29, 2007. For the period prior to commencement of operations of the Institutional Shares, the performance information shown is for the Fund's Class A Shares. The performance for Class A Shares has not been adjusted to reflect the expenses of the Institutional Shares since the Institutional Shares are estimated to have a lower expense ratio than the expense ratio of the Class A Shares. The performance of the Class A Shares has been adjusted to remove any voluntary waiver of Fund expenses related to the Class A Shares that may have occurred during the period prior to commencement of operations of the Institutional Shares. |
Annual Shareholder Report Portfolio of Investments Summary Tables (unaudited)
At October 31, 2011, the Fund's portfolio composition1 was as follows:
| Percentage of
Total Net Assets |
| Futures Contracts — Short (notional value)2 | (26.4)% |
| U.S. Equity Securities | 27.6% |
| International Equity Securities | 6.2% |
| Investment Company Securities | 8.1% |
| U.S. Treasury Securities | 32.5% |
| Purchased Put Options | 0.4% |
| Other Investments3 | 1.7% |
| Other Derivative Contracts4 | (0.1)% |
| Cash Equivalents5 | 22.5% |
| Adjustment for Futures Contracts (notional value)2 | 25.2% |
| Other Assets and Liabilities — Net6 | 2.3% |
| TOTAL | 100.0% |
| 1 | See the Fund's Prospectus for a description of the principal types of securities in which the Fund invests. |
| 2 | More complete information regarding the Fund's direct investments in futures contracts, including unrealized appreciation (depreciation), value, and notional values or amounts of such contracts, can be found in the table at the end of the Portfolio of Investments included in this Report. |
| 3 | Other Investments include an exchange-traded fund. |
| 4 | Based upon net unrealized appreciation (depreciation) or value of the derivative contracts as applicable. Other Derivative Contracts may consist of futures, forwards, options and swaps. The impact of a derivative contract on the Fund's performance may be larger than its unrealized appreciation (depreciation) or value may indicate. In many cases, the notional value or amount of a derivative contract may provide a better indication of the contract's significance to the portfolio. More complete information regarding the Fund's direct investments in derivative contracts, including unrealized appreciation (depreciation), value and notional values or amounts of such contracts, can be found in the table at the end of the Portfolio of Investments included in this Report. |
| 5 | Cash Equivalents include any investments in money market mutual funds and/or overnight repurchase agreements. |
| 6 | Assets, other than investments in securities and derivative contracts, less liabilities. See Statement of Assets and Liabilities. |
Annual Shareholder Report
At October 31, 2011, the Fund's sector composition7 for its equity securities was as follows:| Sector Composition | Percentage of
Equity Securities |
| Information Technology | 22.7% |
| Health Care | 16.0% |
| Consumer Discretionary | 15.4% |
| Energy | 12.1% |
| Materials | 10.2% |
| Industrials | 7.1% |
| Utilities | 7.1% |
| Consumer Staples | 4.7% |
| Telecommunication Services | 4.7% |
| TOTAL | 100.0% |
| 7 | Sector classifications are based upon, and individual portfolio securities are assigned to, the classifications of the Global Industry Classification Standard (GICS) except that the Adviser assigns a classification to securities not classified by the GICS and to securities for which the Adviser does not have access to the classification made by the GICS. |
Annual Shareholder Report Portfolio of Investments
October 31, 2011
Principal
Amount or
Shares | | | Value in
U.S. Dollars |
| | COMMON STOCKS – 33.8% | |
| | Aerospace & Defense – 1.3% | |
| 48,000 | | Cubic Corp. | 2,261,760 |
| 56,000 | 1 | Transdigm Group, Inc. | 5,259,520 |
| | TOTAL | 7,521,280 |
| | Biotechnology – 1.0% | |
| 55,000 | | Amgen, Inc. | 3,149,850 |
| 80,000 | 1 | Gilead Sciences, Inc. | 3,332,800 |
| | TOTAL | 6,482,650 |
| | Chemicals – 1.9% | |
| 60,000 | | Albemarle Corp. | 3,197,400 |
| 135,000 | 1 | Asahi Kasei Corp. | 799,500 |
| 63,000 | | Praxair, Inc. | 6,405,210 |
| 620,000 | 1 | Ube Industries, Ltd. | 1,823,742 |
| | TOTAL | 12,225,852 |
| | Communications Equipment – 0.8% | |
| 96,000 | | Qualcomm, Inc. | 4,953,600 |
| | Construction & Engineering – 0.3% | |
| 175,000 | 1 | Chiyoda Corp. | 2,008,290 |
| | Distributors – 0.9% | |
| 189,000 | 1 | LKQ Corp. | 5,515,020 |
| | Diversified Telecommunication Services – 1.2% | |
| 120,000 | | AT&T, Inc. | 3,517,200 |
| 1,200,000 | 1 | Telstra Corp. Ltd. | 3,902,907 |
| | TOTAL | 7,420,107 |
| | Electric Utilities – 0.8% | |
| 117,000 | | Southern Co. | 5,054,400 |
| | Electronic Equipment Instruments & Components – 1.5% | |
| 22,300 | | Apple, Inc. | 9,026,594 |
| | Energy Equipment & Services – 1.9% | |
| 104,000 | | Halliburton Co. | 3,885,440 |
| 101,000 | | Oceaneering International, Inc. | 4,224,830 |
| 119,000 | 1 | Superior Energy Services, Inc. | 3,346,280 |
| 14,000 | 1 | Unit Corp. | 686,840 |
| | TOTAL | 12,143,390 |
Annual Shareholder ReportPrincipal
Amount or
Shares | | | Value in
U.S. Dollars |
| | Food & Staples Retailing – 0.7% | |
| 121,000 | | CVS Caremark Corp. | 4,392,300 |
| | Gas Utilities – 0.4% | |
| 600,000 | 1 | Tokyo Gas Co. Ltd. | 2,577,189 |
| | Health Care Equipment & Supplies – 0.6% | |
| 48,000 | | Becton, Dickinson & Co. | 3,755,040 |
| | Health Care Providers & Services – 2.5% | |
| 124,000 | 1 | Centene Corp. | 4,358,600 |
| 92,000 | 1 | Express Scripts, Inc., Class A | 4,207,160 |
| 126,000 | 1 | Medco Health Solutions, Inc. | 6,912,360 |
| | TOTAL | 15,478,120 |
| | Internet Software & Services – 1.6% | |
| 8,600 | 1 | Google Inc. | 5,096,704 |
| 374,000 | 1 | NIC, Inc. | 5,164,940 |
| | TOTAL | 10,261,644 |
| | IT Services – 2.1% | |
| 153,000 | 1 | Amdocs Ltd. | 4,593,060 |
| 217,000 | 1 | Booz Allen Hamilton Holding Corp. | 3,430,770 |
| 165,000 | 1 | Cardtronics, Inc. | 4,113,450 |
| | TOTAL | 12,137,280 |
| | Leisure Equipment & Products – 0.7% | |
| 40,000 | 1 | Sankyo Co. Ltd. | 2,090,435 |
| 115,000 | 1 | Sega Sammy Holdings, Inc. | 2,503,734 |
| | TOTAL | 4,594,169 |
| | Machinery – 0.2% | |
| 14,000 | | Valmont Industries, Inc. | 1,200,500 |
| | Metals & Mining – 1.5% | |
| 7,000 | | Agnico Eagle Mines Ltd. | 303,730 |
| 5,000 | 1 | Allied Nevada Gold Corp. | 189,616 |
| 150,000 | 1 | Ampella Mining Ltd. | 283,133 |
| 21,575 | 1,2 | Barisan Gold Corp. | 8,187 |
| 450,000 | 1 | Centamin Egypt Ltd. | 776,524 |
| 4,000 | 1 | Detour Gold Corp. | 132,430 |
| 140,000 | 1 | Fortuna Silver Mines, Inc. | 889,090 |
| 120,000 | 1 | Grayd Resource Corp. | 296,162 |
| 50,000 | 1 | IAMGOLD Corp. | 1,074,994 |
| 20,000 | 1 | Imperial Metals Corp. | 422,373 |
| 75,000 | 1 | Kaminak Gold Corp. | 223,476 |
Annual Shareholder ReportPrincipal
Amount or
Shares | | | Value in
U.S. Dollars |
| 200,000 | 1 | Mansfield Minerals, Inc. | 240,783 |
| 50,000 | 1 | Mountain Province Diamonds, Inc. | 204,163 |
| 74,000 | 1 | Osisko Mining Corp. | 892,380 |
| 250,000 | 1 | Perseus Mining Ltd. | 810,702 |
| 170,000 | 1 | Rockgate Capital Corp. | 197,843 |
| 17,000 | | Royal Gold, Inc. | 1,216,860 |
| 58,000 | | Yamana Gold, Inc. | 868,260 |
| | TOTAL | 9,030,706 |
| | Multiline Retail – 1.1% | |
| 171,000 | 1 | Big Lots, Inc. | 6,444,990 |
| | Multi-Utilities – 1.2% | |
| 145,000 | | CMS Energy Corp. | 3,018,900 |
| 420,000 | 1 | National Grid PLC | 4,160,017 |
| | TOTAL | 7,178,917 |
| | Oil Gas & Consumable Fuels – 2.1% | |
| 94,000 | 1 | Bankers Petroleum Ltd. | 499,824 |
| 100,000 | 1 | BNK Petroleum, Inc. | 206,672 |
| 50,000 | | Devon Energy Corp. | 3,247,500 |
| 110,000 | 1 | Tesoro Petroleum Corp. | 2,853,400 |
| 62,000 | 1 | Total SA | 3,242,196 |
| 120,000 | | Valero Energy Corp. | 2,952,000 |
| | TOTAL | 13,001,592 |
| | Pharmaceuticals – 1.2% | |
| 170,000 | 1 | Mylan Laboratories, Inc. | 3,326,900 |
| 64,000 | 1 | Watson Pharmaceuticals, Inc. | 4,298,240 |
| | TOTAL | 7,625,140 |
| | Road & Rail – 0.7% | |
| 40,000 | | Union Pacific Corp. | 3,982,800 |
| | Semiconductors & Semiconductor Equipment – 0.5% | |
| 240,000 | | Applied Materials, Inc. | 2,956,800 |
| | Software – 1.3% | |
| 133,000 | | Microsoft Corp. | 3,541,790 |
| 260,000 | 1 | Symantec Corp. | 4,422,600 |
| | TOTAL | 7,964,390 |
| | Specialty Retail – 1.7% | |
| 45,000 | | Ross Stores, Inc. | 3,947,850 |
Annual Shareholder ReportPrincipal
Amount or
Shares | | | Value in
U.S. Dollars |
| 117,000 | | TJX Cos., Inc. | 6,894,810 |
| | TOTAL | 10,842,660 |
| | Textiles Apparel & Luxury Goods – 0.8% | |
| 40,000 | 1 | Deckers Outdoor Corp. | 4,609,600 |
| | Tobacco – 0.9% | |
| 49,000 | | Lorillard, Inc. | 5,422,340 |
| | Wireless Telecommunication Services – 0.4% | |
| 1,350 | 1 | NTT DoCoMo, Inc. | 2,384,592 |
| | TOTAL COMMON STOCKS
(IDENTIFIED COST $195,746,796) | 208,191,952 |
| | U.S. TREASURY – 32.5% | |
| $90,000,000 | 3 | United States Treasury Bill, 0.01%, 12/22/2011 | 89,998,722 |
| 110,000,000 | 3,4 | United States Treasury Bill, 0.03%, 11/17/2011 | 109,999,637 |
| | TOTAL U.S. TREASURY
(IDENTIFIED COST $199,997,770) | 199,998,359 |
| | INVESTMENT FUND – 8.1% | |
| 461,407 | | GML Agricultural Commodity Finance Fund LLC
(IDENTIFIED COST $46,140,744) | 49,879,528 |
| | EXCHANGE TRADED FUND – 1.7% | |
| | Exchange Traded Fund – 1.7% | |
| 720,000 | 1 | Sprott Physical Gold Trust
(IDENTIFIED COST $10,802,466) | 10,627,200 |
| | PURCHASED PUT OPTIONS – 0.4% | |
| | Index – 0.1% | |
| 2,000 | | iShares MSCI EAFE Index Fund, Strike Price $55, Expiration Date 12/17/2011 | 755,000 |
| | Purchased Options – 0.3% | |
| 4,000 | | SPDR S&P 500 ETF Trust, Strike Price $110, Expiration Date 1/21/2012 | 880,000 |
| 3,000 | | SPDR S&P 500 ETF Trust, Strike Price $115, Expiration Date 1/21/2012 | 936,000 |
| | TOTAL | 1,816,000 |
| | TOTAL PURCHASED PUT OPTIONS
(IDENTIFIED COST $1,844,250) | 2,571,000 |
Annual Shareholder ReportPrincipal
Amount or
Shares | | | Value in
U.S. Dollars |
| | MUTUAL FUND – 22.5% | |
| 138,314,352 | 5,6 | Federated Prime Value Obligations Fund, Institutional Shares, 0.18%
(AT NET ASSET VALUE) | 138,314,352 |
| | TOTAL INVESTMENTS — 99.0%
(IDENTIFIED COST $592,846,378)7 | 609,582,391 |
| | OTHER ASSETS AND LIABILITIES - NET — 1.0%8 | 6,440,775 |
| | TOTAL NET ASSETS — 100% | $616,023,166 |
At October 31, 2011, the Fund had the following open futures contract:
| Description | Number of
Contracts | Notional
Value | Expiration
Date | Unrealized
Depreciation |
| S&P 500 Index Short Futures | 520 | $162,409,000 | December 2011 | $(7,554,305) |
At October 31, 2011, the Fund had outstanding foreign exchange contracts as follows:
Settlement
Date | Foreign Currency
Units to
Receive/Deliver | In
Exchange
For | Contracts
at Value | Unrealized
Appreciation/
(Depreciation) |
| Contracts Purchased: | | | | |
| 11/04/2011 | 2,800,000 GBP | $4,513,295 | $4,501,941 | $(11,354) |
| 11/30/2011 | 235,000,000 JPY | $3,105,057 | $3,007,511 | $(97,546) |
| 11/30/2011 | 412,350,400 JPY | $5,390,695 | $5,277,227 | $(113,468) |
| Contracts Sold: | | | | |
| 11/4/2011 | 5,400,000 GBP | $8,313,840 | $8,682,314 | $(368,474) |
| 11/18/2011 | 4,700,000 AUD | $4,815,150 | $4,942,483 | $(127,333) |
| 11/21/2011 | 2,300,000 EUR | $3,173,172 | $3,181,863 | $(8,691) |
| 11/21/2011 | 5,750,000 CAD | $5,678,283 | $5,765,995 | $(87,712) |
| 11/30/2011 | 1,780,500,500 JPY | $23,292,176 | $22,786,702 | $505,474 |
| NET UNREALIZED DEPRECIATION ON FOREIGN EXCHANGE CONTRACTS | $(309,104) |
Net Unrealized Depreciation on Futures Contracts and Foreign Exchange Contracts are included in “Other Assets and Liabilities — Net.”
| 1 | Non-income producing security. |
| 2 | Market quotations and price evaluations are not available. Fair value determined in accordance with procedures established by and under the general supervision of the Board of Trustees (the “Trustees”). |
| 3 | Discount rate at the time of purchase. |
| 4 | Pledged as collateral to ensure the Fund is able to satisfy the obligations of its outstanding short futures contracts. |
| 5 | Affiliated holding. |
| 6 | 7-Day net yield. |
| 7 | The cost of investments for federal tax purposes amounts to $627,155,557. |
| 8 | Assets, other than investments in securities, less liabilities. See Statement of Assets and Liabilities. |
Annual Shareholder ReportNote: The categories of investments are shown as a percentage of total net assets at October 31, 2011.
Various inputs are used in determining the value of the Fund's investments. These inputs are summarized in the three broad levels listed below:
Level 1 — quoted prices in active markets for identical securities, including investment companies with daily net asset values, if applicable.
Level 2 — other significant observable inputs (including quoted prices for similar securities, interest rates, prepayment speeds, credit risk, etc.). Also includes securities valued at amortized cost.
Level 3 — significant unobservable inputs (including the Fund's own assumptions in determining the fair value of investments).
The inputs or methodology used for valuing securities are not an indication of the risk associated with investing in those securities.
The following is a summary of the inputs used, as of October 31, 2011, in valuing the Fund's assets carried at fair value:
| Valuation Inputs | | | | |
| Level 1 —
Quoted
Prices and
Investments In
Mutual Funds | Level 2 —
Other
Significant
Observable
Inputs | Level 3 —
Significant
Unobservable
Inputs | Total |
| Equity Securities: | | | | |
| Domestic | $169,585,948 | $ — | $ — | $169,585,948 |
| International | 12,011,381 | 26,586,436 | 8,187 | 38,606,004 |
| Debt Securities: |
| U.S. Treasury | — | 199,998,359 | — | 199,998,359 |
| Investment Fund | 49,879,528 | — | — | 49,879,528 |
| Exchange Traded Fund | 10,627,200 | — | — | 10,627,200 |
| Purchased Put Options | 2,571,000 | — | — | 2,571,000 |
| Mutual Fund | 138,314,352 | — | — | 138,314,352 |
| TOTAL SECURITIES | $382,989,409 | $226,584,795 | $8,187 | $609,582,391 |
| OTHER FINANCIAL INSTRUMENTS1 | $(7,554,305) | $(309,104) | $ — | $(7,863,409) |
| 1 | Other financial instruments include futures contracts and foreign exchange contracts. |
Following is a reconciliation of assets in which significant unobservable inputs (Level 3) were used In determining fair value:
| Investments in
Equity Securities –
International |
| Balance as of November 1, 2010 | $ — |
| Purchases1 | 0 |
| Change in unrealized appreciation/depreciation | 8,187 |
| Balance as of October 31, 2011 | $8,187 |
Annual Shareholder Report | Investments in
Equity Securities –
International |
| The total change in unrealized appreciation (depreciation) included in the Statement of Operations attributable to investments still held at October 31, 2011 | $8,187 |
| 1 | Shares acquired in conjunction with corporate action on security which was recorded at zero cost. |
The following acronyms are used throughout this portfolio:
| AUD | — Australian Dollar |
| CAD | — Canadian Dollars |
| ETF | — Exchange Traded Fund |
| EUR | — Euro |
| GBP | — Great Britain Pound |
| JPY | — Japanese Yen |
| SPDRs | — Standard & Poor's Depository Receipts |
See Notes which are an integral part of the Financial Statements
Annual Shareholder Report Financial Highlights – Class A Shares
(For a Share Outstanding Throughout Each Period)
| Year Ended October 31 | 2011 | 2010 | 2009 | 2008 | 2007 |
| Net Asset Value, Beginning of Period | $10.10 | $11.09 | $10.26 | $12.22 | $12.69 |
| Income From Investment Operations: | | | | | |
| Net investment income (loss)1 | (0.04) | 0.03 | 0.24 | 0.42 | 0.41 |
| Net realized and unrealized gain (loss) on investments, short sales, futures contracts, written options, certain receivables and foreign currency transactions | 0.21 | (0.77) | 1.05 | (1.83) | (0.43) |
| TOTAL FROM INVESTMENT OPERATIONS | 0.17 | (0.74) | 1.29 | (1.41) | (0.02) |
| Less Distributions: | | | | | |
| Distributions from net investment income | (0.38) | (0.25) | (0.46) | (0.55) | (0.45) |
| Net Asset Value, End of Period | $9.89 | $10.10 | $11.09 | $10.26 | $12.22 |
| Total Return2 | 1.74% | (6.67)% | 12.88% | (12.18)% | (0.18)% |
| Ratios to Average Net Assets: | | | | | |
| Net expenses3 | 1.26% | 1.89% | 1.39% | 1.20% | 1.22% |
| Net expenses excluding dividends and other expenses related to short sales3 | 1.24% | 1.24% | 1.24% | 1.20% | 1.22% |
| Net investment income (loss) | (0.41)% | 0.27% | 2.23% | 3.46% | 3.31% |
| Expense waiver/reimbursement4 | 0.08% | 0.05% | 0.07% | 0.04% | 0.02% |
| Supplemental Data: | | | | | |
| Net assets, end of period (000 omitted) | $257,503 | $464,884 | $835,964 | $721,632 | $981,852 |
| Portfolio turnover | 129% | 180% | 191% | 255% | 79% |
| 1 | Per share numbers have been calculated using the average shares method. |
| 2 | Based on net asset value, which does not reflect the sales charge, redemption fee or contingent deferred sales charge, if applicable. |
| 3 | The net expense ratio is calculated without reduction for expense offset arrangements. The net expense ratios are 1.26%, 1.89%, 1.39%, 1.20% and 1.22% for the years ended October 31, 2011, 2010, 2009, 2008 and 2007, respectively, after taking into account these expense reductions. The net expense ratios excluding dividends and other expenses related to short sales are also calculated without reduction for these expense offset arrangements. |
| 4 | This expense decrease is reflected in both the net expense and net investment income (loss) ratios shown above. |
See Notes which are an integral part of the Financial Statements
Annual Shareholder Report Financial Highlights – Class B Shares
(For a Share Outstanding Throughout Each Period)
| Year Ended October 31 | 2011 | 2010 | 2009 | 2008 | 2007 |
| Net Asset Value, Beginning of Period | $9.99 | $10.99 | $10.21 | $12.16 | $12.63 |
| Income From Investment Operations: | | | | | |
| Net investment income (loss)1 | (0.11) | (0.05) | 0.16 | 0.33 | 0.32 |
| Net realized and unrealized gain (loss) on investments, short sales, futures contracts, written options, certain receivables and foreign currency transactions | 0.21 | (0.76) | 1.04 | (1.82) | (0.44) |
| TOTAL FROM INVESTMENT OPERATIONS | 0.10 | (0.81) | 1.20 | (1.49) | (0.12) |
| Less Distributions: | | | | | |
| Distributions from net investment income | (0.27) | (0.19) | (0.42) | (0.46) | (0.35) |
| Net Asset Value, End of Period | $9.82 | $9.99 | $10.99 | $10.21 | $12.16 |
| Total Return2 | 1.08% | (7.44)% | 12.01% | (12.82)% | (0.96)% |
| Ratios to Average Net Assets: | | | | | |
| Net expenses3 | 2.01% | 2.64% | 2.14% | 1.95% | 1.97% |
| Net expenses excluding dividends and other expenses related to short sales3 | 1.99% | 1.99% | 1.99% | 1.95% | 1.97% |
| Net investment income (loss) | (1.15)% | (0.50)% | 1.54% | 2.69% | 2.56% |
| Expense waiver/reimbursement4 | 0.09% | 0.05% | 0.07% | 0.04% | 0.02% |
| Supplemental Data: | | | | | |
| Net assets, end of period (000 omitted) | $60,018 | $103,483 | $166,561 | $197,694 | $291,938 |
| Portfolio turnover | 129% | 180% | 191% | 255% | 79% |
| 1 | Per share numbers have been calculated using the average shares method. |
| 2 | Based on net asset value, which does not reflect the sales charge, redemption fee or contingent deferred sales charge, if applicable. |
| 3 | The net expense ratio is calculated without reduction for expense offset arrangements. The net expense ratios are 2.01%, 2.64%, 2.13%, 1.95% and 1.97% for the years ended October 31, 2011, 2010, 2009, 2008 and 2007, respectively, after taking into account these expense reductions. The net expense ratios excluding dividends and other expenses related to short sales are also calculated without reduction for these expense offset arrangements. |
| 4 | This expense decrease is reflected in both the net expense and net investment income (loss) ratios shown above. |
See Notes which are an integral part of the Financial Statements
Annual Shareholder Report Financial Highlights – Class C Shares
(For a Share Outstanding Throughout Each Period)
| Year Ended October 31 | 2011 | 2010 | 2009 | 2008 | 2007 |
| Net Asset Value, Beginning of Period | $9.96 | $10.96 | $10.19 | $12.13 | $12.60 |
| Income From Investment Operations: | | | | | |
| Net investment income (loss)1 | (0.11) | (0.05) | 0.16 | 0.33 | 0.32 |
| Net realized and unrealized gain (loss) on investments, short sales, futures contracts, written options, certain receivables and foreign currency transactions | 0.20 | (0.76) | 1.03 | (1.81) | (0.44) |
| TOTAL FROM INVESTMENT OPERATIONS | 0.09 | (0.81) | 1.19 | (1.48) | (0.12) |
| Less Distributions: | | | | | |
| Distributions from net investment income | (0.28) | (0.19) | (0.42) | (0.46) | (0.35) |
| Net Asset Value, End of Period | $9.77 | $9.96 | $10.96 | $10.19 | $12.13 |
| Total Return2 | 0.98% | (7.38)% | 11.96% | (12.77)% | (0.96)% |
| Ratios to Average Net Assets: | | | | | |
| Net expenses3 | 2.01% | 2.63% | 2.14% | 1.95% | 1.97% |
| Net expenses excluding dividends and other expenses related to short sales3 | 1.99% | 1.99% | 1.99% | 1.95% | 1.97% |
| Net investment income (loss) | (1.16)% | (0.50)% | 1.50% | 2.70% | 2.56% |
| Expense waiver/reimbursement4 | 0.08% | 0.05% | 0.07% | 0.04% | 0.02% |
| Supplemental Data: | | | | | |
| Net assets, end of period (000 omitted) | $207,932 | $365,433 | $489,260 | $445,425 | $651,388 |
| Portfolio turnover | 129% | 180% | 191% | 255% | 79% |
| 1 | Per share numbers have been calculated using the average shares method. |
| 2 | Based on net asset value, which does not reflect the sales charge, redemption fee or contingent deferred sales charge, if applicable. |
| 3 | The net expense ratio is calculated without reduction for expense offset arrangements. The net expense ratios are 2.01%, 2.63%, 2.13%, 1.95% and 1.97% for the years ended October 31, 2011, 2010, 2009, 2008 and 2007, respectively, after taking into account these expense reductions. The net expense ratios excluding dividends and other expenses related to short sales are also calculated without reduction for these expense offset arrangements. |
| 4 | This expense decrease is reflected in both the net expense and net investment income (loss) ratios shown above. |
See Notes which are an integral part of the Financial Statements
Annual Shareholder Report Financial Highlights – Institutional Shares
(For a Share Outstanding Throughout Each Period)
| Year Ended October 31, | Period Ended
10/31/20071 |
| 2011 | 2010 | 2009 | 2008 |
| Net Asset Value, Beginning of Period | $10.15 | $11.14 | $10.29 | $12.23 | $12.16 |
| Income From Investment Operations: | | | | | |
| Net investment income (loss)2 | (0.02) | 0.03 | 0.23 | 0.50 | 0.17 |
| Net realized and unrealized gain (loss) on investments, short sales, futures contracts, written options, certain receivables and foreign currency transactions | 0.22 | (0.75) | 1.08 | (1.88) | 0.003 |
| TOTAL FROM INVESTMENT OPERATIONS | 0.20 | (0.72) | 1.31 | (1.38) | 0.17 |
| Less Distributions: | | | | | |
| Distributions from net investment income | (0.40) | (0.27) | (0.46) | (0.56) | (0.10) |
| Net Asset Value, End of Period | $9.95 | $10.15 | $11.14 | $10.29 | $12.23 |
| Total Return4 | 2.08% | (6.49)% | 13.12% | (11.95)% | 1.43% |
| Ratios to Average Net Assets: | | | | | |
| Net expenses5 | 1.01% | 1.58% | 1.22% | 0.95% | 0.97%6 |
| Net expenses excluding dividends and other expenses related to short sales5 | 0.99% | 0.99% | 0.99% | 0.95% | 0.97%6 |
| Net investment income (loss) | (0.17)% | 0.30% | 2.05% | 4.62% | 4.30%6 |
| Expense waiver/reimbursement7 | 0.08% | 0.05% | 0.07% | 0.04% | 0.03%6 |
| Supplemental Data: | | | | | |
| Net assets, end of period (000 omitted) | $90,569 | $194,702 | $81,473 | $6,551 | $484 |
| Portfolio turnover | 129% | 180% | 191% | 255% | 79%8 |
| 1 | Reflects operations for the period from June 29, 2007 (date of initial investment) to October 31, 2007. |
| 2 | Per share numbers have been calculated using the average shares method. |
| 3 | Represents less than $0.01. |
| 4 | Based on net asset value. Total returns for periods of less than one year are not annualized. |
| 5 | The net expense ratio is calculated without reduction for expense offset arrangements. The net expense ratios are 1.01%, 1.58%, 1.21%, 0.95% and 0.97% for the years ended October 31, 2011, 2010, 2009 and 2008, and the period ended October 31, 2007, respectively, after taking into account these expense reductions. The net expense ratios excluding dividends and other expenses related to short sales are also calculated without reduction for these expense offset arrangements. |
| 6 | Computed on an annualized basis. |
| 7 | This expense decrease is reflected in both the net expense and net investment income (loss) ratios shown above. |
| 8 | Portfolio turnover is calculated at the Fund level. Percentage indicated was calculated for the fiscal year ended October 31, 2007. |
See Notes which are an integral part of the Financial Statements
Annual Shareholder Report Statement of Assets and Liabilities
October 31, 2011
| Assets: | | |
| Short-term investments in securities from an affiliated holding, at value (Note 5) | $138,314,352 | |
| Long-term investments in securities, at value | 471,268,039 | |
| Total investments in securities, at value (identified cost $592,846,378) | | $609,582,391 |
| Cash denominated in foreign currencies (identified cost $114,473) | | 114,122 |
| Receivable for investments sold (Note 10) | | 9,522,512 |
| Receivable for daily variation margin | | 4,184,920 |
| Receivable for shares sold | | 1,146,202 |
| Income receivable | | 596,424 |
| Unrealized appreciation on foreign exchange contracts | | 505,474 |
| TOTAL ASSETS | | 625,652,045 |
| Liabilities: | | |
| Payable for investments purchased | 5,202,378 | |
| Payable for shares redeemed | 2,733,796 | |
| Unrealized depreciation on foreign exchange contracts | 814,578 | |
| Payable for transfer and dividend disbursing agent fees and expenses | 309,244 | |
| Payable for shareholder services fee (Note 5) | 210,824 | |
| Payable for distribution services fee (Note 5) | 171,885 | |
| Payable for Directors'/Trustees' fees | 2,209 | |
| Accrued expenses | 183,965 | |
| TOTAL LIABILITIES | | 9,628,879 |
| Net assets for 62,523,750 shares outstanding | | $616,023,166 |
| Net Assets Consist of: | | |
| Paid-in capital | | $1,051,674,555 |
| Net unrealized appreciation of investments, futures contracts, certain receivables and translation of assets and liabilities in foreign currency | | 2,106,467 |
| Accumulated net realized loss on investments, short sells, futures contracts, written options and foreign currency transactions | | (439,966,751) |
| Undistributed net investment income | | 2,208,895 |
| TOTAL NET ASSETS | | $616,023,166 |
Annual Shareholder ReportStatement of Assets and Liabilities — continued| Net Asset Value, Offering Price and Redemption Proceeds Per Share | | |
| Class A Shares: | | |
| Net asset value per share ($257,503,109 ÷ 26,033,484 shares outstanding), no par value, unlimited shares authorized | | $9.89 |
| Offering price per share (100/94.50 of $9.89) | | $10.47 |
| Redemption proceeds per share | | $9.89 |
| Class B Shares: | | |
| Net asset value per share ($60,018,323 ÷ 6,112,375 shares outstanding), no par value, unlimited shares authorized | | $9.82 |
| Offering price per share | | $9.82 |
| Redemption proceeds per share (94.50/100 of $9.82) | | $9.28 |
| Class C Shares: | | |
| Net asset value per share ($207,932,276 ÷ 21,275,185 shares outstanding), no par value, unlimited shares authorized | | $9.77 |
| Offering price per share | | $9.77 |
| Redemption proceeds per share (99.00/100 of $9.77) | | $9.67 |
| Institutional Shares: | | |
| Net asset value per share ($90,569,458 ÷ 9,102,706 shares outstanding), no par value, unlimited shares authorized | | $9.95 |
| Offering price per share | | $9.95 |
| Redemption proceeds per share | | $9.95 |
See Notes which are an integral part of the Financial Statements
Annual Shareholder Report Statement of Operations
Year Ended October 31, 2011
| Investment Income: | | | |
| Dividends (including $325,988 received from an affiliated holding (Note 5) and net of foreign taxes withheld of $142,034) | | | $6,375,535 |
| Interest | | | 159,372 |
| TOTAL INCOME | | | 6,534,907 |
| Expenses: | | | |
| Investment adviser fee (Note 5) | | $5,791,604 | |
| Administrative fee (Note 5) | | 603,274 | |
| Custodian fees | | 82,071 | |
| Transfer and dividend disbursing agent fees and expenses | | 1,380,845 | |
| Directors'/Trustees' fees | | 12,107 | |
| Auditing fees | | 33,548 | |
| Legal fees | | 7,730 | |
| Portfolio accounting fees | | 163,006 | |
| Distribution services fee (Note 5) | | 2,556,211 | |
| Shareholder services fee (Note 5) | | 1,642,084 | |
| Account administration fee (Note 2) | | 1,306 | |
| Share registration costs | | 106,863 | |
| Printing and postage | | 132,097 | |
| Insurance premiums | | 6,679 | |
| Dividends and other expenses related to short sales | | 128,203 | |
| Miscellaneous | | 6,568 | |
| TOTAL EXPENSES | | 12,654,196 | |
Annual Shareholder ReportStatement of Operations — continued| Waivers, Reimbursements and Reduction: | | | |
| Waiver/reimbursement of investment adviser fee (Note 5) | $(627,330) | | |
| Waiver of administrative fee (Note 5) | (15,619) | | |
| Waiver of distribution services fee (Note 5) | (800) | | |
| Reimbursement of shareholder services fee (Note 5) | (750) | | |
| Fees paid indirectly from directed brokerage arrangements (Note 6) | (18,696) | | |
| TOTAL WAIVERS, REIMBURSEMENTS AND REDUCTION | | $(663,195) | |
| Net expenses | | | $11,991,001 |
| Net investment income (loss) | | | $(5,456,094) |
| Realized and Unrealized Gain (Loss) on Investments, Short Sales, Futures Contracts, Certain Receivables and Foreign Currency Transactions: | | | |
| Net realized gain on investments and foreign currency transactions | | | 14,757,183 |
| Net realized loss on futures contracts | | | (4,621,824) |
| Net change in unrealized depreciation of investments, certain receivables and translation of assets and liabilities in foreign currency | | | (6,751,248) |
| Net change in unrealized depreciation of short sales | | | 14,225,024 |
| Net change in unrealized depreciation of futures contracts | | | (5,187,135) |
| Net realized and unrealized gain on investments, short sales, futures contracts, certain receivables and foreign currency transactions | | | 12,422,000 |
| Change in net assets resulting from operations | | | $6,965,906 |
See Notes which are an integral part of the Financial Statements
Annual Shareholder Report Statement of Changes in Net Assets
| Year Ended October 31 | 2011 | 2010 |
| Increase (Decrease) in Net Assets | | |
| Operations: | | |
| Net investment income (loss) | $(5,456,094) | $(637,386) |
| Net realized gain (loss) on investments, short sales, futures contracts and foreign currency transactions | 10,135,359 | (87,269,599) |
| Net change in unrealized appreciation/depreciation of investments, short sales, futures contracts, certain receivables and translation of assets and liabilities in foreign currency | 2,286,641 | (19,042,233) |
| CHANGE IN NET ASSETS RESULTING FROM OPERATIONS | 6,965,906 | (106,949,218) |
| Distributions to Shareholders: | | |
| Distributions from net investment income | | |
| Class A Shares | (14,746,332) | (18,918,620) |
| Class B Shares | (2,608,413) | (2,725,757) |
| Class C Shares | (9,099,164) | (8,716,171) |
| Institutional Shares | (5,874,579) | (1,987,024) |
| CHANGE IN NET ASSETS RESULTING FROM DISTRIBUTIONS TO SHAREHOLDERS | (32,328,488) | (32,347,572) |
| Share Transactions: | | |
| Proceeds from sale of shares | 189,424,285 | 518,602,364 |
| Net asset value of shares issued to shareholders in payment of distributions declared | 24,334,306 | 24,699,463 |
| Cost of shares redeemed | (700,873,767) | (848,761,595) |
| CHANGE IN NET ASSETS RESULTING FROM SHARE TRANSACTIONS | (487,115,176) | (305,459,768) |
| Change in net assets | (512,477,758) | (444,756,558) |
| Net Assets: | | |
| Beginning of period | 1,128,500,924 | 1,573,257,482 |
| End of period (including undistributed net investment income of $2,208,895 and $15,289,046, respectively) | $616,023,166 | $1,128,500,924 |
See Notes which are an integral part of the Financial Statements
Annual Shareholder Report Notes to Financial Statements
October 31, 2011
1. Organization
Federated Equity Funds (the “Trust”) is registered under the Investment Company Act of 1940, as amended (the “Act”), as an open-end management investment company. The Trust consists of 13 diversified portfolios. The financial statements included herein are only those of Federated Market Opportunity Fund (the “Fund”). The financial statements of the other portfolios are presented separately. The assets of each portfolio are segregated and a shareholder's interest is limited to the portfolio in which shares are held. Each portfolio pays its own expenses. The Fund offers four classes of shares: Class A Shares, Class B Shares, Class C Shares and Institutional Shares. All shares of the Fund have equal rights with respect to voting, except on class-specific matters. The investment objective of the Fund is to provide absolute (positive) returns with low correlation to the U.S. equity market.
2. Significant Accounting Policies
The following is a summary of significant accounting policies consistently followed by the Fund in the preparation of its financial statements. These policies are in conformity with U.S. generally accepted accounting principles (GAAP).
Investment Valuation
In calculating its net asset value (NAV), the Fund generally values investments as follows:
- Equity securities listed on an exchange or traded through a regulated market system are valued at their last reported sale price or official closing price in their principal exchange or market.
- Shares of other mutual funds are valued based upon their reported NAVs.
- Fixed-income securities acquired with remaining maturities greater than 60 days are fair valued using price evaluations provided by a pricing service approved by the Trustees.
- Fixed-income securities acquired with remaining maturities of 60 days or less are valued at their cost (adjusted for the accretion of any discount or amortization of any premium), which approximates market value.
- Derivative contracts listed on exchanges are valued at their reported settlement or closing price.
- Over-the-counter (OTC) derivative contracts are fair valued using price evaluations provided by a pricing service approved by the Trustees.
- For securities that are fair valued in accordance with procedures established by and under the general supervision of the Trustees, certain factors may be considered such as: the purchase price of the security, information obtained by contacting the issuer, analysis of the issuer's financial statements or other available documents, fundamental analytical data, the nature and duration of restrictions on disposition, the movement of the market in which the security is normally traded and public trading in similar securities of the issuer or comparable issuers.
If the Fund cannot obtain a price or price evaluation from a pricing service for an investment, the Fund may attempt to value the investment based upon the mean of bid and asked quotations or fair value the investment based on price evaluations, from one or more dealers. If any price, quotation, price evaluation or other pricing source is not readily available when the NAV is calculated, the Fund uses the fair value of the investment determined in accordance with the procedures described below. There can be no assurance that the Fund could purchase or sell an investment at the price used to calculate the Fund's NAV.
Annual Shareholder Report
Fair Valuation and Significant Events ProceduresThe Trustees have authorized the use of pricing services to provide evaluations of the current fair value of certain investments for purposes of calculating the NAV. Factors considered by pricing services in evaluating an investment include the yields or prices of investments of comparable quality, coupon, maturity, call rights and other potential prepayments, terms and type, reported transactions, indications as to values from dealers and general market conditions. Some pricing services provide a single price evaluation reflecting the bid side of the market for an investment (a “bid” evaluation). Other pricing services offer both bid evaluations and price evaluations indicative of a price between the prices bid and asked for the investment (a “mid” evaluation). The Fund normally uses bid evaluations for U.S. Treasury and Agency securities, mortgage-backed securities and municipal securities. The Fund normally uses mid evaluations for other types of fixed-income securities and OTC derivative contracts. In the event that market quotations and price evaluations are not available for an investment, the fair value of the investment is determined in accordance with procedures adopted by the Trustees.
The Trustees also have adopted procedures requiring an investment to be priced at its fair value whenever the Adviser determines that a significant event affecting the value of the investment has occurred between the time as of which the price of the investment would otherwise be determined and the time as of which the NAV is computed. An event is considered significant if there is both an affirmative expectation that the investment's value will change in response to the event and a reasonable basis for quantifying the resulting change in value. Examples of significant events that may occur after the close of the principal market on which a security is traded, or after the time of a price evaluation provided by a pricing service or a dealer, include:
- With respect to securities traded in foreign markets, significant trends in U.S. equity markets or in the trading of foreign securities index futures or options contracts;
- With respect to price evaluations of fixed-income securities determined before the close of regular trading on the NYSE, actions by the Federal Reserve Open Market Committee and other significant trends in U.S. fixed-income markets;
- Political or other developments affecting the economy or markets in which an issuer conducts its operations or its securities are traded; and
- Announcements concerning matters such as acquisitions, recapitalizations, litigation developments, a natural disaster affecting the issuer's operations or regulatory changes or market developments affecting the issuer's industry.
The Trustees have approved the use of a pricing service to determine the fair value of equity securities traded principally in foreign markets when the Adviser determines that there has been a significant trend in the U.S. equity markets or in index futures trading. For other significant events, the Fund may seek to obtain more current quotations or price evaluations from alternative pricing sources. If a reliable alternative pricing source is not available, the Fund will determine the fair value of the investment using another method approved by the Trustees.
Repurchase Agreements
The Fund may invest in repurchase agreements for short-term liquidity purposes. It is the policy of the Fund to require the other party to a repurchase agreement to transfer to the Fund's custodian or sub-custodian eligible securities or cash with a market value (after transaction costs) at least equal to the repurchase price to be paid under the repurchase agreement. The eligible securities are transferred to accounts with the custodian or sub-custodian in which the Fund holds a “securities entitlement” and exercises “control” as those Annual Shareholder Report
terms are defined in the Uniform Commercial Code. The Fund has established procedures for monitoring the market value of the transferred securities and requiring the transfer of additional eligible securities if necessary to equal at least the repurchase price. These procedures also allow the other party to require securities to be transferred from the account to the extent that their market value exceeds the repurchase price or in exchange for other eligible securities of equivalent market value.The insolvency of the other party or other failure to repurchase the securities may delay the disposition of the underlying securities or cause the Fund to receive less than the full repurchase price. Under the terms of the repurchase agreement, any amounts received by the Fund in excess of the repurchase price and related transaction costs must be remitted to the other party.
The Fund may enter into repurchase agreements in which eligible securities are transferred into joint trading accounts maintained by the custodian or sub-custodian for investment companies and other clients advised by the Fund's Adviser and its affiliates. The Fund will participate on a pro rata basis with the other investment companies and clients in its share of the securities transferred under such repurchase agreements and in its share of proceeds from any repurchase or other disposition of such securities.
Investment Income, Gains and Losses, Expenses and Distributions
Investment transactions are accounted for on a trade-date basis. Realized gains and losses from investment transactions are recorded on an identified cost basis. Interest income and expenses are accrued daily. Dividend income and distributions to shareholders are recorded on the ex-dividend date. Foreign dividends are recorded on the ex-dividend date or when the Fund is informed of the ex-dividend date. Distributions of net investment income are declared and paid annually. Non-cash dividends included in dividend income, if any, are recorded at fair value. Investment income, realized and unrealized gains and losses and fund-level expenses are allocated to each class based on relative average daily net assets, except that Class A Shares, Class B Shares, Class C Shares and Institutional Shares may bear certain account administration fees, distribution services fees and shareholder services fees unique to those classes. For the year ended October 31, 2011, account administration fees for the Fund were as follows:
| Account
Administration
Fees Incurred |
| Class A Shares | $1,109 |
| Class C Shares | 197 |
| TOTAL | $1,306 |
Dividends are declared separately for each class. No class has preferential dividend rights; differences in per share dividend rates are generally due to differences in separate class expenses.
Premium and Discount Amortization
All premiums and discounts on fixed-income securities are amortized/accreted using the effective interest rate method.
Annual Shareholder Report
Federal TaxesIt is the Fund's policy to comply with the Subchapter M provision of the Internal Revenue Code and to distribute to shareholders each year substantially all of its income. Accordingly, no provision for federal income tax is necessary. As of and during the year ended October 31, 2011, the Fund did not have a liability for any uncertain tax positions. The Fund recognizes interest and penalties, if any, related to tax liabilities as income tax expense in the Statement of Operations. As of October 31, 2011, tax years 2008 through 2011 remain subject to examination by the Fund's major tax jurisdictions, which include the United States of America and the Commonwealth of Massachusetts.
The Fund may be subject to taxes imposed by governments of countries in which it invests. Such taxes are generally based on either income or gains earned or repatriated. The Fund accrues and applies such taxes to net investment income, net realized gains and net unrealized gains as income and/or gains are earned.
When-Issued and Delayed Delivery Transactions
The Fund may engage in when-issued or delayed delivery transactions. The Fund records when-issued securities on the trade date and maintains security positions such that sufficient liquid assets will be available to make payment for the securities purchased. Securities purchased on a when-issued or delayed delivery basis are marked to market daily and begin earning interest on the settlement date. Losses may occur on these transactions due to changes in market conditions or the failure of counterparties to perform under the contract.
Futures Contracts
The Fund purchases and sells financial futures contracts to manage cash flows, enhance yield, manage duration and to potentially reduce transaction costs. Upon entering into a financial futures contract with a broker, the Fund is required to deposit in a segregated account a specified amount of cash or U.S. government securities. Futures contracts are valued daily and unrealized gains or losses are recorded in a “variation margin” account. Daily, the Fund receives from or pays to the broker a specified amount of cash based upon changes in the variation margin account. When a contract is closed, the Fund recognizes a realized gain or loss. Futures contracts have market risks, including the risk that the change in the value of the contract may not correlate with the changes in the value of the underlying securities. There is minimal counterparty risk to the Fund since futures are exchange traded and the exchange's clearinghouse, as counterparty to all exchange traded futures, guarantees the futures against default.
The average notional amount of futures contracts held by the Fund throughout the period was $218,186,277. This is based on amounts held as of each month-end throughout the fiscal period.
Futures contracts outstanding at period end are listed after the Fund's Portfolio of Investments.
Foreign Exchange Contracts
The Fund enters into foreign exchange contracts for the delayed delivery of securities or foreign currency exchange transactions. The Fund also enters into foreign exchange contracts to protect assets against adverse changes in foreign currency exchange rates or exchange control regulations. Purchased contracts are used to acquire exposure to foreign currencies, whereas, contracts to sell are used to hedge the Fund's securities against currency fluctuations. Risks may arise upon entering into these transactions from the potential inability Annual Shareholder Report
of counterparties to meet the terms of their commitments and from unanticipated movements in security prices or foreign exchange rates. The foreign exchange contracts are adjusted by the daily exchange rate of the underlying currency and any gains or losses are recorded for financial statement purposes as unrealized until the settlement date.The average value at settlement date payable and receivable of foreign exchange contracts purchased and sold by the Fund throughout the period was $6,390,101 and $5,077,028, respectively. This is based on the contracts held as of each month-end throughout the fiscal period.
Foreign exchange contracts outstanding at period end are listed after the Fund's Portfolio of Investments.
Foreign Currency Translation
The accounting records of the Fund are maintained in U.S. dollars. All assets and liabilities denominated in foreign currencies (FCs) are translated into U.S. dollars based on the rates of exchange of such currencies against U.S. dollars on the date of valuation. Purchases and sales of securities, income and expenses are translated at the rate of exchange quoted on the respective date that such transactions are recorded. The Fund does not isolate that portion of the results of operations resulting from changes in foreign exchange rates on investments from the fluctuations arising from changes in market prices of securities held. Such fluctuations are included with the net realized and unrealized gain or loss from investments.
Reported net realized foreign exchange gains or losses arise from sales of portfolio securities, sales and maturities of short-term securities, sales of FCs, currency gains or losses realized between the trade and settlement dates on securities transactions, the difference between the amounts of dividends, interest and foreign withholding taxes recorded on the Fund's books and the U.S. dollar equivalent of the amounts actually received or paid. Net unrealized foreign exchange gains and losses arise from changes in the value of assets and liabilities other than investments in securities at fiscal year end, resulting from changes in the exchange rate.
Short Sales
In a short sale, the Fund sells a security it does not own in anticipation of a decline in the fair market value of the security. When the Fund sells a security short, it must borrow the security in order to deliver it at the completion of the sale. A gain, limited to the price at which the Fund sold the security short, or a loss, unlimited in size, will be recognized upon the termination of the short sale.
The Fund has an obligation to replace the borrowed security (e.g., to purchase the security at a future date and deliver it to the lender of the security). While the security is borrowed, the proceeds from the sale are deposited with the lender (“Prime Broker”). The Fund may incur two types of expenses from short sales: borrowing expenses and dividend expenses. Borrowing expenses may occur because the Fund may be obligated to pay fees to the Prime Broker on borrowed securities. This fee is normally based upon the market value of the borrowed security and is dependent upon the availability of the security. Dividend expenses may occur because the Fund has to pay the Prime Broker the equivalent of any dividends earned on the borrowed security.
Annual Shareholder Report
Options ContractsThe Fund buys/sells put and call options for hedging and asset allocation purposes. The seller (writer) of an option receives a payment or premium, from the buyer, which the writer keeps regardless of whether the buyer exercises the option. When the Fund writes a put or call option, an amount equal to the premium received is recorded as a liability and subsequently marked to market to reflect the current value of the option written. Premiums received from writing options which expire are treated as realized gains. The Fund, as a writer of an option, bears the market risk of an unfavorable change in the price of the underlying reference instrument. When the Fund purchases a put or call option, an amount equal to the premium paid is recorded as an increase to the cost of the investment and subsequently marked to market to reflect the current value of the option purchased. Premiums paid for purchasing options which expire are treated as realized losses. Premiums received/paid for writing/purchasing options which are exercised or closed are added to the proceeds or offset against amounts paid on the underlying reference instrument to determine the realized gain or loss. The risk associated with purchasing put and call options is limited to the premium paid. Options can trade on securities or commodities exchanges. In this case, the exchange sets all the terms of the contract except for the price. Most exchanges require investors to maintain margin accounts through their brokers to cover their potential obligations to the exchange. This protects investors against potential defaults by the counterparty.
The average notional amount of purchased options held by the Fund throughout the period was $11,803,085. This is based on amounts held as of each month-end throughout the fiscal period.
As of October 31, 2011, the Fund had no written options.
Additional Disclosure Related to Derivative Instruments
| Fair Value of Derivative Instruments |
| Asset | Liability |
| Statement of
Assets and
Liabilities
Location | Fair
Value | Statement of
Assets and
Liabilities
Location | Fair
Value |
| Derivatives not accounted for as hedging instruments under ASC Topic 815 | | | | |
| Foreign exchange contracts | Unrealized appreciation on foreign exchange contracts | $505,474 | Unrealized depreciation on foreign exchange contracts | $814,578 |
| Equity contracts | Receivable for daily variation margin | (7,554,305)* | | |
| Total derivatives not accounted for as hedging instruments under ASC Topic 815 | | $(7,048,831) | | $814,578 |
| * | Includes cumulative appreciation/depreciation of futures contracts as reported in the footnotes to the Portfolio of Investments. Only the current day's variation margin is reported within the Statement of Assets and Liabilities. |
Annual Shareholder ReportThe Effect of Derivative Instruments on the Statement of Operations For the year ended October 31, 2011
| Amount of Realized Gain or (Loss) on Derivatives Recognized in Income |
| Futures | Options
Purchased | Forward
Currency
Contracts | Total |
| Foreign exchange contracts | — | — | $(10,868,688) | $(10,868,688) |
| Equity contracts | $(4,621,824) | $(39,138,741) | — | $(43,760,565) |
| TOTAL | $(4,621,824) | $(39,138,741) | $(10,868,688) | $(54,629,253) |
| Change in Unrealized Appreciation or (Depreciation) on Derivatives Recognized in Income |
| Futures | Options
Purchased | Forward
Currency
Contracts | Total |
| Foreign exchange contracts | — | — | $9,277,946 | $9,277,946 |
| Equity contracts | $(5,187,135) | $20,142,700 | — | $14,955,565 |
| TOTAL | $(5,187,135) | $20,142,700 | $9,277,946 | $24,233,511 |
Restricted Securities
The Fund may purchase securities which are considered restricted. Restricted securities are securities that either: (a) cannot be offered for public sale without first being registered, or being able to take advantage of an exemption from registration, under the Securities Act of 1933; or (b) are subject to contractual restrictions on public sales. In some cases, when a security cannot be offered for public sale without first being registered, the issuer of the restricted security has agreed to register such securities for resale, at the issuer's expense, either upon demand by the Fund or in connection with another registered offering of the securities. Many such restricted securities may be resold in the secondary market in transactions exempt from registration. Restricted securities may be determined to be liquid under criteria established by the Trustees. The Fund will not incur any registration costs upon such resales. The Fund's restricted securities are valued at the price provided by dealers in the secondary market or, if no market prices are available, at the fair value as determined in accordance with procedures established by and under the general supervision of the Trustees.
Other
The preparation of financial statements in conformity with GAAP requires management to make estimates and assumptions that affect the amounts of assets, liabilities, expenses and revenues reported in the financial statements. Actual results could differ from those estimated.
Annual Shareholder Report
3. Shares of Beneficial InterestThe following tables summarize share activity:
| Year Ended October 31 | 2011 | 2010 |
| Class A Shares: | Shares | Amount | Shares | Amount |
| Shares sold | 8,630,781 | $84,887,631 | 22,661,859 | $235,731,233 |
| Shares issued to shareholders in payment of distributions declared | 1,346,469 | 12,993,419 | 1,408,803 | 14,397,970 |
| Shares redeemed | (29,987,177) | (294,437,644) | (53,394,984) | (547,279,322) |
NET CHANGE RESULTING FROM
CLASS A SHARE TRANSACTIONS | (20,009,927) | $(196,556,594) | (29,324,322) | $(297,150,119) |
| Year Ended October 31 | 2011 | 2010 |
| Class B Shares: | Shares | Amount | Shares | Amount |
| Shares sold | 304,314 | $2,966,672 | 915,600 | $9,462,663 |
| Shares issued to shareholders in payment of distributions declared | 213,595 | 2,059,058 | 221,406 | 2,253,915 |
| Shares redeemed | (4,759,643) | (46,365,265) | (5,935,586) | (60,848,280) |
NET CHANGE RESULTING FROM
CLASS B SHARE TRANSACTIONS | (4,241,734) | $(41,339,535) | (4,798,580) | $(49,131,702) |
| Year Ended October 31 | 2011 | 2010 |
| Class C Shares: | Shares | Amount | Shares | Amount |
| Shares sold | 2,967,206 | $28,805,208 | 7,265,270 | $75,187,335 |
| Shares issued to shareholders in payment of distributions declared | 658,323 | 6,319,898 | 608,948 | 6,180,821 |
| Shares redeemed | (19,045,424) | (184,966,666) | (15,810,851) | (161,262,868) |
NET CHANGE RESULTING FROM
CLASS C SHARE TRANSACTIONS | (15,419,895) | $(149,841,560) | (7,936,633) | $(79,894,712) |
| Year Ended October 31 | 2011 | 2010 |
| Institutional Shares: | Shares | Amount | Shares | Amount |
| Shares sold | 7,390,304 | $72,764,774 | 19,364,412 | $198,221,133 |
| Shares issued to shareholders in payment of distributions declared | 305,669 | 2,961,931 | 181,945 | 1,866,757 |
| Shares redeemed | (17,769,379) | (175,104,192) | (7,680,734) | (79,371,125) |
NET CHANGE RESULTING FROM
INSTITUTIONAL SHARE TRANSACTIONS | (10,073,406) | $(99,377,487) | 11,865,623 | $120,716,765 |
NET CHANGE RESULTING FROM
TOTAL FUND SHARE TRANSACTIONS | (49,744,962) | $(487,115,176) | (30,193,912) | $(305,459,768) |
Annual Shareholder Report4. Federal Tax Information
The timing and character of income and capital gain distributions are determined in accordance with income tax regulations, which may differ from GAAP. These differences are due in part to differing treatments for foreign currency transactions, passive foreign investment companies, discount accretion/premium amortization on debt securities, dividends paid on short positions and partnerships.
For the year ended October 31, 2011, permanent differences identified and reclassified among the components of net assets were as follows:
| Increase (Decrease) |
Undistributed Net
Investment Income
(Loss) | Accumulated
Net Realized
Gains (Losses) |
| $24,704,431 | $(24,704,431) |
Net investment income (loss), net realized gains (losses) and net assets were not affected by this reclassification.
The tax character of distributions as reported on the Statement of Changes in Net Assets for the years ended October 31, 2011 and 2010, was as follows:
| 2011 | 2010 |
| Ordinary income | $32,328,488 | $32,347,572 |
As of October 31, 2011, the components of distributable earnings on a tax basis were as follows:
| Undistributed ordinary income | $2,208,893 |
| Net unrealized depreciation | $(24,339,301) |
| Capital loss carryforwards | $(413,520,981) |
The difference between book-basis and tax-basis net unrealized appreciation/depreciation is attributable to differing treatments for the deferral of losses on wash sales, defaulted bonds, partnerships and discount accretion/premium amortization on debt securities.
At October 31, 2011, the cost of investments for federal tax purposes was $627,155,557. The net unrealized depreciation of investments for federal tax purposes excluding any unrealized appreciation/depreciation resulting from changes in foreign currency exchange rates, foreign currency commitements and futures contracts was $17,573,166. This consists of net unrealized appreciation from investments for those securities having an excess of value over cost of $22,672,443 and net unrealized depreciation from investments for those securities having an excess of cost over value of $40,245,609.
Annual Shareholder Report
At October 31, 2011, the Fund had a capital loss carryforward of $413,520,981 which will reduce the Fund's taxable income arising from future net realized gains on investments, if any, to the extent permitted by the Code and thus will reduce the amount of distributions to shareholders which would otherwise be necessary to relieve the Fund of any liability for federal income tax. Pursuant to the Code, such capital loss carryforward will expire as follows:| Expiration Year | Expiration Amount |
| 2015 | $26,587,308 |
| 2017 | $257,322,572 |
| 2018 | $111,051,824 |
| 2019 | $18,559,277 |
Under the recently enacted Regulated Investment Company Modernization Act of 2010, the Fund will be permitted to carry forward capital losses incurred in taxable years beginning after December 22, 2010 for an unlimited period. However, any losses incurred during those future years will be required to be utilized prior to the losses incurred in pre-enactment tax years. As a result of this ordering rule, pre-enactment capital loss carryforwards may be more likely to expire unused. Additionally, post-enactment capital losses that are carried forward will retain their character as either short-term or long-term capital losses rather than being considered all short-term as under previous law.
5. Investment Adviser Fee and Other Transactions with Affiliates
Investment Adviser Fee
Federated Equity Management Company of Pennsylvania is the Fund's investment adviser (the “Adviser”). The advisory agreement between the Fund and the Adviser provides for an annual fee equal to 0.75% of the Fund's average daily net assets. Subject to the terms described in the Expense Limitation note, the Adviser may voluntarily choose to waive any portion of its fee. For the year ended October 31, 2011, the Adviser voluntarily waived $423,063 of its fee.
Certain of the Fund's assets are managed by Federated Investment Management Company (the “Sub-Adviser”). Under the terms of a sub-adviser agreement between the Adviser and the Sub-Adviser, the Sub-Adviser receives an allocable portion of the Fund's adviser fee. The fee is paid by the Adviser out of its resources and is not an incremental Fund expense. For the year ended October 31, 2011, the Sub-Adviser earned a fee of $322,332.
Administrative Fee
Federated Administrative Services (FAS), under the Administrative Services Agreement, provides the Fund with administrative personnel and services. The fee paid to FAS is based on the average aggregate daily net assets of certain Federated funds as specified below:
| Administrative Fee | Average Aggregate Daily Net Assets
of the Federated Funds |
| 0.150% | on the first $5 billion |
| 0.125% | on the next $5 billion |
| 0.100% | on the next $10 billion |
| 0.075% | on assets in excess of $20 billion |
Annual Shareholder ReportThe administrative fee received during any fiscal year shall be at least $150,000 per portfolio and $40,000 per each additional class of Shares. Subject to the terms described in the Expense Limitation note, FAS may voluntarily choose to waive any portion of its fee. For the year ended October 31, 2011, the net fee paid to FAS was 0.076% of average daily net assets of the Fund. FAS waived $15,619 of its fee.
Distribution Services Fee
The Fund has adopted a Distribution Plan (the “Plan”) pursuant to Rule 12b-1 under the Act. Under the terms of the Plan, the Fund will compensate Federated Securities Corp. (FSC), the principal distributor, from the daily net assets of the Fund's Class A Shares, Class B Shares and Class C Shares to finance activities intended to result in the sale of these shares. The Plan provides that the Fund may incur distribution expenses at the following percentages of average daily net assets annually, to compensate FSC:
| Share Class Name | Percentage of Average Daily
Net Assets of Class |
| Class A Shares | 0.05% |
| Class B Shares | 0.75% |
| Class C Shares | 0.75% |
Subject to the terms described in the Expense Limitation note, FSC may voluntarily choose to waive any portion of its fee. For the year ended October 31, 2011, distribution services fees for the Fund were as follows:
| Distribution
Services Fees
Incurred | Distribution
Services Fees
Waived |
| Class B Shares | $594,835 | $ — |
| Class C Shares | 1,961,376 | (800) |
| TOTAL | $2,556,211 | $(800) |
When FSC receives fees, it may pay some or all of them to financial intermediaries whose customers purchase shares. For the year ended October 31, 2011, FSC retained $205,813 of fees paid by the Fund. For the year ended October 31, 2011, the Fund's Class A Shares did not incur a distribution services fee; however, it may begin to incur this fee upon approval of the Trustees.
Annual Shareholder Report
Sales ChargesFront-end sales charges and contingent deferred sales charges (CDSC) do not represent expenses of the Fund. They are deducted from the proceeds of sales of Fund shares prior to investment or from redemption proceeds prior to remittance, as applicable. For the year ended October 31, 2011, FSC retained $42,643 in sales charges from the sale of Class A Shares. FSC also retained $579 of contingent deferred sales charges relating to redemptions of Class A Shares, $27,518 relating to redemptions on Class B Shares and $6,972 relating to redemptions on Class C Shares.
Shareholder Services Fee
The Fund may pay fees (Service Fees) up to 0.25% of the average daily net assets of the Fund's Class A Shares, Class B Shares and Class C Shares to financial intermediaries or to Federated Shareholder Services Company (FSSC) for providing services to shareholders and maintaining shareholder accounts. Subject to the terms described in the Expense Limitation note, FSSC may voluntarily reimburse the Fund for Services Fees. For the year ended October 31, 2011, Service Fees for the Fund were as follows:
| Service Fees
Incurred | Service Fees
Reimbursed |
| Class A Shares | $790,210 | $ — |
| Class B Shares | 198,279 | (750) |
| Class C Shares | 653,595 | — |
| TOTAL | $1,642,084 | $(750) |
For the year ended October 31, 2011, FSSC did not receive any fees paid by the Fund.
Expense Limitation
The Adviser and its affiliates (which may include FSC, FAS and FSSC) have voluntarily agreed to waive their fees and/or reimburse expenses so that the total annual fund operating expenses (as shown in the financial highlights excluding dividends and other expenses related to short sales) paid by the Fund's Class A Shares, Class B Shares, Class C Shares and Institutional Shares (after the voluntary waivers and reimbursements) will not exceed 1.24%, 1.99%, 1.99% and 0.99% (the “Fee Limit”), respectively, up to but not including the later of (the “Termination Date”): (a) January 1, 2013; or (b) the date of the Fund's next effective Prospectus. While the Adviser and its affiliates currently do not anticipate terminating these arrangements prior to the Termination Date, these arrangements may only be terminated or the Fee Limit increased prior to the Termination Date with the agreement of the Trustees.
General
Certain Officers and Trustees of the Fund are Officers and Directors or Trustees of the above companies.
Annual Shareholder Report
Transactions Involving Affiliated HoldingsAffiliated holdings are mutual funds which are managed by the Adviser or an affiliate of the Adviser. The Adviser has agreed to reimburse the Fund for certain investment adviser fees as a result of transactions in other affiliated mutual funds. For the year ended October 31, 2011, the Adviser reimbursed $204,267. Transactions involving affiliated holdings during the year ended October 31, 2011 were as follows:
| Federated
Prime Value
Obligations Fund,
Institutional Shares |
| Balance of Shares Held 10/31/2010 | 339,943,362 |
| Purchases/Additions | 637,821,478 |
| Sales/Reductions | 839,450,488 |
| Balance of Shares Held 10/31/2011 | 138,314,352 |
| Value | $138,314,352 |
| Dividend Income | $325,988 |
6. Expense Reduction
The Fund directs portfolio trades to a broker that in turn pays a portion of the Fund's operating expenses. For the year ended October 31, 2011, the Fund's expenses were reduced by $18,696 under these arrangements.
7. Investment Transactions
Purchases and sales of investments, excluding long-term U.S. government securities and short-term obligations, for the year ended October 31, 2011, were as follows:
| Purchases | $596,202,920 |
| Sales | $1,055,317,253 |
8. Line of Credit
The Fund participates in a $100,000,000 unsecured, uncommitted revolving line of credit (LOC) agreement with PNC Bank. The LOC was made available for extraordinary or emergency purposes, primarily for financing redemption payments. Borrowings are charged interest at a rate offered to the Fund by PNC Bank at the time of the borrowing. As of October 31, 2011, there were no outstanding loans. During the year ended October 31, 2011, the Fund did not utilize the LOC.
9. Interfund Lending
Pursuant to an Exemptive Order issued by the Securities and Exchange Commission, the Fund, along with other funds advised by subsidiaries of Federated Investors, Inc., may participate in an interfund lending program. This program provides an alternative credit facility allowing the funds to borrow from other participating affiliated funds. As of October 31, 2011, there were no outstanding loans. During the year ended October 31, 2011, the program was not utilized.
Annual Shareholder Report
10. RECEIVABLE FROM BANKRUPTCY TRUSTEEThe amount presented on the Statement of Assets and Liabilities, under the caption receivable for investments sold, includes $5,587,282 which represents the net realizable proceeds due from the bankruptcy trustee for certain security transactions executed through Lehman Brothers in 2008.
11. Recent Accounting Pronouncements
In April 2011, the Financial Accounting Standards Board (FASB) released Accounting Standards Update (ASU) No. 2011-03, “Reconsideration of Effective Control for Repurchase Agreements.” This ASU amends FASB Accounting Standards Codification (ASC) Topic 860, “Transfers and Servicing”; specifically the criteria required to determine whether a repurchase agreement and similar agreements should be accounted for as sales of financial assets or secured borrowings with commitments. This ASU is effective for fiscal years and interim periods beginning after December 15, 2011. At this time, management is evaluating the implications of adopting ASU No. 2011-03 and its impact on the Fund's financial statements and the accompanying notes, net assets and results of operations.
In addition, in May 2011, FASB released ASU No. 2011-04, “Amendments to Achieve Common Fair Value Measurement and Disclosure Requirements in U.S. GAAP and IFRSs.” This ASU amends FASB ASC Topic 820, “Fair Value Measurement,” to establish common requirements for measuring fair value and for disclosing information about fair value measurements in accordance with GAAP. This ASU is effective for fiscal years and interim periods beginning after December 15, 2011. At this time, management is evaluating the implications of adopting ASU No. 2011-04 and its impact on the Fund's financial statements and the accompanying notes.
12. Federal Tax Information (unaudited)
For the fiscal year ended October 31, 2011, 45.53% of total ordinary income distributions made by the Fund are qualifying dividends which may be subject to a maximum tax rate of 15%, as provided for by the Jobs and Growth Tax Relief Act of 2003. Complete information is reported in conjunction with the reporting of your distributions on Form 1099-DIV. Of the ordinary income distributions made by the Fund during the year ended October 31, 2011, 17.78% qualify for the dividend received deduction available to corporate shareholders.
Annual Shareholder Report Report of Independent Registered Public Accounting Firm
TO THE BOARD OF TRUSTEES OF THE FEDERATED EQUITY FUNDS AND SHAREHOLDERS OF Federated Market Opportunity fund
We have audited the accompanying statement of assets and liabilities, including the portfolio of investments, of Federated Market Opportunity Fund (the “Fund”), a portfolio of Federated Equity Funds, as of October 31, 2011, and the related statement of operations for the year then ended, the statements of changes in net assets for each of the years in the two-year period then ended and the financial highlights for each of the years in the five-year period then ended. These financial statements and financial highlights are the responsibility of the Fund's management. Our responsibility is to express an opinion on these financial statements and financial highlights based on our audits.
We conducted our audits in accordance with the standards of the Public Company Accounting Oversight Board (United States). Those standards require that we plan and perform the audit to obtain reasonable assurance about whether the financial statements and financial highlights are free of material misstatement. An audit includes examining, on a test basis, evidence supporting the amounts and disclosures in the financial statements. Our procedures included confirmation of securities owned as of October 31, 2011, by correspondence with the custodian, transfer agent and brokers, or by other appropriate auditing procedures. An audit also includes assessing the accounting principles used and significant estimates made by management, as well as evaluating the overall financial statement presentation. We believe that our audits provide a reasonable basis for our opinion.
In our opinion, the financial statements and financial highlights referred to above present fairly, in all material respects, the financial position of the Federated Market Opportunity Fund as of October 31, 2011, and the results of its operations for the year then ended, the changes in its net assets for each of the years in the two-year period then ended and the financial highlights for each of the years in the five-year period then ended, in conformity with U.S. generally accepted accounting principles.
Boston, Massachusetts
December 23, 2011
Annual Shareholder Report Shareholder Expense Example (unaudited)
As a shareholder of the Fund, you incur two types of costs: (1) transaction costs, including sales charges (loads) on purchase or redemption payments; and (2) ongoing costs, including management fees and to the extent applicable, distribution (12b-1) fees and/or shareholder services fees and other Fund expenses. This Example is intended to help you to understand your ongoing costs (in dollars) of investing in the Fund and to compare these costs with the ongoing costs of investing in other mutual funds. It is based on an investment of $1,000 invested at the beginning of the period and held for the entire period from May 1, 2011 to October 31, 2011.
ACTUAL EXPENSES
The first section of the table below provides information about actual account values and actual expenses. You may use the information in this section, together with the amount you invested, to estimate the expenses that you incurred over the period. Simply divide your account value by $1,000 (for example, an $8,600 account value divided by $1,000 = 8.6), then multiply the result by the number in the first section under the heading entitled “Expenses Paid During Period” to estimate the expenses attributable to your investment during this period.
HYPOTHETICAL EXAMPLE FOR COMPARISON PURPOSES
The second section of the table below provides information about hypothetical account values and hypothetical expenses based on the Fund's actual expense ratio and an assumed rate of return of 5% per year before expenses, which is not the Fund's actual return. Thus, you should not use the hypothetical account values and expenses to estimate the actual ending account balance or your expenses for the period. Rather, these figures are required to be provided to enable you to compare the ongoing costs of investing in the Fund with other funds. To do so, compare this 5% hypothetical example with the 5% hypothetical examples that appear in the shareholder reports of the other funds.
Annual Shareholder Report
Please note that the expenses shown in the table are meant to highlight your ongoing costs only and do not reflect any transaction costs, such as sales charges (loads) on purchase or redemption payments. Therefore, the second section of the table is useful in comparing ongoing costs only, and will not help you determine the relative total costs of owning different funds. In addition, if these transaction costs were included, your costs would have been higher. | Beginning
Account Value
5/1/2011 | Ending
Account Value
10/31/2011 | Expenses Paid
During Period1 |
| Actual: | | | |
| Class A Shares | $1,000 | $1,003.00 | $6.26 |
| Class B Shares | $1,000 | $1,000.00 | $10.03 |
| Class C Shares | $1,000 | $1,000.00 | $10.03 |
| Institutional Shares | $1,000 | $1,005.10 | $5.00 |
Hypothetical (assuming a 5% return
before expenses): | | | |
| Class A Shares | $1,000 | $1,018.95 | $6.31 |
| Class B Shares | $1,000 | $1,015.17 | $10.11 |
| Class C Shares | $1,000 | $1,015.17 | $10.11 |
| Institutional Shares | $1,000 | $1,020.21 | $5.04 |
| 1 | Expenses are equal to the Fund's annualized net expense ratios, multiplied by the average account value over the period, multiplied by 184/365 (to reflect the one-half-year period). The annualized net expense ratios are as follows: |
| Class A Shares | 1.24% |
| Class B Shares | 1.99% |
| Class C Shares | 1.99% |
| Institutional Shares | 0.99% |
Annual Shareholder Report Board of Trustees and Trust Officers
The Board of Trustees is responsible for managing the Trust's business affairs and for exercising all the Trust's powers except those reserved for the shareholders. The following tables give information about each Trustee and the senior officers of the Fund. Where required, the tables separately list Trustees who are “interested persons” of the Fund (i.e., “Interested” Trustees) and those who are not (i.e., “Independent” Trustees). Unless otherwise noted, the address of each person listed is Federated Investors Tower, 1001 Liberty Avenue, Pittsburgh, PA 15222. The address of all Independent Trustees listed is 4000 Ericsson Drive, Warrendale, PA 15086-7561; Attention: Mutual Fund Board. As of December 31, 2010, the Trust comprised 13 portfolio(s), and the Federated Fund Family consisted of 43 investment companies (comprising 136 portfolios). Unless otherwise noted, each Officer is elected annually. Unless otherwise noted, each Trustee oversees all portfolios in the Federated Fund Family and serves for an indefinite term. The Fund's Statement of Additional Information includes additional information about Trust Trustees and is available, without charge and upon request, by calling 1-800-341-7400.
Interested Trustees Background
Name
Birth Date
Positions Held with Trust
Date Service Began | Principal Occupation(s) for Past Five Years,
Other Directorships Held and Previous Position(s) |
John F. Donahue*
Birth Date: July 28, 1924
Trustee
Began serving: April 1984 | Principal Occupations: Director or Trustee of the Federated Fund Family; Chairman and Director, Federated Investors, Inc.; Chairman of the Federated Fund Family's Executive Committee.
Previous Positions: Chairman of the Federated Fund Family; Trustee, Federated Investment Management Company; Chairman and Director, Federated Investment Counseling. |
J. Christopher Donahue*
Birth Date: April 11, 1949
President and Trustee
Began serving: January 2000 | Principal Occupations: Principal Executive Officer and President of the Federated Fund Family; Director or Trustee of some of the Funds in the Federated Fund Family; President, Chief Executive Officer and Director, Federated Investors, Inc.; Chairman and Trustee, Federated Investment Management Company; Trustee, Federated Investment Counseling; Chairman and Director, Federated Global Investment Management Corp.; Chairman, Federated Equity Management Company of Pennsylvania and Passport Research, Ltd. (investment advisory subsidiary of Federated); Trustee, Federated Shareholder Services Company; Director, Federated Services Company.
Previous Positions: President, Federated Investment Counseling; President and Chief Executive Officer, Federated Investment Management Company, Federated Global Investment Management Corp. and Passport Research, Ltd. |
| * | Family relationships and reasons for “interested” status: John F. Donahue is the father of J. Christopher Donahue; both are “interested” due to their beneficial ownership of shares of Federated Investors, Inc. and the positions they hold with Federated and its subsidiaries. |
Annual Shareholder ReportINDEPENDENT Trustees Background
Name
Birth Date
Positions Held with Trust
Date Service Began | Principal Occupation(s) for Past Five Years,
Other Directorships Held, Previous Position(s) and Qualifications |
Nicholas P. Constantakis, CPA
Birth Date: September 3, 1939
Trustee
Began serving: February 1998 | Principal Occupation: Director or Trustee of the Federated Fund Family.
Other Directorship Held: Director and Chairman of the Audit Committee, Michael Baker Corporation (architecture, engineering and construction services).
Previous Position: Partner, Andersen Worldwide SC.
Qualifications: Public accounting and director experience. |
John F. Cunningham
Birth Date: March 5, 1943
Trustee
Began serving: January 1999 | Principal Occupation: Director or Trustee of the Federated Fund Family.
Other Directorships Held: Chairman, President and Chief Executive Officer, Cunningham & Co., Inc. (strategic business consulting); Trustee Associate, Boston College.
Previous Positions: Director, Redgate Communications and EMC Corporation (computer storage systems); Chairman of the Board and Chief Executive Officer, Computer Consoles, Inc.; President and Chief Operating Officer, Wang Laboratories; Director, First National Bank of Boston; Director, Apollo Computer, Inc.
Qualifications: Business management and director experience. |
Maureen Lally-Green
Birth Date: July 5, 1949
Trustee
Began serving: August 2009 | Principal Occupations: Director or Trustee of the Federated Fund Family; Director, Office of Church Relations, Diocese of Pittsburgh; Adjunct Professor of Law, Duquesne University School of Law.
Other Directorships Held: Director, Auberle; Trustee, St. Francis University; Director, Ireland Institute of Pittsburgh; Director, UPMC Mercy Hospital; Regent, St. Vincent Seminary; Director, Epilepsy Foundation of Western and Central Pennsylvania; Director, Saint Thomas More Society, Allegheny County.
Previous Position: Pennsylvania Superior Court Judge.
Qualifications: Legal and director experience. |
Peter E. Madden
Birth Date: March 16, 1942
Trustee
Began serving: November 1991 | Principal Occupation: Director or Trustee, and Chairman of the Board of Directors or Trustees, of the Federated Fund Family.
Previous Positions: Representative, Commonwealth of Massachusetts General Court; President, Chief Operating Officer and Director, State Street Bank and Trust Company and State Street Corporation (retired); Director, VISA USA and VISA International; Chairman and Director, Massachusetts Bankers Association; Director, Depository Trust Corporation; Director, The Boston Stock Exchange.
Qualifications: Business management, mutual fund services and director experience. |
Annual Shareholder ReportName
Birth Date
Positions Held with Trust
Date Service Began | Principal Occupation(s) for Past Five Years,
Other Directorships Held, Previous Position(s) and Qualifications |
Charles F. Mansfield, Jr.
Birth Date: April 10, 1945
Trustee
Began serving: January 1999 | Principal Occupations: Director or Trustee and Chairman of the Audit Committee of the Federated Fund Family; Management Consultant.
Previous Positions: Chief Executive Officer, PBTC International Bank; Partner, Arthur Young & Company (now Ernst & Young LLP); Chief Financial Officer of Retail Banking Sector, Chase Manhattan Bank; Senior Vice President, HSBC Bank USA (formerly Marine Midland Bank); Vice President, Citibank; Assistant Professor of Banking and Finance, Frank G. Zarb School of Business, Hofstra University; Executive Vice President, DVC Group, Inc. (marketing, communications and technology).
Qualifications: Banking, business management, education and director experience. |
R. James Nicholson
Birth Date: February 4, 1938
Trustee
Began serving: January 2008 | Principal Occupations: Director or Trustee of the Federated Fund Family; Senior Counsel, Brownstein Hyatt Farber Schrek, P.C.; Former Secretary of the U.S. Dept. of Veterans Affairs; Former U.S. Ambassador to the Holy See; Former Chairman of the Republican National Committee.
Other Directorships Held: Director, Horatio Alger Association; Director, The Daniels Fund, both charitable nonprofit organizations.
Previous Positions: Colonel, U.S. Army Reserve; Partner, Calkins, Kramer, Grimshaw and Harring, P.C.; General Counsel, Colorado Association of Housing and Building; Chairman and CEO, Nicholson Enterprises, Inc. (real estate holding company); Chairman and CEO, Renaissance Homes of Colorado.
Qualifications: Legal, government, business management and director experience. |
Thomas M. O'Neill
Birth Date: June 14, 1951
Trustee
Began serving: October 2006 | Principal Occupations: Director or Trustee of the Federated Fund Family; Sole Proprietor, Navigator Management Company (investment and strategic consulting).
Other Directorships Held: Board of Overseers, Children's Hospital of Boston; Visiting Committee on Athletics, Harvard College; Board of Directors, Medicines for Humanity.
Previous Positions: Chief Executive Officer and President, Managing Director and Chief Investment Officer, Fleet Investment Advisors; President and Chief Executive Officer, Aeltus Investment Management, Inc.; General Partner, Hellman, Jordan Management Co., Boston, MA; Chief Investment Officer, The Putnam Companies, Boston, MA; Credit Analyst and Lending Officer, Fleet Bank; Director and Consultant, EZE Castle Software (investment order management software); Director, Midway Pacific (lumber).
Qualifications: Business management, mutual fund, director and investment experience. |
Annual Shareholder ReportName
Birth Date
Positions Held with Trust
Date Service Began | Principal Occupation(s) for Past Five Years,
Other Directorships Held, Previous Position(s) and Qualifications |
John S. Walsh
Birth Date: November 28, 1957
Trustee
Began serving: January 1999 | Principal Occupations: Director or Trustee of the Federated Fund Family; President and Director, Heat Wagon, Inc. (manufacturer of construction temporary heaters); President and Director, Manufacturers Products, Inc. (distributor of portable construction heaters); President, Portable Heater Parts, a division of Manufacturers Products, Inc.
Previous Position: Vice President, Walsh & Kelly, Inc.
Qualifications: Business management and director experience. |
James F. Will
Birth Date: October 12, 1938
Trustee
Began serving: April 2006 | Principal Occupations: Director or Trustee of the Federated Fund Family; formerly, Vice Chancellor and President, Saint Vincent College.
Other Directorships Held: Trustee, Saint Vincent College; Director, Alleghany Corporation; Trustee, Wheeling Jesuit University; Director, Liberty Tire Recycling.
Previous Positions: Chairman, President and Chief Executive Officer, Armco, Inc.; President and Chief Executive Officer, Cyclops Industries; President and Chief Operating Officer, Kaiser Steel Corporation.
Qualifications: Business management, education and director experience. |
OFFICERS
Name
Birth Date
Address
Positions Held with Trust
Date Service Began | Principal Occupation(s) for Past Five Years
and Previous Position(s) |
John W. McGonigle
Birth Date: October 26, 1938
EXECUTIVE VICE PRESIDENT AND SECRETARY
Began serving: April 1984 | Principal Occupations: Executive Vice President and Secretary of the Federated Fund Family; Vice Chairman, Executive Vice President, Secretary and Director, Federated Investors, Inc.
Previous Positions: Trustee, Federated Investment Management Company and Federated Investment Counseling; Director, Federated Global Investment Management Corp., Federated Services Company and Federated Securities Corp. |
Richard A. Novak
Birth Date: December 25, 1963
TREASURER
Began serving: January 2006 | Principal Occupations: Principal Financial Officer and Treasurer of the Federated Fund Family; Senior Vice President, Federated Administrative Services; Financial and Operations Principal for Federated Securities Corp., Edgewood Services, Inc. and Southpointe Distribution Services, Inc.
Previous Positions: Controller of Federated Investors, Inc.; Vice President, Finance of Federated Services Company; held various financial management positions within The Mercy Hospital of Pittsburgh; Auditor, Arthur Andersen & Co. |
Annual Shareholder ReportName
Birth Date
Address
Positions Held with Trust
Date Service Began | Principal Occupation(s) for Past Five Years
and Previous Position(s) |
Richard B. Fisher
Birth Date: May 17, 1923
VICE PRESIDENT
Began serving: April 1984 | Principal Occupations: Vice Chairman or Vice President of some of the Funds in the Federated Fund Family; Vice Chairman, Federated Investors, Inc.; Chairman, Federated Securities Corp.
Previous Positions: President and Director or Trustee of some of the Funds in the Federated Fund Family; Executive Vice President, Federated Investors, Inc.; Director and Chief Executive Officer, Federated Securities Corp. |
Brian P. Bouda
Birth Date: February 28, 1947
CHIEF COMPLIANCE OFFICER AND SENIOR VICE PRESIDENT
Began serving: August 2004 | Principal Occupations: Senior Vice President and Chief Compliance Officer of the Federated Fund Family; Vice President and Chief Compliance Officer of Federated Investors, Inc. and Chief Compliance Officer of its subsidiaries. Mr. Bouda joined Federated in 1999 and is a member of the American Bar Association and the State Bar Association of Wisconsin. |
Stephen F. Auth
Birth Date: September 3, 1956
450 Lexington Avenue
Suite 3700
New York, NY 10017-3943
CHIEF INVESTMENT OFFICER
Began serving: November 2002 | Principal Occupations: Mr. Auth is Chief Investment Officer of this Fund and various other Funds in the Federated Fund Family; Executive Vice President, Federated Investment Counseling, Federated Global Investment Management Corp. and Federated Equity Management Company of Pennsylvania.
Previous Positions: Executive Vice President, Federated Investment Management Company, and Passport Research, Ltd. (investment advisory subsidiary of Federated); Senior Vice President, Global Portfolio Management Services Division; Senior Vice President, Federated Investment Management Company and Passport Research, Ltd.; Senior Managing Director and Portfolio Manager, Prudential Investments. |
Douglas C. Noland
Birth Date: December 2, 1962
VICE PRESIDENT
Began serving: February 2011 | Principal Occupations: Douglas C. Noland has been the Fund's Portfolio Manager since November 2010. He is Vice President of the Fund. Mr. Noland joined Federated in December 2008 and was named a Senior Vice President of the Fund's Adviser in December 2008. Prior to joining Federated, Mr. Noland was employed with David Tice & Associates, Inc. where he served as an Assistant Portfolio Manager and strategist of Prudent Bear Fund and Prudent Global Income Fund from January 1999. From 1990 through 1998, Mr. Noland worked as a trader, portfolio manager and analyst for short-biased hedge funds including G. W. Ringoen & Associates from January 1990 to September 1996, Fleckenstein Capital from September 1996 to March 1997 and East Shore Partners, Inc. from October 1997 to December 1998. Mr. Noland earned a B.S. in Accounting and Finance from the University of Oregon and an M.B.A. from Indiana University. |
Annual Shareholder Report Evaluation and Approval of Advisory Contract – May 2011
federated market opportunity fund (the “Fund”)
The Fund's Board reviewed the Fund's investment advisory and subadvisory contracts at meetings held in May 2011. The Board's decision regarding these contracts reflects the exercise of its business judgment on whether to continue the existing arrangements.
In this connection, the Federated Funds' Board had previously appointed a Senior Officer, whose duties include specified responsibilities relating to the process by which advisory fees are to be charged to a Federated fund. The Senior Officer has the authority to retain consultants, experts, or staff as may be reasonably necessary to assist in the performance of his duties, reports directly to the Board, and may be terminated only with the approval of a majority of the independent members of the Board. The Senior Officer prepared and furnished to the Board an independent, written evaluation that covered topics discussed below (the “Evaluation”). The Board considered that Evaluation, along with other information, in deciding to approve the advisory and subadvisory contracts.
During its review of these contracts, the Board considered compensation and benefits received by the Adviser and subadviser. This included the fees received for services provided to the Fund by other entities in the Federated organization and research services (if any) received by the Adviser from brokers that execute Federated fund trades, as well as advisory fees. The Board is also familiar with and considered judicial decisions concerning allegedly excessive investment advisory fees, which have indicated that the following factors may be relevant to an Adviser's fiduciary duty with respect to its receipt of compensation from a fund: the nature and quality of the services provided by the Adviser, including the performance of the fund; the Adviser's cost of providing the services; the extent to which the Adviser may realize “economies of scale” as a fund grows larger; any indirect benefits that may accrue to the Adviser and its affiliates as a result of the Adviser's relationship with a fund; performance and expenses of comparable funds; and the extent to which the independent Board members are fully informed about all facts the Board deems relevant bearing on the Adviser's services and fees. The Board further considered management fees (including any components thereof) charged to institutional and other clients of the Adviser and subadviser for what might be viewed as like services, and the cost to the Adviser and its affiliates of supplying services pursuant to the management fee agreements, excluding any intra-corporate profit and profit margins of the Adviser and its affiliates for supplying such services. The Board was aware of these factors and was guided by them in its review of the Fund's advisory and subadvisory contracts to the extent it considered them to be appropriate and relevant, as discussed further below.
Annual Shareholder Report
The Board considered and weighed these circumstances in light of its substantial accumulated experience in governing the Fund and working with Federated on matters relating to the Federated funds, and was assisted in its deliberations by independent legal counsel. Throughout the year, the Board has requested and received substantial and detailed information about the Fund and the Federated organization that was in addition to the extensive materials that comprise and accompany the Senior Officer's Evaluation. Federated provided much of this information at each regular meeting of the Board, and furnished additional information in connection with the particular meeting at which the Board's formal review of the advisory and subadvisory contracts occurred. Between regularly scheduled meetings, the Board also received information on particular matters as the need arose. Thus, the Board's consideration of the advisory and subadvisory contracts included review of the Senior Officer's Evaluation, accompanying data and additional information covering such matters as: the Adviser's and subadviser's investment philosophy, revenue, profitability, personnel and processes; investment and operating strategies; the Fund's short- and long-term performance (in absolute terms, both on a gross basis and net of expenses, as well as in relationship to its particular investment program and certain competitor or “peer group” funds and/or other benchmarks, as appropriate), and comments on the reasons for performance; the Fund's investment objectives; the Fund's expenses (including the advisory fee itself and the overall expense structure of the Fund, both in absolute terms and relative to similar and/or competing funds, with due regard for contractual or voluntary expense limitations); the use and allocation of brokerage commissions derived from trading the Fund's portfolio securities (if any); and the nature, quality and extent of the advisory and other services provided to the Fund by the Adviser and its affiliates. The Board also considered the preferences and expectations of Fund shareholders and their relative sophistication; the continuing state of competition in the mutual fund industry and market practices; the range of comparable fees for similar funds in the mutual fund industry; the Fund's relationship to the Federated family of funds which include a comprehensive array of funds with different investment objectives, policies and strategies which are available for exchange without the incurrence of additional sales charges; compliance and audit reports concerning the Federated funds and the Federated companies that service them (including communications from regulatory agencies), as well as Federated's responses to any issues raised therein; and relevant developments in the mutual fund industry and how the Federated funds and/or Federated are responding to them. The Board's evaluation process is evolutionary. The criteria considered and the emphasis placed on relevant criteria change in recognition of changing circumstances in the mutual fund marketplace.Annual Shareholder Report
With respect to the Fund's performance and expenses in particular, the Board has found the use of comparisons to other mutual funds with comparable investment programs to be relevant, given the high degree of competition in the mutual fund business. The Board focused on comparisons with other similar mutual funds more heavily than non-mutual fund products or services because it is believed that they are more relevant. For example, other mutual funds are the products most like the Fund, they are readily available to Fund shareholders as alternative investment vehicles, and they are the type of investment vehicle in fact chosen and maintained by the Fund's investors. The range of their fees and expenses therefore appears to be a generally reliable indication of what consumers have found to be reasonable in the precise marketplace in which the Fund competes. The Fund's ability to deliver competitive performance when compared to its peer group was a useful indicator of how the Adviser is executing the Fund's investment program, which in turn assisted the Board in reaching a conclusion that the nature, extent, and quality of the Adviser's investment management services were such as to warrant continuation of the advisory contract. In this regard, the Senior Officer has reviewed Federated's fees for providing advisory services to products outside the Federated family of funds (e.g., institutional and separate accounts). He concluded that mutual funds and institutional accounts are inherently different products. Those differences include, but are not limited to, different types of targeted investors; being subject to different laws and regulations; different legal structures; different average account sizes; different associated costs; different portfolio management techniques made necessary by different cash flows; and portfolio manager time spent in review of securities pricing. The Senior Officer did not consider these fee schedules to be determinative in judging the appropriateness of mutual fund advisory contracts.The Senior Officer reviewed information compiled by Federated, using data supplied by independent fund ranking organizations, regarding the performance of, and fees charged by, other mutual funds, noting his view that comparisons to fund peer groups are relevant in judging the reasonableness of proposed fees.
The Fund's performance fell below the median of the relevant peer group for the one-year, three-year and five-year periods covered by the Evaluation. The Board discussed the Fund's performance with the Adviser and recognized the efforts being undertaken by the Adviser. The Board will continue to monitor these efforts and the performance of the Fund.
The Board also received financial information about Federated, including information regarding the compensation and benefits Federated derived from its relationships with the Federated funds. This information covered not only the fees under the advisory contracts, but also fees received by Federated's subsidiaries for providing other services to the Federated funds under separate contracts (e.g., for serving as the Federated funds' administrator). The information also detailed any indirect benefit Federated may derive from its receipt of research services from brokers who execute Federated fund trades. In Annual Shareholder Report
addition, the Board considered the fact that, in order for a fund to be competitive in the marketplace, Federated and its affiliates frequently waived fees and/or reimbursed expenses and have disclosed to fund investors and/or indicated to the Board their intention to do so in the future, where appropriate. Moreover, the Board receives regular reporting as to the institution or elimination of these voluntary waivers.Federated furnished information, requested by the Senior Officer, that reported revenues on a fund-by-fund basis and made estimates of the allocation of expenses on a fund-by-fund basis, using allocation methodologies specified by the Senior Officer. The Senior Officer noted that, although they may apply consistent allocation processes, the inherent difficulties in allocating costs (and the unavoidable arbitrary aspects of that exercise) and the lack of consensus on how to allocate those costs may render such allocation information unreliable. The allocation information was considered in the analysis by the Board but was determined to be of limited use.
The Board and the Senior Officer also reviewed information compiled by Federated comparing profitability information for Federated to other publicly held fund management companies. In this regard, the Senior Officer noted the limited availability of such information, but nonetheless concluded that Federated's profit margins did not appear to be excessive and the Board agreed.
The Senior Officer's Evaluation also discussed the notion of possible realization of “economies of scale” as a fund grows larger. The Board considered in this regard that the Adviser has made significant and long-term investments in areas that support all of the Federated funds, such as personnel and processes for the portfolio management, compliance, internal audit, and risk management functions; and systems technology; and that the benefits of these efforts (as well as any economies, should they exist) were likely to be enjoyed by the fund complex as a whole. Finally, the Board also noted the absence of any applicable regulatory or industry guidelines on this subject, which (as discussed in the Senior Officer's Evaluation) is compounded by the lack of any common industry practice or general pattern with respect to structuring fund advisory fees with “breakpoints” that serve to reduce the fee as the fund attains a certain size. The Senior Officer did not recommend institution of breakpoints in pricing Federated's fund advisory services at this time.
It was noted in the materials for the Board meeting that for the period covered by the Evaluation, the Fund's investment advisory fee, after waivers and expense reimbursements, if any, was below the median of the relevant peer group. The Board reviewed the fees and other expenses of the Fund with the Adviser and was satisfied that the overall expense structure of the Fund remained competitive.
The Senior Officer noted that, considering the totality of the circumstances, and all of the factors referenced within his Evaluation, he had concluded that, subject to comments and recommendations made within his Evaluation, his observations and the information accompanying the Evaluation supported a Annual Shareholder Report
finding by the Board that the management fees for each of the funds are reasonable and that Federated appeared to provide appropriate administrative services to the Fund for the fees paid. Under these circumstances, no changes were recommended to, and no objection was raised to, the continuation of the Fund's advisory and subadvisory contracts. The Board concluded that the nature, quality and scope of services provided the Fund by the Adviser and its affiliates were satisfactory.In its decision to continue an existing investment advisory contract, the Board was mindful of the potential disruptions of the Fund's operations and various risks, uncertainties and other effects that could occur as a result of a decision to terminate or not renew an advisory contract. In particular, the Board recognized that many shareholders have invested in the Fund on the strength of the Adviser's industry standing and reputation and with the expectation that the Adviser will have a continuing role in providing advisory services to the Fund. Thus, the Board's approval of the advisory contract reflected the fact that it is the shareholders who have effectively selected the Adviser by virtue of having invested in the Fund.
The Board based its decision to approve the advisory and subadvisory contracts on the totality of the circumstances and relevant factors and with a view to past and future long-term considerations. Not all of the factors and considerations identified above were necessarily relevant to the Fund, nor did the Board consider any one of them to be determinative. With respect to the factors that were relevant, the Board's decision to approve the contract reflects its determination that Federated's performance and actions provided a satisfactory basis to support the decision to continue the existing arrangements.
Annual Shareholder Report Voting Proxies on Fund Portfolio Securities
A description of the policies and procedures that the Fund uses to determine how to vote proxies, if any, relating to securities held in the Fund's portfolio is available, without charge and upon request, by calling 1-800-341-7400. A report on “Form N-PX” of how the Fund voted any such proxies during the most recent 12-month period ended June 30 is available from Federated's website at FederatedInvestors.com. To access this information from the home page, select “All” under “Asset Classes.” Select a fund name and share class, if applicable, to go to the Fund Overview page. On the Fund Overview page, select the “Documents” tab. At the bottom of that page, select “Proxy Voting Record Report (Form N-PX).” Form N-PX filings are also available at the SEC's website at www.sec.gov.
Quarterly Portfolio Schedule
The Fund files with the SEC a complete schedule of its portfolio holdings, as of the close of the first and third quarters of its fiscal year, on “Form N-Q.” These filings are available on the SEC's website at www.sec.gov and may be reviewed and copied at the SEC's Public Reference Room in Washington, DC. (Call 1-800-SEC-0330 for information on the operation of the Public Reference Room.) You may also access this information from the “Products” section of Federated's website at FederatedInvestors.com. From the home page, select “All” under “Asset Classes.” Select a fund name and share class, if applicable, to go to the Fund Overview page. On the Fund Overview page, select the “Documents” tab. At the bottom of that page, select “Form N-Q.”
Annual Shareholder ReportMutual funds are not bank deposits or obligations, are not guaranteed by any bank and are not insured or guaranteed by the U.S. government, the Federal Deposit Insurance Corporation, the Federal Reserve Board or any other government agency. Investment in mutual funds involves investment risk, including the possible loss of principal.
This Report is authorized for distribution to prospective investors only when preceded or accompanied by the Fund's Prospectus, which contains facts concerning its objective and policies, management fees, expenses and other information.
Federated Market Opportunity Fund
Federated Investors Funds
4000 Ericsson Drive
Warrendale, PA 15086-7561
Contact us at FederatedInvestors.com
or call 1-800-341-7400.
Federated Securities Corp., Distributor
Cusip 314172743
Cusip 314172735
Cusip 314172727
Cusip 314172453
26852 (12/11)
Federated is a registered trademark of Federated Investors, Inc.
2011 © Federated Investors, Inc.
| | Annual Shareholder Report |
| | October 31, 2011 |
|
| Share Class | Ticker |
| A | FGSAX |
| B | FGSBX |
| C | FGSCX |
| R* | FGSKX |
| Institutional | FGSIX |
*formerly, Class K Shares
Federated Mid Cap Growth Strategies Fund
Fund Established 1984
A Portfolio of Federated Equity Funds
Dear Valued Shareholder,
I am pleased to present the Annual Shareholder Report for your fund covering the period from November 1, 2010 through October 31, 2011. This report includes Management's Discussion of Fund Performance, a complete listing of your fund's holdings, performance information and financial statements along with other important fund information.
In addition, our website, FederatedInvestors.com, offers easy access to Federated resources that include timely fund updates, economic and market insights from our investment strategists, and financial planning tools. We invite you to register to take full advantage of its capabilities.
Thank you for investing with Federated. I hope you find this information useful and look forward to keeping you informed.
Sincerely,
J. Christopher Donahue, President
Not FDIC Insured May Lose Value No Bank Guarantee
CONTENTS
Management's Discussion of Fund Performance (unaudited)
The Fund's total return, based on net asset value, for the fiscal year ended October 31, 2011, was 5.16% for the Class A Shares, 4.39% for the Class B Shares, 4.41% for the Class C Shares, 4.65% for the Class R Shares and 5.43% for the Institutional Shares. The total return of the Russell Midcap Growth Index (RMCGI)1 was 10.08% for the same period. The Fund's total return for the fiscal year reflected actual cash flows, transaction costs and other expenses which were not reflected in the total return of the RMCGI.
MARKET OVERVIEW
Mid-cap growth stocks, as measured by the RMCGI, had a strong 12-month period. Mid-cap growth stocks outpaced mid-cap value stocks by 4.25% and also outperformed the Standard & Poor's 500 Index2 by nearly 200 basis points over the 12-month reporting period.
The biggest investment issues during the reporting period were the continued, albeit somewhat lumpy, strength in domestic equity markets after unprecedented fiscal and monetary stimuli and sharp increase in general uncertainty brought about by the European sovereign debt crisis. The latter point was often cited as the key reason for the very high levels of stock correlation and concurrent volatility.
FUND PERFORMANCE
The Fund underperformed its benchmark, the RMCGI, by 465 basis points, and ranked in the 70th percentile out of 764 funds of the Mid Cap Growth Peer Group of Morningstar3 and in the 62nd percentile out of 499 funds of the Lipper Multi-Cap Growth Peer Group.4 Rankings are based on total return and do not take sales charges into account.
While volatile, equity market performance during the fiscal year was dominated by the market's preference for an interesting combination of cyclically leveraged and high dividend paying stocks. The Consumer Staples, Consumer Discretionary and Utilities sectors provided the highest market returns during the fiscal year.
The Fund's caution that the debt crisis in Europe would lead to a contraction in earnings expectations and an increase in risk premiums caused management to underweight cyclical exposure through stock selection and sector weights during the reporting period. This investment strategy was generally not aggressive enough, which thus detracted from the Fund's performance relative to its benchmark. This was the case through the first half of 2011 but particularly true during the very strong rally seen during October 2011. The Fund's overall underperformance relative to its benchmark, RMCGI, primarily resulted from stock selection in Materials, Information Technology, and Industrials. Specific holdings that detracted from Fund performance included Stillwater Mining, Omnivision Technology and Avery Denison.
Annual Shareholder Report
The Fund's performance relative to its benchmark was aided by its stock selection in the Consumer Staples, Consumer Discretionary and Health Care sectors. Positive individual contributors to Fund performance were Pharmasset, Melco Crown Entertainment, Sina and Herbalife.| 1 | Russell Midcap® Growth Index measures the performance of those Russell Midcap® companies with higher price-to-book ratios and higher forecasted growth values. The stocks are also members of the Russell 1000® Growth Index. The index is unmanaged and, unlike the Fund, is not affected by cashflows. Investments cannot be made directly in an index. |
| 2 | Standard and Poor's 500 Index is an unmanaged capitalization-weighted index of 500 stocks designed to measure performance of the broad domestic economy through changes in the aggregate market value of 500 stocks representing all major industries. The index is unmanaged and, unlike the Fund, is not affected by cashflows. Investments cannot be made directly in an index. |
| 3 | Morningstar Category identifies funds based on their actual investment styles as measured by their underlying portfolio holdings over the past three years. For the year ending October 31, 2011, the Fund ranked in the 77 percentile out of 607 funds and in the 68 percentile out of 412 funds for the five- and ten-year periods, respectively. © 2011 Morningstar, Inc. All Rights Reserved. The information contained herein: (1) is proprietary to Morningstar and/or its content providers; (2) may not be copied or distributed; and (3) is not warranted to be accurate, complete or timely. Neither Morningstar nor its content providers are responsible for any damages or losses arising from any use of this information. Past performance is no guarantee of future results. |
| 4 | For the year ending October 31, 2011, the Fund ranked 221 out of 338 funds and 108 out of 230 funds for the five- and ten-year periods, respectively. Lipper Averages represent the average total returns reported by all mutual funds designated by Lipper, Inc. as falling into the respective categories indicated. Rankings are for Class A Shares. |
Annual Shareholder ReportFUND PERFORMANCE AND GROWTH OF A $10,000 INVESTMENT
The Average Annual Total Return table below shows returns for each class averaged over the stated periods. The graphs below illustrate the hypothetical investment of $10,0001 in the Federated Mid Cap Growth Strategies Fund (the “Fund”) from October 31, 2001 to October 31, 2011, compared to the Russell Midcap Growth Index (RMCGI)2 and the Lipper Multi-Cap Growth Funds Average (LMCGFA).2
Average Annual Total Returns for the Period Ended 10/31/2011
(returns reflect all applicable sales charges and contingent deferred sales charges as specified below in footnote #1)
| Share Class | 1 Year | 5 Years | 10 Years |
| Class A Shares | -0.61% | -0.17% | 4.38% |
| Class B Shares | -1.11% | -0.14% | 4.32% |
| Class C Shares | 3.41% | 0.22% | 4.17% |
| Class R Shares3 | 4.65% | 0.59% | 4.48% |
| Institutional Shares | 5.43% | 0.99% | 4.97% |
Performance data quoted represents past performance which is no guarantee of future results. Investment return and principal value will fluctuate so that an investor's shares, when redeemed, may be worth more or less than their original cost. Mutual fund performance changes over time and current performance may be lower or higher than what is stated. For current to the most recent month-end performance and after-tax returns, visit FederatedInvestors.com or call 1-800-341-7400. Returns shown do not reflect the deduction of taxes that a shareholder would pay on Fund distributions or the redemption of Fund shares. Mutual funds are not obligations of or guaranteed by any bank and are not federally insured.
Annual Shareholder Report
Growth of a $10,000 Investment – class A sHARES| Federated Mid Cap Growth Strategies Fund - | C000026743 | RMCGI | LMCGFA |
| 10/31/2001 | 9,450 | 10,000 | 10,000 |
| 10/31/2002 | 7,700 | 8,239 | 8,187 |
| 10/31/2003 | 10,178 | 11,476 | 10,741 |
| 10/31/2004 | 11,109 | 12,482 | 11,354 |
| 10/31/2005 | 12,895 | 14,468 | 12,854 |
| 10/31/2006 | 14,623 | 16,567 | 14,351 |
| 10/31/2007 | 18,385 | 19,834 | 18,026 |
| 10/31/2008 | 10,808 | 11,375 | 10,697 |
| 10/31/2009 | 12,031 | 13,932 | 12,556 |
| 10/30/2010 | 14,593 | 17,838 | 15,223 |
| 10/31/2011 | 15,346 | 19,636 | 16,171 |
41 graphic description end -->
- Total returns shown include the maximum sales charge of 5.50% ($10,000 investment minus $550 sales charge = $9,450).
Growth of a $10,000 Investment – class B sHARES
| Federated Mid Cap Growth Strategies Fund - | C000026744 | RMCGI | LMCGFA |
| 10/31/2001 | 10,000 | 10,000 | 10,000 |
| 10/31/2002 | 8,084 | 8,239 | 8,187 |
| 10/31/2003 | 10,609 | 11,476 | 10,741 |
| 10/31/2004 | 11,494 | 12,482 | 11,354 |
| 10/31/2005 | 13,229 | 14,468 | 12,854 |
| 10/31/2006 | 14,882 | 16,567 | 14,351 |
| 10/31/2007 | 18,569 | 19,834 | 18,026 |
| 10/31/2008 | 9,491 | 11,375 | 10,697 |
| 10/31/2009 | 10,487 | 13,932 | 12,556 |
| 10/30/2010 | 14,516 | 17,838 | 15,223 |
| 10/31/2011 | 15,265 | 19,636 | 16,171 |
41 graphic description end -->
- Total returns shown include the maximum contingent deferred sales charge of 5.50% as applicable.
Annual Shareholder Report
Growth of a $10,000 Investment – class c sHARES| Federated Mid Cap Growth Strategies Fund - | C000026745 | RMCGI | LMCGFA |
| 10/31/2001 | 10,000 | 10,000 | 10,000 |
| 10/31/2002 | 8,088 | 8,239 | 8,187 |
| 10/31/2003 | 10,612 | 11,476 | 10,741 |
| 10/31/2004 | 11,498 | 12,482 | 11,354 |
| 10/31/2005 | 13,230 | 14,468 | 12,854 |
| 10/31/2006 | 14,890 | 16,567 | 14,351 |
| 10/31/2007 | 18,574 | 19,834 | 18,026 |
| 10/31/2008 | 10,840 | 11,375 | 10,697 |
| 10/31/2009 | 11,976 | 13,932 | 12,556 |
| 10/30/2010 | 14,415 | 17,838 | 15,223 |
| 10/31/2011 | 15,051 | 19,636 | 16,171 |
41 graphic description end -->
- Total returns shown include the contingent deferred sales charge of 1.00%, as applicable.
Growth of a $10,000 Investment – class R sHARES3
Annual Shareholder Report| Federated Mid Cap Growth Strategies Fund - | C000043493 | RMCGI | LMCGFA |
| 10/31/2001 | 10,000 | 10,000 | 10,000 |
| 10/31/2002 | 8,108 | 8,239 | 8,187 |
| 10/31/2003 | 10,664 | 11,476 | 10,741 |
| 10/31/2004 | 11,582 | 12,482 | 11,354 |
| 10/31/2005 | 13,377 | 14,468 | 12,854 |
| 10/31/2006 | 15,054 | 16,567 | 14,351 |
| 10/31/2007 | 18,914 | 19,834 | 18,026 |
| 10/31/2008 | 11,083 | 11,375 | 10,697 |
| 10/31/2009 | 12,271 | 13,932 | 12,556 |
| 10/30/2010 | 14,814 | 17,838 | 15,223 |
| 10/31/2011 | 15,503 | 19,636 | 16,171 |
41 graphic description end -->
Growth of a $10,000 Investment – INSTITUTIONAL sHARES
| Federated Mid Cap Growth Strategies Fund - | C000082649 | RMCGI | LMCGFA |
| 10/31/2001 | 10,000 | 10,000 | 10,000 |
| 10/31/2002 | 8,149 | 8,239 | 8,187 |
| 10/31/2003 | 10,771 | 11,476 | 10,741 |
| 10/31/2004 | 11,757 | 12,482 | 11,354 |
| 10/31/2005 | 13,646 | 14,468 | 12,854 |
| 10/31/2006 | 15,471 | 16,567 | 14,351 |
| 10/31/2007 | 19,444 | 19,834 | 18,026 |
| 10/31/2008 | 11,423 | 11,375 | 10,697 |
| 10/31/2009 | 12,690 | 13,932 | 12,556 |
| 10/30/2010 | 15,414 | 17,838 | 15,223 |
| 10/31/2011 | 16,250 | 19,636 | 16,171 |
41 graphic description end -->
| 1 | Represents a hypothetical investment of $10,000 in the Fund after deducting applicable sales charges: For Class A Shares, the maximum sales charge of 5.50% ($10,000 investment minus $550 sales charge = $9,450); for Class B Shares, the maximum contingent deferred sales charge is 5.50% on any redemption less than one year from the purchase date; for Class C Shares, the maximum contingent deferred sales charge is 1.00% on any redemption less than one year from the purchase date. The Fund's performance assumes the reinvestment of all dividends and distributions. The RMCGI and the LMCGFA have been adjusted to reflect reinvestment of dividends on securities in the indexes. |
| 2 | The RMCGI is not adjusted to reflect sales loads, expenses or other fees that the Securities and Exchange Commission (SEC) requires to be reflected in the Fund's performance. The index is unmanaged and unlike the Fund, is not affected by cash flows. It is not possible to invest directly in an index. The LMCGFA represents the average of the total returns reported by all the mutual funds designated by Lipper, Inc. as falling into the category, and is not adjusted to reflect any sales charges. However, these total returns are reported net of expenses or other fees that the SEC requires to be reflected in a fund's performance. |
| 3 | Class R Shares of the Fund were offered beginning December 12, 2006. Performance results shown before that date are for the Fund's Class A Shares, adjusted to reflect the expenses of Class R Shares. |
Annual Shareholder Report Portfolio of Investments Summary Table (unaudited)
At October 31, 2011, the Fund's sector composition1 was as follows:
| Sector | Percentage of
Net Assets |
| Information Technology | 20.9% |
| Consumer Discretionary | 20.0% |
| Health Care | 15.2% |
| Industrials | 13.0% |
| Energy | 8.7% |
| Consumer Staples | 7.5% |
| Materials | 7.4% |
| Financials | 4.2% |
| Utilities | 1.2% |
| Telecommunication Services | 1.1% |
| Securities Lending Collateral2 | 1.6% |
| Cash Equivalents3 | 2.0% |
| Other Assets and Liabilities — Net4 | (2.8)% |
| TOTAL | 100.0% |
| 1 | Except for Securities Lending Collateral, Cash Equivalents and Other Assets and Liabilities, sector classifications are based upon, and individual portfolio securities are assigned to, the classifications of the Global Industry Classification Standard (GICS) except that the Adviser assigns a classification to securities not classified by the GICS and to securities for which the Adviser does not have access to the classification made by the GICS. |
| 2 | Cash collateral received from lending portfolio securities which is invested in short term investments such as repurchase agreements or money market mutual funds. |
| 3 | Cash Equivalents include any investments in money market mutual funds and/or overnight repurchase agreements other than those representing securities lending collateral. |
| 4 | Assets, other than investments in securities, less liabilities. See Statement of Assets and Liabilities. |
Annual Shareholder Report Portfolio of Investments
October 31, 2011
| Shares | | | Value |
| | COMMON STOCKS – 99.2% | |
| | Consumer Discretionary – 20.0% | |
| 33,200 | | Abercrombie & Fitch Co., Class A | 2,470,080 |
| 77,821 | 1,2 | Ascena Retail Group, Inc. | 2,249,027 |
| 5,200 | 1 | AutoZone, Inc. | 1,682,668 |
| 39,100 | 1 | Bed Bath & Beyond, Inc. | 2,417,944 |
| 4,700 | 1 | Chipotle Mexican Grill, Inc. | 1,579,764 |
| 30,200 | | Coach, Inc. | 1,965,114 |
| 23,300 | 1 | Deckers Outdoor Corp. | 2,685,092 |
| 60,879 | 1 | Discovery Communications, Inc. | 2,645,801 |
| 77,000 | | Expedia, Inc. | 2,022,020 |
| 131,300 | | International Game Technology | 2,309,567 |
| 52,200 | | Kohl's Corp. | 2,767,122 |
| 35,700 | 1 | Liberty Media Corp. | 2,742,474 |
| 85,500 | | Macy's, Inc. | 2,610,315 |
| 254,600 | 1,2 | Melco PBL Entertainment (Macau) Ltd., ADR | 2,920,262 |
| 53,000 | | Nordstrom, Inc. | 2,686,570 |
| 405,900 | | PDG Realty SA | 1,789,710 |
| 23,400 | 1 | Panera Bread Co. | 3,128,346 |
| 95,100 | | Penney (J.C.) Co., Inc. | 3,050,808 |
| 3,900 | 1 | Priceline.com, Inc. | 1,980,108 |
| 46,400 | | Ross Stores, Inc. | 4,070,672 |
| 201,100 | 1 | Sally Beauty Holdings, Inc. | 3,859,109 |
| 51,200 | 1 | TRW Automotive Holdings Corp. | 2,155,520 |
| 40,300 | | Tupperware Brands Corp. | 2,278,562 |
| | TOTAL | 58,066,655 |
| | Consumer Staples – 7.5% | |
| 48,100 | | Bunge Ltd. | 2,971,137 |
| 66,900 | | Church and Dwight, Inc. | 2,955,642 |
| 117,700 | | ConAgra Foods, Inc. | 2,981,341 |
| 73,500 | | Corn Products International, Inc. | 3,564,750 |
| 24,400 | | Estee Lauder Cos., Inc., Class A | 2,402,180 |
| 25,200 | 1 | Hansen Natural Corp. | 2,245,068 |
| 37,400 | | Herbalife Ltd. | 2,332,264 |
| 57,200 | | Reynolds American, Inc. | 2,212,496 |
| | TOTAL | 21,664,878 |
Annual Shareholder Report| Shares | | | Value |
| | Energy – 8.7% | |
| 55,800 | 1 | Cameron International Corp. | 2,742,012 |
| 153,700 | 1 | Denbury Resources, Inc. | 2,413,090 |
| 60,400 | 1 | Dresser-Rand Group, Inc. | 2,923,360 |
| 65,100 | 1 | FMC Technologies, Inc. | 2,917,782 |
| 26,000 | | Golar LNG Ltd. | 1,051,180 |
| 98,800 | 1 | McDermott International, Inc. | 1,084,824 |
| 47,100 | | Oceaneering International, Inc. | 1,970,193 |
| 163,100 | | Paramount Resources Ltd. | 5,934,926 |
| 47,900 | | Peabody Energy Corp. | 2,077,423 |
| 38,300 | | Transocean Ltd. | 2,188,845 |
| | TOTAL | 25,303,635 |
| | Financials – 4.2% | |
| 209,200 | | Annaly Capital Management, Inc. | 3,525,020 |
| 51,300 | | Capital One Financial Corp. | 2,342,358 |
| 74,100 | | Discover Financial Services | 1,745,796 |
| 79,500 | 1 | Ezcorp, Inc., Class A | 2,208,510 |
| 350,300 | | KeyCorp | 2,473,118 |
| | TOTAL | 12,294,802 |
| | Health Care – 15.2% | |
| 55,400 | 1 | Agilent Technologies, Inc. | 2,053,678 |
| 32,500 | 1 | Alexion Pharmaceuticals, Inc. | 2,194,075 |
| 33,500 | | Allergan, Inc. | 2,818,020 |
| 89,200 | 1 | Arthrocare Corp. | 2,689,380 |
| 106,300 | 1 | Centene Corp. | 3,736,445 |
| 42,600 | 1 | Covance, Inc. | 2,161,098 |
| 35,900 | 1 | Express Scripts, Inc., Class A | 1,641,707 |
| 53,800 | | Humana, Inc. | 4,567,082 |
| 171,600 | 1 | Idenix Pharmaceuticals, Inc. | 1,029,600 |
| 16,200 | 1 | Laboratory Corp. of America Holdings | 1,358,370 |
| 61,500 | | Medicis Pharmaceutical Corp., Class A | 2,354,835 |
| 61,500 | 1 | Mylan Laboratories, Inc. | 1,203,555 |
| 30,000 | | Perrigo Co. | 2,708,400 |
| 58,000 | 1 | Pharmasset, Inc. | 4,083,200 |
| 38,400 | | Quality Systems, Inc. | 1,494,144 |
| 18,500 | 1 | Regeneron Pharmaceuticals, Inc. | 1,023,050 |
| 83,500 | 1 | Seattle Genetics, Inc. | 1,837,000 |
| 248,400 | 1 | Universal American Financial Corp. | 2,856,600 |
Annual Shareholder Report| Shares | | | Value |
| 37,900 | 1 | Watson Pharmaceuticals, Inc. | 2,545,364 |
| | TOTAL | 44,355,603 |
| | Industrials – 13.0% | |
| 53,400 | 1 | Clean Harbors, Inc. | 3,111,618 |
| 116,500 | 1 | Corrections Corp. of America | 2,589,795 |
| 65,300 | | Crane Co. | 2,880,383 |
| 99,900 | | Curtiss Wright Corp. | 3,274,722 |
| 32,500 | 1 | Esterline Technologies Corp. | 1,816,750 |
| 48,000 | | Expeditors International Washington, Inc. | 2,188,800 |
| 70,400 | 1 | FTI Consulting, Inc. | 2,774,464 |
| 58,800 | 1 | Genesee & Wyoming, Inc., Class A | 3,481,548 |
| 103,100 | 1 | Geo Group, Inc. | 1,879,513 |
| 18,000 | 1 | IHS, Inc., Class A | 1,511,820 |
| 61,100 | | Pall Corp. | 3,126,487 |
| 31,300 | | Parker-Hannifin Corp. | 2,552,515 |
| 21,900 | | Roper Industries, Inc. | 1,776,090 |
| 55,900 | 1 | Thomas & Betts Corp. | 2,777,671 |
| 65,000 | | Waste Connections, Inc. | 2,213,250 |
| | TOTAL | 37,955,426 |
| | Information Technology – 20.9% | |
| 42,399 | 1 | Acme Packet, Inc. | 1,535,268 |
| 52,600 | | Altera Corp. | 1,994,592 |
| 103,700 | | Analog Devices, Inc. | 3,792,309 |
| 4,700 | 1 | Apple, Inc. | 1,902,466 |
| 96,700 | 1 | BMC Software, Inc. | 3,361,292 |
| 19,200 | 1 | Baidu.com, Inc., ADR | 2,691,456 |
| 42,500 | 1 | Cognizant Technology Solutions Corp. | 3,091,875 |
| 20,900 | 1 | F5 Networks, Inc. | 2,172,555 |
| 54,100 | | Intuit, Inc. | 2,903,547 |
| 55,300 | | KLA-Tencor Corp. | 2,604,077 |
| 64,900 | 1 | MICROS Systems Corp. | 3,194,378 |
| 95,700 | | MKS Instruments, Inc. | 2,549,448 |
| 196,300 | 1 | Marvell Technology Group Ltd. | 2,746,237 |
| 66,042 | | Motorola, Inc. | 3,098,030 |
| 43,200 | 1 | NetApp, Inc. | 1,769,472 |
| 40,400 | 1 | Riverbed Technology, Inc. | 1,114,232 |
| 32,200 | 1 | SINA.com | 2,617,538 |
| 49,300 | 1 | Sandisk Corp. | 2,498,031 |
Annual Shareholder Report| Shares | | | Value |
| 191,600 | 1 | Symantec Corp. | 3,259,116 |
| 250,300 | 1,2 | Teradyne, Inc. | 3,584,296 |
| 26,300 | 1 | VMware, Inc., Class A | 2,570,825 |
| 88,900 | 1 | Verifone Systems, Inc. | 3,752,469 |
| 75,400 | 1 | Western Digital Corp. | 2,008,656 |
| | TOTAL | 60,812,165 |
| | Materials – 7.4% | |
| 33,600 | | Agrium, Inc. | 2,764,944 |
| 18,600 | | CF Industries Holdings, Inc. | 3,018,222 |
| 18,939 | | Cliffs Natural Resources, Inc. | 1,292,018 |
| 61,300 | | Eastman Chemical Co. | 2,408,477 |
| 55,900 | 1 | Intrepid Potash, Inc. | 1,555,697 |
| 44,298 | | Mosaic Co./The | 2,594,091 |
| 56,900 | | Silgan Holdings, Inc. | 2,136,026 |
| 191,300 | 1 | Stillwater Mining Co. | 2,173,168 |
| 22,600 | | Walter Industries, Inc. | 1,709,690 |
| 134,200 | | Yamana Gold, Inc. | 2,008,974 |
| | TOTAL | 21,661,307 |
| | Telecommunication Services – 1.1% | |
| 82,700 | | BCE, Inc. | 3,275,747 |
| | Utilities – 1.2% | |
| 100,800 | | Northeast Utilities Co. | 3,484,656 |
| | TOTAL COMMON STOCKS
(IDENTIFIED COST $260,270,731) | 288,874,874 |
| | MUTUAL FUND – 3.6% | |
| 10,597,522 | 3,4,5 | Federated Prime Value Obligations Fund, Institutional Shares, 0.18%
(AT NET ASSET VALUE) | 10,597,522 |
| | TOTAL INVESTMENTS — 102.8%
(IDENTIFIED COST $270,868,253)6 | 299,472,396 |
| | OTHER ASSETS AND LIABILITIES - NET — (2.8)%7 | (8,273,624) |
| | TOTAL NET ASSETS — 100% | $291,198,772 |
| 1 | Non-income producing security. |
| 2 | Certain or all shares are temporarily on loan to unaffiliated broker/dealers. |
| 3 | Affiliated holding. |
| 4 | 7-Day net yield. |
| 5 | All or a portion of this security is held as collateral for securities lending. |
| 6 | The cost of investments for federal tax purposes amounts to $272,109,520. |
| 7 | Assets, other than investments in securities, less liabilities. See Statement of Assets and Liabilities. |
Annual Shareholder Report
Note: The categories of investments are shown as a percentage of total net assets at October 31, 2011.Various inputs are used in determining the value of the Fund's investments. These inputs are summarized in the three broad levels listed below:
Level 1 — quoted prices in active markets for identical securities, including investment companies with daily net asset values, if applicable.
Level 2 — other significant observable inputs (including quoted prices for similar securities, interest rates, prepayment speeds, credit risk, etc.). Also includes securities valued at amortized cost.
Level 3 — significant unobservable inputs (including the Fund's own assumptions in determining the fair value of investments).
The inputs or methodology used for valuing securities are not an indication of the risk associated with investing in those securities.
As of October 31, 2011, all investments of the Fund utilized Level 1 inputs in valuing the Fund's assets carried at fair value.
The following acronym is used throughout this portfolio:
| ADR | — American Depositary Receipt |
See Notes which are an integral part of the Financial Statements
Annual Shareholder Report Financial Highlights – Class A Shares
(For a Share Outstanding Throughout Each Period)
| Year Ended October 31 | 2011 | 2010 | 2009 | 2008 | 2007 |
| Net Asset Value, Beginning of Period | $32.38 | $26.77 | $24.05 | $45.41 | $36.12 |
| Income From Investment Operations: | | | | | |
| Net investment income (loss) | (0.21)1 | 0.011 | 0.091 | (0.00)1,2 | (0.12)1 |
| Net realized and unrealized gain (loss) on investments and foreign currency transactions | 1.88 | 5.68 | 2.61 | (17.11) | 9.41 |
| TOTAL FROM INVESTMENT OPERATIONS | 1.67 | 5.69 | 2.70 | (17.11) | 9.29 |
| Less Distributions: | | | | | |
| Distributions from net investment income | — | (0.08) | — | — | — |
| Distributions from net realized gain on investments and foreign currency transactions | — | — | — | (4.25) | — |
| TOTAL DISTRIBUTIONS | — | (0.08) | — | (4.25) | — |
| Regulatory Settlement Proceeds | — | — | 0.023 | — | — |
| Net Asset Value, End of Period | $34.05 | $32.38 | $26.77 | $24.05 | $45.41 |
| Total Return4 | 5.16% | 21.30% | 11.31%3 | (41.21)% | 25.72% |
| Ratios to Average Net Assets: | | | | | |
| Net expenses5 | 1.19%6 | 0.99%6 | 0.99%6 | 0.99%6 | 0.98%6 |
| Net investment income (loss) | (0.60)% | 0.04% | 0.37% | (0.00)%7 | (0.29)% |
| Expense waiver/reimbursement8 | 0.22% | 0.38% | 0.45% | 0.32% | 0.28% |
| Supplemental Data: | | | | | |
| Net assets, end of period (000 omitted) | $245,823 | $283,387 | $298,431 | $293,777 | $544,647 |
| Portfolio turnover | 172% | 265% | 207% | 215% | 118% |
| 1 | Per share numbers have been calculated using the average shares method. |
| 2 | Represents less than $0.01. |
| 3 | During the year, the Fund received a regulatory settlement from an unaffiliated third party, which had an impact of 0.08% on the total return. |
| 4 | Based on net asset value, which does not reflect the sales charge, redemption fee or contingent deferred sales charge, if applicable. |
| 5 | Pursuant to a settlement with the New York Attorney General, the Adviser agreed to waive management fees in compliance with an Assurance of Discontinuance dated November 17, 2005. The net management fee was reduced to 0.4975% effective January 1, 2006 through December 31, 2010. |
| 6 | The net expense ratio is calculated without reduction for expense offset arrangements. The net expense ratios are 1.18%, 0.98%, 0.96%, 0.98% and 0.98% for the years ended October 31, 2011, 2010, 2009, 2008 and 2007, respectively, after taking into account these expense reductions. |
| 7 | Represents less than 0.01%. |
| 8 | This expense decrease is reflected in both the net expense and the net investment income (loss) ratios shown above. |
See Notes which are an integral part of the Financial Statements
Annual Shareholder Report Financial Highlights – Class B Shares
(For a Share Outstanding Throughout Each Period)
| Year Ended October 31 | 2011 | 2010 | 2009 | 2008 | 2007 |
| Net Asset Value, Beginning of Period | $28.24 | $23.46 | $21.23 | $40.89 | $32.77 |
| Income From Investment Operations: | | | | | |
| Net investment income (loss) | (0.42)1 | (0.19)1 | (0.06)1 | (0.24)1 | (0.38)1 |
| Net realized and unrealized gain (loss) on investments and foreign currency transactions | 1.66 | 4.97 | 2.27 | (15.17) | 8.50 |
| TOTAL FROM INVESTMENT OPERATIONS | 1.24 | 4.78 | 2.21 | (15.41) | 8.12 |
| Less Distributions: | | | | | |
| Distributions from net realized gain on investments and foreign currency transactions | — | — | — | (4.25) | — |
| Regulatory Settlement Proceeds | — | — | 0.022 | — | — |
| Net Asset Value, End of Period | $29.48 | $28.24 | $23.46 | $21.23 | $40.89 |
| Total Return3 | 4.39% | 20.38% | 10.50%2 | (41.65)% | 24.78% |
| Ratios to Average Net Assets: | | | | | |
| Net expenses4 | 1.93%5 | 1.74%5 | 1.73%5 | 1.74%5 | 1.74%5 |
| Net investment income (loss) | (1.35)% | (0.73)% | (0.28)% | (0.75)% | (1.05)% |
| Expense waiver/reimbursement6 | 0.30% | 0.46% | 0.52% | 0.39% | 0.34% |
| Supplemental Data: | | | | | |
| Net assets, end of period (000 omitted) | $6,325 | $8,344 | $11,669 | $21,592 | $76,376 |
| Portfolio turnover | 172% | 265% | 207% | 215% | 118% |
| 1 | Per share numbers have been calculated using the average shares method. |
| 2 | During the year, the Fund received a regulatory settlement from an unaffiliated third party, which had an impact of 0.14% on the total return. |
| 3 | Based on net asset value, which does not reflect the sales charge, redemption fee or contingent deferred sales charge, if applicable. |
| 4 | Pursuant to a settlement with the New York Attorney General, the Adviser agreed to waive management fees in compliance with an Assurance of Discontinuance dated November 17, 2005. The net management fee was reduced to 0.4975% effective January 1, 2006 through December 31, 2010. |
| 5 | The net expense ratio is calculated without reduction for expense offset arrangements. The net expense ratios are 1.93%, 1.73%, 1.69%, 1.73% and 1.74% for the years ended October 31, 2011, 2010, 2009, 2008 and 2007, respectively, after taking into account these expense reductions. |
| 6 | This expense decrease is reflected in both the net expense and the net investment income (loss) ratios shown above. |
See Notes which are an integral part of the Financial Statements
Annual Shareholder Report Financial Highlights – Class C Shares
(For a Share Outstanding Throughout Each Period)
| Year Ended October 31 | 2011 | 2010 | 2009 | 2008 | 2007 |
| Net Asset Value, Beginning of Period | $28.55 | $23.72 | $21.47 | $41.29 | $33.10 |
| Income From Investment Operations: | | | | | |
| Net investment income (loss) | (0.42)1 | (0.19)1 | (0.08)1 | (0.24)1 | (0.39)1 |
| Net realized and unrealized gain (loss) on investments and foreign currency transactions | 1.68 | 5.02 | 2.31 | (15.33) | 8.58 |
| TOTAL FROM INVESTMENT OPERATIONS | 1.26 | 4.83 | 2.23 | (15.57) | 8.19 |
| Less Distributions: | | | | | |
| Distributions from net realized gain on investments and foreign currency transactions | — | — | — | (4.25) | — |
| Regulatory Settlement Proceeds | — | — | 0.022 | — | — |
| Net Asset Value, End of Period | $29.81 | $28.55 | $23.72 | $21.47 | $41.29 |
| Total Return3 | 4.41% | 20.36% | 10.48%2 | (41.64)% | 24.74% |
| Ratios to Average Net Assets: | | | | | |
| Net expenses4 | 1.94%5 | 1.74%5 | 1.74%5 | 1.74%5 | 1.74%5 |
| Net investment income (loss) | (1.34)% | (0.71)% | (0.36)% | (0.75)% | (1.04)% |
| Expense waiver/reimbursement6 | 0.26% | 0.42% | 0.49% | 0.35% | 0.29% |
| Supplemental Data: | | | | | |
| Net assets, end of period (000 omitted) | $10,733 | $11,060 | $11,880 | $13,227 | $27,366 |
| Portfolio turnover | 172% | 265% | 207% | 215% | 118% |
| 1 | Per share numbers have been calculated using the average shares method. |
| 2 | During the year, the Fund received a regulatory settlement from an unaffiliated third party, which had an impact of 0.09% on the total return. |
| 3 | Based on net asset value, which does not reflect the sales charge, redemption fee or contingent deferred sales charge, if applicable. |
| 4 | Pursuant to a settlement with the New York Attorney General, the Adviser agreed to waive management fees in compliance with an Assurance of Discontinuance dated November 17, 2005. The net management fee was reduced to 0.4975% effective January 1, 2006 through December 31, 2010. |
| 5 | The net expense ratio is calculated without reduction for expense offset arrangements. The net expense ratios are 1.93%, 1.73%, 1.71%, 1.73% and 1.73% for the years ended October 31, 2011, 2010, 2009, 2008 and 2007, respectively, after taking into account these expense reductions. |
| 6 | This expense decrease is reflected in both the net expense and the net investment income (loss) ratios shown above. |
See Notes which are an integral part of the Financial Statements
Annual Shareholder Report Financial Highlights – Class R Shares
(For a Share Outstanding Throughout Each Period)
| Year Ended October 31, | Period
Ended
10/31/20071 |
| 2011 | 2010 | 2009 | 2008 |
| Net Asset Value, Beginning of Period | $32.04 | $26.54 | $23.97 | $45.41 | $37.77 |
| Income From Investment Operations: | | | | | |
| Net investment income (loss) | (0.36)2 | (0.13)2 | (0.06)2 | (0.18)2 | (0.16)2 |
| Net realized and unrealized gain (loss) on investments and foreign currency transactions | 1.85 | 5.63 | 2.63 | (17.01) | 7.80 |
| TOTAL FROM INVESTMENT OPERATIONS | 1.49 | 5.50 | 2.57 | (17.19) | 7.64 |
| Less Distributions: | | | | | |
| Distributions from net realized gain on investments and foreign currency transactions | — | — | —�� | (4.25) | — |
| Net Asset Value, End of Period | $33.53 | $32.04 | $26.54 | $23.97 | $45.41 |
| Total Return3 | 4.65% | 20.72% | 10.72% | (41.40)% | 20.23% |
| Ratios to Average Net Assets: | | | | | |
| Net expenses4 | 1.70%5 | 1.49%5 | 1.49%5 | 1.49%5 | 1.47%5,6 |
| Net investment income (loss) | (1.04)% | (0.44)% | (0.26)% | (0.51)% | (0.81)% 6 |
| Expense waiver/reimbursement7 | 0.17% | 0.31% | 0.37% | 0.30% | 0.26%6 |
| Supplemental Data: | | | | | |
| Net assets, end of period (000 omitted) | $1,483 | $610 | $461 | $150 | $08 |
| Portfolio turnover | 172% | 265% | 207% | 215% | 118%9 |
| 1 | Reflects operations for the period from December 12, 2006 (date of initial public offering) to October 31, 2007. |
| 2 | Per share numbers have been calculated using the average shares method. |
| 3 | Based on net asset value. Total returns for periods of less than one year are not annualized. |
| 4 | Pursuant to a settlement with the New York Attorney General, the Adviser agreed to waive management fees in compliance with an Assurance of Discontinuance dated November 17, 2005. The net management fee was reduced to 0.4975% effective January 1, 2006 through December 31, 2010. |
| 5 | The net expense ratio is calculated without reduction for expense offset arrangements. The net expense ratios are 1.69%, 1.48%, 1.46%, 1.47% and 1.46% for the years ended October 31, 2011, 2010, 2009 and 2008, and for the period ended October 31, 2007, respectively, after taking into account these expense reductions. |
| 6 | Computed on an annualized basis. |
| 7 | This expense decrease is reflected in both the net expense and the net investment income (loss) ratios shown above. |
| 8 | Represents less than $1,000. |
| 9 | Portfolio turnover is calculated at the Fund level. Percentage indicated was calculated for the entire fiscal year ended October 31, 2007. |
See Notes which are an integral part of the Financial Statements
Annual Shareholder Report Financial Highlights – Institutional Shares
(For a Share Outstanding Throughout Each Period)
| Year Ended
10/31/2011 | Period
Ended
10/31/20101 |
| Net Asset Value, Beginning of Period | $32.44 | $28.18 |
| Income From Investment Operations: | | |
| Net investment income (loss) | (0.12)2 | 0.102 |
| Net realized and unrealized gain on investments and foreign currency transactions | 1.88 | 4.16 |
| TOTAL FROM INVESTMENT OPERATIONS | 1.76 | 4.26 |
| Net Asset Value, End of Period | $34.20 | $32.44 |
| Total Return3 | 5.43% | 15.12% |
| Ratios to Average Net Assets: | | |
| Net expenses4 | 0.93%6 | 0.74%5,6 |
| Net investment income (loss) | (0.35)% | 0.43%5 |
| Expense waiver/reimbursement7 | 0.18% | 0.33%5 |
| Supplemental Data: | | |
| Net assets, end of period (000 omitted) | $26,835 | $37,709 |
| Portfolio turnover | 172% | 265%8 |
| 1 | Reflects operations for the period from January 29, 2010 (date of initial investment) to October 31, 2010. |
| 2 | Per share numbers have been calculated using the average shares method. |
| 3 | Based on net asset value. Total returns for periods of less than one year are not annualized. |
| 4 | Pursuant to a settlement with the New York Attorney General, the Adviser agreed to waive management fees in compliance with an Assurance of Discontinuance dated November 17, 2005. The net management fee was reduced to 0.4975% effective January 1, 2006 through December 31, 2010. |
| 5 | Computed on an annualized basis. |
| 6 | The net expense ratios are calculated without reduction for expense offset arrangements. The net expense ratios are 0.92% and 0.73% for the year ended October 31, 2011 and for the period ended October 31, 2010, respectively, after taking into account these expense reductions. |
| 7 | This expense decrease is reflected in both the net expense and the net investment income (loss) ratios shown above. |
| 8 | Portfolio turnover is calculated at the Fund level. Percentage indicated was calculated for the entire fiscal year ended October 31, 2010. |
See Notes which are an integral part of the Financial Statements
Annual Shareholder Report Statement of Assets and Liabilities
October 31, 2011
| Assets: | | |
| Total investments in securities, at value including $4,535,552 of securities loaned and $10,597,522 of investments in an affiliated holding (Note 5) (identified cost $270,868,253) | | $299,472,396 |
| Cash | | 16,198 |
| Income receivable | | 66,751 |
| Receivable for investments sold | | 2,676,199 |
| Receivable for shares sold | | 72,627 |
| Other assets | | 9,954 |
| TOTAL ASSETS | | 302,314,125 |
| Liabilities: | | |
| Payable for investments purchased | $5,641,856 | |
| Payable for shares redeemed | 260,492 | |
| Payable for collateral due to broker for securities lending | 4,892,000 | |
| Payable for Directors'/Trustees' fees | 381 | |
| Payable for distribution services fee (Note 5) | 11,005 | |
| Payable for shareholder services fee (Note 5) | 131,258 | |
| Accrued expenses | 178,361 | |
| TOTAL LIABILITIES | | 11,115,353 |
| Net assets for 8,622,826 shares outstanding | | $291,198,772 |
| Net Assets Consist of: | | |
| Paid-in capital | | $290,538,623 |
| Net unrealized appreciation of investments | | 28,604,143 |
| Accumulated net realized loss on investments and foreign currency transactions | | (27,943,994) |
| TOTAL NET ASSETS | | $291,198,772 |
Annual Shareholder ReportStatement of Assets and Liabilities — continued| Net Asset Value, Offering Price and Redemption Proceeds Per Share | | |
| Class A Shares: | | |
| Net asset value per share ($245,822,501 ÷ 7,219,325 shares outstanding), no par value, unlimited shares authorized | | $34.05 |
| Offering price per share (100/94.50 of $34.05) | | $36.03 |
| Redemption proceeds per share | | $34.05 |
| Class B Shares: | | |
| Net asset value per share ($6,324,685 ÷ 214,563 shares outstanding), no par value, unlimited shares authorized | | $29.48 |
| Offering price per share | | $29.48 |
| Redemption proceeds per share (94.50/100 of $29.48) | | $27.86 |
| Class C Shares: | | |
| Net asset value per share ($10,733,395 ÷ 360,098 shares outstanding), no par value, unlimited shares authorized | | $29.81 |
| Offering price per share | | $29.81 |
| Redemption proceeds per share (99.00/100 of $29.81) | | $29.51 |
| Class R Shares: | | |
| Net asset value per share ($1,483,326 ÷ 44,241 shares outstanding), no par value, unlimited shares authorized | | $33.53 |
| Offering price per share | | $33.53 |
| Redemption proceeds per share | | $33.53 |
| Institutional Shares: | | |
| Net asset value per share ($26,834,865 ÷ 784,599 shares outstanding), no par value, unlimited shares authorized | | $34.20 |
| Offering price per share | | $34.20 |
| Redemption proceeds per share | | $34.20 |
See Notes which are an integral part of the Financial Statements
Annual Shareholder Report Statement of Operations
Year Ended October 31, 2011
| Investment Income: | | | |
| Dividends (including $9,370 received from an affiliated holding (Note 5) and net of foreign taxes withheld of $38,922) | | | $1,810,369 |
| Interest (including income on securities loaned of $171,073) | | | 180,782 |
| TOTAL INCOME | | | 1,991,151 |
| Expenses: | | | |
| Investment adviser fee (Note 5) | | $2,566,173 | |
| Administrative fee (Note 5) | | 310,000 | |
| Custodian fees | | 79,284 | |
| Transfer and dividend disbursing agent fees and expenses (Note 2) | | 671,917 | |
| Directors'/Trustees' fees | | 4,356 | |
| Auditing fees | | 23,000 | |
| Legal fees | | 6,160 | |
| Portfolio accounting fees | | 135,389 | |
| Distribution services fee (Note 5) | | 152,592 | |
| Shareholder services fee (Note 5) | | 724,624 | |
| Account administration fee (Note 2) | | 24,924 | |
| Share registration costs | | 82,890 | |
| Printing and postage | | 66,071 | |
| Insurance premiums | | 4,805 | |
| Miscellaneous | | 8,225 | |
| TOTAL EXPENSES | | 4,860,410 | |
Annual Shareholder ReportStatement of Operations — continued| Waivers, Reimbursements and Reduction: | | | |
| Waiver/reimbursement of investment adviser fee (Note 5) | $(469,920) | | |
| Waiver of administrative fee (Note 5) | (49,620) | | |
| Reimbursement of transfer and dividend disbursing agent fees and expenses (Note 2) and (Note 5) | (217,562) | | |
Fees paid indirectly from directed brokerage
arrangements (Note 6) | (25,329) | | |
| TOTAL WAIVERS, REIMBURSEMENTS AND REDUCTION | | $(762,431) | |
| Net expenses | | | $4,097,979 |
| Net investment income (loss) | | | (2,106,828) |
| Realized and Unrealized Gain (Loss) on Investments and Foreign Currency Transactions: | | | |
| Net realized gain on investments and foreign currency transactions (including foreign taxes withheld of $6,916) | | | 43,000,799 |
| Net change in unrealized appreciation of investments and translation of assets and liabilities in foreign currency | | | (19,992,577) |
| Net realized and unrealized gain on investments and foreign currency transactions | | | 23,008,222 |
| Change in net assets resulting from operations | | | $20,901,394 |
See Notes which are an integral part of the Financial Statements
Annual Shareholder Report Statement of Changes in Net Assets
| Year Ended October 31 | 2011 | 2010 |
| Increase (Decrease) in Net Assets | | |
| Operations: | | |
| Net investment income (loss) | $(2,106,828) | $66,952 |
| Net realized gain on investments and foreign currency transactions | 43,000,799 | 50,795,889 |
| Net change in unrealized appreciation/depreciation of investments and translation of assets and liabilities in foreign currency | (19,992,577) | 13,614,723 |
| CHANGE IN NET ASSETS RESULTING FROM OPERATIONS | 20,901,394 | 64,477,564 |
| Distributions to Shareholders: | | |
| Distributions from net investment income | | |
| Class A Shares | — | (923,724) |
| Share Transactions: | | |
| Proceeds from sale of shares | 31,535,282 | 63,014,617 |
| Net asset value of shares issued to shareholders in payment of distributions declared | — | 811,126 |
| Cost of shares redeemed | (102,346,932) | (108,711,084) |
| CHANGE IN NET ASSETS RESULTING FROM SHARE TRANSACTIONS | (70,811,650) | (44,885,341) |
| CHANGE IN NET ASSETS | (49,910,256) | 18,668,499 |
| Net Assets: | | |
| Beginning of period | 341,109,028 | 322,440,529 |
| End of period | $291,198,772 | $341,109,028 |
See Notes which are an integral part of the Financial Statements
Annual Shareholder Report Notes to Financial Statements
October 31, 2011
1. ORGANIZATION
Federated Equity Funds (the “Trust”) is registered under the Investment Company Act of 1940, as amended (the “Act”), as an open-end management investment company. The Trust consists of 13 diversified portfolios. The financial statements included herein are only those of Federated Mid Cap Growth Strategies Fund (the “Fund”). The financial statements of the other portfolios are presented separately. The assets of each portfolio are segregated and a shareholder's interest is limited to the portfolio in which shares are held. Each portfolio pays its own expenses. The Fund offers five classes of shares: Class A Shares, Class B Shares, Class C Shares, Class R Shares and Institutional Shares. All shares of the Fund have equal rights with respect to voting, except on class-specific matters. The investment objective of the Fund is appreciation of capital.
The Fund commenced offering Institutional Shares on January 29, 2010.
2. SIGNIFICANT ACCOUNTING POLICIES
The following is a summary of significant accounting policies consistently followed by the Fund in the preparation of its financial statements. These policies are in conformity with U.S. generally accepted accounting principles (GAAP).
Investment Valuation
In calculating its net asset value (NAV), the Fund generally values investments as follows:
- Equity securities listed on an exchange or traded through a regulated market system are valued at their last reported sale price or official closing price in their principal exchange or market.
- Shares of other mutual funds are valued based upon their reported NAVs.
- Derivative contracts listed on exchanges are valued at their reported settlement or closing price.
- Over-the-counter (OTC) derivative contracts are fair valued using price evaluations provided by a pricing service approved by the Board of Trustees (the “Trustees”).
- Fixed-income securities acquired with remaining maturities greater than 60 days are fair valued using price evaluations provided by a pricing service approved by the Trustees.
- Fixed-income securities acquired with remaining maturities of 60 days or less are valued at their cost (adjusted for the accretion of any discount or amortization of any premium), which approximates market value.
- For securities that are fair valued in accordance with procedures established by and under the general supervision of the Trustees, certain factors may be considered such as: the purchase price of the security, information obtained by contacting the issuer, analysis of the issuer's financial statements or other available documents, fundamental analytical data, the nature and duration of restrictions on disposition, the movement of the market in which the security is normally traded and public trading in similar securities of the issuer or comparable issuers.
Annual Shareholder Report
If the Fund cannot obtain a price or price evaluation from a pricing service for an investment, the Fund may attempt to value the investment based upon the mean of bid and asked quotations or fair value the investment based on price evaluations, from one or more dealers. If any price, quotation, price evaluation or other pricing source is not readily available when the NAV is calculated, the Fund uses the fair value of the investment determined in accordance with the procedures described below. There can be no assurance that the Fund could purchase or sell an investment at the price used to calculate the Fund's NAV.Fair Valuation and Significant Events Procedures
The Trustees have authorized the use of pricing services to provide evaluations of the current fair value of certain investments for purposes of calculating the NAV. Factors considered by pricing services in evaluating an investment include the yields or prices of investments of comparable quality, coupon, maturity, call rights and other potential prepayments, terms and type, reported transactions, indications as to values from dealers and general market conditions. Some pricing services provide a single price evaluation reflecting the bid-side of the market for an investment (a “bid” evaluation). Other pricing services offer both bid evaluations and price evaluations indicative of a price between the prices bid and asked for the investment (a “mid” evaluation). The Fund normally uses bid evaluations for U.S. Treasury and Agency securities and mortgage-backed securities. The Fund normally uses mid evaluations for other types of fixed-income securities and OTC derivative contracts. In the event that market quotations and price evaluations are not available for an investment, the fair value of the investment is determined in accordance with procedures adopted by the Trustees.
The Trustees also have adopted procedures requiring an investment to be priced at its fair value whenever the Adviser determines that a significant event affecting the value of the investment has occurred between the time as of which the price of the investment would otherwise be determined and the time as of which the NAV is computed. An event is considered significant if there is both an affirmative expectation that the investment's value will change in response to the event and a reasonable basis for quantifying the resulting change in value. Examples of significant events that may occur after the close of the principal market on which a security is traded, or after the time of a price evaluation provided by a pricing service or a dealer, include:
- With respect to securities traded in foreign markets, significant trends in U.S. equity markets or in the trading of foreign securities index futures or options contracts;
- With respect to price evaluations of fixed-income securities determined before the close of regular trading on the NYSE, actions by the Federal Reserve Open Market Committee and other significant trends in U.S. fixed-income markets;
- Political or other developments affecting the economy or markets in which an issuer conducts its operations or its securities are traded; and
- Announcements concerning matters such as acquisitions, recapitalizations, litigation developments, a natural disaster affecting the issuer's operations or regulatory changes or market developments affecting the issuer's industry.
Annual Shareholder Report
The Trustees have approved the use of a pricing service to determine the fair value of equity securities traded principally in foreign markets when the Adviser determines that there has been a significant trend in the U.S. equity markets or in index futures trading. For other significant events, the Fund may seek to obtain more current quotations or price evaluations from alternative pricing sources. If a reliable alternative pricing source is not available, the Fund will determine the fair value of the investment using another method approved by the Trustees.Repurchase Agreements
The Fund may invest in repurchase agreements for short-term liquidity purposes. It is the policy of the Fund to require the other party to a repurchase agreement to transfer to the Fund's custodian or sub-custodian eligible securities or cash with a market value (after transaction costs) at least equal to the repurchase price to be paid under the repurchase agreement. The eligible securities are transferred to accounts with the custodian or sub-custodian in which the Fund holds a “securities entitlement” and exercises “control” as those terms are defined in the Uniform Commercial Code. The Fund has established procedures for monitoring the market value of the transferred securities and requiring the transfer of additional eligible securities if necessary to equal at least the repurchase price. These procedures also allow the other party to require securities to be transferred from the account to the extent that their market value exceeds the repurchase price or in exchange for other eligible securities of equivalent market value.
The insolvency of the other party or other failure to repurchase the securities may delay the disposition of the underlying securities or cause the Fund to receive less than the full repurchase price. Under the terms of the repurchase agreement, any amounts received by the Fund in excess of the repurchase price and related transaction costs must be remitted to the other party.
The Fund may enter into repurchase agreements in which eligible securities are transferred into joint trading accounts maintained by the custodian or sub-custodian for investment companies and other clients advised by the Fund's Adviser and its affiliates. The Fund will participate on a pro rata basis with the other investment companies and clients in its share of the securities transferred under such repurchase agreements and in its share of proceeds from any repurchase or other disposition of such securities.
Annual Shareholder Report
Investment Income, Gains and Losses, Expenses and DistributionsInvestment transactions are accounted for on a trade-date basis. Realized gains and losses from investment transactions are recorded on an identified-cost basis. Interest income and expenses are accrued daily. Dividend income and distributions to shareholders are recorded on the ex-dividend date. Foreign dividends are recorded on the ex-dividend date or when the Fund is informed of the ex-dividend date. Distributions of net investment income, if any, are declared and paid annually. Non-cash dividends included in dividend income, if any, are recorded at fair value. Investment income, realized and unrealized gains and losses and certain fund-level expenses are allocated to each class based on relative average daily net assets, except that Class A Shares, Class B Shares, Class C Shares, Class R Shares and Institutional Shares may bear distribution services fees, shareholder services fees, account administration fees and certain transfer and dividend disbursing agent fees unique to those classes. For the year ended October 31, 2011, transfer and dividend disbursing agent fees and account administration fees for the Fund were as follows:
| Transfer and
Dividend
Disbursing
Agent Fees
Incurred | Transfer and
Dividend
Disbursing
Agent Fees
Reimbursed | Account
Administration
Fees Incurred |
| Class A Shares | $569,097 | $(184,644) | $23,928 |
| Class B Shares | 21,373 | (11,341) | — |
| Class C Shares | 27,026 | (12,009) | 996 |
| Class R Shares | 2,934 | — | — |
| Institutional Shares | 51,487 | (9,568) | — |
| TOTAL | $671,917 | $(217,562) | $24,924 |
Dividends are declared separately for each class. No class has preferential dividend rights; differences in per share dividend rates are generally due to differences in separate class expenses.
Premium and Discount Amortization
All premiums and discounts on fixed-income securities are amortized/accreted using the effective interest rate method.
Federal Taxes
It is the Fund's policy to comply with the Subchapter M provision of the Internal Revenue Code (the “Code”) and to distribute to shareholders each year substantially all of its income. Accordingly, no provision for federal income tax is necessary. As of and during the year ended October 31, 2011, the Fund did not have a liability for any uncertain tax positions. The Fund recognizes interest and penalties, if any, related to tax liabilities as income tax expense in the Statement of Operations. As of October 31, 2011, tax years 2008 through 2011 remain subject to examination by the Fund's major tax jurisdictions, which include the United States of America and the Commonwealth of Massachusetts.
The Fund may be subject to taxes imposed by governments of countries in which it invests. Such taxes are generally based on either income or gains earned or repatriated. The Fund accrues and applies such taxes to net investment income, net realized gains and net unrealized gains as income and/or gains are earned.
Annual Shareholder Report
When-Issued and Delayed Delivery TransactionsThe Fund may engage in when-issued or delayed delivery transactions. The Fund records when-issued securities on the trade date and maintains security positions such that sufficient liquid assets will be available to make payment for the securities purchased. Securities purchased on a when-issued or delayed delivery basis are marked to market daily and begin earning interest on the settlement date. Losses may occur on these transactions due to changes in market conditions or the failure of counterparties to perform under the contract.
Foreign Exchange Contracts
The Fund enters into foreign exchange contracts for the delayed delivery of securities or foreign currency exchange transactions. The Fund enters into foreign exchange contracts to protect assets against adverse changes in foreign currency exchange rates or exchange control regulations. Purchased contracts are used to acquire exposure to foreign currencies, whereas, contracts to sell are used to hedge the Fund's securities against currency fluctuations. Risks may arise upon entering into these transactions from the potential inability of counterparties to meet the terms of their commitments and from unanticipated movements in security prices or foreign exchange rates. The foreign exchange contracts are adjusted by the daily exchange rate of the underlying currency and any gains or losses are recorded for financial statement purposes as unrealized until the settlement date.
At October 31, 2011, the Fund had no outstanding foreign exchange contracts.
The average value at settlement date payable and receivable of foreign exchange contracts purchased and sold by the Fund throughout the period was $677 and $285, respectively. This is based on the contracts held as of each month-end throughout the fiscal period.
Foreign Currency Translation
The accounting records of the Fund are maintained in U.S. dollars. All assets and liabilities denominated in foreign currencies (FCs) are translated into U.S. dollars based on the rates of exchange of such currencies against U.S. dollars on the date of valuation. Purchases and sales of securities, income and expenses are translated at the rate of exchange quoted on the respective date that such transactions are recorded. The Fund does not isolate that portion of the results of operations resulting from changes in foreign exchange rates on investments from the fluctuations arising from changes in market prices of securities held. Such fluctuations are included with the net realized and unrealized gain or loss from investments.
Reported net realized foreign exchange gains or losses arise from sales of portfolio securities, sales and maturities of short-term securities, sales of FCs, currency gains or losses realized between the trade and settlement dates on securities transactions, the difference between the amounts of dividends, interest and foreign withholding taxes recorded on the Fund's books and the U.S. dollar equivalent of the amounts actually received or paid. Net unrealized foreign exchange gains and losses arise from changes in the value of assets and liabilities other than investments in securities at fiscal year end, resulting from changes in the exchange rate.
Annual Shareholder Report
Securities LendingThe Fund participates in a securities lending program providing for the lending of equity securities to qualified brokers. The Fund normally receives cash collateral for securities loaned that is invested in an affiliated money market fund or in short-term securities including repurchase agreements. Collateral is maintained at a minimum level of 100% of the market value of investments loaned, plus interest, if applicable. Earnings on collateral are allocated between the securities lending agent, as a fee for its services under the program, and the Fund, according to agreed-upon rates.
As of October 31, 2011, Securities subject to this type of arrangement and related collateral were as follows:
Market Value of
Securities Loaned | Market Value
of Collateral |
| $4,535,552 | $4,892,000 |
The Effect of Derivative Instruments on the Statement of Operations for the Year Ended October 31, 2011
| Amount of Realized Gain or (Loss) on Derivatives Recognized in Income |
| Forward
Currency
Contracts |
| Foreign exchange contracts | $21,707 |
| Change in Unrealized Appreciation or (Depreciation) on Derivatives Recognized in Income |
| Forward
Currency
Contracts |
| Foreign exchange contracts | $90 |
Other
The preparation of financial statements in conformity with GAAP requires management to make estimates and assumptions that affect the amounts of assets, liabilities, expenses and revenues reported in the financial statements. Actual results could differ from those estimated.
3. SHARES OF BENEFICIAL INTEREST
The following tables summarize share activity:
| Year Ended October 31 | 2011 | 2010 |
| Class A Shares: | Shares | Amount | Shares | Amount |
| Shares sold | 646,037 | $23,652,967 | 691,848 | $20,423,526 |
| Shares issued to shareholders in payment of distributions declared | — | — | 27,255 | 811,126 |
| Shares redeemed | (2,179,316) | (77,919,363) | (3,115,445) | (92,946,615) |
NET CHANGE RESULTING FROM
CLASS ASHARE TRANSACTIONS | (1,533,279) | $(54,266,396) | (2,396,342) | $(71,711,963) |
Annual Shareholder Report| Year Ended October 31 | 2011 | 2010 |
| Class B Shares: | Shares | Amount | Shares | Amount |
| Shares sold | 31,347 | $975,030 | 18,369 | 480,666 |
| Shares redeemed | (112,223) | (3,492,415) | (220,354) | (5,653,957) |
NET CHANGE RESULTING FROM
CLASS BSHARE TRANSACTIONS | (80,876) | $(2,517,385) | (201,985) | (5,173,291) |
| Year Ended October 31 | 2011 | 2010 |
| Class C Shares: | Shares | Amount | Shares | Amount |
| Shares sold | 61,306 | $1,901,432 | 30,551 | $811,539 |
| Shares redeemed | (88,541) | (2,748,593) | (144,146) | (3,769,825) |
NET CHANGE RESULTING FROM
CLASS CSHARE TRANSACTIONS | (27,235) | $(847,161) | (113,595) | $(2,958,286) |
| Year Ended October 31 | 2011 | 2010 |
| Class R Shares: | Shares | Amount | Shares | Amount |
| Shares sold | 40,069 | $1,321,761 | 6,423 | $188,978 |
| Shares redeemed | (14,854) | (523,695) | (4,781) | (142,213) |
NET CHANGE RESULTING FROM
CLASS RSHARE TRANSACTIONS | 25,215 | $798,066 | 1,642 | $ 46,765 |
| | Year Ended
10/31/2011 | Period Ended
10/31/20101 |
| Institutional Shares: | Shares | Amount | Shares | Amount |
| Shares sold | 102,429 | $3,684,092 | 1,363,578 | $41,109,908 |
| Shares redeemed | (480,264) | (17,662,866) | (201,144) | (6,198,474) |
NET CHANGE RESULTING FROM
INSTITUTIONALSHARE TRANSACTIONS | (377,835) | $(13,978,774) | 1,162,434 | $34,911,434 |
NET CHANGE RESULTING FROM
TOTAL FUND SHARE TRANSACTIONS | (1,994,010) | $(70,811,650) | (1,547,846) | $(44,885,341) |
| 1. | Reflects operations for the period from January 29, 2010 (date of initial investment) to October 31, 2010. |
4. FEDERAL TAX INFORMATION
The timing and character of income and capital gain distributions are determined in accordance with income tax regulations, which may differ from GAAP. These differences are due to differing treatments for foreign currency transactions, realized capital gain tax expenses, partnerships and net operating loss.
Annual Shareholder Report
For the year ended October 31, 2011, permanent differences identified and reclassified among the components of net assets were as follows:| Increase (Decrease) |
| Paid-In Capital | Undistributed
Net Investment
Income (Loss) | Accumulated
Net Realized
Gain (Loss) |
| $(2,383,436) | $2,106,828 | $276,608 |
Net investment income (loss), net realized gains (losses) and net assets were not affected by this reclassification.
The tax character of distributions as reported on the Statement of Changes in Net Assets for the years ended October 31, 2011 and 2010, was as follows:
| 2011 | 2010 |
| Ordinary income | $ — | $923,724 |
As of October 31, 2011, the components of distributable earnings on a tax basis were as follows:
| Net unrealized appreciation | $27,362,876 |
| Capital loss carryforwards | $(26,702,727) |
The difference between book-basis and tax-basis net unrealized appreciation/depreciation is attributable to the deferral of losses on wash sales.
At October 31, 2011, the cost of investments for federal tax purposes was $272,109,520. The net unrealized appreciation of investments for federal tax purposes was $27,362,876. This consists of net unrealized appreciation from investments for those securities having an excess of value over cost of $38,746,149 and net unrealized depreciation from investments for those securities having an excess of cost over value of $11,383,273.
At October 31, 2011, the Fund had a capital loss carryforward of $26,702,727 which will reduce the Fund's taxable income arising from future net realized gains on investments, if any, to the extent permitted by the Code and thus will reduce the amount of distributions to shareholders which would otherwise be necessary to relieve the Fund of any liability for federal income tax. Pursuant to the Code, such capital loss carryforward will expire in 2017.
Under the recently enacted Regulated Investment Company Modernization Act of 2010, the Fund will be permitted to carry forward capital losses incurred in taxable years beginning after December 22, 2010, for an unlimited period. However, any losses incurred during those future years will be required to be utilized prior to the losses incurred in pre-enactment tax years. As a result of this ordering rule, pre-enactment capital loss carryforwards may be more likely to expire unused. Additionally, post-enactment capital losses that are carried forward will retain their character as either short-term or long-term capital losses rather than being considered all short-term as under previous law.
The Fund used capital loss carryforwards of $43,183,224 to offset taxable capital gains realized during the year ended October 31, 2011.
Annual Shareholder Report
5. INVESTMENT ADVISER FEE AND OTHER TRANSACTIONS WITH AFFILIATESInvestment Adviser Fee
Federated Equity Management Company of Pennsylvania is the Fund's investment adviser (the “Adviser”). The advisory agreement between the Fund and the Adviser provides for an annual fee equal to 0.75% of the Fund's average daily net assets. Subject to the terms described in the Expense Limitation note, the Adviser may voluntarily choose to waive any portion of its fee. For the year ended October 31, 2011, the Adviser voluntarily waived $453,173 of its fee. In addition, an affiliate of the Adviser reimbursed $217,562 of transfer and dividend disbursing agent fees and expenses.
Pursuant to a settlement with the New York Attorney General, the Adviser waived investment adviser fees in compliance with an Assurance of Discontinuance dated November 17, 2005. The net adviser fee was reduced to 0.4975% effective January 1, 2006 through December 31, 2010. The Adviser fee waived as a result of this settlement is included in the $453,173 mentioned in the previous paragraph.
Administrative Fee
Federated Administrative Services (FAS), under the Administrative Services Agreement, provides the Fund with administrative personnel and services. The fee paid to FAS is based on the average aggregate daily net assets of certain Federated funds as specified below:
| Administrative Fee | Average Aggregate Daily Net Assets
of the Federated Funds |
| 0.150% | on the first $5 billion |
| 0.125% | on the next $5 billion |
| 0.100% | on the next $10 billion |
| 0.075% | on assets in excess of $20 billion |
The administrative fee received during any fiscal year shall be at least $150,000 per portfolio and $40,000 per each additional class of Shares. Subject to the terms described in the Expense Limitation note, FAS may voluntarily choose to waive any portion of its fee. For the year ended October 31, 2011, the net fee paid to FAS was 0.076% of average daily net assets of the Fund. FAS waived $49,620 of its fee.
Distribution Services Fee
The Fund has adopted a Distribution Plan (the “Plan”) pursuant to Rule 12b-1 under the Act. Under the terms of the Plan, the Fund will compensate Federated Securities Corp. (FSC), the principal distributor, from the daily net assets of the Fund's Class B Shares, Class C Shares and Class R Shares to finance activities intended to result in the sale of these shares. The Plan provides that the Fund may incur distribution expenses at the following percentages of average daily net assets annually, to compensate FSC:
| Share Class Name | Percentage of Average Daily
Net Assets of Class |
| Class B Shares | 0.75% |
| Class C Shares | 0.75% |
| Class R Shares | 0.50% |
Annual Shareholder ReportSubject to the terms described in the Expense Limitation note, FSC may voluntarily choose to waive any portion of its fee. For the year ended October 31, 2011, distribution services fees for the Fund were as follows:
| Distribution Services
Fees Incurred |
| Class B Shares | $59,820 |
| Class C Shares | 88,928 |
| Class R Shares | 3,844 |
| TOTAL | $152,592 |
When FSC receives fees, it may pay some or all of them to financial intermediaries whose customers purchase shares. For the year ended October 31, 2011, FSC retained $8,878 of fees paid by the Fund.
Sales Charges
Front-end sales charges and contingent deferred sales charges (CDSC) do not represent expenses of the Fund. They are deducted from the proceeds of sales of Fund shares prior to investment or from redemption proceeds prior to remittance, as applicable. For the year ended October 31, 2011, FSC retained $9,194 in sales charges from the sale of Class A Shares. FSC also retained $1,846 and $757 of CDSC relating to redemptions of Class B Shares and Class C Shares.
Shareholder Services Fee
The Fund may pay fees (“Service Fees”) up to 0.25% of the average daily net assets of the Fund's Class A Shares, Class B Shares and Class C Shares to financial intermediaries or to Federated Shareholder Services Company (FSSC) for providing services to shareholders and maintaining shareholder accounts. Financial intermediaries may include a company affiliated with management of Federated Investors, Inc. A financial intermediary affiliated with management of Federated Investors, Inc. received $9,634 of Service Fees for the year ended October 31, 2011. Subject to the terms described in the Expense Limitation note, FSSC may voluntarily reimburse the Fund for Service Fees. For the year ended October 31, 2011, Service Fees for the Fund were as follows:
| Service
Fees
Incurred |
| Class A Shares | $676,114 |
| Class B Shares | 19,940 |
| Class C Shares | 28,570 |
| TOTAL | $724,624 |
For the year ended October 31, 2011, FSSC did not receive any fees paid by the Fund.
Annual Shareholder Report
Expense LimitationThe Adviser and its affiliates (which may include FSC, FAS and FSSC) have voluntarily agreed to waive their fees and/or reimburse expenses so that the total annual fund operating expenses (as shown in the financial highlights) paid by the Fund's Class A Shares, Class B Shares, Class C Shares, Class R Shares and Institutional Shares (after the voluntary waivers and/or reimbursements) will not exceed 1.22%, 1.97%, 1.97%, 1.72% and 0.97% (the “Fee Limit”), respectively, up to but not including the later of (the “Termination Date”): (a) January 1, 2013; or (b) the date of the Fund's next effective Prospectus. While the Adviser and its affiliates currently do not anticipate terminating or increasing these arrangements prior to the Termination Date, these arrangements may only be terminated or the Fee Limit increased prior to the Termination Date with the agreement of the Trustees. The Adviser previously agreed to maintain the management fee at 0.4975% for the period ended December 31, 2010, and this obligation expired on that date. Accordingly, the management fee waivers were reduced and the management fee of the Fund increased after December 31, 2010, subject to the Fee Limit for each Class of Shares reflected above.
General
Certain Officers and Trustees of the Fund are Officers and Directors or Trustees of the above companies.
Interfund Transactions
During the year ended October 31, 2011, the Fund engaged in purchase and sale transactions with funds that have a common investment adviser (or affiliated investment advisers), common Directors/Trustees, and/or common Officers. These purchase and sale transactions complied with Rule 17a-7 under the Act and amounted to $325,200 and $0, respectively.
Transactions Involving Affiliated Holdings
Affiliated holdings are mutual funds which are managed by the Adviser or an affiliate of the Adviser. The Adviser has agreed to reimburse the Fund for certain investment adviser fees as a result of transactions in other affiliated mutual funds. For the year ended October 31, 2011, the Adviser reimbursed $16,747. Transactions involving the affiliated holding during the year ended October 31, 2011, were as follows:
| Federated
Prime Value
Obligations Fund,
Institutional Shares |
| Balance of Shares Held 10/31/2010 | — |
| Purchases/Additions | 136,448,015 |
| Sales/Reductions | 125,850,493 |
| Balance of Shares Held 10/31/2011 | 10,597,522 |
| Value | $10,597,522 |
| Dividend Income | $9,370 |
6. EXPENSE Reduction
The Fund directs portfolio trades to a broker that in turn pays a portion of the Fund's operating expenses. For the year ended October 31, 2011, the Fund's expenses were reduced by $25,329 under these arrangements.
Annual Shareholder Report
7. Investment TRANSACTIONSPurchases and sales of investments, excluding long-term U.S. government securities and short-term obligations, for the year ended October 31, 2011, were as follows:
| Purchases | $576,168,256 |
| Sales | $646,490,501 |
8. LINE OF CREDIT
The Fund participates in a $100,000,000 unsecured, uncommitted revolving line of credit (LOC) agreement with PNC Bank. The LOC was made available for extraordinary or emergency purposes, primarily for financing redemption payments. Borrowings are charged interest at a rate offered to the Fund by PNC Bank at the time of the borrowing. As of October 31, 2011, there were no outstanding loans. During the year ended October 31, 2011, the Fund did not utilize the LOC.
9. INTERFUND LENDING
Pursuant to an Exemptive Order issued by the Securities and Exchange Commission, the Fund, along with other funds advised by subsidiaries of Federated Investors, Inc., may participate in an interfund lending program. This program provides an alternative credit facility allowing the Fund to borrow from other participating affiliated funds. As of October 31, 2011, there were no outstanding loans. During the year ended October 31, 2011, the program was not utilized.
10. RECENT ACCOUNTING PRONOUNCEMENTS
In April 2011, the Financial Accounting Standards Board (FASB) released Accounting Standards Update (ASU) No. 2011-03, “Reconsideration of Effective Control for Repurchase Agreements.” This ASU amends FASB Accounting Standards Codification (ASC) Topic 860, “Transfers and Servicing”; specifically the criteria required to determine whether a repurchase agreement and similar agreements should be accounted for as sales of financial assets or secured borrowings with commitments. This ASU is effective for fiscal years and interim periods beginning after December 15, 2011. At this time, management is evaluating the implications of adopting ASU No. 2011-03 and its impact on the Fund's financial statements and the accompanying notes, net assets and results of operations.
In addition, in May 2011, FASB released ASU No. 2011-04, “Amendments to Achieve Common Fair Value Measurement and Disclosure Requirements in U.S. GAAP and IFRSs.” This ASU amends FASB ASC Topic 820, “Fair Value Measurement,” to establish common requirements for measuring fair value and for disclosing information about fair value measurements in accordance with GAAP. This ASU is effective for fiscal years and interim periods beginning after December 15, 2011. At this time, management is evaluating the implications of adopting ASU No. 2011-04 and its impact on the Fund's financial statements and the accompanying notes.
Annual Shareholder Report Report of Independent Registered Public Accounting Firm
TO THE BOARD OF TRUSTEES OF THE FEDERATED EQUITY FUNDS AND SHAREHOLDERS OF Federated Mid cap growth strategies fund
We have audited the accompanying statement of assets and liabilities, including the portfolio of investments, of Federated Mid Cap Growth Strategies Fund (the “Fund”), a portfolio of Federated Equity Funds, as of October 31, 2011, and the related statement of operations for the year then ended, the statements of changes in net assets for each of the years or periods in the two-year period then ended and the financial highlights for each of the years in the five-year period then ended. These financial statements and financial highlights are the responsibility of the Fund's management. Our responsibility is to express an opinion on these financial statements and financial highlights based on our audits.
We conducted our audits in accordance with the standards of the Public Company Accounting Oversight Board (United States). Those standards require that we plan and perform the audit to obtain reasonable assurance about whether the financial statements and financial highlights are free of material misstatement. An audit includes examining, on a test basis, evidence supporting the amounts and disclosures in the financial statements. Our procedures included confirmation of securities owned as of October 31, 2011, by correspondence with the custodian, transfer agent and brokers, or by other appropriate auditing procedures. An audit also includes assessing the accounting principles used and significant estimates made by management, as well as evaluating the overall financial statement presentation. We believe that our audits provide a reasonable basis for our opinion.
In our opinion, the financial statements and financial highlights referred to above present fairly, in all material respects, the financial position of the Federated Mid Cap Growth Strategies Fund as of October 31, 2011, and the results of its operations for the year then ended, the changes in its net assets for each of the years in the two-year period then ended and the financial highlights for each of the years or periods in the five-year period then ended, in conformity with U.S. generally accepted accounting principles.
Boston, Massachusetts
December 23, 2011
Annual Shareholder Report Shareholder Expense Example (unaudited)
As a shareholder of the Fund, you incur two types of costs: (1) transaction costs, including sales charges (“loads”) on purchase or redemption payments; and (2) ongoing costs, including management fees and to the extent applicable, distribution (12b-1) fees and/or shareholder services fees and other Fund expenses. This Example is intended to help you to understand your ongoing costs (in dollars) of investing in the Fund and to compare these costs with the ongoing costs of investing in other mutual funds. It is based on an investment of $1,000 invested at the beginning of the period and held for the entire period from May 1, 2011 to October 31, 2011.
ACTUAL EXPENSES
The first section of the table below provides information about actual account values and actual expenses. You may use the information in this section, together with the amount you invested, to estimate the expenses that you incurred over the period. Simply divide your account value by $1,000 (for example, an $8,600 account value divided by $1,000 = 8.6), then multiply the result by the number in the first section under the heading entitled “Expenses Paid During Period” to estimate the expenses attributable to your investment during this period.
HYPOTHETICAL EXAMPLE FOR COMPARISON PURPOSES
The second section of the table below provides information about hypothetical account values and hypothetical expenses based on the Fund's actual expense ratio and an assumed rate of return of 5% per year before expenses, which is not the Fund's actual return. Thus, you should not use the hypothetical account values and expenses to estimate the actual ending account balance or your expenses for the period. Rather, these figures are required to be provided to enable you to compare the ongoing costs of investing in the Fund with other funds. To do so, compare this 5% hypothetical example with the 5% hypothetical examples that appear in the shareholder reports of the other funds.
Annual Shareholder Report
Please note that the expenses shown in the table are meant to highlight your ongoing costs only and do not reflect any transaction costs, such as sales charges (“loads”) on purchase or redemption payments. Therefore, the second section of the table is useful in comparing ongoing costs only, and will not help you determine the relative total costs of owning different funds. In addition, if these transaction costs were included, your costs would have been higher. | Beginning
Account Value
5/1/2011 | Ending
Account Value
10/31/2011 | Expenses Paid
During Period1 |
| Actual: | | | |
| Class A Shares | $1,000 | $856.40 | $5.71 |
| Class B Shares | $1,000 | $853.30 | $9.20 |
| Class C Shares | $1,000 | $853.40 | $9.20 |
| Class R Shares | $1,000 | $854.50 | $8.04 |
| Institutional Shares | $1,000 | $857.60 | $4.54 |
Hypothetical (assuming a 5% return
before expenses): | | | |
| Class A Shares | $1,000 | $1,019.06 | $6.21 |
| Class B Shares | $1,000 | $1,015.27 | $10.01 |
| Class C Shares | $1,000 | $1,015.27 | $10.01 |
| Class R Shares | $1,000 | $1,016.53 | $8.74 |
| Institutional Shares | $1,000 | $1,020.32 | $4.94 |
| 1 | Expenses are equal to the Fund's annualized net expense ratios, multiplied by the average account value over the period, multiplied by 184/365 (to reflect the one-half-year period). The annualized net expense ratios are as follows: |
| Class A Shares | 1.22% |
| Class B Shares | 1.97% |
| Class C Shares | 1.97% |
| Class R Shares | 1.72% |
| Institutional Shares | 0.97% |
Annual Shareholder Report Board of Trustees and Trust Officers
The Board of Trustees is responsible for managing the Trust's business affairs and for exercising all the Trust's powers except those reserved for the shareholders. The following tables give information about each Trustee and the senior officers of the Fund. Where required, the tables separately list Trustees who are “interested persons” of the Fund (i.e., “Interested” Trustees) and those who are not (i.e., “Independent” Trustees). Unless otherwise noted, the address of each person listed is Federated Investors Tower, 1001 Liberty Avenue, Pittsburgh, PA 15222. The address of all Independent Trustees listed is 4000 Ericsson Drive, Warrendale, PA 15086-7561; Attention: Mutual Fund Board. As of December 31, 2010, the Trust comprised 13 portfolio(s), and the Federated Fund Family consisted of 43 investment companies (comprising 136 portfolios). Unless otherwise noted, each Officer is elected annually. Unless otherwise noted, each Trustee oversees all portfolios in the Federated Fund Family and serves for an indefinite term. The Fund's Statement of Additional Information includes additional information about Trust Trustees and is available, without charge and upon request, by calling 1-800-341-7400.
Interested TRUSTEES Background
Name
Birth Date
Positions Held with Trust
Date Service Began | Principal Occupation(s) for Past Five Years,
Other Directorships Held and Previous Position(s) |
John F. Donahue*
Birth Date: July 28, 1924
Trustee
Began serving: April 1984 | Principal Occupations: Director or Trustee of the Federated Fund Family; Chairman and Director, Federated Investors, Inc.; Chairman of the Federated Fund Family's Executive Committee.
Previous Positions: Chairman of the Federated Fund Family; Trustee, Federated Investment Management Company; Chairman and Director, Federated Investment Counseling. |
J. Christopher Donahue*
Birth Date: April 11, 1949
President and Trustee
Began serving: January 2000 | Principal Occupations: Principal Executive Officer and President of the Federated Fund Family; Director or Trustee of some of the Funds in the Federated Fund Family; President, Chief Executive Officer and Director, Federated Investors, Inc.; Chairman and Trustee, Federated Investment Management Company; Trustee, Federated Investment Counseling; Chairman and Director, Federated Global Investment Management Corp.; Chairman, Federated Equity Management Company of Pennsylvania and Passport Research, Ltd. (investment advisory subsidiary of Federated); Trustee, Federated Shareholder Services Company; Director, Federated Services Company.
Previous Positions: President, Federated Investment Counseling; President and Chief Executive Officer, Federated Investment Management Company, Federated Global Investment Management Corp. and Passport Research, Ltd. |
| * | Family relationships and reasons for “interested” status: John F. Donahue is the father of J. Christopher Donahue; both are “interested” due to their beneficial ownership of shares of Federated Investors, Inc. and the positions they hold with Federated and its subsidiaries. |
Annual Shareholder ReportINDEPENDENT TRUSTEES Background
Name
Birth Date
Positions Held with Trust
Date Service Began | Principal Occupation(s) for Past Five Years,
Other Directorships Held, Previous Position(s) and Qualifications |
Nicholas P. Constantakis, CPA
Birth Date: September 3, 1939
Trustee
Began serving: February 1998 | Principal Occupation: Director or Trustee of the Federated Fund Family.
Other Directorship Held: Director and Chairman of the Audit Committee, Michael Baker Corporation (architecture, engineering and construction services).
Previous Position: Partner, Andersen Worldwide SC.
Qualifications: Public accounting and director experience. |
John F. Cunningham
Birth Date: March 5, 1943
Trustee
Began serving: January 1999 | Principal Occupation: Director or Trustee of the Federated Fund Family.
Other Directorships Held: Chairman, President and Chief Executive Officer, Cunningham & Co., Inc. (strategic business consulting); Trustee Associate, Boston College.
Previous Positions: Director, Redgate Communications and EMC Corporation (computer storage systems); Chairman of the Board and Chief Executive Officer, Computer Consoles, Inc.; President and Chief Operating Officer, Wang Laboratories; Director, First National Bank of Boston; Director, Apollo Computer, Inc.
Qualifications: Business management and director experience. |
Maureen Lally-Green
Birth Date: July 5, 1949
Trustee
Began serving: August 2009 | Principal Occupations: Director or Trustee of the Federated Fund Family; Director, Office of Church Relations, Diocese of Pittsburgh; Adjunct Professor of Law, Duquesne University School of Law.
Other Directorships Held: Director, Auberle; Trustee, St. Francis University; Director, Ireland Institute of Pittsburgh; Director, UPMC Mercy Hospital; Regent, St. Vincent Seminary; Director, Epilepsy Foundation of Western and Central Pennsylvania; Director, Saint Thomas More Society, Allegheny County.
Previous Position: Pennsylvania Superior Court Judge.
Qualifications: Legal and director experience. |
Peter E. Madden
Birth Date: March 16, 1942
Trustee
Began serving: November 1991 | Principal Occupation: Director or Trustee, and Chairman of the Board of Directors or Trustees, of the Federated Fund Family.
Previous Positions: Representative, Commonwealth of Massachusetts General Court; President, Chief Operating Officer and Director, State Street Bank and Trust Company and State Street Corporation (retired); Director, VISA USA and VISA International; Chairman and Director, Massachusetts Bankers Association; Director, Depository Trust Corporation; Director, The Boston Stock Exchange.
Qualifications: Business management, mutual fund services and director experience. |
Annual Shareholder ReportName
Birth Date
Positions Held with Trust
Date Service Began | Principal Occupation(s) for Past Five Years,
Other Directorships Held, Previous Position(s) and Qualifications |
Charles F. Mansfield, Jr.
Birth Date: April 10, 1945
Trustee
Began serving: January 1999 | Principal Occupations: Director or Trustee and Chairman of the Audit Committee of the Federated Fund Family; Management Consultant.
Previous Positions: Chief Executive Officer, PBTC International Bank; Partner, Arthur Young & Company (now Ernst & Young LLP); Chief Financial Officer of Retail Banking Sector, Chase Manhattan Bank; Senior Vice President, HSBC Bank USA (formerly Marine Midland Bank); Vice President, Citibank; Assistant Professor of Banking and Finance, Frank G. Zarb School of Business, Hofstra University; Executive Vice President, DVC Group, Inc. (marketing, communications and technology).
Qualifications: Banking, business management, education and director experience. |
R. James Nicholson
Birth Date: February 4, 1938
Trustee
Began serving: January 2008 | Principal Occupations: Director or Trustee of the Federated Fund Family; Senior Counsel, Brownstein Hyatt Farber Schrek, P.C.; Former Secretary of the U.S. Dept. of Veterans Affairs; Former U.S. Ambassador to the Holy See; Former Chairman of the Republican National Committee.
Other Directorships Held: Director, Horatio Alger Association; Director, The Daniels Fund, both charitable nonprofit organizations.
Previous Positions: Colonel, U.S. Army Reserve; Partner, Calkins, Kramer, Grimshaw and Harring, P.C.; General Counsel, Colorado Association of Housing and Building; Chairman and CEO, Nicholson Enterprises, Inc. (real estate holding company); Chairman and CEO, Renaissance Homes of Colorado.
Qualifications: Legal, government, business management and director experience. |
Thomas M. O'Neill
Birth Date: June 14, 1951
Trustee
Began serving: October 2006 | Principal Occupations: Director or Trustee of the Federated Fund Family; Sole Proprietor, Navigator Management Company (investment and strategic consulting).
Other Directorships Held: Board of Overseers, Children's Hospital of Boston; Visiting Committee on Athletics, Harvard College; Board of Directors, Medicines for Humanity.
Previous Positions: Chief Executive Officer and President, Managing Director and Chief Investment Officer, Fleet Investment Advisors; President and Chief Executive Officer, Aeltus Investment Management, Inc.; General Partner, Hellman, Jordan Management Co., Boston, MA; Chief Investment Officer, The Putnam Companies, Boston, MA; Credit Analyst and Lending Officer, Fleet Bank; Director and Consultant, EZE Castle Software (investment order management software); Director, Midway Pacific (lumber).
Qualifications: Business management, mutual fund, director and investment experience. |
Annual Shareholder ReportName
Birth Date
Positions Held with Trust
Date Service Began | Principal Occupation(s) for Past Five Years,
Other Directorships Held, Previous Position(s) and Qualifications |
John S. Walsh
Birth Date: November 28, 1957
Trustee
Began serving: January 1999 | Principal Occupations: Director or Trustee of the Federated Fund Family; President and Director, Heat Wagon, Inc. (manufacturer of construction temporary heaters); President and Director, Manufacturers Products, Inc. (distributor of portable construction heaters); President, Portable Heater Parts, a division of Manufacturers Products, Inc.
Previous Position: Vice President, Walsh & Kelly, Inc.
Qualifications: Business management and director experience. |
James F. Will
Birth Date: October 12, 1938
Trustee
Began serving: April 2006 | Principal Occupations: Director or Trustee of the Federated Fund Family; formerly, Vice Chancellor and President, Saint Vincent College.
Other Directorships Held: Trustee, Saint Vincent College; Director, Alleghany Corporation; Trustee, Wheeling Jesuit University; Director, Liberty Tire Recycling.
Previous Positions: Chairman, President and Chief Executive Officer, Armco, Inc.; President and Chief Executive Officer, Cyclops Industries; President and Chief Operating Officer, Kaiser Steel Corporation.
Qualifications: Business management, education and director experience. |
OFFICERS
Name
Birth Date
Address
Positions Held with Trust
Date Service Began | Principal Occupation(s) for Past Five Years
and Previous Position(s) |
John W. McGonigle
Birth Date: October 26, 1938
EXECUTIVE VICE PRESIDENT AND SECRETARY
Began serving: April 1984 | Principal Occupations: Executive Vice President and Secretary of the Federated Fund Family; Vice Chairman, Executive Vice President, Secretary and Director, Federated Investors, Inc.
Previous Positions: Trustee, Federated Investment Management Company and Federated Investment Counseling; Director, Federated Global Investment Management Corp., Federated Services Company and Federated Securities Corp. |
Richard A. Novak
Birth Date: December 25, 1963
Treasurer
Began serving: January 2006 | Principal Occupations: Principal Financial Officer and Treasurer of the Federated Fund Family; Senior Vice President, Federated Administrative Services; Financial and Operations Principal for Federated Securities Corp., Edgewood Services, Inc. and Southpointe Distribution Services, Inc.
Previous Positions: Controller of Federated Investors, Inc.; Vice President, Finance of Federated Services Company; held various financial management positions within The Mercy Hospital of Pittsburgh; Auditor, Arthur Andersen & Co. |
Annual Shareholder ReportName
Birth Date
Address
Positions Held with Trust
Date Service Began | Principal Occupation(s) for Past Five Years
and Previous Position(s) |
Richard B. Fisher
Birth Date: May 17, 1923
Vice President
Began serving: April 1984 | Principal Occupations: Vice Chairman or Vice President of some of the Funds in the Federated Fund Family; Vice Chairman, Federated Investors, Inc.; Chairman, Federated Securities Corp.
Previous Positions: President and Director or Trustee of some of the Funds in the Federated Fund Family; Executive Vice President, Federated Investors, Inc.; Director and Chief Executive Officer, Federated Securities Corp. |
Brian P. Bouda
Birth Date: February 28, 1947
CHIEF COMPLIANCE OFFICER AND SENIOR VICE PRESIDENT
Began serving: August 2004 | Principal Occupations: Senior Vice President and Chief Compliance Officer of the Federated Fund Family; Vice President and Chief Compliance Officer of Federated Investors, Inc. and Chief Compliance Officer of its subsidiaries. Mr. Bouda joined Federated in 1999 and is a member of the American Bar Association and the State Bar Association of Wisconsin. |
Stephen F. Auth
Birth Date: September 3, 1956
450 Lexington Avenue
Suite 3700
New York, NY 10017-3943
CHIEF INVESTMENT OFFICER
Began serving: November 2002 | Principal Occupations: Mr. Auth is Chief Investment Officer of this Fund and various other Funds in the Federated Fund Family; Executive Vice President, Federated Investment Counseling, Federated Global Investment Management Corp. and Federated Equity Management Company of Pennsylvania.
Previous Positions: Executive Vice President, Federated Investment Management Company, and Passport Research, Ltd. (investment advisory subsidiary of Federated); Senior Vice President, Global Portfolio Management Services Division; Senior Vice President, Federated Investment Management Company and Passport Research, Ltd.; Senior Managing Director and Portfolio Manager, Prudential Investments. |
James E. Grefenstette
Birth Date: November 7, 1962
Vice President
Began serving: February 2011 | Principal Occupations: James E. Grefenstette has been the Fund's Senior Portfolio Manager since December 2009. He is Vice President of the Fund's Adviser. Mr. Grefenstette joined Federated in December 2009. Previously, he served as founder and managing partner of Blazer Investment Advisers from April 2008 until December 2009, and as founder and managing partner of Aspirante Capital Management, a long/short hedge fund, from August 2006 until September 2007. Prior to that, Mr. Grefenstette worked at Federated as Portfolio Manager of the Fund from 1994 until June 2006 and as Senior Vice President of the Fund's Adviser from January 2000 until July 2006. He also served as Vice President and Assistant Vice President of the Fund's Adviser from 1994 until 1999. Mr. Grefenstette has received the Chartered Financial Analyst designation; he received his M.S. in Industrial Administration from Carnegie Mellon University and his BSBA from Georgetown University. |
Annual Shareholder Report Evaluation and Approval of Advisory Contract – May 2011
Federated Mid cap growth strategies fund (the “Fund”)
The Fund's Board reviewed the Fund's investment advisory contract at meetings held in May 2011. The Board's decision regarding the contract reflects the exercise of its business judgment on whether to continue the existing arrangements.
In this connection, the Federated Funds' Board had previously appointed a Senior Officer, whose duties include specified responsibilities relating to the process by which advisory fees are to be charged to a Federated fund. The Senior Officer has the authority to retain consultants, experts, or staff as may be reasonably necessary to assist in the performance of his duties, reports directly to the Board, and may be terminated only with the approval of a majority of the independent members of the Board. The Senior Officer prepared and furnished to the Board an independent, written evaluation that covered topics discussed below (the “Evaluation”). The Board considered that Evaluation, along with other information, in deciding to approve the advisory contract.
During its review of the contract, the Board considered compensation and benefits received by the Adviser. This included the fees received for services provided to the Fund by other entities in the Federated organization and research services (if any) received by the Adviser from brokers that execute Federated fund trades, as well as advisory fees. The Board is also familiar with and considered judicial decisions concerning allegedly excessive investment advisory fees, which have indicated that the following factors may be relevant to an Adviser's fiduciary duty with respect to its receipt of compensation from a fund: the nature and quality of the services provided by the Adviser, including the performance of the fund; the Adviser's cost of providing the services; the extent to which the Adviser may realize “economies of scale” as a fund grows larger; any indirect benefits that may accrue to the Adviser and its affiliates as a result of the Adviser's relationship with a fund; performance and expenses of comparable funds; and the extent to which the independent Board members are fully informed about all facts the Board deems relevant bearing on the Adviser's services and fees. The Board further considered management fees (including any components thereof) charged to institutional and other clients of the Adviser for what might be viewed as like services, and the cost to the Adviser and its affiliates of supplying services pursuant to the management fee agreements, excluding any intra-corporate profit and profit margins of the Adviser and its affiliates for supplying such services. The Board was aware of these factors and was guided by them in its review of the Fund's advisory contract to the extent it considered them to be appropriate and relevant, as discussed further below.
Annual Shareholder Report
The Board considered and weighed these circumstances in light of its substantial accumulated experience in governing the Fund and working with Federated on matters relating to the Federated funds, and was assisted in its deliberations by independent legal counsel. Throughout the year, the Board has requested and received substantial and detailed information about the Fund and the Federated organization that was in addition to the extensive materials that comprise and accompany the Senior Officer's Evaluation. Federated provided much of this information at each regular meeting of the Board, and furnished additional information in connection with the particular meeting at which the Board's formal review of the advisory contract occurred. Between regularly scheduled meetings, the Board also received information on particular matters as the need arose. Thus, the Board's consideration of the advisory contract included review of the Senior Officer's Evaluation, accompanying data and additional information covering such matters as: the Adviser's investment philosophy, revenue, profitability, personnel and processes; investment and operating strategies; the Fund's short- and long-term performance (in absolute terms, both on a gross basis and net of expenses, as well as in relationship to its particular investment program and certain competitor or “peer group” funds and/or other benchmarks, as appropriate), and comments on the reasons for performance; the Fund's investment objectives; the Fund's expenses (including the advisory fee itself and the overall expense structure of the Fund, both in absolute terms and relative to similar and/or competing funds, with due regard for contractual or voluntary expense limitations); the use and allocation of brokerage commissions derived from trading the Fund's portfolio securities (if any); and the nature, quality and extent of the advisory and other services provided to the Fund by the Adviser and its affiliates. The Board also considered the preferences and expectations of Fund shareholders and their relative sophistication; the continuing state of competition in the mutual fund industry and market practices; the range of comparable fees for similar funds in the mutual fund industry; the Fund's relationship to the Federated family of funds which include a comprehensive array of funds with different investment objectives, policies and strategies which are available for exchange without the incurrence of additional sales charges; compliance and audit reports concerning the Federated funds and the Federated companies that service them (including communications from regulatory agencies), as well as Federated's responses to any issues raised therein; and relevant developments in the mutual fund industry and how the Federated funds and/or Federated are responding to them. The Board's evaluation process is evolutionary. The criteria considered and the emphasis placed on relevant criteria change in recognition of changing circumstances in the mutual fund marketplace.With respect to the Fund's performance and expenses in particular, the Board has found the use of comparisons to other mutual funds with comparable investment programs to be relevant, given the high degree of competition in the mutual fund business. The Board focused on comparisons with other similar Annual Shareholder Report
mutual funds more heavily than non-mutual fund products or services because it is believed that they are more relevant. For example, other mutual funds are the products most like the Fund, they are readily available to Fund shareholders as alternative investment vehicles, and they are the type of investment vehicle in fact chosen and maintained by the Fund's investors. The range of their fees and expenses therefore appears to be a generally reliable indication of what consumers have found to be reasonable in the precise marketplace in which the Fund competes. The Fund's ability to deliver competitive performance when compared to its peer group was a useful indicator of how the Adviser is executing the Fund's investment program, which in turn assisted the Board in reaching a conclusion that the nature, extent, and quality of the Adviser's investment management services were such as to warrant continuation of the advisory contract. In this regard, the Senior Officer has reviewed Federated's fees for providing advisory services to products outside the Federated family of funds (e.g., institutional and separate accounts). He concluded that mutual funds and institutional accounts are inherently different products. Those differences include, but are not limited to, different types of targeted investors; being subject to different laws and regulations; different legal structures; different average account sizes; different associated costs; different portfolio management techniques made necessary by different cash flows; and portfolio manager time spent in review of securities pricing. The Senior Officer did not consider these fee schedules to be determinative in judging the appropriateness of mutual fund advisory contracts.The Senior Officer reviewed information compiled by Federated, using data supplied by independent fund ranking organizations, regarding the performance of, and fees charged by, other mutual funds, noting his view that comparisons to fund peer groups are relevant in judging the reasonableness of proposed fees.
The Fund's performance fell below the median of the relevant peer group for the one-year, three-year and five-year periods covered by the Evaluation. The Board discussed the Fund's performance with the Adviser and recognized the efforts being undertaken by the Adviser. The Board will continue to monitor these efforts and the performance of the Fund.
The Board also received financial information about Federated, including information regarding the compensation and benefits Federated derived from its relationships with the Federated funds. This information covered not only the fees under the advisory contracts, but also fees received by Federated's subsidiaries for providing other services to the Federated funds under separate contracts (e.g., for serving as the Federated funds' administrator). The information also detailed any indirect benefit Federated may derive from its receipt of research services from brokers who execute Federated fund trades. In addition, the Board considered the fact that, in order for a fund to be competitive in the marketplace, Federated and its affiliates frequently waived fees Annual Shareholder Report
and/or reimbursed expenses and have disclosed to fund investors and/or indicated to the Board their intention to do so in the future, where appropriate. Moreover, the Board receives regular reporting as to the institution or elimination of these voluntary waivers.Federated furnished information, requested by the Senior Officer, that reported revenues on a fund-by-fund basis and made estimates of the allocation of expenses on a fund-by-fund basis, using allocation methodologies specified by the Senior Officer. The Senior Officer noted that, although they may apply consistent allocation processes, the inherent difficulties in allocating costs (and the unavoidable arbitrary aspects of that exercise) and the lack of consensus on how to allocate those costs may render such allocation information unreliable. The allocation information was considered in the analysis by the Board but was determined to be of limited use.
The Board and the Senior Officer also reviewed information compiled by Federated comparing profitability information for Federated to other publicly held fund management companies. In this regard, the Senior Officer noted the limited availability of such information, but nonetheless concluded that Federated's profit margins did not appear to be excessive and the Board agreed.
The Senior Officer's Evaluation also discussed the notion of possible realization of “economies of scale” as a fund grows larger. The Board considered in this regard that the Adviser has made significant and long-term investments in areas that support all of the Federated funds, such as personnel and processes for the portfolio management, compliance, internal audit, and risk management functions; and systems technology; and that the benefits of these efforts (as well as any economies, should they exist) were likely to be enjoyed by the fund complex as a whole. Finally, the Board also noted the absence of any applicable regulatory or industry guidelines on this subject, which (as discussed in the Senior Officer's Evaluation) is compounded by the lack of any common industry practice or general pattern with respect to structuring fund advisory fees with “breakpoints” that serve to reduce the fee as the fund attains a certain size. The Senior Officer did not recommend institution of breakpoints in pricing Federated's fund advisory services at this time.
It was noted in the materials for the Board meeting that for the period covered by the Evaluation, the Fund's investment advisory fee, after waivers and expense reimbursements, if any, was below the median of the relevant peer group. The Board reviewed the fees and other expenses of the Fund with the Adviser and was satisfied that the overall expense structure of the Fund remained competitive.
The Senior Officer noted that, considering the totality of the circumstances, and all of the factors referenced within his Evaluation, he had concluded that, subject to comments and recommendations made within his Evaluation, his observations and the information accompanying the Evaluation supported a finding by the Board that the management fees for each of the funds are reasonable and that Federated appeared to provide appropriate administrative Annual Shareholder Report
services to the Fund for the fees paid. Under these circumstances, no changes were recommended to, and no objection was raised to, the continuation of the Fund's advisory contract. The Board concluded that the nature, quality and scope of services provided the Fund by the Adviser and its affiliates were satisfactory.In its decision to continue an existing investment advisory contract, the Board was mindful of the potential disruptions of the Fund's operations and various risks, uncertainties and other effects that could occur as a result of a decision to terminate or not renew an advisory contract. In particular, the Board recognized that many shareholders have invested in the Fund on the strength of the Adviser's industry standing and reputation and with the expectation that the Adviser will have a continuing role in providing advisory services to the Fund. Thus, the Board's approval of the advisory contract reflected the fact that it is the shareholders who have effectively selected the Adviser by virtue of having invested in the Fund.
The Board based its decision to approve the advisory contract on the totality of the circumstances and relevant factors and with a view to past and future long-term considerations. Not all of the factors and considerations identified above were necessarily relevant to the Fund, nor did the Board consider any one of them to be determinative. With respect to the factors that were relevant, the Board's decision to approve the contract reflects its determination that Federated's performance and actions provided a satisfactory basis to support the decision to continue the existing arrangements.
Annual Shareholder Report Voting Proxies on Fund Portfolio Securities
A description of the policies and procedures that the Fund uses to determine how to vote proxies, if any, relating to securities held in the Fund's portfolio is available, without charge and upon request, by calling 1-800-341-7400. A report on “Form N-PX” of how the Fund voted any such proxies during the most recent 12-month period ended June 30 is available from Federated's website at FederatedInvestors.com. To access this information from the home page, select “All” under “Asset Classes.” Select a fund name and share class, if applicable, to go to the Fund Overview page. On the Fund Overview page, select the “Documents” tab. At the bottom of that page, select “Proxy Voting Record Report (Form N-PX).” Form N-PX filings are also available at the SEC's website at www.sec.gov.
Quarterly Portfolio Schedule
The Fund files with the SEC a complete schedule of its portfolio holdings, as of the close of the first and third quarters of its fiscal year, on “Form N-Q.” These filings are available on the SEC's website at www.sec.gov and may be reviewed and copied at the SEC's Public Reference Room in Washington, DC. (Call 1-800-SEC-0330 for information on the operation of the Public Reference Room.) You may also access this information from the “Products” section of Federated's website at FederatedInvestors.com. From the home page, select “All” under “Asset Classes.” Select a fund name and share class, if applicable, to go to the Fund Overview page. On the Fund Overview page, select the “Documents” tab. At the bottom of that page, select “Form N-Q.”
Annual Shareholder ReportMutual funds are not bank deposits or obligations, are not guaranteed by any bank and are not insured or guaranteed by the U.S. government, the Federal Deposit Insurance Corporation, the Federal Reserve Board or any other government agency. Investment in mutual funds involves investment risk, including the possible loss of principal.
This Report is authorized for distribution to prospective investors only when preceded or accompanied by the Fund's Prospectus, which contains facts concerning its objective and policies, management fees, expenses and other information.
Federated Mid Cap Growth Strategies Fund
Federated Investors Funds
4000 Ericsson Drive
Warrendale, PA 15086-7561
Contact us at FederatedInvestors.com
or call 1-800-341-7400.
Federated Securities Corp., Distributor
Cusip 314172107
Cusip 314172206
Cusip 314172305
Cusip 314172529
Cusip 314172198
G01228-08 (12/11)
Federated is a registered trademark of Federated Investors, Inc.
2011 © Federated Investors, Inc.
| | Annual Shareholder Report |
| | October 31, 2011 |
|
| Share Class | Ticker |
| A | SVAAX |
| C | SVACX |
| Institutional | SVAIX |
Federated Strategic Value Dividend Fund
Fund Established 2005
A Portfolio of Federated Equity Funds
Dear Valued Shareholder,
I am pleased to present the Annual Shareholder Report for your fund covering the period from November 1, 2010 through October 31, 2011. This report includes Management's Discussion of Fund Performance, a complete listing of your fund's holdings, performance information and financial statements along with other important fund information.
In addition, our website, FederatedInvestors.com, offers easy access to Federated resources that include timely fund updates, economic and market insights from our investment strategists, and financial planning tools. We invite you to register to take full advantage of its capabilities.
Thank you for investing with Federated. I hope you find this information useful and look forward to keeping you informed.
Sincerely,
J. Christopher Donahue, President
Not FDIC Insured May Lose Value No Bank Guarantee
CONTENTS
Management Discussion of Fund Performance
The Fund's total return, based on net asset value, for the fiscal year ended October 31, 2011, was 11.50% for the Class A Shares, 10.67% for the Class C Shares and 11.48% for the Institutional Shares. Although the Fund is not a benchmark-driven strategy, this compares to a return of 12.9% for the Dow Jones Select Dividend Index,1 which attempts to reflect the domestic dividend-paying universe, and a return of 8.1% for the Standard & Poor's 500 Index,2 representative of the broad securities market.
MARKET OVERVIEW
The fiscal year began with an equity rally after a lull in November 2010. Major indices posted their strongest December in almost two decades as investors focused on data suggestive of a recovery. This was mainly driven by the Federal government's delivery of a bill that not only extended the Bush tax cuts for two years and jobless benefits for an additional 13 months, but also provided a one-year, two-percentage-point reduction in employee Social Security payroll taxes. Combined, the fiscal stimulus was valued at roughly $900 billion, larger than the original stimulus passed in early 2009.
While the outlook seemed brighter, it fizzled quickly as 2011 had a rough start. A devastating earthquake, tsunami and nuclear disaster hit Japan and a war in Libya led by Moammar Gadhafi escalated to include the involvement of U.S. and other NATO forces. We also saw consumer confidence plunge amid rising gasoline prices and oil-price volatility. This negative sentiment continued into the third quarter as the labor market struggled and several key regional indicators unexpectedly slipped into negative territory, notably the Philadelphia and New York Federal Reserve manufacturing indices. On the geopolitical front, the U.S. debt ceiling showdown loomed over the market, with the outcome a potential game-changer.
The fiscal year ended with the equity markets rallying in October on modestly better-than-expected domestic growth, a tentative euro-zone bailout plan and signs that China may avoid a hard landing. News that the 17-member European Union countries were able to reach consensus on a plan to assist Greece, other debt-laden peripheral countries and major European banks that had been left holding a lot of that debt was viewed positively. However, this sentiment cooled a bit as limited details dribbled out and concerns arose anew over the plan's viability. All this said, domestic, economic and employment growth remained subpar relative to past recoveries, housing continued to bounce around a bottom, interest rates were still near historic lows and consumer attitudes remained mired in recession levels.
Annual Shareholder Report
FUND PERFORMANCESteady on its course, the Fund continued to meet its objectives of delivering high dividend income and dividend growth to investors.3 The Fund ended its fiscal year with a current dividend yield of 4.8% (a generous figure in comparison to the broad market's 2.2% yield) and a 30-day SEC yield of 3.4% for Class A Shares.4 Additionally, dividend growth continued to develop, driven by the 41 dividend increases by holdings in the Fund. Among the companies who raised their dividends within the Fund, nine increased their distributions in excess of 10%. That includes Chevron Corp., BCE Inc. and Reynolds American, Inc., all of which raised their dividends twice in the period, bringing their year-over-year dividend increases to 12.5%, 13.1% and 14.3% respectively.
The Fund primarily invests in high yield, beta, high quality holdings which investors have recently favored since the escalation of global debt concerns. These investment types contributed positively to the Fund's performance, as did its large investment in the dividend-friendly Consumer Staples sector. Consumer Staples returned 17.2% for the Fund with tobacco stocks performing particularly well. Lorillard Inc., Reynolds American Inc. and Philip Morris International Inc. saw the highest returns, delivering 36.8%, 26.4% and 24.6% respectively. The Fund also benefited from the performance of its HealthCare and Utilities holdings. Dominion Resources Inc. and Bristol Myers Squibb Co. led the way in each of those sectors with returns of 23.8% and 23.0%. The Financials sector, which continued to struggle, was the only sector to produce a negative contribution. As a final point, hedging foreign currency risk at the beginning of the period contributed 0.2% to total return.
| 1 | The Dow Jones Select Dividend Index is a dividend-weighted index intended to represent the 100 stocks in the Dow Jones U.S. Total Market Index that have the highest indicated annual dividend yield. The index is unmanaged and unlike the Fund is not affected by cash flows. It is not possible to invest directly in an index. |
| 2 | The S&P 500 Index is an unmanaged, capitalization-weighted index of 500 stocks designed to measure performance of the broad domestic economy through changes in the aggregate market value of 500 stocks representing all major industries. The index is unmanaged and unlike the Fund is not affected by cash flows. It is not possible to invest directly in an index. |
| 3 | There are no guarantees that dividend paying stocks will continue to pay dividends. In addition, dividend paying stocks many not experience the same capital appreciation potential as non-dividend paying stocks. |
| 4 | In the absence of temporary expense waivers or reimbursements the 30-day SEC yield would have been 3.28%. The dividend yield represents the average yield of the underlying securities within the portfolio. |
Annual Shareholder ReportFUND PERFORMANCE AND GROWTH OF A $10,000 INVESTMENT
The Average Annual Total Return table below shows returns for each class averaged over the stated periods. The graphs below illustrate the hypothetical investment of $10,0001 in the Federated Strategic Value Dividend Fund (the “Fund”) from March 30, 2005 (start of performance) to October 31, 2011, compared to the Standard & Poor's Index (S&P 500)2 and the Dow Jones Select Dividend Index (DJSDI).2
Average Annual Total Returns for the Period Ended 10/31/2011
(returns reflect all applicable sales charges and contingent sales charge as specified below in footnote #1)
| Share Class | 1 Year | 5 Years | Start of
Performance* |
| Class A Shares | 5.46% | -1.41% | 3.32% |
| Class C Shares | 9.67% | -1.03% | 3.47% |
| Institutional Shares | 11.48% | -0.07% | 4.47% |
| * | The Fund's start of performance date was March 30, 2005. |
Performance data quoted represents past performance which is no guarantee of future results. Investment return and principal value will fluctuate so that an investor's shares, when redeemed, may be worth more or less than their original cost. Mutual fund performance changes over time and current performance may be lower or higher than what is stated. For current to the most recent month-end performance and after-tax returns, visit FederatedInvestors.com or call 1-800-341-7400. Returns shown do not reflect the deduction of taxes that a shareholder would pay on Fund distributions or the redemption of Fund shares. Mutual funds are not obligations of or guaranteed by any bank and are not federally insured.
Annual Shareholder Report
Growth of a $10,000 Investment – Class A shares| Federated Strategic Value Dividend Fund - Class A Shares | C000026746 | S&P 500 | DJSDI |
| 3/30/2005 | 9,450 | 10,000 | 10,000 |
| 10/31/2005 | 10,029 | 10,320 | 9,322 |
| 10/31/2006 | 12,588 | 12,008 | 10,795 |
| 10/31/2007 | 13,463 | 13,756 | 11,359 |
| 10/31/2008 | 9,407 | 8,791 | 8,179 |
| 10/31/2009 | 9,436 | 9,652 | 7,496 |
| 10/31/2010 | 11,119 | 11,246 | 9,244 |
| 10/31/2011 | 12,398 | 12,156 | 10,440 |
41 graphic description end -->
- Total returns shown include the maximum sales charge of 5.50% ($10,000 investment minus $550 sales charge = $9,450).
Growth of a $10,000 Investment – Class C shares
| Federated Strategic Value Dividend Fund - Class C Shares | C000026747 | S&P 500 | DJSDI |
| 3/30/2005 | 10,000 | 10,000 | 10,000 |
| 10/31/2005 | 10,592 | 10,320 | 9,322 |
| 10/31/2006 | 13,191 | 12,008 | 10,795 |
| 10/31/2007 | 14,003 | 13,756 | 11,359 |
| 10/31/2008 | 9,722 | 8,791 | 8,179 |
| 10/31/2009 | 9,655 | 9,652 | 7,496 |
| 10/31/2010 | 11,317 | 11,246 | 9,244 |
| 10/31/2011 | 12,524 | 12,156 | 10,440 |
41 graphic description end -->
- Total returns shown include the maximum contingent deferred sales charge of 1.00%, as applicable.
Annual Shareholder ReportGrowth of a $10,000 Investment – institutional Shares
| Federated Strategic Value Dividend Fund - Institutional Shares | C000026748 | S&P 500 | DJSDI |
| 3/30/2005 | 10,000 | 10,000 | 10,000 |
| 10/31/2005 | 10,645 | 10,320 | 9,322 |
| 10/31/2006 | 13,388 | 12,008 | 10,795 |
| 10/31/2007 | 14,352 | 13,756 | 11,359 |
| 10/31/2008 | 10,057 | 8,791 | 8,179 |
| 10/31/2009 | 10,113 | 9,652 | 7,496 |
| 10/31/2010 | 11,967 | 11,246 | 9,244 |
| 10/31/2011 | 13,341 | 12,156 | 10,440 |
41 graphic description end -->
| 1 | Represents a hypothetical investment of $10,000 in the Fund after deducting applicable sales charges: For Class A Shares, the maximum sales charge of 5.50% ($10,000 investment minus $550 sales charge = $9,450); for Class C Shares, a 100% contingent deferred sales charge would be applied to on any redemption less than one year from the purchase date. The Fund's performance assumes the reinvestment of all dividends and distributions. The S&P 500 and DJSDI have been adjusted to reflect reinvestment of dividends on securities in the indexes. |
| 2 | The S&P 500 is a capitalization-weighted index of 500 stocks designed to measure performance of the broad domestic economy through changes in the aggregate market value of 500 stocks representing all major industries. The DJSDI is a dividend-weighted index intended to represent the 100 stocks in the Dow Jones U.S. Total Market Index that have the highest indicated annual dividend yield. The S&P 500 and the DJSDI are not adjusted to reflect sales loads, expenses or other fees that the Securities and Exchange Commission requires to be reflected in the Fund's performance. The indexes are unmanaged and, unlike the Fund, are not affected by cash flows. It is not possible to invest in an index . |
Annual Shareholder Report Portfolio of Investments Summary Table (unaudited)
At October 31, 2011, the Fund's sector composition1 was as follows:
| Sector Composition | Percentage of
Total Net Assets |
| Consumer Staples | 27.2% |
| Health Care | 21.2% |
| Telecommunication Services | 19.3% |
| Utilities | 16.0% |
| Energy | 11.4% |
| Consumer Discretionary | 2.0% |
| Financials | 1.3% |
| Cash Equivalents2 | 1.8% |
| Other Assets and Liabilities — Net3 | (0.2)% |
| TOTAL | 100.0% |
| 1 | Except for Cash Equivalents and Other Assets and Liabilities, sector classifications are based upon, and individual portfolio securities are assigned to, the classifications of the Global Industry Classification Standard (GICS) except that the adviser assigns a classification to securities not classified by the GICS and to securities for which the adviser does not have access to the classification made by the GICS. |
| 2 | Cash Equivalents include any investments in money market mutual funds and/or overnight repurchase agreements. |
| 3 | Assets, other than investments in securities, less liabilities. See Statement of Assets and Liabilities. |
Annual Shareholder Report Portfolio of Investments
October 31, 2011
| Shares | | | Value |
| | COMMON STOCKS – 98.4% | |
| | Consumer Discretionary – 2.0% | |
| 969,625 | | McDonald's Corp. | 90,029,681 |
| | Consumer Staples – 27.2% | |
| 4,935,385 | | Altria Group, Inc. | 135,969,857 |
| 3,398,100 | | Avon Products, Inc. | 62,117,268 |
| 1,716,100 | | General Mills, Inc. | 66,121,333 |
| 2,347,570 | | H.J. Heinz Co. | 125,454,141 |
| 1,223,500 | | Kellogg Co. | 66,325,935 |
| 1,846,725 | | Kimberly-Clark Corp. | 128,735,200 |
| 352,760 | | Lorillard, Inc. | 39,036,421 |
| 877,700 | | PepsiCo, Inc. | 55,251,215 |
| 1,944,785 | | Philip Morris International, Inc. | 135,882,128 |
| 2,267,770 | | Procter & Gamble Co. | 145,114,602 |
| 2,934,762 | | Reynolds American, Inc. | 113,516,594 |
| 413,175 | | The Coca-Cola Co. | 28,228,116 |
| 4,358,302 | | Unilever PLC | 145,483,968 |
| | TOTAL | 1,247,236,778 |
| | Energy – 11.4% | |
| 481,980 | | Chevron Corp. | 50,631,999 |
| 2,132,055 | | ConocoPhillips | 148,497,631 |
| 4,870,425 | | Royal Dutch Shell PLC, Class B | 174,786,508 |
| 2,870,840 | | Total S.A. | 150,126,222 |
| | TOTAL | 524,042,360 |
| | Financials – 1.3% | |
| 951,000 | | Cincinnati Financial Corp. | 27,521,940 |
| 2,513,200 | | New York Community Bancorp, Inc. | 33,450,692 |
| | TOTAL | 60,972,632 |
| | Health Care – 21.2% | |
| 2,824,000 | | Abbott Laboratories | 152,128,880 |
| 3,520,000 | | AstraZeneca PLC | 168,082,384 |
| 4,956,815 | | Bristol-Myers Squibb Co. | 156,585,786 |
| 4,474,115 | | Eli Lilly & Co. | 166,258,113 |
| 7,076,473 | | GlaxoSmithKline PLC | 158,615,837 |
| 2,621,715 | | Johnson & Johnson | 168,812,229 |
| | TOTAL | 970,483,229 |
Annual Shareholder Report| Shares | | | Value |
| | Telecommunication Services – 19.3% | |
| 6,332,145 | | AT&T, Inc. | 185,595,170 |
| 2,160,910 | | BCE, Inc. | 85,655,936 |
| 4,141,230 | | CenturyLink, Inc. | 146,019,770 |
| 3,620,198 | | Telefonica SA | 77,236,761 |
| 4,267,255 | | Verizon Communications, Inc. | 157,803,090 |
| 62,768,874 | | Vodafone Group PLC | 174,075,839 |
| 4,936,785 | | Windstream Corp. | 60,080,673 |
| | TOTAL | 886,467,239 |
| | Utilities – 16.0% | |
| 521,500 | | Consolidated Edison Co. | 30,179,205 |
| 466,895 | | Dominion Resources, Inc. | 24,087,113 |
| 8,540,600 | | Duke Energy Corp. | 174,399,052 |
| 16,274,999 | | National Grid PLC | 161,200,889 |
| 3,014,000 | | PPL Corp. | 88,521,180 |
| 2,700,000 | | Pepco Holdings, Inc. | 53,460,000 |
| 534,900 | | Pinnacle West Capital Corp. | 24,380,742 |
| 790,040 | | SCANA Corp. | 33,402,891 |
| 3,333,528 | | Southern Co. | 144,008,410 |
| | TOTAL | 733,639,482 |
| | TOTAL COMMON STOCKS
(IDENTIFIED COST $4,194,413,477) | 4,512,871,401 |
| | MUTUAL FUND – 1.8% | |
| 82,711,312 | 1,2 | Federated Prime Value Obligations Fund, Institutional Shares, 0.18% (AT NET ASSET VALUE) | 82,711,312 |
| | TOTAL INVESTMENTS — 100.2%
(IDENTIFIED COST $4,277,124,789)3 | 4,595,582,713 |
| | OTHER ASSETS AND LIABILITIES - NET — (0.2)%4 | (9,877,641) |
| | TOTAL NET ASSETS — 100% | $4,585,705,702 |
At October 31, 2011, the Fund had the following outstanding foreign exchange contracts as follows:
| Settlement Date | Foreign
Currency
Unit to
Receive | In
Exchange
For | Unrealized
(Depreciation) |
| Contracts Purchased: |
| 11/1/2011 | 2,141,985 Pound Sterling | $3,457,806 | $(13,707) |
Unrealized Depreciation on Foreign Exchange Contracts is included in “Other Assets and Liabilities — Net.”
Annual Shareholder Report
| 1 | Affiliated holding. |
| 2 | 7-Day net yield. |
| 3 | The cost of investments for federal tax purposes amounts to $4,277,257,748. |
| 4 | Assets, other than investments in securities, less liabilities. See Statement of Assets and Liabilities. |
Note: The categories of investments are shown as a percentage of total net assets at October 31, 2011.
Various inputs are used in determining the value of the Fund's investments. These inputs are summarized in the three broad levels listed below:
Level 1 — quoted prices in active markets for identical securities, including investment companies with daily net asset values, if applicable.
Level 2 — other significant observable inputs (including quoted prices for similar securities, interest rates, prepayment speeds, credit risk, etc.). Also includes securities valued at amortized cost.
Level 3 — significant unobservable inputs (including the Fund's own assumptions in determining the fair value of investments).
The inputs or methodology used for valuing securities are not an indication of the risk associated with investing in those securities.
The following is a summary of the inputs used, as October 31, 2011, in valuing the Fund's assets carried at fair value:
| Valuation Inputs | | | | |
| Level 1 —
Quoted
Prices and
Investments in
Mutual Funds | Level 2 —
Other
Significant
Observable
Inputs | Level 3 —
Significant
Unobservable
Inputs | Total |
| Equity Securities: | | | | |
| Common Stock | | | | |
| Domestic | $3,217,607,058 | $ — | $ — | $3,217,607,058 |
| International | 85,655,935 | 1,209,608,408 | — | 1,295,264,343 |
| Mutual Fund | 82,711,312 | — | — | 82,711,312 |
| TOTAL SECURITIES | $3,385,974,305 | $1,209,608,408 | $ — | $4,595,582,713 |
| OTHER FINANCIAL INSTRUMENTS* | $(13,707) | $ — | $ — | $(13,707) |
| * | Other financial instruments include foreign exchange contracts. |
See Notes which are an integral part of the Financial Statements
Annual Shareholder Report Financial Highlights – Class A Shares
(For a Share Outstanding Throughout Each Period)
| Year Ended October 31 | 2011 | 2010 | 2009 | 2008 | 2007 |
| Net Asset Value, Beginning of Period | $4.36 | $3.85 | $4.01 | $6.36 | $6.27 |
| Income From Investment Operations: | | | | | |
| Net investment income | 0.171 | 0.161 | 0.15 | 0.27 | 0.27 |
| Net realized and unrealized gain (loss) on investments and foreign currency transactions | 0.32 | 0.51 | (0.15) | (2.05) | 0.16 |
| TOTAL FROM INVESTMENT OPERATIONS | 0.49 | 0.67 | — | (1.78) | 0.43 |
| Less Distributions: | | | | | |
| Distributions from net investment income | (0.16) | (0.16) | (0.16) | (0.28) | (0.25) |
| Distributions from net realized gain on investments and foreign currency transactions | — | — | — | (0.29) | (0.09) |
| TOTAL DISTRIBUTIONS | (0.16) | (0.16) | (0.16) | (0.57) | (0.34) |
| Net Asset Value, End of Period | $4.69 | $4.36 | $3.85 | $4.01 | $6.36 |
| Total Return2 | 11.50% | 17.83% | 0.31% | (30.13)% | 6.96% |
| Ratios to Average Net Assets: | | | | | |
| Net expenses | 1.05%3 | 1.05%3 | 1.04%3 | 1.00%3 | 1.00%3 |
| Net investment income | 3.67% | 3.98% | 4.38% | 5.14% | 4.03% |
| Expense waiver/reimbursement4 | 0.14% | 0.19% | 0.20% | 0.25% | 0.22% |
| Supplemental Data: | | | | | |
| Net assets, end of period (000 omitted) | $992,799 | $439,433 | $358,589 | $249,725 | $555,896 |
| Portfolio turnover | 17% | 20% | 42% | 48% | 66% |
| 1 | Per share numbers have been calculated using the average shares method. |
| 2 | Based on net asset value, which does not reflect the sales charge, redemption fee or contingent deferred sales charge, if applicable. |
| 3 | The net expense ratio is calculated without reduction for expense offset arrangements. The net expense ratios are 1.05%, 1.04%, 1.04%, 1.00% and 0.99%, for the years ended October 31, 2011, 2010, 2009, 2008 and 2007, respectively, after taking into account these expense reductions. |
| 4 | This expense decrease is reflected in both the net expense and the net investment income ratios shown above. |
See Notes which are an integral part of the Financial Statements
Annual Shareholder Report Financial Highlights – Class C Shares
(For a Share Outstanding Throughout Each Period)
| Year Ended October 31 | 2011 | 2010 | 2009 | 2008 | 2007 |
| Net Asset Value, Beginning of Period | $4.37 | $3.85 | $4.02 | $6.37 | $6.28 |
| Income From Investment Operations: | | | | | |
| Net investment income | 0.131 | 0.131 | 0.13 | 0.23 | 0.21 |
| Net realized and unrealized gain (loss) on investments and foreign currency transactions | 0.33 | 0.52 | (0.17) | (2.05) | 0.18 |
| TOTAL FROM INVESTMENT OPERATIONS | 0.46 | 0.65 | (0.04) | (1.82) | 0.39 |
| Less Distributions: | | | | | |
| Distributions from net investment income | (0.13) | (0.13) | (0.13) | (0.24) | (0.21) |
| Distributions from net realized gain on investments and foreign currency transactions | — | — | — | (0.29) | (0.09) |
| TOTAL DISTRIBUTIONS | (0.13) | (0.13) | (0.13) | (0.53) | (0.30) |
| Net Asset Value, End of Period | $4.70 | $4.37 | $3.85 | $4.02 | $6.37 |
| Total Return2 | 10.67% | 17.21% | (0.69)% | (30.57)% | 6.16% |
| Ratios to Average Net Assets: | | | | | |
| Net expenses | 1.80%3 | 1.80%3 | 1.79%3 | 1.75%3 | 1.75%3 |
| Net investment income | 2.95% | 3.22% | 3.65% | 4.44% | 3.33% |
| Expense waiver/reimbursement4 | 0.14% | 0.19% | 0.20% | 0.25% | 0.22% |
| Supplemental Data: | | | | | |
| Net assets, end of period (000 omitted) | $328,987 | $173,394 | $123,604 | $112,894 | $217,849 |
| Portfolio turnover | 17% | 20% | 42% | 48% | 66% |
| 1 | Per share numbers have been calculated using the average shares method. |
| 2 | Based on net asset value, which does not reflect the sales charge, redemption fee or contingent deferred sales charge, if applicable. |
| 3 | The net expense ratio is calculated without reduction for expense offset arrangements. The net expense ratios are 1.80%, 1.80%, 1.78%, 1.75% and 1.74%, for the years ended October 31, 2011, 2010, 2009, 2008 and 2007, respectively, after taking into account these expense reductions. |
| 4 | This expense decrease is reflected in both the net expense and the net investment income ratios shown above. |
See Notes which are an integral part of the Financial Statements
Annual Shareholder Report Financial Highlights – Institutional Shares
(For a Share Outstanding Throughout Each Period)
| Year Ended October 31 | 2011 | 2010 | 2009 | 2008 | 2007 |
| Net Asset Value, Beginning of Period | $4.38 | $3.86 | $4.02 | $6.37 | $6.28 |
| Income From Investment Operations: | | | | | |
| Net investment income | 0.181 | 0.171 | 0.17 | 0.28 | 0.27 |
| Net realized and unrealized gain (loss) on investments and foreign currency transactions | 0.31 | 0.52 | (0.16) | (2.05) | 0.18 |
| TOTAL FROM INVESTMENT OPERATIONS | 0.49 | 0.69 | 0.01 | (1.77) | 0.45 |
| Less Distributions: | | | | | |
| Distributions from net investment income | (0.17) | (0.17) | (0.17) | (0.29) | (0.27) |
| Distributions from net realized gain on investments and foreign currency transactions | — | — | — | (0.29) | (0.09) |
| TOTAL DISTRIBUTIONS | (0.17) | (0.17) | (0.17) | (0.58) | (0.36) |
| Net Asset Value, End of Period | $4.70 | $4.38 | $3.86 | $4.02 | $6.37 |
| Total Return2 | 11.48% | 18.34% | 0.55% | (29.92)% | 7.20% |
| Ratios to Average Net Assets: | | | | | |
| Net expenses | 0.80%3 | 0.80%3 | 0.80%3 | 0.75%3 | 0.75%3 |
| Net investment income | 3.89% | 4.14% | 4.59% | 5.67% | 4.29% |
| Expense waiver/reimbursement4 | 0.14% | 0.19% | 0.19% | 0.25% | 0.22% |
| Supplemental Data: | | | | | |
| Net assets, end of period (000 omitted) | $3,263,920 | $1,340,561 | $383,503 | $176,187 | $199,630 |
| Portfolio turnover | 17% | 20% | 42% | 48% | 66% |
| 1 | Per share numbers have been calculated using the average shares method. |
| 2 | Based on net asset value. |
| 3 | The net expense ratio is calculated without reduction for expense offset arrangements. The net expense ratios are 0.80%, 0.80%, 0.80%, 0.75% and 0.74%, for the years ended October 31, 2011, 2010, 2009, 2008 and 2007, respectively, after taking into account these expense reductions. |
| 4 | This expense decrease is reflected in both the net expense and the net investment income ratios shown above. |
See Notes which are an integral part of the Financial Statements
Annual Shareholder Report Statement of Assets and Liabilities
October 31, 2011
| Assets: | | |
| Total investments in securities, at value including $82,711,312 of investments in an affiliated holding (Note 5) (identified cost $4,277,124,789) | | $4,595,582,713 |
| Income receivable | | 11,596,332 |
| Receivable for shares sold | | 43,778,188 |
| TOTAL ASSETS | | 4,650,957,233 |
| Liabilities: | | |
| Payable for investments purchased | $59,822,232 | |
| Payable for shares redeemed | 4,202,084 | |
| Unrealized depreciation on foreign exchange contracts | 13,707 | |
| Bank overdraft denominated in foreign currencies (identified cost $4,535) | 4,686 | |
| Income distribution payable | 3,233 | |
| Payable for Directors'/Trustees' fees | 554 | |
| Payable for distribution services fee (Note 5) | 196,522 | |
| Payable for shareholder services fee (Note 5) | 532,786 | |
| Accrued expenses | 475,727 | |
| TOTAL LIABILITIES | | 65,251,531 |
| Net assets for 975,765,810 shares outstanding | | $4,585,705,702 |
| Net Assets Consist of: | | |
| Paid-in capital | | $4,470,612,626 |
| Net unrealized appreciation of investments and translation of assets and liabilities in foreign currency | | 318,424,954 |
| Accumulated net realized loss on investments and foreign currency transactions | | (204,588,597) |
| Undistributed net investment income | | 1,256,719 |
| TOTAL NET ASSETS | | $4,585,705,702 |
Annual Shareholder ReportStatement of Assets and Liabilities — continued| Net Asset Value, Offering Price and Redemption Proceeds Per Share | | |
| Class A Shares: | | |
| Net asset value per share ($992,799,019 ÷ 211,768,666 shares outstanding), no par value, unlimited shares authorized | | $4.69 |
| Offering price per share (100/94.50 of $4.69) | | $4.96 |
| Redemption proceeds per share | | $4.69 |
| Class C Shares: | | |
| Net asset value per share ($328,986,918 ÷ 70,059,128 shares outstanding), no par value, unlimited shares authorized | | $4.70 |
| Offering price per share | | $4.70 |
| Redemption proceeds per share (99.00/100 of $4.70) | | $4.65 |
| Institutional Shares: | | |
| Net asset value per share ($3,263,919,765 ÷ 693,938,016 shares outstanding), no par value, unlimited shares authorized | | $4.70 |
| Offering price per share | | $4.70 |
| Redemption proceeds per share | | $4.70 |
See Notes which are an integral part of the Financial Statements
Annual Shareholder Report Statement of Operations
Year Ended October 31, 2011
| Investment Income: | | | |
| Dividends (including $81,400 received from an affiliated holding (Note 5) and net of foreign taxes withheld of $2,291,112) | | | $134,343,205 |
| Expenses: | | | |
| Investment adviser fee (Note 5) | | $21,417,737 | |
| Administrative fee (Note 5) | | 2,230,646 | |
| Custodian fees | | 326,334 | |
| Transfer and dividend disbursing agent fees and expenses | | 2,206,083 | |
| Directors'/Trustees' fees | | 15,253 | |
| Auditing fees | | 18,912 | |
| Legal fees | | 6,064 | |
| Portfolio accounting fees | | 201,051 | |
| Distribution services fee (Note 5) | | 1,792,892 | |
| Shareholder services fee (Note 5) | | 2,070,476 | |
| Account administration fee (Note 2) | | 6,213 | |
| Share registration costs | | 215,868 | |
| Printing and postage | | 195,907 | |
| Insurance premiums | | 8,302 | |
| Miscellaneous | | 7,375 | |
| TOTAL EXPENSES | | 30,719,113 | |
| Waivers, Reimbursement and Expense Reduction: | | | |
| Waiver/reimbursement of investment adviser fee (Note 5) | $(3,806,557) | | |
| Waiver of administrative fee (Note 5) | (57,460) | | |
| Waiver of distribution services fee (Note 5) | (250) | | |
Fees paid indirectly from directed brokerage
arrangements (Note 6) | (69,592) | | |
| TOTAL WAIVERS, REIMBURSEMENT AND EXPENSE REDUCTION | | (3,933,859) | |
| Net expenses | | | 26,785,254 |
| Net investment income | | | 107,557,951 |
| Realized and Unrealized Gain on Investments and Foreign Currency Transactions: | | | |
| Net realized gain on investments and foreign currency transactions | | | 66,656,799 |
| Net change in unrealized appreciation of investments and translation of assets and liabilities in foreign currency | | | 159,594,223 |
| Net realized and unrealized gain on investments and foreign currency transactions | | | 226,251,022 |
| Change in net assets resulting from operations | | | $333,808,973 |
See Notes which are an integral part of the Financial Statements
Annual Shareholder Report Statement of Changes in Net Assets
| Year Ended October 31 | 2011 | 2010 |
| Increase (Decrease) in Net Assets | | |
| Operations: | | |
| Net investment income | $107,557,951 | $43,864,018 |
| Net realized gain (loss) on investments and foreign currency transactions | 66,656,799 | (3,457,624) |
| Net change in unrealized appreciation/depreciation of investments and translation of assets and liabilities in foreign currency | 159,594,223 | 162,298,804 |
| CHANGE IN NET ASSETS RESULTING FROM OPERATIONS | 333,808,973 | 202,705,198 |
| Distributions to Shareholders: | | |
| Distributions from net investment income | | |
| Class A Shares | (21,666,474) | (15,198,007) |
| Class C Shares | (6,814,261) | (4,518,899) |
| Institutional Shares | (77,545,884) | (23,929,494) |
| CHANGE IN NET ASSETS RESULTING FROM DISTRIBUTIONS TO SHAREHOLDERS | (106,026,619) | (43,646,400) |
| Share Transactions: | | |
| Proceeds from sale of shares | 3,111,743,170 | 1,309,543,774 |
| Net asset value of shares issued to shareholders in payment of distributions declared | 39,084,245 | 23,498,553 |
| Cost of shares redeemed | (746,291,681) | (404,409,867) |
| CHANGE IN NET ASSETS RESULTING FROM SHARE TRANSACTIONS | 2,404,535,734 | 928,632,460 |
| Change in net assets | 2,632,318,088 | 1,087,691,258 |
| Net Assets: | | |
| Beginning of period | 1,953,387,614 | 865,696,356 |
| End of period (including undistributed net investment income of $1,256,719 and $122,525, respectively) | $4,585,705,702 | $1,953,387,614 |
See Notes which are an integral part of the Financial Statements
Annual Shareholder Report Notes to Financial Statements
October 31, 2011
1. ORGANIZATION
Federated Equity Funds (the “Trust”) is registered under the Investment Company Act of 1940, as amended (the “Act”), as an open-end management investment company. The Trust consists of 13 portfolios. The financial statements included herein are only those of Federated Strategic Value Dividend Fund (formerly, Federated Strategic Value Fund) (the “Fund”), a diversified portfolio. The financial statements of the other portfolios are presented separately. The assets of each portfolio are segregated and a shareholder's interest is limited to the portfolio in which shares are held. Each portfolio pays its own expenses. The Fund offers three classes of shares: Class A Shares, Class C Shares and Institutional Shares. All shares of the Fund have equal rights with respect to voting, except on class-specific matters. The investment objective of the Fund is to provide income and long-term capital appreciation.
2. SIGNIFICANT ACCOUNTING POLICIES
The following is a summary of significant accounting policies consistently followed by the Fund in the preparation of its financial statements. These policies are in conformity with U.S. generally accepted accounting principles (GAAP).
Investment Valuation
In calculating its net asset value (NAV), the Fund generally values investments as follows:
- Equity securities listed on an exchange or traded through a regulated market system are valued at their last reported sale price or official closing price in their principal exchange or market.
- Shares of other mutual funds are valued based upon their reported NAVs.
- Derivative contracts listed on exchanges are valued at their reported settlement or closing price.
- Over-the-counter (OTC) derivative contracts are fair valued using price evaluations provided by a pricing service approved by the Board of Trustees (the “Trustees”).
- Fixed-income securities acquired with remaining maturities greater than 60 days are fair valued using price evaluations provided by a pricing service approved by the Trustees.
- Fixed-income securities acquired with remaining maturities of 60 days or less are valued at their cost (adjusted for the accretion of any discount or amortization of any premium), which approximates market value.
- For securities that are fair valued in accordance with procedures established by and under the general supervision of the Trustees, certain factors may be considered such as: the purchase price of the security, information obtained by contacting the issuer, analysis of the issuer's financial statements or other available documents, fundamental analytical data, the nature and duration of restrictions on disposition, the movement of the market in which the security is normally traded and public trading in similar securities of the issuer or comparable issuers.
If the Fund cannot obtain a price or price evaluation from a pricing service for an investment, the Fund may attempt to value the investment based upon the mean of bid and asked quotations or fair value the investment based on price evaluations, from one or more dealers. If any price, quotation, price evaluation or other pricing source is not readily available when the NAV is calculated, the Fund uses the fair value of the investment determined in accordance with the procedures described below. There can be no assurance that the Fund could purchase or sell an investment at the price used to calculate the Fund's NAV.
Annual Shareholder Report
Fair Valuation and Significant Events ProceduresThe Trustees have authorized the use of pricing services to provide evaluations of the current fair value of certain investments for purposes of calculating the NAV. Factors considered by pricing services in evaluating an investment include the yields or prices of investments of comparable quality, coupon, maturity, call rights and other potential prepayments, terms and type, reported transactions, indications as to values from dealers and general market conditions. Some pricing services provide a single price evaluation reflecting the bid-side of the market for an investment (a “bid” evaluation). Other pricing services offer both bid evaluations and price evaluations indicative of a price between the prices bid and asked for the investment (a “mid” evaluation). The Fund normally uses bid evaluations for U.S. Treasury and Agency securities, mortgage-backed securities and municipal securities. The Fund normally uses mid evaluations for other types of fixed-income securities and OTC derivative contracts. In the event that market quotations and price evaluations are not available for an investment, the fair value of the investment is determined in accordance with procedures adopted by the Trustees.
The Trustees also have adopted procedures requiring an investment to be priced at its fair value whenever the Adviser determines that a significant event affecting the value of the investment has occurred between the time as of which the price of the investment would otherwise be determined and the time as of which the NAV is computed. An event is considered significant if there is both an affirmative expectation that the investment's value will change in response to the event and a reasonable basis for quantifying the resulting change in value. Examples of significant events that may occur after the close of the principal market on which a security is traded, or after the time of a price evaluation provided by a pricing service or a dealer, include:
- With respect to securities traded in foreign markets, significant trends in U.S. equity markets or in the trading of foreign securities index futures or options contracts;
- With respect to price evaluations of fixed-income securities determined before the close of regular trading on the NYSE, actions by the Federal Reserve Open Market Committee and other significant trends in U.S. fixed-income markets;
- Political or other developments affecting the economy or markets in which an issuer conducts its operations or its securities are traded; and
- Announcements concerning matters such as acquisitions, recapitalizations, litigation developments, a natural disaster affecting the issuer's operations or regulatory changes or market developments affecting the issuer's industry.
The Trustees have approved the use of a pricing service to determine the fair value of equity securities traded principally in foreign markets when the Adviser determines that there has been a significant trend in the U.S. equity markets or in index futures trading. For other significant events, the Fund may seek to obtain more current quotations or price evaluations from alternative pricing sources. If a reliable alternative pricing source is not available, the Fund will determine the fair value of the investment using another method approved by the Trustees.
Annual Shareholder Report
Repurchase Agreements
The Fund may invest in repurchase agreements for short-term liquidity purposes. It is the policy of the Fund to require the other party to a repurchase agreement to transfer to the Fund's custodian or sub-custodian eligible securities or cash with a market value (after transaction costs) at least equal to the repurchase price to be paid under the repurchase agreement. The eligible securities are transferred to accounts with the custodian or sub-custodian in which the Fund holds a “securities entitlement” and exercises “control” as those terms are defined in the Uniform Commercial Code. The Fund has established procedures for monitoring the market value of the transferred securities and requiring the transfer of additional eligible securities if necessary to equal at least the repurchase price. These procedures also allow the other party to require securities to be transferred from the account to the extent that their market value exceeds the repurchase price or in exchange for other eligible securities of equivalent market value.
The insolvency of the other party or other failure to repurchase the securities may delay the disposition of the underlying securities or cause the Fund to receive less than the full repurchase price. Under the terms of the repurchase agreement, any amounts received by the Fund in excess of the repurchase price and related transaction costs must be remitted to the other party.
The Fund may enter into repurchase agreements in which eligible securities are transferred into joint trading accounts maintained by the custodian or sub-custodian for investment companies and other clients advised by the Fund's Adviser and its affiliates. The Fund will participate on a pro rata basis with the other investment companies and clients in its share of the securities transferred under such repurchase agreements and in its share of proceeds from any repurchase or other disposition of such securities.
Investment Income, Gains and Losses, Expenses and Distributions
Investment transactions are accounted for on a trade-date basis. Realized gains and losses from investment transactions are recorded on an identified-cost basis. Interest income and expenses are accrued daily. Dividend income and distributions to shareholders are recorded on the ex-dividend date. Foreign dividends are recorded on the ex-dividend date or when the Fund is informed of the ex-dividend date. Distributions of net investment income are declared and paid monthly. Non-cash dividends included in dividend income, if any, are recorded at fair value. Investment income, realized and unrealized gains and losses and certain fund-level expenses are allocated to each class based on relative average daily net assets, except that Class A Shares, Class C Shares and Institutional Shares may bear distribution services fees, shareholder services fees and certain account administration fees unique to those classes. For the year ended October 31, 2011, account administration fees for the Fund were as follows:
| Account
Administration
Fees Incurred |
| Class A Shares | $5,741 |
| Class C Shares | 472 |
| TOTAL | $6,213 |
Dividends are declared separately for each class. No class has preferential dividend rights; differences in per share dividend rates are generally due to differences in separate class expenses.
Annual Shareholder Report
Premium and Discount Amortization
All premiums and discounts on fixed-income securities are amortized/accreted using the effective interest rate method.
Federal Taxes
It is the Fund's policy to comply with the Subchapter M provision of the Internal Revenue Code (the “Code”) and to distribute to shareholders each year substantially all of its income. Accordingly, no provision for federal income tax is necessary. As of and during the year ended October 31, 2011, the Fund did not have a liability for any uncertain tax positions. The Fund recognizes interest and penalties, if any, related to tax liabilities as income tax expense in the Statement of Operations. As of October 31, 2011, tax years 2008 through 2011 remain subject to examination by the Fund's major tax jurisdictions, which include the United States of America and the Commonwealth of Massachusetts.
The Fund may be subject to taxes imposed by governments of countries in which it invests. Such taxes are generally based on either income or gains earned or repatriated. The Fund accrues and applies such taxes to net investment income, net realized gains and net unrealized gains as income and/or gains are earned.
When-Issued and Delayed Delivery Transactions
The Fund may engage in when-issued or delayed delivery transactions. The Fund records when-issued securities on the trade date and maintains security positions such that sufficient liquid assets will be available to make payment for the securities purchased. Securities purchased on a when-issued or delayed delivery basis are marked to market daily and begin earning interest on the settlement date. Losses may occur on these transactions due to changes in market conditions or the failure of counterparties to perform under the contract.
Foreign Exchange Contracts
The Fund enters into foreign exchange contracts for the delayed delivery of securities or foreign currency exchange transactions. The Fund enters into foreign exchange contracts to protect assets against adverse changes in foreign currency exchange rates or exchange control regulations. Purchased contracts are used to acquire exposure to foreign currencies, whereas, contracts to sell are used to hedge the Fund's securities against currency fluctuations. Risks may arise upon entering into these transactions from the potential inability of counterparties to meet the terms of their commitments and from unanticipated movements in security prices or foreign exchange rates. The foreign exchange contracts are adjusted by the daily exchange rate of the underlying currency and any gains or losses are recorded for financial statement purposes as unrealized until the settlement date.
Foreign exchange contracts outstanding at period end are listed after the Fund's Portfolio of Investments.
The average value at settlement date payable and receivable of foreign exchange contracts purchased and sold by the Fund throughout the period was $1,244,649 and $675,482, respectively. This is based on the contracts held as of each month-end throughout the fiscal period.
Annual Shareholder Report
Foreign Currency Translation
The accounting records of the Fund are maintained in U.S. dollars. All assets and liabilities denominated in foreign currencies (FCs) are translated into U.S. dollars based on the rates of exchange of such currencies against U.S. dollars on the date of valuation. Purchases and sales of securities, income and expenses are translated at the rate of exchange quoted on the respective date that such transactions are recorded. The Fund does not isolate that portion of the results of operations resulting from changes in foreign exchange rates on investments from the fluctuations arising from changes in market prices of securities held. Such fluctuations are included with the net realized and unrealized gain or loss from investments.
Reported net realized foreign exchange gains or losses arise from sales of portfolio securities, sales and maturities of short-term securities, sales of FCs, currency gains or losses realized between the trade and settlement dates on securities transactions, the difference between the amounts of dividends, interest and foreign withholding taxes recorded on the Fund's books and the U.S. dollar equivalent of the amounts actually received or paid. Net unrealized foreign exchange gains and losses arise from changes in the value of assets and liabilities other than investments in securities at fiscal year end, resulting from changes in the exchange rate.
Additional Disclosure Related to Derivative Instruments
| Fair Value of Derivative Instruments |
| Liability |
| Statement of
Assets and
Liabilities
Location | Fair
Value |
Derivatives not accounted for as hedging instruments
under ASC Topic 815 | | |
| Foreign exchange contracts | Unrealized depreciation on
foreign exchange contracts | $13,707 |
The Effect of Derivative Instruments on the Statement of Operations for the Year Ended October 31, 2011
| Amount of Realized Gain or (Loss) on Derivatives Recognized in Income |
| Forward
Currency
Contracts |
| Foreign exchange contracts | $(1,940,700) |
| Change in Unrealized Appreciation or (Depreciation) on Derivatives Recognized in Income |
| Forward
Currency
Contracts |
| Foreign exchange contracts | $6,613,081 |
Annual Shareholder ReportOther
The preparation of financial statements in conformity with GAAP requires management to make estimates and assumptions that affect the amounts of assets, liabilities, expenses and revenues reported in the financial statements. Actual results could differ from those estimated.
3. SHARES OF BENEFICIAL INTEREST
The following tables summarize share activity:
| Year Ended October 31 | 2011 | 2010 |
| Class A Shares: | Shares | Amount | Shares | Amount |
| Shares sold | 146,149,603 | $664,664,047 | 45,267,839 | $185,529,847 |
| Shares issued to shareholders in payment of distributions declared | 3,482,525 | 15,867,360 | 2,585,596 | 10,383,068 |
| Shares redeemed | (38,575,887) | (174,955,116) | (40,400,255) | (163,979,696) |
NET CHANGE RESULTING FROM
CLASS A SHARE TRANSACTIONS | 111,056,241 | $505,576,291 | 7,453,180 | $31,933,219 |
| Year Ended October 31 | 2011 | 2010 |
| Class C Shares: | Shares | Amount | Shares | Amount |
| Shares sold | 39,272,581 | $177,848,640 | 15,808,060 | $65,088,566 |
| Shares issued to shareholders in payment of distributions declared | 1,177,331 | 5,359,069 | 918,172 | 3,687,483 |
| Shares redeemed | (10,059,645) | (45,468,828) | (9,146,625) | (37,229,060) |
NET CHANGE RESULTING FROM
CLASS C SHARE TRANSACTIONS | 30,390,267 | $137,738,881 | 7,579,607 | $31,546,989 |
| Year Ended October 31 | 2011 | 2010 |
| Institutional Shares: | Shares | Amount | Shares | Amount |
| Shares sold | 499,426,899 | $2,269,230,483 | 254,250,825 | $1,058,925,361 |
| Shares issued to shareholders in payment of distributions declared | 3,902,426 | 17,857,816 | 2,343,251 | 9,428,002 |
| Shares redeemed | (115,706,264) | (525,867,737) | (49,734,963) | (203,201,111) |
NET CHANGE RESULTING FROM
INSTITUTIONAL SHARE TRANSACTIONS | 387,623,061 | $1,761,220,562 | 206,859,113 | $865,152,252 |
NET CHANGE RESULTING FROM
TOTAL FUND SHARE TRANSACTIONS | 529,069,569 | $2,404,535,734 | 221,891,900 | $928,632,460 |
Annual Shareholder Report
4. FEDERAL TAX INFORMATIONThe timing and character of income and capital gain distributions are determined in accordance with income tax regulations, which may differ from GAAP. These differences are due to differing treatments for foreign currency transactions.
For the year ended October 31, 2011, permanent differences identified and reclassified among the components of net assets were as follows:
Undistributed
Net Investment
Income (Loss) | Accumulated
Net Realized
Gain (Loss) |
| $(397,138) | $397,138 |
Net investment income (loss), net realized gains (losses) and net assets were not affected by this reclassification.
The tax character of distributions as reported on the Statement of Changes in Net Assets for the years ended October 31, 2011 and 2010, was as follows:
| 2011 | 2010 |
| Ordinary income | $106,026,619 | $43,646,400 |
As of October 31, 2011, the components of distributable earnings on a tax basis were as follows:
| Undistributed ordinary income | $1,256,719 |
| Net unrealized appreciation | $318,291,995 |
| Capital loss carryforwards | $(204,455,638) |
The difference between book-basis and tax-basis net unrealized appreciation/depreciation is attributable to differing treatments for the deferral of losses on wash sales.
At October 31, 2011, the cost of investments for federal tax purposes was $4,277,257,748. The net unrealized appreciation of investments for federal tax purposes excluding any unrealized appreciation/depreciation resulting from changes in foreign currency exchange rates and outstanding foreign currency commitments was $318,324,965. This consists of net unrealized appreciation from investments for those securities having an excess of value over cost of $374,191,261 and net unrealized depreciation from investments for those securities having an excess of cost over value of $55,866,296.
Annual Shareholder Report
At October 31, 2011, the Fund had a capital loss carryforward of $204,455,638 which will reduce the Fund's taxable income arising from future net realized gains on investments, if any, to the extent permitted by the Code and thus will reduce the amount of distributions to shareholders which would otherwise be necessary to relieve the Fund of any liability for federal income tax. Pursuant to the Code, such capital loss carryforward will expire as follows:| Expiration Year | Expiration Amount |
| 2016 | $84,516,876 |
| 2017 | $111,289,322 |
| 2018 | $8,649,440 |
Under the recently enacted Regulated Investment Company Modernization Act of 2010, the Fund will be permitted to carry forward capital losses incurred in taxable years beginning after December 22, 2010, for an unlimited period. However, any losses incurred during those future years will be required to be utilized prior to the losses incurred in pre-enactment tax years. As a result of this ordering rule, pre-enactment capital loss carryforwards may be more likely to expire unused. Additionally, post-enactment capital losses that are carried forward will retain their character as either short-term or long-term capital losses rather than being considered all short-term as under previous law.
The Fund used capital loss carryforwards of $73,838,401 to offset taxable capital gains realized during the year ended October 31, 2011.
5. INVESTMENT ADVISER FEE AND OTHER TRANSACTIONS WITH AFFILIATES
Investment Adviser Fee
Federated Equity Management Company of Pennsylvania is the Fund's investment adviser (the “Adviser”). The advisory agreement between the Fund and the Adviser provides for an annual fee equal to 0.75% of the Fund's average daily net assets. Subject to the terms described in the Expense Limitation note, the Adviser may voluntarily choose to waive any portion of its fee. For the year ended October 31, 2011, the Adviser voluntarily waived $3,752,570 of its fee.
Administrative Fee
Federated Administrative Services (FAS), under the Administrative Services Agreement, provides the Fund with administrative personnel and services. The fee paid to FAS is based on the average aggregate daily net assets of certain Federated funds as specified below:
| Administrative Fee | Average Aggregate Daily Net Assets
of the Federated Funds |
| 0.150% | on the first $5 billion |
| 0.125% | on the next $5 billion |
| 0.100% | on the next $10 billion |
| 0.075% | on assets in excess of $20 billion |
The administrative fee received during any fiscal year shall be at least $150,000 per portfolio and $40,000 per each additional class of Shares. Subject to the terms described in the Expense Limitation note, FAS may voluntarily choose to waive any portion of its fee. For the year ended October 31, 2011, the net fee paid to FAS was 0.076% of average daily net assets of the Fund. FAS waived $57,460 of its fee.
Annual Shareholder Report
Distribution Services FeeThe Fund has adopted a Distribution Plan (the “Plan”) pursuant to Rule 12b-1 under the Act. Under the terms of the Plan, the Fund will compensate Federated Securities Corp. (FSC), the principal distributor, from the daily net assets of the Fund's Class A Shares and Class C Shares to finance activities intended to result in the sale of these shares. The Plan provides that the Fund may incur distribution expenses at the following percentages of average daily net assets annually, to compensate FSC:
| Share Class Name | Percentage of Average Daily
Net Assets of Class |
| Class A Shares | 0.05% |
| Class C Shares | 0.75% |
Subject to the terms described in the Expense Limitation note, FSC may voluntarily choose to waive any portion of its fee. For the year ended October 31, 2011, distribution services fees for the Fund were as follows:
| Distribution
Services
Fees Incurred | Distribution
Services
Fees Waived |
| Class C Shares | $1,792,892 | $(250) |
When FSC receives fees, it may pay some or all of them to financial intermediaries whose customers purchase shares. For the year ended October 31, 2011, FSC retained $758,562 of fees paid by the Fund. For the year ended October 31, 2011, the Fund's Class A Shares did not incur a distribution services fee; however, it may begin to incur this fee upon approval of the Trustees.
Sales Charges
Front-end sales charges and contingent deferred sales charges (CDSC) do not represent expenses of the Fund. They are deducted from the proceeds of sales of Fund shares prior to investment or from redemption proceeds prior to remittance, as applicable. For the year ended October 31, 2011, FSC retained $560,548 in sales charges from the sale of Class A Shares. FSC also retained $13,362 of CDSC relating to redemptions of Class C Shares.
Shareholder Services Fee
The Fund may pay fees (“Service Fees”) up to 0.25% of the average daily net assets of the Fund's Class A Shares and Class C Shares to financial intermediaries or to Federated Shareholder Services Company (FSSC) for providing services to shareholders and maintaining shareholder accounts. Subject to the terms described in the Expense Limitation note, FSSC may voluntarily reimburse the Fund for Service Fees. For the year ended October 31, 2011, Service Fees for the Fund were as follows:
| Service
Fees
Incurred |
| Class A Shares | $1,473,317 |
| Class C Shares | $597,159 |
| TOTAL | $2,070,476 |
For the year ended October 31, 2011, FSSC received $13,733 of fees paid by the Fund.
Annual Shareholder Report
Expense LimitationThe Adviser and its affiliates (which may include FSC, FAS and FSSC) have voluntarily agreed to waive their fees and/or reimburse expenses so that the total annual fund operating expenses (as shown in the financial highlights) paid by the Fund's Class A Shares, Class C Shares and Institutional Shares (after the voluntary waivers and reimbursements) will not exceed 1.05%, 1.80% and 0.80% (the “Fee Limit”), respectively, up to but not including the later of (the “Termination Date”): (a) January 1, 2013; or (b) the date of the Fund's next effective Prospectus. While the Adviser and its affiliates currently do not anticipate terminating or increasing these arrangements prior to the Termination Date, these arrangements may only be terminated or the Fee Limit increased prior to the Termination Date with the agreement of the Trustees.
Interfund Transactions
During the year ended October 31, 2011, the Fund engaged in purchase and sale transactions with funds that have a common investment adviser (or affiliated investment advisers), common Directors/Trustees and/or common Officers. These purchase and sale transactions complied with Rule 17a-7 under the Act and amounted to $9,470,867 and $2,424,972, respectively.
General
Certain Officers and Trustees of the Fund are Officers and Directors or Trustees of the above companies.
Transactions Involving Affiliated Holdings
Affiliated holdings are mutual funds which are managed by the Adviser or an affiliate of the Adviser. The Adviser has agreed to reimburse the Fund for certain investment adviser fees as a result of transactions in other affiliated mutual funds. For the year ended October 31, 2011, the Adviser reimbursed $53,987. Transactions involving the affiliated holding during the year ended October 31, 2011, were as follows:
| Federated
Prime Value
Obligations Fund,
Institutional Shares |
| Balance of Shares Held 10/31/2010 | 37,095,521 |
| Purchases/Additions | 1,204,822,552 |
| Sales/Reductions | 1,159,206,761 |
| Balance of Shares Held 10/31/2011 | 82,711,312 |
| Value | $82,711,312 |
| Dividend Income | $81,400 |
6. EXPENSE Reduction
The Fund directs portfolio trades to a broker that in turn pays a portion of the Fund's operating expenses. For the year ended October 31, 2011, the Fund's expenses were reduced by $69,592 under these arrangements.
Annual Shareholder Report
7. Investment TRANSACTIONSPurchases and sales of investments, excluding long-term U.S. government securities and short-term obligations, for the year ended October 31, 2011, were as follows:
| Purchases | $2,868,531,876 |
| Sales | $495,330,863 |
8. LINE OF CREDIT
The Fund participates in a $100,000,000 unsecured, uncommitted revolving line of credit (LOC) agreement with PNC Bank. The LOC was made available for extraordinary or emergency purposes, primarily for financing redemption payments. Borrowings are charged interest at a rate offered to the Fund by PNC Bank at the time of the borrowing. As of October 31, 2011, there were no outstanding loans. During the year ended October 31, 2011, the Fund did not utilize the LOC.
9. INTERFUND LENDING
Pursuant to an Exemptive Order issued by the Securities and Exchange Commission, the Fund, along with other funds advised by subsidiaries of Federated Investors, Inc., may participate in an interfund lending program. This program provides an alternative credit facility allowing the Fund to borrow from other participating affiliated funds. As of October 31, 2011, there were no outstanding loans. During the year ended October 31, 2011, the program was not utilized.
10. RECENT ACCOUNTING PRONOUNCEMENTS
In April 2011, the Financial Accounting Standards Board (FASB) released Accounting Standards Update (ASU) No. 2011-03, “Reconsideration of Effective Control for Repurchase Agreements.” This ASU amends FASB Accounting Standards Codification (ASC) Topic 860, “Transfers and Servicing”; specifically the criteria required to determine whether a repurchase agreement and similar agreements should be accounted for as sales of financial assets or secured borrowings with commitments. This ASU is effective for fiscal years and interim periods beginning after December 15, 2011. At this time, management is evaluating the implications of adopting ASU No. 2011-03 and its impact on the Fund's financial statements and the accompanying notes, net assets and results of operations.
In addition, in May 2011, FASB released ASU No. 2011-04, “Amendments to Achieve Common Fair Value Measurement and Disclosure Requirements in U.S. GAAP and IFRSs.” This ASU amends FASB ASC Topic 820, “Fair Value Measurement,” to establish common requirements for measuring fair value and for disclosing information about fair value measurements in accordance with GAAP. This ASU is effective for fiscal years and interim periods beginning after December 15, 2011. At this time, management is evaluating the implications of adopting ASU No. 2011-04 and its impact on the Fund's financial statements and the accompanying notes.
11. FEDERAL TAX INFORMATION (UNAUDITED)
For the fiscal year ended October 31, 2011, 100.0% of total ordinary income distributions made by the Fund are qualifying dividends which may be subject to a maximum tax rate of 15%, as provided for by the Jobs and Growth Tax Relief Act of 2003. Complete information is reported in conjunction with the reporting of your distributions on Form 1099-DIV.
Of the ordinary income distributions made by the Fund during the year ended October 31, 2011, 87.3% qualify for the dividend received deduction available to corporate shareholders.
Annual Shareholder Report Report of Independent Registered Public Accounting Firm
TO THE BOARD OF Trustees OF Federated Equity Funds AND SHAREHOLDERS OF Federated Strategic Value Dividend Fund:
We have audited the accompanying statement of assets and liabilities of Federated Strategic Value Dividend Fund (the “Fund”) (one of the portfolios constituting Federated Equity Funds), including the portfolio of investments, as of October 31, 2011, and the related statement of operations for the year then ended, the statement of changes in net assets for each of the two years in the period then ended and the financial highlights for each of the five years in the period then ended. These financial statements and financial highlights are the responsibility of the Fund's management. Our responsibility is to express an opinion on these financial statements and financial highlights based on our audits.
We conducted our audits in accordance with standards of the Public Company Accounting Oversight Board (United States). Those standards require that we plan and perform the audit to obtain reasonable assurance about whether the financial statements and financial highlights are free of material misstatement. We were not engaged to perform an audit of the Fund's internal control over financial reporting. Our audits included consideration of internal control over financial reporting as a basis for designing audit procedures that are appropriate in the circumstances, but not for the purpose of expressing an opinion on the effectiveness of the Fund's internal control over financial reporting. Accordingly, we express no such opinion. An audit also includes examining, on a test basis, evidence supporting the amounts and disclosures in the financial statements and financial highlights, assessing the accounting principles used and significant estimates made by management, and evaluating the overall financial statement presentation. Our procedures included confirmation of securities owned as of October 31, 2011, by correspondence with the custodian and others or by other appropriate auditing procedures where replies from others were not received. We believe that our audits provide a reasonable basis for our opinion.
In our opinion, the financial statements and financial highlights referred to above present fairly, in all material respects, the financial position of Federated Strategic Value Dividend Fund, a portfolio of Federated Equity Funds, at October 31, 2011, the results of its operations for the year then ended, the changes in its net assets for each of the two years in the period then ended, and the financial highlights for each of the five years in the period then ended, in conformity with U.S. generally accepted accounting principles.
Boston, Massachusetts
December 23, 2011
Annual Shareholder Report Shareholder Expense Example (unaudited)
As a shareholder of the Fund, you incur two types of costs: (1) transaction costs, including sales charges (“loads”) on purchase or redemption payments; and (2) ongoing costs, including management fees and to the extent applicable, distribution (12b-1) fees and/or shareholder services fees and other Fund expenses. This Example is intended to help you to understand your ongoing costs (in dollars) of investing in the Fund and to compare these costs with the ongoing costs of investing in other mutual funds. It is based on an investment of $1,000 invested at the beginning of the period and held for the entire period from May 1, 2011 to October 31, 2011.
ACTUAL EXPENSES
The first section of the table below provides information about actual account values and actual expenses. You may use the information in this section, together with the amount you invested, to estimate the expenses that you incurred over the period. Simply divide your account value by $1,000 (for example, an $8,600 account value divided by $1,000 = 8.6), then multiply the result by the number in the first section under the heading entitled “Expenses Paid During Period” to estimate the expenses attributable to your investment during this period.
HYPOTHETICAL EXAMPLE FOR COMPARISON PURPOSES
The second section of the table below provides information about hypothetical account values and hypothetical expenses based on the Fund's actual expense ratio and an assumed rate of return of 5% per year before expenses, which is not the Fund's actual return. Thus, you should not use the hypothetical account values and expenses to estimate the actual ending account balance or your expenses for the period. Rather, these figures are required to be provided to enable you to compare the ongoing costs of investing in the Fund with other funds. To do so, compare this 5% hypothetical example with the 5% hypothetical examples that appear in the shareholder reports of the other funds.
Annual Shareholder Report
Please note that the expenses shown in the table are meant to highlight your ongoing costs only and do not reflect any transaction costs, such as sales charges (“loads”) on purchase or redemption payments. Therefore, the second section of the table is useful in comparing ongoing costs only, and will not help you determine the relative total costs of owning different funds. In addition, if these transaction costs were included, your costs would have been higher. | Beginning
Account Value
5/1/2011 | Ending
Account Value
10/31/2011 | Expenses Paid
During Period1 |
| Actual: | | | |
| Class A Shares | $1,000 | $1,005.50 | $5.31 |
| Class C Shares | $1,000 | $1,001.80 | $9.08 |
| Institutional Shares | $1,000 | $1,004.60 | $4.04 |
Hypothetical (assuming a 5% return
before expenses): | | | |
| Class A Shares | $1,000 | $1,019.91 | $5.35 |
| Class C Shares | $1,000 | $1,016.13 | $9.15 |
| Institutional Shares | $1,000 | $1,021.17 | $4.08 |
| 1 | Expenses are equal to the Fund's annualized net expense ratios, multiplied by the average account value over the period, multiplied by 184/365 (to reflect the one-half-year period). The annualized net expense ratios are as follows: |
| Class A Shares | 1.05% |
| Class C Shares | 1.80% |
| Institutional Shares | 0.80% |
Annual Shareholder Report Board of Trustees and Trust Officers
The Board of Trustees is responsible for managing the Trust's business affairs and for exercising all the Trust's powers except those reserved for the shareholders. The following tables give information about each Trustee and the senior officers of the Fund. Where required, the tables separately list Trustees who are “interested persons” of the Fund (i.e., “Interested” Trustees) and those who are not (i.e., “Independent” Trustees). Unless otherwise noted, the address of each person listed is Federated Investors Tower, 1001 Liberty Avenue, Pittsburgh, PA 15222. The address of all Independent Trustees listed is 4000 Ericsson Drive, Warrendale, PA 15086-7561; Attention: Mutual Fund Board. As of December 31, 2010, the Trust comprised 13 portfolio(s), and the Federated Fund Family consisted of 43 investment companies (comprising 136 portfolios). Unless otherwise noted, each Officer is elected annually. Unless otherwise noted, each Trustee oversees all portfolios in the Federated Fund Family and serves for an indefinite term. The Fund's Statement of Additional Information includes additional information about Trust Trustees and is available, without charge and upon request, by calling 1-800-341-7400.
Interested TRUSTEES Background
Name
Birth Date
Positions Held with Trust
Date Service Began | Principal Occupation(s) for Past Five Years,
Other Directorships Held and Previous Position(s) |
John F. Donahue*
Birth Date: July 28, 1924
Trustee
Began serving: April 1984 | Principal Occupations: Director or Trustee of the Federated Fund Family; Chairman and Director, Federated Investors, Inc.; Chairman of the Federated Fund Family's Executive Committee.
Previous Positions: Chairman of the Federated Fund Family; Trustee, Federated Investment Management Company; Chairman and Director, Federated Investment Counseling. |
J. Christopher Donahue*
Birth Date: April 11, 1949
President and Trustee
Began serving: January 2000 | Principal Occupations: Principal Executive Officer and President of the Federated Fund Family; Director or Trustee of some of the Funds in the Federated Fund Family; President, Chief Executive Officer and Director, Federated Investors, Inc.; Chairman and Trustee, Federated Investment Management Company; Trustee, Federated Investment Counseling; Chairman and Director, Federated Global Investment Management Corp.; Chairman, Federated Equity Management Company of Pennsylvania and Passport Research, Ltd. (investment advisory subsidiary of Federated); Trustee, Federated Shareholder Services Company; Director, Federated Services Company.
Previous Positions: President, Federated Investment Counseling; President and Chief Executive Officer, Federated Investment Management Company, Federated Global Investment Management Corp. and Passport Research, Ltd. |
| * | Family relationships and reasons for “interested” status: John F. Donahue is the father of J. Christopher Donahue; both are “interested” due to their beneficial ownership of shares of Federated Investors, Inc. and the positions they hold with Federated and its subsidiaries. |
Annual Shareholder ReportINDEPENDENT TRUSTEES Background
Name
Birth Date
Positions Held with Trust
Date Service Began | Principal Occupation(s) for Past Five Years,
Other Directorships Held, Previous Position(s) and Qualifications |
Nicholas P. Constantakis, CPA
Birth Date: September 3, 1939
Trustee
Began serving: February 1998 | Principal Occupation: Director or Trustee of the Federated Fund Family.
Other Directorship Held: Director and Chairman of the Audit Committee, Michael Baker Corporation (architecture, engineering and construction services).
Previous Position: Partner, Andersen Worldwide SC.
Qualifications: Public accounting and director experience. |
John F. Cunningham
Birth Date: March 5, 1943
Trustee
Began serving: January 1999 | Principal Occupation: Director or Trustee of the Federated Fund Family.
Other Directorships Held: Chairman, President and Chief Executive Officer, Cunningham & Co., Inc. (strategic business consulting); Trustee Associate, Boston College.
Previous Positions: Director, Redgate Communications and EMC Corporation (computer storage systems); Chairman of the Board and Chief Executive Officer, Computer Consoles, Inc.; President and Chief Operating Officer, Wang Laboratories; Director, First National Bank of Boston; Director, Apollo Computer, Inc.
Qualifications: Business management and director experience. |
Maureen Lally-Green
Birth Date: July 5, 1949
Trustee
Began serving: August 2009 | Principal Occupations: Director or Trustee of the Federated Fund Family; Director, Office of Church Relations, Diocese of Pittsburgh; Adjunct Professor of Law, Duquesne University School of Law.
Other Directorships Held: Director, Auberle; Trustee, St. Francis University; Director, Ireland Institute of Pittsburgh; Director, UPMC Mercy Hospital; Regent, St. Vincent Seminary; Director, Epilepsy Foundation of Western and Central Pennsylvania; Director, Saint Thomas More Society, Allegheny County.
Previous Position: Pennsylvania Superior Court Judge.
Qualifications: Legal and director experience. |
Peter E. Madden
Birth Date: March 16, 1942
Trustee
Began serving: November 1991 | Principal Occupation: Director or Trustee, and Chairman of the Board of Directors or Trustees, of the Federated Fund Family.
Previous Positions: Representative, Commonwealth of Massachusetts General Court; President, Chief Operating Officer and Director, State Street Bank and Trust Company and State Street Corporation (retired); Director, VISA USA and VISA International; Chairman and Director, Massachusetts Bankers Association; Director, Depository Trust Corporation; Director, The Boston Stock Exchange.
Qualifications: Business management, mutual fund services and director experience. |
Annual Shareholder ReportName
Birth Date
Positions Held with Trust
Date Service Began | Principal Occupation(s) for Past Five Years,
Other Directorships Held, Previous Position(s) and Qualifications |
Charles F. Mansfield, Jr.
Birth Date: April 10, 1945
Trustee
Began serving: January 1999 | Principal Occupations: Director or Trustee and Chairman of the Audit Committee of the Federated Fund Family; Management Consultant.
Previous Positions: Chief Executive Officer, PBTC International Bank; Partner, Arthur Young & Company (now Ernst & Young LLP); Chief Financial Officer of Retail Banking Sector, Chase Manhattan Bank; Senior Vice President, HSBC Bank USA (formerly Marine Midland Bank); Vice President, Citibank; Assistant Professor of Banking and Finance, Frank G. Zarb School of Business, Hofstra University; Executive Vice President, DVC Group, Inc. (marketing, communications and technology).
Qualifications: Banking, business management, education and director experience. |
R. James Nicholson
Birth Date: February 4, 1938
Trustee
Began serving: January 2008 | Principal Occupations: Director or Trustee of the Federated Fund Family; Senior Counsel, Brownstein Hyatt Farber Schrek, P.C.; Former Secretary of the U.S. Dept. of Veterans Affairs; Former U.S. Ambassador to the Holy See; Former Chairman of the Republican National Committee.
Other Directorships Held: Director, Horatio Alger Association; Director, The Daniels Fund, both charitable nonprofit organizations.
Previous Positions: Colonel, U.S. Army Reserve; Partner, Calkins, Kramer, Grimshaw and Harring, P.C.; General Counsel, Colorado Association of Housing and Building; Chairman and CEO, Nicholson Enterprises, Inc. (real estate holding company); Chairman and CEO, Renaissance Homes of Colorado.
Qualifications: Legal, government, business management and director experience. |
Thomas M. O'Neill
Birth Date: June 14, 1951
Trustee
Began serving: October 2006 | Principal Occupations: Director or Trustee of the Federated Fund Family; Sole Proprietor, Navigator Management Company (investment and strategic consulting).
Other Directorships Held: Board of Overseers, Children's Hospital of Boston; Visiting Committee on Athletics, Harvard College; Board of Directors, Medicines for Humanity.
Previous Positions: Chief Executive Officer and President, Managing Director and Chief Investment Officer, Fleet Investment Advisors; President and Chief Executive Officer, Aeltus Investment Management, Inc.; General Partner, Hellman, Jordan Management Co., Boston, MA; Chief Investment Officer, The Putnam Companies, Boston, MA; Credit Analyst and Lending Officer, Fleet Bank; Director and Consultant, EZE Castle Software (investment order management software); Director, Midway Pacific (lumber).
Qualifications: Business management, mutual fund, director and investment experience. |
Annual Shareholder ReportName
Birth Date
Positions Held with Trust
Date Service Began | Principal Occupation(s) for Past Five Years,
Other Directorships Held, Previous Position(s) and Qualifications |
John S. Walsh
Birth Date: November 28, 1957
Trustee
Began serving: January 1999 | Principal Occupations: Director or Trustee of the Federated Fund Family; President and Director, Heat Wagon, Inc. (manufacturer of construction temporary heaters); President and Director, Manufacturers Products, Inc. (distributor of portable construction heaters); President, Portable Heater Parts, a division of Manufacturers Products, Inc.
Previous Position: Vice President, Walsh & Kelly, Inc.
Qualifications: Business management and director experience. |
James F. Will
Birth Date: October 12, 1938
Trustee
Began serving: April 2006 | Principal Occupations: Director or Trustee of the Federated Fund Family; formerly, Vice Chancellor and President, Saint Vincent College.
Other Directorships Held: Trustee, Saint Vincent College; Director, Alleghany Corporation; Trustee, Wheeling Jesuit University; Director, Liberty Tire Recycling.
Previous Positions: Chairman, President and Chief Executive Officer, Armco, Inc.; President and Chief Executive Officer, Cyclops Industries; President and Chief Operating Officer, Kaiser Steel Corporation.
Qualifications: Business management, education and director experience. |
OFFICERS
Name
Birth Date
Address
Positions Held with Trust
Date Service Began | Principal Occupation(s) for Past Five Years
and Previous Position(s) |
John W. McGonigle
Birth Date: October 26, 1938
EXECUTIVE VICE PRESIDENT AND SECRETARY
Began serving: April 1984 | Principal Occupations: Executive Vice President and Secretary of the Federated Fund Family; Vice Chairman, Executive Vice President, Secretary and Director, Federated Investors, Inc.
Previous Positions: Trustee, Federated Investment Management Company and Federated Investment Counseling; Director, Federated Global Investment Management Corp., Federated Services Company and Federated Securities Corp. |
Richard A. Novak
Birth Date: December 25, 1963
TREASURER
Began serving: January 2006 | Principal Occupations: Principal Financial Officer and Treasurer of the Federated Fund Family; Senior Vice President, Federated Administrative Services; Financial and Operations Principal for Federated Securities Corp., Edgewood Services, Inc. and Southpointe Distribution Services, Inc.
Previous Positions: Controller of Federated Investors, Inc.; Vice President, Finance of Federated Services Company; held various financial management positions within The Mercy Hospital of Pittsburgh; Auditor, Arthur Andersen & Co. |
Annual Shareholder ReportName
Birth Date
Address
Positions Held with Trust
Date Service Began | Principal Occupation(s) for Past Five Years
and Previous Position(s) |
Richard B. Fisher
Birth Date: May 17, 1923
VICE PRESIDENT
Began serving: April 1984 | Principal Occupations: Vice Chairman or Vice President of some of the Funds in the Federated Fund Family; Vice Chairman, Federated Investors, Inc.; Chairman, Federated Securities Corp.
Previous Positions: President and Director or Trustee of some of the Funds in the Federated Fund Family; Executive Vice President, Federated Investors, Inc.; Director and Chief Executive Officer, Federated Securities Corp. |
Brian P. Bouda
Birth Date: February 28, 1947
CHIEF COMPLIANCE OFFICER AND SENIOR VICE PRESIDENT
Began serving: August 2004 | Principal Occupations: Senior Vice President and Chief Compliance Officer of the Federated Fund Family; Vice President and Chief Compliance Officer of Federated Investors, Inc. and Chief Compliance Officer of its subsidiaries. Mr. Bouda joined Federated in 1999 and is a member of the American Bar Association and the State Bar Association of Wisconsin. |
Stephen F. Auth
Birth Date: September 3, 1956
450 Lexington Avenue
Suite 3700
New York, NY 10017-3943
CHIEF INVESTMENT OFFICER
Began serving: November 2002 | Principal Occupations: Mr. Auth is Chief Investment Officer of this Fund and various other Funds in the Federated Fund Family; Executive Vice President, Federated Investment Counseling, Federated Global Investment Management Corp. and Federated Equity Management Company of Pennsylvania.
Previous Positions: Executive Vice President, Federated Investment Management Company, and Passport Research, Ltd. (investment advisory subsidiary of Federated); Senior Vice President, Global Portfolio Management Services Division; Senior Vice President, Federated Investment Management Company and Passport Research, Ltd.; Senior Managing Director and Portfolio Manager, Prudential Investments. |
Walter C. Bean
Birth Date: June 22, 1945
VICE PRESIDENT
Began serving: November 2006 | Principal Occupations: Walter C. Bean has been the Fund's Portfolio Manager since inception. Walter C. Bean is Vice President of the Trust. Mr. Bean is a Senior Vice President, Senior Portfolio Manager and the Head of the Equity Income Management Team of the Fund's Adviser. Mr. Bean joined Federated in 2000. His previous associations included: various investment management and research positions with C.S. McKee & Company, First Chicago Investment Advisors, CIGNA Investment Advisors and Mellon Bank. Mr. Bean earned a Bachelors Degree in Business Administration from Ohio University and an M.B.A. from the Pennsylvania State University. Mr. Bean has received the Chartered Financial Analyst designation and has 42 years of investment experience. |
Annual Shareholder Report Evaluation and Approval of Advisory Contract – May 2011
Federated Strategic Value dividend fund (the “Fund”)
(formerly, Federated Strategic Value Fund)
The Fund's Board reviewed the Fund's investment advisory contract at meetings held in May 2011. The Board's decision regarding the contract reflects the exercise of its business judgment on whether to continue the existing arrangements.
In this connection, the Federated Funds' Board had previously appointed a Senior Officer, whose duties include specified responsibilities relating to the process by which advisory fees are to be charged to a Federated fund. The Senior Officer has the authority to retain consultants, experts, or staff as may be reasonably necessary to assist in the performance of his duties, reports directly to the Board, and may be terminated only with the approval of a majority of the independent members of the Board. The Senior Officer prepared and furnished to the Board an independent, written evaluation that covered topics discussed below (the “Evaluation”). The Board considered that Evaluation, along with other information, in deciding to approve the advisory contract.
During its review of the contract, the Board considered compensation and benefits received by the Adviser. This included the fees received for services provided to the Fund by other entities in the Federated organization and research services (if any) received by the Adviser from brokers that execute Federated fund trades, as well as advisory fees. The Board is also familiar with and considered judicial decisions concerning allegedly excessive investment advisory fees, which have indicated that the following factors may be relevant to an Adviser's fiduciary duty with respect to its receipt of compensation from a fund: the nature and quality of the services provided by the Adviser, including the performance of the fund; the Adviser's cost of providing the services; the extent to which the Adviser may realize “economies of scale” as a fund grows larger; any indirect benefits that may accrue to the Adviser and its affiliates as a result of the Adviser's relationship with a fund; performance and expenses of comparable funds; and the extent to which the independent Board members are fully informed about all facts the Board deems relevant bearing on the Adviser's services and fees. The Board further considered management fees (including any components thereof) charged to institutional and other clients of the Adviser for what might be viewed as like services, and the cost to the Adviser and its affiliates of supplying services pursuant to the management fee agreements, excluding any intra-corporate profit and profit margins of the Adviser and its affiliates for supplying such services. The Board was aware of these factors and was guided by them in its review of the Fund's advisory contract to the extent it considered them to be appropriate and relevant, as discussed further below.
Annual Shareholder Report
The Board considered and weighed these circumstances in light of its substantial accumulated experience in governing the Fund and working with Federated on matters relating to the Federated funds, and was assisted in its deliberations by independent legal counsel. Throughout the year, the Board has requested and received substantial and detailed information about the Fund and the Federated organization that was in addition to the extensive materials that comprise and accompany the Senior Officer's Evaluation. Federated provided much of this information at each regular meeting of the Board, and furnished additional information in connection with the particular meeting at which the Board's formal review of the advisory contract occurred. Between regularly scheduled meetings, the Board also received information on particular matters as the need arose. Thus, the Board's consideration of the advisory contract included review of the Senior Officer's Evaluation, accompanying data and additional information covering such matters as: the Adviser's investment philosophy, revenue, profitability, personnel and processes; investment and operating strategies; the Fund's short- and long-term performance (in absolute terms, both on a gross basis and net of expenses, as well as in relationship to its particular investment program and certain competitor or “peer group” funds and/or other benchmarks, as appropriate), and comments on the reasons for performance; the Fund's investment objectives; the Fund's expenses (including the advisory fee itself and the overall expense structure of the Fund, both in absolute terms and relative to similar and/or competing funds, with due regard for contractual or voluntary expense limitations); the use and allocation of brokerage commissions derived from trading the Fund's portfolio securities (if any); and the nature, quality and extent of the advisory and other services provided to the Fund by the Adviser and its affiliates. The Board also considered the preferences and expectations of Fund shareholders and their relative sophistication; the continuing state of competition in the mutual fund industry and market practices; the range of comparable fees for similar funds in the mutual fund industry; the Fund's relationship to the Federated family of funds which include a comprehensive array of funds with different investment objectives, policies and strategies which are available for exchange without the incurrence of additional sales charges; compliance and audit reports concerning the Federated funds and the Federated companies that service them (including communications from regulatory agencies), as well as Federated's responses to any issues raised therein; and relevant developments in the mutual fund industry and how the Federated funds and/or Federated are responding to them. The Board's evaluation process is evolutionary. The criteria considered and the emphasis placed on relevant criteria change in recognition of changing circumstances in the mutual fund marketplace.With respect to the Fund's performance and expenses in particular, the Board has found the use of comparisons to other mutual funds with comparable investment programs to be relevant, given the high degree of competition in the mutual fund business. The Board focused on comparisons with other similar Annual Shareholder Report
mutual funds more heavily than non-mutual fund products or services because it is believed that they are more relevant. For example, other mutual funds are the products most like the Fund, they are readily available to Fund shareholders as alternative investment vehicles, and they are the type of investment vehicle in fact chosen and maintained by the Fund's investors. The range of their fees and expenses therefore appears to be a generally reliable indication of what consumers have found to be reasonable in the precise marketplace in which the Fund competes. The Fund's ability to deliver competitive performance when compared to its peer group was a useful indicator of how the Adviser is executing the Fund's investment program, which in turn assisted the Board in reaching a conclusion that the nature, extent, and quality of the Adviser's investment management services were such as to warrant continuation of the advisory contract. In this regard, the Senior Officer has reviewed Federated's fees for providing advisory services to products outside the Federated family of funds (e.g., institutional and separate accounts). He concluded that mutual funds and institutional accounts are inherently different products. Those differences include, but are not limited to, different types of targeted investors; being subject to different laws and regulations; different legal structures; different average account sizes; different associated costs; different portfolio management techniques made necessary by different cash flows; and portfolio manager time spent in review of securities pricing. The Senior Officer did not consider these fee schedules to be determinative in judging the appropriateness of mutual fund advisory contracts.The Senior Officer reviewed information compiled by Federated, using data supplied by independent fund ranking organizations, regarding the performance of, and fees charged by, other mutual funds, noting his view that comparisons to fund peer groups are relevant in judging the reasonableness of proposed fees.
For the periods covered by the Evaluation, the Fund's performance for the five-year period was above the median of the relevant peer group, the Fund's performance for the three-year period was at the median of the relevant peer group and the Fund's performance fell below the median of the relevant peer group for the one-year period. The Board discussed the Fund's performance with the Adviser and recognized the efforts being undertaken by the Adviser. The Board will continue to monitor these efforts and the performance of the Fund.
The Board also received financial information about Federated, including information regarding the compensation and benefits Federated derived from its relationships with the Federated funds. This information covered not only the fees under the advisory contracts, but also fees received by Federated's subsidiaries for providing other services to the Federated funds under separate contracts (e.g., for serving as the Federated funds' administrator). The information also detailed any indirect benefit Federated may derive from its receipt of research services from brokers who execute Federated fund trades. In addition, the Board considered the fact that, in order for a fund to be Annual Shareholder Report
competitive in the marketplace, Federated and its affiliates frequently waived fees and/or reimbursed expenses and have disclosed to fund investors and/or indicated to the Board their intention to do so in the future, where appropriate. Moreover, the Board receives regular reporting as to the institution or elimination of these voluntary waivers.Federated furnished information, requested by the Senior Officer, that reported revenues on a fund-by-fund basis and made estimates of the allocation of expenses on a fund-by-fund basis, using allocation methodologies specified by the Senior Officer. The Senior Officer noted that, although they may apply consistent allocation processes, the inherent difficulties in allocating costs (and the unavoidable arbitrary aspects of that exercise) and the lack of consensus on how to allocate those costs may render such allocation information unreliable. The allocation information was considered in the analysis by the Board but was determined to be of limited use.
The Board and the Senior Officer also reviewed information compiled by Federated comparing profitability information for Federated to other publicly held fund management companies. In this regard, the Senior Officer noted the limited availability of such information, but nonetheless concluded that Federated's profit margins did not appear to be excessive and the Board agreed.
The Senior Officer's Evaluation also discussed the notion of possible realization of “economies of scale” as a fund grows larger. The Board considered in this regard that the Adviser has made significant and long-term investments in areas that support all of the Federated funds, such as personnel and processes for the portfolio management, compliance, internal audit, and risk management functions; and systems technology; and that the benefits of these efforts (as well as any economies, should they exist) were likely to be enjoyed by the fund complex as a whole. Finally, the Board also noted the absence of any applicable regulatory or industry guidelines on this subject, which (as discussed in the Senior Officer's Evaluation) is compounded by the lack of any common industry practice or general pattern with respect to structuring fund advisory fees with “breakpoints” that serve to reduce the fee as the fund attains a certain size. The Senior Officer did not recommend institution of breakpoints in pricing Federated's fund advisory services at this time.
It was noted in the materials for the Board meeting that for the period covered by the Evaluation, the Fund's investment advisory fee, after waivers and expense reimbursements, if any, was below the median of the relevant peer group. The Board reviewed the fees and other expenses of the Fund with the Adviser and was satisfied that the overall expense structure of the Fund remained competitive.
The Senior Officer noted that, considering the totality of the circumstances, and all of the factors referenced within his Evaluation, he had concluded that, subject to comments and recommendations made within his Evaluation, his observations and the information accompanying the Evaluation supported a finding by the Board that the management fees for each of the funds are Annual Shareholder Report
reasonable and that Federated appeared to provide appropriate administrative services to the Fund for the fees paid. Under these circumstances, no changes were recommended to, and no objection was raised to, the continuation of the Fund's advisory contract. The Board concluded that the nature, quality and scope of services provided the Fund by the Adviser and its affiliates were satisfactory.In its decision to continue an existing investment advisory contract, the Board was mindful of the potential disruptions of the Fund's operations and various risks, uncertainties and other effects that could occur as a result of a decision to terminate or not renew an advisory contract. In particular, the Board recognized that many shareholders have invested in the Fund on the strength of the Adviser's industry standing and reputation and with the expectation that the Adviser will have a continuing role in providing advisory services to the Fund. Thus, the Board's approval of the advisory contract reflected the fact that it is the shareholders who have effectively selected the Adviser by virtue of having invested in the Fund.
The Board based its decision to approve the advisory contract on the totality of the circumstances and relevant factors and with a view to past and future long-term considerations. Not all of the factors and considerations identified above were necessarily relevant to the Fund, nor did the Board consider any one of them to be determinative. With respect to the factors that were relevant, the Board's decision to approve the contract reflects its determination that Federated's performance and actions provided a satisfactory basis to support the decision to continue the existing arrangements.
Annual Shareholder Report Voting Proxies on Fund Portfolio Securities
A description of the policies and procedures that the Fund uses to determine how to vote proxies, if any, relating to securities held in the Fund's portfolio is available, without charge and upon request, by calling 1-800-341-7400. A report on “Form N-PX” of how the Fund voted any such proxies during the most recent 12-month period ended June 30 is available from Federated's website at FederatedInvestors.com. To access this information from the home page, select “All” under “Asset Classes.” Select a fund name and share class, if applicable, to go to the Fund Overview page. On the Fund Overview page, select the “Documents” tab. At the bottom of that page, select “Proxy Voting Record Report (Form N-PX).” Form N-PX filings are also available at the SEC's website at www.sec.gov.
Quarterly Portfolio Schedule
The Fund files with the SEC a complete schedule of its portfolio holdings, as of the close of the first and third quarters of its fiscal year, on “Form N-Q.” These filings are available on the SEC's website at www.sec.gov and may be reviewed and copied at the SEC's Public Reference Room in Washington, DC. (Call 1-800-SEC-0330 for information on the operation of the Public Reference Room.) You may also access this information from the “Products” section of Federated's website at FederatedInvestors.com. From the home page, select “All” under “Asset Classes.” Select a fund name and share class, if applicable, to go to the Fund Overview page. On the Fund Overview page, select the “Documents” tab. At the bottom of that page, select “Form N-Q.”
Annual Shareholder ReportMutual funds are not bank deposits or obligations, are not guaranteed by any bank and are not insured or guaranteed by the U.S. government, the Federal Deposit Insurance Corporation, the Federal Reserve Board or any other government agency. Investment in mutual funds involves investment risk, including the possible loss of principal.
This Report is authorized for distribution to prospective investors only when preceded or accompanied by the Fund's Prospectus, which contains facts concerning its objective and policies, management fees, expenses and other information.
Federated Strategic Value Dividend Fund
Federated Investors Funds
4000 Ericsson Drive
Warrendale, PA 15086-7561
Contact us at FederatedInvestors.com
or call 1-800-341-7400.
Federated Securities Corp., Distributor
Cusip 314172586
Cusip 314172578
Cusip 314172560
33982 (12/11)
Federated is a registered trademark of Federated Investors, Inc.
2011 © Federated Investors, Inc.
Item 2. Code of Ethics
(a) As of the end of the period covered by this report, the registrant has adopted a code of ethics (the "Section 406 Standards for Investment Companies - Ethical Standards for Principal Executive and Financial Officers") that applies to the registrant's Principal Executive Officer and Principal Financial Officer; the registrant's Principal Financial Officer also serves as the Principal Accounting Officer.
(c) Not Applicable
(d) Not Applicable
(e) Not Applicable
(f)(3) The registrant hereby undertakes to provide any person, without charge, upon request, a copy of the code of ethics. To request a copy of the code of ethics, contact the registrant at 1-800-341-7400, and ask for a copy of the Section 406 Standards for Investment Companies - Ethical Standards for Principal Executive and Financial Officers.
Item 3. Audit Committee Financial Expert
The registrant's Board has determined that each of the following members of the Board's Audit Committee is an “audit committee financial expert,” and is "independent," for purposes of this Item: Nicholas P. Constantakis, Charles F. Mansfield, Jr., Thomas M. O'Neill and John S. Walsh.
Item 4. Principal Accountant Fees and Services
(a) Audit Fees billed to the registrant for the two most recent fiscal years:
Fiscal year ended 2011 - $355,700
Fiscal year ended 2010 - $379,900
(b) Audit-Related Fees billed to the registrant for the two most recent fiscal years:
Fiscal year ended 2011 - $97
Fiscal year ended 2010 - $7,510
Fiscal year ended 2011- Travel to Audit Committee meetings.
Fiscal year ended 2010- Travel to Audit Committee meetings and audit procedures in connection with fund reorganization.
Amount requiring approval of the registrant’s audit committee pursuant to paragraph (c)(7)(ii) of Rule 2-01 of Regulation S-X, $2,328 and $7,288 respectively. Fiscal year ended 2011- Audit consent fee for N-14 merger documents. Fiscal year ended 2010- Audit consent fees for N-14 merger documents and new share class prospectus.
(c) Tax Fees billed to the registrant for the two most recent fiscal years:
Fiscal year ended 2011 - $0
Fiscal year ended 2010 - $0
Amount requiring approval of the registrant’s audit committee pursuant to paragraph (c)(7)(ii) of Rule 2-01 of Regulation S-X, $22,932 and $0 respectively. Fiscal year ended 2011- Tax preparation fees for fiscal year end 2010.
(d) All Other Fees billed to the registrant for the two most recent fiscal years:
Fiscal year ended 2011 - $0
Fiscal year ended 2010 - $0
Amount requiring approval of the registrant’s audit committee pursuant to paragraph (c)(7)(ii) of Rule 2-01 of Regulation S-X, $41,364 and $32,356 respectively. Fiscal year ended 2011- Service fee for analysis of potential Passive Foreign Investment Company holdings. Fiscal year ended 2010- Service fee for analysis of potential Passive Foreign Investment Company holdings.
(e)(1) Audit Committee Policies regarding Pre-approval of Services.
The Audit Committee is required to pre-approve audit and non-audit services performed by the independent auditor in order to assure that the provision of such services do not impair the auditor’s independence. Unless a type of service to be provided by the independent auditor has received general pre-approval, it will require specific pre-approval by the Audit Committee. Any proposed services exceeding pre-approved cost levels will require specific pre-approval by the Audit Committee.
Certain services have the general pre-approval of the Audit Committee. The term of the general pre-approval is 12 months from the date of pre-approval, unless the Audit Committee specifically provides for a different period. The Audit Committee will annually review the services that may be provided by the independent auditor without obtaining specific pre-approval from the Audit Committee and may grant general pre-approval for such services. The Audit Committee will revise the list of general pre-approved services from time to time, based on subsequent determinations. The Audit Committee will not delegate its responsibilities to pre-approve services performed by the independent auditor to management.
The Audit Committee has delegated pre-approval authority to its Chairman. The Chairman will report any pre-approval decisions to the Audit Committee at its next scheduled meeting. The Committee will designate another member with such pre-approval authority when the Chairman is unavailable.
AUDIT SERVICES
The annual Audit services engagement terms and fees will be subject to the specific pre-approval of the Audit Committee. The Audit Committee must approve any changes in terms, conditions and fees resulting from changes in audit scope, registered investment company (RIC) structure or other matters.
In addition to the annual Audit services engagement specifically approved by the Audit Committee, the Audit Committee may grant general pre-approval for other Audit Services, which are those services that only the independent auditor reasonably can provide. The Audit Committee has pre-approved certain Audit services, all other Audit services must be specifically pre-approved by the Audit Committee.
AUDIT-RELATED SERVICES
Audit-related services are assurance and related services that are reasonably related to the performance of the audit or review of the Company’s financial statements or that are traditionally performed by the independent auditor. The Audit Committee believes that the provision of Audit-related services does not impair the independence of the auditor, and has pre-approved certain Audit-related services, all other Audit-related services must be specifically pre-approved by the Audit Committee.
TAX SERVICES
The Audit Committee believes that the independent auditor can provide Tax services to the Company such as tax compliance, tax planning and tax advice without impairing the auditor’s independence. However, the Audit Committee will not permit the retention of the independent auditor in connection with a transaction initially recommended by the independent auditor, the purpose of which may be tax avoidance and the tax treatment of which may not be supported in the Internal Revenue Code and related regulations. The Audit Committee has pre-approved certain Tax services, all Tax services involving large and complex transactions must be specifically pre-approved by the Audit Committee.
ALL OTHER SERVICES
With respect to the provision of services other than audit, review or attest services the pre-approval requirement is waived if:
(1) The aggregate amount of all such services provided constitutes no more than five percent of the total amount of revenues paid by the registrant, the registrant’s adviser (not including any sub-adviser whose role is primarily portfolio management and is subcontracted with or overseen by another investment adviser), and any entity controlling, controlled by, or under common control with the investment adviser that provides ongoing services to the registrant to its accountant during the fiscal year in which the services are provided;
(2) Such services were not recognized by the registrant, the registrant’s adviser (not including any sub-adviser whose role is primarily portfolio management and is subcontracted with or overseen by another investment adviser), and any entity controlling, controlled by, or under common control with the investment adviser that provides ongoing services to the registrant at the time of the engagement to be non-audit services; and
(3) Such services are promptly brought to the attention of the Audit Committee of the issuer and approved prior to the completion of the audit by the Audit Committee or by one or more members of the Audit Committee who are members of the board of directors to whom authority to grant such approvals has been delegated by the Audit Committee.
The Audit Committee may grant general pre-approval to those permissible non-audit services classified as All Other services that it believes are routine and recurring services, and would not impair the independence of the auditor.
The SEC’s rules and relevant guidance should be consulted to determine the precise definitions of prohibited non-audit services and the applicability of exceptions to certain of the prohibitions.
PRE-APPROVAL FEE LEVELS
Pre-approval fee levels for all services to be provided by the independent auditor will be established annually by the Audit Committee. Any proposed services exceeding these levels will require specific pre-approval by the Audit Committee.
PROCEDURES
Requests or applications to provide services that require specific approval by the Audit Committee will be submitted to the Audit Committee by both the independent auditor and the Principal Accounting Officer and/or Internal Auditor, and must include a joint statement as to whether, in their view, the request or application is consistent with the SEC’s rules on auditor independence.
(e)(2) Percentage of services identified in items 4(b) through 4(d) that were approved by the registrants audit committee pursuant to paragraph (c)(7)(i)(C) of Rule 2-01 of Regulation S-X:
4(b)
Fiscal year ended 2011 – 0%
Fiscal year ended 2010 - 0%
Percentage of services provided to the registrants investment adviser and any entity controlling, controlled by, or under common control with the investment adviser that provides ongoing services to the registrant that were approved by the registrants audit committee pursuant to paragraph (c)(7)(i)(C) of Rule 2-01 of Regulation S-X, 0% and 0% respectively.
4(c)
Fiscal year ended 2011 – 0%
Fiscal year ended 2010 – 0%
Percentage of services provided to the registrants investment adviser and any entity controlling, controlled by, or under common control with the investment adviser that provides ongoing services to the registrant that were approved by the registrants audit committee pursuant to paragraph (c)(7)(i)(C) of Rule 2-01 of Regulation S-X, 0% and 0% respectively.
4(d)
Fiscal year ended 2011 – 0%
Fiscal year ended 2010 – 0%
Percentage of services provided to the registrants investment adviser and any entity controlling, controlled by, or under common control with the investment adviser that provides ongoing services to the registrant that were approved by the registrants audit committee pursuant to paragraph (c)(7)(i)(C) of Rule 2-01 of Regulation S-X, 0% and 0% respectively.
(f) NA
(g) Non-Audit Fees billed to the registrant, the registrant’s investment adviser, and certain entities controlling, controlled by or under common control with the investment adviser:
Fiscal year ended 2011 - $524,043
Fiscal year ended 2010 - $514,701
(h) The registrant’s Audit Committee has considered that the provision of non-audit services that were rendered to the registrant’s adviser (not including any sub-adviser whose role is primarily portfolio management and is subcontracted with or overseen by another investment adviser), and any entity controlling, controlled by, or under common control with the investment adviser that provides ongoing services to the registrant that were not pre-approved pursuant to paragraph (c)(7)(ii) of Rule 2-01 of Regulation S-X is compatible with maintaining the principal accountant’s independence.
Item 5. Audit Committee of Listed Registrants
Not Applicable
Item 6. Schedule of Investments
(a) The registrant’s Schedule of Investments is included as part of the Report to Stockholders filed under Item 1 of this form.
(b) Not Applicable; Fund had no divestments during the reporting period covered since the previous Form N-CSR filing.
Item 7. Disclosure of Proxy Voting Policies and Procedures for Closed-End Management Investment Companies
Not Applicable
Item 8. Portfolio Managers of Closed-End Management Investment Companies
Not Applicable
Item 9. Purchases of Equity Securities by Closed-End Management Investment Company and Affiliated Purchasers
Not Applicable
Item 10. Submission of Matters to a Vote of Security Holders
Not Applicable
Item 11. Controls and Procedures
(a) The registrant’s President and Treasurer have concluded that the
registrant’s disclosure controls and procedures (as defined in rule 30a-3(c) under the Act) are effective in design and operation and are sufficient to form the basis of the certifications required by Rule 30a-(2) under the Act, based on their evaluation of these disclosure controls and procedures within 90 days of the filing date of this report on Form N-CSR.
(b) There were no changes in the registrant’s internal control over financial reporting (as defined in rule 30a-3(d) under the Act) during the second fiscal quarter of the period covered by this report that have materially affected, or are reasonably likely to materially affect, the registrant’s internal control over financial reporting.
Item 12. Exhibits
(a)(1) Code of Ethics- Not Applicable to this Annual Report.
(a)(2) Certifications of Principal Executive Officer and Principal Financial Officer.
(a)(3) Not Applicable.
(b) Certifications pursuant to 18 U.S.C. Section 1350.
SIGNATURES
Pursuant to the requirements of the Securities Exchange Act of 1934 and the Investment Company Act of 1940, the registrant has duly caused this report to be signed on its behalf by the undersigned, thereunto duly authorized.
Registrant Federated Equity Funds
By /S/ Richard A. Novak
Richard A. Novak, Principal Financial Officer
Date December 16, 2011
Pursuant to the requirements of the Securities Exchange Act of 1934 and the Investment Company Act of 1940, this report has been signed below by the following persons on behalf of the registrant and in the capacities and on the dates indicated.
By /S/ J. Christopher Donahue
J. Christopher Donahue, Principal Executive Officer
Date December 16, 2011
By /S/ Richard A. Novak
Richard A. Novak, Principal Financial Officer
Date December 16, 2011