United States
Securities and Exchange Commission
Washington, D.C. 20549
Form N-CSR
Certified Shareholder Report of Registered Management Investment Companies
811-4017
(Investment Company Act File Number)
Federated Equity Funds
_______________________________________________________________
(Exact Name of Registrant as Specified in Charter)
Federated Investors Funds
4000 Ericsson Drive
Warrendale, Pennsylvania 15086-7561
(Address of Principal Executive Offices)
(412) 288-1900
(Registrant's Telephone Number)
John W. McGonigle, Esquire
Federated Investors Tower
1001 Liberty Avenue
Pittsburgh, Pennsylvania 15222-3779
(Name and Address of Agent for Service)
(Notices should be sent to the Agent for Service)
Date of Fiscal Year End: 10/31/2012
Date of Reporting Period: 10/31/2012
Item 1. Reports to Stockholders

Annual Shareholder Report
October 31, 2012
| Share Class | Ticker |
| A | FEDEX |
| B | CPABX |
| C | CPACX |
| R | CPAKX |
| Institutional | CPAIX |
Federated Capital Appreciation Fund
Fund Established 1977
A Portfolio of Federated Equity Funds
Dear Valued Shareholder,
I am pleased to present the Annual Shareholder Report for your fund covering the period from November 1, 2011 through October 31, 2012. This report includes Management's Discussion of Fund Performance, a complete listing of your fund's holdings, performance information and financial statements along with other important fund information.
In addition, our website, FederatedInvestors.com, offers easy access to Federated resources that include timely fund updates, economic and market insights from our investment strategists, and financial planning tools. We invite you to register to take full advantage of its capabilities.
Thank you for investing with Federated. I hope you find this information useful and look forward to keeping you informed.
Sincerely,
J. Christopher Donahue, President
Not FDIC Insured • May Lose Value • No Bank Guarantee
Management's Discussion of Fund Performance (unaudited)
The Fund's total return, based on net asset value, for the 12-month reporting period ended October 31, 2012, was 9.46% for the Class A Shares, 8.45% for the Class B Shares, 8.52% for the Class C Shares, 9.14% for the Class R Shares and 9.67% for the Institutional Shares. The total return of the Standard and Poor's 500 Index (S&P 500),1 the Fund's broad-based securities market index, was 15.21% for the same period. The Fund's total return for the fiscal year reflected actual cash flows, transaction costs and other expenses which were not reflected in the total return of the S&P 500.
The following discussion will focus on the performance of the Fund's Institutional Shares.
MARKET OVERVIEW
Stocks, as measured by the S&P 500, rose 15.21% during the 12-month period. While mixed, equity market performance during the fiscal year was led by the market's preference for mostly cyclically leveraged stocks. Telecom Services and Healthcare were the strongest performing sectors within the S&P 500, rising 26.22% and 21.95%, respectively. Energy and Materials were the notable underperforming sectors within the S&P 500.
FUND PERFORMANCE
During the reporting period, the Fund underperformed the S&P 500. The majority of the Fund's underperformance was driven by stock selection. The Fund's relative performance was constrained by poor stock selection within the Information Technology, Healthcare and Materials sectors.
The Fund began the reporting period with overweight positions in the cyclical or growth areas of the market (Industrials, Consumer Discretionary, Energy and Technology). The Fund increased this positioning as the year progressed. While the market had plenty of things to worry about (i.e. European debt crisis, the threat of simultaneous spending cuts and tax increases in the U.S. that are slated to take place at the end of 2012 (i.e., the “fiscal cliff”), U.S. presidential election and Middle East uncertainty), Fund management believed the U.S. economy was showing positive signs of growth, primarily in the housing sector and employment. These trends, coupled with the Federal Reserve continuing to add stimulus through quantitative easing measures, led to the pro-cyclical positioning of the Fund. The sector tilt toward the pro-cyclical areas disappointed, however, during the reporting period as stock selection in the Industrials and Energy sectors underperformed the S&P 500. Investments in the Telecom and Consumer Staples sectors, on the other hand, outperformed the S&P 500. Fund management continued to see positive developments for stocks and thus saw no reason, based on the following factors, to shift
Annual Shareholder Report
strategy: corporations were in good financial shape, the Federal Reserve continued to be very accommodating, the U.S. government showed progress towards a resolution to improve the fiscal situation and the European Central Bank was being proactive on resolving the European debt crisis.
The top five positive contributors within the portfolio were: Apple Computers, Discover Financials, Pharmasset Inc., General Electric Co. and Discovery Communications. The largest negative contributors were: Idenix Pharmaceuticals, Centene Corp., Newmont Mining Corp., Sandisk Corp. and ON Semiconductor.
Please note that a Special Meeting of Shareholders of the Fund will be held at 4000 Ericsson Drive, Warrendale, Pennsylvania 15086-7561, at 10:00 AM (Eastern Time), on March 11, 2013 so that shareholders may approve or disapprove a proposed Agreement and Plan of Reorganization pursuant to which Federated Equity Income Fund, Inc., would acquire all or substantially all of the assets of the Fund in exchange for Class A Shares, Class B Shares, Class C Shares, Class R Shares and Institutional Shares of Federated Equity Income Fund, Inc. The shares of Federated Equity Income Fund, Inc. held by the Fund would then be distributed to the Fund's Shareholders, pro rata, in complete liquidation and termination of the Fund. A prospectus/proxy statement with respect to the proposed reorganization will be mailed to shareholders and filed with the Securities and Exchange Commission (SEC). Shareholders are urged to read the prospectus/proxy statement as it contains important information. The prospectus/proxy statement and other relevant documents will be available free of charge on the SEC's website at www.sec.gov or by calling 1-800-341-7000.
| 1 | The S&P 500 Index is a capitalization-weighted index of 500 stocks designed to measure performance of the broad domestic economy through changes in the aggregate market value of 500 stocks representing all major industries. The index is unmanaged, and it is not possible to invest directly in an index. |
Annual Shareholder Report
FUND PERFORMANCE AND GROWTH OF A $10,000 INVESTMENT
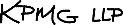
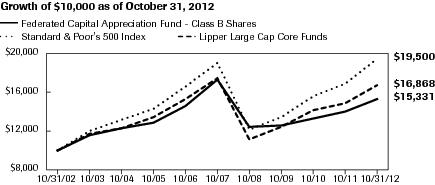
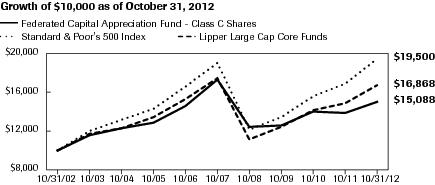
The Fund's Institutional Shares and Class R Shares commenced operations on December 31, 2007 and April 8, 2003, respectively. For the period prior to the commencement of operations of the Institutional Shares, the performance information shown is for the Fund's Class A Shares. The performance of the Class A Shares has not been adjusted to reflect the expenses of the Institutional Shares since the Institutional Shares have a lower expense ratio than the expense ratio of the Class A Shares. The performance of Class A Shares has been adjusted to remove any voluntary waiver of Fund expenses that may have occurred during the period prior to the commencement of operations of the Institutional Shares. For the period prior to commencement of operations of the Class R Shares, the performance information shown is for the Fund's Class A Shares, adjusted to reflect the expense of the Class R Shares. The Average Annual Total Return table below shows returns for each class averaged over the stated periods. The graphs below illustrate the hypothetical investment of $10,0001 in the Federated Capital Appreciation Fund (the “Fund”) from October 31, 2002 to October 31, 2012, compared to the Standard & Poor's 500 Index (S&P 500)2 and the Lipper Large-Cap Core Funds Average (LLCCFA).2
Average Annual Total Returns for the Period Ended 10/31/2012
(returns reflect all applicable sales charges and contingent deferred sales charges as specified below in footnote #1)
| Share Class | 1 Year | 5 Years | 10 Years |
| Class A Shares | 3.45% | -3.10% | 4.45% |
| Class B Shares | 2.95% | -3.13% | 4.37% |
| Class C Shares | 7.52% | -2.79% | 4.20% |
| Class R Shares | 9.14% | -2.35% | 4.62% |
| Institutional Shares | 9.67% | -1.75% | 5.17% |
Performance data quoted represents past performance which is no guarantee of future results. Investment return and principal value will fluctuate so that an investor's shares, when redeemed, may be worth more or less than their original cost. Mutual fund performance changes over time and current performance may be lower or higher than what is stated. For current to the most recent month-end performance and after-tax returns, visit FederatedInvestors.com or call 1-800-341-7400. Returns shown do not reflect the deduction of taxes that a shareholder would pay on Fund distributions or the redemption of Fund shares. Mutual funds are not obligations of or guaranteed by any bank and are not federally insured.
Annual Shareholder Report
Growth of a $10,000 Investment–CLASS A SHARES

| Federated Capital Appreciation Fund - Class A Shares | C000026725 | Standard & Poor's 500 Index | Lipper Large Cap Core Funds Average |
| 10/31/2002 | 9,450 | 10,000 | 10,000 |
| 10/31/2003 | 11,046 | 12,080 | 11,731 |
| 10/31/2004 | 11,815 | 13,218 | 12,391 |
| 10/31/2005 | 12,432 | 14,370 | 13,426 |
| 10/31/2006 | 14,263 | 16,721 | 15,337 |
| 10/31/2007 | 17,084 | 19,155 | 17,570 |
| 10/31/2008 | 12,352 | 12,240 | 11,222 |
| 10/31/2009 | 12,564 | 13,440 | 12,439 |
| 10/31/2010 | 14,222 | 15,660 | 14,237 |
| 10/31/2011 | 14,114 | 16,926 | 15,003 |
| 10/31/2012 | 15,449 | 19,500 | 16,868 |
41 graphic description end -->
| ■ | Total returns shown include the maximum sales charge of 5.50% ($10,000 investment minus $550 sales charge = $9,450). |
Growth of a $10,000 Investment–CLASS B SHARES
| Federated Capital Appreciation Fund - Class B Shares | C000026726 | Standard & Poor's 500 Index | Lipper Large Cap Core Funds Average |
| 10/31/2002 | 10,000 | 10,000 | 10,000 |
| 10/31/2003 | 11,599 | 12,080 | 11,731 |
| 10/31/2004 | 12,317 | 13,218 | 12,391 |
| 10/31/2005 | 12,855 | 14,370 | 13,426 |
| 10/31/2006 | 14,633 | 16,721 | 15,337 |
| 10/31/2007 | 17,387 | 19,155 | 17,570 |
| 10/31/2008 | 12,468 | 12,240 | 11,222 |
| 10/31/2009 | 12,571 | 13,440 | 12,439 |
| 10/31/2010 | 13,390 | 15,660 | 14,237 |
| 10/31/2011 | 14,006 | 16,926 | 15,003 |
| 10/31/2012 | 15,331 | 19,500 | 16,868 |
41 graphic description end -->
| ■ | Total returns shown include the maximum contingent deferred sales charge of 5.50%, as applicable. |
Annual Shareholder Report
Growth of a $10,000 Investment–CLASS C SHARES
| Federated Capital Appreciation Fund - Class C Shares | C000026727 | Standard & Poor's 500 Index | Lipper Large Cap Core Funds Average |
| 10/31/2002 | 10,000 | 10,000 | 10,000 |
| 10/31/2003 | 11,595 | 12,080 | 11,731 |
| 10/31/2004 | 12,313 | 13,218 | 12,391 |
| 10/31/2005 | 12,848 | 14,370 | 13,426 |
| 10/31/2006 | 14,621 | 16,721 | 15,337 |
| 10/31/2007 | 17,383 | 19,155 | 17,570 |
| 10/31/2008 | 12,468 | 12,240 | 11,222 |
| 10/31/2009 | 12,579 | 13,440 | 12,439 |
| 10/31/2010 | 14,126 | 15,660 | 14,237 |
| 10/31/2011 | 13,904 | 16,926 | 15,003 |
| 10/31/2012 | 15,088 | 19,500 | 16,868 |
41 graphic description end -->
| ■ | Total returns shown include the maximum contingent deferred sales charge of 1.00%, as applicable. |
Growth of a $10,000 Investment–CLASS R SHARES

| Federated Capital Appreciation Fund - Class R Shares | C000026728 | Standard & Poor's 500 Index | Lipper Large Cap Core Funds Average |
| 10/31/2002 | 10,000 | 10,000 | 10,000 |
| 10/31/2003 | 11,646 | 12,080 | 11,731 |
| 10/31/2004 | 12,403 | 13,218 | 12,391 |
| 10/31/2005 | 12,989 | 14,370 | 13,426 |
| 10/31/2006 | 14,836 | 16,721 | 15,337 |
| 10/31/2007 | 17,693 | 19,155 | 17,570 |
| 10/31/2008 | 12,729 | 12,240 | 11,222 |
| 10/31/2009 | 12,895 | 13,440 | 12,439 |
| 10/31/2010 | 14,532 | 15,660 | 14,237 |
| 10/31/2011 | 14,391 | 16,926 | 15,003 |
| 10/31/2012 | 15,707 | 19,500 | 16,868 |
41 graphic description end -->
Annual Shareholder Report
Growth of a $10,000 Investment–INSTITUTIONAL SHARES
| Federated Capital Appreciation Fund - Institutional Shares | C000060702 | Standard & Poor's 500 Index | Lipper Large Cap Core Funds Average |
| 10/31/2002 | 10,000 | 10,000 | 10,000 |
| 10/31/2003 | 11,689 | 12,080 | 11,731 |
| 10/31/2004 | 12,503 | 13,218 | 12,391 |
| 10/31/2005 | 13,155 | 14,370 | 13,426 |
| 10/31/2006 | 15,093 | 16,721 | 15,337 |
| 10/31/2007 | 18,078 | 19,155 | 17,570 |
| 10/31/2008 | 13,096 | 12,240 | 11,222 |
| 10/31/2009 | 13,354 | 13,440 | 12,439 |
| 10/31/2010 | 15,164 | 15,660 | 14,237 |
| 10/31/2011 | 15,092 | 16,926 | 15,003 |
| 10/31/2012 | 16,552 | 19,500 | 16,868 |
41 graphic description end -->
| 1 | Represents a hypothetical investment of $10,000 in the Fund after deducting applicable sales charges: For Class A Shares, the maximum sales charge of 5.50% ($10,000 investment minus $550 sales charge = $9,450); for Class B Shares, the maximum contingent deferred sales charge is 5.50% on any redemption less than one year from the purchase date; for Class C Shares, the maximum contingent deferred sales charge is 1.00% on any redemption less than one year from the purchase date. The Fund's performance assumes the reinvestment of all dividends and distributions. The S&P 500 and LLCCFA have been adjusted to reflect reinvestment of dividends on securities in the index and average. |
| 2 | The S&P 500 is not adjusted to reflect sales loads, expenses or other fees that the Securities and Exchange Commission (SEC) requires to be reflected in the Fund's performance. The LLCCFA represents the average of the total returns reported by all of the mutual funds designated by Lipper, Inc. as falling into the category indicated, and is not adjusted to reflect sales charges. Total returns of the LLCCFA are reported net of expenses or other fees that the SEC requires to be reflected in a fund's performance. The S&P 500 is unmanaged and, unlike the Fund, is not affected by cash flows. It is not possible to invest in an index or average. |
Annual Shareholder Report
Portfolio of Investments Summary Table (unaudited)
At October 31, 2012, the Fund's sector composition1 was as follows:
| Sector Composition | Percentage of
Total Net Assets |
| Information Technology | 19.7% |
| Financials | 17.8% |
| Industrials | 13.4% |
| Health Care | 12.7% |
| Energy | 12.6% |
| Consumer Discretionary | 12.4% |
| Consumer Staples | 5.7% |
| Materials | 5.1% |
| Cash Equivalents2 | 0.6% |
| Other Assets and Liabilities—Net3,4 | (0.0)% |
| TOTAL | 100.0% |
| 1 | Except for Cash Equivalents and Other Assets and Liabilities, sector classifications are based upon, and individual portfolio securities are assigned to, the classifications of the Global Industry Classification Standard (GICS) except that the Adviser assigns a classification to securities not classified by the GICS and to securities for which the Adviser does not have access to the classification made by the GICS. |
| 2 | Cash Equivalents include any investments in money market mutual funds and/or overnight repurchase agreements. |
| 3 | Represents less than 0.1%. |
| 4 | Assets, other than investments in securities, less liabilities. See Statement of Assets and Liabilities.
|
Annual Shareholder Report
Portfolio of Investments
October 31, 2012
| Shares | | | Value |
| | COMMON STOCKS—99.4% | |
| | Consumer Discretionary—12.4% | |
| 245,100 | | Comcast Corp., Class A | $9,193,701 |
| 762,310 | | D. R. Horton, Inc. | 15,978,018 |
| 60,703 | 1 | Discovery Communications, Inc. | 3,582,691 |
| 238,500 | | Foot Locker, Inc. | 7,989,750 |
| 239,000 | 1 | Hyatt Hotels Corp. | 8,723,500 |
| 310,600 | | Las Vegas Sands Corp. | 14,424,264 |
| 186,700 | | Macy's, Inc. | 7,107,669 |
| 56,400 | | Nike, Inc., Class B | 5,153,832 |
| 14,500 | 1 | Priceline.com, Inc. | 8,319,665 |
| 205,456 | | Scripps Networks Interactive | 12,475,288 |
| 211,600 | 1 | TRW Automotive Holdings Corp. | 9,841,516 |
| 126,300 | | Walt Disney Co. | 6,197,541 |
| | TOTAL | 108,987,435 |
| | Consumer Staples—5.7% | |
| 303,200 | | Altria Group, Inc. | 9,641,760 |
| 550,400 | | Kroger Co. | 13,881,088 |
| 348,388 | | The Coca-Cola Co. | 12,953,066 |
| 188,200 | | Wal-Mart Stores, Inc. | 14,118,764 |
| | TOTAL | 50,594,678 |
| | Energy—12.6% | |
| 163,600 | 1 | Cameron International Corp. | 8,284,704 |
| 141,993 | | Chevron Corp. | 15,649,049 |
| 136,700 | | Exxon Mobil Corp. | 12,462,939 |
| 251,700 | | Halliburton Co. | 8,127,393 |
| 449,200 | | Marathon Oil Corp. | 13,502,952 |
| 158,800 | | National-Oilwell, Inc. | 11,703,560 |
| 172,500 | | Occidental Petroleum Corp. | 13,620,600 |
| 160,221 | | Phillips 66 | 7,556,022 |
| 126,200 | | Schlumberger Ltd. | 8,774,686 |
| 240,200 | | Transocean Ltd. | 10,974,738 |
| | TOTAL | 110,656,643 |
| | Financials—17.8% | |
| 264,800 | 1 | American International Group, Inc. | 9,249,464 |
| 181,100 | | Bank of New York Mellon Corp. | 4,474,981 |
| 51,900 | | BlackRock, Inc. | 9,844,392 |
Annual Shareholder Report
| Shares | | | Value |
| | COMMON STOCKS—continued | |
| | Financials—continued | |
| 304,800 | | Citigroup, Inc. | $11,396,472 |
| 277,600 | | Discover Financial Services | 11,381,600 |
| 162,900 | | Goldman Sachs Group, Inc. | 19,937,331 |
| 489,855 | | J.P. Morgan Chase & Co. | 20,417,156 |
| 645,170 | | MetLife, Inc. | 22,897,083 |
| 279,700 | | PNC Financial Services Group | 16,275,743 |
| 551,900 | | SunTrust Banks, Inc. | 15,011,680 |
| 468,974 | | Wells Fargo & Co. | 15,799,734 |
| | TOTAL | 156,685,636 |
| | Health Care—12.7% | |
| 269,737 | 1 | Amarin Corporation PLC., ADR | 3,177,502 |
| 70,512 | | Amgen, Inc. | 6,102,461 |
| 272,700 | | Bristol-Myers Squibb Co. | 9,067,275 |
| 136,700 | 1 | Gilead Sciences, Inc. | 9,180,772 |
| 178,200 | | GlaxoSmithKline PLC, ADR | 8,001,180 |
| 138,200 | | Humana, Inc. | 10,264,114 |
| 213,300 | | Johnson & Johnson | 15,105,906 |
| 97,300 | | McKesson Corp. | 9,079,063 |
| 237,900 | | Merck & Co., Inc. | 10,855,377 |
| 352,800 | 1 | Mylan, Inc. | 8,939,952 |
| 704,000 | | Pfizer, Inc. | 17,508,480 |
| 78,800 | | UnitedHealth Group, Inc. | 4,412,800 |
| | TOTAL | 111,694,882 |
| | Industrials—13.4% | |
| 266,100 | | Danaher Corp. | 13,765,353 |
| 88,700 | | Dover Corp. | 5,164,114 |
| 663,519 | | General Electric Co. | 13,973,710 |
| 266,807 | | Honeywell International, Inc. | 16,339,261 |
| 185,900 | | Northrop Grumman Corp. | 12,769,471 |
| 103,000 | | Parker-Hannifin Corp. | 8,101,980 |
| 153,520 | | Union Pacific Corp. | 18,887,565 |
| 162,300 | | United Parcel Service, Inc. | 11,888,475 |
| 221,810 | | United Technologies Corp. | 17,336,670 |
| | TOTAL | 118,226,599 |
| | Information Technology—19.7% | |
| 65,927 | | Accenture PLC | 4,444,139 |
| 68,400 | 1 | Alliance Data Systems Corp. | 9,784,620 |
| 54,620 | | Apple, Inc. | 32,504,362 |
Annual Shareholder Report
| Shares | | | Value |
| | COMMON STOCKS—continued | |
| | Information Technology—continued | |
| 147,900 | 1 | Broadcom Corp. | $4,664,027 |
| 642,560 | 1 | EMC Corp. | 15,691,315 |
| 210,900 | 1 | eBay, Inc. | 10,184,361 |
| 55,100 | 1 | F5 Networks, Inc. | 4,544,648 |
| 28,400 | 1 | Google, Inc. | 19,305,468 |
| 529,500 | | Intel Corp. | 11,450,437 |
| 673,631 | | Microsoft Corp. | 19,222,061 |
| 376,941 | 1 | NXP Semiconductors NV | 9,144,589 |
| 204,100 | | Oracle Corp. | 6,337,305 |
| 229,300 | | Qualcomm, Inc. | 13,431,247 |
| 95,000 | | Visa, Inc., Class A | 13,182,200 |
| | TOTAL | 173,890,779 |
| | Materials—5.1% | |
| 27,500 | | CF Industries Holdings, Inc. | 5,642,725 |
| 168,300 | | Du Pont (E.I.) de Nemours & Co. | 7,492,716 |
| 193,600 | | Eastman Chemical Co. | 11,468,864 |
| 163,400 | | Freeport-McMoran Copper & Gold, Inc. | 6,352,992 |
| 91,200 | | Newmont Mining Corp. | 4,974,960 |
| 76,800 | | PPG Industries, Inc. | 8,991,744 |
| | TOTAL | 44,924,001 |
| | TOTAL COMMON STOCKS
(IDENTIFIED COST $784,965,260) | 875,660,653 |
| | MUTUAL FUND—0.6% | |
| 5,296,925 | 2,3 | Federated Prime Value Obligations Fund, Institutional Shares, 0.16%
(AT NET ASSET VALUE) | 5,296,925 |
| | TOTAL INVESTMENTS—100.0%
(IDENTIFIED COST $790,262,185)4 | 880,957,578 |
| | OTHER ASSETS AND LIABILITIES - NET—(0.0)%5 | (221,158) |
| | TOTAL NET ASSETS—100% | $880,736,420 |
| 1 | Non-income producing security. |
| 2 | Affiliated holding. |
| 3 | 7-Day net yield. |
| 4 | The cost of investments for federal tax purposes amounts to $795,812,980. |
| 5 | Assets, other than investments in securities, less liabilities. See Statement of Assets and Liabilities. |
Note: The categories of investments are shown as a percentage of total net assets at October 31, 2012.
Annual Shareholder Report
Various inputs are used in determining the value of the Fund's investments. These inputs are summarized in the three broad levels listed below:
Level 1—quoted prices in active markets for identical securities, including investment companies with daily net asset values, if applicable.
Level 2—other significant observable inputs (including quoted prices for similar securities, interest rates, prepayment speeds, credit risk, etc.). Also includes securities valued at amortized cost.
Level 3—significant unobservable inputs (including the Fund's own assumptions in determining the fair value of investments).
The inputs or methodology used for valuing securities are not an indication of the risk associated with investing in those securities.
As of October 31, 2012, all investments of the Fund utilized Level 1 inputs in valuing the Fund's assets carried at fair value.
The following acronym is used throughout this portfolio:
| ADR | —American Depositary Receipt |
See Notes which are an integral part of the Financial Statements
Annual Shareholder Report
Financial Highlights–Class A Shares
(For a Share Outstanding Throughout Each Period)
| Year Ended October 31 | 2012 | 2011 | 2010 | 2009 | 2008 |
| Net Asset Value, Beginning of Period | $17.89 | $18.13 | $16.13 | $16.03 | $28.14 |
| Income From Investment Operations: | | | | | |
| Net investment income | 0.131 | 0.111 | 0.101 | 0.171 | 0.181 |
| Net realized and unrealized gain (loss) on investments and foreign currency transactions | 1.55 | (0.24) | 2.02 | 0.09 | (6.60) |
| TOTAL FROM INVESTMENT OPERATIONS | 1.68 | (0.13) | 2.12 | 0.26 | (6.42) |
| Less Distributions: | | | | | |
| Distributions from net investment income | (0.11) | (0.11) | (0.12) | (0.16) | (0.15) |
| Distributions from net realized gain on investments and foreign currency transactions | — | — | — | — | (5.54) |
| TOTAL DISTRIBUTIONS | (0.11) | (0.11) | (0.12) | (0.16) | (5.69) |
| Net Asset Value, End of Period | $19.46 | $17.89 | $18.13 | $16.13 | $16.03 |
| Total Return2 | 9.46% | (0.76)% | 13.20% | 1.71% | (27.70)% |
| Ratios to Average Net Assets: | | | | | |
| Net expenses | 1.24%3 | 1.24%3 | 1.24%3 | 1.23%3 | 1.25%3 |
| Net investment income | 0.68% | 0.58% | 0.58% | 1.11% | 0.88% |
| Expense waiver/reimbursement4 | 0.09% | 0.07% | 0.04% | 0.08% | 0.01% |
| Supplemental Data: | | | | | |
| Net assets, end of period (000 omitted) | $645,433 | $784,928 | $865,886 | $943,922 | $939,280 |
| Portfolio turnover | 113% | 175% | 245% | 254% | 252% |
| 1 | Per share numbers have been calculated using the average shares method. |
| 2 | Based on net asset value, which does not reflect the sales charge, redemption fee or contingent deferred sales charge, if applicable. |
| 3 | The net expense ratio is calculated without reduction for expense offset arrangements. The net expense ratios are 1.24%, 1.24%, 1.23%, 1.22% and 1.24% for the years ended October 31, 2012, 2011, 2010, 2009 and 2008, respectively, after taking into account these expense reductions. |
| 4 | This expense decrease is reflected in both the net expense and the net investment income ratios shown above. |
See Notes which are an integral part of the Financial Statements
Annual Shareholder Report
Financial Highlights–Class B Shares
(For a Share Outstanding Throughout Each Period)
| Year Ended October 31 | 2012 | 2011 | 2010 | 2009 | 2008 |
| Net Asset Value, Beginning of Period | $16.93 | $17.20 | $15.32 | $15.24 | $27.07 |
| Income From Investment Operations: | | | | | |
| Net investment income (loss) | (0.03)1 | (0.05)1 | (0.04)1 | 0.041 | 0.021 |
| Net realized and unrealized gain (loss) on investments and foreign currency transactions | 1.46 | (0.22) | 1.92 | 0.08 | (6.31) |
| TOTAL FROM INVESTMENT OPERATIONS | 1.43 | (0.27) | 1.88 | 0.12 | (6.29) |
| Less Distributions: | | | | | |
| Distributions from net investment income | — | — | — | (0.04) | — |
| Distributions from net realized gain on investments and foreign currency transactions | — | — | — | — | (5.54) |
| TOTAL DISTRIBUTIONS | — | — | — | (0.04) | (5.54) |
| Net Asset Value, End of Period | $18.36 | $16.93 | $17.20 | $15.32 | $15.24 |
| Total Return2 | 8.45% | (1.57)% | 12.27% | 0.83% | (28.29)% |
| Ratios to Average Net Assets: | | | | | |
| Net expenses | 2.10%3 | 2.10%3 | 2.10%3 | 2.10%3 | 2.05%3 |
| Net investment income (loss) | (0.15)% | (0.28)% | (0.27)% | 0.31% | 0.10% |
| Expense waiver/reimbursement4 | 0.12% | 0.04% | 0.01% | 0.02% | 0.01% |
| Supplemental Data: | | | | | |
| Net assets, end of period (000 omitted) | $37,533 | $64,708 | $116,426 | $163,827 | $221,131 |
| Portfolio turnover | 113% | 175% | 245% | 254% | 252% |
| 1 | Per share numbers have been calculated using the average shares method. |
| 2 | Based on net asset value, which does not reflect the sales charge, redemption fee or contingent deferred sales charge, if applicable. |
| 3 | The net expense ratio is calculated without reduction for expense offset arrangements. The net expense ratios are 2.10%, 2.10%, 2.09%, 2.09% and 2.04% for the years ended October 31, 2012, 2011, 2010, 2009 and 2008, respectively, after taking into account these expense reductions. |
| 4 | This expense decrease is reflected in both the net expense and the net investment income (loss) ratios shown above. |
See Notes which are an integral part of the Financial Statements
Annual Shareholder Report
Financial Highlights–Class C Shares
(For a Share Outstanding Throughout Each Period)
| Year Ended October 31 | 2012 | 2011 | 2010 | 2009 | 2008 |
| Net Asset Value, Beginning of Period | $16.90 | $17.17 | $15.29 | $15.23 | $27.05 |
| Income From Investment Operations: | | | | | |
| Net investment income (loss) | (0.03)1 | (0.04)1 | (0.04)1 | 0.041 | 0.021 |
| Net realized and unrealized gain (loss) on investments and foreign currency transactions | 1.47 | (0.23) | 1.92 | 0.09 | (6.30) |
| TOTAL FROM INVESTMENT OPERATIONS | 1.44 | (0.27) | 1.88 | 0.13 | (6.28) |
| Less Distributions: | | | | | |
| Distributions from net investment income | — | — | — | (0.07) | — |
| Distributions from net realized gain on investments and foreign currency transactions | — | — | — | — | (5.54) |
| TOTAL DISTRIBUTIONS | — | — | — | (0.07) | (5.54) |
| Net Asset Value, End of Period | $18.34 | $16.90 | $17.17 | $15.29 | $15.23 |
| Total Return2 | 8.52% | (1.57)% | 12.30% | 0.89% | (28.27)% |
| Ratios to Average Net Assets: | | | | | |
| Net expenses | 2.06%3 | 2.06%3 | 2.06%3 | 2.06%3 | 2.03%3 |
| Net investment income (loss) | (0.14)% | (0.24)% | (0.23)% | 0.30% | 0.11% |
| Expense waiver/reimbursement4 | 0.05% | 0.02% | 0.01% | 0.02% | 0.01% |
| Supplemental Data: | | | | | |
| Net assets, end of period (000 omitted) | $57,705 | $64,550 | $77,045 | $83,060 | $88,572 |
| Portfolio turnover | 113% | 175% | 245% | 254% | 252% |
| 1 | Per share numbers have been calculated using the average shares method. |
| 2 | Based on net asset value, which does not reflect the sales charge, redemption fee or contingent deferred sales charge, if applicable. |
| 3 | The net expense ratio is calculated without reduction for expense offset arrangements. The net expense ratios are 2.06%, 2.06%, 2.05%, 2.05% and 2.02% for the years ended October 31, 2012, 2011, 2010, 2009 and 2008, respectively, after taking into account these expense reductions. |
| 4 | This expense decrease is reflected in both the net expense and the net investment income (loss) ratios shown above. |
See Notes which are an integral part of the Financial Statements
Annual Shareholder Report
Financial Highlights–Class R Shares
(For a Share Outstanding Throughout Each Period)
| Year Ended October 31 | 2012 | 2011 | 2010 | 2009 | 2008 |
| Net Asset Value, Beginning of Period | $17.72 | $17.93 | $15.94 | $15.90 | $27.98 |
| Income From Investment Operations: | | | | | |
| Net investment income | 0.091 | 0.071 | 0.021 | 0.111 | 0.071 |
| Net realized and unrealized gain (loss) on investments and foreign currency transactions | 1.52 | (0.24) | 2.00 | 0.08 | (6.55) |
| TOTAL FROM INVESTMENT OPERATIONS | 1.61 | (0.17) | 2.02 | 0.19 | (6.48) |
| Less Distributions: | | | | | |
| Distributions from net investment income | (0.08) | (0.04) | (0.03) | (0.15) | (0.06) |
| Distributions from net realized gain on investments and foreign currency transactions | — | — | — | — | (5.54) |
| TOTAL DISTRIBUTIONS | (0.08) | (0.04) | (0.03) | (0.15) | (5.60) |
| Net Asset Value, End of Period | $19.25 | $17.72 | $17.93 | $15.94 | $15.90 |
| Total Return2 | 9.14% | (0.97)% | 12.70% | 1.30% | (28.05)% |
| Ratios to Average Net Assets: | | | | | |
| Net expenses | 1.46%3 | 1.47%3 | 1.69%3 | 1.71%3 | 1.70%3 |
| Net investment income | 0.47% | 0.36% | 0.14% | 0.78% | 0.33% |
| Expense waiver/reimbursement4 | 0.27% | 0.24% | 0.01% | 0.02% | 0.01% |
| Supplemental Data: | | | | | |
| Net assets, end of period (000 omitted) | $22,943 | $28,461 | $22,290 | $21,994 | $39,155 |
| Portfolio turnover | 113% | 175% | 245% | 254% | 252% |
| 1 | Per share numbers have been calculated using the average shares method. |
| 2 | Based on net asset value. |
| 3 | The net expense ratio is calculated without reduction for expense offset arrangements. The net expense ratios are 1.46%, 1.47%, 1.68%, 1.70% and 1.69% for the years ended October 31, 2012, 2011, 2010, 2009 and 2008, respectively, after taking into account these expense reductions. |
| 4 | This expense decrease is reflected in both the net expense and the net investment income ratios shown above. |
See Notes which are an integral part of the Financial Statements
Annual Shareholder Report
Financial Highlights–Institutional Shares
(For a Share Outstanding Throughout Each Period)
| Year Ended October 31, | Period
Ended
10/31/20081 |
| 2012 | 2011 | 2010 | 2009 |
| Net Asset Value, Beginning of Period | $17.91 | $18.15 | $16.14 | $16.06 | $21.34 |
| Income From Investment Operations: | | | | | |
| Net investment income | 0.182 | 0.162 | 0.152 | 0.182 | 0.152 |
| Net realized and unrealized gain (loss) on investments and foreign currency transactions | 1.53 | (0.24) | 2.03 | 0.11 | (5.43) |
| TOTAL FROM INVESTMENT OPERATIONS | 1.71 | (0.08) | 2.18 | 0.29 | (5.28) |
| Less Distributions: | | | | | |
| Distributions from net investment income | (0.16) | (0.16) | (0.17) | (0.21) | — |
| Net Asset Value, End of Period | $19.46 | $17.91 | $18.15 | $16.14 | $16.06 |
| Total Return3 | 9.67% | (0.47)% | 13.55% | 1.97% | (24.74)% |
| Ratios to Average Net Assets: | | | | | |
| Net expenses | 0.98%5 | 0.98%5 | 0.95%5 | 0.96%5 | 0.96%4,5 |
| Net investment income | 0.93% | 0.85% | 0.89% | 1.22% | 0.93%4 |
| Expense waiver/reimbursement6 | 0.08% | 0.02% | 0.01% | 0.03% | 0.02%4 |
| Supplemental Data: | | | | | |
| Net assets, end of period (000 omitted) | $117,123 | $118,716 | $168,884 | $211,470 | $75,775 |
| Portfolio turnover | 113% | 175% | 245% | 254% | 252%7 |
| 1 | Reflects operations for the period from December 31, 2007 (date of initial investment) to October 31, 2008. |
| 2 | Per share numbers have been calculated using the average shares method. |
| 3 | Based on net asset value. Total returns for periods of less than one year are not annualized. |
| 4 | Computed on an annualized basis. |
| 5 | The net expense ratio is calculated without reduction for expense offset arrangements. The net expense ratios are 0.98%, 0.98%, 0.94%, 0.95% and 0.94% for the years ended October 31, 2012, 2011, 2010 and 2009 and for the period ended October 31, 2008, respectively, after taking into account these expense reductions. |
| 6 | This expense decrease is reflected in both the net expense and the net investment income ratios shown above. |
| 7 | Portfolio turnover is calculated at the Fund level. Percentage indicated was calculated for the year ended October 31, 2008. |
See Notes which are an integral part of the Financial Statements
Annual Shareholder Report
Statement of Assets and Liabilities
October 31, 2012
| Assets: | | |
| Total investment in securities, at value including $5,296,925 of investment in an affiliated holding (Note 5) (identified cost $790,262,185) | | $880,957,578 |
| Income receivable | | 849,552 |
| Receivable for investments sold | | 11,945,992 |
| Receivable for shares sold | | 458,130 |
| TOTAL ASSETS | | 894,211,252 |
| Liabilities: | | |
| Payable for investments purchased | $10,628,472 | |
| Payable for shares redeemed | 1,964,902 | |
| Bank overdraft | 8,846 | |
| Payable for Directors'/Trustees' fees | 2,917 | |
| Payable for distribution services fee (Note 5) | 67,391 | |
| Payable for shareholder services fee (Note 5) | 355,918 | |
| Accrued expenses | 446,386 | |
| TOTAL LIABILITIES | | 13,474,832 |
| Net assets for 45,573,304 shares outstanding | | $880,736,420 |
| Net Assets Consist of: | | |
| Paid-in capital | | $832,344,370 |
| Net unrealized appreciation of investments and translation of assets and liabilities in foreign currency | | 90,688,076 |
| Accumulated net realized loss on investments and foreign currency transactions | | (48,006,687) |
| Undistributed net investment income | | 5,710,661 |
| TOTAL NET ASSETS | | $880,736,420 |
Annual Shareholder Report
Statement of Assets and Liabilities–continued
| Net Asset Value, Offering Price and Redemption Proceeds Per Share | | |
| Class A Shares: | | |
Net asset value per share ($645,433,272 ÷ 33,173,592 shares outstanding),
no par value, unlimited shares authorized | | $19.46 |
| Offering price per share (100/94.50 of $19.46) | | $20.59 |
| Redemption proceeds per share | | $19.46 |
| Class B Shares: | | |
Net asset value per share ($37,532,551 ÷ 2,044,295 shares outstanding),
no par value, unlimited shares authorized | | $18.36 |
| Offering price per share | | $18.36 |
| Redemption proceeds per share (94.50/100 of $18.36) | | $17.35 |
| Class C Shares: | | |
Net asset value per share ($57,705,234 ÷ 3,146,096 shares outstanding),
no par value, unlimited shares authorized | | $18.34 |
| Offering price per share | | $18.34 |
| Redemption proceeds per share (99.00/100 of $18.34) | | $18.16 |
| Class R Shares: | | |
Net asset value per share ($22,942,666 ÷ 1,191,628 shares outstanding),
no par value, unlimited shares authorized | | $19.25 |
| Offering price per share | | $19.25 |
| Redemption proceeds per share | | $19.25 |
| Institutional Shares: | | |
Net asset value per share ($117,122,697 ÷ 6,017,693 shares outstanding),
no par value, unlimited shares authorized | | $19.46 |
| Offering price per share | | $19.46 |
| Redemption proceeds per share | | $19.46 |
See Notes which are an integral part of the Financial Statements
Annual Shareholder Report
Statement of Operations
Year Ended October 31, 2012
| Investment Income: | | | |
| Dividends (including $11,248 received from an affiliated holding (Note 5) and net of foreign taxes withheld of $28,184) | | | $18,312,085 |
| Expenses: | | | |
| Investment adviser fee (Note 5) | | $7,124,983 | |
| Administrative fee (Note 5) | | 741,131 | |
| Custodian fees | | 44,649 | |
| Transfer and dividend disbursing agent fees and expenses (Note 2) | | 2,095,428 | |
| Directors'/Trustees' fees | | 6,990 | |
| Auditing fees | | 27,451 | |
| Legal fees | | 9,023 | |
| Portfolio accounting fees | | 173,236 | |
| Distribution services fee (Note 5) | | 970,094 | |
| Shareholder services fee (Note 5) | | 2,071,309 | |
| Account administration fee (Note 2) | | 10,334 | |
| Share registration costs | | 78,492 | |
| Printing and postage | | 87,452 | |
| Insurance premiums | | 5,778 | |
| Miscellaneous | | 9,595 | |
| TOTAL EXPENSES | | 13,455,945 | |
| Waivers, Reimbursements and Reduction: | | | |
| Waiver/reimbursement of investment adviser fee (Note 5) | $(181,211) | | |
| Waiver of administrative fee (Note 5) | (15,204) | | |
| Waiver of distribution services fee (Note 5) | (64,641) | | |
| Reimbursement of transfer and dividend disbursing agent fees and expenses (Note 2) | (613,701) | | |
| Fees paid indirectly from directed brokerage arrangements (Note 6) | (5,220) | | |
| TOTAL WAIVERS, REIMBURSEMENTS AND REDUCTION | | (879,977) | |
| Net expenses | | | 12,575,968 |
| Net investment income | | | 5,736,117 |
| Realized and Unrealized Gain on Investments and Foreign Currency Transactions: | | | |
| Net realized gain on investments and foreign currency transactions | | | 77,773,513 |
| Net change in unrealized appreciation of investments and translation of assets and liabilities in foreign currency | | | 2,991,827 |
| Net realized and unrealized gain on investments and foreign currency transactions | | | 80,765,340 |
| Change in net assets resulting from operations | | | $86,501,457 |
See Notes which are an integral part of the Financial Statements
Annual Shareholder Report
Statement of Changes in Net Assets
| Year Ended October 31 | 2012 | 2011 |
| Increase (Decrease) in Net Assets | | |
| Operations: | | |
| Net investment income | $5,736,117 | $5,917,944 |
| Net realized gain on investments and foreign currency transactions | 77,773,513 | 98,051,399 |
| Net change in unrealized appreciation/depreciation of investments and translation of assets and liabilities in foreign currency | 2,991,827 | (110,625,929) |
| CHANGE IN NET ASSETS RESULTING FROM OPERATIONS | 86,501,457 | (6,656,586) |
| Distributions to Shareholders: | | |
| Distributions from net investment income | | |
| Class A Shares | (4,497,058) | (5,067,934) |
| Class R Shares | (128,597) | (46,090) |
| Institutional Shares | (942,623) | (1,517,759) |
CHANGE IN NET ASSETS RESULTING
FROM DISTRIBUTIONS TO SHAREHOLDERS | (5,568,278) | (6,631,783) |
| Share Transactions: | | |
| Proceeds from sale of shares | 81,966,716 | 170,731,406 |
| Proceeds from shares issued in connection with the tax-free transfer of assets from EquiTrust Series Fund, Inc., Blue Chip Portfolio | — | 45,934,321 |
| Proceeds from shares issued in connection with the tax-free transfer of assets from EquiTrust Series Fund, Inc., Value Growth Portfolio | — | 62,700,801 |
| Proceeds from shares issued in connection with the tax-free transfer of assets from Performance Large Cap Equity Fund | 66,276,418 | — |
| Net asset value of shares issued to shareholders in payment of distributions declared | 4,785,572 | 4,919,430 |
| Cost of shares redeemed | (414,588,861) | (460,166,012) |
CHANGE IN NET ASSETS RESULTING
FROM SHARE TRANSACTIONS | (261,560,155) | (175,880,054) |
| Change in net assets | (180,626,976) | (189,168,423) |
| Net Assets: | | |
| Beginning of period | 1,061,363,396 | 1,250,531,819 |
| End of period (including undistributed net investment income of $5,710,661 and $5,566,226, respectively) | $880,736,420 | $1,061,363,396 |
See Notes which are an integral part of the Financial Statements
Annual Shareholder Report
Notes to Financial Statements
October 31, 2012
1. ORGANIZATION
Federated Equity Funds (the “Trust”) is registered under the Investment Company Act of 1940, as amended (the “Act”), as an open-end management investment company. The Trust consists of 13 portfolios. The financial statements included herein are only those of Federated Capital Appreciation Fund (the “Fund”), a diversified portfolio. The financial statements of the other portfolios are presented separately. The assets of each portfolio are segregated and a shareholder's interest is limited to the portfolio in which shares are held. Each portfolio pays its own expenses. The Fund offers five classes of shares: Class A Shares, Class B Shares, Class C Shares, Class R Shares and Institutional Shares. All shares of the Fund have equal rights with respect to voting, except on class-specific matters. The investment objective of the Fund is to provide capital appreciation.
On September 21, 2012, the Fund acquired all of the net assets of Performance Large Cap Equity Fund (the “Acquired Fund”), an open-end investment company in a tax-free reorganization in exchange for shares of the Fund, pursuant to a plan of reorganization approved by the Acquired Fund's shareholders on September 19, 2012. The purpose of the transaction was to combine two portfolios with comparable investment objectives and strategies. For financial reporting purposes, assets received and shares issued by the Fund were recorded at fair value; however, the cost basis of the investments received from the Acquired Fund was carried forward to align ongoing reporting of the Fund's realized and unrealized gains and losses with amounts distributable to shareholders for tax purposes.
Assuming the acquisition had been completed on November 1, 2011, the beginning of the annual reporting period of the Fund, the Fund's pro forma results of operations for the year ended October 31, 2012, are as follows:
| Net investment income* | $6,472,106 |
| Net realized and unrealized gain on investments | $105,730,829 |
| Net increase in net assets resulting from operations | $112,202,935 |
| * | Net investment income includes $30,069 of pro forma eliminated expenses. |
Because the combined investment portfolios have been managed as a single integrated portfolio since the acquisition was completed, it is not practicable to separate the amounts of revenue and earnings of the Acquired Fund that has been included in the Fund's Statement of Operations as of October 31, 2012.
For every one share of Performance Large Cap Equity Fund Class A Shares exchanged, a shareholder received 0.495 shares of Federated Capital Appreciation Fund Class A Shares.
For every one share of Performance Large Cap Equity Fund Class B Shares exchanged, a shareholder received 0.444 shares of Federated Capital Appreciation Fund Class A Shares.
For every one share of Performance Large Cap Equity Fund Institutional Class Shares exchanged, a shareholder received 0.503 shares of Federated Capital Appreciation Fund Institutional Shares.
Annual Shareholder Report
The Fund received net assets from the Acquired Fund as the result of the tax-free reorganization as follows:
Shares of the
Fund Issued | Performance
Large Cap
Equity Fund
Net Assets
Received | Unrealized
Appreciation1 | Net Assets
of the Fund
Immediately
Prior to
Combination | Net Assets
of the Fund
Immediately
After
Combination |
| 3,282,647 | $66,276,418 | $16,014,302 | $873,800,901 | $940,077,319 |
| 1 | Unrealized Appreciation is included in the Acquired Fund Net Assets Received amount shown above. |
On July 15, 2011, the Fund acquired all of the net assets of EquiTrust Series Fund, Inc., Blue Chip Portfolio and EquiTrust Series Fund, Inc., Value Growth Portfolio (the “Acquired Funds”), open-end investment companies, in a tax-free reorganization in exchange for shares of the Fund, pursuant to a plan of reorganization approved by the Acquired Funds' shareholders on July 15, 2011. The purpose of the transaction was to combine three portfolios with comparable investment objectives and strategies. For financial reporting purposes, assets received and shares issued by the Fund were recorded at fair value; however, the cost basis of the investments received from the Acquired Funds was carried forward to align ongoing reporting of the Fund's realized and unrealized gains and losses with amounts distributable to shareholders for tax purposes.
Assuming the acquisition had been completed on November 1, 2010, the beginning of the annual reporting period of the Fund, the Fund's pro forma results of operations for the year ended October 31, 2011, were as follows:
| Net investment income* | $6,688,461 |
| Net realized and unrealized loss on investments | $(820,269) |
| Net increase in net assets resulting from operations | $5,868,192 |
| * | Net investment income includes $13,847 of pro forma additional expenses. |
Because the combined investment portfolios have been managed as a single integrated portfolio since the acquisition was completed, it is not practicable to separate the amounts of revenue and earnings of the Acquired Funds that has been included in the Fund's Statement of Operations as of October 31, 2011.
For every one share of EquiTrust Series Fund, Inc., Blue Chip Portfolio Class A Shares exchanged, a shareholder received 2.145 shares of Federated Capital Appreciation Fund Class A Shares.
For every one share of EquiTrust Series Fund, Inc., Blue Chip Portfolio Class B Shares exchanged, a shareholder received 2.143 shares of Federated Capital Appreciation Fund Class A Shares.
For every one share of EquiTrust Series Fund, Inc., Blue Chip Portfolio Class I Shares exchanged, a shareholder received 2.160 shares of Federated Capital Appreciation Fund Institutional Shares.
For every one share of EquiTrust Series Fund, Inc., Value Growth Portfolio Class A Shares or Class B Shares exchanged, a shareholder received 0.801 shares of Federated Capital Appreciation Fund Class A Shares.
Annual Shareholder Report
For every one share of EquiTrust Series Fund, Inc., Value Growth Portfolio Class I Shares exchanged, a shareholder received 0.810 shares of Federated Capital Appreciation Fund Institutional Shares.
On July 15, 2011, the Fund received assets from EquiTrust Series Fund, Inc., Blue Chip Portfolio as a result of a tax-free reorganization, as follows:
Shares of the
Fund Issued | EquiTrust
Series Fund, Inc.,
Blue Chip
Portfolio
Net Assets
Received | Unrealized
Appreciation1 | Net Assets
of the Fund
Immediately
Prior to
Combination | Net Assets
of the Fund
Immediately
After
Combination2 |
| 2,398,660 | $45,934,321 | $16,560,900 | $1,140,815,602 | $1,249,450,724 |
| 1 | Unrealized Appreciation is included in the EquiTrust Series Fund, Inc., Blue Chip Portfolio Net Assets Received amount shown above. |
| 2 | Net Assets of the Fund Immediately After Combination includes the net assets received from EquiTrust Series Fund, Inc., Value Growth Portfolio, which also reorganized into the Fund on July 15, 2011. |
On July 15, 2011, the Fund received assets from EquiTrust Series Fund, Inc., Value Growth Portfolio as a result of a tax-free reorganization, as follows:
Shares of the
Fund Issued | EquiTrust
Series Fund, Inc.,
Value Growth
Portfolio
Net Assets
Received | Unrealized
Appreciation1 | Net Assets
of the Fund
Immediately
Prior to
Combination | Net Assets
of the Fund
Immediately
After
Combination2 |
| 3,274,169 | $62,700,801 | $2,500,605 | $1,140,815,602 | $1,249,450,724 |
| 1 | Unrealized Appreciation is included in the EquiTrust Series Fund, Inc., Value Growth Portfolio Net Assets Received amount shown above. |
| 2 | Net Assets of the Fund immediately After Combination includes the net assets received from EquiTrust Series Fund, Inc., Blue Chip Portfolio, which also reorganized into the Fund on July 15, 2011. |
2. SIGNIFICANT ACCOUNTING POLICIES
The following is a summary of significant accounting policies consistently followed by the Fund in the preparation of its financial statements. These policies are in conformity with U.S. generally accepted accounting principles (GAAP).
Investment Valuation
In calculating its net asset value (NAV), the Fund generally values investments as follows:
| ■ | Equity securities listed on an exchange or traded through a regulated market system are valued at their last reported sale price or official closing price in their principal exchange or market. |
| ■ | Shares of other mutual funds are valued based upon their reported NAVs. |
| ■ | Derivative contracts listed on exchanges are valued at their reported settlement or closing price. |
| ■ | Over-the-counter (OTC) derivative contracts are fair valued using price evaluations provided by a pricing service approved by the Board of Trustees (the “Trustees”). |
| ■ | Fixed-income securities acquired with remaining maturities greater than 60 days are fair valued using price evaluations provided by a pricing service approved by the Trustees. |
Annual Shareholder Report
| ■ | Fixed-income securities acquired with remaining maturities of 60 days or less are valued at their cost (adjusted for the accretion of any discount or amortization of any premium), which approximates market value. |
| ■ | For securities that are fair valued in accordance with procedures established by and under the general supervision of the Trustees, certain factors may be considered such as: the purchase price of the security, information obtained by contacting the issuer, analysis of the issuer's financial statements or other available documents, fundamental analytical data, the nature and duration of restrictions on disposition, the movement of the market in which the security is normally traded and public trading in similar securities of the issuer or comparable issuers. |
If the Fund cannot obtain a price or price evaluation from a pricing service for an investment, the Fund may attempt to value the investment based upon the mean of bid and asked quotations or fair value the investment based on price evaluations, from one or more dealers. If any price, quotation, price evaluation or other pricing source is not readily available when the NAV is calculated, the Fund uses the fair value of the investment determined in accordance with the procedures described below. There can be no assurance that the Fund could purchase or sell an investment at the price used to calculate the Fund's NAV.
Fair Valuation and Significant Events Procedures
The Trustees have appointed a Valuation Committee comprised of officers of the Fund, Federated Equity Management Company of Pennsylvania (“Adviser”) and the Adviser's affiliated companies to determine fair value of securities and in overseeing the calculation of the NAV. The Trustees have also authorized the use of pricing services recommended by the Valuation Committee to provide fair value evaluations of the current value of certain investments for purposes of calculating the NAV. The Valuation Committee employs various methods for reviewing third-party pricing service evaluations including periodic reviews of third-party pricing services' policies, procedures and valuation methods (including key inputs and assumptions), transactional back-testing, comparisons of evaluations of different pricing services and review of price challenges by the Adviser based on recent market activity. In the event that market quotations and price evaluations are not available for an investment, the Valuation Committee determines the fair value of the investment in accordance with procedures adopted by the Trustees. The Trustees periodically review and approve the fair valuations made by the Valuation Committee and any changes made to the procedures.
Factors considered by pricing services in evaluating an investment include the yields or prices of investments of comparable quality, coupon, maturity, call rights and other potential prepayments, terms and type, reported transactions, indications as to values from dealers and general market conditions. Some pricing services provide a single price evaluation reflecting the bid-side of the market for an investment (a “bid” evaluation). Other pricing services offer both bid evaluations and price evaluations indicative of a price between the prices bid and asked for the investment (a “mid” evaluation). The Fund normally uses bid evaluations for U.S. Treasury and Agency securities and mortgage-backed securities. The Fund normally uses mid evaluations for other types of fixed-income securities and OTC derivative contracts. In the event that market quotations and price evaluations are not available for an investment, the fair value of the investment is determined in accordance with procedures adopted by the Trustees.
The Trustees also have adopted procedures requiring an investment to be priced at its fair value whenever the Adviser determines that a significant event affecting the value of the investment has occurred between the time as of which the price of the investment would otherwise be determined and the time as of which the NAV is computed. An event is considered significant if there is both an affirmative expectation that the investment's value
Annual Shareholder Report
will change in response to the event and a reasonable basis for quantifying the resulting change in value. Examples of significant events that may occur after the close of the principal market on which a security is traded, or after the time of a price evaluation provided by a pricing service or a dealer, include:
| ■ | With respect to securities traded in foreign markets, significant trends in U.S. equity markets or in the trading of foreign securities index futures contracts; |
| ■ | Political or other developments affecting the economy or markets in which an issuer conducts its operations or its securities are traded; and |
| ■ | Announcements concerning matters such as acquisitions, recapitalizations, litigation developments, a natural disaster affecting the issuer's operations or regulatory changes or market developments affecting the issuer's industry. |
The Trustees have approved the use of a pricing service to determine the fair value of equity securities traded principally in foreign markets when the Adviser determines that there has been a significant trend in the U.S. equity markets or in index futures trading. For other significant events, the Fund may seek to obtain more current quotations or price evaluations from alternative pricing sources. If a reliable alternative pricing source is not available, the Fund will determine the fair value of the investment using another method approved by the Trustees.
Repurchase Agreements
The Fund may invest in repurchase agreements for short-term liquidity purposes. It is the policy of the Fund to require the other party to a repurchase agreement to transfer to the Fund's custodian or sub-custodian eligible securities or cash with a market value (after transaction costs) at least equal to the repurchase price to be paid under the repurchase agreement. The eligible securities are transferred to accounts with the custodian or sub-custodian in which the Fund holds a “securities entitlement” and exercises “control” as those terms are defined in the Uniform Commercial Code. The Fund has established procedures for monitoring the market value of the transferred securities and requiring the transfer of additional eligible securities if necessary to equal at least the repurchase price. These procedures also allow the other party to require securities to be transferred from the account to the extent that their market value exceeds the repurchase price or in exchange for other eligible securities of equivalent market value.
The insolvency of the other party or other failure to repurchase the securities may delay the disposition of the underlying securities or cause the Fund to receive less than the full repurchase price. Under the terms of the repurchase agreement, any amounts received by the Fund in excess of the repurchase price and related transaction costs must be remitted to the other party.
The Fund may enter into repurchase agreements in which eligible securities are transferred into joint trading accounts maintained by the custodian or sub-custodian for investment companies and other clients advised by the Fund's Adviser and its affiliates. The Fund will participate on a pro rata basis with the other investment companies and clients in its share of the securities transferred under such repurchase agreements and in its share of proceeds from any repurchase or other disposition of such securities.
Investment Income, Gains and Losses, Expenses and Distributions
Investment transactions are accounted for on a trade-date basis. Realized gains and losses from investment transactions are recorded on an identified-cost basis. Interest income and expenses are accrued daily. Dividend income and distributions to shareholders are recorded on the ex-dividend date. Foreign dividends are recorded on the ex-dividend date or when the
Annual Shareholder Report
Fund is informed of the ex-dividend date. Distributions of net investment income are declared and paid annually. Non-cash dividends included in dividend income, if any, are recorded at fair value. Investment income, realized and unrealized gains and losses, and certain fund-level expenses are allocated to each class based on relative average daily net assets, except that Class A Shares, Class B Shares, Class C Shares, Class R Shares and Institutional Shares may bear distribution services fees, shareholder services fees, account administration fees and certain transfer and dividend disbursing agent fees unique to those classes. For the year ended October 31, 2012, transfer and dividend disbursing agent fees and account administration fees for the Fund were as follows:
| Transfer and
Dividend
Disbursing
Agent Fees
Incurred | Transfer and
Dividend
Disbursing
Agent Fees
Reimbursed | Account
Administration
Fees Incurred |
| Class A Shares | $1,507,986 | $(492,345) | $5,753 |
| Class B Shares | 174,247 | (47,703) | — |
| Class C Shares | 144,803 | (14,976) | 4,581 |
| Class R Shares | 93,232 | — | — |
| Institutional Shares | 175,160 | (58,677) | — |
| TOTAL | $2,095,428 | $(613,701) | $10,334 |
Dividends are declared separately for each class. No class has preferential dividend rights; differences in per share dividend rates are generally due to differences in separate class expenses.
Premium and Discount Amortization
All premiums and discounts on fixed-income securities are amortized/accreted using the effective interest rate method.
Federal Taxes
It is the Fund's policy to comply with the Subchapter M provision of the Internal Revenue Code (the “Code”) and to distribute to shareholders each year substantially all of its income. Accordingly, no provision for federal income tax is necessary. As of and during the year ended October 31, 2012, the Fund did not have a liability for any uncertain tax positions. The Fund recognizes interest and penalties, if any, related to tax liabilities as income tax expense in the Statement of Operations. As of October 31, 2012, tax years 2009 through 2012 remain subject to examination by the Fund's major tax jurisdictions, which include the United States of America and the Commonwealth of Massachusetts.
The Fund may be subject to taxes imposed by governments of countries in which it invests. Such taxes are generally based on either income or gains earned or repatriated. The Fund accrues and applies such taxes to net investment income, net realized gains and net unrealized gains as income and/or gains are earned.
Annual Shareholder Report
When-Issued and Delayed Delivery Transactions
The Fund may engage in when-issued or delayed delivery transactions. The Fund records when-issued securities on the trade date and maintains security positions such that sufficient liquid assets will be available to make payment for the securities purchased. Securities purchased on a when-issued or delayed delivery basis are marked to market daily and begin earning interest on the settlement date. Losses may occur on these transactions due to changes in market conditions or the failure of counterparties to perform under the contract.
Foreign Exchange Contracts
The Fund enters into foreign exchange contracts for the delayed delivery of securities or foreign currency exchange transactions. The Fund enters into foreign exchange contracts to protect assets against adverse changes in foreign currency exchange rates or exchange control regulations. Purchased contracts are used to acquire exposure to foreign currencies, whereas, contracts to sell are used to hedge the Fund's securities against currency fluctuations. Risks may arise upon entering into these transactions from the potential inability of counterparties to meet the terms of their commitments and from unanticipated movements in security prices or foreign exchange rates. The foreign exchange contracts are adjusted by the daily exchange rate of the underlying currency and any gains or losses are recorded for financial statement purposes as unrealized until the settlement date.
At October 31, 2012, the Fund had no outstanding foreign exchange contracts.
The average value at settlement date payable of foreign exchange contracts purchased by the Fund throughout the period was $108. This is based on the contracts held as of each month-end throughout the fiscal period.
Foreign Currency Translation
The accounting records of the Fund are maintained in U.S. dollars. All assets and liabilities denominated in foreign currencies (FCs) are translated into U.S. dollars based on the rates of exchange of such currencies against U.S. dollars on the date of valuation. Purchases and sales of securities, income and expenses are translated at the rate of exchange quoted on the respective date that such transactions are recorded. The Fund does not isolate that portion of the results of operations resulting from changes in foreign exchange rates on investments from the fluctuations arising from changes in market prices of securities held. Such fluctuations are included with the net realized and unrealized gain or loss from investments.
Reported net realized foreign exchange gains or losses arise from sales of portfolio securities, sales and maturities of short-term securities, sales of FCs, currency gains or losses realized between the trade and settlement dates on securities transactions, the difference between the amounts of dividends, interest and foreign withholding taxes recorded on the Fund's books, and the U.S. dollar equivalent of the amounts actually received or paid. Net unrealized foreign exchange gains and losses arise from changes in the value of assets and liabilities other than investments in securities at fiscal year end, resulting from changes in the exchange rate.
Annual Shareholder Report
Additional Disclosure Related to Derivative Instruments
The Effect of Derivative Instruments on the Statement of Operations for the Year Ended October 31, 2012
| Amount of Realized Gain or (Loss) on Derivatives Recognized in Income |
| Forward
Currency
Contracts |
| Foreign exchange contracts | $10,965 |
Other
The preparation of financial statements in conformity with GAAP requires management to make estimates and assumptions that affect the amounts of assets, liabilities, expenses and revenues reported in the financial statements. Actual results could differ from those estimated.
3. SHARES OF BENEFICIAL INTEREST
The following tables summarize share activity:
| Year Ended October 31 | 2012 | 2011 |
| Class A Shares: | Shares | Amount | Shares | Amount |
| Shares sold | 2,901,338 | $54,877,487 | 6,348,935 | $118,719,508 |
| Proceeds from shares issued in connection with the tax-free transfer of assets from Performance Large Cap Equity Fund | 727,763 | 14,693,527 | — | — |
| Proceeds from shares issued in connection with the tax-free transfer of assets from EquiTrust Series Fund, Inc., Blue Chip Portfolio | — | — | 1,717,167 | 32,883,740 |
| Proceeds from shares issued in connection with the tax-free transfer of assets from EquiTrust Series Fund, Inc., Value Growth Portfolio | — | — | 2,627,334 | 50,314,097 |
| Shares issued to shareholders in payment of distributions declared | 238,447 | 4,122,755 | 236,902 | 4,503,506 |
| Shares redeemed | (14,558,975) | (275,370,710) | (14,816,248) | (276,732,168) |
NET CHANGE RESULTING FROM
CLASS A SHARE TRANSACTIONS | (10,691,427) | $(201,676,941) | (3,885,910) | $(70,311,317) |
| Year Ended October 31 | 2012 | 2011 |
| Class B Shares: | Shares | Amount | Shares | Amount |
| Shares sold | 100,604 | $1,808,447 | 239,736 | $4,307,221 |
| Shares redeemed | (1,879,400) | (33,588,938) | (3,184,584) | (56,582,380) |
NET CHANGE RESULTING FROM
CLASS B SHARE TRANSACTIONS | (1,778,796) | $(31,780,491) | (2,944,848) | $(52,275,159) |
Annual Shareholder Report
| Year Ended October 31 | 2012 | 2011 |
| Class C Shares: | Shares | Amount | Shares | Amount |
| Shares sold | 351,259 | $6,287,483 | 643,711 | $11,449,334 |
| Shares redeemed | (1,024,472) | (18,317,225) | (1,311,476) | (23,150,602) |
NET CHANGE RESULTING FROM
CLASS C SHARE TRANSACTIONS | (673,213) | $(12,029,742) | (667,765) | $(11,701,268) |
| Year Ended October 31 | 2012 | 2011 |
| Class R Shares: | Shares | Amount | Shares | Amount |
| Shares sold | 450,095 | $8,530,768 | 911,364 | $17,186,429 |
| Shares issued to shareholders in payment of distributions declared | 7,101 | 121,703 | 2,219 | 41,834 |
| Shares redeemed | (871,981) | (16,650,019) | (550,444) | (10,056,912) |
NET CHANGE RESULTING FROM
CLASS R SHARE TRANSACTIONS | (414,785) | $(7,997,548) | 363,139 | $7,171,351 |
| Year Ended October 31 | 2012 | 2011 |
| Institutional Shares: | Shares | Amount | Shares | Amount |
| Shares sold | 554,685 | $10,462,531 | 1,008,664 | $19,068,914 |
| Proceeds from shares issued in connection with the tax-free transfer of assets from Performance Large Cap Equity Fund | 2,554,884 | 51,582,891 | — | — |
| Proceeds from shares issued in connection with the tax-free transfer of assets from EquiTrust Series Fund, Inc., Blue Chip Portfolio | — | — | 681,493 | 13,050,581 |
| Proceeds from shares issued in connection with the tax-free transfer of assets from EquiTrust Series Fund, Inc., Value Growth Portfolio | — | — | 646,835 | 12,386,704 |
| Shares issued to shareholders in payment of distributions declared | 31,369 | 541,114 | 19,710 | 374,090 |
| Shares redeemed | (3,751,920) | (70,661,969) | (5,030,797) | (93,643,950) |
| NET CHANGE RESULTING FROM INSTITUTIONAL SHARE TRANSACTIONS | (610,982) | $(8,075,433) | (2,674,095) | $(48,763,661) |
| NET CHANGE RESULTING FROM TOTAL FUND SHARE TRANSACTIONS | (14,169,203) | $(261,560,155) | (9,809,479) | $(175,880,054) |
Annual Shareholder Report
4. FEDERAL TAX INFORMATION
The timing and character of income and capital gain distributions are determined in accordance with income tax regulations, which may differ from GAAP. These differences are due in part to differing treatments for capital loss carryforwards acquired through mergers, wash sales deferrals acquired through mergers, foreign cash reclasses and regulatory settlement proceeds.
For the year ended October 31, 2012, permanent differences identified and reclassified among the components of net assets were as follows:
| Increase (Decrease) |
| Paid-In Capital | Undistributed
Net Investment
Income (Loss) | Accumulated
Net Realized
Gain (Loss) |
| $4,221,786 | $(23,404) | $(4,198,382) |
Net investment income (loss), net realized gains (losses), and net assets were not affected by this reclassification.
The tax character of distributions as reported on the Statement of Changes in Net Assets for the years ended October 31, 2012 and 2011, was as follows:
| 2012 | 2011 |
| Ordinary income | $5,568,278 | $6,631,783 |
As of October 31, 2012, the components of distributable earnings on a tax basis were as follows:
| Undistributed ordinary income | $5,710,661 |
| Undistributed long-term capital gain | $6,488,927 |
| Net unrealized appreciation | $85,137,281 |
| Capital loss carryforwards | $(48,944,819) |
The difference between book-basis and tax-basis net unrealized appreciation/depreciation is attributable to differing treatments for the deferral of losses on wash sales.
At October 31, 2012, the cost of investments for federal tax purposes was $795,812,980. The net unrealized appreciation of investments for federal tax purposes excluding any unrealized appreciation/depreciation resulting from the translation from FCs to U.S. dollars of assets and liabilities other than investments in securities was $85,144,598. This consists of net unrealized appreciation from investments for those securities having an excess of value over cost of $99,031,267 and net unrealized depreciation from investments for those securities having an excess of cost over value of $13,886,669.
At October 31, 2012, the Fund had a capital loss carryforward of $48,944,819 which will reduce the Fund's taxable income arising from future net realized gains on investments, if any, to the extent permitted by the Code, thereby reducing the amount of distributions to shareholders which would otherwise be necessary to relieve the Fund of any liability for federal income tax. Pursuant to the Code, a net capital loss incurred in taxable years beginning on or before December 22, 2010, is characterized as short-term and may be carried forward
Annual Shareholder Report
for a maximum of eight tax years (“Carryforward Limit”), whereas a net capital loss incurred in taxable years beginning after December 22, 2010, retains its character as either short-term or long-term, does not expire and is required to be utilized prior to the losses which have a Carryforward Limit.
The following schedule summarizes the Fund's capital loss carryforward and expiration year:
| Expiration Year | Short-Term | Long-Term | Total |
| 2017 | $48,944,819 | NA | $48,944,819 |
The Fund used capital loss carryforwards of $67,662,442 to offset capital gains realized during the year ended October 31, 2012.
As a result of the tax-free transfer of assets from fund mergers, the use of certain capital loss carryforwards listed above may be limited.
5. INVESTMENT ADVISER FEE AND OTHER TRANSACTIONS WITH AFFILIATES
Investment Adviser Fee
The advisory agreement between the Fund and the Adviser provides for an annual fee equal to 0.75% of the Fund's average daily net assets. Subject to the terms described in the Expense Limitation note, the Adviser may voluntarily choose to waive any portion of its fee. For the year ended October 31, 2012, the Adviser voluntarily waived $175,085 of its fee.
Administrative Fee
Federated Administrative Services (FAS), under the Administrative Services Agreement, provides the Fund with administrative personnel and services. The fee paid to FAS is based on the average aggregate daily net assets of certain Federated funds as specified below, plus certain out-of-pocket expenses:
| Administrative Fee | Average Aggregate Daily Net Assets
of the Federated Funds |
| 0.150% | on the first $5 billion |
| 0.125% | on the next $5 billion |
| 0.100% | on the next $10 billion |
| 0.075% | on assets in excess of $20 billion |
Prior to September 1, 2012, the administrative fee received during any fiscal year was at least $150,000 per portfolio and $40,000 per each additional class of Shares. Subject to the terms described in the Expense Limitation note, FAS may voluntarily choose to waive any portion of its fee. For the year ended October 31, 2012, FAS waived $15,204 of its fee. The net fee paid to FAS was 0.076% of average daily net assets of the Fund.
Annual Shareholder Report
Distribution Services Fee
The Fund has adopted a Distribution Plan (the “Plan”) pursuant to Rule 12b-1 under the Act. Under the terms of the Plan, the Fund will compensate Federated Securities Corp. (FSC), the principal distributor, from the daily net assets of the Fund's Class A Shares, Class B Shares, Class C Shares and Class R Shares to finance activities intended to result in the sale of these shares. The Plan provides that the Fund may incur distribution expenses at the following percentages of average daily net assets annually, to compensate FSC:
| Share Class Name | Percentage of Average Daily
Net Assets of Class |
| Class A Shares | 0.05% |
| Class B Shares | 0.75% |
| Class C Shares | 0.75% |
| Class R Shares | 0.50% |
Subject to the terms described in the Expense Limitation note, FSC may voluntarily choose to waive any portion of its fee. For the year ended October 31, 2012, distribution services fees for the Fund were as follows:
| Distribution
Services
Fees Incurred | Distribution
Services
Fees Waived |
| Class B Shares | $376,820 | $— |
| Class C Shares | 463,993 | — |
| Class R Shares | 129,281 | (64,641) |
| TOTAL | $970,094 | $(64,641) |
When FSC receives fees, it may pay some or all of them to financial intermediaries whose customers purchase shares. For the year ended October 31, 2012, FSC retained $111,329 of fees paid by the Fund. For the year ended October 31, 2012, the Fund's Class A Shares did not incur a distribution services fee; however, it may begin to incur this fee upon approval of the Trustees.
Sales Charges
Front-end sales charges and contingent deferred sales charges (CDSC) do not represent expenses of the Fund. They are deducted from the proceeds of sales of Fund shares prior to investment or from redemption proceeds prior to remittance, as applicable. For the year ended October 31, 2012, FSC retained $26,601 in sales charges from the sale of Class A Shares. FSC also retained $2,014 of CDSC relating to redemptions of Class A Shares, $26,084 relating to redemptions of Class B Shares and $805 relating to redemptions of Class C Shares.
Annual Shareholder Report
Shareholder Services Fee
The Fund may pay fees (“Service Fees”) up to 0.25% of the average daily net assets of the Fund's Class A Shares, Class B Shares and Class C Shares to financial intermediaries or to Federated Shareholder Services Company (FSSC) for providing services to shareholders and maintaining shareholder accounts. Subject to the terms described in the Expense Limitation note, FSSC may voluntarily reimburse the Fund for Service Fees. For the year ended October 31, 2012, Service Fees for the Fund were as follows:
| Service
Fees
Incurred |
| Class A Shares | $1,795,620 |
| Class B Shares | 125,606 |
| Class C Shares | 150,083 |
| TOTAL | $2,071,309 |
For the year ended October 31, 2012, FSSC did not receive any fees paid by the Fund.
Expense Limitation
The Adviser and its affiliates (which may include FSC, FAS and FSSC) have voluntarily agreed to waive their fees and/or reimburse expenses so that the total annual fund operating expenses (as shown in the financial highlights) paid by the Fund's Class A Shares, Class B Shares, Class C Shares, Class R Shares and Institutional Shares (after the voluntary waivers and reimbursements) will not exceed 1.24%, 2.10%, 2.06%, 1.46% and 0.98% (the “Fee Limit”), respectively, up to but not including the later of (the “Termination Date”): (a) January 1, 2014; or (b) the date of the Fund's next effective Prospectus. While the Adviser and its affiliates currently do not anticipate terminating or increasing these arrangements prior to the Termination Date, these arrangements may only be terminated or the Fee Limit increased prior to the Termination Date with the agreement of the Trustees.
Interfund Transactions
During the year ended October 31, 2012, the Fund engaged in purchase and sale transactions with funds that have a common investment adviser (or affiliated investment advisers), common Directors/Trustees, and/or common Officers. These purchase and sale transactions complied with Rule 17a-7 under the Act and amounted to $1,854,398 and $386,022, respectively.
General
Certain Officers and Trustees of the Fund are Officers and Directors or Trustees of the above companies.
Annual Shareholder Report
Transactions Involving Affiliated Holdings
Affiliated holdings are mutual funds which are managed by the Adviser or an affiliate of the Adviser. The Adviser has agreed to reimburse the Fund for certain investment adviser fees as a result of transactions in other affiliated mutual funds. For the year ended October 31, 2012, the Adviser reimbursed $6,126. Transactions involving the affiliated holding during the year ended October 31, 2012, were as follows:
| Federated
Prime Value
Obligations Fund,
Institutional Shares |
| Balance of Shares Held 10/31/2011 | 34,771,413 |
| Purchases/Additions | 220,446,536 |
| Sales/Reductions | 249,921,024 |
| Balance of Shares Held 10/31/2012 | 5,296,925 |
| Value | $5,296,925 |
| Dividend Income | $11,248 |
6. EXPENSE Reduction
The Fund directs portfolio trades to a broker that in turn pays a portion of the Fund's operating expenses. For the year ended October 31, 2012, the Fund's expenses were reduced by $5,220 under these arrangements.
7. Investment TRANSACTIONS
Purchases and sales of investments, excluding long-term U.S. government securities and short-term obligations, for the year ended October 31, 2012, were as follows:
| Purchases | $1,065,662,033 |
| Sales | $1,377,725,278 |
8. LINE OF CREDIT
The Fund participates in a $100,000,000 unsecured, uncommitted revolving line of credit (LOC) agreement with PNC Bank. The LOC was made available for extraordinary or emergency purposes, primarily for financing redemption payments. Borrowings are charged interest at a rate offered to the Fund by PNC Bank at the time of the borrowing. As of October 31, 2012, there were no outstanding loans. During the year ended October 31, 2012, the Fund did not utilize the LOC.
9. INTERFUND LENDING
Pursuant to an Exemptive Order issued by the Securities and Exchange Commission, the Fund, along with other funds advised by subsidiaries of Federated Investors, Inc., may participate in an interfund lending program. This program provides an alternative credit facility allowing the Fund to borrow from other participating affiliated funds. As of October 31, 2012, there were no outstanding loans. During the year ended October 31, 2012, the program was not utilized.
Annual Shareholder Report
10. FEDERAL TAX INFORMATION (UNAUDITED)
For the fiscal year ended October 31, 2012, 100% of total ordinary dividends paid by the Fund are qualifying dividends which may be subject to a maximum tax rate of 15%, as provided for by the Jobs and Growth Tax Relief Act of 2003. Complete information is reported in conjunction with the reporting of your distributions on Form 1099-DIV.
Of the ordinary income distributions made by the Fund during the year ended October 31, 2012, 100% qualify for the dividend received deduction available to corporate shareholders.
Annual Shareholder Report
Report of Independent Registered Public Accounting Firm
TO THE BOARD OF TRUSTEES OF THE FEDERATED EQUITY FUNDS AND SHAREHOLDERS OF Federated CAPITAL APPRECIATION FUND:
We have audited the accompanying statement of assets and liabilities, including the portfolio of investments, of the Federated Capital Appreciation Fund (the “Fund”), a portfolio of Federated Equity Funds, as of October 31, 2012, and the related statement of operations for the year then ended, the statements of changes in net assets for each of the years in the two-year period then ended, and the financial highlights for each of the years in the five-year period then ended. These financial statements and financial highlights are the responsibility of the Fund's management. Our responsibility is to express an opinion on these financial statements and financial highlights based on our audits.
We conducted our audits in accordance with the standards of the Public Company Accounting Oversight Board (United States). Those standards require that we plan and perform the audit to obtain reasonable assurance about whether the financial statements and financial highlights are free of material misstatement. An audit includes examining, on a test basis, evidence supporting the amounts and disclosures in the financial statements. Our procedures included confirmation of securities owned as of October 31, 2012 by correspondence with the custodian, transfer agent and brokers, or by other appropriate auditing procedures. An audit also includes assessing the accounting principles used and significant estimates made by management, as well as evaluating the overall financial statement presentation. We believe that our audits provide a reasonable basis for our opinion.
In our opinion, the financial statements and financial highlights referred to above present fairly, in all material respects, the financial position of Federated Capital Appreciation Fund as of October 31, 2012 and the results of its operations for the year then ended, the changes in its net assets for each of the years in the two-year period then ended, and the financial highlights for each of the years in the five-year period then ended, in conformity with U.S. generally accepted accounting principles.
Boston, Massachusetts
December 24, 2012
Annual Shareholder Report
Shareholder Expense Example (unaudited)
As a shareholder of the Fund, you incur two types of costs: (1) transaction costs, including sales charges (loads) on purchase or redemption payments; and (2) ongoing costs, including management fees and to the extent applicable, distribution (12b-1) fees and/or shareholder services fees and other Fund expenses. This Example is intended to help you to understand your ongoing costs (in dollars) of investing in the Fund and to compare these costs with the ongoing costs of investing in other mutual funds. It is based on an investment of $1,000 invested at the beginning of the period and held for the entire period from May 1, 2012 to October 31, 2012.
ACTUAL EXPENSES
The first section of the table below provides information about actual account values and actual expenses. You may use the information in this section, together with the amount you invested, to estimate the expenses that you incurred over the period. Simply divide your account value by $1,000 (for example, an $8,600 account value divided by $1,000 = 8.6), then multiply the result by the number in the first section under the heading entitled “Expenses Paid During Period” to estimate the expenses attributable to your investment during this period.
HYPOTHETICAL EXAMPLE FOR COMPARISON PURPOSES
The second section of the table below provides information about hypothetical account values and hypothetical expenses based on the Fund's actual expense ratio and an assumed rate of return of 5% per year before expenses, which is not the Fund's actual return. Thus, you should not use the hypothetical account values and expenses to estimate the actual ending account balance or your expenses for the period. Rather, these figures are required to be provided to enable you to compare the ongoing costs of investing in the Fund with other funds. To do so, compare this 5% hypothetical example with the 5% hypothetical examples that appear in the shareholder reports of the other funds.
Annual Shareholder Report
Please note that the expenses shown in the table are meant to highlight your ongoing costs only and do not reflect any transaction costs, such as sales charges (loads) on purchase or redemption payments. Therefore, the second section of the table is useful in comparing ongoing costs only, and will not help you determine the relative total costs of owning different funds. In addition, if these transaction costs were included, your costs would have been higher.
| Beginning
Account Value
5/1/2012 | Ending
Account Value
10/31/2012 | Expenses Paid
During Period1 |
| Actual: | | | |
| Class A Shares | $1,000 | $986.80 | $6.19 |
| Class B Shares | $1,000 | $982.30 | $10.46 |
| Class C Shares | $1,000 | $982.30 | $10.26 |
| Class R Shares | $1,000 | $985.20 | $7.29 |
| Institutional Shares | $1,000 | $987.80 | $4.90 |
Hypothetical (assuming a 5% return
before expenses): | | | |
| Class A Shares | $1,000 | $1,018.90 | $6.29 |
| Class B Shares | $1,000 | $1,014.58 | $10.63 |
| Class C Shares | $1,000 | $1,014.78 | $10.43 |
| Class R Shares | $1,000 | $1,017.80 | $7.41 |
| Institutional Shares | $1,000 | $1,020.21 | $4.98 |
| 1 | Expenses are equal to the Fund's annualized net expense ratios, multiplied by the average account value over the period, multiplied by 184/366 (to reflect the one-half-year period). The annualized net expense ratios are as follows: |
| Class A Shares | 1.24% |
| Class B Shares | 2.10% |
| Class C Shares | 2.06% |
| Class R Shares | 1.46% |
| Institutional Shares | 0.98% |
Annual Shareholder Report
Board of Trustees and Trust Officers
The Board of Trustees is responsible for managing the Trust's business affairs and for exercising all the Trust's powers except those reserved for the shareholders. The following tables give information about each Trustee and the senior officers of the Fund. Where required, the tables separately list Trustees who are “interested persons” of the Fund (i.e., “Interested” Trustees) and those who are not (i.e., “Independent” Trustees). Unless otherwise noted, the address of each person listed is Federated Investors Tower, 1001 Liberty Avenue, Pittsburgh, PA 15222. The address of all Independent Trustees listed is 4000 Ericsson Drive, Warrendale, PA 15086-7561; Attention: Mutual Fund Board. As of December 31, 2011, the Trust comprised 13 portfolio(s), and the Federated Fund Family consisted of 43 investment companies (comprising 134 portfolios). Unless otherwise noted, each Officer is elected annually. Unless otherwise noted, each Trustee oversees all portfolios in the Federated Fund Family and serves for an indefinite term. The Fund's Statement of Additional Information includes additional information about Trust Trustees and is available, without charge and upon request, by calling 1-800-341-7400.
Interested TRUSTEES Background
Name
Birth Date
Positions Held with Trust
Date Service Began | Principal Occupation(s) for Past Five Years,
Other Directorships Held and Previous Position(s) |
John F. Donahue*
Birth Date: July 28, 1924
Trustee
Began serving: April 1984 | Principal Occupations: Director or Trustee of the Federated Fund Family; Chairman and Director, Federated Investors, Inc.; Chairman of the Federated Fund Family's Executive Committee.
Previous Positions: Chairman of the Federated Fund Family; Trustee, Federated Investment Management Company; Chairman and Director, Federated Investment Counseling. |
J. Christopher Donahue*
Birth Date: April 11, 1949
President and Trustee
Began serving: January 2000 | Principal Occupations: Principal Executive Officer and President of the Federated Fund Family; Director or Trustee of some of the Funds in the Federated Fund Family; President, Chief Executive Officer and Director, Federated Investors, Inc.; Chairman and Trustee, Federated Investment Management Company; Trustee, Federated Investment Counseling; Chairman and Director, Federated Global Investment Management Corp.; Chairman, Federated Equity Management Company of Pennsylvania and Passport Research, Ltd. (investment advisory subsidiary of Federated); Trustee, Federated Shareholder Services Company; Director, Federated Services Company.
Previous Positions: President, Federated Investment Counseling; President and Chief Executive Officer, Federated Investment Management Company, Federated Global Investment Management Corp. and Passport Research, Ltd. |
| * | Family relationships and reasons for “interested” status: John F. Donahue is the father of J. Christopher Donahue; both are “interested” due to their beneficial ownership of shares of Federated Investors, Inc. and the positions they hold with Federated and its subsidiaries. |
Annual Shareholder Report
INDEPENDENT TRUSTEES Background
Name
Birth Date
Positions Held with Trust
Date Service Began | Principal Occupation(s) for Past Five Years,
Other Directorships Held, Previous Position(s) and Qualifications |
Nicholas P. Constantakis, CPA
Birth Date: September 3, 1939
Trustee
Began serving: February 1998 | Principal Occupation: Director or Trustee of the Federated Fund Family.
Other Directorship Held: Director, Chairman of the Audit Committee, and member of the Compensation Committee, Michael Baker Corporation (architecture, engineering and construction services).
Previous Position: Partner, Andersen Worldwide SC.
Qualifications: Public accounting and director experience. |
John F. Cunningham
Birth Date: March 5, 1943
Trustee
Began serving: January 1999 | Principal Occupation: Director or Trustee of the Federated Fund Family.
Other Directorships Held: Chairman, President and Chief Executive Officer, Cunningham & Co., Inc. (strategic business consulting); Trustee Associate, Boston College.
Previous Positions: Director, Redgate Communications and EMC Corporation (computer storage systems); Chairman of the Board and Chief Executive Officer, Computer Consoles, Inc.; President and Chief Operating Officer, Wang Laboratories; Director, First National Bank of Boston; Director, Apollo Computer, Inc.
Qualifications: Business management and director experience. |
Maureen Lally-Green
Birth Date: July 5, 1949
Trustee
Began serving: August 2009 | Principal Occupations: Director or Trustee of the Federated Fund Family; Director, Office of Church Relations, Diocese of Pittsburgh; Adjunct Professor of Law, Duquesne University School of Law.
Other Directorships Held: Director, Auberle; Member, Pennsylvania State Board of Education; Director, Saint Vincent College; Director, Ireland Institute of Pittsburgh; Chair and Director, UPMC Mercy Hospital; Regent, St. Vincent Seminary; Director, Epilepsy Foundation of Western and Central Pennsylvania; Director, Saint Thomas More Society, Allegheny County; Director, Our Campaign for the Church Alive, Inc.
Previous Position: Pennsylvania Superior Court Judge.
Qualifications: Legal and director experience. |
Peter E. Madden
Birth Date: March 16, 1942
Trustee
Began serving: November 1991 | Principal Occupation: Director or Trustee, and Chairman of the Board of Directors or Trustees, of the Federated Fund Family.
Previous Positions: Representative, Commonwealth of Massachusetts General Court; President, Chief Operating Officer and Director, State Street Bank and Trust Company and State Street Corporation (retired); Director, VISA USA and VISA International; Chairman and Director, Massachusetts Bankers Association; Director, Depository Trust Corporation; Director, The Boston Stock Exchange.
Qualifications: Business management, mutual fund services and director experience. |
Annual Shareholder Report
Name
Birth Date
Positions Held with Trust
Date Service Began | Principal Occupation(s) for Past Five Years,
Other Directorships Held, Previous Position(s) and Qualifications |
Charles F. Mansfield, Jr.
Birth Date: April 10, 1945
Trustee
Began serving: January 1999 | Principal Occupations: Director or Trustee of the Federated Fund Family; Management Consultant.
Previous Positions: Chief Executive Officer, PBTC International Bank; Partner, Arthur Young & Company (now Ernst & Young LLP); Chief Financial Officer of Retail Banking Sector, Chase Manhattan Bank; Senior Vice President, HSBC Bank USA (formerly Marine Midland Bank); Vice President, Citibank; Assistant Professor of Banking and Finance, Frank G. Zarb School of Business, Hofstra University; Executive Vice President, DVC Group, Inc. (marketing, communications and technology).
Qualifications: Banking, business management, education and director experience. |
Thomas M. O'Neill
Birth Date: June 14, 1951
Trustee
Began serving: October 2006 | Principal Occupations: Director or Trustee, Vice Chairman of the Audit Committee of the Federated Fund Family; Sole Proprietor, Navigator Management Company (investment and strategic consulting).
Other Directorships Held: Board of Overseers, Children's Hospital of Boston; Visiting Committee on Athletics, Harvard College; Board of Directors, Medicines for Humanity; Board of Directors, The Golisano Children's Museum of Naples, Florida.
Previous Positions: Chief Executive Officer and President, Managing Director and Chief Investment Officer, Fleet Investment Advisors; President and Chief Executive Officer, Aeltus Investment Management, Inc.; General Partner, Hellman, Jordan Management Co., Boston, MA; Chief Investment Officer, The Putnam Companies, Boston, MA; Credit Analyst and Lending Officer, Fleet Bank; Director and Consultant, EZE Castle Software (investment order management software); Director, Midway Pacific (lumber).
Qualifications: Business management, mutual fund, director and investment experience. |
John S. Walsh
Birth Date: November 28, 1957
Trustee
Began serving: January 1999 | Principal Occupations: Director or Trustee, Chairman of the Audit Committee of the Federated Fund Family; President and Director, Heat Wagon, Inc. (manufacturer of construction temporary heaters); President and Director, Manufacturers Products, Inc. (distributor of portable construction heaters); President, Portable Heater Parts, a division of Manufacturers Products, Inc.
Previous Position: Vice President, Walsh & Kelly, Inc.
Qualifications: Business management and director experience. |
Annual Shareholder Report
OFFICERS
Name
Birth Date
Address
Positions Held with Trust
Date Service Began | Principal Occupation(s) for Past Five Years
and Previous Position(s) |
John W. McGonigle
Birth Date: October 26, 1938
EXECUTIVE VICE PRESIDENT AND SECRETARY
Officer since: April 1984 | Principal Occupations: Executive Vice President and Secretary of the Federated Fund Family; Vice Chairman, Executive Vice President, Secretary and Director, Federated Investors, Inc.
Previous Positions: Trustee, Federated Investment Management Company and Federated Investment Counseling; Director, Federated Global Investment Management Corp., Federated Services Company and Federated Securities Corp. |
Richard A. Novak
Birth Date: December 25, 1963
TREASURER
Officer since: January 2006 | Principal Occupations: Principal Financial Officer and Treasurer of the Federated Fund Family; Senior Vice President, Federated Administrative Services; Financial and Operations Principal for Federated Securities Corp., Edgewood Services, Inc. and Southpointe Distribution Services, Inc.
Previous Positions: Controller of Federated Investors, Inc.; Vice President, Finance of Federated Services Company; held various financial management positions within The Mercy Hospital of Pittsburgh; Auditor, Arthur Andersen & Co. |
Richard B. Fisher
Birth Date: May 17, 1923
VICE PRESIDENT
Officer since: April 1984 | Principal Occupations: Vice Chairman or Vice President of some of the Funds in the Federated Fund Family; Vice Chairman, Federated Investors, Inc.; Chairman, Federated Securities Corp.
Previous Positions: President and Director or Trustee of some of the Funds in the Federated Fund Family; Executive Vice President, Federated Investors, Inc.; Director and Chief Executive Officer, Federated Securities Corp. |
Peter J. Germain
Birth Date: September 3, 1959
CHIEF LEGAL OFFICER
Officer since: January 2005
| Principal Occupations: Mr. Germain is Chief Legal Officer of the Federated Fund Family. He is General Counsel and Vice President, Federated Investors, Inc.; President, Federated Administrative Services and Federated Administrative Services, Inc.; Vice President, Federated Securities Corp.; Secretary, Federated Private Asset Management, Inc.; and Secretary, Retirement Plan Service Company of America. Mr. Germain joined Federated in 1984 and is a member of the Pennsylvania Bar Association.
Previous Positions: Deputy General Counsel, Special Counsel, Managing Director of Mutual Fund Services, Federated Investors, Inc.; Senior Vice President, Federated Services Company; and Senior Corporate Counsel, Federated Investors, Inc. |
Brian P. Bouda
Birth Date: February 28, 1947
CHIEF COMPLIANCE OFFICER AND SENIOR VICE PRESIDENT
Officer since: August 2004 | Principal Occupations: Senior Vice President and Chief Compliance Officer of the Federated Fund Family; Vice President and Chief Compliance Officer of Federated Investors, Inc. and Chief Compliance Officer of its subsidiaries. Mr. Bouda joined Federated in 1999 and is a member of the American Bar Association and the State Bar Association of Wisconsin. |
Annual Shareholder Report
Name
Birth Date
Address
Positions Held with Trust
Date Service Began | Principal Occupation(s) for Past Five Years
and Previous Position(s) |
Stephen F. Auth
Birth Date: September 3, 1956
450 Lexington Avenue
Suite 3700
New York, NY 10017-3943
CHIEF INVESTMENT OFFICER
Officer since: November 2002 | Principal Occupations: Mr. Auth is Chief Investment Officer of this Fund and various other Funds in the Federated Fund Family; Executive Vice President, Federated Investment Counseling, Federated Global Investment Management Corp. and Federated Equity Management Company of Pennsylvania.
Previous Positions: Executive Vice President, Federated Investment Management Company, and Passport Research, Ltd. (investment advisory subsidiary of Federated); Senior Vice President, Global Portfolio Management Services Division; Senior Vice President, Federated Investment Management Company and Passport Research, Ltd.; Senior Managing Director and Portfolio Manager, Prudential Investments. |
James E. Grefenstette
Birth Date: November 7, 1962
Vice President
Officer since: February 2011
Portfolio Manager since: April 2011. | Principal Occupations: James E. Grefenstette has been the Fund's Senior Portfolio Manager since April 2011. He is Vice President of the Trust with respect to the Fund. He is Vice President of the Fund's Adviser. Mr. Grefenstette joined Federated in December 2009. Previously, he served as founder and managing partner of Blazer Investment Advisers from April 2008 until December 2009, and as founder and managing partner of Aspirante Capital Management, a long/short hedge fund, from August 2006 until September 2007. Prior to that, Mr. Grefenstette worked at Federated as Portfolio Manager of the Fund from 1994 until June 2006 and as Senior Vice President of the Fund's Adviser from January 2000 until July 2006. He also served as Vice President and Assistant Vice President of the Fund's Adviser from 1994 until 1999. Mr. Grefenstette has received the Chartered Financial Analyst designation; he received his M.S. in Industrial Administration from Carnegie Mellon University and his BSBA from Georgetown University. |
Annual Shareholder Report
Evaluation and Approval of Advisory Contract–May 2012
Federated Capital Appreciation Fund (the “Fund”)
Following a review and recommendation of approval by the Fund's independent trustees, the Fund's Board reviewed and approved at its May 2012 meetings the Fund's investment advisory contract for an additional one-year term. The Board's decision regarding the contract reflects the exercise of its business judgment on whether to continue the existing arrangements.
In this connection, the Federated Funds' Board had previously appointed a Senior Officer, whose duties include specified responsibilities relating to the process by which advisory fees are to be charged to a Federated fund. The Senior Officer has the authority to retain consultants, experts, or staff as may be reasonably necessary to assist in the performance of his duties, reports directly to the Board, and may be terminated only with the approval of a majority of the independent members of the Board. The Senior Officer prepared and furnished to the Board an independent, written evaluation that covered topics discussed below (the “Evaluation”). The Board considered that Evaluation, along with other information, in deciding to approve the advisory contract.
The Board is also familiar with and considered judicial decisions concerning allegedly excessive investment advisory fees, which have indicated that the following factors may be relevant to an Adviser's fiduciary duty with respect to its receipt of compensation from a fund: the nature and quality of the services provided by the Adviser to a fund and its shareholders, including the performance and expenses of the fund and of comparable funds; the Adviser's cost of providing the services, including the profitability to the Adviser of providing advisory services to a fund; the extent to which the Adviser may realize “economies of scale” as a fund grows larger and, if such economies exist, whether they have been shared with a fund and its shareholders; any “fall-out financial benefits” that accrue to the Adviser because of its relationship with a fund (including research services received from brokers that execute fund trades and any fees paid to affiliates of the Adviser for services rendered to a fund); comparative fee structures, including a comparison of fees paid to the Adviser with those paid by similar funds; and the extent to which the Board members are fully informed about all facts the Board deems relevant to its consideration of the Adviser's services and fees. Consistent with these judicial decisions, the Board also considered management fees (including any components thereof) charged to institutional and other clients of the Adviser for what might be viewed as like services. The Board was aware of these factors and was guided by them in its review of the Fund's advisory contract to the extent it considered them to be appropriate and relevant, as discussed further below.
Annual Shareholder Report
The Board considered and weighed these circumstances in light of its substantial accumulated experience in governing the Fund and working with Federated on matters relating to the Federated funds, and was assisted in its deliberations by independent legal counsel. Throughout the year, and in connection with its May meetings, the Board requested and received substantial and detailed information about the Fund and the Federated organization that was in addition to the extensive materials that comprise and accompany the Senior Officer's Evaluation. Federated provided much of this information at each regular meeting of the Board, and furnished additional substantial information in connection with the May meeting at which the Board's formal review of the advisory contract occurred. At this May meeting, senior management of the Adviser also met with the independent trustees and their counsel to discuss the materials presented and any other matters thought relevant by the Adviser or the trustees. Between regularly scheduled meetings, the Board also received information on particular matters as the need arose. Thus, the Board's consideration of the advisory contract included review of the Senior Officer's Evaluation, accompanying data and additional information covering such matters as: the Adviser's investment philosophy, revenue, profitability, personnel and processes; investment and operating strategies; the Fund's short- and long-term performance (in absolute terms, both on a gross basis and net of expenses, as well as in relationship to its particular investment program and certain competitor or “peer group” funds and/or other benchmarks, as appropriate), and comments on the reasons for performance; the Fund's investment objectives; the Fund's expenses (including the advisory fee itself and the overall expense structure of the Fund, both in absolute terms and relative to similar and/or competing funds, with due regard for contractual or voluntary expense limitations); the use and allocation of brokerage commissions derived from trading the Fund's portfolio securities (if any); and the nature, quality and extent of the advisory and other services provided to the Fund by the Adviser and its affiliates. The Board also considered the preferences and expectations of Fund shareholders; the entrepreneurial risk assumed by the Adviser in sponsoring the funds; the continuing state of competition in the mutual fund industry and market practices; the range of comparable fees for similar funds in the mutual fund industry; the Fund's relationship to the Federated family of funds which include a comprehensive array of funds with different investment objectives, policies and strategies which are available for exchange without the incurrence of additional sales charges; compliance and audit reports concerning the Federated funds and the Federated companies that service them (including communications from regulatory agencies), as well as Federated's responses to any issues raised therein; and relevant developments in the mutual fund industry and how the Federated funds and/or Federated are responding to them. The Board's evaluation process is evolutionary. The criteria considered and the emphasis placed on relevant criteria change in recognition of changing circumstances in the mutual fund marketplace.
Annual Shareholder Report
While mindful that courts have cautioned against giving such comparisons too much weight, the Board has found the use of comparisons of the Fund's fees and expenses to other mutual funds with comparable investment programs to be relevant, given the high degree of competition in the mutual fund business. The Board focused on comparisons with other similar mutual funds more heavily than non-mutual fund products or services because it is believed that they are more relevant. For example, other mutual funds are the products most like the Fund, they are readily available to Fund shareholders as alternative investment vehicles, and they are the type of investment vehicle in fact chosen and maintained by the Fund's investors. The range of their fees and expenses therefore appears to be a generally reliable indication of what consumers have found to be reasonable in the precise marketplace in which the Fund competes. In this regard, the Senior Officer has reviewed Federated's fees for providing advisory services to products outside the Federated family of funds (e.g., institutional and separate accounts). He concluded that mutual funds and institutional accounts are inherently different products. Those differences include, but are not limited to, different types of targeted investors; being subject to different laws and regulations; different legal structures; different average account sizes; different associated costs; different portfolio management techniques made necessary by different cash flows; and portfolio manager time spent in review of securities pricing. The Senior Officer did not consider these fee schedules to be determinative in judging the appropriateness of mutual fund advisory contracts.
The Fund's ability to deliver competitive performance when compared to its peer group was also deemed to be relevant by the Board as a useful indicator of how the Adviser is executing the Fund's investment program, which in turn assisted the Board in reaching a conclusion that the nature, extent, and quality of the Adviser's investment management services were such as to warrant continuation of the advisory contract.
The Senior Officer reviewed information compiled by Federated, using data supplied by independent fund ranking organizations, regarding the performance of, and fees charged by, other mutual funds, noting his view that comparisons to fund peer groups are relevant in judging the reasonableness of proposed fees.
The Fund's performance fell below the median of the relevant peer group for the one-year, three-year and five-year periods covered by the Evaluation. The Board discussed the Fund's performance with the Adviser and recognized the efforts being undertaken by the Adviser. The Board will continue to monitor these efforts and the performance of the Fund.
The Board also received financial information about Federated, including information regarding the compensation and benefits Federated derived from its relationships with the Federated funds. This information covered not only the fees under the advisory contracts, but also fees received by Federated's subsidiaries for providing other services to the Federated funds under separate contracts (e.g., for serving as the Federated funds' administrator). The
Annual Shareholder Report
information also detailed any indirect benefit Federated may derive from its receipt of research services from brokers who execute Federated fund trades. In addition, the Board considered the fact that, in order for a fund to be competitive in the marketplace, Federated and its affiliates frequently waived fees and/or reimbursed expenses and have disclosed to fund investors and/or indicated to the Board their intention to do so in the future, where appropriate. Moreover, the Board receives regular reporting as to the institution or elimination of these voluntary waivers.
Federated furnished information, requested by the Senior Officer, that reported revenues on a fund-by-fund basis and made estimates of the allocation of expenses on a fund-by-fund basis, using allocation methodologies specified by the Senior Officer. The Senior Officer noted that, although they may apply consistent allocation processes, the inherent difficulties in allocating costs (and the unavoidable arbitrary aspects of that exercise) and the lack of consensus on how to allocate those costs may render such allocation information unreliable. The allocation information was considered in the analysis by the Board but was determined to be of limited use.
The Board and the Senior Officer also reviewed information compiled by Federated comparing profitability information for Federated to other publicly held fund management companies. In this regard, the Senior Officer noted the limited availability of such information, but nonetheless concluded that Federated's profit margins did not appear to be excessive.
The Senior Officer's Evaluation also discussed the notion of possible realization of “economies of scale” as a fund grows larger. The Board considered in this regard that the Adviser has made significant and long-term investments in areas that support all of the Federated funds, such as personnel and processes for the portfolio management, shareholder services, compliance, internal audit, and risk management functions; and systems technology; and that the benefits of these efforts (as well as any economies, should they exist) were likely to be enjoyed by the fund complex as a whole. Finally, the Board also noted the absence of any applicable regulatory or industry guidelines on this subject, which (as discussed in the Senior Officer's Evaluation) is compounded by the lack of any common industry practice or general pattern with respect to structuring fund advisory fees with “breakpoints” that serve to reduce the fee as the fund attains a certain size. The Senior Officer did not recommend institution of breakpoints in pricing Federated's fund advisory services at this time.
It was noted in the materials for the Board meeting that, for the period covered by the Evaluation, the Fund's investment advisory fee, after waivers and expense reimbursements, if any, was above the median of the relevant peer group. The Board reviewed the fees and other expenses of the Fund with the Adviser and was satisfied that the overall expense structure of the Fund remained competitive. The Board will continue to monitor advisory fees and other expenses borne by the Fund.
Annual Shareholder Report
The Senior Officer noted that, considering the totality of the circumstances, and all of the factors referenced within his Evaluation, he had concluded that, subject to comments and recommendations made within his Evaluation, his observations and the information accompanying the Evaluation supported a finding by the Board that the management fees for each of the funds was reasonable and that Federated appeared to provide appropriate advisory and administrative services to the Fund for the fees paid. Under these circumstances, no changes were recommended to, and no objection was raised to, the continuation of the Fund's advisory contract.
In its decision to continue an existing investment advisory contract, the Board was mindful of the potential disruptions of the Fund's operations and various risks, uncertainties and other effects that could occur as a result of a decision to terminate or not renew an advisory contract. In particular, the Board recognized that many shareholders have invested in the Fund on the strength of the Adviser's industry standing and reputation and with the expectation that the Adviser will have a continuing role in providing advisory services to the Fund. Thus, the Board's approval of the advisory contract reflected the fact that it is the shareholders who have effectively selected the Adviser by virtue of having invested in the Fund. The Board concluded that, in light of the factors discussed above, including the nature, quality and scope of the services provided to the Fund by the Adviser and its affiliates, continuation of the advisory contract was appropriate.
The Board based its decision to approve the advisory contract on the totality of the circumstances and relevant factors and with a view to past and future long-term considerations. Not all of the factors and considerations identified above were necessarily relevant to the Fund, nor did the Board consider any one of them to be determinative. With respect to the factors that were relevant, the Board's decision to approve the contract reflects its determination that Federated's performance and actions provided a satisfactory basis to support the decision to continue the existing arrangements.
Annual Shareholder Report
Voting Proxies on Fund Portfolio Securities
A description of the policies and procedures that the Fund uses to determine how to vote proxies, if any, relating to securities held in the Fund's portfolio is available, without charge and upon request, by calling 1-800-341-7400. A report on “Form N-PX” of how the Fund voted any such proxies during the most recent 12-month period ended June 30 is available from Federated's website at FederatedInvestors.com. To access this information from the home page, select “All” under “Asset Classes.” Select a fund name and share class, if applicable, to go to the Fund Overview page. On the Fund Overview page, select the “Documents” tab. At the bottom of that page, select “Proxy Voting Record Report (Form N-PX).” Form N-PX filings are also available at the SEC's website at www.sec.gov.
Quarterly Portfolio Schedule
The Fund files with the SEC a complete schedule of its portfolio holdings, as of the close of the first and third quarters of its fiscal year, on “Form N-Q.” These filings are available on the SEC's website at www.sec.gov and may be reviewed and copied at the SEC's Public Reference Room in Washington, DC. (Call 1-800-SEC-0330 for information on the operation of the Public Reference Room.) You may also access this information from the “Products” section of Federated's website at FederatedInvestors.com. From the home page, select “All” under “Asset Classes.” Select a fund name and share class, if applicable, to go to the Fund Overview page. On the Fund Overview page, select the “Documents” tab. At the bottom of that page, select “Form N-Q.”
Annual Shareholder Report
[PAGE INTENTIONALLY LEFT BLANK]
[PAGE INTENTIONALLY LEFT BLANK]
[PAGE INTENTIONALLY LEFT BLANK]
[PAGE INTENTIONALLY LEFT BLANK]
Mutual funds are not bank deposits or obligations, are not guaranteed by any bank and are not insured or guaranteed by the U.S. government, the Federal Deposit Insurance Corporation, the Federal Reserve Board or any other government agency. Investment in mutual funds involves investment risk, including the possible loss of principal.
This Report is authorized for distribution to prospective investors only when preceded or accompanied by the Fund's Prospectus, which contains facts concerning its objective and policies, management fees, expenses and other information.
Federated Capital Appreciation Fund
Federated Investors Funds
4000 Ericsson Drive
Warrendale, PA 15086-7561
Contact us at FederatedInvestors.com
or call 1-800-341-7400.
Federated Securities Corp., Distributor
CUSIP 314172701
CUSIP 314172800
CUSIP 314172883
CUSIP 314172594
CUSIP 314172396
G01649-04 (12/12)
Federated is a registered trademark of Federated Investors, Inc.
2012 ©Federated Investors, Inc.
Annual Shareholder Report
October 31, 2012
| Share Class | Ticker |
| A | KAUAX |
| B | KAUBX |
| C | KAUCX |
Federated Kaufmann Fund
Successor to the Kaufmann Fund, Inc., with performance history since February 21, 1986
A Portfolio of Federated Equity Funds
Not FDIC Insured • May Lose Value • No Bank Guarantee
Management's Discussion of Fund Performance (unaudited)
The Fund's total return, based on net asset value, for the 12-month reporting period ended October 31, 2012, was 9.45% for the Class A Shares, 8.72% for the Class B Shares and 8.72% for the Class C Shares. The total return of the Fund's benchmark, the Russell Midcap Growth Index (RMCG),1 a broad-based securities market index, was 9.09% for the same period. The Fund's total return for the fiscal year reflected actual cash flows, transaction costs and other expenses which were not reflected in the total return of the RMCG.
The following discussion will focus on the performance of the Fund's Class A Shares.
Market OVERVIEW
As markets continued to digest corporate and macroeconomic results, volatility was evident in global equity markets with weakness corresponding to investor uncertainty during November 2011 and for the first half of the summer of 2012. Subsequently, stock markets rallied significantly posting strong returns throughout the remainder of the fiscal year. The Standard and Poor's 500 Index (S&P 500)2 bottomed in November 2011 and rallied strongly to finish the year up 15.21%. Overall large-cap stocks performed best, followed by mid-cap and small-cap stocks. In terms of investment style, value stocks significantly outperformed growth stocks across all three capitalization groups: small, mid and large.
Market conditions remained volatile and uncertain, with macroeconomic factors and news headlines still showing some progress on economic conditions globally; however, economic indicators can best be described during the reporting period as mixed.
Globally, central banks remained accommodative by keeping interest rates low and continuing the various bond purchase programs to reduce both sovereign and corporate interest rates. While monetary stimulus generally controlled by central banks has remained accommodative to economic growth, fiscal policies globally are being vigorously debated as to the correct balance between stimulating economic growth and reducing deficits.
Fund Performance
The Fund's Class A Shares outperformed the RMCG during the reporting period. Key factors affecting Fund performance included: stock selection, sector weightings and investment in international holdings.3
Regarding stock selection, the companies that were strong performers and contributed most to the Fund's returns during the period were: Apple (+48%), Prada Spa (+64%), Express Scripts Holdings (+35%), Michael Kors (+173%), Amadeus IT Holdings (+33%), Samsonite International (+27%), Dyax Corp. (+122%), Gilead Sciences (+41%) and Verisk Analytics (+45%).
Annual Shareholder Report
The nine worst contributing holdings during the period accounted for a large portion of the weakness in stock selection results: Cetip (-17%), Zynga (-78%), Progenics Pharmaceuticals (-57%), Abercrombie & Fitch (-45%), Expeditors International (-19%), Mongolian Mining (-50%), Tns Inc. (-27%), First Solar (-63%) and Riverbed Technology (-33%).
Regarding sector weightings, a substantial underweighting of Energy and Consumer Staples along with substantial overweights in the Healthcare and Financials sectors relative to the RMCG contributed positively to Fund performance.
The Fund maintained exposure to growth companies outside of the United States. Although stock selection in foreign holdings was generally strong, exposure to Brazil, India and Spain contributed negatively to Fund performance.
The Fund was substantially invested in stocks during the reporting period; however, average holdings of cash equivalents of approximate 4% during the period hurt Fund performance.
| 1 | The Russell Midcap Growth Index measures the performance of the mid-cap growth segment of the U.S. equity universe. It includes those Russell Midcap Index companies with higher price-to-book ratios and higher forecasted growth values. The index is unmanaged, and it is not possible to invest directly in an index. |
| 2 | The S&P 500 Index is a capitalization-weighted index of 500 stocks designed to measure performance of the broad domestic economy through changes in the aggregate market value of 500 stocks representing all major industries. The index is unmanaged, and it is not possible to invest directly in an index. |
| 3 | International investing involves special risks including currency risk, increased volatility, political risks and differences in auditing and other financial standards. |
Annual Shareholder Report
FUND PERFORMANCE AND GROWTH OF A $10,000 INVESTMENT
The Average Annual Total Return table below shows returns for each class averaged over the stated periods. The graphs below illustrate the hypothetical investment of $10,0001 in the Federated Kaufmann Fund (the “Fund”) from October 31, 1997 to October 31, 2012, compared to the Russell Midcap® Growth Index (RMCG)2 and the Lipper Multi-Cap Growth Funds Category (LMCGC).2
Average Annual Total Returns for the Period Ended 10/31/2012
(returns reflect all applicable sales charges and contingent deferred sales charges as specified below in footnote #1)
| Share Class | 6-Month
(Cumulative) | 1 Year | 3 Years | 5 Years | 10 Years | 15 Years |
| Class A Shares | -7.94% | 3.43% | 6.72% | -4.25% | 7.45% | 6.22% |
| Class B Shares | -8.28% | 3.22% | 6.91% | -4.04% | 7.57% | 6.34% |
| Class C Shares | -3.92% | 7.72% | 8.08% | -3.69% | 7.46% | 6.07% |
| Russell Midcap Growth Index | -2.82% | 9.09% | 15.42% | 1.55% | 10.03% | 6.00% |
| Lipper Multi-Cap Growth Funds Category | -2.56% | 9.36% | 12.34% | -0.58% | 7.54% | 5.24% |
Performance data quoted represents past performance which is no guarantee of future results. Investment return and principal value will fluctuate so that an investor's shares, when redeemed, may be worth more or less than their original cost. Mutual fund performance changes over time and current performance may be lower or higher than what is stated. For current to the most recent month-end performance and after-tax returns, visit FederatedInvestors.com or call 1-800-341-7400. Returns shown do not reflect the deduction of taxes that a shareholder would pay on Fund distributions or the redemption of Fund shares. Mutual funds are not obligations of or guaranteed by any bank and are not federally insured.
Annual Shareholder Report
Growth of a $10,000 Investment–CLASS A SHARES
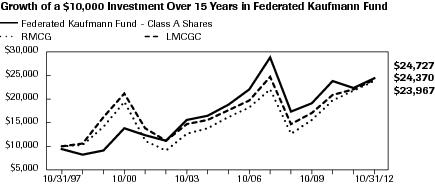
| Federated Kaufmann Fund - Class A Shares | C000026729 | RMCG | LMCGC |
| 10/31/1997 | 9,450 | 10,000 | 10,000 |
| 10/31/1998 | 8,238 | 10,243 | 10,744 |
| 10/31/1999 | 9,130 | 14,101 | 16,209 |
| 10/31/2000 | 13,815 | 19,555 | 21,398 |
| 10/31/2001 | 12,503 | 11,189 | 13,780 |
| 10/31/2002 | 11,391 | 9,218 | 11,282 |
| 10/31/2003 | 15,767 | 12,840 | 14,801 |
| 10/31/2004 | 16,593 | 13,966 | 15,646 |
| 10/31/2005 | 18,924 | 16,188 | 17,713 |
| 10/31/2006 | 22,153 | 18,537 | 19,776 |
| 10/31/2007 | 29,036 | 22,192 | 24,841 |
| 10/31/2008 | 17,357 | 12,727 | 14,741 |
| 10/31/2009 | 19,225 | 15,588 | 17,303 |
| 10/31/2010 | 24,052 | 19,958 | 20,978 |
| 10/31/2011 | 22,592 | 21,970 | 22,285 |
| 10/31/2012 | 24,727 | 23,967 | 24,370 |
41 graphic description end -->
| ■ | Total returns shown include the maximum sales charge of 5.50% ($10,000 investment minus $550 sales charge = $9,450). |
Growth of a $10,000 Investment–CLASS b SHARES
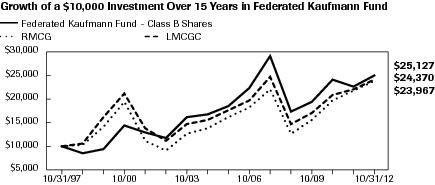
| Federated Kaufmann Fund - Class B Shares | C000026730 | RMCG | LMCGC |
| 10/31/1997 | 10,000 | 10,000 | 10,000 |
| 10/31/1998 | 8,674 | 10,243 | 10,744 |
| 10/31/1999 | 9,565 | 14,101 | 16,209 |
| 10/31/2000 | 14,403 | 19,555 | 21,398 |
| 10/31/2001 | 12,973 | 11,189 | 13,780 |
| 10/31/2002 | 11,780 | 9,218 | 11,282 |
| 10/31/2003 | 16,197 | 12,840 | 14,801 |
| 10/31/2004 | 16,955 | 13,966 | 15,646 |
| 10/31/2005 | 18,777 | 16,188 | 17,713 |
| 10/31/2006 | 22,512 | 18,537 | 19,776 |
| 10/31/2007 | 29,506 | 22,192 | 24,841 |
| 10/31/2008 | 17,638 | 12,727 | 14,741 |
| 10/31/2009 | 19,536 | 15,588 | 17,303 |
| 10/31/2010 | 24,441 | 19,958 | 20,978 |
| 10/31/2011 | 22,958 | 21,970 | 22,285 |
| 10/31/2012 | 25,127 | 23,967 | 24,370 |
41 graphic description end -->
| ■ | Total returns shown include the maximum contingent deferred sales charge of 5.50%, as applicable. |
Annual Shareholder Report
Growth of a $10,000 Investment–CLASS c SHARES
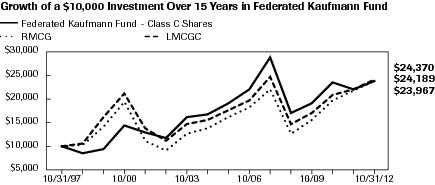
| Federated Kaufmann Fund - Class C Shares | C000026731 | RMCG | LMCGC |
| 10/31/1997 | 10,000 | 10,000 | 10,000 |
| 10/31/1998 | 8,674 | 10,243 | 10,744 |
| 10/31/1999 | 9,565 | 14,101 | 16,209 |
| 10/31/2000 | 14,403 | 19,555 | 21,398 |
| 10/31/2001 | 12,973 | 11,189 | 13,780 |
| 10/31/2002 | 11,780 | 9,218 | 11,282 |
| 10/31/2003 | 16,197 | 12,840 | 14,801 |
| 10/31/2004 | 16,955 | 13,966 | 15,646 |
| 10/31/2005 | 19,238 | 16,188 | 17,713 |
| 10/31/2006 | 22,376 | 18,537 | 19,776 |
| 10/31/2007 | 29,190 | 22,192 | 24,841 |
| 10/31/2008 | 17,338 | 12,727 | 14,741 |
| 10/31/2009 | 19,158 | 15,588 | 17,303 |
| 10/31/2010 | 23,804 | 19,958 | 20,978 |
| 10/31/2011 | 22,249 | 21,970 | 22,285 |
| 10/31/2012 | 24,189 | 23,967 | 24,370 |
41 graphic description end -->
| ■ | Total returns shown include the maximum contingent deferred sales charge of 1.00%, as applicable. |
| 1 | Represents a hypothetical investment of $10,000 in the Fund after deducting applicable sales charges: For Class A Shares, the maximum sales charge of 5.50% ($10,000 investment minus $550 sales charge = $9,450); for Class B Shares, the maximum contingent deferred sales charge is 5.50% on any redemption less than one year from the purchase date; for Class C Shares, the maximum contingent deferred sales charge is 1.00% on any redemption less than one year from the purchase date. The Fund's performance assumes the reinvestment of all dividends and distributions. The RMCG and the LMCGC have been adjusted to reflect reinvestment of all dividends on securities in the index and the average. The Fund is a successor to the Kaufmann Fund, Inc. (Kaufmann Fund) pursuant to a reorganization that took place on April 23, 2001. Prior to that date, the Fund had no investment operations. Accordingly, the performance information provided is historical information of the Kaufmann Fund, but has been adjusted to reflect the expenses applicable to the Fund's Class A Shares, Class B Shares and Class C Shares, respectively. |
| 2 | The RMCG is not adjusted to reflect sales charges, expenses or other fees that the Securities and Exchange Commission requires to be reflected in the Fund's performance. The RMCG measures the performance of those Russell Midcap companies with higher price-to-book ratios and higher forecasted growth values. The stocks are also members of the Russell 1000 Growth Index. The LMCGC is an equal dollar-weighted index of the largest mutual funds within the mid-cap growth classification, as defined by Lipper, Inc. The LMCGC does not reflect sales charges and is adjusted for the reinvestment of capital gains and income dividends. The RMCG is unmanaged and, unlike the Fund, is not affected by cash flows. Investments cannot be made in an index and an average. |
Annual Shareholder Report
Portfolio of Investments Summary Table (unaudited)
At October 31, 2012, the Fund's sector composition1 was as follows:
| Sector Composition | Percentage of
Total Net Assets |
| Health Care | 25.5% |
| Financials | 20.1% |
| Information Technology | 17.8% |
| Industrials | 13.3% |
| Consumer Discretionary | 11.7% |
| Materials | 3.7% |
| Consumer Staples | 1.3% |
| Telecommunication Services | 1.1% |
| Utilities | 0.7% |
| Energy | 0.3% |
| Securities Lending Collateral2 | 6.7% |
| Cash Equivalents3 | 4.6% |
| Other Assets and Liabilities—Net4 | (6.8)% |
| TOTAL | 100.0% |
| 1 | Except for Securities Lending Collateral, Cash Equivalents and Other Assets and Liabilities, sector classifications are based upon, and individual portfolio securities are assigned to, the classifications of the Global Industry Classification System (GICS), except that the Adviser assigns a classification to securities not classified by the GICS and to securities for which the Adviser does not have access to the classification made by the GICS. |
| 2 | Cash collateral received from lending portfolio securities, which is invested in short-term investments such as repurchase agreements or money market mutual funds. |
| 3 | Cash Equivalents include any investments in money market mutual funds and/or overnight repurchase agreements other than those representing securities lending collateral. |
| 4 | Assets, other than investments in securities, less liabilities. See Statement of Assets and Liabilities.
|
Annual Shareholder Report
Portfolio of Investments
October 31, 2012
Shares or
Principal
Amount | | | Value |
| | COMMON STOCKS—94.4% | |
| | Consumer Discretionary—11.7% | |
| 1,000,000 | | Arezzo Industria e Comercio SA | $17,847,911 |
| 167,095 | 1 | CDON Group AB | 937,137 |
| 700,000 | | Cia Hering | 16,081,337 |
| 1,469,967 | 2 | D. R. Horton, Inc. | 30,810,508 |
| 1,000,000 | 1 | Del Frisco's Restaurant Group LLC | 14,800,000 |
| 589,000 | 1,3,4 | Inretail Peru Corp. | 11,397,150 |
| 325,000 | | Johnson Controls, Inc. | 8,368,750 |
| 5,000,000 | | L'Occitane International SA | 15,580,545 |
| 1,033,927 | | Las Vegas Sands Corp. | 48,015,570 |
| 1,049,163 | 1,2 | Melco PBL Entertainment (Macau) Ltd., ADR | 15,223,355 |
| 418,746 | 1 | Meritage Corp. | 15,485,227 |
| 1,100,000 | 1,2 | Michael Kors Holdings Ltd. | 60,159,000 |
| 28,448,212 | | NagaCorp Limited | 15,820,775 |
| 871,200 | | National CineMedia, Inc. | 13,468,752 |
| 14,345,000 | | Prada Holding SpA | 117,072,954 |
| 129,500 | | Ralph Lauren Corp. | 19,902,855 |
| 1,254,120 | | Restoque Comercio e Confeccoes de Roupas SA | 5,347,323 |
| 56,060,200 | | Samsonite International SA | 116,459,793 |
| 935,813 | 1,2 | Shutterfly, Inc. | 28,317,701 |
| 300,000 | | Starbucks Corp. | 13,770,000 |
| 98,200 | 1 | Ulta Salon Cosmetics & Fragrance, Inc. | 9,056,004 |
| 2,082,433 | 1,2 | Yoox SpA | 31,499,014 |
| | TOTAL | 625,421,661 |
| | Consumer Staples—1.3% | |
| 1,950,000 | | Almacenes Exito SA | 37,173,983 |
| 1,045,129 | 1 | Amira Nature Food Ltd. | 8,413,288 |
| 600,000 | | ConAgra Foods, Inc. | 16,704,000 |
| 500,000 | 1 | White Wave, Inc. | 8,235,000 |
| | TOTAL | 70,526,271 |
| | Energy—0.3% | |
| 1,012,400 | 1,2 | Gevo, Inc. | 2,045,048 |
| 388,040 | 1 | Linn Co. LLC | 15,090,875 |
| | TOTAL | 17,135,923 |
Annual Shareholder Report
Shares or
Principal
Amount | | | Value |
| | COMMON STOCKS—continued | |
| | Financials—20.0% | |
| 7,500,000 | 1 | American International Group, Inc. | $261,975,000 |
| 884,300 | | Banco BTG Pactual SA | 13,932,498 |
| 300,000 | | BlackRock, Inc. | 56,904,000 |
| 21,638,901 | 5 | CETIP SA-Mercados Organizado | 249,304,686 |
| 19,650,000 | 1 | Direct Line Insurance Group PLC | 61,676,282 |
| 2,655,120 | | EverBank Financial Corp. | 40,464,029 |
| 1 | 1,3,6 | FA Private Equity Fund IV LP | 792,184 |
| 4,239,483 | | Fibra Uno Administracion SA | 11,170,167 |
| 9,964,000 | | Housing Development Finance Corp. Ltd. | 140,425,813 |
| 1 | 1,3,6 | Infrastructure Fund | 0 |
| 2,000,000 | | J.P. Morgan Chase & Co. | 83,360,000 |
| 2,068,390 | | LPS Brasil Cons De Imoveis | 35,541,622 |
| 800,000 | | Multiplan Empreendimentos Imobiliarios SA | 23,436,153 |
| 1 | 3,6 | Peachtree Leadscope LLC, Class A and B | 0 |
| 1 | 1,3,6 | Peachtree Leadscope LLC, Class C | 1,500,000 |
| 437,420 | 1 | Spirit Realty Capital, Inc. | 7,147,443 |
| 2,385,000 | | Wells Fargo & Co. | 80,350,650 |
| | TOTAL | 1,067,980,527 |
| | Health Care—24.5% | |
| 3,296,513 | 1 | Alkermes, Inc. | 61,084,386 |
| 600,000 | | Allergan, Inc. | 53,952,000 |
| 900,000 | 1,2 | Amarin Corporation PLC, ADR | 10,602,000 |
| 1 | 3,6 | Apollo Investment Fund V | 3,060,493 |
| 446,500 | 1 | Biogen Idec, Inc. | 61,715,230 |
| 185,980 | 1 | Chindex International, Inc. | 1,928,613 |
| 1,725,460 | 1,2,3,5 | Conceptus, Inc. | 32,507,666 |
| 9,430,000 | 1,5 | Corcept Therapeutics, Inc. | 23,575,000 |
| 2,500,000 | 1,2 | Cubist Pharmaceuticals, Inc. | 107,250,000 |
| 1 | 3,6 | Denovo Ventures I LP | 507,529 |
| 7,500,000 | 1,2,5 | Dexcom, Inc. | 98,250,000 |
| 126,065 | 1,5 | Dexcom, Inc. | 1,651,452 |
| 17,962,000 | 1,5 | Dyax Corp. | 53,886,000 |
| 2,497,500 | 1,2 | Dynavax Technologies Corp. | 10,339,650 |
| 3,920,000 | 1,2,5 | ExamWorks Group, Inc. | 54,958,400 |
| 2,600,000 | 1 | Express Scripts Holding Co. | 160,004,000 |
| 1,310,000 | 1 | Gilead Sciences, Inc. | 87,979,600 |
| 100,000 | 1,2 | Heartware International, Inc. | 8,398,000 |
Annual Shareholder Report
Shares or
Principal
Amount | | | Value |
| | COMMON STOCKS—continued | |
| | Health Care—continued | |
| 250,000 | 1 | Hologic, Inc. | $5,155,000 |
| 2,383,454 | 1,2,5 | Insulet Corp. | 50,553,059 |
| 1 | 3,6 | Latin Healthcare Fund | 308,335 |
| 4,662,442 | 1,2 | Nektar Therapeutics | 41,961,978 |
| 1 | 3,6 | Peachtree Velquest | 337,700 |
| 5,246,193 | 1,5 | Progenics Pharmaceuticals, Inc. | 14,951,650 |
| 6,706,495 | 1,2,5 | Protalix Biotherapeutics, Inc. | 32,392,371 |
| 332,200 | 1 | Puma Biotechnology, Inc. | 6,843,320 |
| 182,400 | 1 | Regeneron Pharmaceuticals, Inc. | 25,955,520 |
| 2,700,000 | 1,5 | Repligen Corp. | 13,770,000 |
| 1,952,726 | 1 | Salix Pharmaceuticals Ltd. | 76,234,423 |
| 1,150,000 | 1,2 | Seattle Genetics, Inc. | 28,934,000 |
| 959,018 | 1,5,6 | Soteira, Inc. | 0 |
| 1,767,000 | 1,2 | Threshold Pharmaceuticals, Inc., Class THL | 7,262,370 |
| 3,000,000 | 1,2 | Vical, Inc. | 10,230,000 |
| 615,000 | 1,2 | Vivus, Inc. | 9,163,500 |
| 5,566,264 | 1 | Warner Chilcott PLC | 64,457,337 |
| 610,000 | 1 | Watson Pharmaceuticals, Inc. | 52,429,500 |
| 16,500,000 | 1,5 | Zogenix, Inc. | 40,260,000 |
| | TOTAL | 1,312,850,082 |
| | Industrials—13.3% | |
| 1,600,000 | 2 | Chicago Bridge & Iron Co., N.V. | 60,080,000 |
| 100,000 | | Cummins, Inc. | 9,358,000 |
| 991,300 | | Danaher Corp. | 51,279,949 |
| 1,700,000 | | Expeditors International Washington, Inc. | 62,237,000 |
| 322,100 | 1 | IHS, Inc., Class A | 27,182,019 |
| 658,400 | | Kansas City Southern Industries, Inc. | 52,974,864 |
| 131,900 | | Kuehne & Nagel International AG | 15,395,179 |
| 2,532,900 | 1,2 | MRC Global, Inc. | 61,929,405 |
| 498,500 | | MSC Industrial Direct Co. | 37,188,100 |
| 200,000 | 1 | Old Dominion Freight Lines, Inc. | 6,708,000 |
| 800,000 | 1 | Owens Corning, Inc. | 26,872,000 |
| 215,000 | | Precision Castparts Corp. | 37,210,050 |
| 1,200,000 | 1 | Quanta Services, Inc. | 31,116,000 |
| 2,421,000 | 1 | RPX Corp. | 25,493,130 |
| 586,100 | | Ryder System, Inc. | 26,444,832 |
| 1,345,000 | 1 | Spirit Airlines, Inc. | 23,604,750 |
Annual Shareholder Report
Shares or
Principal
Amount | | | Value |
| | COMMON STOCKS—continued | |
| | Industrials—continued | |
| 255,000 | 1 | Teledyne Technologies, Inc. | $16,327,650 |
| 1,700,000 | | Trinity Industries, Inc. | 53,176,000 |
| 1,500,000 | 1 | Verisk Analytics, Inc. | 76,500,000 |
| 161,000 | | Wabtec Corp. | 13,185,900 |
| | TOTAL | 714,262,828 |
| | Information Technology—17.8% | |
| 4,850,000 | | Amadeus IT Holding SA | 120,068,800 |
| 150,000 | | Apple, Inc. | 89,265,000 |
| 1,345,000 | | Avago Technologies Ltd. | 44,425,350 |
| 557,700 | 1 | Check Point Software Technologies Ltd. | 24,834,381 |
| 427,500 | 1 | Citrix Systems, Inc. | 26,423,775 |
| 2,800,000 | 1 | Comverse Technology, Inc. | 18,452,000 |
| 568,008 | 1 | CoStar Group, Inc. | 47,087,863 |
| 200,000 | 1,2 | Demandware, Inc. | 5,938,000 |
| 1,106,900 | 1 | eBay, Inc. | 53,452,201 |
| 367,397 | 1 | Eloqua, Inc. | 8,571,372 |
| 1,059,322 | 3,6 | Expand Networks Ltd. | 0 |
| 437,000 | 1,2 | IPG Photonics Corp. | 23,195,960 |
| 50,000 | 1 | LinkedIn Corp. | 5,346,500 |
| 208,000 | 1 | Mail.RU Group Ltd., GDR | 6,936,800 |
| 745,773 | 1,3,4 | Mail.RU Group Ltd., Series 144A, GDR | 24,871,530 |
| 165,293 | 2 | Mercadolibre, Inc. | 13,879,653 |
| 3,242,710 | 1 | Microsemi Corp. | 62,260,032 |
| 1,710,000 | 1 | Moneygram International, Inc. | 26,573,400 |
| 1,710,000 | 1 | NCR Corp. | 36,388,800 |
| 1,941,790 | 1 | NIC, Inc. | 27,767,597 |
| 2,375,000 | 1 | NXP Semiconductors NV | 57,617,500 |
| 1 | 3,6 | Peachtree Open Networks | 0 |
| 700,000 | | Qualcomm, Inc. | 41,002,500 |
| 794,110 | 1 | RADWARE Ltd. | 26,046,808 |
| 1,211,300 | 1 | Riverbed Technology, Inc. | 22,372,711 |
| 401,250 | 1,2 | STR Holdings, Inc. | 862,687 |
| 3,751 | 3,5,6 | Sensable Technologies, Inc. | 0 |
| 2,690,069 | 1,5 | TNS, Inc. | 38,521,788 |
| 1,025,000 | 1,2 | The Active Network, Inc. | 9,081,500 |
| 345,419 | 1 | Tyler Technologies, Inc. | 16,514,482 |
| 237,500 | 1 | VMware, Inc., Class A | 20,132,875 |
Annual Shareholder Report
Shares or
Principal
Amount | | | Value |
| | COMMON STOCKS—continued | |
| | Information Technology—continued | |
| 2,189,360 | 1 | Vantiv, Inc. | $44,181,285 |
| 4,000,000 | 1,2 | Zynga, Inc. | 9,000,000 |
| | TOTAL | 951,073,150 |
| | Materials—3.7% | |
| 1,046,107 | | Eagle Materials, Inc. | 55,412,288 |
| 600,000 | | LyondellBasell Industries NV | 32,034,000 |
| 591,800 | | Reliance Steel & Aluminum Co. | 32,158,412 |
| 842,400 | | Sociedad Quimica Y Minera de Chile, ADR | 48,732,840 |
| 400,000 | 2 | Westlake Chemical Corp. | 30,424,000 |
| | TOTAL | 198,761,540 |
| | Telecommunication Services—1.1% | |
| 2,364,755 | 1,2 | TW Telecom, Inc. | 60,230,310 |
| | Utilities—0.7% | |
| 475,000 | 2 | ITC Holdings Corp. | 37,819,500 |
| | TOTAL COMMON STOCKS
(IDENTIFIED COST $3,841,191,437) | 5,056,061,792 |
| | WARRANTS—0.4% | |
| | Health Care—0.4% | |
| 382,897 | 1 | Alexza Pharmaceuticals, Inc., 10/05/2016 | 187,734 |
| 797,358 | 1,5 | Corcept Therapeutics, Inc., 3/29/2015 | 431,131 |
| 857,143 | 1 | Cyclacel Pharmaceuticals, Inc., 4/28/2013 | 203,486 |
| 242,091 | 1 | Cyclacel Pharmaceuticals, Inc., 2/17/2014 | 80,858 |
| 2,750,000 | 1 | Dynavax Technologies Corp., 4/16/2015 | 9,795,775 |
| 1,042,038 | 1 | Favrille, Inc., 11/07/2012 | 0 |
| 1,713,798 | 1 | Threshold Pharmaceuticals, Inc., 10/05/2014 | 4,709,860 |
| 7,425,000 | 1,5,6 | Zogenix, Inc., 7/27/2017 | 3,897,383 |
| | TOTAL WARRANTS
(IDENTIFIED COST $842,911) | 19,306,227 |
| | Preferred Stocks—0.0% | |
| | Information Technology—0.0% | |
| 679,348 | 1,3,6 | Multiplex, Inc., Pfd., Series C (IDENTIFIED COST $4,998,976) | 0 |
| | Corporate Bonds—0.7% | |
| | Financials—0.1% | |
| $5,435,000 | 3,4 | TICC Capital Corp., Conv. Bond, Series 144A, 7.50%, 11/1/2017 | 5,509,677 |
| | Health Care—0.6% | |
| 14,630,000 | 5 | Insulet Corp., Conv. Bond, 3.75%, 6/15/2016 | 16,263,732 |
Annual Shareholder Report
Shares or
Principal
Amount | | | Value |
| | Corporate Bonds—continued | |
| | Health Care—continued | |
| $12,670,000 | 5 | Insulet Corp., Conv. Bond, 5.375%, 6/15/2013 | $15,505,166 |
| | TOTAL | 31,768,898 |
| | TOTAL CORPORATE BONDS
(IDENTIFIED COST $32,735,000) | 37,278,575 |
| | MUTUAL FUND—11.3% | |
| 606,024,453 | 5,7,8 | Federated Prime Value Obligations Fund, Institutional Shares, 0.16%
(AT NET ASSET VALUE) | 606,024,453 |
| | TOTAL INVESTMENTS—106.8%
(IDENTIFIED COST $4,485,792,777)9 | 5,718,671,047 |
| | OTHER ASSETS AND LIABILITIES - NET—(6.8)%10 | (364,119,130) |
| | TOTAL NET ASSETS—100% | $5,354,551,917 |
At October 31, 2012, the Fund had the following outstanding foreign exchange contracts:
| Settlement Date | Foreign
Currency
Units to
Receive | In
Exchange
For | Unrealized
Depreciation |
| Contracts Sold: |
| 11/5/2012 | 585,052 Brazilian Real | $287,636 | $(418) |
Unrealized Depreciation on Foreign Exchange Contracts is included in “Other Assets and Liabilities—Net.”
| 1 | Non-income producing security. |
| 2 | All or a portion of these securities are temporarily on loan to unaffiliated broker/dealers. |
| 3 | Denotes a restricted security that either: (a) cannot be offered for public sale without first being registered, or being able to take advantage of an exemption from registration, under the Securities Act of 1933; or (b) is subject to a contractual restriction on public sales. At October 31, 2012, these restricted securities amounted to $80,792,264, which represented 1.5% of total net assets. |
| 4 | Denotes a restricted security that may be resold without restriction to “qualified institutional buyers” as defined in Rule 144A under the Securities Act of 1933 and that the Fund has determined to be liquid under criteria established by the Fund's Board of Trustees (the “Trustees”). At October 31, 2012, these liquid restricted securities amounted to $41,778,357, which represented 0.8% of total net assets. |
| 5 | Affiliated companies and holdings. |
| 6 | Market quotations and price evaluations are not available. Fair value determined in accordance with procedures established by and under the general supervision of the Trustees. |
| 7 | 7-Day net yield. |
| 8 | All or a portion of this security is held as collateral for securities lending. |
| 9 | The cost of investments for federal tax purposes amounts to $4,524,980,534. |
| 10 | Assets, other than investments in securities, less liabilities. See Statement of Assets and Liabilities. |
Note: The categories of investments are shown as a percentage of total net assets at October 31, 2012.
Annual Shareholder Report
Various inputs are used in determining the value of the Fund's investments. These inputs are summarized in the three broad levels listed below:
Level 1—quoted prices in active markets for identical securities, including investment companies with daily net asset values, if applicable.
Level 2—other significant observable inputs (including quoted prices for similar securities, interest rates, prepayment speeds, credit risk, etc.). Also includes securities valued at amortized cost.
Level 3—significant unobservable inputs (including the Fund's own assumptions in determining the fair value of investments).
The inputs or methodology used for valuing securities are not an indication of the risk associated with investing in those securities.
The following is a summary of the inputs used, as of October 31, 2012, in valuing the Fund's assets carried at fair value:
| Valuation Inputs |
| Level 1—
Quoted
Prices and
Investments in
Mutual Funds | Level 2—
Other
Significant
Observable
Inputs | Level 3—
Significant
Unobservable
Inputs | Total |
| Equity Securities: | | | | |
| Common Stocks | | | | |
| Domestic | $3,447,867,854 | $— | $6,506,241 | $3,454,374,095 |
| International | 1,565,419,0171 | 36,268,680 | — | 1,601,687,697 |
| Preferred Stocks | | | | |
| Domestic | — | — | 0 | 0 |
| Debt Securities: | | | | |
| Corporate Bonds | — | 37,278,575 | — | 37,278,575 |
| Warrants | — | 15,408,844 | 3,897,383 | 19,306,227 |
| Mutual Fund | 606,024,453 | — | — | 606,024,453 |
| TOTAL SECURITIES | $5,619,311,324 | $88,956,099 | $10,403,624 | $5,718,671,047 |
OTHER FINANCIAL
INSTRUMENTS2 | $(418) | $— | $— | $(418) |
| 1 | Includes $498,908,068 of securities transferred from Level 2 to Level 1 because quoted prices on equity securities for which fair value factors were previously applied to account for significant post market close activity. Transfers shown represent the value of the securities at the beginning of the period. |
| 2 | Other financial instruments include foreign exchange contracts. |
The following acronyms are used throughout this portfolio:
| ADR | —American Depositary Receipt |
| GDR | —Global Depository Receipt |
See Notes which are an integral part of the Financial Statements
Annual Shareholder Report
Financial Highlights–Class A Shares
(For a Share Outstanding Throughout Each Period)
| Year Ended October 31 | 2012 | 2011 | 2010 | 2009 | 2008 |
| Net Asset Value, Beginning of Period | $4.92 | $5.27 | $4.22 | $3.80 | $7.03 |
| Income From Investment Operations: | | | | | |
| Net investment income (loss) | (0.05)1 | (0.05)1 | 0.021 | (0.00)1,2 | (0.03)1 |
| Net realized and unrealized gain (loss) on investments, written options, futures contracts, short sales and foreign currency transactions | 0.50 | (0.27) | 1.04 | 0.42 | (2.57) |
| TOTAL FROM INVESTMENT OPERATIONS | 0.45 | (0.32) | 1.06 | 0.42 | (2.60) |
| Less Distributions: | | | | | |
| Distributions from net investment income | — | (0.03) | (0.01) | — | — |
| Distributions from net realized gain on investments and foreign currency transactions | (0.09) | (0.00)2 | — | — | (0.63) |
| TOTAL DISTRIBUTIONS | (0.09) | (0.03) | (0.01) | — | (0.63) |
| Net Asset Value, End of Period | $5.28 | $4.92 | $5.27 | $4.22 | $3.80 |
| Total Return3 | 9.45% | (6.07)% | 25.11% | 11.05% | (40.38)% |
| Ratios to Average Net Assets: | | | | | |
| Net expenses | 1.95%4 | 1.95%4 | 1.95%4 | 1.95%4 | 1.95%4 |
| Net expenses excluding dividends and other expenses related to short sales | 1.95%4 | 1.95%4 | 1.95%4 | 1.95%4 | 1.95%4 |
| Net investment income (loss) | (0.97)% | (0.99)% | 0.39% | (0.12)% | (0.56)% |
| Expense waiver/reimbursement5 | 0.28% | 0.29% | 0.28% | 0.27% | 0.23% |
| Supplemental Data: | | | | | |
| Net assets, end of period (000 omitted) | $1,898,465 | $1,999,940 | $2,469,094 | $2,153,443 | $2,158,140 |
| Portfolio turnover | 61% | 64% | 54% | 91% | 78% |
| 1 | Per share numbers have been calculated using the average shares method. |
| 2 | Represents less than $0.01. |
| 3 | Based on net asset value, which does not reflect the sales charge, redemption fee or contingent deferred sales charge, if applicable. |
| 4 | The net expense ratio is calculated without reduction for fees paid indirectly for expense offset arrangements. The net expense ratios are 1.95%, 1.95%, 1.95%, 1.95% and 1.95% after taking into account these expense reductions for the years ended October 31, 2012, 2011, 2010, 2009 and 2008, respectively. The net expense ratios excluding dividends and other expenses related to short sales are also calculated without reduction for these fees paid indirectly for expense offset arrangements. |
| 5 | This expense decrease is reflected in both the net expense and the net investment income (loss) ratios shown above. |
See Notes which are an integral part of the Financial Statements
Annual Shareholder Report
Financial Highlights–Class B Shares
(For a Share Outstanding Throughout Each Period)
| Year Ended October 31 | 2012 | 2011 | 2010 | 2009 | 2008 |
| Net Asset Value, Beginning of Period | $4.64 | $4.96 | $4.00 | $3.62 | $6.75 |
| Income From Investment Operations: | | | | | |
| Net investment income (loss) | (0.07)1 | (0.08)1 | (0.01)1 | (0.02)1 | (0.06)1 |
| Net realized and unrealized gain (loss) on investments, written options, futures contracts, short sales and foreign currency transactions | 0.46 | (0.24) | 0.97 | 0.40 | (2.44) |
| TOTAL FROM INVESTMENT OPERATIONS | 0.39 | (0.32) | 0.96 | 0.38 | (2.50) |
| Less Distributions: | | | | | |
| Distributions from net investment income | — | (0.00)2 | — | — | — |
| Distributions from net realized gain on investments and foreign currency transactions | (0.09) | (0.00)2 | — | — | (0.63) |
| TOTAL DISTRIBUTIONS | (0.09) | (0.00)2 | — | — | (0.63) |
| Net Asset Value, End of Period | $4.94 | $4.64 | $4.96 | $4.00 | $3.62 |
| Total Return3 | 8.72% | (6.40)% | 24.00% | 10.50% | (40.60)% |
| Ratios to Average Net Assets: | | | | | |
| Net expenses | 2.50%4 | 2.50%4 | 2.50%4 | 2.50%4 | 2.50%4 |
| Net expenses excluding dividends and other expenses related to short sales | 2.50%4 | 2.50%4 | 2.50%4 | 2.50%4 | 2.50%4 |
| Net investment income (loss) | (1.52)% | (1.53)% | (0.27)% | (0.67)% | (1.11)% |
| Expense waiver/reimbursement5 | 0.23% | 0.24% | 0.23% | 0.22% | 0.19% |
| Supplemental Data: | | | | | |
| Net assets, end of period (000 omitted) | $184,726 | $301,469 | $473,934 | $562,618 | $651,474 |
| Portfolio turnover | 61% | 64% | 54% | 91% | 78% |
| 1 | Per share numbers have been calculated using the average shares method. |
| 2 | Represents less than $0.01. |
| 3 | Based on net asset value, which does not reflect the sales charge, redemption fee or contingent deferred sales charge, if applicable. |
| 4 | The net expense ratio is calculated without reduction for fees paid indirectly for expense offset arrangements. The net expense ratios are 2.50%, 2.50%, 2.50%, 2.50% and 2.50% after taking into account these expense reductions for the years ended October 31, 2012, 2011, 2010, 2009 and 2008, respectively. The net expense ratios excluding dividends and other expenses related to short sales are also calculated without reduction for these fees paid indirectly for expense offset arrangements. |
| 5 | This expense decrease is reflected in both the net expense and the net investment income (loss) ratios shown above. |
See Notes which are an integral part of the Financial Statements
Annual Shareholder Report
Financial Highlights–Class C Shares
(For a Share Outstanding Throughout Each Period)
| Year Ended October 31 | 2012 | 2011 | 2010 | 2009 | 2008 |
| Net Asset Value, Beginning of Period | $4.64 | $4.97 | $4.00 | $3.62 | $6.75 |
| Income From Investment Operations: | | | | | |
| Net investment income (loss) | (0.07)1 | (0.08)1 | (0.01)1 | (0.02)1 | (0.06)1 |
| Net realized and unrealized gain (loss) on investments, written options, futures contracts, short sales and foreign currency transactions | 0.46 | (0.24) | 0.98 | 0.40 | (2.44) |
| TOTAL FROM INVESTMENT OPERATIONS | 0.39 | (0.32) | 0.97 | 0.38 | (2.50) |
| Less Distributions: | | | | | |
| Distributions from net investment income | — | (0.01) | — | — | — |
| Distributions from net realized gain on investments and foreign currency transactions | (0.09) | (0.00)2 | — | — | (0.63) |
| TOTAL DISTRIBUTIONS | (0.09) | (0.01) | — | — | (0.63) |
| Net Asset Value, End of Period | $4.94 | $4.64 | $4.97 | $4.00 | $3.62 |
| Total Return3 | 8.72% | (6.53)% | 24.25% | 10.50% | (40.60)% |
| Ratios to Average Net Assets: | | | | | |
| Net expenses | 2.50%4 | 2.50%4 | 2.50%4 | 2.50%4 | 2.50%4 |
| Net expenses excluding dividends and other expenses related to short sales | 2.50%4 | 2.50%4 | 2.50%4 | 2.50%4 | 2.50%4 |
| Net investment income (loss) | (1.52)% | (1.53)% | (0.19)% | (0.67)% | (1.11)% |
| Expense waiver/reimbursement5 | 0.23% | 0.24% | 0.23% | 0.22% | 0.19% |
| Supplemental Data: | | | | | |
| Net assets, end of period (000 omitted) | $392,886 | $494,457 | $680,501 | $656,086 | $707,980 |
| Portfolio turnover | 61% | 64% | 54% | 91% | 78% |
| 1 | Per share numbers have been calculated using the average shares method. |
| 2 | Represents less than $0.01. |
| 3 | Based on net asset value, which does not reflect the sales charge, redemption fee or contingent deferred sales charge, if applicable. |
| 4 | The net expense ratio is calculated without reduction for fees paid indirectly for expense offset arrangements. The net expense ratios are 2.50%, 2.50%, 2.50%, 2.50% and 2.50% after taking into account these expense reductions for the years ended October 31, 2012, 2011, 2010, 2009 and 2008, respectively. The net expense ratios excluding dividends and other expenses related to short sales are also calculated without reduction for these fees paid indirectly for expense offset arrangements. |
| 5 | This expense decrease is reflected in both the net expense and the net investment income (loss) ratios shown above. |
See Notes which are an integral part of the Financial Statements
Annual Shareholder Report
Statement of Assets and Liabilities
October 31, 2012
| Assets: | | |
| Total investment in securities, at value including $341,527,111 of securities loaned, $606,024,453 of investment in an affiliated holding and $740,679,484 of investment in affiliated companies (Note 5) (identified cost $4,485,792,777) | | $5,718,671,047 |
| Cash | | 1,239,085 |
| Cash denominated in foreign currencies (identified cost $239,741) | | 238,252 |
| Income receivable | | 1,338,736 |
| Receivable for investments sold | | 5,092,808 |
| Receivable for shares sold | | 5,298,455 |
| TOTAL ASSETS | | 5,731,878,383 |
| Liabilities: | | |
| Payable for investments purchased | $1,975,329 | |
| Payable for shares redeemed | 9,601,973 | |
| Unrealized depreciation on foreign exchange contracts | 418 | |
| Payable for collateral due to broker for securities lending | 357,289,183 | |
| Payable for capital gains taxes withheld | 2,377,370 | |
| Payable to adviser (Note 5) | 2,813 | |
| Payable for transfer and dividend disbursing agent fees and expenses | 1,577,489 | |
| Payable for distribution services fee (Note 5) | 1,027,715 | |
| Payable for shareholder services fee (Note 5) | 2,993,037 | |
| Accrued expenses | 481,139 | |
| TOTAL LIABILITIES | | 377,326,466 |
| Net assets for 1,021,453,073 shares outstanding | | $5,354,551,917 |
| Net Assets Consist of: | | |
| Paid-in capital | | $3,794,677,859 |
| Net unrealized appreciation of investments and translation of assets and liabilities in foreign currency | | 1,231,853,600 |
| Accumulated net realized gain on investments, futures contracts and foreign currency transactions | | 380,357,765 |
| Accumulated net investment income (loss) | | (52,337,307) |
| TOTAL NET ASSETS | | $5,354,551,917 |
Annual Shareholder Report
Statement of Assets and Liabilities–continued
| Net Asset Value, Offering Price and Redemption Proceeds Per Share | | |
| Class A Shares: | | |
| Net asset value per share ($1,898,464,628 ÷ 359,643,018 shares outstanding), no par value, unlimited shares authorized | | $5.28 |
| Offering price per share (100/94.50 of $5.28) | | $5.59 |
| Redemption proceeds per share | | $5.28 |
| Class B Shares: | | |
| Net asset value per share ($184,725,569 ÷ 37,370,779 shares outstanding), no par value, unlimited shares authorized | | $4.94 |
| Offering price per share | | $4.94 |
| Redemption proceeds per share (94.50/100 of $4.94) | | $4.67 |
| Class C Shares: | | |
| Net asset value per share ($392,885,512 ÷ 79,516,914 shares outstanding), no par value, unlimited shares authorized | | $4.94 |
| Offering price per share | | $4.94 |
| Redemption proceeds per share (99.00/100 of $4.94) | | $4.89 |
| Class R Shares: | | |
| Net asset value per share ($2,878,476,208 ÷ 544,922,362 shares outstanding), no par value, unlimited shares authorized | | $5.28 |
| Offering price per share | | $5.28 |
| Redemption proceeds per share (99.80/100 of $5.28) | | $5.27 |
See Notes which are an integral part of the Financial Statements
Annual Shareholder Report
Statement of Operations
Year Ended October 31, 2012
| Investment Income: | | | |
| Dividends (including $425,415 received from an affiliated holding and $3,722,843 received from affiliated companies (Note 5) and net of foreign taxes withheld of $1,359,123) | | | $49,867,028 |
| Interest (including income on securities loaned of $3,735,036) | | | 5,001,950 |
| TOTAL INCOME | | | 54,868,978 |
| Expenses: | | | |
| Investment adviser fee (Note 5) | | $79,799,496 | |
| Administrative fee (Note 5) | | 4,368,815 | |
| Custodian fees | | 2,646,662 | |
| Transfer and dividend disbursing agent fees and expenses (Note 2) | | 8,776,850 | |
| Directors'/Trustees' fees | | 32,594 | |
| Auditing fees | | 38,050 | |
| Legal fees | | 6,445 | |
| Portfolio accounting fees | | 208,604 | |
| Distribution services fee (Note 5) | | 24,853,578 | |
| Shareholder services fee (Note 5) | | 13,935,603 | |
| Account administration fee (Note 2) | | 26,755 | |
| Share registration costs | | 88,709 | |
| Printing and postage | | 422,668 | |
| Insurance premiums | | 10,025 | |
| Miscellaneous | | 39,717 | |
| Interest expense | | 1,115 | |
| TOTAL EXPENSES | | 135,255,686 | |
Annual Shareholder Report
Statement of Operations–continued
| Waiver, Reimbursements and Reduction: | | | |
| Waiver/reimbursement of investment adviser fee (Note 5) | $(8,399,947) | | |
| Waiver of administrative fee (Note 5) | (88,804) | | |
| Waiver of distribution services fee (Note 5) | (13,386,552) | | |
| Reimbursement of shareholder services fee (Note 5) | (178,397) | | |
| Fees paid indirectly from directed brokerage arrangements (Note 6) | (67,170) | | |
| TOTAL WAIVERS, REIMBURSEMENTS AND REDUCTION | | $(22,120,870) | |
| Net expenses | | | $113,134,816 |
| Net investment income (loss) | | | (58,265,838) |
| Realized and Unrealized Gain on Investments and Foreign Currency Transactions: | | | |
| Net realized gain on investments and foreign currency transactions (including realized gain of $91,370,979 in sales of investments in affiliated companies (Note 5)) | | | 420,311,646 |
| Net change in unrealized appreciation of investments and translation of assets and liabilities in foreign currency (including foreign taxes withheld of $1,125,704) | | | 140,388,725 |
| Net realized and unrealized gain on investments and foreign currency transactions | | | 560,700,371 |
| Change in net assets resulting from operations | | | $502,434,533 |
See Notes which are an integral part of the Financial Statements
Annual Shareholder Report
Statement of Changes in Net Assets
| Year Ended October 31 | 2012 | 2011 |
| Increase (Decrease) in Net Assets | | |
| Operations: | | |
| Net investment income (loss) | $(58,265,838) | $(73,289,475) |
| Net realized gain on investments and foreign currency transactions | 420,311,646 | 845,883,977 |
| Net change in unrealized appreciation/depreciation of investments and translation of assets and liabilities in foreign currency | 140,388,725 | (1,116,013,448) |
| CHANGE IN NET ASSETS RESULTING FROM OPERATIONS | 502,434,533 | (343,418,946) |
| Distributions to Shareholders: | | |
| Distributions from net investment income | | |
| Class A Shares | — | (15,556,814) |
| Class B Shares | — | (253,171) |
| Class C Shares | — | (803,794) |
| Class R Shares | — | (22,840,571) |
| Distributions from net realized gain on investments | | |
| Class A Shares | (37,360,604) | (19,173) |
| Class B Shares | (5,896,217) | (312) |
| Class C Shares | (9,766,246) | (991) |
| Class R Shares | (56,939,036) | (28,151) |
| CHANGE IN NET ASSETS RESULTING FROM DISTRIBUTIONS TO SHAREHOLDERS | (109,962,103) | (39,502,977) |
| Share Transactions: | | |
| Proceeds from sale of shares | 695,512,067 | 763,905,692 |
| Net asset value of shares issued to shareholders in payment of distributions declared | 103,024,246 | 36,595,371 |
| Cost of shares redeemed | (1,633,547,746) | (1,865,805,782) |
| CHANGE IN NET ASSETS RESULTING FROM SHARE TRANSACTIONS | (835,011,433) | (1,065,304,719) |
| Change in net assets | (442,539,003) | (1,448,226,642) |
| Net Assets: | | |
| Beginning of period | 5,797,090,920 | 7,245,317,562 |
| End of period (including accumulated net investment income (loss)/undistributed net investment income of $(52,337,307) and $0, respectively) | $5,354,551,917 | $5,797,090,920 |
See Notes which are an integral part of the Financial Statements
Annual Shareholder Report
Notes to Financial Statements
October 31, 2012
1. ORGANIZATION
Federated Equity Funds (the “Trust”) is registered under the Investment Company Act of 1940, as amended (the “Act”), as an open-end management investment company. The Trust consists of 13 diversified portfolios. The financial statements included herein are only those of Federated Kaufmann Fund (the “Fund”), a diversified portfolio. The financial statements of the other portfolios are presented separately. The assets of each portfolio are segregated and a shareholder's interest is limited to the portfolio in which shares are held. Each portfolio pays its own expenses. The Fund offers four classes of shares: Class A Shares, Class B Shares, Class C Shares and Class R Shares. All shares of the Fund have equal rights with respect to voting, except on class-specific matters. The financial highlights of the Class R Shares are presented separately. The investment objective of the Fund is to provide capital appreciation.
2. SIGNIFICANT ACCOUNTING POLICIES
The following is a summary of significant accounting policies consistently followed by the Fund in the preparation of its financial statements. These policies are in conformity with U.S. generally accepted accounting principles (GAAP).
Investment Valuation
In calculating its net asset value (NAV), the Fund generally values investments as follows:
| ■ | Equity securities listed on an exchange or traded through a regulated market system are valued at their last reported sale price or official closing price in their principal exchange or market. |
| ■ | Shares of other mutual funds are valued based upon their reported NAVs. |
| ■ | Fixed-income securities acquired with remaining maturities greater than 60 days are fair valued using price evaluations provided by a pricing service approved by the Trustees. |
| ■ | Fixed-income securities acquired with remaining maturities of 60 days or less are valued at their cost (adjusted for the accretion of any discount or amortization of any premium), which approximates market value. |
| ■ | Derivative contracts listed on exchanges are valued at their reported settlement or closing price. |
| ■ | Over-the-counter (OTC) derivative contracts are fair valued using price evaluations provided by a pricing service approved by the Trustees. |
| ■ | For securities that are fair valued in accordance with procedures established by and under the general supervision of the Trustees, certain factors may be considered such as: the purchase price of the security, information obtained by contacting the issuer, analysis of the issuer's financial statements or other available documents, fundamental analytical data, the nature and duration of restrictions on disposition, the movement of the market in which the security is normally traded and public trading in similar securities of the issuer or comparable issuers. |
If the Fund cannot obtain a price or price evaluation from a pricing service for an investment, the Fund may attempt to value the investment based upon the mean of bid and asked quotations or fair value the investment based on price evaluations, from one or more dealers. If any price, quotation, price evaluation or other pricing source is not readily available when the NAV is calculated, the Fund uses the fair value of the investment determined in accordance with the procedures described below. There can be no assurance that the Fund could purchase or sell an investment at the price used to calculate the Fund's NAV.
Annual Shareholder Report
Fair Valuation and Significant Events Procedures
The Trustees have appointed a Valuation Committee comprised of officers of the Fund, Federated Equity Management Company of Pennsylvania (“Adviser”) and the Adviser's affiliated companies to determine fair value of securities and in overseeing the calculation of the NAV. The Trustees have also authorized the use of pricing services recommended by the Valuation Committee to provide fair value evaluations of the current value of certain investments for purposes of calculating the NAV. The Valuation Committee employs various methods for reviewing third-party pricing service evaluations including periodic reviews of third-party pricing services' policies, procedures and valuation methods (including key inputs and assumptions), transactional back-testing, comparisons of evaluations of different pricing services, and review of price challenges by the Adviser based on recent market activity. In the event that market quotations and price evaluations are not available for an investment, the Valuation Committee determines the fair value of the investment in accordance with procedures adopted by the Trustees. The Trustees periodically review and approve the fair valuations made by the Valuation Committee and any changes made to the procedures.
Factors considered by pricing services in evaluating an investment include the yields or prices of investments of comparable quality, coupon, maturity, call rights and other potential prepayments, terms and type, reported transactions, indications as to values from dealers and general market conditions. Some pricing services provide a single price evaluation reflecting the bid-side of the market for an investment (a “bid” evaluation). Other pricing services offer both bid evaluations and price evaluations indicative of a price between the prices bid and asked for the investment (a “mid” evaluation). The Fund normally uses bid evaluations for U.S. Treasury and Agency securities. The Fund normally uses mid evaluations for other types of fixed-income securities and OTC derivative contracts. In the event that market quotations and price evaluations are not available for an investment, the fair value of the investment is determined in accordance with procedures adopted by the Trustees.
The Trustees also have adopted procedures requiring an investment to be priced at its fair value whenever the Adviser determines that a significant event affecting the value of the investment has occurred between the time as of which the price of the investment would otherwise be determined and the time as of which the NAV is computed. An event is considered significant if there is both an affirmative expectation that the investment's value will change in response to the event and a reasonable basis for quantifying the resulting change in value. Examples of significant events that may occur after the close of the principal market on which a security is traded, or after the time of a price evaluation provided by a pricing service or a dealer, include:
| ■ | With respect to securities traded in foreign markets, significant trends in U.S. equity markets or in the trading of foreign securities index futures contracts; |
| ■ | Political or other developments affecting the economy or markets in which an issuer conducts its operations or its securities are traded; and |
| ■ | Announcements concerning matters such as acquisitions, recapitalizations, litigation developments, a natural disaster affecting the issuer's operations or regulatory changes or market developments affecting the issuer's industry. |
Annual Shareholder Report
The Trustees have approved the use of a pricing service to determine the fair value of equity securities traded principally in foreign markets when the Adviser determines that there has been a significant trend in the U.S. equity markets or in index futures trading. For other significant events, the Fund may seek to obtain more current quotations or price evaluations from alternative pricing sources. If a reliable alternative pricing source is not available, the Fund will determine the fair value of the investment using another method approved by the Trustees.
Repurchase Agreements
The Fund may invest in repurchase agreements for short-term liquidity purposes. It is the policy of the Fund to require the other party to a repurchase agreement to transfer to the Fund's custodian or sub-custodian eligible securities or cash with a market value (after transaction costs) at least equal to the repurchase price to be paid under the repurchase agreement. The eligible securities are transferred to accounts with the custodian or sub-custodian in which the Fund holds a “securities entitlement” and exercises “control” as those terms are defined in the Uniform Commercial Code. The Fund has established procedures for monitoring the market value of the transferred securities and requiring the transfer of additional eligible securities if necessary to equal at least the repurchase price. These procedures also allow the other party to require securities to be transferred from the account to the extent that their market value exceeds the repurchase price or in exchange for other eligible securities of equivalent market value.
The insolvency of the other party or other failure to repurchase the securities may delay the disposition of the underlying securities or cause the Fund to receive less than the full repurchase price. Under the terms of the repurchase agreement, any amounts received by the Fund in excess of the repurchase price and related transaction costs must be remitted to the other party.
The Fund may enter into repurchase agreements in which eligible securities are transferred into joint trading accounts maintained by the custodian or sub-custodian for investment companies and other clients advised by the Fund's Adviser and its affiliates. The Fund will participate on a pro rata basis with the other investment companies and clients in its share of the securities transferred under such repurchase agreements and in its share of proceeds from any repurchase or other disposition of such securities.
Annual Shareholder Report
Investment Income, Gains and Losses, Expenses and Distributions
Investment transactions are accounted for on a trade-date basis. Realized gains and losses from investment transactions are recorded on an identified-cost basis. Interest income and expenses are accrued daily. Dividend income and distributions to shareholders are recorded on the ex-dividend date. Foreign dividends are recorded on the ex-dividend date or when the Fund is informed of the ex-dividend date. Distributions of net investment income, if any, are declared and paid annually. Non-cash dividends included in dividend income, if any, are recorded at fair value. Investment income, realized and unrealized gains and losses, and certain fund-level expenses are allocated to each class based on relative average daily net assets, except that Class A Shares, Class B Shares, Class C Shares and Class R Shares may bear distribution services fees, shareholder services fees, account administration fees and certain transfer and dividend disbursing agent fees unique to those classes. For the year ended October 31, 2012, transfer and dividend disbursing agent fees and account administration fees for the Fund were as follows:
| Transfer and
Dividend
Disbursing
Agent Fees
Incurred | Account
Administration
Fees Incurred |
| Class A Shares | $3,165,502 | $24,410 |
| Class B Shares | 396,052 | — |
| Class C Shares | 722,106 | 2,345 |
| Class R Shares | 4,493,190 | — |
| TOTAL | $8,776,850 | $26,755 |
Dividends are declared separately for each class. No class has preferential dividend rights; differences in per share dividend rates are generally due to differences in separate class expenses.
Premium and Discount Amortization
All premiums and discounts on fixed-income securities are amortized/accreted using the effective interest rate method.
Federal Taxes
It is the Fund's policy to comply with the Subchapter M provision of the Internal Revenue Code and to distribute to shareholders each year substantially all of its income. Accordingly, no provision for federal income tax is necessary. As of and during the year ended October 31, 2012, the Fund did not have a liability for any uncertain tax positions. The Fund recognizes interest and penalties, if any, related to tax liabilities as income tax expense in the Statement of Operations. As of October 31, 2012, tax years 2009 through 2012 remain subject to examination by the Fund's major tax jurisdictions, which include the United States of America and the Commonwealth of Massachusetts.
The Fund may be subject to taxes imposed by governments of countries in which it invests. Such taxes are generally based on either income or gains earned or repatriated. The Fund accrues and applies such taxes to net investment income, net realized gains and net unrealized gains as income and/or gains are earned.
Annual Shareholder Report
When-Issued and Delayed Delivery Transactions
The Fund may engage in when-issued or delayed delivery transactions. The Fund records when-issued securities on the trade date and maintains security positions such that sufficient liquid assets will be available to make payment for the securities purchased. Securities purchased on a when-issued or delayed delivery basis are marked to market daily and begin earning interest on the settlement date. Losses may occur on these transactions due to changes in market conditions or the failure of counterparties to perform under the contract.
Foreign Exchange Contracts
The Fund enters into foreign exchange contracts for the delayed delivery of securities or foreign currency exchange transactions. The Fund enters into foreign exchange contracts to protect assets against adverse changes in foreign currency exchange rates or exchange control regulations. Purchased contracts are used to acquire exposure to foreign currencies, whereas, contracts to sell are used to hedge the Fund's securities against currency fluctuations. Risks may arise upon entering into these transactions from the potential inability of counterparties to meet the terms of their commitments and from unanticipated movements in security prices or foreign exchange rates. The foreign exchange contracts are adjusted by the daily exchange rate of the underlying currency and any gains or losses are recorded for financial statement purposes as unrealized until the settlement date.
Foreign exchange contracts outstanding at period end are listed after the Fund's Portfolio of Investments.
The average value at settlement date payable and receivable of foreign exchange contracts purchased and sold by the Fund throughout the period was $11,247 and $8,689, respectively. This is based on the contracts held as of each month-end throughout the fiscal period.
Foreign Currency Translation
The accounting records of the Fund are maintained in U.S. dollars. All assets and liabilities denominated in foreign currencies (FCs) are translated into U.S. dollars based on the rates of exchange of such currencies against U.S. dollars on the date of valuation. Purchases and sales of securities, income and expenses are translated at the rate of exchange quoted on the respective date that such transactions are recorded. The Fund does not isolate that portion of the results of operations resulting from changes in foreign exchange rates on investments from the fluctuations arising from changes in market prices of securities held. Such fluctuations are included with the net realized and unrealized gain or loss from investments.
Reported net realized foreign exchange gains or losses arise from sales of portfolio securities, sales and maturities of short-term securities, sales of FCs, currency gains or losses realized between the trade and settlement dates on securities transactions, the difference between the amounts of dividends, interest and foreign withholding taxes recorded on the Fund's books, and the U.S. dollar equivalent of the amounts actually received or paid. Net unrealized foreign exchange gains and losses arise from changes in the value of assets and liabilities other than investments in securities at fiscal year end, resulting from changes in the exchange rate.
Annual Shareholder Report
Securities Lending
The Fund participates in a securities lending program providing for the lending of equity securities to qualified brokers. The Fund normally receives cash collateral for securities loaned that is invested in an affiliated money market fund or in short-term securities including repurchase agreements. Collateral is maintained at a minimum level of 100% of the market value of investments loaned, plus interest, if applicable. Earnings on collateral are allocated between the borrower of the security, the securities lending agent, as a fee for its services under the program and the Fund, according to agreed-upon rates.
As of October 31, 2012, securities subject to this type of arrangement and related collateral were as follows:
Market Value of
Securities Loaned | Market Value
of Collateral |
| $341,527,111 | $357,289,183 |
Short Sales
In a short sale, the Fund sells a security it does not own in anticipation of a decline in the fair market value of the security. When the Fund sells a security short, it must borrow the security in order to deliver it at the completion of the sale. A gain, limited to the price at which the Fund sold the security short, or a loss, unlimited in size, will be recognized upon the termination of the short sale.
The Fund has an obligation to replace the borrowed security (e.g., to purchase the security at a future date and deliver it to the lender of the security). While the security is borrowed, the proceeds from the sale are deposited with the lender (“Prime Broker”). The Fund may incur two types of expenses from short sales: borrowing expenses and dividend expenses. Borrowing expenses may occur because the Fund may be obligated to pay fees to the Prime Broker on borrowed securities. This fee is normally based upon the market value of the borrowed security and is dependent upon the availability of the security. Dividend expenses may occur because the Fund has to pay the Prime Broker the equivalent of any dividends earned on the borrowed security.
At October 31, 2012, the Fund had no outstanding Short Sales.
Restricted Securities
The Fund may purchase securities which are considered restricted. Restricted securities are securities that either: (a) cannot be offered for public sale without first being registered, or being able to take advantage of an exemption from registration, under the Securities Act of 1933; or (b) are subject to contractual restrictions on public sales. In some cases, when a security cannot be offered for public sale without first being registered, the issuer of the restricted security has agreed to register such securities for resale, at the issuer's expense, either upon demand by the Fund or in connection with another registered offering of the securities. Many such restricted securities may be resold in the secondary market in transactions exempt from registration. Restricted securities may be determined to be liquid under criteria established by the Trustees. The Fund will not incur any registration costs upon such resales. The Fund's restricted securities are valued at the price provided by dealers in the secondary market or, if no market prices are available, at the fair value as determined in accordance with procedures established by and under the general supervision of the Trustees.
Annual Shareholder Report
Additional information on restricted securities, excluding securities purchased under Rule 144A that have been deemed liquid by the Trustees, if applicable, held at October 31, 2012, is as follows:
| Security | Acquisition Date | Cost | Market Value |
| Apollo Investment Fund V | 5/18/2001 | $0 | $3,060,493 |
| Conceptus, Inc. | 4/10/2001 - 8/11/2005 | $14,616,806 | $32,507,666 |
| Denovo Ventures I LP | 3/9/2000 | $2,888,396 | $507,529 |
| Expand Networks Ltd. | 9/22/2000 | $2,500,000 | $0 |
| FA Private Equity Fund IV LP | 3/4/2002 | $380,354 | $792,184 |
| Infrastructure Fund | 8/11/2000 | $404,496 | $0 |
| Latin Healthcare Fund | 11/28/2000 | $0 | $308,335 |
| Multiplex, Inc., Pfd., Series C | 2/22/2001 | $5,000,001 | $0 |
| Peachtree Leadscope LLC, Class A and B | 6/30/2000 | $712,054 | $0 |
| Peachtree Leadscope LLC, Class C | 4/30/2002 | $3,000,000 | $1,500,000 |
| Peachtree Open Networks | 10/5/2000 | $892,599 | $0 |
| Peachtree Velquest | 9/14/2000 | $494,382 | $337,700 |
| Sensable Technologies, Inc. | 10/15/2004 | $0 | $0 |
Additional Disclosure Related to Derivative Instruments
| Fair Value of Derivative Instruments |
| | Liability |
| | | Statement of
Assets and
Liabilities
Location | Fair
Value |
| Derivatives not accounted for as hedging instruments under ASC Topic 815 | | | | |
| Foreign exchange contracts | | | Unrealized depreciation on
foreign exchange contracts | $418 |
The Effect of Derivative Instruments on the Statement of Operations for the Year Ended October 31, 2012
| Amount of Realized Gain or (Loss) on Derivatives Recognized in Income |
| Forward
Currency
Contracts |
| Foreign exchange contracts | $(378,156) |
Annual Shareholder Report
| Change in Unrealized Appreciation or (Depreciation) on Derivatives Recognized in Income |
| Forward
Currency
Contracts |
| Foreign exchange contracts | $4,408 |
Other
The preparation of financial statements in conformity with GAAP requires management to make estimates and assumptions that affect the amounts of assets, liabilities, expenses and revenues reported in the financial statements. Actual results could differ from those estimated.
3. SHARES OF BENEFICIAL INTEREST
The following tables summarize share activity:
| Year Ended October 31 | 2012 | 2011 |
| Class A Shares: | Shares | Amount | Shares | Amount |
| Shares sold | 101,325,201 | $517,640,174 | 98,824,715 | $516,747,402 |
| Shares issued to shareholders in payment of distributions declared | 7,318,704 | 34,837,031 | 2,507,026 | 13,688,361 |
| Shares redeemed | (155,265,119) | (788,003,375) | (163,851,163) | (870,540,365) |
| NET CHANGE RESULTING FROM CLASS A SHARE TRANSACTIONS | (46,621,214) | $(235,526,170) | (62,519,422) | $(340,104,602) |
| Year Ended October 31 | 2012 | 2011 |
| Class B Shares: | Shares | Amount | Shares | Amount |
| Shares sold | 1,821,412 | $8,869,192 | 3,793,204 | $19,214,651 |
| Shares issued to shareholders in payment of distributions declared | 1,223,197 | 5,467,692 | 44,017 | 227,570 |
| Shares redeemed | (30,641,240) | (147,053,853) | (34,331,522) | (172,846,233) |
| NET CHANGE RESULTING FROM CLASS B SHARE TRANSACTIONS | (27,596,631) | $(132,716,969) | (30,494,301) | $(153,404,012) |
| Year Ended October 31 | 2012 | 2011 |
| Class C Shares: | Shares | Amount | Shares | Amount |
| Shares sold | 4,989,635 | $24,006,713 | 9,418,288 | $47,966,563 |
| Shares issued to shareholders in payment of distributions declared | 1,739,345 | 7,774,872 | 122,226 | 631,908 |
| Shares redeemed | (33,800,648) | (161,486,802) | (39,974,916) | (201,008,903) |
| NET CHANGE RESULTING FROM CLASS C SHARE TRANSACTIONS | (27,071,668) | $(129,705,217) | (30,434,402) | $(152,410,432) |
Annual Shareholder Report
| Year Ended October 31 | 2012 | 2011 |
| Class R Shares: | Shares | Amount | Shares | Amount |
| Shares sold | 28,537,282 | $144,995,988 | 33,245,133 | $179,977,076 |
| Shares issued to shareholders in payment of distributions declared | 11,542,994 | 54,944,651 | 4,030,627 | 22,047,532 |
| Shares redeemed | (104,394,919) | (537,003,716) | (115,185,739) | (621,410,281) |
| NET CHANGE RESULTING FROM CLASS R SHARE TRANSACTIONS | (64,314,643) | $(337,063,077) | (77,909,979) | $(419,385,673) |
| NET CHANGE RESULTING FROM TOTAL FUND SHARE TRANSACTIONS | (165,604,156) | $(835,011,433) | (201,358,104) | $(1,065,304,719) |
Redemption Fee
The Fund's Class R Shares imposes a redemption fee of 0.20% on the redemption price of the Fund's Class R Shares redeemed, if such shares were purchased after February 1, 1985. The redemption fee is applied to the Fund's Class R Shares expenses for providing redemption services, including, but not limited to: transfer agent fees; postage; printing; telephone; and related employment costs. Any excess fee proceeds are added to the Fund's assets. Shares acquired through employer-sponsored retirement plans will not be subject to the redemption fee. However, if shares are purchased for a retirement plan account through a broker, financial institution or other intermediary maintaining an omnibus account for the shares, the waiver may not apply. In addition, this waiver does not apply to individual retirement accounts, such as Traditional, Roth and SEP-IRAs. For the years ended October 31, 2012 and October 31, 2011, redemption fees of $649,922 and $646,227 were allocated to cover the cost of redemptions.
4. FEDERAL TAX INFORMATION
The timing and character of income and capital gain distributions are determined in accordance with income tax regulations, which may differ from GAAP. These differences are due to differing treatments for foreign currency transactions, partnership adjustments, ordinary loss netting to reduce short term capital gains, reclassification for regulatory settlement proceeds and net operating losses.
For the year ended October 31, 2012, permanent differences identified and reclassified among the components of net assets were as follows:
| Increase (Decrease) |
| Paid-In Capital | Undistributed
Net Investment
Income (Loss) | Accumulated
Net Realized
Gain (Loss) |
| $(8,065,047) | $5,928,531 | $2,136,516 |
Net investment income (loss), net realized gains (losses), and net assets were not affected by this reclassification.
Annual Shareholder Report
The tax character of distributions as reported on the Statement of Changes in Net Assets for the years ended October 31, 2012 and 2011, was as follows:
| 2012 | 2011 |
| Ordinary income | $— | $39,454,350 |
| Long-term capital gains | $109,962,103 | $48,627 |
As of October 31, 2012, the components of distributable earnings on a tax basis were as follows:
| Undistributed capital gains | $420,797,188 |
| Net unrealized appreciation | $1,191,414,177 |
| Ordinary loss deferrals | $(52,337,307) |
The difference between book-basis and tax-basis net unrealized appreciation/depreciation is attributable to differing treatments for the deferral of losses on wash sales and partnership adjustments.
At October 31, 2012, the cost of investments for federal tax purposes was $4,524,980,534. The net unrealized appreciation of investments for federal tax purposes excluding: a) any unrealized appreciation/depreciation resulting from the translation of FCs to U.S. dollars of assets and liabilities other than investments in securities and b) outstanding foreign currency commitments was $1,193,690,513. This consists of net unrealized appreciation from investments for those securities having an excess of value over cost of $1,370,468,961 and net unrealized depreciation from investments for those securities having an excess of cost over value of $176,778,448.
Under current tax law, late-year ordinary loss realized after December 31 through the end of the Fund's fiscal year (“Late Year Ordinary Loss”) may be deferred, in whole or in part, and treated as occurring on the first day of the following fiscal year. As of October 31, 2012, for federal income tax purposes, a Late Year Ordinary Loss of $52,337,307 was deferred to November 1, 2012.
5. INVESTMENT ADVISER FEE AND OTHER TRANSACTIONS WITH AFFILIATES
Investment Adviser Fee
The advisory agreement between the Fund and the Adviser provides for an annual fee equal to 1.425% of the Fund's average daily net assets. Pursuant to the settlement of certain litigation, the Adviser has agreed, for a period continuing through June 30, 2022, to waive its investment advisory fee so that such fee will not exceed 1.275%. Also as part of the settlement agreement, effective July 1, 2012 and continuing through June 30, 2022, the Adviser has agreed to further waive the advisory fee by an additional 0.02%, 0.04%, 0.06% or 0.07% if the Fund's net assets exceed eight, nine, ten or twelve billion dollars, respectively. Subject to the terms described in the Expense Limitation note, the Adviser may voluntarily choose to waive any portion of its fee. For the year ended October 31, 2012, the Adviser voluntarily waived $7,676,944 of its fee.
Certain of the Fund's assets are managed by Federated Global Investment Management Corp. (the “Sub-Adviser”). Under the terms of a sub-advisory agreement between the Adviser and the Sub-Adviser, the Sub-Adviser receives an allocable portion of the Fund's adviser fee. The fee is paid by the Adviser out of its resources and is not an incremental Fund expense. For the year ended October 31, 2012, the Sub-Adviser earned a fee of $65,799,584.
Annual Shareholder Report
Administrative Fee
Federated Administrative Services (FAS), under the Administrative Services Agreement, provides the Fund with administrative personnel and services. The fee paid to FAS is based on the average aggregate daily net assets of certain Federated funds as specified below, plus certain out-of-pocket expenses:
| Administrative Fee | Average Aggregate Daily Net Assets
of the Federated Funds |
| 0.150% | on the first $5 billion |
| 0.125% | on the next $5 billion |
| 0.100% | on the next $10 billion |
| 0.075% | on assets in excess of $20 billion |
Prior to September 1, 2012, the administrative fee received during any fiscal year was at least $150,000 per portfolio and $40,000 per each additional class of Shares. Subject to the terms described in the Expense Limitation note, FAS may voluntarily choose to waive any portion of its fee. For the year ended October 31, 2012, FAS waived $88,804 of its fee. The net fee paid to FAS was 0.076% of average daily net assets of the Fund.
Distribution Services Fee
The Fund has adopted a Distribution Plan (the “Plan”) pursuant to Rule 12b-1 under the Act. Under the terms of the Plan, the Fund will compensate Federated Securities Corp. (FSC), the principal distributor, from the daily net assets of the Fund's Class A Shares, Class B Shares, Class C Shares and Class R Shares to finance activities intended to result in the sale of these shares. The Plan provides that the Fund may incur distribution expenses at the following percentages of average daily net assets annually, to compensate FSC:
| Share Class Name | Percentage of Average Daily
Net Assets of Class |
| Class A Shares | 0.25% |
| Class B Shares | 0.75% |
| Class C Shares | 0.75% |
| Class R Shares | 0.50% |
Subject to the terms described in the Expense Limitation note, FSC may voluntarily choose to waive any portion of its fee. For the year ended October 31, 2012, distribution services fees for the Fund were as follows:
| Distribution
Services
Fees Incurred | Distribution
Services
Fees Waived |
| Class A Shares | $4,851,821 | $(2,365,682) |
| Class B Shares | 1,807,252 | — |
| Class C Shares | 3,309,476 | (321,528) |
| Class R Shares | 14,885,029 | (10,699,342) |
| TOTAL | $24,853,578 | $(13,386,552) |
Annual Shareholder Report
When FSC receives fees, it may pay some or all of them to financial intermediaries whose customers purchase shares. For the year ended October 31, 2012, FSC retained $6,016,523 of fees paid by the Fund.
Sales Charges
Front-end sales charges and contingent deferred sales charges (CDSC) do not represent expenses of the Fund. They are deducted from the proceeds of sales of Fund shares prior to investment or from redemption proceeds prior to remittance, as applicable. For the year ended October 31, 2012, FSC retained $73,707 in sales charges from the sale of Class A Shares. FSC also retained $8,908 of CDSC relating to redemptions of Class A Shares, $113,165 relating to redemptions of Class B Shares and $19,183 relating to redemptions of Class C Shares.
Shareholder Services Fee
The Fund may pay fees (“Service Fees”) up to 0.25% of the average daily net assets of the Fund's Class A Shares, Class B Shares, Class C Shares and Class R Shares to financial intermediaries or to Federated Shareholder Services Company (FSSC) for providing services to shareholders and maintaining shareholder accounts. Financial intermediaries may include a company affiliated with management of Federated Investors, Inc. A financial intermediary affiliated with management of Federated Investors, Inc. received $17,407 of Service Fees for the year ended October 31, 2012. Subject to the terms described in the Expense Limitation note, FSSC may voluntarily reimburse the Fund for Service Fees. For the year ended October 31, 2012, Service Fees for the Fund were as follows:
| Service
Fees
Incurred | Service
Fees
Reimbursed |
| Class A Shares | $4,816,186 | $— |
| Class B Shares | 602,417 | (178,397) |
| Class C Shares | 1,100,814 | — |
| Class R Shares | 7,416,186 | — |
| TOTAL | $13,935,603 | $(178,397) |
For the year ended October 31, 2012, FSSC received $4,746,146 of fees paid by the Fund.
Commitments and Contingencies
In the course of pursuing its investment objective, the Fund sometimes invests in limited partnerships and limited liability companies. These entities often require the Fund to commit to a total dollar amount to be invested. The investments are usually made in installments over a period of time. At October 31, 2012, the Fund had total commitments to limited partnerships and limited liability companies of $34,683,400; of this amount, $33,577,120 was invested by the Fund leaving the Fund contingently liable for additional investments of $1,106,280.
Expense Limitation
The Adviser and its affiliates (which may include FSC, FAS and FSSC) have voluntarily agreed to waive their fees and/or reimburse expenses so that the total annual fund operating expenses (as shown in the financial highlights, excluding dividends and other expenses related to short sales) paid by the Fund's Class A Shares, Class B Shares, Class C Shares and Class R Shares (after the voluntary waivers and/or reimbursements) will not exceed 1.95%, 2.50%, 2.50% and 1.95% (the “Fee Limit”), respectively, up to but not including the later of (the
Annual Shareholder Report
“Termination Date”): (a) January 1, 2014; or (b) the date of the Fund's next effective Prospectus. While the Adviser and its affiliates currently do not anticipate terminating or increasing these arrangements prior to the Termination Date, these arrangements may only be terminated or the Fee Limit increased prior to the Termination Date with the agreement of the Trustees.
Interfund Transactions
During the year ended October 31, 2012, the Fund engaged in purchase and sale transactions with funds that have a common investment adviser (or affiliated investment advisers), common Directors/Trustees, and/or common Officers. These purchase and sale transactions complied with Rule 17a-7 under the Act and amounted to $21,447,288 and $9,804,674, respectively.
General
Certain Officers and Trustees of the Fund are Officers and Directors or Trustees of the above companies.
Transactions Involving Affiliated Companies and Affiliated Holdings
An affiliated company is a company in which the Fund has ownership of at least 5% of the voting shares. Transactions with affiliated companies during the year ended October 31, 2012, were as follows:
| Affiliates | Balance of
Shares Held
10/31/2011 | Purchases/
Additions | Sales/
Reductions | Balance of
Shares Held
10/31/2012 | Value | Dividend
Income |
| *Alkermes, Inc. | 5,818,897 | 589,166 | 3,111,550 | 3,296,513 | $61,084,386 | $— |
CETIP SA-
Mercados Organizado | 21,640,000 | 1,793,735 | 1,794,834 | 21,638,901 | 249,304,686 | 3,443,236 |
| Conceptus, Inc. | 1,725,460 | — | — | 1,725,460 | 32,507,666 | — |
Corcept
Therapeutics, Inc. | 3,653,165 | 5,776,835 | — | 9,430,000 | 23,575,000 | — |
Corcept
Therapeutics, Inc., 3/29/2015 | — | 797,358 | — | 797,358 | 431,131 | — |
| *Cubist Pharmaceuticals, Inc. | 4,250,000 | — | 1,750,000 | 2,500,000 | 107,250,000 | — |
| Dexcom, Inc. | 3,717,624 | 3,891,049 | 108,673 | 7,500,000 | 98,250,000 | — |
| Dexcom, Inc. | 126,065 | — | — | 126,065 | 1,651,452 | — |
| Dyax Corp. | 15,200,000 | 2,762,000 | — | 17,962,000 | 53,886,000 | — |
| ExamWorks Group, Inc. | 3,000,000 | 1,343,617 | 423,617 | 3,920,000 | 54,958,400 | — |
| Insulet Corp. | 1,834,871 | 783,454 | 234,871 | 2,383,454 | 50,553,059 | — |
Insulet Corp., Conv.
Bond, 3.75, 6/15/2016 | 14,630,000 | — | — | 14,630,000 | 16,263,732 | — |
Insulet Corp., Conv.
Bond, 5.375, 6/15/2013 | 12,670,000 | — | — | 12,670,000 | 15,505,166 | — |
| Progenics Pharmaceuticals, Inc. | 5,246,193 | — | — | 5,246,193 | 14,951,650 | — |
| Protalix Biotherapeutics, Inc. | 5,400,000 | 1,306,495 | — | 6,706,495 | $32,392,371 | — |
Annual Shareholder Report
| Affiliates | Balance of
Shares Held
10/31/2011 | Purchases/
Additions | Sales/
Reductions | Balance of
Shares Held
10/31/2012 | Value | Dividend
Income |
| Repligen Corp. | 2,998,043 | — | 298,043 | 2,700,000 | 13,770,000 | $— |
| *Restoque Comercio e Confeccoes de Roupas SA | 3,698,035 | — | 2,443,915 | 1,254,120 | 5,347,323 | 279,607 |
| Sensable Technologies, Inc. | 3,751 | — | — | 3,751 | — | — |
| Soteira, Inc. | 959,018 | — | — | 959,018 | — | — |
| TNS, Inc. | 2,964,645 | — | 274,576 | 2,690,069 | 38,521,788 | — |
| Zogenix, Inc. | — | 16,500,000 | — | 16,500,000 | 40,260,000 | — |
| Zogenix, Inc., 7/27/2017 | — | 7,425,000 | — | 7,425,000 | 3,897,383 | — |
| *Vical, Inc. | 7,048,500 | 2,664,209 | 6,712,709 | 3,000,000 | 10,230,000 | — |
TOTAL OF
AFFILIATED
COMPANIES | 114,306,102 | 47,911,083 | 17,152,788 | 145,064,397 | $924,591,193 | $3,722,843 |
| * | At October 31, 2012, the Fund no longer has ownership of at least 5% of the voting shares. |
Affiliated holdings are mutual funds which are managed by the Adviser or an affiliate of the Adviser. The Adviser has agreed to reimburse the Fund for certain investment adviser fees as a result of transactions in other affiliated mutual funds. For the year ended October 31, 2012, the Adviser reimbursed $723,003. Transactions involving the affiliated holding during the year ended October 31, 2012, were as follows:
| Federated
Prime Value
Obligations Fund,
Institutional Shares |
| Balance of Shares Held 10/31/2011 | 511,911,319 |
| Purchases/Additions | 4,508,620,683 |
| Sales/Reductions | 4,414,507,549 |
| Balance of Shares Held 10/31/2012 | 606,024,453 |
| Value | $606,024,453 |
| Dividend Income | $425,415 |
6. EXPENSE Reduction
The Fund directs portfolio trades to a broker that in turn pays a portion of the Fund's operating expenses. For the year ended October 31, 2012, the Fund's expenses were reduced by $67,170 under these arrangements.
Annual Shareholder Report
7. Investment TRANSACTIONS
Purchases and sales of investments, excluding long-term U.S. government securities and short-term obligations, for the year ended October 31, 2012, were as follows:
| Purchases | $3,303,789,656 |
| Sales | $4,510,996,589 |
8. CONCENTRATION OF RISK
The Fund invests in securities of non-U.S. issuers. Political or economic developments may have an effect on the liquidity and volatility of portfolio securities and currency holdings.
At October 31, 2012, the diversification of countries was as follows:
| Country | Percentage of
Net Assets |
| United States | 65.6% |
| Brazil | 6.8% |
| Italy | 2.8% |
| Netherlands | 2.8% |
| India | 2.6% |
| Luxembourg | 2.5% |
| Ireland | 2.3% |
| Spain | 2.2% |
| British Virgin Islands | 1.7% |
| United Kingdom | 1.4% |
| Israel | 0.9% |
| Chile | 0.9% |
| Singapore | 0.8% |
| Colombia | 0.7% |
| Cayman Islands | 0.6% |
| Switzerland | 0.3% |
| Mexico | 0.2% |
| Peru | 0.2% |
| United Arab Emirates | 0.2% |
| Sweden | 0.0%1 |
| 1 | Represents less than 0.1%. |
9. LINE OF CREDIT
The Fund participates in a $100,000,000 unsecured, uncommitted revolving line of credit (LOC) agreement with PNC Bank. The LOC was made available for extraordinary or emergency purposes, primarily for financing redemption payments. Borrowings are charged interest at a rate offered to the Fund by PNC Bank at the time of the borrowing. As of October 31, 2012, there were no outstanding loans. During the year ended October 31, 2012, the Fund did not utilize the LOC.
Annual Shareholder Report
10. INTERFUND LENDING
Pursuant to an Exemptive Order issued by the Securities and Exchange Commission, the Fund, along with other funds advised by subsidiaries of Federated Investors, Inc., may participate in an interfund lending program. This program provides an alternative credit facility allowing the Fund to borrow from other participating affiliated funds. As of October 31, 2012, there were no outstanding loans. During the year ended October 31, 2012, the program was not utilized.
11. Legal Proceedings
Since February 2004, Federated Investors, Inc. and related entities (collectively, “Federated”), have been named as defendants in several lawsuits in the United States District Court for the Western District of Pennsylvania. These lawsuits have been consolidated into a single action alleging excessive advisory fees involving the Fund. Without admitting the validity of any claim, in April 2011, Federated reached a final settlement to resolve this lawsuit resulting in no material adverse effect on Federated or the Fund.
12. FEDERAL TAX INFORMATION (UNAUDITED)
For the year ended October 31, 2012, the amount of long-term capital gains designated by the Fund was $109,962,103.
Annual Shareholder Report
Report of Independent Registered Public Accounting Firm
TO THE BOARD OF Trustees OF Federated Equity Funds AND SHAREHOLDERS OF Federated Kaufmann Fund:
We have audited the accompanying statement of assets and liabilities of Federated Kaufmann Fund (the “Fund”) (one of the portfolios constituting Federated Equity Funds), including the portfolio of investments, as of October 31, 2012, and the related statement of operations for the year then ended, the statement of changes in net assets for each of the two years in the period then ended, and the financial highlights of Classes A, B and C for each of the five years in the period then ended. These financial statements and financial highlights are the responsibility of the Fund's management. Our responsibility is to express an opinion on these financial statements and financial highlights based on our audits.
We conducted our audits in accordance with standards of the Public Company Accounting Oversight Board (United States). Those standards require that we plan and perform the audit to obtain reasonable assurance about whether the financial statements and financial highlights are free of material misstatement. We were not engaged to perform an audit of the Fund's internal control over financial reporting. Our audits included consideration of internal control over financial reporting as a basis for designing audit procedures that are appropriate in the circumstances, but not for the purpose of expressing an opinion on the effectiveness of the Fund's internal control over financial reporting. Accordingly, we express no such opinion. An audit also includes examining, on a test basis, evidence supporting the amounts and disclosures in the financial statements and financial highlights, assessing the accounting principles used and significant estimates made by management, and evaluating the overall financial statement presentation. Our procedures included confirmation of securities owned as of October 31, 2012, by correspondence with the custodian and others or by other appropriate auditing procedures where replies from others were not received. We believe that our audits provide a reasonable basis for our opinion.
In our opinion, the financial statements and financial highlights referred to above present fairly, in all material respects, the financial position of the Federated Kaufmann Fund, a portfolio of Federated Equity Funds, at October 31, 2012, the results of its operations for the year then ended, the changes in its net assets for each of the two years in the period then ended, and the financial highlights of Classes A, B and C for each of the five years in the period then ended, in conformity with U.S. generally accepted accounting principles.
Boston, Massachusetts
December 24, 2012
Annual Shareholder Report
Shareholder Expense Example (unaudited)
As a shareholder of the Fund, you incur two types of costs: (1) transaction costs, including sales charges (loads) on purchase or redemption payments; and (2) ongoing costs, including management fees and to the extent applicable, distribution (12b-1) fees and/or shareholder services fees and other Fund expenses. This Example is intended to help you to understand your ongoing costs (in dollars) of investing in the Fund and to compare these costs with the ongoing costs of investing in other mutual funds. It is based on an investment of $1,000 invested at the beginning of the period and held for the entire period from May 1, 2012 to October 31, 2012.
ACTUAL EXPENSES
The first section of the table below provides information about actual account values and actual expenses. You may use the information in this section, together with the amount you invested, to estimate the expenses that you incurred over the period. Simply divide your account value by $1,000 (for example, an $8,600 account value divided by $1,000 = 8.6), then multiply the result by the number in the first section under the heading entitled “Expenses Paid During Period” to estimate the expenses attributable to your investment during this period.
HYPOTHETICAL EXAMPLE FOR COMPARISON PURPOSES
The second section of the table below provides information about hypothetical account values and hypothetical expenses based on the Fund's actual expense ratio and an assumed rate of return of 5% per year before expenses, which is not the Fund's actual return. Thus, you should not use the hypothetical account values and expenses to estimate the actual ending account balance or your expenses for the period. Rather, these figures are required to be provided to enable you to compare the ongoing costs of investing in the Fund with other funds. To do so, compare this 5% hypothetical example with the 5% hypothetical examples that appear in the shareholder reports of the other funds.
Annual Shareholder Report
Please note that the expenses shown in the table are meant to highlight your ongoing costs only and do not reflect any transaction costs, such as sales charges (loads) on purchase or redemption payments. Therefore, the second section of the table is useful in comparing ongoing costs only, and will not help you determine the relative total costs of owning different funds. In addition, if these transaction costs were included, your costs would have been higher.
| Beginning
Account Value
5/1/2012 | Ending
Account Value
10/31/2012 | Expenses Paid
During Period1 |
| Actual: | | | |
| Class A Shares | $1,000 | $974.20 | $9.68 |
| Class B Shares | $1,000 | $970.50 | $12.38 |
| Class C Shares | $1,000 | $970.50 | $12.38 |
Hypothetical (assuming a 5% return
before expenses): | | | |
| Class A Shares | $1,000 | $1,015.33 | $9.88 |
| Class B Shares | $1,000 | $1,012.57 | $12.65 |
| Class C Shares | $1,000 | $1,012.57 | $12.65 |
| 1 | Expenses are equal to the Fund's annualized net expense ratios, multiplied by the average account value over the period, multiplied by 184/366 (to reflect the one-half-year period). The annualized net expense ratios are as follows: |
| Class A Shares | 1.95% |
| Class B Shares | 2.50% |
| Class C Shares | 2.50% |
Annual Shareholder Report
Board of Trustees and Trust Officers
The Board of Trustees is responsible for managing the Trust business affairs and for exercising all the Trust powers except those reserved for the shareholders. The following tables give information about each Trustee and the senior officers of the Fund. Where required, the tables separately list Trustees who are “interested persons” of the Fund (i.e., “Interested” Trustees) and those who are not (i.e., “Independent” Trustees). Unless otherwise noted, the address of each person listed is Federated Investors Tower, 1001 Liberty Avenue, Pittsburgh, PA 15222. The address of all Independent Trustees listed is 4000 Ericsson Drive, Warrendale, PA 15086-7561; Attention: Mutual Fund Board. As of December 31, 2011, the Trust comprised 13 portfolio(s), and the Federated Fund Family consisted of 43 investment companies (comprising 134 portfolios). Unless otherwise noted, each Officer is elected annually. Unless otherwise noted, each Trustee oversees all portfolios in the Federated Fund Family and serves for an indefinite term. The Fund's Statement of Additional Information includes additional information about Trust Trustees and is available, without charge and upon request, by calling 1-800-341-7400.
Interested TRUSTEES Background
Name
Birth Date
Positions Held with Trust
Date Service Began | Principal Occupation(s) for Past Five Years,
Other Directorships Held and Previous Position(s) |
John F. Donahue*
Birth Date: July 28, 1924
Trustee
Began serving: April 1984 | Principal Occupations: Director or Trustee of the Federated Fund Family; Chairman and Director, Federated Investors, Inc.; Chairman of the Federated Fund Family's Executive Committee.
Previous Positions: Chairman of the Federated Fund Family; Trustee, Federated Investment Management Company; Chairman and Director, Federated Investment Counseling. |
J. Christopher Donahue*
Birth Date: April 11, 1949
President and Trustee
Began serving: January 2000 | Principal Occupations: Principal Executive Officer and President of the Federated Fund Family; Director or Trustee of some of the Funds in the Federated Fund Family; President, Chief Executive Officer and Director, Federated Investors, Inc.; Chairman and Trustee, Federated Investment Management Company; Trustee, Federated Investment Counseling; Chairman and Director, Federated Global Investment Management Corp.; Chairman, Federated Equity Management Company of Pennsylvania and Passport Research, Ltd. (investment advisory subsidiary of Federated); Trustee, Federated Shareholder Services Company; Director, Federated Services Company.
Previous Positions: President, Federated Investment Counseling; President and Chief Executive Officer, Federated Investment Management Company, Federated Global Investment Management Corp. and Passport Research, Ltd. |
| * | Family relationships and reasons for “interested” status: John F. Donahue is the father of J. Christopher Donahue; both are “interested” due to their beneficial ownership of shares of Federated Investors, Inc. and the positions they hold with Federated and its subsidiaries. |
Annual Shareholder Report
INDEPENDENT TRUSTEES Background
Name
Birth Date
Positions Held with Trust
Date Service Began | Principal Occupation(s) for Past Five Years,
Other Directorships Held, Previous Position(s) and Qualifications |
Nicholas P. Constantakis, CPA
Birth Date: September 3, 1939
Trustee
Began serving: February 1998 | Principal Occupation: Director or Trustee of the Federated Fund Family.
Other Directorship Held: Director, Chairman of the Audit Committee, and member of the Compensation Committee, Michael Baker Corporation (architecture, engineering and construction services).
Previous Position: Partner, Andersen Worldwide SC.
Qualifications: Public accounting and director experience. |
John F. Cunningham
Birth Date: March 5, 1943
Trustee
Began serving: January 1999 | Principal Occupation: Director or Trustee of the Federated Fund Family.
Other Directorships Held: Chairman, President and Chief Executive Officer, Cunningham & Co., Inc. (strategic business consulting); Trustee Associate, Boston College.
Previous Positions: Director, Redgate Communications and EMC Corporation (computer storage systems); Chairman of the Board and Chief Executive Officer, Computer Consoles, Inc.; President and Chief Operating Officer, Wang Laboratories; Director, First National Bank of Boston; Director, Apollo Computer, Inc.
Qualifications: Business management and director experience. |
Maureen Lally-Green
Birth Date: July 5, 1949
Trustee
Began serving: August 2009 | Principal Occupations: Director or Trustee of the Federated Fund Family; Director, Office of Church Relations, Diocese of Pittsburgh; Adjunct Professor of Law, Duquesne University School of Law.
Other Directorships Held: Director, Auberle; Member, Pennsylvania State Board of Education; Director, Saint Vincent College; Director, Ireland Institute of Pittsburgh; Chair and Director, UPMC Mercy Hospital; Regent, St. Vincent Seminary; Director, Epilepsy Foundation of Western and Central Pennsylvania; Director, Saint Thomas More Society, Allegheny County; Director, Our Campaign for the Church Alive, Inc.
Previous Position: Pennsylvania Superior Court Judge.
Qualifications: Legal and director experience. |
Peter E. Madden
Birth Date: March 16, 1942
Trustee
Began serving: November 1991 | Principal Occupation: Director or Trustee, and Chairman of the Board of Directors or Trustees, of the Federated Fund Family.
Previous Positions: Representative, Commonwealth of Massachusetts General Court; President, Chief Operating Officer and Director, State Street Bank and Trust Company and State Street Corporation (retired); Director, VISA USA and VISA International; Chairman and Director, Massachusetts Bankers Association; Director, Depository Trust Corporation; Director, The Boston Stock Exchange.
Qualifications: Business management, mutual fund services and director experience. |
Annual Shareholder Report
Name
Birth Date
Positions Held with Trust
Date Service Began | Principal Occupation(s) for Past Five Years,
Other Directorships Held, Previous Position(s) and Qualifications |
Charles F. Mansfield, Jr.
Birth Date: April 10, 1945
Trustee
Began serving: January 1999 | Principal Occupations: Director or Trustee of the Federated Fund Family; Management Consultant.
Previous Positions: Chief Executive Officer, PBTC International Bank; Partner, Arthur Young & Company (now Ernst & Young LLP); Chief Financial Officer of Retail Banking Sector, Chase Manhattan Bank; Senior Vice President, HSBC Bank USA (formerly Marine Midland Bank); Vice President, Citibank; Assistant Professor of Banking and Finance, Frank G. Zarb School of Business, Hofstra University; Executive Vice President, DVC Group, Inc. (marketing, communications and technology).
Qualifications: Banking, business management, education and director experience. |
Thomas M. O'Neill
Birth Date: June 14, 1951
Trustee
Began serving: October 2006 | Principal Occupations: Director or Trustee, Vice Chairman of the Audit Committee of the Federated Fund Family; Sole Proprietor, Navigator Management Company (investment and strategic consulting).
Other Directorships Held: Board of Overseers, Children's Hospital of Boston; Visiting Committee on Athletics, Harvard College; Board of Directors, Medicines for Humanity; Board of Directors, The Golisano Children's Museum of Naples, Florida.
Previous Positions: Chief Executive Officer and President, Managing Director and Chief Investment Officer, Fleet Investment Advisors; President and Chief Executive Officer, Aeltus Investment Management, Inc.; General Partner, Hellman, Jordan Management Co., Boston, MA; Chief Investment Officer, The Putnam Companies, Boston, MA; Credit Analyst and Lending Officer, Fleet Bank; Director and Consultant, EZE Castle Software (investment order management software); Director, Midway Pacific (lumber).
Qualifications: Business management, mutual fund, director and investment experience. |
John S. Walsh
Birth Date: November 28, 1957
Trustee
Began serving: January 1999 | Principal Occupations: Director or Trustee, Chairman of the Audit Committee of the Federated Fund Family; President and Director, Heat Wagon, Inc. (manufacturer of construction temporary heaters); President and Director, Manufacturers Products, Inc. (distributor of portable construction heaters); President, Portable Heater Parts, a division of Manufacturers Products, Inc.
Previous Position: Vice President, Walsh & Kelly, Inc.
Qualifications: Business management and director experience. |
Annual Shareholder Report
OFFICERS
Name
Birth Date
Address
Positions Held with Trust
Date Service Began | Principal Occupation(s) for Past Five Years
and Previous Position(s) |
John W. McGonigle
Birth Date: October 26, 1938
EXECUTIVE VICE PRESIDENT AND SECRETARY
Officer since: April 1984 | Principal Occupations: Executive Vice President and Secretary of the Federated Fund Family; Vice Chairman, Executive Vice President, Secretary and Director, Federated Investors, Inc.
Previous Positions: Trustee, Federated Investment Management Company and Federated Investment Counseling; Director, Federated Global Investment Management Corp., Federated Services Company and Federated Securities Corp. |
Richard A. Novak
Birth Date: December 25, 1963
Treasurer
Officer since: January 2006 | Principal Occupations: Principal Financial Officer and Treasurer of the Federated Fund Family; Senior Vice President, Federated Administrative Services; Financial and Operations Principal for Federated Securities Corp., Edgewood Services, Inc. and Southpointe Distribution Services, Inc.
Previous Positions: Controller of Federated Investors, Inc.; Vice President, Finance of Federated Services Company; held various financial management positions within The Mercy Hospital of Pittsburgh; Auditor, Arthur Andersen & Co. |
Richard B. Fisher
Birth Date: May 17, 1923
Vice President
Officer since: April 1984 | Principal Occupations: Vice Chairman or Vice President of some of the Funds in the Federated Fund Family; Vice Chairman, Federated Investors, Inc.; Chairman, Federated Securities Corp.
Previous Positions: President and Director or Trustee of some of the Funds in the Federated Fund Family; Executive Vice President, Federated Investors, Inc.; Director and Chief Executive Officer, Federated Securities Corp. |
Peter J. Germain
Birth Date: September 3, 1959
CHIEF LEGAL OFFICER
Officer since: January 2005
| Principal Occupations: Mr. Germain is Chief Legal Officer of the Federated Fund Family. He is General Counsel and Vice President, Federated Investors, Inc.; President, Federated Administrative Services and Federated Administrative Services, Inc.; Vice President, Federated Securities Corp.; Secretary, Federated Private Asset Management, Inc.; and Secretary, Retirement Plan Service Company of America. Mr. Germain joined Federated in 1984 and is a member of the Pennsylvania Bar Association.
Previous Positions: Deputy General Counsel, Special Counsel, Managing Director of Mutual Fund Services, Federated Investors, Inc.; Senior Vice President, Federated Services Company; and Senior Corporate Counsel, Federated Investors, Inc. |
Brian P. Bouda
Birth Date: February 28, 1947
CHIEF COMPLIANCE OFFICER AND SENIOR VICE PRESIDENT
Officer since: August 2004 | Principal Occupations: Senior Vice President and Chief Compliance Officer of the Federated Fund Family; Vice President and Chief Compliance Officer of Federated Investors, Inc. and Chief Compliance Officer of its subsidiaries. Mr. Bouda joined Federated in 1999 and is a member of the American Bar Association and the State Bar Association of Wisconsin. |
Annual Shareholder Report
Name
Birth Date
Address
Positions Held with Trust
Date Service Began | Principal Occupation(s) for Past Five Years
and Previous Position(s) |
Stephen F. Auth
Birth Date: September 3, 1956
450 Lexington Avenue
Suite 3700
New York, NY 10017-3943
CHIEF INVESTMENT OFFICER
Officer since: November 2002 | Principal Occupations: Mr. Auth is Chief Investment Officer of this Fund and various other Funds in the Federated Fund Family; Executive Vice President, Federated Investment Counseling, Federated Global Investment Management Corp. and Federated Equity Management Company of Pennsylvania.
Previous Positions: Executive Vice President, Federated Investment Management Company, and Passport Research, Ltd. (investment advisory subsidiary of Federated); Senior Vice President, Global Portfolio Management Services Division; Senior Vice President, Federated Investment Management Company and Passport Research, Ltd.; Senior Managing Director and Portfolio Manager, Prudential Investments. |
Lawrence Auriana
Birth Date: January 8, 1944
140 East 45th Street
New York, NY 10017
VICE PRESIDENT
Officer since: November 2001
Portfolio Manager since: February 1986 | Principal Occupations: Lawrence Auriana has been the Fund's Portfolio Manager since February 1986. He is Vice President of the Trust. Mr. Auriana joined Federated in April 2001 as Co-Head of Investments/Federated Kaufmann. From August 1984 to April 2001, Mr. Auriana was President and Treasurer of Edgemont Asset Management Corp., and Chairman of the Board and Portfolio Manager to The Kaufmann Fund, Inc. (predecessor to the Federated Kaufmann Fund). Mr. Auriana earned a B.S. in economics from Fordham University and has been engaged in the securities business since 1965. |
Hans P. Utsch
Birth Date: July 3, 1936
140 East 45th Street
New York, NY 10017
VICE PRESIDENT
Officer since: November 2001
Portfolio Manager since: February 1986 | Principal Occupations: Hans P. Utsch has been the Fund's Portfolio Manager since February 1986. He is Vice President of the Trust. Mr. Utsch joined Federated in April 2001 as Co-Head of Investments/Federated Kaufmann. From August 1984 to April 2001, Mr. Utsch was Chairman of the Board and Secretary of Edgemont Asset Management Corp., and President and Portfolio Manager to The Kaufmann Fund, Inc. (predecessor to the Federated Kaufmann Fund). Mr. Utsch graduated from Amherst College and holds an M.B.A. from Columbia University. He has been engaged in the securities business since 1962. |
Annual Shareholder Report
Evaluation and Approval of Advisory Contract–May 2012
Federated Kaufmann Fund (the “Fund”)
Following a review and recommendation of approval by the Fund's independent trustees, the Fund's Board reviewed and approved at its May 2012 meetings the Fund's investment advisory and subadvisory contracts for an additional one-year term. The Board's decision regarding these contracts reflects the exercise of its business judgment on whether to continue the existing arrangements.
In this connection, the Federated Funds' Board had previously appointed a Senior Officer, whose duties include specified responsibilities relating to the process by which advisory fees are to be charged to a Federated fund. The Senior Officer has the authority to retain consultants, experts, or staff as may be reasonably necessary to assist in the performance of his duties, reports directly to the Board, and may be terminated only with the approval of a majority of the independent members of the Board. The Senior Officer prepared and furnished to the Board an independent, written evaluation that covered topics discussed below (the “Evaluation”). The Board considered that Evaluation, along with other information, in deciding to approve the advisory and subadvisory contracts.
The Board is also familiar with and considered judicial decisions concerning allegedly excessive investment advisory fees, which have indicated that the following factors may be relevant to an Adviser's fiduciary duty with respect to its receipt of compensation from a fund: the nature and quality of the services provided by the Adviser to a fund and its shareholders, including the performance and expenses of the fund and of comparable funds; the Adviser's cost of providing the services, including the profitability to the Adviser of providing advisory services to a fund; the extent to which the Adviser may realize “economies of scale” as a fund grows larger and, if such economies exist, whether they have been shared with a fund and its shareholders; any “fall-out financial benefits” that accrue to the Adviser because of its relationship with a fund (including research services received from brokers that execute fund trades and any fees paid to affiliates of the Adviser for services rendered to a fund); comparative fee structures, including a comparison of fees paid to the Adviser with those paid by similar funds; and the extent to which the Board members are fully informed about all facts the Board deems relevant to its consideration of the Adviser's services and fees. Consistent with these judicial decisions, the Board also considered management fees (including any components thereof) charged to institutional and other clients of the Adviser and subadviser for what might be viewed as like services. The Board was aware of these factors and was guided by them in its review of the Fund's advisory and subadvisory contracts to the extent it considered them to be appropriate and relevant, as discussed further below.
Annual Shareholder Report
The Board considered and weighed these circumstances in light of its substantial accumulated experience in governing the Fund and working with Federated on matters relating to the Federated funds, and was assisted in its deliberations by independent legal counsel. Throughout the year, and in connection with its May meetings, the Board requested and received substantial and detailed information about the Fund and the Federated organization that was in addition to the extensive materials that comprise and accompany the Senior Officer's Evaluation. Federated provided much of this information at each regular meeting of the Board, and furnished additional substantial information in connection with the May meeting at which the Board's formal review of the advisory and subadvisory contracts occurred. At this May meeting, senior management of the Adviser also met with the independent trustees and their counsel to discuss the materials presented and any other matters thought relevant by the Adviser or the trustees. Between regularly scheduled meetings, the Board also received information on particular matters as the need arose. Thus, the Board's consideration of the advisory and subadvisory contracts included review of the Senior Officer's Evaluation, accompanying data and additional information covering such matters as: the Adviser's and subadviser's investment philosophy, revenue, profitability, personnel and processes; investment and operating strategies; the Fund's short- and long-term performance (in absolute terms, both on a gross basis and net of expenses, as well as in relationship to its particular investment program and certain competitor or “peer group” funds and/or other benchmarks, as appropriate), and comments on the reasons for performance; the Fund's investment objectives; the Fund's expenses (including the advisory fee itself and the overall expense structure of the Fund, both in absolute terms and relative to similar and/or competing funds, with due regard for contractual or voluntary expense limitations); the use and allocation of brokerage commissions derived from trading the Fund's portfolio securities (if any); and the nature, quality and extent of the advisory and other services provided to the Fund by the Adviser and its affiliates. The Board also considered the preferences and expectations of Fund shareholders; the entrepreneurial risk assumed by the Adviser in sponsoring the funds; the continuing state of competition in the mutual fund industry and market practices; the range of comparable fees for similar funds in the mutual fund industry; the Fund's relationship to the Federated family of funds which include a comprehensive array of funds with different investment objectives, policies and strategies which are available for exchange without the incurrence of additional sales charges; compliance and audit reports concerning the Federated funds and the Federated companies that service them (including communications from regulatory agencies), as well as Federated's responses to any issues raised therein; and relevant developments in the mutual fund industry and how the Federated funds and/or Federated are responding to them. The Board also considered that the longevity and experience of the Fund's portfolio management team and
Annual Shareholder Report
their unique approach to investing may limit the utility of comparisons to other equity mutual funds. The Board's evaluation process is evolutionary. The criteria considered and the emphasis placed on relevant criteria change in recognition of changing circumstances in the mutual fund marketplace.
While mindful that courts have cautioned against giving such comparisons too much weight, the Board has found the use of comparisons of the Fund's fees and expenses to other mutual funds with comparable investment programs to be relevant, given the high degree of competition in the mutual fund business. The Board focused on comparisons with other similar mutual funds more heavily than non-mutual fund products or services because it is believed that they are more relevant. For example, other mutual funds are the products most like the Fund, they are readily available to Fund shareholders as alternative investment vehicles, and they are the type of investment vehicle in fact chosen and maintained by the Fund's investors. The range of their fees and expenses therefore appears to be a generally reliable indication of what consumers have found to be reasonable in the precise marketplace in which the Fund competes. In this regard, the Senior Officer has reviewed Federated's fees for providing advisory services to products outside the Federated family of funds (e.g., institutional and separate accounts). He concluded that mutual funds and institutional accounts are inherently different products. Those differences include, but are not limited to, different types of targeted investors; being subject to different laws and regulations; different legal structures; different average account sizes; different associated costs; different portfolio management techniques made necessary by different cash flows; and portfolio manager time spent in review of securities pricing. The Senior Officer did not consider these fee schedules to be determinative in judging the appropriateness of mutual fund advisory contracts.
The Fund's ability to deliver competitive performance when compared to its peer group was also deemed to be relevant by the Board as a useful indicator of how the Adviser is executing the Fund's investment program, which in turn assisted the Board in reaching a conclusion that the nature, extent, and quality of the Adviser's investment management services were such as to warrant continuation of the advisory and subadvisory contracts.
The Senior Officer reviewed information compiled by Federated, using data supplied by independent fund ranking organizations, regarding the performance of, and fees charged by, other mutual funds, noting his view that comparisons to fund peer groups are relevant in judging the reasonableness of proposed fees.
The Fund's performance fell below the median of the relevant peer group for the one-year, three-year and five-year periods covered by the Evaluation. The Board discussed the Fund's performance with the Adviser and recognized the efforts being undertaken by the Adviser. The Board will continue to monitor these efforts and the performance of the Fund.
Annual Shareholder Report
The Board also received financial information about Federated, including information regarding the compensation and benefits Federated derived from its relationships with the Federated funds. This information covered not only the fees under the advisory contracts, but also fees received by Federated's subsidiaries for providing other services to the Federated funds under separate contracts (e.g., for serving as the Federated funds' administrator). The information also detailed any indirect benefit Federated may derive from its receipt of research services from brokers who execute Federated fund trades. In addition, the Board considered the fact that, in order for a fund to be competitive in the marketplace, Federated and its affiliates frequently waived fees and/or reimbursed expenses and have disclosed to fund investors and/or indicated to the Board their intention to do so in the future, where appropriate. Moreover, the Board receives regular reporting as to the institution or elimination of these voluntary waivers.
Federated furnished information, requested by the Senior Officer, that reported revenues on a fund-by-fund basis and made estimates of the allocation of expenses on a fund-by-fund basis, using allocation methodologies specified by the Senior Officer. The Senior Officer noted that, although they may apply consistent allocation processes, the inherent difficulties in allocating costs (and the unavoidable arbitrary aspects of that exercise) and the lack of consensus on how to allocate those costs may render such allocation information unreliable. The allocation information was considered in the analysis by the Board but was determined to be of limited use.
The Board and the Senior Officer also reviewed information compiled by Federated comparing profitability information for Federated to other publicly held fund management companies. In this regard, the Senior Officer noted the limited availability of such information, but nonetheless concluded that Federated's profit margins did not appear to be excessive.
The Senior Officer's Evaluation also discussed the notion of possible realization of “economies of scale” as a fund grows larger. The Board considered in this regard that the Adviser has made significant and long-term investments in areas that support all of the Federated funds, such as personnel and processes for the portfolio management, shareholder services, compliance, internal audit, and risk management functions; and systems technology; and that the benefits of these efforts (as well as any economies, should they exist) were likely to be enjoyed by the fund complex as a whole. Finally, the Board also noted the absence of any applicable regulatory or industry guidelines on this subject, which (as discussed in the Senior Officer's Evaluation) is compounded by the lack of any common industry practice or general pattern with respect to structuring fund advisory fees with “breakpoints” that serve to reduce the fee as the fund attains a certain size. The Senior Officer did not recommend institution of breakpoints in pricing Federated's fund advisory services at this time. In this regard, the Senior Officer's Evaluation noted that the Board is aware that the Fund is a relatively more expensive fund for the Adviser to
Annual Shareholder Report
manage than other Federated equity funds and that the Fund has for long periods in the past been significantly and consistently above median in its investment performance. The Board agreed to monitor future developments and review changes in industry practices or competitive initiatives.
The Board also considered that on April 28, 2011, the adviser reached a final settlement to resolve the consolidated cases involving the fees being charged to the Federated Kaufmann Fund.
It was noted in the materials for the Board meeting that, for the period covered by the Evaluation, the Fund's investment advisory fee, after waivers and expense reimbursements, if any, was above the median of the relevant peer group. The Board reviewed the fees and other expenses of the Fund with the Adviser and was satisfied that the overall expense structure of the Fund remained competitive. The Board will continue to monitor advisory fees and other expenses borne by the Fund.
The Senior Officer noted that, considering the totality of the circumstances, and all of the factors referenced within his Evaluation, he had concluded that, subject to comments and recommendations made within his Evaluation, his observations and the information accompanying the Evaluation supported a finding by the Board that the management fees for each of the funds was reasonable and that Federated appeared to provide appropriate advisory and administrative services to the Fund for the fees paid. Under these circumstances, no changes were recommended to, and no objection was raised to, the continuation of the Fund's advisory and subadvisory contracts.
In its decision to continue an existing investment advisory contract, the Board was mindful of the potential disruptions of the Fund's operations and various risks, uncertainties and other effects that could occur as a result of a decision to terminate or not renew an advisory contract. In particular, the Board recognized that many shareholders have invested in the Fund on the strength of the Adviser's industry standing and reputation and with the expectation that the Adviser will have a continuing role in providing advisory services to the Fund. Thus, the Board's approval of the advisory contract reflected the fact that it is the shareholders who have effectively selected the Adviser by virtue of having invested in the Fund. The Board concluded that, in light of the factors discussed above, including the nature, quality and scope of the services provided to the Fund by the Adviser and its affiliates, continuation of the advisory contract was appropriate.
The Board based its decision to approve the advisory and subadvisory contracts on the totality of the circumstances and relevant factors and with a view to past and future long-term considerations. Not all of the factors and considerations identified above were necessarily relevant to the Fund, nor did the Board consider any one of them to be determinative. With respect to the factors that were relevant, the Board's decision to approve the contract reflects its determination that Federated's performance and actions provided a satisfactory basis to support the decision to continue the existing arrangements.
Annual Shareholder Report
Voting Proxies on Fund Portfolio Securities
A description of the policies and procedures that the Fund uses to determine how to vote proxies, if any, relating to securities held in the Fund's portfolio is available, without charge and upon request, by calling 1-800-341-7400. A report on “Form N-PX” of how the Fund voted any such proxies during the most recent 12-month period ended June 30 is available from Federated's website at FederatedInvestors.com. To access this information from the home page, select “All” under “Asset Classes.” Select a fund name and share class, if applicable, to go to the Fund Overview page. On the Fund Overview page, select the “Documents” tab. At the bottom of that page, select “Proxy Voting Record Report (Form N-PX).” Form N-PX filings are also available at the SEC's website at www.sec.gov.
Quarterly Portfolio Schedule
The Fund files with the SEC a complete schedule of its portfolio holdings, as of the close of the first and third quarters of its fiscal year, on “Form N-Q.” These filings are available on the SEC's website at www.sec.gov and may be reviewed and copied at the SEC's Public Reference Room in Washington, DC. (Call 1-800-SEC-0330 for information on the operation of the Public Reference Room.) You may also access this information from the “Products” section of Federated's website at FederatedInvestors.com. From the home page, select “All” under “Asset Classes.” Select a fund name and share class, if applicable, to go to the Fund Overview page. On the Fund Overview page, select the “Documents” tab. At the bottom of that page, select “Form N-Q.”
Annual Shareholder Report
Mutual funds are not bank deposits or obligations, are not guaranteed by any bank and are not insured or guaranteed by the U.S. government, the Federal Deposit Insurance Corporation, the Federal Reserve Board or any other government agency. Investment in mutual funds involves investment risk, including the possible loss of principal.
This Report is authorized for distribution to prospective investors only when preceded or accompanied by the Fund's Prospectus, which contains facts concerning its objective and policies, management fees, expenses and other information.
Federated Kaufmann Fund
Federated Investors Funds
4000 Ericsson Drive
Warrendale, PA 15086-7561
Contact us at FederatedInvestors.com
or call 1-800-341-7400.
Federated Securities Corp., Distributor
CUSIP 314172677
CUSIP 314172669
CUSIP 314172651
26396 (12/12)
Federated is a registered trademark of Federated Investors, Inc.
2012 ©Federated Investors, Inc.
Annual Shareholder Report
October 31, 2012
Federated Kaufmann Fund
Successor to the Kaufmann Fund, Inc., with performance history since February 21, 1986
A Portfolio of Federated Equity Funds
Not FDIC Insured • May Lose Value • No Bank Guarantee
Management's Discussion of Fund Performance (unaudited)
The Fund's total return, based on net asset value, for the 12-month reporting period ended October 31, 2012, was 9.23% for the Class R Shares. The total return of the Fund's benchmark, the Russell Midcap Growth Index (RMCG),1 a broad-based securities market index, was 9.09% for the same period. The Fund's total return for the fiscal year reflected actual cash flows, transaction costs and other expenses which were not reflected in the total return of the RMCG.
The following discussion will focus on the performance of the Fund's Class R Shares.
Market OVERVIEW
As markets continued to digest corporate and macroeconomic results, volatility was evident in global equity markets with weakness corresponding to investor uncertainty during November 2011 and for the first half of the summer of 2012. Subsequently, stock markets rallied significantly posting strong returns throughout the remainder of the fiscal year. The Standard and Poor's 500 Index (S&P 500)2 bottomed in November 2011 and rallied strongly to finish the year up 15.21%. Overall large-cap stocks performed best, followed by mid-cap and small-cap stocks. In terms of investment style, value stocks significantly outperformed growth stocks across all three capitalization groups: small, mid and large.
Market conditions remained volatile and uncertain, with macroeconomic factors and news headlines still showing some progress on economic conditions globally; however, economic indicators can best be described during the reporting period as mixed.
Globally, central banks remained accommodative by keeping interest rates low and continuing the various bond purchase programs to reduce both sovereign and corporate interest rates. While monetary stimulus generally controlled by central banks has remained accommodative to economic growth, fiscal policies globally are being vigorously debated as to the correct balance between stimulating economic growth and reducing deficits.
Fund Performance
The Fund's Class R Shares outperformed the RMCG during the reporting period. Key factors affecting Fund performance included: stock selection, sector weightings and investment in international holdings.3
Regarding stock selection, the companies that were strong performers and contributed most to the Fund's returns during the period were: Apple (+48%), Prada Spa (+64%), Express Scripts Holdings (+35%), Michael Kors (+173%), Amadeus IT Holdings (+33%), Samsonite International (+27%), Dyax Corp. (+122%), Gilead Sciences (+41%) and Verisk Analytics (+45%).
Annual Shareholder Report
The nine worst contributing holdings during the period accounted for a large portion of the weakness in stock selection results: Cetip (-17%), Zynga (-78%), Progenics Pharmaceuticals (-57%), Abercrombie & Fitch (-45%), Expeditors International (-19%), Mongolian Mining (-50%), Tns Inc. (-27%), First Solar (-63%) and Riverbed Technology (-33%).
Regarding sector weightings, a substantial underweighting of Energy and Consumer Staples along with substantial overweights in the Healthcare and Financials sectors relative to the RMCG contributed positively to Fund performance.
The Fund maintained exposure to growth companies outside of the United States. Although stock selection in foreign holdings was generally strong, exposure to Brazil, India and Spain contributed negatively to Fund performance.
The Fund was substantially invested in stocks during the reporting period; however, average holdings of cash equivalents of approximate 4% during the period hurt Fund performance.
| 1 | The Russell Midcap Growth Index measures the performance of the mid-cap growth segment of the U.S. equity universe. It includes those Russell Midcap Index companies with higher price-to-book ratios and higher forecasted growth values. The index is unmanaged, and it is not possible to invest directly in an index. |
| 2 | The S&P 500 Index is a capitalization-weighted index of 500 stocks designed to measure performance of the broad domestic economy through changes in the aggregate market value of 500 stocks representing all major industries. The index is unmanaged, and it is not possible to invest directly in an index. |
| 3 | International investing involves special risks including currency risk, increased volatility, political risks and differences in auditing and other financial standards. |
Annual Shareholder Report
FUND PERFORMANCE AND GROWTH OF A $10,000 INVESTMENT
The Average Annual Total Return table below shows returns for each class averaged over the stated periods. The graphs below illustrate the hypothetical investment of $10,0001 in the Federated Kaufmann Fund (the “Fund”) from October 31, 1997 to October 31, 2012, compared to the Russell Midcap Growth Index (RMCG)2 and the Lipper Multi-Cap Growth Funds Category (LMCGC).2
Average Annual Total Returns for the Period Ended 10/31/2012
| Share Class | 6-Month
(Cumulative) | 1 Year | 3 Years | 5 Years | 10 Years | 15 Years |
| Class R Shares | -2.78% | 9.01% | 8.59% | -3.20% | 8.03% | 6.67% |
| Russell Midcap Growth Index | -2.82% | 9.09% | 15.42% | 1.55% | 10.03% | 6.00% |
| Lipper Multi-Cap Growth Funds Category | -2.56% | 9.36% | 12.34% | -0.58% | 7.54% | 5.24% |
Performance data quoted represents past performance which is no guarantee of future results. Investment return and principal value will fluctuate so that an investor's shares, when redeemed, may be worth more or less than their original cost. Mutual fund performance changes over time and current performance may be lower or higher than what is stated. For current to the most recent month-end performance and after-tax returns, visit FederatedInvestors.com or call 1-800-341-7400. Returns shown do not reflect the deduction of taxes that a shareholder would pay on Fund distributions or the redemption of Fund shares. Mutual funds are not obligations of or guaranteed by any bank and are not federally insured.
Annual Shareholder Report
Growth of a $10,000 Investment–class R shares
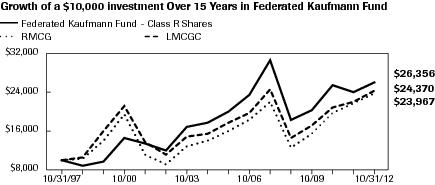
| Federated Kaufmann Fund - Class R Shares | C000026732 | RMCG | LMCGC |
| 10/31/1997 | 10,000 | 10,000 | 10,000 |
| 10/31/1998 | 8,742 | 10,243 | 10,744 |
| 10/31/1999 | 9,716 | 14,101 | 16,209 |
| 10/31/2000 | 14,742 | 19,555 | 21,398 |
| 10/31/2001 | 13,360 | 11,189 | 13,780 |
| 10/31/2002 | 12,169 | 9,218 | 11,282 |
| 10/31/2003 | 16,844 | 12,840 | 14,801 |
| 10/31/2004 | 17,725 | 13,966 | 15,646 |
| 10/31/2005 | 20,251 | 16,188 | 17,713 |
| 10/31/2006 | 23,617 | 18,537 | 19,776 |
| 10/31/2007 | 30,954 | 22,192 | 24,841 |
| 10/31/2008 | 18,501 | 12,727 | 14,741 |
| 10/31/2009 | 20,540 | 15,588 | 17,303 |
| 10/31/2010 | 25,636 | 19,958 | 20,978 |
| 10/31/2011 | 24,129 | 21,970 | 22,285 |
| 10/31/2012 | 26,356 | 23,967 | 24,370 |
41 graphic description end -->
| 1 | Represents a hypothetical investment of $10,000 in the Fund. The ending value of the Fund reflects a 0.20% redemption fee. The Fund's performance assumes the reinvestment of all dividends and distributions. The RMCG and the LMCGC have been adjusted to reflect reinvestment of all dividends on securities in the index and average. |
| 2 | The RMCG is not adjusted to reflect sales charges, expenses or other fees that the Securities and Exchange Commission requires to be reflected in the Fund's performance. The RMCG measures the performance of those Russell Midcap companies with higher price-to-book ratios and higher forecasted growth values. The stocks are also members of the Russell 1000 Growth Index. The LMCGC is an equal dollar-weighted index of the largest mutual funds within the mid-cap growth classification, as defined by Lipper, Inc. The LMCGC does not reflect sales charges and is adjusted for the reinvestment of capital gains and income dividends. The RMCG is unmanaged and, unlike the Fund, is not affected by cash flows. Investments cannot be made in an index or an average. |
Annual Shareholder Report
Portfolio of Investments Summary Table (unaudited)
At October 31, 2012, the Fund's sector composition1 was as follows:
| Sector Composition | Percentage of
Total Net Assets |
| Health Care | 25.5% |
| Financials | 20.1% |
| Information Technology | 17.8% |
| Industrials | 13.3% |
| Consumer Discretionary | 11.7% |
| Materials | 3.7% |
| Consumer Staples | 1.3% |
| Telecommunication Services | 1.1% |
| Utilities | 0.7% |
| Energy | 0.3% |
| Securities Lending Collateral2 | 6.7% |
| Cash Equivalents3 | 4.6% |
| Other Assets and Liabilities—Net4 | (6.8)% |
| TOTAL | 100.0% |
| 1 | Except for Securities Lending Collateral, Cash Equivalents and Other Assets and Liabilities, sector classifications are based upon, and individual portfolio securities are assigned to, the classifications of the Global Industry Classification System (GICS), except that the Adviser assigns a classification to securities not classified by the GICS and to securities for which the Adviser does not have access to the classification made by the GICS. |
| 2 | Cash collateral received from lending portfolio securities, which is invested in short-term investments such as repurchase agreements or money market mutual funds. |
| 3 | Cash Equivalents include any investments in money market mutual funds and/or overnight repurchase agreements other than those representing securities lending collateral. |
| 4 | Assets, other than investments in securities, less liabilities. See Statement of Assets and Liabilities.
|
Annual Shareholder Report
Portfolio of Investments
October 31, 2012
Shares or
Principal
Amount | | | Value |
| | COMMON STOCKS—94.4% | |
| | Consumer Discretionary—11.7% | |
| 1,000,000 | | Arezzo Industria e Comercio SA | $17,847,911 |
| 167,095 | 1 | CDON Group AB | 937,137 |
| 700,000 | | Cia Hering | 16,081,337 |
| 1,469,967 | 2 | D. R. Horton, Inc. | 30,810,508 |
| 1,000,000 | 1 | Del Frisco's Restaurant Group LLC | 14,800,000 |
| 589,000 | 1,3,4 | Inretail Peru Corp. | 11,397,150 |
| 325,000 | | Johnson Controls, Inc. | 8,368,750 |
| 5,000,000 | | L'Occitane International SA | 15,580,545 |
| 1,033,927 | | Las Vegas Sands Corp. | 48,015,570 |
| 1,049,163 | 1,2 | Melco PBL Entertainment (Macau) Ltd., ADR | 15,223,355 |
| 418,746 | 1 | Meritage Corp. | 15,485,227 |
| 1,100,000 | 1,2 | Michael Kors Holdings Ltd. | 60,159,000 |
| 28,448,212 | | NagaCorp Limited | 15,820,775 |
| 871,200 | | National CineMedia, Inc. | 13,468,752 |
| 14,345,000 | | Prada Holding SpA | 117,072,954 |
| 129,500 | | Ralph Lauren Corp. | 19,902,855 |
| 1,254,120 | | Restoque Comercio e Confeccoes de Roupas SA | 5,347,323 |
| 56,060,200 | | Samsonite International SA | 116,459,793 |
| 935,813 | 1,2 | Shutterfly, Inc. | 28,317,701 |
| 300,000 | | Starbucks Corp. | 13,770,000 |
| 98,200 | 1 | Ulta Salon Cosmetics & Fragrance, Inc. | 9,056,004 |
| 2,082,433 | 1,2 | Yoox SpA | 31,499,014 |
| | TOTAL | 625,421,661 |
| | Consumer Staples—1.3% | |
| 1,950,000 | | Almacenes Exito SA | 37,173,983 |
| 1,045,129 | 1 | Amira Nature Food Ltd. | 8,413,288 |
| 600,000 | | ConAgra Foods, Inc. | 16,704,000 |
| 500,000 | 1 | White Wave, Inc. | 8,235,000 |
| | TOTAL | 70,526,271 |
| | Energy—0.3% | |
| 1,012,400 | 1,2 | Gevo, Inc. | 2,045,048 |
| 388,040 | 1 | Linn Co. LLC | 15,090,875 |
| | TOTAL | 17,135,923 |
Annual Shareholder Report
Shares or
Principal
Amount | | | Value |
| | COMMON STOCKS—continued | |
| | Financials—20.0% | |
| 7,500,000 | 1 | American International Group, Inc. | $261,975,000 |
| 884,300 | | Banco BTG Pactual SA | 13,932,498 |
| 300,000 | | BlackRock, Inc. | 56,904,000 |
| 21,638,901 | 5 | CETIP SA-Mercados Organizado | 249,304,686 |
| 19,650,000 | 1 | Direct Line Insurance Group PLC | 61,676,282 |
| 2,655,120 | | EverBank Financial Corp. | 40,464,029 |
| 1 | 1,3,6 | FA Private Equity Fund IV LP | 792,184 |
| 4,239,483 | | Fibra Uno Administracion SA | 11,170,167 |
| 9,964,000 | | Housing Development Finance Corp. Ltd. | 140,425,813 |
| 1 | 1,3,6 | Infrastructure Fund | 0 |
| 2,000,000 | | J.P. Morgan Chase & Co. | 83,360,000 |
| 2,068,390 | | LPS Brasil Cons De Imoveis | 35,541,622 |
| 800,000 | | Multiplan Empreendimentos Imobiliarios SA | 23,436,153 |
| 1 | 3,6 | Peachtree Leadscope LLC, Class A and B | 0 |
| 1 | 1,3,6 | Peachtree Leadscope LLC, Class C | 1,500,000 |
| 437,420 | 1 | Spirit Realty Capital, Inc. | 7,147,443 |
| 2,385,000 | | Wells Fargo & Co. | 80,350,650 |
| | TOTAL | 1,067,980,527 |
| | Health Care—24.5% | |
| 3,296,513 | 1 | Alkermes, Inc. | 61,084,386 |
| 600,000 | | Allergan, Inc. | 53,952,000 |
| 900,000 | 1,2 | Amarin Corporation PLC, ADR | 10,602,000 |
| 1 | 3,6 | Apollo Investment Fund V | 3,060,493 |
| 446,500 | 1 | Biogen Idec, Inc. | 61,715,230 |
| 185,980 | 1 | Chindex International, Inc. | 1,928,613 |
| 1,725,460 | 1,2,3,5 | Conceptus, Inc. | 32,507,666 |
| 9,430,000 | 1,5 | Corcept Therapeutics, Inc. | 23,575,000 |
| 2,500,000 | 1,2 | Cubist Pharmaceuticals, Inc. | 107,250,000 |
| 1 | 3,6 | Denovo Ventures I LP | 507,529 |
| 7,500,000 | 1,2,5 | Dexcom, Inc. | 98,250,000 |
| 126,065 | 1,5 | Dexcom, Inc. | 1,651,452 |
| 17,962,000 | 1,5 | Dyax Corp. | 53,886,000 |
| 2,497,500 | 1,2 | Dynavax Technologies Corp. | 10,339,650 |
| 3,920,000 | 1,2,5 | ExamWorks Group, Inc. | 54,958,400 |
| 2,600,000 | 1 | Express Scripts Holding Co. | 160,004,000 |
| 1,310,000 | 1 | Gilead Sciences, Inc. | 87,979,600 |
| 100,000 | 1,2 | Heartware International, Inc. | 8,398,000 |
Annual Shareholder Report
Shares or
Principal
Amount | | | Value |
| | COMMON STOCKS—continued | |
| | Health Care—continued | |
| 250,000 | 1 | Hologic, Inc. | $5,155,000 |
| 2,383,454 | 1,2,5 | Insulet Corp. | 50,553,059 |
| 1 | 3,6 | Latin Healthcare Fund | 308,335 |
| 4,662,442 | 1,2 | Nektar Therapeutics | 41,961,978 |
| 1 | 3,6 | Peachtree Velquest | 337,700 |
| 5,246,193 | 1,5 | Progenics Pharmaceuticals, Inc. | 14,951,650 |
| 6,706,495 | 1,2,5 | Protalix Biotherapeutics, Inc. | 32,392,371 |
| 332,200 | 1 | Puma Biotechnology, Inc. | 6,843,320 |
| 182,400 | 1 | Regeneron Pharmaceuticals, Inc. | 25,955,520 |
| 2,700,000 | 1,5 | Repligen Corp. | 13,770,000 |
| 1,952,726 | 1 | Salix Pharmaceuticals Ltd. | 76,234,423 |
| 1,150,000 | 1,2 | Seattle Genetics, Inc. | 28,934,000 |
| 959,018 | 1,5,6 | Soteira, Inc. | 0 |
| 1,767,000 | 1,2 | Threshold Pharmaceuticals, Inc., Class THL | 7,262,370 |
| 3,000,000 | 1,2 | Vical, Inc. | 10,230,000 |
| 615,000 | 1,2 | Vivus, Inc. | 9,163,500 |
| 5,566,264 | 1 | Warner Chilcott PLC | 64,457,337 |
| 610,000 | 1 | Watson Pharmaceuticals, Inc. | 52,429,500 |
| 16,500,000 | 1,5 | Zogenix, Inc. | 40,260,000 |
| | TOTAL | 1,312,850,082 |
| | Industrials—13.3% | |
| 1,600,000 | 2 | Chicago Bridge & Iron Co., N.V. | 60,080,000 |
| 100,000 | | Cummins, Inc. | 9,358,000 |
| 991,300 | | Danaher Corp. | 51,279,949 |
| 1,700,000 | | Expeditors International Washington, Inc. | 62,237,000 |
| 322,100 | 1 | IHS, Inc., Class A | 27,182,019 |
| 658,400 | | Kansas City Southern Industries, Inc. | 52,974,864 |
| 131,900 | | Kuehne & Nagel International AG | 15,395,179 |
| 2,532,900 | 1,2 | MRC Global, Inc. | 61,929,405 |
| 498,500 | | MSC Industrial Direct Co. | 37,188,100 |
| 200,000 | 1 | Old Dominion Freight Lines, Inc. | 6,708,000 |
| 800,000 | 1 | Owens Corning, Inc. | 26,872,000 |
| 215,000 | | Precision Castparts Corp. | 37,210,050 |
| 1,200,000 | 1 | Quanta Services, Inc. | 31,116,000 |
| 2,421,000 | 1 | RPX Corp. | 25,493,130 |
| 586,100 | | Ryder System, Inc. | 26,444,832 |
| 1,345,000 | 1 | Spirit Airlines, Inc. | 23,604,750 |
Annual Shareholder Report
Shares or
Principal
Amount | | | Value |
| | COMMON STOCKS—continued | |
| | Industrials—continued | |
| 255,000 | 1 | Teledyne Technologies, Inc. | $16,327,650 |
| 1,700,000 | | Trinity Industries, Inc. | 53,176,000 |
| 1,500,000 | 1 | Verisk Analytics, Inc. | 76,500,000 |
| 161,000 | | Wabtec Corp. | 13,185,900 |
| | TOTAL | 714,262,828 |
| | Information Technology—17.8% | |
| 4,850,000 | | Amadeus IT Holding SA | 120,068,800 |
| 150,000 | | Apple, Inc. | 89,265,000 |
| 1,345,000 | | Avago Technologies Ltd. | 44,425,350 |
| 557,700 | 1 | Check Point Software Technologies Ltd. | 24,834,381 |
| 427,500 | 1 | Citrix Systems, Inc. | 26,423,775 |
| 2,800,000 | 1 | Comverse Technology, Inc. | 18,452,000 |
| 568,008 | 1 | CoStar Group, Inc. | 47,087,863 |
| 200,000 | 1,2 | Demandware, Inc. | 5,938,000 |
| 1,106,900 | 1 | eBay, Inc. | 53,452,201 |
| 367,397 | 1 | Eloqua, Inc. | 8,571,372 |
| 1,059,322 | 3,6 | Expand Networks Ltd. | 0 |
| 437,000 | 1,2 | IPG Photonics Corp. | 23,195,960 |
| 50,000 | 1 | LinkedIn Corp. | 5,346,500 |
| 208,000 | 1 | Mail.RU Group Ltd., GDR | 6,936,800 |
| 745,773 | 1,3,4 | Mail.RU Group Ltd., Series 144A, GDR | 24,871,530 |
| 165,293 | 2 | Mercadolibre, Inc. | 13,879,653 |
| 3,242,710 | 1 | Microsemi Corp. | 62,260,032 |
| 1,710,000 | 1 | Moneygram International, Inc. | 26,573,400 |
| 1,710,000 | 1 | NCR Corp. | 36,388,800 |
| 1,941,790 | 1 | NIC, Inc. | 27,767,597 |
| 2,375,000 | 1 | NXP Semiconductors NV | 57,617,500 |
| 1 | 3,6 | Peachtree Open Networks | 0 |
| 700,000 | | Qualcomm, Inc. | 41,002,500 |
| 794,110 | 1 | RADWARE Ltd. | 26,046,808 |
| 1,211,300 | 1 | Riverbed Technology, Inc. | 22,372,711 |
| 401,250 | 1,2 | STR Holdings, Inc. | 862,687 |
| 3,751 | 3,5,6 | Sensable Technologies, Inc. | 0 |
| 2,690,069 | 1,5 | TNS, Inc. | 38,521,788 |
| 1,025,000 | 1,2 | The Active Network, Inc. | 9,081,500 |
| 345,419 | 1 | Tyler Technologies, Inc. | 16,514,482 |
| 237,500 | 1 | VMware, Inc., Class A | 20,132,875 |
Annual Shareholder Report
Shares or
Principal
Amount | | | Value |
| | COMMON STOCKS—continued | |
| | Information Technology—continued | |
| 2,189,360 | 1 | Vantiv, Inc. | $44,181,285 |
| 4,000,000 | 1,2 | Zynga, Inc. | 9,000,000 |
| | TOTAL | 951,073,150 |
| | Materials—3.7% | |
| 1,046,107 | | Eagle Materials, Inc. | 55,412,288 |
| 600,000 | | LyondellBasell Industries NV | 32,034,000 |
| 591,800 | | Reliance Steel & Aluminum Co. | 32,158,412 |
| 842,400 | | Sociedad Quimica Y Minera de Chile, ADR | 48,732,840 |
| 400,000 | 2 | Westlake Chemical Corp. | 30,424,000 |
| | TOTAL | 198,761,540 |
| | Telecommunication Services—1.1% | |
| 2,364,755 | 1,2 | TW Telecom, Inc. | 60,230,310 |
| | Utilities—0.7% | |
| 475,000 | 2 | ITC Holdings Corp. | 37,819,500 |
| | TOTAL COMMON STOCKS
(IDENTIFIED COST $3,841,191,437) | 5,056,061,792 |
| | WARRANTS—0.4% | |
| | Health Care—0.4% | |
| 382,897 | 1 | Alexza Pharmaceuticals, Inc., 10/05/2016 | 187,734 |
| 797,358 | 1,5 | Corcept Therapeutics, Inc., 3/29/2015 | 431,131 |
| 857,143 | 1 | Cyclacel Pharmaceuticals, Inc., 4/28/2013 | 203,486 |
| 242,091 | 1 | Cyclacel Pharmaceuticals, Inc., 2/17/2014 | 80,858 |
| 2,750,000 | 1 | Dynavax Technologies Corp., 4/16/2015 | 9,795,775 |
| 1,042,038 | 1 | Favrille, Inc., 11/07/2012 | 0 |
| 1,713,798 | 1 | Threshold Pharmaceuticals, Inc., 10/05/2014 | 4,709,860 |
| 7,425,000 | 1,5,6 | Zogenix, Inc., 7/27/2017 | 3,897,383 |
| | TOTAL WARRANTS
(IDENTIFIED COST $842,911) | 19,306,227 |
| | Preferred Stocks—0.0% | |
| | Information Technology—0.0% | |
| 679,348 | 1,3,6 | Multiplex, Inc., Pfd., Series C (IDENTIFIED COST $4,998,976) | 0 |
| | Corporate Bonds—0.7% | |
| | Financials—0.1% | |
| $5,435,000 | 3,4 | TICC Capital Corp., Conv. Bond, Series 144A, 7.50%, 11/1/2017 | 5,509,677 |
| | Health Care—0.6% | |
| 14,630,000 | 5 | Insulet Corp., Conv. Bond, 3.75%, 6/15/2016 | 16,263,732 |
Annual Shareholder Report
Shares or
Principal
Amount | | | Value |
| | Corporate Bonds—continued | |
| | Health Care—continued | |
| $12,670,000 | 5 | Insulet Corp., Conv. Bond, 5.375%, 6/15/2013 | $15,505,166 |
| | TOTAL | 31,768,898 |
| | TOTAL CORPORATE BONDS
(IDENTIFIED COST $32,735,000) | 37,278,575 |
| | MUTUAL FUND—11.3% | |
| 606,024,453 | 5,7,8 | Federated Prime Value Obligations Fund, Institutional Shares, 0.16%
(AT NET ASSET VALUE) | 606,024,453 |
| | TOTAL INVESTMENTS—106.8%
(IDENTIFIED COST $4,485,792,777)9 | 5,718,671,047 |
| | OTHER ASSETS AND LIABILITIES - NET—(6.8)%10 | (364,119,130) |
| | TOTAL NET ASSETS—100% | $5,354,551,917 |
At October 31, 2012, the Fund had the following outstanding foreign exchange contracts:
| Settlement Date | Foreign
Currency
Units to
Receive | In
Exchange
For | Unrealized
Depreciation |
| Contracts Sold: |
| 11/5/2012 | 585,052 Brazilian Real | $287,636 | $(418) |
Unrealized Depreciation on Foreign Exchange Contracts is included in “Other Assets and Liabilities—Net.”
| 1 | Non-income producing security. |
| 2 | All or a portion of these securities are temporarily on loan to unaffiliated broker/dealers. |
| 3 | Denotes a restricted security that either: (a) cannot be offered for public sale without first being registered, or being able to take advantage of an exemption from registration, under the Securities Act of 1933; or (b) is subject to a contractual restriction on public sales. At October 31, 2012, these restricted securities amounted to $80,792,264, which represented 1.5% of total net assets. |
| 4 | Denotes a restricted security that may be resold without restriction to “qualified institutional buyers” as defined in Rule 144A under the Securities Act of 1933 and that the Fund has determined to be liquid under criteria established by the Fund's Board of Trustees (the “Trustees”). At October 31, 2012, these liquid restricted securities amounted to $41,778,357, which represented 0.8% of total net assets. |
| 5 | Affiliated companies and holdings. |
| 6 | Market quotations and price evaluations are not available. Fair value determined in accordance with procedures established by and under the general supervision of the Trustees. |
| 7 | 7-Day net yield. |
| 8 | All or a portion of this security is held as collateral for securities lending. |
| 9 | The cost of investments for federal tax purposes amounts to $4,524,980,534. |
| 10 | Assets, other than investments in securities, less liabilities. See Statement of Assets and Liabilities. |
Note: The categories of investments are shown as a percentage of total net assets at October 31, 2012.
Annual Shareholder Report
Various inputs are used in determining the value of the Fund's investments. These inputs are summarized in the three broad levels listed below:
Level 1—quoted prices in active markets for identical securities, including investment companies with daily net asset values, if applicable.
Level 2—other significant observable inputs (including quoted prices for similar securities, interest rates, prepayment speeds, credit risk, etc.). Also includes securities valued at amortized cost.
Level 3—significant unobservable inputs (including the Fund's own assumptions in determining the fair value of investments).
The inputs or methodology used for valuing securities are not an indication of the risk associated with investing in those securities.
The following is a summary of the inputs used, as of October 31, 2012, in valuing the Fund's assets carried at fair value:
| Valuation Inputs |
| Level 1—
Quoted
Prices and
Investments in
Mutual Funds | Level 2—
Other
Significant
Observable
Inputs | Level 3—
Significant
Unobservable
Inputs | Total |
| Equity Securities: | | | | |
| Common Stocks | | | | |
| Domestic | $3,447,867,854 | $— | $6,506,241 | $3,454,374,095 |
| International | 1,565,419,0171 | 36,268,680 | — | 1,601,687,697 |
| Preferred Stocks | | | | |
| Domestic | — | — | 0 | 0 |
| Debt Securities: | | | | |
| Corporate Bonds | — | 37,278,575 | — | 37,278,575 |
| Warrants | — | 15,408,844 | 3,897,383 | 19,306,227 |
| Mutual Fund | 606,024,453 | — | — | 606,024,453 |
| TOTAL SECURITIES | $5,619,311,324 | $88,956,099 | $10,403,624 | $5,718,671,047 |
OTHER FINANCIAL
INSTRUMENTS2 | $(418) | $— | $— | $(418) |
| 1 | Includes $498,908,068 of securities transferred from Level 2 to Level 1 because quoted prices on equity securities for which fair value factors were previously applied to account for significant post market close activity. Transfers shown represent the value of the securities at the beginning of the period. |
| 2 | Other financial instruments include foreign exchange contracts. |
The following acronyms are used throughout this portfolio:
| ADR | —American Depositary Receipt |
| GDR | —Global Depository Receipt |
See Notes which are an integral part of the Financial Statements
Annual Shareholder Report
Financial Highlights–Class R Shares
(For a Share Outstanding Throughout Each Period)
| Year Ended October 31 | 2012 | 2011 | 2010 | 2009 | 2008 |
| Net Asset Value, Beginning of Period | $4.93 | $5.27 | $4.23 | $3.81 | $7.03 |
| Income From Investment Operations: | | | | | |
| Net investment income (loss) | (0.05)1 | (0.05)1 | 0.021 | (0.00)1,2 | (0.03)1 |
| Net realized and unrealized gain (loss) on investments, written options, futures contracts, short sales and foreign currency transactions | 0.49 | (0.26) | 1.03 | 0.42 | (2.56) |
| TOTAL FROM INVESTMENT OPERATIONS | 0.44 | (0.31) | 1.05 | 0.42 | (2.59) |
| Less Distributions: | | | | | |
| Distributions from net investment income | — | (0.03) | (0.01) | — | — |
| Distributions from net realized gain on investments and foreign currency transactions | (0.09) | (0.00)2 | — | — | (0.63) |
| TOTAL DISTRIBUTIONS | (0.09) | (0.03) | (0.01) | — | (0.63) |
| Net Asset Value, End of Period | $5.28 | $4.93 | $5.27 | $4.23 | $3.81 |
| Total Return3 | 9.23% | (5.88)% | 24.81% | 11.02% | (40.23)% |
| Ratios to Average Net Assets: | | | | | |
| Net expenses | 1.95%4 | 1.95%4 | 1.95%4 | 1.95%4 | 1.95%4 |
| Net expenses excluding dividends and other expenses related to short sales | 1.95%4 | 1.95%4 | 1.95%4 | 1.95%4 | 1.95%4 |
| Net investment income (loss) | (0.97)% | (0.99)% | 0.39% | (0.12)% | (0.56)% |
| Expense waiver/reimbursement5 | 0.52% | 0.54% | 0.54% | 0.53% | 0.49% |
| Supplemental Data: | | | | | |
| Net assets, end of period (000 omitted) | $2,878,476 | $3,001,225 | $3,621,789 | $3,168,922 | $3,051,697 |
| Portfolio turnover | 61% | 64% | 54% | 91% | 78% |
| 1 | Per share numbers have been calculated using the average shares method. |
| 2 | Represents less than $0.01. |
| 3 | Based on net asset value, which does not reflect the sales charge, redemption fee or contingent deferred sales charge, if applicable. |
| 4 | The net expense ratio is calculated without reduction for fees paid indirectly for expense offset arrangements. The net expense ratios are 1.95%, 1.95%, 1.95%, 1.95% and 1.95% after taking into account these expense reductions for the years ended October 31, 2012, 2011, 2010, 2009 and 2008, respectively. The net expense ratios excluding dividends and other expenses related to short sales are also calculated without reduction for these fees paid indirectly for expense offset arrangements. |
| 5 | This expense decrease is reflected in both the net expense and the net investment income (loss) ratios shown above. |
See Notes which are an integral part of the Financial Statements
Annual Shareholder Report
Statement of Assets and Liabilities
October 31, 2012
| Assets: | | |
| Total investment in securities, at value including $341,527,111 of securities loaned, $606,024,453 of investment in an affiliated holding and $740,679,484 of investment in affiliated companies (Note 5) (identified cost $4,485,792,777) | | $5,718,671,047 |
| Cash | | 1,239,085 |
| Cash denominated in foreign currencies (identified cost $239,741) | | 238,252 |
| Income receivable | | 1,338,736 |
| Receivable for investments sold | | 5,092,808 |
| Receivable for shares sold | | 5,298,455 |
| TOTAL ASSETS | | 5,731,878,383 |
| Liabilities: | | |
| Payable for investments purchased | $1,975,329 | |
| Payable for shares redeemed | 9,601,973 | |
| Unrealized depreciation on foreign exchange contracts | 418 | |
| Payable for collateral due to broker for securities lending | 357,289,183 | |
| Payable for capital gains taxes withheld | 2,377,370 | |
| Payable to adviser (Note 5) | 2,813 | |
| Payable for transfer and dividend disbursing agent fees and expenses | 1,577,489 | |
| Payable for distribution services fee (Note 5) | 1,027,715 | |
| Payable for shareholder services fee (Note 5) | 2,993,037 | |
| Accrued expenses | 481,139 | |
| TOTAL LIABILITIES | | 377,326,466 |
| Net assets for 1,021,453,073 shares outstanding | | $5,354,551,917 |
| Net Assets Consist of: | | |
| Paid-in capital | | $3,794,677,859 |
| Net unrealized appreciation of investments and translation of assets and liabilities in foreign currency | | 1,231,853,600 |
| Accumulated net realized gain on investments, futures contracts and foreign currency transactions | | 380,357,765 |
| Accumulated net investment income (loss) | | (52,337,307) |
| TOTAL NET ASSETS | | $5,354,551,917 |
Annual Shareholder Report
Statement of Assets and Liabilities–continued
| Net Asset Value, Offering Price and Redemption Proceeds Per Share | | |
| Class A Shares: | | |
| Net asset value per share ($1,898,464,628 ÷ 359,643,018 shares outstanding), no par value, unlimited shares authorized | | $5.28 |
| Offering price per share (100/94.50 of $5.28) | | $5.59 |
| Redemption proceeds per share | | $5.28 |
| Class B Shares: | | |
| Net asset value per share ($184,725,569 ÷ 37,370,779 shares outstanding), no par value, unlimited shares authorized | | $4.94 |
| Offering price per share | | $4.94 |
| Redemption proceeds per share (94.50/100 of $4.94) | | $4.67 |
| Class C Shares: | | |
| Net asset value per share ($392,885,512 ÷ 79,516,914 shares outstanding), no par value, unlimited shares authorized | | $4.94 |
| Offering price per share | | $4.94 |
| Redemption proceeds per share (99.00/100 of $4.94) | | $4.89 |
| Class R Shares: | | |
| Net asset value per share ($2,878,476,208 ÷ 544,922,362 shares outstanding), no par value, unlimited shares authorized | | $5.28 |
| Offering price per share | | $5.28 |
| Redemption proceeds per share (99.80/100 of $5.28) | | $5.27 |
See Notes which are an integral part of the Financial Statements
Annual Shareholder Report
Statement of Operations
Year Ended October 31, 2012
| Investment Income: | | | |
| Dividends (including $425,415 received from an affiliated holding and $3,722,843 received from affiliated companies (Note 5) and net of foreign taxes withheld of $1,359,123) | | | $49,867,028 |
| Interest (including income on securities loaned of $3,735,036) | | | 5,001,950 |
| TOTAL INCOME | | | 54,868,978 |
| Expenses: | | | |
| Investment adviser fee (Note 5) | | $79,799,496 | |
| Administrative fee (Note 5) | | 4,368,815 | |
| Custodian fees | | 2,646,662 | |
| Transfer and dividend disbursing agent fees and expenses (Note 2) | | 8,776,850 | |
| Directors'/Trustees' fees | | 32,594 | |
| Auditing fees | | 38,050 | |
| Legal fees | | 6,445 | |
| Portfolio accounting fees | | 208,604 | |
| Distribution services fee (Note 5) | | 24,853,578 | |
| Shareholder services fee (Note 5) | | 13,935,603 | |
| Account administration fee (Note 2) | | 26,755 | |
| Share registration costs | | 88,709 | |
| Printing and postage | | 422,668 | |
| Insurance premiums | | 10,025 | |
| Miscellaneous | | 39,717 | |
| Interest expense | | 1,115 | |
| TOTAL EXPENSES | | 135,255,686 | |
Annual Shareholder Report
Statement of Operations–continued
| Waiver, Reimbursements and Reduction: | | | |
| Waiver/reimbursement of investment adviser fee (Note 5) | $(8,399,947) | | |
| Waiver of administrative fee (Note 5) | (88,804) | | |
| Waiver of distribution services fee (Note 5) | (13,386,552) | | |
| Reimbursement of shareholder services fee (Note 5) | (178,397) | | |
| Fees paid indirectly from directed brokerage arrangements (Note 6) | (67,170) | | |
| TOTAL WAIVERS, REIMBURSEMENTS AND REDUCTION | | $(22,120,870) | |
| Net expenses | | | $113,134,816 |
| Net investment income (loss) | | | (58,265,838) |
| Realized and Unrealized Gain on Investments and Foreign Currency Transactions: | | | |
| Net realized gain on investments and foreign currency transactions (including realized gain of $91,370,979 in sales of investments in affiliated companies (Note 5)) | | | 420,311,646 |
| Net change in unrealized appreciation of investments and translation of assets and liabilities in foreign currency (including foreign taxes withheld of $1,125,704) | | | 140,388,725 |
| Net realized and unrealized gain on investments and foreign currency transactions | | | 560,700,371 |
| Change in net assets resulting from operations | | | $502,434,533 |
See Notes which are an integral part of the Financial Statements
Annual Shareholder Report
Statement of Changes in Net Assets
| Year Ended October 31 | 2012 | 2011 |
| Increase (Decrease) in Net Assets | | |
| Operations: | | |
| Net investment income (loss) | $(58,265,838) | $(73,289,475) |
| Net realized gain on investments and foreign currency transactions | 420,311,646 | 845,883,977 |
| Net change in unrealized appreciation/depreciation of investments and translation of assets and liabilities in foreign currency | 140,388,725 | (1,116,013,448) |
| CHANGE IN NET ASSETS RESULTING FROM OPERATIONS | 502,434,533 | (343,418,946) |
| Distributions to Shareholders: | | |
| Distributions from net investment income | | |
| Class A Shares | — | (15,556,814) |
| Class B Shares | — | (253,171) |
| Class C Shares | — | (803,794) |
| Class R Shares | — | (22,840,571) |
| Distributions from net realized gain on investments | | |
| Class A Shares | (37,360,604) | (19,173) |
| Class B Shares | (5,896,217) | (312) |
| Class C Shares | (9,766,246) | (991) |
| Class R Shares | (56,939,036) | (28,151) |
| CHANGE IN NET ASSETS RESULTING FROM DISTRIBUTIONS TO SHAREHOLDERS | (109,962,103) | (39,502,977) |
| Share Transactions: | | |
| Proceeds from sale of shares | 695,512,067 | 763,905,692 |
| Net asset value of shares issued to shareholders in payment of distributions declared | 103,024,246 | 36,595,371 |
| Cost of shares redeemed | (1,633,547,746) | (1,865,805,782) |
| CHANGE IN NET ASSETS RESULTING FROM SHARE TRANSACTIONS | (835,011,433) | (1,065,304,719) |
| Change in net assets | (442,539,003) | (1,448,226,642) |
| Net Assets: | | |
| Beginning of period | 5,797,090,920 | 7,245,317,562 |
| End of period (including accumulated net investment income (loss)/undistributed net investment income of $(52,337,307) and $0, respectively) | $5,354,551,917 | $5,797,090,920 |
See Notes which are an integral part of the Financial Statements
Annual Shareholder Report
Notes to Financial Statements
October 31, 2012
1. ORGANIZATION
Federated Equity Funds (the “Trust”) is registered under the Investment Company Act of 1940, as amended (the “Act”), as an open-end management investment company. The Trust consists of 13 diversified portfolios. The financial statements included herein are only those of Federated Kaufmann Fund (the “Fund”), a diversified portfolio. The financial statements of the other portfolios are presented separately. The assets of each portfolio are segregated and a shareholder's interest is limited to the portfolio in which shares are held. Each portfolio pays its own expenses. The Fund offers four classes of shares: Class A Shares, Class B Shares, Class C Shares and Class R Shares. All shares of the Fund have equal rights with respect to voting, except on class-specific matters. The financial highlights of the Class A Shares, Class B Shares and Class C Shares are presented separately. The investment objective of the Fund is to provide capital appreciation.
2. SIGNIFICANT ACCOUNTING POLICIES
The following is a summary of significant accounting policies consistently followed by the Fund in the preparation of its financial statements. These policies are in conformity with U.S. generally accepted accounting principles (GAAP).
Investment Valuation
In calculating its net asset value (NAV), the Fund generally values investments as follows:
| ■ | Equity securities listed on an exchange or traded through a regulated market system are valued at their last reported sale price or official closing price in their principal exchange or market. |
| ■ | Shares of other mutual funds are valued based upon their reported NAVs. |
| ■ | Fixed-income securities acquired with remaining maturities greater than 60 days are fair valued using price evaluations provided by a pricing service approved by the Trustees. |
| ■ | Fixed-income securities acquired with remaining maturities of 60 days or less are valued at their cost (adjusted for the accretion of any discount or amortization of any premium), which approximates market value. |
| ■ | Derivative contracts listed on exchanges are valued at their reported settlement or closing price. |
| ■ | Over-the-counter (OTC) derivative contracts are fair valued using price evaluations provided by a pricing service approved by the Trustees. |
| ■ | For securities that are fair valued in accordance with procedures established by and under the general supervision of the Trustees, certain factors may be considered such as: the purchase price of the security, information obtained by contacting the issuer, analysis of the issuer's financial statements or other available documents, fundamental analytical data, the nature and duration of restrictions on disposition, the movement of the market in which the security is normally traded and public trading in similar securities of the issuer or comparable issuers. |
Annual Shareholder Report
If the Fund cannot obtain a price or price evaluation from a pricing service for an investment, the Fund may attempt to value the investment based upon the mean of bid and asked quotations or fair value the investment based on price evaluations, from one or more dealers. If any price, quotation, price evaluation or other pricing source is not readily available when the NAV is calculated, the Fund uses the fair value of the investment determined in accordance with the procedures described below. There can be no assurance that the Fund could purchase or sell an investment at the price used to calculate the Fund's NAV.
Fair Valuation and Significant Events Procedures
The Trustees have appointed a Valuation Committee comprised of officers of the Fund, Federated Equity Management Company of Pennsylvania (“Adviser”) and the Adviser's affiliated companies to determine fair value of securities and in overseeing the calculation of the NAV. The Trustees have also authorized the use of pricing services recommended by the Valuation Committee to provide fair value evaluations of the current value of certain investments for purposes of calculating the NAV. The Valuation Committee employs various methods for reviewing third-party pricing service evaluations including periodic reviews of third-party pricing services' policies, procedures and valuation methods (including key inputs and assumptions), transactional back-testing, comparisons of evaluations of different pricing services, and review of price challenges by the Adviser based on recent market activity. In the event that market quotations and price evaluations are not available for an investment, the Valuation Committee determines the fair value of the investment in accordance with procedures adopted by the Trustees. The Trustees periodically review and approve the fair valuations made by the Valuation Committee and any changes made to the procedures.
Factors considered by pricing services in evaluating an investment include the yields or prices of investments of comparable quality, coupon, maturity, call rights and other potential prepayments, terms and type, reported transactions, indications as to values from dealers and general market conditions. Some pricing services provide a single price evaluation reflecting the bid-side of the market for an investment (a “bid” evaluation). Other pricing services offer both bid evaluations and price evaluations indicative of a price between the prices bid and asked for the investment (a “mid” evaluation). The Fund normally uses bid evaluations for U.S. Treasury and Agency securities. The Fund normally uses mid evaluations for other types of fixed-income securities and OTC derivative contracts. In the event that market quotations and price evaluations are not available for an investment, the fair value of the investment is determined in accordance with procedures adopted by the Trustees.
The Trustees also have adopted procedures requiring an investment to be priced at its fair value whenever the Adviser determines that a significant event affecting the value of the investment has occurred between the time as of which the price of the investment would otherwise be determined and the time as of which the NAV is computed. An event is considered significant if there is both an affirmative expectation that the investment's value will change in response to the event and a reasonable basis for quantifying the resulting change in value. Examples of significant events that may occur after the close of the principal market on which a security is traded, or after the time of a price evaluation provided by a pricing service or a dealer, include:
| ■ | With respect to securities traded in foreign markets, significant trends in U.S. equity markets or in the trading of foreign securities index futures contracts; |
| ■ | Political or other developments affecting the economy or markets in which an issuer conducts its operations or its securities are traded; and |
Annual Shareholder Report
| ■ | Announcements concerning matters such as acquisitions, recapitalizations, litigation developments, a natural disaster affecting the issuer's operations or regulatory changes or market developments affecting the issuer's industry. |
The Trustees have approved the use of a pricing service to determine the fair value of equity securities traded principally in foreign markets when the Adviser determines that there has been a significant trend in the U.S. equity markets or in index futures trading. For other significant events, the Fund may seek to obtain more current quotations or price evaluations from alternative pricing sources. If a reliable alternative pricing source is not available, the Fund will determine the fair value of the investment using another method approved by the Trustees.
Repurchase Agreements
The Fund may invest in repurchase agreements for short-term liquidity purposes. It is the policy of the Fund to require the other party to a repurchase agreement to transfer to the Fund's custodian or sub-custodian eligible securities or cash with a market value (after transaction costs) at least equal to the repurchase price to be paid under the repurchase agreement. The eligible securities are transferred to accounts with the custodian or sub-custodian in which the Fund holds a “securities entitlement” and exercises “control” as those terms are defined in the Uniform Commercial Code. The Fund has established procedures for monitoring the market value of the transferred securities and requiring the transfer of additional eligible securities if necessary to equal at least the repurchase price. These procedures also allow the other party to require securities to be transferred from the account to the extent that their market value exceeds the repurchase price or in exchange for other eligible securities of equivalent market value.
The insolvency of the other party or other failure to repurchase the securities may delay the disposition of the underlying securities or cause the Fund to receive less than the full repurchase price. Under the terms of the repurchase agreement, any amounts received by the Fund in excess of the repurchase price and related transaction costs must be remitted to the other party.
The Fund may enter into repurchase agreements in which eligible securities are transferred into joint trading accounts maintained by the custodian or sub-custodian for investment companies and other clients advised by the Fund's Adviser and its affiliates. The Fund will participate on a pro rata basis with the other investment companies and clients in its share of the securities transferred under such repurchase agreements and in its share of proceeds from any repurchase or other disposition of such securities.
Annual Shareholder Report
Investment Income, Gains and Losses, Expenses and Distributions
Investment transactions are accounted for on a trade-date basis. Realized gains and losses from investment transactions are recorded on an identified-cost basis. Interest income and expenses are accrued daily. Dividend income and distributions to shareholders are recorded on the ex-dividend date. Foreign dividends are recorded on the ex-dividend date or when the Fund is informed of the ex-dividend date. Distributions of net investment income, if any, are declared and paid annually. Non-cash dividends included in dividend income, if any, are recorded at fair value. Investment income, realized and unrealized gains and losses, and certain fund-level expenses are allocated to each class based on relative average daily net assets, except that Class A Shares, Class B Shares, Class C Shares and Class R Shares may bear distribution services fees, shareholder services fees, account administration fees and certain transfer and dividend disbursing agent fees unique to those classes. For the year ended October 31, 2012, transfer and dividend disbursing agent fees and account administration fees for the Fund were as follows:
| Transfer and
Dividend
Disbursing
Agent Fees
Incurred | Account
Administration
Fees Incurred |
| Class A Shares | $3,165,502 | $24,410 |
| Class B Shares | 396,052 | — |
| Class C Shares | 722,106 | 2,345 |
| Class R Shares | 4,493,190 | — |
| TOTAL | $8,776,850 | $26,755 |
Dividends are declared separately for each class. No class has preferential dividend rights; differences in per share dividend rates are generally due to differences in separate class expenses.
Premium and Discount Amortization
All premiums and discounts on fixed-income securities are amortized/accreted using the effective interest rate method.
Federal Taxes
It is the Fund's policy to comply with the Subchapter M provision of the Internal Revenue Code and to distribute to shareholders each year substantially all of its income. Accordingly, no provision for federal income tax is necessary. As of and during the year ended October 31, 2012, the Fund did not have a liability for any uncertain tax positions. The Fund recognizes interest and penalties, if any, related to tax liabilities as income tax expense in the Statement of Operations. As of October 31, 2012, tax years 2009 through 2012 remain subject to examination by the Fund's major tax jurisdictions, which include the United States of America and the Commonwealth of Massachusetts.
The Fund may be subject to taxes imposed by governments of countries in which it invests. Such taxes are generally based on either income or gains earned or repatriated. The Fund accrues and applies such taxes to net investment income, net realized gains and net unrealized gains as income and/or gains are earned.
Annual Shareholder Report
When-Issued and Delayed Delivery Transactions
The Fund may engage in when-issued or delayed delivery transactions. The Fund records when-issued securities on the trade date and maintains security positions such that sufficient liquid assets will be available to make payment for the securities purchased. Securities purchased on a when-issued or delayed delivery basis are marked to market daily and begin earning interest on the settlement date. Losses may occur on these transactions due to changes in market conditions or the failure of counterparties to perform under the contract.
Foreign Exchange Contracts
The Fund enters into foreign exchange contracts for the delayed delivery of securities or foreign currency exchange transactions. The Fund enters into foreign exchange contracts to protect assets against adverse changes in foreign currency exchange rates or exchange control regulations. Purchased contracts are used to acquire exposure to foreign currencies, whereas, contracts to sell are used to hedge the Fund's securities against currency fluctuations. Risks may arise upon entering into these transactions from the potential inability of counterparties to meet the terms of their commitments and from unanticipated movements in security prices or foreign exchange rates. The foreign exchange contracts are adjusted by the daily exchange rate of the underlying currency and any gains or losses are recorded for financial statement purposes as unrealized until the settlement date.
Foreign exchange contracts outstanding at period end are listed after the Fund's Portfolio of Investments.
The average value at settlement date payable and receivable of foreign exchange contracts purchased and sold by the Fund throughout the period was $11,247 and $8,689, respectively. This is based on the contracts held as of each month-end throughout the fiscal period.
Foreign Currency Translation
The accounting records of the Fund are maintained in U.S. dollars. All assets and liabilities denominated in foreign currencies (FCs) are translated into U.S. dollars based on the rates of exchange of such currencies against U.S. dollars on the date of valuation. Purchases and sales of securities, income and expenses are translated at the rate of exchange quoted on the respective date that such transactions are recorded. The Fund does not isolate that portion of the results of operations resulting from changes in foreign exchange rates on investments from the fluctuations arising from changes in market prices of securities held. Such fluctuations are included with the net realized and unrealized gain or loss from investments.
Reported net realized foreign exchange gains or losses arise from sales of portfolio securities, sales and maturities of short-term securities, sales of FCs, currency gains or losses realized between the trade and settlement dates on securities transactions, the difference between the amounts of dividends, interest and foreign withholding taxes recorded on the Fund's books, and the U.S. dollar equivalent of the amounts actually received or paid. Net unrealized foreign exchange gains and losses arise from changes in the value of assets and liabilities other than investments in securities at fiscal year end, resulting from changes in the exchange rate.
Annual Shareholder Report
Securities Lending
The Fund participates in a securities lending program providing for the lending of equity securities to qualified brokers. The Fund normally receives cash collateral for securities loaned that is invested in an affiliated money market fund or in short-term securities including repurchase agreements. Collateral is maintained at a minimum level of 100% of the market value of investments loaned, plus interest, if applicable. Earnings on collateral are allocated between the borrower of the security, the securities lending agent, as a fee for its services under the program and the Fund, according to agreed-upon rates.
As of October 31, 2012, securities subject to this type of arrangement and related collateral were as follows:
Market Value of
Securities Loaned | Market Value
of Collateral |
| $341,527,111 | $357,289,183 |
Short Sales
In a short sale, the Fund sells a security it does not own in anticipation of a decline in the fair market value of the security. When the Fund sells a security short, it must borrow the security in order to deliver it at the completion of the sale. A gain, limited to the price at which the Fund sold the security short, or a loss, unlimited in size, will be recognized upon the termination of the short sale.
The Fund has an obligation to replace the borrowed security (e.g., to purchase the security at a future date and deliver it to the lender of the security). While the security is borrowed, the proceeds from the sale are deposited with the lender (“Prime Broker”). The Fund may incur two types of expenses from short sales: borrowing expenses and dividend expenses. Borrowing expenses may occur because the Fund may be obligated to pay fees to the Prime Broker on borrowed securities. This fee is normally based upon the market value of the borrowed security and is dependent upon the availability of the security. Dividend expenses may occur because the Fund has to pay the Prime Broker the equivalent of any dividends earned on the borrowed security.
At October 31, 2012, the Fund had no outstanding Short Sales.
Restricted Securities
The Fund may purchase securities which are considered restricted. Restricted securities are securities that either: (a) cannot be offered for public sale without first being registered, or being able to take advantage of an exemption from registration, under the Securities Act of 1933; or (b) are subject to contractual restrictions on public sales. In some cases, when a security cannot be offered for public sale without first being registered, the issuer of the restricted security has agreed to register such securities for resale, at the issuer's expense, either upon demand by the Fund or in connection with another registered offering of the securities. Many such restricted securities may be resold in the secondary market in transactions exempt from registration. Restricted securities may be determined to be liquid under criteria established by the Trustees. The Fund will not incur any registration costs upon such resales. The Fund's restricted securities are valued at the price provided by dealers in the secondary market or, if no market prices are available, at the fair value as determined in accordance with procedures established by and under the general supervision of the Trustees.
Annual Shareholder Report
Additional information on restricted securities, excluding securities purchased under Rule 144A that have been deemed liquid by the Trustees, if applicable, held at October 31, 2012, is as follows:
| Security | Acquisition Date | Cost | Market Value |
| Apollo Investment Fund V | 5/18/2001 | $0 | $3,060,493 |
| Conceptus, Inc. | 4/10/2001 - 8/11/2005 | $14,616,806 | $32,507,666 |
| Denovo Ventures I LP | 3/9/2000 | $2,888,396 | $507,529 |
| Expand Networks Ltd. | 9/22/2000 | $2,500,000 | $0 |
| FA Private Equity Fund IV LP | 3/4/2002 | $380,354 | $792,184 |
| Infrastructure Fund | 8/11/2000 | $404,496 | $0 |
| Latin Healthcare Fund | 11/28/2000 | $0 | $308,335 |
| Multiplex, Inc., Pfd., Series C | 2/22/2001 | $5,000,001 | $0 |
| Peachtree Leadscope LLC, Class A and B | 6/30/2000 | $712,054 | $0 |
| Peachtree Leadscope LLC, Class C | 4/30/2002 | $3,000,000 | $1,500,000 |
| Peachtree Open Networks | 10/5/2000 | $892,599 | $0 |
| Peachtree Velquest | 9/14/2000 | $494,382 | $337,700 |
| Sensable Technologies, Inc. | 10/15/2004 | $0 | $0 |
Additional Disclosure Related to Derivative Instruments
| Fair Value of Derivative Instruments |
| | Liability |
| | | Statement of
Assets and
Liabilities
Location | Fair
Value |
| Derivatives not accounted for as hedging instruments under ASC Topic 815 | | | | |
| Foreign exchange contracts | | | Unrealized depreciation on
foreign exchange contracts | $418 |
The Effect of Derivative Instruments on the Statement of Operations for the Year Ended October 31, 2012
| Amount of Realized Gain or (Loss) on Derivatives Recognized in Income |
| Forward
Currency
Contracts |
| Foreign exchange contracts | $(378,156) |
Annual Shareholder Report
| Change in Unrealized Appreciation or (Depreciation) on Derivatives Recognized in Income |
| Forward
Currency
Contracts |
| Foreign exchange contracts | $4,408 |
Other
The preparation of financial statements in conformity with GAAP requires management to make estimates and assumptions that affect the amounts of assets, liabilities, expenses and revenues reported in the financial statements. Actual results could differ from those estimated.
3. SHARES OF BENEFICIAL INTEREST
The following tables summarize share activity:
| Year Ended October 31 | 2012 | 2011 |
| Class A Shares: | Shares | Amount | Shares | Amount |
| Shares sold | 101,325,201 | $517,640,174 | 98,824,715 | $516,747,402 |
| Shares issued to shareholders in payment of distributions declared | 7,318,704 | 34,837,031 | 2,507,026 | 13,688,361 |
| Shares redeemed | (155,265,119) | (788,003,375) | (163,851,163) | (870,540,365) |
| NET CHANGE RESULTING FROM CLASS A SHARE TRANSACTIONS | (46,621,214) | $(235,526,170) | (62,519,422) | $(340,104,602) |
| Year Ended October 31 | 2012 | 2011 |
| Class B Shares: | Shares | Amount | Shares | Amount |
| Shares sold | 1,821,412 | $8,869,192 | 3,793,204 | $19,214,651 |
| Shares issued to shareholders in payment of distributions declared | 1,223,197 | 5,467,692 | 44,017 | 227,570 |
| Shares redeemed | (30,641,240) | (147,053,853) | (34,331,522) | (172,846,233) |
| NET CHANGE RESULTING FROM CLASS B SHARE TRANSACTIONS | (27,596,631) | $(132,716,969) | (30,494,301) | $(153,404,012) |
| Year Ended October 31 | 2012 | 2011 |
| Class C Shares: | Shares | Amount | Shares | Amount |
| Shares sold | 4,989,635 | $24,006,713 | 9,418,288 | $47,966,563 |
| Shares issued to shareholders in payment of distributions declared | 1,739,345 | 7,774,872 | 122,226 | 631,908 |
| Shares redeemed | (33,800,648) | (161,486,802) | (39,974,916) | (201,008,903) |
| NET CHANGE RESULTING FROM CLASS C SHARE TRANSACTIONS | (27,071,668) | $(129,705,217) | (30,434,402) | $(152,410,432) |
Annual Shareholder Report
| Year Ended October 31 | 2012 | 2011 |
| Class R Shares: | Shares | Amount | Shares | Amount |
| Shares sold | 28,537,282 | $144,995,988 | 33,245,133 | $179,977,076 |
| Shares issued to shareholders in payment of distributions declared | 11,542,994 | 54,944,651 | 4,030,627 | 22,047,532 |
| Shares redeemed | (104,394,919) | (537,003,716) | (115,185,739) | (621,410,281) |
| NET CHANGE RESULTING FROM CLASS R SHARE TRANSACTIONS | (64,314,643) | $(337,063,077) | (77,909,979) | $(419,385,673) |
| NET CHANGE RESULTING FROM TOTAL FUND SHARE TRANSACTIONS | (165,604,156) | $(835,011,433) | (201,358,104) | $(1,065,304,719) |
Redemption Fee
The Fund's Class R Shares imposes a redemption fee of 0.20% on the redemption price of the Fund's Class R Shares redeemed, if such shares were purchased after February 1, 1985. The redemption fee is applied to the Fund's Class R Shares expenses for providing redemption services, including, but not limited to: transfer agent fees; postage; printing; telephone; and related employment costs. Any excess fee proceeds are added to the Fund's assets. Shares acquired through employer-sponsored retirement plans will not be subject to the redemption fee. However, if shares are purchased for a retirement plan account through a broker, financial institution or other intermediary maintaining an omnibus account for the shares, the waiver may not apply. In addition, this waiver does not apply to individual retirement accounts, such as Traditional, Roth and SEP-IRAs. For the years ended October 31, 2012 and October 31, 2011, redemption fees of $649,922 and $646,227 were allocated to cover the cost of redemptions.
4. FEDERAL TAX INFORMATION
The timing and character of income and capital gain distributions are determined in accordance with income tax regulations, which may differ from GAAP. These differences are due to differing treatments for foreign currency transactions, partnership adjustments, ordinary loss netting to reduce short term capital gains, reclassification for regulatory settlement proceeds and net operating losses.
For the year ended October 31, 2012, permanent differences identified and reclassified among the components of net assets were as follows:
| Increase (Decrease) |
| Paid-In Capital | Undistributed
Net Investment
Income (Loss) | Accumulated
Net Realized
Gain (Loss) |
| $(8,065,047) | $5,928,531 | $2,136,516 |
Net investment income (loss), net realized gains (losses), and net assets were not affected by this reclassification.
Annual Shareholder Report
The tax character of distributions as reported on the Statement of Changes in Net Assets for the years ended October 31, 2012 and 2011, was as follows:
| 2012 | 2011 |
| Ordinary income | $— | $39,454,350 |
| Long-term capital gains | $109,962,103 | $48,627 |
As of October 31, 2012, the components of distributable earnings on a tax basis were as follows:
| Undistributed capital gains | $420,797,188 |
| Net unrealized appreciation | $1,191,414,177 |
| Ordinary loss deferrals | $(52,337,307) |
The difference between book-basis and tax-basis net unrealized appreciation/depreciation is attributable to differing treatments for the deferral of losses on wash sales and partnership adjustments.
At October 31, 2012, the cost of investments for federal tax purposes was $4,524,980,534. The net unrealized appreciation of investments for federal tax purposes excluding: a) any unrealized appreciation/depreciation resulting from the translation of FCs to U.S. dollars of assets and liabilities other than investments in securities and b) outstanding foreign currency commitments was $1,193,690,513. This consists of net unrealized appreciation from investments for those securities having an excess of value over cost of $1,370,468,961 and net unrealized depreciation from investments for those securities having an excess of cost over value of $176,778,448.
Under current tax law, late-year ordinary loss realized after December 31 through the end of the Fund's fiscal year (“Late Year Ordinary Loss”) may be deferred, in whole or in part, and treated as occurring on the first day of the following fiscal year. As of October 31, 2012, for federal income tax purposes, a Late Year Ordinary Loss of $52,337,307 was deferred to November 1, 2012.
5. INVESTMENT ADVISER FEE AND OTHER TRANSACTIONS WITH AFFILIATES
Investment Adviser Fee
The advisory agreement between the Fund and the Adviser provides for an annual fee equal to 1.425% of the Fund's average daily net assets. Pursuant to the settlement of certain litigation, the Adviser has agreed, for a period continuing through June 30, 2022, to waive its investment advisory fee so that such fee will not exceed 1.275%. Also as part of the settlement agreement, effective July 1, 2012 and continuing through June 30, 2022, the Adviser has agreed to further waive the advisory fee by an additional 0.02%, 0.04%, 0.06% or 0.07% if the Fund's net assets exceed eight, nine, ten or twelve billion dollars, respectively. Subject to the terms described in the Expense Limitation note, the Adviser may voluntarily choose to waive any portion of its fee. For the year ended October 31, 2012, the Adviser voluntarily waived $7,676,944 of its fee.
Certain of the Fund's assets are managed by Federated Global Investment Management Corp. (the “Sub-Adviser”). Under the terms of a sub-advisory agreement between the Adviser and the Sub-Adviser, the Sub-Adviser receives an allocable portion of the Fund's adviser fee. The fee is paid by the Adviser out of its resources and is not an incremental Fund expense. For the year ended October 31, 2012, the Sub-Adviser earned a fee of $65,799,584.
Annual Shareholder Report
Administrative Fee
Federated Administrative Services (FAS), under the Administrative Services Agreement, provides the Fund with administrative personnel and services. The fee paid to FAS is based on the average aggregate daily net assets of certain Federated funds as specified below, plus certain out-of-pocket expenses:
| Administrative Fee | Average Aggregate Daily Net Assets
of the Federated Funds |
| 0.150% | on the first $5 billion |
| 0.125% | on the next $5 billion |
| 0.100% | on the next $10 billion |
| 0.075% | on assets in excess of $20 billion |
Prior to September 1, 2012, the administrative fee received during any fiscal year was at least $150,000 per portfolio and $40,000 per each additional class of Shares. Subject to the terms described in the Expense Limitation note, FAS may voluntarily choose to waive any portion of its fee. For the year ended October 31, 2012, FAS waived $88,804 of its fee. The net fee paid to FAS was 0.076% of average daily net assets of the Fund.
Distribution Services Fee
The Fund has adopted a Distribution Plan (the “Plan”) pursuant to Rule 12b-1 under the Act. Under the terms of the Plan, the Fund will compensate Federated Securities Corp. (FSC), the principal distributor, from the daily net assets of the Fund's Class A Shares, Class B Shares, Class C Shares and Class R Shares to finance activities intended to result in the sale of these shares. The Plan provides that the Fund may incur distribution expenses at the following percentages of average daily net assets annually, to compensate FSC:
| Share Class Name | Percentage of Average Daily
Net Assets of Class |
| Class A Shares | 0.25% |
| Class B Shares | 0.75% |
| Class C Shares | 0.75% |
| Class R Shares | 0.50% |
Subject to the terms described in the Expense Limitation note, FSC may voluntarily choose to waive any portion of its fee. For the year ended October 31, 2012, distribution services fees for the Fund were as follows:
| Distribution
Services
Fees Incurred | Distribution
Services
Fees Waived |
| Class A Shares | $4,851,821 | $(2,365,682) |
| Class B Shares | 1,807,252 | — |
| Class C Shares | 3,309,476 | (321,528) |
| Class R Shares | 14,885,029 | (10,699,342) |
| TOTAL | $24,853,578 | $(13,386,552) |
Annual Shareholder Report
When FSC receives fees, it may pay some or all of them to financial intermediaries whose customers purchase shares. For the year ended October 31, 2012, FSC retained $6,016,523 of fees paid by the Fund.
Sales Charges
Front-end sales charges and contingent deferred sales charges (CDSC) do not represent expenses of the Fund. They are deducted from the proceeds of sales of Fund shares prior to investment or from redemption proceeds prior to remittance, as applicable. For the year ended October 31, 2012, FSC retained $73,707 in sales charges from the sale of Class A Shares. FSC also retained $8,908 of CDSC relating to redemptions of Class A Shares, $113,165 relating to redemptions of Class B Shares and $19,183 relating to redemptions of Class C Shares.
Shareholder Services Fee
The Fund may pay fees (“Service Fees”) up to 0.25% of the average daily net assets of the Fund's Class A Shares, Class B Shares, Class C Shares and Class R Shares to financial intermediaries or to Federated Shareholder Services Company (FSSC) for providing services to shareholders and maintaining shareholder accounts. Financial intermediaries may include a company affiliated with management of Federated Investors, Inc. A financial intermediary affiliated with management of Federated Investors, Inc. received $17,407 of Service Fees for the year ended October 31, 2012. Subject to the terms described in the Expense Limitation note, FSSC may voluntarily reimburse the Fund for Service Fees. For the year ended October 31, 2012, Service Fees for the Fund were as follows:
| Service
Fees
Incurred | Service
Fees
Reimbursed |
| Class A Shares | $4,816,186 | $— |
| Class B Shares | 602,417 | (178,397) |
| Class C Shares | 1,100,814 | — |
| Class R Shares | 7,416,186 | — |
| TOTAL | $13,935,603 | $(178,397) |
For the year ended October 31, 2012, FSSC received $4,746,146 of fees paid by the Fund.
Commitments and Contingencies
In the course of pursuing its investment objective, the Fund sometimes invests in limited partnerships and limited liability companies. These entities often require the Fund to commit to a total dollar amount to be invested. The investments are usually made in installments over a period of time. At October 31, 2012, the Fund had total commitments to limited partnerships and limited liability companies of $34,683,400; of this amount, $33,577,120 was invested by the Fund leaving the Fund contingently liable for additional investments of $1,106,280.
Expense Limitation
The Adviser and its affiliates (which may include FSC, FAS and FSSC) have voluntarily agreed to waive their fees and/or reimburse expenses so that the total annual fund operating expenses (as shown in the financial highlights, excluding dividends and other expenses related to short sales) paid by the Fund's Class A Shares, Class B Shares, Class C Shares and Class R Shares (after the voluntary waivers and/or reimbursements) will not exceed 1.95%, 2.50%, 2.50% and 1.95% (the “Fee Limit”), respectively, up to but not including the later of (the
Annual Shareholder Report
“Termination Date”): (a) January 1, 2014; or (b) the date of the Fund's next effective Prospectus. While the Adviser and its affiliates currently do not anticipate terminating or increasing these arrangements prior to the Termination Date, these arrangements may only be terminated or the Fee Limit increased prior to the Termination Date with the agreement of the Trustees.
Interfund Transactions
During the year ended October 31, 2012, the Fund engaged in purchase and sale transactions with funds that have a common investment adviser (or affiliated investment advisers), common Directors/Trustees, and/or common Officers. These purchase and sale transactions complied with Rule 17a-7 under the Act and amounted to $21,447,288 and $9,804,674, respectively.
General
Certain Officers and Trustees of the Fund are Officers and Directors or Trustees of the above companies.
Transactions Involving Affiliated Companies and Affiliated Holdings
An affiliated company is a company in which the Fund has ownership of at least 5% of the voting shares. Transactions with affiliated companies during the year ended October 31, 2012, were as follows:
| Affiliates | Balance of
Shares Held
10/31/2011 | Purchases/
Additions | Sales/
Reductions | Balance of
Shares Held
10/31/2012 | Value | Dividend
Income |
| *Alkermes, Inc. | 5,818,897 | 589,166 | 3,111,550 | 3,296,513 | $61,084,386 | $— |
CETIP SA-
Mercados Organizado | 21,640,000 | 1,793,735 | 1,794,834 | 21,638,901 | 249,304,686 | 3,443,236 |
| Conceptus, Inc. | 1,725,460 | — | — | 1,725,460 | 32,507,666 | — |
Corcept
Therapeutics, Inc. | 3,653,165 | 5,776,835 | — | 9,430,000 | 23,575,000 | — |
Corcept
Therapeutics, Inc., 3/29/2015 | — | 797,358 | — | 797,358 | 431,131 | — |
| *Cubist Pharmaceuticals, Inc. | 4,250,000 | — | 1,750,000 | 2,500,000 | 107,250,000 | — |
| Dexcom, Inc. | 3,717,624 | 3,891,049 | 108,673 | 7,500,000 | 98,250,000 | — |
| Dexcom, Inc. | 126,065 | — | — | 126,065 | 1,651,452 | — |
| Dyax Corp. | 15,200,000 | 2,762,000 | — | 17,962,000 | 53,886,000 | — |
| ExamWorks Group, Inc. | 3,000,000 | 1,343,617 | 423,617 | 3,920,000 | 54,958,400 | — |
| Insulet Corp. | 1,834,871 | 783,454 | 234,871 | 2,383,454 | 50,553,059 | — |
Insulet Corp., Conv.
Bond, 3.75, 6/15/2016 | 14,630,000 | — | — | 14,630,000 | 16,263,732 | — |
Insulet Corp., Conv.
Bond, 5.375, 6/15/2013 | 12,670,000 | — | — | 12,670,000 | 15,505,166 | — |
| Progenics Pharmaceuticals, Inc. | 5,246,193 | — | — | 5,246,193 | 14,951,650 | — |
| Protalix Biotherapeutics, Inc. | 5,400,000 | 1,306,495 | — | 6,706,495 | $32,392,371 | — |
Annual Shareholder Report
| Affiliates | Balance of
Shares Held
10/31/2011 | Purchases/
Additions | Sales/
Reductions | Balance of
Shares Held
10/31/2012 | Value | Dividend
Income |
| Repligen Corp. | 2,998,043 | — | 298,043 | 2,700,000 | 13,770,000 | $— |
| *Restoque Comercio e Confeccoes de Roupas SA | 3,698,035 | — | 2,443,915 | 1,254,120 | 5,347,323 | 279,607 |
| Sensable Technologies, Inc. | 3,751 | — | — | 3,751 | — | — |
| Soteira, Inc. | 959,018 | — | — | 959,018 | — | — |
| TNS, Inc. | 2,964,645 | — | 274,576 | 2,690,069 | 38,521,788 | — |
| Zogenix, Inc. | — | 16,500,000 | — | 16,500,000 | 40,260,000 | — |
| Zogenix, Inc., 7/27/2017 | — | 7,425,000 | — | 7,425,000 | 3,897,383 | — |
| *Vical, Inc. | 7,048,500 | 2,664,209 | 6,712,709 | 3,000,000 | 10,230,000 | — |
TOTAL OF
AFFILIATED
COMPANIES | 114,306,102 | 47,911,083 | 17,152,788 | 145,064,397 | $924,591,193 | $3,722,843 |
| * | At October 31, 2012, the Fund no longer has ownership of at least 5% of the voting shares. |
Affiliated holdings are mutual funds which are managed by the Adviser or an affiliate of the Adviser. The Adviser has agreed to reimburse the Fund for certain investment adviser fees as a result of transactions in other affiliated mutual funds. For the year ended October 31, 2012, the Adviser reimbursed $723,003. Transactions involving the affiliated holding during the year ended October 31, 2012, were as follows:
| Federated
Prime Value
Obligations Fund,
Institutional Shares |
| Balance of Shares Held 10/31/2011 | 511,911,319 |
| Purchases/Additions | 4,508,620,683 |
| Sales/Reductions | 4,414,507,549 |
| Balance of Shares Held 10/31/2012 | 606,024,453 |
| Value | $606,024,453 |
| Dividend Income | $425,415 |
6. EXPENSE Reduction
The Fund directs portfolio trades to a broker that in turn pays a portion of the Fund's operating expenses. For the year ended October 31, 2012, the Fund's expenses were reduced by $67,170 under these arrangements.
Annual Shareholder Report
7. Investment TRANSACTIONS
Purchases and sales of investments, excluding long-term U.S. government securities and short-term obligations, for the year ended October 31, 2012, were as follows:
| Purchases | $3,303,789,656 |
| Sales | $4,510,996,589 |
8. CONCENTRATION OF RISK
The Fund invests in securities of non-U.S. issuers. Political or economic developments may have an effect on the liquidity and volatility of portfolio securities and currency holdings.
At October 31, 2012, the diversification of countries was as follows:
| Country | Percentage of
Net Assets |
| United States | 65.6% |
| Brazil | 6.8% |
| Italy | 2.8% |
| Netherlands | 2.8% |
| India | 2.6% |
| Luxembourg | 2.5% |
| Ireland | 2.3% |
| Spain | 2.2% |
| British Virgin Islands | 1.7% |
| United Kingdom | 1.4% |
| Israel | 0.9% |
| Chile | 0.9% |
| Singapore | 0.8% |
| Colombia | 0.7% |
| Cayman Islands | 0.6% |
| Switzerland | 0.3% |
| Mexico | 0.2% |
| Peru | 0.2% |
| United Arab Emirates | 0.2% |
| Sweden | 0.0%1 |
| 1 | Represents less than 0.1%. |
9. LINE OF CREDIT
The Fund participates in a $100,000,000 unsecured, uncommitted revolving line of credit (LOC) agreement with PNC Bank. The LOC was made available for extraordinary or emergency purposes, primarily for financing redemption payments. Borrowings are charged interest at a rate offered to the Fund by PNC Bank at the time of the borrowing. As of October 31, 2012, there were no outstanding loans. During the year ended October 31, 2012, the Fund did not utilize the LOC.
Annual Shareholder Report
10. INTERFUND LENDING
Pursuant to an Exemptive Order issued by the Securities and Exchange Commission, the Fund, along with other funds advised by subsidiaries of Federated Investors, Inc., may participate in an interfund lending program. This program provides an alternative credit facility allowing the Fund to borrow from other participating affiliated funds. As of October 31, 2012, there were no outstanding loans. During the year ended October 31, 2012, the program was not utilized.
11. Legal Proceedings
Since February 2004, Federated Investors, Inc. and related entities (collectively, “Federated”), have been named as defendants in several lawsuits in the United States District Court for the Western District of Pennsylvania. These lawsuits have been consolidated into a single action alleging excessive advisory fees involving the Fund. Without admitting the validity of any claim, in April 2011, Federated reached a final settlement to resolve this lawsuit resulting in no material adverse effect on Federated or the Fund.
12. FEDERAL TAX INFORMATION (UNAUDITED)
For the year ended October 31, 2012, the amount of long-term capital gains designated by the Fund was $109,962,103.
Annual Shareholder Report
Report of Independent Registered Public Accounting Firm
TO THE BOARD OF Trustees OF Federated Equity Funds AND SHAREHOLDERS OF Federated Kaufmann Fund:
We have audited the accompanying statement of assets and liabilities of Federated Kaufmann Fund (the “Fund”) (one of the portfolios constituting Federated Equity Funds), including the portfolio of investments, as of October 31, 2012, and the related statement of operations for the year then ended, the statement of changes in net assets for each of the two years in the period then ended, and the financial highlights of Class R Shares for each of the five years in the period then ended. These financial statements and financial highlights are the responsibility of the Fund's management. Our responsibility is to express an opinion on these financial statements and financial highlights based on our audits.
We conducted our audits in accordance with standards of the Public Company Accounting Oversight Board (United States). Those standards require that we plan and perform the audit to obtain reasonable assurance about whether the financial statements and financial highlights are free of material misstatement. We were not engaged to perform an audit of the Fund's internal control over financial reporting. Our audits included consideration of internal control over financial reporting as a basis for designing audit procedures that are appropriate in the circumstances, but not for the purpose of expressing an opinion on the effectiveness of the Fund's internal control over financial reporting. Accordingly, we express no such opinion. An audit also includes examining, on a test basis, evidence supporting the amounts and disclosures in the financial statements and financial highlights, assessing the accounting principles used and significant estimates made by management, and evaluating the overall financial statement presentation. Our procedures included confirmation of securities owned as of October 31, 2012, by correspondence with the custodian and others or by other appropriate auditing procedures where replies from others were not received. We believe that our audits provide a reasonable basis for our opinion.
In our opinion, the financial statements and financial highlights referred to above present fairly, in all material respects, the financial position of the Federated Kaufmann Fund, a portfolio of Federated Equity Funds, at October 31, 2012, the results of its operations for the year then ended, the changes in its net assets for each of the two years in the period then ended, and the financial highlights of Class R Shares for each of the five years in the period then ended, in conformity with U.S. generally accepted accounting principles.
Boston, Massachusetts
December 24, 2012
Annual Shareholder Report
Shareholder Expense Example (unaudited)
As a shareholder of the Fund, you incur two types of costs: (1) transaction costs, including sales charges (loads) on purchase or redemption payments and redemption/exchange fees; and (2) ongoing costs, including management fees and to the extent applicable, distribution (12b-1) fees and/or shareholder services fees and other Fund expenses. This Example is intended to help you to understand your ongoing costs (in dollars) of investing in the Fund and to compare these costs with the ongoing costs of investing in other mutual funds. It is based on an investment of $1,000 invested at the beginning of the period and held for the entire period from May 1, 2012 to October 31, 2012.
ACTUAL EXPENSES
The first section of the table below provides information about actual account values and actual expenses. You may use the information in this section, together with the amount you invested, to estimate the expenses that you incurred over the period. Simply divide your account value by $1,000 (for example, an $8,600 account value divided by $1,000 = 8.6), then multiply the result by the number in the first section under the heading entitled “Expenses Paid During Period” to estimate the expenses attributable to your investment during this period.
HYPOTHETICAL EXAMPLE FOR COMPARISON PURPOSES
The second section of the table below provides information about hypothetical account values and hypothetical expenses based on the Fund's actual expense ratio and an assumed rate of return of 5% per year before expenses, which is not the Fund's actual return. Thus, you should not use the hypothetical account values and expenses to estimate the actual ending account balance or your expenses for the period. Rather, these figures are required to be provided to enable you to compare the ongoing costs of investing in the Fund with other funds. To do so, compare this 5% hypothetical example with the 5% hypothetical examples that appear in the shareholder reports of the other funds.
Annual Shareholder Report
Please note that the expenses shown in the table are meant to highlight your ongoing costs only and do not reflect any transaction costs, such as sales charges (loads) on purchase or redemption payments, or redemption/exchange fees. Therefore, the second section of the table is useful in comparing ongoing costs only, and will not help you determine the relative total costs of owning different funds. In addition, if these transaction costs were included, your costs would have been higher.
| Beginning
Account Value
5/1/2012 | Ending
Account Value
10/31/2012 | Expenses Paid
During Period1 |
| Actual | $1,000 | $974.20 | $9.68 |
Hypothetical (assuming a 5% return
before expenses) | $1,000 | $1,015.33 | $9.88 |
| 1 | Expenses are equal to the Fund's annualized net expense ratio of 1.95%, multiplied by the average account value over the period, multiplied by 184/366 (to reflect the one-half-year period). |
Annual Shareholder Report
Board of Trustees and Trust Officers
The Board of Trustees is responsible for managing the Trust business affairs and for exercising all the Trust powers except those reserved for the shareholders. The following tables give information about each Trustee and the senior officers of the Fund. Where required, the tables separately list Trustees who are “interested persons” of the Fund (i.e., “Interested” Trustees) and those who are not (i.e., “Independent” Trustees). Unless otherwise noted, the address of each person listed is Federated Investors Tower, 1001 Liberty Avenue, Pittsburgh, PA 15222. The address of all Independent Trustees listed is 4000 Ericsson Drive, Warrendale, PA 15086-7561; Attention: Mutual Fund Board. As of December 31, 2011, the Trust comprised 13 portfolio(s), and the Federated Fund Family consisted of 43 investment companies (comprising 134 portfolios). Unless otherwise noted, each Officer is elected annually. Unless otherwise noted, each Trustee oversees all portfolios in the Federated Fund Family and serves for an indefinite term. The Fund's Statement of Additional Information includes additional information about Trust Trustees and is available, without charge and upon request, by calling 1-800-341-7400.
Interested TRUSTEES Background
Name
Birth Date
Positions Held with Trust
Date Service Began | Principal Occupation(s) for Past Five Years,
Other Directorships Held and Previous Position(s) |
John F. Donahue*
Birth Date: July 28, 1924
Trustee
Began serving: April 1984 | Principal Occupations: Director or Trustee of the Federated Fund Family; Chairman and Director, Federated Investors, Inc.; Chairman of the Federated Fund Family's Executive Committee.
Previous Positions: Chairman of the Federated Fund Family; Trustee, Federated Investment Management Company; Chairman and Director, Federated Investment Counseling. |
J. Christopher Donahue*
Birth Date: April 11, 1949
President and Trustee
Began serving: January 2000 | Principal Occupations: Principal Executive Officer and President of the Federated Fund Family; Director or Trustee of some of the Funds in the Federated Fund Family; President, Chief Executive Officer and Director, Federated Investors, Inc.; Chairman and Trustee, Federated Investment Management Company; Trustee, Federated Investment Counseling; Chairman and Director, Federated Global Investment Management Corp.; Chairman, Federated Equity Management Company of Pennsylvania and Passport Research, Ltd. (investment advisory subsidiary of Federated); Trustee, Federated Shareholder Services Company; Director, Federated Services Company.
Previous Positions: President, Federated Investment Counseling; President and Chief Executive Officer, Federated Investment Management Company, Federated Global Investment Management Corp. and Passport Research, Ltd. |
| * | Family relationships and reasons for “interested” status: John F. Donahue is the father of J. Christopher Donahue; both are “interested” due to their beneficial ownership of shares of Federated Investors, Inc. and the positions they hold with Federated and its subsidiaries. |
Annual Shareholder Report
INDEPENDENT TRUSTEES Background
Name
Birth Date
Positions Held with Trust
Date Service Began | Principal Occupation(s) for Past Five Years,
Other Directorships Held, Previous Position(s) and Qualifications |
Nicholas P. Constantakis, CPA
Birth Date: September 3, 1939
Trustee
Began serving: February 1998 | Principal Occupation: Director or Trustee of the Federated Fund Family.
Other Directorship Held: Director, Chairman of the Audit Committee, and member of the Compensation Committee, Michael Baker Corporation (architecture, engineering and construction services).
Previous Position: Partner, Andersen Worldwide SC.
Qualifications: Public accounting and director experience. |
John F. Cunningham
Birth Date: March 5, 1943
Trustee
Began serving: January 1999 | Principal Occupation: Director or Trustee of the Federated Fund Family.
Other Directorships Held: Chairman, President and Chief Executive Officer, Cunningham & Co., Inc. (strategic business consulting); Trustee Associate, Boston College.
Previous Positions: Director, Redgate Communications and EMC Corporation (computer storage systems); Chairman of the Board and Chief Executive Officer, Computer Consoles, Inc.; President and Chief Operating Officer, Wang Laboratories; Director, First National Bank of Boston; Director, Apollo Computer, Inc.
Qualifications: Business management and director experience. |
Maureen Lally-Green
Birth Date: July 5, 1949
Trustee
Began serving: August 2009 | Principal Occupations: Director or Trustee of the Federated Fund Family; Director, Office of Church Relations, Diocese of Pittsburgh; Adjunct Professor of Law, Duquesne University School of Law.
Other Directorships Held: Director, Auberle; Member, Pennsylvania State Board of Education; Director, Saint Vincent College; Director, Ireland Institute of Pittsburgh; Chair and Director, UPMC Mercy Hospital; Regent, St. Vincent Seminary; Director, Epilepsy Foundation of Western and Central Pennsylvania; Director, Saint Thomas More Society, Allegheny County; Director, Our Campaign for the Church Alive, Inc.
Previous Position: Pennsylvania Superior Court Judge.
Qualifications: Legal and director experience. |
Peter E. Madden
Birth Date: March 16, 1942
Trustee
Began serving: November 1991 | Principal Occupation: Director or Trustee, and Chairman of the Board of Directors or Trustees, of the Federated Fund Family.
Previous Positions: Representative, Commonwealth of Massachusetts General Court; President, Chief Operating Officer and Director, State Street Bank and Trust Company and State Street Corporation (retired); Director, VISA USA and VISA International; Chairman and Director, Massachusetts Bankers Association; Director, Depository Trust Corporation; Director, The Boston Stock Exchange.
Qualifications: Business management, mutual fund services and director experience. |
Annual Shareholder Report
Name
Birth Date
Positions Held with Trust
Date Service Began | Principal Occupation(s) for Past Five Years,
Other Directorships Held, Previous Position(s) and Qualifications |
Charles F. Mansfield, Jr.
Birth Date: April 10, 1945
Trustee
Began serving: January 1999 | Principal Occupations: Director or Trustee of the Federated Fund Family; Management Consultant.
Previous Positions: Chief Executive Officer, PBTC International Bank; Partner, Arthur Young & Company (now Ernst & Young LLP); Chief Financial Officer of Retail Banking Sector, Chase Manhattan Bank; Senior Vice President, HSBC Bank USA (formerly Marine Midland Bank); Vice President, Citibank; Assistant Professor of Banking and Finance, Frank G. Zarb School of Business, Hofstra University; Executive Vice President, DVC Group, Inc. (marketing, communications and technology).
Qualifications: Banking, business management, education and director experience. |
Thomas M. O'Neill
Birth Date: June 14, 1951
Trustee
Began serving: October 2006 | Principal Occupations: Director or Trustee, Vice Chairman of the Audit Committee of the Federated Fund Family; Sole Proprietor, Navigator Management Company (investment and strategic consulting).
Other Directorships Held: Board of Overseers, Children's Hospital of Boston; Visiting Committee on Athletics, Harvard College; Board of Directors, Medicines for Humanity; Board of Directors, The Golisano Children's Museum of Naples, Florida.
Previous Positions: Chief Executive Officer and President, Managing Director and Chief Investment Officer, Fleet Investment Advisors; President and Chief Executive Officer, Aeltus Investment Management, Inc.; General Partner, Hellman, Jordan Management Co., Boston, MA; Chief Investment Officer, The Putnam Companies, Boston, MA; Credit Analyst and Lending Officer, Fleet Bank; Director and Consultant, EZE Castle Software (investment order management software); Director, Midway Pacific (lumber).
Qualifications: Business management, mutual fund, director and investment experience. |
John S. Walsh
Birth Date: November 28, 1957
Trustee
Began serving: January 1999 | Principal Occupations: Director or Trustee, Chairman of the Audit Committee of the Federated Fund Family; President and Director, Heat Wagon, Inc. (manufacturer of construction temporary heaters); President and Director, Manufacturers Products, Inc. (distributor of portable construction heaters); President, Portable Heater Parts, a division of Manufacturers Products, Inc.
Previous Position: Vice President, Walsh & Kelly, Inc.
Qualifications: Business management and director experience. |
Annual Shareholder Report
OFFICERS
Name
Birth Date
Address
Positions Held with Trust
Date Service Began | Principal Occupation(s) for Past Five Years
and Previous Position(s) |
John W. McGonigle
Birth Date: October 26, 1938
EXECUTIVE VICE PRESIDENT AND SECRETARY
Officer since: April 1984 | Principal Occupations: Executive Vice President and Secretary of the Federated Fund Family; Vice Chairman, Executive Vice President, Secretary and Director, Federated Investors, Inc.
Previous Positions: Trustee, Federated Investment Management Company and Federated Investment Counseling; Director, Federated Global Investment Management Corp., Federated Services Company and Federated Securities Corp. |
Richard A. Novak
Birth Date: December 25, 1963
Treasurer
Officer since: January 2006 | Principal Occupations: Principal Financial Officer and Treasurer of the Federated Fund Family; Senior Vice President, Federated Administrative Services; Financial and Operations Principal for Federated Securities Corp., Edgewood Services, Inc. and Southpointe Distribution Services, Inc.
Previous Positions: Controller of Federated Investors, Inc.; Vice President, Finance of Federated Services Company; held various financial management positions within The Mercy Hospital of Pittsburgh; Auditor, Arthur Andersen & Co. |
Richard B. Fisher
Birth Date: May 17, 1923
Vice President
Officer since: April 1984 | Principal Occupations: Vice Chairman or Vice President of some of the Funds in the Federated Fund Family; Vice Chairman, Federated Investors, Inc.; Chairman, Federated Securities Corp.
Previous Positions: President and Director or Trustee of some of the Funds in the Federated Fund Family; Executive Vice President, Federated Investors, Inc.; Director and Chief Executive Officer, Federated Securities Corp. |
Peter J. Germain
Birth Date: September 3, 1959
CHIEF LEGAL OFFICER
Officer since: January 2005 | Principal Occupations: Mr. Germain is Chief Legal Officer of the Federated Fund Family. He is General Counsel and Vice President, Federated Investors, Inc.; President, Federated Administrative Services and Federated Administrative Services, Inc.; Vice President, Federated Securities Corp.; Secretary, Federated Private Asset Management, Inc.; and Secretary, Retirement Plan Service Company of America. Mr. Germain joined Federated in 1984 and is a member of the Pennsylvania Bar Association.
Previous Positions: Deputy General Counsel, Special Counsel, Managing Director of Mutual Fund Services, Federated Investors, Inc.; Senior Vice President, Federated Services Company; and Senior Corporate Counsel, Federated Investors, Inc. |
Brian P. Bouda
Birth Date: February 28, 1947
CHIEF COMPLIANCE OFFICER AND SENIOR VICE PRESIDENT
Officer since: August 2004 | Principal Occupations: Senior Vice President and Chief Compliance Officer of the Federated Fund Family; Vice President and Chief Compliance Officer of Federated Investors, Inc. and Chief Compliance Officer of its subsidiaries. Mr. Bouda joined Federated in 1999 and is a member of the American Bar Association and the State Bar Association of Wisconsin. |
Annual Shareholder Report
Name
Birth Date
Address
Positions Held with Trust
Date Service Began | Principal Occupation(s) for Past Five Years
and Previous Position(s) |
Stephen F. Auth
Birth Date: September 3, 1956
450 Lexington Avenue
Suite 3700
New York, NY 10017-3943
CHIEF INVESTMENT OFFICER
Officer since: November 2002 | Principal Occupations: Mr. Auth is Chief Investment Officer of this Fund and various other Funds in the Federated Fund Family; Executive Vice President, Federated Investment Counseling, Federated Global Investment Management Corp. and Federated Equity Management Company of Pennsylvania.
Previous Positions: Executive Vice President, Federated Investment Management Company, and Passport Research, Ltd. (investment advisory subsidiary of Federated); Senior Vice President, Global Portfolio Management Services Division; Senior Vice President, Federated Investment Management Company and Passport Research, Ltd.; Senior Managing Director and Portfolio Manager, Prudential Investments. |
Lawrence Auriana
Birth Date: January 8, 1944
140 East 45th Street
New York, NY 10017
VICE PRESIDENT
Officer since: November 2001
Portfolio Manager since: February 1986 | Principal Occupations: Lawrence Auriana has been the Fund's Portfolio Manager since February 1986. He is Vice President of the Trust. Mr. Auriana joined Federated in April 2001 as Co-Head of Investments/Federated Kaufmann. From August 1984 to April 2001, Mr. Auriana was President and Treasurer of Edgemont Asset Management Corp., and Chairman of the Board and Portfolio Manager to The Kaufmann Fund, Inc. (predecessor to the Federated Kaufmann Fund). Mr. Auriana earned a B.S. in economics from Fordham University and has been engaged in the securities business since 1965. |
Hans P. Utsch
Birth Date: July 3, 1936
140 East 45th Street
New York, NY 10017
VICE PRESIDENT
Officer since: November 2001
Portfolio Manager since: February 1986 | Principal Occupations: Hans P. Utsch has been the Fund's Portfolio Manager since February 1986. He is Vice President of the Trust. Mr. Utsch joined Federated in April 2001 as Co-Head of Investments/Federated Kaufmann. From August 1984 to April 2001, Mr. Utsch was Chairman of the Board and Secretary of Edgemont Asset Management Corp., and President and Portfolio Manager to The Kaufmann Fund, Inc. (predecessor to the Federated Kaufmann Fund). Mr. Utsch graduated from Amherst College and holds an M.B.A. from Columbia University. He has been engaged in the securities business since 1962. |
Annual Shareholder Report
Evaluation and Approval of Advisory Contract–May 2012
Federated Kaufmann Fund (the “Fund”)
Following a review and recommendation of approval by the Fund's independent trustees, the Fund's Board reviewed and approved at its May 2012 meetings the Fund's investment advisory and subadvisory contracts for an additional one-year term. The Board's decision regarding these contracts reflects the exercise of its business judgment on whether to continue the existing arrangements.
In this connection, the Federated Funds' Board had previously appointed a Senior Officer, whose duties include specified responsibilities relating to the process by which advisory fees are to be charged to a Federated fund. The Senior Officer has the authority to retain consultants, experts, or staff as may be reasonably necessary to assist in the performance of his duties, reports directly to the Board, and may be terminated only with the approval of a majority of the independent members of the Board. The Senior Officer prepared and furnished to the Board an independent, written evaluation that covered topics discussed below (the “Evaluation”). The Board considered that Evaluation, along with other information, in deciding to approve the advisory and subadvisory contracts.
The Board is also familiar with and considered judicial decisions concerning allegedly excessive investment advisory fees, which have indicated that the following factors may be relevant to an Adviser's fiduciary duty with respect to its receipt of compensation from a fund: the nature and quality of the services provided by the Adviser to a fund and its shareholders, including the performance and expenses of the fund and of comparable funds; the Adviser's cost of providing the services, including the profitability to the Adviser of providing advisory services to a fund; the extent to which the Adviser may realize “economies of scale” as a fund grows larger and, if such economies exist, whether they have been shared with a fund and its shareholders; any “fall-out financial benefits” that accrue to the Adviser because of its relationship with a fund (including research services received from brokers that execute fund trades and any fees paid to affiliates of the Adviser for services rendered to a fund); comparative fee structures, including a comparison of fees paid to the Adviser with those paid by similar funds; and the extent to which the Board members are fully informed about all facts the Board deems relevant to its consideration of the Adviser's services and fees. Consistent with these judicial decisions, the Board also considered management fees (including any components thereof) charged to institutional and other clients of the Adviser and subadviser for what might be viewed as like services. The Board was aware of these factors and was guided by them in its review of the Fund's advisory and subadvisory contracts to the extent it considered them to be appropriate and relevant, as discussed further below.
Annual Shareholder Report
The Board considered and weighed these circumstances in light of its substantial accumulated experience in governing the Fund and working with Federated on matters relating to the Federated funds, and was assisted in its deliberations by independent legal counsel. Throughout the year, and in connection with its May meetings, the Board requested and received substantial and detailed information about the Fund and the Federated organization that was in addition to the extensive materials that comprise and accompany the Senior Officer's Evaluation. Federated provided much of this information at each regular meeting of the Board, and furnished additional substantial information in connection with the May meeting at which the Board's formal review of the advisory and subadvisory contracts occurred. At this May meeting, senior management of the Adviser also met with the independent trustees and their counsel to discuss the materials presented and any other matters thought relevant by the Adviser or the trustees. Between regularly scheduled meetings, the Board also received information on particular matters as the need arose. Thus, the Board's consideration of the advisory and subadvisory contracts included review of the Senior Officer's Evaluation, accompanying data and additional information covering such matters as: the Adviser's and subadviser's investment philosophy, revenue, profitability, personnel and processes; investment and operating strategies; the Fund's short- and long-term performance (in absolute terms, both on a gross basis and net of expenses, as well as in relationship to its particular investment program and certain competitor or “peer group” funds and/or other benchmarks, as appropriate), and comments on the reasons for performance; the Fund's investment objectives; the Fund's expenses (including the advisory fee itself and the overall expense structure of the Fund, both in absolute terms and relative to similar and/or competing funds, with due regard for contractual or voluntary expense limitations); the use and allocation of brokerage commissions derived from trading the Fund's portfolio securities (if any); and the nature, quality and extent of the advisory and other services provided to the Fund by the Adviser and its affiliates. The Board also considered the preferences and expectations of Fund shareholders; the entrepreneurial risk assumed by the Adviser in sponsoring the funds; the continuing state of competition in the mutual fund industry and market practices; the range of comparable fees for similar funds in the mutual fund industry; the Fund's relationship to the Federated family of funds which include a comprehensive array of funds with different investment objectives, policies and strategies which are available for exchange without the incurrence of additional sales charges; compliance and audit reports concerning the Federated funds and the Federated companies that service them (including communications from regulatory agencies), as well as Federated's responses to any issues raised therein; and relevant developments in the mutual fund industry and how the Federated funds and/or Federated are responding to them. The Board also considered that the longevity and experience of the Fund's portfolio management team and
Annual Shareholder Report
their unique approach to investing may limit the utility of comparisons to other equity mutual funds. The Board's evaluation process is evolutionary. The criteria considered and the emphasis placed on relevant criteria change in recognition of changing circumstances in the mutual fund marketplace.
While mindful that courts have cautioned against giving such comparisons too much weight, the Board has found the use of comparisons of the Fund's fees and expenses to other mutual funds with comparable investment programs to be relevant, given the high degree of competition in the mutual fund business. The Board focused on comparisons with other similar mutual funds more heavily than non-mutual fund products or services because it is believed that they are more relevant. For example, other mutual funds are the products most like the Fund, they are readily available to Fund shareholders as alternative investment vehicles, and they are the type of investment vehicle in fact chosen and maintained by the Fund's investors. The range of their fees and expenses therefore appears to be a generally reliable indication of what consumers have found to be reasonable in the precise marketplace in which the Fund competes. In this regard, the Senior Officer has reviewed Federated's fees for providing advisory services to products outside the Federated family of funds (e.g., institutional and separate accounts). He concluded that mutual funds and institutional accounts are inherently different products. Those differences include, but are not limited to, different types of targeted investors; being subject to different laws and regulations; different legal structures; different average account sizes; different associated costs; different portfolio management techniques made necessary by different cash flows; and portfolio manager time spent in review of securities pricing. The Senior Officer did not consider these fee schedules to be determinative in judging the appropriateness of mutual fund advisory contracts.
The Fund's ability to deliver competitive performance when compared to its peer group was also deemed to be relevant by the Board as a useful indicator of how the Adviser is executing the Fund's investment program, which in turn assisted the Board in reaching a conclusion that the nature, extent, and quality of the Adviser's investment management services were such as to warrant continuation of the advisory and subadvisory contracts.
The Senior Officer reviewed information compiled by Federated, using data supplied by independent fund ranking organizations, regarding the performance of, and fees charged by, other mutual funds, noting his view that comparisons to fund peer groups are relevant in judging the reasonableness of proposed fees.
The Fund's performance fell below the median of the relevant peer group for the one-year, three-year and five-year periods covered by the Evaluation. The Board discussed the Fund's performance with the Adviser and recognized the efforts being undertaken by the Adviser. The Board will continue to monitor these efforts and the performance of the Fund.
Annual Shareholder Report
The Board also received financial information about Federated, including information regarding the compensation and benefits Federated derived from its relationships with the Federated funds. This information covered not only the fees under the advisory contracts, but also fees received by Federated's subsidiaries for providing other services to the Federated funds under separate contracts (e.g., for serving as the Federated funds' administrator). The information also detailed any indirect benefit Federated may derive from its receipt of research services from brokers who execute Federated fund trades. In addition, the Board considered the fact that, in order for a fund to be competitive in the marketplace, Federated and its affiliates frequently waived fees and/or reimbursed expenses and have disclosed to fund investors and/or indicated to the Board their intention to do so in the future, where appropriate. Moreover, the Board receives regular reporting as to the institution or elimination of these voluntary waivers.
Federated furnished information, requested by the Senior Officer, that reported revenues on a fund-by-fund basis and made estimates of the allocation of expenses on a fund-by-fund basis, using allocation methodologies specified by the Senior Officer. The Senior Officer noted that, although they may apply consistent allocation processes, the inherent difficulties in allocating costs (and the unavoidable arbitrary aspects of that exercise) and the lack of consensus on how to allocate those costs may render such allocation information unreliable. The allocation information was considered in the analysis by the Board but was determined to be of limited use.
The Board and the Senior Officer also reviewed information compiled by Federated comparing profitability information for Federated to other publicly held fund management companies. In this regard, the Senior Officer noted the limited availability of such information, but nonetheless concluded that Federated's profit margins did not appear to be excessive.
The Senior Officer's Evaluation also discussed the notion of possible realization of “economies of scale” as a fund grows larger. The Board considered in this regard that the Adviser has made significant and long-term investments in areas that support all of the Federated funds, such as personnel and processes for the portfolio management, shareholder services, compliance, internal audit, and risk management functions; and systems technology; and that the benefits of these efforts (as well as any economies, should they exist) were likely to be enjoyed by the fund complex as a whole. Finally, the Board also noted the absence of any applicable regulatory or industry guidelines on this subject, which (as discussed in the Senior Officer's Evaluation) is compounded by the lack of any common industry practice or general pattern with respect to structuring fund advisory fees with “breakpoints” that serve to reduce the fee as the fund attains a certain size. The Senior Officer did not recommend institution of breakpoints in pricing Federated's fund advisory services at this time. In this regard, the Senior Officer's Evaluation noted that the Board is aware that the Fund is a relatively more expensive fund for the Adviser to
Annual Shareholder Report
manage than other Federated equity funds and that the Fund has for long periods in the past been significantly and consistently above median in its investment performance. The Board agreed to monitor future developments and review changes in industry practices or competitive initiatives.
The Board also considered that on April 28, 2011, the adviser reached a final settlement to resolve the consolidated cases involving the fees being charged to the Federated Kaufmann Fund.
It was noted in the materials for the Board meeting that, for the period covered by the Evaluation, the Fund's investment advisory fee, after waivers and expense reimbursements, if any, was above the median of the relevant peer group. The Board reviewed the fees and other expenses of the Fund with the Adviser and was satisfied that the overall expense structure of the Fund remained competitive. The Board will continue to monitor advisory fees and other expenses borne by the Fund.
The Senior Officer noted that, considering the totality of the circumstances, and all of the factors referenced within his Evaluation, he had concluded that, subject to comments and recommendations made within his Evaluation, his observations and the information accompanying the Evaluation supported a finding by the Board that the management fees for each of the funds was reasonable and that Federated appeared to provide appropriate advisory and administrative services to the Fund for the fees paid. Under these circumstances, no changes were recommended to, and no objection was raised to, the continuation of the Fund's advisory and subadvisory contracts.
In its decision to continue an existing investment advisory contract, the Board was mindful of the potential disruptions of the Fund's operations and various risks, uncertainties and other effects that could occur as a result of a decision to terminate or not renew an advisory contract. In particular, the Board recognized that many shareholders have invested in the Fund on the strength of the Adviser's industry standing and reputation and with the expectation that the Adviser will have a continuing role in providing advisory services to the Fund. Thus, the Board's approval of the advisory contract reflected the fact that it is the shareholders who have effectively selected the Adviser by virtue of having invested in the Fund. The Board concluded that, in light of the factors discussed above, including the nature, quality and scope of the services provided to the Fund by the Adviser and its affiliates, continuation of the advisory contract was appropriate.
The Board based its decision to approve the advisory and subadvisory contracts on the totality of the circumstances and relevant factors and with a view to past and future long-term considerations. Not all of the factors and considerations identified above were necessarily relevant to the Fund, nor did the Board consider any one of them to be determinative. With respect to the factors that were relevant, the Board's decision to approve the contract reflects its determination that Federated's performance and actions provided a satisfactory basis to support the decision to continue the existing arrangements.
Annual Shareholder Report
Voting Proxies on Fund Portfolio Securities
A description of the policies and procedures that the Fund uses to determine how to vote proxies, if any, relating to securities held in the Fund's portfolio is available, without charge and upon request, by calling 1-800-341-7400. A report on “Form N-PX” of how the Fund voted any such proxies during the most recent 12-month period ended June 30 is available from Federated's website at FederatedInvestors.com. To access this information from the home page, select “All” under “Asset Classes.” Select a fund name and share class, if applicable, to go to the Fund Overview page. On the Fund Overview page, select the “Documents” tab. At the bottom of that page, select “Proxy Voting Record Report (Form N-PX).” Form N-PX filings are also available at the SEC's website at www.sec.gov.
Quarterly Portfolio Schedule
The Fund files with the SEC a complete schedule of its portfolio holdings, as of the close of the first and third quarters of its fiscal year, on “Form N-Q.” These filings are available on the SEC's website at www.sec.gov and may be reviewed and copied at the SEC's Public Reference Room in Washington, DC. (Call 1-800-SEC-0330 for information on the operation of the Public Reference Room.) You may also access this information from the “Products” section of Federated's website at FederatedInvestors.com. From the home page, select “All” under “Asset Classes.” Select a fund name and share class, if applicable, to go to the Fund Overview page. On the Fund Overview page, select the “Documents” tab. At the bottom of that page, select “Form N-Q.”
Annual Shareholder Report
Mutual funds are not bank deposits or obligations, are not guaranteed by any bank and are not insured or guaranteed by the U.S. government, the Federal Deposit Insurance Corporation, the Federal Reserve Board or any other government agency. Investment in mutual funds involves investment risk, including the possible loss of principal.
This Report is authorized for distribution to prospective investors only when preceded or accompanied by the Fund's Prospectus, which contains facts concerning its objective and policies, management fees, expenses and other information.
Federated Kaufmann Fund
Federated Investors Funds
4000 Ericsson Drive
Warrendale, PA 15086-7561
Contact us at FederatedInvestors.com
or call 1-800-341-7400.
Federated Securities Corp., Distributor
CUSIP 314172644
26851 (12/12)
Federated is a registered trademark of Federated Investors, Inc.
2012 ©Federated Investors, Inc.
Annual Shareholder Report
October 31, 2012
| Share Class | Ticker |
| A | KLCAX |
| C | KLCCX |
| R | KLCKX |
| Institutional | KLCIX |
Federated Kaufmann Large Cap Fund
Fund Established 2007
A Portfolio of Federated Equity Funds
Not FDIC Insured • May Lose Value • No Bank Guarantee
Management's Discussion of Fund Performance (unaudited)
The Fund's total return, based on net asset value, for the 12-month reporting period ended October 31, 2012, was 15.37% for Institutional Shares, 15.08% for Class A Shares, 14.20% for Class C Shares and 14.46% for Class R Shares. The total return of the Fund's benchmark, the Russell 1000 Growth Index (R1000G),1 a broad-based securities market index, was 13.02% for the same period. The Fund's total return for the fiscal year reflected actual cash flows, transaction costs, and other expenses which were not reflected in the total return of the R1000G.
The following discussion will focus on the performance of the Fund's Institutional Shares.
Market OVERVIEW
As markets continued to digest corporate and macroeconomic results, volatility was evident in global equity markets with weakness corresponding to investor uncertainty during November 2011 and for the first half of the summer of 2012. Subsequently, stock markets rallied significantly posting strong returns throughout the remainder of the fiscal year. The Standard and Poor's 500 Index (S&P 500)2 bottomed in November 2011 and rallied strongly to finish the year up 15.21%. Overall large-cap stocks performed best, followed by mid-cap and small-cap stocks. In terms of investment style, value stocks significantly outperformed growth stocks across all three capitalization groups: small, mid and large.
Market conditions remained volatile and uncertain, with macroeconomic factors and news headlines still showing some progress on economic conditions globally; however, economic indicators can best be described during the reporting period as mixed.
Globally, central banks remained accommodative by keeping interest rates low and continuing the various bond purchase programs to reduce both sovereign and corporate interest rates. While monetary stimulus generally controlled by central banks has remained accommodative to economic growth, fiscal policies globally are being vigorously debated as to the correct balance between stimulating economic growth and reducing deficits.
Annual Shareholder Report
Fund Performance
The Fund outperformed the R1000G during the reporting period. Key factors affecting Fund performance included: stock selection, sector weightings and investment in international holdings.3
Approximately one-half of excess performance was due to strong stock selection. Companies that were strong performers and contributed most to the Fund's returns during the period were: Workday (+51%), Gilead Sciences (+60%), Apple (+48%), Prada Spa (+64%), Nxp Semiconductors (+35%), Lyondellbasell Industries (+34%), Visa (+50%), Ebay (+63%), Lululemon Athletica (+46%) and Express Scripts (+35%).
The ten worst contributing holdings during the period detracted from stock selection results: Zynga (-76%), Mongolian Mining (-53%), Central European Media (-51%), Expeditors International (-18%), Johnson Controls (-19%), Canadian Natural Resources (-25%), Citrix Systems (-15%), Caterpillar (-10%), Occidental Petroleum (-12%) and Valero Energy (-9%).
Fund performance benefited by overweighting Health Care and Financials sectors and market-weighting the Energy sector relative to the R1000G.
The Fund maintained exposure to growth companies outside of the U.S. Although stock selection in foreign holdings was generally strong, the exposure to foreign markets detracted somewhat from Fund performance.
The Fund was substantially invested in stocks during the reporting period, and the average holdings of cash equivalents was less than 2% during the period.
| 1 | The Russell 1000® Growth Index measures the performance of those Russell 1000 companies with higher price-to-book ratios and higher forecasted growth values. The index is unmanaged, and it is not possible to invest directly in an index. |
| 2 | The Standard and Poor's 500 Index is a capitalization-weighted index of 500 stocks designed to measure performance of the broad domestic economy through changes in the aggregate market value of 500 stocks representing all major industries. The index is unmanaged, and it is not possible to invest directly in an index. |
| 3 | International investing involves special risks including currency risk, increased volatility, political risks and differences in auditing and other financial standards. |
Annual Shareholder Report
FUND PERFORMANCE AND GROWTH OF A $10,000 INVESTMENT
The Average Annual Total Return table below shows returns for each class averaged over the stated periods. The graphs below illustrate the hypothetical investment of $10,0001 in the Federated Kaufmann Large Cap Fund (the “Fund”) from December 5, 2007 (start of performance) to October 31, 2012, compared to the Russell 1000 Growth Index (R1000G)2 and the Lipper Large Cap Growth Funds Index (LLCGFI).2
Average Annual Total Returns for the Period Ended 10/31/2012
(returns reflect all applicable sales charges and contingent deferred sales charges as specified below in footnote #1)
| Share Class | 1 Year | Start of
Performance* |
| Class A Shares | 8.79% | 4.02% |
| Class C Shares | 13.20% | 4.41% |
| Class R Shares | 14.46% | 4.78% |
| Institutional Shares | 15.37% | 5.51% |
| * | The Fund's Class A Shares, Class C Shares, Class R Shares and Institutional Shares start of performance date was December 5, 2007. |
Performance data quoted represents past performance which is no guarantee of future results. Investment return and principal value will fluctuate so that an investor's shares, when redeemed, may be worth more or less than their original cost. Mutual fund performance changes over time and current performance may be lower or higher than what is stated. For current to the most recent month-end performance and after-tax returns, visit FederatedInvestors.com or call 1-800-341-7400. Returns shown do not reflect the deduction of taxes that a shareholder would pay on Fund distributions or the redemption of Fund shares. Mutual funds are not obligations of or guaranteed by any bank and are not federally insured.
Annual Shareholder Report
Growth of a $10,000 Investment–CLASS A SHARES
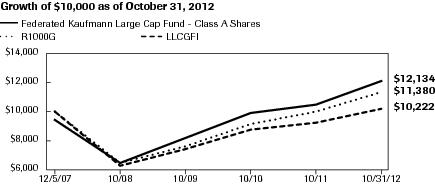
| Federated Kaufmann Large Cap Fund - Class A Shares | C000055072 | R1000G | LLCGFI |
| 12/5/2007 | 9,450 | 10,000 | 10,000 |
| 10/31/2008 | 6,502 | 6,516 | 6,337 |
| 10/31/2009 | 8,246 | 7,656 | 7,408 |
| 10/31/2010 | 9,981 | 9,161 | 8,761 |
| 10/31/2011 | 10,543 | 10,069 | 9,317 |
| 10/31/2012 | 12,134 | 11,380 | 10,222 |
41 graphic description end -->
| ■ | Total returns shown include the maximum sales charge of 5.50% ($10,000 investment minus $550 sales charge = $9,450). |
Growth of a $10,000 Investment–CLASS C SHARES

| Federated Kaufmann Large Cap Fund - Class C Shares | C000055073 | R1000G | LLCGFI |
| 12/5/2007 | 10,000 | 10,000 | 10,000 |
| 10/31/2008 | 6,850 | 6,516 | 6,337 |
| 10/31/2009 | 8,610 | 7,656 | 7,408 |
| 10/31/2010 | 10,330 | 9,161 | 8,761 |
| 10/31/2011 | 10,820 | 10,069 | 9,317 |
| 10/31/2012 | 12,356 | 11,380 | 10,222 |
41 graphic description end -->
| ■ | Total returns shown include the maximum contingent deferred sales charge of 1.00%, as applicable. |
Annual Shareholder Report
Growth of a $10,000 Investment–CLASS R SHARES

| Federated Kaufmann Large Cap Fund - Class R Shares | C000055074 | R1000G | LLCGFI |
| 12/5/2007 | 10,000 | 10,000 | 10,000 |
| 10/31/2008 | 6,870 | 6,516 | 6,337 |
| 10/31/2009 | 8,664 | 7,656 | 7,408 |
| 10/31/2010 | 10,442 | 9,161 | 8,761 |
| 10/31/2011 | 10,984 | 10,069 | 9,317 |
| 10/31/2012 | 12,572 | 11,380 | 10,222 |
41 graphic description end -->
Growth of a $10,000 Investment–Institutional Shares
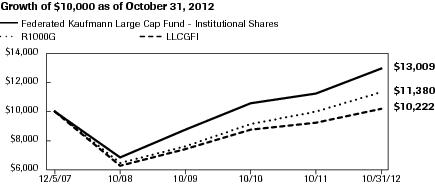
| Federated Kaufmann Large Cap Fund - Institutional Shares | C000055075 | R1000G | LLCGFI |
| 12/5/2007 | 10,000 | 10,000 | 10,000 |
| 10/31/2008 | 6,900 | 6,516 | 6,337 |
| 10/31/2009 | 8,772 | 7,656 | 7,408 |
| 10/31/2010 | 10,648 | 9,161 | 8,761 |
| 10/31/2011 | 11,275 | 10,069 | 9,317 |
| 10/31/2012 | 13,009 | 11,380 | 10,222 |
41 graphic description end -->
| 1 | Represents a hypothetical investment of $10,000 in the Fund after deducting applicable sales charges: For Class A Shares, the maximum sales charge of 5.50% ($10,000 investment minus $550 sales charge = $9,450); for Class C Shares, a 1.00% contingent deferred sales charge would be applied to any redemption less than one year from the purchase date. The Fund's performance assumes the reinvestment of all dividends and distributions. The R1000G and the LLCGFI have been adjusted to reflect the reinvestment of dividends on securities in the R1000G and the funds in the LLCGFI. |
| 2 | The R1000G is not adjusted to reflect expenses or other fees that the Securities and Exchange Commission requires to be reflected in the Fund's performance. The LLCGFI represents the composite performance of the 30 largest funds by assets in the Lipper Large Cap Growth category, and is not adjusted to reflect any sales charges. The R1000G in unmanaged and, unlike the Fund, is not affected by cash flows. It is not possible to invest directly in an index. |
Annual Shareholder Report
Portfolio of Investments Summary Table (unaudited)
At October 31, 2012, the Fund's sector composition1 was as follows:
| Sector Composition | Percentage of
Total Net Assets |
| Information Technology | 28.3% |
| Health Care | 16.5% |
| Consumer Discretionary | 14.7% |
| Financials | 14.5% |
| Energy | 10.5% |
| Industrials | 9.8% |
| Materials | 3.1% |
| Securities Lending Collateral2 | 0.6% |
| Cash Equivalents3 | 2.5% |
| Other Assets and Liabilities—Net4 | (0.5)% |
| TOTAL | 100.0% |
| 1 | Except for Securities Lending Collateral, Cash Equivalents and Other Assets and Liabilities, sector classifications are based upon, and individual portfolio securities are assigned to, the classifications of the Global Industry Classification Standard (GICS) except that the Adviser assigns a classification to securities not classified by the GICS and to securities for which the Adviser does not have access to the classification made by the GICS. |
| 2 | Cash collateral received from lending portfolio securities which is invested in short-term investments such as repurchase agreements or money market mutual funds. |
| 3 | Cash Equivalents include any investments in money market mutual funds and/or overnight repurchase agreements other than those representing securities lending collateral. |
| 4 | Assets, other than investments in securities, less liabilities. See Statement of Assets and Liabilities.
|
Annual Shareholder Report
Portfolio of Investments
October 31, 2012
| Shares | | | |
| | COMMON STOCKS—97.4% | |
| | Consumer Discretionary—14.7% | |
| 407,600 | 1,2 | Central European Media Enterprises Ltd., Class A | $2,184,736 |
| 111,600 | | Johnson Controls, Inc. | 2,873,700 |
| 156,200 | | Las Vegas Sands Corp. | 7,253,928 |
| 81,400 | 1 | Lululemon Athletica, Inc. | 5,617,414 |
| 326,814 | 1,2 | Melco PBL Entertainment (Macau) Ltd., ADR | 4,742,071 |
| 135,000 | 1 | Michael Kors Holdings Ltd. | 7,383,150 |
| 919,000 | | Prada Holding SpA | 7,500,178 |
| 164,600 | | Starbucks Corp. | 7,555,140 |
| 99,800 | | Target Corp. | 6,362,250 |
| | TOTAL | 51,472,567 |
| | Energy—10.5% | |
| 97,400 | | Anadarko Petroleum Corp. | 6,702,094 |
| 200,400 | | Cenovus Energy, Inc. | 7,076,124 |
| 206,400 | | Halliburton Co. | 6,664,656 |
| 117,000 | | Schlumberger Ltd. | 8,135,010 |
| 273,500 | | Valero Energy Corp. | 7,958,850 |
| | TOTAL | 36,536,734 |
| | Financials—14.5% | |
| 428,000 | 1 | American International Group, Inc. | 14,950,040 |
| 36,700 | | BlackRock, Inc. | 6,961,256 |
| 138,600 | | Capital One Financial Corp. | 8,339,562 |
| 46,500 | | Goldman Sachs Group, Inc. | 5,691,135 |
| 182,700 | | J.P. Morgan Chase & Co. | 7,614,936 |
| 206,000 | | Wells Fargo & Co. | 6,940,140 |
| | TOTAL | 50,497,069 |
| | Health Care—16.5% | |
| 61,000 | 1 | Biogen Idec, Inc. | 8,431,420 |
| 139,800 | 1 | Express Scripts Holding Co. | 8,603,292 |
| 210,000 | 1 | Gilead Sciences, Inc. | 14,103,600 |
| 1,500,000 | 1 | IHH Heathcare Bhd | 1,610,309 |
| 26,917 | 1 | Regeneron Pharmaceuticals, Inc. | 3,830,289 |
| 90,000 | | UnitedHealth Group, Inc. | 5,040,000 |
| 101,400 | 1 | Varian Medical Systems, Inc. | 6,769,464 |
| 106,700 | 1 | Watson Pharmaceuticals, Inc. | 9,170,865 |
| | TOTAL | 57,559,239 |
Annual Shareholder Report
| Shares | | | |
| | COMMON STOCKS—continued | |
| | Industrials—9.8% | |
| 59,800 | | Caterpillar, Inc. | $5,071,638 |
| 73,200 | | FedEx Corp. | 6,733,668 |
| 64,800 | | Kuehne & Nagel International AG | 7,563,363 |
| 236,300 | 1 | Owens Corning, Inc. | 7,937,317 |
| 40,000 | | Precision Castparts Corp. | 6,922,800 |
| | TOTAL | 34,228,786 |
| | Information Technology—28.3% | |
| 318,200 | | Amadeus IT Holding SA | 7,877,504 |
| 15,900 | | Apple, Inc. | 9,462,090 |
| 126,000 | 1 | Citrix Systems, Inc. | 7,788,060 |
| 140,200 | 1 | eBay, Inc. | 6,770,258 |
| 13,200 | 1 | Mail.RU Group Ltd., GDR | 440,220 |
| 151,894 | 1,3,4 | Mail.RU Group Ltd., Series 144A, GDR | 5,065,665 |
| 13,300 | | Mastercard, Inc. | 6,130,369 |
| 210,000 | | Microsoft Corp. | 5,992,350 |
| 424,500 | 1 | NXP Semiconductors NV | 10,298,370 |
| 162,500 | | Qualcomm, Inc. | 9,518,437 |
| 44,734 | 1 | Salesforce.com, Inc. | 6,530,269 |
| 434,250 | 1 | Vantiv, Inc. | 8,763,165 |
| 56,500 | | Visa, Inc., Class A | 7,839,940 |
| 134,000 | 1 | Workday, Inc. | 6,499,000 |
| | TOTAL | 98,975,697 |
| | Materials—3.1% | |
| 200,000 | | LyondellBasell Industries NV, Class A | 10,678,000 |
| | TOTAL COMMON STOCKS
(IDENTIFIED COST $281,904,703) | 339,948,092 |
| | MUTUAL FUND—3.1% | |
| 10,959,586 | 5,6,7 | Federated Prime Value Obligations Fund, Institutional Shares, 0.16%
(AT NET ASSET VALUE) | 10,959,586 |
| | TOTAL INVESTMENTS—100.5%
(IDENTIFIED COST $292,864,289)8 | 350,907,678 |
| | OTHER ASSETS AND LIABILITIES - NET—(0.5)%9 | (1,666,690) |
| | TOTAL NET ASSETS—100% | $349,240,988 |
| 1 | Non-income producing security. |
| 2 | All or a portion of these securities are temporarily on loan to unaffiliated broker/dealers. |
| 3 | Denotes a restricted security that either: (a) cannot be offered for public sale without first being registered, or being able to take advantage of an exemption from registration, under the Securities Act of 1933; or (b) is subject to a contractual restriction on public sales. At October 31, 2012, these restricted securities amounted to $5,065,665, which represented 1.5% of total net assets. |
Annual Shareholder Report
| 4 | Denotes a restricted security that may be resold without restriction to “qualified institutional buyers” as defined in Rule 144A under the Securities Act of 1933 and that the Fund has determined to be liquid under criteria established by the Fund's Board of Trustees (the “Trustees”). At October 31, 2012, these liquid restricted securities amounted to $5,065,665, which represented 1.5% of total net assets. |
| 5 | Affiliated holding. |
| 6 | 7-Day net yield. |
| 7 | All or a portion of this security is held as collateral for securities lending. |
| 8 | The cost of investments for federal tax purposes amounts to $294,834,770. |
| 9 | Assets, other than investments in securities, less liabilities. See Statement of Assets and Liabilities. |
Note: The categories of investments are shown as a percentage of total net assets at October 31, 2012.
Various inputs are used in determining the value of the Fund's investments. These inputs are summarized in the three broad levels listed below:
Level 1—quoted prices in active markets for identical securities, including investment companies with daily net asset values, if applicable.
Level 2—other significant observable inputs (including quoted prices for similar securities, interest rates, prepayment speeds, credit risk, etc.). Also includes securities valued at amortized cost.
Level 3—significant unobservable inputs (including the Fund's own assumptions in determining the fair value of investments).
The inputs or methodology used for valuing securities are not an indication of the risk associated with investing in those securities.
The following is a summary of the inputs used, as of October 31, 2012, in valuing the Fund's assets carried at fair value:
| Valuation Inputs |
| Level 1—
Quoted
Prices and
Investments in
Mutual Funds | Level 2—
Other
Significant
Observable
Inputs | Level 3—
Significant
Unobservable
Inputs | Total |
| Equity Securities: | | | | |
| Common Stock | | | | |
| Domestic | $259,393,394 | $— | $— | $259,393,394 |
| International | 75,489,033 | 5,065,665 | — | 80,554,698 |
| Mutual Fund | 10,959,586 | — | — | 10,959,586 |
| TOTAL SECURITIES | $345,842,013 | $5,065,665 | $— | $350,907,678 |
The following acronyms are used throughout this portfolio:
| ADR | —American Depositary Receipt |
| GDR | —Global Depository Receipt |
See Notes which are an integral part of the Financial Statements
Annual Shareholder Report
Financial Highlights–Class A Shares
(For a Share Outstanding Throughout Each Period)
| Year Ended October 31, | Period
Ended
10/31/20081 |
| 2012 | 2011 | 2010 | 2009 |
| Net Asset Value, Beginning of Period | $11.07 | $10.53 | $8.69 | $6.88 | $10.00 |
| Income From Investment Operations: | | | | | |
| Net investment income (loss) | (0.04)2 | (0.04)2 | 0.092 | 0.052 | 0.032 |
| Net realized and unrealized gain (loss) on investments and foreign currency transactions | 1.64 | 0.63 | 1.75 | 1.78 | (3.15) |
| TOTAL FROM INVESTMENT OPERATIONS | 1.60 | 0.59 | 1.84 | 1.83 | (3.12) |
| Less Distributions: | | | | | |
| Distributions from net investment income | — | (0.05) | (0.00)3 | (0.02) | — |
| Distributions from net realized gain on investments and foreign currency transactions | (0.45) | (0.00)3 | — | — | — |
| TOTAL DISTRIBUTIONS | (0.45) | (0.05) | (0.00)3 | (0.02) | |
| Net Asset Value, End of Period | $12.22 | $11.07 | $10.53 | $8.69 | $6.88 |
| Total Return4 | 15.08% | 5.63% | 21.18% | 26.68% | (31.20)% |
| Ratios to Average Net Assets: | | | | | |
| Net expenses | 1.50% | 1.50%5 | 1.50%5 | 1.50%5 | 1.50%6 |
| Net investment income (loss) | (0.34)% | (0.37)% | 0.94% | 0.67% | 0.37%6 |
| Expense waiver/reimbursement7 | 0.49% | 0.56% | 0.75% | 1.26% | 1.88%6 |
| Supplemental Data: | | | | | |
| Net assets, end of period (000 omitted) | $142,229 | $140,128 | $89,815 | $60,203 | $31,156 |
| Portfolio turnover | 94% | 128% | 69% | 170% | 70% |
| 1 | Reflects operations for the period from December 5, 2007 (date of initial investment) to October 31, 2008. |
| 2 | Per share numbers have been calculated using the average shares method. |
| 3 | Represents less than $0.01. |
| 4 | Based on net asset value, which does not reflect the sales charge, redemption fee or contingent deferred sales charge, if applicable. Total returns for periods of less than one year are not annualized. |
| 5 | The net expense ratio is calculated without reduction for fees paid indirectly for expense offset arrangements. The net expense ratios are 1.50%, 1.49% and 1.50% for the years ended October 31, 2011, 2010 and 2009, respectively, after taking into account these expense reductions. |
| 6 | Computed on an annualized basis. |
| 7 | This expense decrease is reflected in both the net expense and the net investment income (loss) ratios shown above. |
See Notes which are an integral part of the Financial Statements
Annual Shareholder Report
Financial Highlights–Class C Shares
(For a Share Outstanding Throughout Each Period)
| Year Ended October 31, | Period
Ended
10/31/20081 |
| 2012 | 2011 | 2010 | 2009 |
| Net Asset Value, Beginning of Period | $10.82 | $10.33 | $8.60 | $6.85 | $10.00 |
| Income From Investment Operations: | | | | | |
| Net investment income (loss) | (0.13)2 | (0.13)2 | 0.012 | (0.01)2 | (0.04)2 |
| Net realized and unrealized gain (loss) on investments and foreign currency transactions | 1.60 | 0.62 | 1.72 | 1.76 | (3.11) |
| TOTAL FROM INVESTMENT OPERATIONS | 1.47 | 0.49 | 1.73 | 1.75 | (3.15) |
| Less Distributions: | | | | | |
| Distributions from net realized gain on investments and foreign currency transactions | (0.45) | — | — | — | — |
| Net Asset Value, End of Period | $11.84 | $10.82 | $10.33 | $8.60 | $6.85 |
| Total Return3 | 14.20% | 4.74% | 20.12% | 25.55% | (31.50)% |
| Ratios to Average Net Assets: | | | | | |
| Net expenses | 2.34% | 2.33%4 | 2.34%4 | 2.32%4 | 2.33%5 |
| Net investment income (loss) | (1.15)% | (1.20)% | 0.14% | (0.12)% | (0.46)%5 |
| Expense waiver/reimbursement6 | 0.40% | 0.48% | 0.68% | 1.19% | 1.82%5 |
| Supplemental Data: | | | | | |
| Net assets, end of period (000 omitted) | $81,269 | $69,810 | $47,002 | $32,721 | $16,307 |
| Portfolio turnover | 94% | 128% | 69% | 170% | 70% |
| 1 | Reflects operations for the period from December 5, 2007 (date of initial investment) to October 31, 2008. |
| 2 | Per share numbers have been calculated using the average shares method. |
| 3 | Based on net asset value, which does not reflect the sales charge, redemption fee or contingent deferred sales charge, if applicable. Total returns for periods of less than one year are not annualized. |
| 4 | The net expense ratio is calculated without reduction for fees paid indirectly for expense offset arrangements. The net expense ratios are 2.33%, 2.33% and 2.31% for the years ended October 31, 2011, 2010 and 2009, respectively, after taking into account these expense reductions. |
| 5 | Computed on an annualized basis. |
| 6 | This expense decrease is reflected in both the net expense and the net investment income (loss) ratios shown above. |
See Notes which are an integral part of the Financial Statements
Annual Shareholder Report
Financial Highlights–Class R Shares
(For a Share Outstanding Throughout Each Period)
| Year Ended October 31, | Period
Ended
10/31/20081 |
| 2012 | 2011 | 2010 | 2009 |
| Net Asset Value, Beginning of Period | $10.91 | $10.40 | $8.63 | $6.87 | $10.00 |
| Income From Investment Operations: | | | | | |
| Net investment income (loss) | (0.09)2 | (0.07)2 | 0.082 | 0.012 | (0.01)2 |
| Net realized and unrealized gain (loss) on investments and foreign currency transactions | 1.60 | 0.61 | 1.69 | 1.78 | (3.12) |
| TOTAL FROM INVESTMENT OPERATIONS | 1.51 | 0.54 | 1.77 | 1.79 | (3.13) |
| Less Distributions: | | | | | |
| Distributions from net investment income | — | (0.03) | — | (0.03) | — |
| Distributions from net realized gain on investments and foreign currency transactions | (0.45) | (0.00)3 | — | — | — |
| TOTAL DISTRIBUTIONS | (0.45) | (0.03) | — | (0.03) | — |
| Net Asset Value, End of Period | $11.97 | $10.91 | $10.40 | $8.63 | $6.87 |
| Total Return4 | 14.46% | 5.20% | 20.51% | 26.12% | (31.30)% |
| Ratios to Average Net Assets: | | | | | |
| Net expenses | 1.95% | 1.95%5 | 1.95%5 | 1.95%5 | 1.95%6 |
| Net investment income (loss) | (0.77)% | (0.65)% | 0.88% | 0.06% | (0.08)%6 |
| Expense waiver/reimbursement7 | 0.44% | 0.55% | 0.71% | 1.14% | 1.88%6 |
| Supplemental Data: | | | | | |
| Net assets, end of period (000 omitted) | $19,688 | $16,393 | $1,901 | $332 | $2 |
| Portfolio turnover | 94% | 128% | 69% | 170% | 70% |
| 1 | Reflects operations for the period from December 5, 2007 (date of initial investment) to October 31, 2008. |
| 2 | Per share numbers have been calculated using the average shares method. |
| 3 | Represents less than $0.01. |
| 4 | Based on net asset value. Total returns for periods of less than one year are not annualized. |
| 5 | The net expense ratio is calculated without reduction for fees paid indirectly for expense offset arrangements. The net expense ratios are 1.95%, 1.94% and 1.95% for the years ended October 31, 2011, 2010 and 2009, respectively, after taking into account these expense reductions. |
| 6 | Computed on an annualized basis. |
| 7 | This expense decrease is reflected in both the net expense and the net investment income (loss) ratios shown above. |
See Notes which are an integral part of the Financial Statements
Annual Shareholder Report
Financial Highlights–Institutional Shares
(For a Share Outstanding Throughout Each Period)
| Year Ended October 31, | Period
Ended
10/31/20081 |
| 2012 | 2011 | 2010 | 2009 |
| Net Asset Value, Beginning of Period | $11.13 | $10.58 | $8.73 | $6.90 | $10.00 |
| Income From Investment Operations: | | | | | |
| Net investment income (loss) | (0.01)2 | (0.01)2 | 0.162 | 0.072 | 0.052 |
| Net realized and unrealized gain (loss) on investments and foreign currency transactions | 1.65 | 0.63 | 1.70 | 1.79 | (3.15) |
| TOTAL FROM INVESTMENT OPERATIONS | 1.64 | 0.62 | 1.86 | 1.86 | (3.10) |
| Less Distributions: | | | | | |
| Distributions from net investment income | — | (0.07) | (0.01) | (0.03) | — |
| Distributions from net realized gain on investments and foreign currency transactions | (0.45) | (0.00)3 | — | — | — |
| TOTAL DISTRIBUTIONS | (0.45) | (0.07) | (0.01) | (0.03) | — |
| Net Asset Value, End of Period | $12.32 | $11.13 | $10.58 | $8.73 | $6.90 |
| Total Return4 | 15.37% | 5.89% | 21.38% | 27.13% | (31.00)% |
| Ratios to Average Net Assets: | | | | | |
| Net expenses | 1.25% | 1.25%5 | 1.25%5 | 1.25%5 | 1.25%6 |
| Net investment income (loss) | (0.07)% | (0.10)% | 1.62% | 0.95% | 0.62%6 |
| Expense waiver/reimbursement7 | 0.45% | 0.52% | 0.68% | 1.18% | 1.88%6 |
| Supplemental Data: | | | | | |
| Net assets, end of period (000 omitted) | $106,055 | $93,222 | $54,905 | $15,931 | $2,446 |
| Portfolio turnover | 94% | 128% | 69% | 170% | 70% |
| 1 | Reflects operations for the period from December 5, 2007 (date of initial investment) to October 31, 2008. |
| 2 | Per share numbers have been calculated using the average shares method. |
| 3 | Represents less than $0.01. |
| 4 | Based on net asset value. Total returns for periods of less than one year are not annualized. |
| 5 | The net expense ratio is calculated without reduction for fees paid indirectly for expense offset arrangements. The net expense ratios are 1.25%, 1.24% and 1.25% for the years ended October 31, 2011, 2010 and 2009, respectively, after taking into account these expense reductions. |
| 6 | Computed on an annualized basis. |
| 7 | This expense decrease is reflected in both the net expense and the net investment income (loss) ratios shown above. |
See Notes which are an integral part of the Financial Statements
Annual Shareholder Report
Statement of Assets and Liabilities
October 31, 2012
| Assets: | | |
| Total investment in securities, at value including $1,874,911 of securities loaned and $10,959,586 of investment in an affiliated holding (Note 5) (identified cost $292,864,289) | | $350,907,678 |
| Cash denominated in foreign currencies (identified cost $7) | | 6 |
| Income receivable | | 100,790 |
| Receivable for shares sold | | 1,129,685 |
| Other assets | | 10,260 |
| TOTAL ASSETS | | 352,148,419 |
| Liabilities: | | |
| Payable for shares redeemed | $341,361 | |
| Payable for collateral due to broker for securities lending | 2,266,500 | |
| Payable for transfer and dividend disbursing agent fees and expenses | 79,365 | |
| Payable for Directors'/Trustees' fees | 428 | |
| Payable for distribution services fee (Note 5) | 59,517 | |
| Payable for shareholder services fee (Note 5) | 76,868 | |
| Accrued expenses | 83,392 | |
| TOTAL LIABILITIES | | 2,907,431 |
| Net assets for 28,764,466 shares outstanding | | $349,240,988 |
| Net Assets Consist of: | | |
| Paid-in capital | | $284,587,724 |
| Net unrealized appreciation of investments and translation of assets and liabilities in foreign currency | | 58,041,193 |
| Accumulated net realized gain on investments and foreign currency transactions | | 6,612,071 |
| TOTAL NET ASSETS | | $349,240,988 |
Annual Shareholder Report
Statement of Assets and Liabilities–continued
| Net Asset Value, Offering Price and Redemption Proceeds Per Share | | |
| Class A Shares: | | |
| Net asset value per share ($142,229,258 ÷ 11,642,878 shares outstanding), no par value, unlimited shares authorized | | $12.22 |
| Offering price per share (100/94.50 of $12.22) | | $12.93 |
| Redemption proceeds per share | | $12.22 |
| Class C Shares: | | |
| Net asset value per share ($81,268,563 ÷ 6,866,454 shares outstanding), no par value, unlimited shares authorized | | $11.84 |
| Offering price per share | | $11.84 |
| Redemption proceeds per share (99.00/100 of $11.84) | | $11.72 |
| Class R Shares: | | |
| Net asset value per share ($19,687,900 ÷ 1,644,108 shares outstanding), no par value, unlimited shares authorized | | $11.97 |
| Offering price per share | | $11.97 |
| Redemption proceeds per share | | $11.97 |
| Institutional Shares: | | |
| Net asset value per share ($106,055,267 ÷ 8,611,026 shares outstanding), no par value, unlimited shares authorized | | $12.32 |
| Offering price per share | | $12.32 |
| Redemption proceeds per share | | $12.32 |
See Notes which are an integral part of the Financial Statements
Annual Shareholder Report
Statement of Operations
Year Ended October 31, 2012
| Investment Income: | | | |
| Dividends (including $11,732 received from an affiliated holding (Note 5) and net of foreign taxes withheld of $147,789) | | | $3,884,377 |
| Expenses: | | | |
| Investment adviser fee (Note 5) | | $4,698,279 | |
| Administrative fee (Note 5) | | 270,911 | |
| Custodian fees | | 27,412 | |
| Transfer and dividend disbursing agent fees and expenses (Note 2) | | 429,159 | |
| Directors'/Trustees' fees | | 3,531 | |
| Auditing fees | | 39,476 | |
| Legal fees | | 9,677 | |
| Portfolio accounting fees | | 119,391 | |
| Distribution services fee (Note 5) | | 658,025 | |
| Shareholder services fee (Note 5) | | 531,583 | |
| Account administration fee (Note 2) | | 6,044 | |
| Share registration costs | | 101,393 | |
| Printing and postage | | 32,421 | |
| Insurance premiums | | 4,325 | |
| Miscellaneous | | 6,797 | |
| TOTAL EXPENSES | | 6,938,424 | |
| Waivers and Reimbursements: | | | |
| Waiver/reimbursement of investment adviser fee (Note 5) | $(1,276,495) | | |
| Waiver of administrative fee (Note 5) | (18,831) | | |
| Waiver of distribution services fee (Note 5) | (9,119) | | |
| Reimbursement of transfer and dividend disbursing agent fees and expenses (Note 2) | (197,282) | | |
| TOTAL WAIVERS AND REIMBURSEMENTS | | (1,501,727) | |
| Net expenses | | | 5,436,697 |
| Net investment income (loss) | | | (1,552,320) |
| Realized and Unrealized Gain on Investments and Foreign Currency Transactions: | | | |
| Net realized gain on investments and foreign currency transactions | | | 11,048,780 |
| Net change in unrealized appreciation of investments and translation of assets and liabilities in foreign currency | | | 37,344,589 |
| Net realized and unrealized gain on investments and foreign currency transactions | | | 48,393,369 |
| Change in net assets resulting from operations | | | $46,841,049 |
See Notes which are an integral part of the Financial Statements
Annual Shareholder Report
Statement of Changes in Net Assets
| Year ended October 31 | 2012 | 2011 |
| Increase (Decrease) in Net Assets | | |
| Operations: | | |
| Net investment income (loss) | $(1,552,320) | $(1,424,760) |
| Net realized gain on investments and foreign currency transactions | 11,048,780 | 16,936,568 |
| Net change in unrealized appreciation/depreciation of investments and translation of assets and liabilities in foreign currency | 37,344,589 | (8,583,489) |
| CHANGE IN NET ASSETS RESULTING FROM OPERATIONS | 46,841,049 | 6,928,319 |
| Distributions to Shareholders: | | |
| Distributions from net investment income | | |
| Class A Shares | — | (535,880) |
| Class R Shares | — | (6,861) |
| Institutional Shares | — | (401,071) |
| Distributions from net realized gain on investments and foreign currency transactions | | |
| Class A Shares | (5,472,649) | (230) |
| Class C Shares | (2,866,442) | — |
| Class R Shares | (680,325) | (3) |
| Institutional Shares | (3,696,969) | (173) |
| CHANGE IN NET ASSETS RESULTING FROM DISTRIBUTIONS TO SHAREHOLDERS | (12,716,385) | (944,218) |
| Share Transactions: | | |
| Proceeds from sale of shares | 119,462,149 | 227,200,879 |
| Net asset value of shares issued to shareholders in payment of distributions declared | 9,999,942 | 837,341 |
| Cost of shares redeemed | (133,899,332) | (108,091,891) |
| CHANGE IN NET ASSETS RESULTING FROM SHARE TRANSACTIONS | (4,437,241) | 119,946,329 |
| Change in net assets | 29,687,423 | 125,930,430 |
| Net Assets: | | |
| Beginning of period | 319,553,565 | 193,623,135 |
| End of period | $349,240,988 | $319,553,565 |
See Notes which are an integral part of the Financial Statements
Annual Shareholder Report
Notes to Financial Statements
October 31, 2012
1. ORGANIZATION
Federated Equity Funds (the “Trust”) is registered under the Investment Company Act of 1940, as amended (the “Act”), as an open-end management investment company. The Trust consists of 13 diversified portfolios. The financial statements included herein are only those of Federated Kaufmann Large Cap Fund (the “Fund”), a diversified portfolio. The financial statements of the other portfolios are presented separately. The assets of each portfolio are segregated and a shareholder's interest is limited to the portfolio in which shares are held. Each portfolio pays its own expenses. The Fund offers four classes of shares: Class A Shares, Class C Shares, Class R Shares and Institutional Shares. All shares of the Fund have equal rights with respect to voting, except on class-specific matters. The investment objective of the Fund is to provide capital appreciation.
2. SIGNIFICANT ACCOUNTING POLICIES
The following is a summary of significant accounting policies consistently followed by the Fund in the preparation of its financial statements. These policies are in conformity with U.S. generally accepted accounting principles (GAAP).
Investment Valuation
In calculating its net asset value (NAV), the Fund generally values investments as follows:
| ■ | Equity securities listed on an exchange or traded through a regulated market system are valued at their last reported sale price or official closing price in their principal exchange or market. |
| ■ | Fixed-income securities acquired with remaining maturities greater than 60 days are fair valued using price evaluations provided by a pricing service approved by the Trustees. |
| ■ | Fixed-income securities acquired with remaining maturities of 60 days or less are valued at their cost (adjusted for the accretion of any discount or amortization of any premium), which approximates market value. |
| ■ | Shares of other mutual funds are valued based upon their reported NAVs. |
| ■ | Derivative contracts listed on exchanges are valued at their reported settlement or closing price. |
| ■ | Over-the-counter (OTC) derivative contracts are fair valued using price evaluations provided by a pricing service approved by the Trustees. |
| ■ | For securities that are fair valued in accordance with procedures established by and under the general supervision of the Trustees, certain factors may be considered such as: the purchase price of the security, information obtained by contacting the issuer, analysis of the issuer's financial statements or other available documents, fundamental analytical data, the nature and duration of restrictions on disposition, the movement of the market in which the security is normally traded and public trading in similar securities of the issuer or comparable issuers. |
If the Fund cannot obtain a price or price evaluation from a pricing service for an investment, the Fund may attempt to value the investment based upon the mean of bid and asked quotations or fair value the investment based on price evaluations, from one or more dealers. If any price, quotation, price evaluation or other pricing source is not readily available when the NAV is calculated, the Fund uses the fair value of the investment determined in accordance with the procedures described below. There can be no assurance that the Fund could purchase or sell an investment at the price used to calculate the Fund's NAV.
Annual Shareholder Report
Fair Valuation and Significant Events Procedures
The Trustees have appointed a Valuation Committee comprised of officers of the Fund, Federated Equity Management Company of Pennsylvania (“Adviser”) and the Adviser's affiliated companies to determine fair value of securities and in overseeing the calculation of the NAV. The Trustees have also authorized the use of pricing services recommended by the Valuation Committee to provide fair value evaluations of the current value of certain investments for purposes of calculating the NAV. The Valuation Committee employs various methods for reviewing third-party pricing service evaluations including periodic reviews of third-party pricing services' policies, procedures and valuation methods (including key inputs and assumptions), transactional back-testing, comparisons of evaluations of different pricing services and review of price challenges by the Adviser based on recent market activity. In the event that market quotations and price evaluations are not available for an investment, the Valuation Committee determines the fair value of the investment in accordance with procedures adopted by the Trustees. The Trustees periodically review and approve the fair valuations made by the Valuation Committee and any changes made to the procedures.
Factors considered by pricing services in evaluating an investment include the yields or prices of investments of comparable quality, coupon, maturity, call rights and other potential prepayments, terms and type, reported transactions, indications as to values from dealers and general market conditions. Some pricing services provide a single price evaluation reflecting the bid-side of the market for an investment (a “bid” evaluation). Other pricing services offer both bid evaluations and price evaluations indicative of a price between the prices bid and asked for the investment (a “mid” evaluation). The Fund normally uses bid evaluations for U.S. Treasury and Agency securities and mortgage-backed securities. The Fund normally uses mid evaluations for other types of fixed-income securities and OTC derivative contracts. In the event that market quotations and price evaluations are not available for an investment, the fair value of the investment is determined in accordance with procedures adopted by the Trustees.
The Trustees also have adopted procedures requiring an investment to be priced at its fair value whenever the Adviser determines that a significant event affecting the value of the investment has occurred between the time as of which the price of the investment would otherwise be determined and the time as of which the NAV is computed. An event is considered significant if there is both an affirmative expectation that the investment's value will change in response to the event and a reasonable basis for quantifying the resulting change in value. Examples of significant events that may occur after the close of the principal market on which a security is traded, or after the time of a price evaluation provided by a pricing service or a dealer, include:
| ■ | With respect to securities traded in foreign markets, significant trends in U.S. equity markets or in the trading of foreign securities index futures contracts; |
| ■ | Political or other developments affecting the economy or markets in which an issuer conducts its operations or its securities are traded; and |
| ■ | Announcements concerning matters such as acquisitions, recapitalizations, litigation developments, a natural disaster affecting the issuer's operations or regulatory changes or market developments affecting the issuer's industry. |
Annual Shareholder Report
The Trustees have approved the use of a pricing service to determine the fair value of equity securities traded principally in foreign markets when the Adviser determines that there has been a significant trend in the U.S. equity markets or in index futures trading. For other significant events, the Fund may seek to obtain more current quotations or price evaluations from alternative pricing sources. If a reliable alternative pricing source is not available, the Fund will determine the fair value of the investment using another method approved by the Trustees.
Repurchase Agreements
The Fund may invest in repurchase agreements for short-term liquidity purposes. It is the policy of the Fund to require the other party to a repurchase agreement to transfer to the Fund's custodian or sub-custodian eligible securities or cash with a market value (after transaction costs) at least equal to the repurchase price to be paid under the repurchase agreement. The eligible securities are transferred to accounts with the custodian or sub-custodian in which the Fund holds a “securities entitlement” and exercises “control” as those terms are defined in the Uniform Commercial Code. The Fund has established procedures for monitoring the market value of the transferred securities and requiring the transfer of additional eligible securities if necessary to equal at least the repurchase price. These procedures also allow the other party to require securities to be transferred from the account to the extent that their market value exceeds the repurchase price or in exchange for other eligible securities of equivalent market value.
The insolvency of the other party or other failure to repurchase the securities may delay the disposition of the underlying securities or cause the Fund to receive less than the full repurchase price. Under the terms of the repurchase agreement, any amounts received by the Fund in excess of the repurchase price and related transaction costs must be remitted to the other party.
The Fund may enter into repurchase agreements in which eligible securities are transferred into joint trading accounts maintained by the custodian or sub-custodian for investment companies and other clients advised by the Fund's Adviser and its affiliates. The Fund will participate on a pro rata basis with the other investment companies and clients in its share of the securities transferred under such repurchase agreements and in its share of proceeds from any repurchase or other disposition of such securities.
Annual Shareholder Report
Investment Income, Gains and Losses, Expenses and Distributions
Investment transactions are accounted for on a trade-date basis. Realized gains and losses from investment transactions are recorded on an identified-cost basis. Interest income and expenses are accrued daily. Dividend income and distributions to shareholders are recorded on the ex-dividend date. Foreign dividends are recorded on the ex-dividend date or when the Fund is informed of the ex-dividend date. Distributions of net investment income, if any, are declared and paid annually. Non-cash dividends included in dividend income, if any, are recorded at fair value. Investment income, realized and unrealized gains and losses and certain fund-level expenses are allocated to each class based on relative average daily net assets, except that Class A Shares, Class C Shares, Class R Shares and Institutional Shares may bear distribution services fees, shareholder services fees, account administration fees and certain transfer and dividend disbursing agent fees unique to those classes. For the year ended October 31, 2012, transfer and dividend disbursing agent fees and account administration fees for the Fund were as follows:
| Transfer and
Dividend
Disbursing
Agent Fees
Incurred | Transfer and
Dividend
Disbursing
Agent Fees
Reimbursed | Account
Administration
Fees Incurred |
| Class A Shares | $191,861 | $(141,178) | $6,044 |
| Class C Shares | 99,831 | (4,967) | — |
| Class R Shares | 51,482 | — | — |
| Institutional Shares | 85,985 | (51,137) | — |
| TOTAL | $429,159 | $(197,282) | $6,044 |
Dividends are declared separately for each class. No class has preferential dividend rights; differences in per share dividend rates are generally due to differences in separate class expenses.
Premium and Discount Amortization
All premiums and discounts on fixed-income securities are amortized/accreted using the effective interest rate method.
Federal Taxes
It is the Fund's policy to comply with the Subchapter M provision of the Internal Revenue Code and to distribute to shareholders each year substantially all of its income. Accordingly, no provision for federal income tax is necessary. As of and during the year ended October 31, 2012, the Fund did not have a liability for any uncertain tax positions. The Fund recognizes interest and penalties, if any, related to tax liabilities as income tax expense in the Statement of Operations. As of October 31, 2012, tax years 2009 through 2012 remain subject to examination by the Fund's major tax jurisdictions, which include the United States of America and the Commonwealth of Massachusetts.
The Fund may be subject to taxes imposed by governments of countries in which it invests. Such taxes are generally based on either income or gains earned or repatriated. The Fund accrues and applies such taxes to net investment income, net realized gains and net unrealized gains as income and/or gains are earned.
Annual Shareholder Report
When-Issued and Delayed Delivery Transactions
The Fund may engage in when-issued or delayed delivery transactions. The Fund records when-issued securities on the trade date and maintains security positions such that sufficient liquid assets will be available to make payment for the securities purchased. Securities purchased on a when-issued or delayed delivery basis are marked to market daily and begin earning interest on the settlement date. Losses may occur on these transactions due to changes in market conditions or the failure of counterparties to perform under the contract.
Restricted Securities
The Fund may purchase securities which are considered restricted. Restricted securities are securities that either: (a) cannot be offered for public sale without first being registered, or being able to take advantage of an exemption from registration, under the Securities Act of 1933; or (b) are subject to contractual restrictions on public sales. In some cases, when a security cannot be offered for public sale without first being registered, the issuer of the restricted security has agreed to register such securities for resale, at the issuer's expense, either upon demand by the Fund or in connection with another registered offering of the securities. Many such restricted securities may be resold in the secondary market in transactions exempt from registration. Restricted securities may be determined to be liquid under criteria established by the Trustees. The Fund will not incur any registration costs upon such resales. The Fund's restricted securities are valued at the price provided by dealers in the secondary market or, if no market prices are available, at the fair value as determined in accordance with procedures established by and under the general supervision of the Trustees.
Foreign Exchange Contracts
The Fund enters into foreign exchange contracts for the delayed delivery of securities or foreign currency exchange transactions. The Fund enters into foreign exchange contracts to protect assets against adverse changes in foreign currency exchange rates or exchange control regulations. Purchased contracts are used to acquire exposure to foreign currencies, whereas, contracts to sell are used to hedge the Fund's securities against currency fluctuations. Risks may arise upon entering into these transactions from the potential inability of counterparties to meet the terms of their commitments and from unanticipated movements in security prices or foreign exchange rates. The foreign exchange contracts are adjusted by the daily exchange rate of the underlying currency and any gains or losses are recorded for financial statement purposes as unrealized until the settlement date.
At October 31, 2012, the Fund had no outstanding foreign exchange contracts.
The average value at settlement date payable of foreign exchange contracts purchased by the Fund throughout the period was $1,740. This is based on the contracts held as of each month-end throughout the fiscal period.
Foreign Currency Translation
The accounting records of the Fund are maintained in U.S. dollars. All assets and liabilities denominated in foreign currencies (FCs) are translated into U.S. dollars based on the rates of exchange of such currencies against U.S. dollars on the date of valuation. Purchases and sales of securities, income and expenses are translated at the rate of exchange quoted on the respective date that such transactions are recorded. The Fund does not isolate that portion of the results of operations resulting from changes in foreign exchange rates on investments from the fluctuations arising from changes in market prices of securities held. Such fluctuations are included with the net realized and unrealized gain or loss from investments.
Annual Shareholder Report
Reported net realized foreign exchange gains or losses arise from sales of portfolio securities, sales and maturities of short-term securities, sales of FCs, currency gains or losses realized between the trade and settlement dates on securities transactions, the difference between the amounts of dividends, interest and foreign withholding taxes recorded on the Fund's books and the U.S. dollar equivalent of the amounts actually received or paid. Net unrealized foreign exchange gains and losses arise from changes in the value of assets and liabilities other than investments in securities at fiscal year-end, resulting from changes in the exchange rate.
Securities Lending
The Fund participates in a securities lending program providing for the lending of equity securities to qualified brokers. The Fund normally receives cash collateral for securities loaned that is invested in an affiliated money market fund or in short-term securities including repurchase agreements. Collateral is maintained at a minimum level of 100% of the market value of investments loaned, plus interest, if applicable. Earnings on collateral are allocated between the borrower of the security, the securities lending agent, as a fee for its services under the program and the Fund, according to agreed-upon rates.
As of October 31, 2012, securities subject to this type of arrangement and related collateral were as follows:
Market Value of
Securities Loaned | Market Value
of Collateral |
| $1,874,911 | $2,266,500 |
Additional Disclosure Related to Derivative Instruments
The Effect of Derivative Instruments on the Statement of Operations for the Year Ended October 31, 2012
| Amount of Realized Gain or (Loss) on Derivatives Recognized in Income |
| Forward
Currency
Contracts |
| Foreign exchange contracts | $(3,549) |
Other
The preparation of financial statements in conformity with GAAP requires management to make estimates and assumptions that affect the amounts of assets, liabilities, expenses and revenues reported in the financial statements. Actual results could differ from those estimated.
Annual Shareholder Report
3. SHARES OF BENEFICIAL INTEREST
The following tables summarize share activity:
| Year Ended October 31 | 2012 | 2011 |
| Class A Shares: | Shares | Amount | Shares | Amount |
| Shares sold | 5,466,566 | $61,393,213 | 10,669,802 | $119,261,751 |
| Shares issued to shareholders in payment of distributions declared | 484,063 | 5,121,389 | 44,303 | 497,523 |
| Shares redeemed | (6,967,812) | (79,640,042) | (6,585,333) | (72,988,781) |
| NET CHANGE RESULTING FROM CLASS A SHARE TRANSACTIONS | (1,017,183) | $(13,125,440) | 4,128,772 | $ 46,770,493 |
| Year Ended October 31 | 2012 | 2011 |
| Class C Shares: | Shares | Amount | Shares | Amount |
| Shares sold | 1,705,524 | $19,056,014 | 3,339,989 | $37,039,734 |
| Shares issued to shareholders in payment of distributions declared | 192,649 | 1,990,071 | — | — |
| Shares redeemed | (1,480,980) | (16,413,466) | (1,439,791) | (15,675,897) |
| NET CHANGE RESULTING FROM CLASS C SHARE TRANSACTIONS | 417,193 | $4,632,619 | 1,900,198 | $21,363,837 |
| Year Ended October 31 | 2012 | 2011 |
| Class R Shares: | Shares | Amount | Shares | Amount |
| Shares sold | 728,500 | $8,178,109 | 1,573,657 | $17,644,634 |
| Shares issued to shareholders in payment of distributions declared | 65,353 | 680,325 | 618 | 6,864 |
| Shares redeemed | (652,963) | (7,312,038) | (253,821) | (2,723,526) |
| NET CHANGE RESULTING FROM CLASS R SHARE TRANSACTIONS | 140,890 | $1,546,396 | 1,320,454 | $14,927,972 |
| Year Ended October 31 | 2012 | 2011 |
| Institutional Shares: | Shares | Amount | Shares | Amount |
| Shares sold | 2,667,047 | $30,834,813 | 4,683,381 | $ 53,254,760 |
| Shares issued to shareholders in payment of distributions declared | 207,534 | 2,208,157 | 29,543 | 332,954 |
| Shares redeemed | (2,640,413) | (30,533,786) | (1,526,565) | (16,703,687) |
| NET CHANGE RESULTING FROM INSTITUTIONAL SHARE TRANSACTIONS | 234,168 | $2,509,184 | 3,186,359 | $ 36,884,027 |
| NET CHANGE RESULTING FROM TOTAL FUND SHARE TRANSACTIONS | (224,932) | $(4,437,241) | 10,535,783 | $119,946,329 |
Annual Shareholder Report
4. FEDERAL TAX INFORMATION
The timing and character of income and capital gain distributions are determined in accordance with income tax regulations, which may differ from GAAP. These differences are due to differing treatments for foreign currency transactions and net operating losses.
For the year ended October 31, 2012, permanent differences identified and reclassified among the components of net assets were as follows:
| Increase (Decrease) |
Undistributed
Net Investment
Income (Loss) | Accumulated
Net Realized
Gain (Loss) |
| $1,552,320 | $(1,552,320) |
Net investment income (loss), net realized gains (losses) and net assets were not affected by this reclassification.
The tax character of distributions as reported on the Statement of Changes in Net Assets for the years ended October 31, 2012 and 2011, was as follows:
| 2012 | 2011 |
| Ordinary income | $— | $943,812 |
| Long-term capital gains | $12,716,385 | $406 |
As of October 31, 2012, the components of distributable earnings on a tax basis were as follows:
| Undistributed ordinary income1 | $6,429,528 |
| Undistributed long-term capital gains | $2,153,024 |
| Net unrealized appreciation | $56,070,712 |
| 1 | For tax purposes, short-term capital gains are treated as ordinary income for distribution purposes. |
The difference between book-basis and tax-basis net unrealized appreciation/depreciation is attributable in part to differing treatments for the deferral of losses on wash sales.
At October 31, 2012, the cost of investments for federal tax purposes was $294,834,770. The net unrealized appreciation of investments for federal tax purposes excluding any unrealized depreciation resulting from changes in foreign currency exchange rates and foreign currency commitments was $56,072,908. This consists of net unrealized appreciation from investments for those securities having an excess of value over cost of $63,613,683 and net unrealized depreciation from investments for those securities having an excess of cost over value of $7,540,775.
Annual Shareholder Report
5. INVESTMENT ADVISER FEE AND OTHER TRANSACTIONS WITH AFFILIATES
Investment Adviser Fee
The advisory agreement between the Fund and the Adviser provides for an annual fee equal to 1.425% of the Fund's average daily net assets. Subject to the terms described in the Expense Limitation note, the Adviser may voluntarily choose to waive any portion of its fee. For the year ended October 31, 2012, the Adviser voluntarily waived $1,269,578 of its fee.
Certain of the Fund's assets are managed by Federated Global Investment Management Corp. (the “Sub-Adviser”). Under the terms of a sub-advisory agreement between the Adviser and the Sub-Adviser, the Sub-Adviser receives an allocable portion of the Fund's adviser fee. The fee is paid by the Adviser out of its resources and is not an incremental Fund expense. For the year ended October 31, 2012, the Sub-Adviser earned a fee of $3,874,020.
Administrative Fee
Federated Administrative Services (FAS), under the Administrative Services Agreement, provides the Fund with administrative personnel and services. The fee paid to FAS is based on the average aggregate daily net assets of certain Federated funds as specified below, plus certain out-of-pocket expenses:
| Administrative Fee | Average Aggregate Daily Net Assets
of the Federated Funds |
| 0.150% | on the first $5 billion |
| 0.125% | on the next $5 billion |
| 0.100% | on the next $10 billion |
| 0.075% | on assets in excess of $20 billion |
Prior to September 1, 2012, the administrative fee received during any fiscal year was at least $150,000 per portfolio and $40,000 per each additional class of Shares. Subject to the terms described in the Expense Limitation note, FAS may voluntarily choose to waive any portion of its fee. For the year ended October 31, 2012, FAS waived $18,831 of its fee. The net fee paid to FAS was 0.076% of average daily net assets of the Fund.
Distribution Services Fee
The Fund has adopted a Distribution Plan (the “Plan”) pursuant to Rule 12b-1 under the Act. Under the terms of the Plan, the Fund will compensate Federated Securities Corp. (FSC), the principal distributor, from the daily net assets of the Fund's Class A Shares, Class C Shares and Class R Shares to finance activities intended to result in the sale of these shares. The Plan provides that the Fund may incur distribution expenses at the following percentages of average daily net assets annually, to compensate FSC:
| Share Class Name | Percentage of Average Daily
Net Assets of Class |
| Class A Shares | 0.25% |
| Class C Shares | 0.75% |
| Class R Shares | 0.50% |
Annual Shareholder Report
Subject to the terms described in the Expense Limitation note, FSC may voluntarily choose to waive any portion of its fee. For the year ended October 31, 2012, distribution services fees for the Fund were as follows:
| Distribution
Services Fees
Incurred | Distribution
Services Fees
Waived |
| Class C Shares | $567,986 | $— |
| Class R Shares | 90,039 | (9,119) |
| TOTAL | $658,025 | $(9,119) |
When FSC receives fees, it may pay some or all of them to financial intermediaries whose customers purchase shares. For the year ended October 31, 2012, FSC retained $116,398 of fees paid by the Fund. For the year ended October 31, 2012, the Fund's Class A Shares did not incur a distribution services fee; however, it may begin to incur this fee upon approval of the Trustees.
Sales Charges
Front-end sales charges and contingent deferred sales charges (CDSC) do not represent expenses of the Fund. They are deducted from the proceeds of sales of Fund shares prior to investment or from redemption proceeds prior to remittance, as applicable. For the year ended October 31, 2012, FSC retained $62,782 in sales charges from the sale of Class A Shares. FSC also retained $788 of CDSC relating to redemptions of Class A Shares and $7,826 of CDSC related to redemptions of Class C Shares.
Shareholder Services Fee
The Fund may pay fees (“Service Fees”) up to 0.25% of the average daily net assets of the Fund's Class A Shares and Class C Shares to financial intermediaries or to Federated Shareholder Services Company (FSSC) for providing services to shareholders and maintaining shareholder accounts. Subject to the terms described in the Expense Limitation note, FSSC may voluntarily reimburse the Fund for Service Fees. For the year ended October 31, 2012, Service Fees for the Fund were as follows:
| Service Fees
Incurred |
| Class A Shares | $342,254 |
| Class C Shares | 189,329 |
| TOTAL | $531,583 |
For the year ended October 31, 2012, FSSC did not receive any fees paid by the Fund.
Annual Shareholder Report
Expense Limitation
The Adviser and its affiliates (which may include FSC, FAS and FSSC) have voluntarily agreed to waive their fees and/or reimburse expenses so that the total annual fund operating expenses (as shown in the financial highlights) paid by the Fund's Class A Shares, Class C Shares, Class R Shares and Institutional Shares (after the voluntary waivers and/or reimbursements) will not exceed 1.50%, 2.34%, 1.95% and 1.25% (the “Fee Limit”), respectively, up to but not including the later of (the “Termination Date”): (a) January 1, 2014; or (b) the date of the Fund's next effective Prospectus. While the Adviser and its affiliates currently do not anticipate terminating or increasing these arrangements prior to the Termination Date, these arrangements may only be terminated or the Fee Limit increased prior to the Termination Date with the agreement of the Trustees.
General
Certain Officers and Trustees of the Fund are Officers and Directors or Trustees of the above companies.
Transactions Involving Affiliated Holdings
Affiliated holdings are mutual funds which are managed by the Adviser or an affiliate of the Adviser. The Adviser has agreed to reimburse the Fund for certain investment adviser fees as a result of transactions in other affiliated mutual funds. For the year ended October 31, 2012, the Adviser reimbursed $6,917. Transactions involving the affiliated holding during the year ended October 31, 2012, were as follows:
| | | | Federated
Prime Value
Obligations Fund,
Institutional Shares |
| Balance of Shares Held 10/31/2011 | | | | 2,168,171 |
| Purchases/Additions | | | | 161,530,646 |
| Sales/Reductions | | | | 152,739,231 |
| Balance of Shares Held 10/31/2012 | | | | 10,959,586 |
| Value | | | | $10,959,586 |
| Dividend Income | | | | $11,732 |
6. Investment TRANSACTIONS
Purchases and sales of investments, excluding long-term U.S. government securities and short-term obligations, for the year ended October 31, 2012, were as follows:
| Purchases | $305,601,926 |
| Sales | $326,823,095 |
7. CONCENTRATION OF RISK
The Fund invests in securities of non-U.S. issuers. Political or economic developments may have an effect on the liquidity and volatility of portfolio securities and currency holdings.
Annual Shareholder Report
8. LINE OF CREDIT
The Fund participates in a $100,000,000 unsecured, uncommitted revolving line of credit (LOC) agreement with PNC Bank. The LOC was made available for extraordinary or emergency purposes, primarily for financing redemption payments. Borrowings are charged interest at a rate offered to the Fund by PNC Bank at the time of the borrowing. As of October 31, 2012, there were no outstanding loans. During the year ended October 31, 2012, the Fund did not utilize the LOC.
9. INTERFUND LENDING
Pursuant to an Exemptive Order issued by the Securities and Exchange Commission, the Fund, along with other funds advised by subsidiaries of Federated Investors, Inc., may participate in an interfund lending program. This program provides an alternative credit facility allowing the Fund to borrow from other participating affiliated funds. As of October 31, 2012, there were no outstanding loans. During the year ended October 31, 2012, the program was not utilized.
10. FEDERAL TAX INFORMATION (UNAUDITED)
For the year ended October 31, 2012, the amount of long-term capital gains designated by the Fund was $12,716,385.
Annual Shareholder Report
Report of Independent Registered Public Accounting Firm
TO THE BOARD OF Trustees OF Federated Equity Funds AND SHAREHOLDERS OF Federated Kaufmann Large Cap Fund:
We have audited the accompanying statement of assets and liabilities of Federated Kaufmann Large Cap Fund (the “Fund”) (one of the portfolios constituting Federated Equity Funds), including the portfolio of investments, as of October 31, 2012, and the related statement of operations for the year then ended, the statement of changes in net assets for each of the two years in the period then ended and the financial highlights for each of the periods indicated therein. These financial statements and financial highlights are the responsibility of the Fund's management. Our responsibility is to express an opinion on these financial statements and financial highlights based on our audits.
We conducted our audits in accordance with standards of the Public Company Accounting Oversight Board (United States). Those standards require that we plan and perform the audit to obtain reasonable assurance about whether the financial statements and financial highlights are free of material misstatement. We were not engaged to perform an audit of the Fund's internal control over financial reporting. Our audits included consideration of internal control over financial reporting as a basis for designing audit procedures that are appropriate in the circumstances, but not for the purpose of expressing an opinion on the effectiveness of the Fund's internal control over financial reporting. Accordingly, we express no such opinion. An audit also includes examining, on a test basis, evidence supporting the amounts and disclosures in the financial statements and financial highlights, assessing the accounting principles used and significant estimates made by management, and evaluating the overall financial statement presentation. Our procedures included confirmation of securities owned as of October 31, 2012, by correspondence with the custodian and others. We believe that our audits provide a reasonable basis for our opinion.
In our opinion, the financial statements and financial highlights referred to above present fairly, in all material respects, the financial position of the Federated Kaufmann Large Cap Fund, a portfolio of Federated Equity Funds, at October 31, 2012, the results of its operations for the year then ended, the changes in its net assets for each of the two years in the period then ended and the financial highlights for each of the periods indicated therein, in conformity with U.S. generally accepted accounting principles.
Boston, Massachusetts
December 24, 2012
Annual Shareholder Report
Shareholder Expense Example (unaudited)
As a shareholder of the Fund, you incur two types of costs: (1) transaction costs, including sales charges (loads) on purchase or redemption payments; and (2) ongoing costs, including management fees and to the extent applicable, distribution (12b-1) fees and/or shareholder services fees and other Fund expenses. This Example is intended to help you to understand your ongoing costs (in dollars) of investing in the Fund and to compare these costs with the ongoing costs of investing in other mutual funds. It is based on an investment of $1,000 invested at the beginning of the period and held for the entire period from May 1, 2012 to October 31, 2012.
ACTUAL EXPENSES
The first section of the table below provides information about actual account values and actual expenses. You may use the information in this section, together with the amount you invested, to estimate the expenses that you incurred over the period. Simply divide your account value by $1,000 (for example, an $8,600 account value divided by $1,000 = 8.6), then multiply the result by the number in the first section under the heading entitled “Expenses Paid During Period” to estimate the expenses attributable to your investment during this period.
HYPOTHETICAL EXAMPLE FOR COMPARISON PURPOSES
The second section of the table below provides information about hypothetical account values and hypothetical expenses based on the Fund's actual expense ratio and an assumed rate of return of 5% per year before expenses, which is not the Fund's actual return. Thus, you should not use the hypothetical account values and expenses to estimate the actual ending account balance or your expenses for the period. Rather, these figures are required to be provided to enable you to compare the ongoing costs of investing in the Fund with other funds. To do so, compare this 5% hypothetical example with the 5% hypothetical examples that appear in the shareholder reports of the other funds.
Annual Shareholder Report
Please note that the expenses shown in the table are meant to highlight your ongoing costs only and do not reflect any transaction costs, such as sales charges (loads) on purchase or redemption payments. Therefore, the second section of the table is useful in comparing ongoing costs only, and will not help you determine the relative total costs of owning different funds. In addition, if these transaction costs were included, your costs would have been higher.
| Beginning
Account Value
5/1/2012 | Ending
Account Value
10/31/2012 | Expenses Paid
During Period1 |
| Actual: | | | |
| Class A Shares | $1,000 | $993.50 | $7.52 |
| Class C Shares | $1,000 | $989.10 | $11.70 |
| Class R Shares | $1,000 | $990.10 | $9.75 |
| Institutional Shares | $1,000 | $994.40 | $6.27 |
Hypothetical (assuming a 5% return
before expenses): | | | |
| Class A Shares | $1,000 | $1,017.60 | $7.61 |
| Class C Shares | $1,000 | $1,013.37 | $11.84 |
| Class R Shares | $1,000 | $1,015.33 | $9.88 |
| Institutional Shares | $1,000 | $1,018.85 | $6.34 |
| 1 | Expenses are equal to the Fund's annualized net expense ratios, multiplied by the average account value over the period, multiplied by 184/366 (to reflect the one-half-year period). The annualized net expense ratios are as follows: |
| Class A Shares | 1.50% |
| Class C Shares | 2.34% |
| Class R Shares | 1.95% |
| Institutional Shares | 1.25% |
Annual Shareholder Report
Board of Trustees and Trust Officers
The Board of Trustees is responsible for managing the Trust's business affairs and for exercising all the Trust's powers except those reserved for the shareholders. The following tables give information about each Trustee and the senior officers of the Fund. Where required, the tables separately list Trustees who are “interested persons” of the Fund (i.e., “Interested” Trustees) and those who are not (i.e., “Independent” Trustees). Unless otherwise noted, the address of each person listed is Federated Investors Tower, 1001 Liberty Avenue, Pittsburgh, PA 15222. The address of all Independent Trustees listed is 4000 Ericsson Drive, Warrendale, PA 15086-7561; Attention: Mutual Fund Board. As of December 31, 2011, the Trust comprised 13 portfolio(s), and the Federated Fund Family consisted of 43 investment companies (comprising 134 portfolios). Unless otherwise noted, each Officer is elected annually. Unless otherwise noted, each Trustee oversees all portfolios in the Federated Fund Family and serves for an indefinite term. The Fund's Statement of Additional Information includes additional information about Trust Trustees and is available, without charge and upon request, by calling 1-800-341-7400.
Interested Trustees Background
Name
Birth Date
Positions Held with Trust
Date Service Began | Principal Occupation(s) for Past Five Years,
Other Directorships Held and Previous Position(s) |
John F. Donahue*
Birth Date: July 28, 1924
Trustee
Began serving: April 1984 | Principal Occupations: Director or Trustee of the Federated Fund Family; Chairman and Director, Federated Investors, Inc.; Chairman of the Federated Fund Family's Executive Committee.
Previous Positions: Chairman of the Federated Fund Family; Trustee, Federated Investment Management Company; Chairman and Director, Federated Investment Counseling. |
J. Christopher Donahue*
Birth Date: April 11, 1949
President and Trustee
Began serving: January 2000 | Principal Occupations: Principal Executive Officer and President of the Federated Fund Family; Director or Trustee of some of the Funds in the Federated Fund Family; President, Chief Executive Officer and Director, Federated Investors, Inc.; Chairman and Trustee, Federated Investment Management Company; Trustee, Federated Investment Counseling; Chairman and Director, Federated Global Investment Management Corp.; Chairman, Federated Equity Management Company of Pennsylvania and Passport Research, Ltd. (investment advisory subsidiary of Federated); Trustee, Federated Shareholder Services Company; Director, Federated Services Company.
Previous Positions: President, Federated Investment Counseling; President and Chief Executive Officer, Federated Investment Management Company, Federated Global Investment Management Corp. and Passport Research, Ltd. |
| * | Family relationships and reasons for “interested” status: John F. Donahue is the father of J. Christopher Donahue; both are “interested” due to their beneficial ownership of shares of Federated Investors, Inc. and the positions they hold with Federated and its subsidiaries. |
Annual Shareholder Report
INDEPENDENT Trustees Background
Name
Birth Date
Positions Held with Trust
Date Service Began | Principal Occupation(s) for Past Five Years,
Other Directorships Held, Previous Position(s) and Qualifications |
Nicholas P. Constantakis, CPA
Birth Date: September 3, 1939
Trustee
Began serving: February 1998 | Principal Occupation: Director or Trustee of the Federated Fund Family.
Other Directorship Held: Director, Chairman of the Audit Committee, and member of the Compensation Committee, Michael Baker Corporation (architecture, engineering and construction services).
Previous Position: Partner, Andersen Worldwide SC.
Qualifications: Public accounting and director experience. |
John F. Cunningham
Birth Date: March 5, 1943
Trustee
Began serving: January 1999 | Principal Occupation: Director or Trustee of the Federated Fund Family.
Other Directorships Held: Chairman, President and Chief Executive Officer, Cunningham & Co., Inc. (strategic business consulting); Trustee Associate, Boston College.
Previous Positions: Director, Redgate Communications and EMC Corporation (computer storage systems); Chairman of the Board and Chief Executive Officer, Computer Consoles, Inc.; President and Chief Operating Officer, Wang Laboratories; Director, First National Bank of Boston; Director, Apollo Computer, Inc.
Qualifications: Business management and director experience. |
Maureen Lally-Green
Birth Date: July 5, 1949
Trustee
Began serving: August 2009 | Principal Occupations: Director or Trustee of the Federated Fund Family; Director, Office of Church Relations, Diocese of Pittsburgh; Adjunct Professor of Law, Duquesne University School of Law.
Other Directorships Held: Director, Auberle; Member, Pennsylvania State Board of Education; Director, Saint Vincent College; Director, Ireland Institute of Pittsburgh; Chair and Director, UPMC Mercy Hospital; Regent, St. Vincent Seminary; Director, Epilepsy Foundation of Western and Central Pennsylvania; Director, Saint Thomas More Society, Allegheny County; Director, Our Campaign for the Church Alive, Inc.
Previous Position: Pennsylvania Superior Court Judge.
Qualifications: Legal and director experience. |
Peter E. Madden
Birth Date: March 16, 1942
Trustee
Began serving: November 1991 | Principal Occupation: Director or Trustee, and Chairman of the Board of Directors or Trustees, of the Federated Fund Family.
Previous Positions: Representative, Commonwealth of Massachusetts General Court; President, Chief Operating Officer and Director, State Street Bank and Trust Company and State Street Corporation (retired); Director, VISA USA and VISA International; Chairman and Director, Massachusetts Bankers Association; Director, Depository Trust Corporation; Director, The Boston Stock Exchange.
Qualifications: Business management, mutual fund services and director experience. |
Annual Shareholder Report
Name
Birth Date
Positions Held with Trust
Date Service Began | Principal Occupation(s) for Past Five Years,
Other Directorships Held, Previous Position(s) and Qualifications |
Charles F. Mansfield, Jr.
Birth Date: April 10, 1945
Trustee
Began serving: January 1999 | Principal Occupations: Director or Trustee of the Federated Fund Family; Management Consultant.
Previous Positions: Chief Executive Officer, PBTC International Bank; Partner, Arthur Young & Company (now Ernst & Young LLP); Chief Financial Officer of Retail Banking Sector, Chase Manhattan Bank; Senior Vice President, HSBC Bank USA (formerly Marine Midland Bank); Vice President, Citibank; Assistant Professor of Banking and Finance, Frank G. Zarb School of Business, Hofstra University; Executive Vice President, DVC Group, Inc. (marketing, communications and technology).
Qualifications: Banking, business management, education and director experience. |
Thomas M. O'Neill
Birth Date: June 14, 1951
Trustee
Began serving: October 2006 | Principal Occupations: Director or Trustee, Vice Chairman of the Audit Committee of the Federated Fund Family; Sole Proprietor, Navigator Management Company (investment and strategic consulting).
Other Directorships Held: Board of Overseers, Children's Hospital of Boston; Visiting Committee on Athletics, Harvard College; Board of Directors, Medicines for Humanity; Board of Directors, The Golisano Children's Museum of Naples, Florida.
Previous Positions: Chief Executive Officer and President, Managing Director and Chief Investment Officer, Fleet Investment Advisors; President and Chief Executive Officer, Aeltus Investment Management, Inc.; General Partner, Hellman, Jordan Management Co., Boston, MA; Chief Investment Officer, The Putnam Companies, Boston, MA; Credit Analyst and Lending Officer, Fleet Bank; Director and Consultant, EZE Castle Software (investment order management software); Director, Midway Pacific (lumber).
Qualifications: Business management, mutual fund, director and investment experience. |
John S. Walsh
Birth Date: November 28, 1957
Trustee
Began serving: January 1999 | Principal Occupations: Director or Trustee, Chairman of the Audit Committee of the Federated Fund Family; President and Director, Heat Wagon, Inc. (manufacturer of construction temporary heaters); President and Director, Manufacturers Products, Inc. (distributor of portable construction heaters); President, Portable Heater Parts, a division of Manufacturers Products, Inc.
Previous Position: Vice President, Walsh & Kelly, Inc.
Qualifications: Business management and director experience. |
Annual Shareholder Report
OFFICERS
Name
Birth Date
Address
Positions Held with Trust
Date Service Began | Principal Occupation(s) for Past Five Years
and Previous Position(s) |
John W. McGonigle
Birth Date: October 26, 1938
EXECUTIVE VICE PRESIDENT AND SECRETARY
Officer since: April 1984 | Principal Occupations: Executive Vice President and Secretary of the Federated Fund Family; Vice Chairman, Executive Vice President, Secretary and Director, Federated Investors, Inc.
Previous Positions: Trustee, Federated Investment Management Company and Federated Investment Counseling; Director, Federated Global Investment Management Corp., Federated Services Company and Federated Securities Corp. |
Richard A. Novak
Birth Date: December 25, 1963
TREASURER
Officer since: January 2006 | Principal Occupations: Principal Financial Officer and Treasurer of the Federated Fund Family; Senior Vice President, Federated Administrative Services; Financial and Operations Principal for Federated Securities Corp., Edgewood Services, Inc. and Southpointe Distribution Services, Inc.
Previous Positions: Controller of Federated Investors, Inc.; Vice President, Finance of Federated Services Company; held various financial management positions within The Mercy Hospital of Pittsburgh; Auditor, Arthur Andersen & Co. |
Richard B. Fisher
Birth Date: May 17, 1923
VICE PRESIDENT
Officer since: April 1987 | Principal Occupations: Vice Chairman or Vice President of some of the Funds in the Federated Fund Family; Vice Chairman, Federated Investors, Inc.; Chairman, Federated Securities Corp.
Previous Positions: President and Director or Trustee of some of the Funds in the Federated Fund Family; Executive Vice President, Federated Investors, Inc.; Director and Chief Executive Officer, Federated Securities Corp. |
Peter J. Germain
Birth Date: September 3, 1959
CHIEF LEGAL OFFICER
Officer since: January 2005 | Principal Occupations: Mr. Germain is Chief Legal Officer of the Federated Fund Family. He is General Counsel and Vice President, Federated Investors, Inc.; President, Federated Administrative Services and Federated Administrative Services, Inc.; Vice President, Federated Securities Corp.; Secretary, Federated Private Asset Management, Inc.; and Secretary, Retirement Plan Service Company of America. Mr. Germain joined Federated in 1984 and is a member of the Pennsylvania Bar Association.
Previous Positions: Deputy General Counsel, Special Counsel, Managing Director of Mutual Fund Services, Federated Investors, Inc.; Senior Vice President, Federated Services Company; and Senior Corporate Counsel, Federated Investors, Inc. |
Brian P. Bouda
Birth Date: February 28, 1947
CHIEF COMPLIANCE OFFICER AND SENIOR VICE PRESIDENT
Officer since: August 2004 | Principal Occupations: Senior Vice President and Chief Compliance Officer of the Federated Fund Family; Vice President and Chief Compliance Officer of Federated Investors, Inc. and Chief Compliance Officer of its subsidiaries. Mr. Bouda joined Federated in 1999 and is a member of the American Bar Association and the State Bar Association of Wisconsin. |
Annual Shareholder Report
Name
Birth Date
Address
Positions Held with Trust
Date Service Began | Principal Occupation(s) for Past Five Years
and Previous Position(s) |
Stephen F. Auth
Birth Date: September 3, 1956
450 Lexington Avenue
Suite 3700
New York, NY 10017-3943
CHIEF INVESTMENT OFFICER
Officer since: November 2002 | Principal Occupations: Mr. Auth is Chief Investment Officer of this Fund and various other Funds in the Federated Fund Family; Executive Vice President, Federated Investment Counseling, Federated Global Investment Management Corp. and Federated Equity Management Company of Pennsylvania.
Previous Positions: Executive Vice President, Federated Investment Management Company, and Passport Research, Ltd. (investment advisory subsidiary of Federated); Senior Vice President, Global Portfolio Management Services Division; Senior Vice President, Federated Investment Management Company and Passport Research, Ltd.; Senior Managing Director and Portfolio Manager, Prudential Investments. |
Lawrence Auriana
Birth Date: January 8, 1944
140 East 45th Street
New York, NY 10017
VICE PRESIDENT
Officer since: November 2001
Portfolio Manager since: December 2007 | Principal Occupations: Lawrence Auriana has been the Fund's Portfolio Manager since December 2007. He is Vice President of the Trust. Mr. Auriana joined Federated in April 2001 as Co-Head of Investments/Federated Kaufmann. From August 1984 to April 2001, Mr. Auriana was President and Treasurer of Edgemont Asset Management Corp., and Chairman of the Board and Portfolio Manager to The Kaufmann Fund, Inc. (predecessor to the Federated Kaufmann Fund). Mr. Auriana earned a B.S. in economics from Fordham University and has been engaged in the securities business since 1965. |
Hans P. Utsch
Birth Date: July 3, 1936
140 East 45th Street
New York, NY 10017
VICE PRESIDENT
Officer since: November 2001
Portfolio Manager since: December 2007 | Principal Occupations: Hans P. Utsch has been the Fund's Portfolio Manager since December 2007. He is Vice President of the Trust. Mr. Utsch joined Federated in April 2001 as Co-Head of Investments/Federated Kaufmann. From August 1984 to April 2001, Mr. Utsch was Chairman of the Board and Secretary of Edgemont Asset Management Corp., and President and Portfolio Manager to The Kaufmann Fund, Inc. (predecessor to the Federated Kaufmann Fund). Mr. Utsch graduated from Amherst College and holds an M.B.A. from Columbia University. He has been engaged in the securities business since 1962. |
Annual Shareholder Report
Evaluation and Approval of Advisory Contract–May 2012
Federated Kaufmann Large Cap Fund (the “Fund”)
Following a review and recommendation of approval by the Fund's independent trustees, the Fund's Board reviewed and approved at its May 2012 meetings the Fund's investment advisory and subadvisory contracts for an additional one-year term. The Board's decision regarding these contracts reflects the exercise of its business judgment on whether to continue the existing arrangements.
In this connection, the Federated Funds' Board had previously appointed a Senior Officer, whose duties include specified responsibilities relating to the process by which advisory fees are to be charged to a Federated fund. The Senior Officer has the authority to retain consultants, experts, or staff as may be reasonably necessary to assist in the performance of his duties, reports directly to the Board, and may be terminated only with the approval of a majority of the independent members of the Board. The Senior Officer prepared and furnished to the Board an independent, written evaluation that covered topics discussed below (the “Evaluation”). The Board considered that Evaluation, along with other information, in deciding to approve the advisory and subadvisory contracts.
The Board is also familiar with and considered judicial decisions concerning allegedly excessive investment advisory fees, which have indicated that the following factors may be relevant to an Adviser's fiduciary duty with respect to its receipt of compensation from a fund: the nature and quality of the services provided by the Adviser to a fund and its shareholders, including the performance and expenses of the fund and of comparable funds; the Adviser's cost of providing the services, including the profitability to the Adviser of providing advisory services to a fund; the extent to which the Adviser may realize “economies of scale” as a fund grows larger and, if such economies exist, whether they have been shared with a fund and its shareholders; any “fall-out financial benefits” that accrue to the Adviser because of its relationship with a fund (including research services received from brokers that execute fund trades and any fees paid to affiliates of the Adviser for services rendered to a fund); comparative fee structures, including a comparison of fees paid to the Adviser with those paid by similar funds; and the extent to which the Board members are fully informed about all facts the Board deems relevant to its consideration of the Adviser's services and fees. Consistent with these judicial decisions, the Board also considered management fees (including any components thereof) charged to institutional and other clients of the Adviser and subadviser for what might be viewed as like services. The Board was aware of these factors and was guided by them in its review of the Fund's advisory and subadvisory contracts to the extent it considered them to be appropriate and relevant, as discussed further below.
Annual Shareholder Report
The Board considered and weighed these circumstances in light of its substantial accumulated experience in governing the Fund and working with Federated on matters relating to the Federated funds, and was assisted in its deliberations by independent legal counsel. Throughout the year, and in connection with its May meetings, the Board requested and received substantial and detailed information about the Fund and the Federated organization that was in addition to the extensive materials that comprise and accompany the Senior Officer's Evaluation. Federated provided much of this information at each regular meeting of the Board, and furnished additional substantial information in connection with the May meeting at which the Board's formal review of the advisory and subadvisory contracts occurred. At this May meeting, senior management of the Adviser also met with the independent trustees and their counsel to discuss the materials presented and any other matters thought relevant by the Adviser or the trustees. Between regularly scheduled meetings, the Board also received information on particular matters as the need arose. Thus, the Board's consideration of the advisory and subadvisory contracts included review of the Senior Officer's Evaluation, accompanying data and additional information covering such matters as: the Adviser's and subadviser's investment philosophy, revenue, profitability, personnel and processes; investment and operating strategies; the Fund's short- and long-term performance (in absolute terms, both on a gross basis and net of expenses, as well as in relationship to its particular investment program and certain competitor or “peer group” funds and/or other benchmarks, as appropriate), and comments on the reasons for performance; the Fund's investment objectives; the Fund's expenses (including the advisory fee itself and the overall expense structure of the Fund, both in absolute terms and relative to similar and/or competing funds, with due regard for contractual or voluntary expense limitations); the use and allocation of brokerage commissions derived from trading the Fund's portfolio securities (if any); and the nature, quality and extent of the advisory and other services provided to the Fund by the Adviser and its affiliates. The Board also considered the preferences and expectations of Fund shareholders; the entrepreneurial risk assumed by the Adviser in sponsoring the funds; the continuing state of competition in the mutual fund industry and market practices; the range of comparable fees for similar funds in the mutual fund industry; the Fund's relationship to the Federated family of funds which include a comprehensive array of funds with different investment objectives, policies and strategies which are available for exchange without the incurrence of additional sales charges; compliance and audit reports concerning the Federated funds and the Federated companies that service them (including communications from regulatory agencies), as well as Federated's responses to any issues raised therein; and relevant developments in the mutual fund industry and how the Federated funds and/or Federated are responding to them. The Board also considered that the longevity and experience of the Fund's portfolio management team and
Annual Shareholder Report
their unique approach to investing may limit the utility of comparisons to other equity mutual funds. The Board's evaluation process is evolutionary. The criteria considered and the emphasis placed on relevant criteria change in recognition of changing circumstances in the mutual fund marketplace.
While mindful that courts have cautioned against giving such comparisons too much weight, the Board has found the use of comparisons of the Fund's fees and expenses to other mutual funds with comparable investment programs to be relevant, given the high degree of competition in the mutual fund business. The Board focused on comparisons with other similar mutual funds more heavily than non-mutual fund products or services because it is believed that they are more relevant. For example, other mutual funds are the products most like the Fund, they are readily available to Fund shareholders as alternative investment vehicles, and they are the type of investment vehicle in fact chosen and maintained by the Fund's investors. The range of their fees and expenses therefore appears to be a generally reliable indication of what consumers have found to be reasonable in the precise marketplace in which the Fund competes. In this regard, the Senior Officer has reviewed Federated's fees for providing advisory services to products outside the Federated family of funds (e.g., institutional and separate accounts). He concluded that mutual funds and institutional accounts are inherently different products. Those differences include, but are not limited to, different types of targeted investors; being subject to different laws and regulations; different legal structures; different average account sizes; different associated costs; different portfolio management techniques made necessary by different cash flows; and portfolio manager time spent in review of securities pricing. The Senior Officer did not consider these fee schedules to be determinative in judging the appropriateness of mutual fund advisory contracts.
The Fund's ability to deliver competitive performance when compared to its peer group was also deemed to be relevant by the Board as a useful indicator of how the Adviser is executing the Fund's investment program, which in turn assisted the Board in reaching a conclusion that the nature, extent, and quality of the Adviser's investment management services were such as to warrant continuation of the advisory and subadvisory contracts.
The Senior Officer reviewed information compiled by Federated, using data supplied by independent fund ranking organizations, regarding the performance of, and fees charged by, other mutual funds, noting his view that comparisons to fund peer groups are relevant in judging the reasonableness of proposed fees.
For the periods covered by the Evaluation, the Fund's performance for the three-year period was above the median of the relevant peer group, and the Fund's performance fell below the median of the relevant peer group of the one-year period. The Board discussd the Fund's performance with the Adviser and recognized the efforts being undertaken by the Adviser. The Board will continue to monitor these efforts and the performance of the Fund.
Annual Shareholder Report
The Board also received financial information about Federated, including information regarding the compensation and benefits Federated derived from its relationships with the Federated funds. This information covered not only the fees under the advisory contracts, but also fees received by Federated's subsidiaries for providing other services to the Federated funds under separate contracts (e.g., for serving as the Federated funds' administrator). The information also detailed any indirect benefit Federated may derive from its receipt of research services from brokers who execute Federated fund trades. In addition, the Board considered the fact that, in order for a fund to be competitive in the marketplace, Federated and its affiliates frequently waived fees and/or reimbursed expenses and have disclosed to fund investors and/or indicated to the Board their intention to do so in the future, where appropriate. Moreover, the Board receives regular reporting as to the institution or elimination of these voluntary waivers.
Federated furnished information, requested by the Senior Officer, that reported revenues on a fund-by-fund basis and made estimates of the allocation of expenses on a fund-by-fund basis, using allocation methodologies specified by the Senior Officer. The Senior Officer noted that, although they may apply consistent allocation processes, the inherent difficulties in allocating costs (and the unavoidable arbitrary aspects of that exercise) and the lack of consensus on how to allocate those costs may render such allocation information unreliable. The allocation information was considered in the analysis by the Board but was determined to be of limited use.
The Board and the Senior Officer also reviewed information compiled by Federated comparing profitability information for Federated to other publicly held fund management companies. In this regard, the Senior Officer noted the limited availability of such information, but nonetheless concluded that Federated's profit margins did not appear to be excessive.
The Senior Officer's Evaluation also discussed the notion of possible realization of “economies of scale” as a fund grows larger. The Board considered in this regard that the Adviser has made significant and long-term investments in areas that support all of the Federated funds, such as personnel and processes for the portfolio management, shareholder services, compliance, internal audit, and risk management functions; and systems technology; and that the benefits of these efforts (as well as any economies, should they exist) were likely to be enjoyed by the fund complex as a whole. Finally, the Board also noted the absence of any applicable regulatory or industry guidelines on this subject, which (as discussed in the Senior Officer's Evaluation) is compounded by the lack of any common industry practice or general pattern with respect to structuring fund advisory fees with “breakpoints” that serve to reduce the fee as the fund attains a certain size. The Senior Officer did not recommend institution of breakpoints in pricing Federated's fund advisory services at this time.
Annual Shareholder Report
It was noted in the materials for the Board meeting that, for the period covered by the Evaluation, the Fund's investment advisory fee, after waivers and expense reimbursements, if any, was above the median of the relevant peer group. The Board reviewed the fees and other expenses of the Fund with the Adviser and was satisfied that the overall expense structure of the Fund remained competitive. The Board will continue to monitor advisory fees and other expenses borne by the Fund.
The Senior Officer noted that, considering the totality of the circumstances, and all of the factors referenced within his Evaluation, he had concluded that, subject to comments and recommendations made within his Evaluation, his observations and the information accompanying the Evaluation supported a finding by the Board that the management fees for each of the funds was reasonable and that Federated appeared to provide appropriate advisory and administrative services to the Fund for the fees paid. Under these circumstances, no changes were recommended to, and no objection was raised to, the continuation of the Fund's advisory and subadvisory contracts.
In its decision to continue an existing investment advisory contract, the Board was mindful of the potential disruptions of the Fund's operations and various risks, uncertainties and other effects that could occur as a result of a decision to terminate or not renew an advisory contract. In particular, the Board recognized that many shareholders have invested in the Fund on the strength of the Adviser's industry standing and reputation and with the expectation that the Adviser will have a continuing role in providing advisory services to the Fund. Thus, the Board's approval of the advisory contract reflected the fact that it is the shareholders who have effectively selected the Adviser by virtue of having invested in the Fund. The Board concluded that, in light of the factors discussed above, including the nature, quality and scope of the services provided to the Fund by the Adviser and its affiliates, continuation of the advisory contract was appropriate.
The Board based its decision to approve the advisory and subadvisory contracts on the totality of the circumstances and relevant factors and with a view to past and future long-term considerations. Not all of the factors and considerations identified above were necessarily relevant to the Fund, nor did the Board consider any one of them to be determinative. With respect to the factors that were relevant, the Board's decision to approve the contract reflects its determination that Federated's performance and actions provided a satisfactory basis to support the decision to continue the existing arrangements.
Annual Shareholder Report
Voting Proxies on Fund Portfolio Securities
A description of the policies and procedures that the Fund uses to determine how to vote proxies, if any, relating to securities held in the Fund's portfolio is available, without charge and upon request, by calling 1-800-341-7400. A report on “Form N-PX” of how the Fund voted any such proxies during the most recent 12-month period ended June 30 is available from Federated's website at FederatedInvestors.com. To access this information from the home page, select “All” under “Asset Classes.” Select a fund name and share class, if applicable, to go to the Fund Overview page. On the Fund Overview page, select the “Documents” tab. At the bottom of that page, select “Proxy Voting Record Report (Form N-PX).” Form N-PX filings are also available at the SEC's website at www.sec.gov.
Quarterly Portfolio Schedule
The Fund files with the SEC a complete schedule of its portfolio holdings, as of the close of the first and third quarters of its fiscal year, on “Form N-Q.” These filings are available on the SEC's website at www.sec.gov and may be reviewed and copied at the SEC's Public Reference Room in Washington, DC. (Call 1-800-SEC-0330 for information on the operation of the Public Reference Room.) You may also access this information from the “Products” section of Federated's website at FederatedInvestors.com. From the home page, select “All” under “Asset Classes.” Select a fund name and share class, if applicable, to go to the Fund Overview page. On the Fund Overview page, select the “Documents” tab. At the bottom of that page, select “Form N-Q.”
Annual Shareholder Report
Mutual funds are not bank deposits or obligations, are not guaranteed by any bank and are not insured or guaranteed by the U.S. government, the Federal Deposit Insurance Corporation, the Federal Reserve Board or any other government agency. Investment in mutual funds involves investment risk, including the possible loss of principal.
This Report is authorized for distribution to prospective investors only when preceded or accompanied by the Fund's Prospectus, which contains facts concerning its objective and policies, management fees, expenses and other information.
Federated Kaufmann Large Cap Fund
Federated Investors Funds
4000 Ericsson Drive
Warrendale, PA 15086-7561
Contact us at FederatedInvestors.com
or call 1-800-341-7400.
Federated Securities Corp., Distributor
CUSIP 314172446
CUSIP 314172438
CUSIP 314172420
CUSIP 314172412
39667 (12/12)
Federated is a registered trademark of Federated Investors, Inc.
2012 ©Federated Investors, Inc.
Annual Shareholder Report
October 31, 2012
| Share Class | Ticker |
| A | FKASX |
| B | FKBSX |
| C | FKCSX |
| R | FKKSX |
Federated Kaufmann Small Cap Fund
Fund Established 2002
A Portfolio of Federated Equity Funds
Not FDIC Insured • May Lose Value • No Bank Guarantee
Management's Discussion of Fund Performance (unaudited)
The Fund's total return, based on net asset value, for the 12-month reporting period ended October 31, 2012, was 17.00% for Class A Shares, 16.36% for Class B Shares, 16.36% for Class C Shares and 17.00% for Class R Shares. The total return of the Fund's benchmark, the Russell 2000 Growth Index (R2000G),1 a broad-based securities market index, was 9.70% for the same period. The Fund's total return for the fiscal year reflected actual cash flows, transaction costs and other expenses which were not reflected in the total return of the R2000G.
The following discussion will focus on the performance of the Fund's Class A Shares.
Market OVERVIEW
As markets continued to digest corporate and macroeconomic results, volatility was evident in global equity markets with weakness corresponding to investor uncertainty during November 2011 and for the first half of the summer of 2012. Subsequently, stock markets rallied significantly posting strong returns throughout the remainder of the fiscal year. The Standard and Poor's 500 Index (S&P 500)2 bottomed in November 2011 and rallied strongly to finish the year up 15.21%. Overall large-cap stocks performed best, followed by mid-cap and small-cap stocks. In terms of investment style, value stocks significantly outperformed growth stocks across all three capitalization groups: small, mid and large.
Market conditions remained volatile and uncertain, with macroeconomic factors and news headlines still showing some progress on economic conditions globally; however, economic indicators can best be described during the reporting period as mixed.
Globally, central banks remained accommodative by keeping interest rates low and continuing the various bond purchase programs to reduce both sovereign and corporate interest rates. While monetary stimulus generally controlled by central banks has remained accommodative to economic growth, fiscal policies globally are being vigorously debated as to the correct balance between stimulating economic growth and reducing deficits.
Fund Performance
The Fund significantly outperformed the R2000G during the reporting period. Key factors affecting Fund performance included: stock selection, sector weightings and investment in international holdings.3
Annual Shareholder Report
More than two-thirds of excess performance was due to strong stock selection. Companies that were strong performers and contributed most to the Fund's returns during the reporting period were: Dynavax (+52%), Kenexa (+101%), Inhibitex (+526%), International Meal (+54%), Vivus (+58%), Commvault Systems (+47%), Mellanox Technologies (+138%), Regeneron Pharmaceuticals (+157%), Synacor (+162%) and Conceptus (+64%).
The ten worst contributing holdings during the reporting period that detracted from stock selection results were: Progenics Pharmaceuticals (-57%), Manappuram Finance (-69%), Constant Contact (-39%), Central European Media (-51%), Gevo Incorporated (-59%), Riverbed Technology (-50%), Mindspeed Technologies (-39%), Satcon Technology (-99%), Ctrip.com (-62%) and Protalix Biotherapeutics (-21%).
Regarding sector weightings, a substantial underweighting of the Energy sector along with substantial overweighting of the Healthcare sector relative to the R2000G significantly contributed to Fund performance. A slight overweighting of the Technology sector slightly detracted from Fund performance.
The Fund maintained exposure to growth companies outside of the United States. Although stock selection in foreign holdings was generally strong, exposure to Brazil, India and Israel contributed negatively to Fund performance.
The Fund was substantially invested in stocks during the reporting period, and the average holdings of cash equivalents was less than 1% during the period.
| 1 | The Russell 2000® Growth Index measures the performance of those Russell 2000 companies with higher price-to-book ratios and higher forecasted growth values. The index is unmanaged, and it is not possible to invest directly in an index. |
| 2 | The S&P 500 Index is a capitalization-weighted index of 500 stocks designed to measure performance of the broad domestic economy through changes in the aggregate market value of 500 stocks representing all major industries. The index is unmanaged, and it is not possible to invest directly in an index. |
| 3 | International investing involves special risks including currency risk, increased volatility, political risks, and differences in auditing and other financial standards. Small company stocks may be less liquid and subject to greater price volatility than large capitalization stocks. |
Annual Shareholder Report
FUND PERFORMANCE AND GROWTH OF A $10,000 INVESTMENT
The Average Annual Total Return table below shows returns for each class averaged over the stated periods. The graphs below illustrate the hypothetical investment of $10,0001 in the Federated Kaufmann Small Cap Fund (the “Fund”) from December 18, 2002 (start of performance) to October 31, 2012, for Class A Shares, Class B Shares and Class C Shares and from November 1, 2005 (start of performance) to October 31, 2012, for Class R Shares, compared to the Russell 2000 Growth Index (R2000G)2 and the Lipper Small-Cap Growth Funds Average (LSCGFA).2
Average Annual Total Returns for the Period Ended 10/31/2012
(returns reflect all applicable sales charges and contingent deferred sales charges as specified below in footnote #1)
| Share Class | 1 Year | 5 Years | Start of
Performance* |
| Class A Shares | 10.58% | -1.18% | 11.90% |
| Class B Shares | 10.86% | -0.96% | 12.07% |
| Class C Shares | 15.36% | -0.60% | 11.95% |
| Class R Shares | 17.00% | -0.05% | 5.48% |
| * | The Fund's Class A Shares, Class B Shares and Class C Shares start of performance date was December 18, 2002. The Fund's Class R Shares start of performance date was November 1, 2005. |
Performance data quoted represents past performance which is no guarantee of future results. Investment return and principal value will fluctuate so that an investor's shares, when redeemed, may be worth more or less than their original cost. Mutual fund performance changes over time and current performance may be lower or higher than what is stated. For current to the most recent month-end performance and after-tax returns, visit FederatedInvestors.com or call 1-800-341-7400. Returns shown do not reflect the deduction of taxes that a shareholder would pay on Fund distributions or the redemption of Fund shares. Mutual funds are not obligations of or guaranteed by any bank and are not federally insured.
Annual Shareholder Report
Growth of a $10,000 Investment–CLASS A SHARES

| Federated Kaufmann Small Cap Fund - Class A Shares | C000026733 | R2000G | LSCGFA |
| 12/18/2002 | 9,450 | 10,000 | 10,000 |
| 10/31/2003 | 16,131 | 14,299 | 13,171 |
| 10/31/2004 | 18,505 | 15,089 | 13,554 |
| 10/31/2005 | 20,871 | 16,735 | 15,175 |
| 10/31/2006 | 25,150 | 19,592 | 17,121 |
| 10/31/2007 | 30,412 | 22,869 | 20,600 |
| 10/31/2008 | 16,943 | 14,209 | 11,948 |
| 10/31/2009 | 19,910 | 15,820 | 13,515 |
| 10/31/2010 | 27,171 | 20,355 | 17,261 |
| 10/31/2011 | 25,922 | 22,358 | 18,823 |
| 10/31/2012 | 30,329 | 24,527 | 20,532 |
41 graphic description end -->
| ■ | Total returns shown include the maximum sales charge of 5.50% ($10,000 investment minus $550 sales charge = $9,450). |
Growth of a $10,000 INVESTMENT–CLASS B SHARES
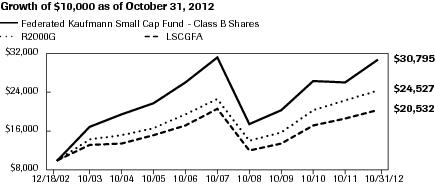
| Federated Kaufmann Small Cap Fund - Class B Shares | C000026734 | R2000G | LSCGFA |
| 12/18/2002 | 10,000 | 10,000 | 10,000 |
| 10/31/2003 | 17,040 | 14,299 | 13,171 |
| 10/31/2004 | 19,441 | 15,089 | 13,554 |
| 10/31/2005 | 21,807 | 16,735 | 15,175 |
| 10/31/2006 | 26,131 | 19,592 | 17,121 |
| 10/31/2007 | 31,423 | 22,869 | 20,600 |
| 10/31/2008 | 17,406 | 14,209 | 11,948 |
| 10/31/2009 | 20,341 | 15,820 | 13,515 |
| 10/31/2010 | 26,433 | 20,355 | 17,261 |
| 10/31/2011 | 26,320 | 22,358 | 18,823 |
| 10/31/2012 | 30,795 | 24,527 | 20,532 |
41 graphic description end -->
| ■ | Total returns shown include the maximum contingent deferred sales charge of 5.50%, as applicable. |
Annual Shareholder Report
Growth of a $10,000 INVESTMENT–CLASS C SHARES

| Federated Kaufmann Small Cap Fund - Class C Shares | C000026735 | R2000G | LSCGFA |
| 12/18/2002 | 10,000 | 10,000 | 10,000 |
| 10/31/2003 | 17,030 | 14,299 | 13,171 |
| 10/31/2004 | 19,441 | 15,089 | 13,554 |
| 10/31/2005 | 21,807 | 16,735 | 15,175 |
| 10/31/2006 | 26,131 | 19,592 | 17,121 |
| 10/31/2007 | 31,423 | 22,869 | 20,600 |
| 10/31/2008 | 17,406 | 14,209 | 11,948 |
| 10/31/2009 | 20,341 | 15,820 | 13,515 |
| 10/31/2010 | 27,618 | 20,355 | 17,261 |
| 10/31/2011 | 26,198 | 22,358 | 18,823 |
| 10/31/2012 | 30,484 | 24,527 | 20,532 |
41 graphic description end -->
| ■ | Total returns shown include the maximum contingent deferred sales charge of 1.00%, as applicable. |
Growth of a $10,000 INVESTMENT–CLASS R SHARES

| Federated Kaufmann Small Cap Fund - Class R Shares | C000026736 | R2000G | LSCGFA |
| 11/1/2005 | 10,000 | 10,000 | 10,000 |
| 10/31/2006 | 12,050 | 11,771 | 10,942 |
| 10/31/2007 | 14,571 | 13,740 | 13,165 |
| 10/31/2008 | 8,118 | 8,537 | 7,636 |
| 10/31/2009 | 9,539 | 9,505 | 8,638 |
| 10/31/2010 | 13,018 | 12,230 | 11,031 |
| 10/31/2011 | 12,420 | 13,434 | 12,030 |
| 10/31/2012 | 14,531 | 14,737 | 13,122 |
41 graphic description end -->
| 1 | Represents a hypothetical investment of $10,000 in the Fund after deducting the applicable sales charges: For Class A Shares, the maximum sales charge of 5.50% ($10,000 investment minus $550 sales charge = $9,450); for Class B Shares, the maximum contingent deferred sales charge is 5.50% on any redemption less than one year from the purchase date; for Class C Shares, a 1.00% contingent deferred sales charge would be applied on any redemption less than one year from the purchase date. The Fund's performance assumes the reinvestment of all dividends and distributions. The R2000G and the LSCGFA have been adjusted to reflect reinvestment of dividends on securities in the index and the average. |
| 2 | The R2000G is not adjusted to reflect sales charges, expenses or other fees that the Securities and Exchange Commission (SEC) requires to be reflected in the Fund's performance. The LSCGFA represents the average of the total returns reported by all of the mutual funds designated by Lipper, Inc. as falling in the respective category indicated, and is not adjusted to reflect any sales charges. However, these total returns are reported net of expenses or other fees that the SEC requires to be reflected in a fund's performance. The 2000G measures the performance of those Russell 2000 companies with higher price-to-book ratios and higher forecasted growth values. The index is unmanaged and, unlike the Fund, is not affected by cash flows. It is not possible to invest directly in an index. |
Annual Shareholder Report
Portfolio of Investments Summary Table (unaudited)
At October 31, 2012, the Fund's sector composition1 was as follows:
| Sector Composition | Percentage of
Total Net Assets |
| Health Care | 26.3% |
| Information Technology | 24.3% |
| Consumer Discretionary | 19.3% |
| Industrials | 17.3% |
| Financials | 5.6% |
| Energy | 3.3% |
| Consumer Staples | 1.3% |
| Materials | 1.2% |
| Telecommunication Services | 0.9% |
| Utilities | 0.4% |
| Securities Lending Collateral2 | 12.5% |
| Cash Equivalents3 | 0.1% |
| Other Assets and Liabilities—Net4 | (12.5)% |
| TOTAL | 100.0% |
| 1 | Except for Securities Lending Collateral, Cash Equivalents and Other Assets and Liabilities, sector classifications are based upon, and individual portfolio securities are assigned to, the classifications of the Global Industry Classification Standard (GICS) except that the Adviser assigns a classification to securities not classified by the GICS and to securities for which the Adviser does not have access to the classification made by the GICS. |
| 2 | Cash collateral received from lending portfolio securities which is invested in short-term investments such as repurchase agreements or money market mutual funds. |
| 3 | Cash Equivalents include any investments in money market mutual funds and/or overnight repurchase agreements other than those representing securities lending collateral. |
| 4 | Assets, other than investments in securities, less liabilities. See Statement of Assets and Liabilities.
|
Annual Shareholder Report
Portfolio of Investments
October 31, 2012
| Shares | | | Value |
| | COMMON STOCKS—99.3% | |
| | Consumer Discretionary—19.3% | |
| 45,200 | 1 | ASOS PLC | $1,644,830 |
| 392,632 | 1 | Acquity Group, ADR | 3,934,173 |
| 851,300 | | Arezzo Industria e Comercio SA | 15,193,927 |
| 381,500 | 1 | Bloomin Brands, Inc. | 5,215,105 |
| 111,600 | 1 | Brunello Cucinelli SpA | 1,974,476 |
| 53,900 | 1 | Buffalo Wild Wings, Inc. | 4,093,705 |
| 353,100 | 1 | CDON Group AB | 1,980,328 |
| 928,200 | 1,2 | Central European Media Enterprises Ltd., Class A | 4,975,152 |
| 82,800 | | Cia Hering | 1,902,192 |
| 204,000 | | Dick's Sporting Goods, Inc. | 10,200,000 |
| 233,400 | 1 | Gordmans Stores, Inc. | 3,515,004 |
| 1,575,583 | | International Meal Co. Holdings SA | 16,213,132 |
| 119,000 | 1,2 | Lululemon Athletica, Inc. | 8,212,190 |
| 312,941 | 1,2 | Melco PBL Entertainment (Macau) Ltd., ADR | 4,540,774 |
| 221,000 | 1 | Meritage Corp. | 8,172,580 |
| 8,550,692 | | NagaCorp Limited | 4,755,257 |
| 150,900 | | National CineMedia, Inc. | 2,332,914 |
| 562,000 | 2 | Salvatore Ferragamo Italia SpA | 11,414,592 |
| 4,300,000 | | Samsonite International SA | 8,932,846 |
| 139,400 | 1 | Shutterfly, Inc. | 4,218,244 |
| 79,500 | 1 | Shutterstock, Inc. | 1,888,125 |
| 55,400 | 1 | Ulta Salon Cosmetics & Fragrance, Inc. | 5,108,988 |
| 144,900 | 1 | Vitamin Shoppe Industries, Inc. | 8,294,076 |
| 502,800 | 1,2 | Yoox SpA | 7,605,385 |
| | TOTAL | 146,317,995 |
| | Consumer Staples—1.3% | |
| 148,179 | 1 | Amira Nature Food Ltd. | 1,192,841 |
| 137,426 | 1,2 | Annie's, Inc. | 5,428,327 |
| 211,600 | 1 | White Wave, Inc. | 3,485,052 |
| | TOTAL | 10,106,220 |
| | Energy—3.3% | |
| 50,100 | | Baytex Energy Corporation | 2,282,556 |
| 1,500,000 | 1,2 | Gevo, Inc. | 3,030,000 |
| 555,000 | 1 | Kodiak Oil & Gas Corp. | 5,128,200 |
| 62,600 | | Range Resources Corp. | 4,091,536 |
Annual Shareholder Report
| Shares | | | Value |
| | COMMON STOCKS—continued | |
| | Energy—continued | |
| 79,300 | 1,2 | Seadrill Partners LLC | $1,907,165 |
| 1,931,540 | 1,2 | Syntroleum Corp. | 1,216,870 |
| 78,800 | 2 | Vermilion Energy, Inc. | 3,767,409 |
| 92,841 | 1 | Whiting Petroleum Corp. | 3,901,179 |
| | TOTAL | 25,324,915 |
| | Financials—5.5% | |
| 78,250 | 1 | Affiliated Managers Group | 9,898,625 |
| 462,963 | 1,2 | China Housing & Land Development, Inc. | 675,926 |
| 25,493 | 1,3,4 | China Housing & Land Development, Inc. | 37,220 |
| 327,100 | | EverBank Financial Corp. | 4,985,004 |
| 1,300,600 | | Fibra Uno Administracion SA | 3,426,814 |
| 346,200 | | LPS Brasil Consultoria De Imoveis | 5,948,834 |
| 257,200 | 1 | Popular, Inc. | 4,971,676 |
| 56,100 | 1 | Spirit Realty Capital, Inc. | 916,674 |
| 638,436 | 1 | Walker & Dunlop, Inc. | 10,604,422 |
| | TOTAL | 41,465,195 |
| | Health Care—25.8% | |
| 506,300 | 1 | Achillion Pharmaceuticals, Inc. | 4,779,472 |
| 465,300 | 1,2 | Alexza Pharmaceuticals, Inc. | 2,335,806 |
| 106,700 | 1 | Alkermes, Inc. | 1,977,151 |
| 797,700 | 1,2 | Amarin Corporation PLC, ADR | 9,396,906 |
| 1,000,000 | 1 | ArQule, Inc. | 2,510,000 |
| 2,134,207 | 1,2,5 | Catalyst Pharmaceutical Partners, Inc. | 3,265,337 |
| 24,050 | 1 | Chindex International, Inc. | 249,399 |
| 418,900 | 1,2 | Conceptus, Inc. | 7,892,076 |
| 1,160,000 | 1 | Corcept Therapeutics, Inc. | 2,900,000 |
| 426,061 | 1 | Cubist Pharmaceuticals, Inc. | 18,278,017 |
| 640,565 | 1,2 | Dexcom, Inc. | 8,391,401 |
| 14,218,206 | 1,5 | Dynavax Technologies Corp. | 58,863,373 |
| 35,000 | 1 | Heartware International, Inc. | 2,939,300 |
| 542,700 | 1 | Idenix Pharmaceuticals, Inc. | 1,932,012 |
| 341,800 | 1,2 | Insulet Corp. | 7,249,578 |
| 227,652 | 1 | Nektar Therapeutics | 2,048,868 |
| 1,787,300 | 1,5 | Progenics Pharmaceuticals, Inc. | 5,093,805 |
| 2,058,671 | 1,2 | Protalix Biotherapeutics, Inc. | 9,943,381 |
| 91,985 | 1 | Puma Biotechnology, Inc. | 1,894,891 |
| 39,000 | 1 | Regeneron Pharmaceuticals, Inc. | 5,549,700 |
| 450,000 | 1,2 | Sagent Pharmaceuticals, Inc. | 6,786,000 |
Annual Shareholder Report
| Shares | | | Value |
| | COMMON STOCKS—continued | |
| | Health Care—continued | |
| 179,000 | 1 | Salix Pharmaceuticals Ltd. | $6,988,160 |
| 165,400 | 1,2 | Seattle Genetics, Inc. | 4,161,464 |
| 346,700 | 1 | Swedish Orphan Biovitrum AB | 1,960,115 |
| 830,900 | 1,2 | Threshold Pharmaceuticals, Inc., Class THL | 3,414,999 |
| 1,190,812 | 1 | Vical, Inc. | 4,060,669 |
| 88,300 | 1,2 | Vivus, Inc. | 1,315,670 |
| 2,528,300 | 1 | YM Biosciences, Inc. | 3,994,714 |
| 2,325,000 | 1 | Zogenix, Inc. | 5,673,000 |
| | TOTAL | 195,845,264 |
| | Industrials—17.3% | |
| 395,800 | 1,2 | Air Lease Corp. | 8,240,556 |
| 21,523,588 | | Aramex PJSC | 11,368,299 |
| 184,000 | 1,2 | Atlas Air Worldwide Holdings, Inc. | 10,118,160 |
| 276,700 | | Chicago Bridge & Iron Co., NV | 10,390,085 |
| 266,500 | | DSV, De Sammensluttede Vognmad AS | 5,991,834 |
| 561,400 | 1 | Edgen Group, Inc. | 4,272,254 |
| 52,700 | 1 | EnPro Industries, Inc. | 1,926,712 |
| 32,800 | 1 | IHS, Inc., Class A | 2,767,992 |
| 1,400,000 | 1,5 | Innovative Solutions and Support, Inc. | 6,020,000 |
| 116,200 | | Intersections, Inc. | 1,079,498 |
| 300,000 | 1 | MRC Global Inc. | 7,335,000 |
| 146,500 | | MSC Industrial Direct Co. | 10,928,900 |
| 235,200 | 1 | Old Dominion Freight Lines, Inc. | 7,888,608 |
| 248,000 | 1 | Owens Corning, Inc. | 8,330,320 |
| 151,850 | 1 | RPX Corp. | 1,598,980 |
| 200,000 | | Ryder System, Inc. | 9,024,000 |
| 124,000 | 1 | Teledyne Technologies, Inc. | 7,939,720 |
| 334,544 | 1,2 | Titan Machinery, Inc. | 7,911,966 |
| 276,000 | | Trinity Industries, Inc. | 8,633,280 |
| | TOTAL | 131,766,164 |
| | Information Technology—24.3% | |
| 110,000 | 1 | Acme Packet, Inc. | 1,819,400 |
| 583,900 | 1,2 | Ambarella, Inc. | 4,279,987 |
| 504,000 | 1,2 | Brightcove, Inc. | 6,360,480 |
| 231,777 | 1 | BroadSoft, Inc. | 8,858,517 |
| 2,400,000 | 1,5 | Cinedigm Digital Cinema Corp. | 3,576,000 |
| 767,000 | 1,5 | Cinedigm Digital Cinema Corp. | 1,127,490 |
| 313,000 | 1 | Commvault Systems, Inc. | 19,553,110 |
Annual Shareholder Report
| Shares | | | Value |
| | COMMON STOCKS—continued | |
| | Information Technology—continued | |
| 455,000 | 1,2 | Constant Contact, Inc. | $5,614,700 |
| 92,400 | 1 | CoStar Group, Inc. | 7,659,960 |
| 51,158 | 1 | Eloqua, Inc. | 1,193,516 |
| 675,000 | 1 | Envestnet, Inc. | 9,436,500 |
| 175,400 | 1 | Exa Corp. | 2,167,944 |
| 55,423 | 1 | Faro Technologies, Inc. | 2,228,005 |
| 120,000 | 1,2 | Fleetmatics Group PLC | 2,602,800 |
| 919,400 | 1 | Gilat Satellite Networks | 4,091,330 |
| 90,916 | 1 | IPG Photonics Corp. | 4,825,821 |
| 106,500 | 1,2 | Jive Software, Inc. | 1,192,800 |
| 96,100 | 1 | LivePerson, Inc. | 1,507,809 |
| 143,050 | 1 | Mellanox Technologies Ltd. | 11,010,558 |
| 21,000 | | Mercadolibre, Inc. | 1,763,370 |
| 434,216 | 1 | Microsemi Corp. | 8,336,947 |
| 325,000 | 1,2 | Millennial Media, Inc. | 5,209,750 |
| 1,853,900 | 1,2 | Mindspeed Technologies, Inc. | 6,321,799 |
| 227,600 | 1 | Moneygram International, Inc. | 3,536,904 |
| 279,536 | 1 | NIC, Inc. | 3,997,365 |
| 876,900 | 1 | Nova Measuring Instruments Ltd. | 6,594,288 |
| 253,260 | 1 | Peregrine Semiconductor Corp. | 4,485,235 |
| 334,902 | 1 | RADWARE Ltd. | 10,984,786 |
| 600,000 | 1 | RDA Microelectronics, Inc., ADR | 6,510,000 |
| 61,573 | 1,2 | Rubicon Technology, Inc. | 535,069 |
| 126,000 | 1,2 | ServiceNow, Inc. | 3,861,900 |
| 210,000 | 1 | Synchronoss Technologies, Inc. | 4,302,900 |
| 83,000 | | Syntel, Inc. | 4,947,630 |
| 218,904 | 1 | TNS, Inc. | 3,134,705 |
| 482,000 | | Telecity Group PLC | 7,012,111 |
| 196,100 | 1 | The Active Network, Inc. | 1,737,446 |
| 41,442 | 1,2 | VistaPrint Ltd. | 1,262,738 |
| 249,750 | 1 | WebMediaBrands, Inc. | 586,913 |
| | TOTAL | 184,228,583 |
| | Materials—1.2% | |
| 84,700 | | Eagle Materials, Inc. | 4,486,559 |
| 75,000 | | Eastman Chemical Co. | 4,443,000 |
| 560 | | Greatview Aseptic Packaging Company Ltd. | 293 |
| | TOTAL | 8,929,852 |
Annual Shareholder Report
| Shares | | | Value |
| | COMMON STOCKS—continued | |
| | Telecommunication Services—0.9% | |
| 255,292 | 1 | inContact, Inc. | $1,470,482 |
| 224,854 | 1 | TW Telecom, Inc. | 5,727,031 |
| | TOTAL | 7,197,513 |
| | Utilities—0.4% | |
| 42,500 | | ITC Holdings Corp. | 3,383,850 |
| | TOTAL COMMON STOCKS
(IDENTIFIED COST $591,069,531) | 754,565,551 |
| | Corporate Bond—0.1% | |
| | Financials—0.1% | |
| 786,000 | 3,4 | TICC Capital Corp., Conv. Bond, Series 144A, 7.50%, 11/1/2017
(IDENTIFIED COST $786,000) | 796,800 |
| | WARRANTS—0.5% | |
| | Energy—0.0% | |
| 966,936 | 1 | Syntroleum Corp., Warrants | 172,308 |
| | Health Care—0.5% | |
| 1,925,000 | 1 | Alexza Pharmaceuticals, Inc., Warrants | 965,580 |
| 121,142 | 1 | Corcept Therapeutics, Inc., Warrants | 65,502 |
| 446,014 | 1,5 | Dynavax Technologies Corp., Warrants | 1,588,746 |
| 257,688 | 1 | Threshold Pharmaceuticals, Inc., Warrants | 708,178 |
| 1,046,250 | 1,6 | Zogenix, Inc., Warrants | 549,177 |
| | TOTAL | 3,877,183 |
| | TOTAL WARRANTS
(IDENTIFIED COST $103,105) | 4,049,491 |
| | MUTUAL FUND—12.6% | |
| 95,539,991 | 5,7,8 | Federated Prime Value Obligations Fund, Institutional Shares, 0.16%
(AT NET ASSET VALUE) | 95,539,991 |
| | TOTAL INVESTMENTS—112.5%
(IDENTIFIED COST $687,498,627)9 | 854,951,833 |
| | OTHER ASSETS AND LIABILITIES - NET— (12.5)%10 | (95,292,483) |
| | TOTAL NET ASSETS—100% | $759,659,350 |
Annual Shareholder Report
| 1 | Non-income producing security. |
| 2 | All or a portion of these securities are temporarily on loan to unaffiliated broker/dealers. |
| 3 | Denotes a restricted security that either: (a) cannot be offered for public sale without first being registered, or being able to take advantage of an exemption from registration, under the Securities Act of 1933; or (b) is subject to a contractual restriction on public sales. At October 31, 2012, these restricted securities amounted to $834,020, which represented 0.1% of total net assets. |
| 4 | Denotes a restricted security that may be resold without restriction to “qualified institutional buyers” as defined in Rule 144A under the Securities Act of 1933 and that the Fund has determined to be liquid under criteria established by the Fund's Board of Trustees (the “Trustees”). At October 31, 2012, these liquid restricted securities amounted to $834,020, which represented 0.1% of total net assets. |
| 5 | Affiliated companies and holdings. |
| 6 | Market quotations and price evaluations are not available. Fair value determined in accordance with procedures established by and under the general supervision of the Trustees. |
| 7 | 7-Day net yield. |
| 8 | All or a portion of this security is held as collateral for securities lending. |
| 9 | The cost of investments for federal tax purposes amounts to $694,321,293. |
| 10 | Assets, other than investments in securities, less liabilities. See Statement of Assets and Liabilities. A significant portion of this balance represents loans to unaffiliated qualified brokers for securities lending. The Fund receives cash from the broker as collateral for the loaned securities and reinvests the collateral in certain short-term securities such as repurchase agreements or money market mutual funds. |
Note: The categories of investments are shown as a percentage of total net assets at October 31, 2012.
Various inputs are used in determining the value of the Fund's investments. These inputs are summarized in the three broad levels listed below:
Level 1—quoted prices in active markets for identical securities, including investment companies with daily net asset values, if applicable.
Level 2—other significant observable inputs (including quoted prices for similar securities, interest rates, prepayment speeds, credit risk, etc.). Also includes securities valued at amortized cost.
Level 3—significant unobservable inputs (including the Fund's own assumptions in determining the fair value of investments).
The inputs or methodology used for valuing securities are not an indication of the risk associated with investing in those securities.
Annual Shareholder Report
The following is a summary of the inputs used, as of October 31, 2012, in valuing the Fund's assets carried at fair value:
| Valuation Inputs |
| Level 1—
Quoted
Prices and
Investments in
Mutual Funds | Level 2—
Other
Significant
Observable
Inputs | Level 3—
Significant
Unobservable
Inputs | Total |
| Equity Securities: | | | | |
| Common Stocks | | | | |
| Domestic | $545,011,838 | $— | $— | $545,011,838 |
| International | 209,553,7131 | — | — | 209,553,713 |
| Corporate Bond | — | 796,800 | — | 796,800 |
| Warrants | — | 3,500,314 | 549,177 | 4,049,491 |
| Mutual Fund | 95,539,991 | — | — | 95,539,991 |
| TOTAL SECURITIES | $850,105,542 | $4,297,114 | $549,177 | $854,951,833 |
| 1 | Includes $69,820,164 of common stock securities transferred from Level 2 to Level 1 because quoted prices on equity securities traded principally in foreign markets were utilized to value securities for which fair value factors were previously applied to account for significant post market close activity. Transfers shown represent the value of the securities at the beginning of the period. |
The following acronym is used throughout this portfolio:
| ADR | —American Depositary Receipt |
See Notes which are an integral part of the Financial Statements
Annual Shareholder Report
Financial Highlights–Class A Shares
(For a Share Outstanding Throughout Each Period)
| Year Ended October 31 | 2012 | 2011 | 2010 | 2009 | 2008 |
| Net Asset Value, Beginning of Period | $23.24 | $24.36 | $17.85 | $15.19 | $28.16 |
| Income From Investment Operations: | | | | | |
| Net investment income (loss) | (0.26)1 | (0.29)1 | (0.05)1 | (0.09)1 | (0.17)1 |
| Net realized and unrealized gain (loss) on investments, short sales and foreign currency transactions | 3.94 | (0.83) | 6.56 | 2.75 | (11.95) |
| TOTAL FROM INVESTMENT OPERATIONS | 3.68 | (1.12) | 6.51 | 2.66 | (12.12) |
| Less Distributions: | | | | | |
| Distributions from net realized gain on investments, short sales and foreign currency transactions | (1.66) | — | — | — | (0.85) |
| Net Asset Value, End of Period | $25.26 | $23.24 | $24.36 | $17.85 | $15.19 |
| Total Return2 | 17.00% | (4.60)% | 36.47% | 17.51% | (44.29)% |
| Ratios to Average Net Assets: | | | | | |
| Net expenses | 1.95%3 | 1.95% | 1.95% | 1.95%3 | 1.95%3 |
| Net expenses excluding dividends and other expenses related to short sales | 1.95% | 1.95% | 1.95% | 1.95% | 1.95% |
| Net investment income (loss) | (1.09)% | (1.15)% | (0.24)% | (0.58)% | (0.77)% |
| Expense waiver/reimbursement4 | 0.35% | 0.36% | 0.36% | 0.38% | 0.28% |
| Supplemental Data: | | | | | |
| Net assets, end of period (000 omitted) | $525,581 | $687,567 | $919,029 | $709,757 | $543,187 |
| Portfolio turnover | 44% | 55% | 68% | 90% | 58% |
| 1 | Per share numbers have been calculated using the average shares method. |
| 2 | Based on net asset value, which does not reflect the sales charge, redemption fee or contingent deferred sales charge, if applicable. |
| 3 | The net expense ratio is calculated without reduction for expense offset arrangements. The net expense ratios are 1.95%, 1.95% and 1.95% for the years ended October 31, 2012, 2009 and 2008, respectively, after taking into account these expense reductions. |
| 4 | This expense decrease is reflected in both the net expense and the net investment income (loss) ratios shown above. |
See Notes which are an integral part of the Financial Statements
Annual Shareholder Report
Financial Highlights–Class B Shares
(For a Share Outstanding Throughout Each Period)
| Year Ended October 31 | 2012 | 2011 | 2010 | 2009 | 2008 |
| Net Asset Value, Beginning of Period | $22.14 | $23.34 | $17.19 | $14.71 | $27.45 |
| Income From Investment Operations: | | | | | |
| Net investment income (loss) | (0.37)1 | (0.41)1 | (0.16)1 | (0.17)1 | (0.29)1 |
| Net realized and unrealized gain (loss) on investments, short sales and foreign currency transactions | 3.73 | (0.79) | 6.31 | 2.65 | (11.60) |
| TOTAL FROM INVESTMENT OPERATIONS | 3.36 | (1.20) | 6.15 | 2.48 | (11.89) |
| Less Distributions: | | | | | |
| Distributions from net realized gain on investments, short sales and foreign currency transactions | (1.66) | — | — | — | (0.85) |
| Net Asset Value, End of Period | $23.84 | $22.14 | $23.34 | $17.19 | $14.71 |
| Total Return2 | 16.36% | (5.14)% | 35.78% | 16.86% | (44.61)% |
| Ratios to Average Net Assets: | | | | | |
| Net expenses | 2.50%3 | 2.50% | 2.50% | 2.50%3 | 2.50%3 |
| Net expenses excluding dividends and other expenses related to short sales | 2.50% | 2.50% | 2.50% | 2.50% | 2.50% |
| Net investment income (loss) | (1.64)% | (1.69)% | (0.82)% | (1.11)% | (1.35)% |
| Expense waiver/reimbursement4 | 0.35% | 0.32% | 0.33% | 0.36% | 0.28% |
| Supplemental Data: | | | | | |
| Net assets, end of period (000 omitted) | $42,298 | $61,010 | $82,726 | $76,876 | $78,150 |
| Portfolio turnover | 44% | 55% | 68% | 90% | 58% |
| 1 | Per share numbers have been calculated using the average shares method. |
| 2 | Based on net asset value, which does not reflect the sales charge, redemption fee or contingent deferred sales charge, if applicable. |
| 3 | The net expense ratio is calculated without reduction for expense offset arrangements. The net expense ratios are 2.50%, 2.50% and 2.50% for the years ended October 31, 2012, 2009 and 2008, respectively, after taking into account these expense reductions. |
| 4 | This expense decrease is reflected in both the net expense and the net investment income (loss) ratios shown above. |
See Notes which are an integral part of the Financial Statements
Annual Shareholder Report
Financial Highlights–Class C Shares
(For a Share Outstanding Throughout Each Period)
| Year Ended October 31 | 2012 | 2011 | 2010 | 2009 | 2008 |
| Net Asset Value, Beginning of Period | $22.14 | $23.34 | $17.19 | $14.71 | $27.45 |
| Income From Investment Operations: | | | | | |
| Net investment income (loss) | (0.38)1 | (0.41)1 | (0.16)1 | (0.17)1 | (0.29)1 |
| Net realized and unrealized gain (loss) on investments, short sales and foreign currency transactions | 3.74 | (0.79) | 6.31 | 2.65 | (11.60) |
| TOTAL FROM INVESTMENT OPERATIONS | 3.36 | (1.20) | 6.15 | 2.48 | (11.89) |
| Less Distributions: | | | | | |
| Distributions from net realized gain on investments, short sales and foreign currency transactions | (1.66) | — | — | — | (0.85) |
| Net Asset Value, End of Period | $23.84 | $22.14 | $23.34 | $17.19 | $14.71 |
| Total Return2 | 16.36% | (5.14)% | 35.78% | 16.86% | (44.61)% |
| Ratios to Average Net Assets: | | | | | |
| Net expenses | 2.50%3 | 2.50% | 2.50% | 2.50%3 | 2.50%3 |
| Net expenses excluding dividends and other expenses related to short sales | 2.50% | 2.50% | 2.50% | 2.50% | 2.50% |
| Net investment income (loss) | (1.65)% | (1.68)% | (0.80)% | (1.12)% | (1.34)% |
| Expense waiver/reimbursement4 | 0.27% | 0.28% | 0.29% | 0.34% | 0.28% |
| Supplemental Data: | | | | | |
| Net assets, end of period (000 omitted) | $160,295 | $172,922 | $208,270 | $175,955 | $175,301 |
| Portfolio turnover | 44% | 55% | 68% | 90% | 58% |
| 1 | Per share numbers have been calculated using the average shares method. |
| 2 | Based on net asset value, which does not reflect the sales charge, redemption fee or contingent deferred sales charge, if applicable. |
| 3 | The net expense ratio is calculated without reduction for expense offset arrangements. The net expense ratios are 2.50%, 2.50% and 2.50% for the years ended October 31, 2012, 2009 and 2008, respectively, after taking into account these expense reductions. |
| 4 | This expense decrease is reflected in both the net expense and the net investment income (loss) ratios shown above. |
See Notes which are an integral part of the Financial Statements
Annual Shareholder Report
Financial Highlights–Class R Shares
(For a Share Outstanding Throughout Each Period)
| Year Ended October 31 | 2012 | 2011 | 2010 | 2009 | 2008 |
| Net Asset Value, Beginning of Period | $23.24 | $24.36 | $17.85 | $15.19 | $28.16 |
| Income From Investment Operations: | | | | | |
| Net investment income (loss) | (0.27)1 | (0.29)1 | (0.04)1 | (0.09)1 | (0.16)1 |
| Net realized and unrealized gain (loss) on investments, short sales and foreign currency transactions | 3.95 | (0.83) | 6.55 | 2.75 | (11.96) |
| TOTAL FROM INVESTMENT OPERATIONS | 3.68 | (1.12) | 6.51 | 2.66 | (12.12) |
| Less Distributions: | | | | | |
| Distributions from net realized gain on investments, short sales and foreign currency transactions | (1.66) | — | — | — | (0.85) |
| Net Asset Value, End of Period | $25.26 | $23.24 | $24.36 | $17.85 | $15.19 |
| Total Return2 | 17.00% | (4.60)% | 36.47% | 17.51% | (44.29)% |
| Ratios to Average Net Assets: | | | | | |
| Net expenses | 1.95%3 | 1.95% | 1.95% | 1.95%3 | 1.95%3 |
| Net expenses excluding dividends and other expenses related to short sales | 1.95% | 1.95% | 1.95% | 1.95% | 1.95% |
| Net investment income (loss) | (1.10)% | (1.14)% | (0.21)% | (0.58)% | (0.73)% |
| Expense waiver/reimbursement4 | 0.44% | 0.45% | 0.45% | 0.49% | 0.46% |
| Supplemental Data: | | | | | |
| Net assets, end of period (000 omitted) | $31,485 | $27,715 | $35,515 | $25,955 | $17.665 |
| Portfolio turnover | 44% | 55% | 68% | 90% | 58% |
| 1 | Per share numbers have been calculated using the average shares method. |
| 2 | Based on net asset value. |
| 3 | The net expense ratio is calculated without reduction for expense offset arrangements. The net expense ratios are 1.95%, 1.95% and 1.95% for the years ended October 31, 2012, 2009 and 2008, respectively, after taking into account these expense reductions. |
| 4 | This expense decrease is reflected in both the net expense and the net investment income (loss) ratios shown above. |
See Notes which are an integral part of the Financial Statements
Annual Shareholder Report
Statement of Assets and Liabilities
October 31, 2012
| Assets: | | |
| Total investment in securities, at value including $89,472,742 of securities loaned, $95,539,991 of investment in an affiliated holding and $85,856,550 of investment in affiliated companies (Note 5) (identified cost $687,498,627) | | $854,951,833 |
| Cash denominated in foreign currencies (identified cost $13,372) | | 13,086 |
| Income receivable | | 35,751 |
| Receivable for investments sold | | 1,009,980 |
| Receivable for shares sold | | 847,909 |
| Other assets | | 1,501 |
| TOTAL ASSETS | | 856,860,060 |
| Liabilities: | | |
| Payable for shares redeemed | $1,105,931 | |
| Payable for collateral due to broker for securities lending | 95,109,321 | |
| Payable for Directors'/Trustees' fees | 3,908 | |
| Payable for distribution services fee (Note 5) | 235,209 | |
| Payable for shareholder services fee (Note 5) | 312,813 | |
| Accrued expenses | 433,528 | |
| TOTAL LIABILITIES | | 97,200,710 |
| Net assets for 30,553,647 shares outstanding | | $759,659,350 |
| Net Assets Consist of: | | |
| Paid-in capital | | $551,241,262 |
| Net unrealized appreciation of investments and translation of assets and liabilities in foreign currency | | 167,452,974 |
| Accumulated net realized gain on investments, written options and foreign currency transactions | | 40,965,114 |
| TOTAL NET ASSETS | | $759,659,350 |
Annual Shareholder Report
Statement of Assets and Liabilities–continued
| Net Asset Value, Offering Price and Redemption Proceeds Per Share | | |
| Class A Shares: | | |
| Net asset value per share ($525,581,378 ÷ 20,809,271 shares outstanding), no par value, unlimited shares authorized | | $25.26 |
| Offering price per share (100/94.50 of $25.26) | | $26.73 |
| Redemption proceeds per share | | $25.26 |
| Class B Shares: | | |
| Net asset value per share ($42,298,383 ÷ 1,774,367 shares outstanding), no par value, unlimited shares authorized | | $23.84 |
| Offering price per share | | $23.84 |
| Redemption proceeds per share (94.50/100 of $23.84) | | $22.53 |
| Class C Shares: | | |
| Net asset value per share ($160,294,551 ÷ 6,723,773 shares outstanding), no par value, unlimited shares authorized | | $23.84 |
| Offering price per share | | $23.84 |
| Redemption proceeds per share (99.00/100 of $23.84) | | $23.60 |
| Class R Shares: | | |
| Net asset value per share ($31,485,038 ÷ 1,246,236 shares outstanding), no par value, unlimited shares authorized | | $25.26 |
| Offering price per share | | $25.26 |
| Redemption proceeds per share | | $25.26 |
See Notes which are an integral part of the Financial Statements
Annual Shareholder Report
Statement of Operations
Year Ended October 31, 2012
| Investment Income: | | | |
| Dividends (including $11,786 received from an affiliated holding (Note 5) and net of foreign taxes withheld of $123,827) | | | $4,428,386 |
| Interest (including income on securities loaned of $3,162,146) | | | 3,169,033 |
| TOTAL INCOME | | | 7,597,419 |
| Expenses: | | | |
| Investment adviser fee (Note 5) | | $12,541,435 | |
| Administrative fee (Note 5) | | 686,567 | |
| Custodian fees | | 369,858 | |
| Transfer and dividend disbursing agent fees and expenses (Note 2) | | 1,853,956 | |
| Directors'/Trustees' fees | | 10,551 | |
| Auditing fees | | 39,500 | |
| Legal fees | | 24,993 | |
| Portfolio accounting fees | | 153,692 | |
| Distribution services fee (Note 5) | | 3,377,233 | |
| Shareholder services fee (Note 5) | | 2,098,259 | |
| Account administration fee (Note 2) | | 9,490 | |
| Share registration costs | | 73,430 | |
| Printing and postage | | 120,634 | |
| Insurance premiums | | 5,505 | |
| Miscellaneous | | 12,731 | |
| Interest expense | | 183 | |
| TOTAL EXPENSES | | 21,378,017 | |
Annual Shareholder Report
Statement of Operations–continued
| Waivers, Reimbursements and Reduction: | | | |
| Waiver/reimbursement of investment adviser fee (Note 5) | $(1,174,469) | | |
| Waiver of administrative fee (Note 5) | (14,167) | | |
| Waiver of distribution services fee (Note 5) | (392,383) | | |
| Reimbursement of transfer and dividend disbursing agent fees and expenses (Note 2) | (1,383,652) | | |
| Fees paid indirectly from directed brokerage arrangements (Note 6) | (16,361) | | |
| TOTAL WAIVERS, REIMBURSEMENTS AND REDUCTION | | $(2,981,032) | |
| Net expenses | | | $18,396,985 |
| Net investment income (loss) | | | (10,799,566) |
| Realized and Unrealized Gain on Investments and Foreign Currency Transactions: | | | |
| Net realized gain on investments and foreign currency transactions | | | 56,312,459 |
| Net change in unrealized appreciation of investments and translation of assets and liabilities in foreign currency | | | 83,549,325 |
| Net realized and unrealized gain on investments and foreign currency transactions | | | 139,861,784 |
| Change in net assets resulting from operations | | | $129,062,218 |
See Notes which are an integral part of the Financial Statements
Annual Shareholder Report
Statement of Changes in Net Assets
| Year Ended October 31 | 2012 | 2011 |
| Increase (Decrease) in Net Assets | | |
| Operations: | | |
| Net investment income (loss) | $(10,799,566) | $(15,428,852) |
| Net realized gain on investments and foreign currency transactions | 56,312,459 | 113,695,968 |
| Net change in unrealized appreciation/depreciation of investments and translation of assets and liabilities in foreign currency | 83,549,325 | (139,675,910) |
| CHANGE IN NET ASSETS RESULTING FROM OPERATIONS | 129,062,218 | (41,408,794) |
| Distributions to Shareholders: | | |
| Distributions from net realized gain on investments and foreign currency transactions | | |
| Class A Shares | (48,281,054) | — |
| Class B Shares | (4,396,648) | — |
| Class C Shares | (12,655,170) | — |
| Class R Shares | (1,991,943) | — |
| CHANGE IN NET ASSETS RESULTING FROM DISTRIBUTIONS TO SHAREHOLDERS | (67,324,815) | — |
| Share Transactions: | | |
| Proceeds from sale of shares | 170,481,254 | 243,224,995 |
| Net asset value of shares issued to shareholders in payment of distributions declared | 62,357,132 | — |
| Cost of shares redeemed | (484,130,302) | (498,142,291) |
| CHANGE IN NET ASSETS RESULTING FROM SHARE TRANSACTIONS | (251,291,916) | (254,917,296) |
| Change in net assets | (189,554,513) | (296,326,090) |
| Net Assets: | | |
| Beginning of period | 949,213,863 | 1,245,539,953 |
| End of period | $759,659,350 | $949,213,863 |
See Notes which are an integral part of the Financial Statements
Annual Shareholder Report
Notes to Financial Statements
October 31, 2012
1. ORGANIZATION
Federated Equity Funds (the “Trust”) is registered under the Investment Company Act of 1940, as amended (the “Act”), as an open-end management investment company. The Trust consists of 13 diversified portfolios. The financial statements included herein are only those of Federated Kaufmann Small Cap Fund (the “Fund”), a diversified portfolio. The financial statements of the other portfolios are presented separately. The assets of each portfolio are segregated and a shareholder's interest is limited to the portfolio in which shares are held. Each portfolio pays its own expenses. The Fund offers four classes of shares: Class A Shares, Class B Shares, Class C Shares and Class R Shares. All shares of the Fund have equal rights with respect to voting, except on class-specific matters. The investment objective of the Fund is capital appreciation.
2. SIGNIFICANT ACCOUNTING POLICIES
The following is a summary of significant accounting policies consistently followed by the Fund in the preparation of its financial statements. These policies are in conformity with U.S. generally accepted accounting principles (GAAP).
Investment Valuation
In calculating its net asset value (NAV), the Fund generally values investments as follows:
| ■ | Equity securities listed on an exchange or traded through a regulated market system are valued at their last reported sale price or official closing price in their principal exchange or market. |
| ■ | Shares of other mutual funds are valued based upon their reported NAVs. |
| ■ | Fixed-income securities acquired with remaining maturities greater than 60 days are fair valued using price evaluations provided by a pricing service approved by the Trustees. |
| ■ | Fixed-income securities acquired with remaining maturities of 60 days or less are valued at their cost (adjusted for the accretion of any discount or amortization of any premium), which approximates market value. |
| ■ | Derivative contracts listed on exchanges are valued at their reported settlement or closing price. |
| ■ | Over-the-counter (OTC) derivative contracts are fair valued using price evaluations provided by a pricing service approved by the Trustees. |
| ■ | For securities that are fair valued in accordance with procedures established by and under the general supervision of the Trustees, certain factors may be considered such as: the purchase price of the security, information obtained by contacting the issuer, analysis of the issuer's financial statements or other available documents, fundamental analytical data, the nature and duration of restrictions on disposition, the movement of the market in which the security is normally traded and public trading in similar securities of the issuer or comparable issuers. |
If the Fund cannot obtain a price or price evaluation from a pricing service for an investment, the Fund may attempt to value the investment based upon the mean of bid and asked quotations or fair value the investment based on price evaluations, from one or more dealers. If any price, quotation, price evaluation or other pricing source is not readily available when the NAV is calculated, the Fund uses the fair value of the investment determined in accordance with the procedures described below. There can be no assurance that the Fund could purchase or sell an investment at the price used to calculate the Fund's NAV.
Annual Shareholder Report
Fair Valuation and Significant Events Procedures
The Trustees have appointed a Valuation Committee comprised of officers of the Fund, Federated Equity Management Company of Pennsylvania (“Adviser”) and the Adviser's affiliated companies to determine fair value of securities and in overseeing the calculation of the NAV. The Trustees have also authorized the use of pricing services recommended by the Valuation Committee to provide fair value evaluations of the current value of certain investments for purposes of calculating the NAV. The Valuation Committee employs various methods for reviewing third-party pricing service evaluations including periodic reviews of third-party pricing services' policies, procedures and valuation methods (including key inputs and assumptions), transactional back-testing, comparisons of evaluations of different pricing services, and review of price challenges by the Adviser based on recent market activity. In the event that market quotations and price evaluations are not available for an investment, the Valuation Committee determines the fair value of the investment in accordance with procedures adopted by the Trustees. The Trustees periodically review and approve the fair valuations made by the Valuation Committee and any changes made to the procedures.
Factors considered by pricing services in evaluating an investment include the yields or prices of investments of comparable quality, coupon, maturity, call rights and other potential prepayments, terms and type, reported transactions, indications as to values from dealers and general market conditions. Some pricing services provide a single price evaluation reflecting the bid-side of the market for an investment (a “bid” evaluation). Other pricing services offer both bid evaluations and price evaluations indicative of a price between the prices bid and asked for the investment (a “mid” evaluation). The Fund normally uses bid evaluations for U.S. Treasury and Agency securities and mortgage-backed securities. The Fund normally uses mid evaluations for other types of fixed-income securities and OTC derivative contracts. In the event that market quotations and price evaluations are not available for an investment, the fair value of the investment is determined in accordance with procedures adopted by the Trustees.
The Trustees also have adopted procedures requiring an investment to be priced at its fair value whenever the Adviser determines that a significant event affecting the value of the investment has occurred between the time as of which the price of the investment would otherwise be determined and the time as of which the NAV is computed. An event is considered significant if there is both an affirmative expectation that the investment's value will change in response to the event and a reasonable basis for quantifying the resulting change in value. Examples of significant events that may occur after the close of the principal market on which a security is traded, or after the time of a price evaluation provided by a pricing service or a dealer, include:
| ■ | With respect to securities traded in foreign markets, significant trends in U.S. equity markets or in the trading of foreign securities index futures contracts; |
| ■ | Political or other developments affecting the economy or markets in which an issuer conducts its operations or its securities are traded; and |
| ■ | Announcements concerning matters such as acquisitions, recapitalizations, litigation developments, a natural disaster affecting the issuer's operations or regulatory changes or market developments affecting the issuer's industry. |
Annual Shareholder Report
The Trustees have approved the use of a pricing service to determine the fair value of equity securities traded principally in foreign markets when the Adviser determines that there has been a significant trend in the U.S. equity markets or in index futures trading. For other significant events, the Fund may seek to obtain more current quotations or price evaluations from alternative pricing sources. If a reliable alternative pricing source is not available, the Fund will determine the fair value of the investment using another method approved by the Trustees.
Repurchase Agreements
The Fund may invest in repurchase agreements for short-term liquidity purposes. It is the policy of the Fund to require the other party to a repurchase agreement to transfer to the Fund's custodian or sub-custodian eligible securities or cash with a market value (after transaction costs) at least equal to the repurchase price to be paid under the repurchase agreement. The eligible securities are transferred to accounts with the custodian or sub-custodian in which the Fund holds a “securities entitlement” and exercises “control” as those terms are defined in the Uniform Commercial Code. The Fund has established procedures for monitoring the market value of the transferred securities and requiring the transfer of additional eligible securities if necessary to equal at least the repurchase price. These procedures also allow the other party to require securities to be transferred from the account to the extent that their market value exceeds the repurchase price or in exchange for other eligible securities of equivalent market value.
The insolvency of the other party or other failure to repurchase the securities may delay the disposition of the underlying securities or cause the Fund to receive less than the full repurchase price. Under the terms of the repurchase agreement, any amounts received by the Fund in excess of the repurchase price and related transaction costs must be remitted to the other party.
The Fund may enter into repurchase agreements in which eligible securities are transferred into joint trading accounts maintained by the custodian or sub-custodian for investment companies and other clients advised by the Fund's Adviser and its affiliates. The Fund will participate on a pro rata basis with the other investment companies and clients in its share of the securities transferred under such repurchase agreements and in its share of proceeds from any repurchase or other disposition of such securities.
Annual Shareholder Report
Investment Income, Gains and Losses, Expenses and Distributions
Investment transactions are accounted for on a trade-date basis. Realized gains and losses from investment transactions are recorded on an identified-cost basis. Interest income and expenses are accrued daily. Dividend income and distributions to shareholders are recorded on the ex-dividend date. Foreign dividends are recorded on the ex-dividend date or when the Fund is informed of the ex-dividend date. Distributions of net investment income, if any, are declared and paid annually. Non-cash dividends included in dividend income, if any, are recorded at fair value. Investment income, realized and unrealized gains and losses, and certain fund-level expenses are allocated to each class based on relative average daily net assets, except that Class A Shares, Class B Shares, Class C Shares and Class R Shares may bear distribution services fees, shareholder services fees, account administration fees and certain transfer and dividend disbursing agent fees unique to those classes. For the year ended October 31, 2012, transfer and dividend disbursing agent fees and account administration fees for the Fund were as follows:
| Transfer and
Dividend
Disbursing
Agent Fees
Incurred | Transfer and
Dividend
Disbursing
Agent Fees
Reimbursed | Account
Administration
Fees Incurred |
| Class A Shares | $1,328,962 | $(1,046,186) | $8,858 |
| Class B Shares | 129,471 | (106,232) | — |
| Class C Shares | 306,147 | (231,234) | 632 |
| Class R Shares | 89,376 | — | — |
| TOTAL | $1,853,956 | $(1,383,652) | $9,490 |
Dividends are declared separately for each class. No class has preferential dividend rights; differences in per share dividend rates are generally due to differences in separate class expenses.
Premium and Discount Amortization
All premiums and discounts on fixed-income securities are amortized/accreted using the effective interest rate method.
Federal Taxes
It is the Fund's policy to comply with the Subchapter M provision of the Internal Revenue Code and to distribute to shareholders each year substantially all of its income. Accordingly, no provision for federal income tax is necessary. As of and during the year ended October 31, 2012, the Fund did not have a liability for any uncertain tax positions. The Fund recognizes interest and penalties, if any, related to tax liabilities as income tax expense in the Statement of Operations. As of October 31, 2012, tax years 2009 through 2012 remain subject to examination by the Fund's major tax jurisdictions, which include the United States of America and the Commonwealth of Massachusetts.
The Fund may be subject to taxes imposed by governments of countries in which it invests. Such taxes are generally based on either income or gains earned or repatriated. The Fund accrues and applies such taxes to net investment income, net realized gains and net unrealized gains as income and/or gains are earned.
Annual Shareholder Report
When-Issued and Delayed Delivery Transactions
The Fund may engage in when-issued or delayed delivery transactions. The Fund records when-issued securities on the trade date and maintains security positions such that sufficient liquid assets will be available to make payment for the securities purchased. Securities purchased on a when-issued or delayed delivery basis are marked to market daily and begin earning interest on the settlement date. Losses may occur on these transactions due to changes in market conditions or the failure of counterparties to perform under the contract.
Foreign Exchange Contracts
The Fund enters into foreign exchange contracts for the delayed delivery of securities or foreign currency exchange transactions. The Fund enters into foreign exchange contracts to protect assets against adverse changes in foreign currency exchange rates or exchange control regulations. Purchased contracts are used to acquire exposure to foreign currencies, whereas, contracts to sell are used to hedge the Fund's securities against currency fluctuations. Risks may arise upon entering into these transactions from the potential inability of counterparties to meet the terms of their commitments and from unanticipated movements in security prices or foreign exchange rates. The foreign exchange contracts are adjusted by the daily exchange rate of the underlying currency and any gains or losses are recorded for financial statement purposes as unrealized until the settlement date.
At October 31, 2012, the Fund had no outstanding foreign exchange contracts.
The average value at settlement date payable and receivable of foreign exchange contracts purchased and sold by the Fund throughout the period was $4,605 and $1,489, respectively. This is based on the contracts held as of each month-end throughout the fiscal period.
Foreign Currency Translation
The accounting records of the Fund are maintained in U.S. dollars. All assets and liabilities denominated in foreign currencies (FCs) are translated into U.S. dollars based on the rates of exchange of such currencies against U.S. dollars on the date of valuation. Purchases and sales of securities, income and expenses are translated at the rate of exchange quoted on the respective date that such transactions are recorded. The Fund does not isolate that portion of the results of operations resulting from changes in foreign exchange rates on investments from the fluctuations arising from changes in market prices of securities held. Such fluctuations are included with the net realized and unrealized gain or loss from investments.
Reported net realized foreign exchange gains or losses arise from sales of portfolio securities, sales and maturities of short-term securities, sales of FCs, currency gains or losses realized between the trade and settlement dates on securities transactions, the difference between the amounts of dividends, interest and foreign withholding taxes recorded on the Fund's books, and the U.S. dollar equivalent of the amounts actually received or paid. Net unrealized foreign exchange gains and losses arise from changes in the value of assets and liabilities other than investments in securities at fiscal year end, resulting from changes in the exchange rate.
Annual Shareholder Report
Additional Disclosure Related to Derivative Instruments
The Effect of Derivative Instruments on the Statement of Operations for the Year Ended October 31, 2012
| Amount of Realized Gain or (Loss) on Derivatives Recognized in Income |
| Forward
Currency
Contracts |
| Foreign exchange contracts | $(111,059) |
Securities Lending
The Fund participates in a securities lending program providing for the lending of equity securities to qualified brokers. The Fund normally receives cash collateral for securities loaned that is invested in an affiliated money market fund or in short-term securities including repurchase agreements. Collateral is maintained at a minimum level of 100% of the market value of investments loaned, plus interest, if applicable. Earnings on collateral are allocated between the borrower of the security, the securities lending agent, as a fee for its services under the program, and the Fund, according to agreed-upon rates.
As of October 31, 2012, securities subject to this type of arrangement and related collateral were as follows:
Market Value of
Securities Loaned | Market Value
of Collateral |
| $89,472,742 | $95,109,321 |
Restricted Securities
The Fund may purchase securities which are considered restricted. Restricted securities are securities that either: (a) cannot be offered for public sale without first being registered, or being able to take advantage of an exemption from registration, under the Securities Act of 1933; or (b) are subject to contractual restrictions on public sales. In some cases, when a security cannot be offered for public sale without first being registered, the issuer of the restricted security has agreed to register such securities for resale, at the issuer's expense, either upon demand by the Fund or in connection with another registered offering of the securities. Many such restricted securities may be resold in the secondary market in transactions exempt from registration. Restricted securities may be determined to be liquid under criteria established by the Trustees. The Fund will not incur any registration costs upon such resales. The Fund's restricted securities are valued at the price provided by dealers in the secondary market or, if no market prices are available, at the fair value as determined in accordance with procedures established by and under the general supervision of the Trustees.
Other
The preparation of financial statements in conformity with GAAP requires management to make estimates and assumptions that affect the amounts of assets, liabilities, expenses and revenues reported in the financial statements. Actual results could differ from those estimated.
Annual Shareholder Report
3. SHARES OF BENEFICIAL INTEREST
The following tables summarize share activity:
| Year Ended October 31 | 2012 | 2011 |
| Class A Shares: | Shares | Amount | Shares | Amount |
| Shares sold | 5,937,846 | $144,492,781 | 7,967,034 | $202,304,601 |
| Shares issued to shareholders in payment of distributions declared | 2,110,353 | 45,857,972 | — | — |
| Shares redeemed | (16,829,536) | (394,529,888) | (16,103,734) | (406,038,823) |
NET CHANGE RESULTING FROM
CLASS A SHARE TRANSACTIONS | (8,781,337) | $(204,179,135) | (8,136,700) | $(203,734,222) |
| Year Ended October 31 | 2012 | 2011 |
| Class B Shares: | Shares | Amount | Shares | Amount |
| Shares sold | 134,921 | $3,098,868 | 240,944 | $5,925,106 |
| Shares issued to shareholders in payment of distributions declared | 194,226 | 4,002,999 | — | — |
| Shares redeemed | (1,310,846) | (29,714,866) | (1,029,854) | (24,495,645) |
NET CHANGE RESULTING FROM
CLASS B SHARE TRANSACTIONS | (981,699) | $(22,612,999) | (788,910) | $(18,570,539) |
| Year Ended October 31 | 2012 | 2011 |
| Class C Shares: | Shares | Amount | Shares | Amount |
| Shares sold | 507,674 | $11,470,510 | 895,081 | $22,019,731 |
| Shares issued to shareholders in payment of distributions declared | 511,133 | 10,534,455 | — | — |
| Shares redeemed | (2,106,303) | (47,772,581) | (2,008,502) | (47,970,706) |
NET CHANGE RESULTING FROM
CLASS C SHARE TRANSACTIONS | (1,087,496) | $(25,767,616) | (1,113,421) | $(25,950,975) |
| Year Ended October 31 | 2012 | 2011 |
| Class R Shares: | Shares | Amount | Shares | Amount |
| Shares sold | 468,777 | $11,419,095 | 507,897 | $12,975,557 |
| Shares issued to shareholders in payment of distributions declared | 90,235 | 1,961,706 | — | — |
| Shares redeemed | (505,297) | (12,112,967) | (773,018) | (19,637,117) |
NET CHANGE RESULTING FROM
CLASS R SHARE TRANSACTIONS | 53,715 | $1,267,834 | (265,121) | $(6,661,560) |
NET CHANGE RESULTING FROM
TOTAL FUND SHARE TRANSACTIONS | (10,796,817) | $(251,291,916) | (10,304,152) | $(254,917,296) |
Annual Shareholder Report
4. FEDERAL TAX INFORMATION
The timing and character of income and capital gain distributions are determined in accordance with income tax regulations, which may differ from GAAP. These differences are due to differing treatments for foreign currency transactions, net operating losses and discount accretion/premium amortization on debt securities.
For the year ended October 31, 2012, permanent differences identified and reclassified among the components of net assets were as follows:
| Increase (Decrease) |
Undistributed
Net Investment
Income (Loss) | | Accumulated
Net Realized
Gain (Loss) |
| $10,799,566 | | $(10,799,566) |
Net investment income (loss), net realized gains (losses), and net assets were not affected by this reclassification.
The tax character of distributions as reported on the Statement of Changes in Net Assets for the years ended October 31, 2012 and 2011, was as follows:
| 2012 | 2011 |
| Long-term capital gains | $67,324,815 | $— |
As of October 31, 2012, the components of distributable earnings on a tax basis were as follows:
| Undistributed ordinary income1 | $3,375,960 |
| Undistributed long-term capital gains | $44,411,820 |
| Net unrealized appreciation | $160,630,308 |
| 1 | For tax purposes, short-term capital gains are treated as ordinary income for distribution purposes. |
The difference between book-basis and tax-basis net unrealized appreciation/depreciation is attributable to differing treatments for the deferral of losses on wash sales.
At October 31, 2012, the cost of investments for federal tax purposes was $694,321,293. The net unrealized appreciation of investments for federal tax purposes excluding any unrealized depreciation resulting from the translation from FCs to U.S. dollars of assets and liabilities other than investments in securities was $160,630,540. This consists of net unrealized appreciation from investments for those securities having an excess of value over cost of $236,391,812 and net unrealized depreciation from investments for those securities having an excess of cost over value of $75,761,272.
Annual Shareholder Report
5. INVESTMENT ADVISER FEE AND OTHER TRANSACTIONS WITH AFFILIATES
Investment Adviser Fee
The advisory agreement between the Fund and the Adviser provides for an annual fee equal to 1.425% of the Fund's average daily net assets. Subject to the terms described in the Expense Limitation note, the Adviser may voluntarily choose to waive any portion of its fee. For the year ended October 31, 2012, the Adviser voluntarily waived $1,034,108 of its fee.
Certain of the Fund's assets are managed by Federated Global Investment Management Corp. (the “Sub-Adviser”). Under the terms of a sub-advisory agreement between the Adviser and the Sub-Adviser, the Sub-Adviser receives an allocable portion of the Fund's adviser fee. The fee is paid by the Adviser out of its resources and is not an incremental Fund expense. For the year ended October 31, 2012, the Sub-Adviser earned a fee of $10,341,183.
Administrative Fee
Federated Administrative Services (FAS), under the Administrative Services Agreement, provides the Fund with administrative personnel and services. The fee paid to FAS is based on the average aggregate daily net assets of certain Federated funds as specified below, plus certain out-of-pocket expenses:
| Administrative Fee | Average Aggregate Daily Net Assets
of the Federated Funds |
| 0.150% | on the first $5 billion |
| 0.125% | on the next $5 billion |
| 0.100% | on the next $10 billion |
| 0.075% | on assets in excess of $20 billion |
Prior to September 1, 2012, the administrative fee received during any fiscal year was at least $150,000 per portfolio and $40,000 per each additional class of Shares. Subject to the terms described in the Expense Limitation note, FAS may voluntarily choose to waive any portion of its fee. For the year ended October 31, 2012, FAS waived $14,167 of its fee. The net fee paid to FAS was 0.076% of average daily net assets of the Fund.
Distribution Services Fee
The Fund has adopted a Distribution Plan (the “Plan”) pursuant to Rule 12b-1 under the Act. Under the terms of the Plan, the Fund will compensate Federated Securities Corp. (FSC), the principal distributor, from the daily net assets of the Fund's Class A Shares, Class B Shares, Class C Shares and Class R Shares to finance activities intended to result in the sale of these shares. The Plan provides that the Fund may incur distribution expenses at the following percentages of average daily net assets annually, to compensate FSC.
| Share Class Name | Percentage of Average Daily
Net Assets of Class |
| Class A Shares | 0.25% |
| Class B Shares | 0.75% |
| Class C Shares | 0.75% |
| Class R Shares | 0.50% |
Annual Shareholder Report
Subject to the terms described in the Expense Limitation note, FSC may voluntarily choose to waive any portion of its fee. For the year ended October 31, 2012, distribution services fees for the Fund were as follows:
| Distribution
Services
Fees Incurred | Distribution
Services
Fees Waived |
| Class A Shares | $1,573,706 | $(298,850) |
| Class B Shares | 383,904 | — |
| Class C Shares | 1,267,401 | (1,400) |
| Class R Shares | 152,222 | (92,133) |
| TOTAL | $3,377,233 | $(392,383) |
When FSC receives fees, it may pay some or all of them to financial intermediaries whose customers purchase shares. For the year ended October 31, 2012, FSC retained $1,367,229 of fees paid by the Fund.
Sales Charges
Front-end sales charges and contingent deferred sales charges (CDSC) do not represent expenses of the Fund. They are deducted from the proceeds of sales of Fund shares prior to investment or from redemption proceeds prior to remittance, as applicable. For the year ended October 31, 2012, FSC retained $29,632 in sales charges from the sale of Class A Shares. FSC also retained $2,705, $27,079 and $7,385 of CDSC relating to redemptions of Class A Shares, Class B Shares and Class C Shares, respectively.
Shareholder Services Fee
The Fund may pay fees (“Service Fees”) up to 0.25% of the average daily net assets of the Fund's Class A Shares, Class B Shares and Class C Shares to financial intermediaries or to Federated Shareholder Services Company (FSSC) for providing services to shareholders and maintaining shareholder accounts. Financial intermediaries may include a company affiliated with management of Federated Investors, Inc. A financial intermediary affiliated with management of Federated Investors, Inc. received $13,773 of Service Fees for the year ended October 31, 2012. Subject to the terms described in the Expense Limitation note, FSSC may voluntarily reimburse the Fund for Service Fees. For the year ended October 31, 2012, Service Fees for the Fund were as follows:
| Service
Fees
Incurred |
| Class A Shares | $1,548,456 |
| Class B Shares | 127,968 |
| Class C Shares | 421,835 |
| TOTAL | $2,098,259 |
For the year ended October 31, 2012, FSSC did not receive any fees paid by the Fund.
Annual Shareholder Report
Expense Limitation
The Adviser and its affiliates (which may include FSC, FAS and FSSC) have voluntarily agreed to waive their fees and/or reimburse expenses so that the total annual fund operating expenses (as shown in the financial highlights) paid by the Fund's Class A Shares, Class B Shares, Class C Shares and Class R Shares (after the voluntary waivers and/or reimbursements) will not exceed 1.95%, 2.50%, 2.50% and 1.95% (the “Fee Limit”), respectively, up to but not including the later of (the “Termination Date”): (a) January 1, 2014; or (b) the date of the Fund's next effective Prospectus. While the Adviser and its affiliates currently do not anticipate terminating or increasing these arrangements prior to the Termination Date, these arrangements may only be terminated or the Fee Limit increased prior to the Termination Date with the agreement of the Trustees.
Interfund Transactions
During the year ended October 31, 2012, the Fund engaged in purchase and sale transactions with funds that have a common investment adviser (or affiliated investment advisers), common Directors/Trustees, and/or common Officers. These purchase and sale transactions complied with Rule 17a-7 under the Act and amounted to $7,545,999 and $19,838,329, respectively.
General
Certain Officers and Trustees of the Fund are Officers and Directors or Trustees of the above companies.
Transactions Involving Affiliated Companies and Affiliated Holdings
An affiliated company is a company in which the Fund has ownership of at least 5% of the voting shares. Transactions with affiliated companies during the year ended October 31, 2012, were as follows:
| Affiliates | Balance of
Shares Held
10/31/2011 | Purchases/
Additions | Sales/
Reductions | Balance of
Shares Held
10/31/2012 | Value |
| Catalyst Pharmaceutical Partners, Inc. | 2,163,806 | — | 29,599 | 2,134,207 | $3,265,337 |
| Cinedigm Digital Cinema Corp. | 2,173,800 | 576,200 | 350,000 | 2,400,000 | 3,576,000 |
| Cinedigm Digital Cinema Corp. | 767,000 | — | — | 767,000 | 1,127,490 |
| Dynavax Technologies Corp. | 13,905,776 | 2,309,624 | 1,997,194 | 14,218,206 | 58,863,373 |
| Dynavax Technologies Corp., Warrants | 446,014 | — | — | 446,014 | 1,588,746 |
Annual Shareholder Report
| Affiliates | Balance of
Shares Held
10/31/2011 | Purchases/
Additions | Sales/
Reductions | Balance of
Shares Held
10/31/2012 | Value |
| Innovative Solutions and Support, Inc. | 1,652,379 | — | 252,379 | 1,400,000 | $6,020,000 |
| *Mindspeed Technologies, Inc. | 1,941,900 | 35,000 | 123,000 | 1,853,900 | 6,321,799 |
| Progenics Pharmaceuticals, Inc. | 1,787,300 | — | — | 1,787,300 | 5,093,805 |
TOTAL OF AFFILIATED
COMPANIES | 24,837,975 | 2,920,824 | 2,752,172 | 25,006,627 | $85,856,550 |
| * | At October 31, 2012, the Fund no longer has ownership of at least 5% of the voting shares. |
Affiliated holdings are mutual funds which are managed by the Adviser or an affiliate of the Adviser. The Adviser has agreed to reimburse the Fund for certain investment adviser fees as a result of transactions in other affiliated mutual funds. For the year ended October 31, 2012, the Adviser reimbursed $140,361. Transactions involving the affiliated holding during the year ended October 31, 2012, were as follows:
| Federated Prime
Value Obligations
Fund, Institutional
Shares |
| Balance of Shares Held 10/31/2011 | 114,511,100 |
| Purchases/Additions | 750,826,451 |
| Sales/Reductions | 769,797,560 |
| Balance of Shares Held 10/31/2012 | 95,539,991 |
| Value | $95,539,991 |
| Dividend Income | $11,786 |
6. EXPENSE Reduction
The Fund directs portfolio trades to a broker that in turn pays a portion of the Fund's operating expenses. For the year ended October 31, 2012, the Fund's expenses were reduced by $16,361 under these arrangements.
7. Investment TRANSACTIONS
Purchases and sales of investments, excluding long-term U.S. government securities and short-term obligations, for the year ended October 31, 2012, were as follows:
| Purchases | $381,726,106 |
| Sales | $713,167,573 |
8. CONCENTRATION OF RISK
The Fund may invest a portion of its assets in securities of companies that are deemed by the Fund's management to be classified in similar business sectors. Economic developments may have an effect on the liquidity and volatility of the portfolio securities.
Annual Shareholder Report
9. LINE OF CREDIT
The Fund participates in a $100,000,000 unsecured, uncommitted revolving line of credit (LOC) agreement with PNC Bank. The LOC was made available for extraordinary or emergency purposes, primarily for financing redemption payments. Borrowings are charged interest at a rate offered to the Fund by PNC Bank at the time of the borrowing. As of October 31, 2012, there were no outstanding loans. During the year ended October 31, 2012, the Fund did not utilize the LOC.
10. INTERFUND LENDING
Pursuant to an Exemptive Order issued by the Securities and Exchange Commission, the Fund, along with other funds advised by subsidiaries of Federated Investors, Inc., may participate in an interfund lending program. This program provides an alternative credit facility allowing the Fund to borrow from other participating affiliated funds. As of October 31, 2012, there were no outstanding loans. During the year ended October 31, 2012, the program was not utilized.
11. FEDERAL TAX INFORMATION (UNAUDITED)
For the year ended October 31, 2012, the amount of long-term capital gains designated by the Fund was $67,324,815.
Annual Shareholder Report
Report of Independent Registered Public Accounting Firm
TO THE BOARD OF Trustees OF Federated Equity Funds AND SHAREHOLDERS OF Federated Kaufmann Small Cap Fund:
We have audited the accompanying statement of assets and liabilities of Federated Kaufmann Small Cap Fund (the “Fund”) (one of the portfolios constituting Federated Equity Funds), including the portfolio of investments, as of October 31, 2012, and the related statement of operations for the year then ended, the statement of changes in net assets for each of the two years in the period then ended, and the financial highlights for each of the five years in the period then ended. These financial statements and financial highlights are the responsibility of the Fund's management. Our responsibility is to express an opinion on these financial statements and financial highlights based on our audits.
We conducted our audits in accordance with standards of the Public Company Accounting Oversight Board (United States). Those standards require that we plan and perform the audit to obtain reasonable assurance about whether the financial statements and financial highlights are free of material misstatement. We were not engaged to perform an audit of the Fund's internal control over financial reporting. Our audits included consideration of internal control over financial reporting as a basis for designing audit procedures that are appropriate in the circumstances, but not for the purpose of expressing an opinion on the effectiveness of the Fund's internal control over financial reporting. Accordingly, we express no such opinion. An audit also includes examining, on a test basis, evidence supporting the amounts and disclosures in the financial statements and financial highlights, assessing the accounting principles used and significant estimates made by management, and evaluating the overall financial statement presentation. Our procedures included confirmation of securities owned as of October 31, 2012, by correspondence with the custodian and others. We believe that our audits provide a reasonable basis for our opinion.
In our opinion, the financial statements and financial highlights referred to above present fairly, in all material respects, the financial position of Federated Kaufmann Small Cap Fund, a portfolio of Federated Equity Funds, at October 31, 2012, the results of its operations for the year then ended, the changes in its net assets for each of the two years in the period then ended, and the financial highlights for each of the five years in the period then ended, in conformity with U.S. generally accepted accounting principles.
Boston, Massachusetts
December 24, 2012
Annual Shareholder Report
Shareholder Expense Example (unaudited)
As a shareholder of the Fund, you incur two types of costs: (1) transaction costs, including sales charges (loads) on purchase or redemption payments; and (2) ongoing costs, including management fees and to the extent applicable, distribution (12b-1) fees and/or shareholder services fees and other Fund expenses. This Example is intended to help you to understand your ongoing costs (in dollars) of investing in the Fund and to compare these costs with the ongoing costs of investing in other mutual funds. It is based on an investment of $1,000 invested at the beginning of the period and held for the entire period from May 1, 2012 to October 31, 2012.
ACTUAL EXPENSES
The first section of the table below provides information about actual account values and actual expenses. You may use the information in this section, together with the amount you invested, to estimate the expenses that you incurred over the period. Simply divide your account value by $1,000 (for example, an $8,600 account value divided by $1,000 = 8.6), then multiply the result by the number in the first section under the heading entitled “Expenses Paid During Period” to estimate the expenses attributable to your investment during this period.
HYPOTHETICAL EXAMPLE FOR COMPARISON PURPOSES
The second section of the table below provides information about hypothetical account values and hypothetical expenses based on the Fund's actual expense ratio and an assumed rate of return of 5% per year before expenses, which is not the Fund's actual return. Thus, you should not use the hypothetical account values and expenses to estimate the actual ending account balance or your expenses for the period. Rather, these figures are required to be provided to enable you to compare the ongoing costs of investing in the Fund with other funds. To do so, compare this 5% hypothetical example with the 5% hypothetical examples that appear in the shareholder reports of the other funds.
Annual Shareholder Report
Please note that the expenses shown in the table are meant to highlight your ongoing costs only and do not reflect any transaction costs, such as sales charges (loads) on purchase or redemption payments. Therefore, the second section of the table is useful in comparing ongoing costs only, and will not help you determine the relative total costs of owning different funds. In addition, if these transaction costs were included, your costs would have been higher.
| Beginning
Account Value
5/1/2012 | Ending
Account Value
10/31/2012 | Expenses Paid
During Period1 |
| Actual: | | | |
| Class A Shares | $1,000 | $967.10 | $9.64 |
| Class B Shares | $1,000 | $964.40 | $12.34 |
| Class C Shares | $1,000 | $964.40 | $12.34 |
| Class R Shares | $1,000 | $966.70 | $9.64 |
Hypothetical (assuming a 5% return
before expenses): | | | |
| Class A Shares | $1,000 | $1,015.33 | $9.88 |
| Class B Shares | $1,000 | $1,012.57 | $12.65 |
| Class C Shares | $1,000 | $1,012.57 | $12.65 |
| Class R Shares | $1,000 | $1,015.33 | $9.88 |
| 1 | Expenses are equal to the Fund's annualized net expense ratios, multiplied by the average account value over the period, multiplied by 184/366 (to reflect the one-half-year period). The annualized net expense ratios are as follows: |
| Class A Shares | 1.95% |
| Class B Shares | 2.50% |
| Class C Shares | 2.50% |
| Class R Shares | 1.95% |
Annual Shareholder Report
Board of Trustees and Trust Officers
The Board of Trustees is responsible for managing the Trust's business affairs and for exercising all the Trust's powers except those reserved for the shareholders. The following tables give information about each Trustee and the senior officers of the Fund. Where required, the tables separately list Trustees who are “interested persons” of the Fund (i.e., “Interested” Trustees) and those who are not (i.e., “Independent” Trustees). Unless otherwise noted, the address of each person listed is Federated Investors Tower, 1001 Liberty Avenue, Pittsburgh, PA 15222. The address of all Independent Trustees listed is 4000 Ericsson Drive, Warrendale, PA 15086-7561; Attention: Mutual Fund Board. As of December 31, 2011, the Trust comprised 13 portfolio(s), and the Federated Fund Family consisted of 43 investment companies (comprising 134 portfolios). Unless otherwise noted, each Officer is elected annually. Unless otherwise noted, each Trustee oversees all portfolios in the Federated Fund Family and serves for an indefinite term. The Fund's Statement of Additional Information includes additional information about Trust Trustees and is available, without charge and upon request, by calling 1-800-341-7400.
Interested Trustees Background
Name
Birth Date
Positions Held with Trust
Date Service Began | Principal Occupation(s) for Past Five Years,
Other Directorships Held and Previous Position(s) |
John F. Donahue*
Birth Date: July 28, 1924
Trustee
Began serving: April 1984 | Principal Occupations: Director or Trustee of the Federated Fund Family; Chairman and Director, Federated Investors, Inc.; Chairman of the Federated Fund Family's Executive Committee.
Previous Positions: Chairman of the Federated Fund Family; Trustee, Federated Investment Management Company; Chairman and Director, Federated Investment Counseling. |
J. Christopher Donahue*
Birth Date: April 11, 1949
President and Trustee
Began serving: January 2000 | Principal Occupations: Principal Executive Officer and President of the Federated Fund Family; Director or Trustee of some of the Funds in the Federated Fund Family; President, Chief Executive Officer and Director, Federated Investors, Inc.; Chairman and Trustee, Federated Investment Management Company; Trustee, Federated Investment Counseling; Chairman and Director, Federated Global Investment Management Corp.; Chairman, Federated Equity Management Company of Pennsylvania and Passport Research, Ltd. (investment advisory subsidiary of Federated); Trustee, Federated Shareholder Services Company; Director, Federated Services Company.
Previous Positions: President, Federated Investment Counseling; President and Chief Executive Officer, Federated Investment Management Company, Federated Global Investment Management Corp. and Passport Research, Ltd. |
| * | Family relationships and reasons for “interested” status: John F. Donahue is the father of J. Christopher Donahue; both are “interested” due to their beneficial ownership of shares of Federated Investors, Inc. and the positions they hold with Federated and its subsidiaries. |
Annual Shareholder Report
INDEPENDENT Trustees Background
Name
Birth Date
Positions Held with Trust
Date Service Began | Principal Occupation(s) for Past Five Years,
Other Directorships Held, Previous Position(s) and Qualifications |
Nicholas P. Constantakis, CPA
Birth Date: September 3, 1939
Trustee
Began serving: February 1998 | Principal Occupation: Director or Trustee of the Federated Fund Family.
Other Directorship Held: Director, Chairman of the Audit Committee, and member of the Compensation Committee, Michael Baker Corporation (architecture, engineering and construction services).
Previous Position: Partner, Andersen Worldwide SC.
Qualifications: Public accounting and director experience. |
John F. Cunningham
Birth Date: March 5, 1943
Trustee
Began serving: January 1999 | Principal Occupation: Director or Trustee of the Federated Fund Family.
Other Directorships Held: Chairman, President and Chief Executive Officer, Cunningham & Co., Inc. (strategic business consulting); Trustee Associate, Boston College.
Previous Positions: Director, Redgate Communications and EMC Corporation (computer storage systems); Chairman of the Board and Chief Executive Officer, Computer Consoles, Inc.; President and Chief Operating Officer, Wang Laboratories; Director, First National Bank of Boston; Director, Apollo Computer, Inc.
Qualifications: Business management and director experience. |
Maureen Lally-Green
Birth Date: July 5, 1949
Trustee
Began serving: August 2009 | Principal Occupations: Director or Trustee of the Federated Fund Family; Director, Office of Church Relations, Diocese of Pittsburgh; Adjunct Professor of Law, Duquesne University School of Law.
Other Directorships Held: Director, Auberle; Member, Pennsylvania State Board of Education; Director, Saint Vincent College; Director, Ireland Institute of Pittsburgh; Chair and Director, UPMC Mercy Hospital; Regent, St. Vincent Seminary; Director, Epilepsy Foundation of Western and Central Pennsylvania; Director, Saint Thomas More Society, Allegheny County; Director, Our Campaign for the Church Alive, Inc.
Previous Position: Pennsylvania Superior Court Judge.
Qualifications: Legal and director experience. |
Peter E. Madden
Birth Date: March 16, 1942
Trustee
Began serving: November 1991 | Principal Occupation: Director or Trustee, and Chairman of the Board of Directors or Trustees, of the Federated Fund Family.
Previous Positions: Representative, Commonwealth of Massachusetts General Court; President, Chief Operating Officer and Director, State Street Bank and Trust Company and State Street Corporation (retired); Director, VISA USA and VISA International; Chairman and Director, Massachusetts Bankers Association; Director, Depository Trust Corporation; Director, The Boston Stock Exchange.
Qualifications: Business management, mutual fund services and director experience. |
Annual Shareholder Report
Name
Birth Date
Positions Held with Trust
Date Service Began | Principal Occupation(s) for Past Five Years,
Other Directorships Held, Previous Position(s) and Qualifications |
Charles F. Mansfield, Jr.
Birth Date: April 10, 1945
Trustee
Began serving: January 1999 | Principal Occupations: Director or Trustee of the Federated Fund Family; Management Consultant.
Previous Positions: Chief Executive Officer, PBTC International Bank; Partner, Arthur Young & Company (now Ernst & Young LLP); Chief Financial Officer of Retail Banking Sector, Chase Manhattan Bank; Senior Vice President, HSBC Bank USA (formerly Marine Midland Bank); Vice President, Citibank; Assistant Professor of Banking and Finance, Frank G. Zarb School of Business, Hofstra University; Executive Vice President, DVC Group, Inc. (marketing, communications and technology).
Qualifications: Banking, business management, education and director experience. |
Thomas M. O'Neill
Birth Date: June 14, 1951
Trustee
Began serving: October 2006 | Principal Occupations: Director or Trustee, Vice Chairman of the Audit Committee of the Federated Fund Family; Sole Proprietor, Navigator Management Company (investment and strategic consulting).
Other Directorships Held: Board of Overseers, Children's Hospital of Boston; Visiting Committee on Athletics, Harvard College; Board of Directors, Medicines for Humanity; Board of Directors, The Golisano Children's Museum of Naples, Florida.
Previous Positions: Chief Executive Officer and President, Managing Director and Chief Investment Officer, Fleet Investment Advisors; President and Chief Executive Officer, Aeltus Investment Management, Inc.; General Partner, Hellman, Jordan Management Co., Boston, MA; Chief Investment Officer, The Putnam Companies, Boston, MA; Credit Analyst and Lending Officer, Fleet Bank; Director and Consultant, EZE Castle Software (investment order management software); Director, Midway Pacific (lumber).
Qualifications: Business management, mutual fund, director and investment experience. |
John S. Walsh
Birth Date: November 28, 1957
Trustee
Began serving: January 1999 | Principal Occupations: Director or Trustee, Chairman of the Audit Committee of the Federated Fund Family; President and Director, Heat Wagon, Inc. (manufacturer of construction temporary heaters); President and Director, Manufacturers Products, Inc. (distributor of portable construction heaters); President, Portable Heater Parts, a division of Manufacturers Products, Inc.
Previous Position: Vice President, Walsh & Kelly, Inc.
Qualifications: Business management and director experience. |
Annual Shareholder Report
OFFICERS
Name
Birth Date
Address
Positions Held with Trust
Date Service Began | Principal Occupation(s) for Past Five Years
and Previous Position(s) |
John W. McGonigle
Birth Date: October 26, 1938
EXECUTIVE VICE PRESIDENT AND SECRETARY
Officer since: April 1984 | Principal Occupations: Executive Vice President and Secretary of the Federated Fund Family; Vice Chairman, Executive Vice President, Secretary and Director, Federated Investors, Inc.
Previous Positions: Trustee, Federated Investment Management Company and Federated Investment Counseling; Director, Federated Global Investment Management Corp., Federated Services Company and Federated Securities Corp. |
Richard A. Novak
Birth Date: December 25, 1963
TREASURER
Officer since: January 2006 | Principal Occupations: Principal Financial Officer and Treasurer of the Federated Fund Family; Senior Vice President, Federated Administrative Services; Financial and Operations Principal for Federated Securities Corp., Edgewood Services, Inc. and Southpointe Distribution Services, Inc.
Previous Positions: Controller of Federated Investors, Inc.; Vice President, Finance of Federated Services Company; held various financial management positions within The Mercy Hospital of Pittsburgh; Auditor, Arthur Andersen & Co. |
Richard B. Fisher
Birth Date: May 17, 1923
VICE PRESIDENT
Officer since: April 1987 | Principal Occupations: Vice Chairman or Vice President of some of the Funds in the Federated Fund Family; Vice Chairman, Federated Investors, Inc.; Chairman, Federated Securities Corp.
Previous Positions: President and Director or Trustee of some of the Funds in the Federated Fund Family; Executive Vice President, Federated Investors, Inc.; Director and Chief Executive Officer, Federated Securities Corp. |
Peter J. Germain
Birth Date: September 3, 1959
CHIEF LEGAL OFFICER
Officer since: January 2005 | Principal Occupations: Mr. Germain is Chief Legal Officer of the Federated Fund Family. He is General Counsel and Vice President, Federated Investors, Inc.; President, Federated Administrative Services and Federated Administrative Services, Inc.; Vice President, Federated Securities Corp.; Secretary, Federated Private Asset Management, Inc.; and Secretary, Retirement Plan Service Company of America. Mr. Germain joined Federated in 1984 and is a member of the Pennsylvania Bar Association.
Previous Positions: Deputy General Counsel, Special Counsel, Managing Director of Mutual Fund Services, Federated Investors, Inc.; Senior Vice President, Federated Services Company; and Senior Corporate Counsel, Federated Investors, Inc. |
Brian P. Bouda
Birth Date: February 28, 1947
CHIEF COMPLIANCE OFFICER AND SENIOR VICE PRESIDENT
Officer since: August 2004 | Principal Occupations: Senior Vice President and Chief Compliance Officer of the Federated Fund Family; Vice President and Chief Compliance Officer of Federated Investors, Inc. and Chief Compliance Officer of its subsidiaries. Mr. Bouda joined Federated in 1999 and is a member of the American Bar Association and the State Bar Association of Wisconsin. |
Annual Shareholder Report
Name
Birth Date
Address
Positions Held with Trust
Date Service Began | Principal Occupation(s) for Past Five Years
and Previous Position(s) |
Stephen F. Auth
Birth Date: September 3, 1956
450 Lexington Avenue
Suite 3700
New York, NY 10017-3943
CHIEF INVESTMENT OFFICER
Officer since: November 2002 | Principal Occupations: Mr. Auth is Chief Investment Officer of this Fund and various other Funds in the Federated Fund Family; Executive Vice President, Federated Investment Counseling, Federated Global Investment Management Corp. and Federated Equity Management Company of Pennsylvania.
Previous Positions: Executive Vice President, Federated Investment Management Company, and Passport Research, Ltd. (investment advisory subsidiary of Federated); Senior Vice President, Global Portfolio Management Services Division; Senior Vice President, Federated Investment Management Company and Passport Research, Ltd.; Senior Managing Director and Portfolio Manager, Prudential Investments. |
Lawrence Auriana
Birth Date: January 8, 1944
140 East 45th Street
New York, NY 10017
VICE PRESIDENT
Officer since: November 2001
Portfolio Manager since: December 2002 | Principal Occupations: Lawrence Auriana has been the Fund's Portfolio Manager since December 2002. He is Vice President of the Trust. Mr. Auriana joined Federated in April 2001 as Co-Head of Investments/Federated Kaufmann. From August 1984 to April 2001, Mr. Auriana was President and Treasurer of Edgemont Asset Management Corp., and Chairman of the Board and Portfolio Manager to The Kaufmann Fund, Inc. (predecessor to the Federated Kaufmann Fund). Mr. Auriana earned a B.S. in economics from Fordham University and has been engaged in the securities business since 1965. |
Hans P. Utsch
Birth Date: July 3, 1936
140 East 45th Street
New York, NY 10017
VICE PRESIDENT
Officer since: November 2001
Portfolio Manager since: December 2002 | Principal Occupations: Hans P. Utsch has been the Fund's Portfolio Manager since December 2002. He is Vice President of the Trust. Mr. Utsch joined Federated in April 2001 as Co-Head of Investments/Federated Kaufmann. From August 1984 to April 2001, Mr. Utsch was Chairman of the Board and Secretary of Edgemont Asset Management Corp., and President and Portfolio Manager to The Kaufmann Fund, Inc. (predecessor to the Federated Kaufmann Fund). Mr. Utsch graduated from Amherst College and holds an M.B.A. from Columbia University. He has been engaged in the securities business since 1962. |
Annual Shareholder Report
Evaluation and Approval of Advisory Contract–May 2012
Federated Kaufmann Small Cap Fund (the “Fund”)
Following a review and recommendation of approval by the Fund's independent trustees, the Fund's Board reviewed and approved at its May 2012 meetings the Fund's investment advisory and subadvisory contracts for an additional one-year term. The Board's decision regarding these contracts reflects the exercise of its business judgment on whether to continue the existing arrangements.
In this connection, the Federated Funds' Board had previously appointed a Senior Officer, whose duties include specified responsibilities relating to the process by which advisory fees are to be charged to a Federated fund. The Senior Officer has the authority to retain consultants, experts, or staff as may be reasonably necessary to assist in the performance of his duties, reports directly to the Board, and may be terminated only with the approval of a majority of the independent members of the Board. The Senior Officer prepared and furnished to the Board an independent, written evaluation that covered topics discussed below (the “Evaluation”). The Board considered that Evaluation, along with other information, in deciding to approve the advisory and subadvisory contracts.
The Board is also familiar with and considered judicial decisions concerning allegedly excessive investment advisory fees, which have indicated that the following factors may be relevant to an Adviser's fiduciary duty with respect to its receipt of compensation from a fund: the nature and quality of the services provided by the Adviser to a fund and its shareholders, including the performance and expenses of the fund and of comparable funds; the Adviser's cost of providing the services, including the profitability to the Adviser of providing advisory services to a fund; the extent to which the Adviser may realize “economies of scale” as a fund grows larger and, if such economies exist, whether they have been shared with a fund and its shareholders; any “fall-out financial benefits” that accrue to the Adviser because of its relationship with a fund (including research services received from brokers that execute fund trades and any fees paid to affiliates of the Adviser for services rendered to a fund); comparative fee structures, including a comparison of fees paid to the Adviser with those paid by similar funds; and the extent to which the Board members are fully informed about all facts the Board deems relevant to its consideration of the Adviser's services and fees. Consistent with these judicial decisions, the Board also considered management fees (including any components thereof) charged to institutional and other clients of the Adviser and subadviser for what might be viewed as like services. The Board was aware of these factors and was guided by them in its review of the Fund's advisory and subadvisory contracts to the extent it considered them to be appropriate and relevant, as discussed further below.
Annual Shareholder Report
The Board considered and weighed these circumstances in light of its substantial accumulated experience in governing the Fund and working with Federated on matters relating to the Federated funds, and was assisted in its deliberations by independent legal counsel. Throughout the year, and in connection with its May meetings, the Board requested and received substantial and detailed information about the Fund and the Federated organization that was in addition to the extensive materials that comprise and accompany the Senior Officer's Evaluation. Federated provided much of this information at each regular meeting of the Board, and furnished additional substantial information in connection with the May meeting at which the Board's formal review of the advisory and subadvisory contracts occurred. At this May meeting, senior management of the Adviser also met with the independent trustees and their counsel to discuss the materials presented and any other matters thought relevant by the Adviser or the trustees. Between regularly scheduled meetings, the Board also received information on particular matters as the need arose. Thus, the Board's consideration of the advisory and subadvisory contracts included review of the Senior Officer's Evaluation, accompanying data and additional information covering such matters as: the Adviser's and subadviser's investment philosophy, revenue, profitability, personnel and processes; investment and operating strategies; the Fund's short- and long-term performance (in absolute terms, both on a gross basis and net of expenses, as well as in relationship to its particular investment program and certain competitor or “peer group” funds and/or other benchmarks, as appropriate), and comments on the reasons for performance; the Fund's investment objectives; the Fund's expenses (including the advisory fee itself and the overall expense structure of the Fund, both in absolute terms and relative to similar and/or competing funds, with due regard for contractual or voluntary expense limitations); the use and allocation of brokerage commissions derived from trading the Fund's portfolio securities (if any); and the nature, quality and extent of the advisory and other services provided to the Fund by the Adviser and its affiliates. The Board also considered the preferences and expectations of Fund shareholders; the entrepreneurial risk assumed by the Adviser in sponsoring the funds; the continuing state of competition in the mutual fund industry and market practices; the range of comparable fees for similar funds in the mutual fund industry; the Fund's relationship to the Federated family of funds which include a comprehensive array of funds with different investment objectives, policies and strategies which are available for exchange without the incurrence of additional sales charges; compliance and audit reports concerning the Federated funds and the Federated companies that service them (including communications from regulatory agencies), as well as Federated's responses to any issues raised therein; and relevant developments in the mutual fund industry and how the Federated funds and/or Federated are responding to them. The Board also considered that the longevity and experience of the Fund's portfolio management team and
Annual Shareholder Report
their unique approach to investing may limit the utility of comparisons to other equity mutual funds. The Board's evaluation process is evolutionary. The criteria considered and the emphasis placed on relevant criteria change in recognition of changing circumstances in the mutual fund marketplace.
While mindful that courts have cautioned against giving such comparisons too much weight, the Board has found the use of comparisons of the Fund's fees and expenses to other mutual funds with comparable investment programs to be relevant, given the high degree of competition in the mutual fund business. The Board focused on comparisons with other similar mutual funds more heavily than non-mutual fund products or services because it is believed that they are more relevant. For example, other mutual funds are the products most like the Fund, they are readily available to Fund shareholders as alternative investment vehicles, and they are the type of investment vehicle in fact chosen and maintained by the Fund's investors. The range of their fees and expenses therefore appears to be a generally reliable indication of what consumers have found to be reasonable in the precise marketplace in which the Fund competes. In this regard, the Senior Officer has reviewed Federated's fees for providing advisory services to products outside the Federated family of funds (e.g., institutional and separate accounts). He concluded that mutual funds and institutional accounts are inherently different products. Those differences include, but are not limited to, different types of targeted investors; being subject to different laws and regulations; different legal structures; different average account sizes; different associated costs; different portfolio management techniques made necessary by different cash flows; and portfolio manager time spent in review of securities pricing. The Senior Officer did not consider these fee schedules to be determinative in judging the appropriateness of mutual fund advisory contracts.
The Fund's ability to deliver competitive performance when compared to its peer group was also deemed to be relevant by the Board as a useful indicator of how the Adviser is executing the Fund's investment program, which in turn assisted the Board in reaching a conclusion that the nature, extent, and quality of the Adviser's investment management services were such as to warrant continuation of the advisory and subadvisory contracts.
The Senior Officer reviewed information compiled by Federated, using data supplied by independent fund ranking organizations, regarding the performance of, and fees charged by, other mutual funds, noting his view that comparisons to fund peer groups are relevant in judging the reasonableness of proposed fees.
The Fund's performance fell below the median of the relevant peer group for the one-year, three-year and five-year periods covered by the Evaluation. The Board discussed the Fund's performance with the Adviser and recognized the efforts being undertaken by the Adviser. The Board will continue to monitor these efforts and the performance of the Fund.
Annual Shareholder Report
The Board also received financial information about Federated, including information regarding the compensation and benefits Federated derived from its relationships with the Federated funds. This information covered not only the fees under the advisory contracts, but also fees received by Federated's subsidiaries for providing other services to the Federated funds under separate contracts (e.g., for serving as the Federated funds' administrator). The information also detailed any indirect benefit Federated may derive from its receipt of research services from brokers who execute Federated fund trades. In addition, the Board considered the fact that, in order for a fund to be competitive in the marketplace, Federated and its affiliates frequently waived fees and/or reimbursed expenses and have disclosed to fund investors and/or indicated to the Board their intention to do so in the future, where appropriate. Moreover, the Board receives regular reporting as to the institution or elimination of these voluntary waivers.
Federated furnished information, requested by the Senior Officer, that reported revenues on a fund-by-fund basis and made estimates of the allocation of expenses on a fund-by-fund basis, using allocation methodologies specified by the Senior Officer. The Senior Officer noted that, although they may apply consistent allocation processes, the inherent difficulties in allocating costs (and the unavoidable arbitrary aspects of that exercise) and the lack of consensus on how to allocate those costs may render such allocation information unreliable. The allocation information was considered in the analysis by the Board but was determined to be of limited use.
The Board and the Senior Officer also reviewed information compiled by Federated comparing profitability information for Federated to other publicly held fund management companies. In this regard, the Senior Officer noted the limited availability of such information, but nonetheless concluded that Federated's profit margins did not appear to be excessive.
The Senior Officer's Evaluation also discussed the notion of possible realization of “economies of scale” as a fund grows larger. The Board considered in this regard that the Adviser has made significant and long-term investments in areas that support all of the Federated funds, such as personnel and processes for the portfolio management, shareholder services, compliance, internal audit, and risk management functions; and systems technology; and that the benefits of these efforts (as well as any economies, should they exist) were likely to be enjoyed by the fund complex as a whole. Finally, the Board also noted the absence of any applicable regulatory or industry guidelines on this subject, which (as discussed in the Senior Officer's Evaluation) is compounded by the lack of any common industry practice or general pattern with respect to structuring fund advisory fees with “breakpoints” that serve to reduce the fee as the fund attains a certain size. The Senior Officer did not recommend institution of breakpoints in pricing Federated's fund advisory services at this time.
Annual Shareholder Report
It was noted in the materials for the Board meeting that, for the period covered by the Evaluation, the Fund's investment advisory fee, after waivers and expense reimbursements, if any, was above the median of the relevant peer group. The Board reviewed the fees and other expenses of the Fund with the Adviser and was satisfied that the overall expense structure of the Fund remained competitive. The Board will continue to monitor advisory fees and other expenses borne by the Fund.
The Senior Officer noted that, considering the totality of the circumstances, and all of the factors referenced within his Evaluation, he had concluded that, subject to comments and recommendations made within his Evaluation, his observations and the information accompanying the Evaluation supported a finding by the Board that the management fees for each of the funds was reasonable and that Federated appeared to provide appropriate advisory and administrative services to the Fund for the fees paid. Under these circumstances, no changes were recommended to, and no objection was raised to, the continuation of the Fund's advisory and subadvisory contracts.
In its decision to continue an existing investment advisory contract, the Board was mindful of the potential disruptions of the Fund's operations and various risks, uncertainties and other effects that could occur as a result of a decision to terminate or not renew an advisory contract. In particular, the Board recognized that many shareholders have invested in the Fund on the strength of the Adviser's industry standing and reputation and with the expectation that the Adviser will have a continuing role in providing advisory services to the Fund. Thus, the Board's approval of the advisory contract reflected the fact that it is the shareholders who have effectively selected the Adviser by virtue of having invested in the Fund. The Board concluded that, in light of the factors discussed above, including the nature, quality and scope of the services provided to the Fund by the Adviser and its affiliates, continuation of the advisory contract was appropriate.
The Board based its decision to approve the advisory and subadvisory contracts on the totality of the circumstances and relevant factors and with a view to past and future long-term considerations. Not all of the factors and considerations identified above were necessarily relevant to the Fund, nor did the Board consider any one of them to be determinative. With respect to the factors that were relevant, the Board's decision to approve the contract reflects its determination that Federated's performance and actions provided a satisfactory basis to support the decision to continue the existing arrangements.
Annual Shareholder Report
Voting Proxies on Fund Portfolio Securities
A description of the policies and procedures that the Fund uses to determine how to vote proxies, if any, relating to securities held in the Fund's portfolio is available, without charge and upon request, by calling 1-800-341-7400. A report on “Form N-PX” of how the Fund voted any such proxies during the most recent 12-month period ended June 30 is available from Federated's website at FederatedInvestors.com. To access this information from the home page, select “All” under “Asset Classes.” Select a fund name and share class, if applicable, to go to the Fund Overview page. On the Fund Overview page, select the “Documents” tab. At the bottom of that page, select “Proxy Voting Record Report (Form N-PX).” Form N-PX filings are also available at the SEC's website at www.sec.gov.
Quarterly Portfolio Schedule
The Fund files with the SEC a complete schedule of its portfolio holdings, as of the close of the first and third quarters of its fiscal year, on “Form N-Q.” These filings are available on the SEC's website at www.sec.gov and may be reviewed and copied at the SEC's Public Reference Room in Washington, DC. (Call 1-800-SEC-0330 for information on the operation of the Public Reference Room.) You may also access this information from the “Products” section of Federated's website at FederatedInvestors.com. From the home page, select “All” under “Asset Classes.” Select a fund name and share class, if applicable, to go to the Fund Overview page. On the Fund Overview page, select the “Documents” tab. At the bottom of that page, select “Form N-Q.”
Annual Shareholder Report
Mutual funds are not bank deposits or obligations, are not guaranteed by any bank and are not insured or guaranteed by the U.S. government, the Federal Deposit Insurance Corporation, the Federal Reserve Board or any other government agency. Investment in mutual funds involves investment risk, including the possible loss of principal.
This Report is authorized for distribution to prospective investors only when preceded or accompanied by the Fund's Prospectus, which contains facts concerning its objective and policies, management fees, expenses and other information.
Federated Kaufmann Small Cap Fund
Federated Investors Funds
4000 Ericsson Drive
Warrendale, PA 15086-7561
Contact us at FederatedInvestors.com
or call 1-800-341-7400.
Federated Securities Corp., Distributor
CUSIP 314172636
CUSIP 314172628
CUSIP 314172610
CUSIP 314172537
29503 (12/12)
Federated is a registered trademark of Federated Investors, Inc.
2012 ©Federated Investors, Inc.
Annual Shareholder Report
October 31, 2012
| Share Class | Ticker |
| A | FGSAX |
| B | FGSBX |
| C | FGSCX |
| R | FGSKX |
| Institutional | FGSIX |
Federated Mid Cap Growth Strategies Fund
Fund Established 1984
A Portfolio of Federated Equity Funds
Dear Valued Shareholder,
I am pleased to present the Annual Shareholder Report for your fund covering the period from November 1, 2011 through October 31, 2012. This report includes Management's Discussion of Fund Performance, a complete listing of your fund's holdings, performance information and financial statements along with other important fund information.
In addition, our website, FederatedInvestors.com, offers easy access to Federated resources that include timely fund updates, economic and market insights from our investment strategists, and financial planning tools. We invite you to register to take full advantage of its capabilities.
Thank you for investing with Federated. I hope you find this information useful and look forward to keeping you informed.
Sincerely,
J. Christopher Donahue, President
Not FDIC Insured • May Lose Value • No Bank Guarantee
Management's Discussion of Fund Performance (unaudited)
The Fund's total return, based on net asset value, for the fiscal year ended October 31, 2012, was 2.11% for the Class A Shares, 1.32% for the Class B Shares, 1.34% for the Class C Shares, 1.61% for the Class R Shares and 2.37% for the Institutional Share Class. The total return of the Fund's benchmark, the Russell Midcap Growth Index (RMCGI)1 was 9.09% for the same period. The Fund's total return for the fiscal year reflects actual cash flows, transaction costs and other expenses which are not reflected in the total return of the RMCGI.
The following discussion will focus on the performance of the Fund's Institutional Shares.
MARKET OVERVIEW
Mid-cap growth stocks, as measured by the RMCGI, had a positive but relatively weak 12-month period. While up generally, mid-cap growth stocks lagged mid-cap value stocks by almost 5% and trailed the Standard & Poor's 500 Index2 by more than 5% over the 12-month reporting period.
The reporting period experienced continued, albeit somewhat lumpy, strength in domestic equity markets affected by modest (but above expected) economic growth and uncertainty brought about by the European sovereign debt crisis. The latter point, as the market hoped, appeared to be mitigated by a more recently aggressive European Central Bank (ECB).
While mixed, equity market performance during the fiscal year was led by the market's preference for mostly cyclically leveraged stocks. The Health Care, Materials and Financial sectors provided the highest market returns within the RMCGI during the fiscal year. Information Technology and Energy stocks, normally very cyclical sectors, were the weakest within the benchmark.
FUND PERFORMANCE
The Fund's overall underperformance, relative to its benchmark, primarily resulted from stock selection in Health Care, Information Technology and Materials sectors. Within Health Care, setbacks in HMO stocks and a couple of biotech holdings dampened returns. The Technology sector was affected by underperformers in Software and Communications Hardware, and Materials were negatively affected by a weakness in agricultural and mining stocks.
With regard to its broader portfolio construction, the Fund was generally on the right side of the market. At the beginning of the year, the Fund looked forward to an ameliorating fiscal climate in Europe, as the ECB seemed more proactive, and to an improving economic climate in the U.S. Both of these top down situations generally came to pass. The Fund came into the fiscal year neutral-to-positive and was positioned more bullishly as we moved into calendar year 2012.
Annual Shareholder Report
On the positive side, the Fund's performance, relative to its benchmark, was aided by stock selection in the Financial and Energy Stocks and by relative weighting in Consumer Staples. Positive individual contributors to Fund performance were Pharmasset, Tesoro Petroleum, Expedia and Discover Financial Services. Specific holdings that detracted from the Fund performance during the period were Idenix Pharmaceuticals, Stillwater Mining, Sina and Abercrombie and Fitch.
Please note that effective January 18, 2013, Federated MDTA LLC's investment management team will take over management of the Fund and accordingly the Fund's name will change to Federated MDT Mid-Cap Growth Strategies Fund. Further information on these changes is being sent to shareholders of the Fund.
| 1 | Russell Midcap® Growth Index measures the performance of those Russell Midcap® companies with higher price-to-book ratios and higher forecasted growth values. The stocks are also members of the Russell 1000® Growth Index. The index is unmanaged and, unlike the Fund, is not affected by cashflows. Investments cannot be made directly in an index. |
| 2 | Standard and Poor's 500 Index is an unmanaged capitalization-weighted index of 500 stocks designed to measure performance of the broad domestic economy through changes in the aggregate market value of 500 stocks representing all major industries. The index is unmanaged and, unlike the Fund, is not affected by cashflows. Investments cannot be made directly in an index. |
Annual Shareholder Report
FUND PERFORMANCE AND GROWTH OF A $10,000 INVESTMENT
The Fund's Class R Shares and Institutional Shares commenced operations on December 12, 2006 and January 29, 2010, respectively. For the period prior to commencement of operations of the Class R Shares, the performance information shown is for the Fund's Class A Shares, adjusted to reflect the expense of the Class R Shares. For the period prior to the commencement of operations of the Institutional Shares, the performance information shown is for the Fund's Class A Shares. The performance of the Class A Shares has not been adjusted to reflect the expenses of the Institutional Shares since the Institutional Shares have a lower expense ratio than the expense ratio of the Class A Shares. The performance of Class A Shares has been adjusted to remove any voluntary waiver of Fund expenses that may have occurred during the period prior to the commencement of operations of the Institutional Shares. The Average Annual Total Return table below shows returns for each class averaged over the stated periods. The graphs below illustrate the hypothetical investment of $10,0001 in the Federated Mid Cap Growth Strategies Fund (the “Fund”) from October 31, 2002 to October 31, 2012, compared to the Russell Midcap Growth Index (RMCGI)2 and the Lipper Multi-Cap Growth Funds Average (LMCGFA).2
Average Annual Total Returns for the Period Ended 10/31/2012
(returns reflect all applicable sales charges and contingent deferred sales charges as specified below in footnote #1)
| Share Class | 1 Year | 5 Years | 10 Years |
| Class A Shares | -3.50% | -4.23% | 6.76% |
| Class B Shares | -4.18% | -4.21% | 6.71% |
| Class C Shares | 0.34% | -3.86% | 6.55% |
| Class R Shares | 1.61% | -3.59% | 6.87% |
| Institutional Shares | 2.37% | -3.07% | 7.40% |
Performance data quoted represents past performance which is no guarantee of future results. Investment return and principal value will fluctuate so that an investor's shares, when redeemed, may be worth more or less than their original cost. Mutual fund performance changes over time and current performance may be lower or higher than what is stated. For current to the most recent month-end performance and after-tax returns, visit FederatedInvestors.com or call 1-800-341-7400. Returns shown do not reflect the deduction of taxes that a shareholder would pay on Fund distributions or the redemption of Fund shares. Mutual funds are not obligations of or guaranteed by any bank and are not federally insured.
Annual Shareholder Report
Growth of a $10,000 Investment–class A sHARES
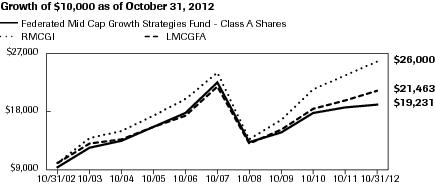
| Federated Mid Cap Growth Strategies Fund - | C000026743 | RMCGI | LMCGFA |
| 10/31/2002 | 9,450 | 10,000 | 10,000 |
| 10/31/2003 | 12,491 | 13,930 | 13,119 |
| 10/31/2004 | 13,633 | 15,151 | 13,868 |
| 10/31/2005 | 15,825 | 17,561 | 15,700 |
| 10/31/2006 | 17,946 | 20,109 | 17,529 |
| 10/31/2007 | 22,562 | 24,075 | 22,018 |
| 10/31/2008 | 13,264 | 13,807 | 13,066 |
| 10/31/2009 | 14,764 | 16,911 | 15,336 |
| 10/31/2010 | 17,909 | 21,651 | 18,594 |
| 10/31/2011 | 18,833 | 23,834 | 19,752 |
| 10/31/2012 | 19,231 | 26,000 | 21,463 |
41 graphic description end -->
| ■ | Total returns shown include the maximum sales charge of 5.50% ($10,000 investment minus $550 sales charge = $9,450). |
Growth of a $10,000 Investment–class B sHARES
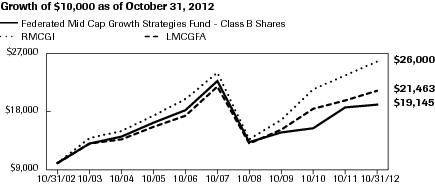
| Federated Mid Cap Growth Strategies Fund - | C000026744 | RMCGI | LMCGFA |
| 10/31/2002 | 10,000 | 10,000 | 10,000 |
| 10/31/2003 | 13,124 | 13,930 | 13,119 |
| 10/31/2004 | 14,219 | 15,151 | 13,868 |
| 10/31/2005 | 16,365 | 17,561 | 15,700 |
| 10/31/2006 | 18,410 | 20,109 | 17,529 |
| 10/31/2007 | 22,972 | 24,075 | 22,018 |
| 10/31/2008 | 13,404 | 13,807 | 13,066 |
| 10/31/2009 | 14,811 | 16,911 | 15,336 |
| 10/31/2010 | 15,550 | 21,651 | 18,594 |
| 10/31/2011 | 18,749 | 23,834 | 19,752 |
| 10/31/2012 | 19,145 | 26,000 | 21,463 |
41 graphic description end -->
| ■ | Total returns shown include the maximum contingent deferred sales charge of 5.50% as applicable. |
Annual Shareholder Report
Growth of a $10,000 Investment–class c sHARES
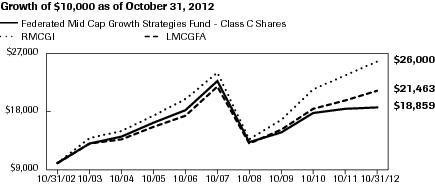
| Federated Mid Cap Growth Strategies Fund - | C000026745 | RMCGI | LMCGFA |
| 10/31/2002 | 10,000 | 10,000 | 10,000 |
| 10/31/2003 | 13,120 | 13,930 | 13,119 |
| 10/31/2004 | 14,216 | 15,151 | 13,868 |
| 10/31/2005 | 16,357 | 17,561 | 15,700 |
| 10/31/2006 | 18,409 | 20,109 | 17,529 |
| 10/31/2007 | 22,964 | 24,075 | 22,018 |
| 10/31/2008 | 13,403 | 13,807 | 13,066 |
| 10/31/2009 | 14,807 | 16,911 | 15,336 |
| 10/31/2010 | 17,822 | 21,651 | 18,594 |
| 10/31/2011 | 18,609 | 23,834 | 19,752 |
| 10/31/2012 | 18,859 | 26,000 | 21,463 |
41 graphic description end -->
| ■ | Total returns shown include the contingent deferred sales charge of 1.00%, as applicable. |
Growth of a $10,000 Investment–class R sHARES
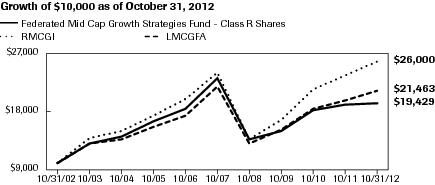
| Federated Mid Cap Growth Strategies Fund - | C000043493 | RMCGI | LMCGFA |
| 10/31/2002 | 10,000 | 10,000 | 10,000 |
| 10/31/2003 | 13,153 | 13,930 | 13,119 |
| 10/31/2004 | 14,285 | 15,151 | 13,868 |
| 10/31/2005 | 16,499 | 17,561 | 15,700 |
| 10/31/2006 | 18,568 | 20,109 | 17,529 |
| 10/31/2007 | 23,328 | 24,075 | 22,018 |
| 10/31/2008 | 13,669 | 13,807 | 13,066 |
| 10/31/2009 | 15,135 | 16,911 | 15,336 |
| 10/31/2010 | 18,271 | 21,651 | 18,594 |
| 10/31/2011 | 19,121 | 23,834 | 19,752 |
| 10/31/2012 | 19,429 | 26,000 | 21,463 |
41 graphic description end -->
Annual Shareholder Report
Growth of a $10,000 Investment–INSTITUTIONAL sHARES
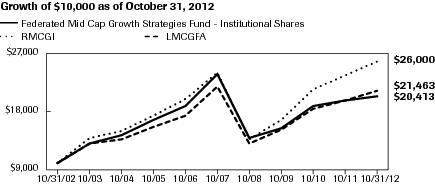
| Federated Mid Cap Growth Strategies Fund - | C000082649 | RMCGI | LMCGFA |
| 10/31/2002 | 10,000 | 10,000 | 10,000 |
| 10/31/2003 | 13,218 | 13,930 | 13,119 |
| 10/31/2004 | 14,427 | 15,151 | 13,868 |
| 10/31/2005 | 16,746 | 17,561 | 15,700 |
| 10/31/2006 | 18,985 | 20,109 | 17,529 |
| 10/31/2007 | 23,861 | 24,075 | 22,018 |
| 10/31/2008 | 14,018 | 13,807 | 13,066 |
| 10/31/2009 | 15,572 | 16,911 | 15,336 |
| 10/31/2010 | 18,915 | 21,651 | 18,594 |
| 10/31/2011 | 19,941 | 23,834 | 19,752 |
| 10/31/2012 | 20,413 | 26,000 | 21,463 |
41 graphic description end -->
| 1 | Represents a hypothetical investment of $10,000 in the Fund after deducting applicable sales charges: For Class A Shares, the maximum sales charge of 5.50% ($10,000 investment minus $550 sales charge = $9,450); for Class B Shares, the maximum contingent deferred sales charge is 5.50% on any redemption less than one year from the purchase date; for Class C Shares, the maximum contingent deferred sales charge is 1.00% on any redemption less than one year from the purchase date. The Fund's performance assumes the reinvestment of all dividends and distributions. The RMCGI and the LMCGFA have been adjusted to reflect reinvestment of dividends on securities in the indexes. |
| 2 | The RMCGI is not adjusted to reflect sales loads, expenses or other fees that the Securities and Exchange Commission (SEC) requires to be reflected in the Fund's performance. The index is unmanaged and unlike the Fund, is not affected by cash flows. It is not possible to invest directly in an index. The LMCGFA represents the average of the total returns reported by all the mutual funds designated by Lipper, Inc. as falling into the category, and is not adjusted to reflect any sales charges. However, these total returns are reported net of expenses or other fees that the SEC requires to be reflected in a fund's performance. |
Annual Shareholder Report
Portfolio of Investments Summary Table (unaudited)
At October 31, 2012, the Fund's sector composition1 was as follows:
| Sector | Percentage of
Net Assets |
| Consumer Discretionary | 26.7% |
| Information Technology | 18.4% |
| Industrials | 16.4% |
| Financials | 9.5% |
| Health Care | 8.9% |
| Materials | 8.3% |
| Energy | 7.5% |
| Consumer Staples | 3.5% |
| Telecommunication Services | 0.7% |
| Securities Lending Collateral2 | 6.8% |
| Cash Equivalents3 | 0.2% |
| Other Assets and Liabilities—Net4 | (6.9)% |
| TOTAL | 100.0% |
| 1 | Except for Securities Lending Collateral, Cash Equivalents and Other Assets and Liabilities, sector classifications are based upon, and individual portfolio securities are assigned to, the classifications of the Global Industry Classification Standard (GICS) except that the Adviser assigns a classification to securities not classified by the GICS and to securities for which the Adviser does not have access to the classification made by the GICS. |
| 2 | Cash collateral received from lending portfolio securities which is invested in short-term investments such as repurchase agreements or money market mutual funds. |
| 3 | Cash Equivalents include any investments in money market mutual funds and/or overnight repurchase agreements other than those representing securities lending collateral. |
| 4 | Assets, other than investments in securities, less liabilities. See Statement of Assets and Liabilities.
|
Annual Shareholder Report
Portfolio of Investments
October 31, 2012
| Shares | | | Value |
| | COMMON STOCKS—99.9% | |
| | Consumer Discretionary—26.7% | |
| 38,100 | | Advance Auto Parts, Inc. | $2,702,814 |
| 157,580 | 1 | Ascena Retail Group, Inc. | 3,120,084 |
| 49,400 | 1 | Bed Bath & Beyond, Inc. | 2,849,392 |
| 150,800 | | Block (H&R), Inc. | 2,669,160 |
| 78,700 | | Choice Hotels International, Inc. | 2,462,523 |
| 54,300 | | Coach, Inc. | 3,043,515 |
| 61,400 | 1,2 | Coinstar, Inc. | 2,882,116 |
| 91,518 | 2 | D. R. Horton, Inc. | 1,918,217 |
| 101,946 | | Delphi Automotive PLC | 3,205,182 |
| 38,500 | | Dillards, Inc., Class A | 2,964,500 |
| 58,222 | 1 | Discovery Communications, Inc. | 3,436,262 |
| 50,450 | | Expedia, Inc. | 2,984,118 |
| 147,500 | | Finish Line, Inc., Class A | 3,068,737 |
| 90,300 | | Foot Locker, Inc. | 3,025,050 |
| 26,700 | 1 | Genesco, Inc. | 1,529,910 |
| 94,581 | | HSN, Inc. | 4,920,104 |
| 66,100 | | Harman International Industries, Inc. | 2,771,573 |
| 71,800 | | Hasbro, Inc. | 2,584,082 |
| 72,600 | 1 | Hyatt Hotels Corp. | 2,649,900 |
| 208,900 | | Interpublic Group of Cos., Inc. | 2,109,890 |
| 66,000 | 1 | LKQ Corp. | 1,378,740 |
| 22,829 | 1 | Liberty Media Corp. | 2,549,314 |
| 51,800 | | Macy's, Inc. | 1,972,026 |
| 62,756 | 1 | Madison Square Garden Co./The | 2,583,037 |
| 6,000 | | PVH Corp. | 659,940 |
| 36,600 | | PetSmart, Inc. | 2,429,874 |
| 5,000 | 1 | Priceline.com, Inc. | 2,868,850 |
| 64,201 | | Scripps Networks Interactive | 3,898,285 |
| 176,800 | | Service Corp. International | 2,482,272 |
| 19,488 | | Time Warner Cable, Inc. | 1,931,456 |
| 74,762 | 1,2 | Tumi Holdings, Inc. | 1,674,669 |
| 37,400 | | Tupperware Brands Corp. | 2,210,340 |
| 31,900 | 1 | Warnaco Group, Inc. | 2,251,502 |
| 16,000 | | Wyndham Worldwide Corp. | 806,400 |
| | TOTAL | 86,593,834 |
Annual Shareholder Report
| Shares | | | Value |
| | COMMON STOCKS—continued | |
| | Consumer Staples—3.5% | |
| 24,300 | | Bunge Ltd. | $1,726,029 |
| 68,800 | 2 | Herbalife Ltd. | 3,532,880 |
| 45,793 | | Ingredion, Inc. | 2,814,438 |
| 20,900 | | Lorillard, Inc. | 2,424,609 |
| 17,982 | 1 | Monster Beverage Co. | 803,256 |
| | TOTAL | 11,301,212 |
| | Energy—7.5% | |
| 56,300 | 1 | Cameron International Corp. | 2,851,032 |
| 43,000 | 1 | Dresser-Rand Group, Inc. | 2,215,790 |
| 83,543 | 1 | Helix Energy Solutions Group, Inc. | 1,444,458 |
| 15,000 | | HollyFrontier Corp. | 579,450 |
| 244,400 | 1 | McDermott International, Inc. | 2,617,524 |
| 61,100 | | Oceaneering International, Inc. | 3,197,363 |
| 123,492 | | Paramount Resources Ltd. | 4,179,254 |
| 115,700 | | Tesoro Petroleum Corp. | 4,363,047 |
| 67,500 | | Transocean Ltd. | 3,084,075 |
| | TOTAL | 24,531,993 |
| | Financials—9.5% | |
| 25,800 | | American Tower Corp. | 1,942,482 |
| 73,000 | | CBOE Holdings, Inc. | 2,152,770 |
| 92,000 | | Comerica, Inc. | 2,742,520 |
| 103,200 | | Discover Financial Services | 4,231,200 |
| 39,451 | | HCP, Inc. | 1,747,679 |
| 217,603 | | Jefferies Group, Inc. | 3,098,667 |
| 256,600 | | KeyCorp | 2,160,572 |
| 35,800 | | Post Properties, Inc. | 1,747,398 |
| 41,800 | 1 | SVB Financial Group | 2,365,462 |
| 99,800 | | SunTrust Banks, Inc. | 2,714,560 |
| 156,300 | | TD Ameritrade Holding Corp. | 2,452,347 |
| 106,400 | | Waddell & Reed Financial, Inc., Class A | 3,546,312 |
| | TOTAL | 30,901,969 |
| | Health Care—8.9% | |
| 72,600 | | Agilent Technologies, Inc. | 2,612,874 |
| 22,200 | 1 | Alexion Pharmaceuticals, Inc. | 2,006,436 |
| 28,900 | | Allergan, Inc. | 2,598,688 |
| 142,870 | 1,2 | Amarin Corporation PLC., ADR | 1,683,009 |
| 8,000 | | Amgen, Inc. | 692,360 |
| 104,400 | 1 | Ariad Pharmaceutiacals, Inc. | 2,249,820 |
Annual Shareholder Report
| Shares | | | Value |
| | COMMON STOCKS—continued | |
| | Health Care—continued | |
| 49,512 | 1,2 | Express Scripts Holding Co. | $3,046,968 |
| 37,600 | | Humana, Inc. | 2,792,552 |
| 40,996 | | Medivation, Inc. | 2,095,716 |
| 4,500 | 1 | Mettler-Toledo International, Inc. | 762,165 |
| 166,600 | 1 | Mylan, Inc. | 4,221,644 |
| 29,100 | | Universal Health Services, Inc., Class B | 1,204,449 |
| 35,100 | 1 | Vertex Pharmaceuticals, Inc. | 1,693,224 |
| 76,700 | 1,2 | Vivus, Inc. | 1,142,830 |
| | TOTAL | 28,802,735 |
| | Industrials—16.4% | |
| 49,500 | | AMETEK, Inc. | 1,759,725 |
| 107,300 | | Actuant Corp. | 3,030,152 |
| 9,000 | 1 | B/E Aerospace, Inc. | 405,810 |
| 21,500 | | Carlisle Cos., Inc. | 1,194,325 |
| 78,800 | | Cintas Corp. | 3,294,628 |
| 27,700 | 1 | Clean Harbors, Inc. | 1,616,295 |
| 59,800 | | Corrections Corp. of America | 2,012,270 |
| 69,700 | | Crane Co. | 2,926,006 |
| 92,500 | | Curtiss Wright Corp. | 2,855,475 |
| 54,000 | | Danaher Corp. | 2,793,420 |
| 50,200 | | Dover Corp. | 2,922,644 |
| 48,200 | 1 | Esterline Technologies Corp. | 2,785,478 |
| 15,600 | | Hubbell, Inc., Class B | 1,306,032 |
| 11,000 | | Hunt (J.B.) Transportation Services, Inc. | 645,700 |
| 71,600 | | IDEX Corp. | 3,045,148 |
| 54,100 | | Joy Global, Inc. | 3,378,545 |
| 43,700 | | Kansas City Southern Industries, Inc. | 3,516,102 |
| 38,900 | | Pall Corp. | 2,449,144 |
| 32,200 | | Parker-Hannifin Corp. | 2,532,852 |
| 74,300 | 1 | Quanta Services, Inc. | 1,926,599 |
| 34,800 | | Roper Industries, Inc. | 3,799,116 |
| 6,000 | | Union Pacific Corp. | 738,180 |
| 103,383 | | Xylem, Inc. | 2,508,071 |
| | TOTAL | 53,441,717 |
| | Information Technology—18.4% | |
| 14,700 | 1 | ACI Worldwide, Inc. | 574,770 |
| 38,500 | 1,2 | Alliance Data Systems Corp. | 5,507,425 |
| 2,600 | | Apple, Inc. | 1,547,260 |
Annual Shareholder Report
| Shares | | | Value |
| | COMMON STOCKS—continued | |
| | Information Technology—continued | |
| 100,700 | 1 | Broadcom Corp. | $3,175,575 |
| 238,100 | 1 | Cadence Design Systems, Inc. | 3,014,346 |
| 98,774 | 1 | Cardtronics, Inc. | 2,806,169 |
| 50,100 | 1 | Commvault Systems, Inc. | 3,129,747 |
| 93,609 | 1 | CoreLogic, Inc. | 2,227,894 |
| 16,000 | 1 | eBay, Inc. | 772,640 |
| 25,700 | 1 | F5 Networks, Inc. | 2,119,736 |
| 38,700 | | Fair Isaac & Co., Inc. | 1,803,420 |
| 113,800 | 1 | Fortinet, Inc. | 2,204,306 |
| 60,600 | | Global Payments, Inc. | 2,590,650 |
| 61,579 | | IAC Interactive Corp. | 2,977,345 |
| 56,200 | | KLA-Tencor Corp. | 2,614,424 |
| 47,300 | 1 | MICROS Systems Corp. | 2,146,947 |
| 87,800 | 1 | Mentor Graphics Corp. | 1,362,656 |
| 164,100 | 1 | NVIDIA Corp. | 1,964,277 |
| 23,400 | 1 | OSI Systems, Inc. | 1,854,450 |
| 34,500 | 1 | Red Hat, Inc. | 1,696,365 |
| 53,500 | 1 | Solarwinds, Inc. | 2,706,565 |
| 61,700 | 1,2 | Synaptics, Inc. | 1,428,972 |
| 52,000 | 1 | Synopsys, Inc. | 1,674,400 |
| 36,081 | 1 | Teradata Corp. | 2,464,693 |
| 34,100 | 1 | VMware, Inc., Class A | 2,890,657 |
| 35,300 | 1 | Verifone Systems, Inc. | 1,046,292 |
| 47,200 | | Western Digital Corp. | 1,615,656 |
| | TOTAL | 59,917,637 |
| | Materials—8.3% | |
| 31,700 | | Albemarle Corp. | 1,746,987 |
| 19,000 | | Ashland, Inc. | 1,351,850 |
| 43,200 | | Ball Corp. | 1,850,256 |
| 96,300 | | Buckeye Technologies, Inc. | 2,523,060 |
| 87,800 | | Cabot Corp. | 3,139,728 |
| 53,300 | | Eastman Chemical Co. | 3,157,492 |
| 74,700 | | International Paper Co. | 2,676,501 |
| 13,200 | 2 | Newmarket Corp. | 3,581,292 |
| 21,500 | | PPG Industries, Inc. | 2,517,220 |
| 6,000 | | Rock-Tenn Co. | 439,140 |
| 29,100 | | Valspar Corp. | 1,630,473 |
Annual Shareholder Report
| Shares | | | Value |
| | COMMON STOCKS—continued | |
| | Materials—continued | |
| 29,900 | | Westlake Chemical Corp. | $2,274,194 |
| | TOTAL | 26,888,193 |
| | Telecommunication Services—0.7% | |
| 83,900 | 1 | TW Telecom, Inc. | 2,136,933 |
| | TOTAL COMMON STOCKS
(IDENTIFIED COST $292,488,607) | 324,516,223 |
| | MUTUAL FUND—7.0% | |
| 22,744,890 | 3,4,5 | Federated Prime Value Obligations Fund, Institutional Shares, 0.16%
(AT NET ASSET VALUE) | 22,744,890 |
| | TOTAL INVESTMENTS—106.9%
(IDENTIFIED COST $315,233,497)6 | 347,261,113 |
| | OTHER ASSETS AND LIABILITIES - NET—(6.9)%7 | (22,452,926) |
| | TOTAL NET ASSETS—100% | $324,808,187 |
| 1 | Non-income producing security. |
| 2 | All or a portion of these securities are temporarily on loan to unaffiliated broker/dealers. |
| 3 | Affiliated holding. |
| 4 | 7-Day net yield. |
| 5 | All or a portion of this security is held as collateral for securities lending. |
| 6 | The cost of investments for federal tax purposes amounts to $315,921,353. |
| 7 | Assets, other than investments in securities, less liabilities. See Statement of Assets and Liabilities. |
Note: The categories of investments are shown as a percentage of total net assets at October 31, 2012.
Various inputs are used in determining the value of the Fund's investments. These inputs are summarized in the three broad levels listed below:
Level 1—quoted prices in active markets for identical securities, including investment companies with daily net asset values, if applicable.
Level 2—other significant observable inputs (including quoted prices for similar securities, interest rates, prepayment speeds, credit risk, etc.). Also includes securities valued at amortized cost.
Level 3—significant unobservable inputs (including the Fund's own assumptions in determining the fair value of investments).
The inputs or methodology used for valuing securities are not an indication of the risk associated with investing in those securities.
As of October 31, 2012, all investments of the Fund utilized Level 1 inputs in valuing the Fund's assets carried at fair value.
The following acronym is used throughout this portfolio:
| ADR | —American Depositary Receipt |
See Notes which are an integral part of the Financial Statements
Annual Shareholder Report
Financial Highlights–Class A Shares
(For a Share Outstanding Throughout Each Period)
| Year Ended October 31 | 2012 | 2011 | 2010 | 2009 | 2008 |
| Net Asset Value, Beginning of Period | $34.05 | $32.38 | $26.77 | $24.05 | $45.41 |
| Income From Investment Operations: | | | | | |
| Net investment income (loss) | (0.11)1 | (0.21)1 | 0.011 | 0.091 | (0.00)1,2 |
| Net realized and unrealized gain (loss) on investments and foreign currency transactions | 0.77 | 1.88 | 5.68 | 2.61 | (17.11) |
| TOTAL FROM INVESTMENT OPERATIONS | 0.66 | 1.67 | 5.69 | 2.70 | (17.11) |
| Less Distributions: | | | | | |
| Distributions from net investment income | — | — | (0.08) | — | — |
| Distributions from net realized gain on investments and foreign currency transactions | — | — | — | — | (4.25) |
| TOTAL DISTRIBUTIONS | — | — | (0.08) | — | (4.25) |
| Regulatory Settlement Proceeds | 0.063 | — | — | 0.023 | — |
| Net Asset Value, End of Period | $34.77 | $34.05 | $32.38 | $26.77 | $24.05 |
| Total Return4 | 2.11%3 | 5.16% | 21.30% | 11.31%3 | (41.21)% |
| Ratios to Average Net Assets: | | | | | |
| Net expenses | 1.22% | 1.19%5,6 | 0.99%5,6 | 0.99%5,6 | 0.99%5,6 |
| Net investment income (loss) | (0.32)% | (0.60)% | 0.04% | 0.37% | (0.00)%7 |
| Expense waiver/reimbursement8 | 0.18% | 0.22% | 0.38% | 0.45% | 0.32% |
| Supplemental Data: | | | | | |
| Net assets, end of period (000 omitted) | $226,079 | $245,823 | $283,387 | $298,431 | $293,777 |
| Portfolio turnover | 135% | 172% | 265% | 207% | 215% |
| 1 | Per share numbers have been calculated using the average shares method. |
| 2 | Represents less than $0.01. |
| 3 | During the years ended October 31, 2012 and 2009, the Fund received a regulatory settlement from an unaffiliated third party, which had an impact of 0.21% and 0.08%, respectively, on the total return. |
| 4 | Based on net asset value, which does not reflect the sales charge, redemption fee or contingent deferred sales charge, if applicable. |
| 5 | Pursuant to a settlement with the New York Attorney General, the Adviser has agreed to waive management fees in compliance with an Assurance of Discontinuance dated November 17, 2005. The net management fee was reduced to 0.4975% effective January 1, 2006 through December 31, 2010. |
| 6 | The net expense ratio is calculated without reduction for expense offset arrangements. The net expense ratios are 1.18%, 0.98%, 0.96% and 0.98% for the years ended October 31, 2011, 2010, 2009 and 2008, respectively, after taking into account these expense reductions. |
| 7 | Represents less than 0.01%. |
| 8 | This expense decrease is reflected in both the net expense and the net investment income (loss) ratios shown above. |
See Notes which are an integral part of the Financial Statements
Annual Shareholder Report
Financial Highlights–Class B Shares
(For a Share Outstanding Throughout Each Period)
| Year Ended October 31 | 2012 | 2011 | 2010 | 2009 | 2008 |
| Net Asset Value, Beginning of Period | $29.48 | $28.24 | $23.46 | $21.23 | $40.89 |
| Income From Investment Operations: | | | | | |
| Net investment income (loss) | (0.32)1 | (0.42)1 | (0.19)1 | (0.06)1 | (0.24)1 |
| Net realized and unrealized gain (loss) on investments and foreign currency transactions | 0.66 | 1.66 | 4.97 | 2.27 | (15.17) |
| TOTAL FROM INVESTMENT OPERATIONS | 0.34 | 1.24 | 4.78 | 2.21 | (15.41) |
| Less Distributions: | | | | | |
| Distributions from net realized gain on investments and foreign currency transactions | — | — | — | — | (4.25) |
| Regulatory Settlement Proceeds | 0.052 | — | — | 0.022 | — |
| Net Asset Value, End of Period | $29.87 | $29.48 | $28.24 | $23.46 | $21.23 |
| Total Return3 | 1.32%2 | 4.39% | 20.38% | 10.50%2 | (41.65)% |
| Ratios to Average Net Assets: | | | | | |
| Net expenses | 1.97% | 1.93%4,5 | 1.74%4,5 | 1.73%4,5 | 1.74%4,5 |
| Net investment income (loss) | (1.06)% | (1.35)% | (0.73)% | (0.28)% | (0.75)% |
| Expense waiver/reimbursement6 | 0.31% | 0.30% | 0.46% | 0.52% | 0.39% |
| Supplemental Data: | | | | | |
| Net assets, end of period (000 omitted) | $4,239 | $6,325 | $8,344 | $11,669 | $21,592 |
| Portfolio turnover | 135% | 172% | 265% | 207% | 215% |
| 1 | Per share numbers have been calculated using the average shares method. |
| 2 | During the years ended October 31, 2012 and 2009, the Fund received a regulatory settlement from an unaffiliated third party, which had an impact of 0.24% and 0.14%, respectively, on the total return. |
| 3 | Based on net asset value, which does not reflect the sales charge, redemption fee or contingent deferred sales charge, if applicable. |
| 4 | Pursuant to a settlement with the New York Attorney General, the Adviser has agreed to waive management fees in compliance with an Assurance of Discontinuance dated November 17, 2005. The net management fee was reduced to 0.4975% effective January 1, 2006 through December 31, 2010. |
| 5 | The net expense ratio is calculated without reduction for expense offset arrangements. The net expense ratios are 1.93%, 1.73%, 1.69% and 1.73% for the years ended October 31, 2011, 2010, 2009 and 2008, respectively, after taking into account these expense reductions. |
| 6 | This expense decrease is reflected in both the net expense and the net investment income (loss) ratios shown above. |
See Notes which are an integral part of the Financial Statements
Annual Shareholder Report
Financial Highlights–Class C Shares
(For a Share Outstanding Throughout Each Period)
| Year Ended October 31 | 2012 | 2011 | 2010 | 2009 | 2008 |
| Net Asset Value, Beginning of Period | $29.81 | $28.55 | $23.72 | $21.47 | $41.29 |
| Income From Investment Operations: | | | | | |
| Net investment income (loss) | (0.33)1 | (0.42)1 | (0.19)1 | (0.08)1 | (0.24)1 |
| Net realized and unrealized gain (loss) on investments and foreign currency transactions | 0.68 | 1.68 | 5.02 | 2.31 | (15.33) |
| TOTAL FROM INVESTMENT OPERATIONS | 0.35 | 1.26 | 4.83 | 2.23 | (15.57) |
| Less Distributions: | | | | | |
| Distributions from net realized gain on investments and foreign currency transactions | — | — | — | — | (4.25) |
| Regulatory Settlement Proceeds | 0.052 | — | — | 0.022 | — |
| Net Asset Value, End of Period | $30.21 | $29.81 | $28.55 | $23.72 | $21.47 |
| Total Return3 | 1.34%2 | 4.41% | 20.36% | 10.48%2 | (41.64)% |
| Ratios to Average Net Assets: | | | | | |
| Net expenses | 1.97% | 1.94%4,5 | 1.74%4,5 | 1.74%4,5 | 1.74%4,5 |
| Net investment income (loss) | (1.07)% | (1.34)% | (0.71)% | (0.36)% | (0.75)% |
| Expense waiver/reimbursement6 | 0.20% | 0.26% | 0.42% | 0.49% | 0.35% |
| Supplemental Data: | | | | | |
| Net assets, end of period (000 omitted) | $9,843 | $10,733 | $11,060 | $11,880 | $13,227 |
| Portfolio turnover | 135% | 172% | 265% | 207% | 215% |
| 1 | Per share numbers have been calculated using the average shares method. |
| 2 | During the years ended October 31, 2012 and 2009, the Fund received a regulatory settlement from an unaffiliated third party, which had an impact of 0.20% and 0.09%, respectively, on the total return. |
| 3 | Based on net asset value, which does not reflect the sales charge, redemption fee or contingent deferred sales charge, if applicable. |
| 4 | Pursuant to a settlement with the New York Attorney General, the Adviser has agreed to waive management fees in compliance with an Assurance of Discontinuance dated November 17, 2005. The net management fee was reduced to 0.4975% effective January 1, 2006 through December 31, 2010. |
| 5 | The net expense ratio is calculated without reduction for expense offset arrangements. The net expense ratios are 1.93%, 1.73%, 1.71% and 1.73% for the years ended October 31, 2011, 2010, 2009 and 2008, respectively, after taking into account these expense reductions. |
| 6 | This expense decrease is reflected in both the net expense and the net investment income (loss) ratios shown above. |
See Notes which are an integral part of the Financial Statements
Annual Shareholder Report
Financial Highlights–Class R Shares
(For a Share Outstanding Throughout Each Period)
| Year Ended October 31 | 2012 | 2011 | 2010 | 2009 | 2008 |
| Net Asset Value, Beginning of Period | $33.53 | $32.04 | $26.54 | $23.97 | $45.41 |
| Income From Investment Operations: | | | | | |
| Net investment income (loss) | (0.29)1 | (0.36)1 | (0.13)1 | (0.06)1 | (0.18)1 |
| Net realized and unrealized gain (loss) on investments and foreign currency transactions | 0.77 | 1.85 | 5.63 | 2.63 | (17.01) |
| TOTAL FROM INVESTMENT OPERATIONS | 0.48 | 1.49 | 5.50 | 2.57 | (17.19) |
| Less Distributions: | | | | | |
| Distributions from net realized gain on investments and foreign currency transactions | — | — | — | — | (4.25) |
| Regulatory Settlement Proceeds | 0.062 | — | — | — | — |
| Net Asset Value, End of Period | $34.07 | $33.53 | $32.04 | $26.54 | $23.97 |
| Total Return3 | 1.61%2 | 4.65% | 20.72% | 10.72% | (41.40)% |
| Ratios to Average Net Assets: | | | | | |
| Net expenses | 1.72% | 1.70%4,5 | 1.49%4,5 | 1.49%4,5 | 1.49%4,5 |
| Net investment income (loss) | (0.83)% | (1.04)% | (0.44)% | (0.26)% | (0.51)% |
| Expense waiver/reimbursement6 | 0.09% | 0.17% | 0.31% | 0.37% | 0.30% |
| Supplemental Data: | | | | | |
| Net assets, end of period (000 omitted) | $2,156 | $1,483 | $610 | $461 | $150 |
| Portfolio turnover | 135% | 172% | 265% | 207% | 215% |
| 1 | Per share numbers have been calculated using the average shares method. |
| 2 | During the year ended October 31, 2012, the Fund received a regulatory settlement from an unaffiliated third party, which had an impact of 0.15% on the total return. |
| 3 | Based on net asset value. |
| 4 | Pursuant to a settlement with the New York Attorney General, the Adviser has agreed to waive management fees in compliance with an Assurance of Discontinuance dated November 17, 2005. The net management fee was reduced to 0.4975% effective January 1, 2006 through December 31, 2010. |
| 5 | The net expense ratio is calculated without reduction for expense offset arrangements. The net expense ratios are 1.69%, 1.48%, 1.46% and 1.47% for the years ended October 31, 2011, 2010, 2009 and 2008, respectively, after taking into account these expense reductions. |
| 6 | This expense decrease is reflected in both the net expense and the net investment income (loss) ratios shown above. |
See Notes which are an integral part of the Financial Statements
Annual Shareholder Report
Financial Highlights–Institutional Shares
(For a Share Outstanding Throughout Each Period)
| Year Ended October 31, | Period
Ended
10/31/20101 |
| 2012 | 2011 |
| Net Asset Value, Beginning of Period | $34.20 | $32.44 | $28.18 |
| Income From Investment Operations: | | | |
| Net investment income (loss) | (0.03)2 | (0.12)2 | 0.102 |
| Net realized and unrealized gain on investments and foreign currency transactions | 0.78 | 1.88 | 4.16 |
| TOTAL FROM INVESTMENT OPERATIONS | 0.75 | 1.76 | 4.26 |
| Regulatory Settlement Proceeds | 0.063 | — | — |
| Net Asset Value, End of Period | $35.01 | $34.20 | $32.44 |
| Total Return4 | 2.37%3 | 5.43% | 15.12% |
| Ratios to Average Net Assets: | | | |
| Net expenses5 | 0.97% | 0.93%7 | 0.74%6,7 |
| Net investment income (loss) | (0.09)% | (0.35)% | 0.43%6 |
| Expense waiver/reimbursement8 | 0.11% | 0.18% | 0.33%6 |
| Supplemental Data: | | | |
| Net assets, end of period (000 omitted) | $82,490 | $26,835 | $37,709 |
| Portfolio turnover | 135% | 172% | 265%9 |
| 1 | Reflects operations for the period from January 29, 2010 (date of initial investment) to October 31, 2010. |
| 2 | Per share numbers have been calculated using the average shares method. |
| 3 | During the year ended October 31, 2012, the Fund received a regulatory settlement from an unaffiliated third party, which had an impact of 0.06% on the total return. |
| 4 | Based on net asset value. Total returns for periods of less than one year are not annualized. |
| 5 | Pursuant to a settlement with the New York Attorney General, the Adviser has agreed to waive management fees in compliance with an Assurance of Discontinuance dated November 17, 2005. The net management fee was reduced to 0.4975% effective January 1, 2006 through December 31, 2010. |
| 6 | Computed on an annualized basis. |
| 7 | The net expense ratios are calculated without reduction for expense offset arrangements. The net expense ratios are 0.92% and 0.73% for the year ended October 31, 2011 and for the period ended October 31, 2010, respectively, after taking into account these expense reductions. |
| 8 | This expense decrease is reflected in both the net expense and the net investment income (loss) ratios shown above. |
| 9 | Portfolio turnover is calculated at the Fund level. Percentage indicated was calculated for the entire fiscal year ended October 31, 2010. |
See Notes which are an integral part of the Financial Statements
Annual Shareholder Report
Statement of Assets and Liabilities
October 31, 2012
| Assets: | | |
| Total investment in securities, at value including $21,383,222 of securities loaned and $22,744,890 of investment in an affiliated holding (Note 5) (identified cost $315,233,497) | | $347,261,113 |
| Income receivable | | 96,920 |
| Receivable for shares sold | | 133,163 |
| Other assets | | 9,511 |
| TOTAL ASSETS | | 347,500,707 |
| Liabilities: | | |
| Payable for shares redeemed | $316,138 | |
| Payable for collateral due to broker for securities lending | 22,112,193 | |
| Payable for Directors'/Trustees' fees | 1,004 | |
| Payable for distribution services fee (Note 5) | 10,073 | |
| Payable for shareholder services fee (Note 5) | 119,645 | |
| Accrued expenses | 133,467 | |
| TOTAL LIABILITIES | | 22,692,520 |
| Net assets for 9,389,861 shares outstanding | | $324,808,187 |
| Net Assets Consist of: | | |
| Paid-in capital | | $322,748,916 |
| Net unrealized appreciation of investments | | 32,027,616 |
| Accumulated net realized loss on investments and foreign currency transactions | | (28,976,867) |
| Accumulated net investment income (loss) | | (991,478) |
| TOTAL NET ASSETS | | $324,808,187 |
Annual Shareholder Report
Statement of Assets and Liabilities–continued
| Net Asset Value, Offering Price and Redemption Proceeds Per Share | | |
| Class A Shares: | | |
Net asset value per share ($226,078,767 ÷ 6,502,586 shares outstanding),
no par value, unlimited shares authorized | | $34.77 |
| Offering price per share (100/94.50 of $34.77) | | $36.79 |
| Redemption proceeds per share | | $34.77 |
| Class B Shares: | | |
Net asset value per share ($4,239,424 ÷ 141,915 shares outstanding),
no par value, unlimited shares authorized | | $29.87 |
| Offering price per share | | $29.87 |
| Redemption proceeds per share (94.50/100 of $29.87) | | $28.23 |
| Class C Shares: | | |
Net asset value per share ($9,843,405 ÷ 325,863 shares outstanding),
no par value, unlimited shares authorized | | $30.21 |
| Offering price per share | | $30.21 |
| Redemption proceeds per share (99.00/100 of $30.21) | | $29.91 |
| Class R Shares: | | |
Net asset value per share ($2,156,112 ÷ 63,294 shares outstanding),
no par value, unlimited shares authorized | | $34.07 |
| Offering price per share | | $34.07 |
| Redemption proceeds per share | | $34.07 |
| Institutional Shares: | | |
Net asset value per share ($82,490,479 ÷ 2,356,203 shares outstanding),
no par value, unlimited shares authorized | | $35.01 |
| Offering price per share | | $35.01 |
| Redemption proceeds per share | | $35.01 |
See Notes which are an integral part of the Financial Statements
Annual Shareholder Report
Statement of Operations
Year Ended October 31, 2012
| Investment Income: | | | |
| Dividends (including $4,271 received from an affiliated holding (Note 5) and net of foreign taxes withheld of $8,783) | | | $2,541,026 |
| Interest received from securities loaned | | | 41,109 |
| TOTAL INCOME | | | 2,582,135 |
| Expenses: | | | |
| Investment adviser fee (Note 5) | | $2,136,565 | |
| Administrative fee (Note 5) | | 298,230 | |
| Custodian fees | | 41,903 | |
| Transfer and dividend disbursing agent fees and expenses (Note 2) and (Note 5) | | 519,174 | |
| Directors'/Trustees' fees | | 3,042 | |
| Auditing fees | | 23,000 | |
| Legal fees | | 8,825 | |
| Portfolio accounting fees | | 123,809 | |
| Distribution services fee (Note 5) | | 127,335 | |
| Shareholder services fee (Note 5) | | 592,320 | |
| Account administration fee (Note 2) | | 20,142 | |
| Share registration costs | | 70,234 | |
| Printing and postage | | 44,930 | |
| Insurance premiums | | 4,366 | |
| Miscellaneous | | 12,777 | |
| TOTAL EXPENSES | | 4,026,652 | |
| Waivers and Reimbursements: | | | |
| Waiver/reimbursement of investment adviser fee (Note 5) | $(215,446) | | |
| Waiver of administrative fee (Note 5) | (51,827) | | |
| Reimbursement of transfer and dividend disbursing agent fees and expenses (Note 2) and (Note 5) | (224,086) | | |
| TOTAL WAIVERS AND REIMBURSEMENTS | | $(491,359) | |
| Net expenses | | | $3,535,293 |
| Net investment income (loss) | | | (953,158) |
| Realized and Unrealized Gain (Loss) on Investments and Foreign Currency Transactions: | | | |
| Net realized gain on investments and foreign currency transactions | | | 18,395,245 |
| Net change in unrealized depreciation of investments | | | (14,259,702) |
| Net realized and unrealized gain on investments and foreign currency transactions | | | 4,135,543 |
| Change in net assets resulting from operations | | | $3,182,385 |
See Notes which are an integral part of the Financial Statements
Annual Shareholder Report
Statement of Changes in Net Assets
| Year Ended October 31 | 2012 | 2011 |
| Increase (Decrease) in Net Assets | | |
| Operations: | | |
| Net investment income (loss) | $(953,158) | $(2,106,828) |
| Net realized gain on investments and foreign currency transactions | 18,395,245 | 43,000,799 |
| Net change in unrealized appreciation/depreciation of investments and translation of assets and liabilities in foreign currency | (14,259,702) | (19,992,577) |
| CHANGE IN NET ASSETS RESULTING FROM OPERATIONS | 3,182,385 | 20,901,394 |
| Share Transactions: | | |
| Proceeds from sale of shares | 16,461,918 | 31,535,282 |
| Proceeds from shares issued in connection with the tax-free transfer of assets from Performance Mid Cap Equity Fund | 49,366,949 | — |
| Proceeds from shares issued in connection with the tax-free transfer of assets from Performance Leaders Equity Fund | 26,713,674 | — |
| Cost of shares redeemed | (62,628,057) | (102,346,932) |
| CHANGE IN NET ASSETS RESULTING FROM SHARE TRANSACTIONS | 29,914,484 | (70,811,650) |
| Regulatory Settlement Proceeds: | | |
| Net increase from regulatory settlement (Note 7) | 512,546 | — |
| CHANGE IN NET ASSETS | 33,609,415 | (49,910,256) |
| Net Assets: | | |
| Beginning of period | 291,198,772 | 341,109,028 |
| End of period (including accumulated net investment income (loss) of $(991,478) for the year ended October 31, 2012 and undistributed net investment income of $0 for the year ended October 31, 2011) | $324,808,187 | $291,198,772 |
See Notes which are an integral part of the Financial Statements
Annual Shareholder Report
Notes to Financial Statements
October 31, 2012
1. ORGANIZATION
Federated Equity Funds (the “Trust”) is registered under the Investment Company Act of 1940, as amended (the “Act”), as an open-end management investment company. The Trust consists of 13 diversified portfolios. The financial statements included herein are only those of Federated Mid Cap Growth Strategies Fund (the “Fund”). The financial statements of the other portfolios are presented separately. The assets of each diversified portfolio are segregated and a shareholder's interest is limited to the portfolio in which shares are held. Each portfolio pays its own expenses. The Fund offers five classes of shares: Class A Shares, Class B Shares, Class C Shares, Class R Shares and Institutional Shares. All shares of the Fund have equal rights with respect to voting, except on class-specific matters. The investment objective of the Fund is appreciation of capital.
On September 21, 2012, the Fund acquired all of the net assets of Performance Mid Cap Equity Fund and Performance Leaders Equity Fund (the “Acquired Funds”), open-end investment companies in a tax-free reorganization in exchange for shares of the Fund, pursuant to a plan of reorganization approved by the Acquired Funds' shareholders on September 19, 2012. The purpose of the transaction was to combine three portfolios with comparable investment objectives and strategies. For financial reporting purposes, assets received and shares issued by the Fund were recorded at fair value; however, the cost basis of the investments received from the Acquired Funds was carried forward to align ongoing reporting of the Fund's realized and unrealized gains and losses with amounts distributable to shareholders for tax purposes.
Assuming the acquisition had been completed on November 1, 2011, the beginning of the annual reporting period of the Fund, the Fund's pro forma results of operations for the year ended October 31, 2012, are as follows:
| Net investment income* | $(992,056) |
| Net realized and unrealized gain on investments | $30,677,095 |
| Net increase in net assets resulting from operations | $29,685,039 |
| * | Net investment income includes $190,847 of pro forma eliminated expenses. |
Because the combined investment portfolios have been managed as a single integrated portfolio since the acquisition was completed, it is not practicable to separate the amounts of revenue and earnings of the Acquired Funds that has been included in the Fund's Statement of Operations as of October 31, 2012.
For every one share of Performance Mid Cap Equity Fund Class A Shares exchanged, a shareholder received 0.321 shares of Federated Mid Cap Growth Strategies Fund Class A Shares.
For every one share of Performance Mid Cap Equity Fund Class B Shares exchanged, a shareholder received 0.267 shares of Federated Mid Cap Growth Strategies Fund Class A Shares.
For every one share of Performance Mid Cap Equity Fund Institutional Class Shares exchanged, a shareholder received 0.333 shares of Federated Mid Cap Growth Strategies Fund Institutional Shares.
Annual Shareholder Report
For every one share of Performance Leaders Equity Fund Class A Shares exchanged, a shareholder received 0.228 shares of Federated Mid Cap Growth Strategies Fund Class A Shares.
For every one share of Performance Leaders Equity Fund Class B Shares exchanged, a shareholder received 0.206 shares of Federated Mid Cap Growth Strategies Fund Class A Shares.
For every one share of Performance Leaders Equity Fund Institutional Class Shares exchanged, a shareholder received 0.234 shares of Federated Mid Cap Growth Strategies Fund Institutional Shares.
The Fund received net assets from the Performance Mid Cap Equity Fund as the result of the tax-free reorganization as follows:
Shares of the
Fund Issued | Performance
Mid Cap
Equity Fund
Net Assets
Received | Unrealized
Appreciation1 | Net Assets
of the Fund
Immediately
Prior to
Combination | Net Assets
of the Fund
Immediately
After
Combination |
| 1,359,390 | $49,366,949 | $13,007,605 | $267,813,098 | $343,893,7212 |
| 1 | Unrealized Appreciation is included in the Performance Mid Cap Equity Fund Net Assets Received amount shown above. |
| 2 | Net Assets of the Fund Immediately After Combination includes the net assets received from Performance Leaders Equity Fund which was also reorganized into the Fund on September 21, 2012. |
The Fund received net assets from the Performance Leaders Equity Fund as the result of the tax-free reorganization as follows:
Shares of the
Fund Issued | Performance
Leaders
Equity Fund
Net Assets
Received | Unrealized
Appreciation1 | Net Assets
of the Fund
Immediately
Prior to
Combination | Net Assets
of the Fund
Immediately
After
Combination |
| 734,474 | $26,713,674 | $4,675,570 | $267,813,098 | $343,893,7212 |
| 1 | Unrealized Appreciation is included in the Performance Leaders Equity Fund Net Assets Received amount shown above. |
| 2 | Net Assets of the Fund Immediately After Combination includes the net assets received from Performance Mid Cap Equity Fund which was also reorganized into the Fund on September 21, 2012. |
2. SIGNIFICANT ACCOUNTING POLICIES
The following is a summary of significant accounting policies consistently followed by the Fund in the preparation of its financial statements. These policies are in conformity with U.S. generally accepted accounting principles (GAAP).
Investment Valuation
In calculating its net asset value (NAV), the Fund generally values investments as follows:
| ■ | Equity securities listed on an exchange or traded through a regulated market system are valued at their last reported sale price or official closing price in their principal exchange or market. |
| ■ | Shares of other mutual funds are valued based upon their reported NAVs. |
Annual Shareholder Report
| ■ | Derivative contracts listed on exchanges are valued at their reported settlement or closing price. |
| ■ | Over-the-counter (OTC) derivative contracts are fair valued using price evaluations provided by a pricing service approved by the Board of Trustees (the “Trustees”). |
| ■ | Fixed-income securities acquired with remaining maturities greater than 60 days are fair valued using price evaluations provided by a pricing service approved by the Trustees. |
| ■ | Fixed-income securities acquired with remaining maturities of 60 days or less are valued at their cost (adjusted for the accretion of any discount or amortization of any premium), which approximates market value. |
| ■ | For securities that are fair valued in accordance with procedures established by and under the general supervision of the Trustees, certain factors may be considered such as: the purchase price of the security, information obtained by contacting the issuer, analysis of the issuer's financial statements or other available documents, fundamental analytical data, the nature and duration of restrictions on disposition, the movement of the market in which the security is normally traded and public trading in similar securities of the issuer or comparable issuers. |
If the Fund cannot obtain a price or price evaluation from a pricing service for an investment, the Fund may attempt to value the investment based upon the mean of bid and asked quotations or fair value the investment based on price evaluations, from one or more dealers. If any price, quotation, price evaluation or other pricing source is not readily available when the NAV is calculated, the Fund uses the fair value of the investment determined in accordance with the procedures described below. There can be no assurance that the Fund could purchase or sell an investment at the price used to calculate the Fund's NAV.
Fair Valuation and Significant Events Procedures
The Trustees have appointed a Valuation Committee comprised of officers of the Fund, Federated Equity Management Company of Pennsylvania (“Adviser”) and the Adviser's affiliated companies to determine fair value of securities and in overseeing the calculation of the NAV. The Trustees have also authorized the use of pricing services recommended by the Valuation Committee to provide fair value evaluations of the current value of certain investments for purposes of calculating the NAV. The Valuation Committee employs various methods for reviewing third-party pricing service evaluations including periodic reviews of third-party pricing services' policies, procedures and valuation methods (including key inputs and assumptions), transactional back-testing, comparisons of evaluations of different pricing services, and review of price challenges by the Adviser based on recent market activity. In the event that market quotations and price evaluations are not available for an investment, the Valuation Committee determines the fair value of the investment in accordance with procedures adopted by the Trustees. The Trustees periodically review and approve the fair valuations made by the Valuation Committee and any changes made to the procedures.
Factors considered by pricing services in evaluating an investment include the yields or prices of investments of comparable quality, coupon, maturity, call rights and other potential prepayments, terms and type, reported transactions, indications as to values from dealers and general market conditions. Some pricing services provide a single price evaluation reflecting the bid-side of the market for an investment (a “bid” evaluation). Other pricing services offer both bid evaluations and price evaluations indicative of a price between the prices bid and asked for the investment (a “mid” evaluation). The Fund normally uses bid evaluations for
Annual Shareholder Report
U.S. Treasury and Agency securities and mortgage-backed securities. The Fund normally uses mid evaluations for other types of fixed-income securities and OTC derivative contracts. In the event that market quotations and price evaluations are not available for an investment, the fair value of the investment is determined in accordance with procedures adopted by the Trustees.
The Trustees also have adopted procedures requiring an investment to be priced at its fair value whenever the Adviser determines that a significant event affecting the value of the investment has occurred between the time as of which the price of the investment would otherwise be determined and the time as of which the NAV is computed. An event is considered significant if there is both an affirmative expectation that the investment's value will change in response to the event and a reasonable basis for quantifying the resulting change in value. Examples of significant events that may occur after the close of the principal market on which a security is traded, or after the time of a price evaluation provided by a pricing service or a dealer, include:
| ■ | With respect to securities traded in foreign markets, significant trends in U.S. equity markets or in the trading of foreign securities index futures contracts; |
| ■ | Political or other developments affecting the economy or markets in which an issuer conducts its operations or its securities are traded; and |
| ■ | Announcements concerning matters such as acquisitions, recapitalizations, litigation developments, a natural disaster affecting the issuer's operations or regulatory changes or market developments affecting the issuer's industry. |
The Trustees have approved the use of a pricing service to determine the fair value of equity securities traded principally in foreign markets when the Adviser determines that there has been a significant trend in the U.S. equity markets or in index futures trading. For other significant events, the Fund may seek to obtain more current quotations or price evaluations from alternative pricing sources. If a reliable alternative pricing source is not available, the Fund will determine the fair value of the investment using another method approved by the Trustees.
Repurchase Agreements
The Fund may invest in repurchase agreements for short-term liquidity purposes. It is the policy of the Fund to require the other party to a repurchase agreement to transfer to the Fund's custodian or sub-custodian eligible securities or cash with a market value (after transaction costs) at least equal to the repurchase price to be paid under the repurchase agreement. The eligible securities are transferred to accounts with the custodian or sub-custodian in which the Fund holds a “securities entitlement” and exercises “control” as those terms are defined in the Uniform Commercial Code. The Fund has established procedures for monitoring the market value of the transferred securities and requiring the transfer of additional eligible securities if necessary to equal at least the repurchase price. These procedures also allow the other party to require securities to be transferred from the account to the extent that their market value exceeds the repurchase price or in exchange for other eligible securities of equivalent market value.
The insolvency of the other party or other failure to repurchase the securities may delay the disposition of the underlying securities or cause the Fund to receive less than the full repurchase price. Under the terms of the repurchase agreement, any amounts received by the Fund in excess of the repurchase price and related transaction costs must be remitted to the other party.
Annual Shareholder Report
The Fund may enter into repurchase agreements in which eligible securities are transferred into joint trading accounts maintained by the custodian or sub-custodian for investment companies and other clients advised by the Fund's Adviser and its affiliates. The Fund will participate on a pro rata basis with the other investment companies and clients in its share of the securities transferred under such repurchase agreements and in its share of proceeds from any repurchase or other disposition of such securities.
Investment Income, Gains and Losses, Expenses and Distributions
Investment transactions are accounted for on a trade-date basis. Realized gains and losses from investment transactions are recorded on an identified-cost basis. Interest income and expenses are accrued daily. Dividend income and distributions to shareholders are recorded on the ex-dividend date. Foreign dividends are recorded on the ex-dividend date or when the Fund is informed of the ex-dividend date. Distributions of net investment income, if any, are declared and paid annually. Non-cash dividends included in dividend income, if any, are recorded at fair value. Investment income, realized and unrealized gains and losses, and certain fund-level expenses are allocated to each class based on relative average daily net assets, except that Class A Shares, Class B Shares, Class C Shares, Class R Shares and Institutional Shares may bear distribution services fees, shareholder services fees, account administration fees and certain transfer and dividend disbursing agent fees unique to those classes. For the year ended October 31, 2012, transfer and dividend disbursing agent fees and account administration fees for the Fund were as follows:
| Transfer and
Dividend
Disbursing
Agent Fees
Incurred | Transfer and
Dividend
Disbursing
Agent Fees
Reimbursed | Account
Administration
Fees Incurred |
| Class A Shares | $435,856 | $(192,090) | $19,453 |
| Class B Shares | 16,516 | (11,302) | — |
| Class C Shares | 21,469 | (11,279) | 689 |
| Class R Shares | 6,552 | — | — |
| Institutional Shares | 38,781 | (9,415) | — |
| TOTAL | $519,174 | $(224,086) | $20,142 |
Dividends are declared separately for each class. No class has preferential dividend rights; differences in per share dividend rates are generally due to differences in separate class expenses.
Premium and Discount Amortization
All premiums and discounts on fixed-income securities are amortized/accreted using the effective interest rate method.
Federal Taxes
It is the Fund's policy to comply with the Subchapter M provision of the Internal Revenue Code (the “Code”) and to distribute to shareholders each year substantially all of its income. Accordingly, no provision for federal income tax is necessary. As of and during the year ended October 31, 2012, the Fund did not have a liability for any uncertain tax positions. The Fund
Annual Shareholder Report
recognizes interest and penalties, if any, related to tax liabilities as income tax expense in the Statement of Operations. As of October 31, 2012, tax years 2009 through 2012 remain subject to examination by the Fund's major tax jurisdictions, which include the United States of America and the Commonwealth of Massachusetts.
The Fund may be subject to taxes imposed by governments of countries in which it invests. Such taxes are generally based on either income or gains earned or repatriated. The Fund accrues and applies such taxes to net investment income, net realized gains and net unrealized gains as income and/or gains are earned.
When-Issued and Delayed Delivery Transactions
The Fund may engage in when-issued or delayed delivery transactions. The Fund records when-issued securities on the trade date and maintains security positions such that sufficient liquid assets will be available to make payment for the securities purchased. Securities purchased on a when-issued or delayed delivery basis are marked to market daily and begin earning interest on the settlement date. Losses may occur on these transactions due to changes in market conditions or the failure of counterparties to perform under the contract.
Foreign Exchange Contracts
The Fund enters into foreign exchange contracts for the delayed delivery of securities or foreign currency exchange transactions. The Fund enters into foreign exchange contracts to protect assets against adverse changes in foreign currency exchange rates or exchange control regulations. Purchased contracts are used to acquire exposure to foreign currencies, whereas, contracts to sell are used to hedge the Fund's securities against currency fluctuations. Risks may arise upon entering into these transactions from the potential inability of counterparties to meet the terms of their commitments and from unanticipated movements in security prices or foreign exchange rates. The foreign exchange contracts are adjusted by the daily exchange rate of the underlying currency and any gains or losses are recorded for financial statement purposes as unrealized until the settlement date.
At October 31, 2012, the Fund had no outstanding foreign exchange contracts.
The average value at settlement date payable and receivable of foreign exchange contracts sold by the Fund throughout the period was $1,489. This is based on the contracts held as of each month-end throughout the fiscal period.
Foreign Currency Translation
The accounting records of the Fund are maintained in U.S. dollars. All assets and liabilities denominated in foreign currencies (FCs) are translated into U.S. dollars based on the rates of exchange of such currencies against U.S. dollars on the date of valuation. Purchases and sales of securities, income and expenses are translated at the rate of exchange quoted on the respective date that such transactions are recorded. The Fund does not isolate that portion of the results of operations resulting from changes in foreign exchange rates on investments from the fluctuations arising from changes in market prices of securities held. Such fluctuations are included with the net realized and unrealized gain or loss from investments.
Annual Shareholder Report
Reported net realized foreign exchange gains or losses arise from sales of portfolio securities, sales and maturities of short-term securities, sales of FCs, currency gains or losses realized between the trade and settlement dates on securities transactions, the difference between the amounts of dividends, interest and foreign withholding taxes recorded on the Fund's books and the U.S. dollar equivalent of the amounts actually received or paid. Net unrealized foreign exchange gains and losses arise from changes in the value of assets and liabilities other than investments in securities at fiscal year-end, resulting from changes in the exchange rate.
Securities Lending
The Fund participates in a securities lending program providing for the lending of equity securities to qualified brokers. The Fund normally receives cash collateral for securities loaned that is invested in an affiliated money market fund or in short-term securities including repurchase agreements. Collateral is maintained at a minimum level of 100% of the market value of investments loaned, plus interest, if applicable. Earnings on collateral are allocated between the borrower of the security, the securities lending agent, as a fee for its services under the program and the Fund, according to agreed-upon rates.
As of October 31, 2012, securities subject to this type of arrangement and related collateral were as follows:
Market Value of
Securities Loaned | Market Value
of Collateral |
| $21,383,222 | $22,112,193 |
Additional Disclosure Related to Derivative Instruments
The Effect of Derivative Instruments on the Statement of Operations for the Year Ended October 31, 2012
| Amount of Realized Gain or (Loss) on Derivatives Recognized in Income |
| Forward
Currency
Contracts |
| Foreign exchange contracts | $314 |
Other
The preparation of financial statements in conformity with GAAP requires management to make estimates and assumptions that affect the amounts of assets, liabilities, expenses and revenues reported in the financial statements. Actual results could differ from those estimated.
Annual Shareholder Report
3. SHARES OF BENEFICIAL INTEREST
The following tables summarize share activity:
| Year Ended October 31 | 2012 | 2011 |
| Class A Shares: | Shares | Amount | Shares | Amount |
| Shares sold | 281,157 | $9,865,826 | 646,037 | $23,652,967 |
Proceeds from shares issued in connection with the
tax-free transfer of assets from Performance Mid Cap Equity Fund | 422,458 | 15,271,919 | — | — |
Proceeds from shares issued in connection with the
tax-free transfer of assets from Performance Leaders Equity Fund | 57,354 | 2,073,326 | — | — |
| Shares redeemed | (1,477,708) | (51,782,799) | (2,179,316) | (77,919,363) |
NET CHANGE RESULTING FROM
CLASS A SHARE TRANSACTIONS | (716,739) | $(24,571,728) | (1,533,279) | $(54,266,396) |
| Year Ended October 31 | 2012 | 2011 |
| Class B Shares: | Shares | Amount | Shares | Amount |
| Shares sold | 18,148 | $547,527 | 31,347 | $975,030 |
| Shares redeemed | (90,796) | (2,776,351) | (112,223) | (3,492,415) |
NET CHANGE RESULTING FROM
CLASS B SHARE TRANSACTIONS | (72,648) | $(2,228,824) | (80,876) | $(2,517,385) |
| Year Ended October 31 | 2012 | 2011 |
| Class C Shares: | Shares | Amount | Shares | Amount |
| Shares sold | 33,230 | $1,000,455 | 61,306 | $1,901,432 |
| Shares redeemed | (67,465) | (2,067,863) | (88,541) | (2,748,593) |
NET CHANGE RESULTING FROM
CLASS C SHARE TRANSACTIONS | (34,235) | $(1,067,408) | (27,235) | $(847,161) |
| Year Ended October 31 | 2012 | 2011 |
| Class R Shares: | Shares | Amount | Shares | Amount |
| Shares sold | 27,689 | $966,486 | 40,069 | $1,321,761 |
| Shares redeemed | (8,636) | (299,128) | (14,854) | (523,695) |
NET CHANGE RESULTING FROM
CLASS R SHARE TRANSACTIONS | 19,053 | $667,358 | 25,215 | $798,066 |
Annual Shareholder Report
| Year Ended October 31 | 2012 | 2011 |
| Institutional Shares: | Shares | Amount | Shares | Amount |
| Shares sold | 117,352 | $4,081,624 | 102,429 | $3,684,092 |
Proceeds from shares issued in connection with the
tax-free transfer of assets from Performance Mid Cap Equity Fund | 936,932 | 34,095,030 | — | — |
Proceeds from shares issued in connection with the
tax-free transfer of assets from Performance Leaders Equity Fund | 677,120 | 24,640,348 | — | — |
| Shares redeemed | (159,800) | (5,701,916) | (480,264) | (17,662,866) |
NET CHANGE RESULTING FROM
INSTITUTIONAL SHARE TRANSACTIONS | 1,571,604 | $57,115,086 | (377,835) | $(13,978,774) |
NET CHANGE RESULTING FROM
TOTAL FUND SHARE TRANSACTIONS | 767,035 | $29,914,484 | (1,994,010) | $(70,811,650) |
4. FEDERAL TAX INFORMATION
The timing and character of income and capital gain distributions are determined in accordance with income tax regulations, which may differ from GAAP. These differences are due to differing treatments for foreign currency transactions, regulatory settlement proceeds and capital loss carryforwards resulting from fund mergers.
For the year ended October 31, 2012, permanent differences identified and reclassified among the components of net assets were as follows:
| Increase (Decrease) |
| Paid-In Capital | Undistributed
Net Investment
Income (Loss) | Accumulated
Net Realized
Gain (Loss) |
| $19,466,438 | $(38,320) | $(19,428,118) |
Net investment income (loss), net realized gains (losses) and net assets were not affected by this reclassification.
As of October 31, 2012, the components of distributable earnings on a tax basis were as follows:
| Net unrealized appreciation | $31,339,760 |
| Capital loss carryforwards and deferrals | $(29,280,489) |
The difference between book-basis and tax-basis net unrealized appreciation/depreciation is attributable to the deferral of losses on wash sales.
At October 31, 2012, the cost of investments for federal tax purposes was $315,921,353. The net unrealized appreciation of investments for federal tax purposes was $31,339,760. This consists of net unrealized appreciation from investments for those securities having an excess of value over cost of $42,167,610 and net unrealized depreciation from investments for those securities having an excess of cost over value of $10,827,850.
At October 31, 2012, the Fund had a capital loss carryforward of $28,289,011 which will reduce the Fund's taxable income arising from future net realized gains on investments, if any, to the extent permitted by the Code, thereby reducing the amount of distributions to shareholders which would otherwise be necessary to relieve the Fund of any liability for
Annual Shareholder Report
federal income tax. Pursuant to the Code, a net capital loss incurred in taxable years beginning on or before December 22, 2010 is characterized as short-term and may be carried forward for a maximum of eight tax years (“Carryforward Limit”), whereas a net capital loss incurred in taxable years beginning after December 22, 2010 retains its character as either short-term or long-term, does not expire and is required to be utilized prior to the losses which have a Carryforward Limit.
The following schedule summarizes the Fund's capital loss carryforwards and expiration years:
| Expiration Year | Short-Term | Long-Term | Total |
| 2016 | $9,287,463 | NA | $9,287,463 |
| 2017 | $19,001,548 | NA | $19,001,548 |
The Fund used capital loss carryforwards of $18,392,700 to offset taxable capital gains realized during the year ended October 31, 2012.
Under current tax law, late-year ordinary loss realized after December 31 through the end of the Fund's fiscal year (“Late Year Ordinary Loss”) may be deferred, in whole or in part, and treated as occurring on the first day of the following fiscal year. As of October 31, 2012, for federal income tax purposes, a Late Year Ordinary Loss of $991,478 was deferred to November 1, 2012.
As a result of the tax-free transfer of assets from Performance Mid Cap Equity Fund and Performance Leaders Equity Fund, certain capital loss carryforwards listed above may be limited.
5. INVESTMENT ADVISER FEE AND OTHER TRANSACTIONS WITH AFFILIATES
Investment Adviser Fee
The advisory agreement between the Fund and the Adviser provides for an annual fee equal to 0.75% of the Fund's average daily net assets. Subject to the terms described in the Expense Limitation note, the Adviser may voluntarily choose to waive any portion of its fee. For the year ended October 31, 2012, the Adviser voluntarily waived $199,709 of its fee. In addition, an affiliate of the Adviser reimbursed $224,086 of transfer and dividend disbursing agent fees and expenses. Pursuant to a settlement with the New York Attorney General, the Adviser has agreed to waive investment adviser fees in compliance with an Assurance of Discontinuance date November 17, 2005. The net adviser fee will be reduced to 0.4975% effective January 1, 2006, and could not be increased until after December 31, 2010, at which time the obligation expired.
Annual Shareholder Report
Administrative Fee
Federated Administrative Services (FAS), under the Administrative Services Agreement, provides the Fund with administrative personnel and services. The fee paid to FAS is based on the average aggregate daily net assets of certain Federated funds as specified below, plus certain out-of-pocket expenses:
| Administrative Fee | Average Aggregate Daily Net Assets
of the Federated Funds |
| 0.150% | on the first $5 billion |
| 0.125% | on the next $5 billion |
| 0.100% | on the next $10 billion |
| 0.075% | on assets in excess of $20 billion |
Prior to September 1, 2012, the administrative fee received during any fiscal year was at least $150,000 per portfolio and $40,000 per each additional class of Shares. Subject to the terms described in the Expense Limitation note, FAS may voluntarily choose to waive any portion of its fee. For the year ended October 31, 2012, FAS waived $51,827 of its fee. The net fee paid to FAS was 0.086% of average daily net assets of the Fund.
Distribution Services Fee
The Fund has adopted a Distribution Plan (the “Plan”) pursuant to Rule 12b-1 under the Act. Under the terms of the Plan, the Fund will compensate Federated Securities Corp. (FSC), the principal distributor, from the daily net assets of the Fund's Class B Shares, Class C Shares and Class R Shares to finance activities intended to result in the sale of these shares. The Plan provides that the Fund may incur distribution expenses at the following percentages of average daily net assets annually, to compensate FSC:
| Share Class Name | Percentage of Average Daily
Net Assets of Class |
| Class B Shares | 0.75% |
| Class C Shares | 0.75% |
| Class R Shares | 0.50% |
Subject to the terms described in the Expense Limitation note, FSC may voluntarily choose to waive any portion of its fee. For the year ended October 31, 2012, distribution services fees for the Fund were as follows:
| Distribution
Services
Fees Incurred |
| Class B Shares | $39,637 |
| Class C Shares | 78,260 |
| Class R Shares | 9,438 |
| TOTAL | $127,335 |
When FSC receives fees, it may pay some or all of them to financial intermediaries whose customers purchase shares. For the year ended October 31, 2012, FSC retained $14,780 of fees paid by the Fund.
Annual Shareholder Report
Sales Charges
Front-end sales charges and contingent deferred sales charges (CDSC) do not represent expenses of the Fund. They are deducted from the proceeds of sales of Fund shares prior to investment or from redemption proceeds prior to remittance, as applicable. For the year ended October 31, 2012, FSC retained $9,900 in sales charges from the sale of Class A Shares. FSC also retained $3,218 and $162 of CDSC relating to redemptions of Class B Shares and Class C Shares, respectively.
Shareholder Services Fee
The Fund may pay fees (“Service Fees”) up to 0.25% of the average daily net assets of the Fund's Class A Shares, Class B Shares and Class C Shares to financial intermediaries or to Federated Shareholder Services Company (FSSC) for providing services to shareholders and maintaining shareholder accounts. Financial intermediaries may include a company affiliated with management of Federated Investors, Inc. A financial intermediary affiliated with management of Federated Investors, Inc. received $3,722 of Service Fees for the year ended October 31, 2012. Subject to the terms described in the Expense Limitation note, FSSC may voluntarily reimburse the Fund for Service Fees. For the year ended October 31, 2012, Service Fees for the Fund were as follows:
| Service
Fees
Incurred |
| Class A Shares | $553,705 |
| Class B Shares | 13,212 |
| Class C Shares | 25,403 |
| TOTAL | $592,320 |
For the year ended October 31, 2012, FSSC did not receive any fees paid by the Fund.
Expense Limitation
The Adviser and its affiliates (which may include FSC, FAS and FSSC) have voluntarily agreed to waive their fees and/or reimburse expenses so that the total annual fund operating expenses (as shown in the financial highlights) paid by the Fund's Class A Shares, Class B Shares, Class C Shares, Class R Shares and Institutional Shares (after the voluntary waivers and/or reimbursements) will not exceed 1.22%, 1.97%, 1.97%, 1.72% and 0.97% (the “Fee Limit”), respectively, up to but not including the later of (the “Termination Date”): (a) March 1, 2013; or (b) the date of the Fund's next effective Prospectus. While the Adviser and its affiliates currently do not anticipate terminating or increasing these arrangements prior to the Termination Date, these arrangements may only be terminated or the Fee Limit increased prior to the Termination Date with the agreement of the Trustees.
General
Certain Officers and Trustees of the Fund are Officers and Directors or Trustees of the above companies.
Interfund Transactions
During the year ended October 31, 2012, the Fund engaged in purchase and sale transactions with funds that have a common investment adviser (or affiliated investment advisers), common Directors/Trustees, and/or common Officers. These purchase and sale transactions complied with Rule 17a-7 under the Act and amounted to $669,133 and $1,283,520, respectively.
Annual Shareholder Report
Transactions Involving Affiliated Holdings
Affiliated holdings are mutual funds which are managed by the Adviser or an affiliate of the Adviser. The Adviser has agreed to reimburse the Fund for certain investment adviser fees as a result of transactions in other affiliated mutual funds. For the year ended October 31, 2012, the Adviser reimbursed $15,737. Transactions involving the affiliated holding during the year ended October 31, 2012, were as follows:
| Federated
Prime Value
Obligations Fund,
Institutional Shares |
| Balance of Shares Held 10/31/2011 | 10,597,522 |
| Purchases/Additions | 217,151,122 |
| Sales/Reductions | 205,003,754 |
| Balance of Shares Held 10/31/2012 | 22,744,890 |
| Value | $22,744,890 |
| Dividend Income | $4,271 |
6. Investment TRANSACTIONS
Purchases and sales of investments, excluding long-term U.S. government securities and short-term obligations, for the year ended October 31, 2012, were as follows:
| Purchases | $387,135,441 |
| Sales | $429,188,881 |
7. REGULATORY SETTLEMENT PROCEEDS
During the year ended October 31, 2012, the Fund received $512,546 in settlement of administrative proceedings against other unaffiliated third parties involving findings by the Securities and Exchange Commission (SEC) of market timing and/or late trading of mutual funds. The settlement was recorded as an increase to paid-in capital.
8. LINE OF CREDIT
The Fund participates in a $100,000,000 unsecured, uncommitted revolving line of credit (LOC) agreement with PNC Bank. The LOC was made available for extraordinary or emergency purposes, primarily for financing redemption payments. Borrowings are charged interest at a rate offered to the Fund by PNC Bank at the time of the borrowing. As of October 31, 2012, there were no outstanding loans. During the year ended October 31, 2012, the Fund did not utilize the LOC.
9. INTERFUND LENDING
Pursuant to an Exemptive Order issued by the SEC, the Fund, along with other funds advised by subsidiaries of Federated Investors, Inc., may participate in an interfund lending program. This program provides an alternative credit facility allowing the Fund to borrow from other participating affiliated funds. As of October 31, 2012, there were no outstanding loans. During the year ended October 31, 2012, the program was not utilized.
Annual Shareholder Report
10. SUBSEQUENT EVENTS
On December 14, 2012, a supplement to the Fund's prospectus and statement of additional information was filed to indicate the Fund will change its name to Federated MDT Mid Cap Growth Strategies Fund effective January 18, 2013. Further, effective January 18, 2013, the investment advisory contract will be transferred from the Adviser to Federated MDTA LLC.
Management has evaluated subsequent events through the date the financial statements were issued, and determined that no additional events have occurred that require disclosure.
Annual Shareholder Report
Report of Independent Registered Public Accounting Firm
TO THE BOARD OF TRUSTEES OF THE FEDERATED EQUITY FUNDS AND SHAREHOLDERS OF Federated MID CAP GROWTH STRATEGIES FUND:
We have audited the accompanying statement of assets and liabilities, including the portfolio of investments, of the Federated Mid Cap Growth Strategies Fund (the “Fund”), a portfolio of Federated Equity Funds, as of October 31, 2012, and the related statement of operations for the year then ended, the statements of changes in net assets for each of the years in the two-year period then ended, and the financial highlights for each of the years in the five-year period then ended. These financial statements and financial highlights are the responsibility of the Fund's management. Our responsibility is to express an opinion on these financial statements and financial highlights based on our audits.
We conducted our audits in accordance with the standards of the Public Company Accounting Oversight Board (United States). Those standards require that we plan and perform the audit to obtain reasonable assurance about whether the financial statements and financial highlights are free of material misstatement. An audit includes examining, on a test basis, evidence supporting the amounts and disclosures in the financial statements. Our procedures included confirmation of securities owned as of October 31, 2012 by correspondence with the custodian and transfer agent. An audit also includes assessing the accounting principles used and significant estimates made by management, as well as evaluating the overall financial statement presentation. We believe that our audits provide a reasonable basis for our opinion.
In our opinion, the financial statements and financial highlights referred to above present fairly, in all material respects, the financial position of Federated Mid Cap Growth Strategies Fund as of October 31, 2012 and the results of its operations for the year then ended, the changes in its net assets for each of the years in the two-year period then ended, and the financial highlights for each of the years in the five-year period then ended, in conformity with U.S. generally accepted accounting principles.
Boston, Massachusetts
December 24, 2012
Annual Shareholder Report
Shareholder Expense Example (unaudited)
As a shareholder of the Fund, you incur two types of costs: (1) transaction costs, including sales charges (“loads”) on purchase or redemption payments; and (2) ongoing costs, including management fees and to the extent applicable, distribution (12b-1) fees and/or shareholder services fees and other Fund expenses. This Example is intended to help you to understand your ongoing costs (in dollars) of investing in the Fund and to compare these costs with the ongoing costs of investing in other mutual funds. It is based on an investment of $1,000 invested at the beginning of the period and held for the entire period from May 1, 2012 to October 31, 2012.
ACTUAL EXPENSES
The first section of the table below provides information about actual account values and actual expenses. You may use the information in this section, together with the amount you invested, to estimate the expenses that you incurred over the period. Simply divide your account value by $1,000 (for example, an $8,600 account value divided by $1,000 = 8.6), then multiply the result by the number in the first section under the heading entitled “Expenses Paid During Period” to estimate the expenses attributable to your investment during this period.
HYPOTHETICAL EXAMPLE FOR COMPARISON PURPOSES
The second section of the table below provides information about hypothetical account values and hypothetical expenses based on the Fund's actual expense ratio and an assumed rate of return of 5% per year before expenses, which is not the Fund's actual return. Thus, you should not use the hypothetical account values and expenses to estimate the actual ending account balance or your expenses for the period. Rather, these figures are required to be provided to enable you to compare the ongoing costs of investing in the Fund with other funds. To do so, compare this 5% hypothetical example with the 5% hypothetical examples that appear in the shareholder reports of the other funds.
Annual Shareholder Report
Please note that the expenses shown in the table are meant to highlight your ongoing costs only and do not reflect any transaction costs, such as sales charges (“loads”) on purchase or redemption payments. Therefore, the second section of the table is useful in comparing ongoing costs only, and will not help you determine the relative total costs of owning different funds. In addition, if these transaction costs were included, your costs would have been higher.
| Beginning
Account Value
5/1/2012 | Ending
Account Value
10/31/2012 | Expenses Paid
During Period1 |
| Actual: | | | |
| Class A Shares | $1,000 | $952.60 | $6.00 |
| Class B Shares | $1,000 | $948.90 | $9.68 |
| Class C Shares | $1,000 | $949.10 | $9.68 |
| Class R Shares | $1,000 | $950.30 | $8.46 |
| Institutional Shares | $1,000 | $953.70 | $4.78 |
Hypothetical (assuming a 5% return
before expenses): | | | |
| Class A Shares | $1,000 | $1,019.06 | $6.21 |
| Class B Shares | $1,000 | $1,015.27 | $10.01 |
| Class C Shares | $1,000 | $1,015.27 | $10.01 |
| Class R Shares | $1,000 | $1,016.53 | $8.74 |
| Institutional Shares | $1,000 | $1,020.32 | $4.94 |
| 1 | Expenses are equal to the Fund's annualized net expense ratios, multiplied by the average account value over the period, multiplied by 184/365 (to reflect the one-half-year period). The annualized net expense ratios are as follows: |
| Class A Shares | 1.22% |
| Class B Shares | 1.97% |
| Class C Shares | 1.97% |
| Class R Shares | 1.72% |
| Institutional Shares | 0.97% |
Annual Shareholder Report
Board of Trustees and Trust Officers
The Board of Trustees is responsible for managing the Trust's business affairs and for exercising all the Trust's powers except those reserved for the shareholders. The following tables give information about each Trustee and the senior officers of the Fund. Where required, the tables separately list Trustees who are “interested persons” of the Fund (i.e., “Interested” Trustees) and those who are not (i.e., “Independent” Trustees). Unless otherwise noted, the address of each person listed is Federated Investors Tower, 1001 Liberty Avenue, Pittsburgh, PA 15222. The address of all Independent Trustees listed is 4000 Ericsson Drive, Warrendale, PA 15086-7561; Attention: Mutual Fund Board. As of December 31, 2011, the Trust comprised 13 portfolio(s), and the Federated Fund Family consisted of 43 investment companies (comprising 134 portfolios). Unless otherwise noted, each Officer is elected annually. Unless otherwise noted, each Trustee oversees all portfolios in the Federated Fund Family and serves for an indefinite term. The Fund's Statement of Additional Information includes additional information about Trust Trustees and is available, without charge and upon request, by calling 1-800-341-7400.
Interested TRUSTEES Background
Name
Birth Date
Positions Held with Trust
Date Service Began | Principal Occupation(s) for Past Five Years,
Other Directorships Held and Previous Position(s) |
John F. Donahue*
Birth Date: July 28, 1924
Trustee
Began serving: April 1984 | Principal Occupations: Director or Trustee of the Federated Fund Family; Chairman and Director, Federated Investors, Inc.; Chairman of the Federated Fund Family's Executive Committee.
Previous Positions: Chairman of the Federated Fund Family; Trustee, Federated Investment Management Company; Chairman and Director, Federated Investment Counseling. |
J. Christopher Donahue*
Birth Date: April 11, 1949
President and Trustee
Began serving: January 2000 | Principal Occupations: Principal Executive Officer and President of the Federated Fund Family; Director or Trustee of some of the Funds in the Federated Fund Family; President, Chief Executive Officer and Director, Federated Investors, Inc.; Chairman and Trustee, Federated Investment Management Company; Trustee, Federated Investment Counseling; Chairman and Director, Federated Global Investment Management Corp.; Chairman, Federated Equity Management Company of Pennsylvania and Passport Research, Ltd. (investment advisory subsidiary of Federated); Trustee, Federated Shareholder Services Company; Director, Federated Services Company.
Previous Positions: President, Federated Investment Counseling; President and Chief Executive Officer, Federated Investment Management Company, Federated Global Investment Management Corp. and Passport Research, Ltd. |
| * | Family relationships and reasons for “interested” status: John F. Donahue is the father of J. Christopher Donahue; both are “interested” due to their beneficial ownership of shares of Federated Investors, Inc. and the positions they hold with Federated and its subsidiaries. |
Annual Shareholder Report
INDEPENDENT TRUSTEES Background
Name
Birth Date
Positions Held with Trust
Date Service Began | Principal Occupation(s) for Past Five Years,
Other Directorships Held, Previous Position(s) and Qualifications |
Nicholas P. Constantakis, CPA
Birth Date: September 3, 1939
Trustee
Began serving: February 1998 | Principal Occupation: Director or Trustee of the Federated Fund Family.
Other Directorship Held: Director, Chairman of the Audit Committee, and member of the Compensation Committee, Michael Baker Corporation (architecture, engineering and construction services).
Previous Position: Partner, Andersen Worldwide SC.
Qualifications: Public accounting and director experience. |
John F. Cunningham
Birth Date: March 5, 1943
Trustee
Began serving: January 1999 | Principal Occupation: Director or Trustee of the Federated Fund Family.
Other Directorships Held: Chairman, President and Chief Executive Officer, Cunningham & Co., Inc. (strategic business consulting); Trustee Associate, Boston College.
Previous Positions: Director, Redgate Communications and EMC Corporation (computer storage systems); Chairman of the Board and Chief Executive Officer, Computer Consoles, Inc.; President and Chief Operating Officer, Wang Laboratories; Director, First National Bank of Boston; Director, Apollo Computer, Inc.
Qualifications: Business management and director experience. |
Maureen Lally-Green
Birth Date: July 5, 1949
Trustee
Began serving: August 2009 | Principal Occupations: Director or Trustee of the Federated Fund Family; Director, Office of Church Relations, Diocese of Pittsburgh; Adjunct Professor of Law, Duquesne University School of Law.
Other Directorships Held: Director, Auberle; Member, Pennsylvania State Board of Education; Director, Saint Vincent College; Director, Ireland Institute of Pittsburgh; Chair and Director, UPMC Mercy Hospital; Regent, St. Vincent Seminary; Director, Epilepsy Foundation of Western and Central Pennsylvania; Director, Saint Thomas More Society, Allegheny County; Director, Our Campaign for the Church Alive, Inc.
Previous Position: Pennsylvania Superior Court Judge.
Qualifications: Legal and director experience. |
Peter E. Madden
Birth Date: March 16, 1942
Trustee
Began serving: November 1991 | Principal Occupation: Director or Trustee, and Chairman of the Board of Directors or Trustees, of the Federated Fund Family.
Previous Positions: Representative, Commonwealth of Massachusetts General Court; President, Chief Operating Officer and Director, State Street Bank and Trust Company and State Street Corporation (retired); Director, VISA USA and VISA International; Chairman and Director, Massachusetts Bankers Association; Director, Depository Trust Corporation; Director, The Boston Stock Exchange.
Qualifications: Business management, mutual fund services and director experience. |
Annual Shareholder Report
Name
Birth Date
Positions Held with Trust
Date Service Began | Principal Occupation(s) for Past Five Years,
Other Directorships Held, Previous Position(s) and Qualifications |
Charles F. Mansfield, Jr.
Birth Date: April 10, 1945
Trustee
Began serving: January 1999 | Principal Occupations: Director or Trustee of the Federated Fund Family; Management Consultant.
Previous Positions: Chief Executive Officer, PBTC International Bank; Partner, Arthur Young & Company (now Ernst & Young LLP); Chief Financial Officer of Retail Banking Sector, Chase Manhattan Bank; Senior Vice President, HSBC Bank USA (formerly Marine Midland Bank); Vice President, Citibank; Assistant Professor of Banking and Finance, Frank G. Zarb School of Business, Hofstra University; Executive Vice President, DVC Group, Inc. (marketing, communications and technology).
Qualifications: Banking, business management, education and director experience. |
Thomas M. O'Neill
Birth Date: June 14, 1951
Trustee
Began serving: October 2006 | Principal Occupations: Director or Trustee, Vice Chairman of the Audit Committee of the Federated Fund Family; Sole Proprietor, Navigator Management Company (investment and strategic consulting).
Other Directorships Held: Board of Overseers, Children's Hospital of Boston; Visiting Committee on Athletics, Harvard College; Board of Directors, Medicines for Humanity; Board of Directors, The Golisano Children's Museum of Naples, Florida.
Previous Positions: Chief Executive Officer and President, Managing Director and Chief Investment Officer, Fleet Investment Advisors; President and Chief Executive Officer, Aeltus Investment Management, Inc.; General Partner, Hellman, Jordan Management Co., Boston, MA; Chief Investment Officer, The Putnam Companies, Boston, MA; Credit Analyst and Lending Officer, Fleet Bank; Director and Consultant, EZE Castle Software (investment order management software); Director, Midway Pacific (lumber).
Qualifications: Business management, mutual fund, director and investment experience. |
John S. Walsh
Birth Date: November 28, 1957
Trustee
Began serving: January 1999 | Principal Occupations: Director or Trustee, Chairman of the Audit Committee of the Federated Fund Family; President and Director, Heat Wagon, Inc. (manufacturer of construction temporary heaters); President and Director, Manufacturers Products, Inc. (distributor of portable construction heaters); President, Portable Heater Parts, a division of Manufacturers Products, Inc.
Previous Position: Vice President, Walsh & Kelly, Inc.
Qualifications: Business management and director experience. |
Annual Shareholder Report
OFFICERS
Name
Birth Date
Address
Positions Held with Trust
Date Service Began | Principal Occupation(s) for Past Five Years
and Previous Position(s) |
John W. McGonigle
Birth Date: October 26, 1938
EXECUTIVE VICE PRESIDENT AND SECRETARY
Officer since: April 1984 | Principal Occupations: Executive Vice President and Secretary of the Federated Fund Family; Vice Chairman, Executive Vice President, Secretary and Director, Federated Investors, Inc.
Previous Positions: Trustee, Federated Investment Management Company and Federated Investment Counseling; Director, Federated Global Investment Management Corp., Federated Services Company and Federated Securities Corp. |
Richard A. Novak
Birth Date: December 25, 1963
Treasurer
Officer since: January 2006 | Principal Occupations: Principal Financial Officer and Treasurer of the Federated Fund Family; Senior Vice President, Federated Administrative Services; Financial and Operations Principal for Federated Securities Corp., Edgewood Services, Inc. and Southpointe Distribution Services, Inc.
Previous Positions: Controller of Federated Investors, Inc.; Vice President, Finance of Federated Services Company; held various financial management positions within The Mercy Hospital of Pittsburgh; Auditor, Arthur Andersen & Co. |
Richard B. Fisher
Birth Date: May 17, 1923
Vice President
Officer since: April 1984 | Principal Occupations: Vice Chairman or Vice President of some of the Funds in the Federated Fund Family; Vice Chairman, Federated Investors, Inc.; Chairman, Federated Securities Corp.
Previous Positions: President and Director or Trustee of some of the Funds in the Federated Fund Family; Executive Vice President, Federated Investors, Inc.; Director and Chief Executive Officer, Federated Securities Corp. |
Peter J. Germain
Birth Date: September 3, 1959
CHIEF LEGAL OFFICER
Officer since: January 2005 | Principal Occupations: Mr. Germain is Chief Legal Officer of the Federated Fund Family. He is General Counsel and Vice President, Federated Investors, Inc.; President, Federated Administrative Services and Federated Administrative Services, Inc.; Vice President, Federated Securities Corp.; Secretary, Federated Private Asset Management, Inc.; and Secretary, Retirement Plan Service Company of America. Mr. Germain joined Federated in 1984 and is a member of the Pennsylvania Bar Association.
Previous Positions: Deputy General Counsel, Special Counsel, Managing Director of Mutual Fund Services, Federated Investors, Inc.; Senior Vice President, Federated Services Company; and Senior Corporate Counsel, Federated Investors, Inc. |
Brian P. Bouda
Birth Date: February 28, 1947
CHIEF COMPLIANCE OFFICER AND SENIOR VICE PRESIDENT
Officer since: August 2004 | Principal Occupations: Senior Vice President and Chief Compliance Officer of the Federated Fund Family; Vice President and Chief Compliance Officer of Federated Investors, Inc. and Chief Compliance Officer of its subsidiaries. Mr. Bouda joined Federated in 1999 and is a member of the American Bar Association and the State Bar Association of Wisconsin. |
Annual Shareholder Report
Name
Birth Date
Address
Positions Held with Trust
Date Service Began | Principal Occupation(s) for Past Five Years
and Previous Position(s) |
Stephen F. Auth
Birth Date: September 3, 1956
450 Lexington Avenue
Suite 3700
New York, NY 10017-3943
CHIEF INVESTMENT OFFICER
Officer since: November 2002 | Principal Occupations: Mr. Auth is Chief Investment Officer of this Fund and various other Funds in the Federated Fund Family; Executive Vice President, Federated Investment Counseling, Federated Global Investment Management Corp. and Federated Equity Management Company of Pennsylvania.
Previous Positions: Executive Vice President, Federated Investment Management Company, and Passport Research, Ltd. (investment advisory subsidiary of Federated); Senior Vice President, Global Portfolio Management Services Division; Senior Vice President, Federated Investment Management Company and Passport Research, Ltd.; Senior Managing Director and Portfolio Manager, Prudential Investments. |
James E. Grefenstette
Birth Date: November 7, 1962
Vice President
Officer since: February 2011
Portfolio Manager since: December 2009. | Principal Occupations: James E. Grefenstette has been the Fund's Senior Portfolio Manager since December 2009. He is Vice President of the Trust with respect to the Fund. He is Vice President of the Fund's Adviser. Mr. Grefenstette joined Federated in December 2009. Previously, he served as founder and managing partner of Blazer Investment Advisers from April 2008 until December 2009, and as founder and managing partner of Aspirante Capital Management, a long/short hedge fund, from August 2006 until September 2007. Prior to that, Mr. Grefenstette worked at Federated as Portfolio Manager of the Fund from 1994 until June 2006 and as Senior Vice President of the Fund's Adviser from January 2000 until July 2006. He also served as Vice President and Assistant Vice President of the Fund's Adviser from 1994 until 1999. Mr. Grefenstette has received the Chartered Financial Analyst designation; he received his M.S. in Industrial Administration from Carnegie Mellon University and his BSBA from Georgetown University. |
Annual Shareholder Report
Evaluation and Approval of Advisory Contract–May 2012
Federated Mid Cap Growth Strategies Fund (the “Fund”)
Following a review and recommendation of approval by the Fund's independent trustees, the Fund's Board reviewed and approved at its May 2012 meetings the Fund's investment advisory contract for an additional one-year term. The Board's decision regarding the contract reflects the exercise of its business judgment on whether to continue the existing arrangements.
In this connection, the Federated Funds' Board had previously appointed a Senior Officer, whose duties include specified responsibilities relating to the process by which advisory fees are to be charged to a Federated fund. The Senior Officer has the authority to retain consultants, experts, or staff as may be reasonably necessary to assist in the performance of his duties, reports directly to the Board, and may be terminated only with the approval of a majority of the independent members of the Board. The Senior Officer prepared and furnished to the Board an independent, written evaluation that covered topics discussed below (the “Evaluation”). The Board considered that Evaluation, along with other information, in deciding to approve the advisory contract.
The Board is also familiar with and considered judicial decisions concerning allegedly excessive investment advisory fees, which have indicated that the following factors may be relevant to an Adviser's fiduciary duty with respect to its receipt of compensation from a fund: the nature and quality of the services provided by the Adviser to a fund and its shareholders, including the performance and expenses of the fund and of comparable funds; the Adviser's cost of providing the services, including the profitability to the Adviser of providing advisory services to a fund; the extent to which the Adviser may realize “economies of scale” as a fund grows larger and, if such economies exist, whether they have been shared with a fund and its shareholders; any “fall-out financial benefits” that accrue to the Adviser because of its relationship with a fund (including research services received from brokers that execute fund trades and any fees paid to affiliates of the Adviser for services rendered to a fund); comparative fee structures, including a comparison of fees paid to the Adviser with those paid by similar funds; and the extent to which the Board members are fully informed about all facts the Board deems relevant to its consideration of the Adviser's services and fees. Consistent with these judicial decisions, the Board also considered management fees (including any components thereof) charged to institutional and other clients of the Adviser for what might be viewed as like services. The Board was aware of these factors and was guided by them in its review of the Fund's advisory contract to the extent it considered them to be appropriate and relevant, as discussed further below.
Annual Shareholder Report
The Board considered and weighed these circumstances in light of its substantial accumulated experience in governing the Fund and working with Federated on matters relating to the Federated funds, and was assisted in its deliberations by independent legal counsel. Throughout the year, and in connection with its May meetings, the Board requested and received substantial and detailed information about the Fund and the Federated organization that was in addition to the extensive materials that comprise and accompany the Senior Officer's Evaluation. Federated provided much of this information at each regular meeting of the Board, and furnished additional substantial information in connection with the May meeting at which the Board's formal review of the advisory contract occurred. At this May meeting, senior management of the Adviser also met with the independent trustees and their counsel to discuss the materials presented and any other matters thought relevant by the Adviser or the trustees. Between regularly scheduled meetings, the Board also received information on particular matters as the need arose. Thus, the Board's consideration of the advisory contract included review of the Senior Officer's Evaluation, accompanying data and additional information covering such matters as: the Adviser's investment philosophy, revenue, profitability, personnel and processes; investment and operating strategies; the Fund's short- and long-term performance (in absolute terms, both on a gross basis and net of expenses, as well as in relationship to its particular investment program and certain competitor or “peer group” funds and/or other benchmarks, as appropriate), and comments on the reasons for performance; the Fund's investment objectives; the Fund's expenses (including the advisory fee itself and the overall expense structure of the Fund, both in absolute terms and relative to similar and/or competing funds, with due regard for contractual or voluntary expense limitations); the use and allocation of brokerage commissions derived from trading the Fund's portfolio securities (if any); and the nature, quality and extent of the advisory and other services provided to the Fund by the Adviser and its affiliates. The Board also considered the preferences and expectations of Fund shareholders; the entrepreneurial risk assumed by the Adviser in sponsoring the funds; the continuing state of competition in the mutual fund industry and market practices; the range of comparable fees for similar funds in the mutual fund industry; the Fund's relationship to the Federated family of funds which include a comprehensive array of funds with different investment objectives, policies and strategies which are available for exchange without the incurrence of additional sales charges; compliance and audit reports concerning the Federated funds and the Federated companies that service them (including communications from regulatory agencies), as well as Federated's responses to any issues raised therein; and relevant developments in the mutual fund industry and how the Federated funds and/or Federated are responding to them. The Board's evaluation process is evolutionary. The criteria considered and the emphasis placed on relevant criteria change in recognition of changing circumstances in the mutual fund marketplace.
Annual Shareholder Report
While mindful that courts have cautioned against giving such comparisons too much weight, the Board has found the use of comparisons of the Fund's fees and expenses to other mutual funds with comparable investment programs to be relevant, given the high degree of competition in the mutual fund business. The Board focused on comparisons with other similar mutual funds more heavily than non-mutual fund products or services because it is believed that they are more relevant. For example, other mutual funds are the products most like the Fund, they are readily available to Fund shareholders as alternative investment vehicles, and they are the type of investment vehicle in fact chosen and maintained by the Fund's investors. The range of their fees and expenses therefore appears to be a generally reliable indication of what consumers have found to be reasonable in the precise marketplace in which the Fund competes. In this regard, the Senior Officer has reviewed Federated's fees for providing advisory services to products outside the Federated family of funds (e.g., institutional and separate accounts). He concluded that mutual funds and institutional accounts are inherently different products. Those differences include, but are not limited to, different types of targeted investors; being subject to different laws and regulations; different legal structures; different average account sizes; different associated costs; different portfolio management techniques made necessary by different cash flows; and portfolio manager time spent in review of securities pricing. The Senior Officer did not consider these fee schedules to be determinative in judging the appropriateness of mutual fund advisory contracts.
The Fund's ability to deliver competitive performance when compared to its peer group was also deemed to be relevant by the Board as a useful indicator of how the Adviser is executing the Fund's investment program, which in turn assisted the Board in reaching a conclusion that the nature, extent, and quality of the Adviser's investment management services were such as to warrant continuation of the advisory contract.
The Senior Officer reviewed information compiled by Federated, using data supplied by independent fund ranking organizations, regarding the performance of, and fees charged by, other mutual funds, noting his view that comparisons to fund peer groups are relevant in judging the reasonableness of proposed fees.
For the periods covered by the Evaluation, the Fund's performance for the one-year period was above the median of the relevant peer group, and the Fund's performance fell below the median of the relevant peer group for the three-year and five-year period. The Board discussed the Fund's performance with the Adviser and recognized the efforts being undertaken by the Adviser. The Board will continue to monitor these efforts and the perfromance of the Fund.
The Board also received financial information about Federated, including information regarding the compensation and benefits Federated derived from its relationships with the Federated funds. This information covered not only the fees under the advisory contracts, but also fees received by Federated's
Annual Shareholder Report
subsidiaries for providing other services to the Federated funds under separate contracts (e.g., for serving as the Federated funds' administrator). The information also detailed any indirect benefit Federated may derive from its receipt of research services from brokers who execute Federated fund trades. In addition, the Board considered the fact that, in order for a fund to be competitive in the marketplace, Federated and its affiliates frequently waived fees and/or reimbursed expenses and have disclosed to fund investors and/or indicated to the Board their intention to do so in the future, where appropriate. Moreover, the Board receives regular reporting as to the institution or elimination of these voluntary waivers.
Federated furnished information, requested by the Senior Officer, that reported revenues on a fund-by-fund basis and made estimates of the allocation of expenses on a fund-by-fund basis, using allocation methodologies specified by the Senior Officer. The Senior Officer noted that, although they may apply consistent allocation processes, the inherent difficulties in allocating costs (and the unavoidable arbitrary aspects of that exercise) and the lack of consensus on how to allocate those costs may render such allocation information unreliable. The allocation information was considered in the analysis by the Board but was determined to be of limited use.
The Board and the Senior Officer also reviewed information compiled by Federated comparing profitability information for Federated to other publicly held fund management companies. In this regard, the Senior Officer noted the limited availability of such information, but nonetheless concluded that Federated's profit margins did not appear to be excessive.
The Senior Officer's Evaluation also discussed the notion of possible realization of “economies of scale” as a fund grows larger. The Board considered in this regard that the Adviser has made significant and long-term investments in areas that support all of the Federated funds, such as personnel and processes for the portfolio management, shareholder services, compliance, internal audit, and risk management functions; and systems technology; and that the benefits of these efforts (as well as any economies, should they exist) were likely to be enjoyed by the fund complex as a whole. Finally, the Board also noted the absence of any applicable regulatory or industry guidelines on this subject, which (as discussed in the Senior Officer's Evaluation) is compounded by the lack of any common industry practice or general pattern with respect to structuring fund advisory fees with “breakpoints” that serve to reduce the fee as the fund attains a certain size. The Senior Officer did not recommend institution of breakpoints in pricing Federated's fund advisory services at this time.
Annual Shareholder Report
It was noted in the materials for the Board meeting that for the period covered by the Evaluation, the Fund's investment advisory fee, after waivers and expense reimbursements, if any, was below the median of the relevant peer group. The Board reviewed the fees and other expenses of the Fund with the Adviser and was satisfied that the overall expense structure of the Fund remained competitive.
The Senior Officer noted that, considering the totality of the circumstances, and all of the factors referenced within his Evaluation, he had concluded that, subject to comments and recommendations made within his Evaluation, his observations and the information accompanying the Evaluation supported a finding by the Board that the management fees for each of the funds was reasonable and that Federated appeared to provide appropriate advisory and administrative services to the Fund for the fees paid. Under these circumstances, no changes were recommended to, and no objection was raised to, the continuation of the Fund's advisory contract.
In its decision to continue an existing investment advisory contract, the Board was mindful of the potential disruptions of the Fund's operations and various risks, uncertainties and other effects that could occur as a result of a decision to terminate or not renew an advisory contract. In particular, the Board recognized that many shareholders have invested in the Fund on the strength of the Adviser's industry standing and reputation and with the expectation that the Adviser will have a continuing role in providing advisory services to the Fund. Thus, the Board's approval of the advisory contract reflected the fact that it is the shareholders who have effectively selected the Adviser by virtue of having invested in the Fund. The Board concluded that, in light of the factors discussed above, including the nature, quality and scope of the services provided to the Fund by the Adviser and its affiliates, continuation of the advisory contract was appropriate.
The Board based its decision to approve the advisory contract on the totality of the circumstances and relevant factors and with a view to past and future long-term considerations. Not all of the factors and considerations identified above were necessarily relevant to the Fund, nor did the Board consider any one of them to be determinative. With respect to the factors that were relevant, the Board's decision to approve the contract reflects its determination that Federated's performance and actions provided a satisfactory basis to support the decision to continue the existing arrangements.
Annual Shareholder Report
Voting Proxies on Fund Portfolio Securities
A description of the policies and procedures that the Fund uses to determine how to vote proxies, if any, relating to securities held in the Fund's portfolio is available, without charge and upon request, by calling 1-800-341-7400. A report on “Form N-PX” of how the Fund voted any such proxies during the most recent 12-month period ended June 30 is available from Federated's website at FederatedInvestors.com. To access this information from the home page, select “All” under “Asset Classes.” Select a fund name and share class, if applicable, to go to the Fund Overview page. On the Fund Overview page, select the “Documents” tab. At the bottom of that page, select “Proxy Voting Record Report (Form N-PX).” Form N-PX filings are also available at the SEC's website at www.sec.gov.
Quarterly Portfolio Schedule
The Fund files with the SEC a complete schedule of its portfolio holdings, as of the close of the first and third quarters of its fiscal year, on “Form N-Q.” These filings are available on the SEC's website at www.sec.gov and may be reviewed and copied at the SEC's Public Reference Room in Washington, DC. (Call 1-800-SEC-0330 for information on the operation of the Public Reference Room.) You may also access this information from the “Products” section of Federated's website at FederatedInvestors.com. From the home page, select “All” under “Asset Classes.” Select a fund name and share class, if applicable, to go to the Fund Overview page. On the Fund Overview page, select the “Documents” tab. At the bottom of that page, select “Form N-Q.”
Annual Shareholder Report
Mutual funds are not bank deposits or obligations, are not guaranteed by any bank and are not insured or guaranteed by the U.S. government, the Federal Deposit Insurance Corporation, the Federal Reserve Board or any other government agency. Investment in mutual funds involves investment risk, including the possible loss of principal.
This Report is authorized for distribution to prospective investors only when preceded or accompanied by the Fund's Prospectus, which contains facts concerning its objective and policies, management fees, expenses and other information.
Federated Mid Cap Growth Strategies Fund
Federated Investors Funds
4000 Ericsson Drive
Warrendale, PA 15086-7561
Contact us at FederatedInvestors.com
or call 1-800-341-7400.
Federated Securities Corp., Distributor
CUSIP 314172107
CUSIP 314172206
CUSIP 314172305
CUSIP 314172529
CUSIP 314172198
G01228-08 (12/12)
Federated is a registered trademark of Federated Investors, Inc.
2012 ©Federated Investors, Inc.
Annual Shareholder Report
October 31, 2012
| Share Class | Ticker |
| A | FMAAX |
| B | FMBBX |
| C | FMRCX |
| Institutional | FMIIX |
Federated Prudent Absolute Return Fund
(formerly, Federated Market Opportunity Fund and
effective December 31, 2012, Federated Absolute Return Fund)
Fund Established 2000
A Portfolio of Federated Equity Funds
Dear Valued Shareholder,
I am pleased to present the Annual Shareholder Report for your fund covering the period from November 1, 2011 through October 31, 2012. This report includes Management's Discussion of Fund Performance, a complete listing of your fund's holdings, performance information and financial statements along with other important fund information.
In addition, our website, FederatedInvestors.com, offers easy access to Federated resources that include timely fund updates, economic and market insights from our investment strategists, and financial planning tools. We invite you to register to take full advantage of its capabilities.
Thank you for investing with Federated. I hope you find this information useful and look forward to keeping you informed.
Sincerely,
J. Christopher Donahue, President
Not FDIC Insured • May Lose Value • No Bank Guarantee
Management's Discussion of Fund Performance (unaudited)
The Fund's total return, based on net asset value, for the 12-month reporting period ended October 31, 2012, was -3.41% for Class A Shares, -4.18% for Class B Shares, -4.09% for Class C Shares and -3.11% for Institutional Shares. The total return of the BofA Merrill Lynch 91-Day Treasury Bill Index (BAML91T)1 was 0.08%. The total return of the Russell 3000 Value Index (R3000V)2 was 16.70%. The Fund's total return reflected actual cash flows, transaction costs and other expenses which were not reflected in the total return of the BAML91T and R3000V.
The following discussion will focus on the performance of the Fund's Institutional Shares.
MARKET OVERVIEW
It was a positive 12-month reporting period ended October 31, 2012 for the stock market. For example, the R3000V ended the reporting period with a total return of 16.70%. Commodities, as generally represented by the Thomson Reuters/Jefferies CRB Commodity Index3 returned -7.50% during the reporting period.
The overall global risk market backdrop was unsettled throughout much of the fiscal year. Markets were on edge early in the reporting period, as the European debt crisis expanded to core countries Spain and Italy. Aggressive policy responses, however, bought some time. By late July, however, the global risk market situation was spiraling out of control. Global fundamentals were also deteriorating, as evidence mounted of slowing growth and waning corporate profits. Yet risk markets rallied strongly late in the reporting period, as “do whatever it takes” and “QE infinity” captivated a speculative marketplace.
FUND PERFORMANCE
The Fund returned less than the BAML91T and R3000V and produced a negative return for the fiscal year. The Fund's return was driven, in order of decreasing importance, by losses in: a) equities; b) trade finance notes; and c) commodities.
Within equities, the Fund's gains in stocks were more than offset by losses from shorting equity index futures4 and from losses on equity put options.5 The equity sectors for which the Fund's holdings produced the largest gains were Health Care, Telecom Services and Consumer Staples. Energy was the only equity sector for which Fund holdings produced losses. The equity index futures and equity put option derivative types both produced losses for the Fund, as equities generally posted strong returns during the reporting period. Both derivative types were used throughout the reporting period to reduce the Fund's equity market exposure, and, during the period from early May to early August 2012, to position the Fund moderately net short equities. The Fund managers took this stance as evidence mounted supporting their bearish
Annual Shareholder Report
fundamental thesis. It was their view at the time that the risk versus reward backdrop was unfavorable for both equities and commodities. However, the extraordinary policy responses overwhelmed the deteriorating fundamental backdrop late in the reporting period. During the reporting period, the Fund also invested in currency forward contracts5 for hedging currency risks of international stock holdings.6
Trade finance notes had a negative impact on the Fund's return. Losses on two individual holdings more than offset the gains of the rest of the trade finance holdings in the period. The Fund significantly reduced exposure to trade finance notes during the fiscal year.
Regarding commodities, the Fund's investments in agricultural commodities (through an Exchange-Traded Fund) and gold bullion7 both produced losses in the reporting period. Losses were driven by the commodity markets generally negative returns and high volatility, both of which tended to cause the Fund to reduce exposure/risk during market weakness. The ongoing “risk on, risk off” speculative trading dynamic created atypical market uncertainty throughout the reporting period.
Please note that as of December 31, 2012, the Fund will change its name from Federated Prudent Absolute Return Fund to Federated Absolute Return Fund. Dana Meissner will now be the portfolio manager of the Fund.
| 1 | The BofA Merrill Lynch 91-Day Treasury Bill Index measures the return on U.S. Treasury Bills maturing in 90 days. The index is unmanaged, and it is not possible to invest directly in an index. |
| 2 | The Russell 3000 Value Index measures the performance of those Russell 3000 Index companies with lower price-to-book ratios and lower forecasted growth values. The stocks in this index are also members of either the Russell 1000 Value or the Russell 2000 Value indexes. The index is unmanaged, and it is not possible to invest directly in an index. |
| 3 | The Thomson Reuters/Jefferies CRB Commodity Index measures the overall direction of commodity sectors. The CRB was designed to isolate and reveal the directional movement of prices in overall commodity trades. The index is unmanaged, and it is not possible to invest directly in an index. |
| 4 | The Fund may make short sales of securities, which involves unlimited risk including the possibility that losses may exceed the original amount invested. |
| 5 | The Fund's use of derivative instruments involves risks different from, or possibly greater than, the risks associated with investing directly in securities and other traditional instruments. |
| 6 | International investing involves special risks including currency risks, increased volatility, political risks and differences in auditing and other financial standards. |
| 7 | Investments in gold and precious metals may be subject to additional risks. The Fund's investments in gold bullion may involve higher custody and transaction costs than investments in securities. |
Annual Shareholder Report
FUND PERFORMANCE AND GROWTH OF A $10,000 INVESTMENT
The Average Annual Total Return table below shows returns for each class averaged over the stated periods. The graphs below illustrate the hypothetical investment of $10,0001 in the Federated Prudent Absolute Return Fund (the “Fund”) from October 31, 2002 to October 31, 2012, compared to the Russell 3000 Value Index (R3000V)2 and the BofA Merrill Lynch 91-Day Treasury Bill Index (BAML91T).2
Average Annual Total Returns for the Period Ended 10/31/2012
(returns reflect all applicable sales charges and contingent deferred sales charges as specified below in footnote #1)
| Share Class | 1 Year | 5 Years | 10 Years |
| Class A Shares | -8.76% | -3.00% | 2.03% |
| Class B Shares | -9.45% | -2.99% | 1.99% |
| Class C Shares | -5.05% | -2.63% | 1.85% |
| Institutional Shares3 | -3.11% | -1.63% | 2.75% |
Performance data quoted represents past performance which is no guarantee of future results. Investment return and principal value will fluctuate so that an investor's shares, when redeemed, may be worth more or less than their original cost. Mutual fund performance changes over time and current performance may be lower or higher than what is stated. For current to the most recent month-end performance and after-tax returns, visit FederatedInvestors.com or call 1-800-341-7400. Returns shown do not reflect the deduction of taxes that a shareholder would pay on Fund distributions or the redemption of Fund shares. Mutual funds are not obligations of or guaranteed by any bank and are not federally insured.
Annual Shareholder Report
Growth of a $10,000 Investment–class a Shares

| Federated Prudent Absolute Return Fund - | Class A Shares | R3000V | BAML91T |
| 10/31/2002 | 9,450 | 10,000 | 10,000 |
| 10/31/2003 | 11,254 | 12,406 | 10,125 |
| 10/31/2004 | 12,637 | 14,346 | 10,241 |
| 10/31/2005 | 13,129 | 16,062 | 10,525 |
| 10/31/2006 | 13,475 | 19,528 | 11,011 |
| 10/31/2007 | 13,451 | 21,492 | 11,576 |
| 10/31/2008 | 11,813 | 13,686 | 11,891 |
| 10/31/2009 | 13,334 | 14,310 | 11,927 |
| 10/31/2010 | 12,445 | 16,657 | 11,941 |
| 10/31/2011 | 12,661 | 17,647 | 11,957 |
| 10/31/2012 | 12,230 | 20,594 | 11,966 |
41 graphic description end -->
| ■ | Total returns shown include the maximum sales charge of 5.50% ($10,000 investment minus $550 sales charge = $9,450). |
Growth of a $10,000 Investment–class B Shares
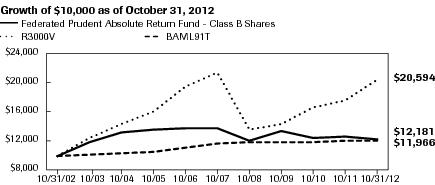
| Federated Prudent Absolute Return Fund - | Class B Shares | R3000V | BAML91T |
| 10/31/2002 | 10,000 | 10,000 | 10,000 |
| 10/31/2003 | 11,816 | 12,406 | 10,125 |
| 10/31/2004 | 13,170 | 14,346 | 10,241 |
| 10/31/2005 | 13,586 | 16,062 | 10,525 |
| 10/31/2006 | 13,842 | 19,528 | 11,011 |
| 10/31/2007 | 13,711 | 21,492 | 11,576 |
| 10/31/2008 | 11,954 | 13,686 | 11,891 |
| 10/31/2009 | 13,390 | 14,309 | 11,927 |
| 10/31/2010 | 12,395 | 16,656 | 11,941 |
| 10/31/2011 | 12,611 | 17,645 | 11,957 |
| 10/31/2012 | 12,181 | 20,594 | 11,966 |
41 graphic description end -->
| ■ | Total returns shown include the maximum contingent deferred sales charge of 5.50% as applicable. |
Annual Shareholder Report
Growth of a $10,000 Investment–class C Shares

| Federated Prudent Absolute Return Fund - | Class C Shares | R3000V | BAML91T |
| 10/31/2002 | 10,000 | 10,000 | 10,000 |
| 10/31/2003 | 11,811 | 12,406 | 10,125 |
| 10/31/2004 | 13,174 | 14,346 | 10,241 |
| 10/31/2005 | 13,582 | 16,062 | 10,525 |
| 10/31/2006 | 13,842 | 19,528 | 11,011 |
| 10/31/2007 | 13,709 | 21,492 | 11,576 |
| 10/31/2008 | 11,958 | 13,686 | 11,891 |
| 10/31/2009 | 13,389 | 14,309 | 11,927 |
| 10/31/2010 | 12,400 | 16,656 | 11,941 |
| 10/31/2011 | 12,522 | 17,645 | 11,957 |
| 10/31/2012 | 12,010 | 20,594 | 11,966 |
41 graphic description end -->
| ■ | Total returns shown include the maximum contingent deferred sales charge of 1.00% as applicable. |
Growth of a $10,000 Investment–Institutional Shares3
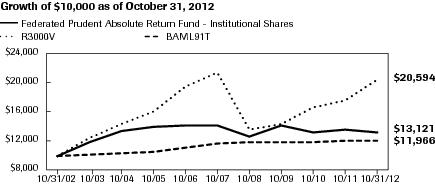
| Federated Prudent Absolute Return Fund - | Institutional Shares | R3000V | BAML91T |
| 10/31/2002 | 10,000 | 10,000 | 10,000 |
| 10/31/2003 | 11,908 | 12,406 | 10,125 |
| 10/31/2004 | 13,370 | 14,346 | 10,241 |
| 10/31/2005 | 13,888 | 16,062 | 10,525 |
| 10/31/2006 | 14,254 | 19,528 | 11,011 |
| 10/31/2007 | 14,243 | 21,492 | 11,576 |
| 10/31/2008 | 12,541 | 13,686 | 11,891 |
| 10/31/2009 | 14,187 | 14,310 | 11,927 |
| 10/31/2010 | 13,266 | 16,657 | 11,941 |
| 10/31/2011 | 13,542 | 17,647 | 11,957 |
| 10/31/2012 | 13,121 | 20,594 | 11,966 |
41 graphic description end -->
Annual Shareholder Report
| 1 | Represents a hypothetical investment of $10,000 in the Fund after deducting applicable sales charges: For Class A Shares, the maximum sales charge of 5.50% ($10,000 investment minus $550 sales charge = $9,450); For Class B Shares, the maximum contingent deferred sales charge is 5.50% on any redemption less than one year from the purchase date; For Class C Shares, the maximum contingent deferred sales charge is 1.00% on any redemption less than one year from the purchase date. The Fund's performance assumes the reinvestment of all dividends and distributions. The R3000V and the BAML91T have been adjusted to reflect reinvestment of dividends on securities in the indexes. |
| 2 | The R3000V measures the performance of those Russell 3000 Index companies with lower price-to-book ratios and lower forecasted growth values. The stocks in this index are also members of either the Russell 1000 Value or the Russell 2000 Value indexes. The BAML91T is an index tracking short-term U.S. government securities. The R3000V and the BAML91T are not adjusted to reflect sales charges, expenses or other fees that the Securities and Exchange Commission requires to be reflected in the Fund's performance. The indexes are unmanaged and, unlike the Fund, are not affected by cash flows. It is not possible to invest in an index. |
| 3 | The Fund's Institutional Shares commenced operations on June 29, 2007. For the period prior to commencement of operations of the Institutional Shares, the performance information shown is for the Fund's Class A Shares. The performance for Class A Shares has not been adjusted to reflect the expenses of the Institutional Shares since the Institutional Shares are estimated to have a lower expense ratio than the expense ratio of the Class A Shares. The performance of the Class A Shares has been adjusted to remove any voluntary waiver of Fund expenses related to the Class A Shares that may have occurred during the period prior to commencement of operations of the Institutional Shares. |
Annual Shareholder Report
Portfolio of Investments Summary Tables (unaudited)
At October 31, 2012, the Fund's portfolio composition1 was as follows:
| Security Type | Percentage of
Total Net Assets |
| Futures Contracts—Short (notional value)2 | (45.3)% |
| U.S. Equity Securities | 45.3% |
| International Equity Securities | 6.2% |
| Investment Company Securities | 6.1% |
| U.S. Treasury Securities | 34.2% |
| Purchased Put Options | 0.6% |
| Gold Bullion | 2.0% |
| Other Derivative Contracts3,4 | 0.0% |
| Rights4 | 0.0% |
| Cash Equivalents5 | 5.5% |
| Adjustment for Futures Contracts (notional value)2 | 46.1% |
| Other Assets and Liabilities—Net6 | (0.7)% |
| TOTAL | 100.0% |
At October 31, 2012, the Fund's sector composition7 for its equity securities was as follows:
| Sector Composition | Percentage of
Equity Securities |
| Consumer Staples | 22.9% |
| Financials | 22.2% |
| Health Care | 21.0% |
| Consumer Discretionary | 10.9% |
| Telecommunication Services | 10.4% |
| Utilities | 6.9% |
| Materials | 4.8% |
| Industrials | 0.9% |
| Energy4 | 0.0% |
| TOTAL | 100.0% |
| 1 | See the Fund's Prospectus for a description of the principal types of securities in which the Fund invests. |
| 2 | More complete information regarding the Fund's direct investments in futures contracts, including unrealized appreciation (depreciation), value and notional values or amounts of such contracts, can be found in the table at the end of the Portfolio of Investments included in this Report. |
Annual Shareholder Report
| 3 | Based upon net unrealized appreciation (depreciation) or value of the derivative contracts as applicable. Other Derivative Contracts may consist of futures, forwards, options and swaps. The impact of a derivative contract on the Fund's performance may be larger than its unrealized appreciation (depreciation) or value may indicate. In many cases, the notional value or amount of a derivative contract may provide a better indication of the contract's significance to the portfolio. More complete information regarding the Fund's direct investments in derivative contracts, including unrealized appreciation (depreciation), value and notional values or amounts of such contracts, can be found in the table at the end of the Portfolio of Investments included in this Report. |
| 4 | Represents less than 0.1%. |
| 5 | Cash Equivalents include any investments in money market mutual funds and/or overnight repurchase agreements. |
| 6 | Assets, other than investments in securities and derivative contracts less liabilities. See Statement of Assets and Liabilities. |
| 7 | Sector classifications are based upon, and individual portfolio securities are assigned to, the classifications of the Global Industry Classification Standard (GICS) except that the Adviser assigns a classification to securities not classified by the GICS and to securities for which the Adviser does not have access to the classification made by the GICS. |
Annual Shareholder Report
Portfolio of Investments
October 31, 2012
Shares, Principal
Amount or
Troy Ounces | | | Value in
U.S. Dollars |
| | COMMON STOCKS—51.5% | |
| | Beverages—1.4% | |
| 90,000 | | PepsiCo, Inc. | $6,231,600 |
| | Biotechnology—2.0% | |
| 100,000 | | Amgen, Inc. | 8,654,500 |
| | Chemicals—0.4% | |
| 35,000 | | Mosaic Co./The | 1,831,900 |
| | Commercial Banks—3.7% | |
| 70,000 | | BB&T Corp. | 2,026,500 |
| 100,000 | | SunTrust Banks, Inc. | 2,720,000 |
| 1,280,000 | | Synovus Financial Corp. | 3,136,000 |
| 250,000 | | Wells Fargo & Co. | 8,422,500 |
| | TOTAL | 16,305,000 |
| | Consumer Finance—1.1% | |
| 120,000 | | Discover Financial Services | 4,920,000 |
| | Diversified Financial Services—1.6% | |
| 740,000 | | Bank of America Corp. | 6,896,800 |
| | Diversified Telecommunication Services—4.6% | |
| 220,000 | | AT&T, Inc. | 7,609,800 |
| 850,000 | | Telstra Corp. Ltd. | 3,652,916 |
| 200,000 | | Verizon Communications, Inc. | 8,928,000 |
| | TOTAL | 20,190,716 |
| | Electric Utilities—2.0% | |
| 80,000 | | Duke Energy Corp. | 5,255,200 |
| 150,000 | | SSE PLC | 3,505,091 |
| | TOTAL | 8,760,291 |
| | Food & Staples Retailing—1.7% | |
| 100,000 | | Wal-Mart Stores, Inc. | 7,502,000 |
| | Food Products—2.0% | |
| 140,000 | | ConAgra Foods, Inc. | 3,897,600 |
| 90,000 | | Kellogg Co. | 4,708,800 |
| | TOTAL | 8,606,400 |
| | Gas Utilities—0.5% | |
| 440,000 | | Tokyo Gas Co. | 2,331,454 |
Annual Shareholder Report
Shares, Principal
Amount or
Troy Ounces | | | Value in
U.S. Dollars |
| | COMMON STOCKS—continued | |
| | Household Products—4.6% | |
| 60,000 | | Clorox Co. | $4,338,000 |
| 100,000 | | Kimberly-Clark Corp. | 8,345,000 |
| 110,000 | | Procter & Gamble Co. | 7,616,400 |
| | TOTAL | 20,299,400 |
| | Insurance—3.4% | |
| 46,000 | | Ace Ltd. | 3,617,900 |
| 40,000 | 1 | Berkshire Hathaway, Inc. | 3,454,000 |
| 150,000 | | MetLife, Inc. | 5,323,500 |
| 44,000 | | Prudential Financial, Inc. | 2,510,200 |
| | TOTAL | 14,905,600 |
| | Media—2.0% | |
| 126,000 | | Cinemark Holdings, Inc. | 3,110,940 |
| 150,000 | | Comcast Corp., Class A | 5,626,500 |
| | TOTAL | 8,737,440 |
| | Metals & Mining—2.0% | |
| 15,865 | | Agnico Eagle Mines Ltd. | 896,071 |
| 21,575 | 1 | Barisan Gold Corp. | 3,240 |
| 15,000 | | Barrick Gold Corp. | 607,500 |
| 4,000 | 1 | Detour Gold Corp. | 112,701 |
| 15,000 | 1 | Dundee Precious Metals, Inc. | 138,023 |
| 140,000 | 1 | Fortuna Silver Mines, Inc. | 776,571 |
| 14,000 | | Goldcorp, Inc., Class A | 633,220 |
| 50,000 | | IAMGOLD Corp. | 775,970 |
| 40,000 | 1 | Imperial Metals Corp. | 511,439 |
| 75,000 | 1 | Kaminak Gold Corp. | 144,180 |
| 10,000 | 1 | Kennady Diamonds, Inc. | 13,016 |
| 50,000 | 1 | Mountain Province Diamonds, Inc. | 185,232 |
| 50,000 | 1 | New Gold, Inc. | 586,500 |
| 12,000 | | Newmont Mining Corp. | 654,600 |
| 74,000 | 1 | Osisko Mining Corp. | 726,849 |
| 170,000 | 1 | Rockgate Capital Corp. | 88,511 |
| 140,000 | 1 | Romarco Minerals, Inc. | 133,166 |
| 9,000 | | Royal Gold, Inc. | 792,720 |
| 8,000 | | Silver Wheaton Corp. | 322,403 |
| 40,000 | | Yamana Gold, Inc. | 808,400 |
| | TOTAL | 8,910,312 |
Annual Shareholder Report
Shares, Principal
Amount or
Troy Ounces | | | Value in
U.S. Dollars |
| | COMMON STOCKS—continued | |
| | Multi-Industry Cap Good—0.5% | |
| 100,000 | | General Electric Co. | $2,106,000 |
| | Multiline Retail—1.8% | |
| 120,000 | | Target Corp. | 7,650,000 |
| | Multi-Utilities—1.0% | |
| 400,000 | | National Grid PLC | 4,560,492 |
| | Oil Gas & Consumable Fuels—0.0% | |
| 100,000 | 1 | BNK Petroleum, Inc. | 65,081 |
| | Pharmaceuticals—8.8% | |
| 100,000 | | Abbott Laboratories | 6,552,000 |
| 115,000 | | Eli Lilly & Co. | 5,592,450 |
| 120,000 | | Johnson & Johnson | 8,498,400 |
| 200,000 | | Merck & Co., Inc. | 9,126,000 |
| 360,000 | | Pfizer, Inc. | 8,953,200 |
| | TOTAL | 38,722,050 |
| | Real Estate Investment Trusts (REITs)—1.7% | |
| 58,000 | | Health Care REIT, Inc. | 3,446,940 |
| 25,000 | | Simon Property Group, Inc. | 3,805,250 |
| | TOTAL | 7,252,190 |
| | Specialty Retail—1.9% | |
| 75,000 | | Lowe's Cos., Inc. | 2,428,500 |
| 40,000 | | Ross Stores, Inc. | 2,438,000 |
| 80,000 | | TJX Cos., Inc. | 3,330,400 |
| | TOTAL | 8,196,900 |
| | Tobacco—2.1% | |
| 140,000 | | Altria Group, Inc. | 4,452,000 |
| 60,000 | | Imperial Tobacco Group PLC | 2,265,722 |
| 60,000 | | Reynolds American, Inc. | 2,498,400 |
| | TOTAL | 9,216,122 |
| | Wireless Telecommunication Services—0.7% | |
| 1,200,000 | | Vodafone Group PLC | 3,258,186 |
| | TOTAL COMMON STOCKS
(IDENTIFIED COST $214,516,055) | 226,110,434 |
| | U.S. TREASURY—34.2% | |
| 90,000,000 | 2,3 | United States Treasury Bill, 0.10%, 12/6/2012 | 89,991,459 |
Annual Shareholder Report
Shares, Principal
Amount or
Troy Ounces | | | Value in
U.S. Dollars |
| | U.S. TREASURY—continued | |
| $60,000,000 | 2 | United States Treasury Bill, 0.11%, 11/15/2012 | $59,998,008 |
| | TOTAL U.S. TREASURY
(IDENTIFIED COST $149,988,557) | 149,989,467 |
| | INVESTMENT FUND—2.7% | |
| 117,852 | 4 | GML Agricultural Commodity Finance Fund LLC
(IDENTIFIED COST $11,785,212) | 11,835,712 |
| | EXCHANGE-TRADED FUND—3.4% | |
| 1,000,000 | 1 | Sprott Physical Gold Trust
(IDENTIFIED COST $14,733,180) | 14,730,000 |
| | BULLION—2.0% | |
| 5,200 | | Gold (IDENTIFIED COST $9,034,335) | 8,946,981 |
| | PURCHASED PUT OPTIONS—0.6% | |
| | Index—0.6% | |
| 4,000 | | SPDR S&P 500 ETF Trust, Strike Price $125, Expiration Date 12/22/2012 | 226,000 |
| 8,000 | | SPDR S&P 500 ETF Trust, Strike Price $130, Expiration Date 3/16/2013 | 2,428,000 |
| | TOTAL PURCHASED PUT OPTIONS
(IDENTIFIED COST $2,490,960) | 2,654,000 |
| | RIGHTS—0.0% | |
| | Metals & Mining—0.0% | |
| 50,000 | 1 | Mountain Province Diamonds, Inc., Rights
(IDENTIFIED COST $0) | 4,756 |
| | MUTUAL FUND—5.5% | |
| 24,178,050 | 5,6 | Federated Prime Value Obligations Fund, Institutional Shares, 0.16%
(AT NET ASSET VALUE) | 24,178,050 |
| | TOTAL INVESTMENTS—99.9% (IDENTIFIED COST $426,726,349)7 | 438,449,400 |
| | OTHER ASSETS AND LIABILITIES - NET—0.1%8 | 183,301 |
| | TOTAL NET ASSETS—100% | $438,632,701 |
Annual Shareholder Report
At October 31, 2012, the Fund had the following open futures contracts:
| Description | Number of
Contracts | Notional
Value | Expiration
Date | Unrealized
Appreciation/
(Depreciation) |
| 1CAC40 Index Short Futures | 204 | $9,056,149 | November 2012 | $270,852 |
| 1DAX Index Short Futures | 58 | $13,665,167 | December 2012 | $(27,913) |
| 1S&P 500 Index Short Futures | 500 | $175,850,000 | December 2012 | $3,237,150 |
| NET UNREALIZED APPRECIATION ON FUTURES CONTRACTS | $3,480,089 |
At October 31, 2012, the Fund had the following outstanding foreign exchange contracts:
| Settlement Date | Foreign
Currency Units
to Deliver | In
Exchange
For | Contracts
at Value | Unrealized
Appreciation/
(Depreciation) |
| Contracts Sold: | | | | |
| 11/9/2012 | 2,937,400 GBP | $4,637,890 | $4,740,104 | $(102,214) |
| 11/9/2012 | 2,375,000 GBP | $3,840,556 | $3,832,556 | $8,000 |
| 11/9/2012 | 2,442,000 GBP | $3,931,122 | $3,940,674 | $(9,552) |
| 11/9/2012 | 156,791,047 JPY | $2,000,299 | $1,964,205 | $36,094 |
| 11/28/2012 | 3,800,000 CAD | $3,818,328 | $3,802,482 | $15,846 |
| 12/28/2012 | 3,300,000 AUD | $3,418,371 | $3,409,170 | $9,201 |
| NET UNREALIZED DEPRECIATION ON FOREIGN EXCHANGE CONTRACTS | $(42,625) |
Net Unrealized Appreciation/(Depreciation) on Futures Contracts and Foreign Exchange Contracts are included in “Other Assets and Liabilities—Net.”
| 1 | Non-income producing security. |
| 2 | Discount rate at the time of purchase. |
| 3 | Pledged as collateral to ensure the Fund is able to satisfy the obligations of its outstanding short futures contracts. |
| 4 | Fair value determined in accordance with procedures established by and under the general supervision of the Fund's Board of Trustees (the “Trustees”). |
| 5 | Affiliated holding. |
| 6 | 7-Day net yield. |
| 7 | The cost of investments for federal tax purposes amounts to $461,219,246. |
| 8 | Assets, other than investments in securities, less liabilities. See Statement of Assets and Liabilities. |
Note: The categories of investments are shown as a percentage of total net assets at October 31, 2012.
Annual Shareholder Report
Various inputs are used in determining the value of the Fund's investments. These inputs are summarized in the three broad levels listed below:
Level 1—quoted prices in active markets for identical securities, including investment companies with daily net asset values, if applicable.
Level 2—other significant observable inputs (including quoted prices for similar securities, interest rates, prepayment speeds, credit risk, etc.). Also includes securities valued at amortized cost.
Level 3—significant unobservable inputs (including the Fund's own assumptions in determining the fair value of investments).
The inputs or methodology used for valuing securities are not an indication of the risk associated with investing in those securities.
The following is a summary of the inputs used, as of October 31, 2012, in valuing the Fund's assets carried at fair value:
| Valuation Inputs | | | | |
| Level 1—
Quoted
Prices and
Investments in
Mutual Funds | Level 2—
Other
Significant
Observable
Inputs | Level 3—
Significant
Unobservable
Inputs | Total |
| Equity Securities: | | | | |
| Common Stock | | | | |
| Domestic | $199,008,500 | $— | $— | $199,008,500 |
| International | 27,101,934 | — | — | 27,101,934 |
| Debt Securities: | | | | |
| U.S. Treasury | — | 149,989,467 | — | 149,989,467 |
| Investment Fund | — | — | 11,835,7121 | 11,835,712 |
| Exchange-Traded Fund | 14,730,000 | — | — | 14,730,000 |
| Bullion | 8,946,981 | — | — | 8,946,981 |
| Purchased Put Options | 2,654,000 | — | — | 2,654,000 |
| Rights | — | 4,756 | — | 4,756 |
| Mutual Fund | 24,178,050 | — | — | 24,178,050 |
| TOTAL SECURITIES | $276,619,465 | $149,994,223 | $11,835,712 | $438,449,400 |
| OTHER FINANCIAL INSTRUMENTS2 | $3,480,089 | $(42,625) | $— | $3,437,464 |
| 1 | Includes $49,879,528 of an investment fund security transferred from Level 1 to Level 3 because the Adviser utilized unobservable market data to value the security. This transfer represents the value of the security at the beginning of the period. |
| 2 | Other financial instruments include futures contracts and foreign exchange contracts.
|
Annual Shareholder Report
Following is a reconciliation of assets in which significant unobservable inputs (Level 3) were used in determining fair value:
| Investments in
Common Stock—
International | Investments in
Investment
Fund |
| Balance as of November 1, 2011 | $8,187 | $— |
| Change in unrealized appreciation/depreciation | — | (904,443) |
| Transfers into Level 3 | — | 12,740,155 |
| Transfers out of Level 3 | (8,187) | — |
| Balance as of October 31, 2012 | $— | $11,835,712 |
| The total change in unrealized appreciation (depreciation) included in the Statement of Operations attributable to investments still held at October 31, 2012 | $— | $(904,443) |
The following acronyms are used throughout this portfolio:
| AUD | —Australian Dollar |
| CAD | —Canadian Dollars |
| ETF | —Exchange-Traded Fund |
| GBP | —Great Britain Pound |
| JPY | —Japanese Yen |
| REITs | —Real Estate Investment Trusts |
| SPDR | —Standard & Poor's Depository Receipts |
See Notes which are an integral part of the Financial Statements
Annual Shareholder Report
Financial Highlights–Class A Shares
(For a Share Outstanding Throughout Each Period)
| Year Ended October 31 | 2012 | 2011 | 2010 | 2009 | 2008 |
| Net Asset Value, Beginning of Period | $9.89 | $10.10 | $11.09 | $10.26 | $12.22 |
| Income From Investment Operations: | | | | | |
| Net investment income (loss)1 | (0.04) | (0.04) | 0.03 | 0.24 | 0.42 |
| Net realized and unrealized gain (loss) on investments, short sales, futures contracts, written options, certain receivables and foreign currency transactions | (0.30) | 0.21 | (0.77) | 1.05 | (1.83) |
| TOTAL FROM INVESTMENT OPERATIONS | (0.34) | 0.17 | (0.74) | 1.29 | (1.41) |
| Less Distributions: | | | | | |
| Distributions from net investment income | (0.05) | (0.38) | (0.25) | (0.46) | (0.55) |
| Net Asset Value, End of Period | $9.50 | $9.89 | $10.10 | $11.09 | $10.26 |
| Total Return2 | (3.41)% | 1.74% | (6.67)% | 12.88% | (12.18)% |
| Ratios to Average Net Assets: | | | | | |
| Net expenses | 1.26% | 1.26%3 | 1.89%3 | 1.39%3 | 1.20%3 |
| Net expenses excluding dividends and other expenses related to short sales | 1.24% | 1.24%3 | 1.24%3 | 1.24%3 | 1.20%3 |
| Net investment income (loss) | (0.45)% | (0.41)% | 0.27% | 2.23% | 3.46% |
| Expense waiver/reimbursement4 | 0.10% | 0.08% | 0.05% | 0.07% | 0.04% |
| Supplemental Data: | | | | | |
| Net assets, end of period (000 omitted) | $175,186 | $257,503 | $464,884 | $835,964 | $721,632 |
| Portfolio turnover | 182% | 129% | 180% | 191% | 255% |
| 1 | Per share numbers have been calculated using the average shares method. |
| 2 | Based on net asset value, which does not reflect the sales charge, redemption fee or contingent deferred sales charge, if applicable. |
| 3 | The net expense ratio is calculated without reduction for expense offset arrangements. The net expense ratios are 1.26%, 1.89%, 1.39% and 1.20% for the years ended October 31, 2011, 2010, 2009 and 2008, respectively, after taking into account these expense reductions. The net expense ratios excluding dividends and other expenses related to short sales are also calculated without reduction for these expense offset arrangements. |
| 4 | This expense decrease is reflected in both the net expense and net investment income (loss) ratios shown above. |
See Notes which are an integral part of the Financial Statements
Annual Shareholder Report
Financial Highlights–Class B Shares
(For a Share Outstanding Throughout Each Period)
| Year Ended October 31 | 2012 | 2011 | 2010 | 2009 | 2008 |
| Net Asset Value, Beginning of Period | $9.82 | $9.99 | $10.99 | $10.21 | $12.16 |
| Income From Investment Operations: | | | | | |
| Net investment income (loss)1 | (0.12) | (0.11) | (0.05) | 0.16 | 0.33 |
| Net realized and unrealized gain (loss) on investments, short sales, futures contracts, written options, certain receivables and foreign currency transactions | (0.29) | 0.21 | (0.76) | 1.04 | (1.82) |
| TOTAL FROM INVESTMENT OPERATIONS | (0.41) | 0.10 | (0.81) | 1.20 | (1.49) |
| Less Distributions: | | | | | |
| Distributions from net investment income | — | (0.27) | (0.19) | (0.42) | (0.46) |
| Net Asset Value, End of Period | $9.41 | $9.82 | $9.99 | $10.99 | $10.21 |
| Total Return2 | (4.18)% | 1.08% | (7.44)% | 12.01% | (12.82)% |
| Ratios to Average Net Assets: | | | | | |
| Net expenses | 2.01% | 2.01%3 | 2.64%3 | 2.14%3 | 1.95%3 |
| Net expenses excluding dividends and other expenses related to short sales | 1.99% | 1.99%3 | 1.99%3 | 1.99%3 | 1.95%3 |
| Net investment income (loss) | (1.21)% | (1.15)% | (0.50)% | 1.54% | 2.69% |
| Expense waiver/reimbursement4 | 0.10% | 0.09% | 0.05% | 0.07% | 0.04% |
| Supplemental Data: | | | | | |
| Net assets, end of period (000 omitted) | $34,029 | $60,018 | $103,483 | $166,561 | $197,694 |
| Portfolio turnover | 182% | 129% | 180% | 191% | 255% |
| 1 | Per share numbers have been calculated using the average shares method. |
| 2 | Based on net asset value, which does not reflect the sales charge, redemption fee or contingent deferred sales charge, if applicable. |
| 3 | The net expense ratio is calculated without reduction for expense offset arrangements. The net expense ratios are 2.01%, 2.64%, 2.13% and 1.95% for the years ended October 31, 2011, 2010, 2009 and 2008, respectively, after taking into account these expense reductions. The net expense ratios excluding dividends and other expenses related to short sales are also calculated without reduction for these expense offset arrangements. |
| 4 | This expense decrease is reflected in both the net expense and net investment income (loss) ratios shown above. |
See Notes which are an integral part of the Financial Statements
Annual Shareholder Report
Financial Highlights–Class C Shares
(For a Share Outstanding Throughout Each Period)
| Year Ended October 31 | 2012 | 2011 | 2010 | 2009 | 2008 |
| Net Asset Value, Beginning of Period | $9.77 | $9.96 | $10.96 | $10.19 | $12.13 |
| Income From Investment Operations: | | | | | |
| Net investment income (loss)1 | (0.11) | (0.11) | (0.05) | 0.16 | 0.33 |
| Net realized and unrealized gain (loss) on investments, short sales, futures contracts, written options, certain receivables and foreign currency transactions | (0.29) | 0.20 | (0.76) | 1.03 | (1.81) |
| TOTAL FROM INVESTMENT OPERATIONS | (0.40) | 0.09 | (0.81) | 1.19 | (1.48) |
| Less Distributions: | | | | | |
| Distributions from net investment income | — | (0.28) | (0.19) | (0.42) | (0.46) |
| Net Asset Value, End of Period | $9.37 | $9.77 | $9.96 | $10.96 | $10.19 |
| Total Return2 | (4.09)% | 0.98% | (7.38)% | 11.96% | (12.77)% |
| Ratios to Average Net Assets: | | | | | |
| Net expenses | 2.01% | 2.01%3 | 2.63%3 | 2.14%3 | 1.95%3 |
| Net expenses excluding dividends and other expenses related to short sales | 1.99% | 1.99%3 | 1.99%3 | 1.99%3 | 1.95%3 |
| Net investment income (loss) | (1.19)% | (1.16)% | (0.50)% | 1.50% | 2.70% |
| Expense waiver/reimbursement4 | 0.10% | 0.08% | 0.05% | 0.07% | 0.04% |
| Supplemental Data: | | | | | |
| Net assets, end of period (000 omitted) | $147,819 | $207,932 | $365,433 | $489,260 | $445,425 |
| Portfolio turnover | 182% | 129% | 180% | 191% | 255% |
| 1 | Per share numbers have been calculated using the average shares method. |
| 2 | Based on net asset value, which does not reflect the sales charge, redemption fee or contingent deferred sales charge, if applicable. |
| 3 | The net expense ratio is calculated without reduction for expense offset arrangements. The net expense ratios are 2.01%, 2.63%, 2.13% and 1.95% for the years ended October 31, 2011, 2010, 2009 and 2008, respectively, after taking into account these expense reductions. The net expense ratios excluding dividends and other expenses related to short sales are also calculated without reduction for these expense offset arrangements. |
| 4 | This expense decrease is reflected in both the net expense and net investment income (loss) ratios shown above. |
See Notes which are an integral part of the Financial Statements
Annual Shareholder Report
Financial Highlights–Institutional Shares
(For a Share Outstanding Throughout Each Period)
| Year Ended October 31 | 2012 | 2011 | 2010 | 2009 | 2008 |
| Net Asset Value, Beginning of Period | $9.95 | $10.15 | $11.14 | $10.29 | $12.23 |
| Income From Investment Operations: | | | | | |
| Net investment income (loss)1 | (0.02) | (0.02) | 0.03 | 0.23 | 0.50 |
| Net realized and unrealized gain (loss) on investments, short sales, futures contracts, written options, certain receivables and foreign currency transactions | (0.29) | 0.22 | (0.75) | 1.08 | (1.88) |
| TOTAL FROM INVESTMENT OPERATIONS | (0.31) | 0.20 | (0.72) | 1.31 | (1.38) |
| Less Distributions: | | | | | |
| Distributions from net investment income | (0.08) | (0.40) | (0.27) | (0.46) | (0.56) |
| Net Asset Value, End of Period | $9.56 | $9.95 | $10.15 | $11.14 | $10.29 |
| Total Return2 | (3.11)% | 2.08% | (6.49)% | 13.12% | (11.95)% |
| Ratios to Average Net Assets: | | | | | |
| Net expenses | 1.01% | 1.01%3 | 1.58%3 | 1.22%3 | 0.95%3 |
| Net expenses excluding dividends and other expenses related to short sales | 0.99% | 0.99%3 | 0.99%3 | 0.99%3 | 0.95%3 |
| Net investment income (loss) | (0.20)% | (0.17)% | 0.30% | 2.05% | 4.62% |
| Expense waiver/reimbursement4 | 0.10% | 0.08% | 0.05% | 0.07% | 0.04% |
| Supplemental Data: | | | | | |
| Net assets, end of period (000 omitted) | $81,598 | $90,569 | $194,702 | $81,473 | $6,551 |
| Portfolio turnover | 182% | 129% | 180% | 191% | 255% |
| 1 | Per share numbers have been calculated using the average shares method. |
| 2 | Based on net asset value. |
| 3 | The net expense ratio is calculated without reduction for expense offset arrangements. The net expense ratios are 1.01%, 1.58%, 1.21% and 0.95% for the years ended October 31, 2011, 2010, 2009 and 2008, respectively, after taking into account these expense reductions. The net expense ratios excluding dividends and other expenses related to short sales are also calculated without reduction for these expense offset arrangements. |
| 4 | This expense decrease is reflected in both the net expense and net investment income (loss) ratios shown above. |
See Notes which are an integral part of the Financial Statements
Annual Shareholder Report
Statement of Assets and Liabilities
October 31, 2012
| Assets: | | |
| Total investment in securities/bullion, at value, including $24,178,050 of investment in an affiliated holding (Note 5) (identified cost $426,726,349) | | $438,449,400 |
| Cash denominated in foreign currencies (identified cost $1,043,056) | | 1,037,285 |
| Receivable for investments sold (Note 9) | | 5,492,660 |
| Receivable for shares sold | | 968,543 |
| Income receivable | | 919,684 |
| Unrealized appreciation on foreign exchange contracts | | 69,141 |
| Receivable for daily variation margin | | 29,119 |
| TOTAL ASSETS | | 446,965,832 |
| Liabilities: | | |
| Bank overdraft | $179,747 | |
| Payable for investments purchased | 4,672,864 | |
| Payable for shares redeemed | 2,697,988 | |
| Unrealized depreciation on foreign exchange contracts | 111,766 | |
| Payable for shareholder services fee (Note 5) | 125,152 | |
| Payable for distribution services fee (Note 5) | 117,511 | |
| Payable for Directors'/Trustees' fees | 2,025 | |
| Accrued expenses | 426,078 | |
| TOTAL LIABILITIES | | 8,333,131 |
| Net assets for 46,360,162 shares outstanding | | $438,632,701 |
| Net Assets Consist of: | | |
| Paid-in capital | | $896,362,601 |
| Net unrealized appreciation of investments, futures contracts, certain receivables and translation of assets and liabilities in foreign currency | | 9,473,307 |
| Accumulated net realized loss on investments, short sales, futures contracts, written options and foreign currency transactions | | (464,920,791) |
| Distributions in excess of net investment income | | (2,282,416) |
| TOTAL NET ASSETS | | $438,632,701 |
Annual Shareholder Report
Statement of Assets and Liabilities–continued
| Net Asset Value, Offering Price and Redemption Proceeds Per Share | | |
| Class A Shares: | | |
Net asset value per share ($175,186,288 ÷ 18,433,846 shares outstanding),
no par value, unlimited shares authorized | | $9.50 |
| Offering price per share (100/94.50 of $9.50) | | $10.05 |
| Redemption proceeds per share | | $9.50 |
| Class B Shares: | | |
Net asset value per share ($34,029,170 ÷ 3,614,413 shares outstanding),
no par value, unlimited shares authorized | | $9.41 |
| Offering price per share | | $9.41 |
| Redemption proceeds per share (94.50/100 of $9.41) | | $8.89 |
| Class C Shares: | | |
Net asset value per share ($147,819,091 ÷ 15,772,925 shares outstanding),
no par value, unlimited shares authorized | | $9.37 |
| Offering price per share | | $9.37 |
| Redemption proceeds per share (99.00/100 of $9.37) | | $9.28 |
| Institutional Shares: | | |
Net asset value per share ($81,598,152 ÷ 8,538,978 shares outstanding),
no par value, unlimited shares authorized | | $9.56 |
| Offering price per share | | $9.56 |
| Redemption proceeds per share | | $9.56 |
See Notes which are an integral part of the Financial Statements
Annual Shareholder Report
Statement of Operations
Year Ended October 31, 2012
| Investment Income: | | | |
| Dividends (including $97,603 received from an affiliated holding (Note 5) and net of foreign taxes withheld of $39,181) | | | $4,210,935 |
| Interest | | | 144,342 |
| TOTAL INCOME | | | 4,355,277 |
| Expenses: | | | |
| Investment adviser fee (Note 5) | | $4,034,750 | |
| Administrative fee (Note 5) | | 419,680 | |
| Custodian fees | | 95,404 | |
| Transfer and dividend disbursing agent fees and expenses | | 932,637 | |
| Directors'/Trustees' fees | | 4,162 | |
| Auditing fees | | 32,500 | |
| Legal fees | | 9,131 | |
| Portfolio accounting fees | | 143,366 | |
| Distribution services fee (Note 5) | | 1,712,929 | |
| Shareholder services fee (Note 5) | | 1,117,148 | |
| Account administration fee (Note 2) | | 911 | |
| Share registration costs | | 79,473 | |
| Printing and postage | | 81,856 | |
| Insurance premiums | | 4,968 | |
| Dividends and other expenses related to short sales | | 68,002 | |
| Taxes | | 20,876 | |
| Miscellaneous | | 6,476 | |
| TOTAL EXPENSES | | 8,764,269 | |
Annual Shareholder Report
Statement of Operations–continued
| Waivers and Reimbursement (Note 5): | | | |
| Waiver/reimbursement of investment adviser fee | $(505,098) | | |
| Waiver of administrative fee | (8,782) | | |
| Waiver of distribution services fee | (225) | | |
| TOTAL WAIVERS AND REIMBURSEMENT | | $(514,105) | |
| Net expenses | | | $8,250,164 |
| Net investment income (loss) | | | (3,894,887) |
| Realized and Unrealized Gain (Loss) on Investments, Short Sales, Futures Contracts, Certain Receivables and Foreign Currency Transactions: | | | |
| Net realized gain on investments and foreign currency transactions | | | 11,684,850 |
| Net realized loss on short sales | | | (251,108) |
| Net realized loss on futures contracts | | | (34,817,146) |
| Net change in unrealized appreciation of investments and translation of assets and liabilities in foreign currency | | | (3,667,554) |
| Net change in unrealized appreciation of futures contracts | | | 11,034,394 |
| Net realized and unrealized loss on investments, short sales, futures contracts, certain receivables and foreign currency transactions | | | (16,016,564) |
| Change in net assets resulting from operations | | | $(19,911,451) |
See Notes which are an integral part of the Financial Statements
Annual Shareholder Report
Statement of Changes in Net Assets
| Year Ended October 31 | 2012 | 2011 |
| Increase (Decrease) in Net Assets | | |
| Operations: | | |
| Net investment income (loss) | $(3,894,887) | $(5,456,094) |
| Net realized gain (loss) on investments, short sales, futures contracts and foreign currency transactions | (23,383,404) | 10,135,359 |
| Net change in unrealized appreciation/depreciation of investments, short sales, futures contracts, certain receivables and translation of assets and liabilities in foreign currency | 7,366,840 | 2,286,641 |
| CHANGE IN NET ASSETS RESULTING FROM OPERATIONS | (19,911,451) | 6,965,906 |
| Distributions to Shareholders: | | |
| Distributions from net investment income | | |
| Class A Shares | (1,328,817) | (14,746,332) |
| Class B Shares | — | (2,608,413) |
| Class C Shares | — | (9,099,164) |
| Institutional Shares | (880,430) | (5,874,579) |
| CHANGE IN NET ASSETS RESULTING FROM DISTRIBUTIONS TO SHAREHOLDERS | (2,209,247) | (32,328,488) |
| Share Transactions: | | |
| Proceeds from sale of shares | 127,992,654 | 189,424,285 |
| Net asset value of shares issued to shareholders in payment of distributions declared | 1,808,177 | 24,334,306 |
| Cost of shares redeemed | (285,070,598) | (700,873,767) |
| CHANGE IN NET ASSETS RESULTING FROM SHARE TRANSACTIONS | (155,269,767) | (487,115,176) |
| Change in net assets | (177,390,465) | (512,477,758) |
| Net Assets: | | |
| Beginning of period | 616,023,166 | 1,128,500,924 |
| End of period (including undistributed (distributions in excess of) net investment income of $(2,282,416) and $2,208,895, respectively) | $438,632,701 | $616,023,166 |
See Notes which are an integral part of the Financial Statements
Annual Shareholder Report
Notes to Financial Statements
October 31, 2012
1. Organization
Federated Equity Funds (the “Trust”) is registered under the Investment Company Act of 1940, as amended (the “Act”), as an open-end management investment company. The Trust consists of 13 diversified portfolios. The financial statements included herein are only those of Federated Prudent Absolute Return Fund (formerly, Federated Market Opportunity Fund) (the “Fund”). The financial statements of the other portfolios are presented separately. The assets of each portfolio are segregated and a shareholder's interest is limited to the portfolio in which shares are held. Each portfolio pays its own expenses. The Fund offers four classes of shares: Class A Shares, Class B Shares, Class C Shares and Institutional Shares. All shares of the Fund have equal rights with respect to voting, except on class-specific matters. The investment objective of the Fund is to provide absolute (positive) returns with low correlation to the U.S. equity market.
2. Significant Accounting Policies
The following is a summary of significant accounting policies consistently followed by the Fund in the preparation of its financial statements. These policies are in conformity with U.S. generally accepted accounting principles (GAAP).
Investment Valuation
In calculating its net asset value (NAV), the Fund generally values investments as follows:
| ■ | Equity securities listed on an exchange or traded through a regulated market system are valued at their last reported sale price or official closing price in their principal exchange or market. |
| ■ | Shares of other mutual funds are valued based upon their reported NAVs. |
| ■ | Fixed-income securities acquired with remaining maturities greater than 60 days are fair valued using price evaluations provided by a pricing service approved by the Trustees. |
| ■ | Fixed-income securities acquired with remaining maturities of 60 days or less are valued at their cost (adjusted for the accretion of any discount or amortization of any premium), which approximates market value. |
| ■ | Derivative contracts listed on exchanges are valued at their reported settlement or closing price. |
| ■ | Over-the-counter (OTC) derivative contracts are fair valued using price evaluations provided by a pricing service approved by the Trustees. |
| ■ | For securities that are fair valued in accordance with procedures established by and under the general supervision of the Trustees, certain factors may be considered such as: the purchase price of the security, information obtained by contacting the issuer, analysis of the issuer's financial statements or other available documents, fundamental analytical data, the nature and duration of restrictions on disposition, the movement of the market in which the security is normally traded and public trading in similar securities of the issuer or comparable issuers. |
Annual Shareholder Report
If the Fund cannot obtain a price or price evaluation from a pricing service for an investment, the Fund may attempt to value the investment based upon the mean of bid and asked quotations or fair value the investment based on price evaluations, from one or more dealers. If any price, quotation, price evaluation or other pricing source is not readily available when the NAV is calculated, the Fund uses the fair value of the investment determined in accordance with the procedures described below. There can be no assurance that the Fund could purchase or sell an investment at the price used to calculate the Fund's NAV.
Fair Valuation and Significant Events Procedures
The Trustees have appointed a Valuation Committee comprised of officers of the Fund, Federated Equity Management Company of Pennsylvania (“Adviser”) and the Adviser's affiliated companies to determine fair value of securities and in overseeing the calculation of the NAV. The Trustees have also authorized the use of pricing services recommended by the Valuation Committee to provide fair value evaluations of the current value of certain investments for purposes of calculating the NAV. The Valuation Committee employs various methods for reviewing third-party pricing service evaluations including periodic reviews of third-party pricing services' policies, procedures and valuation methods (including key inputs and assumptions), transactional back-testing, comparisons of evaluations of different pricing services and review of price challenges by the Adviser based on recent market activity. In the event that market quotations and price evaluations are not available for an investment, the Valuation Committee determines the fair value of the investment in accordance with procedures adopted by the Trustees. The Trustees periodically review and approve the fair valuations made by the Valuation Committee and any changes made to the procedures.
Factors considered by pricing services in evaluating an investment include the yields or prices of investments of comparable quality, coupon, maturity, call rights and other potential prepayments, terms and type, reported transactions, indications as to values from dealers and general market conditions. Some pricing services provide a single price evaluation reflecting the bid side of the market for an investment (a “bid” evaluation). Other pricing services offer both bid evaluations and price evaluations indicative of a price between the prices bid and asked for the investment (a “mid” evaluation). The Fund normally uses bid evaluations for U.S. Treasury and Agency securities, mortgage-backed securities and municipal securities. The Fund normally uses mid evaluations for other types of fixed-income securities and OTC derivative contracts. In the event that market quotations and price evaluations are not available for an investment, the fair value of the investment is determined in accordance with procedures adopted by the Trustees.
The Trustees also have adopted procedures requiring an investment to be priced at its fair value whenever the Adviser determines that a significant event affecting the value of the investment has occurred between the time as of which the price of the investment would otherwise be determined and the time as of which the NAV is computed. An event is considered significant if there is both an affirmative expectation that the investment's value will change in response to the event and a reasonable basis for quantifying the resulting change in value. Examples of significant events that may occur after the close of the principal market on which a security is traded, or after the time of a price evaluation provided by a pricing service or a dealer, include:
| ■ | With respect to securities traded in foreign markets, significant trends in U.S. equity markets or in the trading of foreign securities index futures contracts; |
| ■ | Political or other developments affecting the economy or markets in which an issuer conducts its operations or its securities are traded; and |
Annual Shareholder Report
| ■ | Announcements concerning matters such as acquisitions, recapitalizations, litigation developments, a natural disaster affecting the issuer's operations or regulatory changes or market developments affecting the issuer's industry. |
The Trustees have approved the use of a pricing service to determine the fair value of equity securities traded principally in foreign markets when the Adviser determines that there has been a significant trend in the U.S. equity markets or in index futures trading. For other significant events, the Fund may seek to obtain more current quotations or price evaluations from alternative pricing sources. If a reliable alternative pricing source is not available, the Fund will determine the fair value of the investment using another method approved by the Trustees.
Repurchase Agreements
The Fund may invest in repurchase agreements for short-term liquidity purposes. It is the policy of the Fund to require the other party to a repurchase agreement to transfer to the Fund's custodian or sub-custodian eligible securities or cash with a market value (after transaction costs) at least equal to the repurchase price to be paid under the repurchase agreement. The eligible securities are transferred to accounts with the custodian or sub-custodian in which the Fund holds a “securities entitlement” and exercises “control” as those terms are defined in the Uniform Commercial Code. The Fund has established procedures for monitoring the market value of the transferred securities and requiring the transfer of additional eligible securities if necessary to equal at least the repurchase price. These procedures also allow the other party to require securities to be transferred from the account to the extent that their market value exceeds the repurchase price or in exchange for other eligible securities of equivalent market value.
The insolvency of the other party or other failure to repurchase the securities may delay the disposition of the underlying securities or cause the Fund to receive less than the full repurchase price. Under the terms of the repurchase agreement, any amounts received by the Fund in excess of the repurchase price and related transaction costs must be remitted to the other party.
The Fund may enter into repurchase agreements in which eligible securities are transferred into joint trading accounts maintained by the custodian or sub-custodian for investment companies and other clients advised by the Fund's Adviser and its affiliates. The Fund will participate on a pro rata basis with the other investment companies and clients in its share of the securities transferred under such repurchase agreements and in its share of proceeds from any repurchase or other disposition of such securities.
Annual Shareholder Report
Investment Income, Gains and Losses, Expenses and Distributions
Investment transactions are accounted for on a trade-date basis. Realized gains and losses from investment transactions are recorded on an identified cost basis. Interest income and expenses are accrued daily. Dividend income and distributions to shareholders are recorded on the ex-dividend date. Foreign dividends are recorded on the ex-dividend date or when the Fund is informed of the ex-dividend date. Distributions of net investment income are declared and paid annually. Non-cash dividends included in dividend income, if any, are recorded at fair value. Investment income, realized and unrealized gains and losses, and fund-level expenses are allocated to each class based on relative average daily net assets, except that Class A Shares, Class B Shares, Class C Shares and Institutional Shares may bear certain account administration fees, distribution services fees, and shareholder services fees unique to those classes. For the year ended October 31, 2012, account administration fees for the Fund were as follows:
| Account
Administration
Fees Incurred |
| Class A Shares | $815 |
| Class C Shares | 96 |
| TOTAL | $911 |
Dividends are declared separately for each class. No class has preferential dividend rights; differences in per share dividend rates are generally due to differences in separate class expenses.
Premium and Discount Amortization
All premiums and discounts on fixed-income securities are amortized/accreted using the effective interest rate method.
Federal Taxes
It is the Fund's policy to comply with the Subchapter M provision of the Internal Revenue Code (the “Code”) and to distribute to shareholders each year substantially all of its income. Accordingly, no provision for federal income tax is necessary. As of and during the year ended October 31, 2012, the Fund did not have a liability for any uncertain tax positions. The Fund recognizes interest and penalties, if any, related to tax liabilities as income tax expense in the Statement of Operations. As of October 31, 2012, tax years 2009 through 2012 remain subject to examination by the Fund's major tax jurisdictions, which include the United States of America and the Commonwealth of Massachusetts.
The Fund may be subject to taxes imposed by governments of countries in which it invests. Such taxes are generally based on either income or gains earned or repatriated. The Fund accrues and applies such taxes to net investment income, net realized gains and net unrealized gains as income and/or gains are earned.
Annual Shareholder Report
When-Issued and Delayed Delivery Transactions
The Fund may engage in when-issued or delayed delivery transactions. The Fund records when-issued securities on the trade date and maintains security positions such that sufficient liquid assets will be available to make payment for the securities purchased. Securities purchased on a when-issued or delayed delivery basis are marked to market daily and begin earning interest on the settlement date. Losses may occur on these transactions due to changes in market conditions or the failure of counterparties to perform under the contract.
Futures Contracts
The Fund purchases and sells financial futures contracts to manage cash flows, enhance yield, manage duration and to potentially reduce transaction costs. Upon entering into a financial futures contract with a broker, the Fund is required to deposit in a segregated account a specified amount of cash or U.S. government securities. Futures contracts are valued daily and unrealized gains or losses are recorded in a “variation margin” account. Daily, the Fund receives from or pays to the broker a specified amount of cash based upon changes in the variation margin account. When a contract is closed, the Fund recognizes a realized gain or loss. Futures contracts have market risks, including the risk that the change in the value of the contract may not correlate with the changes in the value of the underlying securities. There is minimal counterparty risk to the Fund since futures are exchange traded and the exchange's clearinghouse, as counterparty to all exchange traded futures, guarantees the futures against default.
Futures contracts outstanding at period end are listed after the Fund's Portfolio of Investments.
The average notional value of futures contracts held by the Fund throughout the period was $162,109,260. This is based on amounts held as of each month-end throughout the fiscal period.
Foreign Exchange Contracts
The Fund enters into foreign exchange contracts for the delayed delivery of securities or foreign currency exchange transactions. The Fund also enters into foreign exchange contracts to protect assets against adverse changes in foreign currency exchange rates or exchange control regulations. Purchased contracts are used to acquire exposure to foreign currencies, whereas, contracts to sell are used to hedge the Fund's securities against currency fluctuations. Risks may arise upon entering into these transactions from the potential inability of counterparties to meet the terms of their commitments and from unanticipated movements in security prices or foreign exchange rates. The foreign exchange contracts are adjusted by the daily exchange rate of the underlying currency and any gains or losses are recorded for financial statement purposes as unrealized until the settlement date.
Foreign exchange contracts outstanding at period end are listed after the Fund's Portfolio of Investments.
The average value at settlement date payable and receivable of foreign exchange contracts purchased and sold by the Fund throughout the period was $256,974 and $245,103, respectively. This is based on the contracts held as of each month-end throughout the fiscal period.
Annual Shareholder Report
Foreign Currency Translation
The accounting records of the Fund are maintained in U.S. dollars. All assets and liabilities denominated in foreign currencies (FCs) are translated into U.S. dollars based on the rates of exchange of such currencies against U.S. dollars on the date of valuation. Purchases and sales of securities, income and expenses are translated at the rate of exchange quoted on the respective date that such transactions are recorded. The Fund does not isolate that portion of the results of operations resulting from changes in foreign exchange rates on investments from the fluctuations arising from changes in market prices of securities held. Such fluctuations are included with the net realized and unrealized gain or loss from investments.
Reported net realized foreign exchange gains or losses arise from sales of portfolio securities, sales and maturities of short-term securities, sales of FCs, currency gains or losses realized between the trade and settlement dates on securities transactions, the difference between the amounts of dividends, interest and foreign withholding taxes recorded on the Fund's books, and the U.S. dollar equivalent of the amounts actually received or paid. Net unrealized foreign exchange gains and losses arise from changes in the value of assets and liabilities other than investments in securities at fiscal year end, resulting from changes in the exchange rate.
Short Sales
In a short sale, the Fund sells a security it does not own in anticipation of a decline in the fair market value of the security. When the Fund sells a security short, it must borrow the security in order to deliver it at the completion of the sale. A gain, limited to the price at which the Fund sold the security short, or a loss, unlimited in size, will be recognized upon the termination of the short sale.
The Fund has an obligation to replace the borrowed security (e.g., to purchase the security at a future date and deliver it to the lender of the security). While the security is borrowed, the proceeds from the sale are deposited with the lender (“Prime Broker”). The Fund may incur two types of expenses from short sales: borrowing expenses and dividend expenses. Borrowing expenses may occur because the Fund may be obligated to pay fees to the Prime Broker on borrowed securities. This fee is normally based upon the market value of the borrowed security and is dependent upon the availability of the security. Dividend expenses may occur because the Fund has to pay the Prime Broker the equivalent of any dividends earned on the borrowed security.
Options Contracts
The Fund buys/sells put and call options for hedging and asset allocation purposes. The seller (writer) of an option receives a payment or premium, from the buyer, which the writer keeps regardless of whether the buyer exercises the option. When the Fund writes a put or call option, an amount equal to the premium received is recorded as a liability and subsequently marked to market to reflect the current value of the option written. Premiums received from writing options which expire are treated as realized gains. The Fund, as a writer of an option, bears the market risk of an unfavorable change in the price of the underlying reference instrument. When the Fund purchases a put or call option, an amount equal to the premium paid is recorded as an increase to the cost of the investment and subsequently marked to market to reflect the current value of the option purchased. Premiums paid for purchasing options which expire are treated as realized losses. Premiums received/paid for writing/purchasing options which are exercised or closed are added to the proceeds or offset against amounts paid on the underlying reference instrument to determine the realized gain or loss. The risk associated with purchasing put and call options is limited to the premium paid.
Annual Shareholder Report
Options can trade on securities or commodities exchanges. In this case, the exchange sets all the terms of the contract except for the price. Most exchanges require investors to maintain margin accounts through their brokers to cover their potential obligations to the exchange. This protects investors against potential defaults by the counterparty.
As of October 31, 2012, the Fund had no written options.
The average notional amount of purchased options held by the Fund throughout the period was $2,301,228. This is based on amounts held as of each month-end throughout the fiscal period.
Additional Disclosure Related to Derivative Instruments
| Fair Value of Derivative Instruments |
| Asset | Liability |
| Statement of
Assets and
Liabilities
Location | Fair
Value | Statement of
Assets and
Liabilities
Location | Fair
Value |
Derivatives not accounted for as
hedging instruments under ASC Topic 815 | | | | |
| Foreign exchange contracts | Unrealized
appreciation on
foreign exchange
contracts | $69,141 | Unrealized
depreciation on
foreign exchange
contracts | $111,766 |
| Equity contracts | Receivable for daily
variation margin | 3,480,089* | | |
| Total derivatives not accounted for as hedging instruments under ASC Topic 815 | | $3,549,230 | | $111,766 |
| * | Includes cumulative appreciation/depreciation of futures contracts as reported in the footnotes to the Portfolio of Investments. Only the current day's variation margin is reported within the Statement of Assets and Liabilities. |
The Effect of Derivative Instruments on the Statement of Operations for the Year Ended October 31, 2012
| Amount of Realized Gain or (Loss) on Derivatives Recognized in Income |
| Futures | Options
Purchased | Forward
Currency
Contracts | Total |
| Foreign exchange contracts | — | — | $362,810 | $362,810 |
| Equity contracts | $(34,817,146) | $(6,960,799) | — | $(41,777,945) |
| TOTAL | $(34,817,146) | $(6,960,799) | $362,810 | $(41,415,135) |
Annual Shareholder Report
| Change in Unrealized Appreciation or (Depreciation) on Derivatives Recognized in Income |
| Futures | Options
Purchased | Forward
Currency
Contracts | Total |
| Foreign exchange contracts | — | — | $266,479 | $266,479 |
| Equity contracts | $11,034,394 | $(563,710) | — | $10,470,684 |
| TOTAL | $11,034,394 | $(563,710) | $266,479 | $10,737,163 |
Other
The preparation of financial statements in conformity with GAAP requires management to make estimates and assumptions that affect the amounts of assets, liabilities, expenses and revenues reported in the financial statements. Actual results could differ from those estimated.
3. Shares of Beneficial Interest
The following tables summarize share activity:
| Year Ended October 31 | 2012 | 2011 |
| Class A Shares: | Shares | Amount | Shares | Amount |
| Shares sold | 4,810,028 | $46,861,027 | 8,630,781 | $84,887,631 |
| Shares issued to shareholders in payment of distributions declared | 124,430 | 1,219,414 | 1,346,469 | 12,993,419 |
| Shares redeemed | (12,534,096) | (121,562,765) | (29,987,177) | (294,437,644) |
NET CHANGE RESULTING FROM
CLASS A SHARE TRANSACTIONS | (7,599,638) | $(73,482,324) | (20,009,927) | $(196,556,594) |
| Year Ended October 31 | 2012 | 2011 |
| Class B Shares: | Shares | Amount | Shares | Amount |
| Shares sold | 164,326 | $1,582,242 | 304,314 | $2,966,672 |
| Shares issued to shareholders in payment of distributions declared | — | — | 213,595 | 2,059,058 |
| Shares redeemed | (2,662,288) | (25,701,229) | (4,759,643) | (46,365,265) |
NET CHANGE RESULTING FROM
CLASS B SHARE TRANSACTIONS | (2,497,962) | $(24,118,987) | (4,241,734) | $(41,339,535) |
| Year Ended October 31 | 2012 | 2011 |
| Class C Shares: | Shares | Amount | Shares | Amount |
| Shares sold | 2,329,992 | $22,546,089 | 2,967,206 | $28,805,208 |
| Shares issued to shareholders in payment of distributions declared | — | — | 658,323 | 6,319,898 |
| Shares redeemed | (7,832,252) | (74,998,971) | (19,045,424) | (184,966,666) |
NET CHANGE RESULTING FROM
CLASS C SHARE TRANSACTIONS | (5,502,260) | $(52,452,882) | (15,419,895) | $(149,841,560) |
Annual Shareholder Report
| Year Ended October 31 | 2012 | 2011 |
| Institutional Shares: | Shares | Amount | Shares | Amount |
| Shares sold | 5,827,229 | $57,003,296 | 7,390,304 | $72,764,774 |
| Shares issued to shareholders in payment of distributions declared | 59,894 | 588,763 | 305,669 | 2,961,931 |
| Shares redeemed | (6,450,851) | (62,807,633) | (17,769,379) | (175,104,192) |
| NET CHANGE RESULTING FROM INSTITUTIONAL SHARE TRANSACTIONS | (563,728) | $(5,215,574) | (10,073,406) | $(99,377,487) |
| NET CHANGE RESULTING FROM TOTAL FUND SHARE TRANSACTIONS | (16,163,588) | $(155,269,767) | (49,744,962) | $(487,115,176) |
4. Federal Tax Information
The timing and character of income and capital gain distributions are determined in accordance with income tax regulations, which may differ from GAAP. These differences are due to differing treatments for foreign currency transactions, passive foreign investment companies (PFICs), dividends paid on short positions, excise tax expense and regulatory settlement proceeds.
For the year ended October 31, 2012, permanent differences identified and reclassified among the components of net assets were as follows:
| Increase (Decrease) |
| Paid-In Capital | Undistributed
Net Investment
Income (Loss) | Accumulated
Net Realized
Gain (Loss) |
| $(42,187) | $1,612,823 | $(1,570,636) |
Net investment income (loss), net realized gains (losses), and net assets were not affected by this reclassification.
The tax character of distributions as reported on the Statement of Changes in Net Assets for the years ended October 31, 2012 and 2011, was as follows:
| 2012 | 2011 |
| Ordinary income | $2,209,247 | $32,328,488 |
As of October 31, 2012, the components of distributable earnings on a tax basis were as follows:
| Distributions in excess of ordinary income | $(2,065,164) |
| Net unrealized depreciation | $(28,214,113) |
| Capital loss carryforwards | $(427,450,623) |
The difference between book-basis and tax-basis net unrealized appreciation/depreciation is attributable to differing treatments for the deferral of losses on wash sales, defaulted bonds, partnerships and the realization for tax purposes of unrealized gains on PFICs.
At October 31, 2012, the cost of investments for federal tax purposes was $461,219,246. The net unrealized depreciation of investments for federal tax purposes excluding: a) any unrealized appreciation/depreciation resulting from the translation of FCs to U.S. dollars of assets and liabilities other than investments in securities, b) outstanding foreign currency
Annual Shareholder Report
commitments and c) futures contracts was $22,769,846. This consists of net unrealized appreciation from investments for those securities having an excess of value over cost of $15,235,568 and net unrealized depreciation from investments for those securities having an excess of cost over value of $38,005,414.
At October 31, 2012, the Fund had a capital loss carryforward of $427,450,623 which will reduce the Fund's taxable income arising from future net realized gains on investments, if any, to the extent permitted by the Code, thereby reducing the amount of distributions to shareholders which would otherwise be necessary to relieve the Fund of any liability for federal income tax. Pursuant to the Code, a net capital loss incurred in taxable years beginning on or before December 22, 2010, is characterized as short-term and may be carried forward for a maximum of eight tax years (“Carryforward Limit”), whereas a net capital loss incurred in taxable years beginning after December 22, 2010, retains its character as either short-term or long-term, does not expire and is required to be utilized prior to the losses which have a Carryforward Limit.
The following schedule summarizes the Fund's capital loss carryforwards and expiration years:
| Expiration Year | Short-Term | Long-Term | Total |
| No expiration | $13,929,642 | — | $13,929,642 |
| 2015 | $26,587,308 | NA | $26,587,308 |
| 2017 | $257,322,572 | NA | $257,322,572 |
| 2018 | $111,051,824 | NA | $111,051,824 |
| 2019 | $18,559,277 | NA | $18,559,277 |
Under current tax law, late-year ordinary loss realized after December 31 through the end of the Fund's fiscal year (“Late Year Ordinary Loss”) may be deferred, in whole or in part, and treated as occurring on the first day of the following fiscal year. As of October 31, 2012, for federal income tax purposes, a Late Year Ordinary Loss of $2,693,956 was deferred to November 1, 2012.
5. Investment Adviser Fee and Other Transactions with Affiliates
Investment Adviser Fee
The advisory agreement between the Fund and the Adviser provides for an annual fee equal to 0.75% of the Fund's average daily net assets. Subject to the terms described in the Expense Limitation note, the Adviser may voluntarily choose to waive any portion of its fee. For the year ended October 31, 2012, the Adviser voluntarily waived $447,760 of its fee.
Certain of the Fund's assets are managed by Federated Investment Management Company (the “Sub-Adviser”). Under the terms of a sub-adviser agreement between the Adviser and the Sub-Adviser, the Sub-Adviser receives an allocable portion of the Fund's adviser fee. The fee is paid by the Adviser out of its resources and is not an incremental Fund expense. For the year ended October 31, 2012, the Sub-Adviser earned a fee of $444,201.
Administrative Fee
Federated Administrative Services (FAS), under the Administrative Services Agreement, provides the Fund with administrative personnel and services. The fee paid to FAS is based on the average aggregate daily net assets of certain Federated funds as specified below, plus certain out-of-pocket expenses:
Annual Shareholder Report
| Administrative Fee | Average Aggregate Daily Net Assets
of the Federated Funds |
| 0.150% | on the first $5 billion |
| 0.125% | on the next $5 billion |
| 0.100% | on the next $10 billion |
| 0.075% | on assets in excess of $20 billion |
Prior to September 1, 2012, the administrative fee received during any fiscal year was at least $150,000 per portfolio and $40,000 per each additional class of Shares. Subject to the terms described in the Expense Limitation note, FAS may voluntarily choose to waive any portion of its fee. For the year ended October 31, 2012, FAS waived $8,782 of its fee. The net fee paid to FAS was 0.076% of average daily net assets of the Fund
Distribution Services Fee
The Fund has adopted a Distribution Plan (the “Plan”) pursuant to Rule 12b-1 under the Act. Under the terms of the Plan, the Fund will compensate Federated Securities Corp. (FSC), the principal distributor, from the daily net assets of the Fund's Class A Shares, Class B Shares and Class C Shares to finance activities intended to result in the sale of these shares. The Plan provides that the Fund may incur distribution expenses at the following percentages of average daily net assets annually, to compensate FSC:
| Share Class Name | Percentage of Average Daily
Net Assets of Class |
| Class A Shares | 0.05% |
| Class B Shares | 0.75% |
| Class C Shares | 0.75% |
Subject to the terms described in the Expense Limitation note, FSC may voluntarily choose to waive any portion of its fee. For the year ended October 31, 2012, distribution services fees for the Fund were as follows:
| Distribution
Services Fees
Incurred | Distribution
Services Fees
Waived |
| Class B Shares | $345,089 | $— |
| Class C Shares | 1,367,840 | (225) |
| TOTAL | $1,712,929 | $(225) |
When FSC receives fees, it may pay some or all of them to financial intermediaries whose customers purchase shares. For the year ended October 31, 2012, FSC retained $211,609 of fees paid by the Fund. For the year ended October 31, 2012, the Fund's Class A Shares did not incur a distribution services fee; however, it may begin to incur this fee upon approval of the Trustees.
Annual Shareholder Report
Sales Charges
Front-end sales charges and contingent deferred sales charges (CDSC) do not represent expenses of the Fund. They are deducted from the proceeds of sales of Fund shares prior to investment or from redemption proceeds prior to remittance, as applicable. For the year ended October 31, 2012, FSC retained $12,752 in sales charges from the sale of Class A Shares. FSC also retained $515, $14,189 and $16,764 of CDSC relating to redemptions of Class A Shares, Class B Shares and Class C shares, respectively.
Shareholder Services Fee
The Fund may pay fees (“Service Fees”) up to 0.25% of the average daily net assets of the Fund's Class A Shares, Class B Shares and Class C Shares to financial intermediaries or to Federated Shareholder Services Company (FSSC) for providing services to shareholders and maintaining shareholder accounts. Subject to the terms described in the Expense Limitation note, FSSC may voluntarily reimburse the Fund for Service Fees. For the year ended October 31, 2012, Service Fees for the Fund were as follows:
| Service Fees
Incurred |
| Class A Shares | $546,268 |
| Class B Shares | 115,029 |
| Class C Shares | 455,851 |
| TOTAL | $1,117,148 |
For the year ended October 31, 2012, FSSC received $4,212 of Service Fees paid by the Fund.
Expense Limitation
The Adviser and its affiliates (which may include FSC, FAS and FSSC) have voluntarily agreed to waive their fees and/or reimburse expenses so that the total annual fund operating expenses (as shown in the financial highlights excluding dividends and other expenses related to short sales) paid by the Fund's Class A Shares, Class B Shares, Class C Shares and Institutional Shares (after the voluntary waivers and reimbursements) will not exceed 1.24%, 1.99%, 1.99% and 0.99%, (the “Fee Limit”), respectively, up to but not including the later of (the “Termination Date”): (a) January 1, 2014; or (b) the date of the Fund's next effective Prospectus. While the Adviser and its affiliates currently do not anticipate terminating these arrangements prior to Termination Date, these arrangements may only be terminated or the Fee Limit increased prior to the Termination Date with the agreement of the Trustees.
General
Certain Officers and Trustees of the Fund are Officers and Directors or Trustees of the above companies.
Transactions Involving Affiliated Holdings
Affiliated holdings are mutual funds which are managed by the Adviser or an affiliate of the Adviser. The Adviser has agreed to reimburse the Fund for certain investment adviser fees as a result of transactions in other affiliated mutual funds. For the year ended October 31, 2012, the Adviser reimbursed $57,338. Transactions involving the affiliated holding during the year ended October 31, 2012, were as follows:
Annual Shareholder Report
| Federated
Prime Value
Obligations Fund,
Institutional Shares |
| Balance of Shares Held 10/31/2011 | $138,314,352 |
| Purchases/Additions | 451,710,063 |
| Sales/Reductions | (565,846,365) |
| Balance of Shares Held 10/31/2012 | 24,178,050 |
| Value | $24,178,050 |
| Dividend Income | $97,603 |
6. Investment Transactions
Purchases and sales of investments, excluding long-term U.S. government securities and short-term obligations, for the year ended October 31, 2012, were as follows:
| Purchases | $458,065,654 |
| Sales | $463,879,229 |
7. Line of Credit
The Fund participates in a $100,000,000 unsecured, uncommitted revolving line of credit (LOC) agreement with PNC Bank. The LOC was made available for extraordinary or emergency purposes, primarily for financing redemption payments. Borrowings are charged interest at a rate offered to the Fund by PNC Bank at the time of the borrowing. As of October 31, 2012, there were no outstanding loans. During the year ended October 31, 2012, the Fund did not utilize the LOC.
8. Interfund Lending
Pursuant to an Exemptive Order issued by the Securities and Exchange Commission, the Fund, along with other funds advised by subsidiaries of Federated Investors, Inc., may participate in an interfund lending program. This program provides an alternative credit facility allowing the Fund to borrow from other participating affiliated funds. As of October 31, 2012, there were no outstanding loans. During the year ended October 31, 2012, the program was not utilized.
9. Receivable from Bankruptcy Trustee
The amount presented on the Statement of Assets and Liabilities, under the caption Receivable for investments sold, includes $4,513,874 which represents the net realizable proceeds due from the bankruptcy trustee for certain security transactions executed through Lehman Brothers in 2008.
10. Federal Tax Information (unaudited)
For the fiscal year ended October 31, 2012, 100% of total ordinary income distributions made by the Fund are qualifying dividends which may be subject to a maximum tax rate of 15%, as provided for by the Jobs and Growth Tax Relief Act of 2003. Complete information is reported in conjunction with the reporting of your distributions on Form 1099-DIV.
Of the ordinary income distributions made by the Fund during the year ended October 31, 2012, 61.4% qualify for the dividend received deduction available to corporate shareholders.
Annual Shareholder Report
11. subsequent events
On December 14, 2012, a supplement to the Fund's prospectus and statement of additional information was filed to change the Fund's name to Federated Absolute Return Fund effective December 31, 2012.
Management has evaluated subsequent events through the date the financial statements were issued, and determined that no additional events have occurred that require disclosure.
Annual Shareholder Report
Report of Independent Registered Public Accounting Firm
TO THE BOARD OF TRUSTEES OF THE FEDERATED EQUITY FUNDS AND SHAREHOLDERS OF Federated prudent absolute return fund
We have audited the accompanying statement of assets and liabilities, including the portfolio of investments, of Federated Prudent Absolute Return Fund (Formerly, Federated Market Opportunity Fund) (the “Fund”), a portfolio of Federated Equity Funds, as of October 31, 2012, and the related statement of operations for the year then ended, the statements of changes in net assets for each of the years in the two-year period then ended and the financial highlights for each of the years in the five-year period then ended. These financial statements and financial highlights are the responsibility of the Fund's management. Our responsibility is to express an opinion on these financial statements and financial highlights based on our audits.
We conducted our audits in accordance with the standards of the Public Company Accounting Oversight Board (United States). Those standards require that we plan and perform the audit to obtain reasonable assurance about whether the financial statements and financial highlights are free of material misstatement. An audit includes examining, on a test basis, evidence supporting the amounts and disclosures in the financial statements. Our procedures included confirmation of securities owned as of October 31, 2012, by correspondence with the custodian, transfer agent and brokers, or by other appropriate auditing procedures. An audit also includes assessing the accounting principles used and significant estimates made by management, as well as evaluating the overall financial statement presentation. We believe that our audits provide a reasonable basis for our opinion.
In our opinion, the financial statements and financial highlights referred to above present fairly, in all material respects, the financial position of the Federated Prudent Absolute Return Fund as of October 31, 2012, and the results of its operations for the year then ended, the changes in its net assets for each of the years in the two-year period then ended and the financial highlights for each of the years in the five-year period then ended, in conformity with U.S. generally accepted accounting principles.
Boston, Massachusetts
December 24, 2012
Annual Shareholder Report
Shareholder Expense Example (unaudited)
As a shareholder of the Fund, you incur two types of costs: (1) transaction costs, including sales charges (loads) on purchase or redemption payments; and (2) ongoing costs, including management fees and to the extent applicable, distribution (12b-1) fees and/or shareholder services fees and other Fund expenses. This Example is intended to help you to understand your ongoing costs (in dollars) of investing in the Fund and to compare these costs with the ongoing costs of investing in other mutual funds. It is based on an investment of $1,000 invested at the beginning of the period and held for the entire period from May 1, 2012 to October 31, 2012.
ACTUAL EXPENSES
The first section of the table below provides information about actual account values and actual expenses. You may use the information in this section, together with the amount you invested, to estimate the expenses that you incurred over the period. Simply divide your account value by $1,000 (for example, an $8,600 account value divided by $1,000 = 8.6), then multiply the result by the number in the first section under the heading entitled “Expenses Paid During Period” to estimate the expenses attributable to your investment during this period.
HYPOTHETICAL EXAMPLE FOR COMPARISON PURPOSES
The second section of the table below provides information about hypothetical account values and hypothetical expenses based on the Fund's actual expense ratio and an assumed rate of return of 5% per year before expenses, which is not the Fund's actual return. Thus, you should not use the hypothetical account values and expenses to estimate the actual ending account balance or your expenses for the period. Rather, these figures are required to be provided to enable you to compare the ongoing costs of investing in the Fund with other funds. To do so, compare this 5% hypothetical example with the 5% hypothetical examples that appear in the shareholder reports of the other funds.
Annual Shareholder Report
Please note that the expenses shown in the table are meant to highlight your ongoing costs only and do not reflect any transaction costs, such as sales charges (loads) on purchase or redemption payments. Therefore, the second section of the table is useful in comparing ongoing costs only, and will not help you determine the relative total costs of owning different funds. In addition, if these transaction costs were included, your costs would have been higher.
| Beginning
Account Value
5/1/2012 | Ending
Account Value
10/31/2012 | Expenses Paid
During Period1 |
| Actual: | | | |
| Class A Shares | $1,000 | $983.40 | $6.18 |
| Class B Shares | $1,000 | $979.20 | $9.90 |
| Class C Shares | $1,000 | $980.10 | $9.90 |
| Institutional Shares | $1,000 | $985.60 | $4.94 |
Hypothetical (assuming a 5% return
before expenses): | | | |
| Class A Shares | $1,000 | $1,018.90 | $6.29 |
| Class B Shares | $1,000 | $1,015.13 | $10.08 |
| Class C Shares | $1,000 | $1,015.13 | $10.08 |
| Institutional Shares | $1,000 | $1,020.16 | $5.03 |
| 1 | Expenses are equal to the Fund's annualized net expense ratios, multiplied by the average account value over the period, multiplied by 184/366 (to reflect the one-half-year period). The annualized net expense ratios are as follows: |
| Class A Shares | 1.24% |
| Class B Shares | 1.99% |
| Class C Shares | 1.99% |
| Institutional Shares | 0.99% |
Annual Shareholder Report
Board of Trustees and Trust Officers
The Board of Trustees is responsible for managing the Trust's business affairs and for exercising all the Trust's powers except those reserved for the shareholders. The following tables give information about each Trustee and the senior officers of the Fund. Where required, the tables separately list Trustees who are “interested persons” of the Fund (i.e., “Interested” Trustees) and those who are not (i.e., “Independent” Trustees). Unless otherwise noted, the address of each person listed is Federated Investors Tower, 1001 Liberty Avenue, Pittsburgh, PA 15222. The address of all Independent Trustees listed is 4000 Ericsson Drive, Warrendale, PA 15086-7561; Attention: Mutual Fund Board. As of December 31, 2011, the Trust comprised 13 portfolio(s), and the Federated Fund Family consisted of 43 investment companies (comprising 134 portfolios). Unless otherwise noted, each Officer is elected annually. Unless otherwise noted, each Trustee oversees all portfolios in the Federated Fund Family and serves for an indefinite term. The Fund's Statement of Additional Information includes additional information about Trust Trustees and is available, without charge and upon request, by calling 1-800-341-7400.
Interested Trustees Background
Name
Birth Date
Positions Held with Trust
Date Service Began | Principal Occupation(s) for Past Five Years,
Other Directorships Held and Previous Position(s) |
John F. Donahue*
Birth Date: July 28, 1924
Trustee
Began serving: April 1984 | Principal Occupations: Director or Trustee of the Federated Fund Family; Chairman and Director, Federated Investors, Inc.; Chairman of the Federated Fund Family's Executive Committee.
Previous Positions: Chairman of the Federated Fund Family; Trustee, Federated Investment Management Company; Chairman and Director, Federated Investment Counseling. |
J. Christopher Donahue*
Birth Date: April 11, 1949
President and Trustee
Began serving: January 2000 | Principal Occupations: Principal Executive Officer and President of the Federated Fund Family; Director or Trustee of some of the Funds in the Federated Fund Family; President, Chief Executive Officer and Director, Federated Investors, Inc.; Chairman and Trustee, Federated Investment Management Company; Trustee, Federated Investment Counseling; Chairman and Director, Federated Global Investment Management Corp.; Chairman, Federated Equity Management Company of Pennsylvania and Passport Research, Ltd. (investment advisory subsidiary of Federated); Trustee, Federated Shareholder Services Company; Director, Federated Services Company.
Previous Positions: President, Federated Investment Counseling; President and Chief Executive Officer, Federated Investment Management Company, Federated Global Investment Management Corp. and Passport Research, Ltd. |
| * | Family relationships and reasons for “interested” status: John F. Donahue is the father of J. Christopher Donahue; both are “interested” due to their beneficial ownership of shares of Federated Investors, Inc. and the positions they hold with Federated and its subsidiaries. |
Annual Shareholder Report
INDEPENDENT Trustees Background
Name
Birth Date
Positions Held with Trust
Date Service Began | Principal Occupation(s) for Past Five Years,
Other Directorships Held, Previous Position(s) and Qualifications |
Nicholas P. Constantakis, CPA
Birth Date: September 3, 1939
Trustee
Began serving: February 1998 | Principal Occupation: Director or Trustee of the Federated Fund Family.
Other Directorship Held: Director, Chairman of the Audit Committee, and member of the Compensation Committee, Michael Baker Corporation (architecture, engineering and construction services).
Previous Position: Partner, Andersen Worldwide SC.
Qualifications: Public accounting and director experience. |
John F. Cunningham
Birth Date: March 5, 1943
Trustee
Began serving: January 1999 | Principal Occupation: Director or Trustee of the Federated Fund Family.
Other Directorships Held: Chairman, President and Chief Executive Officer, Cunningham & Co., Inc. (strategic business consulting); Trustee Associate, Boston College.
Previous Positions: Director, Redgate Communications and EMC Corporation (computer storage systems); Chairman of the Board and Chief Executive Officer, Computer Consoles, Inc.; President and Chief Operating Officer, Wang Laboratories; Director, First National Bank of Boston; Director, Apollo Computer, Inc.
Qualifications: Business management and director experience. |
Maureen Lally-Green
Birth Date: July 5, 1949
Trustee
Began serving: August 2009 | Principal Occupations: Director or Trustee of the Federated Fund Family; Director, Office of Church Relations, Diocese of Pittsburgh; Adjunct Professor of Law, Duquesne University School of Law.
Other Directorships Held: Director, Auberle; Member, Pennsylvania State Board of Education; Director, Saint Vincent College; Director, Ireland Institute of Pittsburgh; Chair and Director, UPMC Mercy Hospital; Regent, St. Vincent Seminary; Director, Epilepsy Foundation of Western and Central Pennsylvania; Director, Saint Thomas More Society, Allegheny County; Director, Our Campaign for the Church Alive, Inc.
Previous Position: Pennsylvania Superior Court Judge.
Qualifications: Legal and director experience. |
Peter E. Madden
Birth Date: March 16, 1942
Trustee
Began serving: November 1991 | Principal Occupation: Director or Trustee, and Chairman of the Board of Directors or Trustees, of the Federated Fund Family.
Previous Positions: Representative, Commonwealth of Massachusetts General Court; President, Chief Operating Officer and Director, State Street Bank and Trust Company and State Street Corporation (retired); Director, VISA USA and VISA International; Chairman and Director, Massachusetts Bankers Association; Director, Depository Trust Corporation; Director, The Boston Stock Exchange.
Qualifications: Business management, mutual fund services and director experience. |
Annual Shareholder Report
Name
Birth Date
Positions Held with Trust
Date Service Began | Principal Occupation(s) for Past Five Years,
Other Directorships Held, Previous Position(s) and Qualifications |
Charles F. Mansfield, Jr.
Birth Date: April 10, 1945
Trustee
Began serving: January 1999 | Principal Occupations: Director or Trustee of the Federated Fund Family; Management Consultant.
Previous Positions: Chief Executive Officer, PBTC International Bank; Partner, Arthur Young & Company (now Ernst & Young LLP); Chief Financial Officer of Retail Banking Sector, Chase Manhattan Bank; Senior Vice President, HSBC Bank USA (formerly Marine Midland Bank); Vice President, Citibank; Assistant Professor of Banking and Finance, Frank G. Zarb School of Business, Hofstra University; Executive Vice President, DVC Group, Inc. (marketing, communications and technology).
Qualifications: Banking, business management, education and director experience. |
Thomas M. O'Neill
Birth Date: June 14, 1951
Trustee
Began serving: October 2006 | Principal Occupations: Director or Trustee, Vice Chairman of the Audit Committee of the Federated Fund Family; Sole Proprietor, Navigator Management Company (investment and strategic consulting).
Other Directorships Held: Board of Overseers, Children's Hospital of Boston; Visiting Committee on Athletics, Harvard College; Board of Directors, Medicines for Humanity; Board of Directors, The Golisano Children's Museum of Naples, Florida.
Previous Positions: Chief Executive Officer and President, Managing Director and Chief Investment Officer, Fleet Investment Advisors; President and Chief Executive Officer, Aeltus Investment Management, Inc.; General Partner, Hellman, Jordan Management Co., Boston, MA; Chief Investment Officer, The Putnam Companies, Boston, MA; Credit Analyst and Lending Officer, Fleet Bank; Director and Consultant, EZE Castle Software (investment order management software); Director, Midway Pacific (lumber).
Qualifications: Business management, mutual fund, director and investment experience. |
John S. Walsh
Birth Date: November 28, 1957
Trustee
Began serving: January 1999 | Principal Occupations: Director or Trustee, Chairman of the Audit Committee of the Federated Fund Family; President and Director, Heat Wagon, Inc. (manufacturer of construction temporary heaters); President and Director, Manufacturers Products, Inc. (distributor of portable construction heaters); President, Portable Heater Parts, a division of Manufacturers Products, Inc.
Previous Position: Vice President, Walsh & Kelly, Inc.
Qualifications: Business management and director experience. |
Annual Shareholder Report
OFFICERS
Name
Birth Date
Address
Positions Held with Trust
Date Service Began | Principal Occupation(s) for Past Five Years
and Previous Position(s) |
John W. McGonigle
Birth Date: October 26, 1938
EXECUTIVE VICE PRESIDENT AND SECRETARY
Officer since: April 1984 | Principal Occupations: Executive Vice President and Secretary of the Federated Fund Family; Vice Chairman, Executive Vice President, Secretary and Director, Federated Investors, Inc.
Previous Positions: Trustee, Federated Investment Management Company and Federated Investment Counseling; Director, Federated Global Investment Management Corp., Federated Services Company and Federated Securities Corp. |
Richard A. Novak
Birth Date: December 25, 1963
TREASURER
Officer since: January 2006 | Principal Occupations: Principal Financial Officer and Treasurer of the Federated Fund Family; Senior Vice President, Federated Administrative Services; Financial and Operations Principal for Federated Securities Corp., Edgewood Services, Inc. and Southpointe Distribution Services, Inc.
Previous Positions: Controller of Federated Investors, Inc.; Vice President, Finance of Federated Services Company; held various financial management positions within The Mercy Hospital of Pittsburgh; Auditor, Arthur Andersen & Co. |
Richard B. Fisher
Birth Date: May 17, 1923
VICE PRESIDENT
Officer since: April 1984 | Principal Occupations: Vice Chairman or Vice President of some of the Funds in the Federated Fund Family; Vice Chairman, Federated Investors, Inc.; Chairman, Federated Securities Corp.
Previous Positions: President and Director or Trustee of some of the Funds in the Federated Fund Family; Executive Vice President, Federated Investors, Inc.; Director and Chief Executive Officer, Federated Securities Corp. |
Peter J. Germain
Birth Date: September 3, 1959
CHIEF LEGAL OFFICER
Officer since: January 2005 | Principal Occupations: Mr. Germain is Chief Legal Officer of the Federated Fund Family. He is General Counsel and Vice President, Federated Investors, Inc.; President, Federated Administrative Services and Federated Administrative Services, Inc.; Vice President, Federated Securities Corp.; Secretary, Federated Private Asset Management, Inc.; and Secretary, Retirement Plan Service Company of America. Mr. Germain joined Federated in 1984 and is a member of the Pennsylvania Bar Association.
Previous Positions: Deputy General Counsel, Special Counsel, Managing Director of Mutual Fund Services, Federated Investors, Inc.; Senior Vice President, Federated Services Company; and Senior Corporate Counsel, Federated Investors, Inc. |
Brian P. Bouda
Birth Date: February 28, 1947
CHIEF COMPLIANCE OFFICER AND SENIOR VICE PRESIDENT
Officer since: August 2004 | Principal Occupations: Senior Vice President and Chief Compliance Officer of the Federated Fund Family; Vice President and Chief Compliance Officer of Federated Investors, Inc. and Chief Compliance Officer of its subsidiaries. Mr. Bouda joined Federated in 1999 and is a member of the American Bar Association and the State Bar Association of Wisconsin. |
Annual Shareholder Report
Name
Birth Date
Address
Positions Held with Trust
Date Service Began | Principal Occupation(s) for Past Five Years
and Previous Position(s) |
Stephen F. Auth
Birth Date: September 3, 1956
450 Lexington Avenue
Suite 3700
New York, NY 10017-3943
CHIEF INVESTMENT OFFICER
Officer since: November 2002 | Principal Occupations: Mr. Auth is Chief Investment Officer of this Fund and various other Funds in the Federated Fund Family; Executive Vice President, Federated Investment Counseling, Federated Global Investment Management Corp. and Federated Equity Management Company of Pennsylvania.
Previous Positions: Executive Vice President, Federated Investment Management Company, and Passport Research, Ltd. (investment advisory subsidiary of Federated); Senior Vice President, Global Portfolio Management Services Division; Senior Vice President, Federated Investment Management Company and Passport Research, Ltd.; Senior Managing Director and Portfolio Manager, Prudential Investments. |
Dana L. Meissner
Birth Date: November 12, 1968
VICE PRESIDENT
Officer since: December 2012
Portfolio Manager since: February 2009 | Principal Occupations: Dana L. Meissner has been the Fund's Portfolio Manager since February 2009. He is Vice President of the Trust with respect to the Fund. Mr. Meissner, a Vice President of a Federated advisory subsidiary, joined Federated in May 2000 as an investment analyst and became senior investment analyst and assistant vice president in 2003. Mr. Meissner has received the Chartered Financial Analyst designation and is a member of the CFA Society of Pittsburgh. He received his MSIA from Carnegie Mellon University and M.S. and B.S. in Engineering from the University of Toledo. |
Annual Shareholder Report
Evaluation and Approval of Advisory Contract–May 2012
Federated Market Opportunity Fund (the “Fund”)
Following a review and recommendation of approval by the Fund's independent trustees, the Fund's Board reviewed and approved at its May 2012 meetings the Fund's investment advisory and subadvisory contracts for an additional one-year term. The Board's decision regarding these contracts reflects the exercise of its business judgment on whether to continue the existing arrangements.
In this connection, the Federated Funds' Board had previously appointed a Senior Officer, whose duties include specified responsibilities relating to the process by which advisory fees are to be charged to a Federated fund. The Senior Officer has the authority to retain consultants, experts, or staff as may be reasonably necessary to assist in the performance of his duties, reports directly to the Board, and may be terminated only with the approval of a majority of the independent members of the Board. The Senior Officer prepared and furnished to the Board an independent, written evaluation that covered topics discussed below (the “Evaluation”). The Board considered that Evaluation, along with other information, in deciding to approve the advisory and subadvisory contracts.
The Board is also familiar with and considered judicial decisions concerning allegedly excessive investment advisory fees, which have indicated that the following factors may be relevant to an Adviser's fiduciary duty with respect to its receipt of compensation from a fund: the nature and quality of the services provided by the Adviser to a fund and its shareholders, including the performance and expenses of the fund and of comparable funds; the Adviser's cost of providing the services, including the profitability to the Adviser of providing advisory services to a fund; the extent to which the Adviser may realize “economies of scale” as a fund grows larger and, if such economies exist, whether they have been shared with a fund and its shareholders; any “fall-out financial benefits” that accrue to the Adviser because of its relationship with a fund (including research services received from brokers that execute fund trades and any fees paid to affiliates of the Adviser for services rendered to a fund); comparative fee structures, including a comparison of fees paid to the Adviser with those paid by similar funds; and the extent to which the Board members are fully informed about all facts the Board deems relevant to its consideration of the Adviser's services and fees. Consistent with these judicial decisions, the Board also considered management fees (including any components thereof) charged to institutional and other clients of the Adviser and subadviser for what might be viewed as like services. The Board was aware of these factors and was guided by them in its review of the Fund's advisory and subadvisory contracts to the extent it considered them to be appropriate and relevant, as discussed further below.
Annual Shareholder Report
The Board considered and weighed these circumstances in light of its substantial accumulated experience in governing the Fund and working with Federated on matters relating to the Federated funds, and was assisted in its deliberations by independent legal counsel. Throughout the year, and in connection with its May meetings, the Board requested and received substantial and detailed information about the Fund and the Federated organization that was in addition to the extensive materials that comprise and accompany the Senior Officer's Evaluation. Federated provided much of this information at each regular meeting of the Board, and furnished additional substantial information in connection with the May meeting at which the Board's formal review of the advisory and subadvisory contracts occurred. At this May meeting, senior management of the Adviser also met with the independent trustees and their counsel to discuss the materials presented and any other matters thought relevant by the Adviser or the trustees. Between regularly scheduled meetings, the Board also received information on particular matters as the need arose. Thus, the Board's consideration of the advisory and subadvisory contracts included review of the Senior Officer's Evaluation, accompanying data and additional information covering such matters as: the Adviser's and subadviser's investment philosophy, revenue, profitability, personnel and processes; investment and operating strategies; the Fund's short- and long-term performance (in absolute terms, both on a gross basis and net of expenses, as well as in relationship to its particular investment program and certain competitor or “peer group” funds and/or other benchmarks, as appropriate), and comments on the reasons for performance; the Fund's investment objectives; the Fund's expenses (including the advisory fee itself and the overall expense structure of the Fund, both in absolute terms and relative to similar and/or competing funds, with due regard for contractual or voluntary expense limitations); the use and allocation of brokerage commissions derived from trading the Fund's portfolio securities (if any); and the nature, quality and extent of the advisory and other services provided to the Fund by the Adviser and its affiliates. The Board also considered the preferences and expectations of Fund shareholders; the entrepreneurial risk assumed by the Adviser in sponsoring the funds; the continuing state of competition in the mutual fund industry and market practices; the range of comparable fees for similar funds in the mutual fund industry; the Fund's relationship to the Federated family of funds which include a comprehensive array of funds with different investment objectives, policies and strategies which are available for exchange without the incurrence of additional sales charges; compliance and audit reports concerning the Federated funds and the Federated companies that service them (including communications from regulatory agencies), as well as Federated's responses to any issues raised therein; and relevant developments in the mutual fund industry and how the Federated
Annual Shareholder Report
funds and/or Federated are responding to them. The Board's evaluation process is evolutionary. The criteria considered and the emphasis placed on relevant criteria change in recognition of changing circumstances in the mutual fund marketplace.
While mindful that courts have cautioned against giving such comparisons too much weight, the Board has found the use of comparisons of the Fund's fees and expenses to other mutual funds with comparable investment programs to be relevant, given the high degree of competition in the mutual fund business. The Board focused on comparisons with other similar mutual funds more heavily than non-mutual fund products or services because it is believed that they are more relevant. For example, other mutual funds are the products most like the Fund, they are readily available to Fund shareholders as alternative investment vehicles, and they are the type of investment vehicle in fact chosen and maintained by the Fund's investors. The range of their fees and expenses therefore appears to be a generally reliable indication of what consumers have found to be reasonable in the precise marketplace in which the Fund competes. In this regard, the Senior Officer has reviewed Federated's fees for providing advisory services to products outside the Federated family of funds (e.g., institutional and separate accounts). He concluded that mutual funds and institutional accounts are inherently different products. Those differences include, but are not limited to, different types of targeted investors; being subject to different laws and regulations; different legal structures; different average account sizes; different associated costs; different portfolio management techniques made necessary by different cash flows; and portfolio manager time spent in review of securities pricing. The Senior Officer did not consider these fee schedules to be determinative in judging the appropriateness of mutual fund advisory contracts.
The Fund's ability to deliver competitive performance when compared to its peer group was also deemed to be relevant by the Board as a useful indicator of how the Adviser is executing the Fund's investment program, which in turn assisted the Board in reaching a conclusion that the nature, extent, and quality of the Adviser's investment management services were such as to warrant continuation of the advisory and subadvisory contracts.
The Senior Officer reviewed information compiled by Federated, using data supplied by independent fund ranking organizations, regarding the performance of, and fees charged by, other mutual funds, noting his view that comparisons to fund peer groups are relevant in judging the reasonableness of proposed fees.
For the periods covered by the Evaluation, the Fund's performance for the one-year period was above the median of the relevant peer group, and the Fund's performance fell below the median of the relevant peer group for the three-year and five-year period. The Board discussed the Fund's performance with the Adviser and recognized the efforts being undertaken by the Adviser. The Board will continue to monitor these efforts and the perfromance of the Fund.
Annual Shareholder Report
The Board also received financial information about Federated, including information regarding the compensation and benefits Federated derived from its relationships with the Federated funds. This information covered not only the fees under the advisory contracts, but also fees received by Federated's subsidiaries for providing other services to the Federated funds under separate contracts (e.g., for serving as the Federated funds' administrator). The information also detailed any indirect benefit Federated may derive from its receipt of research services from brokers who execute Federated fund trades. In addition, the Board considered the fact that, in order for a fund to be competitive in the marketplace, Federated and its affiliates frequently waived fees and/or reimbursed expenses and have disclosed to fund investors and/or indicated to the Board their intention to do so in the future, where appropriate. Moreover, the Board receives regular reporting as to the institution or elimination of these voluntary waivers.
Federated furnished information, requested by the Senior Officer, that reported revenues on a fund-by-fund basis and made estimates of the allocation of expenses on a fund-by-fund basis, using allocation methodologies specified by the Senior Officer. The Senior Officer noted that, although they may apply consistent allocation processes, the inherent difficulties in allocating costs (and the unavoidable arbitrary aspects of that exercise) and the lack of consensus on how to allocate those costs may render such allocation information unreliable. The allocation information was considered in the analysis by the Board but was determined to be of limited use.
The Board and the Senior Officer also reviewed information compiled by Federated comparing profitability information for Federated to other publicly held fund management companies. In this regard, the Senior Officer noted the limited availability of such information, but nonetheless concluded that Federated's profit margins did not appear to be excessive.
The Senior Officer's Evaluation also discussed the notion of possible realization of “economies of scale” as a fund grows larger. The Board considered in this regard that the Adviser has made significant and long-term investments in areas that support all of the Federated funds, such as personnel and processes for the portfolio management, shareholder services, compliance, internal audit, and risk management functions; and systems technology; and that the benefits of these efforts (as well as any economies, should they exist) were likely to be enjoyed by the fund complex as a whole. Finally, the Board also noted the absence of any applicable regulatory or industry guidelines on this subject, which (as discussed in the Senior Officer's Evaluation) is compounded by the lack of any common industry practice or general pattern with respect to structuring fund advisory fees with “breakpoints” that serve to reduce the fee as the fund attains a certain size. The Senior Officer did not recommend institution of breakpoints in pricing Federated's fund advisory services at this time.
Annual Shareholder Report
It was noted in the materials for the Board meeting that for the period covered by the Evaluation, the Fund's investment advisory fee, after waivers and expense reimbursements, if any, was below the median of the relevant peer group. The Board reviewed the fees and other expenses of the Fund with the Adviser and was satisfied that the overall expense structure of the Fund remained competitive.
The Senior Officer noted that, considering the totality of the circumstances, and all of the factors referenced within his Evaluation, he had concluded that, subject to comments and recommendations made within his Evaluation, his observations and the information accompanying the Evaluation supported a finding by the Board that the management fees for each of the funds was reasonable and that Federated appeared to provide appropriate advisory and administrative services to the Fund for the fees paid. Under these circumstances, no changes were recommended to, and no objection was raised to, the continuation of the Fund's advisory and subadvisory contracts.
In its decision to continue an existing investment advisory contract, the Board was mindful of the potential disruptions of the Fund's operations and various risks, uncertainties and other effects that could occur as a result of a decision to terminate or not renew an advisory contract. In particular, the Board recognized that many shareholders have invested in the Fund on the strength of the Adviser's industry standing and reputation and with the expectation that the Adviser will have a continuing role in providing advisory services to the Fund. Thus, the Board's approval of the advisory contract reflected the fact that it is the shareholders who have effectively selected the Adviser by virtue of having invested in the Fund. The Board concluded that, in light of the factors discussed above, including the nature, quality and scope of the services provided to the Fund by the Adviser and its affiliates, continuation of the advisory contract was appropriate.
The Board based its decision to approve the advisory and subadvisory contracts on the totality of the circumstances and relevant factors and with a view to past and future long-term considerations. Not all of the factors and considerations identified above were necessarily relevant to the Fund, nor did the Board consider any one of them to be determinative. With respect to the factors that were relevant, the Board's decision to approve the contract reflects its determination that Federated's performance and actions provided a satisfactory basis to support the decision to continue the existing arrangements.
Annual Shareholder Report
Voting Proxies on Fund Portfolio Securities
A description of the policies and procedures that the Fund uses to determine how to vote proxies, if any, relating to securities held in the Fund's portfolio is available, without charge and upon request, by calling 1-800-341-7400. A report on “Form N-PX” of how the Fund voted any such proxies during the most recent 12-month period ended June 30 is available from Federated's website at FederatedInvestors.com. To access this information from the home page, select “All” under “Asset Classes.” Select a fund name and share class, if applicable, to go to the Fund Overview page. On the Fund Overview page, select the “Documents” tab. At the bottom of that page, select “Proxy Voting Record Report (Form N-PX).” Form N-PX filings are also available at the SEC's website at www.sec.gov.
Quarterly Portfolio Schedule
The Fund files with the SEC a complete schedule of its portfolio holdings, as of the close of the first and third quarters of its fiscal year, on “Form N-Q.” These filings are available on the SEC's website at www.sec.gov and may be reviewed and copied at the SEC's Public Reference Room in Washington, DC. (Call 1-800-SEC-0330 for information on the operation of the Public Reference Room.) You may also access this information from the “Products” section of Federated's website at FederatedInvestors.com. From the home page, select “All” under “Asset Classes.” Select a fund name and share class, if applicable, to go to the Fund Overview page. On the Fund Overview page, select the “Documents” tab. At the bottom of that page, select “Form N-Q.”
Annual Shareholder Report
Mutual funds are not bank deposits or obligations, are not guaranteed by any bank and are not insured or guaranteed by the U.S. government, the Federal Deposit Insurance Corporation, the Federal Reserve Board or any other government agency. Investment in mutual funds involves investment risk, including the possible loss of principal.
This Report is authorized for distribution to prospective investors only when preceded or accompanied by the Fund's Prospectus, which contains facts concerning its objective and policies, management fees, expenses and other information.
Federated Prudent Absolute Return Fund
Federated Investors Funds
4000 Ericsson Drive
Warrendale, PA 15086-7561
Contact us at FederatedInvestors.com
or call 1-800-341-7400.
Federated Securities Corp., Distributor
CUSIP 314172743
CUSIP 314172735
CUSIP 314172727
CUSIP 314172453
26852 (12/12)
Federated is a registered trademark of Federated Investors, Inc.
2012 ©Federated Investors, Inc.
Annual Shareholder Report
October 31, 2012
| Share Class | Ticker |
| A | SVAAX |
| C | SVACX |
| Institutional | SVAIX |
Federated Strategic Value Dividend Fund
Fund Established 2005
A Portfolio of Federated Equity Funds
Dear Valued Shareholder,
I am pleased to present the Annual Shareholder Report for your fund covering the period from November 1, 2011 through October 31, 2012. This report includes Management's Discussion of Fund Performance, a complete listing of your fund's holdings, performance information and financial statements along with other important fund information.
In addition, our website, FederatedInvestors.com, offers easy access to Federated resources that include timely fund updates, economic and market insights from our investment strategists, and financial planning tools. We invite you to register to take full advantage of its capabilities.
Thank you for investing with Federated. I hope you find this information useful and look forward to keeping you informed.
Sincerely,
J. Christopher Donahue, President
Not FDIC Insured • May Lose Value • No Bank Guarantee
Management's Discussion of Fund Performance (unaudited)
The Fund's total return, based on net asset value, for the 12-month reporting period ended October 31, 2012, was 12.63% for the Class A Shares, 11.56% for the Class C Shares and 12.87% for the Institutional Shares. The total return of the Dow Jones Select Dividend Index (DJSDI),1 a broad-based securities market index that represents the dividend-paying universe, was 15.49% for the reporting period, while the total return of the Standard and Poor's 500 Index (S&P 500)2 was 15.21% for the same period. The Fund's total return for the fiscal year reflected actual cash flows, transaction costs and other expenses which were not reflected in the total return of the DJSDI or the S&P 500.
The following discussion will focus on the performance of the Fund's Institutional Shares.
MARKET OVERVIEW
The onset of the fiscal year was full of market-moving events, including a surprise easing move by China, progress on the European Union (EU) sovereign debt front and coordinated action by central banks to support the euro and global liquidity. Domestically, economic news was largely encouraging, as manufacturing and labor market data showed improvements. As 2011 wound to a close, consumer spending and sentiment both rose, and the year finished on a positive note. This optimistic tone carried over into the beginning of 2012, where stocks started strong out of the gate.
During the first quarter of 2012, equities continued to be driven higher by better-than-expected economic reports and further easing of euro-zone concerns. The Federal Reserve (“the Fed”) also contributed to the market's optimistic tone, as it hinted towards the possibility of a third round of quantitative easing (QE3).
The markets reversed course as the second quarter of 2012 began. Much of the major economic data disappointed as job growth slowed, jobless claims rose, business investment tailed off and the initial read on first quarter Gross Domestic Product (GDP) came in below expectations. There were some positives such as good corporate earnings and robust consumer spending, but the negative data points, combined with concerns about Europe, were enough to stall the equity market's sprint out of 2012's gate.
At mid-year, EU leaders defied expectations and agreed to the immediate and direct use of bailout funds to aid struggling European banks. The EU leaders' agreement also dictated that a central euro-zone authority would be created to oversee the region's banks. Even though the details of these measures still needed to be ironed out, the agreement reduced uncertainty in the markets and consequently catapulted stocks higher.
Annual Shareholder Report
Despite weakening economic reports, stocks continued to rise during the third quarter, driven largely by the Fed's actions. At its September meeting, the Fed unveiled QE3, which surprised in its magnitude. Unlike the past two rounds of quantitative easing, QE3 did not specify time limits or dollar limits to its actions. Thus, the move became known as “QE Infinity.” The Fed also extended its 0% target funds rate policy to at least mid-2015 from the previous late-2014 date.
The fiscal year ended with equity prices on a downward course, as multiple factors drove stocks lower. Domestically, corporate earnings were largely disappointing, and the upcoming US fiscal cliff increased investor anxiety. Elsewhere, the euro zone was battling through a recession and China was experiencing a slowdown.
FUND PERFORMANCE
The Fund pursues high dividend income and moderate dividend growth while targeting less risk in order to enhance absolute performance over time. The Fund did well to accomplish its objectives during the reporting period, starting with its high yield.3 The Fund ended the reporting period with a gross dividend yield of 4.9% and a 30-day SEC yield of 3.9%.4 The Fund's gross yield was well above that of both the S&P 500 at 2.3% and the DJSDI at 4.0%. Additionally, dividend growth was strong during the reporting period, as the Fund's holdings experienced 30 dividend increases and 1 special dividend. Within the portfolio, companies announcing some of the highest dividend increases included: Lorillard, Chevron, Phillip Morris International and McDonalds, each raising their dividends by 19.2%, 11.1%, 10.4% and 10.0%, respectively. The special dividend came courtesy of GlaxoSmithKline PLC, following the sale of several of the company's non-core, over-the-counter brands. The Fund did experience one dividend cut from Telefonica SA, which was sold out of the portfolio in May. Despite the cut, dividend growth was still very strong for the fiscal year, as dividend income rose substantially. Year-over-year dividend income rose 16.3%.
Every sector within the portfolio contributed positively to the Fund's total return. The largest contributions came from the Health Care and Consumer Staples sectors, which returned 17.8% and 14.9%, respectively. These non-cyclical, dividend-friendly sectors were led by Abbott Laboratories (+38.1%) and Philip Morris International Inc. (+31.6%).
While all sectors contributed positively to total return, some individual stocks did post declines. To the detriment of the portfolio, its one previously-held Spanish stock, Telefonica SA (-32.9%), contributed negatively to returns, but this was more than offset by the positive contributions of the portfolio's other foreign holdings.5 Domestic holdings that also declined in the period included Windstream (-14.0%) and Exelon (-7.2%).
Annual Shareholder Report
In a year marked by dramatic swings in investor preferences, the Fund was steadfast in its pursuit of high dividend income and dividend growth. As a result, the Fund's performance did not track closely to any benchmark for the period. This was evidenced by the Fund's low beta of 0.54 versus the S&P 500 for the trailing 3 years.6 This low beta showed that the Fund did not move lock-step with the market, typically falling less in times of market distress and rising less during sharp market rallies characterized by investor preferences for low-quality, low-yielding stocks as evidenced by the reporting period.
| 1 | The DJSDI is a dividend-weighted index intended to represent the 100 stocks in the Dow Jones U.S. Total Market Index that have the highest indicated annual dividend yield. The index is unmanaged, and it is not possible to invest directly in an index. |
| 2 | The S&P 500 is a capitalization-weighted index of 500 stocks designed to measure performance of the broad domestic economy through changes in the aggregate market value of 500 stocks representing all major industries. The index is unmanaged, and it is not possible to invest directly in an index. |
| 3 | There are no guarantees that dividend paying stocks will continue to pay dividends. In addition, dividend paying stocks may not experience the same capital appreciation potential as non-dividend paying stocks. |
| 4 | In the absence of temporary expense waivers and reimbursements, the 30-day SEC yield would have been 3.73%. The dividend yield represents the average yield of the underlying securities within the portfolio. |
| 5 | International investing involves special risks, including currency risk, increased volatility, political risks, and differences in auditing and other financial standards. |
| 6 | Beta measures a portfolio's volatility relative to the market. A Beta greater than 1.00 suggests the portfolio has historically been more volatile than the market as measured by the fund's benchmark. A Beta less than 1.00 suggests the portfolio has historically had less volatility relative to the market. |
Annual Shareholder Report
FUND PERFORMANCE AND GROWTH OF A $10,000 INVESTMENT
The Average Annual Total Return table below shows returns for each class averaged over the stated periods. The graphs below illustrate the hypothetical investment of $10,0001 in the Federated Strategic Value Dividend Fund (the “Fund”) from March 30, 2005 (start of performance) to October 31, 2012, compared to the Standard & Poor's Index (S&P 500)2 and the Dow Jones Select Dividend Index (DJSDI).2
Average Annual Total Returns for the Period Ended 10/31/2012
(returns reflect all applicable sales charges and contingent sales charge as specified below in footnote #1)
| Share Class | 1 Year | 5 Years | Start of
Performance* |
| Class A Shares | 6.50% | -0.40% | 4.50% |
| Class C Shares | 10.56% | -0.04% | 4.51% |
| Institutional Shares | 12.87% | 0.97% | 5.54% |
| * | The Fund's start of performance date was March 30, 2005. |
Performance data quoted represents past performance which is no guarantee of future results. Investment return and principal value will fluctuate so that an investor's shares, when redeemed, may be worth more or less than their original cost. Mutual fund performance changes over time and current performance may be lower or higher than what is stated. For current to the most recent month-end performance and after-tax returns, visit FederatedInvestors.com or call 1-800-341-7400. Returns shown do not reflect the deduction of taxes that a shareholder would pay on Fund distributions or the redemption of Fund shares. Mutual funds are not obligations of or guaranteed by any bank and are not federally insured.
Annual Shareholder Report
Growth of a $10,000 Investment–Class A shares

| Federated Strategic Value Dividend Fund - Class A Shares | C000026746 | S&P 500 | DJSDI |
| 3/30/2005 | 9,450 | 10,000 | 10,000 |
| 10/31/2005 | 10,029 | 10,320 | 9,322 |
| 10/31/2006 | 12,588 | 12,008 | 10,795 |
| 10/31/2007 | 13,463 | 13,756 | 11,359 |
| 10/31/2008 | 9,407 | 8,791 | 8,179 |
| 10/31/2009 | 9,436 | 9,652 | 7,496 |
| 10/31/2010 | 11,119 | 11,246 | 9,244 |
| 10/31/2011 | 12,398 | 12,156 | 10,440 |
| 10/31/2012 | 13,964 | 14,004 | 12,062 |
41 graphic description end -->
| ■ | Total returns shown include the maximum sales charge of 5.50% ($10,000 investment minus $550 sales charge = $9,450). |
Growth of a $10,000 Investment–Class C shares
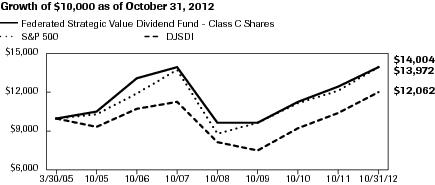
| Federated Strategic Value Dividend Fund - Class C Shares | C000026747 | S&P 500 | DJSDI |
| 3/30/2005 | 10,000 | 10,000 | 10,000 |
| 10/31/2005 | 10,592 | 10,320 | 9,322 |
| 10/31/2006 | 13,191 | 12,008 | 10,795 |
| 10/31/2007 | 14,003 | 13,756 | 11,359 |
| 10/31/2008 | 9,722 | 8,791 | 8,179 |
| 10/31/2009 | 9,655 | 9,652 | 7,496 |
| 10/31/2010 | 11,317 | 11,246 | 9,244 |
| 10/31/2011 | 12,524 | 12,156 | 10,440 |
| 10/31/2012 | 13,972 | 14,004 | 12,062 |
41 graphic description end -->
| ■ | Total returns shown include the maximum contingent deferred sales charge of 1.00%, as applicable. |
Annual Shareholder Report
Growth of a $10,000 Investment–institutional Shares
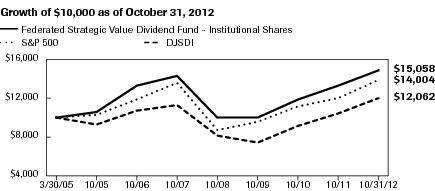
| Federated Strategic Value Dividend Fund - Institutional Shares | C000026748 | S&P 500 | DJSDI |
| 3/30/2005 | 10,000 | 10,000 | 10,000 |
| 10/31/2005 | 10,645 | 10,320 | 9,322 |
| 10/31/2006 | 13,388 | 12,008 | 10,795 |
| 10/31/2007 | 14,352 | 13,756 | 11,359 |
| 10/31/2008 | 10,057 | 8,791 | 8,179 |
| 10/31/2009 | 10,113 | 9,652 | 7,496 |
| 10/31/2010 | 11,967 | 11,246 | 9,244 |
| 10/31/2011 | 13,341 | 12,156 | 10,440 |
| 10/31/2012 | 15,058 | 14,004 | 12,062 |
41 graphic description end -->
| 1 | Represents a hypothetical investment of $10,000 in the Fund after deducting applicable sales charges: For Class A Shares, the maximum sales charge of 5.50% ($10,000 investment minus $550 sales charge = $9,450); for Class C Shares, a 1.00% contingent deferred sales charge would be applied on any redemption less than one year from the purchase date. The Fund's performance assumes the reinvestment of all dividends and distributions. The S&P 500 and DJSDI have been adjusted to reflect reinvestment of dividends on securities in the indexes. |
| 2 | The S&P 500 is a capitalization-weighted index of 500 stocks designed to measure performance of the broad domestic economy through changes in the aggregate market value of 500 stocks representing all major industries. The DJSDI is a dividend-weighted index intended to represent the 100 stocks in the Dow Jones U.S. Total Market Index that have the highest indicated annual dividend yield. The S&P 500 and the DJSDI are not adjusted to reflect sales loads, expenses or other fees that the Securities and Exchange Commission requires to be reflected in the Fund's performance. The indexes are unmanaged and, unlike the Fund, are not affected by cash flows. It is not possible to invest in an index. |
Annual Shareholder Report
Portfolio of Investments Summary Table (unaudited)
At October 31, 2012, the Fund's sector composition1 was as follows:
| Sector Composition | Percentage of
Total Net Assets |
| Consumer Staples | 25.3% |
| Utilities | 22.2% |
| Health Care | 20.4% |
| Telecommunication Services | 17.9% |
| Energy | 12.4% |
| Consumer Discretionary | 0.9% |
| Cash Equivalents2 | 0.6% |
| Other Assets and Liabilities—Net3 | 0.3% |
| TOTAL | 100.0% |
| 1 | Except for Cash Equivalents and Other Assets and Liabilities, sector classifications are based upon, and individual portfolio securities are assigned to, the classifications of the Global Industry Classification Standard (GICS) except that the Adviser assigns a classification to securities not classified by the GICS and to securities for which the Adviser does not have access to the classification made by the GICS. |
| 2 | Cash Equivalents include any investments in money market mutual funds and/or overnight repurchase agreements. |
| 3 | Assets, other than investments in securities, less liabilities. See Statement of Assets and Liabilities.
|
Annual Shareholder Report
Portfolio of Investments
October 31, 2012
| Shares | | | Value |
| | COMMON STOCKS—99.1% | |
| | Consumer Discretionary—0.9% | |
| 681,055 | | McDonald's Corp. | $59,115,574 |
| | Consumer Staples—25.3% | |
| 8,288,845 | | Altria Group, Inc. | 263,585,271 |
| 1,716,100 | | General Mills, Inc. | 68,781,288 |
| 2,546,170 | | H.J. Heinz Co. | 146,430,237 |
| 3,283,200 | | Kellogg Co. | 171,777,024 |
| 1,617,600 | | Kimberly-Clark Corp. | 134,988,720 |
| 3,328,200 | 1 | Kraft Foods Group, Inc. | 151,366,536 |
| 1,007,500 | | Lorillard, Inc. | 116,880,075 |
| 1,637,700 | | PepsiCo, Inc. | 113,394,348 |
| 795,455 | | Philip Morris International, Inc. | 70,445,495 |
| 2,266,030 | | Procter & Gamble Co. | 156,899,917 |
| 5,791,227 | | Reynolds American, Inc. | 241,146,692 |
| 838,050 | | The Coca-Cola Co. | 31,158,699 |
| 1,847,567 | | Unilever PLC | 68,902,688 |
| | TOTAL | 1,735,756,990 |
| | Energy—12.4% | |
| 488,225 | | Chevron Corp. | 53,807,277 |
| 5,150,280 | | ConocoPhillips | 297,943,698 |
| 8,183,360 | | Royal Dutch Shell PLC, Class B | 289,275,025 |
| 4,186,080 | | Total SA | 210,628,977 |
| | TOTAL | 851,654,977 |
| | Health Care—20.4% | |
| 6,278,240 | | AstraZeneca PLC | 291,534,039 |
| 6,968,770 | | Bristol-Myers Squibb Co. | 231,711,602 |
| 4,224,295 | | Eli Lilly & Co. | 205,427,466 |
| 13,837,773 | | GlaxoSmithKline PLC | 309,615,077 |
| 3,004,485 | | Johnson & Johnson | 212,777,628 |
| 3,324,035 | | Merck & Co., Inc. | 151,675,717 |
| | TOTAL | 1,402,741,529 |
| | Telecommunication Services—17.9% | |
| 6,173,465 | | AT&T, Inc. | 213,540,154 |
| 2,485,910 | | BCE, Inc. | 108,670,669 |
| 6,514,480 | | CenturyLink, Inc. | 250,025,742 |
| 6,559,250 | | Verizon Communications, Inc. | 292,804,920 |
Annual Shareholder Report
| Shares | | | Value |
| | COMMON STOCKS—continued | |
| | Telecommunication Services—continued | |
| 103,937,864 | | Vodafone Group PLC | $282,205,118 |
| 8,297,985 | | Windstream Corp. | 79,162,777 |
| | TOTAL | 1,226,409,380 |
| | Utilities—22.2% | |
| 2,088,015 | | American Electric Power Co., Inc. | 92,791,386 |
| 482,715 | | Dominion Resources, Inc. | 25,477,698 |
| 3,838,859 | | Duke Energy Corp. | 252,174,648 |
| 5,693,800 | | Exelon Corp. | 203,724,164 |
| 23,646,244 | | National Grid PLC | 269,594,084 |
| 7,573,905 | | PPL Corp. | 224,036,110 |
| 3,729,500 | | Pepco Holdings, Inc. | 74,105,165 |
| 9,270,070 | | SSE PLC | 216,614,538 |
| 3,564,018 | | Southern Co. | 166,938,603 |
| | TOTAL | 1,525,456,396 |
| | TOTAL COMMON STOCKS
(IDENTIFIED COST $6,093,577,567) | 6,801,134,846 |
| | MUTUAL FUND—0.6% | |
| 42,309,666 | 2,3 | Federated Prime Value Obligations Fund, Institutional Shares, 0.16%
(AT NET ASSET VALUE) | 42,309,666 |
| | TOTAL INVESTMENTS—99.7%
(IDENTIFIED COST $6,135,887,233)4 | 6,843,444,512 |
| | OTHER ASSETS AND LIABILITIES - NET—0.3%5 | 18,415,119 |
| | TOTAL NET ASSETS—100% | $6,861,859,631 |
| 1 | Non-income producing security. |
| 2 | Affiliated holding. |
| 3 | 7-Day net yield. |
| 4 | Also represents cost for federal tax purposes. |
| 5 | Assets, other than investments in securities, less liabilities. See Statement of Assets and Liabilities. |
Note: The categories of investments are shown as a percentage of total net assets at October 31, 2012.
Annual Shareholder Report
Various inputs are used in determining the value of the Fund's investments. These inputs are summarized in the three broad levels listed below:
Level 1—quoted prices in active markets for identical securities, including investment companies with daily net asset values, if applicable.
Level 2—other significant observable inputs (including quoted prices for similar securities, interest rates, prepayment speeds, credit risk, etc.). Also includes securities valued at amortized cost.
Level 3—significant unobservable inputs (including the Fund's own assumptions in determining the fair value of investments).
The inputs or methodology used for valuing securities are not an indication of the risk associated with investing in those securities.
As of October 31, 2012, all investments of the Fund utilized Level 1 inputs in valuing the Fund's assets carried at fair value. Includes $1,132,371,647 of securities transferred from Level 2 to Level 1 because quoted prices on equity securities traded principally in foreign markets were utilized to value securities for which fair value factors were previously applied to account for significant post market close activity. Transfers shown represent the value of the securities at the beginning of the period.
See Notes which are an integral part of the Financial Statements
Annual Shareholder Report
Financial Highlights–Class A Shares
(For a Share Outstanding Throughout Each Period)
| Year Ended October 31 | 2012 | 2011 | 2010 | 2009 | 2008 |
| Net Asset Value, Beginning of Period | $4.69 | $4.36 | $3.85 | $4.01 | $6.36 |
| Income From Investment Operations: | | | | | |
| Net investment income | 0.19 | 0.171 | 0.161 | 0.15 | 0.27 |
| Net realized and unrealized gain (loss) on investments and foreign currency transactions | 0.39 | 0.32 | 0.51 | (0.15) | (2.05) |
| TOTAL FROM INVESTMENT OPERATIONS | 0.58 | 0.49 | 0.67 | — | (1.78) |
| Less Distributions: | | | | | |
| Distributions from net investment income | (0.19) | (0.16) | (0.16) | (0.16) | (0.28) |
| Distributions from net realized gain on investments and foreign currency transactions | — | — | — | — | (0.29) |
| TOTAL DISTRIBUTIONS | (0.19) | (0.16) | (0.16) | (0.16) | (0.57) |
| Net Asset Value, End of Period | $5.08 | $4.69 | $4.36 | $3.85 | $4.01 |
| Total Return2 | 12.63% | 11.50% | 17.83% | 0.31% | (30.13)% |
| Ratios to Average Net Assets: | | | | | |
| Net expenses | 1.05%3 | 1.05%3 | 1.05%3 | 1.04%3 | 1.00%3 |
| Net investment income | 3.83% | 3.67% | 3.98% | 4.38% | 5.14% |
| Expense waiver/reimbursement4 | 0.14% | 0.14% | 0.19% | 0.20% | 0.25% |
| Supplemental Data: | | | | | |
| Net assets, end of period (000 omitted) | $1,531,723 | $992,799 | $439,433 | $358,589 | $249,725 |
| Portfolio turnover | 20% | 17% | 20% | 42% | 48% |
| 1 | Per share numbers have been calculated using the average shares method. |
| 2 | Based on net asset value, which does not reflect the sales charge, redemption fee or contingent deferred sales charge, if applicable. |
| 3 | The net expense ratio is calculated without reduction for expense offset arrangements. The net expense ratios are 1.05%, 1.05%, 1.04%, 1.04% and 1.00%, for the years ended October 31, 2012, 2011, 2010, 2009 and 2008, respectively, after taking into account these expense reductions. |
| 4 | This expense decrease is reflected in both the net expense and the net investment income ratios shown above. |
See Notes which are an integral part of the Financial Statements
Annual Shareholder Report
Financial Highlights–Class C Shares
(For a Share Outstanding Throughout Each Period)
| Year Ended October 31 | 2012 | 2011 | 2010 | 2009 | 2008 |
| Net Asset Value, Beginning of Period | $4.70 | $4.37 | $3.85 | $4.02 | $6.37 |
| Income From Investment Operations: | | | | | |
| Net investment income | 0.15 | 0.131 | 0.131 | 0.13 | 0.23 |
| Net realized and unrealized gain (loss) on investments and foreign currency transactions | 0.38 | 0.33 | 0.52 | (0.17) | (2.05) |
| TOTAL FROM INVESTMENT OPERATIONS | 0.53 | 0.46 | 0.65 | (0.04) | (1.82) |
| Less Distributions: | | | | | |
| Distributions from net investment income | (0.15) | (0.13) | (0.13) | (0.13) | (0.24) |
| Distributions from net realized gain on investments and foreign currency transactions | — | — | — | — | (0.29) |
| TOTAL DISTRIBUTIONS | (0.15) | (0.13) | (0.13) | (0.13) | (0.53) |
| Net Asset Value, End of Period | $5.08 | $4.70 | $4.37 | $3.85 | $4.02 |
| Total Return2 | 11.56% | 10.67% | 17.21% | (0.69)% | (30.57)% |
| Ratios to Average Net Assets: | | | | | |
| Net expenses | 1.80%3 | 1.80%3 | 1.80%3 | 1.79%3 | 1.75%3 |
| Net investment income | 3.05% | 2.95% | 3.22% | 3.65% | 4.44% |
| Expense waiver/reimbursement4 | 0.14% | 0.14% | 0.19% | 0.20% | 0.25% |
| Supplemental Data: | | | | | |
| Net assets, end of period (000 omitted) | $667,700 | $328,987 | $173,394 | $123,604 | $112,894 |
| Portfolio turnover | 20% | 17% | 20% | 42% | 48% |
| 1 | Per share numbers have been calculated using the average shares method. |
| 2 | Based on net asset value, which does not reflect the sales charge, redemption fee or contingent deferred sales charge, if applicable. |
| 3 | The net expense ratio is calculated without reduction for expense offset arrangements. The net expense ratios are 1.80%, 1.80%, 1.80%, 1.78% and 1.75%, for the years ended October 31, 2012, 2011, 2010, 2009 and 2008, respectively, after taking into account these expense reductions. |
| 4 | This expense decrease is reflected in both the net expense and the net investment income ratios shown above. |
See Notes which are an integral part of the Financial Statements
Annual Shareholder Report
Financial Highlights–Institutional Shares
(For a Share Outstanding Throughout Each Period)
| Year Ended October 31 | 2012 | 2011 | 2010 | 2009 | 2008 |
| Net Asset Value, Beginning of Period | $4.70 | $4.38 | $3.86 | $4.02 | $6.37 |
| Income From Investment Operations: | | | | | |
| Net investment income | 0.20 | 0.181 | 0.171 | 0.17 | 0.28 |
| Net realized and unrealized gain (loss) on investments and foreign currency transactions | 0.39 | 0.31 | 0.52 | (0.16) | (2.05) |
| TOTAL FROM INVESTMENT OPERATIONS | 0.59 | 0.49 | 0.69 | 0.01 | (1.77) |
| Less Distributions: | | | | | |
| Distributions from net investment income | (0.20) | (0.17) | (0.17) | (0.17) | (0.29) |
| Distributions from net realized gain on investments and foreign currency transactions | — | — | — | — | (0.29) |
| TOTAL DISTRIBUTIONS | (0.20) | (0.17) | (0.17) | (0.17) | (0.58) |
| Net Asset Value, End of Period | $5.09 | $4.70 | $4.38 | $3.86 | $4.02 |
| Total Return2 | 12.87% | 11.48% | 18.34% | 0.55% | (29.92)% |
| Ratios to Average Net Assets: | | | | | |
| Net expenses | 0.80%3 | 0.80%3 | 0.80%3 | 0.80%3 | 0.75%3 |
| Net investment income | 4.11% | 3.89% | 4.14% | 4.59% | 5.67% |
| Expense waiver/reimbursement4 | 0.14% | 0.14% | 0.19% | 0.19% | 0.25% |
| Supplemental Data: | | | | | |
| Net assets, end of period (000 omitted) | $4,662,436 | $3,263,920 | $1,340,561 | $383,503 | $176,187 |
| Portfolio turnover | 20% | 17% | 20% | 42% | 48% |
| 1 | Per share numbers have been calculated using the average shares method. |
| 2 | Based on net asset value. |
| 3 | The net expense ratio is calculated without reduction for expense offset arrangements. The net expense ratios are 0.80%, 0.80%, 0.80%, 0.80% and 0.75%, for the years ended October 31, 2012, 2011, 2010, 2009 and 2008, respectively, after taking into account these expense reductions. |
| 4 | This expense decrease is reflected in both the net expense and the net investment income ratios shown above. |
See Notes which are an integral part of the Financial Statements
Annual Shareholder Report
Statement of Assets and Liabilities
October 31, 2012
| Assets: | | |
| Total investment in securities, at value including $42,309,666 of investment in an affiliated holding (Note 5) (identified cost $6,135,887,233) | | $6,843,444,512 |
| Cash denominated in foreign currencies (identified cost $11,919) | | 12,106 |
| Income receivable | | 15,080,982 |
| Receivable for shares sold | | 21,327,561 |
| TOTAL ASSETS | | 6,879,865,161 |
| Liabilities: | | |
| Payable for shares redeemed | $12,107,323 | |
| Income distribution payable | 3,346,932 | |
| Payable for transfer and dividend disbursing agent fees and expenses | 883,582 | |
| Payable for distribution services fee (Note 5) | 420,905 | |
| Payable for shareholder services fee (Note 5) | 988,630 | |
| Accrued expenses | 258,158 | |
| TOTAL LIABILITIES | | 18,005,530 |
| Net assets for 1,348,396,998 shares outstanding | | $6,861,859,631 |
| Net Assets Consist of: | | |
| Paid-in capital | | $6,268,788,584 |
| Net unrealized appreciation of investments and translation of assets and liabilities in foreign currency | | 707,558,030 |
| Accumulated net realized loss on investments and foreign currency transactions | | (116,474,459) |
| Undistributed net investment income | | 1,987,476 |
| TOTAL NET ASSETS | | $6,861,859,631 |
| Net Asset Value, Offering Price and Redemption Proceeds Per Share | | |
| Class A Shares: | | |
| Net asset value per share ($1,531,722,769 ÷ 301,726,086 shares outstanding), no par value, unlimited shares authorized | | $5.08 |
| Offering price per share (100/94.50 of $5.08) | | $5.38 |
| Redemption proceeds per share | | $5.08 |
| Class C Shares: | | |
| Net asset value per share ($667,700,393 ÷ 131,329,682 shares outstanding), no par value, unlimited shares authorized | | $5.08 |
| Offering price per share | | $5.08 |
| Redemption proceeds per share (99.00/100 of $5.08) | | $5.03 |
| Institutional Shares: | | |
| Net asset value per share ($4,662,436,469 ÷ 915,341,230 shares outstanding), no par value, unlimited shares authorized | | $5.09 |
| Offering price per share | | $5.09 |
| Redemption proceeds per share | | $5.09 |
See Notes which are an integral part of the Financial Statements
Annual Shareholder Report
Statement of Operations
Year Ended October 31, 2012
| Investment Income: | | | |
| Dividends (including $133,902 received from an affiliated holding (Note 5) and net of foreign taxes withheld of $4,285,573) | | | $294,042,311 |
| Expenses: | | | |
| Investment adviser fee (Note 5) | | $44,968,607 | |
| Administrative fee (Note 5) | | 4,677,928 | |
| Custodian fees | | 771,038 | |
| Transfer and dividend disbursing agent fees and expenses | | 5,216,574 | |
| Directors'/Trustees' fees | | 31,601 | |
| Auditing fees | | 22,900 | |
| Legal fees | | 7,741 | |
| Portfolio accounting fees | | 201,902 | |
| Distribution services fee (Note 5) | | 3,856,169 | |
| Shareholder services fee (Note 5) | | 4,514,260 | |
| Account administration fee (Note 2) | | 10,280 | |
| Share registration costs | | 278,381 | |
| Printing and postage | | 248,826 | |
| Insurance premiums | | 14,327 | |
| Miscellaneous | | 13,454 | |
| TOTAL EXPENSES | | 64,833,988 | |
| Waivers, Reimbursement and Reduction: | | | |
| Waiver/reimbursement of investment adviser fee (Note 5) | $(8,100,755) | | |
| Waiver of administrative fee (Note 5) | (92,216) | | |
| Waiver of distribution services fee (Note 5) | (4,500) | | |
| Fees paid indirectly from directed brokerage arrangements (Note 6) | (40,508) | | |
| TOTAL WAIVERS, REIMBURSEMENT AND REDUCTION | | (8,237,979) | |
| Net expenses | | | 56,596,009 |
| Net investment income | | | 237,446,302 |
| Realized and Unrealized Gain on Investments and Foreign Currency Transactions: | | | |
| Net realized gain on investments and foreign currency transactions | | | 90,258,276 |
| Net change in unrealized appreciation of investments and translation of assets and liabilities in foreign currency | | | 381,788,805 |
| Net realized and unrealized gain on investments and foreign currency transactions | | | 472,047,081 |
| Change in net assets resulting from operations | | | $709,493,383 |
See Notes which are an integral part of the Financial Statements
Annual Shareholder Report
Statement of Changes in Net Assets
| Year Ended October 31 | 2012 | 2011 |
| Increase (Decrease) in Net Assets | | |
| Operations: | | |
| Net investment income | $237,446,302 | $107,557,951 |
| Net realized gain on investments and foreign currency transactions | 90,258,276 | 66,656,799 |
| Net change in unrealized appreciation/depreciation of investments and translation of assets and liabilities in foreign currency | 381,788,805 | 159,594,223 |
| CHANGE IN NET ASSETS RESULTING FROM OPERATIONS | 709,493,383 | 333,808,973 |
| Distributions to Shareholders: | | |
| Distributions from net investment income | | |
| Class A Shares | (50,171,857) | (21,666,474) |
| Class C Shares | (15,955,313) | (6,814,261) |
| Institutional Shares | (171,545,909) | (77,545,884) |
| CHANGE IN NET ASSETS RESULTING FROM DISTRIBUTIONS TO SHAREHOLDERS | (237,673,079) | (106,026,619) |
| Share Transactions: | | |
| Proceeds from sale of shares | 3,597,077,148 | 3,111,743,170 |
| Proceeds from shares issued in connection with the tax-free transfer of assets from Performance Strategic Dividend Fund | 48,068,683 | — |
| Net asset value of shares issued to shareholders in payment of distributions declared | 136,055,951 | 39,084,245 |
| Cost of shares redeemed | (1,976,868,157) | (746,291,681) |
| CHANGE IN NET ASSETS RESULTING FROM SHARE TRANSACTIONS | 1,804,333,625 | 2,404,535,734 |
| Change in net assets | 2,276,153,929 | 2,632,318,088 |
| Net Assets: | | |
| Beginning of period | 4,585,705,702 | 1,953,387,614 |
| End of period (including undistributed net investment income of $1,987,476 and $1,256,719, respectively) | $6,861,859,631 | $4,585,705,702 |
See Notes which are an integral part of the Financial Statements
Annual Shareholder Report
Notes to Financial Statements
October 31, 2012
1. ORGANIZATION
Federated Equity Funds (the “Trust”) is registered under the Investment Company Act of 1940, as amended (the “Act”), as an open-end management investment company. The Trust consists of 13 diversified portfolios. The financial statements included herein are only those of Federated Strategic Value Dividend Fund (the “Fund”), a diversified portfolio. The financial statements of the other portfolios are presented separately. The assets of each portfolio are segregated and a shareholder's interest is limited to the portfolio in which shares are held. Each portfolio pays its own expenses. The Fund offers three classes of shares: Class A Shares, Class C Shares and Institutional Shares. All shares of the Fund have equal rights with respect to voting, except on class-specific matters. The investment objective of the Fund is to provide income and long-term capital appreciation.
On September 21, 2012, the Fund acquired all of the net assets of Performance Strategic Dividend Fund (the “Acquired Fund”), an open-end investment company in a tax-free reorganization in exchange for shares of the Fund, pursuant to a plan of reorganization approved by the Acquired Fund's shareholders on September 19, 2012. The purpose of the transaction was to combine two portfolios with comparable investment objectives and strategies. For financial reporting purposes, assets received and shares issued by the Fund were recorded at fair value; however, the cost basis of the investments received from the Acquired Fund was carried forward to align ongoing reporting of the Fund's realized and unrealized gains and losses with amounts distributable to shareholders for tax purposes.
Assuming the acquisition had been completed on November 1, 2011, the beginning of the annual reporting period of the Fund, the Fund's pro forma results of operations for the year ended October 31, 2012, are as follows:
| Net investment income* | $238,257,080 |
| Net realized and unrealized gain on investments | $482,990,898 |
| Net increase in net assets resulting from operations | $721,247,978 |
| * | Net investment income includes $58,021 of pro forma eliminated expenses. |
Because the combined investment portfolios have been managed as a single integrated portfolio since the acquisition was completed, it is not practicable to separate the amounts of revenue and earnings of the Acquired Fund that has been included in the Fund's Statement of Operations as of October 31, 2012.
For every one share of Performance Strategic Dividend Fund Class A Shares exchanged, a shareholder received 2.284 shares of Federated Strategic Value Dividend Fund Class A Shares.
For every one share of Performance Strategic Dividend Fund Institutional Class Shares exchanged, a shareholder received 2.274 shares of Federated Strategic Value Dividend Fund Institutional Shares.
Annual Shareholder Report
The Fund received net assets from the Acquired Fund as the result of the tax-free reorganization as follows:
Shares of the
Fund Issued | Performance
Strategic
Dividend
Fund Net
Assets Received | Unrealized
Appreciation1 | Net Assets
of the Fund
Immediately
Prior to
Combination | Net Assets
of the Fund
Immediately
After
Combination |
| 9,248,446 | $48,068,683 | $7,344,271 | $6,899,071,764 | $6,947,140,447 |
| 1 | Unrealized Appreciation is included in the Acquired Fund Net Assets Received amount shown above. |
2. SIGNIFICANT ACCOUNTING POLICIES
The following is a summary of significant accounting policies consistently followed by the Fund in the preparation of its financial statements. These policies are in conformity with U.S. generally accepted accounting principles (GAAP).
Investment Valuation
In calculating its net asset value (NAV), the Fund generally values investments as follows:
| ■ | Equity securities listed on an exchange or traded through a regulated market system are valued at their last reported sale price or official closing price in their principal exchange or market. |
| ■ | Shares of other mutual funds are valued based upon their reported NAVs. |
| ■ | Derivative contracts listed on exchanges are valued at their reported settlement or closing price. |
| ■ | Over-the-counter (OTC) derivative contracts are fair valued using price evaluations provided by a pricing service approved by the Fund's Board of Trustees (the “Trustees”). |
| ■ | Fixed-income securities acquired with remaining maturities greater than 60 days are fair valued using price evaluations provided by a pricing service approved by the Trustees. |
| ■ | Fixed-income securities acquired with remaining maturities of 60 days or less are valued at their cost (adjusted for the accretion of any discount or amortization of any premium), which approximates market value. |
| ■ | For securities that are fair valued in accordance with procedures established by and under the general supervision of the Trustees, certain factors may be considered such as: the purchase price of the security, information obtained by contacting the issuer, analysis of the issuer's financial statements or other available documents, fundamental analytical data, the nature and duration of restrictions on disposition, the movement of the market in which the security is normally traded and public trading in similar securities of the issuer or comparable issuers. |
If the Fund cannot obtain a price or price evaluation from a pricing service for an investment, the Fund may attempt to value the investment based upon the mean of bid and asked quotations or fair value the investment based on price evaluations, from one or more dealers. If any price, quotation, price evaluation or other pricing source is not readily available when the NAV is calculated, the Fund uses the fair value of the investment determined in accordance with the procedures described below. There can be no assurance that the Fund could purchase or sell an investment at the price used to calculate the Fund's NAV.
Annual Shareholder Report
Fair Valuation and Significant Events Procedures
The Trustees have appointed a Valuation Committee comprised of officers of the Fund, Federated Equity Management Company of Pennsylvania (“Adviser”) and the Adviser's affiliated companies to determine fair value of securities and in overseeing the calculation of the NAV. The Trustees have also authorized the use of pricing services recommended by the Valuation Committee to provide fair value evaluations of the current value of certain investments for purposes of calculating the NAV. The Valuation Committee employs various methods for reviewing third-party pricing service evaluations including periodic reviews of third-party pricing services' policies, procedures and valuation methods (including key inputs and assumptions), transactional back-testing, comparisons of evaluations of different pricing services, and review of price challenges by the Adviser based on recent market activity. In the event that market quotations and price evaluations are not available for an investment, the Valuation Committee determines the fair value of the investment in accordance with procedures adopted by the Trustees. The Trustees periodically review and approve the fair valuations made by the Valuation Committee and any changes made to the procedures.
Factors considered by pricing services in evaluating an investment include the yields or prices of investments of comparable quality, coupon, maturity, call rights and other potential prepayments, terms and type, reported transactions, indications as to values from dealers and general market conditions. Some pricing services provide a single price evaluation reflecting the bid-side of the market for an investment (a “bid” evaluation). Other pricing services offer both bid evaluations and price evaluations indicative of a price between the prices bid and asked for the investment (a “mid” evaluation). The Fund normally uses bid evaluations for U.S. Treasury and Agency securities and mortgage-backed securities. The Fund normally uses mid evaluations for other types of fixed-income securities and OTC derivative contracts. In the event that market quotations and price evaluations are not available for an investment, the fair value of the investment is determined in accordance with procedures adopted by the Trustees.
The Trustees also have adopted procedures requiring an investment to be priced at its fair value whenever the Adviser determines that a significant event affecting the value of the investment has occurred between the time as of which the price of the investment would otherwise be determined and the time as of which the NAV is computed. An event is considered significant if there is both an affirmative expectation that the investment's value will change in response to the event and a reasonable basis for quantifying the resulting change in value. Examples of significant events that may occur after the close of the principal market on which a security is traded, or after the time of a price evaluation provided by a pricing service or a dealer, include:
| ■ | With respect to securities traded in foreign markets, significant trends in U.S. equity markets or in the trading of foreign securities index futures contracts; |
| ■ | Political or other developments affecting the economy or markets in which an issuer conducts its operations or its securities are traded; and |
| ■ | Announcements concerning matters such as acquisitions, recapitalizations, litigation developments, a natural disaster affecting the issuer's operations or regulatory changes or market developments affecting the issuer's industry. |
Annual Shareholder Report
The Trustees have approved the use of a pricing service to determine the fair value of equity securities traded principally in foreign markets when the Adviser determines that there has been a significant trend in the U.S. equity markets or in index futures trading. For other significant events, the Fund may seek to obtain more current quotations or price evaluations from alternative pricing sources. If a reliable alternative pricing source is not available, the Fund will determine the fair value of the investment using another method approved by the Trustees.
Repurchase Agreements
The Fund may invest in repurchase agreements for short-term liquidity purposes. It is the policy of the Fund to require the other party to a repurchase agreement to transfer to the Fund's custodian or sub-custodian eligible securities or cash with a market value (after transaction costs) at least equal to the repurchase price to be paid under the repurchase agreement. The eligible securities are transferred to accounts with the custodian or sub-custodian in which the Fund holds a “securities entitlement” and exercises “control” as those terms are defined in the Uniform Commercial Code. The Fund has established procedures for monitoring the market value of the transferred securities and requiring the transfer of additional eligible securities if necessary to equal at least the repurchase price. These procedures also allow the other party to require securities to be transferred from the account to the extent that their market value exceeds the repurchase price or in exchange for other eligible securities of equivalent market value.
The insolvency of the other party or other failure to repurchase the securities may delay the disposition of the underlying securities or cause the Fund to receive less than the full repurchase price. Under the terms of the repurchase agreement, any amounts received by the Fund in excess of the repurchase price and related transaction costs must be remitted to the other party.
The Fund may enter into repurchase agreements in which eligible securities are transferred into joint trading accounts maintained by the custodian or sub-custodian for investment companies and other clients advised by the Fund's Adviser and its affiliates. The Fund will participate on a pro rata basis with the other investment companies and clients in its share of the securities transferred under such repurchase agreements and in its share of proceeds from any repurchase or other disposition of such securities.
Annual Shareholder Report
Investment Income, Gains and Losses, Expenses and Distributions
Investment transactions are accounted for on a trade-date basis. Realized gains and losses from investment transactions are recorded on an identified-cost basis. Interest income and expenses are accrued daily. Dividend income and distributions to shareholders are recorded on the ex-dividend date. Foreign dividends are recorded on the ex-dividend date or when the Fund is informed of the ex-dividend date. Distributions of net investment income are declared and paid monthly. Non-cash dividends included in dividend income, if any, are recorded at fair value. Investment income, realized and unrealized gains and losses and certain fund-level expenses are allocated to each class based on relative average daily net assets, except that Class A Shares, Class C Shares and Institutional Shares may bear distribution services fees, shareholder services fees and account administration fees unique to those classes. For the year ended October 31, 2012, account administration fees for the Fund were as follows:
| Account
Administration
Fees Incurred |
| Class A Shares | $9,385 |
| Class C Shares | 895 |
| TOTAL | $10,280 |
Dividends are declared separately for each class. No class has preferential dividend rights; differences in per share dividend rates are generally due to differences in separate class expenses.
Premium and Discount Amortization
All premiums and discounts on fixed-income securities are amortized/accreted using the effective interest rate method.
Federal Taxes
It is the Fund's policy to comply with the Subchapter M provision of the Internal Revenue Code (the “Code”) and to distribute to shareholders each year substantially all of its income. Accordingly, no provision for federal income tax is necessary. As of and during the year ended October 31, 2012, the Fund did not have a liability for any uncertain tax positions. The Fund recognizes interest and penalties, if any, related to tax liabilities as income tax expense in the Statement of Operations. As of October 31, 2012, tax years 2009 through 2012 remain subject to examination by the Fund's major tax jurisdictions, which include the United States of America and the Commonwealth of Massachusetts.
The Fund may be subject to taxes imposed by governments of countries in which it invests. Such taxes are generally based on either income or gains earned or repatriated. The Fund accrues and applies such taxes to net investment income, net realized gains and net unrealized gains as income and/or gains are earned.
Annual Shareholder Report
When-Issued and Delayed Delivery Transactions
The Fund may engage in when-issued or delayed delivery transactions. The Fund records when-issued securities on the trade date and maintains security positions such that sufficient liquid assets will be available to make payment for the securities purchased. Securities purchased on a when-issued or delayed delivery basis are marked to market daily and begin earning interest on the settlement date. Losses may occur on these transactions due to changes in market conditions or the failure of counterparties to perform under the contract.
Foreign Exchange Contracts
The Fund enters into foreign exchange contracts for the delayed delivery of securities or foreign currency exchange transactions. The Fund enters into foreign exchange contracts to protect assets against adverse changes in foreign currency exchange rates or exchange control regulations. Purchased contracts are used to acquire exposure to foreign currencies, whereas, contracts to sell are used to hedge the Fund's securities against currency fluctuations. Risks may arise upon entering into these transactions from the potential inability of counterparties to meet the terms of their commitments and from unanticipated movements in security prices or foreign exchange rates. The foreign exchange contracts are adjusted by the daily exchange rate of the underlying currency and any gains or losses are recorded for financial statement purposes as unrealized until the settlement date.
At October 31, 2012, the Fund had no outstanding foreign exchange contracts.
The average value at settlement date payable of foreign exchange contracts purchased by the Fund throughout the period was $2,148. This is based on the contracts held as of each month-end throughout the fiscal period.
Foreign Currency Translation
The accounting records of the Fund are maintained in U.S. dollars. All assets and liabilities denominated in foreign currencies (FCs) are translated into U.S. dollars based on the rates of exchange of such currencies against U.S. dollars on the date of valuation. Purchases and sales of securities, income and expenses are translated at the rate of exchange quoted on the respective date that such transactions are recorded. The Fund does not isolate that portion of the results of operations resulting from changes in foreign exchange rates on investments from the fluctuations arising from changes in market prices of securities held. Such fluctuations are included with the net realized and unrealized gain or loss from investments.
Reported net realized foreign exchange gains or losses arise from sales of portfolio securities, sales and maturities of short-term securities, sales of FCs, currency gains or losses realized between the trade and settlement dates on securities transactions, the difference between the amounts of dividends, interest and foreign withholding taxes recorded on the Fund's books, and the U.S. dollar equivalent of the amounts actually received or paid. Net unrealized foreign exchange gains and losses arise from changes in the value of assets and liabilities other than investments in securities at fiscal year end, resulting from changes in the exchange rate.
Annual Shareholder Report
Additional Disclosure Related to Derivative Instruments
The Effect of Derivative Instruments on the Statement of Operations for the Year Ended October 31, 2012
| Amount of Realized Gain or (Loss) on Derivatives Recognized in Income |
| Forward
Currency
Contracts |
| Foreign exchange contracts | $122,436 |
| Change in Unrealized Appreciation or (Depreciation) on Derivatives Recognized in Income |
| Forward
Currency
Contracts |
| Foreign exchange contracts | $13,707 |
Other
The preparation of financial statements in conformity with GAAP requires management to make estimates and assumptions that affect the amounts of assets, liabilities, expenses and revenues reported in the financial statements. Actual results could differ from those estimated.
3. SHARES OF BENEFICIAL INTEREST
The following tables summarize share activity:
| Year Ended October 31 | 2012 | 2011 |
| Class A Shares: | Shares | Amount | Shares | Amount |
| Shares sold | 187,474,713 | $911,825,262 | 146,149,603 | $664,664,047 |
| Proceeds from shares issued in connection with the tax-free transfer of assets from Performance Strategic Dividend Fund | 1,160,321 | 6,010,472 | — | — |
| Shares issued to shareholders in payment of distributions declared | 9,017,156 | 43,957,977 | 3,482,525 | 15,867,360 |
| Shares redeemed | (107,694,770) | (522,902,467) | (38,575,887) | (174,955,116) |
| NET CHANGE RESULTING FROM CLASS A SHARE TRANSACTIONS | 89,957,420 | $438,891,244 | 111,056,241 | $505,576,291 |
| Year Ended October 31 | 2012 | 2011 |
| Class C Shares: | Shares | Amount | Shares | Amount |
| Shares sold | 73,236,457 | $357,758,308 | 39,272,581 | $177,848,640 |
| Shares issued to shareholders in payment of distributions declared | 2,592,476 | 12,669,630 | 1,177,331 | 5,359,069 |
| Shares redeemed | (14,558,379) | (71,542,442) | (10,059,645) | (45,468,828) |
| NET CHANGE RESULTING FROM CLASS C SHARE TRANSACTIONS | 61,270,554 | $298,885,496 | 30,390,267 | $137,738,881 |
Annual Shareholder Report
| Year Ended October 31 | 2012 | 2011 |
| Institutional Shares: | Shares | Amount | Shares | Amount |
| Shares sold | 477,495,173 | $2,327,493,578 | 499,426,899 | $2,269,230,483 |
| Proceeds from shares issued in connection with the tax-free transfer of assets from Performance Strategic Dividend Fund | 8,088,125 | 42,058,211 | — | — |
| Shares issued to shareholders in payment of distributions declared | 16,109,953 | 79,428,344 | 3,902,426 | 17,857,816 |
| Shares redeemed | (280,290,037) | (1,382,423,248) | (115,706,264) | (525,867,737) |
| NET CHANGE RESULTING FROM INSTITUTIONAL SHARE TRANSACTIONS | 221,403,214 | $1,066,556,885 | 387,623,061 | $1,761,220,562 |
| NET CHANGE RESULTING FROM TOTAL FUND SHARE TRANSACTIONS | 372,631,188 | $1,804,333,625 | 529,069,569 | $2,404,535,734 |
4. FEDERAL TAX INFORMATION
The timing and character of income and capital gain distributions are determined in accordance with income tax regulations, which may differ from GAAP. These differences are due to differing treatments for foreign currency transactions and capital loss carryforwards acquired through merger.
For the year ended October 31, 2012, permanent differences identified and reclassified among the components of net assets were as follows:
| Increase (Decrease) |
| Paid-In Capital | Undistributed
Net Investment
Income (Loss) | Accumulated
Net Realized
Gain (Loss) |
| $1,186,604 | $957,534 | $(2,144,138) |
Net investment income (loss), net realized gains (losses), and net assets were not affected by this reclassification.
The tax character of distributions as reported on the Statement of Changes in Net Assets for the years ended October 31, 2012 and 2011, was as follows:
| 2012 | 2011 |
| Ordinary income | $237,673,079 | $106,026,619 |
As of October 31, 2012, the components of distributable earnings on a tax basis were as follows:
| Undistributed ordinary income | $1,987,476 |
| Undistributed long-term capital gains | $3,325,259 |
| Net unrealized appreciation | $707,558,030 |
| Capital loss carryforwards | $(119,799,718) |
Annual Shareholder Report
At October 31, 2012, the cost of investments for federal tax purposes was $6,135,887,233. The net unrealized appreciation of investments for federal tax purposes excluding any unrealized appreciation resulting from the translation from FCs to U.S. dollars of assets and liabilities other than investments in securities was $707,557,279. This consists of net unrealized appreciation from investments for those securities having an excess of value over cost of $752,090,555 and net unrealized depreciation from investments for those securities having an excess of cost over value of $44,533,276.
At October 31, 2012, the Fund had a capital loss carryforward of $119,799,718 which will reduce the Fund's taxable income arising from future net realized gains on investments, if any, to the extent permitted by the Code, thereby reducing the amount of distributions to shareholders which would otherwise be necessary to relieve the Fund of any liability for federal income tax. Pursuant to the Code, a net capital loss incurred in taxable years beginning on or before December 22, 2010, is characterized as short-term and may be carried forward for a maximum of eight tax years (“Carryforward Limit”), whereas a net capital loss incurred in taxable years beginning after December 22, 2010, retains its character as either short-term or long-term, does not expire and is required to be utilized prior to the losses which have a Carryforward Limit.
The following schedule summarizes the Fund's capital loss carryforwards and expiration years:
| Expiration Year | Short-Term | Long-Term | Total |
| 2017 | $111,150,278 | NA | $111,150,278 |
| 2018 | $8,649,440 | NA | $8,649,440 |
The Fund used capital loss carryforwards of $85,842,512 to offset capital gains realized during the year ended October 31, 2012.
5. INVESTMENT ADVISER FEE AND OTHER TRANSACTIONS WITH AFFILIATES
Investment Adviser Fee
The advisory agreement between the Fund and the Adviser provides for an annual fee equal to 0.75% of the Fund's average daily net assets. Subject to the terms described in the Expense Limitation note, the Adviser may voluntarily choose to waive any portion of its fee. For the year ended October 31, 2012, the Adviser voluntarily waived $8,023,534 of its fee.
Annual Shareholder Report
Administrative Fee
Federated Administrative Services (FAS), under the Administrative Services Agreement, provides the Fund with administrative personnel and services. The fee paid to FAS is based on the average aggregate daily net assets of certain Federated funds as specified below, plus certain out-of-pocket expenses:
| Administrative Fee | Average Aggregate Daily Net Assets
of the Federated Funds |
| 0.150% | on the first $5 billion |
| 0.125% | on the next $5 billion |
| 0.100% | on the next $10 billion |
| 0.075% | on assets in excess of $20 billion |
Prior to September 1, 2012, the administrative fee received during any fiscal year was at least $150,000 per portfolio and $40,000 per each additional class of Shares. Subject to the terms described in the Expense Limitation note, FAS may voluntarily choose to waive any portion of its fee. For the year ended October 31, 2012, FAS waived $92,216 of its fee. The net fee paid to FAS was 0.076% of average daily net assets of the Fund.
Distribution Services Fee
The Fund has adopted a Distribution Plan (the “Plan”) pursuant to Rule 12b-1 under the Act. Under the terms of the Plan, the Fund will compensate Federated Securities Corp. (FSC), the principal distributor, from the daily net assets of the Fund's Class A Shares and Class C Shares to finance activities intended to result in the sale of these shares. The Plan provides that the Fund may incur distribution expenses at the following percentages of average daily net assets annually, to compensate FSC.
| Share Class Name | Percentage of Average Daily
Net Assets of Class |
| Class A Shares | 0.05% |
| Class C Shares | 0.75% |
Subject to the terms described in the Expense Limitation note, FSC may voluntarily choose to waive any portion of its fee. For the year ended October 31, 2012, distribution services fees for the Fund were as follows:
| Distribution Services
Fees Incurred | Distribution Services
Fees Waived |
| Class C Shares | $3,856,169 | $(4,500) |
When FSC receives fees, it may pay some or all of them to financial intermediaries whose customers purchase shares. For the year ended October 31, 2012, FSC retained $2,031,928 of fees paid by the Fund. For the year ended October 31, 2012, the Fund's Class A Shares did not incur a distribution services fee; however, it may begin to incur this fee upon approval of the Trustees.
Annual Shareholder Report
Sales Charges
Front-end sales charges and contingent deferred sales charges (CDSC) do not represent expenses of the Fund. They are deducted from the proceeds of sales of Fund shares prior to investment or from redemption proceeds prior to remittance, as applicable. For the year ended October 31, 2012, FSC retained $984,474 in sales charges from the sale of Class A Shares. FSC also retained $19,511 and $141,773 of CDSC relating to redemptions of Class A Shares and Class C Shares, respectively.
Shareholder Services Fee
The Fund may pay fees (“Service Fees”) up to 0.25% of the average daily net assets of the Fund's Class A Shares and Class C Shares to financial intermediaries or to Federated Shareholder Services Company (FSSC) for providing services to shareholders and maintaining shareholder accounts. Subject to the terms described in the Expense Limitation note, FSSC may voluntarily reimburse the Fund for Service Fees. For the year ended October 31, 2012, Service Fees for the Fund were as follows:
| Service
Fees
Incurred |
| Class A Shares | $3,229,765 |
| Class C Shares | 1,284,495 |
| TOTAL | $4,514,260 |
For the year ended October 31, 2012, FSSC received $16,279 of fees paid by the Fund.
Expense Limitation
The Adviser and its affiliates (which may include FSC, FAS and FSSC) have voluntarily agreed to waive their fees and/or reimburse expenses so that the total annual fund operating expenses (as shown in the financial highlights) paid by the Fund's Class A Shares, Class C Shares and Institutional Shares (after the voluntary waivers and/or reimbursements) will not exceed 1.05%, 1.80% and 0.80% (the “Fee Limit”), respectively, up to but not including the later of (the “Termination Date”): (a) January 1, 2014; or (b) the date of the Fund's next effective Prospectus. While the Adviser and its affiliates currently do not anticipate terminating or increasing these arrangements prior to the Termination Date, these arrangements may only be terminated or the Fee Limit increased prior to the Termination Date with the agreement of the Trustees.
Interfund Transactions
During the year ended October 31, 2012, the Fund engaged in purchase and sale transactions with funds that have a common investment adviser (or affiliated investment advisers), common Directors/Trustees, and/or common Officers. These purchase and sale transactions complied with Rule 17a-7 under the Act and amounted to $3,358,290 and $0, respectively.
General
Certain Officers and Trustees of the Fund are Officers and Directors or Trustees of the above companies.
Annual Shareholder Report
Transactions Involving Affiliated Holdings
Affiliated holdings are mutual funds which are managed by the Adviser or an affiliate of the Adviser. The Adviser has agreed to reimburse the Fund for certain investment adviser fees as a result of transactions in other affiliated mutual funds. For the year ended October 31, 2012, the Adviser reimbursed $77,221. Transactions involving the affiliated holding during the year ended October 31, 2012, were as follows:
| Federated
Prime Value
Obligations Fund,
Institutional Shares |
| Balance of Shares Held 10/31/2011 | 82,711,312 |
| Purchases/Additions | 1,331,121,802 |
| Sales/Reductions | 1,371,523,448 |
| Balance of Shares Held 10/31/2012 | 42,309,666 |
| Value | $42,309,666 |
| Dividend Income | $133,902 |
6. EXPENSE Reduction
The Fund directs portfolio trades to a broker that in turn pays a portion of the Fund's operating expenses. For the year ended October 31, 2012, the Fund's expenses were reduced by $40,508 under these arrangements.
7. Investment TRANSACTIONS
Purchases and sales of investments, excluding long-term U.S. government securities and short-term obligations, for the year ended October 31, 2012, were as follows:
| Purchases | $2,975,798,616 |
| Sales | $1,202,255,553 |
8. LINE OF CREDIT
The Fund participates in a $100,000,000 unsecured, uncommitted revolving line of credit (LOC) agreement with PNC Bank. The LOC was made available for extraordinary or emergency purposes, primarily for financing redemption payments. Borrowings are charged interest at a rate offered to the Fund by PNC Bank at the time of the borrowing. As of October 31, 2012, there were no outstanding loans. During the year ended October 31, 2012, the Fund did not utilize the LOC.
Annual Shareholder Report
9. INTERFUND LENDING
Pursuant to an Exemptive Order issued by the Securities and Exchange Commission, the Fund, along with other funds advised by subsidiaries of Federated Investors, Inc., may participate in an interfund lending program. This program provides an alternative credit facility allowing the Fund to borrow from other participating affiliated funds. As of October 31, 2012, there were no outstanding loans. During the year ended October 31, 2012, the program was not utilized.
10. FEDERAL TAX INFORMATION (UNAUDITED)
For the fiscal year ended October 31, 2012, 100% of total ordinary income distributions made by the Fund are qualifying dividends which may be subject to a maximum tax rate of 15%, as provided for by the Jobs and Growth Tax Relief Act of 2003. Complete information is reported in conjunction with the reporting of your distributions on Form 1099-DIV.
Of the ordinary income distributions made by the Fund during the year ended October 31, 2012, 79.5% qualify for the dividend received deduction available to corporate shareholders.
Annual Shareholder Report
Report of Independent Registered Public Accounting Firm
TO THE BOARD OF Trustees OF Federated Equity Funds AND SHAREHOLDERS OF Federated Strategic Value Dividend Fund:
We have audited the accompanying statement of assets and liabilities of Federated Strategic Value Dividend Fund (the “Fund”) (one of the portfolios constituting Federated Equity Funds), including the portfolio of investments, as of October 31, 2012 and the related statement of operations for the year then ended, the statement of changes in net assets for each of the two years in the period then ended, and the financial highlights for each of the five years in the period then ended. These financial statements and financial highlights are the responsibility of the Fund's management. Our responsibility is to express an opinion on these financial statements and financial highlights based on our audits.
We conducted our audits in accordance with standards of the Public Company Accounting Oversight Board (United States). Those standards require that we plan and perform the audit to obtain reasonable assurance about whether the financial statements and financial highlights are free of material misstatement. We were not engaged to perform an audit of the Fund's internal control over financial reporting. Our audits included consideration of internal control over financial reporting as a basis for designing audit procedures that are appropriate in the circumstances, but not for the purpose of expressing an opinion on the effectiveness of the Fund's internal control over financial reporting. Accordingly, we express no such opinion. An audit also includes examining, on a test basis, evidence supporting the amounts and disclosures in the financial statements and financial highlights, assessing the accounting principles used and significant estimates made by management, and evaluating the overall financial statement presentation. Our procedures included confirmation of securities owned as of October 31, 2012, by correspondence with the custodian. We believe that our audits provide a reasonable basis for our opinion.
In our opinion, the financial statements and financial highlights referred to above present fairly, in all material respects, the financial position of the Federated Strategic Value Dividend Fund, a portfolio of Federated Equity Funds, at October 31, 2012, the results of its operations for the year then ended, the changes in its net assets for each of the two years in the period then ended, and the financial highlights for each of the five years in the period then ended, in conformity with U.S. generally accepted accounting principles.
Boston, Massachusetts
December 24, 2012
Annual Shareholder Report
Shareholder Expense Example (unaudited)
As a shareholder of the Fund, you incur two types of costs: (1) transaction costs, including sales charges (“loads”) on purchase or redemption payments; and (2) ongoing costs, including management fees and to the extent applicable, distribution (12b-1) fees and/or shareholder services fees and other Fund expenses. This Example is intended to help you to understand your ongoing costs (in dollars) of investing in the Fund and to compare these costs with the ongoing costs of investing in other mutual funds. It is based on an investment of $1,000 invested at the beginning of the period and held for the entire period from May 1, 2012 to October 31, 2012.
ACTUAL EXPENSES
The first section of the table below provides information about actual account values and actual expenses. You may use the information in this section, together with the amount you invested, to estimate the expenses that you incurred over the period. Simply divide your account value by $1,000 (for example, an $8,600 account value divided by $1,000 = 8.6), then multiply the result by the number in the first section under the heading entitled “Expenses Paid During Period” to estimate the expenses attributable to your investment during this period.
HYPOTHETICAL EXAMPLE FOR COMPARISON PURPOSES
The second section of the table below provides information about hypothetical account values and hypothetical expenses based on the Fund's actual expense ratio and an assumed rate of return of 5% per year before expenses, which is not the Fund's actual return. Thus, you should not use the hypothetical account values and expenses to estimate the actual ending account balance or your expenses for the period. Rather, these figures are required to be provided to enable you to compare the ongoing costs of investing in the Fund with other funds. To do so, compare this 5% hypothetical example with the 5% hypothetical examples that appear in the shareholder reports of the other funds.
Annual Shareholder Report
Please note that the expenses shown in the table are meant to highlight your ongoing costs only and do not reflect any transaction costs, such as sales charges (“loads”) on purchase or redemption payments. Therefore, the second section of the table is useful in comparing ongoing costs only, and will not help you determine the relative total costs of owning different funds. In addition, if these transaction costs were included, your costs would have been higher.
| Beginning
Account Value
5/1/2012 | Ending
Account Value
10/31/2012 | Expenses Paid
During Period1 |
| Actual: | | | |
| Class A Shares | $1,000 | $1,059.50 | $5.44 |
| Class C Shares | $1,000 | $1,053.40 | $9.29 |
| Institutional Shares | $1,000 | $1,058.50 | $4.14 |
Hypothetical (assuming a 5% return
before expenses): | | | |
| Class A Shares | $1,000 | $1,019.86 | $5.33 |
| Class C Shares | $1,000 | $1,016.09 | $9.12 |
| Institutional Shares | $1,000 | $1,021.11 | $4.06 |
| 1 | Expenses are equal to the Fund's annualized net expense ratios, multiplied by the average account value over the period, multiplied by 184/366 (to reflect the one-half-year period). The annualized net expense ratios are as follows: |
| Class A Shares | 1.05% |
| Class C Shares | 1.80% |
| Institutional Shares | 0.80% |
Annual Shareholder Report
Board of Trustees and Trust Officers
The Board of Trustees is responsible for managing the Trust's business affairs and for exercising all the Trust's powers except those reserved for the shareholders. The following tables give information about each Trustee and the senior officers of the Fund. Where required, the tables separately list Trustees who are “interested persons” of the Fund (i.e., “Interested” Trustees) and those who are not (i.e., “Independent” Trustees). Unless otherwise noted, the address of each person listed is Federated Investors Tower, 1001 Liberty Avenue, Pittsburgh, PA 15222. The address of all Independent Trustees listed is 4000 Ericsson Drive, Warrendale, PA 15086-7561; Attention: Mutual Fund Board. As of December 31, 2011, the Trust comprised 13 portfolio(s), and the Federated Fund Family consisted of 43 investment companies (comprising 134 portfolios). Unless otherwise noted, each Officer is elected annually. Unless otherwise noted, each Trustee oversees all portfolios in the Federated Fund Family and serves for an indefinite term. The Fund's Statement of Additional Information includes additional information about Trust Trustees and is available, without charge and upon request, by calling 1-800-341-7400.
Interested TRUSTEES Background
Name
Birth Date
Positions Held with Trust
Date Service Began | Principal Occupation(s) for Past Five Years,
Other Directorships Held and Previous Position(s) |
John F. Donahue*
Birth Date: July 28, 1924
Trustee
Began serving: April 1984 | Principal Occupations: Director or Trustee of the Federated Fund Family; Chairman and Director, Federated Investors, Inc.; Chairman of the Federated Fund Family's Executive Committee.
Previous Positions: Chairman of the Federated Fund Family; Trustee, Federated Investment Management Company; Chairman and Director, Federated Investment Counseling. |
J. Christopher Donahue*
Birth Date: April 11, 1949
President and Trustee
Began serving: January 2000 | Principal Occupations: Principal Executive Officer and President of the Federated Fund Family; Director or Trustee of some of the Funds in the Federated Fund Family; President, Chief Executive Officer and Director, Federated Investors, Inc.; Chairman and Trustee, Federated Investment Management Company; Trustee, Federated Investment Counseling; Chairman and Director, Federated Global Investment Management Corp.; Chairman, Federated Equity Management Company of Pennsylvania and Passport Research, Ltd. (investment advisory subsidiary of Federated); Trustee, Federated Shareholder Services Company; Director, Federated Services Company.
Previous Positions: President, Federated Investment Counseling; President and Chief Executive Officer, Federated Investment Management Company, Federated Global Investment Management Corp. and Passport Research, Ltd. |
| * | Family relationships and reasons for “interested” status: John F. Donahue is the father of J. Christopher Donahue; both are “interested” due to their beneficial ownership of shares of Federated Investors, Inc. and the positions they hold with Federated and its subsidiaries. |
Annual Shareholder Report
INDEPENDENT TRUSTEES Background
Name
Birth Date
Positions Held with Trust
Date Service Began | Principal Occupation(s) for Past Five Years,
Other Directorships Held, Previous Position(s) and Qualifications |
Nicholas P. Constantakis, CPA
Birth Date: September 3, 1939
Trustee
Began serving: February 1998 | Principal Occupation: Director or Trustee of the Federated Fund Family.
Other Directorship Held: Director, Chairman of the Audit Committee, and member of the Compensation Committee, Michael Baker Corporation (architecture, engineering and construction services).
Previous Position: Partner, Andersen Worldwide SC.
Qualifications: Public accounting and director experience. |
John F. Cunningham
Birth Date: March 5, 1943
Trustee
Began serving: January 1999 | Principal Occupation: Director or Trustee of the Federated Fund Family.
Other Directorships Held: Chairman, President and Chief Executive Officer, Cunningham & Co., Inc. (strategic business consulting); Trustee Associate, Boston College.
Previous Positions: Director, Redgate Communications and EMC Corporation (computer storage systems); Chairman of the Board and Chief Executive Officer, Computer Consoles, Inc.; President and Chief Operating Officer, Wang Laboratories; Director, First National Bank of Boston; Director, Apollo Computer, Inc.
Qualifications: Business management and director experience. |
Maureen Lally-Green
Birth Date: July 5, 1949
Trustee
Began serving: August 2009 | Principal Occupations: Director or Trustee of the Federated Fund Family; Director, Office of Church Relations, Diocese of Pittsburgh; Adjunct Professor of Law, Duquesne University School of Law.
Other Directorships Held: Director, Auberle; Member, Pennsylvania State Board of Education; Director, Saint Vincent College; Director, Ireland Institute of Pittsburgh; Chair and Director, UPMC Mercy Hospital; Regent, St. Vincent Seminary; Director, Epilepsy Foundation of Western and Central Pennsylvania; Director, Saint Thomas More Society, Allegheny County; Director, Our Campaign for the Church Alive, Inc.
Previous Position: Pennsylvania Superior Court Judge.
Qualifications: Legal and director experience. |
Peter E. Madden
Birth Date: March 16, 1942
Trustee
Began serving: November 1991 | Principal Occupation: Director or Trustee, and Chairman of the Board of Directors or Trustees, of the Federated Fund Family.
Previous Positions: Representative, Commonwealth of Massachusetts General Court; President, Chief Operating Officer and Director, State Street Bank and Trust Company and State Street Corporation (retired); Director, VISA USA and VISA International; Chairman and Director, Massachusetts Bankers Association; Director, Depository Trust Corporation; Director, The Boston Stock Exchange.
Qualifications: Business management, mutual fund services and director experience. |
Annual Shareholder Report
Name
Birth Date
Positions Held with Trust
Date Service Began | Principal Occupation(s) for Past Five Years,
Other Directorships Held, Previous Position(s) and Qualifications |
Charles F. Mansfield, Jr.
Birth Date: April 10, 1945
Trustee
Began serving: January 1999 | Principal Occupations: Director or Trustee of the Federated Fund Family; Management Consultant.
Previous Positions: Chief Executive Officer, PBTC International Bank; Partner, Arthur Young & Company (now Ernst & Young LLP); Chief Financial Officer of Retail Banking Sector, Chase Manhattan Bank; Senior Vice President, HSBC Bank USA (formerly Marine Midland Bank); Vice President, Citibank; Assistant Professor of Banking and Finance, Frank G. Zarb School of Business, Hofstra University; Executive Vice President, DVC Group, Inc. (marketing, communications and technology).
Qualifications: Banking, business management, education and director experience. |
Thomas M. O'Neill
Birth Date: June 14, 1951
Trustee
Began serving: October 2006 | Principal Occupations: Director or Trustee, Vice Chairman of the Audit Committee of the Federated Fund Family; Sole Proprietor, Navigator Management Company (investment and strategic consulting).
Other Directorships Held: Board of Overseers, Children's Hospital of Boston; Visiting Committee on Athletics, Harvard College; Board of Directors, Medicines for Humanity; Board of Directors, The Golisano Children's Museum of Naples, Florida.
Previous Positions: Chief Executive Officer and President, Managing Director and Chief Investment Officer, Fleet Investment Advisors; President and Chief Executive Officer, Aeltus Investment Management, Inc.; General Partner, Hellman, Jordan Management Co., Boston, MA; Chief Investment Officer, The Putnam Companies, Boston, MA; Credit Analyst and Lending Officer, Fleet Bank; Director and Consultant, EZE Castle Software (investment order management software); Director, Midway Pacific (lumber).
Qualifications: Business management, mutual fund, director and investment experience. |
John S. Walsh
Birth Date: November 28, 1957
Trustee
Began serving: January 1999 | Principal Occupations: Director or Trustee, Chairman of the Audit Committee of the Federated Fund Family; President and Director, Heat Wagon, Inc. (manufacturer of construction temporary heaters); President and Director, Manufacturers Products, Inc. (distributor of portable construction heaters); President, Portable Heater Parts, a division of Manufacturers Products, Inc.
Previous Position: Vice President, Walsh & Kelly, Inc.
Qualifications: Business management and director experience. |
Annual Shareholder Report
OFFICERS
Name
Birth Date
Address
Positions Held with Trust
Date Service Began | Principal Occupation(s) for Past Five Years
and Previous Position(s) |
John W. McGonigle
Birth Date: October 26, 1938
EXECUTIVE VICE PRESIDENT AND SECRETARY
Officer since: April 1984 | Principal Occupations: Executive Vice President and Secretary of the Federated Fund Family; Vice Chairman, Executive Vice President, Secretary and Director, Federated Investors, Inc.
Previous Positions: Trustee, Federated Investment Management Company and Federated Investment Counseling; Director, Federated Global Investment Management Corp., Federated Services Company and Federated Securities Corp. |
Richard A. Novak
Birth Date: December 25, 1963
TREASURER
Officer since: January 2006 | Principal Occupations: Principal Financial Officer and Treasurer of the Federated Fund Family; Senior Vice President, Federated Administrative Services; Financial and Operations Principal for Federated Securities Corp., Edgewood Services, Inc. and Southpointe Distribution Services, Inc.
Previous Positions: Controller of Federated Investors, Inc.; Vice President, Finance of Federated Services Company; held various financial management positions within The Mercy Hospital of Pittsburgh; Auditor, Arthur Andersen & Co. |
Richard B. Fisher
Birth Date: May 17, 1923
VICE PRESIDENT
Officer since: April 1984 | Principal Occupations: Vice Chairman or Vice President of some of the Funds in the Federated Fund Family; Vice Chairman, Federated Investors, Inc.; Chairman, Federated Securities Corp.
Previous Positions: President and Director or Trustee of some of the Funds in the Federated Fund Family; Executive Vice President, Federated Investors, Inc.; Director and Chief Executive Officer, Federated Securities Corp. |
Peter J. Germain
Birth Date: September 3, 1959
CHIEF LEGAL OFFICER
Officer since: January 2005 | Principal Occupations: Mr. Germain is Chief Legal Officer of the Federated Fund Family. He is General Counsel and Vice President, Federated Investors, Inc.; President, Federated Administrative Services and Federated Administrative Services, Inc.; Vice President, Federated Securities Corp.; Secretary, Federated Private Asset Management, Inc.; and Secretary, Retirement Plan Service Company of America. Mr. Germain joined Federated in 1984 and is a member of the Pennsylvania Bar Association.
Previous Positions: Deputy General Counsel, Special Counsel, Managing Director of Mutual Fund Services, Federated Investors, Inc.; Senior Vice President, Federated Services Company; and Senior Corporate Counsel, Federated Investors, Inc. |
Brian P. Bouda
Birth Date: February 28, 1947
CHIEF COMPLIANCE OFFICER AND SENIOR VICE PRESIDENT
Officer since: August 2004 | Principal Occupations: Senior Vice President and Chief Compliance Officer of the Federated Fund Family; Vice President and Chief Compliance Officer of Federated Investors, Inc. and Chief Compliance Officer of its subsidiaries. Mr. Bouda joined Federated in 1999 and is a member of the American Bar Association and the State Bar Association of Wisconsin. |
Annual Shareholder Report
Name
Birth Date
Address
Positions Held with Trust
Date Service Began | Principal Occupation(s) for Past Five Years
and Previous Position(s) |
Stephen F. Auth
Birth Date: September 3, 1956
450 Lexington Avenue
Suite 3700
New York, NY 10017-3943
CHIEF INVESTMENT OFFICER
Officer since: November 2002 | Principal Occupations: Mr. Auth is Chief Investment Officer of this Fund and various other Funds in the Federated Fund Family; Executive Vice President, Federated Investment Counseling, Federated Global Investment Management Corp. and Federated Equity Management Company of Pennsylvania.
Previous Positions: Executive Vice President, Federated Investment Management Company, and Passport Research, Ltd. (investment advisory subsidiary of Federated); Senior Vice President, Global Portfolio Management Services Division; Senior Vice President, Federated Investment Management Company and Passport Research, Ltd.; Senior Managing Director and Portfolio Manager, Prudential Investments. |
Walter C. Bean
Birth Date: June 22, 1945
VICE PRESIDENT
Officer since: November 2006
Portfolio Manager since: inception | Principal Occupations: Walter C. Bean has been the Fund's Portfolio Manager since inception. He is Vice President of the Trust with respect to the Fund. Mr. Bean is a Senior Vice President, Senior Portfolio Manager and the Head of the Equity Income Management Team of the Fund's Adviser. Mr. Bean joined Federated in 2000. His previous associations included: various investment management and research positions with C.S. McKee & Company, First Chicago Investment Advisors, CIGNA Investment Advisors and Mellon Bank. Mr. Bean earned a Bachelors Degree in Business Administration from Ohio University and an M.B.A. from the Pennsylvania State University. Mr. Bean has received the Chartered Financial Analyst designation and has 43 years of investment experience. |
Annual Shareholder Report
Evaluation and Approval of Advisory Contract–May 2012
Federated Strategic Value Dividend Fund (the “Fund”)
Following a review and recommendation of approval by the Fund's independent trustees, the Fund's Board reviewed and approved at its May 2012 meetings the Fund's investment advisory contract for an additional one-year term. The Board's decision regarding the contract reflects the exercise of its business judgment on whether to continue the existing arrangements.
In this connection, the Federated Funds' Board had previously appointed a Senior Officer, whose duties include specified responsibilities relating to the process by which advisory fees are to be charged to a Federated fund. The Senior Officer has the authority to retain consultants, experts, or staff as may be reasonably necessary to assist in the performance of his duties, reports directly to the Board, and may be terminated only with the approval of a majority of the independent members of the Board. The Senior Officer prepared and furnished to the Board an independent, written evaluation that covered topics discussed below (the “Evaluation”). The Board considered that Evaluation, along with other information, in deciding to approve the advisory contract.
The Board is also familiar with and considered judicial decisions concerning allegedly excessive investment advisory fees, which have indicated that the following factors may be relevant to an Adviser's fiduciary duty with respect to its receipt of compensation from a fund: the nature and quality of the services provided by the Adviser to a fund and its shareholders, including the performance and expenses of the fund and of comparable funds; the Adviser's cost of providing the services, including the profitability to the Adviser of providing advisory services to a fund; the extent to which the Adviser may realize “economies of scale” as a fund grows larger and, if such economies exist, whether they have been shared with a fund and its shareholders; any “fall-out financial benefits” that accrue to the Adviser because of its relationship with a fund (including research services received from brokers that execute fund trades and any fees paid to affiliates of the Adviser for services rendered to a fund); comparative fee structures, including a comparison of fees paid to the Adviser with those paid by similar funds; and the extent to which the Board members are fully informed about all facts the Board deems relevant to its consideration of the Adviser's services and fees. Consistent with these judicial decisions, the Board also considered management fees (including any components thereof) charged to institutional and other clients of the Adviser for what might be viewed as like services. The Board was aware of these factors and was guided by them in its review of the Fund's advisory contract to the extent it considered them to be appropriate and relevant, as discussed further below.
Annual Shareholder Report
The Board considered and weighed these circumstances in light of its substantial accumulated experience in governing the Fund and working with Federated on matters relating to the Federated funds, and was assisted in its deliberations by independent legal counsel. Throughout the year, and in connection with its May meetings, the Board requested and received substantial and detailed information about the Fund and the Federated organization that was in addition to the extensive materials that comprise and accompany the Senior Officer's Evaluation. Federated provided much of this information at each regular meeting of the Board, and furnished additional substantial information in connection with the May meeting at which the Board's formal review of the advisory contract occurred. At this May meeting, senior management of the Adviser also met with the independent trustees and their counsel to discuss the materials presented and any other matters thought relevant by the Adviser or the trustees. Between regularly scheduled meetings, the Board also received information on particular matters as the need arose. Thus, the Board's consideration of the advisory contract included review of the Senior Officer's Evaluation, accompanying data and additional information covering such matters as: the Adviser's investment philosophy, revenue, profitability, personnel and processes; investment and operating strategies; the Fund's short- and long-term performance (in absolute terms, both on a gross basis and net of expenses, as well as in relationship to its particular investment program and certain competitor or “peer group” funds and/or other benchmarks, as appropriate), and comments on the reasons for performance; the Fund's investment objectives; the Fund's expenses (including the advisory fee itself and the overall expense structure of the Fund, both in absolute terms and relative to similar and/or competing funds, with due regard for contractual or voluntary expense limitations); the use and allocation of brokerage commissions derived from trading the Fund's portfolio securities (if any); and the nature, quality and extent of the advisory and other services provided to the Fund by the Adviser and its affiliates. The Board also considered the preferences and expectations of Fund shareholders; the entrepreneurial risk assumed by the Adviser in sponsoring the funds; the continuing state of competition in the mutual fund industry and market practices; the range of comparable fees for similar funds in the mutual fund industry; the Fund's relationship to the Federated family of funds which include a comprehensive array of funds with different investment objectives, policies and strategies which are available for exchange without the incurrence of additional sales charges; compliance and audit reports concerning the Federated funds and the Federated companies that service them (including communications from regulatory agencies), as well as Federated's responses to any issues raised therein; and relevant developments in the mutual fund industry and how the Federated funds and/or Federated are responding to them. The Board's evaluation process is evolutionary. The criteria considered and the emphasis placed on relevant criteria change in recognition of changing circumstances in the mutual fund marketplace.
Annual Shareholder Report
While mindful that courts have cautioned against giving such comparisons too much weight, the Board has found the use of comparisons of the Fund's fees and expenses to other mutual funds with comparable investment programs to be relevant, given the high degree of competition in the mutual fund business. The Board focused on comparisons with other similar mutual funds more heavily than non-mutual fund products or services because it is believed that they are more relevant. For example, other mutual funds are the products most like the Fund, they are readily available to Fund shareholders as alternative investment vehicles, and they are the type of investment vehicle in fact chosen and maintained by the Fund's investors. The range of their fees and expenses therefore appears to be a generally reliable indication of what consumers have found to be reasonable in the precise marketplace in which the Fund competes. In this regard, the Senior Officer has reviewed Federated's fees for providing advisory services to products outside the Federated family of funds (e.g., institutional and separate accounts). He concluded that mutual funds and institutional accounts are inherently different products. Those differences include, but are not limited to, different types of targeted investors; being subject to different laws and regulations; different legal structures; different average account sizes; different associated costs; different portfolio management techniques made necessary by different cash flows; and portfolio manager time spent in review of securities pricing. The Senior Officer did not consider these fee schedules to be determinative in judging the appropriateness of mutual fund advisory contracts.
The Fund's ability to deliver competitive performance when compared to its peer group was also deemed to be relevant by the Board as a useful indicator of how the Adviser is executing the Fund's investment program, which in turn assisted the Board in reaching a conclusion that the nature, extent, and quality of the Adviser's investment management services were such as to warrant continuation of the advisory contract.
The Senior Officer reviewed information compiled by Federated, using data supplied by independent fund ranking organizations, regarding the performance of, and fees charged by, other mutual funds, noting his view that comparisons to fund peer groups are relevant in judging the reasonableness of proposed fees.
For the one-year, three-year and five-year periods covered by the Evaluation, the Fund's performance was above the median of the relevant peer group.
The Board also received financial information about Federated, including information regarding the compensation and benefits Federated derived from its relationships with the Federated funds. This information covered not only the fees under the advisory contracts, but also fees received by Federated's subsidiaries for providing other services to the Federated funds under separate contracts (e.g., for serving as the Federated funds' administrator). The information also detailed any indirect benefit Federated may derive from its receipt of research services from brokers who execute Federated fund trades. In addition, the Board considered the fact that, in order for a fund to be
Annual Shareholder Report
competitive in the marketplace, Federated and its affiliates frequently waived fees and/or reimbursed expenses and have disclosed to fund investors and/or indicated to the Board their intention to do so in the future, where appropriate. Moreover, the Board receives regular reporting as to the institution or elimination of these voluntary waivers.
Federated furnished information, requested by the Senior Officer, that reported revenues on a fund-by-fund basis and made estimates of the allocation of expenses on a fund-by-fund basis, using allocation methodologies specified by the Senior Officer. The Senior Officer noted that, although they may apply consistent allocation processes, the inherent difficulties in allocating costs (and the unavoidable arbitrary aspects of that exercise) and the lack of consensus on how to allocate those costs may render such allocation information unreliable. The allocation information was considered in the analysis by the Board but was determined to be of limited use.
The Board and the Senior Officer also reviewed information compiled by Federated comparing profitability information for Federated to other publicly held fund management companies. In this regard, the Senior Officer noted the limited availability of such information, but nonetheless concluded that Federated's profit margins did not appear to be excessive.
The Senior Officer's Evaluation also discussed the notion of possible realization of “economies of scale” as a fund grows larger. The Board considered in this regard that the Adviser has made significant and long-term investments in areas that support all of the Federated funds, such as personnel and processes for the portfolio management, shareholder services, compliance, internal audit, and risk management functions; and systems technology; and that the benefits of these efforts (as well as any economies, should they exist) were likely to be enjoyed by the fund complex as a whole. Finally, the Board also noted the absence of any applicable regulatory or industry guidelines on this subject, which (as discussed in the Senior Officer's Evaluation) is compounded by the lack of any common industry practice or general pattern with respect to structuring fund advisory fees with “breakpoints” that serve to reduce the fee as the fund attains a certain size. The Senior Officer did not recommend institution of breakpoints in pricing Federated's fund advisory services at this time.
It was noted in the materials for the Board meeting that, for the period covered by the Evaluation, the Fund's investment advisory fee, after waivers and expense reimbursements, if any, was above the median of the relevant peer group. The Board reviewed the fees and other expenses of the Fund with the Adviser and was satisfied that the overall expense structure of the Fund remained competitive. The Board will continue to monitor advisory fees and other expenses borne by the Fund.
Annual Shareholder Report
The Senior Officer noted that, considering the totality of the circumstances, and all of the factors referenced within his Evaluation, he had concluded that, subject to comments and recommendations made within his Evaluation, his observations and the information accompanying the Evaluation supported a finding by the Board that the management fees for each of the funds was reasonable and that Federated appeared to provide appropriate advisory and administrative services to the Fund for the fees paid. Under these circumstances, no changes were recommended to, and no objection was raised to, the continuation of the Fund's advisory contract.
In its decision to continue an existing investment advisory contract, the Board was mindful of the potential disruptions of the Fund's operations and various risks, uncertainties and other effects that could occur as a result of a decision to terminate or not renew an advisory contract. In particular, the Board recognized that many shareholders have invested in the Fund on the strength of the Adviser's industry standing and reputation and with the expectation that the Adviser will have a continuing role in providing advisory services to the Fund. Thus, the Board's approval of the advisory contract reflected the fact that it is the shareholders who have effectively selected the Adviser by virtue of having invested in the Fund. The Board concluded that, in light of the factors discussed above, including the nature, quality and scope of the services provided to the Fund by the Adviser and its affiliates, continuation of the advisory contract was appropriate.
The Board based its decision to approve the advisory contract on the totality of the circumstances and relevant factors and with a view to past and future long-term considerations. Not all of the factors and considerations identified above were necessarily relevant to the Fund, nor did the Board consider any one of them to be determinative. With respect to the factors that were relevant, the Board's decision to approve the contract reflects its determination that Federated's performance and actions provided a satisfactory basis to support the decision to continue the existing arrangements.
Annual Shareholder Report
Voting Proxies on Fund Portfolio Securities
A description of the policies and procedures that the Fund uses to determine how to vote proxies, if any, relating to securities held in the Fund's portfolio is available, without charge and upon request, by calling 1-800-341-7400. A report on “Form N-PX” of how the Fund voted any such proxies during the most recent 12-month period ended June 30 is available from Federated's website at FederatedInvestors.com. To access this information from the home page, select “All” under “Asset Classes.” Select a fund name and share class, if applicable, to go to the Fund Overview page. On the Fund Overview page, select the “Documents” tab. At the bottom of that page, select “Proxy Voting Record Report (Form N-PX).” Form N-PX filings are also available at the SEC's website at www.sec.gov.
Quarterly Portfolio Schedule
The Fund files with the SEC a complete schedule of its portfolio holdings, as of the close of the first and third quarters of its fiscal year, on “Form N-Q.” These filings are available on the SEC's website at www.sec.gov and may be reviewed and copied at the SEC's Public Reference Room in Washington, DC. (Call 1-800-SEC-0330 for information on the operation of the Public Reference Room.) You may also access this information from the “Products” section of Federated's website at FederatedInvestors.com. From the home page, select “All” under “Asset Classes.” Select a fund name and share class, if applicable, to go to the Fund Overview page. On the Fund Overview page, select the “Documents” tab. At the bottom of that page, select “Form N-Q.”
Annual Shareholder Report
Mutual funds are not bank deposits or obligations, are not guaranteed by any bank and are not insured or guaranteed by the U.S. government, the Federal Deposit Insurance Corporation, the Federal Reserve Board or any other government agency. Investment in mutual funds involves investment risk, including the possible loss of principal.
This Report is authorized for distribution to prospective investors only when preceded or accompanied by the Fund's Prospectus, which contains facts concerning its objective and policies, management fees, expenses and other information.
Federated Strategic Value Dividend Fund
Federated Investors Funds
4000 Ericsson Drive
Warrendale, PA 15086-7561
Contact us at FederatedInvestors.com
or call 1-800-341-7400.
Federated Securities Corp., Distributor
CUSIP 314172586
CUSIP 314172578
CUSIP 314172560
33982 (12/12)
Federated is a registered trademark of Federated Investors, Inc.
2012 ©Federated Investors, Inc.
Item 2. Code of Ethics
(a) As of the end of the period covered by this report, the registrant has adopted a code of ethics (the "Section 406 Standards for Investment Companies - Ethical Standards for Principal Executive and Financial Officers") that applies to the registrant's Principal Executive Officer and Principal Financial Officer; the registrant's Principal Financial Officer also serves as the Principal Accounting Officer.
(c) Not Applicable
(d) Not Applicable
(e) Not Applicable
(f)(3) The registrant hereby undertakes to provide any person, without charge, upon request, a copy of the code of ethics. To request a copy of the code of ethics, contact the registrant at 1-800-341-7400, and ask for a copy of the Section 406 Standards for Investment Companies - Ethical Standards for Principal Executive and Financial Officers.
Item 3. Audit Committee Financial Expert
The registrant's Board has determined that each of the following members of the Board's Audit Committee is an “audit committee financial expert,” and is "independent," for purposes of this Item: Nicholas P. Constantakis, Charles F. Mansfield, Jr., Thomas M. O'Neill and John S. Walsh.
Item 4. Principal Accountant Fees and Services
(a) Audit Fees billed to the registrant for the two most recent fiscal years:
Fiscal year ended 2012 - $383,700
Fiscal year ended 2011 - $355,700
(b) Audit-Related Fees billed to the registrant for the two most recent fiscal years:
Fiscal year ended 2012 - $0
Fiscal year ended 2011 - $97
Travel to Audit Committee meetings.
Amount requiring approval of the registrant’s audit committee pursuant to paragraph (c)(7)(ii) of Rule 2-01 of Regulation S-X, $8,370 and $2,328 respectively. Fiscal year ended 2012- Audit consent fees for N-14 merger documents. Fiscal year ended 2011- Audit consent fee for N-14 merger documents.
(c) Tax Fees billed to the registrant for the two most recent fiscal years:
Fiscal year ended 2012 - $0
Fiscal year ended 2011 - $0
Amount requiring approval of the registrant’s audit committee pursuant to paragraph (c)(7)(ii) of Rule 2-01 of Regulation S-X, $0 and $22,932 respectively. Fiscal year ended 2011- Tax preparation fees for fiscal year end 2010.
(d) All Other Fees billed to the registrant for the two most recent fiscal years:
Fiscal year ended 2012 - $0
Fiscal year ended 2011 - $0
Amount requiring approval of the registrant’s audit committee pursuant to paragraph (c)(7)(ii) of Rule 2-01 of Regulation S-X, $18,894 and $41,364 respectively. Fiscal year ended 2012- Service fee for analysis of potential Passive Foreign Investment Company holdings. Fiscal year ended 2011- Service fee for analysis of potential Passive Foreign Investment Company holdings.
(e)(1) Audit Committee Policies regarding Pre-approval of Services.
The Audit Committee is required to pre-approve audit and non-audit services performed by the independent auditor in order to assure that the provision of such services do not impair the auditor’s independence. Unless a type of service to be provided by the independent auditor has received general pre-approval, it will require specific pre-approval by the Audit Committee. Any proposed services exceeding pre-approved cost levels will require specific pre-approval by the Audit Committee.
Certain services have the general pre-approval of the Audit Committee. The term of the general pre-approval is 12 months from the date of pre-approval, unless the Audit Committee specifically provides for a different period. The Audit Committee will annually review the services that may be provided by the independent auditor without obtaining specific pre-approval from the Audit Committee and may grant general pre-approval for such services. The Audit Committee will revise the list of general pre-approved services from time to time, based on subsequent determinations. The Audit Committee will not delegate its responsibilities to pre-approve services performed by the independent auditor to management.
The Audit Committee has delegated pre-approval authority to its Chairman. The Chairman will report any pre-approval decisions to the Audit Committee at its next scheduled meeting. The Committee will designate another member with such pre-approval authority when the Chairman is unavailable.
AUDIT SERVICES
The annual Audit services engagement terms and fees will be subject to the specific pre-approval of the Audit Committee. The Audit Committee must approve any changes in terms, conditions and fees resulting from changes in audit scope, registered investment company (RIC) structure or other matters.
In addition to the annual Audit services engagement specifically approved by the Audit Committee, the Audit Committee may grant general pre-approval for other Audit Services, which are those services that only the independent auditor reasonably can provide. The Audit Committee has pre-approved certain Audit services, all other Audit services must be specifically pre-approved by the Audit Committee.
AUDIT-RELATED SERVICES
Audit-related services are assurance and related services that are reasonably related to the performance of the audit or review of the Company’s financial statements or that are traditionally performed by the independent auditor. The Audit Committee believes that the provision of Audit-related services does not impair the independence of the auditor, and has pre-approved certain Audit-related services, all other Audit-related services must be specifically pre-approved by the Audit Committee.
TAX SERVICES
The Audit Committee believes that the independent auditor can provide Tax services to the Company such as tax compliance, tax planning and tax advice without impairing the auditor’s independence. However, the Audit Committee will not permit the retention of the independent auditor in connection with a transaction initially recommended by the independent auditor, the purpose of which may be tax avoidance and the tax treatment of which may not be supported in the Internal Revenue Code and related regulations. The Audit Committee has pre-approved certain Tax services, all Tax services involving large and complex transactions must be specifically pre-approved by the Audit Committee.
ALL OTHER SERVICES
With respect to the provision of services other than audit, review or attest services the pre-approval requirement is waived if:
| (1) | The aggregate amount of all such services provided constitutes no more than five percent of the total amount of revenues paid by the registrant, the registrant’s adviser (not including any sub-adviser whose role is primarily portfolio management and is subcontracted with or overseen by another investment adviser), and any entity controlling, controlled by, or under common control with the investment adviser that provides ongoing services to the registrant to its accountant during the fiscal year in which the services are provided; |
| (2) | Such services were not recognized by the registrant, the registrant’s adviser (not including any sub-adviser whose role is primarily portfolio management and is subcontracted with or overseen by another investment adviser), and any entity controlling, controlled by, or under common control with the investment adviser that provides ongoing services to the registrant at the time of the engagement to be non-audit services; and |
| (3) | Such services are promptly brought to the attention of the Audit Committee of the issuer and approved prior to the completion of the audit by the Audit Committee or by one or more members of the Audit Committee who are members of the board of directors to whom authority to grant such approvals has been delegated by the Audit Committee. |
The Audit Committee may grant general pre-approval to those permissible non-audit services classified as All Other services that it believes are routine and recurring services, and would not impair the independence of the auditor.
The SEC’s rules and relevant guidance should be consulted to determine the precise definitions of prohibited non-audit services and the applicability of exceptions to certain of the prohibitions.
PRE-APPROVAL FEE LEVELS
Pre-approval fee levels for all services to be provided by the independent auditor will be established annually by the Audit Committee. Any proposed services exceeding these levels will require specific pre-approval by the Audit Committee.
PROCEDURES
Requests or applications to provide services that require specific approval by the Audit Committee will be submitted to the Audit Committee by both the independent auditor and the Principal Accounting Officer and/or Internal Auditor, and must include a joint statement as to whether, in their view, the request or application is consistent with the SEC’s rules on auditor independence.
(e)(2) Percentage of services identified in items 4(b) through 4(d) that were approved by the registrants audit committee pursuant to paragraph (c)(7)(i)(C) of Rule 2-01 of Regulation S-X:
4(b)
Fiscal year ended 2012 – 0%
Fiscal year ended 2011 - 0%
Percentage of services provided to the registrants investment adviser and any entity controlling, controlled by, or under common control with the investment adviser that provides ongoing services to the registrant that were approved by the registrants audit committee pursuant to paragraph (c)(7)(i)(C) of Rule 2-01 of Regulation S-X, 0% and 0% respectively.
4(c)
Fiscal year ended 2012 – 0%
Fiscal year ended 2011 – 0%
Percentage of services provided to the registrants investment adviser and any entity controlling, controlled by, or under common control with the investment adviser that provides ongoing services to the registrant that were approved by the registrants audit committee pursuant to paragraph (c)(7)(i)(C) of Rule 2-01 of Regulation S-X, 0% and 0% respectively.
4(d)
Fiscal year ended 2012 – 0%
Fiscal year ended 2011 – 0%
Percentage of services provided to the registrants investment adviser and any entity controlling, controlled by, or under common control with the investment adviser that provides ongoing services to the registrant that were approved by the registrants audit committee pursuant to paragraph (c)(7)(i)(C) of Rule 2-01 of Regulation S-X, 0% and 0% respectively.
| (g) | Non-Audit Fees billed to the registrant, the registrant’s investment adviser, and certain entities controlling, controlled by or under common control with the investment adviser: |
Fiscal year ended 2012 - $454,242
Fiscal year ended 2011 - $531,028
(h) The registrant’s Audit Committee has considered that the provision of non-audit services that were rendered to the registrant’s adviser (not including any sub-adviser whose role is primarily portfolio management and is subcontracted with or overseen by another investment adviser), and any entity controlling, controlled by, or under common control with the investment adviser that provides ongoing services to the registrant that were not pre-approved pursuant to paragraph (c)(7)(ii) of Rule 2-01 of Regulation S-X is compatible with maintaining the principal accountant’s independence.
Item 5. Audit Committee of Listed Registrants
Not Applicable
Item 6. Schedule of Investments
(a) The registrant’s Schedule of Investments is included as part of the Report to Stockholders filed under Item 1 of this form.
(b) Not Applicable; Fund had no divestments during the reporting period covered since the previous Form N-CSR filing.
Item 7. Disclosure of Proxy Voting Policies and Procedures for Closed-End Management Investment Companies
Item 8. Portfolio Managers of Closed-End Management Investment Companies
Item 9. Purchases of Equity Securities by Closed-End Management Investment Company and Affiliated Purchasers
Item 10. Submission of Matters to a Vote of Security Holders
Not Applicable
Item 11. Controls and Procedures
(a) The registrant’s President and Treasurer have concluded that the
registrant’s disclosure controls and procedures (as defined in rule 30a-3(c) under the Act) are effective in design and operation and are sufficient to form the basis of the certifications required by Rule 30a-(2) under the Act, based on their evaluation of these disclosure controls and procedures within 90 days of the filing date of this report on Form N-CSR.
(b) There were no changes in the registrant’s internal control over financial reporting (as defined in rule 30a-3(d) under the Act) during the second fiscal quarter of the period covered by this report that have materially affected, or are reasonably likely to materially affect, the registrant’s internal control over financial reporting.
Item 12. Exhibits
(a)(1) Code of Ethics- Not Applicable to this Report.
(a)(2) Certifications of Principal Executive Officer and Principal Financial Officer.
(a)(3) Not Applicable.
(b) Certifications pursuant to 18 U.S.C. Section 1350.
SIGNATURES
Pursuant to the requirements of the Securities Exchange Act of 1934 and the Investment Company Act of 1940, the registrant has duly caused this report to be signed on its behalf by the undersigned, thereunto duly authorized.
Registrant Federated Equity Funds
By /S/ Richard A. Novak
Richard A. Novak, Principal Financial Officer
Date December 21, 2012
Pursuant to the requirements of the Securities Exchange Act of 1934 and the Investment Company Act of 1940, this report has been signed below by the following persons on behalf of the registrant and in the capacities and on the dates indicated.
By /S/ J. Christopher Donahue
J. Christopher Donahue, Principal Executive Officer
Date December 21, 2012
By /S/ Richard A. Novak
Richard A. Novak, Principal Financial Officer
Date December 21, 2012