United States
Securities and Exchange Commission
Washington, D.C. 20549
Form N-CSR
Certified Shareholder Report of Registered Management Investment Companies
811-4017
(Investment Company Act File Number)
Federated Equity Funds
_______________________________________________________________
(Exact Name of Registrant as Specified in Charter)
Federated Investors Funds
4000 Ericsson Drive
Warrendale, Pennsylvania 15086-7561
(Address of Principal Executive Offices)
(412) 288-1900
(Registrant's Telephone Number)
Peter J. Germain, Esquire
Federated Investors Tower
1001 Liberty Avenue
Pittsburgh, Pennsylvania 15222-3779
(Name and Address of Agent for Service)
(Notices should be sent to the Agent for Service)
Date of Fiscal Year End:10/31/19
Date of Reporting Period:10/31/19
| Item 1. | Reports to Stockholders |

Annual Shareholder Report
October 31, 2019
| Share Class | Ticker | A | KAUAX | B | KAUBX | C | KAUCX |
| | R | KAUFX | Institutional | KAUIX | |
Federated Kaufmann Fund
Successor to the Kaufmann Fund, Inc., with performance history since February 21, 1986
A Portfolio of Federated Equity Funds
IMPORTANT NOTICE REGARDING REPORT DELIVERY
Beginning on January 1, 2021, as permitted by regulations adopted by the Securities and Exchange Commission, paper copies of the Fund's shareholder reports like this one will no longer be sent by mail, unless you specifically request paper copies of the reports from the Fund or from your financial intermediary, such as a broker-dealer or bank. Instead, the reports will be made available on a website, and you will be notified by mail each time a report is posted and provided with a website link to access the report.
If you already elected to receive shareholder reports electronically, you will not be affected by this change and you need not take any action. You may elect to receive shareholder reports and other communications from the Fund or your financial intermediary electronically by contacting your financial intermediary (such as a broker-dealer or bank); other shareholders may call the Fund at 1-800-341-7400, Option 4.
You may elect to receive all future reports in paper free of charge. You can inform the Fund or your financial intermediary that you wish to continue receiving paper copies of your shareholder reports by contacting your financial intermediary (such as a broker-dealer or bank); other shareholders may call the Fund at 1-800-341-7400, Option 4. Your election to receive reports in paper will apply to all funds held with the Fund complex or your financial intermediary.
Not FDIC Insured ■ May Lose Value ■ No Bank Guarantee
J. Christopher
Donahue
President
Federated Kaufmann Fund
Letter from the President
Dear Valued Shareholder,
I am pleased to present the Annual Shareholder Report for your fund covering the period from November 1, 2018 through October 31, 2019. This report includes Management's Discussion of Fund Performance, a complete listing of your fund's holdings, performance information and financial statements along with other important fund information.
In addition, our website, FederatedInvestors.com, offers easy access to Federated resources that include timely fund updates, economic and market insights from our investment strategists, and financial planning tools.
Thank you for investing with Federated. I hope you find this information useful and look forward to keeping you informed.
Sincerely,
J. Christopher Donahue, President
CONTENTS
| 1 |
| 5 |
| 6 |
| 17 |
| 22 |
| 24 |
| 26 |
| 27 |
| 41 |
| 43 |
| 45 |
| 51 |
| 59 |
| 59 |
Management's Discussion of Fund Performance (unaudited)
The total return of Federated Kaufmann Fund (the “Fund”), based on net asset value for the 12-month reporting period ended October 31, 2019, was 19.52% for the Class A Shares, 18.88% for the Class B Shares, 18.69% for the Class C Shares, 19.48% for the Class R Shares and 19.98% for the Institutional Shares. The total return of the Russell Midcap® Growth Index (RMCGI),1 the Fund's broad-based securities market index, was 18.93% for the same period. The total return of the Morningstar Mid-Cap Growth Funds Average (MMCGFA),2 a peer group average for the Fund, was 14.13% for the same period. The Fund's and MMCGFA's total returns for the most recently completed fiscal year reflected actual cash flows, transaction costs and other expenses, which were not reflected in the total return of the RMCGI.
During the reporting period, the Fund's investment strategy focused on stock selection, sector exposure, international exposure3 and the effect of cash holdings. These were the most significant factors affecting the Fund's performance relative to the RMCGI.
The following discussion will focus on the performance of the Fund's Class IS Shares.
MARKET OVERVIEW
During the reporting period, returns in most global equity markets increased as economic growth remained positive, despite it slowing. The U.S. Federal Reserve (the “Fed”) reversed its previous path of raising rates and began lowering rates, eventually planning to pause until 2020. U.S. GDP growth remained strong, with the consumer leading the way as business investments slowed when the tax reform momentum wore off. Global central banks remained supportive, easing policies with the hope their economies would respond positively. The large fiscal stimulus in late 2017 along with the administration's business-friendly stance helped U.S. growth outpace much of the world. However, as U.S. trade tensions continued during the reporting period, volatility increased.
STOCK SELECTION
The key factors affecting performance from a macroeconomic standpoint were the improving U.S. economic fundamentals and the accommodative monetary policies of the Fed and other central banks around the world. These monetary accommodations, combined with a more aggressive fiscal stance, helped to boost earnings for most of the S&P 500® Index4 constituents. The profitability of many of the companies in which the Fund invested remained strong throughout the reporting period. Fund management continued to seek what it viewed as attractive mid-cap growth investment opportunities–
Annual Shareholder Report
companies it viewed as dominant competitors, possessing strengthening fundamentals, with the potential to deliver both near-term and long-term growth in sales and earnings.
The majority of the Fund outperformance versus the RMCGI was due to stock selection, particularly in the Health Care, Information Technology and Communication Services sectors. Individual companies that most contributed to Fund performance during the reporting period were: Veeva Systems Inc., arGEN-x, Spark Therapeutics, Galapagos and ServiceNow. Holdings that negatively impacted Fund performance were: Minerva Neurosciences, XPO Logistics, GrafTech International, Grubhub, Inc. and AnaptysBio.
SECTOR EXPOSURE
At the end of the reporting period, approximately 64% of the portfolio was invested in four large sectors: Health Care, Information Technology, Materials and Industrials. These sectors have historically provided what Fund management views as good opportunities for bottom-up growth investors.
INTERNATIONAL EXPOSURE
Stock selection of companies domiciled outside the U.S. was a positive contributor to Fund performance. Approximately 9.59% of the Fund's assets were invested in such companies during the reporting period.
EFFECT OF CASH HOLDINGS
The Fund had significant outflows during the reporting period which resulted in an average cash position of 21%. In a rising market, the cash holdings resulted in a modest drag on relative Fund performance versus the RMCGI.
| 1 | Please see the footnotes to the line graphs below for definitions of, and further information about, the RMCGI. |
| 2 | Please see the footnotes to the line graphs below for definitions of, and further information about, the MMCGFA. |
| 3 | International investing involves special risks including currency risk, increased volatility, political risks and differences in auditing and other financial standards. |
| 4 | The S&P 500® Index is an unmanaged capitalization-weighted index of 500 stocks designed to measure performance of the broad domestic economy through changes in the aggregate market value of 500 stocks representing all major industries. The index is unmanaged, and it is not possible to invest directly in an index. |
Annual Shareholder Report
FUND PERFORMANCE AND GROWTH OF A $10,000 INVESTMENT
The graph below illustrates the hypothetical investment of $10,0001 in the Federated Kaufmann Fund (the “Fund”) from October 31, 2009 to October 31, 2019, compared to the Russell Midcap® Growth Index (RMCGI)2 and the Morningstar Mid-Cap Growth Funds Average (MMCGFA).3The Average Annual Total Return table below shows returns for each class averaged over the stated periods.
Growth of a $10,000 Investment
Growth of $10,000 as of October 31, 2019

| Federated Kaufmann Fund - | Institutional Shares | Class A Shares | Class R Shares | RMCGI | MMCGFA |
| F | F | F | I | I |
| 10/31/2009 | 10,000 | 9,450 | 10,000 | 10,000 | 10,000 |
| 10/31/2010 | 12,470 | 11,823 | 12,481 | 12,803 | 12,594 |
| 10/31/2011 | 11,727 | 11,105 | 11,748 | 14,094 | 13,543 |
| 10/31/2012 | 12,800 | 12,155 | 12,831 | 15,375 | 14,572 |
| 10/31/2013 | 17,378 | 16,485 | 17,427 | 20,592 | 19,273 |
| 10/31/2014 | 19,901 | 18,882 | 19,957 | 23,596 | 21,235 |
| 10/31/2015 | 21,151 | 20,070 | 21,210 | 24,761 | 21,847 |
| 10/31/2016 | 21,524 | 20,424 | 21,584 | 24,861 | 21,644 |
| 10/31/2017 | 27,452 | 25,933 | 27,393 | 31,386 | 27,299 |
| 10/31/2018 | 30,827 | 28,953 | 30,577 | 33,313 | 28,715 |
| 10/31/2019 | 36,985 | 34,603 | 36,460 | 39,619 | 32,717 |
41 graphic description end -->
| ■ | Total returns shown for Class A Shares include the maximum sales charge of 5.50% ($10,000 investment minus $550 sales charge = $9,450). |
| ■ | Total returns shown for Class R Shares include the redemption fee of 0.20%. |
The Fund offers multiple share classes whose performance may be greater than or less than its other share class(es) due to differences in sales charges and expenses. See the Average Annual Return table below for the returns of additional classes not shown in the line graph above.
Average Annual Total Returnsfor the Period Ended 10/31/2019
(returns reflect all applicable sales charges and contingent deferred sales charges as specified below in footnote #1)
| | 1 Year | 5 Years | 10 Years |
| Class A Shares | 12.94% | 11.61% | 13.22% |
| Class B Shares | 13.38% | 12.10% | 13.33% |
| Class C Shares | 17.69% | 12.30% | 13.23% |
| Class R Shares | 19.24% | 12.81% | 13.81% |
| Institutional Shares4 | 19.98% | 13.20% | 13.97% |
| RMCGI | 18.93% | 10.92% | 14.76% |
| MMCGFA | 14.13% | 9.49% | 13.18% |
Annual Shareholder Report
Performance data quoted represents past performance which is no guarantee of future results. Investment return and principal value will fluctuate so that an investor's shares, when redeemed, may be worth more or less than their original cost. Mutual fund performance changes over time and current performance may be lower or higher than what is stated. For current to the most recent month-end performance and after-tax returns, visit FederatedInvestors.com or call 1-800-341-7400. Returns shown do not reflect the deduction of taxes that a shareholder would pay on Fund distributions or the redemption of Fund shares. Mutual funds are not obligations of or guaranteed by any bank and are not federally insured.
| 1 | Represents a hypothetical investment of $10,000 in the Fund after deducting applicable sales charges: For Class A Shares, the maximum sales charge of 5.50% ($10,000 investment minus $550 sales charge = $9,450); for Class B Shares, the maximum contingent deferred sales charge is 5.50% on any redemption less than one year from the purchase date; for Class C Shares, the maximum contingent deferred sales charge is 1.00% on any redemption less than one year from the purchase date; for Class R Shares, the ending value reflects a 0.20% redemption fee. The Fund's performance assumes the reinvestment of all dividends and distributions. The RMCGI and MMCGFA have been adjusted to reflect reinvestment of all dividends on securities in the index and the average. |
| 2 | The RMCGI measures the performance of the mid-cap growth segment of the U.S. equity universe. It includes those Russell Midcap® Index companies with higher price-to-book ratios and higher forecasted growth values. The RMCGI is constructed to provide a comprehensive and unbiased barometer of the mid-cap growth market and is completely reconstituted annually to ensure larger stocks do not distort the performance and characteristics of the true mid-cap growth market. The RMCGI is not adjusted to reflect sales charges, expenses or other fees that the Securities and Exchange Commission requires to be reflected in the Fund's performance. The index is unmanaged and unlike the Fund, is not affected by cash flows. It is not possible to invest directly in an index. |
| 3 | Morningstar figures represent the average of the total returns reported by all the funds designated by Morningstar as falling into the respective category indicated. They do not reflect sales charges. The Morningstar figures in the Growth of $10,000 line graph are based on historical return information published by Morningstar and reflect the return of the funds comprising the category in the year of publication. Because the funds designated by Morningstar as falling into the category can change over time, the Morningstar figures in the line graph may not match the Morningstar figures in the Average Annual Total Returns table, which reflect the return of the funds that currently comprise the category. |
| 4 | The Fund's Institutional Shares commenced operations on December 29, 2016. The Fund offers four other classes of shares: Class A Shares, Class B Shares, Class C Shares and Class R Shares. For the period prior to the commencement of operations of the Institutional Shares, the performance information shown is for the Fund's Class R Shares. In relation to the Institutional Shares, the performance of Class R Shares has not been adjusted to reflect the expenses of the Institutional Shares since the Institutional Shares have a lower expense ratio than the expense ratio of the Class R Shares. The performance of Class R Shares has been adjusted to remove any voluntary waiver of Fund expenses related to the Class R Shares that may have occurred during the period prior to the commencement of operations of the Institutional Shares. |
Annual Shareholder Report
Portfolio of Investments Summary Table (unaudited)
At October 31, 2019, the Fund's sector composition1 was follows:
| Sector Composition | Percentage of
Total Net Assets |
| Health Care | 27.6% |
| Information Technology | 18.3% |
| Materials | 9.6% |
| Industrials | 8.9% |
| Consumer Discretionary | 6.1% |
| Financials | 4.6% |
| Real Estate | 3.0% |
| Energy | 0.5% |
| Consumer Staples | 0.1% |
| Securities Lending Collateral2 | 9.6% |
| Cash Equivalents3 | 22.6% |
| Other Assets and Liabilities—Net4 | (10.9)% |
| TOTAL | 100.0% |
| 1 | Except for Securities Lending Collateral, Cash Equivalents and Other Assets and Liabilities, sector classifications are based upon, and individual portfolio securities are assigned to, the classifications of the Global Industry Classification System (GICS), except that the Adviser assigns a classification to securities not classified by the GICS and to securities for which the Adviser does not have access to the classification made by the GICS. |
| 2 | Represents cash collateral received for portfolio securities on loan that may be invested in affiliated money market funds, other money market instruments and/or repurchase agreements. |
| 3 | Cash Equivalents include any investments in money market mutual funds and/or overnight repurchase agreements other than those representing cash collateral for securities lending. |
| 4 | Assets, other than investments in securities, less liabilities. See Statement of Assets and Liabilities. |
Annual Shareholder Report
Portfolio of Investments
October 31, 2019
| Shares | | | Value |
| | | COMMON STOCKS—78.6% | |
| | | Consumer Discretionary—6.1% | |
| 130,000 | 1 | Alibaba Group Holding Ltd., ADR | $22,967,100 |
| 24,100 | 1 | Amazon.com, Inc. | 42,817,506 |
| 300,000 | 1,2 | Etsy, Inc. | 13,347,000 |
| 785,000 | 1,2 | Floor & Decor Holdings, Inc. | 35,976,550 |
| 221,253 | 1,2 | GrubHub, Inc. | 7,535,877 |
| 257,300 | | Hilton Worldwide Holdings, Inc. | 24,947,808 |
| 60,100 | | Home Depot, Inc. | 14,098,258 |
| 575,000 | | Las Vegas Sands Corp. | 35,558,000 |
| 525,000 | 1,2 | Luckin Coffee, Inc., ADR | 10,279,500 |
| 965,000 | | Moncler S.p.A | 37,277,285 |
| 27,131,566 | | NagaCorp Ltd. | 49,302,342 |
| 219,078 | 1,2 | Peloton Interactive, Inc. | 5,229,392 |
| 150,000 | 1 | Planet Fitness, Inc. | 9,549,000 |
| 100,000 | 1 | Takeaway.com Holding BV | 8,144,244 |
| 296,000 | 1,2 | The RealReal, Inc. | 6,840,560 |
| 148,300 | | Vail Resorts, Inc. | 34,460,471 |
| 547,400 | 2 | Wingstop, Inc. | 45,669,582 |
| | | TOTAL | 404,000,475 |
| | | Consumer Staples—0.1% | |
| 120,500 | 1,2 | Beyond Meat, Inc. | 10,176,225 |
| | | Energy—0.5% | |
| 479,886 | | Euronav NV | 5,341,131 |
| 1,200,000 | 1,2 | New Fortress Energy LLC | 20,688,000 |
| 400,000 | 1,2 | Rattler Midstream Partners LP | 6,008,000 |
| | | TOTAL | 32,037,131 |
| | | Financials—4.6% | |
| 340,600 | 1 | ARYA Sciences Acquisition Corp. | 3,712,540 |
| 3,445,000 | | Ashmore Group PLC | 20,816,579 |
| 150,000 | | BlackRock, Inc. | 69,255,000 |
| 350,389 | | Eurazeo SA | 24,433,211 |
| 1 | 1,3,4 | FA Private Equity Fund IV LP | 424,545 |
| 6,127,305 | | FinecoBank Banca Fineco SPA | 69,095,871 |
| 715,000 | | Hamilton Lane, Inc. | 42,628,300 |
| 1 | 1,3,4 | Infrastructure Fund | 0 |
| 1,000,000 | | KKR & Co., Inc. | 28,830,000 |
Annual Shareholder Report
| Shares | | | Value |
| | | COMMON STOCKS—continued | |
| | | Financials—continued | |
| 6,001 | 1 | Markel Corp. | $7,027,171 |
| 2,000,000 | 1,2 | Qudian Inc., ADR | 13,860,000 |
| 260,000 | | Raymond James Financial, Inc. | 21,707,400 |
| | | TOTAL | 301,790,617 |
| | | Health Care—27.5% | |
| 400,000 | | Abbott Laboratories | 33,444,000 |
| 960,000 | 1 | Albireo Pharma, Inc | 17,635,200 |
| 2,100,000 | 1,2 | Alector, Inc. | 35,364,000 |
| 68,602 | 1 | Alnylam Pharmaceuticals, Inc. | 5,950,538 |
| 1,800,000 | 1,2 | Amarin Corporation PLC., ADR | 29,556,000 |
| 815,000 | 1 | Amphastar Pharmaceuticals, Inc. | 15,741,725 |
| 800,000 | 1,2 | AnaptysBio, Inc. | 30,176,000 |
| 1 | 3,4 | Apollo Investment Fund V | 86,372 |
| 1,185,000 | 1 | Argenx SE | 144,567,252 |
| 1,250,000 | 1,2 | Atara Biotherapeutics, Inc. | 13,650,000 |
| 860,000 | 1 | Boston Scientific Corp. | 35,862,000 |
| 580,000 | 1,2 | CRISPR Therapeutics AG | 29,214,600 |
| 3,100,000 | 1 | Calithera Biosciences, Inc. | 8,928,000 |
| 1,580,000 | 1,2 | Catabasis Pharmaceuticals, Inc. | 7,963,200 |
| 8,640,000 | 1 | Corcept Therapeutics, Inc. | 126,057,600 |
| 385,000 | | Danaher Corp. | 53,060,700 |
| 360,000 | 1 | Dexcom, Inc. | 55,526,400 |
| 4,600,000 | 1 | Dynavax Technologies Corp. | 23,414,000 |
| 850,000 | 1,2 | Editas Medicine, Inc. | 17,714,000 |
| 92,500 | 1 | Edwards Lifesciences Corp. | 22,050,150 |
| 770,000 | 1,2 | Frequency Therapeutics, Inc. | 11,088,000 |
| 160,000 | 1,2 | GW Pharmaceuticals PLC, ADR | 21,411,200 |
| 503,990 | 1 | Galapagos NV | 92,829,611 |
| 636,000 | 1 | Galapagos NV, ADR | 117,004,920 |
| 240,000 | 1 | Genmab A/S | 52,305,261 |
| 385,000 | 1 | Genmab A/S, ADR | 8,412,250 |
| 525,000 | 1,2 | Glaukos Corp. | 33,510,750 |
| 450,000 | 1,2 | Gossamer Bio, Inc. | 9,258,750 |
| 75,000 | 1 | IDEXX Laboratories, Inc. | 21,375,750 |
| 99,971 | 1 | Illumina, Inc. | 29,543,430 |
| 337,500 | 1,2 | Insulet Corp. | 49,045,500 |
| 1 | 1,3,4 | Latin Healthcare Fund | 333,166 |
| 7,490,000 | 1 | Minerva Neurosciences, Inc. | 35,502,600 |
Annual Shareholder Report
| Shares | | | Value |
| | | COMMON STOCKS—continued | |
| | | Health Care—continued | |
| 500,000 | 1,2 | Natera, Inc. | $19,260,000 |
| 960,000 | 1,2 | Nektar Therapeutics | 16,440,000 |
| 150,000 | 1,2 | Penumbra, Inc. | 23,395,500 |
| 415,000 | 1 | Repligen Corp. | 32,988,350 |
| 1,013,600 | 1,2 | Rhythm Pharmaceuticals, Inc. | 21,609,952 |
| 5,360,000 | 1,2 | Scynexis, Inc. | 6,271,200 |
| 385,000 | 1,2 | Seres Therapeutics, Inc. | 1,347,500 |
| 959,018 | 1,4 | Soteira, Inc. | 0 |
| 385,000 | 1 | Stoke Therapeutics, Inc. | 10,910,900 |
| 125,000 | | Stryker Corp. | 27,033,750 |
| 1,030,000 | 1 | Tandem Diabetes Care, Inc. | 63,427,400 |
| 300,000 | 1,2 | Teladoc, Inc. | 22,980,000 |
| 536,795 | 1,2 | Translate Bio, Inc. | 4,908,990 |
| 70,000 | 1,2 | Twist Bioscience Corp. | 1,667,400 |
| 1,920,000 | 1,2 | Ultragenyx Pharmaceutical, Inc. | 77,068,800 |
| 2,100,000 | 1,2 | UniQure N.V. | 105,084,000 |
| 800,000 | 1 | Veeva Systems, Inc. | 113,464,000 |
| 550,000 | 1,2 | Vericel Corp. | 8,728,500 |
| 730,000 | 1,2 | Zai Lab Ltd., ADR | 24,666,700 |
| 875,000 | 1,2 | Zogenix, Inc. | 39,068,750 |
| | | TOTAL | 1,807,904,617 |
| | | Industrials—8.9% | |
| 1,235,000 | | Air Lease Corp. | 54,315,300 |
| 1,850,000 | 1,2 | Azul S.A., ADR | 72,113,000 |
| 140,000 | 1 | CoStar Group, Inc. | 76,932,800 |
| 115,000 | 1,2 | Generac Holdings, Inc. | 11,106,700 |
| 700,000 | 2 | Heico Corp. | 86,338,000 |
| 600,000 | 1 | IHS Markit Ltd. | 42,012,000 |
| 1,025,000 | 1,2 | Mercury Systems, Inc. | 75,501,500 |
| 255,000 | | Roper Technologies, Inc. | 85,924,800 |
| 393,000 | 1,2 | Trex Co., Inc. | 34,540,770 |
| 900,000 | 1,2 | Upwork, Inc. | 13,536,000 |
| 232,000 | | Verisk Analytics, Inc. | 33,570,400 |
| | | TOTAL | 585,891,270 |
| | | Information Technology—18.3% | |
| 54,900 | 1 | Adobe, Inc. | 15,258,357 |
| 2,081,691 | 1 | Advanced Micro Devices, Inc. | 70,631,776 |
| 232,141 | 1 | Ansys, Inc. | 51,105,841 |
Annual Shareholder Report
| Shares | | | Value |
| | | COMMON STOCKS—continued | |
| | | Information Technology—continued | |
| 140,000 | | Broadcom, Inc. | $40,999,000 |
| 525,000 | 1,2 | Coupa Software, Inc. | 72,182,250 |
| 100,000 | 1 | DocuSign, Inc. | 6,619,000 |
| 515,000 | 1 | Envestnet, Inc. | 32,182,350 |
| 100,000 | 1,2 | Everbridge, Inc. | 6,951,000 |
| 778,605 | 1 | Evry AS | 3,045,165 |
| 1,059,322 | 1,3,4 | Expand Networks Ltd. | 0 |
| 335,000 | | Fidelity National Information Services, Inc. | 44,139,600 |
| 1,875,000 | 1,2 | GDS Holdings Ltd., ADR | 78,150,000 |
| 600,000 | 1 | GoDaddy, Inc. | 39,018,000 |
| 1,415,000 | | Marvell Technology Group Ltd. | 34,511,850 |
| 565,973 | 1,2 | Medallia, Inc. | 16,458,495 |
| 1,947,128 | 1,2 | Nexi SpA | 20,169,312 |
| 1,794,674 | 1,2 | PagSeguro Digital Ltd. | 66,546,512 |
| 530,500 | 1 | Q2 Holdings, Inc. | 37,925,445 |
| 1,185,000 | 1 | Radware Ltd. | 26,733,600 |
| 560,000 | 1,2 | Rapid7, Inc. | 28,050,400 |
| 350,000 | 1 | RealPage, Inc. | 21,192,500 |
| 100,000 | 1 | Salesforce.com, Inc. | 15,649,000 |
| 3,751 | 1,3,4 | Sensable Technologies, Inc. | 0 |
| 599,265 | 1 | ServiceNow, Inc. | 148,174,264 |
| 290,000 | 1,2 | Shopify, Inc. | 90,935,300 |
| 600,000 | 1,2 | Splunk, Inc. | 71,976,000 |
| 245,409 | 1 | Tyler Technologies, Inc. | 65,897,225 |
| 595,466 | 1,2 | Workday, Inc. | 96,560,766 |
| | | TOTAL | 1,201,063,008 |
| | | Materials—9.6% | |
| 1,330,000 | 2,3 | Agnico Eagle Mines Ltd. | 81,755,100 |
| 10,950,000 | 1 | B2Gold Corp. | 38,492,521 |
| 275,000 | | Ball Corp. | 19,241,750 |
| 3,025,000 | | Barrick Gold Corp. | 52,514,000 |
| 2,000,000 | 1,2 | Endeavour Financial Corp. | 36,215,929 |
| 70,000 | | Franco-Nevada Corp. | 6,792,195 |
| 6,600,000 | 1 | Kinross Gold Corp. | 32,010,000 |
| 850,000 | | Kirkland Lake Gold Ltd. | 39,907,500 |
| 1,240,000 | | Newcrest Mining Ltd. | 27,082,291 |
| 1,635,000 | | Newmont Goldcorp Corp. | 64,958,550 |
| 2,400,000 | 2 | Osisko Gold Royalties Ltd. | 23,616,000 |
Annual Shareholder Report
| Shares | | | Value |
| | | COMMON STOCKS—continued | |
| | | Materials—continued | |
| 200,000 | 2 | Pan American Silver Corp. | $3,410,000 |
| 2,725,000 | 1,2 | Pretium Resources, Inc. | 27,577,000 |
| 132,200 | | Sherwin-Williams Co. | 75,660,704 |
| 438,247 | | Vulcan Materials Co. | 62,612,349 |
| 119,000 | 2 | Wheaton Precious Metals Corp. | 3,340,330 |
| 9,725,000 | 2 | Yamana Gold, Inc. | 35,399,000 |
| | | TOTAL | 630,585,219 |
| | | Real Estate—3.0% | |
| 525,000 | 2 | Americold Realty Trust | 21,047,250 |
| 400,000 | 1 | CBRE Group, Inc. | 21,420,000 |
| 206,000 | | Crown Castle International Corp. | 28,590,740 |
| 1,150,000 | | JBG Smith Properties | 46,299,000 |
| 250,000 | | Lamar Advertising Co. | 20,002,500 |
| 600,000 | | MGM Growth Properties LLC | 18,726,000 |
| 390,000 | | Ryman Hospitality Properties | 32,826,300 |
| 200,000 | | STAG Industrial, Inc. | 6,208,000 |
| | | TOTAL | 195,119,790 |
| | | TOTAL COMMON STOCKS
(IDENTIFIED COST $2,897,224,427) | 5,168,568,352 |
| | | PREFERRED STOCK—0.0% | |
| | | Information Technology—0.0% | |
| 679,348 | 1,3,4 | Multiplex, Inc., Pfd., Series C
(IDENTIFIED COST $5,000,001) | 0 |
| | | WARRANTS—0.1% | |
| | | Health Care—0.1% | |
| 421,550 | 1 | Catabasis Pharmaceuticals, Inc., Warrants, 2/8/2024 | 1,036,044 |
| 801,900 | 1 | Catabasis Pharmaceuticals, Inc., Warrants, 6/22/2022 | 1,157,382 |
| 3,445,000 | 1 | ContraFect Corp., Warrants, 7/20/2022 | 194,987 |
| 1,735,000 | 1 | ContraFect Corp., Warrants, 7/27/2021 | 59,684 |
| 377,500 | 1 | Dynavax Technologies Corp., Warrants, 2/12/2022 | 1,072,440 |
| 1,017,000 | 1 | Scynexis, Inc., Warrants, 3/8/2023 | 453,785 |
| 848,250 | 1 | Scynexis, Inc., Warrants, 4/6/2021 | 124,269 |
| | | TOTAL WARRANTS
(IDENTIFIED COST $51,800) | 4,098,591 |
Annual Shareholder Report
| Shares | | | Value |
| | | INVESTMENT COMPANY—32.2% | |
| 110,475,332 | | Federated Government Obligations Fund, Premier Shares, 1.75%5 | $110,475,332 |
| 2,005,572,182 | | Federated Institutional Prime Value Obligations Fund, Institutional Shares, 1.93%5 | 2,006,173,853 |
| | | TOTAL INVESTMENT COMPANY
(IDENTIFIED COST $2,116,279,686) | 2,116,649,185 |
| | | TOTAL INVESTMENT IN SECURITIES—110.9%
(IDENTIFIED COST $5,018,555,914)6 | 7,289,316,128 |
| | | OTHER ASSETS AND LIABILITIES - NET—(10.9)%7 | (716,559,755) |
| | | TOTAL NET ASSETS—100% | $6,572,756,373 |
Annual Shareholder Report
[PAGE INTENTIONALLY LEFT BLANK]
Annual Shareholder Report
An affiliated company is a company in which the Fund, alone or in combination with other funds, has ownership of at least 5% of the voting shares. Transactions with affiliated companies during the year ended October 31, 2019, were as follows:
| | Balance of
Shares
Held
10/31/2018 | Purchases/
Additions* | Sales/
Reductions* |
| Energy: | | | |
| New Fortress Energy LLC | — | 1,200,000 | — |
| Financials: | | | |
| Hamilton Lane, Inc.** | 865,685 | — | (150,685) |
| Health Care: | | | |
| Albireo Pharma, Inc | 439,610 | 560,390 | (40,000) |
| Alector, Inc. | 585,000 | 1,515,000 | — |
| Argenx SE | 1,793,314 | — | (608,314) |
| ARYA Sciences Acquisition Corp. | 340,600 | — | — |
| Calithera Biosciences, Inc. | 2,349,072 | 848,830 | (97,902) |
| Catabasis Pharmaceuticals, Inc.*** | 8,019,000 | 843,100 | (65,000) |
| Catabasis Pharmaceuticals, Inc., Warrants, 2/8/2024 | — | 421,550 | — |
| Catabasis Pharmaceuticals, Inc., Warrants, 6/22/2022*** | 8,019,000 | — | (7,217,100) |
| ContraFect Corp., Warrants, 7/27/2021** | 1,735,000 | — | — |
| ContraFect Corp., Warrants, 7/20/2022** | 3,445,000 | — | — |
| Corcept Therapeutics, Inc. | 12,000,000 | — | (3,360,000) |
| Dynavax Technologies Corp. | 1,049,081 | 4,355,593 | (804,674) |
| Dynavax Technologies Corp., Warrants, 2/12/2022 | — | 377,500 | — |
| Minerva Neurosciences, Inc. | 6,075,000 | 1,415,000 | — |
| Scynexis, Inc. | 5,585,000 | — | (225,000) |
| Scynexis, Inc., Warrants, 4/6/2021 | 848,250 | — | — |
| Scynexis, Inc., Warrants, 3/8/2023 | 1,017,000 | — | — |
| Soteira, Inc. | 959,018 | — | — |
| UniQure N.V. | 1,200,000 | 1,700,000 | (800,000) |
| Affiliated Issuers no longer in the portfolio at period end | 12,859,616 | — | (12,859,616) |
| TOTAL OF AFFILIATED TRANSACTIONS | 69,184,246 | 13,236,963 | (26,228,291) |
Annual Shareholder Report
Balance of
Shares
Held
10/31/2019 | Value | Change in
Unrealized
Appreciation/
Depreciation | Net
Realized
Gain/(Loss)* | Dividend
Income* |
| | | | | |
| 1,200,000 | $20,688,000 | $3,801,080 | $— | $— |
| | | | | |
| 715,000 | $42,628,300 | $ 12,288,340 | $3,543,465 | $761,166 |
| | | | | |
| 960,000 | $17,635,200 | $(11,609,754) | $(695,336) | $— |
| 2,100,000 | $35,364,000 | (1,111,230) | $— | $— |
| 1,185,000 | $144,567,252 | $11,939,288 | $67,271,707 | $— |
| 340,600 | $3,712,540 | $204,360 | $— | $— |
| 3,100,000 | $8,928,000 | $ (4,757,930) | $(539,592) | $— |
| 8,797,100 | $7,963,200 | $(758,517) | $(331,190) | $— |
| 421,550 | $1,036,044 | $1,036,043 | $— | $— |
| 801,900 | $1,157,382 | $(1,163,316) | $— | $— |
| 1,735,000 | $59,684 | $(1,287,023) | $— | $— |
| 3,445,000 | $194,987 | $(1,981,564) | $— | $— |
| 8,640,000 | $126,057,600 | $11,280,027 | $17,921,951 | $— |
| 4,600,000 | $23,414,000 | $1,932,336 | $(7,929,514) | $— |
| 377,500 | $1,072,440 | $1,072,440 | $— | $— |
| 7,490,000 | $35,502,600 | $(40,621,514) | $— | $— |
| 5,360,000 | $6,271,200 | $2,790,092 | $(1,873,868) | $— |
| 848,250 | $124,269 | $(2,460) | $— | $— |
| 1,017,000 | $453,785 | $76,885 | $— | $— |
| 959,018 | $10,910,900 | $— | $— | $— |
| 2,100,000 | $105,084,000 | $25,596,901 | $12,100,146 | $— |
| — | — | $(38,716,858) | $— | $— |
| 56,192,918 | $592,825,383 | $(29,992,374) | $89,467,769 | $761,166 |
| * | A portion of the amount shown was recorded when the Fund no longer had ownership of at least 5% of the voting shares. |
| ** | At October 31, 2019, the Fund no longer has ownership of at least 5% voting shares. |
*** A 1:10 reverse stock split occurred for this issue on December 31, 2018.
Annual Shareholder Report
Affiliated fund holdings are investment companies which are managed by the Adviser or an affiliate of the Adviser. Transactions with affiliated fund holdings during the period ended October 31, 2019, were as follows:
| | Federated
Government
Obligations
Fund,
Institutional
Shares* | Federated
Institutional
Prime Value
Obligations
Fund,
Institutional
Shares* | Total of
Affiliated
Transactions |
| Balance of Shares Held 10/31/2018 | 103,275,656 | 1,708,079,602 | 1,811,355,258 |
| Purchases/Additions | 2,006,845,824 | 9,006,434,456 | 11,013,280,280 |
| Sales/Reductions | (1,999,646,148) | (8,708,941,876) | (10,708,588,024) |
| Balance of Shares Held 10/31/2019 | 110,475,332 | 2,005,572,182 | 2,116,047,514 |
| Value | $110,475,332 | $2,006,173,853 | $2,116,649,185 |
| Change in Unrealized Appreciation/Depreciation | N/A | $282,668 | $282,668 |
| Net Realized Gain/(Loss) | N/A | $(64,764) | $(64,764) |
| Dividend Income | $2,987,870 | $44,222,076 | $47,209,946 |
| * | All or a portion of the balance/activity for the fund relates to cash collateral received on securities lending transactions. |
| 1 | Non-income-producing security. |
| 2 | All or a portion of these securities are temporarily on loan to unaffiliated broker/dealers. |
| 3 | Denotes a restricted security that either: (a) cannot be offered for public sale without first being registered, or availing of an exemption from registration, under the Securities Act of 1933; or (b) is subject to a contractual restriction on public sales. At October 31, 2019, these restricted securities amounted to $82,599,183, which represented 1.3% of total net assets. |
| 4 | Market quotations and price evaluations are not available. Fair value determined using significant unobservable inputs in accordance with procedures established by and under the general supervision of the Fund's Board of Trustees (the "Trustees"). |
| 5 | 7-day net yield. |
| 6 | The cost of investments for federal tax purposes amounts to $5,039,238,584. |
| 7 | Assets, other than investments in securities, less liabilities. See Statement of Assets and Liabilities. A significant portion of this balance represents loans to unaffiliated qualified brokers for securities lending. The Fund receives cash from the broker as collateral for the loaned securities and reinvests the collateral in certain short-term securities such as affiliated money market funds, other money market instruments and/or repurchase agreements. |
Note: The categories of investments are shown as a percentage of total net assets at October 31, 2019.
Annual Shareholder Report
Various inputs are used in determining the value of the Fund's investments. These inputs are summarized in the three broad levels listed below:
Level 1—quoted prices in active markets for identical securities.
Level 2—other significant observable inputs (including quoted prices for similar securities, interest rates, prepayment speeds, credit risk, etc.). Also includes securities valued at amortized cost.
Level 3—significant unobservable inputs (including the Fund's own assumptions in determining the fair value of investments).
The inputs or methodology used for valuing securities are not an indication of the risk associated with investing in those securities.
The following is a summary of the inputs used, as of October 31, 2019, in valuing the Fund's assets carried at fair value:
| Valuation Inputs | | | | |
| | Level 1—
Quoted
Prices
| Level 2—
Other
Significant
Observable
Inputs | Level 3—
Significant
Unobservable
Inputs | Total |
| Equity Securities: | | | | |
| Common Stocks | | | | |
| Domestic | $3,435,114,0661 | $— | $844,083 | $3,435,958,149 |
| International | 1,183,541,778 | 549,068,425 | — | 1,732,610,203 |
| Preferred Stocks | | | | |
| Domestic | — | — | 0 | 0 |
| Debt Securities: | | | | |
| Warrants | — | 4,098,591 | — | 4,098,591 |
| Investment Companies | 2,116,649,185 | — | — | 2,116,649,185 |
| TOTAL SECURITIES | $6,735,305,029 | $553,167,016 | $844,083 | $7,289,316,128 |
| 1 | Includes $7,792,982 transferred from Level 3 to Level 1 because observable market data was obtained for a security. This transfer represents the value of the security at the beginning of the period. |
The following acronym is used throughout this portfolio:
| ADR | —American Depositary Receipt |
See Notes which are an integral part of the Financial Statements
Annual Shareholder Report
Financial Highlights–Class A Shares
(For a Share Outstanding Throughout Each Period)
| Year Ended October 31 | 2019 | 2018 | 2017 | 2016 | 2015 |
| Net Asset Value, Beginning of Period | $6.03 | $6.06 | $5.27 | $6.02 | $6.60 |
| Income FromInvestment Operations: | | | | | |
| Net investment income (loss) | (0.05)1 | (0.06)1 | (0.06)1 | (0.05)1 | (0.08)1 |
| Net realized and unrealized gain | 1.09 | 0.69 | 1.37 | 0.16 | 0.46 |
| TOTAL FROM INVESTMENT OPERATIONS | 1.04 | 0.63 | 1.31 | 0.11 | 0.38 |
| Less Distributions: | | | | | |
| Distributions from net realized gain | (0.80) | (0.66) | (0.52) | (0.86) | (0.96) |
| Net Asset Value, End of Period | $6.27 | $6.03 | $6.06 | $5.27 | $6.02 |
| Total Return2 | 19.52% | 11.64% | 26.97% | 1.77% | 6.29% |
| Ratios to Average Net Assets: | | | | | |
| Net expenses | 1.95% | 1.95% | 1.95%3 | 1.95%3 | 1.95%3 |
| Net investment loss | (0.81)% | (1.02)% | (1.13)% | (1.00)% | (1.22)% |
| Expense waiver/reimbursement4 | 0.03% | 0.03% | 0.04% | 0.06% | 0.05% |
| Supplemental Data: | | | | | |
| Net assets, end of period (000 omitted) | $1,629,524 | $1,491,496 | $1,324,155 | $1,364,222 | $1,582,916 |
| Portfolio turnover | 42% | 33% | 47% | 55% | 51% |
| 1 | Per share numbers have been calculated using the average shares method. |
| 2 | Based on net asset value, which does not reflect the sales charge, redemption fee or contingent deferred sales charge, if applicable. |
| 3 | The net expense ratio is calculated without reduction for fees paid indirectly for expense offset arrangements. The net expense ratios are 1.95%, 1.95% and 1.95% for the years ended October 31, 2017, 2016 and 2015, respectively, after taking into account these expense reductions. |
| 4 | This expense decrease is reflected in both the net expense and the net investment income (loss) ratios shown above. |
See Notes which are an integral part of the Financial Statements
Annual Shareholder Report
Financial Highlights–Class B Shares
(For a Share Outstanding Throughout Each Period)
| Year Ended October 31 | 2019 | 2018 | 2017 | 2016 | 2015 |
| Net Asset Value, Beginning of Period | $4.99 | $5.15 | $4.58 | $5.36 | $6.00 |
| Income From Investment Operations: | | | | | |
| Net investment income (loss) | (0.06)1 | (0.08)1 | (0.08)1 | (0.07)1 | (0.10)1 |
| Net realized and unrealized gain | 0.87 | 0.58 | 1.17 | 0.15 | 0.42 |
| TOTAL FROM INVESTMENT OPERATIONS | 0.81 | 0.50 | 1.09 | 0.08 | 0.32 |
| Less Distributions: | | | | | |
| Distributions from net realized gain | (0.80) | (0.66) | (0.52) | (0.86) | (0.96) |
| Net Asset Value, End of Period | $5.00 | $4.99 | $5.15 | $4.58 | $5.36 |
| Total Return2 | 18.88% | 11.11% | 26.16% | 1.34% | 5.83% |
| Ratios to Average Net Assets: | | | | | |
| Net expenses | 2.45% | 2.46% | 2.47%3 | 2.48%3 | 2.48%3 |
| Net investment income (loss) | (1.32)% | (1.54)% | (1.65)% | (1.52)% | (1.74)% |
| Expense waiver/reimbursement4 | 0.03% | 0.03% | 0.03% | 0.03% | 0.03% |
| Supplemental Data: | | | | | |
| Net assets, end of period (000 omitted) | $41,483 | $50,468 | $65,410 | $72,634 | $99,777 |
| Portfolio turnover | 42% | 33% | 47% | 55% | 51% |
| 1 | Per share numbers have been calculated using the average shares method. |
| 2 | Based on net asset value, which does not reflect the sales charge, redemption fee or contingent deferred sales charge, if applicable. |
| 3 | The net expense ratio is calculated without reduction for fees paid indirectly for expense offset arrangements. The net expense ratios are 2.47%, 2.48% and 2.48% for the years ended October 31, 2017, 2016 and 2015, respectively, after taking into account these expense reductions. |
| 4 | This expense decrease is reflected in both the net expense and the net investment income (loss) ratios shown above. |
See Notes which are an integral part of the Financial Statements
Annual Shareholder Report
Financial Highlights–Class C Shares
(For a Share Outstanding Throughout Each Period)
| Year Ended October 31 | 2019 | 2018 | 2017 | 2016 | 2015 |
| Net Asset Value, Beginning of Period | $4.99 | $5.14 | $4.57 | $5.36 | $6.00 |
| Income From Investment Operations: | | | | | |
| Net investment income (loss) | (0.06)1 | (0.08)1 | (0.08)1 | (0.07)1 | (0.10)1 |
| Net realized and unrealized gain | 0.86 | 0.59 | 1.17 | 0.14 | 0.42 |
| TOTAL FROM INVESTMENT OPERATIONS | 0.80 | 0.51 | 1.09 | 0.07 | 0.32 |
| Less Distributions: | | | | | |
| Distributions from net realized gain | (0.80) | (0.66) | (0.52) | (0.86) | (0.96) |
| Net Asset Value, End of Period | $4.99 | $4.99 | $5.14 | $4.57 | $5.36 |
| Total Return2 | 18.69% | 11.36% | 26.22% | 1.15% | 5.86% |
| Ratios to Average Net Assets: | | | | | |
| Net expenses | 2.45% | 2.46% | 2.47%3 | 2.48%3 | 2.48%3 |
| Net investment income (loss) | (1.31)% | (1.56)% | (1.65)% | (1.52)% | (1.75)% |
| Expense waiver/reimbursement4 | 0.03% | 0.03% | 0.03% | 0.03% | 0.03% |
| Supplemental Data: | | | | | |
| Net assets, end of period (000 omitted) | $135,883 | $144,284 | $306,011 | $343,129 | $418,926 |
| Portfolio turnover | 42% | 33% | 47% | 55% | 51% |
| 1 | Per share numbers have been calculated using the average shares method. |
| 2 | Based on net asset value, which does not reflect the sales charge, redemption fee or contingent deferred sales charge, if applicable. |
| 3 | The net expense ratio is calculated without reduction for fees paid indirectly for expense offset arrangements. The net expense ratios are 2.47%, 2.48% and 2.48% for the years ended October 31, 2017, 2016 and 2015, respectively, after taking into account these expense reductions. |
| 4 | This expense decrease is reflected in both the net expense and the net investment income (loss) ratios shown above. |
See Notes which are an integral part of the Financial Statements
Annual Shareholder Report
Financial Highlights–Class R Shares
(For a Share Outstanding Throughout Each Period)
| Year Ended October 31 | 2019 | 2018 | 2017 | 2016 | 2015 |
| Net Asset Value, Beginning of Period | $6.04 | $6.07 | $5.28 | $6.03 | $6.61 |
| Income From Investment Operations: | | | | | |
| Net investment income (loss) | (0.05)1 | (0.06)1 | (0.06)1 | (0.05)1 | (0.08)1 |
| Net realized and unrealized gain | 1.09 | 0.69 | 1.37 | 0.16 | 0.46 |
| TOTAL FROM INVESTMENT OPERATIONS | 1.04 | 0.63 | 1.31 | 0.11 | 0.38 |
| Less Distributions: | | | | | |
| Distributions from net realized gain | (0.80) | (0.66) | (0.52) | (0.86) | (0.96) |
| TOTAL DISTRIBUTIONS | (0.80) | (0.66) | (0.52) | (0.86) | (0.96) |
| Net Asset Value, End of Period | $6.28 | $6.04 | $6.07 | $5.28 | $6.03 |
| Total Return2 | 19.48% | 11.62% | 26.92% | 1.76% | 6.28% |
| Ratios to Average Net Assets: | | | | | |
| Net expenses | 1.95% | 1.95% | 1.95%3 | 1.95%3 | 1.95%3 |
| Net investment income (loss) | (0.81)% | (1.03)% | (1.14)% | (1.00)% | (1.22)% |
| Expense waiver/reimbursement4 | 0.26% | 0.27% | 0.28% | 0.29% | 0.29% |
| Supplemental Data: | | | | | |
| Net assets, end of period (000 omitted) | $4,313,852 | $3,877,851 | $3,704,278 | $3,206,317 | $3,452,182 |
| Portfolio turnover | 42% | 33% | 47% | 55% | 51% |
| 1 | Per share numbers have been calculated using the average shares method. |
| 2 | Based on net asset value. |
| 3 | The net expense ratio is calculated without reduction for expense offset arrangements. The net expense ratios are 1.95%, 1.95% and 1.95% for the years ended October 31, 2017, 2016 and 2015, respectively, after taking into account these expense reductions. |
| 4 | This expense decrease is reflected in both the net expense and the net investment income (loss) ratios shown above. |
See Notes which are an integral part of the Financial Statements
Annual Shareholder Report
Financial Highlights–Institutional Shares
(For a Share Outstanding Throughout Each Period)
| | Year Ended October 31, | Period
Ended
10/31/20171 |
| 2019 | 2018 |
| Net Asset Value, Beginning of Period | $6.11 | $6.10 | $4.94 |
| Income From Investment Operations: | | | |
| Net investment income (loss) | (0.02)2 | (0.03)2 | (0.03)2 |
| Net realized and unrealized gain | 1.10 | 0.70 | 1.19 |
| TOTAL FROM INVESTMENT OPERATIONS | 1.08 | 0.67 | 1.16 |
| Less Distributions: | | | |
| Distributions from net realized gain | (0.80) | (0.66) | — |
| Net Asset Value, End of Period | $6.39 | $6.11 | $6.10 |
| Total Return3 | 19.98% | 12.29% | 23.48% |
| Ratios to Average Net Assets: | | | |
| Net expenses | 1.45% | 1.46% | 1.47%4,5 |
| Net investment income (loss) | (0.31)% | (0.52)% | (0.67)%4 |
| Expense waiver/reimbursement6 | 0.03% | 0.03% | 0.03%4 |
| Supplemental Data: | | | |
| Net assets, end of period (000 omitted) | $452,014 | $325,596 | $198,762 |
| Portfolio turnover | 42% | 33% | 47%7 |
| 1 | Reflects operations for the period from December 29, 2016 (date of initial investment) to October 31, 2017. |
| 2 | Per share numbers have been calculated using the average shares method. |
| 3 | Based on net asset value. Total returns for periods of less than one year are not annualized. |
| 4 | Computed on an annualized basis. |
| 5 | The net expense ratio is calculated without reduction for fees paid indirectly for expense offset arrangements. The net expense ratio is 1.47% for the period from December 29, 2016 (date of initial investment) to October 31, 2017, after taking into account these expense reductions. |
| 6 | This expense decrease is reflected in both the net expense and net investment income (loss) ratios shown above. |
| 7 | Portfolio turnover is calculated at the Fund level. Percentage indicated was calculated for the fiscal year ended October 31, 2017. |
See Notes which are an integral part of the Financial Statements
Annual Shareholder Report
Statement of Assets and Liabilities
October 31, 2019
| Assets: | | |
| Investment in securities, at value including $606,937,978 of securities loaned and including $2,116,649,185 of investment in affiliated holdings* and including $549,942,412 of investments in affiliated companies* (identified cost $5,018,555,914) | | $7,289,316,128 |
| Cash denominated in foreign currencies (identified cost $52,688) | | 53,147 |
| Income receivable | | 2,848,233 |
| Income receivable from affiliated holdings | | 2,441,158 |
| Receivable for investments sold | | 1,129,066 |
| Receivable for shares sold | | 1,588,119 |
| TOTAL ASSETS | | 7,297,375,851 |
| Liabilities: | | |
| Payable for investments purchased | $87,327,456 | |
| Payable for shares redeemed | 2,576,653 | |
| Payable to bank | 228,605 | |
| Payable for collateral due to broker for securities lending | 628,218,028 | |
| Payable for investment adviser fee (Note 5) | 230,172 | |
| Payable for administrative fees (Note 5) | 14,244 | |
| Payable for distribution services fee (Note 5) | 1,435,635 | |
| Payable for other service fees (Notes 2 and 5) | 3,199,658 | |
| Accrued expenses (Note 5) | 1,389,027 | |
| TOTAL LIABILITIES | | 724,619,478 |
| Net assets for 1,053,161,508 shares outstanding | | $6,572,756,373 |
| Net Assets Consist of: | | |
| Paid-in capital | | $3,636,246,647 |
| Total distributable earnings (loss) | | 2,936,509,726 |
| TOTAL NET ASSETS | | $6,572,756,373 |
Annual Shareholder Report
Statement of Assets and Liabilities–continued
| Net Asset Value, Offering Price and Redemption Proceeds Per Share | | |
| Class A Shares: | | |
| Net asset value per share ($1,629,523,869 ÷ 260,060,249 shares outstanding), no par value, unlimited shares authorized | | $6.27 |
| Offering price per share (100/94.50 of $6.27) | | $6.63 |
| Redemption proceeds per share | | $6.27 |
| Class B Shares: | | |
Net asset value per share ($41,482,964 ÷ 8,293,924 shares
outstanding), no par value, unlimited shares authorized | | $5.00 |
| Offering price per share | | $5.00 |
| Redemption proceeds per share (94.50/100 of $5.00) | | $4.73 |
| Class C Shares: | | |
| Net asset value per share ($135,882,992 ÷ 27,229,543 shares outstanding), no par value, unlimited shares authorized | | $4.99 |
| Offering price per share | | $4.99 |
| Redemption proceeds per share (99.00/100 of $4.99) | | $4.94 |
| Class R Shares: | | |
| Net asset value per share ($4,313,852,447 ÷ 686,830,967 shares outstanding), no par value, unlimited shares authorized | | $6.28 |
| Offering price per share | | $6.28 |
| Redemption proceeds per share | | $6.28 |
| Institutional Shares: | | |
| Net asset value per share ($452,014,101 ÷ 70,746,825 shares outstanding), no par value, unlimited shares authorized | | $6.39 |
| Offering price per share | | $6.39 |
| Redemption proceeds per share | | $6.39 |
| * | See information listed after the Fund's Portfolio of Investments. |
See Notes which are an integral part of the Financial Statements
Annual Shareholder Report
Statement of Operations
Year Ended October 31, 2019
| Investment Income: | | | |
| Dividends (including $31,073,144 received from an affiliated holding and affiliated company* and net of foreign taxes withheld of $1,183,818) | | | $65,217,251 |
| Net income on securities loaned (includes $16,897,968 received from affiliated holdings related to cash collateral balances*) | | | 7,866,708 |
| Interest | | | 7,452 |
| TOTAL INCOME | | | 73,091,411 |
| Expenses: | | | |
| Investment adviser fee (Note 5) | | $83,150,780 | |
| Administrative fee (Note 5) | | 5,082,854 | |
| Custodian fees | | 364,977 | |
| Transfer agent fee | | 4,746,554 | |
| Directors'/Trustees' fees (Note 5) | | 44,766 | |
| Auditing fees | | 45,400 | |
| Legal fees | | 10,551 | |
| Portfolio accounting fees | | 213,304 | |
| Distribution services fee (Note 5) | | 26,467,031 | |
| Other service fees (Notes 2 and 5) | | 14,974,659 | |
| Share registration costs | | 140,631 | |
| Printing and postage | | 182,535 | |
| Miscellaneous (Note 5) | | 67,635 | |
| TOTAL EXPENSES | | 135,491,677 | |
| Waivers and Reimbursement: | | | |
| Waiver/reimbursement of investment adviser fee (Note 5) | $(1,599,053) | | |
| Waiver of other operating expenses (Note 5) | (9,912,305) | | |
| TOTAL WAIVERS AND REIMBURSEMENT | | (11,511,358) | |
| Net expenses | | | 123,980,319 |
| Net investment income (loss) | | | (50,888,908) |
Annual Shareholder Report
Statement of Operations–continued
| Realized and Unrealized Gain (Loss) on Investments, Futures Contracts and Foreign Currency Transactions: | | | |
| Net realized gain on investments (including net realized gain of $89,403,005 on sales of investments in affiliated companies and holdings*) | | | $739,646,841 |
| Net realized gain on foreign currency transactions | | | 212,478 |
| Net realized gain on futures contracts | | | 940,845 |
| Net change in unrealized appreciation of investments (including net change in unrealized appreciation of $(29,709,706) on investments in affiliated companies and holdings*) | | | 419,101,891 |
| Net change in unrealized appreciation/depreciation of translation of assets and liabilities in foreign currency | | | (47,832) |
| Net realized and unrealized gain on investments, futures contracts and foreign currency transactions | | | 1,159,854,223 |
| Change in net assets resulting from operations | | | $1,108,965,315 |
* See information listed after the Fund's Portfolio of Investments.
See Notes which are an integral part of the Financial Statements
Annual Shareholder Report
Statement of Changes in Net Assets
| Year Ended October 31 | 2019 | 2018 |
| Increase (Decrease) in Net Assets | | |
| Operations: | | |
| Net investment income (loss) | $(50,888,908) | $(63,777,372) |
| Net realized gain | 740,800,164 | 831,336,391 |
| Net change in unrealized appreciation/depreciation | 419,054,059 | (116,511,693) |
| CHANGE IN NET ASSETS RESULTING FROM OPERATIONS | 1,108,965,315 | 651,047,326 |
| Distributions to Shareholders: | | |
| Class A Shares | (196,156,111) | (142,517,623) |
| Class B Shares | (7,786,018) | (8,041,679) |
| Class C Shares | (22,431,238) | (38,639,046) |
| Class R Shares | (509,207,022) | (399,626,973) |
| Institutional Shares | (42,821,708) | (21,433,572) |
| CHANGE IN NET ASSETS RESULTING FROM DISTRIBUTIONS TO SHAREHOLDERS | (778,402,097) | (610,258,893) |
| Share Transactions: | | |
| Proceeds from sale of shares | 468,113,980 | 583,636,412 |
| Net asset value of shares issued to shareholders in payment of distributions declared | 687,001,939 | 571,902,658 |
| Cost of shares redeemed | (802,617,139) | (905,249,274) |
| CHANGE IN NET ASSETS RESULTING FROM SHARE TRANSACTIONS | 352,498,780 | 250,289,796 |
| Change in net assets | 683,061,998 | 291,078,229 |
| Net Assets: | | |
| Beginning of period | 5,889,694,375 | 5,598,616,146 |
| End of period | $6,572,756,373 | $5,889,694,375 |
See Notes which are an integral part of the Financial Statements
Annual Shareholder Report
Notes to Financial Statements
October 31, 2019
1. ORGANIZATION
Federated Equity Funds (the “Trust”) is registered under the Investment Company Act of 1940, as amended (the “Act”), as an open-end management investment company. The Trust consists of nine portfolios. The financial statements included herein are only those of Federated Kaufmann Fund (the “Fund”), a diversified portfolio. The financial statements of the other portfolios are presented separately. The assets of each portfolio are segregated and a shareholder's interest is limited to the portfolio in which shares are held. Each portfolio pays its own expenses. The Fund offers five classes of shares: Class A Shares, Class B Shares, Class C Shares, Class R Shares and Institutional Shares. All shares of the Fund have equal rights with respect to voting, except on class-specific matters. The investment objective of the Fund is to provide capital appreciation.
On March 30, 2017, the Fund's T Share Class became effective with the Securities and Exchange Commission (SEC), but is not yet offered for sale.
Class B Shares are closed to new accounts, new investors and new purchases made by existing shareholders (excluding reinvestment of dividends and capital gains). Class B Shares of the Fund may be exchanged for Class B Shares of any other Federated fund.
Effective August 1, 2018, an automatic conversion feature for Class C Shares was implemented. Pursuant to this automatic conversion feature, after Class C Shares have been held for ten years from the date of purchase, they will automatically convert to Class A Shares on the next monthly conversion processing date.
2. SIGNIFICANT ACCOUNTING POLICIES
The following is a summary of significant accounting policies consistently followed by the Fund in the preparation of its financial statements. These policies are in conformity with U.S. generally accepted accounting principles (GAAP).
Investment Valuation
In calculating its net asset value (NAV), the Fund generally values investments as follows:
| ■ | Equity securities listed on an exchange or traded through a regulated market system are valued at their last reported sale price or official closing price in their principal exchange or market. |
| ■ | Shares of other mutual funds or non-exchange-traded investment companies are valued based upon their reported NAVs. |
| ■ | Fixed-income securities are fair valued using price evaluations provided by a pricing service approved by the Fund's Board of Trustees. |
| ■ | Derivative contracts listed on exchanges are valued at their reported settlement or closing price, except that options are valued at the mean of closing bid and asked quotations. |
| ■ | Over-the-counter (OTC) derivative contracts are fair valued using price evaluations provided by a pricing service approved by the Trustees. |
| ■ | For securities that are fair valued in accordance with procedures established by and under the general supervision of the Trustees, certain factors may be considered, such as: the last traded or purchase price of the security, information obtained by contacting the issuer or dealers, analysis of the issuer's financial statements or other available documents, fundamental analytical data, the nature and duration of restrictions on disposition, the movement of the market in which the security is normally traded, public trading in similar |
Annual Shareholder Report
| | securities or derivative contracts of the issuer or comparable issuers, movement of a relevant index, or other factors including but not limited to industry changes and relevant government actions. |
If any price, quotation, price evaluation or other pricing source is not readily available when the NAV is calculated, if the Fund cannot obtain price evaluations from a pricing service or from more than one dealer for an investment within a reasonable period of time as set forth in the Fund's valuation policies and procedures, or if information furnished by a pricing service, in the opinion of the valuation committee (“Valuation Committee”), is deemed not representative of the fair value of such security, the Fund uses the fair value of the investment determined in accordance with the procedures described below. There can be no assurance that the Fund could obtain the fair value assigned to an investment if it sold the investment at approximately the time at which the Fund determines its NAV per share.
Fair Valuation and Significant Events Procedures
The Trustees have ultimate responsibility for determining the fair value of investments for which market quotations are not readily available. The Trustees have appointed a Valuation Committee comprised of officers of the Fund, Federated Equity Management Company of Pennsylvania (the “Adviser”) and certain of the Adviser's affiliated companies to assist in determining fair value and in overseeing the calculation of the NAV. The Trustees have also authorized the use of pricing services recommended by the Valuation Committee to provide fair value evaluations of the current value of certain investments for purposes of calculating the NAV. The Valuation Committee employs various methods for reviewing third-party pricing-service evaluations including periodic reviews of third-party pricing services' policies, procedures and valuation methods (including key inputs, methods, models and assumptions), transactional back-testing, comparisons of evaluations of different pricing services, and review of price challenges by the Adviser based on recent market activity. In the event that market quotations and price evaluations are not available for an investment, the Valuation Committee determines the fair value of the investment in accordance with procedures adopted by the Trustees. The Trustees periodically review and approve the fair valuations made by the Valuation Committee and any changes made to the procedures.
Factors considered by pricing services in evaluating an investment include the yields or prices of investments of comparable quality, coupon, maturity, call rights and other potential prepayments, terms and type, reported transactions, indications as to values from dealers and general market conditions. Some pricing services provide a single price evaluation reflecting the bid-side of the market for an investment (a “bid” evaluation). Other pricing services offer both bid evaluations and price evaluations indicative of a price between the prices bid and asked for the investment (a “mid” evaluation). The Fund normally uses bid evaluations for any U.S. Treasury and Agency securities, mortgage-backed securities and municipal securities. The Fund normally uses mid evaluations for any other types of fixed-income securities and any OTC derivative contracts. In the event that market quotations and price evaluations are not available for an investment, the fair value of the investment is determined in accordance with procedures adopted by the Trustees.
The Trustees also have adopted procedures requiring an investment to be priced at its fair value whenever the Adviser determines that a significant event affecting the value of the investment has occurred between the time as of which the price of the investment would otherwise be determined and the time as of which the NAV is computed. An event is considered significant if there is both an affirmative expectation that the investment's value
Annual Shareholder Report
will change in response to the event and a reasonable basis for quantifying the resulting change in value. Examples of significant events that may occur after the close of the principal market on which a security is traded, or after the time of a price evaluation provided by a pricing service or a dealer, include:
| ■ | With respect to securities traded principally in foreign markets, significant trends in U.S. equity markets or in the trading of foreign securities index futures contracts; |
| ■ | Political or other developments affecting the economy or markets in which an issuer conducts its operations or its securities are traded; |
| ■ | Announcements concerning matters such as acquisitions, recapitalizations, litigation developments, or a natural disaster affecting the issuer's operations or regulatory changes or market developments affecting the issuer's industry. |
The Trustees have adopted procedures whereby the Valuation Committee uses a pricing service to provide factors to update the fair value of equity securities traded principally in foreign markets from the time of the close of their respective foreign stock exchanges to the pricing time of the Fund. For other significant events, the Fund may seek to obtain more current quotations or price evaluations from alternative pricing sources. If a reliable alternative pricing source is not available, the Fund will determine the fair value of the investment in accordance with the fair valuation procedures approved by the Trustees. The Trustees have ultimate responsibility for any fair valuations made in response to a significant event.
Repurchase Agreements
The Fund may invest in repurchase agreements for short-term liquidity purposes. It is the policy of the Fund to require the other party to a repurchase agreement to transfer to the Fund's custodian or sub-custodian eligible securities or cash with a market value (after transaction costs) at least equal to the repurchase price to be paid under the repurchase agreement. The eligible securities are transferred to accounts with the custodian or sub-custodian in which the Fund holds a “securities entitlement” and exercises “control” as those terms are defined in the Uniform Commercial Code. The Fund has established procedures for monitoring the market value of the transferred securities and requiring the transfer of additional eligible securities if necessary to equal at least the repurchase price. These procedures also allow the other party to require securities to be transferred from the account to the extent that their market value exceeds the repurchase price or in exchange for other eligible securities of equivalent market value.
The insolvency of the other party or other failure to repurchase the securities may delay the disposition of the underlying securities or cause the Fund to receive less than the full repurchase price. Under the terms of the repurchase agreement, any amounts received by the Fund in excess of the repurchase price and related transaction costs must be remitted to the other party.
The Fund may enter into repurchase agreements in which eligible securities are transferred into joint trading accounts maintained by the custodian or sub-custodian for investment companies and other clients advised by the Fund's Adviser and its affiliates. The Fund will participate on a pro rata basis with the other investment companies and clients in its share of the securities transferred under such repurchase agreements and in its share of proceeds from any repurchase or other disposition of such securities.
Annual Shareholder Report
Investment Income, Gains and Losses, Expenses and Distributions
Investment transactions are accounted for on a trade-date basis. Realized gains and losses from investment transactions are recorded on an identified-cost basis. Interest income and expenses are accrued daily. Dividend income and distributions to shareholders are recorded on the ex-dividend date. Foreign dividends are recorded on the ex-dividend date or when the Fund is informed of the ex-dividend date. Distributions of net investment income, if any, are declared and paid annually. Non-cash dividends included in dividend income, if any, are recorded at fair value. Amortization/accretion of premium and discount is included in investment income.
Investment income, realized and unrealized gains and losses, and certain fund-level expenses are allocated to each class based on relative average daily net assets, except that select classes will bear certain expenses unique to those classes. The detail of the total fund expense waivers and reimbursement of $11,511,358 is disclosed in Note 5. For the year ended October 31, 2019, transfer agent fees for the Fund were as follows:
| | Transfer Agent
Fees Incurred |
| Class A Shares | $1,326,419 |
| Class B Shares | 38,765 |
| Class C Shares | 118,016 |
| Class R Shares | 2,938,832 |
| Institutional Shares | 324,522 |
| TOTAL | $4,746,554 |
Dividends are declared separately for each class. No class has preferential dividend rights; differences in per share dividend rates are generally due to differences in separate class expenses.
Other Service Fees
The Fund may pay other service fees up to 0.25% of the average daily net assets of the Fund's Class A Shares, Class B Shares, Class C Shares and Class R Shares to unaffiliated financial intermediaries or to Federated Shareholder Services Company (FSSC) for providing services to shareholders and maintaining shareholder accounts. Subject to the terms described in the Expense Limitation note, FSSC may voluntarily reimburse the Fund for other service fees. For the year ended October 31, 2019, other service fees for the Fund were as follows:
| | Other Service
Fees Incurred |
| Class A Shares | $4,007,695 |
| Class B Shares | 116,508 |
| Class C Shares | 355,956 |
| Class R Shares | 10,494,500 |
| TOTAL | $14,974,659 |
Annual Shareholder Report
Federal Taxes
It is the Fund's policy to comply with the Subchapter M provision of the Internal Revenue Code and to distribute to shareholders each year substantially all of its income. Accordingly, no provision for federal income tax is necessary. As of and during the year ended October 31, 2019, the Fund did not have a liability for any uncertain tax positions. The Fund recognizes interest and penalties, if any, related to tax liabilities as income tax expense in the Statement of Operations. As of October 31, 2019, tax years 2016 through 2019 remain subject to examination by the Fund's major tax jurisdictions, which include the United States of America and the Commonwealth of Massachusetts.
The Fund may be subject to taxes imposed by governments of countries in which it invests. Such taxes are generally based on either income or gains earned or repatriated. The Fund accrues and applies such taxes to net investment income, net realized gains and net unrealized gains as income and/or gains are earned.
When-Issued and Delayed-Delivery Transactions
The Fund may engage in when-issued or delayed-delivery transactions. The Fund records when-issued securities on the trade date and maintains security positions such that sufficient liquid assets will be available to make payment for the securities purchased. Securities purchased on a when-issued or delayed-delivery basis are marked to market daily and begin earning interest on the settlement date. Losses may occur on these transactions due to changes in market conditions or the failure of counterparties to perform under the contract.
Futures Contracts
The Fund purchases and sells financial futures contracts to manage cash flows and duration, enhance yield and to potentially reduce transaction costs. Upon entering into a financial futures contract with a broker, the Fund is required to deposit in a segregated account, either U.S. government securities or a specified amount of Restricted cash, which is shown in the Statement of Assets and Liabilities. Futures contracts are valued daily and unrealized gains or losses are recorded in a “variation margin” account. Daily, the Fund receives from or pays to the broker a specified amount of cash based upon changes in the variation margin account. When a contract is closed, the Fund recognizes a realized gain or loss. Futures contracts have market risks, including the risk that the change in the value of the contract may not correlate with the changes in the value of the underlying securities. There is minimal counterparty risk to the Fund since futures contracts are exchange traded and the exchange's clearinghouse, as counterparty to all exchange traded futures contracts, guarantees the futures contracts against default.
At October 31, 2019, the Fund had no outstanding futures contracts.
Foreign Exchange Contracts
The Fund enters into foreign exchange contracts for the delayed-delivery of securities or foreign currency exchange transactions. The Fund enters into foreign exchange contracts to protect assets against adverse changes in foreign currency exchange rates or exchange control regulations. Purchased contracts are used to acquire exposure to foreign currencies, whereas, contracts to sell are used to hedge the Fund's securities against currency fluctuations. Risks may arise upon entering into these transactions from the potential inability of counterparties to meet the terms of their commitments and from unanticipated movements in security prices or foreign exchange rates. The foreign exchange contracts are adjusted by the daily exchange rate of the underlying currency and any gains or losses are recorded for financial statement purposes as unrealized until the settlement date.
Annual Shareholder Report
At October 31, 2019, the Fund had no outstanding foreign exchange contracts.
Foreign Currency Translation
The accounting records of the Fund are maintained in U.S. dollars. All assets and liabilities denominated in foreign currencies are translated into U.S. dollars based on the rates of exchange of such currencies against U.S. dollars on the date of valuation. Purchases and sales of securities, income and expenses are translated at the rate of exchange quoted on the respective date that such transactions are recorded. The Fund does not isolate that portion of the results of operations resulting from changes in foreign exchange rates on investments from the fluctuations arising from changes in market prices of securities held. Such fluctuations are included with the net realized and unrealized gain or loss from investments.
Reported net realized foreign exchange gains or losses arise from sales of foreign currencies, currency gains or losses realized between the trade and settlement dates on securities transactions, the difference between the amounts of dividends, interest and foreign withholding taxes recorded on the Fund's books, and the U.S. dollar equivalent of the amounts actually received or paid. Net unrealized foreign exchange gains and losses arise from changes in the value of assets and liabilities other than investments in securities at period end, resulting from changes in the exchange rate.
The Effect of Derivative Instruments on the Statement of Operations for the Year Ended October 31, 2019
| Amount of Realized Gain or (Loss) on Derivatives Recognized in Income |
| | Futures
Contracts |
| Equity contracts | 940,845 |
Securities Lending
The Fund participates in a securities lending program providing for the lending of equity securities to qualified brokers. The term of the loans within the program is one year or less. The Fund normally receives cash collateral for securities loaned that may be invested in affiliated money market funds, other money market instruments and/or repurchase agreements. Investments in money market funds may include funds with a “floating” NAV that can impose redemption fees and liquidity gates, impose certain operational impediments to investing cash collateral, and, if the investee fund's NAV decreases, result in the Fund recognizing losses and being required to cover the decrease in the value of the cash collateral. Collateral is maintained at a minimum level of 100% of the market value of investments loaned, plus interest, if applicable. Earnings on collateral are allocated between the borrower of the security, the securities lending agent, as a fee for its services under the program and the Fund, according to agreed-upon rates. The Fund will not have the right to vote on securities while they are on loan. However, the Fund will attempt to terminate a loan in an effort to reacquire the securities in time to vote on matters that are deemed to be material by the Adviser. There can be no assurance that the Fund will have sufficient notice of such matters to be able to terminate the loan in time to vote thereon.
Securities lending transactions are subject to Master Netting Agreements which are agreements between the Fund and its counterparties that provide for the net settlement of all transactions and collateral with the Fund, through a single payment, in the event of default or termination. Amounts presented on the Portfolio of Investments and Statement of Assets and Liabilities are not net settlement amount but gross. As indicated below, the cash collateral
Annual Shareholder Report
received by the Fund exceeds the market value of the securities loaned reducing the net settlement amount to zero. The chart below identifies the amount of collateral received as well as the market value of securities on loan. Additionally, the securities lending agreement executed by the Fund includes an indemnification clause. This clause stipulates that the borrower will reimburse the Fund for any losses as a result of any failure of the borrower to return equivalent securities to the Fund.
As of October 31, 2019, securities subject to this type of arrangement and related collateral were as follows:
Market Value of
Securities Loaned | Collateral
Received |
| $606,937,978 | $628,218,028 |
Restricted Securities
The Fund may purchase securities which are considered restricted. Restricted securities are securities that either: (a) cannot be offered for public sale without first being registered, or being able to take advantage of an exemption from registration, under the Securities Act of 1933; or (b) are subject to contractual restrictions on public sales. In some cases, when a security cannot be offered for public sale without first being registered, the issuer of the restricted security has agreed to register such securities for resale, at the issuer's expense, either upon demand by the Fund or in connection with another registered offering of the securities. Many such restricted securities may be resold in the secondary market in transactions exempt from registration. Restricted securities may be determined to be liquid under criteria established by the Trustees. The Fund will not incur any registration costs upon such resales. The Fund's restricted securities, like other securities, are priced in accordance with procedures established by and under the general supervision of the Trustees.
Additional information on restricted securities held at October 31, 2019, is as follows:
| Security | Acquisition
Date | Cost | Market
Value |
| Agnico Eagle Mines Ltd. | 12/26/2018 | $65,506,909 | $81,755,100 |
| Apollo Investment Fund V | 5/18/2001 | $0 | $86,372 |
| Expand Networks Ltd. | 9/22/2000 | $2,500,000 | $0 |
| FA Private Equity Fund IV LP | 3/4/2002 | $0 | $424,545 |
| Infrastructure Fund | 8/11/2000 | $404,496 | $0 |
| Latin Healthcare Fund | 11/28/2000 | $0 | $333,166 |
| Multiplex, Inc., Pfd., Series C | 2/22/2001 | $5,000,001 | $0 |
| Sensable Technologies, Inc. | 10/15/2004 | $0 | $0 |
Other
The preparation of financial statements in conformity with GAAP requires management to make estimates and assumptions that affect the amounts of assets, liabilities, expenses and revenues reported in the financial statements. Actual results could differ from those estimated. The Fund applies investment company accounting and reporting guidance.
Annual Shareholder Report
3. SHARES OF BENEFICIAL INTEREST
The following tables summarize share activity:
| Year Ended October 31 | 2019 | 2018 |
| Class A Shares: | Shares | Amount | Shares | Amount |
| Shares sold | 24,008,103 | $141,942,363 | 46,465,461 | $295,885,204 |
| Shares issued to shareholders in payment of distributions declared | 34,373,135 | 183,552,543 | 24,484,553 | 132,216,584 |
| Shares redeemed | (45,583,805) | (269,882,178) | (42,317,174) | (262,640,110) |
NET CHANGE RESULTING FROM
CLASS A SHARE TRANSACTIONS | 12,797,433 | $55,612,728 | 28,632,840 | $165,461,678 |
| Year Ended October 31 | 2019 | 2018 |
| Class B Shares: | Shares | Amount | Shares | Amount |
| Shares sold | 446,899 | $2,131,511 | 286,858 | $2,085,863 |
| Shares issued to shareholders in payment of distributions declared | 1,766,424 | 7,560,294 | 1,739,879 | 7,812,058 |
| Shares redeemed | (4,023,188) | (19,231,184) | (4,628,452) | (23,707,477) |
NET CHANGE RESULTING FROM
CLASS B SHARE TRANSACTIONS | (1,809,865) | $(9,539,379) | (2,601,715) | $(13,809,556) |
| Year Ended October 31 | 2019 | 2018 |
| Class C Shares: | Shares | Amount | Shares | Amount |
| Shares sold | 6,210,372 | $29,007,395 | 6,439,886 | $33,513,903 |
| Shares issued to shareholders in payment of distributions declared | 4,897,396 | 20,911,881 | 8,283,090 | 37,108,241 |
| Shares redeemed | (12,819,934) | (60,479,448) | (45,296,125) | (239,748,093) |
NET CHANGE RESULTING FROM
CLASS C SHARE TRANSACTIONS | (1,712,166) | $(10,560,172) | (30,573,149) | $(169,125,949) |
| Year Ended October 31 | 2019 | 2018 |
| Class R Shares: | Shares | Amount | Shares | Amount |
| Shares sold | 20,227,932 | $115,640,561 | 13,055,958 | $81,089,481 |
| Shares issued to shareholders in payment of distributions declared | 81,735,229 | 437,283,475 | 69,426,558 | 375,597,677 |
| Shares redeemed | (56,639,892) | (338,000,827) | (51,396,423) | (318,994,039) |
NET CHANGE RESULTING FROM
CLASS R SHARE TRANSACTIONS | 45,323,269 | $214,923,209 | 31,086,093 | $137,693,119 |
Annual Shareholder Report
| Year Ended October 31 | 2019 | 2018 |
| Institutional Shares: | Shares | Amount | Shares | Amount |
| Shares sold | 29,739,311 | $179,392,150 | 26,776,051 | $171,061,961 |
| Shares issued to shareholders in payment of distributions declared | 6,954,566 | 37,693,746 | 3,523,547 | 19,168,098 |
| Shares redeemed | (19,250,371) | (115,023,502) | (9,592,939) | (60,159,555) |
NET CHANGE RESULTING FROM
INSTITUTIONAL SHARE TRANSACTIONS | 17,443,506 | $102,062,394 | 20,706,659 | $130,070,504 |
NET CHANGE RESULTING FROM
TOTAL FUND SHARE TRANSACTIONS | 72,042,177 | $352,498,780 | 47,250,728 | $250,289,796 |
Redemption Fees
The Fund's Class R Shares impose a redemption fee of 0.20% on the redemption price of the Fund's Class R Shares redeemed, if such shares were purchased after February 1, 1985. The redemption fee is applied to the Fund's Class R Shares expenses for providing redemption services, including, but not limited to: transfer agent fees, postage, printing, telephone and related employment costs. Excess fee proceeds, if any, are added to the Fund's assets. Shares acquired through employer-sponsored retirement plans will not be subject to the redemption fee. However, if shares are purchased for a retirement plan account through a broker, financial institution or other intermediary maintaining an omnibus account for the shares, the waiver may not apply. In addition, this waiver does not apply to individual retirement accounts, such as Traditional, Roth and SEP-IRAs. For the years ended October 31, 2019 and October 31, 2018, redemption fees of $528,847 and $498,526, respectively, were allocated to cover the cost of redemptions.
4. FEDERAL TAX INFORMATION
The accounting treatment of certain items in accordance with income tax regulations may differ from the accounting treatment in accordance with GAAP which may result in permanent differences. In the case of the Fund, such differences primarily result from net operating losses.
For the year ended October 31, 2019, permanent differences identified and reclassified among the components of net assets were as follows:
| Increase (Decrease) |
| Paid-In Capital | Total Distributable
Earnings (Loss) |
| $(49,933,071) | $49,933,071 |
Net investment income (loss), net realized gains (losses), and net assets were not affected by this reclassification.
The tax character of distributions as reported on the Statement of Changes in Net Assets for the years ended October 31, 2019 and 2018, was as follows:
| | 2019 | 2018 |
| Long-term capital gains | $778,402,097 | $610,258,893 |
Annual Shareholder Report
As of October 31, 2019, the components of distributable earnings on a tax-basis were as follows:
| Net unrealized appreciation | $2,250,030,530 |
| Undistributed long-term capital gains | $735,750,200 |
| Ordinary loss deferrals | $(49,271,004) |
The difference between book-basis and tax-basis net unrealized appreciation/depreciation is attributable to differing treatments for deferral of losses on wash sales, partnership adjustments and passive foreign investment company adjustments.
At October 31, 2019, the cost of investments for federal tax purposes was $5,039,238,584. The net unrealized appreciation of investments for federal tax purposes was $2,250,077,544. This consists of net unrealized appreciation from investments for those securities having an excess of value over cost of $2,395,322,436 and net unrealized depreciation from investments for those securities having an excess of cost over value of $145,244,892.
Under current tax rules, a late-year ordinary loss may be deferred, in whole or in part, and treated as occurring on the first day of the following fiscal year. As of October 31, 2019, for federal income tax purposes, a late year ordinary loss of $49,271,004 was deferred to November 1, 2019.
5. INVESTMENT ADVISER FEE AND OTHER TRANSACTIONS WITH AFFILIATES
Investment Adviser Fee
The advisory agreement between the Fund and the Adviser provides for an annual fee equal to 1.30% of the Fund's average daily net assets. Pursuant to the settlement of certain litigation, the Adviser has agreed, for a period continuing through June 30, 2022, to waive its investment advisory fee so that such fee will not exceed 1.275%. Also, as part of the settlement agreement, effective July 1, 2012 and continuing through June 30, 2022, the Adviser has agreed to further waive the advisory fee by an additional 0.02%, 0.04%, 0.06% or 0.07% if the Fund's net assets exceed eight, nine, ten or twelve billion dollars, respectively. Subject to the terms described in the Expense Limitation note, the Adviser may voluntarily choose to waive any portion of its fee and/or reimburse certain operating expenses of the Fund. For the year ended October 31, 2019, the Adviser voluntarily waived $240,586 of its fee. The Adviser has agreed to reimburse the Fund for certain investment adviser fees as a result of transactions in other affiliated investment companies. For the year ended October 31, 2019, the Adviser reimbursed $1,358,467.
Certain of the Fund's assets are managed by Federated Global Investment Management Corp. (the “Sub-Adviser”). Under the terms of a sub-advisory agreement between the Adviser and the Sub-Adviser, the Sub-Adviser receives an allocable portion of the Fund's adviser fee. The fee is paid by the Adviser out of its resources and is not an incremental Fund expense. For the year ended October 31, 2019, the Sub-Adviser earned a fee of $68,373,028.
Annual Shareholder Report
Administrative Fee
Federated Administrative Services (FAS), under the Administrative Services Agreement, provides the Fund with administrative personnel and services. For purposes of determining the appropriate rate breakpoint, “Investment Complex” is defined as all of the Federated Funds subject to a fee under the Administrative Services Agreement. The fee paid to FAS is based on the average daily net assets of the Investment Complex as specified below:
| Administrative Fee | Average Daily Net Assets
of the Investment Complex |
| 0.100% | on assets up to $50 billion |
| 0.075% | on assets over $50 billion |
Subject to the terms described in the Expense Limitation note, FAS may voluntarily choose to waive any portion of its fee. For the year ended October 31, 2019, the annualized fee paid to FAS was 0.080% of average daily net assets of the Fund.
In addition, FAS may charge certain out-of-pocket expenses to the Fund.
Distribution Services Fee
The Fund has adopted a Distribution Plan (the “Plan”) pursuant to Rule 12b-1 under the Act. Under the terms of the Plan, the Fund will compensate Federated Securities Corp. (FSC), the principal distributor, from the daily net assets of the Fund's Class A Shares, Class B Shares, Class C Shares and Class R Shares to finance activities intended to result in the sale of these shares. The Plan provides that the Fund may incur distribution expenses at the following percentages of average daily net assets annually, to compensate FSC:
| | Percentage of Average Daily
Net Assets of Class |
| Class A Shares | 0.25% |
| Class B Shares | 0.75% |
| Class C Shares | 0.75% |
| Class R Shares | 0.50% |
Subject to the terms described in the Expense Limitation note, FSC may voluntarily choose to waive any portion of its fee. For the year ended October 31, 2019, distribution services fees for the Fund were as follows:
| | Distribution Services
Fees Incurred | Distribution Services
Fees Waived |
| Class A Shares | $4,013,244 | $— |
| Class B Shares | 349,525 | — |
| Class C Shares | 1,067,869 | — |
| Class R Shares | 21,036,393 | (9,912,305) |
| TOTAL | $26,467,031 | $(9,912,305) |
When FSC receives fees, it may pay some or all of them to financial intermediaries whose customers purchase shares. For the year ended October 31, 2019, FSC retained $14,818,032 of fees paid by the Fund.
Annual Shareholder Report
Sales Charges
Front-end sales charges and contingent deferred sales charges (CDSC) do not represent expenses of the Fund. They are deducted from the proceeds of sales of Fund shares prior to investment or from redemption proceeds prior to remittance, as applicable. For the year ended October 31, 2019, FSC retained $123,009 in sales charges from the sale of Class A Shares. FSC also retained $47,078 and $14,724 of CDSC relating to redemptions of Class B Shares and Class C Shares, respectively.
Other Service Fees
For the year ended October 31, 2019, FSSC received $7,597,958 of the other service fees disclosed in Note 2.
Commitments and Contingencies
In the course of pursuing its investment objective, the Fund may invest in limited partnerships and limited liability companies. These entities often require the Fund to commit to a total dollar amount to be invested. The actual investments are usually made in installments over a period of time. At October 31, 2019 the Fund had total commitments to limited partnerships and limited liability companies of $21,000,000; of this amount, $20,304,656 was actually invested by the Fund leaving the Fund contingently liable for additional investments of $695,344.
Expense Limitation
The Adviser and certain of its affiliates (which may include FSC, FAS and FSSC) on their own initiative have agreed to waive certain amounts of their respective fees and/or reimburse expenses. Total annual fund operating expenses (as shown in the financial highlights, excluding interest expense, extraordinary expenses, tax reclaim recovery expenses and proxy-related expenses paid by the Fund, if any) paid by the Fund's Class A Shares, Class B Shares, Class C Shares, Class R Shares and Institutional Shares (after the voluntary waivers and/or reimbursements) will not exceed 1.95%, 2.50%, 2.50%, 1.95% and 1.50% (the “Fee Limit”), respectively, up to but not including the later of (the “Termination Date”): (a) January 1, 2021; or (b) the date of the Fund's next effective Prospectus. While the Adviser and its applicable affiliates currently do not anticipate terminating or increasing these arrangements prior to the Termination Date, these arrangements may only be terminated or the Fee Limit increased prior to the Termination Date with the agreement of the Trustees.
Interfund Transactions
During the year ended October 31, 2019, the Fund engaged in purchase and sale transactions with funds that have a common investment adviser (or affiliated investment advisers), common Directors/Trustees and/or common Officers. These purchase and sale transactions complied with Rule 17a-7 under the Act and amounted to $2,675,563 and $48,775,657, respectively.
Directors'/Trustees' and Miscellaneous Fees
Certain Officers and Trustees of the Fund are Officers and Directors or Trustees of certain of the above companies. To efficiently facilitate payment, Independent Directors'/Trustees' fees and certain expenses related to conducting meetings of the Directors/Trustees and other miscellaneous expenses are paid by an affiliate of the Adviser which in due course are reimbursed by the Fund. These expenses related to conducting meetings of the Directors/Trustees and other miscellaneous expenses may be included in Accrued and Miscellaneous Expenses on the Statement of Assets and Liabilities and Statement of Operations, respectively.
Annual Shareholder Report
6. INVESTMENT TRANSACTIONS
Purchases and sales of investments, excluding long-term U.S. government securities and short-term obligations, for the year ended October 31, 2019, were as follows:
| Purchases | $2,084,384,794 |
| Sales | $2,639,732,913 |
7. CONCENTRATION OF RISK
The Fund invests in securities of non-U.S. issuers. Political or economic developments may have an effect on the liquidity and volatility of portfolio securities and currency holdings.
At October 31, 2019, the diversification of countries was as follows:
| Country | Percentage of
Net Assets |
| United States | 84.6% |
| Canada | 6.1% |
| Netherlands | 3.9% |
| Belgium | 3.3% |
| Cayman Islands | 2.1% |
| China | 1.9% |
| Italy | 1.9% |
| Brazil | 1.6% |
| Bermuda | 1.2% |
| United Kingdom | 1.1% |
| Denmark | 0.9% |
| Ivory Coast | 0.6% |
| Switzerland | 0.4% |
| Australia | 0.4% |
| Israel | 0.4% |
| France | 0.4% |
| Channel Islands | 0.1% |
| Norway | 0.0%1 |
| 1 | Represents less than 0.05%. |
Annual Shareholder Report
8. LINE OF CREDIT
The Fund participates with certain other Federated Funds, on a several basis, in an up to $500,000,000 unsecured, 364-day, committed, revolving line of credit (LOC) agreement. The LOC was made available to finance temporarily the repurchase or redemption of shares of the Fund, failed trades, payment of dividends, settlement of trades and for other short-term, temporary or emergency general business purposes. The Fund cannot borrow under the LOC if an inter-fund loan is outstanding. The Fund's ability to borrow under the LOC also is subject to the limitations of the Act and various conditions precedent that must be satisfied before the Fund can borrow. Loans under the LOC are charged interest at a fluctuating rate per annum equal to the highest, on any day, of (a) (i) the federal funds effective rate, (ii) the one month London Interbank Offered Rate (LIBOR), and (iii) 0.0%, plus (b) a margin. The LOC also requires the Fund to pay, quarterly in arrears and at maturity, its pro rata share of a commitment fee based on the amount of the lenders' commitment that has not been utilized. As of October 31, 2019, the Fund had no outstanding loans. During the year ended October 31, 2019, the Fund did not utilize the LOC.
9. INTERFUND LENDING
Pursuant to an Exemptive Order issued by the Securities and Exchange Commission, the Fund, along with other funds advised by subsidiaries of Federated Investors, Inc., may participate in an interfund lending program. This program provides an alternative credit facility allowing the Fund to borrow from other participating affiliated funds. As of October 31, 2019, there were no outstanding loans. During the year ended October 31, 2019, the program was not utilized.
10. FEDERAL TAX INFORMATION (UNAUDITED)
For the year ended October 31, 2019, the amount of long-term capital gains designated by the Fund was $778,402,097.
Annual Shareholder Report
Report of Independent Registered Public Accounting Firm
TO THE BOARD OF TRUSTEES OF FEDERATED EQUITY FUNDS AND SHAREHOLDERS OF FEDERATED KAUFMANN FUND:
Opinion on the Financial Statements
We have audited the accompanying statement of assets and liabilities of Federated Kaufmann Fund (the “Fund”) (one of the portfolios constituting Federated Equity Funds (the “Trust”)), including the portfolio of investments, as of October 31, 2019, and the related statement of operations for the year then ended, the statement of changes in net assets for each of the two years in the period then ended, the financial highlights for each of the five years in the period then ended and the related notes (collectively referred to as the “financial statements”). In our opinion, the financial statements present fairly, in all material respects, the financial position of the Fund (one of the portfolios constituting Federated Equity Funds) at October 31, 2019, the results of its operations for the year then ended, the changes in its net assets for each of the two years in the period then ended and its financial highlights for each of the five years in the period then ended, in conformity with U.S. generally accepted accounting principles.
Basis for Opinion
These financial statements are the responsibility of the Trust's management. Our responsibility is to express an opinion on the Fund's financial statements based on our audits. We are a public accounting firm registered with the Public Company Accounting Oversight Board (United States) (PCAOB) and are required to be independent with respect to the Trust in accordance with the U.S. federal securities laws and the applicable rules and regulations of the Securities and Exchange Commission and the PCAOB.
We conducted our audits in accordance with standards of the PCAOB. Those standards require that we plan and perform the audit to obtain reasonable assurance about whether the financial statements are free of material misstatement, whether due to error or fraud. The Trust is not required to have, nor were we engaged to perform, an audit of the Trust's internal control over financial reporting. As part of our audits, we are required to obtain an understanding of internal control over financial reporting, but not for the purpose of expressing an opinion on the effectiveness of the Trust's internal control over financial reporting. Accordingly, we express no such opinion.
Annual Shareholder Report
Our audits included performing procedures to assess the risks of material misstatement of the financial statements, whether due to error or fraud, and performing procedures that respond to those risks. Such procedures included examining, on a test basis, evidence regarding the amounts and disclosures in the financial statements. Our procedures included confirmation of securities owned as of October 31, 2019, by correspondence with the custodian and others or by other appropriate auditing procedures where replies from others were not received. Our audits also included evaluating the accounting principles used and significant estimates made by management, as well as evaluating the overall presentation of the financial statements. We believe that our audits provide a reasonable basis for our opinion.
We have served as the auditor of one or more Federated investment companies since 1979.
Boston, Massachusetts
December 20, 2019
Annual Shareholder Report
Shareholder Expense Example (unaudited)
As a shareholder of the Fund, you incur two types of costs: (1) transaction costs, including sales charges (loads) on purchase or redemption payments; and (2) ongoing costs, including management fees and to the extent applicable, distribution (12b-1) fees and/or other service fees and other Fund expenses. This Example is intended to help you to understand your ongoing costs (in dollars) of investing in the Fund and to compare these costs with the ongoing costs of investing in other mutual funds. It is based on an investment of $1,000 invested at the beginning of the period and held for the entire period from May 1, 2019 to October 31, 2019.
ACTUAL EXPENSES
The first section of the table below provides information about actual account values and actual expenses. You may use the information in this section, together with the amount you invested, toestimate the expenses that you incurred over the period. Simply divide your account value by $1,000 (for example, an $8,600 account value divided by $1,000 = 8.6), then multiply the result by the number in the first section under the heading entitled “Expenses Paid During Period” to estimate the expenses attributable to your investment during this period.
HYPOTHETICAL EXAMPLE FOR COMPARISON PURPOSES
The second section of the table below provides information about hypothetical account values and hypothetical expenses based on the Fund's actual expense ratio and anassumed rate of return of 5% per year before expenses, which is not the Fund's actual return. Thus, you shouldnot use the hypothetical account values and expenses to estimate the actual ending account balance or your expenses for the period. Rather, these figures are required to be provided to enable you to compare the ongoing costs of investing in the Fund with other funds. To do so, compare this 5% hypothetical example with the 5% hypothetical examples that appear in the shareholder reports of the other funds.
Annual Shareholder Report
Please note that the expenses shown in the table are meant to highlight your ongoing costs only and do not reflect any transaction costs, such as sales charges (loads) on purchase or redemption payments. Therefore, the second section of the table is useful in comparing ongoing costs only, and will not help you determine the relativetotal costs of owning different funds. In addition, if these transaction costs were included, your costs would have been higher.
| | Beginning
Account Value
5/1/2019 | Ending
Account Value
10/31/2019 | Expenses Paid
During Period1 |
| Actual: | | | |
| Class A Shares | $1,000 | $1,017.90 | $9.92 |
| Class B Shares | $1,000 | $1,014.20 | $12.44 |
| Class C Shares | $1,000 | $1,014.20 | $12.44 |
| Class R Shares | $1,000 | $1,016.20 | $9.91 |
| Institutional Shares | $1,000 | $1,019.10 | $7.38 |
| Hypothetical (assuming a 5% return before expenses): | | | |
| Class A Shares | $1,000 | $1,015.40 | $9.91 |
| Class B Shares | $1,000 | $1,012.80 | $12.43 |
| Class C Shares | $1,000 | $1,012.80 | $12.43 |
| Class R Shares | $1,000 | $1,015.40 | $9.91 |
| Institutional Shares | $1,000 | $1,017.90 | $7.38 |
| 1 | Expenses are equal to the Fund's annualized net expense ratios, multiplied by the average account value over the period, multiplied by 184/365 (to reflect the one-half-year period). The annualized net expense ratios are as follows: |
| | |
| Class A Shares | 1.95% |
| Class B Shares | 2.45% |
| Class C Shares | 2.45% |
| Class R Shares | 1.95% |
| Institutional Shares | 1.45% |
Annual Shareholder Report
Board of Trustees and Trust Officers
The Board of Trustees is responsible for managing the Trust business affairs and for exercising all the Trust powers except those reserved for the shareholders. The following tables give information about each Trustee and the senior officers of the Fund. Where required, the tables separately list Trustees who are “interested persons” of the Fund (i.e., “Interested” Trustees) and those who are not (i.e., “Independent” Trustees). Unless otherwise noted, the address of each person listed is Federated Investors Tower, 1001 Liberty Avenue, Pittsburgh, PA 15222. The address of all Independent Trustees listed is 4000 Ericsson Drive, Warrendale, PA 15086-7561; Attention: Mutual Fund Board. As of December 31, 2018, the Trust comprised 10 portfolio(s), and the Federated Fund Family consisted of 40 investment companies (comprising 102 portfolios). Unless otherwise noted, each Officer is elected annually. Unless otherwise noted, each Trustee oversees all portfolios in the Federated Fund Family and serves for an indefinite term. The Fund's Statement of Additional Information includes additional information about Trust Trustees and is available, without charge and upon request, by calling 1-800-341-7400.
Interested TRUSTEES Background
Name
Birth Date
Positions Held with Trust
Date Service Began | Principal Occupation(s) for Past Five Years,
Other Directorships Held and Previous Position(s) |
J. Christopher Donahue*
Birth Date: April 11, 1949
President and Trustee
Indefinite Term
Began serving: January 2000 | Principal Occupations: Principal Executive Officer and President of certain of the Funds in the Federated Fund Family; Director or Trustee of the Funds in the Federated Fund Family; President, Chief Executive Officer and Director, Federated Investors, Inc.; Chairman and Trustee, Federated Investment Management Company; Trustee, Federated Investment Counseling; Chairman and Director, Federated Global Investment Management Corp.; Chairman and Trustee, Federated Equity Management Company of Pennsylvania; Trustee, Federated Shareholder Services Company; Director, Federated Services Company.
Previous Positions: President, Federated Investment Counseling; President and Chief Executive Officer, Federated Investment Management Company, Federated Global Investment Management Corp. and Passport Research, Ltd; Chairman, Passport Research, Ltd. |
Annual Shareholder Report
Name
Birth Date
Positions Held with Trust
Date Service Began | Principal Occupation(s) for Past Five Years,
Other Directorships Held and Previous Position(s) |
John B. Fisher*
Birth Date: May 16, 1956
Trustee
Indefinite Term
Began serving: May 2016 | Principal Occupations:Principal Executive Officer and President of certain of the Funds in the Federated Fund Family; Director or Trustee of certain of the Funds in the Federated Fund Family; Vice President, Federated Investors, Inc.; President, Director/Trustee and CEO, Federated Advisory Services Company, Federated Equity Management Company of Pennsylvania, Federated Global Investment Management Corp., Federated Investment Counseling, Federated Investment Management Company; President of some of the Funds in the Federated Fund Complex and Director, Federated Investors Trust Company.
Previous Positions: President and Director of the Institutional Sales Division of Federated Securities Corp.; President and Director of Federated Investment Counseling; President and CEO of Passport Research, Ltd.; Director, Edgewood Securities Corp.; Director, Federated Services Company; Director, Federated Investors, Inc.; Chairman and Director, Southpointe Distribution Services, Inc. and President, Technology, Federated Services Company. |
| * | Reasons for “interested” status: J. Christopher Donahue and John B. Fisher are interested due to their beneficial ownership of shares of Federated Investors, Inc. and due to positions they hold with Federated and its subsidiaries. |
INDEPENDENT TRUSTEES Background
Name
Birth Date
Positions Held with Trust
Date Service Began | Principal Occupation(s) for Past Five Years,
Other Directorships Held, Previous Position(s) and Qualifications |
John T. Collins
Birth Date: January 24, 1947
Trustee
Indefinite Term
Began serving: October 2013 | Principal Occupations: Director or Trustee of the Federated Fund Family; formerly, Chairman and CEO, The Collins Group, Inc. (a private equity firm) (Retired).
Other Directorships Held: Director, Chairman of the Compensation Committee, KLX Energy Services Holdings, Inc. (oilfield services); former Director of KLX Corp. (aerospace).
Qualifications: Mr. Collins has served in several business and financial management roles and directorship positions throughout his career. Mr. Collins previously served as Chairman and CEO of The Collins Group, Inc. (a private equity firm) and as a Director of KLX Corp. Mr. Collins serves as Chairman Emeriti, Bentley University. Mr. Collins previously served as Director and Audit Committee Member, Bank of America Corp.; Director, FleetBoston Financial Corp.; and Director, Beth Israel Deaconess Medical Center (Harvard University Affiliate Hospital). |
Annual Shareholder Report
Name
Birth Date
Positions Held with Trust
Date Service Began | Principal Occupation(s) for Past Five Years,
Other Directorships Held, Previous Position(s) and Qualifications |
G. Thomas Hough
Birth Date: February 28, 1955
Trustee
Indefinite Term
Began serving: August 2015 | Principal Occupations: Director or Trustee of the Federated Fund Family; formerly, Vice Chair, Ernst & Young LLP (public accounting firm) (Retired).
Other Directorships Held: Director, Member of Governance and Compensation Committees, Publix Super Markets, Inc.; Director, Chair of the Audit Committee, Equifax, Inc.; Director, Member of the Audit Committee, Haverty Furniture Companies, Inc.
Qualifications: Mr. Hough has served in accounting, business management and directorship positions throughout his career. Mr. Hough most recently held the position of Americas Vice Chair of Assurance with Ernst & Young LLP (public accounting firm). Mr. Hough serves on the President's Cabinet and Business School Board of Visitors for the University of Alabama and is on the Business School Board of Visitors for Wake Forest University. Mr. Hough previously served as an Executive Committee member of the United States Golf Association. |
Maureen Lally-Green
Birth Date: July 5, 1949
Trustee
Indefinite Term
Began serving: August 2009 | Principal Occupations: Director or Trustee of the Federated Fund Family; Adjunct Professor of Law, Duquesne University School of Law; formerly, Dean of the Duquesne University School of Law and Professor of Law and Interim Dean of the Duquesne University School of Law; formerly, Associate General Secretary and Director, Office of Church Relations, Diocese of Pittsburgh.
Other Directorships Held: Director, CNX Resources Corporation (formerly known as CONSOL Energy Inc.).
Qualifications: Judge Lally-Green has served in various legal and business roles and directorship positions throughout her career. Judge Lally-Green previously held the position of Dean of the School of Law of Duquesne University (as well as Interim Dean). Judge Lally-Green previously served as a member of the Superior Court of Pennsylvania and as a Professor of Law, Duquesne University School of Law. Judge Lally-Green also currently holds the positions on not for profit or for profit boards of directors as follows: Director and Chair, UPMC Mercy Hospital; Director and Vice Chair, Our Campaign for the Church Alive!, Inc.; Regent, Saint Vincent Seminary; Member, Pennsylvania State Board of Education (public); and Director CNX Resources Corporation (formerly known as CONSOL Energy Inc.). Judge Lally-Green has held the positions of: Director, Auberle; Director, Epilepsy Foundation of Western and Central Pennsylvania; Director, Ireland Institute of Pittsburgh; Director, Saint Thomas More Society; Director and Chair, Catholic High Schools of the Diocese of Pittsburgh, Inc.; Director, Pennsylvania Bar Institute; Director, St. Vincent College; and Director and Chair, North Catholic High School, Inc. |
Charles F. Mansfield, Jr.
Birth Date: April 10, 1945
Trustee
Indefinite Term
Began serving: January 1999 | Principal Occupations: Director or Trustee of the Federated Fund Family; Management Consultant and Author.
Other Directorships Held: None.
Qualifications: Mr. Mansfield has served as a Marine Corps officer and in several banking, business management, educational roles and directorship positions throughout his long career. He remains active as a Management Consultant and Author. |
Annual Shareholder Report
Name
Birth Date
Positions Held with Trust
Date Service Began | Principal Occupation(s) for Past Five Years,
Other Directorships Held, Previous Position(s) and Qualifications |
Thomas M. O'Neill
Birth Date: June 14, 1951
Trustee
Indefinite Term
Began serving: October 2006 | Principal Occupations: Director or Trustee, Chair of the Audit Committee of the Federated Fund Family; Sole Proprietor, Navigator Management Company (investment and strategic consulting).
Other Directorships Held: None.
Qualifications: Mr. O'Neill has served in several business, mutual fund and financial management roles and directorship positions throughout his career. Mr. O'Neill serves as Director, Medicines for Humanity and Director, The Golisano Children's Museum of Naples, Florida. Mr. O'Neill previously served as Chief Executive Officer and President, Managing Director and Chief Investment Officer, Fleet Investment Advisors; President and Chief Executive Officer, Aeltus Investment Management, Inc.; General Partner, Hellman, Jordan Management Co., Boston, MA; Chief Investment Officer, The Putnam Companies, Boston, MA; Credit Analyst and Lending Officer, Fleet Bank; Director and Consultant, EZE Castle Software (investment order management software); and Director, Midway Pacific (lumber). |
P. Jerome Richey
Birth Date: February 23, 1949
Trustee
Indefinite Term
Began serving: October 2013 | Principal Occupations: Director or Trustee of the Federated Fund Family; Management Consultant; Retired; formerly, Senior Vice Chancellor and Chief Legal Officer, University of Pittsburgh and Executive Vice President and Chief Legal Officer, CNX Resources Corporation (formerly known as CONSOL Energy Inc.).
Other Directorships Held: None.
Qualifications: Mr. Richey has served in several business and legal management roles and directorship positions throughout his career. Mr. Richey most recently held the positions of Senior Vice Chancellor and Chief Legal Officer, University of Pittsburgh. Mr. Richey previously served as Chairman of the Board, Epilepsy Foundation of Western Pennsylvania and Chairman of the Board, World Affairs Council of Pittsburgh. Mr. Richey previously served as Chief Legal Officer and Executive Vice President, CNX Resources Corporation (formerly known as CONSOL Energy Inc.); and Board Member, Ethics Counsel and Shareholder, Buchanan Ingersoll & Rooney PC (a law firm). |
John S. Walsh
Birth Date: November 28, 1957
Trustee
Indefinite Term
Began serving: January 1999 | Principal Occupations: Director or Trustee, and Chair of the Board of Directors or Trustees, of the Federated Fund Family; President and Director, Heat Wagon, Inc. (manufacturer of construction temporary heaters); President and Director, Manufacturers Products, Inc. (distributor of portable construction heaters); President, Portable Heater Parts, a division of Manufacturers Products, Inc.
Other Directorships Held: None.
Qualifications: Mr. Walsh has served in several business management roles and directorship positions throughout his career. Mr. Walsh previously served as Vice President, Walsh & Kelly, Inc. (paving contractors). |
Annual Shareholder Report
OFFICERS
Name
Birth Date
Address
Positions Held with Trust
Date Service Began | Principal Occupation(s) for Past Five Years
and Previous Position(s) |
Lori A. Hensler
Birth Date: January 6, 1967
TREASURER
Officer since: April 2013 | Principal Occupations: Principal Financial Officer and Treasurer of the Federated Fund Family; Senior Vice President, Federated Administrative Services; Financial and Operations Principal for Federated Securities Corp. and Edgewood Services, Inc.; and Assistant Treasurer, Federated Investors Trust Company. Ms. Hensler has received the Certified Public Accountant designation.
Previous Positions: Controller of Federated Investors, Inc.; Senior Vice President and Assistant Treasurer, Federated Investors Management Company; Treasurer, Federated Investors Trust Company; Assistant Treasurer, Federated Administrative Services, Federated Administrative Services, Inc., Federated Securities Corp., Edgewood Services, Inc., Federated Advisory Services Company, Federated Equity Management Company of Pennsylvania, Federated Global Investment Management Corp., Federated Investment Counseling, Federated Investment Management Company, Passport Research, Ltd., and Federated MDTA, LLC; Financial and Operations Principal for Federated Securities Corp., Edgewood Services, Inc. and Southpointe Distribution Services, Inc. |
Peter J. Germain
Birth Date: September 3, 1959
CHIEF LEGAL OFFICER, SECRETARY and EXECUTIVE VICE PRESIDENT
Officer since: January 2005
| Principal Occupations: Mr. Germain is Chief Legal Officer, Secretary and Executive Vice President of the Federated Fund Family. He is General Counsel, Chief Legal Officer, Secretary and Executive Vice President, Federated Investors, Inc.; Trustee and Senior Vice President, Federated Investors Management Company; Trustee and President, Federated Administrative Services; Director and President, Federated Administrative Services, Inc.; Director and Vice President, Federated Securities Corp.; Director and Secretary, Federated Private Asset Management, Inc.; Secretary, Federated Shareholder Services Company; and Secretary, Retirement Plan Service Company of America. Mr. Germain joined Federated in 1984 and is a member of the Pennsylvania Bar Association.
Previous Positions: Deputy General Counsel, Special Counsel, Managing Director of Mutual Fund Services, Federated Investors, Inc.; Senior Vice President, Federated Services Company; and Senior Corporate Counsel, Federated Investors, Inc. |
Stephen Van Meter
Birth Date: June 5, 1975
CHIEF COMPLIANCE OFFICER AND SENIOR VICE PRESIDENT
Officer since: July 2015 | Principal Occupations: Senior Vice President and Chief Compliance Officer of the Federated Fund Family; Vice President and Chief Compliance Officer of Federated Investors, Inc. and Chief Compliance Officer of certain of its subsidiaries. Mr. Van Meter joined Federated in October 2011. He holds FINRA licenses under Series 3, 7, 24 and 66.
Previous Positions: Mr. Van Meter previously held the position of Compliance Operating Officer, Federated Investors, Inc. Prior to joining Federated, Mr. Van Meter served at the United States Securities and Exchange Commission in the positions of Senior Counsel, Office of Chief Counsel, Division of Investment Management and Senior Counsel, Division of Enforcement. |
Annual Shareholder Report
Name
Birth Date
Address
Positions Held with Trust
Date Service Began | Principal Occupation(s) for Past Five Years
and Previous Position(s) |
Stephen F. Auth
Birth Date: September 13, 1956
101 Park Avenue
41st Floor
New York, NY 10178
CHIEF INVESTMENT OFFICER
Officer since: November 2002 | Principal Occupations: Stephen F. Auth is Chief Investment Officer of various Funds in the Federated Fund Family; Executive Vice President, Federated Investment Counseling, Federated Global Investment Management Corp. and Federated Equity Management Company of Pennsylvania.
Previous Positions: Executive Vice President, Federated Investment Management Company and Passport Research, Ltd. (investment advisory subsidiary of Federated); Senior Vice President, Global Portfolio Management Services Division; Senior Vice President, Federated Investment Management Company and Passport Research, Ltd.; Senior Managing Director and Portfolio Manager, Prudential Investments. |
Annual Shareholder Report
Evaluation and Approval of Advisory Contract–May 2019
Federated Kaufmann Fund (the “Fund”)
At its meetings in May 2019, the Fund's Board of Trustees (the “Board”), including a majority of those trustees who are not “interested persons” of the Fund, as defined in the Investment Company Act of 1940 (the “Independent Trustees”), reviewed and unanimously approved the continuation of the Fund's investment advisory and subadvisory contracts for an additional one-year term. The Board's decision regarding these contracts reflects the exercise of its business judgment after considering all of the information received on whether to continue the existing arrangements.
At the request of the Independent Trustees, the Fund's Chief Compliance Officer (the CCO) furnished to the Board in advance of its May 2019 meetings an independent written evaluation presenting on the topics discussed below. The Board considered the CCO's independent written evaluation (the “CCO Fee Evaluation Report”), along with other information, in evaluating the reasonableness of the Fund's management fee and in deciding to approve the continuation of the investment advisory and subadvisory contracts. The CCO, in preparing the CCO Fee Evaluation Report, has the authority to retain consultants, experts or staff as reasonably necessary to assist in the performance of his duties, reports directly to the Board, and can be terminated only with the approval of a majority of the Independent Trustees. At the request of the Independent Trustees, the CCO Fee Evaluation Report followed the same general approach and covered the same topics as that of the report that had previously been delivered by the CCO in his capacity as “Senior Officer,” prior to the elimination of the Senior Officer position in December 2017.
The Board also considered judicial decisions concerning allegedly excessive investment advisory fees in making its decision. Using these judicial decisions as a guide, the Board observed that the following factors may be relevant to an adviser's fiduciary duty with respect to its receipt of compensation from a fund: (1) the nature and quality of the services provided by an adviser to a fund and its shareholders (including the performance of the fund, its benchmark, and comparable funds); (2) an adviser's cost of providing the services (including the profitability to an adviser of providing advisory services to a fund); (3) the extent to which an adviser may realize “economies of scale” as a fund grows larger and, if such economies of scale exist, whether they have been shared with a fund and its shareholders or the family of funds; (4) any “fall-out” financial benefits that accrue to an adviser because of its relationship with a fund (including research services received from brokers that execute fund trades and any fees paid to affiliates of an adviser for services rendered to a fund); (5) comparative fee and expense structures (including a comparison of fees paid to an adviser with those paid by similar funds both internally and externally as well as management fees charged to institutional and other advisory clients of the
Annual Shareholder Report
adviser for what might be viewed as like services); and (6) the extent of care, conscientiousness and independence with which the fund's board members perform their duties and their expertise (including whether they are fully informed about all facts the board deems relevant to its consideration of an adviser's services and fees). The Board noted that the Securities and Exchange Commission (SEC) disclosure requirements regarding the basis for the Board's approval of the Fund's investment advisory and subadvisory contracts generally align with the factors listed above. The Board was aware of these factors and was guided by them in its review of the Fund's investment advisory and subadvisory contracts to the extent it considered them to be appropriate and relevant, as discussed further below.
The Board considered and weighed these factors in light of its substantial accumulated experience in governing the Fund and working with Federated Equity Management Company of Pennsylvania (the “Adviser”) and its affiliates (collectively, “Federated”) on matters relating to the funds advised by Federated (each, a “Federated Fund”). The Independent Trustees were assisted in their deliberations by independent legal counsel.
In addition to the extensive materials that comprise and accompany the CCO Fee Evaluation Report, the Board received detailed information about the Fund and the Federated organization throughout the year, and in connection with its May meetings at which the Board's formal approval of the advisory and subadvisory contracts occurred. In this regard, Federated provided much of this information at each regular meeting of the Board, and furnished additional information specifically in connection with the May meetings. In the months preceding the May meetings, the Board requested and reviewed written materials prepared by Federated in response to requests on behalf of the Independent Trustees encompassing a wide variety of topics. At the May meetings, in addition to meeting in separate sessions of the Independent Trustees without management present, senior management of the Adviser also met with the Independent Trustees and their counsel to discuss the materials presented and such additional matters as the Independent trustees deemed reasonably necessary to evaluate the advisory and subadvisory contracts. Between regularly scheduled meetings, the Board also received information on particular matters as the need arose.
The Board's consideration of the investment advisory and subadvisory contracts included review of the CCO Fee Evaluation Report, accompanying data and additional information covering the following matters, among others: the Adviser's and sub-adviser's investment philosophy, revenue, profitability, personnel and processes; investment and operating strategies; the Fund's short-term and long-term performance (in absolute terms, both on a gross basis and net of expenses, as well as in terms relative to its particular investment program and certain competitor or “peer group” funds and/or other benchmarks, as appropriate) and comments on the reasons for performance; the Fund's investment objectives; the Fund's expenses, including the advisory fee and the
Annual Shareholder Report
overall expense structure of the Fund (both in absolute terms and relative to similar and/or competing funds), with due regard for contractual or voluntary expense limitations; the use and allocation of brokerage commissions derived from trading the Fund's portfolio securities (if any); and the nature, quality and extent of the advisory and other services provided to the Fund by the Adviser and its affiliates. The Board also considered the preferences and expectations of Fund shareholders; the entrepreneurial and other risks assumed by the Adviser in sponsoring the Fund; the continuing state of competition in the mutual fund industry and market practices; the range of comparable fees for similar funds in the mutual fund industry; the Fund's relationship to the Federated Funds which include a comprehensive array of funds with different investment objectives, policies and strategies which are generally available for exchange without the incurrence of additional sales charges; compliance and audit reports concerning the Federated Funds and the Federated companies that service them (including communications from regulatory agencies), as well as Federated's responses to any issues raised therein; and relevant developments in the mutual fund industry and how the Federated Funds and/or Federated are responding to them. The Board also considered that the longevity and experience of the Fund's portfolio management team and their extensive bottom-up approach to investing may limit the utility of comparisons to other equity mutual funds. The Board's evaluation process is evolutionary. The criteria considered and the emphasis placed on relevant criteria change in recognition of changing circumstances in the mutual fund marketplace.
While mindful that courts have cautioned against giving too much weight to comparative information concerning fees charged by other advisers for managing funds with comparable investment programs, the Board has found the use of such comparisons to be relevant to its deliberations. In this regard, the Board was presented with, and considered, information regarding the contractual advisory fee rates, net advisory fee rates, total expense ratios and each element of the Fund's total expense ratio (i.e., gross and net advisory fees, custody fees, portfolio accounting fees and transfer agency fees) relative to an appropriate group of peer funds compiled by Federated using data supplied by independent fund ranking organizations (the “Peer Group”). The Board received a description of the composition and methodology used to select the Peer Group. The Board focused on comparisons with other similar mutual funds more heavily than non-mutual fund products or services because it is believed that they are more relevant. For example, other mutual funds are the products most like the Fund, in that they are readily available to Fund shareholders as alternative investment vehicles. Also, they are the type of investment vehicle, in fact, chosen and maintained by the Fund's investors. The range of their fees and expenses, therefore, appears to be a relevant indicator of what consumers have found to be reasonable in the marketplace in which the Fund competes.
Annual Shareholder Report
The Board reviewed the contractual advisory fee rate, net advisory fee rate and other expenses of the Fund and noted the position of the Fund's fee rates relative to its Peer Group. In this regard, the Board noted that the contractual advisory fee rate was above the median of the relevant Peer Group, but the Board noted the applicable waivers and reimbursements, and that the overall expense structure of the Fund remained competitive in the context of other factors considered by the Board.
The CCO noted that, in 2018, while the Fund's expenses were above median relative to its Peer Group, those fees remained reasonable in light of its extensive bottom-up investment process, the relative expense of that process, the resulting estimated profitability of the Fund over time, and the performance generated over time compared to its Peer Group.
For comparison, the CCO reviewed the fees charged by Federated for providing advisory services to products other than the Federated Funds (e.g., institutional separate accounts and third-party unaffiliated mutual funds for which Federated serves as sub-adviser) (referenced to as “Comparable Funds/Accounts”). With respect to Comparable Funds/Accounts other than third-party mutual funds, the CCO concluded that they are inherently different products. Those differences include, but are not limited to, different types of targeted investors; different applicable laws and regulations; different legal structures; different average account sizes and portfolio management techniques made necessary by different cash flows and different associated costs; and the time spent by portfolio managers and their teams, as well as personnel in the Funds Financial Services, Legal, Compliance and Risk Management departments, in reviewing securities pricing, addressing different administrative responsibilities, addressing different degrees of risk associated with management and a variety of different costs. The CCO also reviewed the differences in the nature of the services required for Federated to manage its proprietary mutual fund business versus managing a discrete pool of assets as a sub-adviser to another institution's mutual fund, and that Federated generally performs significant additional services and assumes substantially greater risks in managing the Fund and other Federated Funds than in its role as sub-adviser to an unaffiliated third-party mutual fund. The CCO did not consider the fees for providing advisory services to Comparable Funds/Accounts to be determinative in judging the appropriateness of the Federated Funds' advisory fees.
In the case of the Fund, Federated does not manage any Comparable Funds/Accounts in the style of the Fund.
Following such evaluation, and full deliberations, the Board concluded that the fees and expenses of the Fund are reasonable and supported renewal of the Fund's investment advisory and subadvisory contracts.
The Board considered the nature, extent and quality of the services provided to the Fund by the Adviser and the resources of the Adviser and its affiliates dedicated to the Fund. In this regard, the Board evaluated, among other things, the Adviser's personnel, experience, track record, financial resources, overall
Annual Shareholder Report
reputation and willingness to invest in personnel and infrastructure that benefit the Fund. In addition, the Board reviewed the qualifications, backgrounds and responsibilities of the portfolio management team primarily responsible for the day-to-day management of the Fund and the Adviser's ability and experience in attracting and retaining qualified personnel to service the Fund. The Board noted the investment research and company engagement capabilities of the Adviser and its affiliates. The Board also noted the compliance program of the Adviser and the compliance-related resources provided to the Fund by the Adviser, including the Adviser's commitment to respond to rulemaking initiatives of the SEC. The Fund's ability to deliver competitive performance when compared to its Peer Group was also deemed to be relevant by the Board as a useful indicator of how the Adviser is executing the Fund's investment program. The Adviser's ability to execute this program was one of the Board's considerations in reaching a conclusion that the nature, extent and quality of the Adviser's investment management services warrant the continuation of the investment advisory and subadvisory contracts.
In evaluating the Fund's investment performance, the Board considered performance results in light of the Fund's investment objective, strategies and risks, as disclosed in the Fund's prospectus. The Board considered detailed investment reports on the Fund's performance that were provided to the Board throughout the year and in connection with the May meetings. The CCO also reviewed information regarding the performance of other mutual funds in the Peer Group, noting the CCO's view that comparisons to fund peer groups may be helpful, though not conclusive, in evaluating the performance of the Adviser in managing the Fund. The Board considered, in evaluating such comparisons, that in some cases there may be differences in the funds' objectives or investment management techniques, or the costs to implement the funds, even within the same Peer Group.
For the one-year, three-year and five-year periods covered by the CCO Fee Evaluation Report, the Fund's performance was above the median of the relevant Peer Group.
Following such evaluation, and full deliberations, the Board concluded that the performance of the Fund supported renewal of the Fund's investment advisory and subadvisory contracts.
The Board also received financial information about Federated, including information regarding the compensation and ancillary (or “fall-out”) benefits Federated derived from its relationships with the Federated Funds. This information covered not only the fees under the investment advisory contracts, but also fees received by Federated's subsidiaries for providing other services to the Federated Funds under separate contracts (e.g., for serving as the Federated funds' administrator and distributor). In this regard, the Board considered that certain Federated subsidiaries provide distribution and shareholder services to the Federated Funds, for which they may be compensated through distribution and servicing fees paid pursuant to Rule 12b-1 plans or otherwise. The
Annual Shareholder Report
information also detailed any indirect benefit Federated may derive from its receipt of research services from brokers who execute Federated Fund trades. In addition, the Board considered the fact that, in order for a Federated Fund to be competitive in the marketplace, the Adviser and its affiliates frequently waived fees and/or reimbursed expenses and have disclosed to Federated Fund investors and/or indicated to the Board their intention to do so in the future. Moreover, the Board receives regular reporting as to the institution, adjustment or elimination of these voluntary waivers. The Board considered Federated's previous reductions in contractual management fees to certain Federated Funds in response to the CCO's recommendations in the prior year's CCO Fee Evaluation Report.
Federated furnished information, requested by the CCO, that reported revenues on a fund-by-fund basis and made estimates of the allocation of expenses on a fund-by-fund basis, using allocation methodologies specified by the CCO. The CCO noted that, while these cost allocation reports apply consistent allocation processes, the inherent difficulties in allocating costs continues to cause the CCO to question the precision of the process and to conclude that such reports may be unreliable, since a single change in an allocation estimate may dramatically alter the resulting estimate of cost and/or profitability of a Federated Fund and may produce unintended consequences. The allocation information, including the CCO's view that fund-by-fund estimations may be unreliable, was considered in the evaluation by the Board.
The Board and the CCO also reviewed information compiled by Federated comparing its profitability information to other publicly held fund management companies, including information regarding profitability trends over time. In this regard, the CCO concluded that Federated's profit margins did not appear to be excessive. The CCO also noted that Federated appeared financially sound, with the resources necessary to fulfill its obligations under its contracts with the Fund.
The CCO Fee Evaluation Report also discussed the notion of possible realization of “economies of scale” as a fund grows larger, the difficulties of calculating economies of scale at an individual fund level, and the extent to which potential scale benefits are shared with shareholders. In this regard, the Board considered that the Adviser has made significant and long-term investments in areas that support all of the Federated Funds, such as personnel and processes for the portfolio management, shareholder services, compliance, internal audit and risk management functions, as well as systems technology (including technology relating to cybersecurity) and that the benefits of these investments (as well as any economies of scale, should they exist) were likely to be shared with the Federated Fund family as a whole. The Board noted that Federated's investments in these areas are extensive. In addition, the Board considered that the Adviser and its affiliates have frequently waived fees and/or reimbursed expenses and that this has allowed potential economies of scale to be shared with shareholders. The Board also considered that such waivers and
Annual Shareholder Report
reimbursements can provide protection from an increase in expenses if a Federated Fund's assets decline. Federated, as it does throughout the year, and specifically in connection with the Board's review of the advisory and subadvisory contracts, furnished information relative to revenue sharing or adviser-paid fees. Federated and the CCO noted that this information should be viewed to determine if there was an incentive to either not apply breakpoints, or to apply breakpoints at higher levels, and should not be viewed to determine the appropriateness of advisory fees. The Board also noted the absence of any applicable regulatory or industry guidelines on this subject, which (as discussed in the CCO Fee Evaluation Report) is compounded by the lack of any common industry practice or general pattern with respect to structuring fund advisory fees with “breakpoints” that serve to reduce the fee as a fund attains a certain size.
The CCO Fee Evaluation Report also noted that the Board is aware of the provisions agreed upon in the settlement of the Kaufmann Fund fee litigation under which, starting July 1, 2012 and for a period of ten years thereafter, a cap on the net investment advisory fee is imposed and under which additional breakpoints are required upon the Fund reaching $8 billion, $9 billion, $10 billion and $12 billion in size.
The CCO stated that his observations and the information accompanying the CCO Fee Evaluation Report supported a finding by the Board that the management fee for the Fund was reasonable. Under these circumstances, no changes were recommended to, and no objection was raised to the continuation of, the Fund's investment advisory and subadvisory contracts. The CCO also recognized that the Board's evaluation of the Federated Funds' advisory and subadvisory arrangements is a continuing and on-going process that is informed by the information that the Board requests and receives from management throughout the course of the year and, in this regard, the CCO noted certain items for future reporting to the Board or further consideration by management as the Board continues its on-going oversight of the Federated Funds.
In its decision to continue an existing investment advisory contract, the Board was mindful of the potential disruptions of the Fund's operations and various risks, uncertainties and other effects that could occur as a result of a decision to terminate or not renew an investment advisory contract. In particular, the Board recognized that many shareholders have invested in the Fund on the strength of the Adviser's industry standing and reputation and with the expectation that the Adviser will have a continuing role in providing advisory services to the Fund. Thus, the Board's approval of the advisory and subadvisory contracts reflected the fact that it is the shareholders who have effectively selected the Adviser by virtue of having invested in the Fund. The Board concluded that, in light of the factors summarized above, including the nature, quality and scope of the services provided to the Fund by the Adviser and its affiliates, continuation of the investment advisory and subadvisory contracts were appropriate.
Annual Shareholder Report
The Board based its decision to approve the investment advisory and subadvisory contracts on the totality of the circumstances and relevant factors and with a view to past and future long-term considerations. Not all of the factors and considerations identified above were necessarily relevant to the Fund, nor did the Board consider any one of them to be determinative. With respect to the factors that were relevant, the Board's decision to approve the continuation of the contracts reflects its view that Federated's performance and actions provided a satisfactory basis to support the decision to continue the existing arrangements.
Annual Shareholder Report
Voting Proxies on Fund Portfolio Securities
A description of the policies and procedures that the Fund uses to determine how to vote proxies, if any, relating to securities held in the Fund's portfolio is available, without charge and upon request, by calling 1-800-341-7400. A report on “Form N-PX” of how the Fund voted any such proxies during the most recent 12-month period ended June 30 is available via the Proxy Voting Record (Form N-PX) link associated with the Fund and share class name at www.FederatedInvestors.com/FundInformation. Form N-PX filings are also available at the SEC's website at www.sec.gov.
Quarterly Portfolio Schedule
Each fiscal quarter, the Fund will file with the SEC a complete schedule of its monthly portfolio holdings on “Form N-PORT.” The Fund's holdings as of the end of the third month of every fiscal quarter, as reported on Form N-PORT, will be publicly available on the SEC's website at www.sec.gov within 60 days of the end of the fiscal quarter upon filing. You may also access this information via the link to the Fund and share class name at www.FederatedInvestors.com.
Annual Shareholder Report
Mutual funds are not bank deposits or obligations, are not guaranteed by any bank and are not insured or guaranteed by the U.S. government, the Federal Deposit Insurance Corporation, the Federal Reserve Board or any other government agency. Investment in mutual funds involves investment risk, including the possible loss of principal.
This Report is authorized for distribution to prospective investors only when preceded or accompanied by the Fund's Prospectus, which contains facts concerning its objective and policies, management fees, expenses and other information.
Federated Kaufmann Fund
Federated Investors Funds
4000 Ericsson Drive
Warrendale, PA 15086-7561
Contact us at FederatedInvestors.com
or call 1-800-341-7400.
Federated Securities Corp., Distributor
CUSIP 314172677
CUSIP 314172669
CUSIP 314172651
CUSIP 314172644
CUSIP 31421N873
26396 (12/19)
Federated is a registered trademark of Federated Investors, Inc.
2019 ©Federated Investors, Inc.
Annual Shareholder Report
October 31, 2019
| Share Class | Ticker | A | KLCAX | C | KLCCX | R | KLCKX |
| | Institutional | KLCIX | R6 | KLCSX | |
Federated Kaufmann Large Cap Fund
Fund Established 2007
A Portfolio of Federated Equity Funds
IMPORTANT NOTICE REGARDING REPORT DELIVERY
Beginning on January 1, 2021, as permitted by regulations adopted by the Securities and Exchange Commission, paper copies of the Fund's shareholder reports like this one will no longer be sent by mail, unless you specifically request paper copies of the reports from the Fund or from your financial intermediary, such as a broker-dealer or bank. Instead, the reports will be made available on a website, and you will be notified by mail each time a report is posted and provided with a website link to access the report.
If you already elected to receive shareholder reports electronically, you will not be affected by this change and you need not take any action. You may elect to receive shareholder reports and other communications from the Fund or your financial intermediary electronically by contacting your financial intermediary (such as a broker-dealer or bank); other shareholders may call the Fund at 1-800-341-7400, Option 4.
You may elect to receive all future reports in paper free of charge. You can inform the Fund or your financial intermediary that you wish to continue receiving paper copies of your shareholder reports by contacting your financial intermediary (such as a broker-dealer or bank); other shareholders may call the Fund at 1-800-341-7400, Option 4. Your election to receive reports in paper will apply to all funds held with the Fund complex or your financial intermediary.
Not FDIC Insured ■ May Lose Value ■ No Bank Guarantee
J. Christopher
Donahue
President
Federated Kaufmann Large Cap Fund
Letter from the President
Dear Valued Shareholder,
I am pleased to present the Annual Shareholder Report for your fund covering the period from November 1, 2018 through October 31, 2019. This report includes Management's Discussion of Fund Performance, a complete listing of your fund's holdings, performance information and financial statements along with other important fund information.
In addition, our website, FederatedInvestors.com, offers easy access to Federated resources that include timely fund updates, economic and market insights from our investment strategists, and financial planning tools.
Thank you for investing with Federated. I hope you find this information useful and look forward to keeping you informed.
Sincerely,
J. Christopher Donahue, President
CONTENTS
| 1 |
| 5 |
| 6 |
| 10 |
| 15 |
| 17 |
| 19 |
| 20 |
| 32 |
| 34 |
| 36 |
| 42 |
| 50 |
| 50 |
Management's Discussion of Fund Performance (unaudited)
The total return of Federated Kaufmann Large Cap Fund (the “Fund”), based on net asset value for the 12-month reporting period ended October 31, 2019, was 22.76% for the Class A Shares, 21.85% for the Class C Shares, 22.32% for the Class R Shares, 23.07% for the Institutional Shares and 23.17% for the Class R6 Shares. The total return of the Russell 1000® Growth Index (R1000G),1 the Fund's broad-based securities market index, was 17.10% for the same period. The total return of the Morningstar Large Growth Funds Average (MLGFA),2 a peer group average for the Fund, was 14.51% for the same period. The Fund's and MLGFA's total returns for the most recently completed fiscal year reflected actual cash flows, transaction costs and other expenses, which were not reflected in the total return of the R1000G.
During the reporting period, the Fund's investment strategy focused on stock selection, sector exposure, international exposure3 and the effect of cash holdings. These were the most significant factors affecting the Fund's performance relative to the R1000G.
The following discussion will focus on the performance of the Fund's Class R6 Shares.
Market Overview
During the reporting period, returns in most global equity markets increased as economic growth remained positive, despite it slowing. The U.S. Federal Reserve (the “Fed”) reversed its previous path of raising rates and began lowering rates, eventually planning to pause until 2020. U.S. GDP growth remained strong, with the consumer leading the way while business investments slowed when the tax reform momentum wore off. Global central banks remained supportive, easing policies with the hope their economies would respond positively. The large fiscal stimulus in late 2017 along with the administration's business-friendly stance helped U.S. growth outpace much of the world. However, as U.S. trade tensions continued during the reporting period, volatility increased.
Stock Selection
The key factors affecting performance from a macroeconomic standpoint were the improving U.S. economic fundamentals and the accommodative monetary policies of the Fed and other central banks around the world. These monetary accommodations, combined with a more aggressive fiscal stance, helped to boost earnings for most of the S&P 500 Index4 constituents. The profitability of many of the companies in which the Fund invested remained strong throughout the reporting period. Fund management continued to seek what it viewed as attractive growth investment opportunities–companies it
Annual Shareholder Report
viewed as dominant competitors, possessing strengthening fundamentals, with the potential to deliver both near-term and long-term growth in sales and earnings.
The majority of the Fund outperformance versus the R1000G was due to stock selection, particularly in the Financials, Industrials and Consumer Discretionary sectors. Individual companies that most contributed to Fund performance during the reporting period were Veeva Systems, Inc., Microsoft Corporation, Galapagos, NV, Worldpay and ServiceNow. Holdings that negatively impacted Fund performance were XPO Logistics, Albemarle Corporation, Dropbox, Inc., Booking Holdings and Constellation Brands.
Sector Exposure
At the end of the reporting period, approximately 79% of the portfolio was invested in four large sectors: Information Technology, Health Care, Consumer Discretionary and Industrials. These sectors have historically provided good opportunities for bottom-up growth investors.
International Exposure
Stock selection of companies domiciled outside the U.S. was a negative contributor to Fund performance. Approximately 9.6% of the Fund's assets were invested in such companies during the reporting period.
Effect of Cash Holdings
The Fund had significant outflows during the reporting period which resulted in an average cash position of 2.71%. In a rising market, the cash holdings resulted in a modest drag on relative Fund performance versus the R1000G.
| 1 | Please see the footnotes to the line graphs below for definitions of, and further information about, the R1000G. |
| 2 | Please see the footnotes to the line graphs below for definitions of, and further information about, the MLGFA. |
| 3 | International investing involves special risks including currency risk, increased volatility, political risks and differences in auditing and other financial standards. |
| 4 | The S&P 500 Index is an unmanaged capitalization-weighted index of 500 stocks designed to measure performance of the broad domestic economy through changes in the aggregate market value of 500 stocks representing all major industries. The S&P 500 Index is unmanaged, and it is not possible to invest directly in an index. |
Annual Shareholder Report
FUND PERFORMANCE AND GROWTH OF A $10,000 INVESTMENT
The graph below illustrates the hypothetical investment of $10,0001 in the Federated Kaufmann Large Cap Fund from October 31, 2009 to October 31, 2019, compared to the Russell 1000® Growth Index (R1000G)2 and the Morningstar Large Growth Funds Average (MLGFA).3 The Average Annual Total Return table below shows returns for each class averaged over the stated periods.
Growth of a $10,000 Investment
Growth of $10,000 as of October 31, 2019
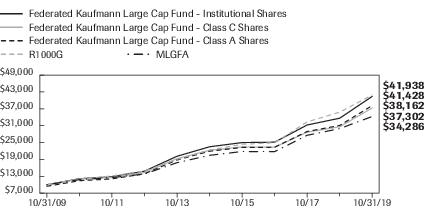
| Federated Kaufmann Large Cap Fund - | Institutional Shares | Class C Shares | Class A Shares | R1000G | MLGFA |
| F | F | F | I | I |
| 10/31/2009 | 10,000 | 10,000 | 9,450 | 10,000 | 10,000 |
| 10/31/2010 | 12,138 | 11,998 | 11,434 | 11,965 | 11,806 |
| 10/31/2011 | 12,853 | 12,567 | 12,078 | 13,152 | 12,547 |
| 10/31/2012 | 14,829 | 14,351 | 13,900 | 14,864 | 13,800 |
| 10/31/2013 | 20,127 | 19,268 | 18,825 | 19,069 | 17,851 |
| 10/31/2014 | 23,497 | 22,263 | 21,916 | 22,332 | 20,462 |
| 10/31/2015 | 24,996 | 23,450 | 23,261 | 24,382 | 21,808 |
| 10/31/2016 | 25,142 | 23,346 | 23,337 | 24,938 | 21,790 |
| 10/31/2017 | 31,251 | 28,706 | 28,930 | 32,348 | 27,591 |
| 10/31/2018 | 33,663 | 30,613 | 31,086 | 35,813 | 29,959 |
| 10/31/2019 | 41,428 | 37,302 | 38,162 | 41,938 | 34,286 |
41 graphic description end -->
| ■ | Total returns shown for Class A shares include the maximum sales charge of 5.50% ($10,000 investment minus $550 sales charge = $9,450). |
| ■ | Total returns shown for Class C Shares include the maximum contingent deferred sales charge of 1.00% as applicable. |
The Fund offers multiple share classes whose performance may be greater than or less than its other share class(es) due to differences in sales charges and expenses. See the Average Annual Total Return table below for the returns of additional classes not shown in the line graph above.
Annual Shareholder Report
Average Annual Total Returns for the Period Ended 10/31/2019
(returns reflect all applicable sales charges and contingent deferred sales charges as specified below in footnote #1)
| | 1 Year | 5 Years | 10 Years |
| Class A Shares | 16.01% | 10.47% | 14.33% |
| Class C Shares | 20.85% | 10.87% | 14.07% |
| Class R Shares | 22.32% | 11.31% | 14.52% |
| Institutional Shares | 23.07% | 12.01% | 15.27% |
| Class R6 Shares4 | 23.17% | 12.08% | 15.28% |
| R1000G | 17.10% | 13.43% | 15.41% |
| MLGFA | 14.51% | 11.00% | 13.63% |
Performance data quoted represents past performance which is no guarantee of future results. Investment return and principal value will fluctuate so that an investor's shares, when redeemed, may be worth more or less than their original cost. Mutual fund performance changes over time and current performance may be lower or higher than what is stated. For current to the most recent month-end performance and after-tax returns, visit FederatedInvestors.com or call 1-800-341-7400. Returns shown do not reflect the deduction of taxes that a shareholder would pay on Fund distributions or the redemption of Fund shares. Mutual funds are not obligations of or guaranteed by any bank and are not federally insured.
| 1 | Represents a hypothetical investment of $10,000 in the Fund after deducting applicable sales charges: For Class A Shares, the maximum sales charge of 5.50% ($10,000 investment minus $550 sales charge = $9,450); for Class C Shares, a 1.00% contingent deferred sales charge would be applied to any redemption less than one year from the purchase date. The Fund's performance assumes the reinvestment of all dividends and distributions. The R1000G and the MLGFA have been adjusted to reflect the reinvestment of dividends on securities in the index and average. |
| 2 | The Russell 1000® Growth Index measures the performance of the large-cap growth segment of the U.S. equity universe. It includes those Russell 1000® Index companies with higher price-to-book ratios and higher forecasted growth values. The R1000G is constructed to provide a comprehensive and unbiased barometer for the large-cap growth segment. The R1000G is completely reconstituted annually to ensure new and growing equities are included and that the represented companies continue to reflect growth characteristics. The R1000G is not adjusted to reflect sales charges, expenses or other fees that the Securities and Exchange Commission requires to be reflected in the Fund's performance. The index is unmanaged and unlike the Fund, is not affected by cash flows. It is not possible to invest directly in an index. |
| 3 | Morningstar figures represent the average of the total returns reported by all the funds designated by Morningstar as falling into the respective category indicated. They do not reflect sales charges. The Morningstar figures in the Growth of $10,000 line graph are based on historical return information published by Morningstar and reflect the return of the funds comprising the category in the year of publication. Because the funds designated by Morningstar as falling into the category can change over time, the Morningstar figures in the line graph may not match the Morningstar figures in the Average Annual Total Returns table, which reflect the return of the funds that currently comprise the category. |
| 4 | The Fund's Class R6 Shares commenced operations on December 30, 2013. For the period prior to the commencement of operations of Class R6 Shares, the performance information shown is for the Fund's Institutional Shares adjusted to reflect expenses of the Class R6 Shares for each year for which the expenses of Class R6 Shares would have exceeded the actual expenses paid by Institutional Shares. |
Annual Shareholder Report
Portfolio of Investments Summary Table (unaudited)
At October 31, 2019, the Fund's sector composition1 was as follows:
| Sector Composition | Percentage of
Total Net Assets |
| Information Technology | 31.4% |
| Health Care | 23.2% |
| Consumer Discretionary | 13.3% |
| Industrials | 10.9% |
| Communication Services | 6.4% |
| Financials | 4.3% |
| Real Estate | 3.1% |
| Materials | 2.7% |
| Consumer Staples | 0.9% |
| Securities Lending Collateral2 | 0.7% |
| Cash Equivalents3 | 4.0% |
| Other Assets and Liabilities—Net4 | (0.9)% |
| TOTAL | 100% |
| 1 | Except for Cash Equivalents, Securities Lending Collateral and Other Assets and Liabilities, sector classifications are based upon, and individual portfolio securities are assigned to, the classifications of the Global Industry Classification Standard (GICS) except that the Adviser assigns a classification to securities not classified by the GICS and to securities for which the Adviser does not have access to the classification made by the GICS. |
| 2 | Represents cash collateral received for portfolio securities on loan that may be invested in affiliated money market funds, other money market instruments and/or repurchase agreements. |
| 3 | Cash Equivalents include any investments in money market mutual funds and/or overnight repurchase agreements other than those representing securities lending collateral. |
| 4 | Assets, other than investments in securities, less liabilities. See Statement of Assets and Liabilities. |
Annual Shareholder Report
Portfolio of Investments
October 31, 2019
| Shares | | | Value |
| | | COMMON STOCKS—96.2% | |
| | | Communication Services—6.4% | |
| 46,400 | 1 | Alphabet, Inc., Class A | $58,408,320 |
| 371,800 | 1 | Facebook, Inc. | 71,255,470 |
| 1,134,500 | 1 | T-Mobile USA, Inc. | 93,777,770 |
| | | TOTAL | 223,441,560 |
| | | Consumer Discretionary—13.3% | |
| 228,300 | 1 | Alibaba Group Holding Ltd., ADR | 40,333,761 |
| 56,250 | 1 | Amazon.com, Inc. | 99,937,125 |
| 540,700 | | Hilton Worldwide Holdings, Inc. | 52,426,272 |
| 256,400 | | Home Depot, Inc. | 60,146,312 |
| 850,000 | | Las Vegas Sands Corp. | 52,564,000 |
| 350,000 | 1 | Lululemon Athletica, Inc. | 71,494,500 |
| 20 | 1,2 | New Cotai LLC/Capital | 0 |
| 369,500 | | Nike, Inc., Class B | 33,088,725 |
| 948,400 | | TJX Cos., Inc. | 54,675,260 |
| | | TOTAL | 464,665,955 |
| | | Consumer Staples—0.9% | |
| 170,500 | 3 | Constellation Brands, Inc., Class A | 32,451,265 |
| | | Financials—4.3% | |
| 155,700 | | BlackRock, Inc. | 71,886,690 |
| 630,200 | | JPMorgan Chase & Co. | 78,724,584 |
| | | TOTAL | 150,611,274 |
| | | Health Care—23.2% | |
| 425,000 | | Abbott Laboratories | 35,534,250 |
| 520,000 | 1 | Alcon, Inc. | 30,721,636 |
| 571,804 | 1 | Alnylam Pharmaceuticals, Inc. | 49,598,279 |
| 1,302,877 | 1 | Boston Scientific Corp. | 54,329,971 |
| 134,053 | 1 | Dexcom, Inc. | 20,676,335 |
| 186,500 | 1 | Edwards Lifesciences Corp. | 44,457,870 |
| 1,228,600 | 1 | Elanco Animal Health, Inc. | 33,196,772 |
| 533,780 | 1 | Galapagos NV, ADR | 98,199,506 |
| 343,000 | 1 | Genmab A/S | 74,752,935 |
| 450,000 | 1 | Genmab A/S, ADR | 9,832,500 |
| 250,000 | 1 | IDEXX Laboratories, Inc. | 71,252,500 |
| 50,000 | 1 | Illumina, Inc. | 14,776,000 |
| 31,500 | 1 | Intuitive Surgical, Inc. | 17,417,925 |
Annual Shareholder Report
| Shares | | | Value |
| | | COMMON STOCKS—continued | |
| | | Health Care—continued | |
| 2,100,000 | 1 | Mylan NV | $40,215,000 |
| 171,700 | | Stryker Corp. | 37,133,559 |
| 440,000 | 1 | Veeva Systems, Inc. | 62,405,200 |
| 278,000 | 1 | Vertex Pharmaceuticals, Inc. | 54,343,440 |
| 450,000 | | Zoetis, Inc. | 57,564,000 |
| | | TOTAL | 806,407,678 |
| | | Industrials—10.9% | |
| 1,049,000 | 1 | AerCap Holdings NV | 60,716,120 |
| 64,250 | 1 | CoStar Group, Inc. | 35,306,660 |
| 1,090,000 | 1 | IHS Markit Ltd. | 76,321,800 |
| 670,900 | | Ingersoll-Rand PLC | 85,130,501 |
| 232,000 | | Roper Technologies, Inc. | 78,174,720 |
| 292,400 | | Verisk Analytics, Inc. | 42,310,280 |
| | | TOTAL | 377,960,081 |
| | | Information Technology—31.4% | |
| 155,000 | | Apple, Inc. | 38,557,800 |
| 285,000 | | Broadcom, Inc. | 83,462,250 |
| 816,048 | | Fidelity National Information Services, Inc. | 107,522,484 |
| 660,000 | 1 | GoDaddy, Inc. | 42,919,800 |
| 923,000 | | Marvell Technology Group Ltd. | 22,511,970 |
| 371,500 | | Mastercard, Inc. | 102,834,915 |
| 1,090,500 | | Microsoft Corp. | 156,344,985 |
| 2,072,198 | 1,3 | PagSeguro Digital Ltd. | 76,837,102 |
| 260,000 | 1 | Palo Alto Networks, Inc. | 59,121,400 |
| 625,000 | 1 | Salesforce.com, Inc. | 97,806,250 |
| 396,300 | 1 | ServiceNow, Inc. | 97,989,138 |
| 325,000 | 1 | Splunk, Inc. | 38,987,000 |
| 618,400 | | Visa, Inc., Class A | 110,607,024 |
| 350,000 | 1 | Workday, Inc. | 56,756,000 |
| | | TOTAL | 1,092,258,118 |
| | | Materials—2.7% | |
| 109,636 | | Sherwin-Williams Co. | 62,746,876 |
| 221,000 | 3 | Vulcan Materials Co. | 31,574,270 |
| | | TOTAL | 94,321,146 |
| | | Real Estate—3.1% | |
| 1,150,000 | 1 | CBRE Group, Inc. | 61,582,500 |
Annual Shareholder Report
| Shares | | | Value |
| | | COMMON STOCKS—continued | |
| | | Real Estate—continued | |
| 343,700 | | Crown Castle International Corp. | $47,702,123 |
| | | TOTAL | 109,284,623 |
| | | TOTAL COMMON STOCKS
(IDENTIFIED COST $1,858,209,402) | 3,351,401,700 |
| | | INVESTMENT COMPANIES—4.7% | |
| 17,820,207 | | Federated Government Obligations Fund, Premier Shares, 1.75%4 | 17,820,207 |
| 144,829,826 | | Federated Institutional Prime Value Obligations Fund, Institutional Shares, 1.93%4 | 144,873,275 |
| | | TOTAL INVESTMENT COMPANIES
(IDENTIFIED COST $162,677,960) | 162,693,482 |
| | | TOTAL INVESTMENT IN SECURITIES—100.9%
(IDENTIFIED COST $2,020,887,362)5 | 3,514,095,182 |
| | | OTHER ASSETS AND LIABILITIES - NET—(0.9)%6 | (29,683,463) |
| | | TOTAL NET ASSETS—100% | $3,484,411,719 |
Affiliated holdings are investment companies which are managed by the Adviser or an affiliate of the Adviser. Transactions with affiliated fund holdings during the period ended October 31, 2019, were as follows:
| | Federated
Government
Obligations Fund,
Premier Shares* | Federated
Institutional
Prime Value
Obligations Fund,
Institutional Shares* | Total of
Affiliated
Transactions |
| Balance of Shares Held 10/31/2018 | 42,486,279 | 125,145,435 | 167,631,714 |
| Purchases/Additions | 384,861,712 | 1,057,818,090 | 1,442,679,802 |
| Sales/Reductions | (409,527,784) | (1,038,133,699) | (1,447,661,483) |
| Balance of Shares Held 10/31/2019 | 17,820,207 | 144,829,826 | 162,650,033 |
| Value | $17,820,207 | $144,873,275 | $162,693,482 |
| Change in Unrealized Appreciation/Depreciation | N/A | $15,361 | $15,361 |
| Net Realized Gain/(Loss) | N/A | $10,461 | $10,461 |
| Dividend Income | $800,974 | $3,166,720 | $3,967,694 |
| * | All or a portion of the balance/activity for the fund relates to cash collateral received on securities lending transactions. |
| 1 | Non-income-producing security. |
| 2 | Market quotations and price evaluations are not available. Fair value determined using significant unobservable inputs in accordance with procedures established by and under the general supervision of the Fund's Board of Trustees (the “Trustees”). |
| 3 | All or a portion of these securities are temporarily on loan to unaffiliated broker/dealers. |
| 4 | 7-day net yield. |
| 5 | The cost of investments for federal tax purposes amounts to $2,027,782,475. |
| 6 | Assets, other than investments in securities, less liabilities. See Statement of Assets and Liabilities. |
Annual Shareholder Report
Note: The categories of investments are shown as a percentage of total net assets at October 31, 2019.
Various inputs are used in determining the value of the Fund's investments. These inputs are summarized in the three broad levels listed below:
Level 1—quoted prices in active markets for identical securities.
Level 2—other significant observable inputs (including quoted prices for similar securities, interest rates, prepayment speeds, credit risk, etc.). Also includes securities valued at amortized cost.
Level 3—significant unobservable inputs (including the Fund's own assumptions in determining the fair value of investments).
The inputs or methodology used for valuing securities are not an indication of the risk associated with investing in those securities.
The following is a summary of the inputs used, as of October 31, 2019, in valuing the Fund's assets carried at fair value:
| Valuation Inputs | | | | |
| | Level 1—
Quoted
Prices | Level 2—
Other
Significant
Observable
Inputs | Level—
Significant
Unobservable
Inputs | Total |
| Equity Securities: | | | | |
| Common Stocks | | | | |
| Domestic | $2,735,828,869 | $— | $0 | $2,735,828,869 |
| International | 510,098,260 | 105,474,571 | — | 615,572,831 |
| Investment Companies | 162,693,482 | — | — | 162,693,482 |
| TOTAL SECURITIES | $3,408,620,611 | $105,474,571 | $0 | $3,514,095,182 |
The following acronym is used throughout this portfolio:
| ADR | —American Depositary Receipt |
See Notes which are an integral part of the Financial Statements
Annual Shareholder Report
Financial Highlights–Class A Shares
(For a Share Outstanding Throughout Each Period)
| Year Ended October 31 | 2019 | 2018 | 2017 | 2016 | 2015 |
| Net Asset Value, Beginning of Period | $24.76 | $23.38 | $18.86 | $18.80 | $18.39 |
| Income From Investment Operations: | | | | | |
| Net investment income (loss)1 | (0.07) | (0.05) | (0.06) | (0.03) | (0.02) |
| Net realized and unrealized gain | 5.17 | 1.77 | 4.58 | 0.09 | 1.13 |
| TOTAL FROM INVESTMENT OPERATIONS | 5.10 | 1.72 | 4.52 | 0.06 | 1.11 |
| Less Distributions: | | | | | |
| Distributions from net investment income | — | — | — | — | (0.00)2 |
| Distributions from net realized gain | (2.47) | (0.34) | — | (0.00)2 | (0.70) |
| TOTAL DISTRIBUTIONS | (2.47) | (0.34) | — | (0.00)2 | (0.70) |
| Net Asset Value, End of Period | $27.39 | $24.76 | $23.38 | $18.86 | $18.80 |
| Total Return3 | 22.76% | 7.45% | 23.97% | 0.33% | 6.14% |
| Ratios to Average Net Assets: | | | | | |
| Net expenses | 1.08% | 1.08% | 1.08% | 1.09%4 | 1.09%4 |
| Net investment income (loss) | (0.29)% | (0.20)% | (0.19)% | (0.15)% | (0.12)% |
| Expense waiver/reimbursement5 | 0.10% | 0.11% | 0.11% | 0.12% | 0.11% |
| Supplemental Data: | | | | | |
| Net assets, end of period (000 omitted) | $616,124 | $539,812 | $609,630 | $772,575 | $968,786 |
| Portfolio turnover | 19% | 35% | 44% | 34% | 55% |
| 1 | Per share numbers have been calculated using the average shares method. |
| 2 | Represents less than $0.01. |
| 3 | Based on net asset value, which does not reflect the sales charge, redemption fee or contingent deferred sales charge, if applicable. |
| 4 | The net expense ratio is calculated without reduction for fees paid indirectly for expense offset arrangements. The net expense ratios are 1.09% and 1.09% for the years ended October 31, 2016 and 2015, respectively, after taking into account these expense reductions. |
| 5 | This expense decrease is reflected in both the net expense and the net investment income (loss) ratios shown above. |
See Notes which are an integral part of the Financial Statements
Annual Shareholder Report
Financial Highlights–Class C Shares
(For a Share Outstanding Throughout Each Period)
| Year Ended October 31 | 2019 | 2018 | 2017 | 2016 | 2015 |
| Net Asset Value, Beginning of Period | $22.77 | $21.69 | $17.64 | $17.72 | $17.50 |
| Income From Investment Operations: | | | | | |
| Net investment income (loss)1 | (0.24) | (0.22) | (0.32) | (0.16) | (0.16) |
| Net realized and unrealized gain | 4.70 | 1.64 | 4.37 | 0.08 | 1.08 |
| TOTAL FROM INVESTMENT OPERATIONS | 4.46 | 1.42 | 4.05 | (0.08) | 0.92 |
| Less Distributions: | | | | | |
| Distributions from net investment income | — | — | — | — | (0.00)2 |
| Distributions from net realized gain | (2.47) | (0.34) | — | (0.00)2 | (0.70) |
| TOTAL DISTRIBUTIONS | (2.47) | (0.34) | — | (0.00)2 | (0.70) |
| Net Asset Value, End of Period | $24.76 | $22.77 | $21.69 | $17.64 | $17.72 |
| Total Return3 | 21.85% | 6.64% | 22.96% | (0.44)% | 5.34% |
| Ratios to Average Net Assets: | | | | | |
| Net expenses | 1.85% | 1.85% | 1.86% | 1.86%4 | 1.87%4 |
| Net investment income (loss) | (1.05)% | (0.97)% | (0.96)% | (0.93)% | (0.89)% |
| Expense waiver/reimbursement5 | 0.09% | 0.09% | 0.09% | 0.10% | 0.09% |
| Supplemental Data: | | | | | |
| Net assets, end of period (000 omitted) | $399,208 | $387,474 | $445,081 | $453,018 | $492,637 |
| Portfolio turnover | 19% | 35% | 44% | 34% | 55% |
| 1 | Per share numbers have been calculated using the average shares method. |
| 2 | Represents less than $0.01. |
| 3 | Based on net asset value, which does not reflect the sales charge, redemption fee or contingent deferred sales charge, if applicable. |
| 4 | The net expense ratio is calculated without reduction for fees paid indirectly for expense offset arrangements. The net expense ratios are 1.86% and 1.87% for the years ended October 31, 2016 and 2015, respectively, after taking into account these expense reductions. |
| 5 | This expense decrease is reflected in both the net expense and the net investment income (loss) ratios shown above. |
See Notes which are an integral part of the Financial Statements
Annual Shareholder Report
Financial Highlights–Class R Shares
(For a Share Outstanding Throughout Each Period)
| Year Ended October 31 | 2019 | 2018 | 2017 | 2016 | 2015 |
| Net Asset Value, Beginning of Period | $23.64 | $22.42 | $18.16 | $18.17 | $17.86 |
| Income From Investment Operations: | | | | | |
| Net investment income (loss)1 | (0.16) | (0.14) | (0.18) | (0.10) | (0.09) |
| Net realized and unrealized gain | 4.91 | 1.70 | 4.44 | 0.09 | 1.10 |
| TOTAL FROM INVESTMENT OPERATIONS | 4.75 | 1.56 | 4.26 | (0.01) | 1.01 |
| Less Distributions: | | | | | |
| Distributions from net investment income | — | — | — | — | (0.00)2 |
| Distributions from net realized gain | (2.47) | (0.34) | — | (0.00)2 | (0.70) |
| TOTAL DISTRIBUTIONS | (2.47) | (0.34) | — | (0.00)2 | (0.70) |
| Net Asset Value, End of Period | $25.92 | $23.64 | $22.42 | $18.16 | $18.17 |
| Total Return3 | 22.32% | 7.05% | 23.46% | (0.05)% | 5.74% |
| Ratios to Average Net Assets: | | | | | |
| Net expenses | 1.46% | 1.47% | 1.47% | 1.47%4 | 1.48%4 |
| Net investment income (loss) | (0.65)% | (0.59)% | (0.58)% | (0.54)% | (0.48)% |
| Expense waiver/reimbursement5 | 0.14% | 0.14% | 0.14% | 0.14% | 0.14% |
| Supplemental Data: | | | | | |
| Net assets, end of period (000 omitted) | $74,919 | $70,350 | $79,138 | $76,336 | $80,007 |
| Portfolio turnover | 19% | 35% | 44% | 34% | 55% |
| 1 | Per share numbers have been calculated using the average shares method. |
| 2 | Represents less than $0.01. |
| 3 | Based on net asset value. |
| 4 | The net expense ratio is calculated without reduction for fees paid indirectly for expense offset arrangements. The net expense ratios are 1.47% and 1.48% for the years ended October 31, 2016 and 2015, respectively, after taking into account these expense reductions. |
| 5 | This expense decrease is reflected in both the net expense and the net investment income (loss) ratios shown above. |
See Notes which are an integral part of the Financial Statements
Annual Shareholder Report
Financial Highlights–Institutional Shares
(For a Share Outstanding Throughout Each Period)
| Year Ended October 31 | 2019 | 2018 | 2017 | 2016 | 2015 |
| Net Asset Value, Beginning of Period | $25.37 | $23.89 | $19.22 | $19.11 | $18.64 |
| Income From Investment Operations: | | | | | |
| Net investment income (loss)1 | (0.01) | 0.01 | (0.01) | 0.02 | 0.03 |
| Net realized and unrealized gain | 5.32 | 1.81 | 4.68 | 0.09 | 1.14 |
| TOTAL FROM INVESTMENT OPERATIONS | 5.31 | 1.82 | 4.67 | 0.11 | 1.17 |
| Less Distributions: | | | | | |
| Distributions from net investment income | — | — | — | — | (0.00)2 |
| Distributions from net realized gain | (2.47) | (0.34) | — | (0.00)2 | (0.70) |
| TOTAL DISTRIBUTIONS | (2.47) | (0.34) | — | (0.00)2 | (0.70) |
| Net Asset Value, End of Period | $28.21 | $25.37 | $23.89 | $19.22 | $19.11 |
| Total Return3 | 23.07% | 7.72% | 24.30% | 0.58% | 6.38% |
| Ratios to Average Net Assets: | | | | | |
| Net expenses | 0.83% | 0.83% | 0.84% | 0.84%4 | 0.84%4 |
| Net investment income (loss) | (0.03)% | 0.05% | 0.05% | 0.10% | 0.13% |
| Expense waiver/reimbursement5 | 0.10% | 0.09% | 0.10% | 0.11% | 0.10% |
| Supplemental Data: | | | | | |
| Net assets, end of period (000 omitted) | $2,264,174 | $1,998,725 | $2,024,361 | $1,332,606 | $1,556,775 |
| Portfolio turnover | 19% | 35% | 44% | 34% | 55% |
| 1 | Per share numbers have been calculated using the average shares method. |
| 2 | Represents less than $0.01. |
| 3 | Based on net asset value. |
| 4 | The net expense ratio is calculated without reduction for fees paid indirectly for expense offset arrangements. The net expense ratios are 0.84% and 0.84% for the years ended October 31, 2016 and 2015, respectively, after taking into account these expense reductions. |
| 5 | This expense decrease is reflected in both the net expense and the net investment income (loss) ratios shown above. |
See Notes which are an integral part of the Financial Statements
Annual Shareholder Report
Financial Highlights–Class R6 Shares
(For a Share Outstanding Throughout Each Period)
| Year Ended October 31 | 2019 | 2018 | 2017 | 2016 | 2015 |
| Net Asset Value, Beginning of Period | $25.44 | $23.94 | $19.26 | $19.13 | $18.65 |
| Income From Investment Operations: | | | | | |
| Net investment income (loss)1 | 0.01 | 0.03 | 0.02 | 0.03 | 0.04 |
| Net realized and unrealized gain | 5.34 | 1.81 | 4.66 | 0.10 | 1.14 |
| TOTAL FROM INVESTMENT OPERATIONS | 5.35 | 1.84 | 4.68 | 0.13 | 1.18 |
| Less Distributions: | | | | | |
| Distributions from net investment income | — | — | — | — | (0.00)2 |
| Distributions from net realized gain | (2.47) | (0.34) | — | (0.00)2 | (0.70) |
| TOTAL DISTRIBUTIONS | (2.47) | (0.34) | — | (0.00)2 | (0.70) |
| Net Asset Value, End of Period | $28.32 | $25.44 | $23.94 | $19.26 | $19.13 |
| Total Return3 | 23.17% | 7.79% | 24.30% | 0.69% | 6.43% |
| Ratios to Average Net Assets: | | | | | |
| Net expenses | 0.77% | 0.77% | 0.78% | 0.78%4 | 0.78%4 |
| Net investment income | 0.04% | 0.11% | 0.11% | 0.17% | 0.21% |
| Expense waiver/reimbursement5 | 0.09% | 0.09% | 0.09% | 0.09% | 0.09% |
| Supplemental Data: | | | | | |
| Net assets, end of period (000 omitted) | $129,987 | $154,136 | $102,285 | $81,107 | $189,120 |
| Portfolio turnover | 19% | 35% | 44% | 34% | 55% |
| 1 | Per share numbers have been calculated using the average shares method. |
| 2 | Represents less than $0.01. |
| 3 | Based on net asset value. Total returns for periods of less than one year are not annualized. |
| 4 | The net expense ratio is calculated without reduction for fees paid indirectly for expense offset arrangements. The net expense ratios are 0.78% and 0.78% for the years ended October 31, 2016 and 2015, respectively, after taking into account these expense reductions. |
| 5 | This expense decrease is reflected in both the net expense and the net investment income ratios shown above. |
See Notes which are an integral part of the Financial Statements
Annual Shareholder Report
Statement of Assets and Liabilities
October 31, 2019
| Assets: | | |
| Investment in securities, at value including $24,158,632 of securities loaned and $162,693,482 of investment in affiliated holdings* (identified cost $2,020,887,362) | | $3,514,095,182 |
| Income receivable | | 453,443 |
| Income receivable from affiliated holdings | | 196,686 |
| Receivable for shares sold | | 6,423,211 |
| TOTAL ASSETS | | 3,521,168,522 |
| Liabilities: | | |
| Payable for investments purchased | $6,620,880 | |
| Payable for shares redeemed | 3,311,447 | |
| Payable to bank | 63,018 | |
| Payable for collateral due to broker for securities lending | 25,386,324 | |
| Payable for investment adviser fee (Note 5) | 63,584 | |
| Payable for administrative fees (Note 5) | 7,569 | |
| Payable for distribution services fee (Note 5) | 277,584 | |
| Payable for other service fees (Notes 2 and 5) | 376,201 | |
| Accrued expenses (Note 5) | 650,196 | |
| TOTAL LIABILITIES | | 36,756,803 |
| Net assets for 126,360,898 shares outstanding | | $3,484,411,719 |
| Net Assets Consist of: | | |
| Paid-in capital | | $1,848,557,219 |
| Total distributable earnings (loss) | | 1,635,854,500 |
| TOTAL NET ASSETS | | $3,484,411,719 |
Annual Shareholder Report
Statement of Assets and Liabilities–continued
| Net Asset Value, Offering Price and Redemption Proceeds Per Share | | |
| Class A Shares: | | |
| Net asset value per share ($616,123,958 ÷ 22,496,149 shares outstanding), no par value, unlimited shares authorized | | $27.39 |
| Offering price per share (100/94.50 of $27.39) | | $28.98 |
| Redemption proceeds per share | | $27.39 |
| Class C Shares: | | |
| Net asset value per share ($399,208,253 ÷ 16,125,638 shares outstanding), no par value, unlimited shares authorized | | $24.76 |
| Offering price per share (100/99.00 of $24.76) | | $25.01 |
| Redemption proceeds per share | | $24.76 |
| Class R Shares: | | |
| Net asset value per share ($74,919,056 ÷ 2,890,930 shares outstanding), no par value, unlimited shares authorized | | $25.92 |
| Offering price per share | | $25.92 |
| Redemption proceeds per share | | $25.92 |
| Institutional Shares: | | |
| Net asset value per share ($2,264,173,795 ÷ 80,257,902 shares outstanding), no par value, unlimited shares authorized | | $28.21 |
| Offering price per share | | $28.21 |
| Redemption proceeds per share | | $28.21 |
| Class R6 Shares: | | |
| Net asset value per share ($129,986,657 ÷ 4,590,279 shares outstanding), no par value, unlimited shares authorized | | $28.32 |
| Offering price per share | | $28.32 |
| Redemption proceeds per share | | $28.32 |
| * | See information listed after the Fund's Portfolio of Investments. |
See Notes which are an integral part of the Financial Statements
Annual Shareholder Report
Statement of Operations
Year Ended October 31, 2019
| Investment Income: | | | |
| Dividends (including $1,988,754 received from affiliated holdings*) | | | $25,758,217 |
| Net income on securities loaned (includes $1,978,940 earned from affiliated holdings related to cash collateral balances*)(Note 2) | | | 410,645 |
| Interest | | | 351 |
| TOTAL INCOME | | | 26,169,213 |
| Expenses: | | | |
| Investment adviser fee (Note 5) | | $24,510,933 | |
| Administrative fee (Note 5) | | 2,597,288 | |
| Custodian fees | | 116,708 | |
| Transfer agent fee (Note 2) | | 2,719,567 | |
| Directors'/Trustees' fees (Note 5) | | 23,397 | |
| Auditing fees | | 44,940 | |
| Legal fees | | 10,724 | |
| Portfolio accounting fees | | 212,253 | |
| Distribution services fee (Note 5) | | 3,329,534 | |
| Other service fees (Notes 2 and 5) | | 2,427,105 | |
| Share registration costs | | 117,549 | |
| Printing and postage | | 110,743 | |
| Miscellaneous (Note 5) | | 50,808 | |
| TOTAL EXPENSES | | $36,271,549 | |
Annual Shareholder Report
Statement of Operations–continued
| Waivers and Reimbursements: | | | |
| Waiver/reimbursement of investment adviser fee (Note 5) | $(2,853,680) | | |
| Waiver/reimbursement of other operating expenses (Notes 2 and 5) | (286,706) | | |
| TOTAL WAIVERS AND REIMBURSEMENTS | | (3,140,386) | |
| Net expenses | | | 33,131,163 |
| Net investment income (loss) | | | (6,961,950) |
| Realized and Unrealized Gain (Loss) on Investments and Foreign Currency Transactions: | | | |
| Net realized gain on investments (including net realized gain of $10,461 on sales of investments in affiliated holdings*) | | | 154,840,980 |
| Net realized gain on foreign currency transactions | | | 101,247 |
| Net change in unrealized appreciation of investments (including net change in unrealized appreciation of $15,361 on investments in affiliated holdings*) | | | 515,137,994 |
| Net change in unrealized appreciation/depreciation of translation of assets and liabilities in foreign currency | | | (4,455) |
| Net realized and unrealized gain (loss) on investments and foreign currency transactions | | | 670,075,766 |
| Change in net assets resulting from operations | | | $663,113,816 |
| * | See information listed after the Fund's Portfolio of Investments. |
See Notes which are an integral part of the Financial Statements
Annual Shareholder Report
Statement of Changes in Net Assets
| Year Ended October 31 | 2019 | 2018 |
| Increase (Decrease) in Net Assets | | |
| Operations: | | |
| Net investment income (loss) | $(6,961,950) | $(4,649,636) |
| Net realized gain | 154,942,227 | 310,942,518 |
| Net change in unrealized appreciation/depreciation | 515,133,539 | (58,375,658) |
| CHANGE IN NET ASSETS RESULTING FROM OPERATIONS | 663,113,816 | 247,917,224 |
| Distributions to Shareholders: | | |
| Class A Shares | (53,017,059) | (8,659,599) |
| Class C Shares | (41,261,574) | (6,839,566) |
| Class R Shares | (7,271,704) | (1,181,814) |
| Institutional Shares | (191,200,835) | (27,830,322) |
| Class R6 Shares | (14,814,142) | (2,120,024) |
| CHANGE IN NET ASSETS RESULTING FROM DISTRIBUTIONS TO SHAREHOLDERS | (307,565,314) | (46,631,325) |
| Share Transactions: | | |
| Proceeds from sale of shares | 629,700,655 | 745,833,456 |
| Net asset value of shares issued to shareholders in payment of distributions declared | 277,828,966 | 42,026,424 |
| Cost of shares redeemed | (929,163,111) | (1,099,144,777) |
| CHANGE IN NET ASSETS RESULTING FROM SHARE TRANSACTIONS | (21,633,490) | (311,284,897) |
| Change in net assets | 333,915,012 | (109,998,998) |
| Net Assets: | | |
| Beginning of period | 3,150,496,707 | 3,260,495,705 |
| End of period | $3,484,411,719 | $3,150,496,707 |
See Notes which are an integral part of the Financial Statements
Annual Shareholder Report
Notes to Financial Statements
October 31, 2019
1. ORGANIZATION
Federated Equity Funds (the “Trust”) is registered under the Investment Company Act of 1940, as amended (the “Act”), as an open-end management investment company. The Trust consists of nine portfolios. The financial statements included herein are only those of Federated Kaufmann Large Cap Fund (the “Fund”), a diversified portfolio. The financial statements of the other portfolios are presented separately. The assets of each portfolio are segregated and a shareholder's interest is limited to the portfolio in which shares are held. Each portfolio pays its own expenses. The Fund offers five classes of shares: Class A Shares, Class C Shares, Class R Shares, Institutional Shares and Class R6 Shares. All shares of the Fund have equal rights with respect to voting, except on class-specific matters. The investment objective of the Fund is to provide capital appreciation.
On March 30, 2017, the Fund's T Share Class became effective with the Securities and Exchange Commission (SEC), but is not yet offered for sale.
Effective August 1, 2018, an automatic conversion feature for Class C Shares was implemented. Pursuant to this automatic conversion feature, after Class C Shares have been held for ten years from the date of purchase, they will automatically convert to Class A Shares on the next monthly conversion processing date.
2. SIGNIFICANT ACCOUNTING POLICIES
The following is a summary of significant accounting policies consistently followed by the Fund in the preparation of its financial statements. These policies are in conformity with U.S. generally accepted accounting principles (GAAP).
Investment Valuation
In calculating its net asset value (NAV), the Fund generally values investments as follows:
| ■ | Equity securities listed on an exchange or traded through a regulated market system are valued at their last reported sale price or official closing price in their principal exchange or market. |
| ■ | Fixed-income securities are fair valued using price evaluations provided by a pricing service approved by the Trustees. |
| ■ | Shares of other mutual funds or non-exchange-traded investment companies are valued based upon their reported NAVs. |
| ■ | Derivative contracts listed on exchanges are valued at their reported settlement or closing price, except that options are valued at the mean of closing bid and asked quotations. |
| ■ | Over-the-counter (OTC) derivative contracts are fair valued using price evaluations provided by a pricing service approved by the Trustees. |
| ■ | For securities that are fair valued in accordance with procedures established by and under the general supervision of the Trustees, certain factors may be considered, such as: the last traded or purchase price of the security, information obtained by contacting the issuer or dealers, analysis of the issuer's financial statements or other available documents, fundamental analytical data, the nature and duration of restrictions on disposition, the movement of the market in which the security is normally traded, public trading in similar securities or derivative contracts of the issuer or comparable issuers, movement of a relevant index, or other factors including but not limited to industry changes and relevant government actions. |
Annual Shareholder Report
If any price, quotation, price evaluation or other pricing source is not readily available when the NAV is calculated, if the Fund cannot obtain price evaluations from a pricing service or from more than one dealer for an investment within a reasonable period of time as set forth in the Fund's valuation policies and procedures, or if information furnished by a pricing service, in the opinion of the valuation committee (“Valuation Committee”), is deemed not representative of the fair value of such security, the Fund uses the fair value of the investment determined in accordance with the procedures described below. There can be no assurance that the Fund could obtain the fair value assigned to an investment if it sold the investment at approximately the time at which the Fund determines its NAV per share.
Fair Valuation and Significant Events Procedures
The Trustees have ultimate responsibility for determining the fair value of investments for which market quotations are not readily available. The Trustees have appointed a Valuation Committee comprised of officers of the Fund, Federated Equity Management Company of Pennsylvania (the “Adviser”) and certain of the Adviser's affiliated companies to assist in determining fair value and in overseeing the calculation of the NAV. The Trustees have also authorized the use of pricing services recommended by the Valuation Committee to provide fair value evaluations of the current value of certain investments for purposes of calculating the NAV. The Valuation Committee employs various methods for reviewing third-party pricing-service evaluations including periodic reviews of third-party pricing services' policies, procedures and valuation methods (including key inputs, methods, models and assumptions), transactional back-testing, comparisons of evaluations of different pricing services, and review of price challenges by the Adviser based on recent market activity. In the event that market quotations and price evaluations are not available for an investment, the Valuation Committee determines the fair value of the investment in accordance with procedures adopted by the Trustees. The Trustees periodically review and approve the fair valuations made by the Valuation Committee and any changes made to the procedures.
Factors considered by pricing services in evaluating an investment include the yields or prices of investments of comparable quality, coupon, maturity, call rights and other potential prepayments, terms and type, reported transactions, indications as to values from dealers and general market conditions. Some pricing services provide a single price evaluation reflecting the bid-side of the market for an investment (a “bid” evaluation). Other pricing services offer both bid evaluations and price evaluations indicative of a price between the prices bid and asked for the investment (a “mid” evaluation). The Fund normally uses bid evaluations for any U.S. Treasury and Agency securities, mortgage-backed securities and municipal securities. The Fund normally uses mid evaluations for any other types of fixed-income securities and any OTC derivative contracts. In the event that market quotations and price evaluations are not available for an investment, the fair value of the investment is determined in accordance with procedures adopted by the Trustees.
Annual Shareholder Report
The Trustees also have adopted procedures requiring an investment to be priced at its fair value whenever the Adviser determines that a significant event affecting the value of the investment has occurred between the time as of which the price of the investment would otherwise be determined and the time as of which the NAV is computed. An event is considered significant if there is both an affirmative expectation that the investment's value will change in response to the event and a reasonable basis for quantifying the resulting change in value. Examples of significant events that may occur after the close of the principal market on which a security is traded, or after the time of a price evaluation provided by a pricing service or a dealer, include:
| ■ | With respect to securities traded principally in foreign markets, significant trends in U.S. equity markets or in the trading of foreign securities index futures contracts; |
| ■ | Political or other developments affecting the economy or markets in which an issuer conducts its operations or its securities are traded; |
| ■ | Announcements concerning matters such as acquisitions, recapitalizations, litigation developments, or a natural disaster affecting the issuer's operations or regulatory changes or market developments affecting the issuer's industry. |
The Trustees have adopted procedures whereby the Valuation Committee uses a pricing service to provide factors to update the fair value of equity securities traded principally in foreign markets from the time of the close of their respective foreign stock exchanges to the pricing time of the Fund. For other significant events, the Fund may seek to obtain more current quotations or price evaluations from alternative pricing sources. If a reliable alternative pricing source is not available, the Fund will determine the fair value of the investment in accordance with the fair valuation procedures approved by the Trustees. The Trustees have ultimate responsibility for any fair valuations made in response to a significant event.
Repurchase Agreements
The Fund may invest in repurchase agreements for short-term liquidity purposes. It is the policy of the Fund to require the other party to a repurchase agreement to transfer to the Fund's custodian or sub-custodian eligible securities or cash with a market value (after transaction costs) at least equal to the repurchase price to be paid under the repurchase agreement. The eligible securities are transferred to accounts with the custodian or sub-custodian in which the Fund holds a “securities entitlement” and exercises “control” as those terms are defined in the Uniform Commercial Code. The Fund has established procedures for monitoring the market value of the transferred securities and requiring the transfer of additional eligible securities if necessary to equal at least the repurchase price. These procedures also allow the other party to require securities to be transferred from the account to the extent that their market value exceeds the repurchase price or in exchange for other eligible securities of equivalent market value.
The insolvency of the other party or other failure to repurchase the securities may delay the disposition of the underlying securities or cause the Fund to receive less than the full repurchase price. Under the terms of the repurchase agreement, any amounts received by the Fund in excess of the repurchase price and related transaction costs must be remitted to the other party.
The Fund may enter into repurchase agreements in which eligible securities are transferred into joint trading accounts maintained by the custodian or sub-custodian for investment companies and other clients advised by the Fund's Adviser and its affiliates. The Fund will participate on a pro rata basis with the other investment companies and clients in its share of the securities transferred under such repurchase agreements and in its share of proceeds from any repurchase or other disposition of such securities.
Annual Shareholder Report
Investment Income, Gains and Losses, Expenses and Distributions
Investment transactions are accounted for on a trade-date basis. Realized gains and losses from investment transactions are recorded on an identified-cost basis. Interest income and expenses are accrued daily. Dividend income and distributions to shareholders are recorded on the ex-dividend date. Foreign dividends are recorded on the ex-dividend date or when the Fund is informed of the ex-dividend date. Distributions of net investment income, if any, are declared and paid annually. Non-cash dividends included in dividend income, if any, are recorded at fair value. Amortization/accretion of premium and discount is included in investment income. Investment income, realized and unrealized gains and losses, and certain fund-level expenses are allocated to each class based on relative average daily net assets, except that select classes will bear certain expenses unique to those classes. The detail of the total fund expense waivers and reimbursements of $3,140,386 is disclosed in various locations in this Note 2 and Note 5. For the year ended October 31, 2019, transfer agent fees for the Fund were as follows:
| | Transfer Agent
Fees Incurred | Transfer Agent
Fees Reimbursed |
| Class A Shares | $478,705 | $(65,518) |
| Class C Shares | 359,736 | — |
| Class R Shares | 177,435 | — |
| Institutional Shares | 1,688,440 | (184,521) |
| Class R6 Shares | 15,251 | — |
| TOTAL | $2,719,567 | $(250,039) |
Dividends are declared separately for each class. No class has preferential dividend rights; differences in per share dividend rates are generally due to differences in separate class expenses.
Other Service Fees
The Fund may pay other service fees up to 0.25% of the average daily net assets of the Fund's Class A Shares and Class C Shares to unaffiliated financial intermediaries or to Federated Shareholder Services Company (FSSC) for providing services to shareholders and maintaining shareholder accounts.
Subject to the terms described in the Expense Limitation note, FSSC may voluntarily reimburse the Fund for other service fees. For the year ended October 31, 2019, other service fees for the Fund were as follows:
| | Other Service
Fees Incurred |
| Class A Shares | $1,439,482 |
| Class C Shares | 987,623 |
| TOTAL | $2,427,105 |
Federal Taxes
It is the Fund's policy to comply with the Subchapter M provision of the Internal Revenue Code and to distribute to shareholders each year substantially all of its income. Accordingly, no provision for federal income tax is necessary. As of and during the year ended October 31, 2019, the Fund did not have a liability for any uncertain tax positions. The Fund
Annual Shareholder Report
recognizes interest and penalties, if any, related to tax liabilities as income tax expense in the Statement of Operations. As of October 31, 2019, tax years 2016 through 2019 remain subject to examination by the Fund's major tax jurisdictions, which include the United States of America and the Commonwealth of Massachusetts.
The Fund may be subject to taxes imposed by governments of countries in which it invests. Such taxes are generally based on either income or gains earned or repatriated. The Fund accrues and applies such taxes to net investment income, net realized gains and net unrealized gains as income and/or gains are earned.
When-Issued and Delayed-Delivery Transactions
The Fund may engage in when-issued or delayed-delivery transactions. The Fund records when-issued securities on the trade date and maintains security positions such that sufficient liquid assets will be available to make payment for the securities purchased. Securities purchased on a when-issued or delayed-delivery basis are marked to market daily and begin earning interest on the settlement date. Losses may occur on these transactions due to changes in market conditions or the failure of counterparties to perform under the contract.
Restricted Securities
The Fund may purchase securities which are considered restricted. Restricted securities are securities that either: (a) cannot be offered for public sale without first being registered, or being able to take advantage of an exemption from registration, under the Securities Act of 1933; or (b) are subject to contractual restrictions on public sales. In some cases, when a security cannot be offered for public sale without first being registered, the issuer of the restricted security has agreed to register such securities for resale, at the issuer's expense, either upon demand by the Fund or in connection with another registered offering of the securities. Many such restricted securities may be resold in the secondary market in transactions exempt from registration. Restricted securities may be determined to be liquid under criteria established by the Trustees. The Fund will not incur any registration costs upon such resales. The Fund's restricted securities, like other securities, are priced in accordance with procedures established by and under the general supervision of the Trustees.
Foreign Exchange Contracts
The Fund enters into foreign exchange contracts to manage currency and market risks. Purchased contracts are used to acquire exposure to foreign currencies, whereas, contracts to sell are used to hedge the Fund's securities against currency fluctuations. Risks may arise upon entering into these transactions from the potential inability of counterparties to meet the terms of their commitments and from unanticipated movements in security prices or foreign exchange rates. The foreign exchange contracts are adjusted by the daily exchange rate of the underlying currency and any gains or losses are recorded for financial statement purposes as unrealized until the settlement date.
At October 31, 2019, the Fund had no outstanding foreign exchange contracts.
Foreign Currency Translation
The accounting records of the Fund are maintained in U.S. dollars. All assets and liabilities denominated in foreign currencies are translated into U.S. dollars based on the rates of exchange of such currencies against U.S. dollars on the date of valuation. Purchases and sales of securities, income and expenses are translated at the rate of exchange quoted on the
Annual Shareholder Report
respective date that such transactions are recorded. The Fund does not isolate that portion of the results of operations resulting from changes in foreign exchange rates on investments from the fluctuations arising from changes in market prices of securities held. Such fluctuations are included with the net realized and unrealized gain or loss from investments.
Reported net realized foreign exchange gains or losses arise from sales of foreign currencies, currency gains or losses realized between the trade and settlement dates on securities transactions, the difference between the amounts of dividends, interest and foreign withholding taxes recorded on the Fund's books, and the U.S. dollar equivalent of the amounts actually received or paid. Net unrealized foreign exchange gains and losses arise from changes in the value of assets and liabilities other than investments in securities at fiscal year end, resulting from changes in the exchange rate.
Securities Lending
The Fund participates in a securities lending program providing for the lending of equity securities to qualified brokers. The term of the loans within the program is one year or less. The Fund normally receives cash collateral for securities loaned that is invested in an affiliated money market fund or in affiliated money market funds, other money market instruments and/or repurchase agreements. Investments in money market funds may include funds with a “floating” NAV that can impose redemption fees and liquidity gates, impose certain operational impediments to investing cash collateral, and, if the investee fund's NAV decreases, result in the Fund recognizing losses and being required to cover the decrease in the value of the cash collateral. Collateral is maintained at a minimum level of 100% of the market value of investments loaned, plus interest, if applicable. In accordance with the Fund's securities lending agreement, the market value of securities on loan is determined each day at the close of business and any additional collateral required to cover the value of securities on loan is delivered to the Fund on the next business day. Earnings on collateral are allocated between the borrower of the security, the securities lending agent, as a fee for its services under the program and the Fund, according to agreed-upon rates. The Fund will not have the right to vote on securities while they are on loan. However, the Fund will attempt to terminate a loan in an effort to reacquire the securities in time to vote on matters that are deemed to be material by the Adviser. There can be no assurance that the Fund will have sufficient notice of such matters to be able to terminate the loan in time to vote thereon.
Securities lending transactions are subject to Master Netting Agreements which are agreements between the Fund and its counterparties that provide for the net settlement of all transactions and collateral with the Fund, through a single payment, in the event of default or termination. Amounts presented on the Portfolio of Investments and Statement of Assets and Liabilities are not net settlement amount but gross. As indicated below, the cash collateral received by the Fund exceeds the market value of the securities loaned reducing the net settlement amount to zero. The chart below identifies the amount of collateral received as well as the market value of securities on loan. Additionally, the securities lending agreement executed by the Fund includes an indemnification clause. This clause stipulates that the borrower will reimburse the Fund for any losses as a result of any failure of the borrower to return equivalent securities to the Fund.
Annual Shareholder Report
As of October 31, 2019, securities subject to this type of arrangement and related collateral were as follows:
Market Value of
Securities Loaned | Collateral
Received |
| $24,158,632 | $25,386,324 |
Other
The preparation of financial statements in conformity with GAAP requires management to make estimates and assumptions that affect the amounts of assets, liabilities, expenses and revenues reported in the financial statements. Actual results could differ from those estimated. The Fund applies investment company accounting and reporting guidance.
3. SHARES OF BENEFICIAL INTEREST
The following tables summarize share activity:
| Year Ended October 31 | 2019 | 2018 |
| Class A Shares: | Shares | Amount | Shares | Amount |
| Shares sold | 4,132,603 | $103,020,731 | 4,119,521 | $104,108,606 |
| Shares issued to shareholders in payment of distributions declared | 2,177,381 | 48,925,742 | 346,427 | 7,988,596 |
| Shares redeemed | (5,617,209) | (139,037,360) | (8,740,192) | (219,655,151) |
NET CHANGE RESULTING FROM
CLASS A SHARE TRANSACTIONS | 692,775 | $12,909,113 | (4,274,244) | $(107,557,949) |
| Year Ended October 31 | 2019 | 2018 |
| Class C Shares: | Shares | Amount | Shares | Amount |
| Shares sold | 2,024,408 | $44,766,428 | 1,852,212 | $43,127,241 |
| Shares issued to shareholders in payment of distributions declared | 1,759,819 | 35,988,301 | 278,078 | 5,939,751 |
| Shares redeemed | (4,674,089) | (105,925,942) | (5,632,280) | (130,821,400) |
NET CHANGE RESULTING FROM
CLASS C SHARE TRANSACTIONS | (889,862) | $(25,171,213) | (3,501,990) | $(81,754,408) |
| Year Ended October 31 | 2019 | 2018 |
| Class R Shares: | Shares | Amount | Shares | Amount |
| Shares sold | 468,950 | $11,175,319 | 523,691 | $12,567,774 |
| Shares issued to shareholders in payment of distributions declared | 326,323 | 6,960,477 | 50,689 | 1,120,225 |
| Shares redeemed | (880,472) | (20,852,794) | (1,127,940) | (27,090,816) |
NET CHANGE RESULTING FROM
CLASS R SHARE TRANSACTIONS | (85,199) | $(2,716,998) | (553,560) | $(13,402,817) |
Annual Shareholder Report
| Year Ended October 31 | 2019 | 2018 |
| Institutional Shares: | Shares | Amount | Shares | Amount |
| Shares sold | 17,222,515 | $442,381,095 | 18,356,723 | $471,530,037 |
| Shares issued to shareholders in payment of distributions declared | 7,550,974 | 174,351,991 | 1,076,554 | 25,385,132 |
| Shares redeemed | (23,295,577) | (588,235,005) | (25,394,702) | (649,434,393) |
NET CHANGE RESULTING FROM
INSTITUTIONAL SHARE TRANSACTIONS | 1,477,912 | $28,498,081 | (5,961,425) | $(152,519,224) |
| Year Ended October 31 | 2019 | 2018 |
| Class R6 Shares: | Shares | Amount | Shares | Amount |
| Shares sold | 1,093,532 | $28,357,082 | 4,531,063 | $114,499,798 |
| Shares issued to shareholders in payment of distributions declared | 500,970 | 11,602,455 | 67,402 | 1,592,720 |
| Shares redeemed | (3,062,222) | (75,112,010) | (2,812,907) | (72,143,017) |
NET CHANGE RESULTING FROM
CLASS R6 SHARE TRANSACTIONS | (1,467,720) | $(35,152,473) | 1,785,558 | $43,949,501 |
NET CHANGE RESULTING FROM
TOTAL FUND SHARE TRANSACTIONS | (272,094) | $(21,633,490) | (12,505,661) | $(311,284,897) |
4. FEDERAL TAX INFORMATION
The accounting treatment of certain items in accordance with income tax regulations may differ from the accounting treatment in accordance with GAAP which may result in permanent differences. In the case of the Fund, such differences primarily result from net operating losses.
For the year ended October 31, 2019, permanent differences identified and reclassified among the components of net assets were as follows:
| Increase (Decrease) |
| Paid-In Capital | Total Distributable
Earnings (Loss) |
| $(4,304,226) | $4,304,226 |
The tax character of distributions as reported on the Statement of Changes in Net Assets for the years ended October 31, 2019 and 2018, was as follows:
| | 2019 | 2018 |
| Long-term capital gains | $307,565,314 | $46,631,325 |
As of October 31, 2019, the components of distributable earnings on a tax-basis were as follows:
| Net unrealized appreciation | $1,486,300,588 |
| Undistributed long-term capital gains | $157,156,355 |
| Ordinary loss deferral | $(7,602,443) |
Annual Shareholder Report
The difference between book-basis and tax-basis net unrealized appreciation/depreciation is attributable to differing treatments for deferral of losses on wash sales.
At October 31, 2019, the cost of investments for federal tax purposes was $2,027,782,475. The net unrealized appreciation of investments for federal tax purposes was $1,486,312,707. This consists of net unrealized appreciation from investments for those securities having an excess of value over cost of $1,506,566,127 and net unrealized depreciation from investments for those securities having an excess of cost over value of $20,253,420.
Under current tax rules, a late-year ordinary loss may be deferred, in whole or in part, and treated as occurring on the first day of the following fiscal year. As of October 31, 2019, for federal income tax purposes, a late year ordinary loss of $7,602,443 was deferred to November 1, 2019.
5. INVESTMENT ADVISER FEE AND OTHER TRANSACTIONS WITH AFFILIATES
Investment Adviser Fee
The advisory agreement between the Fund and the Adviser provides for an annual fee equal to 0.75% of the Fund's average daily net assets. Subject to the terms described in the Expense Limitation note, the Adviser may voluntarily choose to waive any portion of its fee. For the year ended October 31, 2019, the Adviser voluntarily waived $2,742,042 of its fee and voluntarily reimbursed $250,039 of transfer agent fees.
The Adviser has agreed to reimburse the Fund for certain investment adviser fees as a result of transactions in other affiliated investment companies. For the year ended October 31, 2019, the Adviser reimbursed $111,638.
Certain of the Fund's assets are managed by Federated Global Investment Management Corp. (the “Sub-Adviser”). Under the terms of a sub-advisory agreement between the Adviser and the Sub-Adviser, the Sub-Adviser receives an allocable portion of the Fund's adviser fee. The fee is paid by the Adviser out of its resources and is not an incremental Fund expense. For the year ended October 31, 2019, the Sub-Adviser earned a fee of $20,339,342.
Administrative Fee
Federated Administrative Services (FAS), under the Administrative Services Agreement, provides the Fund with administrative personnel and services. For purposes of determining the appropriate rate breakpoint, “Investment Complex” is defined as all of the Federated Funds subject to a fee under the Administrative Services Agreement. The fee paid to FAS is based on the average daily net assets of the Investment Complex as specified below:
| Administrative Fee | Average Daily Net Assets
of the Investment Complex |
| 0.100% | on assets up to $50 billion |
| 0.075% | on assets over $50 billion |
Subject to the terms described in the Expense Limitation note, FAS may voluntarily choose to waive any portion of its fee. For the year ended October 31, 2019, the annualized fee paid to FAS was 0.080% of average daily net assets of the Fund.
In addition, FAS may charge certain out-of-pocket expenses to the Fund.
Annual Shareholder Report
Distribution Services Fee
The Fund has adopted a Distribution Plan (the “Plan”) pursuant to Rule 12b-1 under the Act. Under the terms of the Plan, the Fund will compensate Federated Securities Corp. (FSC), the principal distributor, from the daily net assets of the Fund's Class A Shares, Class C Shares and Class R Shares to finance activities intended to result in the sale of these shares. The Plan provides that the Fund may incur distribution expenses at the following percentages of average daily net assets annually, to compensate FSC:
| | Percentage of Average Daily
Net Assets of Class |
| Class A Shares | 0.25% |
| Class C Shares | 0.75% |
| Class R Shares | 0.50% |
Subject to the terms described in the Expense Limitation note, FSC may voluntarily choose to waive any portion of its fee. For the year ended October 31, 2019, distribution services fees for the Fund were as follows:
| | Distribution Services
Fees Incurred | Distribution Services
Fees Waived |
| Class C Shares | $2,962,870 | $— |
| Class R Shares | 366,664 | (36,667) |
| TOTAL | $3,329,534 | $(36,667) |
When FSC receives fees, it may pay some or all of them to financial intermediaries whose customers purchase shares. For the year ended October 31, 2019, FSC retained $182,137 fees paid by the Fund. For the year ended October 31, 2019, the Fund's Class A Shares did not incur a distribution services fee; however, it may begin to incur this fee upon approval of the Trustees.
Sales Charges
Front-end sales charges and contingent deferred sales charges (CDSC) do not represent expenses of the Fund. They are deducted from the proceeds of sales of Fund shares prior to investment or from redemption proceeds prior to remittance, as applicable. For the year ended October 31, 2019, FSC retained $102,586 in sales charges from the sale of Class A Shares. FSC also retained $2,071 of CDSC relating to redemptions of Class A Shares and $19,198 relating to redemptions of Class C Shares.
Other Service Fees
For the year ended October 31, 2019, FSSC received $32,925 of the other service fees disclosed in Note 2.
Expense Limitation
The Adviser and certain of its affiliates (which may include FSC, FAS and FSSC) on their own initiative have agreed to waive certain amounts of their respective fees and/or reimburse expenses. Total annual fund operating expenses (as shown in the financial highlights, excluding interest expense, extraordinary expenses and proxy-related expenses paid by the Fund, if any) paid by the Fund's Class A Shares, Class C Shares, Class R Shares, Institutional Shares and Class R6 Shares (after the voluntary waivers and/or reimbursements) will not exceed 1.08%, 1.86%, 1.47%, 0.83% and 0.77% (the “Fee Limit”), respectively, up to but not
Annual Shareholder Report
including the later of (the “Termination Date”): (a) January 1, 2021; or (b) the date of the Fund's next effective Prospectus. While the Adviser and its applicable affiliates currently do not anticipate terminating or increasing these arrangements prior to the Termination Date, these arrangements may only be terminated or the Fee Limit increased prior to the Termination Date with the agreement of the Trustees.
Interfund Transactions
During the year ended October 31, 2019, the Fund engaged in purchase and sale transactions with funds that have a common investment adviser (or affiliated investment advisers), common Directors/Trustees and/or common Officers. These purchase and sale transactions complied with Rule 17a-7 under the Act and amounted to $5,613,034 and $3,239,357, respectively.
Directors'/Trustees' and Miscellaneous Fees
Certain Officers and Trustees of the Fund are Officers and Directors or Trustees of certain of the above companies. To efficiently facilitate payment, Independent Directors'/Trustees' fees and certain expenses related to conducting meetings of the Directors/Trustees and other miscellaneous expenses are paid by an affiliate of the Adviser which in due course are reimbursed by the Fund. These expenses related to conducting meetings of the Directors/Trustees and other miscellaneous expenses may be included in Accrued and Miscellaneous Expenses on the Statement of Assets and Liabilities and Statement of Operations, respectively.
6. INVESTMENT TRANSACTIONS
Purchases and sales of investments, excluding long-term U.S. government securities and short-term obligations, for the year ended October 31, 2019, were as follows:
| Purchases | $597,970,472 |
| Sales | $1,004,201,655 |
7. CONCENTRATION OF RISK
The Fund may invest a portion of its assets in securities of companies that are deemed by the Fund's management to be classified in similar business sectors. Economic developments may have an effect on the liquidity and volatility of the portfolio securities.
8. LINE OF CREDIT
The Fund participates with certain other Federated Funds, on a several basis, in an up to $500,000,000 unsecured, 364-day, committed, revolving line of credit (LOC) agreement. The LOC was made available to finance temporarily the repurchase or redemption of shares of the Fund, failed trades, payment of dividends, settlement of trades and for other short-term, temporary or emergency general business purposes. The Fund cannot borrow under the LOC if an inter-fund loan is outstanding. The Fund's ability to borrow under the LOC also is subject to the limitations of the Act and various conditions precedent that must be satisfied before the Fund can borrow. Loans under the LOC are charged interest at a fluctuating rate per annum equal to the highest, on any day, of (a) (i) the federal funds effective rate, (ii) the one month London Interbank Offered Rate (LIBOR), and (iii) 0.0%, plus (b) a margin. The LOC also requires the Fund to pay, quarterly in arrears and at maturity, its pro rata share of a commitment fee based on the amount of the lenders' commitment that has not been utilized. As of October 31, 2019, the Fund had no outstanding loans. During the year ended October 31, 2019, the Fund did not utilize the LOC.
Annual Shareholder Report
9. INTERFUND LENDING
Pursuant to an Exemptive Order issued by the SEC, the Fund, along with other funds advised by subsidiaries of Federated Investors, Inc., may participate in an interfund lending program. This program provides an alternative credit facility allowing the Fund to borrow from other participating affiliated funds.
As of October 31, 2019, there were no outstanding loans. During the year ended October 31, 2019, the program was not utilized.
10. FEDERAL TAX INFORMATION (UNAUDITED)
For the year ended October 31, 2019, the amount of long-term capital gains designated by the Fund was $307,565,314.
Annual Shareholder Report
Report of Independent Registered Public Accounting Firm
TO THE BOARD OF TRUSTEES OF FEDERATED EQUITY FUNDS AND SHAREHOLDERS OF FEDERATED KAUFMANN LARGE CAP FUND:
Opinion on the Financial Statements
We have audited the accompanying statement of assets and liabilities of Federated Kaufmann Large Cap Fund (the “Fund”) (one of the portfolios constituting Federated Equity Funds (the “Trust”)), including the portfolio of investments, as of October 31, 2019, and the related statement of operations for the year then ended, the statement of changes in net assets for each of the two years in the period then ended, the financial highlights for each of the five years in the period then ended and the related notes (collectively referred to as the “financial statements”). In our opinion, the financial statements present fairly, in all material respects, the financial position of the Fund (one of the portfolios constituting Federated Equity Funds) at October 31, 2019, the results of its operations for the year then ended, the changes in its net assets for each of the two years in the period then ended and its financial highlights for each of the five years in the period then ended, in conformity with U.S. generally accepted accounting principles.
Basis for Opinion
These financial statements are the responsibility of the Trust's management. Our responsibility is to express an opinion on the Fund's financial statements based on our audits. We are a public accounting firm registered with the Public Company Accounting Oversight Board (United States) (“PCAOB”) and are required to be independent with respect to the Trust in accordance with the U.S. federal securities laws and the applicable rules and regulations of the Securities and Exchange Commission and the PCAOB.
We conducted our audits in accordance with standards of the PCAOB. Those standards require that we plan and perform the audit to obtain reasonable assurance about whether the financial statements are free of material misstatement, whether due to error or fraud. The Trust is not required to have, nor were we engaged to perform, an audit of the Trust's internal control over financial reporting. As part of our audits, we are required to obtain an understanding of internal control over financial reporting, but not for the purpose of expressing an opinion on the effectiveness of the Trust's internal control over financial reporting. Accordingly, we express no such opinion.
Annual Shareholder Report
Our audits included performing procedures to assess the risks of material misstatement of the financial statements, whether due to error or fraud, and performing procedures that respond to those risks. Such procedures included examining, on a test basis, evidence regarding the amounts and disclosures in the financial statements. Our procedures included confirmation of securities owned as of October 31, 2019, by correspondence with the custodian and others or by other appropriate auditing procedures where replies from others were not received. Our audits also included evaluating the accounting principles used and significant estimates made by management, as well as evaluating the overall presentation of the financial statements. We believe that our audits provide a reasonable basis for our opinion.
We have served as the auditor of one or more Federated investment companies since 1979.
Boston, Massachusetts
December 20, 2019
Annual Shareholder Report
Shareholder Expense Example (unaudited)
As a shareholder of the Fund, you incur two types of costs: (1) transaction costs, including sales charges (loads) on purchase or redemption payments; and (2) ongoing costs, including management fees and to the extent applicable, distribution (12b-1) fees and/or other service fees and other Fund expenses. This Example is intended to help you to understand your ongoing costs (in dollars) of investing in the Fund and to compare these costs with the ongoing costs of investing in other mutual funds. It is based on an investment of $1,000 invested at the beginning of the period and held for the entire period from May 1, 2019 to October 31, 2019.
ACTUAL EXPENSES
The first section of the table below provides information about actual account values and actual expenses. You may use the information in this section, together with the amount you invested, to estimate the expenses that you incurred over the period. Simply divide your account value by $1,000 (for example, an $8,600 account value divided by $1,000 = 8.6), then multiply the result by the number in the first section under the heading entitled “Expenses Paid During Period” to estimate the expenses attributable to your investment during this period.
HYPOTHETICAL EXAMPLE FOR COMPARISON PURPOSES
The second section of the table below provides information about hypothetical account values and hypothetical expenses based on the Fund's actual expense ratio and an assumed rate of return of 5% per year before expenses, which is not the Fund's actual return. Thus, you should not use the hypothetical account values and expenses to estimate the actual ending account balance or your expenses for the period. Rather, these figures are required to be provided to enable you to compare the ongoing costs of investing in the Fund with other funds. To do so, compare this 5% hypothetical example with the 5% hypothetical examples that appear in the shareholder reports of the other funds.
Annual Shareholder Report
Please note that the expenses shown in the table are meant to highlight your ongoing costs only and do not reflect any transaction costs, such as sales charges (loads) on purchase or redemption payments. Therefore, the second section of the table is useful in comparing ongoing costs only, and will not help you determine the relative total costs of owning different funds. In addition, if these transaction costs were included, your costs would have been higher.
| | Beginning
Account Value
5/1/2019 | Ending
Account Value
10/31/2019 | Expenses Paid
During Period1 |
| Actual: | | | |
| Class A Shares | $1,000 | $1,046.20 | $5.57 |
| Class C Shares | $1,000 | $1,042.10 | $9.52 |
| Class R Shares | $1,000 | $1,044.30 | $7.47 |
| Institutional Shares | $1,000 | $1,047.50 | $4.28 |
| Class R6 Shares | $1,000 | $1,047.70 | $3.97 |
Hypothetical (assuming a 5% return
before expenses): | | | |
| Class A Shares | $1,000 | $1,019.80 | $5.50 |
| Class C Shares | $1,000 | $1,015.90 | $9.40 |
| Class R Shares | $1,000 | $1,017.90 | $7.38 |
| Institutional Shares | $1,000 | $1,021.00 | $4.23 |
| Class R6 Shares | $1,000 | $1,021.30 | $3.92 |
| 1 | Expenses are equal to the Fund's annualized net expense ratios, multiplied by the average account value over the period, multiplied by 184/365 (to reflect the one-half-year period). The annualized net expense ratios are as follows: |
| | |
| Class A Shares | 1.08% |
| Class C Shares | 1.85% |
| Class R Shares | 1.45% |
| Institutional Shares | 0.83% |
| Class R6 Shares | 0.77% |
Annual Shareholder Report
Board of Trustees and Trust Officers
The Board of Trustees is responsible for managing the Trust's business affairs and for exercising all the Trust's powers except those reserved for the shareholders. The following tables give information about each Trustee and the senior officers of the Fund. Where required, the tables separately list Trustees who are “interested persons” of the Fund (i.e., “Interested” Trustees) and those who are not (i.e., “Independent” Trustees). Unless otherwise noted, the address of each person listed is Federated Investors Tower, 1001 Liberty Avenue, Pittsburgh, PA 15222. The address of all Independent Trustees listed is 4000 Ericsson Drive, Warrendale, PA 15086-7561; Attention: Mutual Fund Board. As of December 31, 2018, the Trust comprised 10 portfolio(s), and the Federated Fund Family consisted of 40 investment companies (comprising 102 portfolios). Unless otherwise noted, each Officer is elected annually. Unless otherwise noted, each Trustee oversees all portfolios in the Federated Fund Family and serves for an indefinite term. The Fund's Statement of Additional Information includes additional information about Trust Trustees and is available, without charge and upon request, by calling 1-800-341-7400.
Interested Trustees Background
Name
Birth Date
Positions Held with Trust
Date Service Began | Principal Occupation(s) for Past Five Years,
Other Directorships Held and Previous Position(s) |
J. Christopher Donahue*
Birth Date: April 11, 1949
President and Trustee
Indefinite Term
Began serving: January 2000 | Principal Occupations: Principal Executive Officer and President of certain of the Funds in the Federated Fund Family; Director or Trustee of the Funds in the Federated Fund Family; President, Chief Executive Officer and Director, Federated Investors, Inc.; Chairman and Trustee, Federated Investment Management Company; Trustee, Federated Investment Counseling; Chairman and Director, Federated Global Investment Management Corp.; Chairman and Trustee, Federated Equity Management Company of Pennsylvania; Trustee, Federated Shareholder Services Company; Director, Federated Services Company.
Previous Positions: President, Federated Investment Counseling; President and Chief Executive Officer, Federated Investment Management Company, Federated Global Investment Management Corp. and Passport Research, Ltd; Chairman, Passport Research, Ltd. |
Annual Shareholder Report
Name
Birth Date
Positions Held with Trust
Date Service Began | Principal Occupation(s) for Past Five Years,
Other Directorships Held and Previous Position(s) |
John B. Fisher*
Birth Date: May 16, 1956
Trustee
Indefinite Term
Began serving: May 2016 | Principal Occupations:Principal Executive Officer and President of certain of the Funds in the Federated Fund Family; Director or Trustee of certain of the Funds in the Federated Fund Family; Vice President, Federated Investors, Inc.; President, Director/Trustee and CEO, Federated Advisory Services Company, Federated Equity Management Company of Pennsylvania, Federated Global Investment Management Corp., Federated Investment Counseling, Federated Investment Management Company; President of some of the Funds in the Federated Fund Complex and Director, Federated Investors Trust Company.
Previous Positions: President and Director of the Institutional Sales Division of Federated Securities Corp.; President and Director of Federated Investment Counseling; President and CEO of Passport Research, Ltd.; Director, Edgewood Securities Corp.; Director, Federated Services Company; Director, Federated Investors, Inc.; Chairman and Director, Southpointe Distribution Services, Inc. and President, Technology, Federated Services Company. |
| * | Reasons for “interested” status: J. Christopher Donahue and John B. Fisher are interested due to their beneficial ownership of shares of Federated Investors, Inc. and due to positions they hold with Federated and its subsidiaries. |
INDEPENDENT Trustees Background
Name
Birth Date
Positions Held with Trust
Date Service Began | Principal Occupation(s) for Past Five Years,
Other Directorships Held, Previous Position(s) and Qualifications |
John T. Collins
Birth Date: January 24, 1947
Trustee
Indefinite Term
Began serving: October 2013 | Principal Occupations: Director or Trustee of the Federated Fund Family; formerly, Chairman and CEO, The Collins Group, Inc. (a private equity firm) (Retired).
Other Directorships Held: Director, Chairman of the Compensation Committee, KLX Energy Services Holdings, Inc. (oilfield services); former Director of KLX Corp. (aerospace).
Qualifications: Mr. Collins has served in several business and financial management roles and directorship positions throughout his career. Mr. Collins previously served as Chairman and CEO of The Collins Group, Inc. (a private equity firm) and as a Director of KLX Corp. Mr. Collins serves as Chairman Emeriti, Bentley University. Mr. Collins previously served as Director and Audit Committee Member, Bank of America Corp.; Director, FleetBoston Financial Corp.; and Director, Beth Israel Deaconess Medical Center (Harvard University Affiliate Hospital). |
Annual Shareholder Report
Name
Birth Date
Positions Held with Trust
Date Service Began | Principal Occupation(s) for Past Five Years,
Other Directorships Held, Previous Position(s) and Qualifications |
G. Thomas Hough
Birth Date: February 28, 1955
Trustee
Indefinite Term
Began serving: August 2015 | Principal Occupations: Director or Trustee of the Federated Fund Family; formerly, Vice Chair, Ernst & Young LLP (public accounting firm) (Retired).
Other Directorships Held: Director, Member of Governance and Compensation Committees, Publix Super Markets, Inc.; Director, Chair of the Audit Committee, Equifax, Inc.; Director, Member of the Audit Committee, Haverty Furniture Companies, Inc.
Qualifications: Mr. Hough has served in accounting, business management and directorship positions throughout his career. Mr. Hough most recently held the position of Americas Vice Chair of Assurance with Ernst & Young LLP (public accounting firm). Mr. Hough serves on the President's Cabinet and Business School Board of Visitors for the University of Alabama and is on the Business School Board of Visitors for Wake Forest University. Mr. Hough previously served as an Executive Committee member of the United States Golf Association. |
Maureen Lally-Green
Birth Date: July 5, 1949
Trustee
Indefinite Term
Began serving: August 2009 | Principal Occupations: Director or Trustee of the Federated Fund Family; Adjunct Professor of Law, Duquesne University School of Law; formerly, Dean of the Duquesne University School of Law and Professor of Law and Interim Dean of the Duquesne University School of Law; formerly, Associate General Secretary and Director, Office of Church Relations, Diocese of Pittsburgh.
Other Directorships Held: Director, CNX Resources Corporation (formerly known as CONSOL Energy Inc.).
Qualifications: Judge Lally-Green has served in various legal and business roles and directorship positions throughout her career. Judge Lally-Green previously held the position of Dean of the School of Law of Duquesne University (as well as Interim Dean). Judge Lally-Green previously served as a member of the Superior Court of Pennsylvania and as a Professor of Law, Duquesne University School of Law. Judge Lally-Green also currently holds the positions on not for profit or for profit boards of directors as follows: Director and Chair, UPMC Mercy Hospital; Director and Vice Chair, Our Campaign for the Church Alive!, Inc.; Regent, Saint Vincent Seminary; Member, Pennsylvania State Board of Education (public); and Director CNX Resources Corporation (formerly known as CONSOL Energy Inc.). Judge Lally-Green has held the positions of: Director, Auberle; Director, Epilepsy Foundation of Western and Central Pennsylvania; Director, Ireland Institute of Pittsburgh; Director, Saint Thomas More Society; Director and Chair, Catholic High Schools of the Diocese of Pittsburgh, Inc.; Director, Pennsylvania Bar Institute; Director, St. Vincent College; and Director and Chair, North Catholic High School, Inc. |
Charles F. Mansfield, Jr.
Birth Date: April 10, 1945
Trustee
Indefinite Term
Began serving: January 1999 | Principal Occupations: Director or Trustee of the Federated Fund Family; Management Consultant and Author.
Other Directorships Held: None.
Qualifications: Mr. Mansfield has served as a Marine Corps officer and in several banking, business management, educational roles and directorship positions throughout his long career. He remains active as a Management Consultant and Author. |
Annual Shareholder Report
Name
Birth Date
Positions Held with Trust
Date Service Began | Principal Occupation(s) for Past Five Years,
Other Directorships Held, Previous Position(s) and Qualifications |
Thomas M. O'Neill
Birth Date: June 14, 1951
Trustee
Indefinite Term
Began serving: October 2006 | Principal Occupations: Director or Trustee, Chair of the Audit Committee of the Federated Fund Family; Sole Proprietor, Navigator Management Company (investment and strategic consulting).
Other Directorships Held: None.
Qualifications: Mr. O'Neill has served in several business, mutual fund and financial management roles and directorship positions throughout his career. Mr. O'Neill serves as Director, Medicines for Humanity and Director, The Golisano Children's Museum of Naples, Florida. Mr. O'Neill previously served as Chief Executive Officer and President, Managing Director and Chief Investment Officer, Fleet Investment Advisors; President and Chief Executive Officer, Aeltus Investment Management, Inc.; General Partner, Hellman, Jordan Management Co., Boston, MA; Chief Investment Officer, The Putnam Companies, Boston, MA; Credit Analyst and Lending Officer, Fleet Bank; Director and Consultant, EZE Castle Software (investment order management software); and Director, Midway Pacific (lumber). |
P. Jerome Richey
Birth Date: February 23, 1949
Trustee
Indefinite Term
Began serving: October 2013 | Principal Occupations: Director or Trustee of the Federated Fund Family; Management Consultant; Retired; formerly, Senior Vice Chancellor and Chief Legal Officer, University of Pittsburgh and Executive Vice President and Chief Legal Officer, CNX Resources Corporation (formerly known as CONSOL Energy Inc.).
Other Directorships Held: None.
Qualifications: Mr. Richey has served in several business and legal management roles and directorship positions throughout his career. Mr. Richey most recently held the positions of Senior Vice Chancellor and Chief Legal Officer, University of Pittsburgh. Mr. Richey previously served as Chairman of the Board, Epilepsy Foundation of Western Pennsylvania and Chairman of the Board, World Affairs Council of Pittsburgh. Mr. Richey previously served as Chief Legal Officer and Executive Vice President, CNX Resources Corporation (formerly known as CONSOL Energy Inc.); and Board Member, Ethics Counsel and Shareholder, Buchanan Ingersoll & Rooney PC (a law firm). |
John S. Walsh
Birth Date: November 28, 1957
Trustee
Indefinite Term
Began serving: January 1999 | Principal Occupations: Director or Trustee, and Chair of the Board of Directors or Trustees, of the Federated Fund Family; President and Director, Heat Wagon, Inc. (manufacturer of construction temporary heaters); President and Director, Manufacturers Products, Inc. (distributor of portable construction heaters); President, Portable Heater Parts, a division of Manufacturers Products, Inc.
Other Directorships Held: None.
Qualifications: Mr. Walsh has served in several business management roles and directorship positions throughout his career. Mr. Walsh previously served as Vice President, Walsh & Kelly, Inc. (paving contractors). |
Annual Shareholder Report
OFFICERS
Name
Birth Date
Address
Positions Held with Trust
Date Service Began | Principal Occupation(s) for Past Five Years
and Previous Position(s) |
Lori A. Hensler
Birth Date: January 6, 1967
TREASURER
Officer since: April 2013 | Principal Occupations: Principal Financial Officer and Treasurer of the Federated Fund Family; Senior Vice President, Federated Administrative Services; Financial and Operations Principal for Federated Securities Corp. and Edgewood Services, Inc.; and Assistant Treasurer, Federated Investors Trust Company. Ms. Hensler has received the Certified Public Accountant designation.
Previous Positions: Controller of Federated Investors, Inc.; Senior Vice President and Assistant Treasurer, Federated Investors Management Company; Treasurer, Federated Investors Trust Company; Assistant Treasurer, Federated Administrative Services, Federated Administrative Services, Inc., Federated Securities Corp., Edgewood Services, Inc., Federated Advisory Services Company, Federated Equity Management Company of Pennsylvania, Federated Global Investment Management Corp., Federated Investment Counseling, Federated Investment Management Company, Passport Research, Ltd., and Federated MDTA, LLC; Financial and Operations Principal for Federated Securities Corp., Edgewood Services, Inc. and Southpointe Distribution Services, Inc. |
Peter J. Germain
Birth Date: September 3, 1959
CHIEF LEGAL OFFICER, SECRETARY and EXECUTIVE VICE PRESIDENT
Officer since: January 2005 | Principal Occupations: Mr. Germain is Chief Legal Officer, Secretary and Executive Vice President of the Federated Fund Family. He is General Counsel, Chief Legal Officer, Secretary and Executive Vice President, Federated Investors, Inc.; Trustee and Senior Vice President, Federated Investors Management Company; Trustee and President, Federated Administrative Services; Director and President, Federated Administrative Services, Inc.; Director and Vice President, Federated Securities Corp.; Director and Secretary, Federated Private Asset Management, Inc.; Secretary, Federated Shareholder Services Company; and Secretary, Retirement Plan Service Company of America. Mr. Germain joined Federated in 1984 and is a member of the Pennsylvania Bar Association.
Previous Positions: Deputy General Counsel, Special Counsel, Managing Director of Mutual Fund Services, Federated Investors, Inc.; Senior Vice President, Federated Services Company; and Senior Corporate Counsel, Federated Investors, Inc. |
Stephen Van Meter
Birth Date: June 5, 1975
CHIEF COMPLIANCE OFFICER AND SENIOR VICE PRESIDENT
Officer since: July 2015 | Principal Occupations: Senior Vice President and Chief Compliance Officer of the Federated Fund Family; Vice President and Chief Compliance Officer of Federated Investors, Inc. and Chief Compliance Officer of certain of its subsidiaries. Mr. Van Meter joined Federated in October 2011. He holds FINRA licenses under Series 3, 7, 24 and 66.
Previous Positions: Mr. Van Meter previously held the position of Compliance Operating Officer, Federated Investors, Inc. Prior to joining Federated, Mr. Van Meter served at the United States Securities and Exchange Commission in the positions of Senior Counsel, Office of Chief Counsel, Division of Investment Management and Senior Counsel, Division of Enforcement. |
Annual Shareholder Report
Name
Birth Date
Address
Positions Held with Trust
Date Service Began | Principal Occupation(s) for Past Five Years
and Previous Position(s) |
Stephen F. Auth
Birth Date: September 13, 1956
101 Park Avenue
41st Floor
New York, NY 10178
CHIEF INVESTMENT OFFICER
Officer since: November 2002 | Principal Occupations: Stephen F. Auth is Chief Investment Officer of various Funds in the Federated Fund Family; Executive Vice President, Federated Investment Counseling, Federated Global Investment Management Corp. and Federated Equity Management Company of Pennsylvania.
Previous Positions: Executive Vice President, Federated Investment Management Company and Passport Research, Ltd. (investment advisory subsidiary of Federated); Senior Vice President, Global Portfolio Management Services Division; Senior Vice President, Federated Investment Management Company and Passport Research, Ltd.; Senior Managing Director and Portfolio Manager, Prudential Investments. |
Annual Shareholder Report
Evaluation and Approval of Advisory Contract–May 2019
Federated Kaufmann Large Cap Fund (the “Fund”)
At its meetings in May 2019, the Fund's Board of Trustees (the “Board”), including a majority of those Trustees who are not “interested persons” of the Fund, as defined in the Investment Company Act of 1940 (the “Independent Trustees”), reviewed and unanimously approved the continuation of the Fund's investment advisory and subadvisory contracts for an additional one-year term. The Board's decision regarding these contracts reflects the exercise of its business judgment after considering all of the information received on whether to continue the existing arrangements.
At the request of the Independent Trustees, the Fund's Chief Compliance Officer (the CCO) furnished to the Board in advance of its May 2019 meetings an independent written evaluation presenting on the topics discussed below. The Board considered the CCO's independent written evaluation (the “CCO Fee Evaluation Report”), along with other information, in evaluating the reasonableness of the Fund's management fee and in deciding to approve the continuation of the investment advisory and subadvisory contracts. The CCO, in preparing the CCO Fee Evaluation Report, has the authority to retain consultants, experts or staff as reasonably necessary to assist in the performance of his duties, reports directly to the Board, and can be terminated only with the approval of a majority of the Independent Trustees. At the request of the Independent Trustees, the CCO Fee Evaluation Report followed the same general approach and covered the same topics as that of the report that had previously been delivered by the CCO in his capacity as “Senior Officer,” prior to the elimination of the Senior Officer position in December 2017.
The Board also considered judicial decisions concerning allegedly excessive investment advisory fees in making its decision. Using these judicial decisions as a guide, the Board observed that the following factors may be relevant to an adviser's fiduciary duty with respect to its receipt of compensation from a fund: (1) the nature and quality of the services provided by an adviser to a fund and its shareholders (including the performance of the fund, its benchmark, and comparable funds); (2) an adviser's cost of providing the services (including the profitability to an adviser of providing advisory services to a fund); (3) the extent to which an adviser may realize “economies of scale” as a fund grows larger and, if such economies of scale exist, whether they have been shared with a fund and its shareholders or the family of funds; (4) any “fall-out” financial benefits that accrue to an adviser because of its relationship with a fund (including research services received from brokers that execute fund trades and any fees paid to affiliates of an adviser for services rendered to a fund); (5) comparative fee and expense structures (including a comparison of fees paid to an adviser with those paid by similar funds both internally and externally as well as management fees charged to institutional and other advisory clients of the
Annual Shareholder Report
adviser or its affiliates for what might be viewed as like services); and (6) the extent of care, conscientiousness and independence with which the fund's board members perform their duties and their expertise (including whether they are fully informed about all facts the board deems relevant to its consideration of an adviser's services and fees). The Board noted that the Securities and Exchange Commission (SEC) disclosure requirements regarding the basis for the Board's approval of the Fund's investment advisory and subadvisory contracts generally align with the factors listed above. The Board was aware of these factors and was guided by them in its review of the Fund's investment advisory and subadvisory contracts to the extent it considered them to be appropriate and relevant, as discussed further below.
The Board considered and weighed these factors in light of its substantial accumulated experience in governing the Fund and working with Federated Equity Management Company of Pennsylvania (the “Adviser”) and its affiliates (collectively, “Federated”) on matters relating to the funds advised by Federated (each, a “Federated Fund”). The Independent Trustees were assisted in their deliberations by independent legal counsel.
In addition to the extensive materials that comprise and accompany the CCO Fee Evaluation Report, the Board received detailed information about the Fund and the Federated organization throughout the year, and in connection with its May meetings at which the Board's formal approval of the advisory and subadvisory contracts occurred. In this regard, Federated provided much of this information at each regular meeting of the Board, and furnished additional information specifically in connection with the May meetings. In the months preceding the May meetings, the Board requested and reviewed written materials prepared by Federated in response to requests on behalf of the Independent Trustees encompassing a wide variety of topics. At the May meetings, in addition to meeting in separate sessions of the Independent Trustees without management present, senior management of the Adviser also met with the Independent Trustees and their counsel to discuss the materials presented and such additional matters as the Independent Trustees deemed reasonably necessary to evaluate the advisory and subadvisory contracts. Between regularly scheduled meetings, the Board also received information on particular matters as the need arose.
The Board's consideration of the investment advisory and subadvisory contracts included review of the CCO Fee Evaluation Report, accompanying data and additional information covering the following matters, among others: the Adviser's and sub-adviser's investment philosophy, revenue, profitability, personnel and processes; investment and operating strategies; the Fund's short-term and long-term performance (in absolute terms, both on a gross basis and net of expenses, as well as in terms relative to its particular investment program and certain competitor or “peer group” funds and/or other benchmarks, as appropriate) and comments on the reasons for performance; the Fund's investment objectives; the Fund's expenses, including the advisory fee and the
Annual Shareholder Report
overall expense structure of the Fund (both in absolute terms and relative to similar and/or competing funds), with due regard for contractual or voluntary expense limitations; the use and allocation of brokerage commissions derived from trading the Fund's portfolio securities (if any); and the nature, quality and extent of the advisory and other services provided to the Fund by the Adviser and its affiliates. The Board also considered the preferences and expectations of Fund shareholders; the entrepreneurial and other risks assumed by the Adviser in sponsoring the Fund; the continuing state of competition in the mutual fund industry and market practices; the range of comparable fees for similar funds in the mutual fund industry; the Fund's relationship to the Federated Funds which include a comprehensive array of funds with different investment objectives, policies and strategies which are generally available for exchange without the incurrence of additional sales charges; compliance and audit reports concerning the Federated Funds and the Federated companies that service them (including communications from regulatory agencies), as well as Federated's responses to any issues raised therein; and relevant developments in the mutual fund industry and how the Federated Funds and/or Federated are responding to them. The Board also considered that the longevity and experience of the Fund's portfolio management team and their extensive bottom-up approach to investing may limit the utility of comparisons to other equity mutual funds. The Board's evaluation process is evolutionary. The criteria considered and the emphasis placed on relevant criteria change in recognition of changing circumstances in the mutual fund marketplace.
While mindful that courts have cautioned against giving too much weight to comparative information concerning fees charged by other advisers for managing funds with comparable investment programs, the Board has found the use of such comparisons to be relevant to its deliberations. In this regard, the Board was presented with, and considered, information regarding the contractual advisory fee rates, net advisory fee rates, total expense ratios and each element of the Fund's total expense ratio (i.e., gross and net advisory fees, custody fees, portfolio accounting fees and transfer agency fees) relative to an appropriate group of peer funds compiled by Federated using data supplied by independent fund ranking organizations (the “Peer Group”). The Board received a description of the composition and methodology used to select the Peer Group. The Board focused on comparisons with other similar mutual funds more heavily than non-mutual fund products or services because it is believed that they are more relevant. For example, other mutual funds are the products most like the Fund, in that they are readily available to Fund shareholders as alternative investment vehicles. Also, they are the type of investment vehicle, in fact, chosen and maintained by the Fund's investors. The range of their fees and expenses, therefore, appears to be a relevant indicator of what consumers have found to be reasonable in the marketplace in which the Fund competes.
Annual Shareholder Report
The Board reviewed the contractual advisory fee rate, net advisory fee rate and other expenses of the Fund and noted the position of the Fund's fee rates relative to its Peer Group. In this regard, the Board noted that the contractual advisory fee rate was above the median of the relevant Peer Group, but the Board noted the applicable waivers and reimbursements, and that the overall expense structure of the Fund remained competitive in the context of other factors considered by the Board.
For comparison, the CCO reviewed the fees charged by Federated for providing advisory services to products other than the Federated Funds (e.g., institutional separate accounts and third-party unaffiliated mutual funds for which Federated serves as sub-adviser) (referenced to as “Comparable Funds/Accounts”). With respect to Comparable Funds/Accounts other than third-party mutual funds, the CCO concluded that they are inherently different products. Those differences include, but are not limited to, different types of targeted investors different applicable laws and regulations; different legal structures; different average account sizes and portfolio management techniques made necessary by different cash flows and different associated costs; and the time spent by portfolio managers and their teams, as well as personnel in the Funds Financial Services, Legal, Compliance and Risk Management departments, in reviewing securities pricing, addressing different administrative responsibilities, addressing different degrees of risk associated with management and a variety of different costs. The CCO also reviewed the differences in the nature of the services required for Federated to manage its proprietary mutual fund business versus managing a discrete pool of assets as a sub-adviser to another institution's mutual fund, and that Federated generally performs significant additional services and assumes substantially greater risks in managing the Fund and other Federated Funds than in its role as sub-adviser to an unaffiliated third-party mutual fund. The CCO did not consider the fees for providing advisory services to Comparable Funds/Accounts to be determinative in judging the appropriateness of the Federated Funds' advisory fees.
The CCO noted that the services, administrative responsibilities and risks associated with such relationships are quite different than serving as a primary adviser to a fund.
Following such evaluation, and full deliberations, the Board concluded that the fees and expenses of the Fund are reasonable and supported renewal of the Fund's investment advisory and subadvisory contracts.
The Board considered the nature, extent and quality of the services provided to the Fund by the Adviser and the resources of the Adviser and its affiliates dedicated to the Fund. In this regard, the Board evaluated, among other things, the Adviser's personnel, experience, track record, financial resources, overall reputation and willingness to invest in personnel and infrastructure that benefit the Fund. In addition, the Board reviewed the qualifications, backgrounds and responsibilities of the portfolio management team primarily responsible for the day-to-day management of the Fund and the Adviser's ability and experience in
Annual Shareholder Report
attracting and retaining qualified personnel to service the Fund. The Board noted the investment research and company engagement capabilities of the Adviser and its affiliates. The Board also noted the compliance program of the Adviser and the compliance-related resources provided to the Fund by the Adviser, including the Adviser's commitment to respond to rulemaking initiatives of the SEC. The Fund's ability to deliver competitive performance when compared to its Peer Group was also deemed to be relevant by the Board as a useful indicator of how the Adviser is executing the Fund's investment program. The Adviser's ability to execute this program was one of the Board's considerations in reaching a conclusion that the nature, extent and quality of the Adviser's investment management services warrant the continuation of the investment advisory and subadvisory contracts.
In evaluating the Fund's investment performance, the Board considered performance results in light of the Fund's investment objective, strategies and risks, as disclosed in the Fund's prospectus. The Board considered detailed investment reports on the Fund's performance that were provided to the Board throughout the year and in connection with the May meetings. The CCO also reviewed information regarding the performance of other mutual funds in the Peer Group, noting the CCO's view that comparisons to fund peer groups may be helpful, though not conclusive, in evaluating the performance of the Adviser in managing the Fund. The Board considered, in evaluating such comparisons, that in some cases there may be differences in the funds' objectives or investment management techniques, or the costs to implement the funds, even within the same Peer Group.
For the periods covered by the CCO Fee Evaluation Report, the Fund's performance for the one-year period was above the median of the relevant Peer Group, and the Fund's performance fell below the median of the relevant Peer Group for the three-year and five-year periods. The Board discussed the Fund's performance with the Adviser and recognized the efforts being taken by the Adviser in the context of other factors considered relevant by the Board.
Following such evaluation and full deliberations, the Board concluded that the performance of the Fund supported renewal of the Fund's investment advisory and subadvisory contracts.
The Board also received financial information about Federated, including information regarding the compensation and ancillary (or “fall-out”) benefits Federated derived from its relationships with the Federated Funds. This information covered not only the fees under the investment advisory contracts, but also fees received by Federated's subsidiaries for providing other services to the Federated Funds under separate contracts (e.g., for serving as the Federated Funds' administrator and distributor). In this regard, the Board considered that certain Federated subsidiaries provide distribution and shareholder services to the Federated Funds, for which they may be compensated through distribution and servicing fees paid pursuant to Rule 12b-1 plans or otherwise. The information also detailed any indirect benefit Federated may derive from its
Annual Shareholder Report
receipt of research services from brokers who execute Federated Fund trades. In addition, the Board considered the fact that, in order for a Federated Fund to be competitive in the marketplace, the Adviser and its affiliates frequently waived fees and/or reimbursed expenses and have disclosed to Federated Fund investors and/or indicated to the Board their intention to do so in the future. Moreover, the Board receives regular reporting as to the institution, adjustment or elimination of these voluntary waivers. The Board considered Federated's previous reductions in contractual management fees to certain Federated Funds in response to the CCO's recommendations in the prior year's CCO Fee Evaluation Report.
Federated furnished information, requested by the CCO, that reported revenues on a fund-by-fund basis and made estimates of the allocation of expenses on a fund-by-fund basis, using allocation methodologies specified by the CCO. The CCO noted that, while these cost allocation reports apply consistent allocation processes, the inherent difficulties in allocating costs continues to cause the CCO to question the precision of the process and to conclude that such reports may be unreliable, since a single change in an allocation estimate may dramatically alter the resulting estimate of cost and/or profitability of a Federated Fund and may produce unintended consequences. The allocation information, including the CCO's view that fund-by-fund estimations may be unreliable, was considered in the evaluation by the Board.
The Board and the CCO also reviewed information compiled by Federated comparing its profitability information to other publicly held fund management companies, including information regarding profitability trends over time. In this regard, the CCO concluded that Federated's profit margins did not appear to be excessive. The CCO also noted that Federated appeared financially sound, with the resources necessary to fulfill its obligations under its contracts with the Fund.
The CCO Fee Evaluation Report also discussed the notion of possible realization of “economies of scale” as a fund grows larger, the difficulties of calculating economies of scale at an individual fund level, and the extent to which potential scale benefits are shared with shareholders. In this regard, the Board considered that the Adviser has made significant and long-term investments in areas that support all of the Federated Funds, such as personnel and processes for the portfolio management, shareholder services, compliance, internal audit and risk management functions, as well as systems technology (including technology relating to cybersecurity) and that the benefits of these investments (as well as any economies of scale, should they exist) were likely to be shared with the Federated Fund family as a whole. The Board noted that Federated's investments in these areas are extensive. In addition, the Board considered that the Adviser and its affiliates have frequently waived fees and/or reimbursed expenses and that this has allowed potential economies of scale to be shared with shareholders. The Board also considered that such waivers and reimbursements can provide protection from an increase in expenses if a
Annual Shareholder Report
Federated Fund's assets decline. Federated, as it does throughout the year, and specifically in connection with the Board's review of the advisory and subadvisory contracts, furnished information relative to revenue sharing or adviser-paid fees. Federated and the CCO noted that this information should be viewed to determine if there was an incentive to either not apply breakpoints, or to apply breakpoints at higher levels, and should not be viewed to determine the appropriateness of advisory fees. The Board also noted the absence of any applicable regulatory or industry guidelines on this subject, which (as discussed in the CCO Fee Evaluation Report) is compounded by the lack of any common industry practice or general pattern with respect to structuring fund advisory fees with “breakpoints” that serve to reduce the fee as a fund attains a certain size.
The CCO stated that his observations and the information accompanying the CCO Fee Evaluation Report supported a finding by the Board that the management fee for the Fund was reasonable. Under these circumstances, no changes were recommended to, and no objection was raised to, the continuation of the Fund's investment advisory and subadvisory contracts. The CCO also recognized that the Board's evaluation of the Federated Funds' advisory and subadvisory arrangements is a continuing and on-going process that is informed by the information that the Board requests and receives from management throughout the course of the year and, in this regard, the CCO noted certain items for future reporting to the Board or further consideration by management as the Board continues its on-going oversight of the Federated Funds.
In its decision to continue an existing investment advisory contract, the Board was mindful of the potential disruptions of the Fund's operations and various risks, uncertainties and other effects that could occur as a result of a decision to terminate or not renew an investment advisory contract. In particular, the Board recognized that many shareholders have invested in the Fund on the strength of the Adviser's industry standing and reputation and with the expectation that the Adviser will have a continuing role in providing advisory services to the Fund. Thus, the Board's approval of the advisory and subadvisory contracts reflected the fact that it is the shareholders who have effectively selected the Adviser by virtue of having invested in the Fund. The Board concluded that, in light of the factors summarized above, including the nature, quality and scope of the services provided to the Fund by the Adviser and its affiliates, continuation of the investment advisory and subadvisory contracts were appropriate.
Annual Shareholder Report
The Board based its decision to approve the investment advisory and subadvisory contracts on the totality of the circumstances and relevant factors and with a view to past and future long-term considerations. Not all of the factors and considerations identified above were necessarily relevant to the Fund, nor did the Board consider any one of them to be determinative. With respect to the factors that were relevant, the Board's decision to approve the continuation of the contracts reflects its view that Federated's performance and actions provided a satisfactory basis to support the decision to continue the existing arrangements.
Annual Shareholder Report
Voting Proxies on Fund Portfolio Securities
A description of the policies and procedures that the Fund uses to determine how to vote proxies, if any, relating to securities held in the Fund's portfolio is available, without charge and upon request, by calling 1-800-341-7400. A report on “Form N-PX” of how the Fund voted any such proxies during the most recent 12-month period ended June 30 is available via the Proxy Voting Record (Form N-PX) link associated with the Fund and share class name at www.FederatedInvestors.com/FundInformation. Form N-PX filings are also available at the SEC's website at www.sec.gov.
Quarterly Portfolio Schedule
Each fiscal quarter, the Fund will file with the SEC a complete schedule of its monthly portfolio holdings on “Form N-PORT.” The Fund's holdings as of the end of the third month of every fiscal quarter, as reported on Form N-PORT, will be publicly available on the SEC's website at www.sec.gov within 60 days of the end of the fiscal quarter upon filing. You may also access this information via the link to the Fund and share class name at www.FederatedInvestors.com.
Annual Shareholder Report
Mutual funds are not bank deposits or obligations, are not guaranteed by any bank and are not insured or guaranteed by the U.S. government, the Federal Deposit Insurance Corporation, the Federal Reserve Board or any other government agency. Investment in mutual funds involves investment risk, including the possible loss of principal.
This Report is authorized for distribution to prospective investors only when preceded or accompanied by the Fund's Prospectus, which contains facts concerning its objective and policies, management fees, expenses and other information.
Federated Kaufmann Large Cap Fund
Federated Investors Funds
4000 Ericsson Drive
Warrendale, PA 15086-7561
Contact us at FederatedInvestors.com
or call 1-800-341-7400.
Federated Securities Corp., Distributor
CUSIP 314172446
CUSIP 314172438
CUSIP 314172420
CUSIP 314172412
CUSIP 314172131
39667 (12/19)
Federated is a registered trademark of Federated Investors, Inc.
2019 ©Federated Investors, Inc.
Annual Shareholder Report
October 31, 2019
| Share Class | Ticker | A | FKASX | B | FKBSX | C | FKCSX |
| | R | FKKSX | Institutional | FKAIX | R6 | FKALX |
Federated Kaufmann Small Cap Fund
Fund Established 2002
A Portfolio of Federated Equity Funds
IMPORTANT NOTICE REGARDING REPORT DELIVERY
Beginning on January 1, 2021, as permitted by regulations adopted by the Securities and Exchange Commission, paper copies of the Fund's shareholder reports like this one will no longer be sent by mail, unless you specifically request paper copies of the reports from the Fund or from your financial intermediary, such as a broker-dealer or bank. Instead, the reports will be made available on a website, and you will be notified by mail each time a report is posted and provided with a website link to access the report.
If you already elected to receive shareholder reports electronically, you will not be affected by this change and you need not take any action. You may elect to receive shareholder reports and other communications from the Fund or your financial intermediary electronically by contacting your financial intermediary (such as a broker-dealer or bank); other shareholders may call the Fund at 1-800-341-7400, Option 4.
You may elect to receive all future reports in paper free of charge. You can inform the Fund or your financial intermediary that you wish to continue receiving paper copies of your shareholder reports by contacting your financial intermediary (such as a broker-dealer or bank); other shareholders may call the Fund at 1-800-341-7400, Option 4. Your election to receive reports in paper will apply to all funds held with the Fund complex or your financial intermediary.
Not FDIC Insured ■ May Lose Value ■ No Bank Guarantee
J. Christopher
Donahue
President
Federated Kaufmann Small Cap Fund
Letter from the President
Dear Valued Shareholder,
I am pleased to present the Annual Shareholder Report for your fund covering the period from November 1, 2018 through October 31, 2019. This report includes Management's Discussion of Fund Performance, a complete listing of your fund's holdings, performance information and financial statements along with other important fund information.
In addition, our website, FederatedInvestors.com, offers easy access to Federated resources that include timely fund updates, economic and market insights from our investment strategists, and financial planning tools.
Thank you for investing with Federated. I hope you find this information useful and look forward to keeping you informed.
Sincerely,
J. Christopher Donahue, President
CONTENTS
| 1 |
| 6 |
| 7 |
| 19 |
| 25 |
| 27 |
| 29 |
| 30 |
| 42 |
| 44 |
| 46 |
| 52 |
| 60 |
| 60 |
Management's Discussion of Fund Performance (unaudited)
The total return of Federated Kaufmann Small Cap Fund (the “Fund”), based on net asset value for the 12-month reporting period ended October 31, 2019, was 17.96% for the Class A Shares, 17.23% for the Class B Shares, 17.25% for the Class C Shares, 17.99% for the Class R Shares, 18.51% for the Institutional Shares and 18.53% for the Class R6 Shares. The total return of the Russell 2000® Growth Index (R2000G),1 the Fund's broad-based securities market index, was 6.40% for the same period. The total return of the Morningstar Small Growth Funds Average (MSGFA),2 a peer group average for the Fund, was 6.66% for the same period. The Fund's and MSGFA's total returns for the most recently completed fiscal year reflected actual cash flows, transaction costs and other expenses, which were not reflected in the total return of the R2000G.
During the reporting period, the Fund's investment strategy focused on stock selection, sector exposure, international exposure3 and the effect of cash holdings. These were the most significant factors affecting the Fund's performance relative to the R2000G.
The following discussion will focus on the performance of the Fund's Class R6 Shares.
MARKET OVERVIEW
During the reporting period, returns in most global equity markets increased as economic growth remained positive, despite it slowing. The U.S. Federal Reserve (the “Fed”) reversed its previous path of raising rates and began lowering rates, eventually planning to pause until 2020. U.S. GDP growth remained strong, with the consumer leading the way as business investments slowed when the tax reform momentum wore off. Global central banks remained supportive, easing policies with the hope their economies would respond positively. The large fiscal stimulus in late 2017 along with the administration's business-friendly stance helped U.S. growth outpace much of the world. However, as U.S. trade tensions continued during the reporting period, volatility increased.
STOCK SELECTION
The key factors affecting performance from a macroeconomic standpoint were the improving U.S. economic fundamentals and the accommodative monetary policies of the Fed and other central banks around the world. These monetary accommodations, combined with a more aggressive fiscal stance, helped to boost earnings for most of the S&P 500® Index4 constituents. The profitability of many of the companies in which the Fund invested remained strong throughout the reporting period. Fund management continued to seek what it viewed as attractive small-cap5 growth investment
Annual Shareholder Report
opportunities–companies it viewed as dominant competitors, possessing strengthening fundamentals, with the potential to deliver both near-term and long-term growth in sales and earnings.
The majority of the Fund outperformance versus the R2000G was due to stock selection particularly in the Health Care, Information Technology and Consumer Staples sectors. Individual companies that most contributed to Fund performance during the reporting period were Spark Therapeutics, argenx SE ADR, Tesaro Inc, Veeva Systems and Azul SA. Holdings that negatively impacted Fund performance were AnaptysBio, Grubhub, Minerva Neurosciences, MacroGenics and GTT Communications.
SECTOR EXPOSURE
At the end of the reporting period, approximately 66.8% of the portfolio was invested in four large sectors: Health Care, Information Technology, Consumer Discretionary and Industrials. These sectors have historically provided good opportunities for bottom-up growth investors. Overweighting the Information Technology sector benefited relative performance versus the R2000G.
INTERNATIONAL EXPOSURE
Stock selection of companies domiciled outside the U.S. was a positive contributor to Fund performance; however, their group weight was a negative contributor. Approximately 9.9% of the Fund's assets were invested in such companies during the reporting period.
EFFECT OF CASH HOLDINGS
The Fund had significant outflows during the reporting period which resulted in an average cash position of 14.49%. In a rising market, the cash holdings resulted in a modest drag on relative Fund performance versus the R2000G.
| 1 | Please see the footnotes to the line graphs below for definitions of, and further information about, the R2000G. |
| 2 | Please see the footnotes to the line graphs below for definitions of, and further information about, the MSGFA. |
| 3 | International investing involves special risks including currency risk, increased volatility, political risks and differences in auditing and other financial standards. Small company stocks may be less liquid and subject to greater price volatility than large capitalization stocks. |
| 4 | The S&P 500 Index is an unmanaged capitalization-weighted index of 500 stocks designed to measure performance of the broad domestic economy through changes in the aggregate market value of 500 stocks representing all major industries. The index is unmanaged, and it is not possible to invest directly in an index. |
| 5 | Small company stocks may be less liquid and subject to greater price volatility than large company stocks. |
Annual Shareholder Report
FUND PERFORMANCE AND GROWTH OF A $10,000 INVESTMENT
The graph below illustrates the hypothetical investment of $10,0001 in the Federated Kaufmann Small Cap Fund from October 31, 2009 to October 31, 2019, compared to the Russell 2000® Growth Index (R2000G)2 and the Morningstar Small Growth Funds Average (MSGFA).3The Average Annual Total Return table below shows returns for each class averaged over the stated periods.
Growth of a $10,000 Investment–CLASS A SHARES and institutional shares
Growth of $10,000 as of October 31, 2019
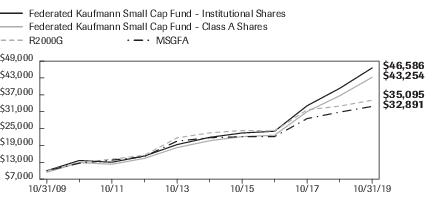
| Federated Kaufmann Small Cap Fund - | Institutional Shares | Class A Shares | R2000G | MSGFA |
| F | F | I | I |
| 10/31/2009 | 10,000 | 9,450 | 10,000 | 10,000 |
| 10/31/2010 | 13,647 | 12,896 | 12,867 | 12,679 |
| 10/31/2011 | 13,020 | 12,303 | 14,133 | 13,782 |
| 10/31/2012 | 15,234 | 14,395 | 15,504 | 15,028 |
| 10/31/2013 | 19,293 | 18,231 | 21,681 | 20,529 |
| 10/31/2014 | 21,873 | 20,669 | 23,472 | 21,756 |
| 10/31/2015 | 23,430 | 22,140 | 24,299 | 22,098 |
| 10/31/2016 | 24,053 | 22,644 | 24,180 | 22,160 |
| 10/31/2017 | 33,130 | 31,050 | 31,675 | 28,552 |
| 10/31/2018 | 39,309 | 36,669 | 32,984 | 30,849 |
| 10/31/2019 | 46,586 | 43,254 | 35,095 | 32,891 |
41 graphic description end -->
| ■ | Total returns shown for Class A Shares include the maximum sales charge of 5.50% ($10,000 investment minus $550 sales charge = $9,450). |
The Fund offers multiple share classes whose performance may be greater than or less than its other share class(es) due to differences in sales charges and expenses. See the Average Annual Total Return table below for the returns of additional classes not shown in the line graph above.
Annual Shareholder Report
Average Annual Total Returnsfor the Period Ended 10/31/2019
(returns reflect all applicable sales charges and contingent deferred sales charges as specified below in footnote #1)
| | 1 Year | 5 Years | 10 Years |
| Class A Shares | 11.46% | 14.62% | 15.77% |
| Class B Shares | 11.73% | 15.01% | 15.92% |
| Class C Shares | 16.25% | 15.25% | 15.78% |
| Class R Shares | 17.99% | 15.96% | 16.47% |
| Institutional Shares4 | 18.51% | 16.32% | 16.63% |
| Class R6 Shares4 | 18.53% | 16.15% | 16.55% |
| R2000G | 6.40% | 8.38% | 13.38% |
| MSGFA | 6.66% | 8.87% | 13.12% |
Performance data quoted represents past performance which is no guarantee of future results. Investment return and principal value will fluctuate so that an investor's shares, when redeemed, may be worth more or less than their original cost. Mutual fund performance changes over time and current performance may be lower or higher than what is stated. For current to the most recent month-end performance and after-tax returns, visit FederatedInvestors.com or call 1-800-341-7400. Returns shown do not reflect the deduction of taxes that a shareholder would pay on Fund distributions or the redemption of Fund shares. Mutual funds are not obligations of or guaranteed by any bank and are not federally insured.
Annual Shareholder Report
| 1 | Represents a hypothetical investment of $10,000 in the Fund after deducting the applicable sales charges: for Class A Shares, the maximum sales charge of 5.50% ($10,000 investment minus $550 sales charge = $9,450); for Class B Shares, the maximum contingent deferred sales charge is 5.50% on any redemption less than one year from the purchase date; for Class C Shares, a 1.00% contingent deferred sales charge would be applied on any redemption less than one year from the purchase date. The Fund's performance assumes the reinvestment of all dividends and distributions. The R2000G and the MSGFA have been adjusted to reflect reinvestment of dividends on securities in the index and the average. |
| 2 | The Russell 2000® Growth Index measures the performance of the small-cap growth segment of the U.S. equity universe. It includes those Russell 2000® Index companies with higher price-to-value ratios and higher forecasted growth values. The R2000G is constructed to provide a comprehensive and unbiased barometer for the small-cap growth segment. The R2000G is completely reconstituted annually to ensure larger stocks do not distort the performance and characteristics of the true small-cap opportunity set and that the represented companies continue to reflect growth characteristics. The R2000G is not adjusted to reflect sales charges, expenses or other fees that the Securities and Exchange Commission requires to be reflected in the Fund's performance. The index is unmanaged and unlike the Fund, is not affected by cash flows. It is not possible to invest directly in an index. |
| 3 | Morningstar figures represent the average of the total returns reported by all the funds designated by Morningstar as falling into the respective category indicated. They do not reflect sales charges. The Morningstar figures in the Growth of $10,000 line graph are based on historical return information published by Morningstar and reflect the return of the funds comprising the category in the year of publication. Because the funds designated by Morningstar as falling into the category can change over time, the Morningstar figures in the line graph may not match the Morningstar figures in the Average Annual Total Returns table, which reflect the return of the funds that currently comprise the category. |
| 4 | The Fund's Institutional Shares commenced operations on December 30, 2015. The Fund's Class R6 Shares commenced operations on September 1, 2017. It is anticipated that this class will have the lowest net expenses of all outstanding share classes. For the period prior to commencement of operations of the Institutional Shares and Class R6 shares, the performance information shown is for the Fund's Class A Shares and has not been adjusted to reflect expenses of the Institutional Shares or Class R6 Shares since Institutional Shares and Class R6 Shares have a lower expense ratio than Class A Shares. The performance of Class A Shares has been adjusted to remove any voluntary waiver of Fund expenses related to Class A Shares that may have occurred during the period prior to commencement of operations of Institutional Shares and Class R6 Shares. Additionally, the performance information shown above has been adjusted to reflect the absence of any sales charges applicable to Class A Shares. |
Annual Shareholder Report
Portfolio of Investments Summary Table (unaudited)
At October 31, 2019, the Fund's sector composition1 was as follows:
| Sector | Percentage of
Total Net Assets |
| Health Care | 25.5% |
| Information Technology | 20.1% |
| Consumer Discretionary | 11.4% |
| Industrials | 9.8% |
| Real Estate | 6.1% |
| Financials | 5.9% |
| Materials | 1.3% |
| Consumer Staples | 1.2% |
| Energy | 0.6% |
| Communication Services | 0.5% |
| Securities Lending Collateral2 | 15.2% |
| Cash Equivalents3 | 17.4% |
| Other Assets and Liabilities—Net4 | (15.0)% |
| TOTAL | 100.0% |
| 1 | Except for Securities Lending Collateral, Cash Equivalents and Other Assets and Liabilities, sector classifications are based upon, and individual portfolio securities are assigned to, the classifications of the Global Industry Classification System (GICS), except that the Adviser assigns a classification to securities not classified by the GICS and to securities for which the Adviser does not have access to the classification made by the GICS. |
| 2 | Represents cash collateral received for portfolio securities on loan that may be invested in affiliated money market funds, other money market instruments and/or repurchase agreements. |
| 3 | Cash Equivalents include any investments in money market mutual funds and/or overnight repurchase agreements other than those representing securities lending collateral. |
| 4 | Assets, other than investments in securities, less liabilities. See Statement of Assets and Liabilities. |
Annual Shareholder Report
Portfolio of Investments
October 31, 2019
Principal
Amount
or Shares | | | Value |
| | | COMMON STOCKS—82.3% | |
| | | Communication Services—0.5% | |
| 375,000 | 1,2 | Glu Mobile, Inc. | $2,223,750 |
| 1,462,200 | | Infrastrutture Wireless Italiane SPA | 15,017,126 |
| | | TOTAL | 17,240,876 |
| | | Consumer Discretionary—11.3% | |
| 130,000 | 1,2 | Baozun, Inc., ADR | 5,657,600 |
| 2,000,000 | 1 | Boohoo Group PLC | 6,852,982 |
| 110,000 | 1 | Bright Horizons Family Solutions, Inc. | 16,337,200 |
| 47,000 | 1,2 | Canada Goose Holdings, Inc. | 1,966,010 |
| 230,000 | 1,2 | Chegg, Inc. | 7,051,800 |
| 131,600 | | Choice Hotels International, Inc. | 11,643,968 |
| 150,100 | 1 | Delivery Hero SE | 7,032,541 |
| 577,000 | 1,2 | Etsy, Inc. | 25,670,730 |
| 250,000 | 1,2 | Fiverr International Ltd. | 5,652,500 |
| 308,000 | 1,2 | Floor & Decor Holdings, Inc. | 14,115,640 |
| 1,095,000 | 1 | Global Fashion Group S.A. | 2,625,694 |
| 968,092 | 1,2 | GreenTree Hospitality Group Ltd., ADR | 9,884,219 |
| 123,904 | 1,2 | GrubHub, Inc. | 4,220,170 |
| 300,000 | 2 | Levi Strauss & Co. | 5,346,000 |
| 500,000 | 1,2 | Lovesac Co./The | 8,165,000 |
| 425,000 | 1,2 | Luckin Coffee, Inc., ADR | 8,321,500 |
| 199,100 | | Moncler S.p.A | 7,691,096 |
| 15,292,067 | | NagaCorp Ltd. | 27,788,102 |
| 535,500 | 1 | National Vision Holdings, Inc. | 12,744,900 |
| 222,000 | 1,2 | Ollie's Bargain Outlet Holding, Inc. | 14,181,360 |
| 110,000 | 1,2 | OneSpaWorld Holdings Ltd. | 1,710,500 |
| 745,000 | 1 | Planet Fitness, Inc. | 47,426,700 |
| 300,000 | 1 | Redbubble Ltd | 397,745 |
| 520,000 | 1,2 | Revolve Group LLC | 10,795,200 |
| 220,300 | 2 | Six Flags Entertainment Corp. | 9,294,457 |
| 295,800 | 1 | Takeaway.com Holding BV | 24,090,674 |
| 500,000 | 1,2 | The RealReal, Inc. | 11,555,000 |
| 2,500,000 | 1 | Trainline PLC | 13,496,588 |
| 142,000 | | Vail Resorts, Inc. | 32,996,540 |
| 440,000 | 2 | Wingstop, Inc. | 36,709,200 |
Annual Shareholder Report
Principal
Amount
or Shares | | | Value |
| | | COMMON STOCKS—continued | |
| | | Consumer Discretionary—continued | |
| 777,100 | 1,2 | YETI Holdings, Inc. | $25,885,201 |
| | | TOTAL | 417,306,817 |
| | | Consumer Staples—1.2% | |
| 90,000 | 1,2 | Beyond Meat, Inc. | 7,600,500 |
| 300,000 | 1,2 | Freshpet, Inc. | 15,678,000 |
| 630,000 | 1,2 | Grocery Outlet Holding Corp. | 20,097,000 |
| | | TOTAL | 43,375,500 |
| | | Energy—0.6% | |
| 265,537 | | Euronav NV | 2,955,427 |
| 1,838,500 | 1 | Independence Contract Drilling, Inc. | 1,636,265 |
| 628,656 | 1,2 | New Fortress Energy LLC | 10,838,029 |
| 520,000 | 1,2 | Rattler Midstream Partners LP | 7,810,400 |
| | | TOTAL | 23,240,121 |
| | | Financials—5.9% | |
| 400,000 | 1 | ARYA Sciences Acquisition Corp. | 4,360,000 |
| 1,335,000 | 2 | Ares Management Corp. | 39,475,950 |
| 5,420,200 | | Ashmore Group PLC | 32,751,821 |
| 1,500,000 | 1,2 | CrossFirst Bankshares, Inc. | 20,055,000 |
| 3,275,000 | 2 | FinecoBank Banca Fineco SPA | 36,931,242 |
| 625,000 | | Hamilton Lane, Inc. | 37,262,500 |
| 500,000 | 1 | Pivotal Acquisition Corp. | 5,090,000 |
| 910,684 | 1 | ProSight Global, Inc. | 14,443,448 |
| 2,700,000 | 1 | Tel Aviv Stock Exchange Ltd. | 9,997,304 |
| 1,365,500 | | Two Harbors Investment Co. | 18,939,485 |
| | | TOTAL | 219,306,750 |
| | | Health Care—25.5% | |
| 42,000 | 1,2 | Adaptive Biotechnologies Corp. | 1,094,730 |
| 450,900 | 1 | Albireo Pharma, Inc. | 8,283,033 |
| 1,500,000 | 1,2 | Alector, Inc. | 25,260,000 |
| 1,265,903 | 1,2 | Amarin Corporation PLC., ADR | 20,786,127 |
| 910,600 | 1 | Amphastar Pharmaceuticals, Inc. | 17,588,239 |
| 679,762 | 1,2 | AnaptysBio, Inc. | 25,640,623 |
| 305,000 | 1 | Argenx SE | 37,209,293 |
| 337,211 | 1,2 | Argenx SE, ADR | 41,294,859 |
| 950,000 | 1,2 | ArQule, Inc. | 9,604,500 |
| 877,500 | 1,2 | Atara Biotherapeutics, Inc. | 9,582,300 |
| 550,000 | 1,2 | aTyr Pharma, Inc. | 1,969,000 |
Annual Shareholder Report
Principal
Amount
or Shares | | | Value |
| | | COMMON STOCKS—continued | |
| | | Health Care—continued | |
| 266,000 | 1,2 | CRISPR Therapeutics AG | $13,398,420 |
| 3,750,500 | 1 | Calithera Biosciences, Inc. | 10,801,440 |
| 65,750 | 1 | Castle Biosciences, Inc. | 1,547,755 |
| 500,000 | 1,2 | Catabasis Pharmaceuticals, Inc. | 2,520,000 |
| 115,000 | 1 | Charles River Laboratories International, Inc. | 14,947,700 |
| 365,300 | 1,2 | Charlotte's Web Holdings, Inc. | 4,518,060 |
| 190,200 | 1,3 | Clementia Pharmaceuticals, Inc., Rights | 256,770 |
| 680,593 | 1,2 | Cryoport, Inc. | 9,548,720 |
| 89,555 | 1 | Dexcom, Inc. | 13,812,963 |
| 3,200,000 | 1 | Dynavax Technologies Corp. | 16,288,000 |
| 564,000 | 1,2 | Editas Medicine, Inc. | 11,753,760 |
| 532,000 | 1,2 | Frequency Therapeutics, Inc. | 7,660,800 |
| 122,500 | 1,2 | GW Pharmaceuticals PLC, ADR | 16,392,950 |
| 245,000 | 1 | Galapagos NV | 45,126,401 |
| 332,850 | 1 | Galapagos NV, ADR | 61,234,414 |
| 144,400 | 1,2 | Glaukos Corp. | 9,217,052 |
| 690,000 | 1,2 | Gossamer Bio, Inc. | 14,196,750 |
| 4,740,500 | 1 | Horizon Discovery Group PLC | 10,113,127 |
| 333,500 | 1,2 | Inspire Medical Systems, Inc. | 20,336,830 |
| 90,000 | 1,2 | Insulet Corp. | 13,078,800 |
| 104,300 | 1 | iRhythm Technologies, Inc. | 6,969,326 |
| 458,598 | 1 | MacroGenics, Inc. | 3,898,083 |
| 220,000 | 1,2 | Merus NV | 3,445,200 |
| 1,915,000 | 1 | Minerva Neurosciences, Inc. | 9,077,100 |
| 420,625 | 1 | NanoString Technologies, Inc. | 9,506,125 |
| 500,000 | 1 | Natera, Inc. | 19,260,000 |
| 525,000 | 1,2 | Nektar Therapeutics | 8,990,625 |
| 823,900 | 1,2 | NeoGenomics, Inc. | 18,892,027 |
| 2,000,000 | 1,2 | Orchard Therapeutics PLC, ADR | 24,120,000 |
| 101,800 | 1 | PRA Health Sciences, Inc. | 9,946,878 |
| 76,000 | 1,2 | Penumbra, Inc. | 11,853,720 |
| 57,613 | 1 | Protalix Biotherapeutics, Inc. | 12,692 |
| 250,000 | 1,2 | Repligen Corp. | 19,872,500 |
| 1,117,119 | 1,2 | Rhythm Pharmaceuticals, Inc. | 23,816,977 |
| 325,000 | 1,2 | Rubius Therapeutics, Inc. | 2,873,000 |
| 370,000 | 1,2 | SI-BONE, Inc. | 6,160,500 |
| 2,000,000 | 1,2 | Scynexis, Inc. | 2,340,000 |
Annual Shareholder Report
Principal
Amount
or Shares | | | Value |
| | | COMMON STOCKS—continued | |
| | | Health Care—continued | |
| 120,900 | 1 | Silk Road Medical, Inc. | $4,004,208 |
| 175,600 | 1 | Stoke Therapeutics, Inc. | 4,976,504 |
| 268,100 | 1 | Tandem Diabetes Care, Inc. | 16,509,598 |
| 350,000 | 1,2 | Teladoc, Inc. | 26,810,000 |
| 1,545,233 | 1,2 | Translate Bio, Inc. | 14,131,156 |
| 187,529 | 1,2 | TransMedics Group, Inc. | 3,364,270 |
| 273,100 | 1,2 | Tricida, Inc. | 10,216,671 |
| 400,000 | 1,2 | Turning Point Therapeutics, Inc. | 15,344,000 |
| 162,300 | 1,2 | Twist Bioscience Corp. | 3,865,986 |
| 882,300 | 1,2 | Ultragenyx Pharmaceutical, Inc. | 35,415,522 |
| 770,000 | 1,2 | UniQure N.V. | 38,530,800 |
| 822,570 | 3 | United Therapeutics Corp. | 217,981 |
| 305,329 | 1,2 | Vapotherm, Inc. | 3,144,889 |
| 220,800 | 1 | Veeva Systems, Inc. | 31,316,064 |
| 560,000 | 1,2 | Vericel Corp. | 8,887,200 |
| 300,000 | 1,2 | Xeris Pharmaceuticals, Inc. | 2,454,000 |
| 825,000 | 1,2 | Zai Lab Ltd., ADR | 27,876,750 |
| 478,000 | 1,2 | Zogenix, Inc. | 21,342,700 |
| | | TOTAL | 944,506,468 |
| | | Industrials—9.8% | |
| 880,000 | | Air Lease Corp. | 38,702,400 |
| 735,000 | | Aramex PJSC | 784,432 |
| 940,000 | 1,2 | Azul S.A., ADR | 36,641,200 |
| 3,345,054 | | Biffa PLC | 11,051,744 |
| 157,800 | 1 | Chart Industries, Inc. | 9,251,814 |
| 500,000 | 1 | Clarivate Analytics PLC | 8,370,000 |
| 610,800 | 1,2 | Colfax Corp. | 20,522,880 |
| 334,470 | | Comfort Systems USA, Inc. | 16,860,633 |
| 41,700 | 1 | CoStar Group, Inc. | 22,914,984 |
| 1,200,000 | 1,2 | Dirtt Environmental Solutions Ltd. | 5,448,333 |
| 1,135,000 | 1 | GMS, Inc. | 34,004,600 |
| 210,200 | 1,2 | Generac Holdings, Inc. | 20,301,116 |
| 40,000 | | HeadHunter Group PLC, ADR | 698,400 |
| 1,150,000 | 1,2 | Kratos Defense & Security Solutions | 21,712,000 |
| 550,000 | 1 | Mercury Systems, Inc. | 40,513,000 |
| 420,000 | 1 | Parsons Corp. | 14,952,000 |
| 1,825,000 | 1 | Quest Resource Holding Corp. | 4,325,250 |
Annual Shareholder Report
Principal
Amount
or Shares | | | Value |
| | | COMMON STOCKS—continued | |
| | | Industrials—continued | |
| 304,400 | 1,2 | Trex Co., Inc. | $26,753,716 |
| 1,052,000 | 1,2 | Upwork, Inc. | 15,822,080 |
| 458,198 | 1,2 | Willdan Group, Inc. | 13,883,399 |
| | | TOTAL | 363,513,981 |
| | | Information Technology—20.1% | |
| 600,000 | 1,2 | ACM Research, Inc. | 7,554,000 |
| 410,000 | 1,2 | Alarm.com Holdings, Inc. | 20,254,000 |
| 300,000 | 1,2 | Alteryx, Inc. | 27,450,000 |
| 350,000 | 1 | Anaplan, Inc. | 16,520,000 |
| 171,200 | 1 | Avalara, Inc. | 12,155,200 |
| 4,000,000 | | Avast PLC | 21,498,036 |
| 260,000 | 1,2 | Blackline, Inc. | 12,152,400 |
| 2,000,000 | 1 | Camtek Ltd. | 21,580,000 |
| 803,490 | 1,2 | Cardtronics, Inc. | 27,527,567 |
| 260,000 | 1,2 | Ceridian HCM Holding, Inc. | 12,545,000 |
| 775,000 | 1,2 | CloudFlare, Inc. | 13,051,000 |
| 87,000 | 1,2 | Coupa Software, Inc. | 11,961,630 |
| 126,600 | 1,2 | DocuSign, Inc. | 8,379,654 |
| 767,000 | 1,2 | Domo, Inc. | 12,333,360 |
| 65,000 | 1,2 | Dynatrace Holdings LLC | 1,314,950 |
| 415,148 | 1 | Endava PLC, ADR | 17,855,516 |
| 520,000 | 1,2 | Envestnet, Inc. | 32,494,800 |
| 330,000 | 1,2 | Everbridge, Inc. | 22,938,300 |
| 275,500 | 1,2 | Forescout Technologies, Inc. | 8,474,380 |
| 400,000 | 1,2 | GDS Holdings Ltd., ADR | 16,672,000 |
| 625,000 | 1,2 | GTT Communications, Inc. | 4,706,250 |
| 226,600 | 1 | GoDaddy, Inc. | 14,735,798 |
| 857,500 | 1,2 | International Money Express, Inc. | 13,136,900 |
| 860,000 | 2 | Kemet Corp. | 18,696,400 |
| 4,682,001 | 1 | Limelight Networks, Inc. | 19,758,044 |
| 1,215,000 | 1,2 | Magnachip Semiconductor Corp. | 15,515,550 |
| 270,731 | 1,2 | Medallia, Inc. | 7,872,858 |
| 321,800 | 1 | Mimecast Ltd. | 12,778,678 |
| 2,000,000 | 1 | Mobile Iron, Inc. | 12,520,000 |
| 2,100,000 | 2 | Nearmap Ltd. | 3,861,283 |
| 4,010,000 | 1 | Network International Holdings Ltd. | 28,096,454 |
| 625,000 | 1,2 | nLight, Inc. | 8,350,000 |
Annual Shareholder Report
Principal
Amount
or Shares | | | Value |
| | | COMMON STOCKS—continued | |
| | | Information Technology—continued | |
| 213,247 | 1,2 | Novoste Corp. | $18,989,645 |
| 200,000 | 1,2 | Pluralsight, Inc. | 3,616,000 |
| 300,000 | 1 | Pushpay Holdings Ltd. | 605,154 |
| 415,000 | 1 | Q2 Holdings, Inc. | 29,668,350 |
| 520,000 | 1 | Radware Ltd. | 11,731,200 |
| 564,200 | 1 | Rapid7, Inc. | 28,260,778 |
| 350,000 | 1,2 | RealPage, Inc. | 21,192,500 |
| 50,000 | 1 | RingCentral, Inc. | 8,076,000 |
| 640,000 | 1,2 | SailPoint Technologies Holding | 12,390,400 |
| 55,500 | 1,2 | Shopify, Inc. | 17,403,135 |
| 690,000 | 1,2 | ShotSpotter, Inc. | 13,938,000 |
| 700,000 | 1,2 | Smartsheet, Inc. | 27,580,000 |
| 540,000 | 1,2 | Tufin Software Technologies Ltd. | 9,217,800 |
| 78,200 | 1,2 | Tyler Technologies, Inc. | 20,998,264 |
| 176,500 | 1 | WNS Holdings Ltd., ADR | 10,914,760 |
| 170,300 | 1 | Zendesk, Inc. | 12,031,695 |
| 288,800 | 1,2 | Zscaler, Inc. | 12,701,424 |
| | | TOTAL | 744,055,113 |
| | | Materials—1.3% | |
| 1,500,000 | 1 | B2Gold Corp. | 5,272,948 |
| 228,300 | | Eagle Materials, Inc. | 20,852,922 |
| 455,000 | | Endeavour Financial Corp. | 8,239,124 |
| 86,200 | 1 | Ingevity Corp. | 7,258,902 |
| 430,000 | 1,2 | Pretium Resources, Inc. | 4,351,600 |
| | | TOTAL | 45,975,496 |
| | | Real Estate—6.1% | |
| 861,000 | | Americold Realty Trust | 34,517,490 |
| 300,000 | 1 | Cushman & Wakefield PLC | 5,595,000 |
| 80,000 | | EPR Properties | 6,223,200 |
| 610,000 | | Easterly Government Properties, Inc. | 13,615,200 |
| 760,000 | | JBG Smith Properties | 30,597,600 |
| 351,000 | | Lamar Advertising Co. | 28,083,510 |
| 815,700 | | MGM Growth Properties LLC | 25,457,997 |
| 365,900 | 2 | QTS Realty Trust, Inc. | 19,608,581 |
| 545,300 | 2 | Ryman Hospitality Properties | 45,897,901 |
Annual Shareholder Report
Principal
Amount
or Shares | | | Value |
| | | COMMON STOCKS—continued | |
| | | Real Estate—continued | |
| 525,000 | | STAG Industrial, Inc. | $16,296,000 |
| | | TOTAL | 225,892,479 |
| | | TOTAL COMMON STOCKS
(IDENTIFIED COST $2,405,504,360) | 3,044,413,601 |
| | | CORPORATE BONDS—0.1% | |
| | | Consumer Discretionary—0.1% | |
| $1,000,000 | | Baozun, Inc., Conv. Bond, 144A, 1.625%, 5/1/2024 | 1,088,130 |
| 500,000 | | Chegg, Inc., Conv. Bond, 144A, 0.125%, 3/15/2025 | 470,440 |
| 2,500,000 | | NagaCorp Ltd., Sr. Unsecd. Note, 144A, 9.375%, 5/21/2021 | 2,653,701 |
| | | TOTAL | 4,212,271 |
| | | Information Technology—0.0% | |
| 750,000 | | Pluralsight, Inc., Conv. Bond, 144A, 0.375%, 3/1/2024 | 656,227 |
| 500,000 | | Q2 Holdings, Inc., Conv. Bond, 0.750%, 6/1/2026 | 531,875 |
| | | TOTAL | 1,188,102 |
| | | TOTAL CORPORATE BONDS
(IDENTIFIED COST $5,170,534) | 5,400,373 |
| | 1 | WARRANTS—0.0% | |
| | | Health Care—0.0% | |
| 129,500 | | Catabasis Pharmaceuticals, Inc., Warrants 2/8/2024 | 318,272 |
| 176,600 | | Catabasis Pharmaceuticals, Inc., Warrants 6/22/2022 | 254,887 |
| 222,500 | | ContraFect Corp., Warrants 7/27/2021 | 7,654 |
| 467,500 | | ContraFect Corp., Warrants 7/20/2022 | 26,460 |
| 187,500 | | Dynavax Technologies Corp., Warrants 2/12/2022 | 532,669 |
| 109,440 | | Scynexis, Inc., Warrants 4/6/2021 | 16,033 |
| 154,800 | | Scynexis, Inc., Warrants 3/8/2023 | 69,072 |
| | | TOTAL WARRANTS
(IDENTIFIED COST $6,900) | 1,225,047 |
| | | INVESTMENT COMPANIES—32.6% | |
| 110,508,279 | | Federated Government Obligations Fund, Premier Shares, 1.75%4 | 110,508,279 |
| 1,094,824,004 | | Federated Institutional Prime Value Obligations Fund,
Institutional Shares, 1.93%4 | 1,095,152,451 |
| | | TOTAL INVESTMENT COMPANIES
(IDENTIFIED COST $1,205,543,820) | 1,205,660,730 |
| | | TOTAL INVESTMENT IN SECURITIES—115.0%
(IDENTIFIED COST $3,616,225,614)5 | 4,256,699,751 |
| | | OTHER ASSETS AND LIABILITIES - NET—(15.0)%6 | (555,332,156) |
| | | TOTAL NET ASSETS—100% | $3,701,367,595 |
Annual Shareholder Report
[PAGE INTENTIONALLY LEFT BLANK]
Annual Shareholder Report
An affiliated company is a company in which the Fund, alone or in combination with other funds, has ownership of at least 5% of the voting shares. Transactions with affiliated companies during the period ended October 31, 2019, were as follows:
| Affiliated | Balance of
Shares
Held
10/31/2018 | Purchases/
Additions** | Sales/
Reductions** |
| Consumer Discretionary: | | | |
| Baozun, Inc., ADR | — | 130,000 | — |
| Baozun, Inc., Conv. Bond, 144A, 1.625%, 5/1/2024 | — | 1,000,000 | — |
| Energy: | | | |
| New Fortress Energy LLC | — | 628,656 | — |
| Financials: | | | |
| ARYA Sciences Acquisition Corp. | 350,000 | 50,000 | — |
| Hamilton Lane, Inc.* | 415,000 | 210,000 | — |
| Tel Aviv Stock Exchange Ltd.* | — | 2,700,000 | — |
| Health Care: | | | |
| Albireo Pharma, Inc. | 134,756 | 316,144 | — |
| Argenx SE | 253,560 | 51,440 | — |
| Argenx SE, ADR | 337,211 | — | — |
| aTyr Pharma, Inc.*** | — | 7,415,592 | (6,865,592) |
| Calithera Biosciences, Inc. | 899,150 | 2,851,350 | — |
| Catabasis Pharmaceuticals, Inc.**** | 2,200,000 | 280,000 | (1,980,000) |
Catabasis Pharmaceuticals, Inc.,
Warrants 6/22/2022**** | 1,766,000 | — | (1,589,400) |
Catabasis Pharmaceuticals, Inc.,
Warrants 2/8/2024 | — | 129,500 | — |
| ContraFect Corp., Warrants 7/27/2021* | 222,500 | — | — |
| ContraFect Corp., Warrants 7/20/2022* | 467,500 | — | — |
| Dynavax Technologies Corp. | 521,000 | 2,679,000 | — |
| Dynavax Technologies Corp., Warrants 2/12/2022 | — | 187,500 | — |
| Minerva Neurosciences, Inc. | 1,297,300 | 617,700 | — |
| Scynexis, Inc. | 1,144,000 | 856,000 | — |
| Scynexis, Inc., Warrants 3/8/2023 | 154,800 | — | — |
| Scynexis, Inc., Warrants 4/6/2021 | 109,440 | — | — |
| UniQure N.V. | 333,000 | 437,000 | — |
| Industrials: | | | |
| Quest Resource Holding Corp. | — | 1,825,000 | — |
| Information Technology: | | | |
| Camtek Ltd. | 1,550,000 | 450,000 | — |
| ShotSpotter, Inc. | 300,700 | 398,200 | (8,900) |
| Affiliated Issuers no longer in the portfolio at period end | 1,422,000 | 33,700 | (1,455,700) |
| TOTAL OF AFFILIATED TRANSACTIONS | 13,877,917 | 23,246,782 | (11,899,592) |
Annual Shareholder Report
Balance of
Shares
Held
10/31/2019 | Value | Change in
Unrealized
Appreciation/
Depreciation | Net
Realized
Gain/
(Loss)** | Dividend
Income** |
| | | | | |
| 130,000 | $5,657,600 | $124,526 | $— | $— |
| 1,000,000 | $1,088,130 | $88,130 | $— | $9,073 |
| | | | | |
| 628,656 | $10,838,029 | $2,310,266 | $— | $— |
| | | | | |
| 400,000 | $4,360,000 | $232,635 | $— | $— |
| 625,000 | $37,262,500 | $11,739,684 | $— | $520,125 |
| 2,700,000 | $9,997,304 | $4,216,495 | $— | $— |
| | | | | |
| 450,900 | $8,283,033 | $(4,862,666) | $— | $— |
| 305,000 | $37,209,293 | $10,541,652 | $— | $— |
| 337,211 | $41,294,859 | $14,314,607 | $— | $— |
| 550,000 | $1,969,000 | $(2,108,425) | $1 | $— |
| 3,750,500 | $10,801,440 | $(6,645,167) | $— | $— |
| 500,000 | $2,520,000 | $(288,452) | $— | $— |
| 176,600 | $254,887 | $(256,194) | $1,589,000 | $— |
| 129,500 | $318,272 | $318,272 | $— | $— |
| 222,500 | $7,654 | $(165,051) | $— | $— |
| 467,500 | $26,460 | $(268,906) | $— | $— |
| 3,200,000 | $16,288,000 | $(4,554,493) | $— | $— |
| 187,500 | $532,669 | $532,669 | $— | $— |
| 1,915,000 | $9,077,100 | $(9,276,460) | $— | $— |
| 2,000,000 | $2,340,000 | $272,808 | $— | $— |
| 154,800 | $69,072 | $(28,359) | $— | $— |
| 109,440 | $16,033 | $(317) | $— | $— |
| 770,000 | $38,530,800 | $8,157,124 | $— | $— |
| | | | | |
| 1,825,000 | $4,325,250 | $1,091,750 | $— | $— |
| | | | | |
| 2,000,000 | $21,580,000 | $5,834,501 | $— | $340,000 |
| 690,000 | $13,938,000 | $(11,227,586) | $54,664 | $— |
| — | $— | $5,984,915 | $4,836,726 | $— |
| 25,225,107 | $278,585,385 | $26,077,958 | $6,480,391 | $869,198 |
| * | At October 31, 2019, the Fund no longer has ownership of at least 5% of the voting shares. |
| ** | A portion of the amount shown was recorded when the Fund no longer had ownership of at least 5% of the voting shares. |
| *** | A 1:14 reverse stock split occurred for this issue on June 28, 2019. |
| **** | A 1:10 reverse stock split occurred for this issue on December 31, 2018. |
Annual Shareholder Report
Affiliated fund holdings are investment companies which are managed by the Adviser or an affiliate of the Adviser. Transactions with affiliated fund holdings during the period ended October 31, 2019, were as follows:
| | Federated
Government
Obligations Fund,
Premier Shares* | Federated
Institutional
Prime Value
Obligations Fund,
Institutional Shares* | Total of
Affiliated
Transactions |
| Balance of Shares Held 10/31/2018 | 61,870,714 | 361,272,309 | 423,143,023 |
| Purchases/Additions | 1,335,377,285 | 2,359,236,032 | 3,694,613,317 |
| Sales/Reductions | (1,286,739,720) | (1,625,684,337) | (2,912,424,057) |
| Balance of Shares Held 10/31/2019 | 110,508,279 | 1,094,824,004 | 1,205,332,283 |
| Value | $110,508,279 | $1,095,152,451 | $1,205,660,730 |
| Change in Unrealized Appreciation/Depreciation | N/A | $85,663 | $85,663 |
| Net Realized Gain/(Loss) | N/A | $(20,859) | $(20,859) |
| Dividend Income | $2,428,807 | $18,481,111 | $20,909,918 |
| * | All or a portion of the balance/activity for the fund relates to cash collateral received on securities lending transactions. |
| 1 | Non-income-producing security. |
| 2 | All or a portion of these securities are temporarily on loan to unaffiliated broker/dealers. |
| 3 | Market quotations and price evaluations are not available. Fair value determined using significant unobservable inputs in accordance with procedures established by and under the general supervision of the Fund's Board of Trustees (the "Trustees"). |
| 4 | 7-day net yield. |
| 5 | The cost of investments for federal tax purposes amounts to $3,623,209,502. |
| 6 | Assets, other than investments in securities, less liabilities. See Statement of Assets and Liabilities. A significant portion of this balance represents loans to unaffiliated qualified brokers for securities lending. The Fund receives cash from the broker as collateral for the loaned securities and reinvests the collateral in certain short-term securities such as affiliated money market funds, other money market instruments and/or repurchase agreements. |
Note: The categories of investments are shown as a percentage of total net assets at October 31, 2019.
Various inputs are used in determining the value of the Fund's investments. These inputs are summarized in the three broad levels listed below:
Level 1—quoted prices in active markets for identical securities.
Level 2—other significant observable inputs (including quoted prices for similar securities, interest rates, prepayment speeds, credit risk, etc.). Also includes securities valued at amortized cost.
Level 3—significant unobservable inputs (including the Fund's own assumptions in determining the fair value of investments).
The inputs or methodology used for valuing securities are not an indication of the risk associated with investing in those securities.
Annual Shareholder Report
The following is a summary of the inputs used, as of October 31, 2019, in valuing the Fund's assets carried at fair value:
| Valuation Inputs | | | | |
| | Level 1—
Quoted
Prices | Level 2—
Other
Significant
Observable
Inputs | Level 3—
Significant
Unobservable
Inputs | Total |
| Equity Securities: | | | | |
| Common Stocks | | | | |
| Domestic | $2,169,527,7691 | $— | $— | $2,169,527,769 |
| International | 544,015,243 | 330,395,838 | 474,751 | 874,885,832 |
| Debt Securities: | | | | |
| Corporate Bonds | — | 5,400,373 | — | 5,400,373 |
| Warrants | — | 1,225,047 | — | 1,225,047 |
| Investment Companies | 1,205,660,730 | — | — | 1,205,660,730 |
| TOTAL SECURITIES | $3,919,203,742 | $337,021,258 | $474,751 | $4,256,699,751 |
| 1 | Includes $1,372,098 transferred from Level 3 to Level 1 because observable market data was obtained for a security. This transfer represents the value of the security at the beginning of the period. |
The following acronym is used throughout this portfolio:
| ADR | —American Depositary Receipt |
See Notes which are an integral part of the Financial Statements
Annual Shareholder Report
Financial Highlights–Class A Shares
(For a Share Outstanding Throughout Each Period)
| Year Ended October 31 | 2019 | 2018 | 2017 | 2016 | 2015 |
| Net Asset Value, Beginning of Period | $36.01 | $32.58 | $23.94 | $25.38 | $28.77 |
| Income From Investment Operations: | | | | | |
| Net investment income (loss)1 | 0.01 | (0.13) | (0.27) | (0.17) | (0.22) |
| Net realized and unrealized gain (loss) | 6.14 | 5.65 | 9.10 | 0.76 | 2.09 |
| TOTAL FROM INVESTMENT OPERATIONS | 6.15 | 5.52 | 8.83 | 0.59 | 1.87 |
| Less Distributions: | | | | | |
| Distributions from net realized gain | (2.07) | (2.09) | (0.19) | (2.03) | (5.26) |
| Net Asset Value, End of Period | $40.09 | $36.01 | $32.58 | $23.94 | $25.38 |
| Total Return2 | 17.96% | 18.10% | 37.12% | 2.27% | 7.12% |
| Ratios to Average Net Assets: | | | | | |
| Net expenses | 1.36% | 1.35% | 1.85% | 1.95%3 | 1.95%3 |
| Net investment income (loss) | 0.03% | (0.37)% | (0.95)% | (0.73)% | (0.83)% |
| Expense waiver/reimbursement4 | 0.16% | 0.17% | 0.13% | 0.14% | 0.12% |
| Supplemental Data: | | | | | |
| Net assets, end of period (000 omitted) | $826,240 | $580,003 | $401,920 | $343,323 | $600,840 |
| Portfolio turnover | 33% | 39% | 46% | 48% | 88% |
| 1 | Per share numbers have been calculated using the average shares method. |
| 2 | Based on net asset value, which does not reflect the sales charge, redemption fee or contingent deferred sales charge, if applicable. |
| 3 | The net expense ratio is calculated without reduction for fees paid indirectly for expense offset arrangements. The net expense ratios are 1.95% and 1.95% for the years ended October 31, 2016 and 2015, respectively, after taking into account these expense reductions. |
| 4 | This expense decrease is reflected in both the net expense and the net investment income (loss) ratios shown above. |
See Notes which are an integral part of the Financial Statements
Annual Shareholder Report
Financial Highlights–Class B Shares
(For a Share Outstanding Throughout Each Period)
| Year Ended October 31 | 2019 | 2018 | 2017 | 2016 | 2015 |
| Net Asset Value, Beginning of Period | $31.02 | $28.52 | $21.10 | $22.72 | $26.41 |
| Income From Investment Operations: | | | | | |
| Net investment income (loss)1 | (0.21) | (0.31) | (0.37) | (0.26) | (0.33) |
| Net realized and unrealized gain (loss) | 5.25 | 4.90 | 7.98 | 0.67 | 1.90 |
| TOTAL FROM INVESTMENT OPERATIONS | 5.04 | 4.59 | 7.61 | 0.41 | 1.57 |
| Less Distributions: | | | | | |
| Distributions from net realized gain | (2.07) | (2.09) | (0.19) | (2.03) | (5.26) |
| Net Asset Value, End of Period | $33.99 | $31.02 | $28.52 | $21.10 | $22.72 |
| Total Return2 | 17.23% | 17.36% | 36.33% | 1.70% | 6.52% |
| Ratios to Average Net Assets: | | | | | |
| Net expenses | 1.98% | 1.99% | 2.42% | 2.50%3 | 2.50%3 |
| Net investment income (loss) | (0.62)% | (1.01)% | (1.52)% | (1.28)% | (1.36)% |
| Expense waiver/reimbursement4 | 0.04% | 0.07% | 0.12% | 0.16% | 0.12% |
| Supplemental Data: | | | | | |
| Net assets, end of period (000 omitted) | $15,488 | $16,445 | $17,420 | $14,987 | $20,182 |
| Portfolio turnover | 33% | 39% | 46% | 48% | 88% |
| 1 | Per share numbers have been calculated using the average shares method. |
| 2 | Based on net asset value, which does not reflect the sales charge, redemption fee or contingent deferred sales charge, if applicable. |
| 3 | The net expense ratio is calculated without reduction for expense offset arrangements. The net expense ratios are 2.50% and 2.50% for the years ended October 31, 2016 and 2015, respectively, after taking into account these expense reductions. |
| 4 | This expense decrease is reflected in both the net expense and the net investment income (loss) ratios shown above. |
See Notes which are an integral part of the Financial Statements
Annual Shareholder Report
Financial Highlights–Class C Shares
(For a Share Outstanding Throughout Each Period)
| Year Ended October 31 | 2019 | 2018 | 2017 | 2016 | 2015 |
| Net Asset Value, Beginning of Period | $31.03 | $28.53 | $21.10 | $22.72 | $26.41 |
| Income From Investment Operations: | | | | | |
| Net investment income (loss)1 | (0.19) | (0.31) | (0.37) | (0.26) | (0.33) |
| Net realized and unrealized gain (loss) | 5.24 | 4.90 | 7.99 | 0.67 | 1.90 |
| TOTAL FROM INVESTMENT OPERATIONS | 5.05 | 4.59 | 7.62 | 0.41 | 1.57 |
| Less Distributions: | | | | | |
| Distributions from net realized gain | (2.07) | (2.09) | (0.19) | (2.03) | (5.26) |
| Net Asset Value, End of Period | $34.01 | $31.03 | $28.53 | $21.10 | $22.72 |
| Total Return2 | 17.25% | 17.36% | 36.38% | 1.70% | 6.52% |
| Ratios to Average Net Assets: | | | | | |
| Net expenses | 1.97% | 1.97% | 2.41% | 2.50%3 | 2.50%3 |
| Net investment income (loss) | (0.57)% | (1.00)% | (1.50)% | (1.27)% | (1.36)% |
| Expense waiver/reimbursement4 | 0.05% | 0.07% | 0.08% | 0.10% | 0.08% |
| Supplemental Data: | | | | | |
| Net assets, end of period (000 omitted) | $204,247 | $117,888 | $151,959 | $144,340 | $182,689 |
| Portfolio turnover | 33% | 39% | 46% | 48% | 88% |
| 1 | Per share numbers have been calculated using the average shares method. |
| 2 | Based on net asset value, which does not reflect the sales charge, redemption fee or contingent deferred sales charge, if applicable. |
| 3 | The net expense ratio is calculated without reduction for expense offset arrangements. The net expense ratios are 2.50% and 2.50% for the years ended October 31, 2016 and 2015, respectively, after taking into account these expense reductions. |
| 4 | This expense decrease is reflected in both the net expense and the net investment income (loss) ratios shown above. |
See Notes which are an integral part of the Financial Statements
Annual Shareholder Report
Financial Highlights–Class R Shares
(For a Share Outstanding Throughout Each Period)
| Year Ended October 31 | 2019 | 2018 | 2017 | 2016 | 2015 |
| Net Asset Value, Beginning of Period | $36.17 | $32.70 | $24.02 | $25.44 | $28.82 |
| Income From Investment Operations: | | | | | |
| Net investment income (loss)1 | 0.03 | (0.12) | (0.25) | (0.16) | (0.21) |
| Net realized and unrealized gain (loss) | 6.16 | 5.68 | 9.12 | 0.77 | 2.09 |
| TOTAL FROM INVESTMENT OPERATIONS | 6.19 | 5.56 | 8.87 | 0.61 | 1.88 |
| Less Distributions: | | | | | |
| Distributions from net realized gain | (2.07) | (2.09) | (0.19) | (2.03) | (5.26) |
| Net Asset Value, End of Period | $40.29 | $36.17 | $32.70 | $24.02 | $25.44 |
| Total Return2 | 17.99% | 18.15% | 37.17% | 2.35% | 7.15% |
| Ratios to Average Net Assets: | | | | | |
| Net expenses | 1.31% | 1.32% | 1.80% | 1.91%3 | 1.90%3 |
| Net investment income (loss) | 0.08% | (0.33)% | (0.91)% | (0.68)% | (0.76)% |
| Expense waiver/reimbursement4 | 0.34% | 0.37% | 0.32% | 0.31% | 0.31% |
| Supplemental Data: | | | | | |
| Net assets, end of period (000 omitted) | $120,487 | $78,387 | $47,497 | $37,850 | $39,846 |
| Portfolio turnover | 33% | 39% | 46% | 48% | 88% |
| 1 | Per share numbers have been calculated using the average shares method. |
| 2 | Based on net asset value, which does not reflect the sales charge, redemption fee or contingent deferred sales charge, if applicable. |
| 3 | The net expense ratio is calculated without reduction for expense offset arrangements. The net expense ratios are 1.91% and 1.90% for the years ended October 31, 2016 and 2015, respectively, after taking into account these expense reductions. |
| 4 | This expense decrease is reflected in both the net expense and the net investment income (loss) ratios shown above. |
See Notes which are an integral part of the Financial Statements
Annual Shareholder Report
Financial Highlights–Institutional Shares
(For a Share Outstanding Throughout Each Period)
| | Year Ended October 31, | Period
Ended
10/31/20161 |
| 2019 | 2018 | 2017 |
| Net Asset Value, Beginning of Period | $36.50 | $32.85 | $24.03 | $24.05 |
| Income From Investment Operations: | | | | |
| Net investment income (loss)2 | 0.22 | 0.04 | (0.14) | (0.05) |
| Net realized and unrealized gain (loss) | 6.21 | 5.70 | 9.15 | 0.03 |
| TOTAL FROM INVESTMENT OPERATIONS | 6.43 | 5.74 | 9.01 | (0.02) |
| Less Distributions: | | | | |
| Distributions from net realized gain | (2.07) | (2.09) | (0.19) | — |
| Net Asset Value, End of Period | $40.86 | $36.50 | $32.85 | $24.03 |
| Total Return3 | 18.51% | 18.65% | 37.74% | (0.08)% |
| Ratios to Average Net Assets: | | | | |
| Net expenses | 0.90% | 0.89% | 1.35% | 1.50%4 |
| Net investment income (loss) | 0.56% | 0.11% | (0.50)% | (0.26)%4 |
| Expense waiver/reimbursement5 | 0.12% | 0.12% | 0.10% | 0.10%4 |
| Supplemental Data: | | | | |
| Net assets, end of period (000 omitted) | $2,339,131 | $735,235 | $215,907 | $81,269 |
| Portfolio turnover | 33% | 39% | 46% | 48%6 |
| 1 | Reflects operations for the period from December 30, 2015 (start of performance) to October 31, 2016. |
| 2 | Per share numbers have been calculated using the average shares method. |
| 3 | Based on net asset value, which does not reflect the sales charge, redemption fee or contingent deferred sales charge, if applicable. Total returns for periods of less than one year are not annualized. |
| 4 | Computed on an annualized basis. |
| 5 | This expense decrease is reflected in both the net expense and the net investment income (loss) ratios shown above. |
| 6 | Portfolio turnover is calculated at the Fund level. Percentage indicated was calculated for the fiscal year ended October 31, 2016. |
See Notes which are an integral part of the Financial Statements
Annual Shareholder Report
Financial Highlights–Class R6 Shares
(For a Share Outstanding Throughout Each Period)
| | Year Ended October 31, | Period
Ended
10/31/20171 |
| 2019 | 2018 |
| Net Asset Value, Beginning of Period | $36.20 | $32.60 | $30.50 |
| Income From Investment Operations: | | | |
| Net investment income (loss)2 | 0.25 | 0.06 | (0.01) |
| Net realized and unrealized gain (loss) | 6.13 | 5.63 | 2.11 |
| TOTAL FROM INVESTMENT OPERATIONS | 6.38 | 5.69 | 2.10 |
| Less Distributions: | | | |
| Distributions from net realized gain | (2.07) | (2.09) | — |
| Net Asset Value, End of Period | $40.51 | $36.20 | $32.60 |
| Total Return3 | 18.53% | 18.64% | 6.89% |
| Ratios to Average Net Assets: | | | |
| Net expenses | 0.88% | 0.88% | 0.88%4 |
| Net investment income | 0.63% | 0.16% | (0.11)%4 |
| Expense waiver/reimbursement5 | 0.04% | 0.07% | 0.12%4 |
| Supplemental Data: | | | |
| Net assets, end of period (000 omitted) | $195,775 | $29,623 | $58 |
| Portfolio turnover | 33% | 39% | 46%6 |
| 1 | Reflects operations for the period from September 1, 2017 (start of performance) to October 31, 2017. |
| 2 | Per share numbers have been calculated using the average shares method. |
| 3 | Based on net asset value. Total returns for periods of less than one year are not annualized. |
| 4 | Computed on an annualized basis. |
| 5 | This expense decrease is reflected in both the net expense and the net investment income (loss) ratios shown above. |
| 6 | Portfolio turnover is calculated at the Fund level. Percentage indicated was calculated for the fiscal year ended October 31, 2017. |
See Notes which are an integral part of the Financial Statements
Annual Shareholder Report
Statement of Assets and Liabilities
October 31, 2019
| Assets: | | |
| Investment in securities, at value including $538,778,065 of securities loaned and including $1,205,660,730 of investment in affiliated holdings* and $231,291,467 of investment in affiliated companies* (identified cost $3,616,225,614) | | $4,256,699,751 |
| Cash denominated in foreign currencies (identified cost $4,948) | | 5,196 |
| Income receivable | | 3,028,914 |
| Income receivable from affiliated holdings | | 969,690 |
| Receivable for investments sold | | 6,581,686 |
| Receivable for shares sold | | 17,752,632 |
| TOTAL ASSETS | | 4,285,037,869 |
| Liabilities: | | |
| Payable for investments purchased | $17,861,506 | |
| Payable for shares redeemed | 2,924,691 | |
| Payable to bank | 75,977 | |
| Payable for collateral due to broker for securities lending | 561,442,637 | |
| Payable for investment adviser fee (Note 5) | 76,596 | |
| Payable for administrative fees (Note 5) | 8,020 | |
| Payable for distribution services fee (Note 5) | 292,932 | |
| Payable for other service fees (Notes 2 and 5) | 390,540 | |
| Accrued expenses (Note 5) | 597,375 | |
| TOTAL LIABILITIES | | 583,670,274 |
| Net assets for 92,147,018 shares outstanding | | $3,701,367,595 |
| Net Assets Consist of: | | |
| Paid-in capital | | $3,050,279,986 |
| Total distributable earnings (loss) | | 651,087,609 |
| TOTAL NET ASSETS | | $3,701,367,595 |
Annual Shareholder Report
Statement of Assets and Liabilities–continued
| Net Asset Value, Offering Price and Redemption Proceeds Per Share | | |
| Class A Shares: | | |
| Net asset value per share ($826,239,647 ÷ 20,610,082 shares outstanding), no par value, unlimited shares authorized | | $40.09 |
| Offering price per share (100/94.50 of $40.09) | | $42.42 |
| Redemption proceeds per share | | $40.09 |
| Class B Shares: | | |
| Net asset value per share ($15,487,738 ÷ 455,606 shares outstanding), no par value, unlimited shares authorized | | $33.99 |
| Offering price per share | | $33.99 |
| Redemption proceeds per share (94.50/100 of $33.99) | | $32.12 |
| Class C Shares: | | |
| Net asset value per share ($204,246,833 ÷ 6,005,660 shares outstanding), no par value, unlimited shares authorized | | $34.01 |
| Offering price per share | | $34.01 |
| Redemption proceeds per share (99.00/100 of $34.01) | | $33.67 |
| Class R Shares: | | |
| Net asset value per share ($120,487,280 ÷ 2,990,185 shares outstanding), no par value, unlimited shares authorized | | $40.29 |
| Offering price per share | | $40.29 |
| Redemption proceeds per share | | $40.29 |
| Institutional Shares: | | |
| Net asset value per share ($2,339,131,065 ÷ 57,252,604 shares outstanding), no par value, unlimited shares authorized | | $40.86 |
| Offering price per share | | $40.86 |
| Redemption proceeds per share | | $40.86 |
| Class R6 Shares: | | |
| Net asset value per share ($195,775,032 ÷ 4,832,881 shares outstanding), no par value, unlimited shares authorized | | $40.51 |
| Offering price per share | | $40.51 |
| Redemption proceeds per share | | $40.51 |
| * | See information listed after the Fund's Portfolio of Investments. |
See Notes which are an integral part of the Financial Statements
Annual Shareholder Report
Statement of Operations
Year Ended October 31, 2019
| Investment Income: | | | |
| Dividends (including $9,776,231 received from affiliated companies and holdings* and net of foreign taxes withheld of $299,631) | | | $25,418,513 |
| Net income on securities loaned (includes $12,002,886 received from affiliated holdings related to cash collateral balances*) | | | 11,467,587 |
| Interest | | | 255,859 |
| TOTAL INCOME | | | 37,141,959 |
| Expenses: | | | |
| Investment adviser fee (Note 5) | | $20,766,697 | |
| Administrative fee (Note 5) | | 2,062,458 | |
| Custodian fees | | 136,952 | |
| Transfer agent fee (Note 2) | | 2,616,432 | |
| Directors'/Trustees' fees (Note 5) | | 14,925 | |
| Auditing fees | | 46,290 | |
| Legal fees | | 10,808 | |
| Portfolio accounting fees | | 227,737 | |
| Distribution services fee (Note 5) | | 3,742,883 | |
| Other service fees (Notes 2 and 5) | | 2,307,092 | |
| Share registration costs | | 296,011 | |
| Printing and postage | | 127,126 | |
| Miscellaneous (Note 5) | | 49,798 | |
| TOTAL EXPENSES | | 32,405,209 | |
| Waivers and Reimbursements: | | | |
| Waiver/reimbursement of investment adviser fee (Note 5) | $(1,141,112) | | |
Waiver/reimbursement of other operating expenses
(Notes 2 and 5) | (2,234,751) | | |
| TOTAL WAIVERS AND REIMBURSEMENTS | | (3,375,863) | |
| Net expenses | | | 29,029,346 |
| Net investment income | | | 8,112,613 |
Annual Shareholder Report
Statement of Operations–continued
| Realized and Unrealized Gain (Loss) on Investments and Foreign Currency Transactions: | | | |
| Net realized gain on investments (including net realized loss of $6,459,532 on sales of investments in affiliated companies and holdings*) | | | $5,817,163 |
| Net realized gain on foreign currency transactions | | | 26,795 |
| Net change in unrealized appreciation of investments (including net change in unrealized appreciation of $26,163,621 on investments in affiliated companies and holdings*) | | | 290,766,471 |
| Net change in unrealized appreciation/depreciation of translation of assets and liabilities in foreign currency | | | 624 |
| Net realized and unrealized gain (loss) on investments and foreign currency transactions | | | 296,611,053 |
| Change in net assets resulting from operations | | | $304,723,666 |
| * | See information listed after the Fund's Portfolio of Investments. |
See Notes which are an integral part of the Financial Statements
Annual Shareholder Report
Statement of Changes in Net Assets
| Year Ended October 31 | 2019 | 2018 |
| Increase (Decrease) in Net Assets | | |
| Operations: | | |
| Net investment income (loss) | $8,112,613 | $(3,408,276) |
| Net realized gain | 5,843,958 | 94,028,384 |
| Net change in unrealized appreciation/depreciation | 290,767,095 | 47,960,052 |
| CHANGE IN NET ASSETS RESULTING FROM OPERATIONS | 304,723,666 | 138,580,160 |
| Distributions to Shareholders: | | |
| Class A Shares | (33,548,216) | (25,996,283) |
| Class B Shares | (1,064,216) | (1,246,610) |
| Class C Shares | (7,908,178) | (11,040,219) |
| Class R Shares | (5,392,467) | (3,050,351) |
| Institutional Shares | (41,694,450) | (12,832,699) |
| Class R6 Shares | (1,962,523) | (1,296,030) |
| CHANGE IN NET ASSETS RESULTING FROM DISTRIBUTIONS TO SHAREHOLDERS | (91,570,050) | (55,462,192) |
| Share Transactions: | | |
| Proceeds from sale of shares | 2,749,902,528 | 1,118,477,136 |
| Net asset value of shares issued to shareholders in payment of distributions declared | 87,265,064 | 51,860,138 |
| Cost of shares redeemed | (906,535,952) | (530,633,476) |
| CHANGE IN NET ASSETS RESULTING FROM SHARE TRANSACTIONS | 1,930,631,640 | 639,703,798 |
| Change in net assets | 2,143,785,256 | 722,821,766 |
| Net Assets: | | |
| Beginning of period | 1,557,582,339 | 834,760,573 |
| End of period | $3,701,367,595 | $1,557,582,339 |
See Notes which are an integral part of the Financial Statements
Annual Shareholder Report
Notes to Financial Statements
October 31, 2019
1. ORGANIZATION
Federated Equity Funds (the “Trust”) is registered under the Investment Company Act of 1940, as amended (the “Act”), as an open-end management investment company. The Trust consists of nine portfolios. The financial statements included herein are only those of Federated Kaufmann Small Cap Fund (the “Fund”), a diversified portfolio. The financial statements of the other portfolios are presented separately. The assets of each portfolio are segregated and a shareholder's interest is limited to the portfolio in which shares are held. Each portfolio pays its own expenses. The Fund offers six classes of shares: Class A Shares, Class B Shares, Class C Shares, Class R Shares, Institutional Shares and Class R6 Shares. All shares of the Fund have equal rights with respect to voting, except on class-specific matters. The investment objective of the Fund is to provide capital appreciation.
On March 30, 2017, the Fund's T Share class became effective with the Securities and Exchange Commission (SEC), but is not yet offered for sale.
Class B Shares are closed to new accounts, new investors and new purchases made by existing shareholders (excluding reinvestment of dividends and capital gains). Class B Shares of the Fund may be exchanged for Class B Shares of any other Federated fund.
Effective August 1, 2018, an automatic conversion feature for Class C Shares was implemented. Pursuant to this automatic conversion feature, after Class C Shares have been held for ten years from the date of purchase, they will automatically convert to Class A Shares on the next monthly conversion processing date.
2. SIGNIFICANT ACCOUNTING POLICIES
The following is a summary of significant accounting policies consistently followed by the Fund in the preparation of its financial statements. These policies are in conformity with U.S. generally accepted accounting principles (GAAP).
Investment Valuation
In calculating its net asset value (NAV), the Fund generally values investments as follows:
| ■ | Equity securities listed on an exchange or traded through a regulated market system are valued at their last reported sale price or official closing price in their principal exchange or market. |
| ■ | Shares of other mutual funds or non-exchange-traded investment companies are valued based upon their reported NAVs. |
| ■ | Fixed-income securities are fair valued using price evaluations provided by a pricing service approved by the Fund's Board of Trustees (the “Trustees”). |
| ■ | Derivative contracts listed on exchanges are valued at their reported settlement or closing price, except that options are valued at the mean of closing bid and asked quotations. |
| ■ | Over-the-counter (OTC) derivative contracts are fair valued using price evaluations provided by a pricing service approved by the Trustees. |
| ■ | For securities that are fair valued in accordance with procedures established by and under the general supervision of the Trustees, certain factors may be considered, such as: the last traded or purchase price of the security, information obtained by contacting the issuer or dealers, analysis of the issuer's financial statements or other available documents, fundamental analytical data, the nature and duration of restrictions on disposition, the movement of the market in which the security is normally traded, public trading in similar |
Annual Shareholder Report
| | securities or derivative contracts of the issuer or comparable issuers, movement of a relevant index, or other factors including but not limited to industry changes and relevant government actions. |
If any price, quotation, price evaluation or other pricing source is not readily available when the NAV is calculated, if the Fund cannot obtain price evaluations from a pricing service or from more than one dealer for an investment within a reasonable period of time as set forth in the Fund's valuation policies and procedures, or if information furnished by a pricing service, in the opinion of the valuation committee (“Valuation Committee”), is deemed not representative of the fair value of such security, the Fund uses the fair value of the investment determined in accordance with the procedures described below. There can be no assurance that the Fund could obtain the fair value assigned to an investment if it sold the investment at approximately the time at which the Fund determines its NAV per share.
Fair Valuation and Significant Events Procedures
The Trustees have ultimate responsibility for determining the fair value of investments for which market quotations are not readily available. The Trustees have appointed a Valuation Committee comprised of officers of the Fund, Federated Equity Management Company of Pennsylvania (the “Adviser”) and certain of the Adviser's affiliated companies to assist in determining fair value and in overseeing the calculation of the NAV. The Trustees have also authorized the use of pricing services recommended by the Valuation Committee to provide fair value evaluations of the current value of certain investments for purposes of calculating the NAV. The Valuation Committee employs various methods for reviewing third-party pricing-service evaluations including periodic reviews of third-party pricing services' policies, procedures and valuation methods (including key inputs, methods, models and assumptions), transactional back-testing, comparisons of evaluations of different pricing services, and review of price challenges by the Adviser based on recent market activity. In the event that market quotations and price evaluations are not available for an investment, the Valuation Committee determines the fair value of the investment in accordance with procedures adopted by the Trustees. The Trustees periodically review and approve the fair valuations made by the Valuation Committee and any changes made to the procedures.
Factors considered by pricing services in evaluating an investment include the yields or prices of investments of comparable quality, coupon, maturity, call rights and other potential prepayments, terms and type, reported transactions, indications as to values from dealers and general market conditions. Some pricing services provide a single price evaluation reflecting the bid-side of the market for an investment (a “bid” evaluation). Other pricing services offer both bid evaluations and price evaluations indicative of a price between the prices bid and asked for the investment (a “mid” evaluation). The Fund normally uses bid evaluations for any U.S. Treasury and Agency securities, mortgage-backed securities and municipal securities. The Fund normally uses mid evaluations for any other types of fixed-income securities and any OTC derivative contracts. In the event that market quotations and price evaluations are not available for an investment, the fair value of the investment is determined in accordance with procedures adopted by the Trustees.
The Trustees also have adopted procedures requiring an investment to be priced at its fair value whenever the Adviser determines that a significant event affecting the value of the investment has occurred between the time as of which the price of the investment would otherwise be determined and the time as of which the NAV is computed. An event is considered significant if there is both an affirmative expectation that the investment's value
Annual Shareholder Report
will change in response to the event and a reasonable basis for quantifying the resulting change in value. Examples of significant events that may occur after the close of the principal market on which a security is traded, or after the time of a price evaluation provided by a pricing service or a dealer, include:
| ■ | With respect to securities traded principally in foreign markets, significant trends in U.S. equity markets or in the trading of foreign securities index futures contracts; |
| ■ | Political or other developments affecting the economy or markets in which an issuer conducts its operations or its securities are traded; |
| ■ | Announcements concerning matters such as acquisitions, recapitalizations, litigation developments, or a natural disaster affecting the issuer's operations or regulatory changes or market developments affecting the issuer's industry. |
The Trustees have adopted procedures whereby the Valuation Committee uses a pricing service to provide factors to update the fair value of equity securities traded principally in foreign markets from the time of the close of their respective foreign stock exchanges to the pricing time of the Fund. For other significant events, the Fund may seek to obtain more current quotations or price evaluations from alternative pricing sources. If a reliable alternative pricing source is not available, the Fund will determine the fair value of the investment in accordance with the fair valuation procedures approved by the Trustees. The Trustees have ultimate responsibility for any fair valuations made in response to a significant event.
Repurchase Agreements
The Fund may invest in repurchase agreements for short-term liquidity purposes. It is the policy of the Fund to require the other party to a repurchase agreement to transfer to the Fund's custodian or sub-custodian eligible securities or cash with a market value (after transaction costs) at least equal to the repurchase price to be paid under the repurchase agreement. The eligible securities are transferred to accounts with the custodian or sub-custodian in which the Fund holds a “securities entitlement” and exercises “control” as those terms are defined in the Uniform Commercial Code. The Fund has established procedures for monitoring the market value of the transferred securities and requiring the transfer of additional eligible securities if necessary to equal at least the repurchase price. These procedures also allow the other party to require securities to be transferred from the account to the extent that their market value exceeds the repurchase price or in exchange for other eligible securities of equivalent market value.
The insolvency of the other party or other failure to repurchase the securities may delay the disposition of the underlying securities or cause the Fund to receive less than the full repurchase price. Under the terms of the repurchase agreement, any amounts received by the Fund in excess of the repurchase price and related transaction costs must be remitted to the other party.
The Fund may enter into repurchase agreements in which eligible securities are transferred into joint trading accounts maintained by the custodian or sub-custodian for investment companies and other clients advised by the Fund's Adviser and its affiliates. The Fund will participate on a pro rata basis with the other investment companies and clients in its share of the securities transferred under such repurchase agreements and in its share of proceeds from any repurchase or other disposition of such securities.
Annual Shareholder Report
Investment Income, Gains and Losses, Expenses and Distributions
Investment transactions are accounted for on a trade-date basis. Realized gains and losses from investment transactions are recorded on an identified-cost basis. Interest income and expenses are accrued daily. Dividend income and distributions to shareholders are recorded on the ex-dividend date. Foreign dividends are recorded on the ex-dividend date or when the Fund is informed of the ex-dividend date. Distributions of net investment income, if any, are declared and paid annually. Non-cash dividends included in dividend income, if any, are recorded at fair value. Amortization/accretion of premium and discount is included in investment income. Investment income, realized and unrealized gains and losses, and certain fund-level expenses are allocated to each class based on relative average daily net assets, except that select classes will bear certain expenses unique to those classes. The detail of the total fund expense waivers and reimbursements of $3,375,863 is disclosed in various locations in this Note 2 and Note 5. For the year ended October 31, 2019, transfer agent fees for the Fund were as follows:
| | Transfer Agent
Fees Incurred | Transfer Agent
Fees Reimbursed |
| Class A Shares | $715,688 | $(453,542) |
| Class B Shares | 19,120 | — |
| Class C Shares | 170,799 | (5,261) |
| Class R Shares | 254,686 | — |
| Institutional Shares | 1,442,344 | (1,084,108) |
| Class R6 Shares | 13,795 | — |
| TOTAL | $2,616,432 | $(1,542,911) |
Dividends are declared separately for each class. No class has preferential dividend rights; differences in per share dividend rates are generally due to differences in separate class expenses.
Other Service Fees
The Fund may pay other service fees up to 0.25% of the average daily net assets of the Fund's Class A Shares, Class B Shares and Class C Shares to unaffiliated financial intermediaries or to Federated Shareholder Services Company (FSSC) for providing services to shareholders and maintaining shareholder accounts. Financial intermediaries may include a company affiliated with management of Federated Investors, Inc. A financial intermediary affiliated with management of Federated Investors, Inc. received $3,418 of other service fees for the year ended October 31, 2019. Subject to the terms described in the Expense Limitation note, FSSC may voluntarily reimburse the Fund for other service fees. For the year ended October 31, 2019, other service fees for the Fund were as follows:
| | Other Service
Fees Incurred |
| Class A Shares | $1,857,640 |
| Class B Shares | 42,283 |
| Class C Shares | 407,169 |
| TOTAL | $2,307,092 |
Annual Shareholder Report
Federal Taxes
It is the Fund's policy to comply with the Subchapter M provision of the Internal Revenue Code and to distribute to shareholders each year substantially all of its income. Accordingly, no provision for federal income tax is necessary. As of and during the year ended October 31, 2019, the Fund did not have a liability for any uncertain tax positions. The Fund recognizes interest and penalties, if any, related to tax liabilities as income tax expense in the Statement of Operations. As of October 31, 2019, tax years 2016 through 2019 remain subject to examination by the Fund's major tax jurisdictions, which include the United States of America and the Commonwealth of Massachusetts.
The Fund may be subject to taxes imposed by governments of countries in which it invests. Such taxes are generally based on either income or gains earned or repatriated. The Fund accrues and applies such taxes to net investment income, net realized gains and net unrealized gains as income and/or gains are earned.
When-Issued and Delayed-Delivery Transactions
The Fund may engage in when-issued or delayed-delivery transactions. The Fund records when-issued securities on the trade date and maintains security positions such that sufficient liquid assets will be available to make payment for the securities purchased. Securities purchased on a when-issued or delayed-delivery basis are marked to market daily and begin earning interest on the settlement date. Losses may occur on these transactions due to changes in market conditions or the failure of counterparties to perform under the contract.
Foreign Exchange Contracts
The Fund may enter into foreign exchange contracts to manage currency and market risks. Purchased contracts are used to acquire exposure to foreign currencies, whereas, contracts to sell are used to hedge the Fund's securities against currency fluctuations. Risks may arise upon entering into these transactions from the potential inability of counterparties to meet the terms of their commitments and from unanticipated movements in security prices or foreign exchange rates. The foreign exchange contracts are adjusted by the daily exchange rate of the underlying currency and any gains or losses are recorded for financial statement purposes as unrealized until the settlement date.
At October 31, 2019, the Fund had no outstanding foreign exchange contracts.
Foreign Currency Translation
The accounting records of the Fund are maintained in U.S. dollars. All assets and liabilities denominated in foreign currencies are translated into U.S. dollars based on the rates of exchange of such currencies against U.S. dollars on the date of valuation. Purchases and sales of securities, income and expenses are translated at the rate of exchange quoted on the respective date that such transactions are recorded. The Fund does not isolate that portion of the results of operations resulting from changes in foreign exchange rates on investments from the fluctuations arising from changes in market prices of securities held. Such fluctuations are included with the net realized and unrealized gain or loss from investments.
Reported net realized foreign exchange gains or losses arise from sales of foreign currencies, currency gains or losses realized between the trade and settlement dates on securities transactions, the difference between the amounts of dividends, interest and foreign withholding taxes recorded on the Fund's books, and the U.S. dollar equivalent of the amounts actually received or paid. Net unrealized foreign exchange gains and losses arise from changes in the value of assets and liabilities other than investments in securities at period end, resulting from changes in the exchange rate.
Annual Shareholder Report
Securities Lending
The Fund participates in a securities lending program providing for the lending of equity securities to qualified brokers. The term of the loans within the program is one year or less. The Fund normally receives cash collateral for securities loaned that may be invested in affiliated money market funds, other money market instruments and/or repurchase agreements. Investments in money market funds may include funds with a “floating” NAV that can impose redemption fees and liquidity gates, impose certain operational impediments to investing cash collateral, and, if the investee fund's NAV decreases, result in the Fund recognizing losses and being required to cover the decrease in the value of the cash collateral. Collateral is maintained at a minimum level of 100% of the market value of investments loaned, plus interest, if applicable. Earnings on collateral are allocated between the borrower of the security, the securities lending agent, as a fee for its services under the program and the Fund, according to agreed-upon rates. The Fund will not have the right to vote on securities while they are on loan. However, the Fund will attempt to terminate a loan in an effort to reacquire the securities in time to vote on matters that are deemed to be material by the Adviser. There can be no assurance that the Fund will have sufficient notice of such matters to be able to terminate the loan in time to vote thereon.
Securities lending transactions are subject to Master Netting Agreements which are agreements between the Fund and its counterparties that provide for the net settlement of all transactions and collateral with the Fund, through a single payment, in the event of default or termination. Amounts presented on the Portfolio of Investments and Statement of Assets and Liabilities are not net settlement amounts but gross. As indicated below, the cash collateral received by the Fund exceeds the market value of the securities loaned reducing the net settlement amount to zero. The chart below identifies the amount of collateral received as well as the market value of securities on loan. Additionally, the securities lending agreement executed by the Fund includes an indemnification clause. This clause stipulates that the borrower will reimburse the Fund for any losses as a result of any failure of the borrower to return equivalent securities to the Fund.
As of October 31, 2019, securities subject to this type of arrangement and related collateral were as follows:
Market Value of
Securities Loaned | Collateral
Received |
| $538,778,065 | $561,442,637 |
Restricted Securities
The Fund may purchase securities which are considered restricted. Restricted securities are securities that either: (a) cannot be offered for public sale without first being registered, or being able to take advantage of an exemption from registration, under the Securities Act of 1933; or (b) are subject to contractual restrictions on public sales. In some cases, when a security cannot be offered for public sale without first being registered, the issuer of the restricted security has agreed to register such securities for resale, at the issuer's expense, either upon demand by the Fund or in connection with another registered offering of the securities. Many such restricted securities may be resold in the secondary market in transactions exempt from registration. Restricted securities may be determined to be liquid under criteria established by the Trustees. The Fund will not incur any registration costs upon such resales. The Fund's restricted securities, like other securities, are priced in accordance with procedures established by and under the general supervision of the Trustees.
Annual Shareholder Report
Other
The preparation of financial statements in conformity with GAAP requires management to make estimates and assumptions that affect the amounts of assets, liabilities, expenses and revenues reported in the financial statements. Actual results could differ from those estimated. The Fund applies investment company accounting and reporting guidance.
3. SHARES OF BENEFICIAL INTEREST
The following tables summarize share activity:
| Year Ended October 31 | 2019 | 2018 |
| Class A Shares: | Shares | Amount | Shares | Amount |
| Shares sold | 10,433,711 | $409,075,507 | 8,406,988 | $308,189,562 |
| Shares issued to shareholders in payment of distributions declared | 925,703 | 32,232,986 | 802,984 | 24,523,131 |
| Shares redeemed | (6,856,886) | (267,133,357) | (5,439,758) | (196,984,464) |
| NET CHANGE RESULTING FROM CLASS A SHARE TRANSACTIONS | 4,502,528 | $174,175,136 | 3,770,214 | $135,728,229 |
| Year Ended October 31 | 2019 | 2018 |
| Class B Shares: | Shares | Amount | Shares | Amount |
| Shares sold | 48,675 | $1,565,858 | 23,155 | $713,653 |
| Shares issued to shareholders in payment of distributions declared | 35,178 | 1,044,433 | 46,090 | 1,220,001 |
| Shares redeemed | (158,321) | (5,243,637) | (149,887) | (4,590,649) |
| NET CHANGE RESULTING FROM CLASS B SHARE TRANSACTIONS | (74,468) | $(2,633,346) | (80,642) | $(2,656,995) |
| Year Ended October 31 | 2019 | 2018 |
| Class C Shares: | Shares | Amount | Shares | Amount |
| Shares sold | 3,325,137 | $111,372,708 | 1,722,987 | $54,996,684 |
| Shares issued to shareholders in payment of distributions declared | 255,939 | 7,601,381 | 403,930 | 10,692,028 |
| Shares redeemed | (1,374,017) | (45,429,070) | (3,654,681) | (118,541,245) |
| NET CHANGE RESULTING FROM CLASS C SHARE TRANSACTIONS | 2,207,059 | $73,545,019 | (1,527,764) | $(52,852,533) |
| Year Ended October 31 | 2019 | 2018 |
| Class R Shares: | Shares | Amount | Shares | Amount |
| Shares sold | 1,986,858 | $77,421,966 | 1,143,163 | $42,649,214 |
| Shares issued to shareholders in payment of distributions declared | 151,834 | 5,311,138 | 96,233 | 2,951,475 |
| Shares redeemed | (1,315,921) | (51,269,976) | (524,569) | (18,726,535) |
| NET CHANGE RESULTING FROM CLASS R SHARE TRANSACTIONS | 822,771 | $31,463,128 | 714,827 | $26,874,154 |
Annual Shareholder Report
| Year Ended October 31 | 2019 | 2018 |
| Institutional Shares: | Shares | Amount | Shares | Amount |
| Shares sold | 49,172,262 | $1,970,878,265 | 17,500,741 | $649,741,071 |
| Shares issued to shareholders in payment of distributions declared | 1,106,785 | 39,113,796 | 362,553 | 11,177,480 |
| Shares redeemed | (13,170,325) | (516,391,968) | (4,292,060) | (159,638,558) |
| NET CHANGE RESULTING FROM INSTITUTIONAL SHARE TRANSACTIONS | 37,108,722 | $1,493,600,093 | 13,571,234 | $501,279,993 |
| Year Ended October 31 | 2019 | 2018 |
| Class R6 Shares: | Shares | Amount | Shares | Amount |
| Shares sold | 4,488,821 | $179,588,224 | 1,680,622 | $62,186,952 |
| Shares issued to shareholders in payment of distributions declared | 55,990 | 1,961,330 | 42,381 | 1,296,023 |
| Shares redeemed | (530,195) | (21,067,944) | (906,506) | (32,152,025) |
| NET CHANGE RESULTING FROM CLASS R6 SHARE TRANSACTIONS | 4,014,616 | $160,481,610 | 816,497 | $31,330,950 |
| NET CHANGE RESULTING FROM TOTAL FUND SHARE TRANSACTIONS | 48,581,228 | $1,930,631,640 | 17,264,366 | $639,703,798 |
4. FEDERAL TAX INFORMATION
The tax character of distributions as reported on the Statement of Changes in Net Assets for the years ended October 31, 2019 and 2018, was as follows:
| | 2019 | 2018 |
| Ordinary income1 | $32,292,522 | $13,746,886 |
| Long-term capital gains | $59,277,528 | $41,715,306 |
| 1 | For tax purposes, short-term capital gain distributions are considered ordinary income distributions. |
As of October 31, 2019, the components of distributable earnings on a tax-basis were as follows:
| Undistributed ordinary income | $10,324,581 |
| Net unrealized appreciation | $633,490,881 |
| Undistributed long-term capital gains | $7,272,147 |
The difference between book-basis and tax-basis net unrealized appreciation/depreciation is attributable to differing treatments for deferral of losses on wash sales, passive foreign investment company adjustments and discount accretion/premium amortization on debt securities.
At October 31, 2019, the cost of investments for federal tax purposes was $3,623,209,502. The net unrealized appreciation of investments for federal tax purposes was $633,490,249. This consists of net unrealized appreciation from investments for those securities having an excess of value over cost of $776,884,684 and net unrealized depreciation from investments for those securities having an excess of cost over value of $143,394,435.
Annual Shareholder Report
5. INVESTMENT ADVISER FEE AND OTHER TRANSACTIONS WITH AFFILIATES
Investment Adviser Fee
The advisory agreement between the Fund and the Adviser provides for an annual fee equal to 0.80% of the Fund's average daily net assets. Subject to the terms described in the Expense Limitation note, the Adviser may voluntarily choose to waive any portion of its fee and/or reimburse certain operating expenses of the Fund. For the year ended October 31, 2019, the Adviser waived $548,916 of its fee and reimbursed $1,542,911 of transfer agent fees. The Adviser has agreed to reimburse the Fund for certain investment adviser fees as a result of transactions in other affiliated investment companies. For the year ended October 31, 2019, the Adviser reimbursed $592,196.
Certain of the Fund's assets are managed by Federated Global Investment Management Corp. (the “Sub-Adviser”). Under the terms of a sub-advisory agreement between the Adviser and the Sub-Adviser, the Sub-Adviser receives an allocable portion of the Fund's adviser fee. The fee is paid by the Adviser out of its resources and is not an incremental Fund expense. For the year ended October 31, 2019, the Sub-Adviser earned a fee of $16,622,391.
Administrative Fee
Federated Administrative Services (FAS), under the Administrative Services Agreement, provides the Fund with administrative personnel and services. For purposes of determining the appropriate rate breakpoint, “Investment Complex” is defined as all of the Federated Funds subject to a fee under the Administrative Services Agreement. The fee paid to FAS is based on the average daily net assets of the Investment Complex as specified below:
| Administrative Fee | Average Daily Net Assets
of the Investment Complex |
| 0.100% | on assets up to $50 billion |
| 0.075% | on assets over $50 billion |
Subject to the terms described in the Expense Limitation note, FAS may voluntarily choose to waive any portion of its fee. For the year ended October 31, 2019, the annualized fee paid to FAS was 0.080% of average daily net assets of the Fund.
In addition, FAS may charge certain out-of-pocket expenses to the Fund.
Annual Shareholder Report
Distribution Services Fee
The Fund has adopted a Distribution Plan (the “Plan”) pursuant to Rule 12b-1 under the Act. Under the terms of the Plan, the Fund will compensate Federated Securities Corp. (FSC), the principal distributor, from the daily net assets of the Fund's Class A Shares, Class B Shares, Class C Shares and Class R Shares to finance activities intended to result in the sale of these shares. The Plan provides that the Fund may incur distribution expenses at the following percentages of average daily net assets annually, to compensate FSC:
| Share Class Name | Percentage of Average Daily
Net Assets of Class |
| Class A Shares | 0.25% |
| Class B Shares | 0.75% |
| Class C Shares | 0.75% |
| Class R Shares | 0.50% |
Subject to the terms described in the Expense Limitation note, FSC may voluntarily choose to waive any portion of its fee. For the year ended October 31, 2019, distribution services fees for the Fund were as follows:
| | Distribution Services
Fees Incurred | Distribution Services
Fees Waived |
| Class A Shares | $1,862,190 | $(372,438) |
| Class B Shares | 126,849 | — |
| Class C Shares | 1,221,508 | — |
| Class R Shares | 532,336 | (319,402) |
| TOTAL | $3,742,883 | $(691,840) |
When FSC receives fees, it may pay some or all of them to financial intermediaries whose customers purchase shares. For the year ended October 31, 2019, FSC retained $1,746,645 fees paid by the Fund.
Sales Charges
Front-end sales charges and contingent deferred sales charges (CDSC) do not represent expenses of the Fund. They are deducted from the proceeds of sales of Fund shares prior to investment or from redemption proceeds prior to remittance, as applicable. For the year ended October 31, 2019, FSC retained $347,440 in sales charges from the sale of Class A Shares. FSC also retained $15,947 and $51,548 of CDSC relating to redemptions of Class B Shares and Class C Shares, respectively.
Other Service Fees
For the year ended October 31, 2019, FSSC received $136,321 of the other service fees disclosed in Note 2.
Expense Limitation
The Adviser and certain of its affiliates (which may include FSC, FAS and FSSC) on their own initiative have agreed to waive certain amounts of their respective fees and/or reimburse expenses. Effective January 1, 2020, total annual fund operating expenses (as shown in the financial highlights, excluding extraordinary expenses and proxy-related expenses paid by the Fund, if any) paid by the Fund's Class A Shares, Class B Shares, Class C Shares, Class R
Annual Shareholder Report
Shares, Institutional Shares and Class R6 Shares (after the voluntary waivers and/or reimbursements) will not exceed 1.35%, 2.02%, 2.00%, 1.35%, 0.89% and 0.88% (the “Fee Limit”), respectively, up to but not including the later of (the “Termination Date”): (a) January 1, 2021; or (b) the date of the Fund's next effective Prospectus. While the Adviser and its applicable affiliates currently do not anticipate terminating or increasing these arrangements prior to the Termination Date, these arrangements may only be terminated or the Fee Limit increased prior to the Termination Date with the agreement of the Trustees.
Interfund Transactions
During the year ended October 31, 2019, the Fund engaged in purchase and sale transactions with funds that have a common investment adviser (or affiliated investment advisers), common Directors/Trustees and/or common Officers. These purchase and sale transactions complied with Rule 17a-7 under the Act and amounted to $45,498,829 and $4,880,330, respectively.
Directors'/Trustees' and Miscellaneous Fees
Certain Officers and Trustees of the Fund are Officers and Directors or Trustees of certain of the above companies. To efficiently facilitate payment, Independent Directors'/Trustees' fees and certain expenses related to conducting meetings of the Directors/Trustees and other miscellaneous expenses are paid by an affiliate of the Adviser which in due course are reimbursed by the Fund. These expenses related to conducting meetings of the Directors/Trustees and other miscellaneous expenses may be included in Accrued and Miscellaneous Expenses on the Statement of Assets and Liabilities and Statement of Operations, respectively.
6. INVESTMENT TRANSACTIONS
Purchases and sales of investments, excluding long-term U.S. government securities and short-term obligations, for the year ended October 31, 2019, were as follows:
| Purchases | $2,067,285,978 |
| Sales | $726,191,568 |
7. CONCENTRATION OF RISK
The Fund may invest a portion of its assets in securities of companies that are deemed by the
Fund's management to be classified in similar business sectors. Economic developments may
have an effect on the liquidity and volatility of the portfolio securities.
8. LINE OF CREDIT
The Fund participates with certain other Federated Funds, on a several basis, in an up to $500,000,000 unsecured, 364-day, committed, revolving line of credit (LOC) agreement. The LOC was made available to finance temporarily the repurchase or redemption of shares of the Fund, failed trades, payment of dividends, settlement of trades and for other short-term, temporary or emergency general business purposes. The Fund cannot borrow under the LOC if an inter-fund loan is outstanding. The Fund's ability to borrow under the LOC also is subject to the limitations of the Act and various conditions precedent that must be satisfied before the Fund can borrow. Loans under the LOC are charged interest at a fluctuating rate per annum equal to the highest, on any day, of (a) (i) the federal funds effective rate, (ii) the one month London Interbank Offered Rate (LIBOR), and (iii) 0.0%, plus (b) a margin. The LOC also
Annual Shareholder Report
requires the Fund to pay, quarterly in arrears and at maturity, its pro rata share of a commitment fee based on the amount of the lenders' commitment that has not been utilized. As of October 31, 2019, the Fund had no outstanding loans. During the year ended October 31, 2019, the Fund did not utilize the LOC.
9. INTERFUND LENDING
Pursuant to an Exemptive Order issued by the SEC, the Fund, along with other funds advised by subsidiaries of Federated Investors, Inc., may participate in an interfund lending program. This program provides an alternative credit facility allowing the Fund to borrow from other participating affiliated funds. As of October 31, 2019, there were no outstanding loans. During the year ended October 31, 2019, the program was not utilized.
10. FEDERAL TAX INFORMATION (UNAUDITED)
For the year ended October 31, 2019, the amount of long-term capital gains designated by the Fund was $59,277,528.
For the fiscal year ended October 31, 2019, 13.08% of total ordinary income (including short-term capital gain) distributions made by the Fund are qualifying dividends which may be subject to a maximum tax rate of 15%, as provided for by the Jobs and Growth Tax Relief Act of 2003. Complete information is reported in conjunction with the reporting of your distributions on Form 1099-DIV.
Of the ordinary income (including short-term capital gain) distributions made by the Fund during the year ended October 31, 2019, 9.55% qualify for the dividend received deduction available to corporate shareholders.
Annual Shareholder Report
Report of Independent Registered Public Accounting Firm
TO THE BOARD OF TRUSTEES OF FEDERATED EQUITY FUNDS AND SHAREHOLDERS OF FEDERATED KAUFMANN SMALL CAP FUND:
Opinion on the Financial Statements
We have audited the accompanying statement of assets and liabilities of Federated Kaufmann Small Cap Fund (the “Fund”) (one of the portfolios constituting Federated Equity Funds (the “Trust”)), including the portfolio of investments, as of October 31, 2019, and the related statement of operations for the year then ended, the statement of changes in net assets for each of the two years in the period then ended, the financial highlights for each of the five years in the period then ended and the related notes (collectively referred to as the “financial statements”). In our opinion, the financial statements present fairly, in all material respects, the financial position of the Fund (one of the portfolios constituting Federated Equity Funds) at October 31, 2019, the results of its operations for the year then ended, the changes in its net assets for each of the two years in the period then ended and its financial highlights for each of the five years in the period then ended, in conformity with U.S. generally accepted accounting principles.
Basis for Opinion
These financial statements are the responsibility of the Trust's management. Our responsibility is to express an opinion on the Fund's financial statements based on our audits We are a public accounting firm registered with the Public Company Accounting Oversight Board (United States) (PCAOB) and are required to be independent with respect to the Trust in accordance with the U.S. federal securities laws and the applicable rules and regulations of the Securities and Exchange Commission and the PCAOB.
We conducted our audits in accordance with standards of the PCAOB. Those standards require that we plan and perform the audit to obtain reasonable assurance about whether the financial statements are free of material misstatement, whether due to error or fraud. The Trust is not required to have, nor were we engaged to perform, an audit of the Trust's internal control over financial reporting. As part of our audits, we are required to obtain an understanding of internal control over financial reporting, but not for the purpose of expressing an opinion on the effectiveness of the Trust's internal control over financial reporting. Accordingly, we express no such opinion.
Annual Shareholder Report
Our audits included performing procedures to assess the risks of material misstatement of the financial statements, whether due to error or fraud, and performing procedures that respond to those risks. Such procedures included examining, on a test basis, evidence regarding the amounts and disclosures in the financial statements. Our procedures included confirmation of securities owned as of October 31, 2019, by correspondence with the custodian and others or by other appropriate auditing procedures where replies from others were not received. Our audits also included evaluating the accounting principles used and significant estimates made by management, as well as evaluating the overall presentation of the financial statements. We believe that our audits provide a reasonable basis for our opinion.
We have served as the auditor of one or more Federated investment companies since 1979.
Boston, Massachusetts
December 20, 2019
Annual Shareholder Report
Shareholder Expense Example (unaudited)
As a shareholder of the Fund, you incur two types of costs: (1) transaction costs, including sales charges (loads) on purchase or redemption payments; and (2) ongoing costs, including management fees and to the extent applicable, distribution (12b-1) fees and/or other service fees and other Fund expenses. This Example is intended to help you to understand your ongoing costs (in dollars) of investing in the Fund and to compare these costs with the ongoing costs of investing in other mutual funds. It is based on an investment of $1,000 invested at the beginning of the period and held for the entire period from May 1, 2019 to October 31, 2019.
ACTUAL EXPENSES
The first section of the table below provides information about actual account values and actual expenses. You may use the information in this section, together with the amount you invested, to estimate the expenses that you incurred over the period. Simply divide your account value by $1,000 (for example, an $8,600 account value divided by $1,000 = 8.6), then multiply the result by the number in the first section under the heading entitled “Expenses Paid During Period” to estimate the expenses attributable to your investment during this period.
HYPOTHETICAL EXAMPLE FOR COMPARISON PURPOSES
The second section of the table below provides information about hypothetical account values and hypothetical expenses based on the Fund's actual expense ratio and an assumed rate of return of 5% per year before expenses, which is not the Fund's actual return. Thus, you should not use the hypothetical account values and expenses to estimate the actual ending account balance or your expenses for the period. Rather, these figures are required to be provided to enable you to compare the ongoing costs of investing in the Fund with other funds. To do so, compare this 5% hypothetical example with the 5% hypothetical examples that appear in the shareholder reports of the other funds.
Annual Shareholder Report
Please note that the expenses shown in the table are meant to highlight your ongoing costs only and do not reflect any transaction costs, such as sales charges (loads) on purchase or redemption payments. Therefore, the second section of the table is useful in comparing ongoing costs only, and will not help you determine the relativetotal costs of owning different funds. In addition, if these transaction costs were included, your costs would have been higher.
| | Beginning
Account Value
5/1/2019 | Ending
Account Value
10/31/2019 | Expenses Paid
During Period1 |
| Actual: | | | |
| Class A Shares | $1,000 | $980.70 | $6.79 |
| Class B Shares | $1,000 | $977.30 | $9.87 |
| Class C Shares | $1,000 | $977.60 | $9.82 |
| Class R Shares | $1,000 | $980.50 | $6.69 |
| Institutional Shares | $1,000 | $982.90 | $4.50 |
| Class R6 Shares | $1,000 | $983.00 | $4.40 |
| Hypothetical (assuming a 5% return before expenses): | | | |
| Class A Shares | $1,000 | $1,018.30 | $6.92 |
| Class B Shares | $1,000 | $1,015.20 | $10.06 |
| Class C Shares | $1,000 | $1,015.30 | $10.01 |
| Class R Shares | $1,000 | $1,018.50 | $6.82 |
| Institutional Shares | $1,000 | $1,020.70 | $4.58 |
| Class R6 Shares | $1,000 | $1,020.80 | $4.48 |
| 1 | Expenses are equal to the Fund's annualized net expense ratios, multiplied by the average account value over the period, multiplied by 184/365 (to reflect the one-half-year period). The annualized net expense ratios are as follows: |
| | |
| Class A Shares | 1.36% |
| Class B Shares | 1.98% |
| Class C Shares | 1.97% |
| Class R Shares | 1.34% |
| Institutional Shares | 0.90% |
| Class R6 Shares | 0.88% |
Annual Shareholder Report
Board of Trustees and Trust Officers
The Board of Trustees is responsible for managing the Trust's business affairs and for exercising all the Trust's powers except those reserved for the shareholders. The following tables give information about each Trustee and the senior officers of the Fund. Where required, the tables separately list Trustees who are “interested persons” of the Fund (i.e., “Interested” Trustees) and those who are not (i.e., “Independent” Trustees). Unless otherwise noted, the address of each person listed is Federated Investors Tower, 1001 Liberty Avenue, Pittsburgh, PA 15222. The address of all Independent Trustees listed is 4000 Ericsson Drive, Warrendale, PA 15086-7561; Attention: Mutual Fund Board. As of December 31, 2018, the Trust comprised 10 portfolio(s), and the Federated Fund Family consisted of 40 investment companies (comprising 102 portfolios). Unless otherwise noted, each Officer is elected annually. Unless otherwise noted, each Trustee oversees all portfolios in the Federated Fund Family and serves for an indefinite term. The Fund's Statement of Additional Information includes additional information about Trust Trustees and is available, without charge and upon request, by calling 1-800-341-7400.
Interested Trustees Background
Name
Birth Date
Positions Held with Trust
Date Service Began | Principal Occupation(s) for Past Five Years,
Other Directorships Held and Previous Position(s) |
J. Christopher Donahue*
Birth Date: April 11, 1949
President and Trustee
Indefinite Term
Began serving: January 2000 | Principal Occupations: Principal Executive Officer and President of certain of the Funds in the Federated Fund Family; Director or Trustee of the Funds in the Federated Fund Family; President, Chief Executive Officer and Director, Federated Investors, Inc.; Chairman and Trustee, Federated Investment Management Company; Trustee, Federated Investment Counseling; Chairman and Director, Federated Global Investment Management Corp.; Chairman and Trustee, Federated Equity Management Company of Pennsylvania; Trustee, Federated Shareholder Services Company; Director, Federated Services Company.
Previous Positions: President, Federated Investment Counseling; President and Chief Executive Officer, Federated Investment Management Company, Federated Global Investment Management Corp. and Passport Research, Ltd; Chairman, Passport Research, Ltd. |
Annual Shareholder Report
Name
Birth Date
Positions Held with Trust
Date Service Began | Principal Occupation(s) for Past Five Years,
Other Directorships Held and Previous Position(s) |
John B. Fisher*
Birth Date: May 16, 1956
Trustee
Indefinite Term
Began serving: May 2016 | Principal Occupations:Principal Executive Officer and President of certain of the Funds in the Federated Fund Family; Director or Trustee of certain of the Funds in the Federated Fund Family; Vice President, Federated Investors, Inc.; President, Director/Trustee and CEO, Federated Advisory Services Company, Federated Equity Management Company of Pennsylvania, Federated Global Investment Management Corp., Federated Investment Counseling, Federated Investment Management Company; President of some of the Funds in the Federated Fund Complex and Director, Federated Investors Trust Company.
Previous Positions: President and Director of the Institutional Sales Division of Federated Securities Corp.; President and Director of Federated Investment Counseling; President and CEO of Passport Research, Ltd.; Director, Edgewood Securities Corp.; Director, Federated Services Company; Director, Federated Investors, Inc.; Chairman and Director, Southpointe Distribution Services, Inc. and President, Technology, Federated Services Company. |
| * | Reasons for “interested” status: J. Christopher Donahue and John B. Fisher are interested due to their beneficial ownership of shares of Federated Investors, Inc. and due to positions they hold with Federated and its subsidiaries. |
INDEPENDENT Trustees Background
Name
Birth Date
Positions Held with Trust
Date Service Began | Principal Occupation(s) for Past Five Years,
Other Directorships Held, Previous Position(s) and Qualifications |
John T. Collins
Birth Date: January 24, 1947
Trustee
Indefinite Term
Began serving: October 2013 | Principal Occupations: Director or Trustee of the Federated Fund Family; formerly, Chairman and CEO, The Collins Group, Inc. (a private equity firm) (Retired).
Other Directorships Held: Director, Chairman of the Compensation Committee, KLX Energy Services Holdings, Inc. (oilfield services); former Director of KLX Corp. (aerospace).
Qualifications: Mr. Collins has served in several business and financial management roles and directorship positions throughout his career. Mr. Collins previously served as Chairman and CEO of The Collins Group, Inc. (a private equity firm) and as a Director of KLX Corp. Mr. Collins serves as Chairman Emeriti, Bentley University. Mr. Collins previously served as Director and Audit Committee Member, Bank of America Corp.; Director, FleetBoston Financial Corp.; and Director, Beth Israel Deaconess Medical Center (Harvard University Affiliate Hospital). |
Annual Shareholder Report
Name
Birth Date
Positions Held with Trust
Date Service Began | Principal Occupation(s) for Past Five Years,
Other Directorships Held, Previous Position(s) and Qualifications |
G. Thomas Hough
Birth Date: February 28, 1955
Trustee
Indefinite Term
Began serving: August 2015 | Principal Occupations: Director or Trustee of the Federated Fund Family; formerly, Vice Chair, Ernst & Young LLP (public accounting firm) (Retired).
Other Directorships Held: Director, Member of Governance and Compensation Committees, Publix Super Markets, Inc.; Director, Chair of the Audit Committee, Equifax, Inc.; Director, Member of the Audit Committee, Haverty Furniture Companies, Inc.
Qualifications: Mr. Hough has served in accounting, business management and directorship positions throughout his career. Mr. Hough most recently held the position of Americas Vice Chair of Assurance with Ernst & Young LLP (public accounting firm). Mr. Hough serves on the President's Cabinet and Business School Board of Visitors for the University of Alabama and is on the Business School Board of Visitors for Wake Forest University. Mr. Hough previously served as an Executive Committee member of the United States Golf Association. |
Maureen Lally-Green
Birth Date: July 5, 1949
Trustee
Indefinite Term
Began serving: August 2009 | Principal Occupations: Director or Trustee of the Federated Fund Family; Adjunct Professor of Law, Duquesne University School of Law; formerly, Dean of the Duquesne University School of Law and Professor of Law and Interim Dean of the Duquesne University School of Law; formerly, Associate General Secretary and Director, Office of Church Relations, Diocese of Pittsburgh.
Other Directorships Held: Director, CNX Resources Corporation (formerly known as CONSOL Energy Inc.).
Qualifications: Judge Lally-Green has served in various legal and business roles and directorship positions throughout her career. Judge Lally-Green previously held the position of Dean of the School of Law of Duquesne University (as well as Interim Dean). Judge Lally-Green previously served as a member of the Superior Court of Pennsylvania and as a Professor of Law, Duquesne University School of Law. Judge Lally-Green also currently holds the positions on not for profit or for profit boards of directors as follows: Director and Chair, UPMC Mercy Hospital; Director and Vice Chair, Our Campaign for the Church Alive!, Inc.; Regent, Saint Vincent Seminary; Member, Pennsylvania State Board of Education (public); and Director CNX Resources Corporation (formerly known as CONSOL Energy Inc.). Judge Lally-Green has held the positions of: Director, Auberle; Director, Epilepsy Foundation of Western and Central Pennsylvania; Director, Ireland Institute of Pittsburgh; Director, Saint Thomas More Society; Director and Chair, Catholic High Schools of the Diocese of Pittsburgh, Inc.; Director, Pennsylvania Bar Institute; Director, St. Vincent College; and Director and Chair, North Catholic High School, Inc. |
Charles F. Mansfield, Jr.
Birth Date: April 10, 1945
Trustee
Indefinite Term
Began serving: January 1999 | Principal Occupations: Director or Trustee of the Federated Fund Family; Management Consultant and Author.
Other Directorships Held: None.
Qualifications: Mr. Mansfield has served as a Marine Corps officer and in several banking, business management, educational roles and directorship positions throughout his long career. He remains active as a Management Consultant and Author. |
Annual Shareholder Report
Name
Birth Date
Positions Held with Trust
Date Service Began | Principal Occupation(s) for Past Five Years,
Other Directorships Held, Previous Position(s) and Qualifications |
Thomas M. O'Neill
Birth Date: June 14, 1951
Trustee
Indefinite Term
Began serving: August 2006 | Principal Occupations: Director or Trustee, Chair of the Audit Committee of the Federated Fund Family; Sole Proprietor, Navigator Management Company (investment and strategic consulting).
Other Directorships Held: None.
Qualifications: Mr. O'Neill has served in several business, mutual fund and financial management roles and directorship positions throughout his career. Mr. O'Neill serves as Director, Medicines for Humanity and Director, The Golisano Children's Museum of Naples, Florida. Mr. O'Neill previously served as Chief Executive Officer and President, Managing Director and Chief Investment Officer, Fleet Investment Advisors; President and Chief Executive Officer, Aeltus Investment Management, Inc.; General Partner, Hellman, Jordan Management Co., Boston, MA; Chief Investment Officer, The Putnam Companies, Boston, MA; Credit Analyst and Lending Officer, Fleet Bank; Director and Consultant, EZE Castle Software (investment order management software); and Director, Midway Pacific (lumber). |
P. Jerome Richey
Birth Date: February 23, 1949
Trustee
Indefinite Term
Began serving: October 2013 | Principal Occupations: Director or Trustee of the Federated Fund Family; Management Consultant; Retired; formerly, Senior Vice Chancellor and Chief Legal Officer, University of Pittsburgh and Executive Vice President and Chief Legal Officer, CNX Resources Corporation (formerly known as CONSOL Energy Inc.).
Other Directorships Held: None.
Qualifications: Mr. Richey has served in several business and legal management roles and directorship positions throughout his career. Mr. Richey most recently held the positions of Senior Vice Chancellor and Chief Legal Officer, University of Pittsburgh. Mr. Richey previously served as Chairman of the Board, Epilepsy Foundation of Western Pennsylvania and Chairman of the Board, World Affairs Council of Pittsburgh. Mr. Richey previously served as Chief Legal Officer and Executive Vice President, CNX Resources Corporation (formerly known as CONSOL Energy Inc.); and Board Member, Ethics Counsel and Shareholder, Buchanan Ingersoll & Rooney PC (a law firm). |
John S. Walsh
Birth Date: November 28, 1957
Trustee
Indefinite Term
Began serving: January 1999 | Principal Occupations: Director or Trustee, and Chair of the Board of Directors or Trustees, of the Federated Fund Family; President and Director, Heat Wagon, Inc. (manufacturer of construction temporary heaters); President and Director, Manufacturers Products, Inc. (distributor of portable construction heaters); President, Portable Heater Parts, a division of Manufacturers Products, Inc.
Other Directorships Held: None.
Qualifications: Mr. Walsh has served in several business management roles and directorship positions throughout his career. Mr. Walsh previously served as Vice President, Walsh & Kelly, Inc. (paving contractors). |
Annual Shareholder Report
OFFICERS
Name
Birth Date
Address
Positions Held with Trust
Date Service Began | Principal Occupation(s) for Past Five Years
and Previous Position(s) |
Lori A. Hensler
Birth Date: January 6, 1967
TREASURER
Officer since: April 2013 | Principal Occupations: Principal Financial Officer and Treasurer of the Federated Fund Family; Senior Vice President, Federated Administrative Services; Financial and Operations Principal for Federated Securities Corp. and Edgewood Services, Inc.; and Assistant Treasurer, Federated Investors Trust Company. Ms. Hensler has received the Certified Public Accountant designation.
Previous Positions: Controller of Federated Investors, Inc.; Senior Vice President and Assistant Treasurer, Federated Investors Management Company; Treasurer, Federated Investors Trust Company; Assistant Treasurer, Federated Administrative Services, Federated Administrative Services, Inc., Federated Securities Corp., Edgewood Services, Inc., Federated Advisory Services Company, Federated Equity Management Company of Pennsylvania, Federated Global Investment Management Corp., Federated Investment Counseling, Federated Investment Management Company, Passport Research, Ltd., and Federated MDTA, LLC; Financial and Operations Principal for Federated Securities Corp., Edgewood Services, Inc. and Southpointe Distribution Services, Inc. |
Peter J. Germain
Birth Date: September 3, 1959
CHIEF LEGAL OFFICER, SECRETARY and EXECUTIVE VICE PRESIDENT
Officer since: January 2005 | Principal Occupations: Mr. Germain is Chief Legal Officer, Secretary and Executive Vice President of the Federated Fund Family. He is General Counsel, Chief Legal Officer, Secretary and Executive Vice President, Federated Investors, Inc.; Trustee and Senior Vice President, Federated Investors Management Company; Trustee and President, Federated Administrative Services; Director and President, Federated Administrative Services, Inc.; Director and Vice President, Federated Securities Corp.; Director and Secretary, Federated Private Asset Management, Inc.; Secretary, Federated Shareholder Services Company; and Secretary, Retirement Plan Service Company of America. Mr. Germain joined Federated in 1984 and is a member of the Pennsylvania Bar Association.
Previous Positions: Deputy General Counsel, Special Counsel, Managing Director of Mutual Fund Services, Federated Investors, Inc.; Senior Vice President, Federated Services Company; and Senior Corporate Counsel, Federated Investors, Inc. |
Stephen Van Meter
Birth Date: June 5, 1975
CHIEF COMPLIANCE OFFICER AND SENIOR VICE PRESIDENT
Officer since: July 2015 | Principal Occupations: Senior Vice President and Chief Compliance Officer of the Federated Fund Family; Vice President and Chief Compliance Officer of Federated Investors, Inc. and Chief Compliance Officer of certain of its subsidiaries. Mr. Van Meter joined Federated in October 2011. He holds FINRA licenses under Series 3, 7, 24 and 66.
Previous Positions: Mr. Van Meter previously held the position of Compliance Operating Officer, Federated Investors, Inc. Prior to joining Federated, Mr. Van Meter served at the United States Securities and Exchange Commission in the positions of Senior Counsel, Office of Chief Counsel, Division of Investment Management and Senior Counsel, Division of Enforcement. |
Annual Shareholder Report
Name
Birth Date
Address
Positions Held with Trust
Date Service Began | Principal Occupation(s) for Past Five Years
and Previous Position(s) |
Stephen F. Auth
Birth Date: September 13, 1956
101 Park Avenue
41st Floor
New York, NY 10178
CHIEF INVESTMENT OFFICER
Officer since: November 2002 | Principal Occupations: Stephen F. Auth is Chief Investment Officer of various Funds in the Federated Fund Family; Executive Vice President, Federated Investment Counseling, Federated Global Investment Management Corp. and Federated Equity Management Company of Pennsylvania.
Previous Positions: Executive Vice President, Federated Investment Management Company and Passport Research, Ltd. (investment advisory subsidiary of Federated); Senior Vice President, Global Portfolio Management Services Division; Senior Vice President, Federated Investment Management Company and Passport Research, Ltd.; Senior Managing Director and Portfolio Manager, Prudential Investments. |
Annual Shareholder Report
Evaluation and Approval of Advisory Contract–May 2019
Federated Kaufmann Small Cap Fund (the “Fund”)
At its meetings in May 2019, the Fund's Board of Trustees (the “Board”), including a majority of those Trustees who are not “interested persons” of the Fund, as defined in the Investment Company Act of 1940 (the “Independent Trustees”), reviewed and unanimously approved the continuation of the Fund's investment advisory and subadvisory contracts for an additional one-year term. The Board's decision regarding these contracts reflects the exercise of its business judgment after considering all of the information received on whether to continue the existing arrangements.
At the request of the Independent Trustees, the Fund's Chief Compliance Officer (the CCO) furnished to the Board in advance of its May 2019 meetings an independent written evaluation presenting on the topics discussed below. The Board considered the CCO's independent written evaluation (the “CCO Fee Evaluation Report”), along with other information, in evaluating the reasonableness of the Fund's management fee and in deciding to approve the continuation of the investment advisory and subadvisory contracts. The CCO, in preparing the CCO Fee Evaluation Report, has the authority to retain consultants, experts or staff as reasonably necessary to assist in the performance of his duties, reports directly to the Board, and can be terminated only with the approval of a majority of the Independent Trustees. At the request of the Independent Trustees, the CCO Fee Evaluation Report followed the same general approach and covered the same topics as that of the report that had previously been delivered by the CCO in his capacity as “Senior Officer,” prior to the elimination of the Senior Officer position in December 2017.
The Board also considered judicial decisions concerning allegedly excessive investment advisory fees in making its decision. Using these judicial decisions as a guide, the Board observed that the following factors may be relevant to an adviser's fiduciary duty with respect to its receipt of compensation from a fund: (1) the nature and quality of the services provided by an adviser to a fund and its shareholders (including the performance of the fund, its benchmark, and comparable funds); (2) an adviser's cost of providing the services (including the profitability to an adviser of providing advisory services to a fund); (3) the extent to which an adviser may realize “economies of scale” as a fund grows larger and, if such economies of scale exist, whether they have been shared with a fund and its shareholders or the family of funds; (4) any “fall-out” financial benefits that accrue to an adviser because of its relationship with a fund (including research services received from brokers that execute fund trades and any fees paid to affiliates of an adviser for services rendered to a fund); (5) comparative fee and expense structures (including a comparison of fees paid to an adviser with those paid by similar funds both internally and externally as well as management fees charged to institutional and other advisory clients of the
Annual Shareholder Report
adviser or its affiliates for what might be viewed as like services); and (6) the extent of care, conscientiousness and independence with which the fund's board members perform their duties and their expertise (including whether they are fully informed about all facts the board deems relevant to its consideration of an adviser's services and fees). The Board noted that the Securities and Exchange Commission (SEC) disclosure requirements regarding the basis for the Board's approval of the Fund's investment advisory and subadvisory contracts generally align with the factors listed above. The Board was aware of these factors and was guided by them in its review of the Fund's investment advisory and subadvisory contracts to the extent it considered them to be appropriate and relevant, as discussed further below.
The Board considered and weighed these factors in light of its substantial accumulated experience in governing the Fund and working with Federated Equity Management Company of Pennsylvania (the “Adviser”) and its affiliates (collectively, “Federated”) on matters relating to the funds advised by Federated (each, a “Federated Fund”). The Independent Trustees were assisted in their deliberations by independent legal counsel.
In addition to the extensive materials that comprise and accompany the CCO Fee Evaluation Report, the Board received detailed information about the Fund and the Federated organization throughout the year, and in connection with its May meetings at which the Board's formal approval of the advisory and subadvisory contracts occurred. In this regard, Federated provided much of this information at each regular meeting of the Board, and furnished additional information specifically in connection with the May meetings. In the months preceding the May meetings, the Board requested and reviewed written materials prepared by Federated in response to requests on behalf of the Independent Trustees encompassing a wide variety of topics. At the May meetings, in addition to meeting in separate sessions of the Independent Trustees without management present, senior management of the Adviser also met with the Independent Trustees and their counsel to discuss the materials presented and such additional matters as the Independent Trustees deemed reasonably necessary to evaluate the advisory and subadvisory contracts. Between regularly scheduled meetings, the Board also received information on particular matters as the need arose.
The Board's consideration of the investment advisory and subadvisory contracts included review of the CCO Fee Evaluation Report, accompanying data and additional information covering the following matters, among others: the Adviser's and sub-adviser's investment philosophy, revenue, profitability, personnel and processes; investment and operating strategies; the Fund's short-term and long-term performance (in absolute terms, both on a gross basis and net of expenses, as well as in terms relative to its particular investment program and certain competitor or “peer group” funds and/or other benchmarks, as appropriate) and comments on the reasons for performance; the Fund's investment objectives; the Fund's expenses, including the advisory fee and the
Annual Shareholder Report
overall expense structure of the Fund (both in absolute terms and relative to similar and/or competing funds), with due regard for contractual or voluntary expense limitations; the use and allocation of brokerage commissions derived from trading the Fund's portfolio securities (if any); and the nature, quality and extent of the advisory and other services provided to the Fund by the Adviser and its affiliates. The Board also considered the preferences and expectations of Fund shareholders; the entrepreneurial and other risks assumed by the Adviser in sponsoring the Fund; the continuing state of competition in the mutual fund industry and market practices; the range of comparable fees for similar funds in the mutual fund industry; the Fund's relationship to the Federated Funds which include a comprehensive array of funds with different investment objectives, policies and strategies which are generally available for exchange without the incurrence of additional sales charges; compliance and audit reports concerning the Federated Funds and the Federated companies that service them (including communications from regulatory agencies), as well as Federated's responses to any issues raised therein; and relevant developments in the mutual fund industry and how the Federated Funds and/or Federated are responding to them. The Board also considered that the longevity and experience of the Fund's portfolio management team and their extensive bottom-up approach to investing may limit the utility of comparisons to other equity mutual funds. The Board's evaluation process is evolutionary. The criteria considered and the emphasis placed on relevant criteria change in recognition of changing circumstances in the mutual fund marketplace.
While mindful that courts have cautioned against giving too much weight to comparative information concerning fees charged by other advisers for managing funds with comparable investment programs, the Board has found the use of such comparisons to be relevant to its deliberations. In this regard, the Board was presented with, and considered, information regarding the contractual advisory fee rates, net advisory fee rates, total expense ratios and each element of the Fund's total expense ratio (i.e., gross and net advisory fees, custody fees, portfolio accounting fees and transfer agency fees) relative to an appropriate group of peer funds compiled by Federated using data supplied by independent fund ranking organizations (the “Peer Group”). The Board received a description of the composition and methodology used to select the Peer Group. The Board focused on comparisons with other similar mutual funds more heavily than non-mutual fund products or services because it is believed that they are more relevant. For example, other mutual funds are the products most like the Fund, in that they are readily available to Fund shareholders as alternative investment vehicles. Also, they are the type of investment vehicle, in fact, chosen and maintained by the Fund's investors. The range of their fees and expenses, therefore, appears to be a relevant indicator of what consumers have found to be reasonable in the marketplace in which the Fund competes.
Annual Shareholder Report
The Board reviewed the contractual advisory fee rate, net advisory fee rate and other expenses of the Fund and noted the position of the Fund's fee rates relative to its Peer Group. In this regard, the Board noted that the contractual advisory fee rate was above the median of the relevant Peer Group, but the Board noted the applicable waivers and reimbursements, and that the overall expense structure of the Fund remained competitive in the context of other factors considered by the Board. The CCO noted that, in 2018, while the Fund's expenses were above median relative to its Peer Group, those fees remained reasonable in light of its extensive bottom-up investment process, the relative expense of that process, the resulting estimated profitability of the Fund over time, and the performance generated over time compared to its Peer Group.
For comparison, the CCO reviewed the fees charged by Federated for providing advisory services to products other than the Federated Funds (e.g., institutional separate accounts and third-party unaffiliated mutual funds for which Federated serves as sub-adviser) (referenced to as “Comparable Funds/Accounts”). With respect to Comparable Funds/Accounts other than third-party mutual funds, the CCO concluded that they are inherently different products. Those differences include, but are not limited to, different types of targeted investors different applicable laws and regulations; different legal structures; different average account sizes and portfolio management techniques made necessary by different cash flows and different associated costs; and the time spent by portfolio managers and their teams, as well as personnel in the Funds Financial Services, Legal, Compliance and Risk Management departments, in reviewing securities pricing, addressing different administrative responsibilities, addressing different degrees of risk associated with management and a variety of different costs. The CCO also reviewed the differences in the nature of the services required for Federated to manage its proprietary mutual fund business versus managing a discrete pool of assets as a sub-adviser to another institution's mutual fund, and that Federated generally performs significant additional services and assumes substantially greater risks in managing the Fund and other Federated Funds than in its role as sub-adviser to an unaffiliated third-party mutual fund. The CCO did not consider the fees for providing advisory services to Comparable Funds/Accounts to be determinative in judging the appropriateness of the Federated Funds' advisory fees.
Following such evaluation, and full deliberations, the Board concluded that the fees and expenses of the Fund are reasonable and supported renewal of the Fund's investment advisory and subadvisory contracts.
The Board considered the nature, extent and quality of the services provided to the Fund by the Adviser and the resources of the Adviser and its affiliates dedicated to the Fund. In this regard, the Board evaluated, among other things, the Adviser's personnel, experience, track record, financial resources, overall reputation and willingness to invest in personnel and infrastructure that benefit the Fund. In addition, the Board reviewed the qualifications, backgrounds and
Annual Shareholder Report
responsibilities of the portfolio management team primarily responsible for the day-to-day management of the Fund and the Adviser's ability and experience in attracting and retaining qualified personnel to service the Fund. The Board noted the investment research and company engagement capabilities of the Adviser and its affiliates. The Board also noted the compliance program of the Adviser and the compliance-related resources provided to the Fund by the Adviser, including the Adviser's commitment to respond to rulemaking initiatives of the SEC. The Fund's ability to deliver competitive performance when compared to its Peer Group was also deemed to be relevant by the Board as a useful indicator of how the Adviser is executing the Fund's investment program. The Adviser's ability to execute this program was one of the Board's considerations in reaching a conclusion that the nature, extent and quality of the Adviser's investment management services warrant the continuation of the investment advisory and subadvisory contracts.
In evaluating the Fund's investment performance, the Board considered performance results in light of the Fund's investment objective, strategies and risks, as disclosed in the Fund's prospectus. The Board considered detailed investment reports on the Fund's performance that were provided to the Board throughout the year and in connection with the May meetings. The CCO also reviewed information regarding the performance of other mutual funds in the Peer Group, noting the CCO's view that comparisons to fund peer groups may be helpful, though not conclusive, in evaluating the performance of the Adviser in managing the Fund. The Board considered, in evaluating such comparisons, that in some cases there may be differences in the funds' objectives or investment management techniques, or the costs to implement the funds, even within the same Peer Group.
For the one-year, three-year and five-year periods covered by the CCO Fee Evaluation Report, the Fund's performance was above the median of the relevant Peer Group.
Following such evaluation and full deliberations, the Board concluded that the performance of the Fund supported renewal of the Fund's investment advisory and subadvisory contracts.
The Board also received financial information about Federated, including information regarding the compensation and ancillary (or “fall-out”) benefits Federated derived from its relationships with the Federated Funds. This information covered not only the fees under the investment advisory contracts, but also fees received by Federated's subsidiaries for providing other services to the Federated Funds under separate contracts (e.g., for serving as the Federated Funds' administrator and distributor). In this regard, the Board considered that certain Federated subsidiaries provide distribution and shareholder services to the Federated Funds, for which they may be compensated through distribution and servicing fees paid pursuant to Rule 12b-1 plans or otherwise. The information also detailed any indirect benefit Federated may derive from its receipt of research services from brokers who execute Federated Fund trades. In
Annual Shareholder Report
addition, the Board considered the fact that, in order for a Federated Fund to be competitive in the marketplace, the Adviser and its affiliates frequently waived fees and/or reimbursed expenses and have disclosed to Federated Fund investors and/or indicated to the Board their intention to do so in the future. Moreover, the Board receives regular reporting as to the institution, adjustment or elimination of these voluntary waivers. The Board considered Federated's previous reductions in contractual management fees to certain Federated Funds in response to the CCO's recommendations in the prior year's CCO Fee Evaluation Report.
In 2017, the Board approved a reduction of 50 basis points in the contractual advisory fee.
Federated furnished information, requested by the CCO, that reported revenues on a fund-by-fund basis and made estimates of the allocation of expenses on a fund-by-fund basis, using allocation methodologies specified by the CCO. The CCO noted that, while these cost allocation reports apply consistent allocation processes, the inherent difficulties in allocating costs continues to cause the CCO to question the precision of the process and to conclude that such reports may be unreliable, since a single change in an allocation estimate may dramatically alter the resulting estimate of cost and/or profitability of a Federated Fund and may produce unintended consequences. The allocation information, including the CCO's view that fund-by-fund estimations may be unreliable, was considered in the evaluation by the Board.
The Board and the CCO also reviewed information compiled by Federated comparing its profitability information to other publicly held fund management companies, including information regarding profitability trends over time. In this regard, the CCO concluded that Federated's profit margins did not appear to be excessive. The CCO also noted that Federated appeared financially sound, with the resources necessary to fulfill its obligations under its contracts with the Fund.
The CCO Fee Evaluation Report also discussed the notion of possible realization of “economies of scale” as a fund grows larger, the difficulties of calculating economies of scale at an individual fund level, and the extent to which potential scale benefits are shared with shareholders. In this regard, the Board considered that the Adviser has made significant and long-term investments in areas that support all of the Federated Funds, such as personnel and processes for the portfolio management, shareholder services, compliance, internal audit and risk management functions, as well as systems technology (including technology relating to cybersecurity) and that the benefits of these investments (as well as any economies of scale, should they exist) were likely to be shared with the Federated Fund family as a whole. The Board noted that Federated's investments in these areas are extensive. In addition, the Board considered that the Adviser and its affiliates have frequently waived fees and/or reimbursed expenses and that this has allowed potential economies of scale to be shared with shareholders. The Board also considered that such waivers and
Annual Shareholder Report
reimbursements can provide protection from an increase in expenses if a Federated Fund's assets decline. Federated, as it does throughout the year, and specifically in connection with the Board's review of the advisory and subadvisory contracts, furnished information relative to revenue sharing or adviser-paid fees. Federated and the CCO noted that this information should be viewed to determine if there was an incentive to either not apply breakpoints, or to apply breakpoints at higher levels, and should not be viewed to determine the appropriateness of advisory fees. The Board also noted the absence of any applicable regulatory or industry guidelines on this subject, which (as discussed in the CCO Fee Evaluation Report) is compounded by the lack of any common industry practice or general pattern with respect to structuring fund advisory fees with “breakpoints” that serve to reduce the fee as a fund attains a certain size.
The CCO stated that his observations and the information accompanying the CCO Fee Evaluation Report supported a finding by the Board that the management fee for the Fund was reasonable. Under these circumstances, no changes were recommended to, and no objection was raised to, the continuation of the Fund's investment advisory and subadvisory contracts. The CCO also recognized that the Board's evaluation of the Federated Funds' advisory and subadvisory arrangements is a continuing and on-going process that is informed by the information that the Board requests and receives from management throughout the course of the year and, in this regard, the CCO noted certain items for future reporting to the Board or further consideration by management as the Board continues its on-going oversight of the Federated Funds.
In its decision to continue an existing investment advisory contract, the Board was mindful of the potential disruptions of the Fund's operations and various risks, uncertainties and other effects that could occur as a result of a decision to terminate or not renew an investment advisory contract. In particular, the Board recognized that many shareholders have invested in the Fund on the strength of the Adviser's industry standing and reputation and with the expectation that the Adviser will have a continuing role in providing advisory services to the Fund. Thus, the Board's approval of the advisory and subadvisory contracts reflected the fact that it is the shareholders who have effectively selected the Adviser by virtue of having invested in the Fund. The Board concluded that, in light of the factors summarized above, including the nature, quality and scope of the services provided to the Fund by the Adviser and its affiliates, continuation of the investment advisory and subadvisory contracts were appropriate.
Annual Shareholder Report
The Board based its decision to approve the investment advisory and subadvisory contracts on the totality of the circumstances and relevant factors and with a view to past and future long-term considerations. Not all of the factors and considerations identified above were necessarily relevant to the Fund, nor did the Board consider any one of them to be determinative. With respect to the factors that were relevant, the Board's decision to approve the continuation of the contracts reflects its view that Federated's performance and actions provided a satisfactory basis to support the decision to continue the existing arrangements.
Annual Shareholder Report
Voting Proxies on Fund Portfolio Securities
A description of the policies and procedures that the Fund uses to determine how to vote proxies, if any, relating to securities held in the Fund's portfolio is available, without charge and upon request, by calling 1-800-341-7400. A report on “Form N-PX” of how the Fund voted any such proxies during the most recent 12-month period ended June 30 is available via the Proxy Voting Record (Form N-PX) link associated with the Fund and share class name at www.FederatedInvestors.com/FundInformation. Form N-PX filings are also available at the SEC's website at www.sec.gov.
Quarterly Portfolio Schedule
Each fiscal quarter, the Fund will file with the SEC a complete schedule of its monthly portfolio holdings on “Form N-PORT.” The Fund's holdings as of the end of the third month of every fiscal quarter, as reported on Form N-PORT, will be publicly available on the SEC's website at www.sec.gov within 60 days of the end of the fiscal quarter upon filing. You may also access this information via the link to the Fund and share class name at www.FederatedInvestors.com.
Annual Shareholder Report
Mutual funds are not bank deposits or obligations, are not guaranteed by any bank and are not insured or guaranteed by the U.S. government, the Federal Deposit Insurance Corporation, the Federal Reserve Board or any other government agency. Investment in mutual funds involves investment risk, including the possible loss of principal.
This Report is authorized for distribution to prospective investors only when preceded or accompanied by the Fund's Prospectus, which contains facts concerning its objective and policies, management fees, expenses and other information.
Federated Kaufmann Small Cap Fund
Federated Investors Funds
4000 Ericsson Drive
Warrendale, PA 15086-7561
Contact us at FederatedInvestors.com
or call 1-800-341-7400.
Federated Securities Corp., Distributor
CUSIP 314172636
CUSIP 314172628
CUSIP 314172610
CUSIP 314172537
CUSIP 31421N402
CUSIP 31421N683
29503 (12/19)
Federated is a registered trademark of Federated Investors, Inc.
2019 ©Federated Investors, Inc.
Annual Shareholder Report
October 31, 2019
| Share Class | Ticker | A | FGSAX | C | FGSCX | Institutional | FGSIX | R6 | FGSKX |
Federated MDT Mid Cap Growth Fund
Fund Established 1984
A Portfolio of Federated Equity Funds
IMPORTANT NOTICE REGARDING REPORT DELIVERY
Beginning on January 1, 2021, as permitted by regulations adopted by the Securities and Exchange Commission, paper copies of the Fund's shareholder reports like this one will no longer be sent by mail, unless you specifically request paper copies of the reports from the Fund or from your financial intermediary, such as a broker-dealer or bank. Instead, the reports will be made available on a website, and you will be notified by mail each time a report is posted and provided with a website link to access the report.
If you already elected to receive shareholder reports electronically, you will not be affected by this change and you need not take any action. You may elect to receive shareholder reports and other communications from the Fund or your financial intermediary electronically by contacting your financial intermediary (such as a broker-dealer or bank); other shareholders may call the Fund at 1-800-341-7400, Option 4.
You may elect to receive all future reports in paper free of charge. You can inform the Fund or your financial intermediary that you wish to continue receiving paper copies of your shareholder reports by contacting your financial intermediary (such as a broker-dealer or bank); other shareholders may call the Fund at 1-800-341-7400, Option 4. Your election to receive reports in paper will apply to all funds held with the Fund complex or your financial intermediary.
Not FDIC Insured ■ May Lose Value ■ No Bank Guarantee
J. Christopher
Donahue
President
Federated MDT Mid Cap Growth Fund
Letter from the President
Dear Valued Shareholder,
I am pleased to present the Annual Shareholder Report for your fund covering the period from November 1, 2018 through October 31, 2019. This report includes Management's Discussion of Fund Performance, a complete listing of your fund's holdings, performance information and financial statements along with other important fund information.
In addition, our website, FederatedInvestors.com, offers easy access to Federated resources that include timely fund updates, economic and market insights from our investment strategists, and financial planning tools.
Thank you for investing with Federated. I hope you find this information useful and look forward to keeping you informed.
Sincerely,
J. Christopher Donahue, President
CONTENTS
| 1 |
| 7 |
| 8 |
| 13 |
| 17 |
| 19 |
| 20 |
| 21 |
| 31 |
| 33 |
| 35 |
| 41 |
| 48 |
| 48 |
Management's Discussion of Fund Performance (unaudited)
The total return of Federated MDT Mid Cap Growth Fund (the “Fund”), based on net asset value for the 12-month reporting period ended October 31, 2019, was 13.40% for the Class A Shares, 12.54% for the Class C Shares, 13.71% for the Institutional Shares and 13.72% for the Class R6 Shares. The total return of the Russell Midcap® Growth Index (RMCGI),1,2 the Fund's broad-based securities market index, was 18.93% for the same period. The total return of the Morningstar Mid Cap Growth Funds Average (MMCGFA),3 a peer group average for the Fund, was 14.13% during the reporting period. The Fund's and the MMCGFA's total returns for the most recently completed fiscal year reflected actual cash flows, transaction costs and other expenses which were not reflected in the total return of the RMCGI.
During the reporting period, the Fund's investment strategy focused on stock selection, which was the most significant factor affecting the Fund's performance relative to the RMCGI.
The following discussion will focus on the performance of the Fund's Institutional Shares.
MARKET OVERVIEW
During the reporting period, the markets favored large-cap stocks over small-cap stocks and growth stocks over value stocks. Large-cap stocks either outperformed or were very close to small-cap stocks in every month except February 2019, when the small-cap Russell 2000® Index (R2000)4 led the large- and mid-cap Russell 1000® Index (R1000)5 by 1.81%. Over the course of the reporting period, the R1000 Index returned 14.15% while the R2000 returned only 4.90%. While value staged a comeback in September 2019, growth dominated the year with the Russell 3000® Growth Index (R3000G)6 returning 16.34% while the Russell 3000® Value Index (R3000V)7 returned 10.65%. The outperformance of large stocks relative to small stocks seemed primarily driven by the tariff war, while the continued outperformance of growth over value seemed to reflect reduced optimism in the overall economy driving buyers away from more conservative value companies. The highest performing of the core domestic Russell indices was, in fact, the benchmark for this product, the RMCGI (18.93%), which benefitted from both large-cap over small-cap (the mid-cap range is contained within the larger cap R1000) and growth over value.
The best-performing sectors in the RMCGI during the reporting period were Real Estate (36.12%), Information Technology (26.77%) and Materials (23.48%). Underperforming sectors during the same period included Energy (-17.45%), Communication Services (-0.44%) and Health Care (9.39%).
Annual Shareholder Report
STOCK SELECTION
Stock selection was the biggest contributor to the Fund's underperformance relative to the RMCGI during the reporting period. The Fund looked for stocks with the specific combinations of fundamental and technical factors that internal research has shown to predict outperformance relative to the RMCGI. In this reporting period, the Fund's holdings with prices near 52-week highs detracted the most from Fund performance. Additional negative contribution in this growth-oriented period came from stocks with high structural earnings, a more value-oriented characteristic. A partial favorable offset came from mid-cap growth stocks chosen for their depressed prices and low external financing needs.
The Fund's sector exposures remained close to RMCGI weights. Favorable stock selection in the Consumer Discretionary and Communication Services sectors contributed the most to the Fund's performance. Poor stock selection in the Information Technology, Health Care and Materials sectors detracted the most from the Fund's performance.
Individual stocks enhancing the Fund's performance included Veeva Systems Inc. (Class A), Xilinx, Inc. and Global Payments Inc. Individual stocks detracting from the Fund's performance during the reporting period included Lam Research Corporation, Urban Outfitters, Inc. and Advanced Micro Devices, Inc. Urban Outfitters underperformed the benchmark and was overweighted by the Fund, while Lam Research Corporation and Advanced Micro Devices, Inc. outperformed the benchmark, but were underweighted by the Fund.
| 1 | Please see the footnotes to the line graphs below for definitions of, and further information about, the RMCGI. |
| 2 | Mid-Capitalization companies often have narrower markets and limited managerial and financial resources compared to larger and more established companies. |
| 3 | Please see the footnotes to the line graphs below for definitions of, and further information about, the MMCGFA. |
| 4 | The Russell 2000® Index measures the performance of the small-cap segment of the U.S. equity universe. The Russell 2000® Index is a subset of the Russell 3000® Index. It includes approximately 2000 of the smallest securities based on a combination of their market cap and current index membership. The Russell 2000® is constructed to provide a comprehensive and unbiased small-cap barometer and is completely reconstituted annually to ensure larger stocks do not distort the performance and characteristics of the true small-cap opportunity set. |
| 5 | The Russell 1000® Index measures the performance of the large-cap segment of the U.S. equity universe. It is a subset of the Russell 3000® Index and includes approximately 1000 of the largest securities based on a combination of their market cap and current index membership. The Russell 1000 represents approximately 92% of the U.S. market. The Russell 1000 Index is constructed to provide a comprehensive and unbiased barometer for the large-cap segment and is completely reconstituted annually to ensure new and growing equities are reflected. |
| 6 | The Russell 3000® Growth Index measures the performance of the broad growth segment of the U.S. equity universe. It includes those Russell 3000® Index companies with higher price-to-book ratios and higher forecasted growth values. The Russell 3000® Growth Index is constructed to provide a comprehensive, unbiased and stable barometer of the broad growth market. The Russell 3000® Growth Index is completely reconstituted annually to ensure new and growing equities are included and that the represented companies continue to reflect growth characteristics.* |
Annual Shareholder Report
| 7 | The Russell 3000® Value Index measures the performance of the broad value segment of the U.S. equity value universe. It includes those Russell 3000® Index companies with lower price-to-book ratios and lower forecasted growth values. The Russell 3000® Value Index is constructed to provide a comprehensive, unbiased and stable barometer of the broad value market. The Russell 3000® Value Index is completely reconstituted annually to ensure new and growing equities are included and that the represented companies continue to reflect value characteristics.* |
| * | The index is unmanaged, and it is not possible to invest directly in an index. |
Annual Shareholder Report
FUND PERFORMANCE AND GROWTH OF A $10,000 INVESTMENT
The graph below illustrates the hypothetical investment of $10,0001 in the Federated MDT Mid Cap Growth Fund2 from October 31, 2009 to October 31, 2019, compared to the Russell Midcap® Growth Index (RMCGI)3 and the Morningstar Mid Cap Growth Funds Average (MMCGFA).4 The Average Annual Total Return table below shows returns for each class averaged over the stated periods.
Growth of a $10,000 Investment
Growth of $10,000 as of October 31, 2019
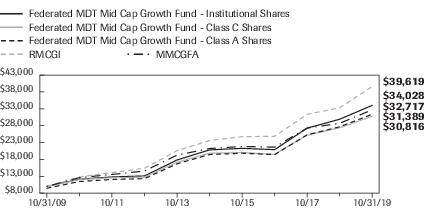
| Federated MDT Mid Cap Growth Fund - | Institutional Shares | Class C Shares | Class A Shares | RMCGI | MMCGFA |
| F | F | F | I | I |
| 10/31/2009 | 10,000 | 10,000 | 9,450 | 10,000 | 10,000 |
| 10/31/2010 | 12,147 | 12,036 | 11,462 | 12,803 | 12,594 |
| 10/31/2011 | 12,806 | 12,567 | 12,053 | 14,094 | 13,543 |
| 10/31/2012 | 13,109 | 12,736 | 12,308 | 15,375 | 14,572 |
| 10/31/2013 | 17,834 | 17,150 | 16,701 | 20,592 | 19,273 |
| 10/31/2014 | 20,830 | 19,836 | 19,457 | 23,596 | 21,235 |
| 10/31/2015 | 21,287 | 20,070 | 19,838 | 24,761 | 21,847 |
| 10/31/2016 | 20,902 | 19,512 | 19,428 | 24,861 | 21,644 |
| 10/31/2017 | 27,280 | 25,219 | 25,295 | 31,386 | 27,299 |
| 10/31/2018 | 29,918 | 27,383 | 27,681 | 33,313 | 28,715 |
| 10/31/2019 | 34,028 | 30,816 | 31,389 | 39,619 | 32,717 |
41 graphic description end -->
| ■ | Total returns shown for the Class C Shares include the maximum contingent deferred sales charge of 1.00% as applicable. |
| ■ | Total returns shown for the Class A Shares include the maximum sales charge of 5.50% ($10,000 investment minus $550 sales charge = $9,450). |
The Fund offers multiple share classes whose performance may be greater than or less than its other share class(es) due to differences in sales charges and expenses. See the Average Annual Total Return table below for the returns of additional classes not shown in the line graph above.
Annual Shareholder Report
Average Annual Total Returnsfor the Period Ended 10/31/2019
(returns reflect all applicable sales charges and contingent deferred sales charges as specified below in footnote #1)
| | 1 Year | 5 Years | 10 Years |
| Class A Shares | 7.15% | 8.80% | 12.12% |
| Class C Shares | 11.61% | 9.21% | 11.91% |
| Institutional Shares2 | 13.71% | 10.31% | 13.03% |
| Class R6 Shares5 | 13.72% | 10.02% | 12.47% |
| RMCGI | 18.93% | 10.92% | 14.76% |
| MMCGFA | 14.13% | 9.49% | 13.18% |
Performance data quoted represents past performance which is no guarantee of future results. Investment return and principal value will fluctuate so that an investor's shares, when redeemed, may be worth more or less than their original cost. Mutual fund performance changes over time and current performance may be lower or higher than what is stated. For current to the most recent month-end performance and after-tax returns, visit FederatedInvestors.com or call 1-800-341-7400. Returns shown do not reflect the deduction of taxes that a shareholder would pay on Fund distributions or the redemption of Fund shares. Mutual funds are not obligations of or guaranteed by any bank and are not federally insured.
| 1 | Represents a hypothetical investment of $10,000 in the Fund after deducting applicable sales charges: for Class A Shares, the maximum sales charge of 5.50% ($10,000 investment minus $550 sales charge = $9,450); for Class C Shares, the maximum contingent deferred sales charge is 1.00% on any redemption less than one year from the purchase date. The Fund's performance assumes the reinvestment of all dividends and distributions. The RMCGI and the MMCGFA have been adjusted to reflect reinvestment of dividends on securities in the index and average. |
| 2 | The Fund's Institutional Shares commenced operations on January 29, 2010. For the period prior to the commencement of operations of the Institutional Shares, the performance information shown is for the Fund's Class A Shares. The performance of the Class A Shares has not been adjusted to reflect the expenses of the Institutional Shares since the Institutional Shares have a lower expense ratio than the expense ratio of the Class A Shares. The performance of Class A Shares has been adjusted to remove any voluntary waiver of Fund expenses that may have occurred during the period prior to the commencement of operations of the Institutional Shares. |
Annual Shareholder Report
| 3 | The RMCGI measures the performance of the mid-cap growth segment of the U.S. equity universe. It includes those Russell Midcap® Index companies with higher price-to-book ratios and higher forecasted growth values. The RMCGI is constructed to provide a comprehensive and unbiased barometer of the mid-cap growth market and is completely reconstituted annually to ensure larger stocks do not distort the performance and characteristics of the true mid-cap growth market. The RMCGI is not adjusted to reflect sales loads, expenses or other fees that the Securities and Exchange Commission (SEC) requires to be reflected in the Fund's performance. The index is unmanaged and unlike the Fund, is not affected by cash flows. It is not possible to invest directly in an index. |
| 4 | Morningstar figures represent the average of the total returns reported by all the funds designated by Morningstar as falling into the respective category indicated. They do not reflect sales charges. The Morningstar figures in the Growth of $10,000 line graph are based on historical return information published by Morningstar and reflect the return of the funds comprising the category in the year of publication. Because the funds designated by Morningstar as falling into the category can change over time, the Morningstar figures in the line graph may not match the Morningstar figures in the Average Annual Total Returns table, which reflect the return of the funds that currently comprise the category. |
| 5 | Prior to September 1, 2016, Class R6 Shares were known as Class R Shares and included 12b-1 fees and certain other expenses. As of September 1, 2016, Class R6 does not include such 12b-1 fees and certain other expenses, and the performance shown above for Class R6 prior to September 1, 2016, reflects the higher Class R expenses. |
Annual Shareholder Report
Portfolio of Investments Summary Table (unaudited)
At October 31, 2019, the Fund's sector composition1 was as follows:
| Sector Composition | Percentage of
Total Net Assets |
| Information Technology | 33.5% |
| Consumer Discretionary | 16.5% |
| Industrials | 16.1% |
| Health Care | 13.5% |
| Communication Services | 5.1% |
| Financials | 3.8% |
| Materials | 3.8% |
| Real Estate | 2.7% |
| Consumer Staples | 2.6% |
| Energy | 0.6% |
| Securities Lending Collateral2 | 0.2% |
| Cash Equivalents3 | 1.9% |
| Other Assets and Liabilities—Net4 | (0.3)% |
| TOTAL | 100.0% |
| 1 | Except for Cash Equivalents, Securities Lending Collateral and Other Assets and Liabilities, sector classifications are based upon, and individual portfolio securities are assigned to, the classifications of the Global Industry Classification Standard (GICS) except that the Adviser assigns a classification to securities not classified by the GICS and to securities for which the Adviser does not have access to the classification made by the GICS. |
| 2 | Represents cash collateral received for portfolio securities on loan that may be invested in affiliated money market funds, other money market instruments and/or repurchase agreements. |
| 3 | Cash Equivalents include any investments in money market mutual funds and/or overnight repurchase agreements other than those representing cash collateral for securities lending. |
| 4 | Assets, other than investments in securities, less liabilities. See Statement of Assets and Liabilities. |
Annual Shareholder Report
Portfolio of Investments
October 31, 2019
| Shares | | | Value |
| | | COMMON STOCKS—98.2% | |
| | | Communication Services—5.1% | |
| 117,453 | 1 | AMC Networks, Inc. | $5,115,078 |
| 69,882 | 1 | Live Nation Entertainment, Inc. | 4,926,681 |
| 27,118 | | Omnicom Group, Inc. | 2,093,239 |
| 78,219 | 1 | Take-Two Interactive Software, Inc. | 9,413,657 |
| 55,496 | 1 | TripAdvisor, Inc. | 2,242,038 |
| 137,725 | 1 | Twitter, Inc. | 4,127,618 |
| | | TOTAL | 27,918,311 |
| | | Consumer Discretionary—16.5% | |
| 2,090 | 1 | AutoZone, Inc. | 2,391,754 |
| 24,441 | 1 | Bright Horizons Family Solutions, Inc. | 3,629,977 |
| 25,025 | 1 | Burlington Stores, Inc. | 4,809,054 |
| 1,875 | 1 | Chipotle Mexican Grill, Inc. | 1,459,050 |
| 31,092 | | Dollar General Corp. | 4,985,291 |
| 178,636 | | Dunkin' Brands Group, Inc. | 14,044,362 |
| 73,990 | | Expedia Group, Inc. | 10,111,473 |
| 74,300 | 1,2 | GNC Holdings, Inc. | 196,152 |
| 26,641 | | Hasbro, Inc. | 2,592,436 |
| 92,472 | | Hilton Worldwide Holdings, Inc. | 8,966,085 |
| 5,008 | | Lennar Corp., Class A | 298,477 |
| 39,965 | 1 | Lululemon Athletica, Inc. | 8,163,651 |
| 380 | 1 | O'Reilly Automotive, Inc. | 165,494 |
| 9,519 | 1 | Skechers USA, Inc., Class A | 355,725 |
| 123,524 | 1 | Tempur Sealy International, Inc. | 11,234,508 |
| 31,247 | | The Wendy's Co. | 661,812 |
| 181,170 | 1 | Under Armour, Inc., Class A | 3,741,161 |
| 285,064 | | Wyndham Destinations, Inc. | 13,229,820 |
| | | TOTAL | 91,036,282 |
| | | Consumer Staples—2.6% | |
| 97,274 | | Church and Dwight, Inc. | 6,803,343 |
| 35,755 | | Hershey Foods Corp. | 5,251,337 |
| 50,882 | | Nu Skin Enterprises, Inc., Class A | 2,268,320 |
| | | TOTAL | 14,323,000 |
| | | Energy—0.6% | |
| 101,691 | | Continental Resources, Inc. | 2,996,834 |
Annual Shareholder Report
| Shares | | | Value |
| | | COMMON STOCKS—continued | |
| | | Financials—3.8% | |
| 63,443 | | Citizens Financial Group, Inc. | $2,230,656 |
| 3,287 | 1 | Credit Acceptance Corp. | 1,439,081 |
| 12,896 | | Discover Financial Services | 1,035,033 |
| 12,420 | | LPL Investment Holdings, Inc. | 1,004,033 |
| 9,538 | | MSCI, Inc., Class A | 2,237,233 |
| 69,868 | | RenaissanceRe Holdings Ltd. | 13,077,892 |
| | | TOTAL | 21,023,928 |
| | | Health Care—13.5% | |
| 7,583 | 1 | Align Technology, Inc. | 1,913,115 |
| 76,740 | 1 | Alkermes, Inc. | 1,498,732 |
| 84,511 | | AmerisourceBergen Corp. | 7,215,549 |
| 47,600 | | Bruker Corp. | 2,118,200 |
| 10,713 | | Cerner Corp. | 719,057 |
| 16,897 | 1 | Charles River Laboratories International, Inc. | 2,196,272 |
| 15,446 | | Chemed Corp. | 6,084,334 |
| 62,252 | 1 | Exelixis, Inc. | 961,793 |
| 93,642 | 1 | Hologic, Inc. | 4,523,845 |
| 13,200 | 1 | IDEXX Laboratories, Inc. | 3,762,132 |
| 39,782 | 1 | IQVIA Holdings, Inc. | 5,745,317 |
| 103,825 | 1 | Incyte Genomics, Inc. | 8,712,994 |
| 23,816 | 1 | Insulet Corp. | 3,460,941 |
| 41,168 | 1 | Jazz Pharmaceuticals PLC. | 5,171,936 |
| 23,981 | 1 | Masimo Corp. | 3,496,190 |
| 1,400 | 1 | Mettler-Toledo International, Inc. | 986,916 |
| 31,010 | 1 | Molina Healthcare, Inc. | 3,648,016 |
| 2,378 | 1 | Seattle Genetics, Inc. | 255,397 |
| 8,453 | | Teleflex, Inc. | 2,936,657 |
| 64,969 | 1 | Veeva Systems, Inc. | 9,214,553 |
| | | TOTAL | 74,621,946 |
| | | Industrials—16.1% | |
| 62,289 | | Alaska Air Group, Inc. | 4,324,725 |
| 2,356 | | Armstrong World Industries, Inc. | 220,357 |
| 10,743 | | Cintas Corp. | 2,886,322 |
| 45,833 | 1 | Copart, Inc. | 3,787,639 |
| 22,215 | 1 | CoStar Group, Inc. | 12,207,587 |
| 134,909 | | Heico Corp. | 16,639,676 |
| 26,299 | | Ingersoll-Rand PLC | 3,337,080 |
| 92,593 | 1 | Jet Blue Airways Corp. | 1,787,045 |
Annual Shareholder Report
| Shares | | | Value |
| | | COMMON STOCKS—continued | |
| | | Industrials—continued | |
| 384,426 | | KAR Auction Services, Inc. | $9,556,830 |
| 53,716 | | L3Harris Technologies, Inc. | 11,082,148 |
| 45,462 | | MSC Industrial Direct Co. | 3,328,273 |
| 35,233 | | Pitney Bowes, Inc. | 155,025 |
| 107,189 | | R.R. Donnelley & Sons Co. | 467,344 |
| 74,455 | | Robert Half International, Inc. | 4,264,038 |
| 5,582 | 1 | Transdigm Group, Inc. | 2,937,695 |
| 141,900 | | TransUnion | 11,723,778 |
| | | TOTAL | 88,705,562 |
| | | Information Technology—33.5% | |
| 70,370 | 1 | Akamai Technologies, Inc. | 6,087,005 |
| 78,482 | 1 | Ansys, Inc. | 17,277,812 |
| 186,221 | | Booz Allen Hamilton Holding Corp. | 13,104,372 |
| 28,177 | | CDW Corp. | 3,604,120 |
| 188,345 | 1 | Cadence Design Systems, Inc. | 12,308,346 |
| 82,862 | 1 | CoreLogic, Inc. | 3,355,082 |
| 23,390 | 1 | EPAM Systems, Inc. | 4,115,704 |
| 4,839 | | Entegris, Inc. | 232,272 |
| 12,899 | 1 | F5 Networks, Inc. | 1,858,488 |
| 9,512 | 1 | Fair Isaac & Co., Inc. | 2,892,029 |
| 70,988 | 1 | Fiserv, Inc. | 7,534,666 |
| 14,411 | 1 | FleetCor Technologies, Inc. | 4,240,004 |
| 43,385 | 1 | Fortinet, Inc. | 3,538,481 |
| 121,622 | | Global Payments, Inc. | 20,576,010 |
| 47,187 | | KLA Corp. | 7,976,491 |
| 75,526 | 1 | Keysight Technologies, Inc. | 7,621,329 |
| 812 | | Lam Research Corp. | 220,085 |
| 18,904 | | LogMeIn, Inc. | 1,241,615 |
| 74,473 | 1 | Manhattan Associates, Inc. | 5,581,751 |
| 73,523 | | Motorola, Inc. | 12,228,345 |
| 65,992 | | Paychex, Inc. | 5,519,571 |
| 36,207 | 1 | Paycom Software, Inc. | 7,658,867 |
| 19,587 | 1,2 | Proofpoint, Inc. | 2,259,752 |
| 14,489 | 1 | RingCentral, Inc. | 2,340,263 |
| 37,017 | 1 | Synopsys, Inc. | 5,025,058 |
| 11,204 | 1 | Tyler Technologies, Inc. | 3,008,498 |
| 57,740 | | Universal Display Corp. | 11,558,393 |
| 905 | 1 | Verisign, Inc. | 171,968 |
Annual Shareholder Report
| Shares | | | Value |
| | | COMMON STOCKS—continued | |
| | | Information Technology—continued | |
| 59,529 | 1 | WEX, Inc. | $11,261,696 |
| | | TOTAL | 184,398,073 |
| | | Materials—3.8% | |
| 179,524 | 1 | Axalta Coating Systems Ltd. | 5,294,163 |
| 97,385 | | Grace (W.R.) & Co. | 6,471,233 |
| 2,456 | | Martin Marietta Materials | 643,251 |
| 10,684 | | Royal Gold, Inc. | 1,233,361 |
| 67,576 | | Scotts Miracle-Gro Co. | 6,783,955 |
| 11,801 | | Sealed Air Corp. | 492,928 |
| 1,142 | | Vulcan Materials Co. | 163,157 |
| | | TOTAL | 21,082,048 |
| | | Real Estate—2.7% | |
| 62,603 | | SBA Communications, Corp. | 15,065,412 |
| | | TOTAL COMMON STOCKS
(IDENTIFIED COST $507,905,142) | 541,171,396 |
| | | INVESTMENT COMPANIES—2.1% | |
| 820,447 | | Federated Government Obligations Fund, Premier Shares, 1.75%3 | 820,447 |
| 10,531,576 | | Federated Institutional Prime Value Obligations Fund, Institutional Shares, 1.93%3 | 10,534,735 |
| | | TOTAL INVESTMENT COMPANIES
(IDENTIFIED COST $11,353,972) | 11,355,182 |
| | | TOTAL INVESTMENT IN SECURITIES—100.3%
(IDENTIFIED COST $519,259,114)4 | 552,526,578 |
| | | OTHER ASSETS AND LIABILITIES - NET—(0.3)%5 | (1,436,251) |
| | | TOTAL NET ASSETS—100% | $551,090,327 |
Annual Shareholder Report
Affiliated fund holdings are investment companies which are managed by the Adviser or an affiliate of the Adviser. Transactions with affiliated fund holdings during the period ended October 31, 2019, were as follows:
| | Federated
Government
Obligations Fund,
Premier Shares* | Federated
Institutional
Prime Value
Obligations Fund,
Institutional Shares | Total of
Affiliated
Transactions |
| Balance of Shares Held 10/31/2018 | 1,554,170 | 7,344,861 | 8,899,031 |
| Purchases/Additions | 62,748,827 | 158,495,517 | 221,244,344 |
| Sales/Reductions | (63,482,550) | (155,308,802) | (218,791,352) |
| Balance of Shares Held 10/31/2019 | 820,447 | 10,531,576 | 11,352,023 |
| Value | $820,447 | $10,534,735 | $11,355,182 |
| Change in Unrealized Appreciation/Depreciation | N/A | $(578) | $(578) |
| Net Realized Gain/(Loss) | N/A | $2,995 | $2,995 |
| Dividend Income | $64,305 | $242,146 | $306,451 |
| * | All or a portion of the balance/activity for the fund relates to cash collateral received on securities lending transactions. |
| 1 | Non-income-producing security. |
| 2 | All or a portion of these securities are temporarily on loan to unaffiliated broker/dealers. |
| 3 | 7-day net yield. |
| 4 | The cost of investments for federal tax purposes amounts to $520,455,312. |
| 5 | Assets, other than investments in securities, less liabilities. See Statement of Assets and Liabilities. |
Note: The categories of investments are shown as a percentage of total net assets at October 31, 2019.
Various inputs are used in determining the value of the Fund's investments. These inputs are summarized in the three broad levels listed below:
Level 1—quoted prices in active markets for identical securities.
Level 2—other significant observable inputs (including quoted prices for similar securities, interest rates, prepayment speeds, credit risk, etc.). Also includes securities valued at amortized cost.
Level 3—significant unobservable inputs (including the Fund's own assumptions in determining the fair value of investments).
The inputs or methodology used for valuing securities are not an indication of the risk associated with investing in those securities.
As of October 31, 2019, all investments of the Fund utilized Level 1 inputs in valuing the Fund's assets carried at fair value.
See Notes which are an integral part of the Financial Statements
Annual Shareholder Report
Financial Highlights–Class A Shares
(For a Share Outstanding Throughout Each Period)
| Year Ended October 31 | 2019 | 2018 | 2017 | 2016 | 2015 |
| Net Asset Value, Beginning of Period | $41.35 | $43.07 | $33.37 | $42.50 | $48.23 |
| Income From Investment Operations: | | | | | |
| Net investment income (loss)1 | (0.07) | (0.14) | (0.04) | 0.05 | (0.03) |
| Net realized and unrealized gain (loss) | 4.77 | 3.92 | 10.06 | (0.77) | 1.01 |
| TOTAL FROM INVESTMENT OPERATIONS | 4.70 | 3.78 | 10.02 | (0.72) | 0.98 |
| Less Distributions: | | | | | |
| Distributions from net investment income | — | — | (0.02) | — | (0.07) |
| Distributions from net realized gain | (4.85) | (5.50) | (0.30) | (8.41) | (6.64) |
| TOTAL DISTRIBUTIONS | (4.85) | (5.50) | (0.32) | (8.41) | (6.71) |
| Net Asset Value, End of Period | $41.20 | $41.35 | $43.07 | $33.37 | $42.50 |
| Total Return2 | 13.40% | 9.43% | 30.20% | (2.07)% | 1.96% |
| Ratios to Average Net Assets: | | | | | |
| Net expenses | 1.14% | 1.22% | 1.22% | 1.22% | 1.22% |
| Net investment income (loss) | (0.18)% | (0.33)% | (0.10)% | 0.16% | (0.08)% |
| Expense waiver/reimbursement3 | 0.11% | 0.06% | 0.10% | 0.11% | 0.07% |
| Supplemental Data: | | | | | |
| Net assets, end of period (000 omitted) | $257,818 | $238,586 | $236,955 | $206,210 | $246,414 |
| Portfolio turnover | 179% | 171% | 109% | 115% | 122% |
| 1 | Per share numbers have been calculated using the average shares method. |
| 2 | Based on net asset value, which does not reflect the sales charge, redemption fee or contingent deferred sales charge, if applicable. |
| 3 | This expense decrease is reflected in both the net expense and the net investment income (loss) ratios shown above. |
See Notes which are an integral part of the Financial Statements
Annual Shareholder Report
Financial Highlights–Class C Shares
(For a Share Outstanding Throughout Each Period)
| Year Ended October 31 | 2019 | 2018 | 2017 | 2016 | 2015 |
| Net Asset Value, Beginning of Period | $29.12 | $32.11 | $25.12 | $34.27 | $40.36 |
| Income From Investment Operations: | | | | | |
| Net investment income (loss)1 | (0.25) | (0.33) | (0.25) | (0.15) | (0.30) |
| Net realized and unrealized gain (loss) | 3.10 | 2.84 | 7.54 | (0.59) | 0.85 |
| TOTAL FROM INVESTMENT OPERATIONS | 2.85 | 2.51 | 7.29 | (0.74) | 0.55 |
| Less Distributions: | | | | | |
| Distributions from net realized gain | (4.85) | (5.50) | (0.30) | (8.41) | (6.64) |
| Net Asset Value, End of Period | $27.12 | $29.12 | $32.11 | $25.12 | $34.27 |
| Total Return2 | 12.54% | 8.58% | 29.25% | (2.78)% | 1.18% |
| Ratios to Average Net Assets: | | | | | |
| Net expenses | 1.88% | 1.97% | 1.97% | 1.97% | 1.97% |
| Net investment income (loss) | (0.94)% | (1.09)% | (0.85)% | (0.60)% | (0.83)% |
| Expense waiver/reimbursement3 | 0.16% | 0.08% | 0.12% | 0.13% | 0.09% |
| Supplemental Data: | | | | | |
| Net assets, end of period (000 omitted) | $15,460 | $10,619 | $10,613 | $9,188 | $11,509 |
| Portfolio turnover | 179% | 171% | 109% | 115% | 122% |
| 1 | Per share numbers have been calculated using the average shares method. |
| 2 | Based on net asset value, which does not reflect the sales charge, redemption fee or contingent deferred sales charge, if applicable. |
| 3 | This expense decrease is reflected in both the net expense and the net investment income (loss) ratios shown above. |
See Notes which are an integral part of the Financial Statements
Annual Shareholder Report
Financial Highlights–Institutional Shares
(For a Share Outstanding Throughout Each Period)
| Year Ended October 31 | 2019 | 2018 | 2017 | 2016 | 2015 |
| Net Asset Value, Beginning of Period | $42.48 | $44.01 | $34.09 | $43.14 | $48.88 |
| Income From Investment Operations: | | | | | |
| Net investment income (loss)1 | 0.04 | (0.05) | 0.07 | 0.14 | 0.08 |
| Net realized and unrealized gain (loss) | 4.93 | 4.02 | 10.25 | (0.78) | 1.01 |
| TOTAL FROM INVESTMENT OPERATIONS | 4.97 | 3.97 | 10.32 | (0.64) | 1.09 |
| Less Distributions: | | | | | |
| Distributions from net investment income | — | — | (0.10) | — | (0.19) |
| Distributions from net realized gain | (4.85) | (5.50) | (0.30) | (8.41) | (6.64) |
| TOTAL DISTRIBUTIONS | (4.85) | (5.50) | (0.40) | (8.41) | (6.83) |
| Net Asset Value, End of Period | $42.60 | $42.48 | $44.01 | $34.09 | $43.14 |
| Total Return2 | 13.71% | 9.69% | 30.52% | (1.81)% | 2.19% |
| Ratios to Average Net Assets: | | | | | |
| Net expenses | 0.84% | 0.95% | 0.97% | 0.97% | 0.97% |
| Net investment income (loss) | 0.10% | (0.12)% | 0.19% | 0.41% | 0.19% |
| Expense waiver/reimbursement3 | 0.21% | 0.07% | 0.11% | 0.07% | 0.05% |
| Supplemental Data: | | | | | |
| Net assets, end of period (000 omitted) | $246,222 | $177,959 | $24,559 | $40,057 | $49,554 |
| Portfolio turnover | 179% | 171% | 109% | 115% | 122% |
| 1 | Per share numbers have been calculated using the average shares method. |
| 2 | Based on net asset value. |
| 3 | This expense decrease is reflected in both the net expense and the net investment income (loss) ratios shown above. |
See Notes which are an integral part of the Financial Statements
Annual Shareholder Report
Financial Highlights–Class R6 Shares
(For a Share Outstanding Throughout Each Period)
| Year Ended October 31 | 2019 | 2018 | 2017 | 2016 | 2015 |
| Net Asset Value, Beginning of Period | $38.95 | $40.80 | $31.53 | $40.74 | $46.63 |
| Income From Investment Operations: | | | | | |
| Net investment income (loss)1 | 0.01 | (0.03) | 0.04 | (0.07) | (0.23) |
| Net realized and unrealized gain (loss) | 4.48 | 3.68 | 9.53 | (0.73) | 0.98 |
| TOTAL FROM INVESTMENT OPERATIONS | 4.49 | 3.65 | 9.57 | (0.80) | 0.75 |
| Less Distributions: | | | | | |
| Distributions from net realized gain | (4.85) | (5.50) | (0.30) | (8.41) | (6.64) |
| Net Asset Value, End of Period | $38.59 | $38.95 | $40.80 | $31.53 | $40.74 |
| Total Return2 | 13.72% | 9.67% | 30.54% | (2.42)% | 1.49% |
| Ratios to Average Net Assets: | | | | | |
| Net expenses | 0.83% | 0.95% | 0.96% | 1.61% | 1.69% |
| Net investment income (loss) | 0.03% | (0.08)% | 0.12% | (0.22)% | (0.55)% |
| Expense waiver/reimbursement3 | 0.11% | 0.02% | 0.04% | 0.05% | 0.01% |
| Supplemental Data: | | | | | |
| Net assets, end of period (000 omitted) | $31,590 | $6,576 | $37,815 | $1,529 | $1,831 |
| Portfolio turnover | 179% | 171% | 109% | 115% | 122% |
| 1 | Per share numbers have been calculated using the average shares method. |
| 2 | Based on net asset value. |
| 3 | This expense decrease is reflected in both the net expense and the net investment income (loss) ratios shown above. |
See Notes which are an integral part of the Financial Statements
Annual Shareholder Report
Statement of Assets and Liabilities
October 31, 2019
| Assets: | | |
| Investment in securities, at value including $772,878 of securities loaned and including $11,355,182 of investment in affiliated holdings* (identified cost $519,259,114) | | $552,526,578 |
| Income receivable | | 78,285 |
| Income receivable from affiliated holdings | | 14,280 |
| Receivable for investments sold | | 4,739,182 |
| Receivable for shares sold | | 491,527 |
| TOTAL ASSETS | | 557,849,852 |
| Liabilities: | | |
| Payable for investments purchased | $4,867,307 | |
| Payable for shares redeemed | 699,673 | |
| Payable to bank | 9,634 | |
| Payable for collateral due to broker for securities lending | 820,447 | |
| Payable for investment adviser fee (Note 5) | 9,660 | |
| Payable for administrative fees (Note 5) | 1,193 | |
| Payable for distribution services fee (Note 5) | 9,626 | |
| Payable for other service fees (Notes 2 and 5) | 131,138 | |
| Accrued expenses (Note 5) | 210,847 | |
| TOTAL LIABILITIES | | 6,759,525 |
| Net assets for 13,426,541 shares outstanding | | $551,090,327 |
| Net Assets Consist of: | | |
| Paid-in capital | | $478,312,771 |
| Total distributable earnings (loss) | | 72,777,556 |
| TOTAL NET ASSETS | | $551,090,327 |
Annual Shareholder Report
Statement of Assets and Liabilities–continued
| Net Asset Value, Offering Price and Redemption Proceeds Per Share | | |
| Class A Shares: | | |
| Net asset value per share ($257,818,160 ÷ 6,258,382 shares outstanding), no par value, unlimited shares authorized | | $41.20 |
| Offering price per share (100/94.50 of $41.20) | | $43.60 |
| Redemption proceeds per share | | $41.20 |
| Class C Shares: | | |
| Net asset value per share ($15,459,763 ÷ 569,988 shares outstanding), no par value, unlimited shares authorized | | $27.12 |
| Offering price per share | | $27.12 |
| Redemption proceeds per share (99.00/100 of $27.12) | | $26.85 |
| Institutional Shares: | | |
| Net asset value per share ($246,222,075 ÷ 5,779,621 shares outstanding), no par value, unlimited shares authorized | | $42.60 |
| Offering price per share | | $42.60 |
| Redemption proceeds per share | | $42.60 |
| Class R6 Shares: | | |
| Net asset value per share ($31,590,329 ÷ 818,550 shares outstanding), no par value, unlimited shares authorized | | $38.59 |
| Offering price per share | | $38.59 |
| Redemption proceeds per share | | $38.59 |
* See information listed after the Fund's Portfolio of Investments.
See Notes which are an integral part of the Financial Statements
Annual Shareholder Report
Statement of Operations
Year Ended October 31, 2019
| Investment Income: | | | |
| Dividends (including $242,146 received from an affiliated holding*) | | | $4,927,984 |
| Net income on securities loaned (includes $64,305 earned from an affiliated holding* related to cash collateral balances) (Note 2) | | | 5,930 |
| TOTAL INCOME | | | 4,933,914 |
| Expenses: | | | |
| Investment adviser fee (Note 5) | | $3,903,186 | |
| Administrative fee (Note 5) | | 413,344 | |
| Custodian fees | | 51,124 | |
| Transfer agent fee (Note 2) | | 587,971 | |
| Directors'/Trustees' fees (Note 5) | | 3,988 | |
| Auditing fees | | 28,021 | |
| Legal fees | | 10,320 | |
| Portfolio accounting fees | | 138,517 | |
| Distribution services fee (Note 5) | | 107,191 | |
| Other service fees (Notes 2 and 5) | | 663,457 | |
| Share registration costs | | 97,553 | |
| Printing and postage | | 52,296 | |
| Miscellaneous (Note 5) | | 32,107 | |
| TOTAL EXPENSES | | 6,089,075 | |
| Waiver and Reimbursements: | | | |
| Waiver/reimbursement of investment adviser fee (Note 5) | $(577,213) | | |
| Reimbursement of other operating expenses (Notes 2 and 5) | (226,447) | | |
| TOTAL WAIVER AND REIMBURSEMENTS | | (803,660) | |
| Net expenses | | | 5,285,415 |
| Net investment income (loss) | | | (351,501) |
| Realized and Unrealized Gain (Loss) on Investments: | | | |
| Net realized gain on investments (including net realized gain of $2,995 on sales of investments in an affiliated holding*) | | | 42,795,896 |
| Net change in unrealized appreciation of investments (including net change in unrealized appreciation of $(578) on investments in an affiliated holdings*) | | | 19,748,104 |
| Net realized and unrealized gain (loss) on investments | | | 62,544,000 |
| Change in net assets resulting from operations | | | $62,192,499 |
| * | See information listed after the Fund's Portfolio of Investments. |
See Notes which are an integral part of the Financial Statements
Annual Shareholder Report
Statement of Changes in Net Assets
| Year Ended October 31 | 2019 | 2018 |
| Increase (Decrease) in Net Assets | | |
| Operations: | | |
| Net investment income (loss) | $(351,501) | $(1,082,623) |
| Net realized gain | 42,795,896 | 49,027,641 |
| Net change in unrealized appreciation/depreciation | 19,748,104 | (25,235,359) |
| CHANGE IN NET ASSETS RESULTING FROM OPERATIONS | 62,192,499 | 22,709,659 |
| Distributions to Shareholders: | | |
| Class A Shares | (27,927,985) | (29,965,706) |
| Class B Shares1 | — | (327,239) |
| Class C Shares | (1,861,401) | (1,804,338) |
| Institutional Shares | (18,505,100) | (3,136,146) |
| Class R6 Shares | (1,015,627) | (5,071,489) |
| CHANGE IN NET ASSETS RESULTING FROM DISTRIBUTIONS TO SHAREHOLDERS | (49,310,113) | (40,304,918) |
| Share Transactions: | | |
| Proceeds from sale of shares | 243,475,009 | 225,133,373 |
| Net asset value of shares issued to shareholders in payment of distributions declared | 45,303,236 | 37,448,217 |
| Cost of shares redeemed | (184,311,036) | (123,138,168) |
| CHANGE IN NET ASSETS RESULTING FROM SHARE TRANSACTIONS | 104,467,209 | 139,443,422 |
| Change in net assets | 117,349,595 | 121,848,163 |
| Net Assets: | | |
| Beginning of period | 433,740,732 | 311,892,569 |
| End of period | $551,090,327 | $433,740,732 |
| 1 | On February 2, 2018, Class B Shares were converted to Class A Shares. |
See Notes which are an integral part of the Financial Statements
Annual Shareholder Report
Notes to Financial Statements
October 31, 2019
1. ORGANIZATION
Federated Equity Funds (the “Trust”) is registered under the Investment Company Act of 1940, as amended (the “Act”), as an open-end management investment company. The Trust consists of nine portfolios. The financial statements included herein are only those of Federated MDT Mid Cap Growth Fund, a diversified portfolio. The financial statements of the other portfolios are presented separately. The assets of each portfolio are segregated and a shareholder's interest is limited to the portfolio in which shares are held. Each portfolio pays its own expenses. The Fund offers four classes of shares: Class A Shares, Class C Shares, Institutional Shares and Class R6 Shares. All shares of the Fund have equal rights with respect to voting, except on class-specific matters. The investment objective of the Fund is appreciation of capital.
On March 30, 2017, the Fund's T Share class became effective with the Securities and Exchange Commission (SEC), but is not yet offered for sale.
On February 2, 2018, Class B Shares were converted into the Fund's existing Class A Shares at the close of business pursuant to a Plan of Conversion approved by the Fund's Board of Trustees (the “Trustees”). The conversion occurred on a tax-free basis. The cash value of a shareholder's investment was not changed as a result of the share class conversion. No action was required by shareholders to effect the conversion.
Effective August 1, 2018, an automatic conversion feature for Class C Shares was implemented. Pursuant to this automatic conversion feature, after Class C Shares have been held for ten years from the date of purchase, they will automatically convert to Class A Shares on the next monthly conversion processing date.
2. SIGNIFICANT ACCOUNTING POLICIES
The following is a summary of significant accounting policies consistently followed by the Fund in the preparation of its financial statements. These policies are in conformity with U.S. generally accepted accounting principles (GAAP).
Investment Valuation
In calculating its net asset value (NAV), the Fund generally values investments as follows:
| ■ | Equity securities listed on an exchange or traded through a regulated market system are valued at their last reported sale price or official closing price in their principal exchange or market. |
| ■ | Shares of other mutual funds or non-exchange-traded investment companies are valued based upon their reported NAVs. |
| ■ | Derivative contracts listed on exchanges are valued at their reported settlement or closing price, except that options are valued at the mean of closing bid and asked quotations. |
| ■ | Over-the-counter (OTC) derivative contracts are fair valued using price evaluations provided by a pricing service approved by the Trustees. |
| ■ | Fixed-income securities are fair valued using price evaluations provided by a pricing service approved by the Trustees. |
| ■ | For securities that are fair valued in accordance with procedures established by and under the general supervision of the Trustees, certain factors may be considered, such as: the last traded or purchase price of the security, information obtained by contacting the issuer or dealers, analysis of the issuer's financial statements or other available documents, |
Annual Shareholder Report
| | fundamental analytical data, the nature and duration of restrictions on disposition, the movement of the market in which the security is normally traded, public trading in similar securities or derivative contracts of the issuer or comparable issuers, movement of a relevant index, or other factors including but not limited to industry changes and relevant government actions. |
If any price, quotation, price evaluation or other pricing source is not readily available when the NAV is calculated, if the Fund cannot obtain price evaluations from a pricing service or from more than one dealer for an investment within a reasonable period of time as set forth in the Fund's valuation policies and procedures, or if information furnished by a pricing service, in the opinion of the valuation committee (“Valuation Committee”), is deemed not representative of the fair value of such security, the Fund uses the fair value of the investment determined in accordance with the procedures described below. There can be no assurance that the Fund could obtain the fair value assigned to an investment if it sold the investment at approximately the time at which the Fund determines its NAV per share.
Fair Valuation and Significant Events Procedures
The Trustees have ultimate responsibility for determining the fair value of investments for which market quotations are not readily available. The Trustees have appointed a Valuation Committee comprised of officers of the Fund, Federated MDTA LLC (the “Adviser”) and certain of the Adviser's affiliated companies to assist in determining fair value and in overseeing the calculation of the NAV. The Trustees have also authorized the use of pricing services recommended by the Valuation Committee to provide fair value evaluations of the current value of certain investments for purposes of calculating the NAV. The Valuation Committee employs various methods for reviewing third-party pricing-service evaluations including periodic reviews of third-party pricing services' policies, procedures and valuation methods (including key inputs, methods, models and assumptions), transactional back-testing, comparisons of evaluations of different pricing services, and review of price challenges by the Adviser based on recent market activity. In the event that market quotations and price evaluations are not available for an investment, the Valuation Committee determines the fair value of the investment in accordance with procedures adopted by the Trustees. The Trustees periodically review and approve the fair valuations made by the Valuation Committee and any changes made to the procedures.
Factors considered by pricing services in evaluating an investment include the yields or prices of investments of comparable quality, coupon, maturity, call rights and other potential prepayments, terms and type, reported transactions, indications as to values from dealers and general market conditions. Some pricing services provide a single price evaluation reflecting the bid-side of the market for an investment (a “bid” evaluation). Other pricing services offer both bid evaluations and price evaluations indicative of a price between the prices bid and asked for the investment (a “mid” evaluation). The Fund normally uses bid evaluations for any U.S. Treasury and Agency securities, mortgage-backed securities and municipal securities. The Fund normally uses mid evaluations for any other types of fixed-income securities and any OTC derivative contracts. In the event that market quotations and price evaluations are not available for an investment, the fair value of the investment is determined in accordance with procedures adopted by the Trustees.
The Trustees also have adopted procedures requiring an investment to be priced at its fair value whenever the Adviser determines that a significant event affecting the value of the investment has occurred between the time as of which the price of the investment would otherwise be determined and the time as of which the NAV is computed. An event is
Annual Shareholder Report
considered significant if there is both an affirmative expectation that the investment's value will change in response to the event and a reasonable basis for quantifying the resulting change in value. Examples of significant events that may occur after the close of the principal market on which a security is traded, or after the time of a price evaluation provided by a pricing service or a dealer, include:
| ■ | With respect to securities traded principally in foreign markets, significant trends in U.S. equity markets or in the trading of foreign securities index futures contracts; |
| ■ | Political or other developments affecting the economy or markets in which an issuer conducts its operations or its securities are traded; |
| ■ | Announcements concerning matters such as acquisitions, recapitalizations, litigation developments, or a natural disaster affecting the issuer's operations or regulatory changes or market developments affecting the issuer's industry. |
The Trustees have adopted procedures whereby the Valuation Committee uses a pricing service to provide factors to update the fair value of equity securities traded principally in foreign markets from the time of the close of their respective foreign stock exchanges to the pricing time of the Fund. For other significant events, the Fund may seek to obtain more current quotations or price evaluations from alternative pricing sources. If a reliable alternative pricing source is not available, the Fund will determine the fair value of the investment in accordance with the fair valuation procedures approved by the Trustees. The Trustees have ultimate responsibility for any fair valuations made in response to a significant event.
Repurchase Agreements
The Fund may invest in repurchase agreements for short-term liquidity purposes. It is the policy of the Fund to require the other party to a repurchase agreement to transfer to the Fund's custodian or sub-custodian eligible securities or cash with a market value (after transaction costs) at least equal to the repurchase price to be paid under the repurchase agreement. The eligible securities are transferred to accounts with the custodian or sub-custodian in which the Fund holds a “securities entitlement” and exercises “control” as those terms are defined in the Uniform Commercial Code. The Fund has established procedures for monitoring the market value of the transferred securities and requiring the transfer of additional eligible securities if necessary to equal at least the repurchase price. These procedures also allow the other party to require securities to be transferred from the account to the extent that their market value exceeds the repurchase price or in exchange for other eligible securities of equivalent market value.
The insolvency of the other party or other failure to repurchase the securities may delay the disposition of the underlying securities or cause the Fund to receive less than the full repurchase price. Under the terms of the repurchase agreement, any amounts received by the Fund in excess of the repurchase price and related transaction costs must be remitted to the other party.
The Fund may enter into repurchase agreements in which eligible securities are transferred into joint trading accounts maintained by the custodian or sub-custodian for investment companies and other clients advised by the Fund's Adviser and its affiliates. The Fund will participate on a pro rata basis with the other investment companies and clients in its share of the securities transferred under such repurchase agreements and in its share of proceeds from any repurchase or other disposition of such securities.
Annual Shareholder Report
Investment Income, Gains and Losses, Expenses and Distributions
Investment transactions are accounted for on a trade-date basis. Realized gains and losses from investment transactions are recorded on an identified-cost basis. Interest income and expenses are accrued daily. Dividend income and distributions to shareholders are recorded on the ex-dividend date. Foreign dividends are recorded on the ex-dividend date or when the Fund is informed of the ex-dividend date. Distributions of net investment income, if any, are declared and paid annually. Non-cash dividends included in dividend income, if any, are recorded at fair value. Amortization/accretion of premium and discount is included in investment income. Investment income, realized and unrealized gains and losses, and certain fund-level expenses are allocated to each class based on relative average daily net assets, except that select classes will bear certain expenses unique to those classes. The detail of the total fund expense waiver and reimbursements of $803,660 is disclosed in various locations in this Note 2 and Note 5. For the year ended October 31, 2019, transfer agent fees for the Fund were as follows:
| | Transfer Agent
Fees Incurred | Transfer Agent
Fees Reimbursed |
| Class A Shares | $233,631 | $— |
| Class C Shares | 19,885 | (7,479) |
| Institutional Shares | 326,446 | (218,968) |
| Class R6 Shares | 8,009 | — |
| TOTAL | $587,971 | $(226,447) |
Dividends are declared separately for each class. No class has preferential dividend rights; differences in per share dividend rates are generally due to differences in separate class expenses.
Other Service Fees
The Fund may pay other service fees up to 0.25% of the average daily net assets of the Fund's Class A Shares and Class C Shares to unaffiliated financial intermediaries or to Federated Shareholder Services Company (FSSC) for providing services to shareholders and maintaining shareholder accounts. Subject to the terms described in the Expense Limitation note, FSSC may voluntarily reimburse the Fund for other service fees. For the year ended October 31, 2019, other service fees for the Fund were as follows:
| | Other Service
Fees Incurred |
| Class A Shares | $627,727 |
| Class C Shares | 35,730 |
| TOTAL | $663,457 |
Federal Taxes
It is the Fund's policy to comply with the Subchapter M provision of the Internal Revenue Code and to distribute to shareholders each year substantially all of its income. Accordingly, no provision for federal income tax is necessary. As of and during the year ended October 31, 2019, the Fund did not have a liability for any uncertain tax positions. The Fund
Annual Shareholder Report
recognizes interest and penalties, if any, related to tax liabilities as income tax expense in the Statement of Operations. As of October 31, 2019, tax years 2016 through 2019 remain subject to examination by the Fund's major tax jurisdictions, which include the United States of America and the Commonwealth of Massachusetts.
When-Issued and Delayed-Delivery Transactions
The Fund may engage in when-issued or delayed-delivery transactions. The Fund records when-issued securities on the trade date and maintains security positions such that sufficient liquid assets will be available to make payment for the securities purchased. Securities purchased on a when-issued or delayed-delivery basis are marked to market daily and begin earning interest on the settlement date. Losses may occur on these transactions due to changes in market conditions or the failure of counterparties to perform under the contract.
Securities Lending
The Fund participates in a securities lending program providing for the lending of equity securities to qualified brokers. The term of the loans within the program is one year or less. The Fund normally receives cash collateral for securities loaned that may be invested in affiliated money market funds, other money market instruments and/or repurchase agreements. Investments in money market funds may include funds with a “floating” NAV that can impose redemption fees and liquidity gates, impose certain operational impediments to investing cash collateral, and, if the investee fund's NAV decreases, result in the Fund recognizing losses and being required to cover the decrease in the value of the cash collateral. Collateral is maintained at a minimum level of 100% of the market value of investments loaned, plus interest, if applicable. Earnings on collateral are allocated between the borrower of the security, the securities lending agent, as a fee for its services under the program and the Fund, according to agreed-upon rates. The Fund will not have the right to vote on securities while they are on loan. However, the Fund will attempt to terminate a loan in an effort to reacquire the securities in time to vote on matters that are deemed to be material by the Adviser. There can be no assurance that the Fund will have sufficient notice of such matters to be able to terminate the loan in time to vote thereon.
Securities lending transactions are subject to Master Netting Agreements which are agreements between the Fund and its counterparties that provide for the net settlement of all transactions and collateral with the Fund, through a single payment, in the event of default or termination. Amounts presented on the Portfolio of Investments and Statement of Assets and Liabilities are not net settlement amount but gross. As indicated below, the cash collateral received by the Fund exceeds the market value of the securities loaned reducing the net settlement amount to zero. The chart below identifies the amount of collateral received as well as the market value of securities on loan. Additionally, the securities lending agreement executed by the Fund includes an indemnification clause. This clause stipulates that the borrower will reimburse the Fund for any losses as a result of any failure of the borrower to return equivalent securities to the Fund.
As of October 31, 2019, securities subject to this type of arrangement and related collateral were as follows:
Market Value of
Securities Loaned | Collateral
Received |
| $772,878 | $820,447 |
Annual Shareholder Report
Other
The preparation of financial statements in conformity with GAAP requires management to make estimates and assumptions that affect the amounts of assets, liabilities, expenses and revenues reported in the financial statements. Actual results could differ from those estimated. The Fund applies investment company accounting and reporting guidance.
3. SHARES OF BENEFICIAL INTEREST
The following tables summarize share activity:
| Year Ended October 31 | 2019 | 2018 |
| Class A Shares: | Shares | Amount | Shares | Amount |
| Shares sold | 679,947 | $26,913,977 | 565,944 | $24,497,958 |
| Shares issued to shareholders in payment of distributions declared | 731,469 | 25,696,511 | 698,338 | 27,465,618 |
| Shares redeemed | (922,810) | (36,512,405) | (995,511) | (42,306,088) |
NET CHANGE RESULTING FROM
CLASS A SHARE TRANSACTIONS | 488,606 | $16,098,083 | 268,771 | $9,657,488 |
| Year Ended October 31 | 2019 | 20181 |
| Class B Shares: | Shares | Amount | Shares | Amount |
| Shares sold | — | $— | 1,077 | $29,293 |
| Shares issued to shareholders in payment of distributions declared | — | — | 10,944 | 297,555 |
| Shares redeemed | — | — | (74,055) | (2,127,515) |
NET CHANGE RESULTING FROM
CLASS B SHARE TRANSACTIONS | — | $— | (62,034) | $(1,800,667) |
| Year Ended October 31 | 2019 | 2018 |
| Class C Shares: | Shares | Amount | Shares | Amount |
| Shares sold | 300,441 | $7,704,376 | 211,933 | $6,492,265 |
| Shares issued to shareholders in payment of distributions declared | 75,555 | 1,758,930 | 61,023 | 1,701,339 |
| Shares redeemed | (170,642) | (4,416,223) | (238,896) | (7,411,329) |
NET CHANGE RESULTING FROM
CLASS C SHARE TRANSACTIONS | 205,354 | $5,047,083 | 34,060 | $782,275 |
| Year Ended October 31 | 2019 | 2018 |
| Institutional Shares: | Shares | Amount | Shares | Amount |
| Shares sold | 4,227,609 | $170,009,422 | 4,220,296 | $184,825,946 |
| Shares issued to shareholders in payment of distributions declared | 466,589 | 16,904,512 | 72,764 | 2,933,122 |
| Shares redeemed | (3,103,897) | (127,678,775) | (661,801) | (28,983,786) |
NET CHANGE RESULTING FROM
INSTITUTIONAL SHARE TRANSACTIONS | 1,590,301 | $59,235,159 | 3,631,259 | $158,775,282 |
Annual Shareholder Report
| Year Ended October 31 | 2019 | 2018 |
| Class R6 Shares: | Shares | Amount | Shares | Amount |
| Shares sold | 1,021,386 | $38,847,234 | 218,797 | $9,287,911 |
| Shares issued to shareholders in payment of distributions declared | 28,741 | 943,283 | 136,613 | 5,050,583 |
| Shares redeemed | (400,411) | (15,703,633) | (1,113,459) | (42,309,450) |
NET CHANGE RESULTING FROM
CLASS R6 SHARE TRANSACTIONS | 649,716 | $24,086,884 | (758,049) | $(27,970,956) |
NET CHANGE RESULTING FROM
TOTAL FUND SHARE TRANSACTIONS | 2,933,977 | $104,467,209 | 3,114,007 | $139,443,422 |
| 1 | On February 2, 2018, Class B Shares were converted to Class A Shares. |
4. FEDERAL TAX INFORMATION
The accounting treatment of certain items in accordance with income tax regulations may differ from the accounting treatment in accordance with GAAP which may result in permanent differences. In the case of the Fund, such differences primarily result from regulatory settlement proceeds.
For the year ended October 31, 2019, permanent differences identified and reclassified among the components of net assets were as follows:
| Increase (Decrease) |
| Paid-In Capital | Total Distributable
Earnings (Loss) |
| $(4,895) | $4,895 |
The tax character of distributions as reported on the Statement of Changes in Net Assets for the years ended October 31, 2019 and 2018, was as follows:
| | 2019 | 2018 |
| Ordinary income1 | $19,982,791 | $26,481,986 |
| Long-term capital gains | $29,327,322 | $13,822,932 |
| 1 | For tax purposes, short-term capital gain distributions are considered ordinary income distributions. |
As of October 31, 2019, the components of distributable earnings on a tax-basis were as follows:
| Undistributed ordinary income2 | $7,616,190 |
| Net unrealized appreciation | $32,071,266 |
| Undistributed long-term capital gains | $33,090,100 |
| 2 | For tax purposes, short-term capital gains are considered ordinary income in determining distributable earnings. |
The difference between book-basis and tax-basis net unrealized appreciation/depreciation is attributable to differing treatments for deferral of losses on wash sales and non-taxable dividends.
Annual Shareholder Report
At October 31, 2019, the cost of investments for federal tax purposes was $520,455,312. The net unrealized appreciation of investments for federal tax purposes was $32,071,266. This consists of net unrealized appreciation from investments for those securities having an excess of value over cost of $49,168,294 and net unrealized depreciation from investments for those securities having an excess of cost over value of $17,097,028.
5. INVESTMENT ADVISER FEE AND OTHER TRANSACTIONS WITH AFFILIATES
Investment Adviser Fee
The advisory agreement between the Fund and the Adviser provides for an annual fee equal to 0.75% of the Fund's average daily net assets. Subject to the terms described in the Expense Limitation note, the Adviser may voluntarily choose to waive any portion of its fee and/or reimburse certain operating expenses of the Fund. For the year ended October 31, 2019, the Adviser voluntarily waived $568,004 of its fee and voluntarily reimbursed $226,447 of transfer agent fees.
The Adviser has agreed to reimburse the Fund for certain investment adviser fees as a result of transactions in other affiliated investment companies. For the year ended October 31, 2019, the Adviser reimbursed $9,209.
Administrative Fee
Federated Administrative Services (FAS), under the Administrative Services Agreement, provides the Fund with administrative personnel and services. For purposes of determining the appropriate rate breakpoint, “Investment Complex” is defined as all of the Federated Funds subject to a fee under the Administrative Services Agreement. The fee paid to FAS is based on the average daily net assets of the Investment Complex as specified below:
| Administrative Fee | Average Daily Net Assets
of the Investment Complex |
| 0.100% | on assets up to $50 billion |
| 0.075% | on assets over $50 billion |
Subject to the terms described in the Expense Limitation note, FAS may voluntarily choose to waive any portion of its fee. For the year ended October 31, 2019, the annualized fee paid to FAS was 0.079% of average daily net assets of the Fund.
In addition, FAS may charge certain out-of-pocket expenses to the Fund.
Distribution Services Fee
The Fund has adopted a Distribution Plan (the “Plan”) pursuant to Rule 12b-1 under the Act. Under the terms of the Plan, the Fund will compensate Federated Securities Corp. (FSC), the principal distributor, from the daily net assets of the Fund's Class C Shares to finance activities intended to result in the sale of these shares. The Plan provides that the Fund may incur distribution expenses at 0.75% of average daily net assets annually, to compensate FSC.
Subject to the terms described in the Expense Limitation note, FSC may voluntarily choose to waive any portion of its fee.
Annual Shareholder Report
For the year ended October 31, 2019, distribution services fees for the Fund were as follows:
| | Distribution Services
Fees Incurred |
| Class C Shares | $107,191 |
When FSC receives fees, it may pay some or all of them to financial intermediaries whose customers purchase shares. For the year ended October 31, 2019, FSC retained $48,361 fees paid by the Fund.
Sales Charges
Front-end sales charges and contingent deferred sales charges (CDSC) do not represent expenses of the Fund. They are deducted from the proceeds of sales of Fund shares prior to investment or from redemption proceeds prior to remittance, as applicable. For the year ended October 31, 2019, FSC retained $19,578 in sales charges from the sale of Class A Shares. FSC also retained $387 of CDSC relating to redemptions of Class A Shares and $2,807 relating to redemptions of Class C Shares.
Other Service Fees
For the year ended October 31, 2019, FSSC received $51,214 of the other service fees disclosed in Note 2.
Expense Limitation
The Adviser and certain of its affiliates (which may include FSC, FAS and FSSC) on their own initiative have agreed to waive certain amounts of their respective fees and/or reimburse expenses. Effective January 1, 2020, total annual fund operating expenses (as shown in the financial highlights, excluding interest expense, extraordinary expenses and proxy-related expenses paid by the Fund, if any) paid by the Fund's Class A Shares, Class C Shares, Institutional Shares and Class R6 Shares (after the voluntary waivers and/or reimbursements) will not exceed 1.14%, 1.94%, 0.84% and 0.83% (the “Fee Limit”), respectively, up to but not including the later of (the “Termination Date”): (a) January 1, 2021; or (b) the date of the Fund's next effective Prospectus. Prior to January 1, 2020, the Fee Limits disclosed above for the referenced share classes were 1.14%, 1.88%, 0.84% and 0.83%. While the Adviser and its applicable affiliates currently do not anticipate terminating or increasing these arrangements prior to the Termination Date, these arrangements may only be terminated or the Fee Limit increased prior to the Termination Date with the agreement of the Trustees.
Directors'/Trustees' and Miscellaneous Fees
Certain Officers and Trustees of the Fund are Officers and Directors or Trustees of certain of the above companies. To efficiently facilitate payment, Independent Directors'/Trustees' fees and certain expenses related to conducting meetings of the Directors/Trustees and other miscellaneous expenses are paid by an affiliate of the Adviser which in due course are reimbursed by the Fund. These expenses related to conducting meetings of the Directors/Trustees and other miscellaneous expenses may be included in Accrued and Miscellaneous Expenses on the Statement of Assets and Liabilities and Statement of Operations, respectively.
Annual Shareholder Report
6. INVESTMENT TRANSACTIONS
Purchases and sales of investments, excluding long-term U.S. government securities and short-term obligations, for the year ended October 31, 2019, were as follows:
| Purchases | $968,185,467 |
| Sales | $911,117,794 |
7. LINE OF CREDIT
The Fund participates with certain other Federated Funds, on a several basis, in an up to $500,000,000 unsecured, 364-day, committed, revolving line of credit (LOC) agreement. The LOC was made available to finance temporarily the repurchase or redemption of shares of the Fund, failed trades, payment of dividends, settlement of trades and for other short-term, temporary or emergency general business purposes. The Fund cannot borrow under the LOC if an inter-fund loan is outstanding. The Fund's ability to borrow under the LOC also is subject to the limitations of the Act and various conditions precedent that must be satisfied before the Fund can borrow. Loans under the LOC are charged interest at a fluctuating rate per annum equal to the highest, on any day, of (a) (i) the federal funds effective rate, (ii) the one month London Interbank Offered Rate (LIBOR), and (iii) 0.0%, plus (b) a margin. The LOC also requires the Fund to pay, quarterly in arrears and at maturity, its pro rata share of a commitment fee based on the amount of the lenders' commitment that has not been utilized. As of October 31, 2019, the Fund had no outstanding loans. During the year ended October 31, 2019, the Fund did not utilize the LOC.
8. CONCENTRATION OF RISK
The Fund may invest a portion of its assets in securities of companies that are deemed by the Fund's management to be classified in similar business sectors. Economic developments may have an effect on the liquidity and volatility of the portfolio securities.
9. INTERFUND LENDING
Pursuant to an Exemptive Order issued by the SEC, the Fund, along with other funds advised by subsidiaries of Federated Investors, Inc., may participate in an interfund lending program. This program provides an alternative credit facility allowing the Fund to borrow from other participating affiliated funds. As of October 31, 2019, there were no outstanding loans. During the year ended October 31, 2019, the program was not utilized.
10. FEDERAL TAX INFORMATION (UNAUDITED)
For the year ended October 31, 2019, the amount of long-term capital gains designated by the Fund was $29,327,322.
For the fiscal year ended October 31, 2019, 16.93% of total ordinary income distributions made by the Fund are qualifying dividends which may be subject to a maximum tax rate of 15%, as provided for by the Jobs and Growth Tax Relief Act of 2003. Complete information is reported in conjunction with the reporting of your distributions on Form 1099-DIV.
Of the ordinary income (including short-term capital gain) distributions made by the Fund during the year ended October 31, 2019, 16.50% qualify for the dividend received deduction available to corporate shareholders.
Annual Shareholder Report
Report of Independent Registered Public Accounting Firm
TO THE BOARD OF TRUSTEES OF THE FEDERATED EQUITY FUNDS AND SHAREHOLDERS OF FEDERATED MDT MID CAP GROWTH FUND:
Opinion on the Financial Statements
We have audited the accompanying statement of assets and liabilities, including the portfolio of investments, of the Federated MDT Mid Cap Growth Fund (the “Fund”), a portfolio of Federated Equity Funds, as of October 31, 2019, the related statement of operations for the year then ended, the statements of changes in net assets for each of the years in the two-year period then ended, and the related notes (collectively, the “financial statements”) and the financial highlights for each of the years in the five-year period then ended. In our opinion, the financial statements and financial highlights present fairly, in all material respects, the financial position of the Fund as of October 31, 2019, the results of its operations for the year then ended, the changes in its net assets for each of the years in the two-year period then ended, and the financial highlights for each of the years in the five-year period then ended, in conformity with U.S. generally accepted accounting principles.
Basis for Opinion
These financial statements and financial highlights are the responsibility of the Fund's management. Our responsibility is to express an opinion on these financial statements and financial highlights based on our audits. We are a public accounting firm registered with the Public Company Accounting Oversight Board (United States) (PCAOB) and are required to be independent with respect to the Fund in accordance with the U.S. federal securities laws and the applicable rules and regulations of the Securities and Exchange Commission and the PCAOB.
Annual Shareholder Report
We conducted our audits in accordance with the standards of the PCAOB. Those standards require that we plan and perform the audit to obtain reasonable assurance about whether the financial statements and financial highlights are free of material misstatement, whether due to error or fraud. Our audits included performing procedures to assess the risks of material misstatement of the financial statements and financial highlights, whether due to error or fraud, and performing procedures that respond to those risks. Such procedures included examining, on a test basis, evidence regarding the amounts and disclosures in the financial statements and financial highlights. Such procedures also included confirmation of securities owned as of October 31, 2019, by correspondence with custodian and brokers or by other appropriate auditing procedures. Our audits also included evaluating the accounting principles used and significant estimates made by management, as well as evaluating the overall presentation of the financial statements and financial highlights. We believe that our audits provide a reasonable basis for our opinion.
We have served as the auditor of one or more of Federated Investors' investment companies since 2006.
Boston, Massachusetts
December 20, 2019
Annual Shareholder Report
Shareholder Expense Example (unaudited)
As a shareholder of the Fund, you incur two types of costs: (1) transaction costs, including sales charges (loads) on purchase or redemption payments; and (2) ongoing costs, including management fees and to the extent applicable, distribution (12b-1) fees and/or other service fees and other Fund expenses. This Example is intended to help you to understand your ongoing costs (in dollars) of investing in the Fund and to compare these costs with the ongoing costs of investing in other mutual funds. It is based on an investment of $1,000 invested at the beginning of the period and held for the entire period from May 1, 2019 to October 31, 2019.
ACTUAL EXPENSES
The first section of the table below provides information about actual account values and actual expenses. You may use the information in this section, together with the amount you invested, toestimate the expenses that you incurred over the period. Simply divide your account value by $1,000 (for example, an $8,600 account value divided by $1,000 = 8.6), then multiply the result by the number in the first section under the heading entitled “Expenses Paid During Period” to estimate the expenses attributable to your investment during this period.
HYPOTHETICAL EXAMPLE FOR COMPARISON PURPOSES
The second section of the table below provides information about hypothetical account values and hypothetical expenses based on the Fund's actual expense ratio and anassumed rate of return of 5% per year before expenses, which is not the Fund's actual return. Thus, you shouldnot use the hypothetical account values and expenses to estimate the actual ending account balance or your expenses for the period. Rather, these figures are required to be provided to enable you to compare the ongoing costs of investing in the Fund with other funds. To do so, compare this 5% hypothetical example with the 5% hypothetical examples that appear in the shareholder reports of the other funds.
Annual Shareholder Report
Please note that the expenses shown in the table are meant to highlight your ongoing costs only and do not reflect any transaction costs, such as sales charges (loads) on purchase or redemption payments. Therefore, the second section of the table is useful in comparing ongoing costs only, and will not help you determine the relativetotal costs of owning different funds. In addition, if these transaction costs were included, your costs would have been higher.
| | Beginning
Account Value
5/1/2019 | Ending
Account Value
10/31/2019 | Expenses Paid
During Period1 |
| Actual: | | | |
| Class A Shares | $1,000 | $992.30 | $5.72 |
| Class C Shares | $1,000 | $988.30 | $9.42 |
| Institutional Shares | $1,000 | $993.70 | $4.22 |
| Class R6 Shares | $1,000 | $993.60 | $4.17 |
Hypothetical (assuming a 5% return
before expenses): | | | |
| Class A Shares | $1,000 | $1,019.50 | $5.80 |
| Class C Shares | $1,000 | $1,015.70 | $9.55 |
| Institutional Shares | $1,000 | $1,021.00 | $4.28 |
| Class R6 Shares | $1,000 | $1,021.00 | $4.23 |
| 1 | Expenses are equal to the Fund's annualized net expense ratios, multiplied by the average account value over the period, multiplied by 184/365 (to reflect the one-half-year period). The annualized net expense ratios are as follows: |
| | |
| Class A Shares | 1.14% |
| Class C Shares | 1.88% |
| Institutional Shares | 0.84% |
| Class R6 Shares | 0.83% |
Annual Shareholder Report
Board of Trustees and Trust Officers
The Board of Trustees is responsible for managing the Trust's business affairs and for exercising all the Trust's powers except those reserved for the shareholders. The following tables give information about each Trustee and the senior officers of the Fund. Where required, the tables separately list Trustees who are “interested persons” of the Fund (i.e., “Interested” Trustees) and those who are not (i.e., “Independent” Trustees). Unless otherwise noted, the address of each person listed is Federated Investors Tower, 1001 Liberty Avenue, Pittsburgh, PA 15222. The address of all Independent Trustees listed is 4000 Ericsson Drive, Warrendale, PA 15086-7561; Attention: Mutual Fund Board. As of December 31, 2018, the Trust comprised 10 portfolio(s), and the Federated Fund Family consisted of 40 investment companies (comprising 102 portfolios). Unless otherwise noted, each Officer is elected annually. Unless otherwise noted, each Trustee oversees all portfolios in the Federated Fund Family and serves for an indefinite term. The Fund's Statement of Additional Information includes additional information about Trust Trustees and is available, without charge and upon request, by calling 1-800-341-7400.
Interested TRUSTEES Background
Name
Birth Date
Positions Held with Trust
Date Service Began | Principal Occupation(s) for Past Five Years,
Other Directorships Held and Previous Position(s) |
J. Christopher Donahue*
Birth Date: April 11, 1949
President and Trustee
Indefinite Term
Began serving: September 1999 | Principal Occupations: Principal Executive Officer and President of certain of the Funds in the Federated Fund Family; Director or Trustee of the Funds in the Federated Fund Family; President, Chief Executive Officer and Director, Federated Investors, Inc.; Chairman and Trustee, Federated Investment Management Company; Trustee, Federated Investment Counseling; Chairman and Director, Federated Global Investment Management Corp.; Chairman and Trustee, Federated Equity Management Company of Pennsylvania; Trustee, Federated Shareholder Services Company; Director, Federated Services Company.
Previous Positions: President, Federated Investment Counseling; President and Chief Executive Officer, Federated Investment Management Company, Federated Global Investment Management Corp. and Passport Research, Ltd; Chairman, Passport Research, Ltd. |
Annual Shareholder Report
Name
Birth Date
Positions Held with Trust
Date Service Began | Principal Occupation(s) for Past Five Years,
Other Directorships Held and Previous Position(s) |
John B. Fisher*
Birth Date: May 16, 1956
Trustee
Indefinite Term
Began serving: May 2016 | Principal Occupations:Principal Executive Officer and President of certain of the Funds in the Federated Fund Family; Director or Trustee of certain of the Funds in the Federated Fund Family; Vice President, Federated Investors, Inc.; President, Director/Trustee and CEO, Federated Advisory Services Company, Federated Equity Management Company of Pennsylvania, Federated Global Investment Management Corp., Federated Investment Counseling, Federated Investment Management Company; President of some of the Funds in the Federated Fund Complex and Director, Federated Investors Trust Company.
Previous Positions: President and Director of the Institutional Sales Division of Federated Securities Corp.; President and Director of Federated Investment Counseling; President and CEO of Passport Research, Ltd.; Director, Edgewood Securities Corp.; Director, Federated Services Company; Director, Federated Investors, Inc.; Chairman and Director, Southpointe Distribution Services, Inc. and President, Technology, Federated Services Company. |
| * | Reasons for “interested” status: J. Christopher Donahue and John B. Fisher are interested due to their beneficial ownership of shares of Federated Investors, Inc. and due to positions they hold with Federated and its subsidiaries. |
INDEPENDENT TRUSTEES Background
Name
Birth Date
Positions Held with Trust
Date Service Began | Principal Occupation(s) for Past Five Years,
Other Directorships Held, Previous Position(s) and Qualifications |
John T. Collins
Birth Date: January 24, 1947
Trustee
Indefinite Term
Began serving: October 2013 | Principal Occupations: Director or Trustee of the Federated Fund Family; formerly, Chairman and CEO, The Collins Group, Inc. (a private equity firm) (Retired).
Other Directorships Held: Director, Chairman of the Compensation Committee, KLX Energy Services Holdings, Inc. (oilfield services); former Director of KLX Corp. (aerospace).
Qualifications: Mr. Collins has served in several business and financial management roles and directorship positions throughout his career. Mr. Collins previously served as Chairman and CEO of The Collins Group, Inc. (a private equity firm) and as a Director of KLX Corp. Mr. Collins serves as Chairman Emeriti, Bentley University. Mr. Collins previously served as Director and Audit Committee Member, Bank of America Corp.; Director, FleetBoston Financial Corp.; and Director, Beth Israel Deaconess Medical Center (Harvard University Affiliate Hospital). |
Annual Shareholder Report
Name
Birth Date
Positions Held with Trust
Date Service Began | Principal Occupation(s) for Past Five Years,
Other Directorships Held, Previous Position(s) and Qualifications |
G. Thomas Hough
Birth Date: February 28, 1955
Trustee
Indefinite Term
Began serving: August 2015 | Principal Occupations: Director or Trustee of the Federated Fund Family; formerly, Vice Chair, Ernst & Young LLP (public accounting firm) (Retired).
Other Directorships Held: Director, Member of Governance and Compensation Committees, Publix Super Markets, Inc.; Director, Chair of the Audit Committee, Equifax, Inc.; Director, Member of the Audit Committee, Haverty Furniture Companies, Inc.
Qualifications: Mr. Hough has served in accounting, business management and directorship positions throughout his career. Mr. Hough most recently held the position of Americas Vice Chair of Assurance with Ernst & Young LLP (public accounting firm). Mr. Hough serves on the President's Cabinet and Business School Board of Visitors for the University of Alabama and is on the Business School Board of Visitors for Wake Forest University. Mr. Hough previously served as an Executive Committee member of the United States Golf Association. |
Maureen Lally-Green
Birth Date: July 5, 1949
Trustee
Indefinite Term
Began serving: August 2009 | Principal Occupations: Director or Trustee of the Federated Fund Family; Adjunct Professor of Law, Duquesne University School of Law; formerly, Dean of the Duquesne University School of Law and Professor of Law and Interim Dean of the Duquesne University School of Law; formerly, Associate General Secretary and Director, Office of Church Relations, Diocese of Pittsburgh.
Other Directorships Held: Director, CNX Resources Corporation (formerly known as CONSOL Energy Inc.).
Qualifications: Judge Lally-Green has served in various legal and business roles and directorship positions throughout her career. Judge Lally-Green previously held the position of Dean of the School of Law of Duquesne University (as well as Interim Dean). Judge Lally-Green previously served as a member of the Superior Court of Pennsylvania and as a Professor of Law, Duquesne University School of Law. Judge Lally-Green also currently holds the positions on not for profit or for profit boards of directors as follows: Director and Chair, UPMC Mercy Hospital; Director and Vice Chair, Our Campaign for the Church Alive!, Inc.; Regent, Saint Vincent Seminary; Member, Pennsylvania State Board of Education (public); and Director CNX Resources Corporation (formerly known as CONSOL Energy Inc.). Judge Lally-Green has held the positions of: Director, Auberle; Director, Epilepsy Foundation of Western and Central Pennsylvania; Director, Ireland Institute of Pittsburgh; Director, Saint Thomas More Society; Director and Chair, Catholic High Schools of the Diocese of Pittsburgh, Inc.; Director, Pennsylvania Bar Institute; Director, St. Vincent College; and Director and Chair, North Catholic High School, Inc. |
Charles F. Mansfield, Jr.
Birth Date: April 10, 1945
Trustee
Indefinite Term
Began serving: January 1999 | Principal Occupations: Director or Trustee of the Federated Fund Family; Management Consultant and Author.
Other Directorships Held: None.
Qualifications: Mr. Mansfield has served as a Marine Corps officer and in several banking, business management, educational roles and directorship positions throughout his long career. He remains active as a Management Consultant and Author. |
Annual Shareholder Report
Name
Birth Date
Positions Held with Trust
Date Service Began | Principal Occupation(s) for Past Five Years,
Other Directorships Held, Previous Position(s) and Qualifications |
Thomas M. O'Neill
Birth Date: June 14, 1951
Trustee
Indefinite Term
Began serving: August 2006 | Principal Occupations: Director or Trustee, Chair of the Audit Committee of the Federated Fund Family; Sole Proprietor, Navigator Management Company (investment and strategic consulting).
Other Directorships Held: None.
Qualifications: Mr. O'Neill has served in several business, mutual fund and financial management roles and directorship positions throughout his career. Mr. O'Neill serves as Director, Medicines for Humanity and Director, The Golisano Children's Museum of Naples, Florida. Mr. O'Neill previously served as Chief Executive Officer and President, Managing Director and Chief Investment Officer, Fleet Investment Advisors; President and Chief Executive Officer, Aeltus Investment Management, Inc.; General Partner, Hellman, Jordan Management Co., Boston, MA; Chief Investment Officer, The Putnam Companies, Boston, MA; Credit Analyst and Lending Officer, Fleet Bank; Director and Consultant, EZE Castle Software (investment order management software); and Director, Midway Pacific (lumber). |
P. Jerome Richey
Birth Date: February 23, 1949
Trustee
Indefinite Term
Began serving: October 2013 | Principal Occupations: Director or Trustee of the Federated Fund Family; Management Consultant; Retired; formerly, Senior Vice Chancellor and Chief Legal Officer, University of Pittsburgh and Executive Vice President and Chief Legal Officer, CNX Resources Corporation (formerly known as CONSOL Energy Inc.).
Other Directorships Held: None.
Qualifications: Mr. Richey has served in several business and legal management roles and directorship positions throughout his career. Mr. Richey most recently held the positions of Senior Vice Chancellor and Chief Legal Officer, University of Pittsburgh. Mr. Richey previously served as Chairman of the Board, Epilepsy Foundation of Western Pennsylvania and Chairman of the Board, World Affairs Council of Pittsburgh. Mr. Richey previously served as Chief Legal Officer and Executive Vice President, CNX Resources Corporation (formerly known as CONSOL Energy Inc.); and Board Member, Ethics Counsel and Shareholder, Buchanan Ingersoll & Rooney PC (a law firm). |
John S. Walsh
Birth Date: November 28, 1957
Trustee
Indefinite Term
Began serving: January 1999 | Principal Occupations: Director or Trustee, and Chair of the Board of Directors or Trustees, of the Federated Fund Family; President and Director, Heat Wagon, Inc. (manufacturer of construction temporary heaters); President and Director, Manufacturers Products, Inc. (distributor of portable construction heaters); President, Portable Heater Parts, a division of Manufacturers Products, Inc.
Other Directorships Held: None.
Qualifications: Mr. Walsh has served in several business management roles and directorship positions throughout his career. Mr. Walsh previously served as Vice President, Walsh & Kelly, Inc. (paving contractors). |
Annual Shareholder Report
OFFICERS
Name
Birth Date
Address
Positions Held with Trust
Date Service Began | Principal Occupation(s) for Past Five Years
and Previous Position(s) |
Lori A. Hensler
Birth Date: January 6, 1967
TREASURER
Officer since: April 2013 | Principal Occupations: Principal Financial Officer and Treasurer of the Federated Fund Family; Senior Vice President, Federated Administrative Services; Financial and Operations Principal for Federated Securities Corp. and Edgewood Services, Inc.; and Assistant Treasurer, Federated Investors Trust Company. Ms. Hensler has received the Certified Public Accountant designation.
Previous Positions: Controller of Federated Investors, Inc.; Senior Vice President and Assistant Treasurer, Federated Investors Management Company; Treasurer, Federated Investors Trust Company; Assistant Treasurer, Federated Administrative Services, Federated Administrative Services, Inc., Federated Securities Corp., Edgewood Services, Inc., Federated Advisory Services Company, Federated Equity Management Company of Pennsylvania, Federated Global Investment Management Corp., Federated Investment Counseling, Federated Investment Management Company, Passport Research, Ltd., and Federated MDTA, LLC; Financial and Operations Principal for Federated Securities Corp., Edgewood Services, Inc. and Southpointe Distribution Services, Inc. |
Peter J. Germain
Birth Date: September 3, 1959
CHIEF LEGAL OFFICER, SECRETARY and EXECUTIVE VICE PRESIDENT
Officer since: January 2005 | Principal Occupations: Mr. Germain is Chief Legal Officer, Secretary and Executive Vice President of the Federated Fund Family. He is General Counsel, Chief Legal Officer, Secretary and Executive Vice President, Federated Investors, Inc.; Trustee and Senior Vice President, Federated Investors Management Company; Trustee and President, Federated Administrative Services; Director and President, Federated Administrative Services, Inc.; Director and Vice President, Federated Securities Corp.; Director and Secretary, Federated Private Asset Management, Inc.; Secretary, Federated Shareholder Services Company; and Secretary, Retirement Plan Service Company of America. Mr. Germain joined Federated in 1984 and is a member of the Pennsylvania Bar Association.
Previous Positions: Deputy General Counsel, Special Counsel, Managing Director of Mutual Fund Services, Federated Investors, Inc.; Senior Vice President, Federated Services Company; and Senior Corporate Counsel, Federated Investors, Inc. |
Stephen Van Meter
Birth Date: June 5, 1975
CHIEF COMPLIANCE OFFICER AND SENIOR VICE PRESIDENT
Officer since: July 2015 | Principal Occupations: Senior Vice President and Chief Compliance Officer of the Federated Fund Family; Vice President and Chief Compliance Officer of Federated Investors, Inc. and Chief Compliance Officer of certain of its subsidiaries. Mr. Van Meter joined Federated in October 2011. He holds FINRA licenses under Series 3, 7, 24 and 66.
Previous Positions: Mr. Van Meter previously held the position of Compliance Operating Officer, Federated Investors, Inc. Prior to joining Federated, Mr. Van Meter served at the United States Securities and Exchange Commission in the positions of Senior Counsel, Office of Chief Counsel, Division of Investment Management and Senior Counsel, Division of Enforcement. |
Annual Shareholder Report
Name
Birth Date
Address
Positions Held with Trust
Date Service Began | Principal Occupation(s) for Past Five Years
and Previous Position(s) |
Stephen F. Auth
Birth Date: September 13, 1956
101 Park Avenue
41st Floor
New York, NY 10178
CHIEF INVESTMENT OFFICER
Officer since: November 2002 | Principal Occupations: Stephen F. Auth is Chief Investment Officer of various Funds in the Federated Fund Family; Executive Vice President, Federated Investment Counseling, Federated Global Investment Management Corp. and Federated Equity Management Company of Pennsylvania.
Previous Positions: Executive Vice President, Federated Investment Management Company and Passport Research, Ltd. (investment advisory subsidiary of Federated); Senior Vice President, Global Portfolio Management Services Division; Senior Vice President, Federated Investment Management Company and Passport Research, Ltd.; Senior Managing Director and Portfolio Manager, Prudential Investments. |
Annual Shareholder Report
Evaluation and Approval of Advisory Contract–May 2019
Federated MDT Mid-Cap Growth Fund (the “Fund”)
At its meetings in May 2019, the Fund's Board of Trustees (the “Board”), including a majority of those Trustees who are not “interested persons” of the Fund, as defined in the Investment Company Act of 1940 (the “Independent Trustees”) reviewed and unanimously approved the continuation of the Fund's investment advisory contract for an additional one-year term. The Board's decision regarding the contract reflects the exercise of its business judgment after considering all of the information received on whether to continue the existing arrangements.
At the request of the Independent Trustees, the Fund's Chief Compliance Officer (the CCO) furnished to the Board in advance of its May 2019 meetings an independent written evaluation presenting on the topics discussed below. The Board considered the CCO's independent written evaluation (the “CCO Fee Evaluation Report”), along with other information, in evaluating the reasonableness of the Fund's management fee and in deciding to approve the continuation of the investment advisory contract. The CCO, in preparing the CCO Fee Evaluation Report, has the authority to retain consultants, experts or staff as reasonably necessary to assist in the performance of his duties, reports directly to the Board, and can be terminated only with the approval of a majority of the Independent Trustees. At the request of the Independent Trustees, the CCO Fee Evaluation Report followed the same general approach and covered the same topics as that of the report that had previously been delivered by the CCO in his capacity as “Senior Officer,” prior to the elimination of the Senior Officer position in December 2017.
The Board also considered judicial decisions concerning allegedly excessive investment advisory fees in making its decision. Using these judicial decisions as a guide, the Board observed that the following factors may be relevant to an adviser's fiduciary duty with respect to its receipt of compensation from a fund: (1) the nature and quality of the services provided by an adviser to a fund and its shareholders (including the performance of the fund, its benchmark, and comparable funds); (2) an adviser's cost of providing the services (including the profitability to an adviser of providing advisory services to a fund); (3) the extent to which an adviser may realize “economies of scale” as a fund grows larger and, if such economies of scale exist, whether they have been shared with a fund and its shareholders or the family of funds; (4) any “fall-out” financial benefits that accrue to an adviser because of its relationship with a fund (including research services received from brokers that execute fund trades and any fees paid to affiliates of an adviser for services rendered to a fund); (5) comparative fee and expense structures (including a comparison of fees paid to an adviser with those paid by similar funds both internally and externally as well as management fees charged to institutional and other advisory clients of the
Annual Shareholder Report
adviser for what might be viewed as like services); and (6) the extent of care, conscientiousness and independence with which the fund's board members perform their duties and their expertise (including whether they are fully informed about all facts the board deems relevant to its consideration of an adviser's services and fees). The Board noted that the Securities and Exchange Commission (SEC) disclosure requirements regarding the basis for the Board's approval of the Fund's investment advisory contract generally align with the factors listed above. The Board was aware of these factors and was guided by them in its review of the Fund's investment advisory contract to the extent it considered them to be appropriate and relevant, as discussed further below.
The Board considered and weighed these factors in light of its substantial accumulated experience in governing the Fund and working with Federated MDTA LLC (the “Adviser”) and its affiliates (collectively “Federated”) on matters relating to the funds advised by Federated (each, a “Federated Fund”). The Independent Trustees were assisted in their deliberations by independent legal counsel.
In addition to the extensive materials that comprise and accompany the CCO Fee Evaluation Report, the Board received detailed information about the Fund and the Federated organization throughout the year, and in connection with its May meetings at which the Board's formal approval of the advisory and subadvisory contracts occurred. In this regard, Federated provided much of this information at each regular meeting of the Board, and furnished additional information specifically in connection with the May meetings. In the months preceding the May meetings, the Board requested and reviewed written materials prepared by Federated in response to requests on behalf of the Independent Trustees encompassing a wide variety of topics. At the May meetings, in addition to meeting in separate sessions of the Independent Trustees without management present, senior management of the Adviser also met with the Independent Trustees and their counsel to discuss the materials presented and such additional matters as the Independent Trustees deemed reasonably necessary to evaluate the advisory and subadvisory contracts. Between regularly scheduled meetings, the Board also received information on particular matters as the need arose.
The Board's consideration of the investment advisory contract included review of the CCO Fee Evaluation Report, accompanying data and additional information covering the following matters, among others: the Adviser's investment philosophy, revenue, profitability, personnel and processes; investment and operating strategies; the Fund's short-term and long-term performance (in absolute terms, both on a gross basis and net of expenses, as well as in terms relative to its particular investment program and certain competitor or “peer group” funds and/or other benchmarks, as appropriate) and comments on the reasons for performance; the Fund's investment objectives; the Fund's expenses, including the advisory fee and the overall expense structure of the Fund (both in absolute terms and relative to similar and/or competing funds), with due
Annual Shareholder Report
regard for contractual or voluntary expense limitations; the use and allocation of brokerage commissions derived from trading the Fund's portfolio securities (if any); and the nature, quality and extent of the advisory and other services provided to the Fund by the Adviser and its affiliates. The Board also considered the preferences and expectations of Fund shareholders; the entrepreneurial and other risks assumed by the Adviser in sponsoring the Fund; the continuing state of competition in the mutual fund industry and market practices; the range of comparable fees for similar funds in the mutual fund industry; the Fund's relationship to the Federated Funds which include a comprehensive array of funds with different investment objectives, policies and strategies which are generally available for exchange without the incurrence of additional sales charges; compliance and audit reports concerning the Federated Funds and the Federated companies that service them (including communications from regulatory agencies), as well as Federated's responses to any issues raised therein; and relevant developments in the mutual fund industry and how the Federated Funds and/or Federated are responding to them. The Board's evaluation process is evolutionary. The criteria considered and the emphasis placed on relevant criteria change in recognition of changing circumstances in the mutual fund marketplace.
While mindful that courts have cautioned against giving too much weight to comparative information concerning fees charged by other advisers for managing funds with comparable investment programs, the Board has found the use of such comparisons to be relevant to its deliberations. In this regard, the Board was presented with, and considered, information regarding the contractual advisory fee rates, net advisory fee rates, total expense ratios and each element of the Fund's total expense ratio (i.e., gross and net advisory fees, custody fees, portfolio accounting fees and transfer agency fees) relative to an appropriate group of peer funds compiled by Federated using data supplied by independent fund ranking organizations (the “Peer Group”). The Board received a description of the composition and methodology used to select the Peer Group. The Board focused on comparisons with other similar mutual funds more heavily than non-mutual fund products or services because it is believed that they are more relevant. For example, other mutual funds are the products most like the Fund, in that they are readily available to Fund shareholders as alternative investment vehicles. Also, they are the type of investment vehicle, in fact, chosen and maintained by the Fund's investors. The range of their fees and expenses, therefore, appears to be a relevant indicator of what consumers have found to be reasonable in the marketplace in which the Fund competes.
The Board reviewed the contractual advisory fee rate, net advisory fee rate and other expenses of the Fund and noted the position of the Fund's fee rates relative to its Peer Group. In this regard, the Board noted that the contractual advisory fee rate was below the median of the relevant Peer Group and the Board was satisfied that the overall expense structure of the Fund remained competitive.
Annual Shareholder Report
For comparison, the CCO reviewed the fees charged by Federated for providing advisory services to products other than the Federated Funds (e.g., institutional separate accounts and third-party unaffiliated mutual funds for which Federated serves as sub-adviser) (referenced to as “Comparable Funds/Accounts”). With respect to Comparable Funds/Accounts other than third-party mutual funds, the CCO concluded that they are inherently different products. Those differences include, but are not limited to, different types of targeted investors; different applicable laws and regulations; different legal structures; different average account sizes and portfolio management techniques made necessary by different cash flows and different associated costs; and the time spent by portfolio managers and their teams, as well as personnel in the Funds Financial Services, Legal, Compliance and Risk Management departments, in reviewing securities pricing, addressing different administrative responsibilities, addressing different degrees of risk associated with management and a variety of different costs. The CCO also reviewed the differences in the nature of the services required for Federated to manage its proprietary mutual fund business versus managing a discrete pool of assets as a sub-adviser to another institution's mutual fund, and that Federated generally performs significant additional services and assumes substantially greater risks in managing the Fund and other Federated Funds than in its role as sub-adviser to an unaffiliated third-party mutual fund. The CCO did not consider the fees for providing advisory services to Comparable Funds/Accounts to be determinative in judging the appropriateness of the Federated Funds' advisory fees.
The CCO noted that the services, administrative responsibilities and risks associated with such relationships are quite different than serving as a primary adviser to a fund.
Following such evaluation, and full deliberations, the Board concluded that the fees and expenses of the Fund are reasonable and supported renewal of the Fund's investment advisory contract.
The Board considered the nature, extent and quality of the services provided to the Fund by the Adviser and the resources of the Adviser and its affiliates dedicated to the Fund. In this regard, the Board evaluated, among other things, the Adviser's personnel, experience, track record, financial resources, overall reputation and willingness to invest in personnel and infrastructure that benefit the Fund. In addition, the Board reviewed the qualifications, backgrounds and responsibilities of the portfolio management team primarily responsible for the day-to-day management of the Fund and the Adviser's ability and experience in attracting and retaining qualified personnel to service the Fund. The Board noted the investment research and company engagement capabilities of the Adviser and its affiliates. The Board also noted the compliance program of the Adviser and the compliance-related resources provided to the Fund by the Adviser, including the Adviser's commitment to respond to rulemaking initiatives of the SEC. The Fund's ability to deliver competitive performance when compared to its Peer Group was also deemed to be relevant by the Board
Annual Shareholder Report
as a useful indicator of how the Adviser is executing the Fund's investment program. The Adviser's ability to execute this program was one of the Board's considerations in reaching a conclusion that the nature, extent and quality of the Adviser's investment management services warrant the continuation of the investment advisory contract.
In evaluating the Fund's investment performance, the Board considered performance results in light of the Fund's investment objective, strategies and risks, as disclosed in the Fund's prospectus. The Board considered detailed investment reports on the Fund's performance that were provided to the Board throughout the year and in connection with the May meetings. The CCO also reviewed information regarding the performance of other mutual funds in the Peer Group, noting the CCO's view that comparisons to fund peer groups may be helpful, though not conclusive, in evaluating the performance of the Adviser in managing the Fund. The Board considered, in evaluating such comparisons, that in some cases there may be differences in the funds' investment objectives or investment management techniques, or the costs to implement funds, even within the same Peer Group, and that the CCO had specifically noted that the Fund's quantitative focus makes fee and expense comparisons particularly difficult as the funds in the Peer Group varied widely in their complexity, and the management of the Fund is among the more complex relative to its Peer Group.
For the one-year, three-year and five-year periods covered by the CCO Fee Evaluation Report, the Fund's performance was above the median of the relevant Peer Group. In addition, the Board was informed by the Adviser that the Fund outperformed its benchmark index for the one-year, three-year and five-year periods.
Following such evaluation, and full deliberations, the Board concluded that the performance of the Fund supported renewal of the Fund's advisory contract.
The Board also received financial information about Federated, including information regarding the compensation and ancillary (or “fall-out”) benefits Federated derived from its relationships with the Federated Funds. This information covered not only the fees under the investment advisory contracts, but also fees received by Federated's subsidiaries for providing other services to the Federated Funds under separate contracts (e.g., for serving as the Federated Funds' administrator and distributor). In this regard, the Board considered that certain Federated subsidiaries provide distribution and shareholder services to the Federated Funds, for which they may be compensated through distribution and servicing fees paid pursuant to Rule 12b-1 plans or otherwise. The information also detailed any indirect benefit Federated may derive from its receipt of research services from brokers who execute Federated Fund trades. In addition, the Board considered the fact that, in order for a Federated Fund to be competitive in the marketplace, the Adviser and its affiliates frequently waived fees and/or reimbursed expenses and have disclosed to Federated Fund investors
Annual Shareholder Report
and/or indicated to the Board their intention to do so in the future. Moreover, the Board receives regular reporting as to the institution, adjustment or elimination of these voluntary waivers. The Board considered Federated's previous reductions in contractual management fees to certain Federated Funds in response to the CCO's recommendations in the prior year's CCO Fee Evaluation Report.
Federated furnished information, requested by the CCO, that reported revenues on a fund-by-fund basis and made estimates of the allocation of expenses on a fund-by-fund basis, using allocation methodologies specified by the CCO. The CCO noted that, while these cost allocation reports apply consistent allocation processes, the inherent difficulties in allocating costs continues to cause the CCO to question the precision of the process and to conclude that such reports may be unreliable, since a single change in an allocation estimate may dramatically alter the resulting estimate of cost and/or profitability of a Federated Fund and may produce unintended consequences. The allocation information, including the CCO's view that fund-by-fund estimations may be unreliable, was considered in the evaluation by the Board.
The Board and the CCO also reviewed information compiled by Federated comparing its profitability information to other publicly held fund management companies, including information regarding profitability trends over time. In this regard, the CCO concluded that Federated's profit margins did not appear to be excessive. The CCO also noted that Federated appeared financially sound, with the resources necessary to fulfill its obligations under its contracts with the Fund.
The CCO Fee Evaluation Report also discussed the notion of possible realization of “economies of scale” as a fund grows larger, the difficulties of calculating economies of scale at an individual fund level, and the extent to which potential scale benefits are shared with shareholders. In this regard, the Board considered that Federated has made significant and long-term investments in areas that support all of the Federated Funds, such as personnel and processes for the portfolio management, shareholder services, compliance, internal audit and risk management functions, as well as systems technology (including technology relating to cybersecurity) and that the benefits of these investments (as well as any economies of scale, should they exist) were likely to be shared with the Federated Fund family as a whole. The Board noted that Federated's investments in these areas are extensive. In addition, the Board considered that the Adviser and its affiliates have frequently waived fees and/or reimbursed expenses and that this has allowed potential economies of scale to be shared with shareholders. The Board also considered that such waivers and reimbursements can provide protection from an increase in expenses if a Federated Fund's assets decline. Federated, as it does throughout the year, and specifically in connection with the Board's review of the advisory and subadvisory contracts, furnished information relative to revenue sharing or adviser-paid fees. Federated and the CCO noted that this information should be
Annual Shareholder Report
viewed to determine if there was an incentive to either not apply breakpoints, or to apply breakpoints at higher levels, and should not be viewed to determine the appropriateness of advisory fees. The Board also noted the absence of any applicable regulatory or industry guidelines on this subject, which (as discussed in the CCO Fee Evaluation Report) is compounded by the lack of any common industry practice or general pattern with respect to structuring fund advisory fees with “breakpoints” that serve to reduce the fee as a fund attains a certain size.
The CCO stated that his observations and the information accompanying the CCO Fee Evaluation Report supported a finding by the Board that the management fee for the Fund was reasonable. Under these circumstances, no changes were recommended to, and no objection was raised to the continuation of, the Fund's investment advisory contract. The CCO also recognized that the Board's evaluation of the Federated Funds' advisory and subadvisory arrangements is a continuing and on-going process that is informed by the information that the Board requests and receives from management throughout the course of the year and, in this regard, the CCO noted certain items for future reporting to the Board or further consideration by management as the Board continues its on-going oversight of the Federated Funds.
In its decision to continue an existing investment advisory contract, the Board was mindful of the potential disruptions of the Fund's operations and various risks, uncertainties and other effects that could occur as a result of a decision to terminate or not renew an investment advisory contract. In particular, the Board recognized that many shareholders have invested in the Fund on the strength of the Adviser's industry standing and reputation and with the expectation that the Adviser will have a continuing role in providing advisory services to the Fund. Thus, the Board's approval of the investment advisory contract reflected the fact that it is the shareholders who have effectively selected the Adviser by virtue of having invested in the Fund. The Board concluded that, in light of the factors summarized above, including the nature, quality and scope of the services provided to the Fund by the Adviser and its affiliates, continuation of the investment advisory contract was appropriate.
The Board based its decision to approve the investment advisory contract on the totality of the circumstances and relevant factors and with a view to past and future long-term considerations. Not all of the factors and considerations identified above were necessarily relevant to the Fund, nor did the Board consider any one of them to be determinative. With respect to the factors that were relevant, the Board's decision to approve the continuation of the contract reflects its view that Federated's performance and actions provided a satisfactory basis to support the decision to continue the existing arrangement.
Annual Shareholder Report
Voting Proxies on Fund Portfolio Securities
A description of the policies and procedures that the Fund uses to determine how to vote proxies, if any, relating to securities held in the Fund's portfolio is available, without charge and upon request, by calling 1-800-341-7400. A report on “Form N-PX” of how the Fund voted any such proxies during the most recent 12-month period ended June 30 is available via the Proxy Voting Record (Form N-PX) link associated with the Fund and share class name at www.FederatedInvestors.com/FundInformation. Form N-PX filings are also available at the SEC's website at www.sec.gov.
Quarterly Portfolio Schedule
Each fiscal quarter, the Fund will file with the SEC a complete schedule of its monthly portfolio holdings on “Form N-PORT.” The Fund's holdings as of the end of the third month of every fiscal quarter, as reported on Form N-PORT, will be publicly available on the SEC's website at www.sec.gov within 60 days of the end of the fiscal quarter upon filing. You may also access this information via the link to the Fund and share class name at www.FederatedInvestors.com.
Annual Shareholder Report
Mutual funds are not bank deposits or obligations, are not guaranteed by any bank and are not insured or guaranteed by the U.S. government, the Federal Deposit Insurance Corporation, the Federal Reserve Board or any other government agency. Investment in mutual funds involves investment risk, including the possible loss of principal.
This Report is authorized for distribution to prospective investors only when preceded or accompanied by the Fund's Prospectus, which contains facts concerning its objective and policies, management fees, expenses and other information.
Federated MDT Mid Cap Growth Fund
Federated Investors Funds
4000 Ericsson Drive
Warrendale, PA 15086-7561
Contact us at FederatedInvestors.com
or call 1-800-341-7400.
Federated Securities Corp., Distributor
CUSIP 314172107
CUSIP 314172305
CUSIP 314172198
CUSIP 314172529
G01228-08 (12/19)
Federated is a registered trademark of Federated Investors, Inc.
2019 ©Federated Investors, Inc.
Annual Shareholder Report
October 31, 2019
| Share Class | Ticker | A | SVAAX | C | SVACX | Institutional | SVAIX | R6 | SVALX |
Federated Strategic Value Dividend Fund
Fund Established 2005
A Portfolio of Federated Equity Funds
IMPORTANT NOTICE REGARDING REPORT DELIVERY
Beginning on January 1, 2021, as permitted by regulations adopted by the Securities and Exchange Commission, paper copies of the Fund's shareholder reports like this one will no longer be sent by mail, unless you specifically request paper copies of the reports from the Fund or from your financial intermediary, such as a broker-dealer or bank. Instead, the reports will be made available on a website, and you will be notified by mail each time a report is posted and provided with a website link to access the report.
If you already elected to receive shareholder reports electronically, you will not be affected by this change and you need not take any action. You may elect to receive shareholder reports and other communications from the Fund or your financial intermediary electronically by contacting your financial intermediary (such as a broker-dealer or bank); other shareholders may call the Fund at 1-800-341-7400, Option 4.
You may elect to receive all future reports in paper free of charge. You can inform the Fund or your financial intermediary that you wish to continue receiving paper copies of your shareholder reports by contacting your financial intermediary (such as a broker-dealer or bank); other shareholders may call the Fund at 1-800-341-7400, Option 4. Your election to receive reports in paper will apply to all funds held with the Fund complex or your financial intermediary.
Not FDIC Insured ■ May Lose Value ■ No Bank Guarantee
J. Christopher
Donahue
President
Federated Strategic Value Dividend Fund
Letter from the President
Dear Valued Shareholder,
I am pleased to present the Annual Shareholder Report for your fund covering the period from November 1, 2018 through October 31, 2019. This report includes Management's Discussion of Fund Performance, a complete listing of your fund's holdings, performance information and financial statements along with other important fund information.
In addition, our website, FederatedInvestors.com, offers easy access to Federated resources that include timely fund updates, economic and market insights from our investment strategists, and financial planning tools.
Thank you for investing with Federated. I hope you find this information useful and look forward to keeping you informed.
Sincerely,
J. Christopher Donahue, President
CONTENTS
| 1 |
| 7 |
| 8 |
| 12 |
| 16 |
| 18 |
| 20 |
| 21 |
| 31 |
| 33 |
| 35 |
| 41 |
| 48 |
| 48 |
Management's Discussion of Fund Performance (unaudited)
The total return of Federated Strategic Value Dividend Fund (the “Fund”), based on net asset value for the 12-month reporting period ended October 31, 2019 was 9.68% for the Class A Shares, 9.02% for the Class C Shares, 10.09% for the Institutional Shares and 10.11% for the Class R6 Shares. The 10.11% total return of the Class R6 Shares for the reporting period consisted of 4.80% in dividend income, 3.57% in capital gains and 1.74% change in the net asset value of the shares. The total return of the Dow Jones Select Dividend Index (DJSDI),1 a broad-based securities market index that represents the domestic dividend-paying universe, was 10.67% for the reporting period, while the total return of the Standard and Poor's 500 Index (S&P 500)2 was 14.33% for the same period. The Fund's total return for the fiscal year reflects actual cash flows, transaction costs and other expenses which are not reflected in the total return of the DJSDI or the S&P 500.
The following discussion will focus on the performance of the Fund's Class R6 Shares.
MARKET OVERVIEW
The fiscal year began with a volatile month for stocks all over the world, as plunging oil prices, U.S. election uncertainty, Brexit (the U.K. exiting the European Union) worries and an ongoing trade war between the globe's two biggest economies weighed on investors. Amid all this stood the Federal Reserve System (the “Fed”), which despite market expectations, signaled in December its intention to stick with at least two more rate increases in 2019, as well as a robust pace of balance-sheet reduction. A month after experiencing their worst December since the Great Depression, U.S. equity markets rebounded strongly, with the Dow Jones Industrial Average3 rising 7.2%, its best January in 30 years, the S&P 500 advancing 7.9%, its best January in 32 years, and the NASDAQ Composite Index4 jumping 9.7%, its best January since 2001. The improvement was evident in global markets too, as the MSCI World Index5 rose 7.7% on the month.
Despite petering out in February's final days, stocks rallied strongly for a second straight month as recession fears eased, hopes for a trade truce with China rose and the Fed reinforced its “patient'' message regarding future rate increases. Risk assets continued to rally throughout the second quarter of the fiscal year as recession fears gave way to stronger growth and better-than-expected earnings in the U.S., green shoots overseas and inflation that remained constrained.
Heading into the third quarter of the fiscal year, escalating trade tensions between the U.S. and China, deteriorating economic data across the U.S., Europe and Asia and worries about increased regulatory oversight of tech behemoths brought an abrupt end to what had been the best 4-month start to a
Annual Shareholder Report
year for major domestic equity indexes since at least 1999. U.S. markets rebounded strongly in June after May's sell-off, driven by hopes that the Fed was about to embark on a new easing regime amid softening economic data, stubbornly low inflation and a little more optimism about an eventual U.S.-China trade resolution. The third quarter ended with a thud, as the major indexes plunged the final day of trading in July after Federal Reserve policymakers cut the benchmark rate a quarter point as expected but failed to suggest further reductions may be forthcoming.
During the fourth quarter of the fiscal year, the equity sell-off worsened after President Trump surprised global markets by announcing that a 10% tariff on an additional $300 billion of Chinese goods would take effect on September 1, barring any progress on trade talks. Most global markets were faring even worse, with the MSCI All Country World Ex-US Index6 down more than 4% and the MSCI World Ex-US Index7 off almost 4%. Stocks rebounded later in the quarter aided by better news on the trade and Brexit fronts, signs of a bottoming in U.S. and global manufacturing, a dovish Fed “hold'' at home and more central bank support overseas.
DIVIDEND-BASED PERFORMANCE8
Dedicated to providing its investors with a high and growing income stream from high quality assets, the Fund provided a 30 day SEC yield9 of 3.97% and a gross weighted average dividend yield of 4.66% at fiscal year-end. This substantially exceeded not only the broad market represented by the S&P 500 Index with its 1.95% yield, and the 10 year U.S. Treasury Note (1.69%), but it also surpassed the 4.02% yield of the DJSDI, which aims to reflect the domestic high dividend-paying universe. Dividend growth has remained robust over the trailing 12-months, as 33 companies raised their dividends, declaring 34 total increases, 2 dividend reductions and 1 special dividend. The most notable increases came courtesy of PNC (21.1%), Abbvie (11.5%), Regions Financial (10.7%), Dominion Energy (9.9%), Keycorp (8.8%), Chevron (6.2%) and Exxon Mobile (6.1%). Additionally, Cracker Barrel declared a special dividend which was payable in August. Two dividend reductions were received from Kraft Heinz and Vodafone.
Annual Shareholder Report
Markets were mixed for the fiscal year as the reporting period started and ended with a flight to safety due to increased uncertainty surrounding monetary policy, trade wars and global economic volatility. While the market recovered slightly in the first half of the calendar year evidenced by the high beta/tech/cyclical10 rally, investors flocked again to safe havens as rates declined and trade tensions intensified. Factor performance was also mixed for the fiscal year period, as low beta outperformed high beta by 15.35% and noting the S&P quality ratings, the highest quality stocks (A+) outperformed the lowest quality stocks (C&D) by 19.13%. Contrarily, high yield continued to be pressured, as high yield underperformed low yield by 2.97%, creating a short-term headwind for our high dividend strategy. Sector performance was mixed for the period as REITS, Utilities and Information Technology were the top performers generating returns of 26.73%, 23.71% and 22.6%, respectively. Because of the notable 22.30% exposure the S&P 500 has in Information Technology, the sector accounted for 32% of the total performance of the overall S&P 500. Our strategy has little to no exposure to Information Technology, which provides little opportunity for a rising dividend income stream.
From an absolute perspective, positive contributors to performance within the portfolio were Utilities, Communication Services and REITS which generated returns of 23.77%, 22.42% and 28.39%, respectively. Utilities and REITS achieved positive performance, notably benefiting from the strong performance in defensive investments driven by the intermittent “risk-off” trade. All of the investments within Communication Services posted strong double digit returns, led by AT&T and BCE which appreciated by 33.41% and 28.12%, respectively. Additionally, individual names that contributed importantly to positive performance included Kimberly Clark, GlaxoSmithKline and Coca-Cola which generated solid performance, posting returns of 31.64%, 24.65% and 17.35%, respectively.
Conversely, weakness was noted in Energy, as crude oil prices declined over the period. Additionally, Occidental Petroleum was further pressured by investor concerns surrounding its Anadarko deal. Individual names that further detracted from performance include Altria, Kraft Heinz, Phillip Morris and Imperial. Declining cigarette sales placed short-term pressure on tobacco names in the period as Altria, Imperial and Phillip Morris declined -26.42%, -22.58% and -1.87%, respectively. Altria faced additional short-term price pressure driven by heightened scrutiny regarding their minority stake in JUUL. The portfolio exited its less than 1% position in Kraft Heinz upon disappointing Q4 earnings results, the issuance of weak 2019 guidance and an unexpected 36% dividend cut. The strategy makes every effort to avoid dividend cuts or the sale of depreciated assets, but they do occur on occasion.
Annual Shareholder Report
Due to its focus on high dividend income and growth in that income over time, the strategy will tend to perform best when the markets prefer high-yield, high-quality, low-beta, large-cap stocks. Often times, the strategy may also outperform in flat markets or periods of market distress. Conversely, the Fund may lag the broad market when investors prefer low-yield, low-quality, high-beta, small-cap stocks. During the reporting period, the Fund faced a significant near-term headwind with lowest-yielding stocks outperforming high-yielding investments. Regardless of the market environment, the Fund remained consistent and focused on its core goals of providing a stable high and rising income stream from high-quality investments, while attempting to expose investors to a lower level of risk.
| 1 | Please see the footnotes to the line graphs below for definitions of, and further information about, the DJSDI. |
| 2 | Please see the footnotes to the line graphs below for definitions of, and further information about, the S&P 500. |
| 3 | The Dow Jones Industrial Average is a price weighted index comprised of 30 of the largest and most widely held public companies in the United States.* |
| 4 | The NASDAQ Composite Index measures all NASDAQ domestic and international based common type stocks listed on The NASDAQ Stock Market. Today the NASDAQ Composite includes over 3,000 companies.* |
| 5 | The MSCI World Index captures large- and mid-cap representation across 23 developed market countries. The index covers approximately 85% of the free float-adjusted market capitalization in each country.* |
| 6 | The MSCI All Country World ex US Index captures large- and mid-cap representation across 22 of 23 developed markets countries (excluding the U.S.) and 23 emerging markets countries. The index covers approximately 85% of the global equity opportunity set outside the U.S.* |
| 7 | The MSCI World ex US Index captures large- and mid-cap representation across 22 of 23 Developed Markets (DM) countries–excluding the United States. The index covers approximately 85% of the free float-adjusted market capitalization in each country.* |
| 8 | There are no guarantees that dividend paying stocks will continue to pay dividends. In addition, dividend-paying stocks may not experience the same capital appreciation potential as non-dividend-paying stocks. |
| 9 | In the absence of temporary expense waivers and reimbursements, the 30-day SEC yield for R6 Shares would have been 3.97%. The dividend yield represents the average yield of the underlying securities within the Fund. The average yield is a weighted average calculated by assigning a weight to each of the underlying securities in the Fund based upon the portion of total assets of the Fund each underlying security represents. |
| 10 | Beta measures a security/fund's volatility relative to the market. A beta greater than 1.00 suggests the security/fund has historically been more volatile than the market as measured by the fund's benchmark. A beta less than 1.00 suggests the security/fund has historically had less volatility relative to the market. |
| * | The index is unmanaged, and it is not possible to invest directly in an index. |
Annual Shareholder Report
FUND PERFORMANCE AND GROWTH OF A $10,000 INVESTMENT
The graph below illustrates the hypothetical investment of $10,0001 in the Federated Strategic Value Dividend Fund from October 31, 2009 to October 31, 2019, compared to the Standard & Poor's 500 Index (S&P 500)2 and the Dow Jones U.S. Select Dividend Index (DJSDI).3The Average Annual Total Return table below shows returns for each class averaged over the stated periods.
Growth of a $10,000 InvestmenT
Growth of $10,000 as of October 31, 2019
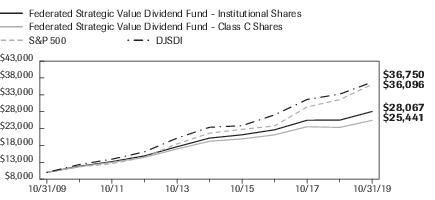
| Federated Strategic Value Dividend Fund - | Institutional Shares | Class C Shares | S&P 500 | DJSDI |
| F | F | I | I |
| 10/31/2009 | 10,000 | 10,000 | 10,000 | 10,000 |
| 10/31/2010 | 11,834 | 11,721 | 11,652 | 12,332 |
| 10/31/2011 | 13,192 | 12,971 | 12,594 | 13,928 |
| 10/31/2012 | 14,890 | 14,471 | 14,509 | 16,092 |
| 10/31/2013 | 17,615 | 16,957 | 18,452 | 20,157 |
| 10/31/2014 | 20,174 | 19,235 | 21,638 | 23,379 |
| 10/31/2015 | 21,156 | 19,942 | 22,764 | 23,854 |
| 10/31/2016 | 22,639 | 21,133 | 23,790 | 27,071 |
| 10/31/2017 | 25,471 | 23,549 | 29,412 | 31,625 |
| 10/31/2018 | 25,495 | 23,335 | 31,573 | 33,205 |
| 10/31/2019 | 28,067 | 25,441 | 36,096 | 36,750 |
41 graphic description end -->
| ■ | Total returns shown for Class C Shares include the maximum contingent deferred sales charge of 1.00% as applicable. |
The Fund offers multiple share classes whose performance may be greater than or less than its other share class(es) due to differences in sales charges and expenses. See the Average Annual Return table below for the returns of additional classes not shown in the line graph above.
Annual Shareholder Report
Average Annual Total Returns for the Period Ended 10/31/2019
(returns reflect all applicable sales charges and contingent sales charges as specified below in footnote #1)
| | 1 Year | 5 Years | 10 Years |
| Class A Shares | 3.71% | 5.33% | 9.97% |
| Class C Shares | 8.02% | 5.75% | 9.79% |
| Institutional Shares | 10.09% | 6.83% | 10.87% |
| Class R6 Shares4 | 10.11% | 6.80% | 10.79% |
| S&P 500 | 14.33% | 10.78% | 13.70% |
| DJSDI | 10.67% | 9.47% | 13.90% |
Performance data quoted represents past performance which is no guarantee of future results. Investment return and principal value will fluctuate so that an investor's shares, when redeemed, may be worth more or less than their original cost. Mutual fund performance changes over time and current performance may be lower or higher than what is stated. For current to the most recent month-end performance and after-tax returns, visit FederatedInvestors.com or call 1-800-341-7400. Returns shown do not reflect the deduction of taxes that a shareholder would pay on Fund distributions or the redemption of Fund shares. Mutual funds are not obligations of or guaranteed by any bank and are not federally insured.
| 1 | Represents a hypothetical investment of $10,000 in the Fund after deducting applicable sales charges: For Class A Shares, the maximum sales charge of 5.50% ($10,000 investment minus $550 sales charge = $9,450); for Class C Shares, a 1.00% contingent deferred sales charge would be applied on any redemption less than one year from the purchase date. The Fund's performance assumes the reinvestment of all dividends and distributions. The S&P 500 and DJSDI have been adjusted to reflect reinvestment of dividends on securities in the indexes. |
| 2 | The S&P 500 is a capitalization-weighted index of 500 stocks designed to measure performance of the broad domestic economy through changes in the aggregate market value of 500 stocks representing all major industries. The S&P 500 is not adjusted to reflect sales loads, expenses or other fees that the Securities and Exchange Commission (SEC) requires to be reflected in the Fund's performance. The index is unmanaged and, unlike the Fund, is not affected by cash flows. It is not possible to invest in an index. |
| 3 | The DJSDI aims to represent U.S. leading stocks by dividend yield. One hundred stocks are selected to the index by dividend yield, subject to screens for dividend-per-share growth rate, dividend payout ratio and average daily dollar trading volume. Components are weighted by indicated annual dividend. The DJSDI is not adjusted to reflect sales loads, expenses or other fees that the SEC requires to be reflected in the Fund's performance. The index is unmanaged and, unlike the Fund, is not affected by cash flows. It is not possible to invest in an index. |
| 4 | The Fund's R6 Shares commenced operations on June 29, 2016. For the period prior to the commencement of operations of the R6 Shares, the performance information shown is for Institutional Shares adjusted to remove any voluntary waiver of fund expenses related to the Institutional Shares that occurred during the period prior to commencement of the R6 Shares. |
Annual Shareholder Report
Portfolio of Investments Summary Table (unaudited)
At October 31, 2019, the Fund's sector composition1 was as follows:
| Sector Composition | Percentage of
Total Net Assets |
| Utilities | 17.6% |
| Energy | 16.8% |
| Communication Services | 16.1% |
| Health Care | 14.8% |
| Consumer Staples | 13.6% |
| Financials | 7.5% |
| Real Estate | 6.3% |
| Materials | 3.3% |
| Industrials | 2.3% |
| Consumer Discretionary | 0.8% |
| Cash Equivalents2 | 0.6% |
| Other Assets and Liabilities—Net3 | 0.3% |
| TOTAL | 100.0% |
| 1 | Except for Cash Equivalents and Other Assets and Liabilities, sector classifications are based upon, and individual portfolio securities are assigned to, the classifications of the Global Industry Classification Standard (GICS) except that the Adviser assigns a classification to securities not classified by the GICS and to securities for which the Adviser does not have access to the classification made by the GICS. |
| 2 | Cash Equivalents include any investments in money market mutual funds and/or overnight repurchase agreements. |
| 3 | Assets, other than investments in securities, less liabilities. See Statement of Assets and Liabilities. |
Annual Shareholder Report
Portfolio of Investments
October 31, 2019
| Shares | | | Dividend
Yield
(unaudited) | Value in
U.S. Dollars |
| | | COMMON STOCKS—99.1% | | |
| | | Communication Services—16.1% | | |
| 15,057,334 | | AT&T, Inc. | 5.30% | $579,556,786 |
| 7,263,685 | | BCE, Inc. | 4.31 | 344,571,436 |
| 7,305,716 | | Verizon Communications, Inc. | 4.07 | 441,776,646 |
| 104,967,014 | | Vodafone Group PLC | 4.93 | 214,738,133 |
| | | TOTAL | | 1,580,643,001 |
| | | Consumer Discretionary—0.8% | | |
| 510,275 | | Cracker Barrel Old Country Store, Inc. | 3.34 | 79,347,763 |
| | | Consumer Staples—13.6% | | |
| 3,321,841 | | Altria Group, Inc. | 7.50 | 148,785,258 |
| 3,526,475 | | British American Tobacco PLC | 7.51 | 123,256,412 |
| 682,500 | | Kimberly-Clark Corp. | 3.10 | 90,690,600 |
| 1,464,775 | | PepsiCo, Inc. | 2.78 | 200,923,187 |
| 5,168,878 | | Philip Morris International, Inc. | 5.75 | 420,953,424 |
| 6,498,500 | | The Coca-Cola Co. | 2.94 | 353,713,355 |
| | | TOTAL | | 1,338,322,236 |
| | | Energy—16.8% | | |
| 66,064,675 | | BP PLC | 6.48 | 419,789,032 |
| 2,835,174 | | Chevron Corp. | 4.10 | 329,277,108 |
| 4,986,925 | | Enbridge, Inc. | 5.23 | 181,628,420 |
| 5,767,450 | | Exxon Mobil Corp. | 5.15 | 389,706,597 |
| 3,408,640 | | Occidental Petroleum Corp. | 7.80 | 138,049,920 |
| 3,357,650 | | Royal Dutch Shell PLC, Class B | 6.55 | 96,700,840 |
| 1,854,425 | | TC Energy Corp. | 3.84 | 93,474,509 |
| | | TOTAL | | 1,648,626,426 |
| | | Financials—7.5% | | |
| 2,970,850 | | Canadian Imperial Bank of Commerce | 4.36 | 253,326,371 |
| 4,408,250 | | Invesco Ltd. | 7.37 | 74,146,765 |
| 6,363,525 | | KeyCorp | 4.12 | 114,352,544 |
| 1,225,125 | | PNC Financial Services Group | 3.14 | 179,725,838 |
| 6,918,100 | | Regions Financial Corp. | 3.85 | 111,381,410 |
| | | TOTAL | | 732,932,928 |
| | | Health Care—14.8% | | |
| 5,788,000 | | AbbVie, Inc. | 5.38 | 460,435,400 |
| 495,500 | | Amgen, Inc. | 2.72 | 105,665,375 |
Annual Shareholder Report
| Shares | | | Dividend
Yield
(unaudited) | Value in
U.S. Dollars |
| | | COMMON STOCKS—cont. | | |
| | | Health Care—cont. | | |
| 3,270,400 | | Gilead Sciences, Inc. | 3.96% | $208,357,184 |
| 15,546,273 | | GlaxoSmithKline PLC | 4.52 | 356,310,268 |
| 8,438,775 | | Pfizer, Inc. | 3.75 | 323,795,797 |
| | | TOTAL | | 1,454,564,024 |
| | | Industrials—2.3% | | |
| 1,967,225 | | United Parcel Service, Inc. | 3.33 | 226,565,303 |
| | | Materials—3.3% | | |
| 15,041,350 | | Amcor PLC | 5.04 | 143,193,652 |
| 1,975,650 | | LyondellBasell Industries N.V. | 4.68 | 177,215,805 |
| | | TOTAL | | 320,409,457 |
| | | Real Estate—6.3% | | |
| 2,058,825 | | National Retail Properties, Inc. | 3.08 | 121,285,381 |
| 3,382,539 | | Omega Healthcare Investors, Inc. | 3.94 | 148,967,018 |
| 3,792,444 | | Ventas, Inc. | 4.87 | 246,888,104 |
| 1,058,555 | | Welltower, Inc. | 3.65 | 96,000,353 |
| | | TOTAL | | 613,140,856 |
| | | Utilities—17.6% | | |
| 4,956,045 | | Dominion Energy, Inc. | 4.45 | 409,121,515 |
| 4,025,959 | | Duke Energy Corp. | 4.01 | 379,486,895 |
| 32,241,290 | | National Grid-SP PLC | 5.25 | 376,911,620 |
| 8,417,305 | | PPL Corp. | 4.93 | 281,895,545 |
| 4,432,443 | | Southern Co. | 3.96 | 277,736,878 |
| | | TOTAL | | 1,725,152,453 |
| | | TOTAL COMMON STOCKS
(IDENTIFIED COST $8,836,360,133) | | 9,719,704,447 |
| | | INVESTMENT COMPANY—0.6% | | |
| 60,544,067 | | Federated Institutional Prime Value Obligations Fund, Institutional Shares, 1.930%1
(IDENTIFIED COST $60,546,135 ) | | 60,562,230 |
| | | TOTAL INVESTMENT IN SECURITIES—99.7%
(IDENTIFIED COST $8,896,906,268)2 | | 9,780,266,677 |
| | | OTHER ASSETS AND LIABILITIES - NET—0.3%3 | | 25,701,931 |
| | | TOTAL NET ASSETS—100% | | $9,805,968,608 |
Annual Shareholder Report
Affiliated fund holdings are investment companies which are managed by the Adviser or an affiliate of the Adviser. Transactions with affiliated fund holdings during the period ended October 31, 2019, were as follows:
| | Federated
Institutional
Prime Value
Obligations Fund,
Institutional Shares |
| Balance of Shares Held 10/31/2018 | 77,185,637 |
| Purchases/Additions | 1,784,576,735 |
| Sales/Reductions | (1,801,218,305) |
| Balance of Shares Held 10/31/2019 | 60,544,067 |
| Value | $60,562,230 |
| Change in Unrealized Appreciation/Depreciation | $5,782 |
| Net Realized Gain/(Loss) | $18,463 |
| Dividend Income | $1,321,401 |
| 1 | 7-day net yield. |
| 2 | The cost of investments for federal tax purposes amounts to $8,898,707,092. |
| 3 | Assets, other than investments in securities, less liabilities. See Statement of Assets and Liabilities. |
Note: The categories of investments are shown as a percentage of total net assets at October 31, 2019.
Various inputs are used in determining the value of the Fund's investments. These inputs are summarized in the three broad levels listed below:
Level 1—quoted prices in active markets for identical securities.
Level 2—other significant observable inputs (including quoted prices for similar securities, interest rates, prepayment speeds, credit risk, etc.). Also includes securities valued at amortized cost.
Level 3—significant unobservable inputs (including the Fund's own assumptions in determining the fair value of investments).
The inputs or methodology used for valuing securities are not an indication of the risk associated with investing in those securities.
Annual Shareholder Report
The following is a summary of the inputs used, as of October 31, 2019, in valuing the Fund's assets carried at fair value:
| Valuation Inputs | | | | |
| | Level 1—
Quoted
Prices | Level 2—
Other
Significant
Observable
Inputs | Level 3—
Significant
Unobservable
Inputs | Total |
| Equity Securities: | | | | |
| Common Stocks | | | | |
| Domestic | $7,258,997,406 | $— | $— | $7,258,997,406 |
| International | 873,000,736 | 1,587,706,305 | — | 2,460,707,041 |
| Investment Company | 60,562,230 | — | — | 60,562,230 |
| TOTAL SECURITIES | $8,192,560,372 | $1,587,706,305 | $— | $9,780,266,677 |
See Notes which are an integral part of the Financial Statements
Annual Shareholder Report
Financial Highlights–Class A Shares
(For a Share Outstanding Throughout Each Period)
| Year Ended October 31 | 2019 | 2018 | 2017 | 2016 | 2015 |
| Net Asset Value, Beginning of Period | $5.73 | $6.34 | $5.97 | $6.06 | $6.25 |
| Income From Investment Operations: | | | | | |
| Net investment income | 0.21 | 0.21 | 0.21 | 0.18 | 0.18 |
| Net realized and unrealized gain (loss) | 0.31 | (0.21) | 0.50 | 0.20 | 0.08 |
| TOTAL FROM INVESTMENT OPERATIONS | 0.52 | — | 0.71 | 0.38 | 0.26 |
| Less Distributions: | | | | | |
| Distributions from net investment income | (0.21) | (0.20) | (0.21) | (0.18) | (0.18) |
| Distributions from net realized gain | (0.22) | (0.41) | (0.13) | (0.29) | (0.27) |
| TOTAL DISTRIBUTIONS | (0.43) | (0.61) | (0.34) | (0.47) | (0.45) |
| Net Asset Value, End of Period | $5.82 | $5.73 | $6.34 | $5.97 | $6.06 |
| Total Return1 | 9.68% | (0.16)% | 12.29% | 6.77% | 4.45% |
| Ratios to Average Net Assets: | | | | | |
| Net expenses | 1.06% | 1.05% | 1.06% | 1.05% | 1.05% |
| Net investment income | 3.75% | 3.44% | 3.36% | 3.00% | 3.07% |
| Expense waiver/reimbursement2 | 0.12% | 0.12% | 0.13% | 0.14% | 0.13% |
| Supplemental Data: | | | | | |
| Net assets, end of period (000 omitted) | $1,456,023 | $1,603,675 | $2,400,842 | $3,300,976 | $2,358,470 |
| Portfolio turnover | 33% | 9% | 19% | 21% | 16% |
| 1 | Based on net asset value, which does not reflect the sales charge, redemption fee or contingent deferred sales charge, if applicable. |
| 2 | This expense decrease is reflected in both the net expense and the net investment income ratios shown above. |
See Notes which are an integral part of the Financial Statements
Annual Shareholder Report
Financial Highlights–Class C Shares
(For a Share Outstanding Throughout Each Period)
| Year Ended October 31 | 2019 | 2018 | 2017 | 2016 | 2015 |
| Net Asset Value, Beginning of Period | $5.74 | $6.35 | $5.98 | $6.07 | $6.26 |
| Income From Investment Operations: | | | | | |
| Net investment income | 0.17 | 0.16 | 0.16 | 0.13 | 0.14 |
| Net realized and unrealized gain (loss) | 0.32 | (0.20) | 0.50 | 0.20 | 0.08 |
| TOTAL FROM INVESTMENT OPERATIONS | 0.49 | (0.04) | 0.66 | 0.33 | 0.22 |
| Less Distributions: | | | | | |
| Distributions from net investment income | (0.17) | (0.16) | (0.16) | (0.13) | (0.14) |
| Distributions from net realized gain | (0.22) | (0.41) | (0.13) | (0.29) | (0.27) |
| TOTAL DISTRIBUTIONS | (0.39) | (0.57) | (0.29) | (0.42) | (0.41) |
| Net Asset Value,End of Period | $5.84 | $5.74 | $6.35 | $5.98 | $6.07 |
| Total Return1 | 9.02% | (0.91)% | 11.43% | 5.97% | 3.68% |
| Ratios to Average Net Assets: | | | | | |
| Net expenses | 1.81% | 1.80% | 1.81% | 1.80% | 1.80% |
| Net investment income | 3.00% | 2.69% | 2.65% | 2.25% | 2.31% |
| Expense waiver/reimbursement2 | 0.13% | 0.13% | 0.12% | 0.13% | 0.13% |
| Supplemental Data: | | | | | |
| Net assets, end of period (000 omitted) | $1,217,811 | $1,472,755 | $1,997,389 | $2,210,580 | $1,592,942 |
| Portfolio turnover | 33% | 9% | 19% | 21% | 16% |
| 1 | Based on net asset value, which does not reflect the sales charge, redemption fee or contingent deferred sales charge, if applicable. |
| 2 | This expense decrease is reflected in both the net expense and the net investment income ratios shown above. |
See Notes which are an integral part of the Financial Statements
Annual Shareholder Report
Financial Highlights–Institutional Shares
(For a Share Outstanding Throughout Each Period)
| Year Ended October 31 | 2019 | 2018 | 2017 | 2016 | 2015 |
| Net Asset Value, Beginning of Period | $5.76 | $6.37 | $6.00 | $6.09 | $6.27 |
| Income From Investment Operations: | | | | | |
| Net investment income | 0.23 | 0.22 | 0.23 | 0.19 | 0.20 |
| Net realized and unrealized gain (loss) | 0.32 | (0.20) | 0.50 | 0.20 | 0.09 |
| TOTAL FROM INVESTMENT OPERATIONS | 0.55 | 0.02 | 0.73 | 0.39 | 0.29 |
| Less Distributions: | | | | | |
| Distributions from net investment income | (0.23) | (0.22) | (0.23) | (0.19) | (0.20) |
| Distributions from net realized gain | (0.22) | (0.41) | (0.13) | (0.29) | (0.27) |
| TOTAL DISTRIBUTIONS | (0.45) | (0.63) | (0.36) | (0.48) | (0.47) |
| Net Asset Value, End of Period | $5.86 | $5.76 | $6.37 | $6.00 | $6.09 |
| Total Return1 | 10.09% | 0.09% | 12.51% | 7.01% | 4.87% |
| Ratios to Average Net Assets: | | | | | |
| Net expenses | 0.81% | 0.80% | 0.81% | 0.80% | 0.80% |
| Net investment income | 3.99% | 3.69% | 3.64% | 3.23% | 3.31% |
| Expense waiver/reimbursement2 | 0.12% | 0.12% | 0.13% | 0.13% | 0.13% |
| Supplemental Data: | | | | | |
| Net assets, end of period (000 omitted) | $6,632,015 | $7,027,654 | $9,293,143 | $9,154,739 | $5,961,135 |
| Portfolio turnover | 33% | 9% | 19% | 21% | 16% |
| 1 | Based on net asset value. |
| 2 | This expense decrease is reflected in both the net expense and the net investment income ratios shown above. |
See Notes which are an integral part of the Financial Statements
Annual Shareholder Report
Financial Highlights–Class R6 Shares
(For a Share Outstanding Throughout Each Period)
| | Year Ended October 31, | Period
Ended
10/31/20161 |
| 2019 | 2018 | 2017 |
| Net Asset Value, Beginning of Period | $5.76 | $6.37 | $6.00 | $6.23 |
| Income From Investment Operations: | | | | |
| Net investment income | 0.23 | 0.22 | 0.23 | 0.06 |
| Net realized and unrealized gain (loss) | 0.32 | (0.20) | 0.50 | (0.22) |
| TOTAL FROM INVESTMENT OPERATIONS | 0.55 | 0.02 | 0.73 | (0.16) |
| Less Distributions: | | | | |
| Distributions from net investment income | (0.23) | (0.22) | (0.23) | (0.07) |
| Distributions from net realized gain | (0.22) | (0.41) | (0.13) | — |
| TOTAL DISTRIBUTIONS | (0.45) | (0.63) | (0.36) | (0.07) |
| Net Asset Value, End of Period | $5.86 | $5.76 | $6.37 | $6.00 |
| Total Return2 | 10.11% | 0.11% | 12.53% | (2.61)% |
| Ratios to Average Net Assets: | | | | |
| Net expenses | 0.79% | 0.78% | 0.79% | 0.78%3 |
| Net investment income | 4.00% | 3.69% | 3.73% | 1.43%3 |
| Expense waiver/reimbursement4 | 0.07% | 0.07% | 0.07% | 0.11%3 |
| Supplemental Data: | | | | |
| Net assets, end of period (000 omitted) | $500,119 | $452,251 | $242,131 | $19,279 |
| Portfolio turnover | 33% | 9% | 19% | 21%5 |
| 1 | Reflects operations for the period from June 29, 2016 (commencement of operations) to October 31, 2016. |
| 2 | Based on net asset value. Total returns for periods of less than one year are not annualized. |
| 3 | Computed on an annualized basis. |
| 4 | This expense decrease is reflected in both the net expense and the net investment income ratios shown above. |
| 5 | Portfolio turnover is calculated at the Fund level. Percentage indicated was calculated for the fiscal year ended October 31, 2016. |
See Notes which are an integral part of the Financial Statements
Annual Shareholder Report
Statement of Assets and Liabilities
October 31, 2019
| Assets: | | |
| Investment in securities, at value including $60,562,230 of investment in an affiliated holding* (identified cost $8,896,906,268) | | $9,780,266,677 |
| Income receivable | | 30,368,735 |
| Receivable for shares sold | | 10,995,530 |
| Income receivable from an affiliated holding | | 129,090 |
| TOTAL ASSETS | | 9,821,760,032 |
| Liabilities: | | |
| Payable for shares redeemed | $12,249,882 | |
| Payable for other service fees (Notes 2 and 5) | 1,070,521 | |
| Payable for transfer agent fees (Note 2) | 953,559 | |
| Payable for distribution services fee (Note 5) | 769,717 | |
| Payable for investment adviser fee (Note 5) | 191,095 | |
| Payable for administrative fee (Note 5) | 21,127 | |
| Accrued expenses (Note 5) | 535,523 | |
| TOTAL LIABILITIES | | 15,791,424 |
| Net assets for 1,676,128,123 shares outstanding | | $9,805,968,608 |
| Net Assets Consists of: | | |
| Paid-in capital | | $8,452,632,464 |
| Total distributable earnings (loss) | | 1,353,336,144 |
| TOTAL NET ASSETS | | $9,805,968,608 |
Annual Shareholder Report
Statement of Assets and Liabilities–continued
| Net Asset Value, Offering Price and Redemption Proceeds Per Share: | | |
| Class A Shares: | | |
| Net asset value per share ($1,456,023,407 ÷ 249,968,204 shares outstanding), no par value, unlimited shares authorized | | $5.82 |
| Offering price per share (100/94.50 of $5.82) | | $6.16 |
| Redemption proceeds per share | | $5.82 |
| Class C Shares: | | |
| Net asset value per share ($1,217,810,665 ÷ 208,663,855 shares outstanding), no par value, unlimited shares authorized | | $5.84 |
| Offering price per share | | $5.84 |
| Redemption proceeds per share (99.00/100 of $5.84) | | $5.78 |
| Institutional Shares: | | |
| Net asset value per share ($6,632,015,301 ÷ 1,132,130,834 shares outstanding), no par value, unlimited shares authorized | | $5.86 |
| Offering price per share | | $5.86 |
| Redemption proceeds per share | | $5.86 |
| Class R6 Shares: | | |
| Net asset value per share ($500,119,235 ÷ 85,365,230 shares outstanding), no par value, unlimited shares authorized | | $5.86 |
| Offering price per share | | $5.86 |
| Redemption proceeds per share | | $5.86 |
| * | See information listed after the Fund's Portfolio of Investments. |
See Notes which are an integral part of the Financial Statements
Annual Shareholder Report
Statement of Operations
Year Ended October 31, 2019
| Investment Income: | | | |
| Dividends (including $1,321,401 received from an affiliated holding* and net of foreign taxes withheld of $7,365,704) | | | $473,051,056 |
| Expenses: | | | |
| Investment adviser fee (Note 5) | | $73,962,088 | |
| Administrative fee (Note 5) | | 7,837,846 | |
| Custodian fees | | 384,560 | |
| Transfer agent fees (Note 2) | | 7,989,687 | |
| Directors'/Trustees' fees (Note 5) | | 71,761 | |
| Auditing fees | | 26,151 | |
| Legal fees | | 11,309 | |
| Distribution services fee (Note 5) | | 9,875,148 | |
| Other service fees (Notes 2 and 5) | | 6,930,557 | |
| Portfolio accounting fees | | 196,132 | |
| Share registration costs | | 215,407 | |
| Printing and postage | | 427,804 | |
| Taxes | | 29,500 | |
| Miscellaneous (Note 5) | | 78,873 | |
| TOTAL EXPENSES | | 108,036,823 | |
| Waiver and Reimbursements: | | | |
| Waiver/reimbursement of investment adviser fee (Note 5) | $(6,696,597) | | |
| Reimbursement of other operating expenses (Notes 2 and 5) | (5,213,966) | | |
| TOTAL WAIVER AND REIMBURSEMENTS | | (11,910,563) | |
| Net expenses | | | 96,126,260 |
| Net investment income | | | $376,924,796 |
Annual Shareholder Report
Statement of Operations–continued
| Realized and Unrealized Gain (Loss) on Investments and Foreign Currency Transactions: | | | |
| Net realized gain on investments (including realized gain of $18,463 on sales of investments in an affiliated holding*) and foreign currency transactions | | | $456,820,382 |
| Net change in unrealized appreciation of investments and translation of assets and liabilities in foreign currency (including net change in unrealized appreciation of $5,782 of investments in an affiliated holding*) | | | 67,705,532 |
| Net realized and unrealized gain (loss) on investments and foreign currency transactions | | | 524,525,914 |
| Change in net assets resulting from operations | | | $901,450,710 |
| * | See information listed after the Fund's Portfolio of Investments. |
See Notes which are an integral part of the Financial Statements
Annual Shareholder Report
Statement of Changes in Net Assets
| Year Ended October 31 | 2019 | 2018 |
| Increase (Decrease) in Net Assets | | |
| Operations: | | |
| Net investment income | $376,924,796 | $428,909,216 |
| Net realized gain | 456,820,382 | 394,950,618 |
| Net change in unrealized appreciation/depreciation | 67,705,532 | (834,661,008) |
| CHANGE IN NET ASSETS RESULTING FROM OPERATIONS | 901,450,710 | (10,801,174) |
| Distributions to Shareholders: | | |
| Class A Shares | (114,942,699) | (212,132,521) |
| Class C Shares | (95,273,313) | (174,186,287) |
| Institutional Shares | (530,242,937) | (901,695,954) |
| Class R6 Shares | (35,421,670) | (26,564,384) |
| CHANGE IN NET ASSETS RESULTING FROM DISTRIBUTIONS TO SHAREHOLDERS | (775,880,619) | (1,314,579,146) |
| Share Transactions: | | |
| Proceeds from sale of shares | 2,203,967,091 | 2,871,966,166 |
| Net asset value of shares issued to shareholders in payment of distributions declared | 655,243,949 | 1,111,008,649 |
| Cost of shares redeemed | (3,735,146,572) | (6,034,765,984) |
| CHANGE IN NET ASSETS RESULTING FROM SHARE TRANSACTIONS | (875,935,532) | (2,051,791,169) |
| Change in net assets | (750,365,441) | (3,377,171,489) |
| Net Assets: | | |
| Beginning of period | 10,556,334,049 | 13,933,505,538 |
| End of period | $9,805,968,608 | $10,556,334,049 |
See Notes which are an integral part of the Financial Statements
Annual Shareholder Report
Notes to Financial Statements
October 31, 2019
1. ORGANIZATION
Federated Equity Funds (the “Trust”) is registered under the Investment Company Act of 1940, as amended (the “Act”), as an open-end management investment company. The Trust consists of nine portfolios. The financial statements included herein are only those of Federated Strategic Value Dividend Fund (the “Fund”), a diversified portfolio. The financial statements of the other portfolios are presented separately. The assets of each portfolio are segregated and a shareholder's interest is limited to the portfolio in which shares are held. Each portfolio pays its own expenses. The Fund offers four classes of shares: Class A Shares, Class C Shares, Institutional Shares and Class R6 Shares. All shares of the Fund have equal rights with respect to voting, except on class-specific matters. The investment objective of the Fund is to provide income and long-term capital appreciation.
On March 30, 2017, the Fund's T Share Class became effective with the Securities and Exchange Commission (SEC), but is not yet offered for sale.
Effective August 1, 2018, an automatic conversion feature for Class C Shares was implemented. Pursuant to this automatic conversion feature, after Class C Shares have been held for ten years from the date of purchase, they will automatically convert to Class A Shares on the next monthly conversion processing date.
2. SIGNIFICANT ACCOUNTING POLICIES
The following is a summary of significant accounting policies consistently followed by the Fund in the preparation of its financial statements. These policies are in conformity with U.S. generally accepted accounting principles (GAAP).
Investment Valuation
In calculating its net asset value (NAV), the Fund generally values investments as follows:
| ■ | Equity securities listed on an exchange or traded through a regulated market system are valued at their last reported sale price or official closing price in their principal exchange or market. |
| ■ | Shares of other mutual funds or non-exchange-traded investment companies are valued based upon their reported NAVs. |
| ■ | Derivative contracts listed on exchanges are valued at their reported settlement or closing price, except that options are valued at the mean of closing bid and asked quotations. |
| ■ | Over-the-counter (OTC) derivative contracts are fair valued using price evaluations provided by a pricing service approved by the Fund's Board of Trustees (the “Trustees”). |
| ■ | Fixed-income securities are fair valued using price evaluations provided by a pricing service approved by the Trustees. |
| ■ | For securities that are fair valued in accordance with procedures established by and under the general supervision of the Trustees, certain factors may be considered, such as: the last traded or purchase price of the security, information obtained by contacting the issuer or dealers, analysis of the issuer's financial statements or other available documents, fundamental analytical data, the nature and duration of restrictions on disposition, the movement of the market in which the security is normally traded, public trading in similar securities or derivative contracts of the issuer or comparable issuers, movement of a relevant index, or other factors including but not limited to industry changes and relevant government actions. |
Annual Shareholder Report
If any price, quotation, price evaluation or other pricing source is not readily available when the NAV is calculated, if the Fund cannot obtain price evaluations from a pricing service or from more than one dealer for an investment within a reasonable period of time as set forth in the Fund's valuation policies and procedures, or if information furnished by a pricing service, in the opinion of the valuation committee (“Valuation Committee”), is deemed not representative of the fair value of such security, the Fund uses the fair value of the investment determined in accordance with the procedures described below. There can be no assurance that the Fund could obtain the fair value assigned to an investment if it sold the investment at approximately the time at which the Fund determines its NAV per share.
Fair Valuation and Significant Events Procedures
The Trustees have ultimate responsibility for determining the fair value of investments for which market quotations are not readily available. The Trustees have appointed a Valuation Committee comprised of officers of the Fund, Federated Equity Management Company of Pennsylvania (the “Adviser”) and certain of the Adviser's affiliated companies to assist in determining fair value and in overseeing the calculation of the NAV. The Trustees have also authorized the use of pricing services recommended by the Valuation Committee to provide fair value evaluations of the current value of certain investments for purposes of calculating the NAV. The Valuation Committee employs various methods for reviewing third-party pricing-service evaluations including periodic reviews of third-party pricing services' policies, procedures and valuation methods (including key inputs, methods, models and assumptions), transactional back-testing, comparisons of evaluations of different pricing services, and review of price challenges by the Adviser based on recent market activity. In the event that market quotations and price evaluations are not available for an investment, the Valuation Committee determines the fair value of the investment in accordance with procedures adopted by the Trustees. The Trustees periodically review and approve the fair valuations made by the Valuation Committee and any changes made to the procedures.
Factors considered by pricing services in evaluating an investment include the yields or prices of investments of comparable quality, coupon, maturity, call rights and other potential prepayments, terms and type, reported transactions, indications as to values from dealers and general market conditions. Some pricing services provide a single price evaluation reflecting the bid-side of the market for an investment (a “bid” evaluation). Other pricing services offer both bid evaluations and price evaluations indicative of a price between the prices bid and asked for the investment (a “mid” evaluation). The Fund normally uses bid evaluations for any U.S. Treasury and Agency securities, mortgage-backed securities and municipal securities. The Fund normally uses mid evaluations for any other types of fixed-income securities and any OTC derivative contracts. In the event that market quotations and price evaluations are not available for an investment, the fair value of the investment is determined in accordance with procedures adopted by the Trustees.
Annual Shareholder Report
The Trustees also have adopted procedures requiring an investment to be priced at its fair value whenever the Adviser determines that a significant event affecting the value of the investment has occurred between the time as of which the price of the investment would otherwise be determined and the time as of which the NAV is computed. An event is considered significant if there is both an affirmative expectation that the investment's value will change in response to the event and a reasonable basis for quantifying the resulting change in value. Examples of significant events that may occur after the close of the principal market on which a security is traded, or after the time of a price evaluation provided by a pricing service or a dealer, include:
| ■ | With respect to securities traded principally in foreign markets, significant trends in U.S. equity markets or in the trading of foreign securities index futures contracts; |
| ■ | Political or other developments affecting the economy or markets in which an issuer conducts its operations or its securities are traded; |
| ■ | Announcements concerning matters such as acquisitions, recapitalizations, litigation developments, or a natural disaster affecting the issuer's operations or regulatory changes or market developments affecting the issuer's industry. |
The Trustees have adopted procedures whereby the Valuation Committee uses a pricing service to provide factors to update the fair value of equity securities traded principally in foreign markets from the time of the close of their respective foreign stock exchanges to the pricing time of the Fund. For other significant events, the Fund may seek to obtain more current quotations or price evaluations from alternative pricing sources. If a reliable alternative pricing source is not available, the Fund will determine the fair value of the investment in accordance with the fair valuation procedures approved by the Trustees. The Trustees have ultimate responsibility for any fair valuations made in response to a significant event.
Repurchase Agreements
The Fund may invest in repurchase agreements for short-term liquidity purposes. It is the policy of the Fund to require the other party to a repurchase agreement to transfer to the Fund's custodian or sub-custodian eligible securities or cash with a market value (after transaction costs) at least equal to the repurchase price to be paid under the repurchase agreement. The eligible securities are transferred to accounts with the custodian or sub-custodian in which the Fund holds a “securities entitlement” and exercises “control” as those terms are defined in the Uniform Commercial Code. The Fund has established procedures for monitoring the market value of the transferred securities and requiring the transfer of additional eligible securities if necessary to equal at least the repurchase price. These procedures also allow the other party to require securities to be transferred from the account to the extent that their market value exceeds the repurchase price or in exchange for other eligible securities of equivalent market value.
The insolvency of the other party or other failure to repurchase the securities may delay the disposition of the underlying securities or cause the Fund to receive less than the full repurchase price. Under the terms of the repurchase agreement, any amounts received by the Fund in excess of the repurchase price and related transaction costs must be remitted to the other party.
The Fund may enter into repurchase agreements in which eligible securities are transferred into joint trading accounts maintained by the custodian or sub-custodian for investment companies and other clients advised by the Fund's Adviser and its affiliates. The Fund will participate on a pro rata basis with the other investment companies and clients in its share of the securities transferred under such repurchase agreements and in its share of proceeds from any repurchase or other disposition of such securities.
Annual Shareholder Report
Investment Income, Gains and Losses, Expenses and Distributions
Investment transactions are accounted for on a trade-date basis. Realized gains and losses from investment transactions are recorded on an identified-cost basis. Interest income and expenses are accrued daily. Dividend income and distributions to shareholders are recorded on the ex-dividend date. Foreign dividends are recorded on the ex-dividend date or when the Fund is informed of the ex-dividend date. Distributions of net investment income, if any, are declared and paid monthly. Non-cash dividends included in dividend income, if any, are recorded at fair value. Amortization/accretion of premium and discount is included in investment income. Investment income, realized and unrealized gains and losses, and certain fund-level expenses are allocated to each class based on relative average daily net assets, except that select classes will bear certain expenses unique to those classes. The detail of the total fund expense waiver and reimbursements of $11,910,563 is disclosed in various locations in this Note 2 and Note 5.
For the year ended October 31, 2019, transfer agent fees for the Fund were as follows:
| | Transfer Agent
Fees Incurred | Transfer Agent
Fees Reimbursed |
| Class A Shares | $1,186,672 | $(808,595) |
| Class C Shares | 1,109,660 | (773,621) |
| Institutional Shares | 5,666,449 | (3,631,750) |
| Class R6 Shares | 26,906 | — |
| TOTAL | $7,989,687 | $(5,213,966) |
Dividends are declared separately for each class. No class has preferential dividend rights; differences in per share dividend rates are generally due to differences in separate class expenses.
Other Service Fees
The Fund may pay other service fees up to 0.25% of the average daily net assets of the Fund's Class A Shares and Class C Shares to unaffiliated financial intermediaries or to Federated Shareholder Services Company (FSSC) for providing services to shareholders and maintaining shareholder accounts. Subject to the terms described in the Expense Limitation note, FSSC may voluntarily reimburse the Fund for other service fees. For the year ended October 31, 2019, other service fees for the Fund were as follows:
| | Other Service
Fees Incurred |
| Class A Shares | $3,638,841 |
| Class C Shares | 3,291,716 |
| TOTAL | $6,930,557 |
Federal Taxes
It is the Fund's policy to comply with the Subchapter M provision of the Internal Revenue Code and to distribute to shareholders each year substantially all of its income. Accordingly, no provision for federal income tax is necessary. As of and during the year ended October 31, 2019, the Fund did not have a liability for any uncertain tax positions. The Fund
Annual Shareholder Report
recognizes interest and penalties, if any, related to tax liabilities as income tax expense in the Statement of Operations. As of October 31, 2019, tax years 2016 through 2019 remain subject to examination by the Fund's major tax jurisdictions, which include the United States of America and the Commonwealth of Massachusetts.
The Fund may be subject to taxes imposed by governments of countries in which it invests. Such taxes are generally based on either income or gains earned or repatriated. The Fund accrues and applies such taxes to net investment income, net realized gains and net unrealized gains as income and/or gains are earned.
When-Issued and Delayed-Delivery Transactions
The Fund may engage in when-issued or delayed-delivery transactions. The Fund records when-issued securities on the trade date and maintains security positions such that sufficient liquid assets will be available to make payment for the securities purchased. Securities purchased on a when-issued or delayed-delivery basis are marked to market daily and begin earning interest on the settlement date. Losses may occur on these transactions due to changes in market conditions or the failure of counterparties to perform under the contract.
Foreign Currency Translation
The accounting records of the Fund are maintained in U.S. dollars. All assets and liabilities denominated in foreign currencies are translated into U.S. dollars based on the rates of exchange of such currencies against U.S. dollars on the date of valuation. Purchases and sales of securities, income and expenses are translated at the rate of exchange quoted on the respective date that such transactions are recorded. The Fund does not isolate that portion of the results of operations resulting from changes in foreign exchange rates on investments from the fluctuations arising from changes in market prices of securities held. Such fluctuations are included with the net realized and unrealized gain or loss from investments.
Reported net realized foreign exchange gains or losses arise from sales of foreign currencies, currency gains or losses realized between the trade and settlement dates on securities transactions, the difference between the amounts of dividends, interest and foreign withholding taxes recorded on the Fund's books, and the U.S. dollar equivalent of the amounts actually received or paid. Net unrealized foreign exchange gains and losses arise from changes in the value of assets and liabilities other than investments in securities at period end, resulting from changes in the exchange rate.
Other
The preparation of financial statements in conformity with GAAP requires management to make estimates and assumptions that affect the amounts of assets, liabilities, expenses and revenues reported in the financial statements. Actual results could differ from those estimated. The Fund applies investment company accounting and reporting guidance.
Annual Shareholder Report
3. SHARES OF BENEFICIAL INTEREST
The following tables summarize share activity:
| Year Ended October 31 | 2019 | 2018 |
| Class A Shares: | Shares | Amount | Shares | Amount |
| Shares sold | 45,025,375 | $252,233,312 | 46,144,895 | $271,546,749 |
| Shares issued to shareholders in payment of distributions declared | 19,620,677 | 109,050,725 | 33,539,550 | 201,556,976 |
| Shares redeemed | (94,389,716) | (525,047,879) | (178,854,915) | (1,057,339,169) |
| NET CHANGE RESULTING FROM CLASS A SHARE TRANSACTIONS | (29,743,664) | $(163,763,842) | (99,170,470) | $(584,235,444) |
| Year Ended October 31 | 2019 | 2018 |
| Class C Shares: | Shares | Amount | Shares | Amount |
| Shares sold | 21,409,272 | $119,245,885 | 23,324,540 | $138,225,158 |
| Shares issued to shareholders in payment of distributions declared | 15,609,041 | 86,815,966 | 26,377,999 | 158,959,316 |
| Shares redeemed | (84,784,306) | (474,079,827) | (107,985,328) | (633,401,260) |
| NET CHANGE RESULTING FROM CLASS C SHARE TRANSACTIONS | (47,765,993) | $(268,017,976) | (58,282,789) | $(336,216,786) |
| Year Ended October 31 | 2019 | 2018 |
| Institutional Shares: | Shares | Amount | Shares | Amount |
| Shares sold | 293,586,685 | $1,645,788,849 | 349,950,548 | $2,078,118,296 |
| Shares issued to shareholders in payment of distributions declared | 76,639,483 | 428,341,959 | 120,161,836 | 725,463,126 |
| Shares redeemed | (457,444,077) | (2,556,973,504) | (710,349,398) | (4,174,087,691) |
| NET CHANGE RESULTING FROM INSTITUTIONAL SHARE TRANSACTIONS | (87,217,909) | $(482,842,696) | (240,237,014) | $(1,370,506,269) |
| Year Ended October 31 | 2019 | 2018 |
| Class R6 Shares: | Shares | Amount | Shares | Amount |
| Shares sold | 33,257,961 | $186,699,045 | 65,454,435 | $384,075,963 |
| Shares issued to shareholders in payment of distributions declared | 5,550,054 | 31,035,299 | 4,157,953 | 25,029,231 |
| Shares redeemed | (31,901,466) | (179,045,362) | (29,168,849) | (169,937,864) |
| NET CHANGE RESULTING FROM CLASS R6 SHARE TRANSACTIONS | 6,906,549 | $38,688,982 | 40,443,539 | $239,167,330 |
| NET CHANGE RESULTING FROM TOTAL FUND SHARE TRANSACTIONS | (157,821,017) | $(875,935,532) | (357,246,734) | $(2,051,791,169) |
Annual Shareholder Report
4. FEDERAL TAX INFORMATION
The tax character of distributions as reported on the Statement of Changes in Net Assets for the years ended October 31, 2019 and 2018, was as follows:
| | 2019 | 2018 |
| Ordinary income1 | $399,580,989 | $556,263,091 |
| Long-term capital gains | $376,299,630 | $758,316,055 |
| 1 | For tax purposes, short-term capital gain distributions are considered ordinary income distributions. |
As of October 31, 2019, the components of distributable earnings on a tax-basis were as follows:
| Undistributed ordinary income2 | $24,937,654 |
| Undistributed long-term capital gains | $446,814,480 |
| Net unrealized appreciation | $881,584,010 |
| 2 | For tax purposes, short-term capital gains are considered ordinary income in determining distributable earnings. |
The difference between book-basis and tax-basis net unrealized appreciation is attributable to differing treatments for the deferral of losses on wash sales.
At October 31, 2019, the cost of investments for federal tax purposes was $8,898,707,092. The net unrealized appreciation of investments for federal tax purposes was $881,559,585. This consists of net unrealized appreciation from investments for those securities having an excess of value over cost of $1,297,288,970 and net unrealized depreciation from investments for those securities having an excess of cost over value of $415,729,385.
5. INVESTMENT ADVISER FEE AND OTHER TRANSACTIONS WITH AFFILIATES
Investment Adviser Fee
The advisory agreement between the Fund and the Adviser provides for an annual fee equal to 0.75% of the Fund's average daily net assets. Subject to the terms described in the Expense Limitation note, the Adviser may voluntarily choose to waive any portion of its fee and/or reimburse certain operating expenses of the Fund. For the year ended October 31, 2019, the Adviser voluntarily waived $6,631,691 of its fee and voluntarily reimbursed $5,213,966 of transfer agent fees.
The Adviser has agreed to reimburse the Fund for certain investment adviser fees as a result of transactions in other affiliated investment companies. For the year ended October 31, 2019, the Adviser reimbursed $64,906.
Annual Shareholder Report
Administrative Fee
Federated Administrative Services (FAS), under the Administrative Services Agreement, provides the Fund with administrative personnel and services. For purposes of determining the appropriate rate breakpoint, “Investment Complex” is defined as all of the Federated Funds subject to a fee under the Administrative Services Agreement. The fee paid to FAS is based on the average daily net assets of the Investment Complex as specified below:
| Administrative Fee | Average Daily Net Assets
of the Investment Complex |
| 0.100% | on assets up to $50 billion |
| 0.075% | on assets over $50 billion |
Subject to the terms described in the Expense Limitation note, FAS may voluntarily choose to waive any portion of its fee. For the year ended October 31, 2019, the annualized fee paid to FAS was 0.080% of average daily net assets of the Fund.
In addition, FAS may charge certain out-of-pocket expenses to the Fund.
Distribution Services Fee
The Fund has adopted a Distribution Plan (the “Plan”) pursuant to Rule 12b-1 under the Act. Under the terms of the Plan, the Fund will compensate Federated Securities Corp. (FSC), the principal distributor, from the daily net assets of the Fund's Class A Shares and Class C Shares to finance activities intended to result in the sale of these shares. The Plan provides that the Fund may incur distribution expenses at the following percentages of average daily net assets annually to compensate FSC:
| Share Class Name | Percentage of Average Daily
Net Assets of Class |
| Class A Shares | 0.05% |
| Class C Shares | 0.75% |
Subject to the terms described in the Expense Limitation note, FSC may voluntarily choose to waive any portion of its fee. For the year ended October 31, 2019, distribution services fees for the Fund were as follows:
| | Distribution Services
Fees Incurred |
| Class C Shares | $9,875,148 |
When FSC receives fees, it may pay some or all of them to financial intermediaries whose customers purchase shares. For the year ended October 31, 2019, FSC retained $728,672 of fees paid by the Fund. For the year ended October 31, 2019, the Fund's Class A Shares did not incur a distribution services fee; however, it may begin to incur this fee upon approval of the Trustees.
Annual Shareholder Report
Sales Charges
Front-end sales charges and contingent deferred sales charges (CDSC) do not represent expenses of the Fund. They are deducted from the proceeds of sales of Fund shares prior to investment or from redemption proceeds prior to remittance, as applicable. For the year ended October 31, 2019, FSC retained $265,960 in sales charges from the sale of Class A Shares. FSC also retained $8,553 and $89,562 of CDSC relating to redemptions of Class A Shares and Class C Shares, respectively.
Other Service Fees
For the year ended October 31, 2019, FSSC received $22,793 of the other service fees disclosed in Note 2.
Expense Limitation
The Adviser and certain of its affiliates (which may include FSC, FAS and FSSC) on their own initiative have agreed to waive certain amounts of their respective fees and/or reimburse expenses. Total annual fund operating expenses (as shown in the financial highlights, excluding tax reclaim recovery expenses, interest expense, extraordinary expenses and proxy-related expenses paid by the Fund, if any) paid by the Fund's Class A Shares, Class C Shares, Institutional Shares and Class R6 Shares (after the voluntary waivers and/or reimbursements) will not exceed 1.05%, 1.80%, 0.80% and 0.78% (the “Fee Limit”), respectively, up to but not including the later of (the “Termination Date”): (a) January 1, 2021; or (b) the date of the Fund's next effective Prospectus. While the Adviser and its applicable affiliates currently do not anticipate terminating or increasing these arrangements prior to the Termination Date, these arrangements may only be terminated or the Fee Limit increased prior to the Termination Date with the agreement of the Trustees.
Directors'/Trustees' and Miscellaneous Fees
Certain Officers and Trustees of the Fund are Officers and Directors or Trustees of certain of the above companies. To efficiently facilitate payment, Independent Directors'/Trustees' fees and certain expenses related to conducting meetings of the Directors/Trustees and other miscellaneous expenses are paid by an affiliate of the Adviser which in due course are reimbursed by the Fund. These expenses related to conducting meetings of the Directors/Trustees and other miscellaneous expenses may be included in Accrued and Miscellaneous Expenses on the Statement of Assets and Liabilities and Statement of Operations, respectively.
6. INVESTMENT TRANSACTIONS
Purchases and sales of investments, excluding long-term U.S. government securities and short-term obligations, for the year ended October 31, 2019, were as follows:
| Purchases | $3,245,963,208 |
| Sales | $4,520,643,944 |
7. CONCENTRATION OF RISK
The Fund may invest a portion of its assets in securities of companies that are deemed by the Fund's management to be classified in similar business sectors. Economic developments may have an effect on the liquidity and volatility of the portfolio securities.
Annual Shareholder Report
8. LINE OF CREDIT
The Fund participates with certain other Federated Funds, on a several basis, in an up to $500,000,000 unsecured, 364-day, committed, revolving line of credit (LOC) agreement. The LOC was made available to finance temporarily the repurchase or redemption of shares of the Fund, failed trades, payment of dividends, settlement of trades and for other short-term, temporary or emergency general business purposes. The Fund cannot borrow under the LOC if an inter-fund loan is outstanding. The Fund's ability to borrow under the LOC also is subject to the limitations of the Act and various conditions precedent that must be satisfied before the Fund can borrow. Loans under the LOC are charged interest at a fluctuating rate per annum equal to the highest, on any day, of (a) (i) the federal funds effective rate, (ii) the one month London Interbank Offered Rate (LIBOR), and (iii) 0.0%, plus (b) a margin. The LOC also requires the Fund to pay, quarterly in arrears and at maturity, its pro rata share of a commitment fee based on the amount of the lenders' commitment that has not been utilized. As of October 31, 2019, the Fund had no outstanding loans. During the year ended October 31, 2019, the Fund did not utilize the LOC.
9. INTERFUND LENDING
Pursuant to an Exemptive Order issued by the SEC, the Fund, along with other funds advised by subsidiaries of Federated Investors, Inc., may participate in an interfund lending program. This program provides an alternative credit facility allowing the Fund to borrow from other participating affiliated funds. As of October 31, 2019, there were no outstanding loans. During the year ended October 31, 2019, the program was not utilized.
10. FEDERAL TAX INFORMATION (UNAUDITED)
For the year ended October 31, 2019, the amount of long-term capital gains designated by the Fund was $376,299,630.
For the fiscal year ended October 31, 2019, 100% of total ordinary income (including short-term capital gain) distributions made by the Fund are qualifying dividends which may be subject to a maximum tax rate of 15%, as provided for by the Jobs and Growth Tax Relief Act of 2003. Complete information is reported in conjunction with the reporting of your distributions on Form 1099-DIV.
Of the ordinary income (including short-term capital gain) distributions made by the Fund during the year ended October 31, 2019, 75.01% qualify for the dividend received deduction available to corporate shareholders.
Annual Shareholder Report
Report of Independent Registered Public Accounting Firm
TO THE BOARD OF Trustees OF Federated Equity Funds AND SHAREHOLDERS OF Federated Strategic Value Dividend Fund:
Opinion on the Financial Statements
We have audited the accompanying statement of assets and liabilities of Federated Strategic Value Dividend Fund (the “Fund”) (one of the portfolios constituting Federated Equity Funds (the “Trust”)), including the portfolio of investments, as of October 31, 2019, and the related statement of operations for the year then ended, the statement of changes in net assets for each of the two years in the period then ended, the financial highlights for each of the five years in the period then ended and the related notes (collectively referred to as the “financial statements”). In our opinion, the financial statements present fairly, in all material respects, the financial position of the Fund (one of the portfolios constituting Federated Equity Funds) at October 31, 2019, the results of its operations for the year then ended, the changes in its net assets for each of the two years in the period then ended and its financial highlights for each of the five years in the period then ended, in conformity with U.S. generally accepted accounting principles.
Basis for Opinion
These financial statements are the responsibility of the Trust's management. Our responsibility is to express an opinion on the Fund's financial statements based on our audits We are a public accounting firm registered with the Public Company Accounting Oversight Board (United States) (“PCAOB”) and are required to be independent with respect to the Trust in accordance with the U.S. federal securities laws and the applicable rules and regulations of the Securities and Exchange Commission and the PCAOB.
We conducted our audits in accordance with standards of the PCAOB. Those standards require that we plan and perform the audit to obtain reasonable assurance about whether the financial statements are free of material misstatement, whether due to error or fraud. The Trust is not required to have, nor were we engaged to perform, an audit of the Trust's internal control over financial reporting. As part of our audits, we are required to obtain an understanding of internal control over financial reporting, but not for the purpose of expressing an opinion on the effectiveness of the Trust's internal control over financial reporting. Accordingly, we express no such opinion.
Annual Shareholder Report
Our audits included performing procedures to assess the risks of material misstatement of the financial statements, whether due to error or fraud, and performing procedures that respond to those risks. Such procedures included examining, on a test basis, evidence regarding the amounts and disclosures in the financial statements. Our procedures included confirmation of securities owned as of October 31, 2019, by correspondence with the custodian and others or by other appropriate auditing procedures where replies from others were not received. Our audits also included evaluating the accounting principles used and significant estimates made by management, as well as evaluating the overall presentation of the financial statements. We believe that our audits provide a reasonable basis for our opinion.
We have served as the auditor of one or more Federated investment companies since 1979.
Boston, Massachusetts
December 20, 2019
Annual Shareholder Report
Shareholder Expense Example (unaudited)
As a shareholder of the Fund, you incur two types of costs: (1) transaction costs, including sales charges (“loads”) on purchase or redemption payments; and (2) ongoing costs, including management fees and to the extent applicable, distribution (12b-1) fees and/or other service fees and other Fund expenses. This Example is intended to help you to understand your ongoing costs (in dollars) of investing in the Fund and to compare these costs with the ongoing costs of investing in other mutual funds. It is based on an investment of $1,000 invested at the beginning of the period and held for the entire period from May 1, 2019 to October 31, 2019.
ACTUAL EXPENSES
The first section of the table below provides information about actual account values and actual expenses. You may use the information in this section, together with the amount you invested, toestimate the expenses that you incurred over the period. Simply divide your account value by $1,000 (for example, an $8,600 account value divided by $1,000 = 8.6), then multiply the result by the number in the first section under the heading entitled “Expenses Paid During Period” to estimate the expenses attributable to your investment during this period.
HYPOTHETICAL EXAMPLE FOR COMPARISON PURPOSES
The second section of the table below provides information about hypothetical account values and hypothetical expenses based on the Fund's actual expense ratio and anassumed rate of return of 5% per year before expenses, which is not the Fund's actual return. Thus, you shouldnot use the hypothetical account values and expenses to estimate the actual ending account balance or your expenses for the period. Rather, these figures are required to be provided to enable you to compare the ongoing costs of investing in the Fund with other funds. To do so, compare this 5% hypothetical example with the 5% hypothetical examples that appear in the shareholder reports of the other funds.
Annual Shareholder Report
Please note that the expenses shown in the table are meant to highlight your ongoing costs only and do not reflect any transaction costs, such as sales charges (“loads”) on purchase or redemption payments. Therefore, the second section of the table is useful in comparing ongoing costs only, and will not help you determine the relativetotal costs of owning different funds. In addition, if these transaction costs were included, your costs would have been higher.
| | Beginning
Account Value
5/1/2019 | Ending
Account Value
10/31/2019 | Expenses Paid
During Period1 |
| Actual: | | | |
| Class A Shares | $1,000 | $1,040.00 | $5.45 |
| Class C Shares | $1,000 | $1,035.90 | $9.29 |
| Institutional Shares | $1,000 | $1,041.00 | $4.17 |
| Class R6 Shares | $1,000 | $1,041.10 | $4.06 |
Hypothetical (assuming a 5% return
before expenses): | | | |
| Class A Shares | $1,000 | $1,019.86 | $5.40 |
| Class C Shares | $1,000 | $1,016.08 | $9.20 |
| Institutional Shares | $1,000 | $1,021.12 | $4.13 |
| Class R6 Shares | $1,000 | $1,021.22 | $4.02 |
| 1 | Expenses are equal to the Fund's annualized net expense ratios, multiplied by the average account value over the period, multiplied by 184/365 (to reflect the one-half-year period). The annualized net expense ratios are as follows: |
| | |
| Class A Shares | 1.06% |
| Class C Shares | 1.81% |
| Institutional Shares | 0.81% |
| Class R6 Shares | 0.79% |
Annual Shareholder Report
Board of Trustees and Trust Officers
The Board of Trustees is responsible for managing the Trust's business affairs and for exercising all the Trust's powers except those reserved for the shareholders. The following tables give information about each Trustee and the senior officers of the Fund. Where required, the tables separately list Trustees who are “interested persons” of the Fund (i.e., “Interested” Trustees) and those who are not (i.e., “Independent” Trustees). Unless otherwise noted, the address of each person listed is Federated Investors Tower, 1001 Liberty Avenue, Pittsburgh, PA 15222. The address of all Independent Trustees listed is 4000 Ericsson Drive, Warrendale, PA 15086-7561; Attention: Mutual Fund Board. As of December 31, 2018, the Trust comprised 10 portfolio(s), and the Federated Fund Family consisted of 40 investment companies (comprising 102 portfolios). Unless otherwise noted, each Officer is elected annually. Unless otherwise noted, each Trustee oversees all portfolios in the Federated Fund Family and serves for an indefinite term. The Fund's Statement of Additional Information includes additional information about Trust Trustees and is available, without charge and upon request, by calling 1-800-341-7400.
Interested TRUSTEES Background
Name
Birth Date
Positions Held with Trust
Date Service Began | Principal Occupation(s) for Past Five Years,
Other Directorships Held and Previous Position(s) |
J. Christopher Donahue*
Birth Date: April 11, 1949
President and Trustee
Indefinite Term
Began serving: September 1999 | Principal Occupations: Principal Executive Officer and President of certain of the Funds in the Federated Fund Family; Director or Trustee of the Funds in the Federated Fund Family; President, Chief Executive Officer and Director, Federated Investors, Inc.; Chairman and Trustee, Federated Investment Management Company; Trustee, Federated Investment Counseling; Chairman and Director, Federated Global Investment Management Corp.; Chairman and Trustee, Federated Equity Management Company of Pennsylvania; Trustee, Federated Shareholder Services Company; Director, Federated Services Company.
Previous Positions: President, Federated Investment Counseling; President and Chief Executive Officer, Federated Investment Management Company, Federated Global Investment Management Corp. and Passport Research, Ltd; Chairman, Passport Research, Ltd. |
Annual Shareholder Report
Name
Birth Date
Positions Held with Trust
Date Service Began | Principal Occupation(s) for Past Five Years,
Other Directorships Held and Previous Position(s) |
John B. Fisher*
Birth Date: May 16, 1956
Trustee
Indefinite Term
Began serving: May 2016 | Principal Occupations:Principal Executive Officer and President of certain of the Funds in the Federated Fund Family; Director or Trustee of certain of the Funds in the Federated Fund Family; Vice President, Federated Investors, Inc.; President, Director/Trustee and CEO, Federated Advisory Services Company, Federated Equity Management Company of Pennsylvania, Federated Global Investment Management Corp., Federated Investment Counseling, Federated Investment Management Company; President of some of the Funds in the Federated Fund Complex and Director, Federated Investors Trust Company.
Previous Positions: President and Director of the Institutional Sales Division of Federated Securities Corp.; President and Director of Federated Investment Counseling; President and CEO of Passport Research, Ltd.; Director, Edgewood Securities Corp.; Director, Federated Services Company; Director, Federated Investors, Inc.; Chairman and Director, Southpointe Distribution Services, Inc. and President, Technology, Federated Services Company. |
| * | Reasons for “interested” status: J. Christopher Donahue and John B. Fisher are interested due to their beneficial ownership of shares of Federated Investors, Inc. and due to positions they hold with Federated and its subsidiaries. |
INDEPENDENT TRUSTEES Background
Name
Birth Date
Positions Held with Trust
Date Service Began | Principal Occupation(s) for Past Five Years,
Other Directorships Held, Previous Position(s) and Qualifications |
John T. Collins
Birth Date: January 24, 1947
Trustee
Indefinite Term
Began serving: October 2013 | Principal Occupations: Director or Trustee of the Federated Fund Family; formerly, Chairman and CEO, The Collins Group, Inc. (a private equity firm) (Retired).
Other Directorships Held: Director, Chairman of the Compensation Committee, KLX Energy Services Holdings, Inc. (oilfield services); former Director of KLX Corp. (aerospace).
Qualifications: Mr. Collins has served in several business and financial management roles and directorship positions throughout his career. Mr. Collins previously served as Chairman and CEO of The Collins Group, Inc. (a private equity firm) and as a Director of KLX Corp. Mr. Collins serves as Chairman Emeriti, Bentley University. Mr. Collins previously served as Director and Audit Committee Member, Bank of America Corp.; Director, FleetBoston Financial Corp.; and Director, Beth Israel Deaconess Medical Center (Harvard University Affiliate Hospital). |
Annual Shareholder Report
Name
Birth Date
Positions Held with Trust
Date Service Began | Principal Occupation(s) for Past Five Years,
Other Directorships Held, Previous Position(s) and Qualifications |
G. Thomas Hough
Birth Date: February 28, 1955
Trustee
Indefinite Term
Began serving: August 2015 | Principal Occupations: Director or Trustee of the Federated Fund Family; formerly, Vice Chair, Ernst & Young LLP (public accounting firm) (Retired).
Other Directorships Held: Director, Member of Governance and Compensation Committees, Publix Super Markets, Inc.; Director, Chair of the Audit Committee, Equifax, Inc.; Director, Member of the Audit Committee, Haverty Furniture Companies, Inc.
Qualifications: Mr. Hough has served in accounting, business management and directorship positions throughout his career. Mr. Hough most recently held the position of Americas Vice Chair of Assurance with Ernst & Young LLP (public accounting firm). Mr. Hough serves on the President's Cabinet and Business School Board of Visitors for the University of Alabama and is on the Business School Board of Visitors for Wake Forest University. Mr. Hough previously served as an Executive Committee member of the United States Golf Association. |
Maureen Lally-Green
Birth Date: July 5, 1949
Trustee
Indefinite Term
Began serving: August 2009 | Principal Occupations: Director or Trustee of the Federated Fund Family; Adjunct Professor of Law, Duquesne University School of Law; formerly, Dean of the Duquesne University School of Law and Professor of Law and Interim Dean of the Duquesne University School of Law; formerly, Associate General Secretary and Director, Office of Church Relations, Diocese of Pittsburgh.
Other Directorships Held: Director, CNX Resources Corporation (formerly known as CONSOL Energy Inc.).
Qualifications: Judge Lally-Green has served in various legal and business roles and directorship positions throughout her career. Judge Lally-Green previously held the position of Dean of the School of Law of Duquesne University (as well as Interim Dean). Judge Lally-Green previously served as a member of the Superior Court of Pennsylvania and as a Professor of Law, Duquesne University School of Law. Judge Lally-Green also currently holds the positions on not for profit or for profit boards of directors as follows: Director and Chair, UPMC Mercy Hospital; Director and Vice Chair, Our Campaign for the Church Alive!, Inc.; Regent, Saint Vincent Seminary; Member, Pennsylvania State Board of Education (public); and Director CNX Resources Corporation (formerly known as CONSOL Energy Inc.). Judge Lally-Green has held the positions of: Director, Auberle; Director, Epilepsy Foundation of Western and Central Pennsylvania; Director, Ireland Institute of Pittsburgh; Director, Saint Thomas More Society; Director and Chair, Catholic High Schools of the Diocese of Pittsburgh, Inc.; Director, Pennsylvania Bar Institute; Director, St. Vincent College; and Director and Chair, North Catholic High School, Inc. |
Charles F. Mansfield, Jr.
Birth Date: April 10, 1945
Trustee
Indefinite Term
Began serving: January 1999 | Principal Occupations: Director or Trustee of the Federated Fund Family; Management Consultant and Author.
Other Directorships Held: None.
Qualifications: Mr. Mansfield has served as a Marine Corps officer and in several banking, business management, educational roles and directorship positions throughout his long career. He remains active as a Management Consultant and Author. |
Annual Shareholder Report
Name
Birth Date
Positions Held with Trust
Date Service Began | Principal Occupation(s) for Past Five Years,
Other Directorships Held, Previous Position(s) and Qualifications |
Thomas M. O'Neill
Birth Date: June 14, 1951
Trustee
Indefinite Term
Began serving: August 2006 | Principal Occupations: Director or Trustee, Chair of the Audit Committee of the Federated Fund Family; Sole Proprietor, Navigator Management Company (investment and strategic consulting).
Other Directorships Held: None.
Qualifications: Mr. O'Neill has served in several business, mutual fund and financial management roles and directorship positions throughout his career. Mr. O'Neill serves as Director, Medicines for Humanity and Director, The Golisano Children's Museum of Naples, Florida. Mr. O'Neill previously served as Chief Executive Officer and President, Managing Director and Chief Investment Officer, Fleet Investment Advisors; President and Chief Executive Officer, Aeltus Investment Management, Inc.; General Partner, Hellman, Jordan Management Co., Boston, MA; Chief Investment Officer, The Putnam Companies, Boston, MA; Credit Analyst and Lending Officer, Fleet Bank; Director and Consultant, EZE Castle Software (investment order management software); and Director, Midway Pacific (lumber). |
P. Jerome Richey
Birth Date: February 23, 1949
Trustee
Indefinite Term
Began serving: October 2013 | Principal Occupations: Director or Trustee of the Federated Fund Family; Management Consultant; Retired; formerly, Senior Vice Chancellor and Chief Legal Officer, University of Pittsburgh and Executive Vice President and Chief Legal Officer, CNX Resources Corporation (formerly known as CONSOL Energy Inc.).
Other Directorships Held: None.
Qualifications: Mr. Richey has served in several business and legal management roles and directorship positions throughout his career. Mr. Richey most recently held the positions of Senior Vice Chancellor and Chief Legal Officer, University of Pittsburgh. Mr. Richey previously served as Chairman of the Board, Epilepsy Foundation of Western Pennsylvania and Chairman of the Board, World Affairs Council of Pittsburgh. Mr. Richey previously served as Chief Legal Officer and Executive Vice President, CNX Resources Corporation (formerly known as CONSOL Energy Inc.); and Board Member, Ethics Counsel and Shareholder, Buchanan Ingersoll & Rooney PC (a law firm). |
John S. Walsh
Birth Date: November 28, 1957
Trustee
Indefinite Term
Began serving: January 1999 | Principal Occupations: Director or Trustee, and Chair of the Board of Directors or Trustees, of the Federated Fund Family; President and Director, Heat Wagon, Inc. (manufacturer of construction temporary heaters); President and Director, Manufacturers Products, Inc. (distributor of portable construction heaters); President, Portable Heater Parts, a division of Manufacturers Products, Inc.
Other Directorships Held: None.
Qualifications: Mr. Walsh has served in several business management roles and directorship positions throughout his career. Mr. Walsh previously served as Vice President, Walsh & Kelly, Inc. (paving contractors). |
Annual Shareholder Report
OFFICERS
Name
Birth Date
Address
Positions Held with Trust
Date Service Began | Principal Occupation(s) for Past Five Years
and Previous Position(s) |
Lori A. Hensler
Birth Date: January 6, 1967
TREASURER
Officer since: April 2013 | Principal Occupations: Principal Financial Officer and Treasurer of the Federated Fund Family; Senior Vice President, Federated Administrative Services; Financial and Operations Principal for Federated Securities Corp. and Edgewood Services, Inc.; and Assistant Treasurer, Federated Investors Trust Company. Ms. Hensler has received the Certified Public Accountant designation.
Previous Positions: Controller of Federated Investors, Inc.; Senior Vice President and Assistant Treasurer, Federated Investors Management Company; Treasurer, Federated Investors Trust Company; Assistant Treasurer, Federated Administrative Services, Federated Administrative Services, Inc., Federated Securities Corp., Edgewood Services, Inc., Federated Advisory Services Company, Federated Equity Management Company of Pennsylvania, Federated Global Investment Management Corp., Federated Investment Counseling, Federated Investment Management Company, Passport Research, Ltd., and Federated MDTA, LLC; Financial and Operations Principal for Federated Securities Corp., Edgewood Services, Inc. and Southpointe Distribution Services, Inc. |
Peter J. Germain
Birth Date: September 3, 1959
CHIEF LEGAL OFFICER, SECRETARY and EXECUTIVE VICE PRESIDENT
Officer since: January 2005 | Principal Occupations: Mr. Germain is Chief Legal Officer, Secretary and Executive Vice President of the Federated Fund Family. He is General Counsel, Chief Legal Officer, Secretary and Executive Vice President, Federated Investors, Inc.; Trustee and Senior Vice President, Federated Investors Management Company; Trustee and President, Federated Administrative Services; Director and President, Federated Administrative Services, Inc.; Director and Vice President, Federated Securities Corp.; Director and Secretary, Federated Private Asset Management, Inc.; Secretary, Federated Shareholder Services Company; and Secretary, Retirement Plan Service Company of America. Mr. Germain joined Federated in 1984 and is a member of the Pennsylvania Bar Association.
Previous Positions: Deputy General Counsel, Special Counsel, Managing Director of Mutual Fund Services, Federated Investors, Inc.; Senior Vice President, Federated Services Company; and Senior Corporate Counsel, Federated Investors, Inc. |
Stephen Van Meter
Birth Date: June 5, 1975
CHIEF COMPLIANCE OFFICER AND SENIOR VICE PRESIDENT
Officer since: July 2015 | Principal Occupations: Senior Vice President and Chief Compliance Officer of the Federated Fund Family; Vice President and Chief Compliance Officer of Federated Investors, Inc. and Chief Compliance Officer of certain of its subsidiaries. Mr. Van Meter joined Federated in October 2011. He holds FINRA licenses under Series 3, 7, 24 and 66.
Previous Positions: Mr. Van Meter previously held the position of Compliance Operating Officer, Federated Investors, Inc. Prior to joining Federated, Mr. Van Meter served at the United States Securities and Exchange Commission in the positions of Senior Counsel, Office of Chief Counsel, Division of Investment Management and Senior Counsel, Division of Enforcement. |
Annual Shareholder Report
Name
Birth Date
Address
Positions Held with Trust
Date Service Began | Principal Occupation(s) for Past Five Years
and Previous Position(s) |
Stephen F. Auth
Birth Date: September 13, 1956
101 Park Avenue
41st Floor
New York, NY 10178
CHIEF INVESTMENT OFFICER
Officer since: November 2002 | Principal Occupations: Stephen F. Auth is Chief Investment Officer of various Funds in the Federated Fund Family; Executive Vice President, Federated Investment Counseling, Federated Global Investment Management Corp. and Federated Equity Management Company of Pennsylvania.
Previous Positions: Executive Vice President, Federated Investment Management Company and Passport Research, Ltd. (investment advisory subsidiary of Federated); Senior Vice President, Global Portfolio Management Services Division; Senior Vice President, Federated Investment Management Company and Passport Research, Ltd.; Senior Managing Director and Portfolio Manager, Prudential Investments. |
Annual Shareholder Report
Evaluation and Approval of Advisory Contract–May 2019
Federated Strategic Value Dividend Fund (the “Fund”)
At its meetings in May 2019, the Fund's Board of Trustees (the “Board”), including a majority of those Trustees who are not “interested persons” of the Fund, as defined in the Investment Company Act of 1940 (the “Independent Trustees”), reviewed and unanimously approved the continuation of the Fund's investment advisory contract for an additional one-year term. The Board's decision regarding the contract reflects the exercise of its business judgment after considering all of the information received on whether to continue the existing arrangements.
At the request of the Independent Trustees, the Fund's Chief Compliance Officer (the CCO) furnished to the Board in advance of its May 2019 meetings an independent written evaluation presenting on the topics discussed below. The Board considered the CCO's independent written evaluation (the “CCO Fee Evaluation Report”), along with other information, in evaluating the reasonableness of the Fund's management fee and in deciding to approve the continuation of the investment advisory contract. The CCO, in preparing the CCO Fee Evaluation Report, has the authority to retain consultants, experts or staff as reasonably necessary to assist in the performance of his duties, reports directly to the Board, and can be terminated only with the approval of a majority of the Independent Trustees. At the request of the Independent Trustees, the CCO Fee Evaluation Report followed the same general approach and covered the same topics as that of the report that had previously been delivered by the CCO in his capacity as “Senior Officer,” prior to the elimination of the Senior Officer position in December 2017.
The Board also considered judicial decisions concerning allegedly excessive investment advisory fees in making its decision. Using these judicial decisions as a guide, the Board observed that the following factors may be relevant to an adviser's fiduciary duty with respect to its receipt of compensation from a fund: (1) the nature and quality of the services provided by an adviser to a fund and its shareholders (including the performance of the fund, its benchmark, and comparable funds); (2) an adviser's cost of providing the services (including the profitability to an adviser of providing advisory services to a fund); (3) the extent to which an adviser may realize “economies of scale” as a fund grows larger and, if such economies of scale exist, whether they have been shared with a fund and its shareholders or the family of funds; (4) any “fall-out” financial benefits that accrue to an adviser because of its relationship with a fund (including research services received from brokers that execute fund trades and any fees paid to affiliates of an adviser for services rendered to a fund); (5) comparative fee and expense structures (including a comparison of fees paid to an adviser with those paid by similar funds both internally and externally as well as management fees charged to institutional and other advisory clients of the
Annual Shareholder Report
adviser for what might be viewed as like services); and (6) the extent of care, conscientiousness and independence with which the fund's board members perform their duties and their expertise (including whether they are fully informed about all facts the board deems relevant to its consideration of an adviser's services and fees). The Board noted that the Securities and Exchange Commission (SEC) disclosure requirements regarding the basis for the Board's approval of the Fund's investment advisory contract generally align with the factors listed above. The Board was aware of these factors and was guided by them in its review of the Fund's investment advisory contract to the extent it considered them to be appropriate and relevant, as discussed further below.
The Board considered and weighed these factors in light of its substantial accumulated experience in governing the Fund and working with Federated Equity Management Company of Pennsylvania (the “Adviser”) and its affiliates (collectively, “Federated”) on matters relating to the funds advised by Federated (each, a “Federated Fund”). The Independent Trustees were assisted in their deliberations by independent legal counsel.
In addition to the extensive materials that comprise and accompany the CCO Fee Evaluation Report, the Board received detailed information about the Fund and the Federated organization throughout the year, and in connection with its May meetings at which the Board's formal approval of the advisory and subadvisory contracts occurred. In this regard, Federated provided much of this information at each regular meeting of the Board, and furnished additional information specifically in connection with the May meetings. In the months preceding the May meetings, the Board requested and reviewed written materials prepared by Federated in response to requests on behalf of the Independent Trustees encompassing a wide variety of topics. At the May meetings, in addition to meeting in separate sessions of the Independent Trustees without management present, senior management of the Adviser also met with the Independent Trustees and their counsel to discuss the materials presented and such additional matters as the Independent Trustees deemed reasonably necessary to evaluate the advisory and subadvisory contracts. Between regularly scheduled meetings, the Board also received information on particular matters as the need arose.
The Board's consideration of the investment advisory contract included review of the CCO Fee Evaluation Report, accompanying data and additional information covering the following matters, among others: the Adviser's investment philosophy, revenue, profitability, personnel and processes; investment and operating strategies; the Fund's short-term and long-term performance (in absolute terms, both on a gross basis and net of expenses, as well as in terms relative to its particular investment program and certain competitor or “peer group” funds and/or other benchmarks, as appropriate) and comments on the reasons for performance; the Fund's investment objectives; the Fund's expenses, including the advisory fee and the overall expense structure of the Fund (both in absolute terms and relative to similar and/or competing funds), with due
Annual Shareholder Report
regard for contractual or voluntary expense limitations; the use and allocation of brokerage commissions derived from trading the Fund's portfolio securities (if any); and the nature, quality and extent of the advisory and other services provided to the Fund by the Adviser and its affiliates. The Board also considered the preferences and expectations of Fund shareholders; the entrepreneurial and other risks assumed by the Adviser in sponsoring the Fund; the continuing state of competition in the mutual fund industry and market practices; the range of comparable fees for similar funds in the mutual fund industry; the Fund's relationship to the Federated Funds which include a comprehensive array of funds with different investment objectives, policies and strategies which are generally available for exchange without the incurrence of additional sales charges; compliance and audit reports concerning the Federated Funds and the Federated companies that service them (including communications from regulatory agencies), as well as Federated's responses to any issues raised therein; and relevant developments in the mutual fund industry and how the Federated Funds and/or Federated are responding to them. The Board's evaluation process is evolutionary. The criteria considered and the emphasis placed on relevant criteria change in recognition of changing circumstances in the mutual fund marketplace.
While mindful that courts have cautioned against giving too much weight to comparative information concerning fees charged by other advisers for managing funds with comparable investment programs, the Board has found the use of such comparisons to be relevant to its deliberations. In this regard, the Board was presented with, and considered, information regarding the contractual advisory fee rates, net advisory fee rates, total expense ratios and each element of the Fund's total expense ratio (i.e., gross and net advisory fees, custody fees, portfolio accounting fees and transfer agency fees) relative to an appropriate group of peer funds compiled by Federated using data supplied by independent fund ranking organizations (the “Peer Group”). The Board received a description of the composition and methodology used to select the Peer Group. The Board focused on comparisons with other similar mutual funds more heavily than non-mutual fund products or services because it is believed that they are more relevant. For example, other mutual funds are the products most like the Fund, in that they are readily available to Fund shareholders as alternative investment vehicles. Also, they are the type of investment vehicle, in fact, chosen and maintained by the Fund's investors. The range of their fees and expenses, therefore, appears to be a relevant indicator of what consumers have found to be reasonable in the marketplace in which the Fund competes.
Annual Shareholder Report
The Board reviewed the contractual advisory fee rate, net advisory fee rate and other expenses of the Fund and noted the position of the Fund's fee rates relative to its Peer Group. In this regard, the Board noted that the contractual advisory fee rate was above the median of the relevant Peer Group, but the Board noted the applicable waivers and reimbursements, and that the overall expense structure of the Fund remained competitive in the context of other factors considered relevant by the Board.
For comparison, the CCO reviewed the fees charged by Federated for providing advisory services to products other than the Federated Funds (e.g., institutional separate accounts and third-party unaffiliated mutual funds for which Federated serves as sub-adviser) (referenced to as “Comparable Funds/Accounts”). With respect to Comparable Funds/Accounts other than third-party mutual funds, the CCO concluded that they are inherently different products. Those differences include, but are not limited to, different types of targeted investors; different applicable laws and regulations; different legal structures; different average account sizes and portfolio management techniques made necessary by different cash flows and different associated costs; and the time spent by portfolio managers and their teams, as well as personnel in the Funds Financial Services, Legal, Compliance and Risk Management departments, in reviewing securities pricing, addressing different administrative responsibilities, addressing different degrees of risk associated with management and a variety of different costs. The CCO also reviewed the differences in the nature of the services required for Federated to manage its proprietary mutual fund business versus managing a discrete pool of assets as a sub-adviser to another institution's mutual fund, and that Federated generally performs significant additional services and assumes substantially greater risks in managing the Fund and other Federated Funds than in its role as sub-adviser to an unaffiliated third-party mutual fund. The CCO did not consider the fees for providing advisory services to Comparable Funds/Accounts to be determinative in judging the appropriateness of the Federated Funds' advisory fees.
The CCO noted that the services, administrative responsibilities and risks associated with such relationships is quite different than serving as a primary adviser to a fund.
Following such evaluation, and full deliberations, the Board concluded that the fees and expenses of the Fund are reasonable and supported renewal of the Fund's investment advisory contract.
The Board considered the nature, extent and quality of the services provided to the Fund by the Adviser and the resources of the Adviser and its affiliates dedicated to the Fund. In this regard, the Board evaluated, among other things, the Adviser's personnel, experience, track record, financial resources, overall reputation and willingness to invest in personnel and infrastructure that benefit the Fund. In addition, the Board reviewed the qualifications, backgrounds and responsibilities of the portfolio management team primarily responsible for the day-to-day management of the Fund and the Adviser's ability and experience in
Annual Shareholder Report
attracting and retaining qualified personnel to service the Fund. The Board noted the investment research and company engagement capabilities of the Adviser and its affiliates. The Board also noted the compliance program of the Adviser and the compliance-related resources provided to the Fund by the Adviser, including the Adviser's commitment to respond to rulemaking initiatives of the SEC. The Fund's ability to deliver competitive performance when compared to its Peer Group was also deemed to be relevant by the Board as a useful indicator of how the Adviser is executing the Fund's investment program. The Adviser's ability to execute this program was one of the Board's considerations in reaching a conclusion that the nature, extent and quality of the Adviser's investment management services warrant the continuation of the investment advisory contract.
In evaluating the Fund's investment performance, the Board considered performance results in light of the Fund's investment objective, strategies and risks, as disclosed in the Fund's prospectus. The Board considered detailed investment reports on the Fund's performance that were provided to the Board throughout the year and in connection with the May meetings. The CCO also reviewed information regarding the performance of other mutual funds in the Peer Group, noting the CCO's view that comparisons to fund peer groups may be helpful, though not conclusive, in evaluating the performance of the Adviser in managing the Fund. The Board considered, in evaluating such comparisons, that in some cases there may be differences in the funds' objectives or investment management techniques, or the costs to implement the funds, even within the same Peer Group.
For the periods covered by the CCO Fee Evaluation Report, the Fund's performance for the one-year and five-year periods was above the median of the relevant Peer Group, and the Fund's performance fell below the median of the relevant Peer Group for the three-year period. The Board discussed the Fund's performance with the Adviser and recognized the efforts being taken by the Adviser in the context of other factors considered relevant by the Board.
Following such evaluation, and full deliberations, the Board concluded that the performance of the Fund supported renewal of the Fund's investment advisory contract.
The Board also received financial information about Federated, including information regarding the compensation and ancillary (or “fall-out”) benefits Federated derived from its relationships with the Federated Funds. This information covered not only the fees under the investment advisory contracts, but also fees received by Federated's subsidiaries for providing other services to the Federated Funds under separate contracts (e.g., for serving as the Federated funds' administrator and distributor). In this regard, the Board considered that certain Federated subsidiaries provide distribution and shareholder services to the Federated Funds, for which they may be compensated through distribution and servicing fees paid pursuant to Rule 12b-1 plans or otherwise. The information also detailed any indirect benefit Federated may derive from its
Annual Shareholder Report
receipt of research services from brokers who execute Federated Fund trades. In addition, the Board considered the fact that, in order for a Federated Fund to be competitive in the marketplace, the Adviser and its affiliates frequently waived fees and/or reimbursed expenses and have disclosed to Federated Fund investors and/or indicated to the Board their intention to do so in the future. Moreover, the Board receives regular reporting as to the institution, adjustment or elimination of these voluntary waivers. The Board considered Federated's previous reductions in contractual management fees to certain Federated Funds in response to the CCO's recommendations in the prior year's CCO Fee Evaluation Report.
Federated furnished information, requested by the CCO, that reported revenues on a fund-by-fund basis and made estimates of the allocation of expenses on a fund-by-fund basis, using allocation methodologies specified by the CCO. The CCO noted that, while these cost allocation reports apply consistent allocation processes, the inherent difficulties in allocating costs continues to cause the CCO to question the precision of the process and to conclude that such reports may be unreliable, since a single change in an allocation estimate may dramatically alter the resulting estimate of cost and/or profitability of a Federated Fund and may produce unintended consequences. The allocation information, including the CCO's view that fund-by-fund estimations may be unreliable, was considered in the evaluation by the Board.
The Board and the CCO also reviewed information compiled by Federated comparing its profitability information to other publicly held fund management companies, including information regarding profitability trends over time. In this regard, the CCO concluded that Federated's profit margins did not appear to be excessive. The CCO also noted that Federated appeared financially sound, with the resources necessary to fulfill its obligations under its contracts with the Fund.
The CCO Fee Evaluation Report also discussed the notion of possible realization of “economies of scale” as a fund grows larger, the difficulties of calculating economies of scale at an individual fund level, and the extent to which potential scale benefits are shared with shareholders. In this regard, the Board considered that Federated has made significant and long-term investments in areas that support all of the Federated Funds, such as personnel and processes for the portfolio management, shareholder services, compliance, internal audit and risk management functions, as well as systems technology (including technology relating to cybersecurity) and that the benefits of these investments (as well as any economies of scale, should they exist) were likely to be shared with the Federated Fund family as a whole. The Board noted that Federated's investments in these areas are extensive. In addition, the Board considered that the Adviser and its affiliates have frequently waived fees and/or reimbursed expenses and that this has allowed potential economies of scale to be shared with shareholders. The Board also considered that such waivers and reimbursements can provide protection from an increase in expenses if a
Annual Shareholder Report
Federated Fund's assets decline. Federated, as it does throughout the year, and specifically in connection with the Board's review of the advisory and subadvisory contracts, furnished information relative to revenue sharing or adviser-paid fees. Federated and the CCO noted that this information should be viewed to determine if there was an incentive to either not apply breakpoints, or to apply breakpoints at higher levels, and should not be viewed to determine the appropriateness of advisory fees. The Board also noted the absence of any applicable regulatory or industry guidelines on this subject, which (as discussed in the CCO Fee Evaluation Report) is compounded by the lack of any common industry practice or general pattern with respect to structuring fund advisory fees with “breakpoints” that serve to reduce the fee as a fund attains a certain size.
The CCO stated that his observations and the information accompanying the CCO Fee Evaluation Report supported a finding by the Board that the management fee for the Fund was reasonable. Under these circumstances, no changes were recommended to, and no objection was raised to the continuation of, the Fund's investment advisory contract. The CCO also recognized that the Board's evaluation of the Federated Funds' advisory and subadvisory arrangements is a continuing and on-going process that is informed by the information that the Board requests and receives from management throughout the course of the year and, in this regard, the CCO noted certain items for future reporting to the Board or further consideration by management as the Board continues its on-going oversight of the Federated Funds.
In its decision to continue an existing investment advisory contract, the Board was mindful of the potential disruptions of the Fund's operations and various risks, uncertainties and other effects that could occur as a result of a decision to terminate or not renew an investment advisory contract. In particular, the Board recognized that many shareholders have invested in the Fund on the strength of the Adviser's industry standing and reputation and with the expectation that the Adviser will have a continuing role in providing advisory services to the Fund. Thus, the Board's approval of the investment advisory contract reflected the fact that it is the shareholders who have effectively selected the Adviser by virtue of having invested in the Fund. The Board concluded that, in light of the factors summarized above, including the nature, quality and scope of the services provided to the Fund by the Adviser and its affiliates, continuation of the investment advisory contract was appropriate.
The Board based its decision to approve the investment advisory contract on the totality of the circumstances and relevant factors and with a view to past and future long-term considerations. Not all of the factors and considerations identified above were necessarily relevant to the Fund, nor did the Board consider any one of them to be determinative. With respect to the factors that were relevant, the Board's decision to approve the continuation of the contract reflects its view that Federated's performance and actions provided a satisfactory basis to support the decision to continue the existing arrangement.
Annual Shareholder Report
Voting Proxies on Fund Portfolio Securities
A description of the policies and procedures that the Fund uses to determine how to vote proxies, if any, relating to securities held in the Fund's portfolio is available, without charge and upon request, by calling 1-800-341-7400. A report on “Form N-PX” of how the Fund voted any such proxies during the most recent 12-month period ended June 30 is available via the Proxy Voting Record (Form N-PX) link associated with the Fund and share class name at www.FederatedInvestors.com/FundInformation. Form N-PX filings are also available at the SEC's website at www.sec.gov.
Quarterly Portfolio Schedule
Each fiscal quarter, the Fund will file with the SEC a complete schedule of its monthly portfolio holdings on “Form N-PORT.” The Fund's holdings as of the end of the third month of every fiscal quarter, as reported on Form N-PORT, will be publicly available on the SEC's website at www.sec.gov within 60 days of the end of the fiscal quarter upon filing. You may also access this information via the link to the Fund and share class name at www.FederatedInvestors.com.
Annual Shareholder Report
Mutual funds are not bank deposits or obligations, are not guaranteed by any bank and are not insured or guaranteed by the U.S. government, the Federal Deposit Insurance Corporation, the Federal Reserve Board or any other government agency. Investment in mutual funds involves investment risk, including the possible loss of principal.
This Report is authorized for distribution to prospective investors only when preceded or accompanied by the Fund's Prospectus, which contains facts concerning its objective and policies, management fees, expenses and other information.
Federated Strategic Value Dividend Fund
Federated Investors Funds
4000 Ericsson Drive
Warrendale, PA 15086-7561
Contact us at FederatedInvestors.com
or call 1-800-341-7400.
Federated Securities Corp., Distributor
CUSIP 314172586
CUSIP 314172578
CUSIP 314172560
CUSIP 31421N881
33982 (12/19)
Federated is a registered trademark of Federated Investors, Inc.
2019 ©Federated Investors, Inc.
Annual Shareholder Report
October 31, 2019
| Share Class | Ticker | A | GVDSX | C | GVDCX | Institutional | GVDIX | R6 | GVDLX |
Federated Global Strategic Value Dividend Fund
Fund Established 2017
A Portfolio of Federated Equity Funds
IMPORTANT NOTICE REGARDING REPORT DELIVERY
Beginning on January 1, 2021, as permitted by regulations adopted by the Securities and Exchange Commission, paper copies of the Fund's shareholder reports like this one will no longer be sent by mail, unless you specifically request paper copies of the reports from the Fund or from your financial intermediary, such as a broker-dealer or bank. Instead, the reports will be made available on a website, and you will be notified by mail each time a report is posted and provided with a website link to access the report.
If you already elected to receive shareholder reports electronically, you will not be affected by this change and you need not take any action. You may elect to receive shareholder reports and other communications from the Fund or your financial intermediary electronically by contacting your financial intermediary (such as a broker-dealer or bank); other shareholders may call the Fund at 1-800-341-7400, Option 4.
You may elect to receive all future reports in paper free of charge. You can inform the Fund or your financial intermediary that you wish to continue receiving paper copies of your shareholder reports by contacting your financial intermediary (such as a broker-dealer or bank); other shareholders may call the Fund at 1-800-341-7400, Option 4. Your election to receive reports in paper will apply to all funds held with the Fund complex or your financial intermediary.
Not FDIC Insured ■ May Lose Value ■ No Bank Guarantee
J. Christopher
Donahue
President
Federated Global Strategic Value Dividend Fund
Letter from the President
Dear Valued Shareholder,
I am pleased to present the Annual Shareholder Report for your fund covering the period from November 1, 2018 through October 31, 2019. This report includes Management's Discussion of Fund Performance, a complete listing of your fund's holdings, performance information and financial statements along with other important fund information.
In addition, our website, FederatedInvestors.com, offers easy access to Federated resources that include timely fund updates, economic and market insights from our investment strategists, and financial planning tools.
Thank you for investing with Federated. I hope you find this information useful and look forward to keeping you informed.
Sincerely,
J. Christopher Donahue, President
CONTENTS
| 1 |
| 7 |
| 8 |
| 12 |
| 16 |
| 18 |
| 19 |
| 20 |
| 30 |
| 32 |
| 34 |
| 40 |
| 47 |
| 47 |
Management's Discussion of Fund Performance (unaudited)
The total return of Federated Global Strategic Value Dividend Fund (the “Fund”), based on net asset value, for the 12-month reporting period ended October 31, 2019, was 13.25% for the Class A Shares, 12.31% for the Class C Shares, 13.53% for the Institutional Shares and 13.54% for the Class R6 Shares. The 13.54% total return of the Class R6 Shares consisted of 4.87% in dividend income and 8.67% change in net asset value of the shares. The total return of the MSCI World High Dividend Yield Index1 (MWHDYI), a broad-based securities market index that represents the global dividend-paying universe, was 12.68% for the reporting period. The MSCI World Index2 (MWI), which is representative of the broader global stock market,3 had a total return of 12.69% for the same period. The Fund's total return for the most recently completed fiscal year reflected actual cash flows, transaction costs and other expenses which are not reflected in the total return of the MWHDYI or the MWI.
The following discussion will focus on the performance of the Fund's Class R6 Shares.
MARKET OVERVIEW
The fiscal year began with a volatile month for stocks all over the world, as plunging oil prices, U.S. election uncertainty, Brexit (the U.K. exiting the European Union) worries, and an ongoing trade war between the globe's two biggest economies weighed on investors. Amid all this, the U.S. Federal Reserve (the “Fed”), despite market expectations, signaled in December its intention to stick with at least two more rate increases in 2019, as well as a robust pace of balance-sheet reduction. A month after experiencing its worst December since the Great Depression, U.S. equity markets rebounded strongly, with the Dow Jones Industrial Average4 rising 7.2%, its best January in 30 years, the S&P 500 Index5advancing 7.9%, its best January in 32 years, and the NASDAQ Composite Index6 jumping 9.7%, its best January since 2001. The improvement was evident in global markets, too, as the MWI rose 7.7% on the month.
Despite petering out in February's final days, stocks rallied strongly for a second straight month as recession fears eased, hopes for a trade truce with China rose and the Fed reinforced its “patient'' message regarding future rate increases. Risk assets continued to rally throughout the second quarter of the fiscal year as recession fears gave way to stronger growth and better-than-expected earnings in the U.S., green shoots overseas and inflation that remained in a box.
Heading into the third quarter of the fiscal year, escalating trade tensions between the U.S. and China, deteriorating economic data across the U.S., Europe and Asia and worries about increased regulatory oversight of tech behemoths brought an abrupt end to what had been the best 4-month start to a year for major domestic equity indexes since at least 1999. U.S. markets
Annual Shareholder Report
rebounded strongly in June after May's sell-off, driven by hopes that the Fed was about to embark on a new easing regime amid softening economic data, stubbornly low inflation and a little more optimism about an eventual U.S.-China trade resolution. The third quarter ended with a thud, as the major indexes plunged the final day of trading in July after the Fed policymakers cut the benchmark rate a quarter point as expected but failed to suggest further reductions may be forthcoming.
During the fourth quarter of the fiscal year, the equity sell-off worsened after President Trump surprised global markets by announcing that a 10% tariff on an additional $300 billion of Chinese goods would take effect on September 1, barring any progress on trade talks. Most global markets were faring even worse, with the MSCI All Country World Ex-US Index7 down more than 4% and the MSCI World Ex-US Index8 off almost 4%. Stocks rebounded later in the quarter aided by better news on the trade and Brexit fronts, signs of a bottoming in U.S. and global manufacturing, a dovish Fed “hold'' at home and more central bank support overseas.
DIVIDEND-BASED9 PERFORMANCE
The Fund ended the reporting period with a 30-day SEC yield of 3.97%10 and a gross weighted-average dividend yield of 4.60%. The Fund's gross yield was greater than the yield of the 10-year U.S. Treasury Note (1.69%), the yield of the broad-market MWI (2.42%) and that of the Fund's benchmark, the MWHDYI (3.91%).
In addition to its higher-than-market yield, the Fund seeks to own high-quality companies with the ability and willingness to raise their dividends over time. During the reporting period, 46 companies within the Fund raised their dividend, accounting for 48 separate increases, two dividend reductions and one special dividend. Some of the most generous increases in the reporting period came from holdings such as PNC Financial (21.1%), AbbVie (11.5%), Regions Financial (10.7%) and Enbridge (10.0%). In addition, Swedish bank holding SEB declared a special dividend in March 2019.
While stock prices can be highly impacted in the short term by rapidly changing market conditions–including a shifting political landscape, oil price fluctuations and changing interest rate expectations– the Fund's management remained steadfastly focused on its objectives of providing a higher-than-market yield and long-term dividend growth. Irrespective of short-term market trends, the Fund pursued these income-based goals by taking a long-term approach to its investments and by owning primarily high-yielding, mature companies with defensive cash flow profiles. With the Fund's investments in the dividend income-producing segment of the worldwide equity markets, which tend to have a lower beta11 versus the MSCI World Index, the Fund's short-term returns are not expected to move in line with the broad market. The Fund posted a total return of 13.54% during the reporting period as markets steadily
Annual Shareholder Report
recovered from the lows at the beginning of the fiscal year and continued to rally through October 2019 as there was better news on trade and Brexit fronts and also from a mix of strong cyclical and defensive sector performance in Utilities, Communication Services and Financials.
Consistent with its dividend-focused strategy, the Fund's holdings remained concentrated in mature markets that consistently offer a broad selection of high-dividend paying stocks. In addition to the U.S., the Fund also has significant exposure to the UK, Canada and select European countries including France, Germany and Switzerland. During the reporting period, the Fund received positive contributions from its core holdings in the U.S. (52.85% of Fund assets), UK (16.91% of Fund assets) and Canada (16.10% of Fund assets) where its investments posted weighted average returns of 12.63%, 8.70% and 23.10%, respectively. Sweden (0% of Fund assets) was the only market to decline in the period which posted a weighted average return of -9.31%.
Returns across economic sectors were mostly positive in the reporting period with Real Estate, Utilities and Information Technology leading the market, while Energy, Financials, Health Care and Materials posted the reporting period's weakest returns. Through most of the fiscal period, investors tended to favor lower-yielding stocks and growth over value despite low beta outperforming high beta equities. But while investor preferences for certain sectors and risk profiles will vary from year to year, the Fund's management remained focused on the key long-term drivers of total return–dividend yield and dividend growth. In order to pursue these income-based goals, the portfolio seeks to invest in high quality companies with attractive, sustainable dividends and stable cash flow profiles–conditions which are most commonly met in sectors that exhibit low levels of cyclicality. Given its persistent preference for stable income generation, the Fund's largest sector concentrations at period-end were in Health Care, Financials and Utilities, representing 18.91%, 17.54% and 16.92%, respectively.
From a sector perspective, the Fund's holdings in Utilities were the most significant contributors to performance, posting a return of 25.65%. Utilities' outperformance was driven by Emera, Enel and Fortis which returned 39.50%, 35.08% and 29.64%, respectively. Communication Services were also a solid contributor to overall Fund performance delivering a return of 18.42%, led by AT&T (33.41%) and BCE (28.12%). Financials added further to Fund performance as reinsurance holdings in Munich Re and Zurich Insurance returned 33.84% and 31.84%, respectively, for the reporting period.
By contrast, the Fund's weakest contribution was noted in the Consumer Discretionary sector, which delivered a weighted average return of -4.56% driven by the Fund's sole investment in this sector, Cracker Barrel. Despite solid earnings and dividend growth, Cracker Barrel has experienced short-term price pressure due to tariffs. Contributions from Energy and Consumer Staples also lagged that of the broad market. Laggards from Energy included Occidental Petroleum (-36.03%), due to investor concerns surrounding the Anadarko Deal,
Annual Shareholder Report
and Exxon (-11.31%), as crude oil prices generally declined over the period, while detractors from Consumer Staples included Kraft Heinz (-35.66%) and Altria (-31.99%). Kraft Heinz declined after reporting disappointing Q4 earnings results, the issuance of weak 2019 guidance and an unexpected 36% dividend cut. And finally, declining cigarette sales and heightened scrutiny regarding their minority stake in JUUL placed pressure on Altria during the reporting period.
Due to its focus on high dividend income and growth in that income stream over time, the Fund will tend to perform best when investors prefer high-yield, high-quality, low-beta, large-cap stocks. Often times, the strategy may also outperform in flat markets or periods of market distress. Conversely, the strategy may lag the broad market when investors prefer low-yield, low-quality, high-risk, small-cap stocks. Over the reporting period, the Fund slightly outpaced the broad global market despite investor's tendency to favor low-yielding equities, and growth over value.
| 1 | Please see the footnotes to the line graphs below for definitions of, and further information about, the MWHDYI. |
| 2 | Please see the footnotes to the line graphs below for definitions of, and further information about, the MWI. |
| 3 | International investing involves special risks including currency risk, increased volatility of foreign securities, political risks and differences in auditing and other financial standards. Prices of emerging markets securities can be significantly more volatile than the prices of securities in developed countries and currency risk and political risks are accentuated in emerging markets. |
| 4 | The Dow Jones Industrial Average is a price weighted index comprised of 30 of the largest and most widely held public companies in the United States.* |
| 5 | The S&P 500 Index is a capitalization-weighted index of 500 stocks designed to measure performance of the broad domestic economy through changes in the aggregate market value of 500 stocks representing all major industries.* |
| 6 | The NASDAQ Composite Index measures all NASDAQ domestic and international based common type stocks listed on The NASDAQ Stock Market. Today the NASDAQ Composite includes over 3,000 companies.* |
| 7 | The MSCI All Country World ex US Index captures large- and mid-cap representation across 22 of 23 developed markets countries (excluding the U.S.) and 23 emerging markets countries. The index covers approximately 85% of the global equity opportunity set outside the U.S.* |
| 8 | The MSCI World ex US Index captures large- and mid-cap representation across 22 of 23 Developed Markets (DM) countries—excluding the United States. The index covers approximately 85% of the free float-adjusted market capitalization in each country.* |
| 9 | There are no guarantees that dividend-paying stocks will continue to pay dividends. In addition, dividend-paying stocks may not experience the same capital appreciation potential as non-dividend-paying stocks. |
| 10 | Represents the 30-day SEC yield for the Fund's Institutional Shares. In the absence of temporary expense waivers or reimbursements the 30-day SEC yield would have been 3.09% for the Fund's Institutional shares. The dividend yield represents the average yield of the underlying securities within the portfolio. |
| 11 | Beta measures a security/fund's volatility relative to the market. A beta greater than 1.00 suggests the security/fund has historically had less volatility relative to the market. |
| * | The index is unmanaged, and it is not possible to invest directly in an index. |
Annual Shareholder Report
FUND PERFORMANCE AND GROWTH OF A $10,000 INVESTMENT
The graph below illustrates the hypothetical investment of $10,0001 in the Federated Global Strategic Value Dividend Fund from January 30, 2017 to October 31, 2019, compared to the MSCI World Index (MWI)2 and the MSCI World High Dividend Yield Index (MWHDYI).3The Average Annual Total Return table below shows returns for each class averaged over the stated periods.
Growth of a $10,000 InvestmenT
Growth of $10,000 as of October 31, 2019
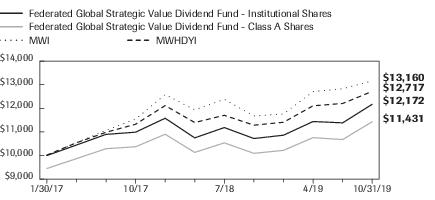
| Federated Global Strategic Value Dividend Fund - | Institutional Shares | Class A Shares | MWI | MWHDYI |
| F | F | I | I |
| 1/30/2017 | 10,000 | 9,452 | 10,002 | 10,020 |
| 4/30/2017 | 10,445 | 9,869 | 10,543 | 10,540 |
| 7/31/2017 | 10,897 | 10,290 | 11,066 | 10,986 |
| 10/31/2017 | 10,990 | 10,372 | 11,544 | 11,326 |
| 1/31/2018 | 11,580 | 10,902 | 12,585 | 12,116 |
| 4/30/2018 | 10,749 | 10,133 | 11,936 | 11,398 |
| 7/31/2018 | 11,186 | 10,538 | 12,380 | 11,705 |
| 10/31/2018 | 10,721 | 10,094 | 11,678 | 11,286 |
| 1/31/2019 | 10,862 | 10,220 | 11,762 | 11,410 |
| 4/30/2019 | 11,441 | 10,759 | 12,710 | 12,107 |
| 7/31/2019 | 11,385 | 10,678 | 12,829 | 12,206 |
| 10/31/2019 | 12,172 | 11,431 | 13,160 | 12,717 |
41 graphic description end -->
| ■ | Total returns shown for Class A Shares include the maximum sales charge of 5.50% ($10,000 investment minus $550 sales charge = $9,450). |
The Fund offers multiple share classes whose performance may be greater than or less than its other share class(es) due to differences in sales charges and expenses. See the Average Annual Return table below for the returns of additional classes not shown in the line graph above.
Average Annual Total Returns for the Period Ended 10/31/2019
(returns reflect all applicable sales charges and contingent sales charges as specified below in footnote #1)
| | 1 Year | Start of
Performance4 |
| Class A Shares | 6.99% | 4.98% |
| Class C Shares | 11.31% | 6.42% |
| Institutional Shares | 13.53% | 7.41% |
| Class R6 Shares | 13.54% | 7.41% |
| MWI | 12.69% | 10.51% |
| MWHDYI | 12.68% | 9.14% |
Annual Shareholder Report
Performance data quoted represents past performance which is no guarantee of future results. Investment return and principal value will fluctuate so that an investor's shares, when redeemed, may be worth more or less than their original cost. Mutual fund performance changes over time and current performance may be lower or higher than what is stated. For current to the most recent month-end performance and after-tax returns, visit FederatedInvestors.com or call 1-800-341-7400. Returns shown do not reflect the deduction of taxes that a shareholder would pay on Fund distributions or the redemption of Fund shares. Mutual funds are not obligations of or guaranteed by any bank and are not federally insured.
| 1 | Represents a hypothetical investment of $10,000 in the Fund after deducting applicable sales charges: For Class A Shares, the maximum sales charge of 5.50% ($10,000 investment minus $550 sales charge = $9,450). The Fund's performance assumes the reinvestment of all dividends and distributions. The MWI and MWXHDYI have been adjusted to reflect reinvestment of dividends on securities in the indexes. For Class C Shares, a 1.00% contingent deferred sales charge would be applied on any redemption less than one year from the purchase date. |
| 2 | The MWI captures large- and mid-cap representation across 23 developed market countries. The index covers approximately 85% of the free float-adjusted market capitalization in each country. The MWI is not adjusted to reflect taxes, expenses or other fees that the Securities and Exchange Commission (SEC) requires to be reflected in the Fund's performance. The MWI is unmanaged and, unlike the Fund, is not affected by cash flows. It is not possible to invest directly in an index. |
| 3 | The MSCI World High Dividend Yield Index is based on the MSCI World Index, its parent index, and includes large- and mid-cap stocks across 23 developed market countries. The index is designed to reflect the performance of equities in the parent index (excluding REITs) with higher dividend income and quality characteristics than average dividend yields that are both sustainable and persistent. The index also applies quality screens and reviews 12-month past performance to omit stocks with potentially deteriorating fundamentals that could force them to cut or reduce dividends. The MWHDYI is not adjusted to reflect taxes, expenses or other fees that the SEC requires to be reflected in the Fund's performance. The MWHDYI is unmanaged and, unlike the Fund, is not affected by cash flows. It is not possible to invest directly in an index. |
| 4 | The Fund commenced operations on January 30, 2017. |
Annual Shareholder Report
Portfolio of Investments Summary Table (unaudited)
At October 31, 2019, the Fund's sector composition1 was as follows:
| Sector Composition | Percentage of
Total Net Assets |
| Health Care | 18.9% |
| Financials | 17.5% |
| Utilities | 16.9% |
| Communication Services | 15.7% |
| Energy | 15.3% |
| Consumer Staples | 10.4% |
| Materials | 5.0% |
| Industrials | 3.5% |
| Real Estate | 2.5% |
| Consumer Discretionary | 2.1% |
| Cash Equivalents2 | 3.5% |
| Other Assets and Liabilities—Net3 | (11.3)% |
| TOTAL | 100.0% |
| 1 | Except for Cash Equivalents and Other Assets and Liabilities, sector classifications are based upon, and individual portfolio securities are assigned to, the classifications of the Global Industry Classification Standard (GICS) except that the Adviser assigns a classification to securities not classified by the GICS and to securities for which the Adviser does not have access to the classification made by the GICS. |
| 2 | Cash Equivalents include any investments in money market mutual funds and/or overnight repurchase agreements. |
| 3 | Assets, other than investments in securities, less liabilities. See Statement of Assets and Liabilities. |
Annual Shareholder Report
Portfolio of Investments
October 31, 2019
| Shares | | | Value in
U.S. Dollars |
| | | COMMON STOCKS—107.8% | |
| | | Australia—1.7% | |
| 1,480 | | Sonic Healthcare Ltd. | $29,063 |
| | | Canada—16.1% | |
| 970 | | BCE, Inc. | 46,014 |
| 664 | | Canadian Imperial Bank of Commerce | 56,620 |
| 430 | | Emera, Inc. | 17,803 |
| 1,309 | | Enbridge, Inc. | 47,675 |
| 520 | | Fortis, Inc. / Canada | 21,604 |
| 930 | | TC Energy Corp. | 46,878 |
| 1,085 | | TELUS Corp. | 38,593 |
| | | TOTAL | 275,187 |
| | | France—8.4% | |
| 825 | | BNP Paribas SA | 43,101 |
| 600 | | Sanofi | 55,310 |
| 1,055 | | Scor SA | 44,468 |
| | | TOTAL | 142,879 |
| | | Germany—2.8% | |
| 170 | | Muenchener Rueckversicherungs-Gesellschaft AG | 47,218 |
| | | Italy—2.0% | |
| 4,435 | | Enel SpA | 34,343 |
| | | Japan—2.4% | |
| 1,525 | | NTT DOCOMO, Inc. | 41,803 |
| | | Spain—1.7% | |
| 2,813 | | Iberdrola SA | 28,894 |
| | | Switzerland—3.0% | |
| 130 | | Zurich Insurance Group AG | 50,817 |
| | | United Kingdom—16.9% | |
| 2,060 | | BAE Systems PLC | 15,378 |
| 5,530 | | BP PLC | 35,139 |
| 255 | | British American Tobacco PLC | 8,913 |
| 2,310 | | GlaxoSmithKline PLC | 52,944 |
| 2,759 | | National Grid-SP PLC | 32,254 |
| 1,420 | | Royal Dutch Shell PLC, Class B | 40,896 |
| 2,130 | | SSE PLC | 35,422 |
| 505 | | Unilever PLC | 30,300 |
Annual Shareholder Report
| Shares | | | Value in
U.S. Dollars |
| | | COMMON STOCKS—continued | |
| | | United Kingdom—continued | |
| 18,475 | | Vodafone Group PLC | $37,795 |
| | | TOTAL | 289,041 |
| | | United States—52.8% | |
| 1,058 | | AbbVie, Inc. | 84,164 |
| 5,170 | | Amcor PLC, GDR | 49,226 |
| 120 | | Amgen, Inc. | 25,590 |
| 1,454 | | AT&T, Inc. | 55,964 |
| 235 | | Chevron Corp. | 27,293 |
| 235 | | Cracker Barrel Old Country Store, Inc. | 36,542 |
| 685 | | Dominion Energy, Inc. | 56,547 |
| 335 | | Duke Energy Corp. | 31,577 |
| 605 | | Exxon Mobil Corp. | 40,880 |
| 370 | | Gilead Sciences, Inc. | 23,573 |
| 150 | | Kimberly-Clark Corp. | 19,932 |
| 405 | | LyondellBasell Industries N.V. | 36,329 |
| 580 | | Occidental Petroleum Corp. | 23,490 |
| 510 | | Omega Healthcare Investors, Inc. | 22,460 |
| 290 | | PepsiCo, Inc. | 39,779 |
| 1,370 | | Pfizer, Inc. | 52,567 |
| 275 | | Philip Morris International, Inc. | 22,396 |
| 210 | | PNC Financial Services Group | 30,807 |
| 920 | | PPL Corp. | 30,811 |
| 1,660 | | Regions Financial Corp. | 26,726 |
| 1,025 | | The Coca-Cola Co. | 55,791 |
| 385 | | United Parcel Service, Inc. | 44,340 |
| 780 | | Verizon Communications, Inc. | 47,167 |
| 215 | | Welltower, Inc. | 19,498 |
| | | TOTAL | 903,449 |
| | | TOTAL COMMON STOCKS
(IDENTIFIED COST $1,740,095) | 1,842,694 |
| | | INVESTMENT COMPANY—3.5% | |
| 59,723 | | Federated Institutional Prime Value Obligations Fund, Institutional Shares, 1.930%,1
(IDENTIFIED COST $59,740) | 59,741 |
| | | TOTAL INVESTMENT IN SECURITIES—111.3%
(IDENTIFIED COST $1,799,835)2 | 1,902,435 |
| | | OTHER ASSETS AND LIABILITIES - NET—(11.3)%3 | (192,934) |
| | | TOTAL NET ASSETS—100% | $1,709,501 |
Annual Shareholder Report
Affiliated fund holdings are investment companies which are managed by the Adviser or an affiliate of the Adviser. Transactions with affiliated fund holdings during the period ended October 31, 2019, were as follows:
| | Federated
Institutional
Prime Value
Obligations Fund,
Institutional Shares |
| Balance of Shares Held 10/31/2018 | 109,153 |
| Purchases/Additions | 628,329 |
| Sales/Reductions | (677,759) |
| Balance of Shares Held 10/31/2019 | 59,723 |
| Value | $59,741 |
| Change in unrealized Appreciation/Depreciation | $1 |
| Net Realized Gain/(Loss) | $3 |
| Dividend Income | $426 |
| 1 | 7-day net yield. |
| 2 | The cost of investments for federal tax purposes amounts to $1,800,216. |
| 3 | Assets, other than investments in securities, less liabilities. See Statement of Assets and Liabilities. |
Note: The categories of investments are shown as a percentage of total net assets at October 31, 2019.
Various inputs are used in determining the value of the Fund's investments. These inputs are summarized in the three broad levels listed below:
Level 1—quoted prices in active markets for identical securities.
Level 2—other significant observable inputs (including quoted prices for similar securities, interest rates, prepayment speeds, credit risk, etc.). Also includes securities valued at amortized cost.
Level 3—significant unobservable inputs (including the Fund's own assumptions in determining the fair value of investments).
The inputs or methodology used for valuing securities are not an indication of the risk associated with investing in those securities.
Annual Shareholder Report
The following is a summary of the inputs used, as of October 31, 2019, in valuing the Fund's assets carried at fair value:
| Valuation Inputs | | | | |
| | Level 1—
Quoted
Prices | Level 2—
Other
Significant
Observable
Inputs | Level 3—
Significant
Unobservable
Inputs | Total |
| Equity Securities: | | | | |
| Common Stocks | | | | |
| Domestic | $854,223 | $49,226 | $— | $903,449 |
| International | 275,187 | 664,058 | — | 939,245 |
| Investment Company | 59,741 | — | — | 59,741 |
| TOTAL SECURITIES | $1,189,151 | $713,284 | $— | $1,902,435 |
See Notes which are an integral part of the Financial Statements
The following acronym is used throughout this portfolio:
| GDR | —Global Depositary Receipt |
Annual Shareholder Report
Financial Highlights–Class A Shares
(For a Share Outstanding Throughout Each Period)
| | Year Ended October 31, | Period
Ended
10/31/20171 |
| 2019 | 2018 |
| Net Asset Value, Beginning of Period | $4.96 | $5.37 | $5.00 |
| Income From Investment Operations: | | | |
| Net investment income | 0.21 | 0.202 | 0.132 |
| Net realized and unrealized gain (loss) | 0.43 | (0.33) | 0.35 |
| TOTAL FROM INVESTMENT OPERATIONS | 0.64 | (0.13) | 0.48 |
| Less Distributions: | | | |
| Distributions from net investment income | (0.21) | (0.19) | (0.11) |
| Distributions from net realized gain | (0.05) | (0.09) | — |
| TOTAL DISTRIBUTIONS | (0.26) | (0.28) | (0.11) |
| Net Asset Value, End of Period | $5.34 | $4.96 | $5.37 |
| Total Return3 | 13.25% | (2.67)% | 9.73% |
| Ratios to Average Net Assets: | | | |
| Net expenses | 1.12% | 1.11% | 1.10%4 |
| Net investment income | 3.94% | 3.84% | 3.22%4 |
| Expense waiver/reimbursement5 | 18.79% | 15.35% | 19.52%4 |
| Supplemental Data: | | | |
| Net assets, end of period (000 omitted) | $344 | $389 | $137 |
| Portfolio turnover | 44% | 25% | 23% |
| 1 | Reflects operations for the period from January 30, 2017 (date of initial investment) to October 31, 2017. Certain ratios included above in Ratios to Average Net Assets and per share amounts may be inflated or deflated as compared to the fee structure for each respective share class as a result of daily systematic allocations being rounded to the nearest penny for fund level income, expense and realized/unrealized gain/loss amounts. Such differences are immaterial. |
| 2 | Per share number has been calculated using the average shares method. |
| 3 | Based on net asset value, which does not reflect the sales charge, redemption fee or contingent deferred sales charge, if applicable. Total returns for periods of less than one year are not annualized. |
| 4 | Computed on an annualized basis. |
| 5 | This expense decrease is reflected in both the net expense and the net investment income ratios shown above. |
See Notes which are an integral part of the Financial Statements
Annual Shareholder Report
Financial Highlights–Class C Shares
(For a Share Outstanding Throughout Each Period)
| | Year Ended October 31, | Period
Ended
10/31/20171 |
| 2019 | 2018 |
| Net Asset Value, Beginning of Period | $4.96 | $5.37 | $5.00 |
| Income From Investment Operations: | | | |
| Net investment income | 0.14 | 0.162 | 0.102 |
| Net realized and unrealized gain (loss) | 0.45 | (0.33) | 0.37 |
| TOTAL FROM INVESTMENT OPERATIONS | 0.59 | (0.17) | 0.47 |
| Less Distributions: | | | |
| Distributions from net investment income | (0.16) | (0.15) | (0.10) |
| Distributions from net realized gain | (0.05) | (0.09) | — |
| TOTAL DISTRIBUTIONS | (0.21) | (0.24) | (0.10) |
| Net Asset Value, End of Period | $5.34 | $4.96 | $5.37 |
| Total Return3 | 12.31% | (3.39)% | 9.36% |
| Ratios to Average Net Assets: | | | |
| Net expenses | 1.89% | 1.86% | 1.85%4 |
| Net investment income | 3.17% | 3.18% | 2.47%4 |
| Expense waiver/reimbursement5 | 17.78% | 15.04% | 18.50%4 |
| Supplemental Data: | | | |
| Net assets, end of period (000 omitted) | $28 | $130 | $133 |
| Portfolio turnover | 44% | 25% | 23% |
| 1 | Reflects operations for the period from January 30, 2017 (date of initial investment) to October 31, 2017. Certain ratios included above in Ratios to Average Net Assets and per share amounts may be inflated or deflated as compared to the fee structure for each respective share class as a result of daily systematic allocations being rounded to the nearest penny for fund level income, expense and realized/unrealized gain/loss amounts. Such differences are immaterial. |
| 2 | Per share number has been calculated using the average shares method. |
| 3 | Based on net asset value, which does not reflect the sales charge, redemption fee or contingent deferred sales charge, if applicable. Total returns for periods of less than one year are not annualized. |
| 4 | Computed on an annualized basis. |
| 5 | This expense decrease is reflected in both the net expense and the net investment income ratios shown above. |
See Notes which are an integral part of the Financial Statements
Annual Shareholder Report
Financial Highlights–Institutional Shares
(For a Share Outstanding Throughout Each Period)
| | Year Ended October 31, | Period
Ended
10/31/20171 |
| 2019 | 2018 |
| Net Asset Value, Beginning of Period | $4.96 | $5.37 | $5.00 |
| Income From Investment Operations: | | | |
| Net investment income | 0.22 | 0.212 | 0.132 |
| Net realized and unrealized gain (loss) | 0.43 | (0.33) | 0.36 |
| TOTAL FROM INVESTMENT OPERATIONS | 0.65 | (0.12) | 0.49 |
| Less Distributions: | | | |
| Distributions from net investment income | (0.22) | (0.20) | (0.12) |
| Distributions from net realized gain | (0.05) | (0.09) | — |
| TOTAL DISTRIBUTIONS | (0.27) | (0.29) | (0.12) |
| Net Asset Value, End of Period | $5.34 | $4.96 | $5.37 |
| Total Return3 | 13.53% | (2.45)% | 9.90% |
| Ratios to Average Net Assets: | | | |
| Net expenses | 0.88% | 0.86% | 0.85%4 |
| Net investment income | 4.25% | 4.04% | 3.20%4 |
| Expense waiver/reimbursement5 | 18.19% | 15.39% | 18.08%4 |
| Supplemental Data: | | | |
| Net assets, end of period (000 omitted) | $119 | $295 | $139 |
| Portfolio turnover | 44% | 25% | 23% |
| 1 | Reflects operations for the period from January 30, 2017 (date of initial investment) to October 31, 2017. Certain ratios included above in Ratios to Average Net Assets and per share amounts may be inflated or deflated as compared to the fee structure for each respective share class as a result of daily systematic allocations being rounded to the nearest penny for fund level income, expense and realized/unrealized gain/loss amounts. Such differences are immaterial. |
| 2 | Per share number has been calculated using the average shares method. |
| 3 | Based on net asset value. Total returns for periods of less than one year are not annualized. |
| 4 | Computed on an annualized basis. |
| 5 | This expense decrease is reflected in both the net expense and the net investment income ratios shown above. |
See Notes which are an integral part of the Financial Statements
Annual Shareholder Report
Financial Highlights–Class R6 Shares
(For a Share Outstanding Throughout Each Period)
| | Year Ended October 31, | Period
Ended
10/31/20171 |
| 2019 | 2018 |
| Net Asset Value, Beginning of Period | $4.96 | $5.37 | $5.00 |
| Income From Investment Operations: | | | |
| Net investment income | 0.22 | 0.212 | 0.152 |
| Net realized and unrealized gain (loss) | 0.43 | (0.33) | 0.34 |
| TOTAL FROM INVESTMENT OPERATIONS | 0.65 | (0.12) | 0.49 |
| Less Distributions: | | | |
| Distributions from net investment income | (0.22) | (0.20) | (0.12) |
| Distributions from net realized gain | (0.05) | (0.09) | — |
| TOTAL DISTRIBUTION | (0.27) | (0.29) | (0.12) |
| Net Asset Value, End of Period | $5.34 | $4.96 | $5.37 |
| Total Return3 | 13.54% | (2.44)% | 9.90% |
| Ratios to Average Net Assets: | | | |
| Net expenses | 0.86% | 0.85% | 0.84%4 |
| Net investment income | 4.31% | 4.05% | 3.82%4 |
| Expense waiver/reimbursement5 | 18.83% | 15.34% | 22.67%4 |
| Supplemental Data: | | | |
| Net assets, end of period (000 omitted) | $1,218 | $1,072 | $1,099 |
| Portfolio turnover | 44% | 25% | 23% |
| 1 | Reflects operations for the period from January 30, 2017 (date of initial investment) to October 31, 2017. Certain ratios included above in Ratios to Average Net Assets and per share amounts may be inflated or deflated as compared to the fee structure for each respective share class as a result of daily systematic allocations being rounded to the nearest penny for fund level income, expense and realized/unrealized gain/loss amounts. Such differences are immaterial. |
| 2 | Per share number has been calculated using the average shares method. |
| 3 | Based on net asset value. Total returns for periods of less than one year are not annualized. |
| 4 | Computed on an annualized basis. |
| 5 | This expense decrease is reflected in both the net expense and the net investment income ratios shown above. |
See Notes which are an integral part of the Financial Statements
Annual Shareholder Report
Statement of Assets and Liabilities
October 31, 2019
| Assets: | | |
| Investment in securities, at value including $59,741 of investment in an affiliated holding* (identified cost $1,799,835) | | $1,902,435 |
| Cash denominated in foreign currencies (identified cost $579) | | 589 |
| Cash | | 196 |
| Income receivable | | 7,393 |
| Receivable for investments sold | | 588 |
| TOTAL ASSETS | | 1,911,201 |
| Liabilities: | | |
| Payable for investments purchased | $45,117 | |
| Payable for portfolio accounting fees | 95,381 | |
| Payable for auditing fees | 29,316 | |
| Payable for share registration costs | 15,086 | |
| Payable for custodian fees | 10,848 | |
| Payable to adviser (Note 5) | 1,155 | |
| Payable for administrative fee (Note 5) | 146 | |
| Payable for other service fees (Notes 2 and 5) | 139 | |
| Accrued expenses (Note 5) | 4,512 | |
| TOTAL LIABILITIES | | 201,700 |
| Net assets for 320,288 shares outstanding | | $1,709,501 |
| Net Assets Consists of: | | |
| Paid-in capital | | $1,657,091 |
| Total distributable earnings (loss) | | 52,410 |
| TOTAL NET ASSETS | | $1,709,501 |
Annual Shareholder Report
Statement of Assets and Liabilities–continued
| Net Asset Value, Offering Price and Redemption Proceeds Per Share: | | |
| Class A Shares: | | |
| Net asset value per share ($344,281 ÷ 64,507 shares outstanding) no par value, unlimited shares authorized | | $5.34 |
| Offering price per share (100/94.50 of $5.34) | | $5.65 |
| Redemption proceeds per share | | $5.34 |
| Class C Shares: | | |
| Net asset value per share ($27,767 ÷ 5,199 shares outstanding) no par value, unlimited shares authorized | | $5.34 |
| Offering price per share | | $5.34 |
| Redemption proceeds per share (99.00/100 of $5.34) | | $5.29 |
| Institutional Shares: | | |
| Net asset value per share ($119,334 ÷ 22,337 shares outstanding) no par value, unlimited shares authorized | | $5.34 |
| Offering price per share | | $5.34 |
| Redemption proceeds per share | | $5.34 |
| Class R6 Shares: | | |
| Net asset value per share ($1,218,119 ÷ 228,245 shares outstanding) no par value, unlimited shares authorized | | $5.34 |
| Offering price per share | | $5.34 |
| Redemption proceeds per share | | $5.34 |
| * | See information listed after the Fund's Portfolio of Investments |
See Notes which are an integral part of the Financial Statements
Annual Shareholder Report
Statement of Operations
Year Ended October 31, 2019
| Investment Income: | | | |
| Dividends (including $426 received from an affiliated holding* and net of foreign taxes withheld of $5,367) | | | $82,634 |
| Expenses: | | | |
| Investment adviser fee (Note 5) | | $12,051 | |
| Administrative fee (Note 5) | | 2,049 | |
| Custodian fees | | 18,417 | |
| Transfer agent fees (Note 2) | | 7,758 | |
| Directors'/Trustees' fees (Note 5) | | 711 | |
| Auditing fees | | 34,490 | |
| Legal fees | | 8,570 | |
| Distribution services fee (Note 5) | | 326 | |
| Other service fees (Notes 2 and 5) | | 803 | |
| Portfolio accounting fees | | 143,647 | |
| Share registration costs | | 59,187 | |
| Printing and postage | | 16,200 | |
| Miscellaneous (Note 5) | | 11,739 | |
| TOTAL EXPENSES | | 315,948 | |
| Waiver and Reimbursements: | | | |
| Waiver/reimbursement of investment adviser fee (Note 5) | $(12,051) | | |
| Reimbursements of other operating expenses (Notes 2 and 5) | (288,891) | | |
| TOTAL WAIVER AND REIMBURSEMENTS | | (300,942) | |
| Net expenses | | | 15,006 |
| Net investment income | | | 67,628 |
| Realized and Unrealized Gain (Loss) on Investments and Foreign Currency Transactions: | | | |
| Net realized loss on investments (including net realized gain of $3 on sales of investments in an affiliated holding*) and foreign currency translations | | | (53,282) |
| Net change in unrealized depreciation of investments and translation of assets and liabilities in foreign currency (including net change in unrealized appreciation of $1 of investments in an affiliated holding*) | | | 186,822 |
| Net realized and unrealized gain (loss) on investments and foreign currency transactions | | | 133,540 |
| Change in net assets resulting from operations | | | $201,168 |
| * | See information listed after the Fund's Portfolio of Investments |
See Notes which are an integral part of the Financial Statements
Annual Shareholder Report
Statement of Changes in Net Assets
| Year Ended October 31 | 2019 | 2018 |
| Increase (Decrease) in Net Assets | | |
| Operations: | | |
| Net investment income | $67,628 | $67,534 |
| Net realized gain (loss) | (53,282) | 16,150 |
| Net change in unrealized appreciation/depreciation | 186,822 | (132,810) |
| CHANGE IN NET ASSETS RESULTING FROM OPERATIONS | 201,168 | (49,126) |
| Distributions to Shareholders: | | |
| Class A Shares | (14,153) | (14,301) |
| Class B Shares | (2,534) | (10,170) |
| Institutional Shares | (9,889) | (7,947) |
| Class R6 Shares | (58,900) | (60,172) |
| CHANGE IN NET ASSETS RESULTING FROM DISTRIBUTIONS TO SHAREHOLDERS | (85,476) | (92,590) |
| Share Transactions: | | |
| Proceeds from sale of shares | 248,141 | 670,638 |
| Net asset value of shares issued to shareholders in payment of distributions declared | 84,548 | 90,559 |
| Cost of shares redeemed | (624,774) | (241,984) |
| CHANGE IN NET ASSETS RESULTING FROM SHARE TRANSACTIONS | (292,085) | 519,213 |
| Change in net assets | (176,393) | 377,497 |
| Net Assets: | | |
| Beginning of period | 1,885,894 | 1,508,397 |
| End of period | $1,709,501 | $1,885,894 |
See Notes which are an integral part of the Financial Statements
Annual Shareholder Report
Notes to Financial Statements
October 31, 2019
1. ORGANIZATION
Federated Equity Funds (the “Trust”) is registered under the Investment Company Act of 1940, as amended (the “Act”), as an open-end management investment company. The Trust consists of 9 portfolios. The financial statements included herein are only those of Federated Global Strategic Value Dividend Fund (the “Fund”), a diversified portfolio. The financial statements of the other portfolios are presented separately. The assets of each portfolio are segregated and a shareholder's interest is limited to the portfolio in which shares are held. Each portfolio pays its own expenses. The Fund offers four classes of shares: Class A Shares, Class C Shares, Institutional Shares and Class R6 Shares. All shares of the Fund have equal rights with respect to voting, except on class-specific matters. The investment objective of the Fund is to provide income and long-term capital appreciation. The Fund's Class A Shares, Class C Shares, Institutional Shares and Class R6 Shares commenced operations on January 30, 2017.
Effective August 1, 2018 an automatic conversion feature for Class C Shares was implemented. Pursuant to this automatic conversion feature, after Class C Shares have been held for ten years from the date of purchase, they will automatically convert to Class A Shares on the next monthly conversion processing date.
2. SIGNIFICANT ACCOUNTING POLICIES
The following is a summary of significant accounting policies consistently followed by the Fund in the preparation of its financial statements. These policies are in conformity with U.S. generally accepted accounting principles (GAAP).
Investment Valuation
In calculating its net asset value (NAV), the Fund generally values investments as follows:
| ■ | Equity securities listed on an exchange or traded through a regulated market system are valued at their last reported sale price or official closing price in their principal exchange or market. |
| ■ | Shares of other mutual funds or non-exchange-traded investment companies are valued based upon their reported NAVs. |
| ■ | Derivative contracts listed on exchanges are valued at their reported settlement or closing price, except that options are valued at the mean of closing bid and asked quotations. |
| ■ | Over-the-counter (OTC) derivative contracts are fair valued using price evaluations provided by a pricing service approved by the Fund's Board of Trustees (the “Trustees”). |
| ■ | Fixed-income securities are fair valued using price evaluations provided by a pricing service approved by the Trustees. |
| ■ | For securities that are fair valued in accordance with procedures established by and under the general supervision of the Trustees, certain factors may be considered such as: the last traded or purchase price of the security, information obtained by contacting the issuer or dealers, analysis of the issuer's financial statements or other available documents, fundamental analytical data, the nature and duration of restrictions on disposition, the movement of the market in which the security is normally traded, public trading in similar securities or derivative contracts of the issuer or comparable issuers, movement of a relevant index, or other factors including but not limited to industry changes and relevant government actions. |
Annual Shareholder Report
If any price, quotation, price evaluation or other pricing source is not readily available when the NAV is calculated, if the Fund cannot obtain price evaluations from a pricing service or from more than one dealer for an investment within a reasonable period of time as set forth in the Fund's valuation policies and procedures, or if information furnished by a pricing service, in the opinion of the valuation committee (“Valuation Committee”), is deemed not representative of the fair value of such security, the Fund uses the fair value of the investment determined in accordance with the procedures described below. There can be no assurance that the Fund could obtain the fair value assigned to an investment if it sold the investment at approximately the time at which the Fund determines its NAV per share.
Fair Valuation and Significant Events Procedures
The Trustees have ultimate responsibility for determining the fair value of investments for which market quotations are not readily available. The Trustees have appointed a Valuation Committee comprised of officers of the Fund, Federated Equity Management Company of Pennsylvania (the “Adviser”) and certain of the Adviser's affiliated companies to assist in determining fair value and in overseeing the calculation of the NAV. The Trustees have also authorized the use of pricing services recommended by the Valuation Committee to provide fair value evaluations of the current value of certain investments for purposes of calculating the NAV. The Valuation Committee employs various methods for reviewing third-party pricing-service evaluations including periodic reviews of third-party pricing services' policies, procedures and valuation methods (including key inputs, methods, models and assumptions), transactional back-testing, comparisons of evaluations of different pricing services, and review of price challenges by the Adviser based on recent market activity. In the event that market quotations and price evaluations are not available for an investment, the Valuation Committee determines the fair value of the investment in accordance with procedures adopted by the Trustees. The Trustees periodically review and approve the fair valuations made by the Valuation Committee and any changes made to the procedures.
Factors considered by pricing services in evaluating an investment include the yields or prices of investments of comparable quality, coupon, maturity, call rights and other potential prepayments, terms and type, reported transactions, indications as to values from dealers and general market conditions. Some pricing services provide a single price evaluation reflecting the bid-side of the market for an investment (a “bid” evaluation). Other pricing services offer both bid evaluations and price evaluations indicative of a price between the prices bid and asked for the investment (a “mid” evaluation). The Fund normally uses bid evaluations for any U.S. Treasury and Agency securities, mortgage-backed securities and municipal securities. The Fund normally uses mid evaluations for any other types of fixed-income securities and any OTC derivative contracts. In the event that market quotations and price evaluations are not available for an investment, the fair value of the investment is determined in accordance with procedures adopted by the Trustees.
Annual Shareholder Report
The Trustees also have adopted procedures requiring an investment to be priced at its fair value whenever the Adviser determines that a significant event affecting the value of the investment has occurred between the time as of which the price of the investment would otherwise be determined and the time as of which the NAV is computed. An event is considered significant if there is both an affirmative expectation that the investment's value will change in response to the event and a reasonable basis for quantifying the resulting change in value. Examples of significant events that may occur after the close of the principal market on which a security is traded, or after the time of a price evaluation provided by a pricing service or a dealer, include:
| ■ | With respect to securities traded principally in foreign markets, significant trends in U.S. equity markets or in the trading of foreign securities index futures contracts; |
| ■ | Political or other developments affecting the economy or markets in which an issuer conducts its operations or its securities are traded; |
| ■ | Announcements concerning matters such as acquisitions, recapitalizations, litigation developments, or a natural disaster affecting the issuer's operations or regulatory changes or market developments affecting the issuer's industry. |
The Trustees have adopted procedures whereby the Valuation Committee uses a pricing service to provide factors to update the fair value of equity securities traded principally in foreign markets from the time of the close of their respective foreign stock exchanges to the pricing time of the Fund. For other significant events, the Fund may seek to obtain more current quotations or price evaluations from alternative pricing sources. If a reliable alternative pricing source is not available, the Fund will determine the fair value of the investment in accordance with the fair valuation procedures approved by the Trustees. The Trustees have ultimate responsibility for any fair valuations made in response to a significant event.
Repurchase Agreements
The Fund may invest in repurchase agreements for short-term liquidity purposes. It is the policy of the Fund to require the other party to a repurchase agreement to transfer to the Fund's custodian or sub-custodian eligible securities or cash with a market value (after transaction costs) at least equal to the repurchase price to be paid under the repurchase agreement. The eligible securities are transferred to accounts with the custodian or sub-custodian in which the Fund holds a “securities entitlement” and exercises “control” as those terms are defined in the Uniform Commercial Code. The Fund has established procedures for monitoring the market value of the transferred securities and requiring the transfer of additional eligible securities if necessary to equal at least the repurchase price. These procedures also allow the other party to require securities to be transferred from the account to the extent that their market value exceeds the repurchase price or in exchange for other eligible securities of equivalent market value.
The insolvency of the other party or other failure to repurchase the securities may delay the disposition of the underlying securities or cause the Fund to receive less than the full repurchase price. Under the terms of the repurchase agreement, any amounts received by the Fund in excess of the repurchase price and related transaction costs must be remitted to the other party.
The Fund may enter into repurchase agreements in which eligible securities are transferred into joint trading accounts maintained by the custodian or sub-custodian for investment companies and other clients advised by the Adviser and its affiliates. The Fund will participate on a pro rata basis with the other investment companies and clients in its share of the securities transferred under such repurchase agreements and in its share of proceeds from any repurchase or other disposition of such securities.
Annual Shareholder Report
Investment Income, Gains and Losses, Expenses and Distributions
Investment transactions are accounted for on a trade-date basis. Realized gains and losses from investment transactions are recorded on an identified-cost basis. Interest income and expenses are accrued daily. Dividend income and distributions to shareholders are recorded on the ex-dividend date. Foreign dividends are recorded on the ex-dividend date or when the Fund is informed of the ex-dividend date. Distributions of net investment income, if any, are declared and paid monthly. Non-cash dividends included in dividend income, if any, are recorded at fair value. Amortization/accretion of premium and discount is included in investment income. Investment income, realized and unrealized gains and losses, and certain fund-level expenses are allocated to each class based on relative average daily net assets, except that select classes will bear certain expenses unique to those classes. The detail of the total fund expense waivers and reimbursements of $300,942 is disclosed in various locations in this Note 2 and Note 5. For the year ended October 31, 2019, transfer agent fees for the Fund were as follows:
| | Transfer Agent
Fees Incurred | Transfer Agent
Fees Reimbursed |
| Class A Shares | $1,610 | $(266) |
| Class C Shares | 140 | — |
| Institutional Shares | 591 | (18) |
| Class R6 Shares | 5,417 | — |
| TOTAL | $7,758 | $(284) |
Dividends are declared separately for each class. No class has preferential dividend rights; differences in per share dividend rates are generally due to differences in separate class expenses.
Other Service Fees
The Fund may pay other service fees up to 0.25% of the average daily net assets of the Fund's Class A Shares and Class C Shares to unaffiliated financial intermediaries or to Federated Shareholder Services Company (FSSC) for providing services to shareholders and maintaining shareholder accounts. Subject to the terms described in the Expense Limitation note, FSSC may voluntarily reimburse the Fund for other service fees. For the year ended October 31, 2019, other service fees for the Fund were as follows:
| | Other
Service Fees
Incurred |
| Class A Shares | $694 |
| Class C Shares | 109 |
| TOTAL | $803 |
Federal Taxes
It is the Fund's policy to comply with the Subchapter M provision of the Internal Revenue Code (the “Code”) and to distribute to shareholders each year substantially all of its income. Accordingly, no provision for federal income tax is necessary. As of and during the year ended October 31, 2019, the Fund did not have a liability for any uncertain tax positions. The Fund
Annual Shareholder Report
recognizes interest and penalties, if any, related to tax liabilities as income tax expense in the Statement of Operations. As of October 31, 2019, tax years 2017 through 2019 remain subject to examination by the Fund's major tax jurisdictions which include the United States of America and the Commonwealth of Massachusetts.
The Fund may be subject to taxes imposed by governments of countries in which it invests. Such taxes are generally based on either income or gains earned or repatriated. The Fund accrues and applies such taxes to net investment income, net realized gains and net unrealized gains as income and/or gains are earned.
When-Issued and Delayed-Delivery Transactions
The Fund may engage in when-issued or delayed-delivery transactions. The Fund records when-issued securities on the trade date and maintains security positions such that sufficient liquid assets will be available to make payment for the securities purchased. Securities purchased on a when-issued or delayed-delivery basis are marked to market daily and begin earning interest on the settlement date. Losses may occur on these transactions due to changes in market conditions or the failure of counterparties to perform under the contract.
Foreign Exchange Contracts
The Fund may enter into foreign exchange contracts to manage currency risk. Purchased contracts are used to acquire exposure to foreign currencies, whereas, contracts to sell are used to hedge the Fund's securities against currency fluctuations. Risks may arise upon entering into these transactions from the potential inability of counterparties to meet the terms of their commitments and from unanticipated movements in security prices or foreign exchange rates. The foreign exchange contracts are adjusted by the daily exchange rate of the underlying currency and any gains or losses are recorded for financial statement purposes as unrealized until the settlement date.
At October 31, 2019, the Fund had no outstanding foreign exchange contracts.
Foreign Currency Translation
The accounting records of the Fund are maintained in U.S. dollars. All assets and liabilities denominated in foreign currencies are translated into U.S. dollars based on the rates of exchange of such currencies against U.S. dollars on the date of valuation. Purchases and sales of securities, income and expenses are translated at the rate of exchange quoted on the respective date that such transactions are recorded. The Fund does not isolate that portion of the results of operations resulting from changes in foreign exchange rates on investments from the fluctuations arising from changes in market prices of securities held. Such fluctuations are included with the net realized and unrealized gain or loss from investments.
Reported net realized foreign exchange gains or losses arise from sales of foreign currencies, currency gains or losses realized between the trade and settlement dates on securities transactions, the difference between the amounts of dividends, interest and foreign withholding taxes recorded on the Fund's books, and the U.S. dollar equivalent of the amounts actually received or paid. Net unrealized foreign exchange gains and losses arise from changes in the value of assets and liabilities other than investments in securities at fiscal year end, resulting from changes in the exchange rate.
Annual Shareholder Report
Other
The preparation of financial statements in conformity with GAAP requires management to make estimates and assumptions that affect the amounts of assets, liabilities, expenses and revenues reported in the financial statements. Actual results could differ from those estimated. The Fund applies investment company accounting and reporting guidance.
3. SHARES OF BENEFICIAL INTEREST
The following tables summarize share activity:
| Year Ended October 31 | 2019 | 2018 |
| Class A Shares: | Shares | Amount | Shares | Amount |
| Shares sold | 24,966 | $127,950 | 60,636 | $315,614 |
Shares issued to shareholders in payment of
distributions declared | 2,842 | 14,148 | 2,745 | 14,296 |
| Shares redeemed | (41,693) | (208,142) | (10,542) | (54,157) |
NET CHANGE RESULTING FROM
CLASS A SHARE TRANSACTIONS | (13,885) | $(66,044) | 52,839 | $275,753 |
| Year Ended October 31 | 2019 | 2018 |
| Class C Shares: | Shares | Amount | Shares | Amount |
| Shares sold | 152 | $780 | 32,113 | $175,001 |
Shares issued to shareholders in payment of
distributions declared | 432 | 2,145 | 1,556 | 8,156 |
| Shares redeemed | (21,583) | (106,027) | (32,190) | (166,031) |
NET CHANGE RESULTING FROM
CLASS C SHARE TRANSACTIONS | (20,999) | $(103,102) | 1,479 | $17,126 |
| Year Ended October 31 | 2019 | 2018 |
| Institutional Shares: | Shares | Amount | Shares | Amount |
| Shares sold | 23,659 | $118,161 | 36,281 | $180,023 |
Shares issued to shareholders in payment of
distributions declared | 1,885 | 9,360 | 1,522 | 7,941 |
| Shares redeemed | (62,662) | (310,605) | (4,231) | (21,796) |
NET CHANGE RESULTING FROM
INSTITUTIONAL SHARE TRANSACTIONS | (37,118) | $(183,084) | 33,572 | $166,168 |
| Year Ended October 31 | 2019 | 2018 |
| Class R6 Shares: | Shares | Amount | Shares | Amount |
| Shares sold | 238 | $1,250 | — | — |
Shares issued to shareholders in payment of
distributions declared | 11,816 | 58,895 | 11,516 | 60,166 |
NET CHANGE RESULTING FROM
CLASS R6 SHARE TRANSACTIONS | 12,054 | $60,145 | 11,516 | $60,166 |
NET CHANGE RESULTING FROM
TOTAL FUND SHARE TRANSACTIONS | (59,948) | $(292,085) | 99,406 | $519,213 |
Annual Shareholder Report
4. FEDERAL TAX INFORMATION
The tax character of distributions as reported on the Statement of Changes in Net Assets for the years ended October 31, 2019, and 2018, were as follows:
| | 2019 | 2018 |
| Ordinary income | $68,066 | $92,590 |
| Long-term capital gains | $17,410 | $— |
As of October 31, 2019, the components of distributable earnings on a tax-basis were as follows:
| Undistributed ordinary income | $3,381 |
| Net unrealized appreciation | $102,162 |
| Capital loss carryforwards | $(53,133) |
At October 31, 2019, the cost of investments for federal tax purposes was $1,800,216. The net unrealized appreciation of investments for federal tax purposes was $102,219. This consists of net unrealized appreciation from investments for those securities having an excess of value over cost of $144,021 and net unrealized depreciation from investments for those securities having an excess of cost over value of $41,802.
As of October 31, 2019, the Fund had a capital loss carryforward of $53,133 which will reduce the Fund's taxable income arising from future net realized gains on investments, if any, to the extent permitted by the Code, thereby reducing the amount of distributions to shareholders which would otherwise be necessary to relieve the Fund of any liability for federal income tax. Pursuant to the Code, these net capital losses retain their character as either short-term or long-term and do not expire.
The following schedule summarizes the Fund's capital loss carryforwards:
| Short-Term | Long-Term | Total |
| $5,811 | $47,322 | $53,133 |
5. INVESTMENT ADVISER FEE AND OTHER TRANSACTIONS WITH AFFILIATES
Investment Adviser Fee
The advisory agreement between the Fund and the Adviser provides for an annual fee equal to 0.75% of the Fund's average daily net assets. Subject to the terms described in the Expense Limitation note, the Adviser may voluntarily choose to waive any portion of its fee and/or reimburse certain operating expenses of the Fund. For the year ended October 31, 2019, the Adviser voluntarily waived $12,037 of its fee, voluntarily reimbursed $284 of transfer agent fees and $288,607 of other operating expenses.
The Adviser has agreed to reimburse the Fund for certain investment adviser fees as a result of transactions in other affiliated investment companies. For the year ended October 31, 2019, the Adviser reimbursed $14.
Annual Shareholder Report
Administrative Fee
Federated Administrative Services (FAS), under the Administrative Services Agreement, provides the Fund with administrative personnel and services. For purposes of determining the appropriate rate breakpoint, “Investment Complex” is defined as all of the Federated Funds subject to a fee under the Administrative Services Agreement. The fee paid to FAS is based on the average daily net assets of the Investment Complex as specified below:
| Administrative Fee | Average Daily Net Assets
of the Investment Complex |
| 0.100 | on assets up to $50 billion |
| 0.075 | on assets over $50 billion |
Subject to the terms described in the Expense Limitation note, FAS may voluntarily choose to waive any portion of its fee. For the year ended October 31, 2019, the annualized fee paid to FAS was 0.128% of average daily net assets of the Fund.
In addition, FAS may charge certain out-of-pocket expenses to the Fund.
Distribution Services Fee
The Fund has adopted a Distribution Plan (the “Plan”) pursuant to Rule 12b-1 under the Act. Under the terms of the Plan, the Fund will compensate Federated Securities Corp. (FSC), the principal distributor, from the daily net assets of the Fund's Class A Shares and Class C Shares to finance activities intended to result in the sale of these shares. The Plan provides that the Fund may incur distribution expenses at the following percentages of average daily net assets annually to compensate FSC:
| Share Class Name | Percentage of Average Daily
Net Assets of Class |
| Class A Shares | 0.05% |
| Class C Shares | 0.75% |
Subject to the terms described in the Expense Limitation note, FSC may voluntarily choose to waive any portion of its fee. For the year ended October 31, 2019, distribution services fees for the Fund were as follows:
| | Distribution
Services Fees
Incurred |
| Class C Shares | $326 |
When FSC receives fees, it may pay some or all of them to financial intermediaries whose customers purchase shares. For the year ended October 31, 2019, FSC retained $27 of fees paid by the Fund. For the year ended October 31, 2019, the Fund's Class A Shares did not incur a distribution services fee; however, it may begin to incur this fee upon approval of the Trustees.
Annual Shareholder Report
Sales Charges
Front-end sales charges and contingent deferred sales charges (CDSC) do not represent expenses of the Fund. They are deducted from the proceeds of sales of Fund shares prior to investment or from redemption proceeds prior to remittance, as applicable. For the year ended October 31, 2019, FSC retained $156 in sales charges from the sale of Class A Shares. For the year ended October 31, 2019, the Fund did not have CDSC.
Other Service Fees
For the year ended October 31, 2019, FSSC received $190 of other service fees disclosed in Note 2.
Expense Limitation
The Adviser and certain of its affiliates (which may include FSC, FAS and FSSC) on their own initiative have agreed to waive certain amounts of their respective fees and/or reimburse expenses. Total annual fund operating expenses (as shown in the financial highlights, excluding tax reclaim recovery expenses, interest expense, extraordinary expenses and proxy-related expenses paid by the Fund, if any) paid by the Fund's Class A Shares, Class C Shares, Institutional Shares and Class R6 Shares (after the voluntary waivers and/or reimbursements) will not exceed 1.10%, 1.89%, 0.85% and 0.84% (the “Fee Limit”), respectively, up to but not including the later of (the “Termination Date”): (a) January 1, 2021; or (b) the date of the Fund's next effective Prospectus. While the Adviser and its applicable affiliates currently do not anticipate terminating or increasing these arrangements prior to the Termination Date, these arrangements may only be terminated or the Fee Limit increased prior to the Termination Date with the agreement of the Trustees.
Directors'/Trustees' and Miscellaneous Fees
Certain Officers and Trustees of the Fund are Officers and Directors or Trustees of certain of the above companies. To efficiently facilitate payment, Independent Directors'/Trustees' fees and certain expenses related to conducting meetings of the Directors/Trustees and other miscellaneous expenses are paid by an affiliate of the Adviser which in due course are reimbursed by the Fund. These expenses related to conducting meetings of the Directors/Trustees and other miscellaneous expenses may be included in Accrued and Miscellaneous Expenses on the Statement of Assets and Liabilities and Statement of Operations, respectively.
Affiliated Shares of Beneficial Interest
As of October 31, 2019, a majority of the shares of beneficial interest outstanding are owned by an affiliate of the Adviser.
6. Investment TRANSACTIONS
Purchases and sales of investments, excluding long-term U.S. government securities and short-term obligations, for the year ended October 31, 2019, were as follows:
| Purchases | $756,603 |
| Sales | $1,043,572 |
Annual Shareholder Report
7. CONCENTRATION OF RISK
The Fund invests in securities of non-U.S. issuers. Political or economic developments may have an effect on the liquidity and volatility of portfolio securities and currency holdings. The Fund may invest a portion of its assets in securities of companies that are deemed by the Fund's management to be classified in similar business sectors. Economic developments may have an effect on the liquidity and volatility of the portfolio securities.
8. Line of cREDT
The Fund participates with certain other Federated Funds, on a several basis, in an up to $500,000,000 unsecured, 364-day, committed, revolving line of credit (LOC) agreement. The LOC was made available to finance temporary the repurchase or redemption of shares of the Fund, failed trades, payment of dividends, settlement of trades and for other short-term, temporary or emergency general business purposes. The Fund cannot borrow under the LOC if an inter-fund loan is outstanding. The Fund's ability to borrow under the LOC also is subject to the limitations of the Act and various conditions precedent that must be satisfied before the Fund can borrow. Loans under the LOC are charged interest at a fluctuating rate per annum equal to the highest, on any day, of (a) (i) the federal funds effective rate, (ii) the one month London Interbank Offered Rate (LIBOR), and (iii) 0.0%, plus (b) a margin. The LOC also requires the Fund to pay, quarterly in arrears and at maturity, its pro rata share of a commitment fee based on the amount of the lenders' commitment that has not been utilized. As of October 31, 2019, the Fund has no outstanding loans. During the year ended October 31, 2019, the Fund did not utilize the LOC.
9. INTERFUND LENDING
Pursuant to an Exemptive Order issued by the Securities and Exchange Commission, the Fund, along with other funds advised by subsidiaries of Federated Investors, Inc., may participate in an interfund lending program. This program provides an alternative credit facility allowing the Fund to borrow from other participating affiliated funds. As of October 31, 2019, there were no outstanding loans. During the year ended October 31, 2019, the program was not utilized.
10. FEDERAL TAX INFORMATION (UNAUDITED)
For the fiscal year ended October 31, 2019, 100.0% of total ordinary income distributions made by the Fund are qualifying dividends which may be subject to a maximum tax rate of 15%, as provided for by the Jobs and Growth Tax Relief Act of 2003. Complete information is reported in conjunction with the reporting of your distributions on Form 1099-DIV.
Of the ordinary income distributions made by the Fund during the year ended October 31, 2019, 43.6% qualify for the dividend received deduction available to corporate shareholders.
If the Fund meets the requirements of Section 853 of the Code, the Fund will pass through to its shareholders credits for foreign taxes paid. For the fiscal year ended October 31, 2019, the Fund derived $55,365 of gross income from foreign sources and paid foreign taxes of $5,367.
For the year ended October 31, 2019, the amount of long-term capital gains designated by the Fund was $17,410.
Annual Shareholder Report
Report of Independent Registered Public Accounting Firm
To the Board of Trustees of Federated Equity Funds and Shareholders of Federated Global Strategic Value Dividend Fund
Opinion on the Financial Statements
We have audited the accompanying statement of assets and liabilities, including the portfolio of investments, of the Federated Global Strategic Value Dividend Fund (the “Fund”), a portfolio of Federated Equity Funds, as of October 31, 2019, the related statement of operations for the year then ended, the statements of changes in net assets for each of the years in the two-year period then ended and the related notes (collectively, the “financial statements”) and the financial highlights for each of the years or period ended in the three-year period ended October 31, 2019. In our opinion, the financial statements and financial highlights present fairly, in all material respects, the financial position of the Fund as of October 31, 2019, the results of its operations for the year then ended, the changes in its net assets for each of the years in the two-year period then ended, and the financial highlights for each of the years or periods in the three-year period then ended, in conformity with U.S. generally accepted accounting principles.
Basis for Opinion
These financial statements and financial highlights are the responsibility of the Fund's management. Our responsibility is to express an opinion on these financial statements and financial highlights based on our audits. We are a public accounting firm registered with the Public Company Accounting Oversight Board (United States) (PCAOB) and are required to be independent with respect to the Fund in accordance with the U.S. federal securities laws and the applicable rules and regulations of the Securities and Exchange Commission and the PCAOB.
Annual Shareholder Report
We conducted our audits in accordance with the standards of the PCAOB. Those standards require that we plan and perform the audit to obtain reasonable assurance about whether the financial statements and financial highlights are free of material misstatement, whether due to error or fraud. Our audits included performing procedures to assess the risks of material misstatement of the financial statements and financial highlights, whether due to error or fraud, and performing procedures that respond to those risks. Such procedures included examining, on a test basis, evidence regarding the amounts and disclosures in the financial statements and financial highlights. Such procedures also included confirmation of securities owned as of October 31, 2019, by correspondence with custodians or by other appropriate auditing procedures. Our audits also included evaluating the accounting principles used and significant estimates made by management, as well as evaluating the overall presentation of the financial statements and financial highlights. We believe that our audits provide a reasonable basis for our opinion.
We have served as the auditor of one or more of Federated Investors' investment companies since 2006.
Boston, Massachusetts
December 20, 2019
Annual Shareholder Report
Shareholder Expense Example (unaudited)
As a shareholder of the Fund, you incur two types of costs: (1) transaction costs, including sales charges (“loads”) on purchase or redemption payments; and (2) ongoing costs, including management fees and to the extent applicable, distribution (12b-1) fees and/or other service fees and other Fund expenses. This Example is intended to help you to understand your ongoing costs (in dollars) of investing in the Fund and to compare these costs with the ongoing costs of investing in other mutual funds. It is based on an investment of $1,000 invested at the beginning of the period and held for the entire period from May 1, 2019 to October 31, 2019.
ACTUAL EXPENSES
The first section of the table below provides information about actual account values and actual expenses. You may use the information in this section, together with the amount you invested, toestimate the expenses that you incurred over the period. Simply divide your account value by $1,000 (for example, an $8,600 account value divided by $1,000 = 8.6), then multiply the result by the number in the first section under the heading entitled “Expenses Paid During Period” to estimate the expenses attributable to your investment during this period.
HYPOTHETICAL EXAMPLE FOR COMPARISON PURPOSES
The second section of the table below provides information about hypothetical account values and hypothetical expenses based on the Fund's actual expense ratio and anassumed rate of return of 5% per year before expenses, which is not the Fund's actual return. Thus, you shouldnot use the hypothetical account values and expenses to estimate the actual ending account balance or your expenses for the period. Rather, these figures are required to be provided to enable you to compare the ongoing costs of investing in the Fund with other funds. To do so, compare this 5% hypothetical example with the 5% hypothetical examples that appear in the shareholder reports of the other funds.
Annual Shareholder Report
Please note that the expenses shown in the table are meant to highlight your ongoing costs only and do not reflect any transaction costs, such as sales charges on purchase or redemption payments. Therefore, the second section of the table is useful in comparing ongoing costs only, and will not help you determine the relativetotal costs of owning different funds. In addition, if these transaction costs were included, your costs would have been higher.
| | Beginning
Account Value
5/1/2019 | Ending
Account Value
10/31/2019 | Expenses Paid
During Period1 |
| Actual: | | | |
| Class A Shares | $1,000 | $1,062.50 | $5.77 |
| Class C Shares | $1,000 | $1,058.60 | $9.55 |
| Institutional Shares | $1,000 | $1,063.90 | $4.42 |
| Class R6 Shares | $1,000 | $1,063.90 | $4.42 |
Hypothetical (assuming a 5% return
before expenses): | | | |
| Class A Shares | $1,000 | $1,019.61 | $5.65 |
| Class C Shares | $1,000 | $1,015.93 | $9.35 |
| Institutional Shares | $1,000 | $1,020.92 | $4.33 |
| Class R6 Shares | $1,000 | $1,020.92 | $4.33 |
1 | Expenses are equal to the Fund's annualized net expense ratios, multiplied by the average account value over the period, multiplied by 184/365 (to reflect the one-half-year period). The annualized net expense ratios are as follows: |
| | |
| Class A Shares | 1.11% |
| Class C Shares | 1.84% |
| Institutional Shares | 0.85% |
| Class R6 Shares | 0.85% |
Annual Shareholder Report
Board of Trustees and Trust Officers
The Board of Trustees is responsible for managing the Trust's business affairs and for exercising all the Trust's powers except those reserved for the shareholders. The following tables give information about each Trustee and the senior officers of the Fund. Where required, the tables separately list Trustees who are “interested persons” of the Fund (i.e., “Interested” Trustees) and those who are not (i.e., “Independent” Trustees). Unless otherwise noted, the address of each person listed is Federated Investors Tower, 1001 Liberty Avenue, Pittsburgh, PA 15222. The address of all Independent Trustees listed is 4000 Ericsson Drive, Warrendale, PA 15086-7561; Attention: Mutual Fund Board. As of December 31, 2018, the Trust comprised 10 portfolio(s), and the Federated Fund Family consisted of 40 investment companies (comprising 102 portfolios). Unless otherwise noted, each Officer is elected annually. Unless otherwise noted, each Trustee oversees all portfolios in the Federated Fund Family and serves for an indefinite term. The Fund's Statement of Additional Information includes additional information about Trust Trustees and is available, without charge and upon request, by calling 1-800-341-7400.
Interested TRUSTEES Background
Name
Birth Date
Positions Held with Trust
Date Service Began | Principal Occupation(s) for Past Five Years,
Other Directorships Held and Previous Position(s) |
J. Christopher Donahue*
Birth Date: April 11, 1949
President and Trustee
Indefinite Term
Began serving: September 1999 | Principal Occupations: Principal Executive Officer and President of certain of the Funds in the Federated Fund Family; Director or Trustee of the Funds in the Federated Fund Family; President, Chief Executive Officer and Director, Federated Investors, Inc.; Chairman and Trustee, Federated Investment Management Company; Trustee, Federated Investment Counseling; Chairman and Director, Federated Global Investment Management Corp.; Chairman and Trustee, Federated Equity Management Company of Pennsylvania; Trustee, Federated Shareholder Services Company; Director, Federated Services Company.
Previous Positions: President, Federated Investment Counseling; President and Chief Executive Officer, Federated Investment Management Company, Federated Global Investment Management Corp. and Passport Research, Ltd; Chairman, Passport Research, Ltd. |
Annual Shareholder Report
Name
Birth Date
Positions Held with Trust
Date Service Began | Principal Occupation(s) for Past Five Years,
Other Directorships Held and Previous Position(s) |
John B. Fisher*
Birth Date: May 16, 1956
Trustee
Indefinite Term
Began serving: May 2016 | Principal Occupations:Principal Executive Officer and President of certain of the Funds in the Federated Fund Family; Director or Trustee of certain of the Funds in the Federated Fund Family; Vice President, Federated Investors, Inc.; President, Director/Trustee and CEO, Federated Advisory Services Company, Federated Equity Management Company of Pennsylvania, Federated Global Investment Management Corp., Federated Investment Counseling, Federated Investment Management Company; President of some of the Funds in the Federated Fund Complex and Director, Federated Investors Trust Company.
Previous Positions: President and Director of the Institutional Sales Division of Federated Securities Corp.; President and Director of Federated Investment Counseling; President and CEO of Passport Research, Ltd.; Director, Edgewood Securities Corp.; Director, Federated Services Company; Director, Federated Investors, Inc.; Chairman and Director, Southpointe Distribution Services, Inc. and President, Technology, Federated Services Company. |
| * | Reasons for “interested” status: J. Christopher Donahue and John B. Fisher are interested due to their beneficial ownership of shares of Federated Investors, Inc. and due to positions they hold with Federated and its subsidiaries. |
INDEPENDENT TRUSTEES Background
Name
Birth Date
Positions Held with Trust
Date Service Began | Principal Occupation(s) for Past Five Years,
Other Directorships Held, Previous Position(s) and Qualifications |
John T. Collins
Birth Date: January 24, 1947
Trustee
Indefinite Term
Began serving: October 2013 | Principal Occupations: Director or Trustee of the Federated Fund Family; formerly, Chairman and CEO, The Collins Group, Inc. (a private equity firm) (Retired).
Other Directorships Held: Director, Chairman of the Compensation Committee, KLX Energy Services Holdings, Inc. (oilfield services); former Director of KLX Corp. (aerospace).
Qualifications: Mr. Collins has served in several business and financial management roles and directorship positions throughout his career. Mr. Collins previously served as Chairman and CEO of The Collins Group, Inc. (a private equity firm) and as a Director of KLX Corp. Mr. Collins serves as Chairman Emeriti, Bentley University. Mr. Collins previously served as Director and Audit Committee Member, Bank of America Corp.; Director, FleetBoston Financial Corp.; and Director, Beth Israel Deaconess Medical Center (Harvard University Affiliate Hospital). |
Annual Shareholder Report
Name
Birth Date
Positions Held with Trust
Date Service Began | Principal Occupation(s) for Past Five Years,
Other Directorships Held, Previous Position(s) and Qualifications |
G. Thomas Hough
Birth Date: February 28, 1955
Trustee
Indefinite Term
Began serving: August 2015 | Principal Occupations: Director or Trustee of the Federated Fund Family; formerly, Vice Chair, Ernst & Young LLP (public accounting firm) (Retired).
Other Directorships Held: Director, Member of Governance and Compensation Committees, Publix Super Markets, Inc.; Director, Chair of the Audit Committee, Equifax, Inc.; Director, Member of the Audit Committee, Haverty Furniture Companies, Inc.
Qualifications: Mr. Hough has served in accounting, business management and directorship positions throughout his career. Mr. Hough most recently held the position of Americas Vice Chair of Assurance with Ernst & Young LLP (public accounting firm). Mr. Hough serves on the President's Cabinet and Business School Board of Visitors for the University of Alabama and is on the Business School Board of Visitors for Wake Forest University. Mr. Hough previously served as an Executive Committee member of the United States Golf Association. |
Maureen Lally-Green
Birth Date: July 5, 1949
Trustee
Indefinite Term
Began serving: August 2009 | Principal Occupations: Director or Trustee of the Federated Fund Family; Adjunct Professor of Law, Duquesne University School of Law; formerly, Dean of the Duquesne University School of Law and Professor of Law and Interim Dean of the Duquesne University School of Law; formerly, Associate General Secretary and Director, Office of Church Relations, Diocese of Pittsburgh.
Other Directorships Held: Director, CNX Resources Corporation (formerly known as CONSOL Energy Inc.).
Qualifications: Judge Lally-Green has served in various legal and business roles and directorship positions throughout her career. Judge Lally-Green previously held the position of Dean of the School of Law of Duquesne University (as well as Interim Dean). Judge Lally-Green previously served as a member of the Superior Court of Pennsylvania and as a Professor of Law, Duquesne University School of Law. Judge Lally-Green also currently holds the positions on not for profit or for profit boards of directors as follows: Director and Chair, UPMC Mercy Hospital; Director and Vice Chair, Our Campaign for the Church Alive!, Inc.; Regent, Saint Vincent Seminary; Member, Pennsylvania State Board of Education (public); and Director CNX Resources Corporation (formerly known as CONSOL Energy Inc.). Judge Lally-Green has held the positions of: Director, Auberle; Director, Epilepsy Foundation of Western and Central Pennsylvania; Director, Ireland Institute of Pittsburgh; Director, Saint Thomas More Society; Director and Chair, Catholic High Schools of the Diocese of Pittsburgh, Inc.; Director, Pennsylvania Bar Institute; Director, St. Vincent College; and Director and Chair, North Catholic High School, Inc. |
Charles F. Mansfield, Jr.
Birth Date: April 10, 1945
Trustee
Indefinite Term
Began serving: January 1999 | Principal Occupations: Director or Trustee of the Federated Fund Family; Management Consultant and Author.
Other Directorships Held: None.
Qualifications: Mr. Mansfield has served as a Marine Corps officer and in several banking, business management, educational roles and directorship positions throughout his long career. He remains active as a Management Consultant and Author. |
Annual Shareholder Report
Name
Birth Date
Positions Held with Trust
Date Service Began | Principal Occupation(s) for Past Five Years,
Other Directorships Held, Previous Position(s) and Qualifications |
Thomas M. O'Neill
Birth Date: June 14, 1951
Trustee
Indefinite Term
Began serving: August 2006 | Principal Occupations: Director or Trustee, Chair of the Audit Committee of the Federated Fund Family; Sole Proprietor, Navigator Management Company (investment and strategic consulting).
Other Directorships Held: None.
Qualifications: Mr. O'Neill has served in several business, mutual fund and financial management roles and directorship positions throughout his career. Mr. O'Neill serves as Director, Medicines for Humanity and Director, The Golisano Children's Museum of Naples, Florida. Mr. O'Neill previously served as Chief Executive Officer and President, Managing Director and Chief Investment Officer, Fleet Investment Advisors; President and Chief Executive Officer, Aeltus Investment Management, Inc.; General Partner, Hellman, Jordan Management Co., Boston, MA; Chief Investment Officer, The Putnam Companies, Boston, MA; Credit Analyst and Lending Officer, Fleet Bank; Director and Consultant, EZE Castle Software (investment order management software); and Director, Midway Pacific (lumber). |
P. Jerome Richey
Birth Date: February 23, 1949
Trustee
Indefinite Term
Began serving: October 2013 | Principal Occupations: Director or Trustee of the Federated Fund Family; Management Consultant; Retired; formerly, Senior Vice Chancellor and Chief Legal Officer, University of Pittsburgh and Executive Vice President and Chief Legal Officer, CNX Resources Corporation (formerly known as CONSOL Energy Inc.).
Other Directorships Held: None.
Qualifications: Mr. Richey has served in several business and legal management roles and directorship positions throughout his career. Mr. Richey most recently held the positions of Senior Vice Chancellor and Chief Legal Officer, University of Pittsburgh. Mr. Richey previously served as Chairman of the Board, Epilepsy Foundation of Western Pennsylvania and Chairman of the Board, World Affairs Council of Pittsburgh. Mr. Richey previously served as Chief Legal Officer and Executive Vice President, CNX Resources Corporation (formerly known as CONSOL Energy Inc.); and Board Member, Ethics Counsel and Shareholder, Buchanan Ingersoll & Rooney PC (a law firm). |
John S. Walsh
Birth Date: November 28, 1957
Trustee
Indefinite Term
Began serving: January 1999 | Principal Occupations: Director or Trustee, and Chair of the Board of Directors or Trustees, of the Federated Fund Family; President and Director, Heat Wagon, Inc. (manufacturer of construction temporary heaters); President and Director, Manufacturers Products, Inc. (distributor of portable construction heaters); President, Portable Heater Parts, a division of Manufacturers Products, Inc.
Other Directorships Held: None.
Qualifications: Mr. Walsh has served in several business management roles and directorship positions throughout his career. Mr. Walsh previously served as Vice President, Walsh & Kelly, Inc. (paving contractors). |
Annual Shareholder Report
OFFICERS
Name
Birth Date
Address
Positions Held with Trust
Date Service Began | Principal Occupation(s) for Past Five Years
and Previous Position(s) |
Lori A. Hensler
Birth Date: January 6, 1967
TREASURER
Officer since: April 2013 | Principal Occupations: Principal Financial Officer and Treasurer of the Federated Fund Family; Senior Vice President, Federated Administrative Services; Financial and Operations Principal for Federated Securities Corp. and Edgewood Services, Inc.; and Assistant Treasurer, Federated Investors Trust Company. Ms. Hensler has received the Certified Public Accountant designation.
Previous Positions: Controller of Federated Investors, Inc.; Senior Vice President and Assistant Treasurer, Federated Investors Management Company; Treasurer, Federated Investors Trust Company; Assistant Treasurer, Federated Administrative Services, Federated Administrative Services, Inc., Federated Securities Corp., Edgewood Services, Inc., Federated Advisory Services Company, Federated Equity Management Company of Pennsylvania, Federated Global Investment Management Corp., Federated Investment Counseling, Federated Investment Management Company, Passport Research, Ltd., and Federated MDTA, LLC; Financial and Operations Principal for Federated Securities Corp., Edgewood Services, Inc. and Southpointe Distribution Services, Inc. |
Peter J. Germain
Birth Date: September 3, 1959
CHIEF LEGAL OFFICER, SECRETARY and EXECUTIVE VICE PRESIDENT
Officer since: January 2005 | Principal Occupations: Mr. Germain is Chief Legal Officer, Secretary and Executive Vice President of the Federated Fund Family. He is General Counsel, Chief Legal Officer, Secretary and Executive Vice President, Federated Investors, Inc.; Trustee and Senior Vice President, Federated Investors Management Company; Trustee and President, Federated Administrative Services; Director and President, Federated Administrative Services, Inc.; Director and Vice President, Federated Securities Corp.; Director and Secretary, Federated Private Asset Management, Inc.; Secretary, Federated Shareholder Services Company; and Secretary, Retirement Plan Service Company of America. Mr. Germain joined Federated in 1984 and is a member of the Pennsylvania Bar Association.
Previous Positions: Deputy General Counsel, Special Counsel, Managing Director of Mutual Fund Services, Federated Investors, Inc.; Senior Vice President, Federated Services Company; and Senior Corporate Counsel, Federated Investors, Inc. |
Stephen Van Meter
Birth Date: June 5, 1975
CHIEF COMPLIANCE OFFICER AND SENIOR VICE PRESIDENT
Officer since: July 2015 | Principal Occupations: Senior Vice President and Chief Compliance Officer of the Federated Fund Family; Vice President and Chief Compliance Officer of Federated Investors, Inc. and Chief Compliance Officer of certain of its subsidiaries. Mr. Van Meter joined Federated in October 2011. He holds FINRA licenses under Series 3, 7, 24 and 66.
Previous Positions: Mr. Van Meter previously held the position of Compliance Operating Officer, Federated Investors, Inc. Prior to joining Federated, Mr. Van Meter served at the United States Securities and Exchange Commission in the positions of Senior Counsel, Office of Chief Counsel, Division of Investment Management and Senior Counsel, Division of Enforcement. |
Annual Shareholder Report
Name
Birth Date
Address
Positions Held with Trust
Date Service Began | Principal Occupation(s) for Past Five Years
and Previous Position(s) |
Stephen F. Auth
Birth Date: September 13, 1956
101 Park Avenue
41st Floor
New York, NY 10178
CHIEF INVESTMENT OFFICER
Officer since: November 2002 | Principal Occupations: Stephen F. Auth is Chief Investment Officer of various Funds in the Federated Fund Family; Executive Vice President, Federated Investment Counseling, Federated Global Investment Management Corp. and Federated Equity Management Company of Pennsylvania.
Previous Positions: Executive Vice President, Federated Investment Management Company and Passport Research, Ltd. (investment advisory subsidiary of Federated); Senior Vice President, Global Portfolio Management Services Division; Senior Vice President, Federated Investment Management Company and Passport Research, Ltd.; Senior Managing Director and Portfolio Manager, Prudential Investments. |
Annual Shareholder Report
Evaluation and Approval of Advisory Contract–May 2019
Federated Global Strategic Value Dividend Fund (the “Fund”)
At its meetings in May 2019, the Fund's Board of Trustees (the “Board”), including a majority of those Trustees who are not “interested persons” of the Fund, as defined in the Investment Company Act of 1940 (the “Independent Trustees”), reviewed and unanimously approved the continuation of the Fund's investment advisory contract for an additional one-year term. The Board's decision regarding the contract reflects the exercise of its business judgment after considering all of the information received on whether to continue the existing arrangements.
At the request of the Independent Trustees, the Fund's Chief Compliance Officer (the CCO) furnished to the Board in advance of its May 2019 meetings an independent written evaluation presenting on the topics discussed below. The Board considered the CCO's independent written evaluation (the “CCO Fee Evaluation Report”), along with other information, in evaluating the reasonableness of the Fund's management fee and in deciding to approve the continuation of the investment advisory contract. The CCO, in preparing the CCO Fee Evaluation Report, has the authority to retain consultants, experts or staff as reasonably necessary to assist in the performance of his duties, reports directly to the Board, and can be terminated only with the approval of a majority of the Independent Trustees. At the request of the Independent Trustees, the CCO Fee Evaluation Report followed the same general approach and covered the same topics as that of the report that had previously been delivered by the CCO in his capacity as “Senior Officer,” prior to the elimination of the Senior Officer position in December 2017.
The Board also considered judicial decisions concerning allegedly excessive investment advisory fees in making its decision. Using these judicial decisions as a guide, the Board observed that the following factors may be relevant to an adviser's fiduciary duty with respect to its receipt of compensation from a fund: (1) the nature and quality of the services provided by an adviser to a fund and its shareholders (including the performance of the fund, its benchmark, and comparable funds); (2) an adviser's cost of providing the services (including the profitability to an adviser of providing advisory services to a fund); (3) the extent to which an adviser may realize “economies of scale” as a fund grows larger and, if such economies of scale exist, whether they have been shared with a fund and its shareholders or the family of funds; (4) any “fall-out” financial benefits that accrue to an adviser because of its relationship with a fund (including research services received from brokers that execute fund trades and any fees paid to affiliates of an adviser for services rendered to a fund); (5) comparative fee and expense structures (including a comparison of fees paid to an adviser with those paid by similar funds both internally and externally as well as management fees charged to institutional and other advisory clients of the
Annual Shareholder Report
adviser for what might be viewed as like services); and (6) the extent of care, conscientiousness and independence with which the fund's board members perform their duties and their expertise (including whether they are fully informed about all facts the board deems relevant to its consideration of an adviser's services and fees). The Board noted that the Securities and Exchange Commission (SEC) disclosure requirements regarding the basis for the Board's approval of the Fund's investment advisory contract generally align with the factors listed above. The Board was aware of these factors and was guided by them in its review of the Fund's investment advisory contract to the extent it considered them to be appropriate and relevant, as discussed further below.
The Board considered and weighed these factors in light of its substantial accumulated experience in governing the Fund and working with Federated Equity Management Company of Pennsylvania (the “Adviser”) and its affiliates (collectively, “Federated”) on matters relating to the funds advised by Federated (each, a “Federated Fund”). The Independent Trustees were assisted in their deliberations by independent legal counsel.
In addition to the extensive materials that comprise and accompany the CCO Fee Evaluation Report, the Board received detailed information about the Fund and the Federated organization throughout the year, and in connection with its May meetings at which the Board's formal approval of the advisory and subadvisory contracts occurred. In this regard, Federated provided much of this information at each regular meeting of the Board, and furnished additional information specifically in connection with the May meetings. In the months preceding the May meetings, the Board requested and reviewed written materials prepared by Federated in response to requests on behalf of the Independent Trustees encompassing a wide variety of topics. At the May meetings, in addition to meeting in separate sessions of the Independent Trustees without management present, senior management of the Adviser also met with the Independent Trustees and their counsel to discuss the materials presented and such additional matters as the Independent Trustees deemed reasonably necessary to evaluate the advisory and subadvisory contracts. Between regularly scheduled meetings, the Board also received information on particular matters as the need arose.
The Board's consideration of the investment advisory contract included review of the CCO Fee Evaluation Report, accompanying data and additional information covering the following matters, among others: the Adviser's investment philosophy, revenue, profitability, personnel and processes; investment and operating strategies; the Fund's short-term and long-term performance (in absolute terms, both on a gross basis and net of expenses, as well as in terms relative to its particular investment program and certain competitor or “peer group” funds and/or other benchmarks, as appropriate) and comments on the reasons for performance; the Fund's investment objectives; the Fund's expenses, including the advisory fee and the overall expense structure of the Fund (both in absolute terms and relative to similar and/or competing funds), with due
Annual Shareholder Report
regard for contractual or voluntary expense limitations; the use and allocation of brokerage commissions derived from trading the Fund's portfolio securities (if any); and the nature, quality and extent of the advisory and other services provided to the Fund by the Adviser and its affiliates. The Board also considered the preferences and expectations of Fund shareholders; the entrepreneurial and other risks assumed by the Adviser in sponsoring the Fund; the continuing state of competition in the mutual fund industry and market practices; the range of comparable fees for similar funds in the mutual fund industry; the Fund's relationship to the Federated Funds which include a comprehensive array of funds with different investment objectives, policies and strategies which are generally available for exchange without the incurrence of additional sales charges; compliance and audit reports concerning the Federated Funds and the Federated companies that service them (including communications from regulatory agencies), as well as Federated's responses to any issues raised therein; and relevant developments in the mutual fund industry and how the Federated Funds and/or Federated are responding to them. The Board's evaluation process is evolutionary. The criteria considered and the emphasis placed on relevant criteria change in recognition of changing circumstances in the mutual fund marketplace.
While mindful that courts have cautioned against giving too much weight to comparative information concerning fees charged by other advisers for managing funds with comparable investment programs, the Board has found the use of such comparisons to be relevant to its deliberations. In this regard, the Board was presented with, and considered, information regarding the contractual advisory fee rates, net advisory fee rates, total expense ratios and each element of the Fund's total expense ratio (i.e., gross and net advisory fees, custody fees, portfolio accounting fees and transfer agency fees) relative to an appropriate group of peer funds compiled by Federated using data supplied by independent fund ranking organizations (the “Peer Group”). The Board received a description of the composition and methodology used to select the Peer Group. The Board focused on comparisons with other similar mutual funds more heavily than non-mutual fund products or services because it is believed that they are more relevant. For example, other mutual funds are the products most like the Fund, in that they are readily available to Fund shareholders as alternative investment vehicles. Also, they are the type of investment vehicle, in fact, chosen and maintained by the Fund's investors. The range of their fees and expenses, therefore, appears to be a relevant indicator of what consumers have found to be reasonable in the marketplace in which the Fund competes.
It was noted in the materials for the Board meeting that the period covered by the CCO Fee Evaluation Report, the Fund's investment advisory fee was waived in its entirety. The Board reviewed the contractual advisory fee rate, net advisory fee rate and other expenses of the Fund with the Adviser and noted
Annual Shareholder Report
the position of the Fund's fee rates relative to its Peer Group. In this regard, the Board noted that the contractual advisory fee rate was below the median of the relevant Peer Group and the Board was satisfied that the overall expense structure of the Fund remained competitive.
For comparison, the CCO reviewed the fees charged by Federated for providing advisory services to products other than the Federated Funds (e.g., institutional separate accounts and third-party unaffiliated mutual funds for which Federated serves as sub-adviser) (referenced to as “Comparable Funds/Accounts”). With respect to Comparable Funds/Accounts other than third-party mutual funds, the CCO concluded that they are inherently different products. Those differences include, but are not limited to, different types of targeted investors; different applicable laws and regulations; different legal structures; different average account sizes and portfolio management techniques made necessary by different cash flows and different associated costs; and the time spent by portfolio managers and their teams, as well as personnel in the Funds Financial Services, Legal, Compliance and Risk Management departments, in reviewing securities pricing, addressing different administrative responsibilities, addressing different degrees of risk associated with management and a variety of different costs. The CCO also reviewed the differences in the nature of the services required for Federated to manage its proprietary mutual fund business versus managing a discrete pool of assets as a sub-adviser to another institution's mutual fund, and that Federated generally performs significant additional services and assumes substantially greater risks in managing the Fund and other Federated Funds than in its role as sub-adviser to an unaffiliated third-party mutual fund. The CCO did not consider the fees for providing advisory services to Comparable Funds/Accounts to be determinative in judging the appropriateness of the Federated Funds' advisory fees.
The CCO noted that the services, administrative responsibilities and risks associated with such relationships is quite different than serving as a primary adviser to a fund.
Following such evaluation, and full deliberations, the Board concluded that the fees and expenses of the Fund are reasonable and supported renewal of the Fund's investment advisory contract.
The Board considered the nature, extent and quality of the services provided to the Fund by the Adviser and the resources of the Adviser and its affiliates dedicated to the Fund. In this regard, the Board evaluated, among other things, the Adviser's personnel, experience, track record, financial resources, overall reputation and willingness to invest in personnel and infrastructure that benefit the Fund. In addition, the Board reviewed the qualifications, backgrounds and responsibilities of the portfolio management team primarily responsible for the day-to-day management of the Fund and the Adviser's ability and experience in attracting and retaining qualified personnel to service the Fund. The Board noted the investment research and company engagement capabilities of the Adviser and its affiliates. The Board also noted the compliance program of the
Annual Shareholder Report
Adviser and the compliance-related resources provided to the Fund by the Adviser, including the Adviser's commitment to respond to rulemaking initiatives of the SEC. The Fund's ability to deliver competitive performance when compared to its Peer Group was also deemed to be relevant by the Board as a useful indicator of how the Adviser is executing the Fund's investment program. The Adviser's ability to execute this program was one of the Board's considerations in reaching a conclusion that the nature, extent and quality of the Adviser's investment management services warrant the continuation of the investment advisory contract.
In evaluating the Fund's investment performance, the Board considered performance results in light of the Fund's investment objective, strategies and risks, as disclosed in the Fund's prospectus. The Board considered detailed investment reports on the Fund's performance that were provided to the Board throughout the year and in connection with the May meetings. The CCO also reviewed information regarding the performance of other mutual funds in the Peer Group, noting the CCO's view that comparisons to fund peer groups may be helpful, though not conclusive, in evaluating the performance of the Adviser in managing the Fund. The Board considered, in evaluating such comparisons, that in some cases there may be differences in the funds' objectives or investment management techniques, or the costs to implement the funds, even within the same Peer Group.
The Fund's performance fell below the median of the relevant Peer Group for the one-year period covered by the CCO Fee Evaluation Report. The Board discussed the Fund's performance with the Adviser and recognized the efforts being taken by the Adviser in the context of the other factors considered relevant by the Board.
Following such evaluation, and full deliberations, the Board concluded that the performance of the Fund supported renewal of the Fund's investment advisory contract.
The Board also received financial information about Federated, including information regarding the compensation and ancillary (or “fall-out”) benefits Federated derived from its relationships with the Federated Funds. This information covered not only the fees under the investment advisory contracts, but also fees received by Federated's subsidiaries for providing other services to the Federated Funds under separate contracts (e.g., for serving as the Federated funds' administrator and distributor). In this regard, the Board considered that certain Federated subsidiaries provide distribution and shareholder services to the Federated Funds, for which they may be compensated through distribution and servicing fees paid pursuant to Rule 12b-1 plans or otherwise. The information also detailed any indirect benefit Federated may derive from its receipt of research services from brokers who execute Federated Fund trades. In addition, the Board considered the fact that, in order for a Federated Fund to be competitive in the marketplace, the Adviser and its affiliates frequently waived fees and/or reimbursed expenses and have disclosed to Federated Fund investors
Annual Shareholder Report
and/or indicated to the Board their intention to do so in the future. Moreover, the Board receives regular reporting as to the institution, adjustment or elimination of these voluntary waivers. The Board considered Federated's previous reductions in contractual management fees to certain Federated Funds in response to the CCO's recommendations in the prior year's CCO Fee Evaluation Report.
Federated furnished information, requested by the CCO, that reported revenues on a fund-by-fund basis and made estimates of the allocation of expenses on a fund-by-fund basis, using allocation methodologies specified by the CCO. The CCO noted that, while these cost allocation reports apply consistent allocation processes, the inherent difficulties in allocating costs continues to cause the CCO to question the precision of the process and to conclude that such reports may be unreliable, since a single change in an allocation estimate may dramatically alter the resulting estimate of cost and/or profitability of a Federated Fund and may produce unintended consequences. The allocation information, including the CCO's view that fund-by-fund estimations may be unreliable, was considered in the evaluation by the Board.
The Board and the CCO also reviewed information compiled by Federated comparing its profitability information to other publicly held fund management companies, including information regarding profitability trends over time. In this regard, the CCO concluded that Federated's profit margins did not appear to be excessive. The CCO also noted that Federated appeared financially sound, with the resources necessary to fulfill its obligations under its contracts with the Fund.
The CCO Fee Evaluation Report also discussed the notion of possible realization of “economies of scale” as a fund grows larger, the difficulties of calculating economies of scale at an individual fund level, and the extent to which potential scale benefits are shared with shareholders. In this regard, the Board considered that Federated has made significant and long-term investments in areas that support all of the Federated Funds, such as personnel and processes for the portfolio management, shareholder services, compliance, internal audit and risk management functions, as well as systems technology (including technology relating to cybersecurity) and that the benefits of these investments (as well as any economies of scale, should they exist) were likely to be shared with the Federated Fund family as a whole. The Board noted that Federated's investments in these areas are extensive. In addition, the Board considered that the Adviser and its affiliates have frequently waived fees and/or reimbursed expenses and that this has allowed potential economies of scale to be shared with shareholders. The Board also considered that such waivers and reimbursements can provide protection from an increase in expenses if a Federated Fund's assets decline. Federated, as it does throughout the year, and specifically in connection with the Board's review of the advisory and subadvisory contracts, furnished information relative to revenue sharing or adviser-paid fees. Federated and the CCO noted that this information should be
Annual Shareholder Report
viewed to determine if there was an incentive to either not apply breakpoints, or to apply breakpoints at higher levels, and should not be viewed to determine the appropriateness of advisory fees. The Board also noted the absence of any applicable regulatory or industry guidelines on this subject, which (as discussed in the CCO Fee Evaluation Report) is compounded by the lack of any common industry practice or general pattern with respect to structuring fund advisory fees with “breakpoints” that serve to reduce the fee as a fund attains a certain size.
The CCO stated that his observations and the information accompanying the CCO Fee Evaluation Report supported a finding by the Board that the management fee for the Fund was reasonable. Under these circumstances, no changes were recommended to, and no objection was raised to the continuation of, the Fund's investment advisory contract. The CCO also recognized that the Board's evaluation of the Federated Funds' advisory and subadvisory arrangements is a continuing and on-going process that is informed by the information that the Board requests and receives from management throughout the course of the year and, in this regard, the CCO noted certain items for future reporting to the Board or further consideration by management as the Board continues its on-going oversight of the Federated Funds.
In its decision to continue an existing investment advisory contract, the Board was mindful of the potential disruptions of the Fund's operations and various risks, uncertainties and other effects that could occur as a result of a decision to terminate or not renew an investment advisory contract. In particular, the Board recognized that many shareholders have invested in the Fund on the strength of the Adviser's industry standing and reputation and with the expectation that the Adviser will have a continuing role in providing advisory services to the Fund. Thus, the Board's approval of the investment advisory contract reflected the fact that it is the shareholders who have effectively selected the Adviser by virtue of having invested in the Fund. The Board concluded that, in light of the factors summarized above, including the nature, quality and scope of the services provided to the Fund by the Adviser and its affiliates, continuation of the investment advisory contract was appropriate.
The Board based its decision to approve the investment advisory contract on the totality of the circumstances and relevant factors and with a view to past and future long-term considerations. Not all of the factors and considerations identified above were necessarily relevant to the Fund, nor did the Board consider any one of them to be determinative. With respect to the factors that were relevant, the Board's decision to approve the continuation of the contract reflects its view that Federated's performance and actions provided a satisfactory basis to support the decision to continue the existing arrangement.
Annual Shareholder Report
Voting Proxies on Fund Portfolio Securities
A description of the policies and procedures that the Fund uses to determine how to vote proxies, if any, relating to securities held in the Fund's portfolio is available, without charge and upon request, by calling 1-800-341-7400. A report on “Form N-PX” of how the Fund voted any such proxies during the most recent 12-month period ended June 30 is available via the Proxy Voting Record (Form N-PX) link associated with the Fund and share class name at www.FederatedInvestors.com/FundInformation. Form N-PX filings are also available at the SEC's website at www.sec.gov.
Quarterly Portfolio Schedule
Each fiscal quarter, the Fund will file with the SEC a complete schedule of its monthly portfolio holdings on “Form N-PORT.” The Fund's holdings as of the end of the third month of every fiscal quarter, as reported on Form N-PORT, will be publicly available on the SEC's website at www.sec.gov within 60 days of the end of the fiscal quarter upon filing. You may also access this information via the link to the Fund and share class name at www.FederatedInvestors.com.
Annual Shareholder Report
Mutual funds are not bank deposits or obligations, are not guaranteed by any bank and are not insured or guaranteed by the U.S. government, the Federal Deposit Insurance Corporation, the Federal Reserve Board or any other government agency. Investment in mutual funds involves investment risk, including the possible loss of principal.
This Report is authorized for distribution to prospective investors only when preceded or accompanied by the Fund's Prospectus, which contains facts concerning its objective and policies, management fees, expenses and other information.
Federated Global Strategic Value Dividend Fund
Federated Investors Funds
4000 Ericsson Drive
Warrendale, PA 15086-7561
Contact us at FederatedInvestors.com
or call 1-800-341-7400.
Federated Securities Corp., Distributor
CUSIP 31421N865
CUSIP 31421N857
CUSIP 31421N840
CUSIP 31421N832
Q453249 (12/19)
Federated is a registered trademark of Federated Investors, Inc.
2019 ©Federated Investors, Inc.
(a) As of the end of the period covered by this report, the registrant has adopted a code of ethics (the "Section 406 Standards for Investment Companies - Ethical Standards for Principal Executive and Financial Officers") that applies to the registrant's Principal Executive Officer and Principal Financial Officer; the registrant's Principal Financial Officer also serves as the Principal Accounting Officer.
(c) There was no amendment to the registrant’s code of ethics described in Item 2(a) above during the period covered by the report.
(d) There was no waiver granted, either actual or implicit, from a provision to the registrant’s code of ethics described in Item 2(a) above during the period covered by the report.
(e) Not Applicable
(f)(3) The registrant hereby undertakes to provide any person, without charge, upon request, a copy of the code of ethics. To request a copy of the code of ethics, contact the registrant at 1-800-341-7400, and ask for a copy of the Section 406 Standards for Investment Companies - Ethical Standards for Principal Executive and Financial Officers.
Item 3. Audit Committee Financial Expert
The registrant's Board has determined that each of the following members of the Board's Audit Committee is an “audit committee financial expert,” and is "independent," for purposes of this Item: John T. Collins, G. Thomas Hough and Thomas M. O'Neill.
| Item 4. | Principal Accountant Fees and Services |
(a) Audit Fees billed to the registrant for the two most recent fiscal years:
Fiscal year ended 2019 - $331,286
Fiscal year ended 2018 - $368,570
(b) Audit-Related Fees billed to the registrant for the two most recent fiscal years:
Fiscal year ended 2019 - $0
Fiscal year ended 2018 - $0
Amount requiring approval of the registrant’s audit committee pursuant to paragraph (c)(7)(ii) of Rule 2-01 of Regulation S-X, $4,816 and $0 respectively. Fiscal year ended 2019- Audit consent for N-14 merger document.
(c) Tax Fees billed to the registrant for the two most recent fiscal years:
Fiscal year ended 2019 - $0
Fiscal year ended 2018 - $0
Amount requiring approval of the registrant’s audit committee pursuant to paragraph (c)(7)(ii) of Rule 2-01 of Regulation S-X, $0 and $0 respectively.
(d) All Other Fees billed to the registrant for the two most recent fiscal years:
Fiscal year ended 2019 - $0
Fiscal year ended 2018 - $0
Amount requiring approval of the registrant’s audit committee pursuant to paragraph (c)(7)(ii) of Rule 2-01 of Regulation S-X, $35,229 and $41,823 respectively. Fiscal year ended 2019- Service fee for analysis of potential Passive Foreign Investment Company holdings. Fiscal year ended 2018- Service fee for analysis of potential Passive Foreign Investment Company holdings.
(e)(1) Audit Committee Policies regarding Pre-approval of Services.
The Audit Committee is required to pre-approve audit and non-audit services performed by the independent auditor in order to assure that the provision of such services do not impair the auditor’s independence. Unless a type of service to be provided by the independent auditor has received general pre-approval, it will require specific pre-approval by the Audit Committee. Any proposed services exceeding pre-approved cost levels will require specific pre-approval by the Audit Committee.
Certain services have the general pre-approval of the Audit Committee. The term of the general pre-approval is 12 months from the date of pre-approval, unless the Audit Committee specifically provides for a different period. The Audit Committee will annually review the services that may be provided by the independent auditor without obtaining specific pre-approval from the Audit Committee and may grant general pre-approval for such services. The Audit Committee will revise the list of general pre-approved services from time to time, based on subsequent determinations. The Audit Committee will not delegate its responsibilities to pre-approve services performed by the independent auditor to management.
The Audit Committee has delegated pre-approval authority to its Chairman. The Chairman will report any pre-approval decisions to the Audit Committee at its next scheduled meeting. The Committee will designate another member with such pre-approval authority when the Chairman is unavailable.
AUDIT SERVICES
The annual Audit services engagement terms and fees will be subject to the specific pre-approval of the Audit Committee. The Audit Committee must approve any changes in terms, conditions and fees resulting from changes in audit scope, registered investment company (RIC) structure or other matters.
In addition to the annual Audit services engagement specifically approved by the Audit Committee, the Audit Committee may grant general pre-approval for other Audit Services, which are those services that only the independent auditor reasonably can provide. The Audit Committee has pre-approved certain Audit services, all other Audit services must be specifically pre-approved by the Audit Committee.
AUDIT-RELATED SERVICES
Audit-related services are assurance and related services that are reasonably related to the performance of the audit or review of the Company’s financial statements or that are traditionally performed by the independent auditor. The Audit Committee believes that the provision of Audit-related services does not impair the independence of the auditor, and has pre-approved certain Audit-related services, all other Audit-related services must be specifically pre-approved by the Audit Committee.
TAX SERVICES
The Audit Committee believes that the independent auditor can provide Tax services to the Company such as tax compliance, tax planning and tax advice without impairing the auditor’s independence. However, the Audit Committee will not permit the retention of the independent auditor in connection with a transaction initially recommended by the independent auditor, the purpose of which may be tax avoidance and the tax treatment of which may not be supported in the Internal Revenue Code and related regulations. The Audit Committee has pre-approved certain Tax services, all Tax services involving large and complex transactions must be specifically pre-approved by the Audit Committee.
ALL OTHER SERVICES
With respect to the provision of services other than audit, review or attest services the pre-approval requirement is waived if:
| (1) | The aggregate amount of all such services provided constitutes no more than five percent of the total amount of revenues paid by the registrant, the registrant’s adviser (not including any sub-adviser whose role is primarily portfolio management and is subcontracted with or overseen by another investment adviser), and any entity controlling, controlled by, or under common control with the investment adviser that provides ongoing services to the registrant to its accountant during the fiscal year in which the services are provided; |
| (2) | Such services were not recognized by the registrant, the registrant’s adviser (not including any sub-adviser whose role is primarily portfolio management and is subcontracted with or overseen by another investment adviser), and any entity controlling, controlled by, or under common control with the investment adviser that provides ongoing services to the registrant at the time of the engagement to be non-audit services; and |
| (3) | Such services are promptly brought to the attention of the Audit Committee of the issuer and approved prior to the completion of the audit by the Audit Committee or by one or more members of the Audit Committee who are members of the board of directors to whom authority to grant such approvals has been delegated by the Audit Committee. |
The Audit Committee may grant general pre-approval to those permissible non-audit services classified as All Other services that it believes are routine and recurring services, and would not impair the independence of the auditor.
The SEC’s rules and relevant guidance should be consulted to determine the precise definitions of prohibited non-audit services and the applicability of exceptions to certain of the prohibitions.
PRE-APPROVAL FEE LEVELS
Pre-approval fee levels for all services to be provided by the independent auditor will be established annually by the Audit Committee. Any proposed services exceeding these levels will require specific pre-approval by the Audit Committee.
PROCEDURES
Requests or applications to provide services that require specific approval by the Audit Committee will be submitted to the Audit Committee by both the independent auditor and the Principal Accounting Officer and/or Internal Auditor, and must include a joint statement as to whether, in their view, the request or application is consistent with the SEC’s rules on auditor independence.
(e)(2) Percentage of services identified in items 4(b) through 4(d) that were approved by the registrants audit committee pursuant to paragraph (c)(7)(i)(C) of Rule 2-01 of Regulation S-X:
4(b)
Fiscal year ended 2019 – 0%
Fiscal year ended 2018 - 0%
Percentage of services provided to the registrants investment adviser and any entity controlling, controlled by, or under common control with the investment adviser that provides ongoing services to the registrant that were approved by the registrants audit committee pursuant to paragraph (c)(7)(i)(C) of Rule 2-01 of Regulation S-X, 0% and 0% respectively.
4(c)
Fiscal year ended 2019 – 0%
Fiscal year ended 2018 – 0%
Percentage of services provided to the registrants investment adviser and any entity controlling, controlled by, or under common control with the investment adviser that provides ongoing services to the registrant that were approved by the registrants audit committee pursuant to paragraph (c)(7)(i)(C) of Rule 2-01 of Regulation S-X, 0% and 0% respectively.
4(d)
Fiscal year ended 2019 – 0%
Fiscal year ended 2018 – 0%
Percentage of services provided to the registrants investment adviser and any entity controlling, controlled by, or under common control with the investment adviser that provides ongoing services to the registrant that were approved by the registrants audit committee pursuant to paragraph (c)(7)(i)(C) of Rule 2-01 of Regulation S-X, 0% and 0% respectively.
| (g) | Non-Audit Fees billed to the registrant, the registrant’s investment adviser, and certain entities controlling, controlled by or under common control with the investment adviser: |
Fiscal year ended 2019 - $801,398
Fiscal year ended 2018 - $1,590,886
| (h) | The registrant’s Audit Committee has considered that the provision of non-audit services that were rendered to the registrant’s adviser (not including any sub-adviser whose role is primarily portfolio management and is subcontracted with or overseen by another investment adviser), and any entity controlling, controlled by, or under common control with the investment adviser that provides ongoing services to the registrant that were not pre-approved pursuant to paragraph (c)(7)(ii) of Rule 2-01 of Regulation S-X is compatible with maintaining the principal accountant’s independence. |
The registrant’s management and Audit Committee continue to believe that the registrant’s registered public accounting firms, Ernst & Young LLP (“EY”) and KPMG LLP (“KPMG”) (as applicable, “EY/KPMG”), have the ability to exercise objective and impartial judgment on all issues encompassed within their audit services. EY/KPMG is required to make a determination that it satisfies certain independence requirements under the federal securities laws. Like other registrants, there is a risk that activities or relationships of EY/KPMG, or its partners or employees, can prevent a determination from being made that it satisfies such independence requirements with respect to the registrant, which could render it ineligible to serve as the registrant’s independent public accountant.
In their respective required communications to the Audit Committee of the registrant’s Board, EY/KPMG informed the Audit Committee that EY/KPMG and/or covered person professionals within EY/KPMG maintain lending relationships with certain owners of greater than 10% of the shares of the registrant and/or certain investment companies within the “investment company complex” as defined under Rule 2-01(f)(14) of Regulation S-X, which are affiliates of the registrant. EY/KPMG has advised the Audit Committee that these lending relationships implicate Rule 2-01(c)(1)(ii)(A) of Regulation S-X (referred to as the “Loan Rule”). The Loan Rule prohibits an independent public accountant, or covered person professionals at such firm, from having a financial relationship (such as a loan) with a lender that is a record or beneficial owner of more than 10% of an audit client’s equity securities. For purposes of the Loan Rule, audit clients include the registrant, as well as all registered investment companies advised by advisory subsidiaries of Federated Investors, Inc., the Adviser (for which EY serves as independent public accountant), and their respective affiliates (collectively, the “Federated Fund Complex”).
EY/KPMG informed the Audit Committee that EY/KPMG believes that these lending relationships described above do not and will not impair EY/KPMG’s ability to exercise objective and impartial judgment in connection with financial statement audits of their respective funds of the registrant and a reasonable investor with knowledge of all relevant facts and circumstances would conclude that EY/KPMG has been and is capable of objective and impartial judgment on all issues encompassed within EY/KPMG’s audits.
On June 20, 2016, the Division of Investment Management of the Securities and Exchange Commission (“SEC”) issued a no-action letter to another mutual fund complex (see Fidelity Management & Research Company et al., No-Action Letter) related to similar Loan Rule matters as those described above (the “Letter”). In the Letter, the SEC Staff confirmed that it would not recommend enforcement action against an investment company that relied on the audit services performed by an independent public accountant where the Loan Rule was implicated in certain specified circumstances provided that: (1) the auditor has complied with PCAOB Rule 3526(b)(1) and 3526(b)(2); (2) the Loan Rule is implicated because of lending relationships; and (3) notwithstanding such lending relationships that implicate the Loan Rule, the auditor has concluded that it is objective and impartial with respect to the issues encompassed within its engagement as auditor of the funds. The circumstances described in the Letter are substantially similar to the circumstances that implicated the Loan Rule with respect to EY/KPMG and the registrant. On September 22, 2017, the SEC extended the expiration of the Letter until the effectiveness of any amendments to the Loan Rule designed to address the concerns in the Letter. On June 18, 2019, the SEC adopted amendments to the Loan Rule, which, refocus the analysis that must be conducted to determine whether an auditor is independent when the auditor has a lending relationship with certain shareholders of an audit client at any time during an audit or professional engagement period.
Additionally, on July 18, 2018, EY informed the registrant that Rule 2-01(c)(1)(i)(A) of Regulation S-X (“Investment Rule”) also has been implicated since July 2, 2018. The Investment Rule prohibits public accounting firms, or covered person professionals and their immediate family members, from having certain direct financial investments in their audit clients and affiliated entities. EY informed the registrant that a pension trust of a non-US affiliated entity of EY had previously made, and as of July 18, 2018 maintained, an investment in a fund (“Hermes Fund”) managed by Hermes Alternative Investment Management Limited (“HAIML”), which is a wholly owned subsidiary of Hermes Fund Managers Limited (“HFML”). The pension trust’s investment in the Hermes Fund involves the Investment Rule because an indirect wholly owned subsidiary of Federated Investors, Inc. (an affiliate of the registrant’s adviser), acquired a 60% majority interest in HFML on July 2, 2018, effective July 1, 2018 (“Hermes Acquisition”). The pension trust first invested in the Hermes Fund in 2007, well prior to the Hermes Acquisition. The pension trust’s investment represented less than 3.3% of the Hermes Fund’s assets as of July 18, 2018. EY subsequently informed the registrant that EY’s affiliated entity’s pension trust had submitted an irrevocable redemption notice to redeem its investment in the Hermes Fund. Pursuant to the redemption terms of the Hermes Fund, the pension trust’s redemption would not be effected until December 26, 2018 at the earliest. The redemption notice could not be revoked by the pension trust. The redemption notice would only be revoked by HAIML, as the adviser for Hermes Fund, if, and to the extent, the pension trust successfully sold its interest in the Hermes Fund in a secondary market transaction. EY also informed the registrant that the pension trust simultaneously submitted a request to HAIML to conduct a secondary market auction for the pension trust’s interests in the Hermes Fund. In addition, the only voting rights shareholders of the Hermes Fund had under the Hermes Fund’s governing documents relate to key appointments, including the election of the non-executive members of the Hermes Fund’s committee, the appointment of the Hermes Fund’s trustee and the adoption of the Hermes Fund’s financial statements. The next meeting of the Hermes Fund at which shareholders can vote on the election of members to the Hermes Fund’s committee is not until June 2019, and the size of the pension trust’s investment in the Hermes Fund would not allow it to unilaterally elect a committee member or the trustee. EY does not audit the Hermes Fund and the Hermes Fund’s assets and operations are not consolidated in the registrant’s financial statements that are subject to audit by EY. Finally, no member of EY’s audit team that provides audit services to the registrant is a beneficiary of EY’s affiliated entity’s pension trust. Management reviewed this matter with the registrant’s Audit Committee, and, based on that review, as well as a letter from EY to the registrant dated July 26, 2018, in which EY indicated that it had determined that this matter does not impair EY’s ability to exercise objective and impartial judgment in connection with the audit of the financial statements for the registrant and the belief that a reasonable investor with knowledge of all relevant facts and circumstances would conclude that EY has been and is capable of exercising objective and impartial judgment on all issues encompassed within EY’s audit, the registrant’s management and Audit Committee made a determination that such matter does not impair EY’s ability to exercise objective and impartial judgment in connection with the audit of the financial statements for the registrant. On August 29, 2018, EY informed the registrant that EY’s affiliated entity’s pension trust sold its entire interest in the Hermes Fund, effective as of August 28, 2018.
If it were to be determined that, with respect to the Loan Rule, the relief available under the Letter was improperly relied upon, or that the independence requirements under the federal securities laws were not complied with regarding the registrant, for certain periods, and/or given the implication of the Investment Rule for certain periods, any of the registrant’s filings with the SEC which contain financial statements of the registrant for such periods may be determined not to be consistent with or comply with applicable federal securities laws, the registrant’s ability to offer shares under its current registration statement may be impacted, andcertain financial reporting and/or other covenants with, and representations and warranties to, the registrant’s lender under its committed line of credit may be impacted. Such eventscould have a material adverse effect on the registrant and the Federated Fund Complex.
| Item 5. | Audit Committee of Listed Registrants |
Not Applicable
| Item 6. | Schedule of Investments |
(a) The registrant’s Schedule of Investments is included as part of the Report to Stockholders filed under Item 1 of this form.
(b) Not Applicable; Fund had no divestments during the reporting period covered since the previous Form N-CSR filing.
| Item 7. | Disclosure of Proxy Voting Policies and Procedures for Closed-End Management Investment Companies |
Not Applicable
| Item 8. | Portfolio Managers of Closed-End Management Investment Companies |
Not Applicable
| Item 9. | Purchases of Equity Securities by Closed-End Management Investment Company and Affiliated Purchasers |
Not Applicable
| Item 10. | Submission of Matters to a Vote of Security Holders |
No Changes to Report
| Item 11. | Controls and Procedures |
(a) The registrant’s President and Treasurer have concluded that the
registrant’s disclosure controls and procedures (as defined in rule 30a-3(c) under the Act) are effective in design and operation and are sufficient to form the basis of the certifications required by Rule 30a-(2) under the Act, based on their evaluation of these disclosure controls and procedures within 90 days of the filing date of this report on Form N-CSR.
(b) There were no changes in the registrant’s internal control over financial reporting (as defined in rule 30a-3(d) under the Act) during the registrant’s most recent fiscal half-year (the registrant’s second fiscal half-year in the case of an annual report) that have materially affected, or are reasonably likely to materially affect, the registrant’s internal control over financial reporting.
| Item 12. | Disclosure of Securities Lending Activities for Closed-End Management Investment Companies |
Not Applicable
(a)(1) Code of Ethics- Not Applicable to this Report.
(a)(2) Certifications of Principal Executive Officer and Principal Financial Officer.
(a)(3) Not Applicable.
(b) Certifications pursuant to 18 U.S.C. Section 1350.
SIGNATURES
Pursuant to the requirements of the Securities Exchange Act of 1934 and the Investment Company Act of 1940, the registrant has duly caused this report to be signed on its behalf by the undersigned, thereunto duly authorized.
RegistrantFederated Equity Funds
By/S/ Lori A. Hensler
Lori A. Hensler, Principal Financial Officer
DateDecember 20, 2019
Pursuant to the requirements of the Securities Exchange Act of 1934 and the Investment Company Act of 1940, this report has been signed below by the following persons on behalf of the registrant and in the capacities and on the dates indicated.
By/S/ J. Christopher Donahue
J. Christopher Donahue, Principal Executive Officer
DateDecember 20, 2019
By/S/ Lori A. Hensler
Lori A. Hensler, Principal Financial Officer
DateDecember 20, 2019