United States
Securities and Exchange Commission
Washington, D.C. 20549
Form N-CSR
Certified Shareholder Report of Registered Management Investment Companies
811-4017
(Investment Company Act File Number)
Federated Hermes Equity Funds
_______________________________________________________________
(Exact Name of Registrant as Specified in Charter)
Federated Hermes Funds
4000 Ericsson Drive
Warrendale, Pennsylvania 15086-7561
(Address of Principal Executive Offices)
(412) 288-1900
(Registrant's Telephone Number)
Peter J. Germain, Esquire
1001 Liberty Avenue
Pittsburgh, Pennsylvania 15222-3779
(Name and Address of Agent for Service)
(Notices should be sent to the Agent for Service)
Date of Fiscal Year End: 10/31/21
Date of Reporting Period: 10/31/21
| Item 1. | Reports to Stockholders |

Share Class | Ticker | A | KAUAX | B | KAUBX | C | KAUCX |
R | KAUFX | Institutional | KAUIX |
Federated Hermes Kaufmann Fund
A Portfolio of Federated Hermes Equity Funds


1 Year | 5 Years | 10 Years | |
Class A Shares | 15.64% | 18.94% | 15.91% |
Class B Shares | 16.23% | 19.50% | 16.09% |
Class C Shares | 20.80% | 19.70% | 16.09% |
Class R Shares | 22.30% | 20.28% | 16.55% |
Institutional Shares4 | 22.96% | 20.87% | 16.83% |
RMCGI | 39.43% | 21.90% | 16.86% |
MMCGFA | 41.84% | 21.26% | 15.74% |
Sector Composition | Percentage of Total Net Assets |
Health Care | 34.1% |
Information Technology | 21.2% |
Industrials | 10.1% |
Consumer Discretionary | 9.5% |
Financials | 8.9% |
Materials | 4.7% |
Real Estate | 2.3% |
Energy | 1.5% |
Communication Services | 1.5% |
Consumer Staples | 1.4% |
Utilities | 0.3% |
Securities Lending Collateral2 | 2.7% |
Cash Equivalents3 | 5.2% |
Other Assets and Liabilities—Net4 | (3.4)% |
TOTAL | 100% |
1 | Except for Securities Lending Collateral, Cash Equivalents and Other Assets and Liabilities, sector classifications are based upon, and individual portfolio securities are assigned to, the classifications of the Global Industry Classification System (GICS), except that the Adviser assigns a classification to securities not classified by the GICS and to securities for which the Adviser does not have access to the classification made by the GICS. |
2 | Represents cash collateral received for portfolio securities on loan that may be invested in affiliated money market funds, other money market instruments and/or repurchase agreements. |
3 | Cash Equivalents include any investments in money market mutual funds and/or overnight repurchase agreements other than those representing cash collateral for securities lending. |
4 | Assets, other than investments in securities, less liabilities. See Statement of Assets and Liabilities. |
Shares | Value | ||
COMMON STOCKS— 95.3% | |||
1 | Communication Services— 1.5% | ||
729,820 | Playtika Holding Corp. | $20,639,310 | |
122,500 | Take-Two Interactive Software, Inc. | 22,172,500 | |
1,260,000 | ZoomInfo Technologies, Inc. | 84,697,200 | |
TOTAL | 127,509,010 | ||
Consumer Discretionary— 9.5% | |||
280,000 | 1 | Airbnb, Inc. | 47,784,800 |
130,000 | 1 | Alibaba Group Holding Ltd., ADR | 21,442,200 |
20,000 | 1 | Amazon.com, Inc. | 67,448,600 |
200,000 | 1 | Chegg, Inc. | 11,888,000 |
15,850 | 1 | Chipotle Mexican Grill, Inc. | 28,197,626 |
150,000 | Choice Hotels International, Inc. | 21,093,000 | |
400,000 | 1,2 | DraftKings, Inc. | 18,636,000 |
300,000 | 1 | Etsy, Inc. | 75,207,000 |
592,000 | 1,2 | First Watch Restaurant Group, Inc. | 12,775,360 |
974,000 | 1,3 | Fisker, Inc. | 15,632,700 |
700,000 | 1 | Floor & Decor Holdings, Inc. | 95,144,000 |
50,000 | Home Depot, Inc. | 18,587,000 | |
300,000 | 1 | Las Vegas Sands Corp. | 11,643,000 |
128,503 | 1 | Lululemon Athletica, Inc. | 59,883,683 |
35,000 | 1 | Mercadolibre, Inc. | 51,835,700 |
500,000 | Moncler S.p.A | 35,982,480 | |
24,740,000 | NagaCorp Ltd. | 22,698,681 | |
300,000 | 1 | Planet Fitness, Inc. | 23,865,000 |
369,790 | 1 | Solo Brands, Inc. | 6,789,344 |
750,000 | 1 | Sportradar Group AG | 15,675,000 |
30,000 | Vail Resorts, Inc. | 10,341,300 | |
570,000 | Wingstop, Inc. | 98,307,900 | |
455,000 | 1 | YETI Holdings, Inc. | 44,740,150 |
TOTAL | 815,598,524 | ||
Consumer Staples— 1.4% | |||
19,600 | Costco Wholesale Corp. | 9,634,184 | |
83,500 | Estee Lauder Cos., Inc., Class A | 27,081,555 | |
150,000 | 1 | Freshpet, Inc. | 23,386,500 |
3,000,000 | 1,2 | Oatly Group AB, ADR | 38,670,000 |
945,000 | 1 | The Duckhorn Portfolio, Inc. | 18,276,300 |
630,000 | 1 | Zevia PBC | 7,049,700 |
TOTAL | 124,098,239 | ||
Energy— 1.5% | |||
245,000 | Cheniere Energy, Inc. | 25,333,000 | |
2,343,000 | 2 | New Fortress Energy, Inc. | 70,290,000 |
Shares | Value | ||
COMMON STOCKS— continued | |||
Energy— continued | |||
174,500 | Pioneer Natural Resources, Inc. | $32,628,010 | |
TOTAL | 128,251,010 | ||
Financials— 8.9% | |||
700,000 | Apollo Global Management LLC | 53,865,000 | |
591,906 | Artisan Partners Asset Management, Inc. | 29,323,023 | |
85,350 | BlackRock, Inc. | 80,524,311 | |
275,000 | 2,3 | Blue Owl Capital, Inc. | 4,741,000 |
9,725,000 | 1 | Blue Owl Capital, Inc. | 167,659,000 |
50,000 | 1,2 | Coinbase Global, Inc. | 15,971,000 |
1 | 1,3,4 | FA Private Equity Fund IV LP | 302,782 |
4,650,000 | FinecoBank Banca Fineco SPA | 88,903,355 | |
26,900 | Goldman Sachs Group, Inc. | 11,119,115 | |
500,000 | 1 | Hamilton Lane Alliance Holdings I, Inc. | 4,895,000 |
745,000 | Hamilton Lane, Inc. | 77,859,950 | |
1,200,000 | KKR & Co., Inc., Class Common | 95,604,000 | |
11,300 | 1 | Markel Corp. | 14,838,369 |
80,000 | MSCI, Inc., Class A | 53,190,400 | |
1,416,598 | StepStone Group, Inc. | 66,551,774 | |
TOTAL | 765,348,079 | ||
Health Care— 33.9% | |||
200,000 | Abbott Laboratories | 25,778,000 | |
540,300 | 1,2,3,4 | Adagio Therapeutics, Inc. | 15,798,372 |
622,500 | 1 | Adagio Therapeutics, Inc. | 15,543,343 |
132,863 | 1 | agilon health, Inc. | 3,255,144 |
1,167,762 | 1,2 | Akouos, Inc. | 10,883,542 |
1,324,024 | 1 | Albireo Pharma, Inc. | 38,687,981 |
2,500,000 | 1 | Alector, Inc. | 54,350,000 |
380,500 | 1 | Alnylam Pharmaceuticals, Inc. | 60,712,580 |
1,266,686 | 1 | Amphastar Pharmaceuticals, Inc. | 23,661,694 |
583,075 | 1 | AnaptysBio, Inc. | 19,183,168 |
1,000,000 | 1 | Annexon, Inc. | 16,310,000 |
1 | 3,4 | Apollo Investment Fund V | 85,701 |
1,378,400 | 1,2 | Arcturus Therapeutics Holdings, Inc. | 61,959,080 |
844,286 | 1 | Argenx SE | 254,376,956 |
2,265,000 | 1,2 | aTyr Pharma, Inc. | 19,456,350 |
1,125,000 | 1,2 | Avidity Biosciences LLC | 25,312,500 |
972,468 | 1 | Avrobio, Inc. | 5,465,270 |
2,631,567 | 1 | Calithera Biosciences, Inc. | 5,078,924 |
870,000 | 1 | Catalent, Inc. | 119,938,200 |
250,000 | 1,2 | Century Therapeutics, Inc. | 5,617,500 |
267,745 | 1,4 | Century Therapeutics, Inc. | 5,407,959 |
38,079,337 | 1,4 | CeQur SA | 10,621,415 |
314,099 | 1 | Cerevel Therapeutics Holdings | 12,768,124 |
861,000 | 1,2 | ContraFect Corp. | 3,245,970 |
Shares | Value | ||
COMMON STOCKS— continued | |||
Health Care— continued | |||
3,750,000 | 1 | Corcept Therapeutics, Inc. | $67,500,000 |
232,000 | 1,2 | CRISPR Therapeutics AG | 21,188,560 |
490,000 | Danaher Corp. | 152,767,300 | |
135,186 | 1 | Definitive Healthcare Corp. | 5,426,366 |
296,000 | 1 | Dexcom, Inc. | 184,470,160 |
7,507,400 | 1,2 | Dynavax Technologies Corp. | 149,922,778 |
267,000 | 1 | Edwards Lifesciences Corp. | 31,991,940 |
121,800 | 1 | Fate Therapeutics, Inc. | 6,552,840 |
1,000,000 | 1,2 | Frequency Therapeutics, Inc. | 6,280,000 |
205,800 | 1 | Frequency Therapeutics, Inc. | 1,292,424 |
4,246,031 | 1,2 | Gamida Cell Ltd. | 16,941,664 |
140,000 | 1 | Genmab A/S | 63,025,022 |
576,734 | 1 | Genmab A/S, ADR | 25,745,406 |
450,000 | 1,2 | Gossamer Bio, Inc. | 5,589,000 |
679,512 | 1,2 | Gracell Biotechnologies, Inc., ADR | 7,270,778 |
320,970 | 1,2 | Graphite Bio, Inc. | 4,089,158 |
880,800 | 1 | IDEAYA Biosciences, Inc. | 18,884,352 |
59,300 | 1 | IDEXX Laboratories, Inc. | 39,502,102 |
340,600 | 1,2 | Immatics N.V. | 4,880,798 |
400,000 | 1,3 | Immatics N.V. - Restricted | 5,732,000 |
255,000 | 1 | Insulet Corp. | 79,055,100 |
182,976 | 1 | Intellia Therapeutics, Inc. | 24,332,148 |
74,700 | 1 | Intuitive Surgical, Inc. | 26,976,411 |
668,100 | 1 | Jasper Therapeutics, Inc. | 6,099,753 |
591,140 | 1,2 | Kaleido Biosciences, Inc. | 2,541,902 |
430,100 | 1 | Karuna Therapeutics, Inc. | 60,377,438 |
164,133 | 1,4 | Laronde, Inc. | 4,595,724 |
1 | 1,3,4 | Latin Healthcare Fund | 287,839 |
792,067 | 1,2 | Legend Biotech Corp., ADR | 41,583,518 |
200,000 | 1,2 | Lyell Immunopharma, Inc. | 2,788,000 |
1,500,000 | 1,2 | Merus NV | 42,075,000 |
5,200,000 | 1 | Minerva Neurosciences, Inc. | 7,280,000 |
196,200 | 1 | Moderna, Inc. | 67,730,202 |
781,736 | 1,2 | Molecular Partners AG | 14,685,827 |
106,943 | 1 | Molecular Partners AG, ADR | 1,982,723 |
50,000 | 1 | Morphic Holding, Inc. | 2,875,000 |
75,000 | 1 | Natera, Inc. | 8,592,750 |
605,460 | 1 | NeoGenomics, Inc. | 27,851,160 |
530,000 | 1 | Orchard Therapeutics PLC | 1,017,600 |
6,930,000 | 1,2 | Orchard Therapeutics PLC, ADR | 13,305,600 |
2,100,000 | 1 | Otonomy, Inc. | 4,410,000 |
258,387 | 1 | Privia Health Group, Inc. | 6,640,546 |
200,000 | 1 | Repligen Corp. | 58,100,000 |
1,525,000 | 1 | Rezolute, Inc. | 9,760,000 |
Shares | Value | ||
COMMON STOCKS— continued | |||
Health Care— continued | |||
413,600 | 1 | Rhythm Pharmaceuticals, Inc. | $4,760,536 |
330,000 | 1 | Rubius Therapeutics, Inc. | 4,689,300 |
300,000 | 1 | Sarepta Therapeutics, Inc. | 23,739,000 |
519,749 | 1,2 | Scynexis, Inc. | 2,603,942 |
6,000,000 | 1 | Seres Therapeutics, Inc. | 36,480,000 |
959,018 | 1,4 | Soteira, Inc. | 0 |
319,000 | 1 | Stoke Therapeutics, Inc. | 7,282,770 |
115,000 | Stryker Corp. | 30,598,050 | |
361,975 | 1 | Surgery Partners, Inc. | 14,891,652 |
1,972,500 | 1 | Talkspace, Inc. | 6,785,400 |
673,200 | 1 | Tandem Diabetes Care, Inc. | 91,777,356 |
700,000 | 1 | Turning Point Therapeutics, Inc. | 29,106,000 |
1,680,000 | 1 | Ultragenyx Pharmaceutical, Inc. | 140,985,600 |
1,162,062 | 1 | UniQure N.V. | 35,408,029 |
600,000 | 1 | Veeva Systems, Inc. | 190,206,000 |
167,833 | 1,2 | Verve Therapeutics, Inc. | 7,785,773 |
840,000 | 1 | Zai Lab Ltd., ADR | 87,696,000 |
568,932 | 1 | Zentalis Pharmaceuticals, LLC | 45,764,890 |
TOTAL | 2,908,054,960 | ||
Industrials— 10.1% | |||
1,746,461 | 1 | Azek Co., Inc. | 64,077,654 |
550,000 | 1,2 | Azul S.A., ADR | 7,276,500 |
1,310,000 | 1 | CoStar Group, Inc. | 112,725,500 |
779,742 | 1 | Fluence Energy, Inc. | 27,735,423 |
235,000 | 1 | Generac Holdings, Inc. | 117,161,600 |
980,000 | 1 | GXO Logistics, Inc. | 87,024,000 |
375,000 | HEICO Corp. | 52,271,250 | |
400,000 | IHS Markit Ltd. | 52,288,000 | |
550,000 | Ingersoll-Rand, Inc. | 29,568,000 | |
590,000 | 1 | Mercury Systems, Inc. | 30,408,600 |
62,300 | Roper Technologies, Inc. | 30,394,301 | |
473,300 | Trane Technologies PLC | 85,634,169 | |
874,200 | 1 | Trex Co., Inc. | 93,014,880 |
600,000 | 1 | Upwork, Inc. | 28,272,000 |
600,000 | 1 | XPO Logistics, Inc. | 51,480,000 |
TOTAL | 869,331,877 | ||
Information Technology— 21.2% | |||
37,600 | 1 | Adobe, Inc. | 24,453,536 |
1,165,000 | 1 | Advanced Micro Devices, Inc. | 140,067,950 |
200,000 | 1 | Anaplan, Inc. | 13,042,000 |
238,000 | 1 | Ansys, Inc. | 90,340,040 |
117,600 | 1 | Avalara, Inc. | 21,125,664 |
300,000 | 1 | Coupa Software, Inc. | 68,310,000 |
235,655 | 1,2 | CS Disco, Inc. | 13,514,814 |
Shares | Value | ||
COMMON STOCKS— continued | |||
Information Technology— continued | |||
100,000 | 1 | DocuSign, Inc. | $27,829,000 |
300,000 | 1 | Domo, Inc. | 26,505,000 |
660,300 | 1 | Envestnet, Inc. | 55,135,050 |
200,000 | 1 | Everbridge, Inc. | 31,862,000 |
1,059,322 | 1,3,4 | Expand Networks Ltd. | 0 |
1,400,000 | 1 | GDS Holdings Ltd., ADR | 83,160,000 |
200,000 | 1 | GoDaddy, Inc. | 13,834,000 |
1,945,000 | 1 | Ironsource, LTD | 22,153,550 |
1,260,000 | Marvell Technology, Inc. | 86,310,000 | |
1,500,000 | McAfee Corp. | 32,055,000 | |
1,725,000 | 1 | Nexi SpA | 30,017,435 |
1,765,000 | 1,2 | PagSeguro Digital Ltd. | 63,893,000 |
475,000 | 1 | Q2 Holdings, Inc. | 37,268,500 |
1,000,000 | 1,2 | Qualtrics International, Inc. | 46,320,000 |
451,163 | 1,2 | Radware Ltd. | 15,984,705 |
560,000 | 1,2 | Rapid7, Inc. | 72,100,000 |
100,000 | 1 | Salesforce.com, Inc. | 29,969,000 |
3,751 | 1,3,4 | Sensable Technologies, Inc. | 0 |
225,000 | 1 | ServiceNow, Inc. | 156,996,000 |
180,000 | 1 | Shopify, Inc. | 264,011,400 |
215,500 | 1 | Smartsheet, Inc. | 14,871,655 |
375,000 | 1 | Splunk, Inc. | 61,807,500 |
175,500 | 1 | Tyler Technologies, Inc. | 95,335,110 |
242,000 | 1 | Unity Software, Inc. | 36,617,020 |
275,000 | 1 | Varonis Systems, Inc. | 17,803,500 |
1,877,500 | 1 | WM Technology, Inc. | 22,980,600 |
360,000 | 1 | Workday, Inc. | 104,392,800 |
TOTAL | 1,820,065,829 | ||
Materials— 4.7% | |||
1,500,000 | 3 | Agnico Eagle Mines Ltd. | 79,575,000 |
2,800,000 | Barrick Gold Corp. | 51,436,000 | |
315,300 | Eagle Materials, Inc. | 46,777,908 | |
1,425,000 | Newmont Corp. | 76,950,000 | |
192,200 | Scotts Miracle-Gro Co. | 28,534,012 | |
387,861 | Sherwin-Williams Co. | 122,800,671 | |
TOTAL | 406,073,591 | ||
Real Estate— 2.3% | |||
518,597 | Americold Realty Trust | 15,283,054 | |
25,000 | Avalonbay Communities, Inc. | 5,917,000 | |
180,000 | Crown Castle International Corp. | 32,454,000 | |
800,000 | MGM Growth Properties LLC | 31,504,000 | |
200,000 | ProLogis, Inc. | 28,992,000 | |
270,000 | 1 | Ryman Hospitality Properties | 23,095,800 |
550,000 | STAG Industrial, Inc. | 23,941,500 |
Shares | Value | ||
COMMON STOCKS— continued | |||
Real Estate— continued | |||
170,000 | Sun Communities, Inc. | $33,316,600 | |
TOTAL | 194,503,954 | ||
Utilities— 0.3% | |||
250,000 | NextEra Energy, Inc. | 21,332,500 | |
TOTAL COMMON STOCKS (IDENTIFIED COST $4,043,813,128) | 8,180,167,573 | ||
PREFERRED STOCK— 0.0% | |||
Information Technology— 0.0% | |||
679,348 | 1,3,4 | Multiplex, Inc., Pfd., Series C (IDENTIFIED COST $5,000,001) | 0 |
1 | WARRANTS— 0.2% | ||
Financials— 0.0% | |||
333,333 | Hamilton Lane Alliance Holdings I, Inc., Warrants 1/8/2026 | 243,333 | |
Health Care— 0.2% | |||
801,900 | Catabasis Pharmaceuticals, Inc., Warrants 6/22/2022 | 150,677 | |
421,550 | Catabasis Pharmaceuticals, Inc., Warrants 2/8/2024 | 189,487 | |
3,445,000 | ContraFect Corp., Warrants 7/20/2022 | 689 | |
377,500 | Dynavax Technologies Corp., Warrants 2/12/2022 | 5,847,135 | |
170,300 | Immatics N.V., Warrants 12/31/2025 | 783,380 | |
200,970 | Rezolute, Inc., Warrants 10/9/2027 | 1,113,394 | |
56,800 | Rezolute, Inc., Warrants 1/1/2099 | 363,520 | |
853,000 | Scynexis, Inc., Warrants 12/21/2021 | 6,312 | |
101,700 | Scynexis, Inc., Warrants 3/8/2023 | 15,265 | |
853,000 | Scynexis, Inc., Warrants 5/21/2024 | 1,270,970 | |
1,706,000 | Scynexis, Inc., Warrants 1/1/2099 | 8,547,060 | |
TOTAL | 18,287,889 | ||
TOTAL WARRANTS (IDENTIFIED COST $11,811,233) | 18,531,222 | ||
INVESTMENT COMPANIES— 7.9% | |||
66,719,105 | Federated Hermes Government Obligations Fund, Premier Shares, 0.03%5 | 66,719,105 | |
608,032,749 | Federated Hermes Institutional Prime Value Obligations Fund, Institutional Shares, 0.02%5 | 608,215,159 | |
TOTAL INVESTMENT COMPANIES (IDENTIFIED COST $674,894,796) | 674,934,264 | ||
TOTAL INVESTMENT IN SECURITIES—103.4% (IDENTIFIED COST $4,735,519,158)6 | 8,873,633,059 | ||
OTHER ASSETS AND LIABILITIES - NET—(3.4)%7 | (288,251,545) | ||
TOTAL NET ASSETS—100% | $8,585,381,514 |
Value as of 10/31/2020 | Purchases at Cost* | Proceeds from Sales* | |
Financials: | |||
StepStone Group, Inc. | $— | $41,789,641 | $— |
Health Care: | |||
Akouos, Inc. | $21,966,938 | $758,958 | $(194,192) |
Albireo Pharma, Inc. | $44,395,452 | $— | $(3,107,472) |
Alector, Inc. | $14,115,000 | $17,066,722 | $(1,973,856) |
Amphastar Pharmaceuticals, Inc. | $24,814,379 | $— | $— |
AnaptysBio, Inc. | $— | $16,004,099 | $— |
Annexon, Inc. | $9,406,120 | $15,545,934 | $— |
Arcturus Therapeutics Holdings, Inc. | $29,744,000 | $86,964,227 | $(29,270,715) |
aTyr Pharma, Inc. | $— | $18,094,695 | $— |
Avidity Biosciences LLC | $16,804,035 | $9,546,814 | $— |
Avrobio, Inc. | $5,487,804 | $10,458,701 | $(4,308,520) |
Calithera Biosciences, Inc. | $11,982,900 | $— | $(2,388,368) |
ContraFect Corp. | $— | $4,305,000 | $— |
ContraFect Corp., Warrants 7/20/2022 | $274,567 | $— | $— |
Dynavax Technologies Corp. | $22,193,500 | $14,013,300 | $— |
Dynavax Technologies Corp., Warrants 2/12/2022 | $699,017 | $— | $— |
Frequency Therapeutics, Inc. | $16,847,600 | $8,523,592 | $(14,742,772) |
Frequency Therapeutics, Inc. | $4,502,904 | $— | $— |
Gamida Cell Ltd. | $15,120,381 | $15,250,130 | $(5,322,742) |
IDEAYA Biosciences, Inc. | $4,872,868 | $8,141,685 | $— |
Merus NV | $16,545,288 | $7,123,380 | $(2,627,211) |
Minerva Neurosciences, Inc. | $16,692,000 | $— | $— |
Molecular Partners AG | $17,105,796 | $— | $— |
Molecular Partners AG, ADR | $— | $2,272,539 | $— |
Orchard Therapeutics PLC, ADR | $— | $17,495,185 | $— |
Otonomy, Inc. | $7,518,000 | $5,005,022 | $(1,556,992) |
Rezolute, Inc. | $12,003,840 | $5,948,870 | $— |
Rezolute, Inc., Warrants 10/9/2027 | $3,621,289 | $— | $— |
Rezolute, Inc., Warrants 1/1/2099 | $— | $368,632 | $— |
Rhythm Pharmaceuticals, Inc. | $21,457,912 | $6,576,001 | $(9,412,180) |
Scynexis, Inc. | $2,271,303 | $— | $— |
Scynexis, Inc., Warrants 12/21/2021 | $— | $— | $— |
Scynexis, Inc., Warrants 3/8/2023 | $35,290 | $— | $— |
Scynexis, Inc., Warrants 5/21/2024 | $— | $— | $— |
Scynexis, Inc., Warrants 1/1/2099 | $— | $10,660,794 | $— |
Seres Therapeutics, Inc. | $58,847,900 | $36,355,863 | $(9,403,249) |
Soteira, Inc. | $— | $— | $— |
Talkspace, Inc. | $— | $19,725,000 | $— |
Ultragenyx Pharmaceutical, Inc. | $196,527,750 | $— | $(38,197,693) |
UniQure N.V. | $75,604,100 | $9,087,319 | $(30,364,120) |
Information Technology: | |||
Domo, Inc. | $— | $26,388,052 | $— |
WM Technology, Inc. | $— | $18,775,000 | $— |
Affiliated Issuers no longer in the portfolio at period end | $15,715,275 | $24,042,456 | $(110,042,216) |
TOTAL OF AFFILIATED COMPANIES TRANSACTIONS | $687,173,208 | $456,287,611 | $(262,912,298) |
Change in Unrealized Appreciation/ Depreciation* | Net Realized Gain/ (Loss)* | Value as of 10/31/2021 | Shares Held as of 10/31/2021 | Dividend Income* |
$24,762,133 | $— | $66,551,774 | 1,416,598 | $198,324 |
$(11,386,854) | $(261,308) | $10,883,542 | 1,167,762 | $— |
$(2,400,430) | $(199,569) | $38,687,981 | 1,324,024 | $— |
$24,329,099 | $813,035 | $54,350,000 | 2,500,000 | $— |
$(1,152,685) | $— | $23,661,694 | 1,266,686 | $— |
$3,179,069 | $— | $19,183,168 | 583,075 | $— |
$(8,642,054) | $— | $16,310,000 | 1,000,000 | $— |
$(3,910,510) | $(21,567,922) | $61,959,080 | 1,378,400 | $— |
$1,361,655 | $— | $19,456,350 | 2,265,000 | $— |
$(1,038,349) | $— | $25,312,500 | 1,125,000 | $— |
$(3,330,841) | $(2,841,874) | $5,465,270 | 972,468 | $— |
$(902,950) | $(3,612,658) | $5,078,924 | 2,631,567 | $— |
$(1,059,030) | $— | $3,245,970 | 861,000 | $— |
$(273,878) | $— | $689 | 3,445,000 | $— |
$113,715,978 | $— | $149,922,778 | 7,507,400 | $— |
$5,148,118 | $— | $5,847,135 | 377,500 | $— |
$(8,611,562) | $4,263,142 | $6,280,000 | 1,000,000 | $— |
$(3,210,480) | $— | $1,292,424 | 205,800 | $— |
$(7,282,785) | $(823,320) | $16,941,664 | 4,246,031 | $— |
$5,869,799 | $— | $18,884,352 | 880,800 | $— |
$20,337,626 | $695,917 | $42,075,000 | 1,500,000 | $— |
$(9,412,000) | $— | $7,280,000 | 5,200,000 | $— |
$(2,419,969) | $— | $14,685,827 | 781,736 | $— |
$(289,816) | $— | $1,982,723 | 106,943 | $— |
$(4,189,585) | $— | $13,305,600 | 6,930,000 | $— |
$(3,108,000) | $(3,448,030) | $4,410,000 | 2,100,000 | $— |
$(8,192,710) | $— | $9,760,000 | 1,525,000 | $— |
$(2,507,895) | $— | $1,113,394 | 200,970 | $— |
$(5,112) | $— | $363,520 | 56,800 | $— |
$1,541,853 | $(15,403,050) | $4,760,536 | 413,600 | $— |
$332,639 | $— | $2,603,942 | 519,749 | $— |
$6,312 | $— | $6,312 | 853,000 | $— |
$(20,025) | $— | $15,265 | 101,700 | $— |
$1,270,970 | $— | $1,270,970 | 853,000 | $— |
$(2,113,734) | $— | $8,547,060 | 1,706,000 | $— |
$(32,178,042) | $(17,142,472) | $36,480,000 | 6,000,000 | $— |
$— | $— | $— | 959,018 | $— |
$(12,939,600) | $— | $6,785,400 | 1,972,500 | $— |
$(37,749,450) | $20,404,993 | $140,985,600 | 1,680,000 | $— |
$(4,721,919) | $(14,197,351) | $35,408,029 | 1,162,062 | $— |
$116,948 | $— | $26,505,000 | 300,000 | $— |
$4,205,600 | $— | $22,980,600 | 1,877,500 | $— |
$3,077,808 | $67,206,677 | $— | — | $— |
$36,205,342 | $13,886,210 | $930,640,073 | 72,953,689 | $198,324 |
* | A portion of the amount shown was recorded when the Fund no longer had ownership of at least 5% of the voting shares. |
Federated Hermes Government Obligations Fund, Premier Shares* | Federated Hermes Institutional Prime Value Obligations Fund, Institutional Shares* | Total of Affiliated Transactions | |
Value as of 10/31/2020 | $90,016,791 | $1,784,982,948 | $1,874,999,739 |
Purchases at Cost | $1,210,603,038 | $2,762,418,275 | $3,973,021,313 |
Proceeds from Sales | $(1,233,900,724) | $(3,939,003,211) | $(5,172,903,935) |
Change in Unrealized Appreciation/ Depreciation | N/A | $(600,865) | $(600,865) |
Net Realized Gain/(Loss) | N/A | $418,012 | $418,012 |
Value as of 10/31/2021 | $66,719,105 | $608,215,159 | $674,934,264 |
Shares Held as of 10/31/2021 | 66,719,105 | 608,032,749 | 674,751,854 |
Dividend Income | $13,834 | $682,378 | $696,212 |
* | All or a portion of the balance/activity for the fund relates to cash collateral received on securities lending transactions. |
1 | Non-income-producing security. |
2 | All or a portion of these securities are temporarily on loan to unaffiliated broker/dealers. |
3 | Denotes a restricted security that either: (a) cannot be offered for public sale without first being registered, or availing of an exemption from registration, under the Securities Act of 1933; or (b) is subject to a contractual restriction on public sales. At October 31, 2021, these restricted securities amounted to $122,155,394, which represented 1.4% of total net assets. |
4 | Market quotations and price evaluations are not available. Fair value determined using significant unobservable inputs in accordance with procedures established by and under the general supervision of the Fund’s Board of Trustees (the “Trustees”). |
5 | 7-day net yield. |
6 | The cost of investments for federal tax purposes amounts to $4,767,006,324. |
7 | Assets, other than investments in securities, less liabilities. See Statement of Assets and Liabilities. |
The following is a summary of the inputs used, as of October 31, 2021, in valuing the Fund’s assets carried at fair value:
Valuation Inputs | ||||
Level 1— Quoted Prices | Level 2— Other Significant Observable Inputs | Level 3— Significant Unobservable Inputs | Total | |
Equity Securities: | ||||
Common Stocks | ||||
Domestic | $6,556,509,004* | $— | $26,223,348 | $6,582,732,352 |
International | 1,077,124,050 | 509,689,756 | 10,621,415 | 1,597,435,221 |
Preferred Stock | ||||
Domestic | — | — | 0 | 0 |
Debt Securities: | ||||
Warrants | 1,390,233 | 17,140,989** | — | 18,531,222 |
Investment Companies | 674,934,264 | — | — | 674,934,264 |
TOTAL SECURITIES | $8,309,957,551 | $526,830,745 | $36,844,763 | $8,873,633,059 |
* | Includes $19,921,458 transferred from Level 3 to Level 1 because fair values were determined using valuation techniques utilizing a quotable price in an active market. This transfer represents the value of the security at the beginning of the period. |
** | Includes $3,621,289 transferred from Level 3 to Level 2 because fair values were determined using valuation techniques utilizing observable market data. This transfer represents the value of the security at the beginning of the period. |
The following acronym(s) are used throughout this portfolio: | ||
ADR | —American Depositary Receipt | |
Year Ended October 31, | |||||
2021 | 2020 | 2019 | 2018 | 2017 | |
Net Asset Value, Beginning of Period | $6.80 | $6.27 | $6.03 | $6.06 | $5.27 |
Income From Investment Operations: | |||||
Net investment income (loss)1 | (0.10) | (0.09) | (0.05) | (0.06) | (0.06) |
Net realized and unrealized gain (loss) | 1.57 | 1.32 | 1.09 | 0.69 | 1.37 |
Total From Investment Operations | 1.47 | 1.23 | 1.04 | 0.63 | 1.31 |
Less Distributions: | |||||
Distributions from net realized gain | (0.50) | (0.70) | (0.80) | (0.66) | (0.52) |
Net Asset Value, End of Period | $7.77 | $6.80 | $6.27 | $6.03 | $6.06 |
Total Return2 | 22.37% | 21.52% | 19.52% | 11.64% | 26.97% |
Ratios to Average Net Assets: | |||||
Net expenses3 | 1.92% | 1.94% | 1.95% | 1.95% | 1.95%4 |
Net investment income (loss) | (1.41)% | (1.38)% | (0.81)% | (1.02)% | (1.13)% |
Expense waiver/reimbursement5 | 0.04% | 0.03% | 0.03% | 0.03% | 0.04% |
Supplemental Data: | |||||
Net assets, end of period (000 omitted) | $2,023,577 | $1,808,715 | $1,629,524 | $1,491,496 | $1,324,155 |
Portfolio turnover6 | 34% | 38% | 42% | 33% | 47% |
1 | Per share numbers have been calculated using the average shares method. |
2 | Based on net asset value, which does not reflect the sales charge, redemption fee or contingent deferred sales charge, if applicable. |
3 | Amount does not reflect net expenses incurred by investment companies in which the Fund may invest. |
4 | The net expense ratio is calculated without reduction for fees paid indirectly for expense offset arrangements. The net expense ratio is 1.95% for the year ended October 31, 2017, after taking into account these expense reductions. |
5 | This expense decrease is reflected in both the net expense and the net investment income (loss) ratios shown above. Amount does not reflect expense waiver/reimbursement recorded by investment companies in which the Fund may invest. |
6 | Securities that mature are considered sales for purposes of this calculation. |
Year Ended October 31, | |||||
2021 | 2020 | 2019 | 2018 | 2017 | |
Net Asset Value, Beginning of Period | $5.24 | $5.00 | $4.99 | $5.15 | $4.58 |
Income From Investment Operations: | |||||
Net investment income (loss)1 | (0.11) | (0.09) | (0.06) | (0.08) | (0.08) |
Net realized and unrealized gain (loss) | 1.20 | 1.03 | 0.87 | 0.58 | 1.17 |
Total From Investment Operations | 1.09 | 0.94 | 0.81 | 0.50 | 1.09 |
Less Distributions: | |||||
Distributions from net realized gain | (0.50) | (0.70) | (0.80) | (0.66) | (0.52) |
Net Asset Value, End of Period | $5.83 | $5.24 | $5.00 | $4.99 | $5.15 |
Total Return2 | 21.73% | 21.10% | 18.88% | 11.11% | 26.16% |
Ratios to Average Net Assets: | |||||
Net expenses3 | 2.42% | 2.44% | 2.45% | 2.46% | 2.47%4 |
Net investment income (loss) | (1.92)% | (1.87)% | (1.32)% | (1.54)% | (1.65)% |
Expense waiver/reimbursement5 | 0.04% | 0.03% | 0.03% | 0.03% | 0.03% |
Supplemental Data: | |||||
Net assets, end of period (000 omitted) | $31,147 | $35,306 | $41,483 | $50,468 | $65,410 |
Portfolio turnover6 | 34% | 38% | 42% | 33% | 47% |
1 | Per share numbers have been calculated using the average shares method. |
2 | Based on net asset value, which does not reflect the sales charge, redemption fee or contingent deferred sales charge, if applicable. |
3 | Amount does not reflect net expenses incurred by investment companies in which the Fund may invest. |
4 | The net expense ratio is calculated without reduction for fees paid indirectly for expense offset arrangements. The net expense ratio is 2.47% for the year ended October 31, 2017, after taking into account these expense reductions. |
5 | This expense decrease is reflected in both the net expense and the net investment income (loss) ratios shown above. Amount does not reflect expense waiver/reimbursement recorded by investment companies in which the Fund may invest. |
6 | Securities that mature are considered sales for purposes of this calculation. |
Year Ended October 31, | |||||
2021 | 2020 | 2019 | 2018 | 2017 | |
Net Asset Value, Beginning of Period | $5.22 | $4.99 | $4.99 | $5.14 | $4.57 |
Income From Investment Operations: | |||||
Net investment income (loss)1 | (0.11) | (0.09) | (0.06) | (0.08) | (0.08) |
Net realized and unrealized gain (loss) | 1.20 | 1.02 | 0.86 | 0.59 | 1.17 |
Total From Investment Operations | 1.09 | 0.93 | 0.80 | 0.51 | 1.09 |
Less Distributions: | |||||
Distributions from net realized gain | (0.50) | (0.70) | (0.80) | (0.66) | (0.52) |
Net Asset Value, End of Period | $5.81 | $5.22 | $4.99 | $4.99 | $5.14 |
Total Return2 | 21.80% | 20.96% | 18.69% | 11.36% | 26.22% |
Ratios to Average Net Assets: | |||||
Net expenses3 | 2.42% | 2.44% | 2.45% | 2.46% | 2.47%4 |
Net investment income (loss) | (1.92)% | (1.87)% | (1.31)% | (1.56)% | (1.65)% |
Expense waiver/reimbursement5 | 0.04% | 0.03% | 0.03% | 0.03% | 0.03% |
Supplemental Data: | |||||
Net assets, end of period (000 omitted) | $139,690 | $141,074 | $135,883 | $144,284 | $306,011 |
Portfolio turnover6 | 34% | 38% | 42% | 33% | 47% |
1 | Per share numbers have been calculated using the average shares method. |
2 | Based on net asset value, which does not reflect the sales charge, redemption fee or contingent deferred sales charge, if applicable. |
3 | Amount does not reflect net expenses incurred by investment companies in which the Fund may invest. |
4 | The net expense ratio is calculated without reduction for fees paid indirectly for expense offset arrangements. The net expense ratio is 2.47% for the year ended October 31, 2017, after taking into account these expense reductions. |
5 | This expense decrease is reflected in both the net expense and the net investment income (loss) ratios shown above. Amount does not reflect expense waiver/reimbursement recorded by investment companies in which the Fund may invest. |
6 | Securities that mature are considered sales for purposes of this calculation. |
Year Ended October 31, | |||||
2021 | 2020 | 2019 | 2018 | 2017 | |
Net Asset Value, Beginning of Period | $6.82 | $6.28 | $6.04 | $6.07 | $5.28 |
Income From Investment Operations: | |||||
Net investment income (loss)1 | (0.11) | (0.09) | (0.05) | (0.06) | (0.06) |
Net realized and unrealized gain (loss) | 1.58 | 1.33 | 1.09 | 0.69 | 1.37 |
Total From Investment Operations | 1.47 | 1.24 | 1.04 | 0.63 | 1.31 |
Less Distributions: | |||||
Distributions from net realized gain | (0.50) | (0.70) | (0.80) | (0.66) | (0.52) |
Net Asset Value, End of Period | $7.79 | $6.82 | $6.28 | $6.04 | $6.07 |
Total Return2 | 22.30% | 21.64% | 19.48% | 11.62% | 26.92% |
Ratios to Average Net Assets: | |||||
Net expenses3 | 1.95% | 1.95% | 1.95% | 1.95% | 1.95%4 |
Net investment income (loss) | (1.45)% | (1.40)% | (0.81)% | (1.03)% | (1.14)% |
Expense waiver/reimbursement5 | 0.25% | 0.25% | 0.26% | 0.27% | 0.28% |
Supplemental Data: | |||||
Net assets, end of period (000 omitted) | $5,582,064 | $4,848,579 | $4,313,852 | $3,877,851 | $3,704,278 |
Portfolio turnover6 | 34% | 38% | 42% | 33% | 47% |
1 | Per share numbers have been calculated using the average shares method. |
2 | Based on net asset value. |
3 | Amount does not reflect net expenses incurred by investment companies in which the Fund may invest. |
4 | The net expense ratio is calculated without reduction for fees paid indirectly for expense offset arrangements. The net expense ratio is 1.95% for the year ended October 31, 2017, after taking into account these expense reductions. |
5 | This expense decrease is reflected in both the net expense and the net investment income (loss) ratios shown above. Amount does not reflect expense waiver/reimbursement recorded by investment companies in which the Fund may invest. |
6 | Securities that mature are considered sales for purposes of this calculation. |
Year Ended October 31, | Period Ended 10/31/20171 | ||||
2021 | 2020 | 2019 | 2018 | ||
Net Asset Value, Beginning of Period | $6.98 | $6.39 | $6.11 | $6.10 | $4.94 |
Income From Investment Operations: | |||||
Net investment income (loss)2 | (0.07) | (0.06) | (0.02) | (0.03) | (0.03) |
Net realized and unrealized gain (loss) | 1.62 | 1.35 | 1.10 | 0.70 | 1.19 |
Total From Investment Operations | 1.55 | 1.29 | 1.08 | 0.67 | 1.16 |
Less Distributions: | |||||
Distributions from net realized gain | (0.50) | (0.70) | (0.80) | (0.66) | — |
Net Asset Value, End of Period | $8.03 | $6.98 | $6.39 | $6.11 | $6.10 |
Total Return3 | 22.96% | 22.11% | 19.98% | 12.29% | 23.48% |
Ratios to Average Net Assets: | |||||
Net expenses4 | 1.42% | 1.44% | 1.45% | 1.46% | 1.47%5, 6 |
Net investment income (loss) | (0.92)% | (0.89)% | (0.31)% | (0.52)% | (0.67)%5 |
Expense waiver/reimbursement7 | 0.04% | 0.03% | 0.03% | 0.03% | 0.03%5 |
Supplemental Data: | |||||
Net assets, end of period (000 omitted) | $808,904 | $640,411 | $452,014 | $325,596 | $198,762 |
Portfolio turnover8 | 34% | 38% | 42% | 33% | 47%9 |
1 | Reflects operations for the period from December 29, 2016 (commencement of operations) to October 31, 2017. |
2 | Per share numbers have been calculated using the average shares method. |
3 | Based on net asset value. Total returns for periods of less than one year are not annualized. |
4 | Amount does not reflect net expenses incurred by investment companies in which the Fund may invest. |
5 | Computed on an annualized basis. |
6 | The net expense ratio is calculated without reduction for fees paid indirectly for expense offset arrangements. The net expense ratio is 1.47% for the period from December 29, 2016 (commencement of operations) to October 31, 2017, after taking into account these expense reductions. |
7 | This expense decrease is reflected in both the net expense and the net investment income (loss) ratios shown above. Amount does not reflect expense waiver/reimbursement recorded by investment companies in which the Fund may invest. |
8 | Securities that mature are considered sales for purposes of this calculation. |
9 | Portfolio turnover is calculated at the Fund level. Percentage indicated was calculated for the year ended October 31, 2017. |
October 31, 2021
Assets: | |
Investment in securities, at value including $223,018,437 of securities loaned and $674,934,264 of investment in affiliated holdings and $930,640,073 of investment in affiliated companies* (identified cost $4,735,519,158) | $8,873,633,059 |
Cash denominated in foreign currencies (identified cost $57,967) | 56,865 |
Income receivable | 381,571 |
Income receivable from affiliated holdings | 13,943 |
Receivable for investments sold | 10,206,123 |
Receivable for shares sold | 2,193,089 |
Total Assets | 8,886,484,650 |
Liabilities: | |
Payable for investments purchased | 55,523,396 |
Payable for shares redeemed | 5,784,907 |
Payable for collateral due to broker for securities lending (Note 2) | 232,561,803 |
Payable for investment adviser fee (Note 5) | 883,663 |
Payable for administrative fee (Note 5) | 55,062 |
Payable for distribution services fee (Note 5) | 1,863,082 |
Payable for other service fees (Notes 2 and 5) | 3,987,638 |
Accrued expenses (Note 5) | 443,585 |
Total Liabilities | 301,103,136 |
Net assets for 1,107,417,172 shares outstanding | $8,585,381,514 |
Net Assets Consist of: | |
Paid-in capital | $3,860,244,604 |
Total distributable earnings (loss) | 4,725,136,910 |
Total Net Assets | $8,585,381,514 |
Net Asset Value, Offering Price and Redemption Proceeds Per Share: | |
Class A Shares: | |
Net asset value per share ($2,023,577,259 ÷ 260,498,276 shares outstanding), no par value, unlimited shares authorized | $7.77 |
Offering price per share (100/94.50 of $7.77) | $8.22 |
Redemption proceeds per share | $7.77 |
Class B Shares: | |
Net asset value per share ($31,147,206 ÷ 5,345,919 shares outstanding), no par value, unlimited shares authorized | $5.83 |
Offering price per share | $5.83 |
Redemption proceeds per share (94.50/100 of $5.83) | $5.51 |
Class C Shares: | |
Net asset value per share ($139,689,607 ÷ 24,049,413 shares outstanding), no par value, unlimited shares authorized | $5.81 |
Offering price per share | $5.81 |
Redemption proceeds per share (99.00/100 of $5.81) | $5.75 |
Class R Shares: | |
Net asset value per share ($5,582,063,808 ÷ 716,845,200 shares outstanding), no par value, unlimited shares authorized | $7.79 |
Offering price per share | $7.79 |
Redemption proceeds per share | $7.79 |
Institutional Shares: | |
Net asset value per share ($808,903,634 ÷ 100,678,364 shares outstanding), no par value, unlimited shares authorized | $8.03 |
Offering price per share | $8.03 |
Redemption proceeds per share | $8.03 |
* | See information listed after the Fund’s Portfolio of Investments. |
Year Ended October 31, 2021
Investment Income: | |
Dividends (including $639,935 received from affiliated companies and holdings* and net of foreign taxes withheld of $793,028) | $40,111,537 |
Net income on securities loaned (includes $254,601 received from affiliated holdings* related to cash collateral balances) (Note 2) | 1,910,356 |
Interest | 2,952 |
TOTAL INCOME | 42,024,845 |
Expenses: | |
Investment adviser fee (Note 5) | 108,451,481 |
Administrative fee (Note 5) | 6,521,602 |
Custodian fees | 496,316 |
Transfer agent fees (Note 2) | 5,421,028 |
Directors’/Trustees’ fees (Note 5) | 45,221 |
Auditing fees | 43,100 |
Legal fees | 11,029 |
Portfolio accounting fees | 213,937 |
Distribution services fee (Note 5) | 33,329,096 |
Other service fees (Notes 2 and 5) | 18,864,152 |
Share registration costs | 147,046 |
Printing and postage | 169,952 |
Miscellaneous (Note 5) | 70,535 |
TOTAL EXPENSES | 173,784,495 |
Waivers and Reimbursement: | |
Waiver/reimbursement of investment adviser fee (Note 5) | (3,474,309) |
Waivers/reimbursement of other operating expenses (Notes 2 and 5) | (11,295,217) |
TOTAL WAIVERS AND REIMBURSEMENT | (14,769,526) |
Net expenses | 159,014,969 |
Net investment loss | (116,990,124) |
Realized and Unrealized Gain (Loss) on Investments, Foreign Currency Transactions and Futures Contracts: | |
Net realized gain on investments (including net realized gain of $14,304,222 on sales of investments in affiliated companies and holdings*) | $781,844,454 |
Net realized loss on foreign currency transactions | (214,011) |
Net realized loss on futures contracts | (775,914) |
Net change in unrealized appreciation of investments (including net change in unrealized appreciation of $35,604,477 on investments in affiliated companies and holdings*) | 972,912,704 |
Net change in unrealized appreciation/depreciation of translation of assets and liabilities in foreign currency | (3,293) |
Net realized and unrealized gain (loss) on investments, foreign currency transactions and futures contracts | 1,753,763,940 |
Change in net assets resulting from operations | $1,636,773,816 |
* | See information listed after the Fund’s Portfolio of Investments. |
Year Ended October 31 | 2021 | 2020 |
Increase (Decrease) in Net Assets | ||
Operations: | ||
Net investment loss | $(116,990,124) | $(96,269,547) |
Net realized gain (loss) | 780,854,529 | 555,280,723 |
Net change in unrealized appreciation/depreciation | 972,909,411 | 894,486,034 |
CHANGE IN NET ASSETS RESULTING FROM OPERATIONS | 1,636,773,816 | 1,353,497,210 |
Distributions to Shareholders: | ||
Class A Shares | (132,230,914) | (181,579,785) |
Class B Shares | (3,299,219) | (5,592,184) |
Class C Shares | (13,420,138) | (18,875,257) |
Class R Shares | (353,888,255) | (480,511,980) |
Institutional Shares | (46,545,249) | (49,190,997) |
CHANGE IN NET ASSETS RESULTING FROM DISTRIBUTIONS TO SHAREHOLDERS | (549,383,775) | (735,750,203) |
Share Transactions: | ||
Proceeds from sale of shares | 506,750,596 | 562,648,735 |
Net asset value of shares issued to shareholders in payment of distributions declared | 484,330,943 | 649,963,701 |
Cost of shares redeemed | (967,176,209) | (929,029,673) |
CHANGE IN NET ASSETS RESULTING FROM SHARE TRANSACTIONS | 23,905,330 | 283,582,763 |
Change in net assets | 1,111,295,371 | 901,329,770 |
Net Assets: | ||
Beginning of period | 7,474,086,143 | 6,572,756,373 |
End of period | $8,585,381,514 | $7,474,086,143 |
Transfer Agent Fees Incurred | |
Class A Shares | $1,325,838 |
Class B Shares | 23,121 |
Class C Shares | 99,027 |
Class R Shares | 3,452,249 |
Institutional Shares | 520,793 |
TOTAL | $5,421,028 |
Other Service Fees Incurred | |
Class A Shares | $4,945,331 |
Class B Shares | 86,521 |
Class C Shares | 370,436 |
Class R Shares | 13,461,864 |
TOTAL | $18,864,152 |
Amount of Realized Gain or (Loss) on Derivatives Recognized in Income | |
Futures Contracts | |
Equity contracts | $(775,914) |
Market Value of Securities Loaned | Collateral Received |
$223,018,437 | $232,561,803 |
Security | Acquisition Date | Cost | Value |
Adagio Therapeutics, Inc. | 8/6/2021 | $9,185,100 | $15,798,372 |
Agnico Eagle Mines Ltd. | 12/26/2018 | $64,446,178 | $79,575,000 |
Apollo Investment Fund V | 5/18/2001 | $0 | $85,701 |
Blue Owl Capital, Inc. | 5/24/2021 | $3,298,891 | $4,741,000 |
Expand Networks Ltd. | 9/22/2000 | $2,500,000 | $0 |
FA Private Equity Fund IV LP | 3/4/2002 | $0 | $302,782 |
Fisker, Inc. | 10/29/2020 | $9,740,000 | $15,632,700 |
Immatics N.V. - Restricted | 6/30/2020 | $4,000,000 | $5,732,000 |
Latin Healthcare Fund | 11/28/2000 | $0 | $287,839 |
Multiplex, Inc., Pfd., Series C | 2/22/2001 | $5,000,001 | $0 |
Sensable Technologies, Inc. | 10/15/2004 | $0 | $0 |
Year Ended 10/31/2021 | Year Ended 10/31/2020 | |||
Class A Shares: | Shares | Amount | Shares | Amount |
Shares sold | 15,067,037 | $109,479,435 | 21,508,041 | $134,518,515 |
Shares issued to shareholders in payment of distributions declared | 17,650,372 | 124,435,121 | 29,190,075 | 170,761,938 |
Shares redeemed | (38,204,058) | (280,361,852) | (44,773,440) | (277,052,292) |
NET CHANGE RESULTING FROM CLASS A SHARE TRANSACTIONS | (5,486,649) | $(46,447,296) | 5,924,676 | $28,228,161 |
Year Ended 10/31/2021 | Year Ended 10/31/2020 | |||
Class B Shares: | Shares | Amount | Shares | Amount |
Shares sold | 39,714 | $219,298 | 214,763 | $992,781 |
Shares issued to shareholders in payment of distributions declared | 598,462 | 3,177,833 | 1,194,132 | 5,409,421 |
Shares redeemed | (2,034,324) | (11,230,539) | (2,960,752) | (14,527,481) |
NET CHANGE RESULTING FROM CLASS B SHARE TRANSACTIONS | (1,396,148) | $(7,833,408) | (1,551,857) | $(8,125,279) |
Year Ended 10/31/2021 | Year Ended 10/31/2020 | |||
Class C Shares: | Shares | Amount | Shares | Amount |
Shares sold | 3,357,830 | $18,375,189 | 6,283,847 | $30,283,907 |
Shares issued to shareholders in payment of distributions declared | 2,425,908 | 12,857,313 | 3,892,750 | 17,556,301 |
Shares redeemed | (8,749,851) | (47,655,601) | (10,390,614) | (49,763,404) |
NET CHANGE RESULTING FROM CLASS C SHARE TRANSACTIONS | (2,966,113) | $(16,423,099) | (214,017) | $(1,923,196) |
Year Ended 10/31/2021 | Year Ended 10/31/2020 | |||
Class R Shares: | Shares | Amount | Shares | Amount |
Shares sold | 16,408,632 | $118,973,341 | 21,264,578 | $130,904,639 |
Shares issued to shareholders in payment of distributions declared | 42,729,473 | 302,097,374 | 70,031,266 | 411,083,530 |
Shares redeemed | (53,457,965) | (393,343,125) | (66,961,751) | (413,516,201) |
NET CHANGE RESULTING FROM CLASS R SHARE TRANSACTIONS | 5,680,140 | $27,727,590 | 24,334,093 | $128,471,968 |
Year Ended 10/31/2021 | Year Ended 10/31/2020 | |||
Institutional Shares: | Shares | Amount | Shares | Amount |
Shares sold | 34,363,850 | $259,703,333 | 40,798,357 | $265,948,893 |
Shares issued to shareholders in payment of distributions declared | 5,752,521 | 41,763,302 | 7,550,587 | 45,152,511 |
Shares redeemed | (31,124,767) | (234,585,092) | (27,409,009) | (174,170,295) |
NET CHANGE RESULTING FROM INSTITUTIONAL SHARE TRANSACTIONS | 8,991,604 | $66,881,543 | 20,939,935 | $136,931,109 |
NET CHANGE RESULTING FROM TOTAL FUND SHARE TRANSACTIONS | 4,822,834 | $23,905,330 | 49,432,830 | $283,582,763 |
Increase (Decrease) | |
Paid-In Capital | Total Distributable Earnings (Loss) |
$(29,170,360) | $29,170,360 |
2021 | 2020 | |
Long-term capital gains | $549,383,775 | $735,750,203 |
Net unrealized appreciation | $4,106,621,479 |
Undistributed long-term capital gains | $720,122,188 |
Ordinary loss deferrals | $(101,606,757) |
Administrative Fee | Average Daily Net Assets of the Investment Complex |
0.100% | on assets up to $50 billion |
0.075% | on assets over $50 billion |
Percentage of Average Daily Net Assets of Class | |
Class A Shares | 0.25% |
Class B Shares | 0.75% |
Class C Shares | 0.75% |
Class R Shares | 0.50% |
Distribution Services Fees Incurred | Distribution Services Fees Waived | |
Class A Shares | $4,951,928 | $— |
Class B Shares | 259,564 | — |
Class C Shares | 1,111,307 | — |
Class R Shares | 27,006,297 | (11,295,217) |
TOTAL | $33,329,096 | $(11,295,217) |
Purchases | $2,911,183,972 |
Sales | $2,612,789,620 |
Country | Percentage of Total Net Assets |
United States | 84.7% |
Canada | 4.6% |
Netherlands | 3.5% |
China | 2.3% |
Italy | 1.8% |
Denmark | 1.0% |
Bermuda | 1.0% |
Ireland | 1.0% |
Brazil | 0.8% |
Switzerland | 0.8% |
Cayman Islands | 0.5% |
Sweden | 0.5% |
Israel | 0.4% |
Kampuchea, Democratic | 0.3% |
United Kingdom | 0.2% |
Germany, Federal Republic of | 0.0% |

Beginning Account Value 5/1/2021 | Ending Account Value 10/31/2021 | Expenses Paid During Period1 | |
Actual: | |||
Class A Shares | $1,000 | $1,077.70 | $10.05 |
Class B Shares | $1,000 | $1,075.60 | $12.66 |
Class C Shares | $1,000 | $1,073.90 | $12.65 |
Class R Shares | $1,000 | $1,077.50 | $10.21 |
Institutional Shares | $1,000 | $1,079.30 | $7.44 |
Hypothetical (assuming a 5% return before expenses): | |||
Class A Shares | $1,000 | $1,015.53 | $9.75 |
Class B Shares | $1,000 | $1,013.01 | $12.28 |
Class C Shares | $1,000 | $1,013.01 | $12.28 |
Class R Shares | $1,000 | $1,015.38 | $9.91 |
Institutional Shares | $1,000 | $1,018.05 | $7.22 |
1 | Expenses are equal to the Fund’s annualized net expense ratios, multiplied by the average account value over the period, multiplied by 184/365 (to reflect the one-half-year period). The annualized net expense ratios are as follows: |
Class A Shares | 1.92% |
Class B Shares | 2.42% |
Class C Shares | 2.42% |
Class R Shares | 1.95% |
Institutional Shares | 1.42% |
Name Birth Date Positions Held with Trust Date Service Began | Principal Occupation(s) for Past Five Years, Other Directorships Held and Previous Position(s) |
J. Christopher Donahue* Birth Date: April 11, 1949 President and Trustee Indefinite Term Began serving: January 2000 | Principal Occupations: Principal Executive Officer and President of certain of the Funds in the Federated Hermes Fund Family; Director or Trustee of the Funds in the Federated Hermes Fund Family; President, Chief Executive Officer and Director, Federated Hermes, Inc.; Chairman and Trustee, Federated Investment Management Company; Trustee, Federated Investment Counseling; Chairman and Director, Federated Global Investment Management Corp.; Chairman and Trustee, Federated Equity Management Company of Pennsylvania; Trustee, Federated Shareholder Services Company; Director, Federated Services Company. Previous Positions: President, Federated Investment Counseling; President and Chief Executive Officer, Federated Investment Management Company, Federated Global Investment Management Corp. and Passport Research, Ltd; Chairman, Passport Research, Ltd. |
Name Birth Date Positions Held with Trust Date Service Began | Principal Occupation(s) for Past Five Years, Other Directorships Held and Previous Position(s) |
John B. Fisher* Birth Date: May 16, 1956 Trustee Indefinite Term Began serving: May 2016 | Principal Occupations: Principal Executive Officer and President of certain of the Funds in the Federated Hermes Fund Family; Director or Trustee of certain of the Funds in the Federated Hermes Fund Family; Vice President, Federated Hermes, Inc.; President, Director/Trustee and CEO, Federated Advisory Services Company, Federated Equity Management Company of Pennsylvania, Federated Global Investment Management Corp., Federated Investment Counseling, Federated Investment Management Company; President of some of the Funds in the Federated Hermes Fund Family and Director, Federated Investors Trust Company. Previous Positions: President and Director of the Institutional Sales Division of Federated Securities Corp.; President and Director of Federated Investment Counseling; President and CEO of Passport Research, Ltd.; Director, Edgewood Securities Corp.; Director, Federated Services Company; Director, Federated Hermes, Inc.; Chairman and Director, Southpointe Distribution Services, Inc. and President, Technology, Federated Services Company. |
Name Birth Date Positions Held with Trust Date Service Began | Principal Occupation(s) for Past Five Years, Other Directorships Held, Previous Position(s) and Qualifications |
John T. Collins Birth Date: January 24, 1947 Trustee Indefinite Term Began serving: October 2013 | Principal Occupations: Director or Trustee, and Chair of the Board of Directors or Trustees, of the Federated Hermes Fund Family; formerly, Chairman and CEO, The Collins Group, Inc. (a private equity firm) (Retired). Other Directorships Held: Chairman of the Board of Directors, Director, KLX Energy Services Holdings, Inc. (oilfield services); former Director of KLX Corp. (aerospace). Qualifications: Mr. Collins has served in several business and financial management roles and directorship positions throughout his career. Mr. Collins previously served as Chairman and CEO of The Collins Group, Inc. (a private equity firm) and as a Director of KLX Corp. Mr. Collins serves as Chairman Emeriti, Bentley University. Mr. Collins previously served as Director and Audit Committee Member, Bank of America Corp.; Director, FleetBoston Financial Corp.; and Director, Beth Israel Deaconess Medical Center (Harvard University Affiliate Hospital). |
Name Birth Date Positions Held with Trust Date Service Began | Principal Occupation(s) for Past Five Years, Other Directorships Held, Previous Position(s) and Qualifications |
G. Thomas Hough Birth Date: February 28, 1955 Trustee Indefinite Term Began serving: August 2015 | Principal Occupations: Director or Trustee, Chair of the Audit Committee of the Federated Hermes Fund Family; formerly, Vice Chair, Ernst & Young LLP (public accounting firm) (Retired). Other Directorships Held: Director, Chair of the Audit Committee, Equifax, Inc.; Director, Member of the Audit Committee, Haverty Furniture Companies, Inc.; formerly, Director, Member of Governance and Compensation Committees, Publix Super Markets, Inc. Qualifications: Mr. Hough has served in accounting, business management and directorship positions throughout his career. Mr. Hough most recently held the position of Americas Vice Chair of Assurance with Ernst & Young LLP (public accounting firm). Mr. Hough serves on the President’s Cabinet and Business School Board of Visitors for the University of Alabama. Mr. Hough previously served on the Business School Board of Visitors for Wake Forest University, and he previously served as an Executive Committee member of the United States Golf Association. |
Maureen Lally-Green Birth Date: July 5, 1949 Trustee Indefinite Term Began serving: August 2009 | Principal Occupations: Director or Trustee of the Federated Hermes Fund Family; Adjunct Professor Emerita of Law, Duquesne University School of Law; formerly, Dean of the Duquesne University School of Law and Professor of Law and Interim Dean of the Duquesne University School of Law; formerly, Associate General Secretary and Director, Office of Church Relations, Diocese of Pittsburgh. Other Directorships Held: Director, CNX Resources Corporation (formerly known as CONSOL Energy Inc.). Qualifications: Judge Lally-Green has served in various legal and business roles and directorship positions throughout her career. Judge Lally-Green previously held the position of Dean of the School of Law of Duquesne University (as well as Interim Dean). Judge Lally-Green previously served as a member of the Superior Court of Pennsylvania and as a Professor of Law, Duquesne University School of Law. Judge Lally-Green was appointed by the Supreme Court of Pennsylvania to serve on the Supreme Court’s Board of Continuing Judicial Education and the Supreme Court’s Appellate Court Procedural Rules Committee. Judge Lally-Green also currently holds the positions on not for profit or for profit boards of directors as follows: Director and Chair, UPMC Mercy Hospital; Regent, Saint Vincent Seminary; Member, Pennsylvania State Board of Education (public); Director, Catholic Charities, Pittsburgh; and Director CNX Resources Corporation (formerly known as CONSOL Energy Inc.). Judge Lally-Green has held the positions of: Director, Auberle; Director, Epilepsy Foundation of Western and Central Pennsylvania; Director, Ireland Institute of Pittsburgh; Director, Saint Thomas More Society; Director and Chair, Catholic High Schools of the Diocese of Pittsburgh, Inc.; Director, Pennsylvania Bar Institute; Director, St. Vincent College; Director and Chair, North Catholic High School, Inc.; and Director and Vice Chair, Our Campaign for the Church Alive!, Inc. |
Name Birth Date Positions Held with Trust Date Service Began | Principal Occupation(s) for Past Five Years, Other Directorships Held, Previous Position(s) and Qualifications |
Thomas M. O’Neill Birth Date: June 14, 1951 Trustee Indefinite Term Began serving: October 2006 | Principal Occupations: Director or Trustee of the Federated Hermes Fund Family; Sole Proprietor, Navigator Management Company (investment and strategic consulting). Other Directorships Held: None. Qualifications: Mr. O’Neill has served in several business, mutual fund and financial management roles and directorship positions throughout his career. Mr. O’Neill serves as Director, Medicines for Humanity and Director, The Golisano Children’s Museum of Naples, Florida. Mr. O’Neill previously served as Chief Executive Officer and President, Managing Director and Chief Investment Officer, Fleet Investment Advisors; President and Chief Executive Officer, Aeltus Investment Management, Inc.; General Partner, Hellman, Jordan Management Co., Boston, MA; Chief Investment Officer, The Putnam Companies, Boston, MA; Credit Analyst and Lending Officer, Fleet Bank; Director and Consultant, EZE Castle Software (investment order management software); and Director, Midway Pacific (lumber). |
Madelyn A. Reilly Birth Date: February 2, 1956 Trustee Indefinite Term Began serving: November 2020 | Principal Occupations: Director or Trustee of the Federated Hermes Fund Family; Senior Vice President for Legal Affairs, General Counsel and Secretary of the Board of Trustees, Duquesne University. Other Directorships Held: None. Qualifications: Ms. Reilly has served in various business and legal management roles throughout her career. Ms. Reilly previously served as Director of Risk Management and Associate General Counsel, Duquesne University. Prior to her work at Duquesne University, Ms. Reilly served as Assistant General Counsel of Compliance and Enterprise Risk as well as Senior Counsel of Environment, Health and Safety, PPG Industries. |
P. Jerome Richey Birth Date: February 23, 1949 Trustee Indefinite Term Began serving: October 2013 | Principal Occupations: Director or Trustee of the Federated Hermes Fund Family; Management Consultant; Retired; formerly, Senior Vice Chancellor and Chief Legal Officer, University of Pittsburgh and Executive Vice President and Chief Legal Officer, CONSOL Energy Inc. (now split into two separate publicly traded companies known as CONSOL Energy Inc. and CNX Resources Corp.). Other Directorships Held: None. Qualifications: Mr. Richey has served in several business and legal management roles and directorship positions throughout his career. Mr. Richey most recently held the positions of Senior Vice Chancellor and Chief Legal Officer, University of Pittsburgh. Mr. Richey previously served as Chairman of the Board, Epilepsy Foundation of Western Pennsylvania and Chairman of the Board, World Affairs Council of Pittsburgh. Mr. Richey previously served as Chief Legal Officer and Executive Vice President, CONSOL Energy Inc. and CNX Gas Company; and Board Member, Ethics Counsel and Shareholder, Buchanan Ingersoll & Rooney PC (a law firm). |
Name Birth Date Positions Held with Trust Date Service Began | Principal Occupation(s) for Past Five Years, Other Directorships Held, Previous Position(s) and Qualifications |
John S. Walsh Birth Date: November 28, 1957 Trustee Indefinite Term Began serving: January 1999 | Principal Occupations: Director or Trustee of the Federated Hermes Fund Family; President and Director, Heat Wagon, Inc. (manufacturer of construction temporary heaters); President and Director, Manufacturers Products, Inc. (distributor of portable construction heaters); President, Portable Heater Parts, a division of Manufacturers Products, Inc. Other Directorships Held: None. Qualifications: Mr. Walsh has served in several business management roles and directorship positions throughout his career. Mr. Walsh previously served as Vice President, Walsh & Kelly, Inc. (paving contractors). |
Name Birth Date Address Positions Held with Trust Date Service Began | Principal Occupation(s) for Past Five Years and Previous Position(s) |
Lori A. Hensler Birth Date: January 6, 1967 TREASURER Officer since: April 2013 | Principal Occupations: Principal Financial Officer and Treasurer of the Federated Hermes Fund Family; Senior Vice President, Federated Administrative Services; Financial and Operations Principal for Federated Securities Corp.; and Assistant Treasurer, Federated Investors Trust Company. Ms. Hensler has received the Certified Public Accountant designation. Previous Positions: Controller of Federated Hermes, Inc.; Senior Vice President and Assistant Treasurer, Federated Investors Management Company; Treasurer, Federated Investors Trust Company; Assistant Treasurer, Federated Administrative Services, Federated Administrative Services, Inc., Federated Securities Corp., Edgewood Services, Inc., Federated Advisory Services Company, Federated Equity Management Company of Pennsylvania, Federated Global Investment Management Corp., Federated Investment Counseling, Federated Investment Management Company, Passport Research, Ltd., and Federated MDTA, LLC; Financial and Operations Principal for Federated Securities Corp., Edgewood Services, Inc. and Southpointe Distribution Services, Inc. |
Name Birth Date Address Positions Held with Trust Date Service Began | Principal Occupation(s) for Past Five Years and Previous Position(s) |
Peter J. Germain Birth Date: September 3, 1959 CHIEF LEGAL OFFICER, SECRETARY and EXECUTIVE VICE PRESIDENT Officer since: January 2005 | Principal Occupations: Mr. Germain is Chief Legal Officer, Secretary and Executive Vice President of the Federated Hermes Fund Family. He is General Counsel, Chief Legal Officer, Secretary and Executive Vice President, Federated Hermes, Inc.; Trustee and Senior Vice President, Federated Investors Management Company; Trustee and President, Federated Administrative Services; Director and President, Federated Administrative Services, Inc.; Director and Vice President, Federated Securities Corp.; Director and Secretary, Federated Private Asset Management, Inc.; Secretary, Federated Shareholder Services Company; and Secretary, Retirement Plan Service Company of America. Mr. Germain joined Federated Hermes, Inc. in 1984 and is a member of the Pennsylvania Bar Association. Previous Positions: Deputy General Counsel, Special Counsel, Managing Director of Mutual Fund Services, Federated Hermes, Inc.; Senior Vice President, Federated Services Company; and Senior Corporate Counsel, Federated Hermes, Inc. |
Stephen Van Meter Birth Date: June 5, 1975 CHIEF COMPLIANCE OFFICER AND SENIOR VICE PRESIDENT Officer since: July 2015 | Principal Occupations: Senior Vice President and Chief Compliance Officer of the Federated Hermes Fund Family; Vice President and Chief Compliance Officer of Federated Hermes, Inc. and Chief Compliance Officer of certain of its subsidiaries. Mr. Van Meter joined Federated Hermes, Inc. in October 2011. He holds FINRA licenses under Series 3, 7, 24 and 66. Previous Positions: Mr. Van Meter previously held the position of Compliance Operating Officer, Federated Hermes, Inc. Prior to joining Federated Hermes, Inc., Mr. Van Meter served at the United States Securities and Exchange Commission in the positions of Senior Counsel, Office of Chief Counsel, Division of Investment Management and Senior Counsel, Division of Enforcement. |
Stephen F. Auth Birth Date: September 13, 1956 101 Park Avenue 41st Floor New York, NY 10178 CHIEF INVESTMENT OFFICER Officer since: November 2002 | Principal Occupations: Stephen F. Auth is Chief Investment Officer of various Funds in the Federated Hermes Fund Family; Executive Vice President, Federated Investment Counseling, Federated Global Investment Management Corp. and Federated Equity Management Company of Pennsylvania. Previous Positions: Executive Vice President, Federated Investment Management Company and Passport Research, Ltd. (investment advisory subsidiary of Federated); Senior Vice President, Global Portfolio Management Services Division; Senior Vice President, Federated Investment Management Company and Passport Research, Ltd.; Senior Managing Director and Portfolio Manager, Prudential Investments. |
Annual Evaluation of Adequacy and Effectiveness


Federated Hermes Funds
4000 Ericsson Drive
Warrendale, PA 15086-7561
or call 1-800-341-7400.
CUSIP 314172669
CUSIP 314172651
CUSIP 314172644
CUSIP 31421N873


Share Class | Ticker | A | KLCAX | C | KLCCX | R | KLCKX |
Institutional | KLCIX | R6 | KLCSX |
Federated Hermes Kaufmann Large Cap Fund
A Portfolio of Federated Hermes Equity Funds
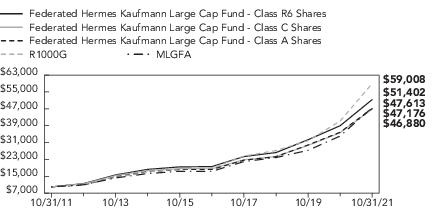
1 Year | 5 Years | 10 Years | |
Class A Shares | 24.23% | 19.53% | 16.78% |
Class C Shares | 29.47% | 19.97% | 16.71% |
Class R Shares | 30.94% | 20.43% | 16.98% |
Institutional Shares | 31.79% | 21.20% | 17.73% |
R6 Shares4 | 31.86% | 21.27% | 17.79% |
R1000G | 43.21% | 25.49% | 19.42% |
MLGFA | 39.55% | 22.95% | 17.43% |
Sector Composition | Percentage of Total Net Assets |
Information Technology | 26.4% |
Health Care | 23.9% |
Consumer Discretionary | 13.8% |
Financials | 10.5% |
Industrials | 8.2% |
Communication Services | 7.8% |
Materials | 3.7% |
Consumer Staples | 1.7% |
Real Estate | 1.5% |
Energy | 1.3% |
Utilities | 0.5% |
Securities Lending Collateral2 | 0.3% |
Cash Equivalents3 | 0.9% |
Other Assets and Liabilities—Net4 | (0.5)% |
TOTAL | 100% |
1 | Except for Cash Equivalents, Securities Lending Collateral and Other Assets and Liabilities, sector classifications are based upon, and individual portfolio securities are assigned to, the classifications of the Global Industry Classification Standard (GICS) except that the Adviser assigns a classification to securities not classified by the GICS and to securities for which the Adviser does not have access to the classification made by the GICS. |
2 | Represents cash collateral received for portfolio securities on loan that may be invested in affiliated money market funds, other money market instruments and/or repurchase agreements. |
3 | Cash Equivalents include any investments in money market mutual funds and/or overnight repurchase agreements other than those representing securities lending collateral. |
4 | Assets, other than investments in securities, less liabilities. See Statement of Assets and Liabilities. |
Shares | Value | ||
COMMON STOCKS— 99.3% | |||
1 | Communication Services— 7.8% | ||
66,500 | Alphabet, Inc., Class A | $196,901,180 | |
287,000 | Facebook, Inc. | 92,864,590 | |
714,000 | T-Mobile USA, Inc. | 82,131,420 | |
TOTAL | 371,897,190 | ||
Consumer Discretionary— 13.8% | |||
245,000 | 1 | Airbnb, Inc. | 41,811,700 |
164,000 | 1 | Alibaba Group Holding Ltd., ADR | 27,050,160 |
48,162 | 1 | Amazon.com, Inc. | 162,422,973 |
22,630 | 1 | Chipotle Mexican Grill, Inc. | 40,259,449 |
250,000 | 1 | Etsy, Inc. | 62,672,500 |
237,500 | 1 | Floor & Decor Holdings, Inc. | 32,281,000 |
129,300 | Home Depot, Inc. | 48,065,982 | |
171,600 | 1 | Lululemon Athletica, Inc. | 79,967,316 |
15,000 | 1 | Mercadolibre, Inc. | 22,215,300 |
20 | 1,2 | New Cotai LLC/Capital | 0 |
332,300 | Nike, Inc., Class B | 55,590,467 | |
39,400 | 1 | Tesla, Inc. | 43,891,600 |
585,100 | TJX Cos., Inc. | 38,318,199 | |
TOTAL | 654,546,646 | ||
Consumer Staples— 1.7% | |||
123,900 | Costco Wholesale Corp. | 60,901,806 | |
67,500 | Estee Lauder Cos., Inc., Class A | 21,892,275 | |
TOTAL | 82,794,081 | ||
Energy— 1.3% | |||
475,000 | 3 | New Fortress Energy, Inc. | 14,250,000 |
1,406,500 | Schlumberger Ltd. | 45,373,690 | |
TOTAL | 59,623,690 | ||
Financials— 10.5% | |||
123,600 | BlackRock, Inc. | 116,611,656 | |
50,000 | 1 | Coinbase Global, Inc. | 15,971,000 |
222,500 | Goldman Sachs Group, Inc. | 91,970,375 | |
535,000 | JPMorgan Chase & Co. | 90,891,150 | |
1,672,200 | KKR & Co., Inc., Class Common | 133,224,174 | |
75,000 | MSCI, Inc., Class A | 49,866,000 | |
TOTAL | 498,534,355 | ||
Health Care— 23.9% | |||
200,000 | Abbott Laboratories | 25,778,000 |
Shares | Value | ||
COMMON STOCKS— continued | |||
Health Care— continued | |||
565,000 | 1 | Alnylam Pharmaceuticals, Inc. | $90,151,400 |
233,400 | 1 | Argenx SE, ADR | 70,477,464 |
405,000 | 1 | Catalent, Inc. | 55,833,300 |
45,000 | 1 | Charles River Laboratories International, Inc. | 20,190,600 |
175,000 | Danaher Corp. | 54,559,750 | |
127,553 | 1 | Dexcom, Inc. | 79,492,305 |
542,511 | 1 | Edwards Lifesciences Corp. | 65,003,668 |
265,000 | 1,3 | Genmab A/S | 119,297,364 |
124,400 | 1 | IDEXX Laboratories, Inc. | 82,867,816 |
45,600 | 1 | Intuitive Surgical, Inc. | 16,467,528 |
107,800 | 1 | Moderna, Inc. | 37,213,638 |
500,000 | 1 | Natera, Inc. | 57,285,000 |
121,000 | 1 | Sarepta Therapeutics, Inc. | 9,574,730 |
125,300 | Stryker Corp. | 33,338,571 | |
725,000 | 1 | Ultragenyx Pharmaceutical, Inc. | 60,842,000 |
360,000 | 1 | Veeva Systems, Inc. | 114,123,600 |
125,000 | 1 | Vertex Pharmaceuticals, Inc. | 23,116,250 |
338,100 | 1,3 | Zai Lab Ltd. | 35,360,190 |
396,000 | Zoetis, Inc. | 85,615,200 | |
TOTAL | 1,136,588,374 | ||
Industrials— 8.2% | |||
1,100,000 | 1 | CoStar Group, Inc. | 94,655,000 |
118,850 | 1 | Generac Holdings, Inc. | 59,253,856 |
847,000 | IHS Markit Ltd. | 110,719,840 | |
683,200 | Trane Technologies PLC | 123,611,376 | |
TOTAL | 388,240,072 | ||
Information Technology— 26.4% | |||
20,500 | 1 | Adobe, Inc. | 13,332,380 |
260,000 | 1 | Advanced Micro Devices, Inc. | 31,259,800 |
530,500 | Apple, Inc. | 79,468,900 | |
200,000 | 1 | GoDaddy, Inc. | 13,834,000 |
881,500 | Marvell Technology, Inc. | 60,382,750 | |
281,300 | Mastercard, Inc. | 94,381,776 | |
715,000 | Microsoft Corp. | 237,108,300 | |
60,000 | NVIDIA Corp. | 15,340,200 | |
880,000 | 1 | PagSeguro Digital Ltd. | 31,856,000 |
110,000 | 1 | PayPal Holdings, Inc. | 25,584,900 |
150,000 | Qualcomm, Inc. | 19,956,000 | |
600,000 | 1 | Qualtrics International, Inc. | 27,792,000 |
547,000 | 1 | Salesforce.com, Inc. | 163,930,430 |
254,100 | 1 | ServiceNow, Inc. | 177,300,816 |
Shares | Value | ||
COMMON STOCKS— continued | |||
Information Technology— continued | |||
33,400 | 1 | Shopify, Inc. | $48,988,782 |
322,800 | 1 | Splunk, Inc. | 53,203,896 |
133,000 | 1 | Unity Software, Inc. | 20,124,230 |
426,900 | Visa, Inc., Class A | 90,404,613 | |
178,500 | 1 | Workday, Inc. | 51,761,430 |
TOTAL | 1,256,011,203 | ||
Materials— 3.7% | |||
204,500 | Ecolab, Inc. | 45,443,990 | |
417,300 | Sherwin-Williams Co. | 132,121,353 | |
TOTAL | 177,565,343 | ||
Real Estate— 1.5% | |||
240,000 | Crown Castle International Corp. | 43,272,000 | |
200,000 | ProLogis, Inc. | 28,992,000 | |
TOTAL | 72,264,000 | ||
Utilities— 0.5% | |||
300,000 | NextEra Energy, Inc. | 25,599,000 | |
TOTAL COMMON STOCKS (IDENTIFIED COST $2,020,984,676) | 4,723,663,954 | ||
INVESTMENT COMPANIES— 1.2% | |||
12,681,451 | Federated Hermes Government Obligations Fund, Premier Shares, 0.03%4 | 12,681,451 | |
43,273,672 | Federated Hermes Institutional Prime Value Obligations Fund, Institutional Shares, 0.02%4 | 43,282,327 | |
TOTAL INVESTMENT COMPANIES (IDENTIFIED COST $55,961,168) | 55,963,778 | ||
TOTAL INVESTMENT IN SECURITIES—100.5% (IDENTIFIED COST $2,076,945,844)5 | 4,779,627,732 | ||
OTHER ASSETS AND LIABILITIES - NET—(0.5)%6 | (22,296,203) | ||
TOTAL NET ASSETS—100% | $4,757,331,529 |
Value as of 10/31/2020 | Purchases at Cost | Proceeds from Sales | |
Health Care: | |||
Ultragenyx Pharmaceutical, Inc. | $74,370,000 | $4,079,762 | $(6,295,281) |
TOTAL OF AFFILIATED COMPANIES TRANSACTIONS | $74,370,000 | $4,079,762 | $(6,295,281) |
Change in Unrealized Appreciation/ Depreciation | Net Realized Gain/ (Loss) | Value as of 10/31/2021 | Shares Held as of 10/31/2021 | Dividend Income |
$(14,007,114) | $2,694,633 | $60,842,000 | 725,000 | $— |
$(14,007,114) | $2,694,633 | $60,842,000 | 725,000 | $— |
Federated Hermes Government Obligations Fund, Premier Shares* | Federated Hermes Institutional Prime Value Obligations Fund, Institutional Shares* | Total of Affiliated Transactions | |
Value as of 10/31/2020 | $34,056,266 | $67,538,330 | $101,594,596 |
Purchases at Cost | $391,166,249 | $1,085,047,855 | $1,476,214,104 |
Proceeds from Sales | $(412,541,064) | $(1,109,286,893) | $(1,521,827,957) |
Change in Unrealized Appreciation/ Depreciation | N/A | $(6,030) | $(6,030) |
Net Realized Gain/(Loss) | N/A | $(10,935) | $(10,935) |
Value as of 10/31/2021 | $12,681,451 | $43,282,327 | $55,963,778 |
Shares Held as of 10/31/2021 | 12,681,451 | 43,273,672 | 55,955,123 |
Dividend Income | $5,053 | $39,489 | $44,542 |
* | All or a portion of the balance/activity for the fund relates to cash collateral received on securities lending transactions. |
1 | Non-income-producing security. |
2 | Market quotations and price evaluations are not available. Fair value determined using significant unobservable inputs in accordance with procedures established by and under the general supervision of the Fund’s Board of Trustees (the “Trustees”). |
3 | All or a portion of these securities are temporarily on loan to unaffiliated broker/dealers. |
4 | 7-day net yield. |
5 | The cost of investments for federal tax purposes amounts to $2,083,172,045. |
6 | Assets, other than investments in securities, less liabilities. See Statement of Assets and Liabilities. |
The following is a summary of the inputs used, as of October 31, 2021, in valuing the Fund’s assets carried at fair value:
Valuation Inputs | ||||
Level 1— Quoted Prices | Level 2— Other Significant Observable Inputs | Level 3— Significant Unobservable Inputs | Total | |
Equity Securities: | ||||
Common Stocks | ||||
Domestic | $4,110,929,088 | $— | $0 | $4,110,929,088 |
International | 458,077,312 | 154,657,554 | — | 612,734,866 |
Investment Companies | 55,963,778 | — | — | 55,963,778 |
TOTAL SECURITIES | $4,624,970,178 | $154,657,554 | $0 | $4,779,627,732 |
The following acronym(s) are used throughout this portfolio: | ||
ADR | —American Depositary Receipt | |
Year Ended October 31, | |||||
2021 | 2020 | 2019 | 2018 | 2017 | |
Net Asset Value, Beginning of Period | $31.46 | $27.39 | $24.76 | $23.38 | $18.86 |
Income From Investment Operations: | |||||
Net investment income (loss)1 | (0.21) | (0.10) | (0.07) | (0.05) | (0.06) |
Net realized and unrealized gain (loss) | 9.88 | 5.42 | 5.17 | 1.77 | 4.58 |
Total From Investment Operations | 9.67 | 5.32 | 5.10 | 1.72 | 4.52 |
Less Distributions: | |||||
Distributions from net realized gain | (1.24) | (1.25) | (2.47) | (0.34) | — |
Net Asset Value, End of Period | $39.89 | $31.46 | $27.39 | $24.76 | $23.38 |
Total Return2 | 31.46% | 20.14% | 22.76% | 7.45% | 23.97% |
Ratios to Average Net Assets: | |||||
Net expenses3 | 1.08% | 1.08% | 1.08% | 1.08% | 1.08% |
Net investment income (loss) | (0.57)% | (0.36)% | (0.29)% | (0.20)% | (0.19)% |
Expense waiver/reimbursement4 | 0.08% | 0.09% | 0.10% | 0.11% | 0.11% |
Supplemental Data: | |||||
Net assets, end of period (000 omitted) | $953,814 | $741,584 | $616,124 | $539,812 | $609,630 |
Portfolio turnover5 | 28% | 24% | 19% | 35% | 44% |
1 | Per share numbers have been calculated using the average shares method. |
2 | Based on net asset value, which does not reflect the sales charge, redemption fee or contingent deferred sales charge, if applicable. |
3 | Amount does not reflect net expenses incurred by investment companies in which the Fund may invest. |
4 | This expense decrease is reflected in both the net expense and the net investment income (loss) ratios shown above. Amount does not reflect expense waiver/reimbursement recorded by investment companies in which the Fund may invest. |
5 | Securities that mature are considered sales for purposes of this calculation. |
Year Ended October 31, | |||||
2021 | 2020 | 2019 | 2018 | 2017 | |
Net Asset Value, Beginning of Period | $28.08 | $24.76 | $22.77 | $21.69 | $17.64 |
Income From Investment Operations: | |||||
Net investment income (loss)1 | (0.42) | (0.29) | (0.24) | (0.22) | (0.32) |
Net realized and unrealized gain (loss) | 8.76 | 4.86 | 4.70 | 1.64 | 4.37 |
Total From Investment Operations | 8.34 | 4.57 | 4.46 | 1.42 | 4.05 |
Less Distributions: | |||||
Distributions from net realized gain | (1.24) | (1.25) | (2.47) | (0.34) | — |
Net Asset Value, End of Period | $35.18 | $28.08 | $24.76 | $22.77 | $21.69 |
Total Return2 | 30.47% | 19.21% | 21.85% | 6.64% | 22.96% |
Ratios to Average Net Assets: | |||||
Net expenses3 | 1.85% | 1.85% | 1.85% | 1.85% | 1.86% |
Net investment income (loss) | (1.33)% | (1.11)% | (1.05)% | (0.97)% | (0.96)% |
Expense waiver/reimbursement4 | 0.08% | 0.09% | 0.09% | 0.09% | 0.09% |
Supplemental Data: | |||||
Net assets, end of period (000 omitted) | $355,877 | $372,382 | $399,208 | $387,474 | $445,081 |
Portfolio turnover5 | 28% | 24% | 19% | 35% | 44% |
1 | Per share numbers have been calculated using the average shares method. |
2 | Based on net asset value, which does not reflect the sales charge, redemption fee or contingent deferred sales charge, if applicable. |
3 | Amount does not reflect net expenses incurred by investment companies in which the Fund may invest. |
4 | This expense decrease is reflected in both the net expense and the net investment income (loss) ratios shown above. Amount does not reflect expense waiver/reimbursement recorded by investment companies in which the Fund may invest. |
5 | Securities that mature are considered sales for purposes of this calculation. |
Year Ended October 31, | |||||
2021 | 2020 | 2019 | 2018 | 2017 | |
Net Asset Value, Beginning of Period | $29.58 | $25.92 | $23.64 | $22.42 | $18.16 |
Income From Investment Operations: | |||||
Net investment income (loss)1 | (0.32) | (0.20) | (0.16) | (0.14) | (0.18) |
Net realized and unrealized gain (loss) | 9.25 | 5.11 | 4.91 | 1.70 | 4.44 |
Total From Investment Operations | 8.93 | 4.91 | 4.75 | 1.56 | 4.26 |
Less Distributions: | |||||
Distributions from net realized gain | (1.24) | (1.25) | (2.47) | (0.34) | — |
Net Asset Value, End of Period | $37.27 | $29.58 | $25.92 | $23.64 | $22.42 |
Total Return2 | 30.94% | 19.69% | 22.32% | 7.05% | 23.46% |
Ratios to Average Net Assets: | |||||
Net expenses3 | 1.47% | 1.46% | 1.46% | 1.47% | 1.47% |
Net investment income (loss) | (0.95)% | (0.72)% | (0.65)% | (0.59)% | (0.58)% |
Expense waiver/reimbursement4 | 0.13% | 0.14% | 0.14% | 0.14% | 0.14% |
Supplemental Data: | |||||
Net assets, end of period (000 omitted) | $82,883 | $76,374 | $74,919 | $70,350 | $79,138 |
Portfolio turnover5 | 28% | 24% | 19% | 35% | 44% |
1 | Per share numbers have been calculated using the average shares method. |
2 | Based on net asset value. |
3 | Amount does not reflect net expenses incurred by investment companies in which the Fund may invest. |
4 | This expense decrease is reflected in both the net expense and the net investment income (loss) ratios shown above. Amount does not reflect expense waiver/reimbursement recorded by investment companies in which the Fund may invest. |
5 | Securities that mature are considered sales for purposes of this calculation. |
Year Ended October 31, | |||||
2021 | 2020 | 2019 | 2018 | 2017 | |
Net Asset Value, Beginning of Period | $32.53 | $28.21 | $25.37 | $23.89 | $19.22 |
Income From Investment Operations: | |||||
Net investment income (loss)1 | (0.12) | (0.03) | (0.01) | 0.01 | (0.01) |
Net realized and unrealized gain (loss) | 10.23 | 5.60 | 5.32 | 1.81 | 4.68 |
Total From Investment Operations | 10.11 | 5.57 | 5.31 | 1.82 | 4.67 |
Less Distributions: | |||||
Distributions from net realized gain | (1.24) | (1.25) | (2.47) | (0.34) | — |
Net Asset Value, End of Period | $41.40 | $32.53 | $28.21 | $25.37 | $23.89 |
Total Return2 | 31.79% | 20.46% | 23.07% | 7.72% | 24.30% |
Ratios to Average Net Assets: | |||||
Net expenses3 | 0.83% | 0.83% | 0.83% | 0.83% | 0.84% |
Net investment income (loss) | (0.32)% | (0.10)% | (0.03)% | 0.05% | 0.05% |
Expense waiver/reimbursement4 | 0.09% | 0.09% | 0.10% | 0.09% | 0.10% |
Supplemental Data: | |||||
Net assets, end of period (000 omitted) | $3,090,630 | $2,635,157 | $2,264,174 | $1,998,725 | $2,024,361 |
Portfolio turnover5 | 28% | 24% | 19% | 35% | 44% |
1 | Per share numbers have been calculated using the average shares method. |
2 | Based on net asset value. |
3 | Amount does not reflect net expenses incurred by investment companies in which the Fund may invest. |
4 | This expense decrease is reflected in both the net expense and the net investment income (loss) ratios shown above. Amount does not reflect expense waiver/reimbursement recorded by investment companies in which the Fund may invest. |
5 | Securities that mature are considered sales for purposes of this calculation. |
Year Ended October 31, | |||||
2021 | 2020 | 2019 | 2018 | 2017 | |
Net Asset Value, Beginning of Period | $32.68 | $28.32 | $25.44 | $23.94 | $19.26 |
Income From Investment Operations: | |||||
Net investment income (loss)1 | (0.10) | (0.02) | 0.01 | 0.03 | 0.02 |
Net realized and unrealized gain (loss) | 10.28 | 5.63 | 5.34 | 1.81 | 4.66 |
Total From Investment Operations | 10.18 | 5.61 | 5.35 | 1.84 | 4.68 |
Less Distributions: | |||||
Distributions from net realized gain | (1.24) | (1.25) | (2.47) | (0.34) | — |
Net Asset Value, End of Period | $41.62 | $32.68 | $28.32 | $25.44 | $23.94 |
Total Return2 | 31.86% | 20.52% | 23.17% | 7.79% | 24.30% |
Ratios to Average Net Assets: | |||||
Net expenses3 | 0.77% | 0.77% | 0.77% | 0.77% | 0.78% |
Net investment income (loss) | (0.26)% | (0.06)% | 0.04% | 0.11% | 0.11% |
Expense waiver/reimbursement4 | 0.08% | 0.09% | 0.09% | 0.09% | 0.09% |
Supplemental Data: | |||||
Net assets, end of period (000 omitted) | $274,128 | $228,285 | $129,987 | $154,136 | $102,285 |
Portfolio turnover5 | 28% | 24% | 19% | 35% | 44% |
1 | Per share numbers have been calculated using the average shares method. |
2 | Based on net asset value. |
3 | Amount does not reflect net expenses incurred by investment companies in which the Fund may invest. |
4 | This expense decrease is reflected in both the net expense and the net investment income (loss) ratios shown above. Amount does not reflect expense waiver/reimbursement recorded by investment companies in which the Fund may invest. |
5 | Securities that mature are considered sales for purposes of this calculation. |
October 31, 2021
Assets: | |
Investment in securities, at value including $15,167,957 of securities loaned and $55,963,778 of investment in affiliated holdings and $60,842,000 of investment in an affiliated company* (identified cost $2,076,945,844) | $4,779,627,732 |
Income receivable | 1,242,039 |
Income receivable from affiliated holdings | 9,035 |
Receivable for shares sold | 2,141,765 |
Total Assets | 4,783,020,571 |
Liabilities: | |
Payable for investments purchased | 4,951,062 |
Payable for shares redeemed | 3,276,228 |
Payable for collateral due to broker for securities lending (Note 2) | 15,781,451 |
Payable for investment adviser fee (Note 5) | 260,134 |
Payable for administrative fee (Note 5) | 30,389 |
Payable for Directors’/Trustees’ fees (Note 5) | 1,334 |
Payable for distribution services fee (Note 5) | 252,138 |
Payable for other service fees (Notes 2 and 5) | 484,832 |
Accrued expenses (Note 5) | 651,474 |
Total Liabilities | 25,689,042 |
Net assets for 117,492,815 shares outstanding | $4,757,331,529 |
Net Assets Consist of: | |
Paid-in capital | $1,485,834,679 |
Total distributable earnings (loss) | 3,271,496,850 |
Total Net Assets | $4,757,331,529 |
Net Asset Value, Offering Price and Redemption Proceeds Per Share: | |
Class A Shares: | |
Net asset value per share ($953,813,971 ÷ 23,911,818 shares outstanding), no par value, unlimited shares authorized | $39.89 |
Offering price per share (100/94.50 of $39.89) | $42.21 |
Redemption proceeds per share | $39.89 |
Class C Shares: | |
Net asset value per share ($355,876,771 ÷ 10,117,011 shares outstanding), no par value, unlimited shares authorized | $35.18 |
Offering price per share | $35.18 |
Redemption proceeds per share (99.00/100 of $35.18) | $34.83 |
Class R Shares: | |
Net asset value per share ($82,883,470 ÷ 2,223,635 shares outstanding), no par value, unlimited shares authorized | $37.27 |
Offering price per share | $37.27 |
Redemption proceeds per share | $37.27 |
Institutional Shares: | |
Net asset value per share ($3,090,629,664 ÷ 74,654,281 shares outstanding), no par value, unlimited shares authorized | $41.40 |
Offering price per share | $41.40 |
Redemption proceeds per share | $41.40 |
Class R6 Shares: | |
Net asset value per share ($274,127,653 ÷ 6,586,070 shares outstanding), no par value, unlimited shares authorized | $41.62 |
Offering price per share | $41.62 |
Redemption proceeds per share | $41.62 |
* | See information listed after the Fund’s Portfolio of Investments. |
Year Ended October 31, 2021
Investment Income: | |
Dividends (including $31,400 received from affiliated holdings* and net of foreign taxes withheld of $6,061) | $23,070,051 |
Net income on securities loaned (includes $13,142 received from affiliated holdings related to cash collateral balances*) (Note 2) | 268,288 |
TOTAL INCOME | 23,338,339 |
Expenses: | |
Investment adviser fee (Note 5) | 34,074,032 |
Administrative fee (Note 5) | 3,551,242 |
Custodian fees | 184,573 |
Transfer agent fees (Note 2) | 3,438,435 |
Directors’/Trustees’ fees (Note 5) | 24,994 |
Auditing fees | 39,700 |
Legal fees | 17,056 |
Portfolio accounting fees | 213,379 |
Distribution services fee (Note 5) | 3,248,309 |
Other service fees (Notes 2 and 5) | 3,094,687 |
Share registration costs | 141,989 |
Printing and postage | 117,744 |
Miscellaneous (Note 5) | 54,740 |
TOTAL EXPENSES | 48,200,880 |
Waivers and Reimbursements: | |
Waiver/reimbursement of investment adviser fee (Note 5) | (3,679,155) |
Waivers/reimbursements of other operating expenses (Notes 2 and 5) | (239,265) |
TOTAL WAIVERS AND REIMBURSEMENTS | (3,918,420) |
Net expenses | 44,282,460 |
Net investment loss | (20,944,121) |
Realized and Unrealized Gain (Loss) on Investments, Foreign Currency Transactions and Foreign Exchange Contracts: | |
Net realized gain on investments (including net realized gain of $2,683,698 on sales of investments in an affiliated company and holdings*) | $595,111,186 |
Net realized loss on foreign currency transactions | (74,247) |
Net realized loss on foreign exchange contracts | (480) |
Net change in unrealized appreciation of investments (including net change in unrealized appreciation of $(14,013,144) on investments in an affiliated company and holdings*) | 650,377,898 |
Net change in unrealized appreciation/depreciation of translation of assets and liabilities in foreign currency | (935) |
Net realized and unrealized gain (loss) on investments, foreign currency transactions and foreign exchange contracts | 1,245,413,422 |
Change in net assets resulting from operations | $1,224,469,301 |
* | See information listed after the Fund’s Portfolio of Investments. |
Year Ended October 31 | 2021 | 2020 |
Increase (Decrease) in Net Assets | ||
Operations: | ||
Net investment loss | $(20,944,121) | $(10,023,747) |
Net realized gain (loss) | 595,036,459 | 159,806,653 |
Net change in unrealized appreciation/depreciation | 650,376,963 | 559,101,351 |
CHANGE IN NET ASSETS RESULTING FROM OPERATIONS | 1,224,469,301 | 708,884,257 |
Distributions to Shareholders: | ||
Class A Shares | (29,185,169) | (27,739,831) |
Class C Shares | (16,216,602) | (19,782,104) |
Class R Shares | (3,184,899) | (3,584,383) |
Institutional Shares | (100,008,954) | (100,227,060) |
Class R6 Shares | (8,646,781) | (5,822,981) |
CHANGE IN NET ASSETS RESULTING FROM DISTRIBUTIONS TO SHAREHOLDERS | (157,242,405) | (157,156,359) |
Share Transactions: | ||
Proceeds from sale of shares | 681,892,322 | 993,455,302 |
Net asset value of shares issued to shareholders in payment of distributions declared | 143,517,460 | 142,093,834 |
Cost of shares redeemed | (1,189,087,037) | (1,117,906,865) |
CHANGE IN NET ASSETS RESULTING FROM SHARE TRANSACTIONS | (363,677,255) | 17,642,271 |
Change in net assets | 703,549,641 | 569,370,169 |
Net Assets: | ||
Beginning of period | 4,053,781,888 | 3,484,411,719 |
End of period | $4,757,331,529 | $4,053,781,888 |
Transfer Agent Fees Incurred | Transfer Agent Fees Reimbursed | |
Class A Shares | $609,096 | $(8,189) |
Class C Shares | 321,580 | — |
Class R Shares | 206,242 | — |
Institutional Shares | 2,275,413 | (190,258) |
Class R6 Shares | 26,104 | — |
TOTAL | $3,438,435 | $(198,447) |
Other Service Fees Incurred | |
Class A Shares | $2,147,977 |
Class C Shares | 946,710 |
TOTAL | $3,094,687 |
Market Value of Securities Loaned | Collateral Received |
$15,167,957 | $15,781,451 |
Amount of Realized Gain or (Loss) on Derivatives Recognized in Income | |
Foreign Exchange Contracts | |
Foreign exchange contracts | $(480) |
Year Ended 10/31/2021 | Year Ended 10/31/2020 | |||
Class A Shares: | Shares | Amount | Shares | Amount |
Shares sold | 4,139,085 | $147,506,630 | 5,398,613 | $156,081,874 |
Shares issued to shareholders in payment of distributions declared | 779,671 | 26,274,916 | 956,117 | 25,901,215 |
Shares redeemed | (4,580,459) | (162,972,930) | (5,277,358) | (148,210,788) |
NET CHANGE RESULTING FROM CLASS A SHARE TRANSACTIONS | 338,297 | $10,808,616 | 1,077,372 | $33,772,301 |
Year Ended 10/31/2021 | Year Ended 10/31/2020 | |||
Class C Shares: | Shares | Amount | Shares | Amount |
Shares sold | 822,226 | $25,689,252 | 1,891,613 | $47,851,501 |
Shares issued to shareholders in payment of distributions declared | 520,267 | 15,571,580 | 700,823 | 17,065,052 |
Shares redeemed | (4,487,301) | (141,991,027) | (5,456,255) | (142,329,474) |
NET CHANGE RESULTING FROM CLASS C SHARE TRANSACTIONS | (3,144,808) | $(100,730,195) | (2,863,819) | $(77,412,921) |
Year Ended 10/31/2021 | Year Ended 10/31/2020 | |||
Class R Shares: | Shares | Amount | Shares | Amount |
Shares sold | 335,775 | $11,198,699 | 456,374 | $12,131,973 |
Shares issued to shareholders in payment of distributions declared | 99,277 | 3,137,168 | 135,826 | 3,471,704 |
Shares redeemed | (793,557) | (26,490,789) | (900,990) | (23,989,524) |
NET CHANGE RESULTING FROM CLASS R SHARE TRANSACTIONS | (358,505) | $(12,154,922) | (308,790) | $(8,385,847) |
Year Ended 10/31/2021 | Year Ended 10/31/2020 | |||
Institutional Shares: | Shares | Amount | Shares | Amount |
Shares sold | 11,727,425 | $431,702,197 | 23,415,291 | $665,462,963 |
Shares issued to shareholders in payment of distributions declared | 2,629,176 | 91,758,251 | 3,279,403 | 91,659,306 |
Shares redeemed | (20,712,813) | (771,083,051) | (25,942,103) | (752,284,081) |
NET CHANGE RESULTING FROM INSTITUTIONAL SHARE TRANSACTIONS | (6,356,212) | $(247,622,603) | 752,591 | $4,838,188 |
Year Ended 10/31/2021 | Year Ended 10/31/2020 | |||
Class R6 Shares: | Shares | Amount | Shares | Amount |
Shares sold | 1,729,121 | $65,795,544 | 3,917,836 | $111,926,991 |
Shares issued to shareholders in payment of distributions declared | 193,201 | 6,775,545 | 142,429 | 3,996,557 |
Shares redeemed | (2,321,935) | (86,549,240) | (1,664,861) | (51,092,998) |
NET CHANGE RESULTING FROM CLASS R6 SHARE TRANSACTIONS | (399,613) | $(13,978,151) | 2,395,404 | $64,830,550 |
NET CHANGE RESULTING FROM TOTAL FUND SHARE TRANSACTIONS | (9,920,841) | $(363,677,255) | 1,052,758 | $17,642,271 |
Increase (Decrease) | |
Paid-In Capital | Total Distributable Earnings (Loss) |
$(11,160,162) | $11,160,162 |
2021 | 2020 | |
Long-term capital gains | $157,242,405 | $157,156,359 |
Net unrealized appreciation | $2,696,447,814 |
Undistributed long-term capital gains | $594,633,640 |
Capital loss carryforwards and deferrals | $19,584,604 |
Administrative Fee | Average Daily Net Assets of the Investment Complex |
0.100% | on assets up to $50 billion |
0.075% | on assets over $50 billion |
Percentage of Average Daily Net Assets of Class | |
Class A Shares | 0.25% |
Class C Shares | 0.75% |
Class R Shares | 0.50% |
Distribution Services Fees Incurred | Distribution Services Fees Waived | |
Class C Shares | $2,840,131 | $— |
Class R Shares | 408,178 | (40,818) |
TOTAL | $3,248,309 | $(40,818) |
Purchases | $1,235,790,886 |
Sales | $1,760,706,460 |
December 23, 2021
Beginning Account Value 5/1/2021 | Ending Account Value 10/31/2021 | Expenses Paid During Period1 | |
Actual: | |||
Class A Shares | $1,000 | $1,115.50 | $5.76 |
Class C Shares | $1,000 | $1,111.20 | $9.84 |
Class R Shares | $1,000 | $1,113.20 | $7.88 |
Institutional Shares | $1,000 | $1,116.80 | $4.43 |
Class R6 Shares | $1,000 | $1,117.00 | $4.11 |
Hypothetical (assuming a 5% return before expenses): | |||
Class A Shares | $1,000 | $1,019.76 | $5.50 |
Class C Shares | $1,000 | $1,015.88 | $9.40 |
Class R Shares | $1,000 | $1,017.74 | $7.53 |
Institutional Shares | $1,000 | $1,021.02 | $4.23 |
Class R6 Shares | $1,000 | $1,021.32 | $3.92 |
1 | Expenses are equal to the Fund’s annualized net expense ratios, multiplied by the average account value over the period, multiplied by 184/365 (to reflect the one-half-year period). The annualized net expense ratios are as follows: |
Class A Shares | 1.08% |
Class C Shares | 1.85% |
Class R Shares | 1.48% |
Institutional Shares | 0.83% |
Class R6 Shares | 0.77% |
Name Birth Date Positions Held with Trust Date Service Began | Principal Occupation(s) for Past Five Years, Other Directorships Held and Previous Position(s) |
J. Christopher Donahue* Birth Date: April 11, 1949 President and Trustee Indefinite Term Began serving: January 2000 | Principal Occupations: Principal Executive Officer and President of certain of the Funds in the Federated Hermes Fund Family; Director or Trustee of the Funds in the Federated Hermes Fund Family; President, Chief Executive Officer and Director, Federated Hermes, Inc.; Chairman and Trustee, Federated Investment Management Company; Trustee, Federated Investment Counseling; Chairman and Director, Federated Global Investment Management Corp.; Chairman and Trustee, Federated Equity Management Company of Pennsylvania; Trustee, Federated Shareholder Services Company; Director, Federated Services Company. Previous Positions: President, Federated Investment Counseling; President and Chief Executive Officer, Federated Investment Management Company, Federated Global Investment Management Corp. and Passport Research, Ltd; Chairman, Passport Research, Ltd. |
Name Birth Date Positions Held with Trust Date Service Began | Principal Occupation(s) for Past Five Years, Other Directorships Held and Previous Position(s) |
John B. Fisher* Birth Date: May 16, 1956 Trustee Indefinite Term Began serving: May 2016 | Principal Occupations: Principal Executive Officer and President of certain of the Funds in the Federated Hermes Fund Family; Director or Trustee of certain of the Funds in the Federated Hermes Fund Family; Vice President, Federated Hermes, Inc.; President, Director/Trustee and CEO, Federated Advisory Services Company, Federated Equity Management Company of Pennsylvania, Federated Global Investment Management Corp., Federated Investment Counseling, Federated Investment Management Company; President of some of the Funds in the Federated Hermes Fund Family and Director, Federated Investors Trust Company. Previous Positions: President and Director of the Institutional Sales Division of Federated Securities Corp.; President and Director of Federated Investment Counseling; President and CEO of Passport Research, Ltd.; Director, Edgewood Securities Corp.; Director, Federated Services Company; Director, Federated Hermes, Inc.; Chairman and Director, Southpointe Distribution Services, Inc. and President, Technology, Federated Services Company. |
Name Birth Date Positions Held with Trust Date Service Began | Principal Occupation(s) for Past Five Years, Other Directorships Held, Previous Position(s) and Qualifications |
John T. Collins Birth Date: January 24, 1947 Trustee Indefinite Term Began serving: October 2013 | Principal Occupations: Director or Trustee, and Chair of the Board of Directors or Trustees, of the Federated Hermes Fund Family; formerly, Chairman and CEO, The Collins Group, Inc. (a private equity firm) (Retired). Other Directorships Held: Chairman of the Board of Directors, Director, KLX Energy Services Holdings, Inc. (oilfield services); former Director of KLX Corp. (aerospace). Qualifications: Mr. Collins has served in several business and financial management roles and directorship positions throughout his career. Mr. Collins previously served as Chairman and CEO of The Collins Group, Inc. (a private equity firm) and as a Director of KLX Corp. Mr. Collins serves as Chairman Emeriti, Bentley University. Mr. Collins previously served as Director and Audit Committee Member, Bank of America Corp.; Director, FleetBoston Financial Corp.; and Director, Beth Israel Deaconess Medical Center (Harvard University Affiliate Hospital). |
Name Birth Date Positions Held with Trust Date Service Began | Principal Occupation(s) for Past Five Years, Other Directorships Held, Previous Position(s) and Qualifications |
G. Thomas Hough Birth Date: February 28, 1955 Trustee Indefinite Term Began serving: August 2015 | Principal Occupations: Director or Trustee, Chair of the Audit Committee of the Federated Hermes Fund Family; formerly, Vice Chair, Ernst & Young LLP (public accounting firm) (Retired). Other Directorships Held: Director, Chair of the Audit Committee, Equifax, Inc.; Director, Member of the Audit Committee, Haverty Furniture Companies, Inc.; formerly, Director, Member of Governance and Compensation Committees, Publix Super Markets, Inc. Qualifications: Mr. Hough has served in accounting, business management and directorship positions throughout his career. Mr. Hough most recently held the position of Americas Vice Chair of Assurance with Ernst & Young LLP (public accounting firm). Mr. Hough serves on the President’s Cabinet and Business School Board of Visitors for the University of Alabama. Mr. Hough previously served on the Business School Board of Visitors for Wake Forest University, and he previously served as an Executive Committee member of the United States Golf Association. |
Maureen Lally-Green Birth Date: July 5, 1949 Trustee Indefinite Term Began serving: August 2009 | Principal Occupations: Director or Trustee of the Federated Hermes Fund Family; Adjunct Professor Emerita of Law, Duquesne University School of Law; formerly, Dean of the Duquesne University School of Law and Professor of Law and Interim Dean of the Duquesne University School of Law; formerly, Associate General Secretary and Director, Office of Church Relations, Diocese of Pittsburgh. Other Directorships Held: Director, CNX Resources Corporation (formerly known as CONSOL Energy Inc.). Qualifications: Judge Lally-Green has served in various legal and business roles and directorship positions throughout her career. Judge Lally-Green previously held the position of Dean of the School of Law of Duquesne University (as well as Interim Dean). Judge Lally-Green previously served as a member of the Superior Court of Pennsylvania and as a Professor of Law, Duquesne University School of Law. Judge Lally-Green was appointed by the Supreme Court of Pennsylvania to serve on the Supreme Court’s Board of Continuing Judicial Education and the Supreme Court’s Appellate Court Procedural Rules Committee. Judge Lally-Green also currently holds the positions on not for profit or for profit boards of directors as follows: Director and Chair, UPMC Mercy Hospital; Regent, Saint Vincent Seminary; Member, Pennsylvania State Board of Education (public); Director, Catholic Charities, Pittsburgh; and Director CNX Resources Corporation (formerly known as CONSOL Energy Inc.). Judge Lally-Green has held the positions of: Director, Auberle; Director, Epilepsy Foundation of Western and Central Pennsylvania; Director, Ireland Institute of Pittsburgh; Director, Saint Thomas More Society; Director and Chair, Catholic High Schools of the Diocese of Pittsburgh, Inc.; Director, Pennsylvania Bar Institute; Director, St. Vincent College; Director and Chair, North Catholic High School, Inc.; and Director and Vice Chair, Our Campaign for the Church Alive!, Inc. |
Name Birth Date Positions Held with Trust Date Service Began | Principal Occupation(s) for Past Five Years, Other Directorships Held, Previous Position(s) and Qualifications |
Thomas M. O’Neill Birth Date: June 14, 1951 Trustee Indefinite Term Began serving: October 2006 | Principal Occupations: Director or Trustee of the Federated Hermes Fund Family; Sole Proprietor, Navigator Management Company (investment and strategic consulting). Other Directorships Held: None. Qualifications: Mr. O’Neill has served in several business, mutual fund and financial management roles and directorship positions throughout his career. Mr. O’Neill serves as Director, Medicines for Humanity and Director, The Golisano Children’s Museum of Naples, Florida. Mr. O’Neill previously served as Chief Executive Officer and President, Managing Director and Chief Investment Officer, Fleet Investment Advisors; President and Chief Executive Officer, Aeltus Investment Management, Inc.; General Partner, Hellman, Jordan Management Co., Boston, MA; Chief Investment Officer, The Putnam Companies, Boston, MA; Credit Analyst and Lending Officer, Fleet Bank; Director and Consultant, EZE Castle Software (investment order management software); and Director, Midway Pacific (lumber). |
Madelyn A. Reilly Birth Date: February 2, 1956 Trustee Indefinite Term Began serving: November 2020 | Principal Occupations: Director or Trustee of the Federated Hermes Fund Family; Senior Vice President for Legal Affairs, General Counsel and Secretary of the Board of Trustees, Duquesne University. Other Directorships Held: None. Qualifications: Ms. Reilly has served in various business and legal management roles throughout her career. Ms. Reilly previously served as Director of Risk Management and Associate General Counsel, Duquesne University. Prior to her work at Duquesne University, Ms. Reilly served as Assistant General Counsel of Compliance and Enterprise Risk as well as Senior Counsel of Environment, Health and Safety, PPG Industries. |
P. Jerome Richey Birth Date: February 23, 1949 Trustee Indefinite Term Began serving: October 2013 | Principal Occupations: Director or Trustee of the Federated Hermes Fund Family; Management Consultant; Retired; formerly, Senior Vice Chancellor and Chief Legal Officer, University of Pittsburgh and Executive Vice President and Chief Legal Officer, CONSOL Energy Inc. (now split into two separate publicly traded companies known as CONSOL Energy Inc. and CNX Resources Corp.). Other Directorships Held: None. Qualifications: Mr. Richey has served in several business and legal management roles and directorship positions throughout his career. Mr. Richey most recently held the positions of Senior Vice Chancellor and Chief Legal Officer, University of Pittsburgh. Mr. Richey previously served as Chairman of the Board, Epilepsy Foundation of Western Pennsylvania and Chairman of the Board, World Affairs Council of Pittsburgh. Mr. Richey previously served as Chief Legal Officer and Executive Vice President, CONSOL Energy Inc. and CNX Gas Company; and Board Member, Ethics Counsel and Shareholder, Buchanan Ingersoll & Rooney PC (a law firm). |
Name Birth Date Positions Held with Trust Date Service Began | Principal Occupation(s) for Past Five Years, Other Directorships Held, Previous Position(s) and Qualifications |
John S. Walsh Birth Date: November 28, 1957 Trustee Indefinite Term Began serving: January 1999 | Principal Occupations: Director or Trustee of the Federated Hermes Fund Family; President and Director, Heat Wagon, Inc. (manufacturer of construction temporary heaters); President and Director, Manufacturers Products, Inc. (distributor of portable construction heaters); President, Portable Heater Parts, a division of Manufacturers Products, Inc. Other Directorships Held: None. Qualifications: Mr. Walsh has served in several business management roles and directorship positions throughout his career. Mr. Walsh previously served as Vice President, Walsh & Kelly, Inc. (paving contractors). |
Name Birth Date Address Positions Held with Trust Date Service Began | Principal Occupation(s) for Past Five Years and Previous Position(s) |
Lori A. Hensler Birth Date: January 6, 1967 TREASURER Officer since: April 2013 | Principal Occupations: Principal Financial Officer and Treasurer of the Federated Hermes Fund Family; Senior Vice President, Federated Administrative Services; Financial and Operations Principal for Federated Securities Corp.; and Assistant Treasurer, Federated Investors Trust Company. Ms. Hensler has received the Certified Public Accountant designation. Previous Positions: Controller of Federated Hermes, Inc.; Senior Vice President and Assistant Treasurer, Federated Investors Management Company; Treasurer, Federated Investors Trust Company; Assistant Treasurer, Federated Administrative Services, Federated Administrative Services, Inc., Federated Securities Corp., Edgewood Services, Inc., Federated Advisory Services Company, Federated Equity Management Company of Pennsylvania, Federated Global Investment Management Corp., Federated Investment Counseling, Federated Investment Management Company, Passport Research, Ltd., and Federated MDTA, LLC; Financial and Operations Principal for Federated Securities Corp., Edgewood Services, Inc. and Southpointe Distribution Services, Inc. |
Name Birth Date Address Positions Held with Trust Date Service Began | Principal Occupation(s) for Past Five Years and Previous Position(s) |
Peter J. Germain Birth Date: September 3, 1959 CHIEF LEGAL OFFICER, SECRETARY and EXECUTIVE VICE PRESIDENT Officer since: January 2005 | Principal Occupations: Mr. Germain is Chief Legal Officer, Secretary and Executive Vice President of the Federated Hermes Fund Family. He is General Counsel, Chief Legal Officer, Secretary and Executive Vice President, Federated Hermes, Inc.; Trustee and Senior Vice President, Federated Investors Management Company; Trustee and President, Federated Administrative Services; Director and President, Federated Administrative Services, Inc.; Director and Vice President, Federated Securities Corp.; Director and Secretary, Federated Private Asset Management, Inc.; Secretary, Federated Shareholder Services Company; and Secretary, Retirement Plan Service Company of America. Mr. Germain joined Federated Hermes, Inc. in 1984 and is a member of the Pennsylvania Bar Association. Previous Positions: Deputy General Counsel, Special Counsel, Managing Director of Mutual Fund Services, Federated Hermes, Inc.; Senior Vice President, Federated Services Company; and Senior Corporate Counsel, Federated Hermes, Inc. |
Stephen Van Meter Birth Date: June 5, 1975 CHIEF COMPLIANCE OFFICER AND SENIOR VICE PRESIDENT Officer since: July 2015 | Principal Occupations: Senior Vice President and Chief Compliance Officer of the Federated Hermes Fund Family; Vice President and Chief Compliance Officer of Federated Hermes, Inc. and Chief Compliance Officer of certain of its subsidiaries. Mr. Van Meter joined Federated Hermes, Inc. in October 2011. He holds FINRA licenses under Series 3, 7, 24 and 66. Previous Positions: Mr. Van Meter previously held the position of Compliance Operating Officer, Federated Hermes, Inc. Prior to joining Federated Hermes, Inc., Mr. Van Meter served at the United States Securities and Exchange Commission in the positions of Senior Counsel, Office of Chief Counsel, Division of Investment Management and Senior Counsel, Division of Enforcement. |
Stephen F. Auth Birth Date: September 13, 1956 101 Park Avenue 41st Floor New York, NY 10178 CHIEF INVESTMENT OFFICER Officer since: November 2002 | Principal Occupations: Stephen F. Auth is Chief Investment Officer of various Funds in the Federated Hermes Fund Family; Executive Vice President, Federated Investment Counseling, Federated Global Investment Management Corp. and Federated Equity Management Company of Pennsylvania. Previous Positions: Executive Vice President, Federated Investment Management Company and Passport Research, Ltd. (investment advisory subsidiary of Federated); Senior Vice President, Global Portfolio Management Services Division; Senior Vice President, Federated Investment Management Company and Passport Research, Ltd.; Senior Managing Director and Portfolio Manager, Prudential Investments. |
Annual Evaluation of Adequacy and Effectiveness
Federated Hermes Funds
4000 Ericsson Drive
Warrendale, PA 15086-7561
or call 1-800-341-7400.
CUSIP 314172438
CUSIP 314172420
CUSIP 314172412
CUSIP 314172131

Share Class | Ticker | A | FKASX | B | FKBSX | C | FKCSX |
R | FKKSX | Institutional | FKAIX | R6 | FKALX |
Federated Hermes Kaufmann Small Cap Fund
A Portfolio of Federated Hermes Equity Funds
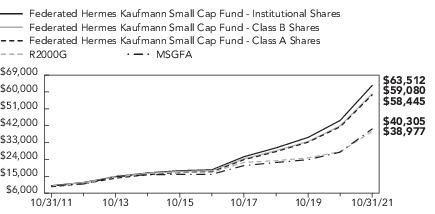
1 Year | 5 Years | 10 Years | |
Class A Shares | 33.36% | 26.00% | 19.31% |
Class B Shares | 34.77% | 26.50% | 19.44% |
Class C Shares | 39.28% | 26.66% | 19.44% |
Class R Shares | 41.14% | 27.47% | 20.04% |
Institutional Shares4 | 41.77% | 28.01% | 20.31% |
Class R6 Shares4 | 41.78% | 27.92% | 20.22% |
R2000G | 38.45% | 17.90% | 14.57% |
MSGFA | 45.00% | 20.79% | 15.47% |
Sector Composition | Percentage of Total Net Assets |
Health Care | 31.8% |
Information Technology | 23.1% |
Consumer Discretionary | 15.5% |
Industrials | 10.0% |
Financials | 7.6% |
Real Estate | 4.2% |
Materials | 3.0% |
Consumer Staples | 1.3% |
Energy | 1.1% |
Communication Services | 1.0% |
Securities Lending Collateral2 | 6.5% |
Cash Equivalents3 | 1.6% |
Other Assets and Liabilities—Net4 | (6.7)% |
TOTAL | 100% |
1 | Except for Securities Lending Collateral, Cash Equivalents and Other Assets and Liabilities, sector classifications are based upon, and individual portfolio securities are assigned to, the classifications of the Global Industry Classification System (GICS), except that the Adviser assigns a classification to securities not classified by the GICS and to securities for which the Adviser does not have access to the classification made by the GICS. |
2 | Represents cash collateral received for portfolio securities on loan that may be invested in affiliated money market funds, other money market instruments and/or repurchase agreements. |
3 | Cash Equivalents include any investments in money market mutual funds and/or overnight repurchase agreements other than those representing securities lending collateral. |
4 | Assets, other than investments in securities, less liabilities. See Statement of Assets and Liabilities. |
Shares | Value | ||
COMMON STOCKS— 98.4% | |||
Communication Services— 1.0% | |||
400,000 | 1 | Boat Rocker Media, Inc. | $2,281,836 |
25,000 | 1 | Genius Sports Ltd. | 463,500 |
2,500,000 | 2 | Infrastrutture Wireless Italiane SPA | 27,640,145 |
45,974 | 1 | Motorsport Gaming U.S. LLC | 542,033 |
1,000,000 | 1,2 | Outbrain, Inc. | 16,940,000 |
700,000 | 1 | Perion Network Ltd. | 19,894,000 |
1,500,000 | 1 | Reservoir Media Management, Inc. | 12,870,000 |
980,100 | 1,2 | Tremor International Ltd., ADR | 18,572,895 |
TOTAL | 99,204,409 | ||
Consumer Discretionary— 15.5% | |||
722,658 | 1,2 | 1stdibs.com, Inc. | 12,386,358 |
1,560,000 | 1 | Academy Sports and Outdoors, Inc. | 66,736,800 |
150,000 | 1 | Bright Horizons Family Solutions, Inc. | 24,900,000 |
650,000 | 1 | Chegg, Inc. | 38,636,000 |
530,000 | Choice Hotels International, Inc. | 74,528,600 | |
4,000,000 | 1 | CTOS LLC | 36,200,000 |
769,200 | 1,2 | Custom Truck One Source, Inc. | 6,961,260 |
415,000 | 1,2 | DraftKings, Inc. | 19,334,850 |
717,078 | 1,2 | Dream Finders Homes, Inc. | 11,380,028 |
537,500 | 1,2 | Dutch Bros, Inc. | 40,979,000 |
385,000 | 1 | Etsy, Inc. | 96,515,650 |
675,000 | 1,2 | European Wax Center, Inc. | 21,519,000 |
673,000 | 1,2 | First Watch Restaurant Group, Inc. | 14,523,340 |
1,170,000 | 1,3 | Fisker, Inc. | 18,778,500 |
255,000 | 1,2 | Fiverr International Ltd. | 43,439,250 |
690,000 | 1 | Floor & Decor Holdings, Inc. | 93,784,800 |
1,575,000 | 1 | Global Fashion Group S.A. | 14,159,096 |
1,000,000 | 1,2 | GreenTree Hospitality Group Ltd., ADR | 8,070,000 |
1,000,000 | 1,2 | GrowGeneration Corp. | 21,080,000 |
280,000 | 1 | Just Eat Takeaway.com NV | 20,125,980 |
906,800 | 1 | Latham Group, Inc. | 13,964,720 |
608,000 | 1 | Lovesac Co./The | 47,430,080 |
1,200,000 | 1 | Mister Car Wash, Inc. | 22,008,000 |
271,200 | Moncler S.p.A | 19,516,898 | |
300,000 | 1,2 | MYT Netherlands Parent B.V., ADR | 7,920,000 |
36,200,000 | NagaCorp Ltd. | 33,213,106 | |
900,000 | 1,2 | National Vision Holdings, Inc. | 55,476,000 |
Shares | Value | ||
COMMON STOCKS— continued | |||
Consumer Discretionary— continued | |||
621,000 | 1 | Neogames SA | $23,070,150 |
250,000 | 1,2 | Ollie’s Bargain Outlet Holding, Inc. | 16,915,000 |
50,000 | 1,2 | On Holding AG | 1,708,000 |
1,400,000 | 1 | Planet Fitness, Inc. | 111,370,000 |
775,000 | 1 | Revolve Group, Inc. | 58,156,000 |
1,225,000 | 1 | Six Flags Entertainment Corp. | 50,384,250 |
420,594 | 1 | Solo Brands, Inc. | 7,722,106 |
800,000 | 1,2 | Sportradar Group AG | 16,720,000 |
950,000 | 1,2 | Torrid Holdings, Inc. | 14,288,000 |
710,000 | 1,2 | Traeger, Inc. | 13,411,900 |
650,000 | 1 | Udemy, Inc. | 17,806,750 |
151,000 | Vail Resorts, Inc. | 52,051,210 | |
680,000 | Wingstop, Inc. | 117,279,600 | |
1,465,000 | 1,2 | Xponential Fitness, Inc. | 24,758,500 |
1,070,000 | 1 | YETI Holdings, Inc. | 105,213,100 |
TOTAL | 1,514,421,882 | ||
Consumer Staples— 1.3% | |||
495,000 | 1 | Freshpet, Inc. | 77,175,450 |
737,000 | 1 | Grocery Outlet Holding Corp. | 16,354,030 |
1,150,000 | 1,2 | The Duckhorn Portfolio, Inc. | 22,241,000 |
770,000 | 1 | Vital Farms, Inc. | 12,643,400 |
TOTAL | 128,413,880 | ||
Energy— 1.1% | |||
775,000 | Cactus, Inc. | 33,712,500 | |
460,000 | Matador Resources Co. | 19,251,000 | |
1,811,731 | 2 | New Fortress Energy, Inc. | 54,351,930 |
TOTAL | 107,315,430 | ||
Financials— 7.6% | |||
800,000 | AFC Gamma, Inc. | 18,768,000 | |
381,000 | A-Mark Precious Metals, Inc. | 28,571,190 | |
1,600,000 | Ares Management Corp. | 135,584,000 | |
1,670,115 | Artisan Partners Asset Management, Inc. | 82,737,497 | |
1,000,000 | 1 | BCLS Acquisition Corp. | 9,910,000 |
1,487,499 | 1 | CrossFirst Bankshares, Inc. | 21,167,111 |
550,000 | 1,2 | FAST Acquisition Corp. | 7,166,500 |
4,530,000 | FinecoBank Banca Fineco SPA | 86,609,074 | |
1,000,000 | Hamilton Lane, Inc. | 104,510,000 | |
1,365,000 | Moelis & Co. | 99,290,100 | |
1,000,000 | 1 | Omega Alpha SPAC | 9,770,000 |
2,776,503 | 1,2 | P10, Inc. | 34,706,287 |
368,025 | 1 | SCVX Corp. | 3,672,890 |
Shares | Value | ||
COMMON STOCKS— continued | |||
Financials— continued | |||
1,790,000 | StepStone Group, Inc. | $84,094,200 | |
4,200,000 | Tel Aviv Stock Exchange Ltd. | 22,950,695 | |
TOTAL | 749,507,544 | ||
Health Care— 31.6% | |||
717,715 | 1,2 | Adagio Therapeutics, Inc. | 20,985,987 |
640,640 | 1,4 | Adagio Therapeutics, Inc. | 15,996,284 |
163,495 | 1 | agilon health, Inc. | 4,005,627 |
1,284,005 | 1,2 | Akouos, Inc. | 11,966,927 |
1,000,000 | 1 | Albireo Pharma, Inc. | 29,220,000 |
2,365,000 | 1 | Alector, Inc. | 51,415,100 |
1,475,000 | 1 | Aligos Therapeutics, Inc. | 23,496,750 |
2,000,000 | 1 | Amphastar Pharmaceuticals, Inc. | 37,360,000 |
916,615 | 1 | AnaptysBio, Inc. | 30,156,633 |
341,200 | 2 | Andlauer Healthcare Group, Inc. | 13,294,008 |
1,000,000 | 1 | Annexon, Inc. | 16,310,000 |
1,336,488 | 1,2 | Arcturus Therapeutics Holdings, Inc. | 60,075,136 |
567,000 | 1 | Argenx SE | 170,832,791 |
242,700 | 1 | Argenx SE, ADR | 73,285,692 |
2,900,000 | 1 | aTyr Pharma, Inc. | 24,911,000 |
1,320,000 | 1 | Avidity Biosciences LLC | 29,700,000 |
1,388,064 | 1 | Avrobio, Inc. | 7,800,920 |
875,952 | 1,2 | Black Diamond Therapeutics, Inc. | 6,709,792 |
3,960,000 | 1 | Calithera Biosciences, Inc. | 7,642,800 |
10,150,000 | 1,2 | CASI Pharmaceuticals, Inc. | 10,962,000 |
430,000 | 1 | Catalent, Inc. | 59,279,800 |
312,548 | 1 | Celcuity, Inc. | 5,657,119 |
293,000 | 1,2 | Century Therapeutics, Inc. | 6,583,710 |
338,980 | 1,4 | Century Therapeutics, Inc. | 6,846,776 |
39,156,130 | 1,4 | CeQur SA | 10,921,763 |
2,390,382 | 1,2 | Cerevel Therapeutics Holdings | 97,169,028 |
400,000 | 1 | Cerevel Therapeutics, Inc. | 16,260,000 |
155,000 | 1 | Charles River Laboratories International, Inc. | 69,545,400 |
190,200 | 1,4 | Clementia Pharmaceuticals, Inc., Rights | 0 |
6,412,388 | 1,2 | ContraFect Corp. | 24,174,703 |
342,500 | 1,2 | CRISPR Therapeutics AG | 31,280,525 |
569,070 | 1,2 | Cryoport, Inc. | 46,401,968 |
157,630 | 1 | Definitive Healthcare Corp. | 6,327,268 |
601,100 | 1 | Denali Therapeutics, Inc. | 29,063,185 |
655,310 | 1,2 | DermTech, Inc. | 17,922,728 |
89,555 | 1 | Dexcom, Inc. | 55,811,572 |
7,629,400 | 1,2 | Dynavax Technologies Corp. | 152,359,118 |
Shares | Value | ||
COMMON STOCKS— continued | |||
Health Care— continued | |||
463,300 | 1,2 | Edgewise Therapeutics, Inc. | $7,644,450 |
600,000 | 1,2 | FIGS, Inc. | 20,166,000 |
1,000,000 | 1,2 | Frequency Therapeutics, Inc. | 6,280,000 |
178,000 | 1 | Frequency Therapeutics, Inc. | 1,117,840 |
1,510,000 | 1,2 | Fusion Pharmaceuticals, Inc. | 10,585,100 |
2,500,000 | 1 | Gossamer Bio, Inc. | 31,050,000 |
600,338 | 1,2 | Gracell Biotechnologies, Inc., ADR | 6,423,617 |
320,970 | 1,2 | Graphite Bio, Inc. | 4,089,158 |
406,308 | 1,4 | Graphite Bio, Inc. | 4,609,322 |
100,000 | 1 | Guardant Health, Inc. | 11,679,000 |
707,053 | 1 | Icad, Inc. | 7,459,409 |
1,257,500 | 1 | IDEAYA Biosciences, Inc. | 26,960,800 |
1,406,000 | 1,2 | Immatics N.V. | 20,147,980 |
290,000 | 1,3 | Immatics N.V. - Restricted | 4,155,700 |
100,000 | 1 | Inari Medical, Inc. | 9,052,000 |
333,500 | 1 | Inspire Medical Systems, Inc. | 89,904,930 |
90,000 | 1 | Insulet Corp. | 27,901,800 |
356,976 | 1 | Intellia Therapeutics, Inc. | 47,470,668 |
500,000 | 1 | Itamar Medical Ltd., ADR | 15,250,000 |
813,300 | 1 | Jasper Therapeutics, Inc. | 7,425,429 |
475,000 | 1 | Karuna Therapeutics, Inc. | 66,680,500 |
307,800 | 1 | Kinnate Biopharma, Inc. | 7,316,406 |
188,702 | 1,4 | Laronde, Inc. | 5,283,656 |
954,940 | 1,2 | Legend Biotech Corp., ADR | 50,134,350 |
984,196 | 1,2 | MaxCyte, Inc. | 11,062,363 |
1,915,000 | 1,2 | Merus NV | 53,715,750 |
4,272,400 | 1 | Minerva Neurosciences, Inc. | 5,981,360 |
154,700 | 1 | Mirati Therapeutics, Inc. | 29,241,394 |
223,000 | 1 | Moderna, Inc. | 76,981,830 |
873,312 | 1,2 | Molecular Partners AG | 16,406,189 |
125,364 | 1 | Molecular Partners AG, ADR | 2,324,249 |
248,700 | 1 | Morphic Holding, Inc. | 14,300,250 |
620,625 | 1 | NanoString Technologies, Inc. | 29,976,187 |
1,013,500 | 1 | Natera, Inc. | 116,116,695 |
587,564 | 1,2 | Nautilus Biotechnology, Inc. | 3,137,592 |
1,123,900 | 1 | NeoGenomics, Inc. | 51,699,400 |
300,000 | 1,2 | Oak Street Health, Inc. | 14,169,000 |
260,000 | 1 | Olema Pharmaceuticals, Inc. | 7,020,000 |
660,900 | 1 | Orchard Therapeutics PLC | 1,268,928 |
1,775,000 | 1 | Otonomy, Inc. | 3,727,500 |
100,000 | 1,2 | Penumbra, Inc. | 27,655,000 |
Shares | Value | ||
COMMON STOCKS— continued | |||
Health Care— continued | |||
250,000 | 1 | PMV Pharmaceuticals, Inc. | $5,905,000 |
314,318 | 1 | Privia Health Group, Inc. | 8,077,973 |
5,761 | 1,2 | Protalix Biotherapeutics, Inc. | 6,510 |
600,000 | 1 | Relay Therapeutics, Inc. | 19,950,000 |
345,000 | 1 | Repligen Corp. | 100,222,500 |
1,625,000 | 1 | Rezolute, Inc. | 10,400,000 |
1,350,000 | 1 | Rhythm Pharmaceuticals, Inc. | 15,538,500 |
650,000 | 1 | Rubius Therapeutics, Inc. | 9,236,500 |
439,899 | 1,2 | RxSight, Inc. | 5,269,990 |
250,000 | 1 | Sarepta Therapeutics, Inc. | 19,782,500 |
290,112 | 1,2 | Scholar Rock Holding Corp. | 7,629,946 |
1,596,034 | 1,2 | Scynexis, Inc. | 7,996,130 |
125,000 | 1,2 | Seer, Inc. | 4,615,000 |
370,000 | 1 | SI-BONE, Inc. | 8,343,500 |
275,000 | 1 | Stoke Therapeutics, Inc. | 6,278,250 |
477,111 | 1 | Surgery Partners, Inc. | 19,628,347 |
1,972,500 | 1 | Talkspace, Inc. | 6,785,400 |
400,000 | 1 | Tandem Diabetes Care, Inc. | 54,532,000 |
450,000 | 1 | Treace Medical Concepts, Inc. | 10,377,000 |
1,015,500 | 1 | Turning Point Therapeutics, Inc. | 42,224,490 |
162,300 | 1 | Twist Bioscience Corp. | 19,281,240 |
1,535,500 | 1 | Ultragenyx Pharmaceutical, Inc. | 128,859,160 |
1,400,000 | 1 | UniQure N.V. | 42,658,000 |
822,570 | 4 | United Therapeutics Corp. | 0 |
555,329 | 1,2 | Vapotherm, Inc. | 12,700,374 |
187,800 | 1 | Veeva Systems, Inc. | 59,534,478 |
1,325,000 | 1 | Vericel Corp. | 60,976,500 |
197,537 | 1,2 | Verve Therapeutics, Inc. | 9,163,741 |
1,010,000 | 1 | Zai Lab Ltd., ADR | 105,444,000 |
690,000 | 1 | Zentalis Pharmaceuticals, LLC | 55,503,600 |
TOTAL | 3,092,224,541 | ||
Industrials— 10.0% | |||
544,100 | Advanced Drainage System, Inc. | 61,374,480 | |
1,000,000 | 1 | Archer Aviation, Inc. | 5,700,000 |
1,250,000 | 1 | Aris Water Solutions, Inc. | 17,087,500 |
1,913,073 | 1 | Azek Co., Inc. | 70,190,648 |
1,000,000 | 1,2 | Azul S.A., ADR | 13,230,000 |
785,500 | 1 | Clarivate PLC | 18,419,975 |
1,425,000 | 1 | Colfax Corp. | 73,558,500 |
600,000 | Comfort Systems USA, Inc. | 54,882,000 | |
417,000 | 1 | CoStar Group, Inc. | 35,882,850 |
Shares | Value | ||
COMMON STOCKS— continued | |||
Industrials— continued | |||
239,500 | 1 | Generac Holdings, Inc. | $119,405,120 |
1,322,300 | 1 | GMS, Inc. | 65,493,519 |
970,000 | 1 | GXO Logistics, Inc. | 86,136,000 |
554,000 | 1,2 | Hydrofarm Holdings Group, Inc. | 18,265,380 |
1,000,000 | 1 | Hyzon Motors, Inc. | 5,210,000 |
2,998,592 | 1 | Meltwater Holding BV | 13,899,128 |
345,000 | 1 | Mercury Systems, Inc. | 17,781,300 |
728,500 | 1 | Montrose Environmental Group, Inc. | 49,938,675 |
620,000 | 1,2 | Plug Power, Inc. | 23,727,400 |
1,194,331 | 1 | Quest Resource Holding Corp. | 6,951,007 |
1,500,000 | 1 | RADA Electronic Industries Ltd. | 15,345,000 |
725,600 | 1 | Trex Co., Inc. | 77,203,840 |
1,305,000 | 1 | Upwork, Inc. | 61,491,600 |
800,000 | 1 | XPO Logistics, Inc. | 68,640,000 |
TOTAL | 979,813,922 | ||
Information Technology— 23.1% | |||
610,000 | 1 | Alarm.com Holdings, Inc. | 51,398,600 |
1,450,000 | 1 | Allegro MicroSystems, Inc. | 48,372,000 |
400,000 | 1,2 | Alteryx, Inc. | 29,276,000 |
1,200,000 | 1 | Anaplan, Inc. | 78,252,000 |
150,000 | 1 | Avalara, Inc. | 26,946,000 |
2,500,000 | 1 | AvePoint, Inc. | 23,300,000 |
1,000,000 | 1,2 | AvidXchange Holdings, Inc. | 22,230,000 |
350,000 | 2 | Bentley Systems, Inc. | 20,702,500 |
397,500 | 1 | Blackline, Inc. | 50,430,825 |
2,100,000 | 1 | Camtek Ltd. | 81,627,000 |
597,761 | 1,2 | Cerence, Inc. | 62,842,614 |
500,000 | 1 | CloudFlare, Inc. | 97,360,000 |
500,000 | 1 | CS Disco, Inc. | 28,675,000 |
250,359 | 1,2 | Datto Holding Corp. | 5,983,580 |
500,000 | 1 | Docebo, Inc. | 37,530,000 |
123,600 | 1 | DocuSign, Inc. | 34,396,644 |
1,400,000 | 1 | Domo, Inc. | 123,690,000 |
390,000 | 1 | Endava PLC, ADR | 61,799,400 |
205,000 | 1 | EngageSmart, Inc. | 6,873,650 |
930,500 | 1 | Envestnet, Inc. | 77,696,750 |
490,000 | 1 | Everbridge, Inc. | 78,061,900 |
400,000 | 1 | GDS Holdings Ltd., ADR | 23,760,000 |
450,000 | 1,2 | GoDaddy, Inc. | 31,126,500 |
1,700,000 | 1 | Grid Dynamics Holdings, Inc. | 48,875,000 |
2,580,983 | 1 | International Money Express, Inc. | 43,205,655 |
Shares | Value | ||
COMMON STOCKS— continued | |||
Information Technology— continued | |||
697,600 | 1,2 | Jamf Holding Corp. | $33,240,640 |
540,616 | 1 | Kaltura, Inc. | 5,103,415 |
1,100,000 | 1,2 | LivePerson, Inc. | 56,661,000 |
1,392,920 | 1 | Livevox Holdings, Inc. | 8,482,883 |
1,793,385 | 1 | Magnachip Semiconductor Corp. | 34,002,580 |
841,938 | 1 | Nordic Semiconductor ASA | 24,987,556 |
425,600 | 1 | Novoste Corp. | 73,441,536 |
790,000 | 1,2 | Nuvei Corp. | 95,131,800 |
700,000 | 1 | Q2 Holdings, Inc. | 54,922,000 |
1,030,000 | 1,2 | Rapid7, Inc. | 132,612,500 |
1,000,000 | 1 | Riskified Ltd. | 19,340,000 |
640,000 | 1 | SailPoint Technologies Holding | 30,707,200 |
372,000,000 | 1 | Seeing Machines Ltd. | 51,861,087 |
250,000 | 1 | Shift4 Payments, Inc. | 15,782,500 |
34,300 | 1 | Shopify, Inc. | 50,308,839 |
1,120,000 | 1,2 | ShotSpotter, Inc. | 43,579,200 |
926,500 | 1 | Smartsheet, Inc. | 63,937,765 |
1,195,000 | 1 | Sumo Logic, Inc. | 20,637,650 |
2,824,200 | 1,2 | SunPower Corp. | 95,062,572 |
78,200 | 1 | Tyler Technologies, Inc. | 42,479,804 |
350,000 | 1 | Varonis Systems, Inc. | 22,659,000 |
2,070,000 | 1 | WM Technology, Inc. | 25,336,800 |
200,000 | 1 | Zscaler, Inc. | 63,772,000 |
TOTAL | 2,258,461,945 | ||
Materials— 3.0% | |||
1,000,000 | 1 | Danimer Scientific LLC | 14,760,000 |
750,800 | Eagle Materials, Inc. | 111,388,688 | |
2,500,000 | 1,2 | Livent Corp. | 70,550,000 |
175,000 | Scotts Miracle-Gro Co. | 25,980,500 | |
1,350,000 | 1,2 | SilverCrest Metals, Inc. | 12,150,000 |
643,800 | Westlake Chemical Corp. | 62,667,492 | |
TOTAL | 297,496,680 | ||
Real Estate— 4.2% | |||
1,573,247 | Americold Realty Trust | 46,363,589 | |
1,830,000 | Easterly Government Properties, Inc. | 38,484,900 | |
625,000 | Lamar Advertising Co. | 70,750,000 | |
2,110,000 | MGM Growth Properties LLC | 83,091,800 | |
240,000 | National Storage Affiliates Trust | 14,990,400 | |
970,000 | 1 | Ryman Hospitality Properties | 82,973,800 |
Shares | Value | ||
COMMON STOCKS— continued | |||
Real Estate— continued | |||
1,775,000 | STAG Industrial, Inc. | $77,265,750 | |
TOTAL | 413,920,239 | ||
TOTAL COMMON STOCKS (IDENTIFIED COST $5,392,440,549) | 9,640,780,472 | ||
WARRANTS— 0.2% | |||
Financials— 0.0% | |||
333,333 | 1 | FirstMark Horizon Acquisition Corp., Warrants 9/26/2025 | 433,333 |
333,333 | 1 | Hamilton Lane Alliance Holdings I, Inc., Warrants 1/8/2026 | 243,333 |
250,000 | 1 | SCVX Corp., Warrants 1/24/2025 | 200,000 |
TOTAL | 876,666 | ||
Health Care— 0.2% | |||
176,600 | 1 | Catabasis Pharmaceuticals, Inc., Warrants 6/22/2022 | 33,183 |
129,500 | 1 | Catabasis Pharmaceuticals, Inc., Warrants 2/8/2024 | 58,210 |
467,500 | 1 | ContraFect Corp., Warrants 7/20/2022 | 93 |
2,247,188 | 1 | ContraFect Corp., Warrants 5/27/2023 | 1,524,492 |
187,500 | 1 | Dynavax Technologies Corp., Warrants 2/12/2022 | 2,904,206 |
193,334 | 1 | Rezolute, Inc., Warrants 10/8/2027 | 1,071,090 |
64,800 | 1 | Rezolute, Inc., Warrants 1/1/2099 | 414,720 |
720,500 | 1 | Scynexis, Inc., Warrants 12/21/2021 | 5,332 |
200,000 | 1 | Immatics N.V., Warrants 12/31/2025 | 920,000 |
15,480 | 1 | Scynexis, Inc., Warrants 3/8/2023 | 2,324 |
720,500 | 1 | Scynexis, Inc., Warrants 5/21/2024 | 1,073,545 |
1,441,000 | 1 | Scynexis, Inc., Warrants 1/1/2099 | 7,219,410 |
1,111,111 | 1 | Scynexis, Inc., Warrants 6/12/2023 | 0 |
100,000 | 1 | Talkspace, Inc., Warrants 6/21/2025 | 67,000 |
TOTAL | 15,293,605 | ||
TOTAL WARRANTS (IDENTIFIED COST $11,670,756) | 16,170,271 | ||
INVESTMENT COMPANIES— 8.1% | |||
118,231,170 | Federated Hermes Government Obligations Fund, Premier Shares, 0.03%5 | 118,231,170 | |
674,811,590 | Federated Hermes Institutional Prime Value Obligations Fund, Institutional Shares, 0.02%5 | 674,899,307 | |
TOTAL INVESTMENT COMPANIES (IDENTIFIED COST $793,121,513) | 793,130,477 | ||
TOTAL INVESTMENT IN SECURITIES—106.7% (IDENTIFIED COST $6,197,232,818)6 | 10,450,081,220 | ||
OTHER ASSETS AND LIABILITIES - NET—(6.7)%7 | (658,872,500) | ||
TOTAL NET ASSETS—100% | $9,791,208,720 |
Value as of 10/31/2020 | Purchases at Cost* | Proceeds from Sales* | |
Consumer Discretionary: | |||
CTOS LLC | $— | $20,000,000 | $— |
Lovesac Co./The** | $16,216,200 | $1,370,293 | $(3,991,328) |
Xponential Fitness, Inc. | $— | $17,325,515 | $— |
Energy: | |||
New Fortress Energy, Inc.** | $48,818,856 | $22,860,709 | $(1,372,273) |
Financials: | |||
BCLS Acquisition Corp. | $10,320,000 | $— | $— |
Hamilton Lane, Inc.** | $55,760,000 | $17,389,713 | $— |
Hamilton Lane Alliance Holdings I, Inc., Warrants 1/8/2026 | $— | $10,315,400 | $(9,612,330) |
Omega Alpha SPAC | $— | $10,000,000 | $— |
P10, Inc. | $— | $33,370,380 | $— |
StepStone Group, Inc. | $15,253,434 | $41,865,983 | $(6,739,168) |
Health Care: | |||
Akouos, Inc. | $18,895,635 | $6,203,322 | $(548,231) |
Albireo Pharma, Inc. | $30,546,924 | $1,139,005 | $— |
Alector, Inc. | $20,937,250 | $5,267,281 | $(2,118,872) |
Amphastar Pharmaceuticals, Inc. | $25,452,249 | $15,451,840 | $(2,040,261) |
AnaptysBio, Inc. | $29,460,000 | $3,200,821 | $(4,847,564) |
Annexon, Inc. | $20,248,130 | $463,360 | $— |
Arcturus Therapeutics Holdings, Inc. | $43,209,920 | $48,902,466 | $(4,967,388) |
Argenx SE** | $142,672,985 | $— | $(1,927,837) |
Argenx SE, ADR** | $61,836,725 | $6,380,480 | $(7,531,244) |
aTyr Pharma, Inc. | $5,119,550 | $9,637,667 | $— |
Avidity Biosciences LLC | $18,151,820 | $12,987,218 | $— |
Avrobio, Inc. | $7,423,701 | $13,426,820 | $(1,353,894) |
ContraFect Corp., Warrants 7/20/2022 | $37,260 | $— | $— |
Calithera Biosciences, Inc. | $14,018,400 | $— | $— |
CASI Pharmaceuticals, Inc. | $16,215,000 | $8,211,177 | $(321,028) |
Catabasis Pharmaceuticals, Inc., Warrants 2/8/2024** | $81,313 | $— | $— |
Catabasis Pharmaceuticals, Inc., Warrants 6/22/2022** | $64,335 | $— | $— |
Cerevel Therapeutics Holdings** | $8,755,000 | $22,345,770 | $— |
ContraFect Corp. | $29,929,112 | $5,576,000 | $— |
ContraFect Corp., Warrants 5/27/2023 | $6,083,812 | $— | $— |
DermTech, Inc.** | $15,501,639 | $— | $(14,782,385) |
Dynavax Technologies Corp. | $17,997,250 | $22,496,876 | $(2,811,874) |
Dynavax Technologies Corp., Warrants 2/12/2022 | $347,194 | $— | $— |
Frequency Therapeutics, Inc. | $11,640,160 | $8,523,593 | $(5,330,854) |
Frequency Therapeutics, Inc. | $3,894,640 | $— | $— |
IDEAYA Biosciences, Inc. | $8,342,535 | $9,564,944 | $— |
Merus NV | $18,757,200 | $12,500,778 | $(1,915,138) |
Minerva Neurosciences, Inc. | $13,714,404 | $— | $— |
Molecular Partners AG | $19,109,645 | $— | $— |
Otonomy, Inc. | $6,354,500 | $— | $— |
Rezolute, Inc. | $11,547,734 | $6,749,280 | $— |
Rezolute, Inc., Warrants 10/8/2027 | $3,483,696 | $— | $— |
Change in Unrealized Appreciation/ Depreciation | Net Realized Gain/ (Loss)* | Value as of 10/31/2021 | Shares Held as of 10/31/2021 | Dividend Income* |
$16,200,000 | $— | $36,200,000 | 4,000,000 | $— |
$31,786,949 | $2,047,966 | $47,430,080 | 608,000 | $— |
$7,432,985 | $— | $24,758,500 | 1,465,000 | $— |
$(14,482,430) | $(1,472,932) | $54,351,930 | 1,811,731 | $713,358 |
$(410,000) | $— | $9,910,000 | 1,000,000 | $— |
$31,360,287 | $— | $104,510,000 | 1,000,000 | $1,262,500 |
$2,108 | $(461,845) | $243,333 | 333,333 | $— |
$(230,000) | $— | $9,770,000 | 1,000,000 | $— |
$1,335,907 | $— | $34,706,287 | 2,776,503 | $— |
$34,110,685 | $(396,734) | $84,094,200 | 1,790,000 | $327,373 |
$(12,133,224) | $(450,575) | $11,966,927 | 1,284,005 | $— |
$(2,465,929) | $— | $29,220,000 | 1,000,000 | $— |
$27,710,569 | $(381,128) | $51,415,100 | 2,365,000 | $— |
$(1,455,949) | $(47,879) | $37,360,000 | 2,000,000 | $— |
$12,772,197 | $(10,428,821) | $30,156,633 | 916,615 | $— |
$(4,401,490) | $— | $16,310,000 | 1,000,000 | $— |
$(12,787,250) | $(14,282,612) | $60,075,136 | 1,336,488 | $— |
$29,550,094 | $537,549 | $170,832,791 | 567,000 | $— |
$12,080,952 | $518,779 | $73,285,692 | 242,700 | $— |
$10,153,783 | $— | $24,911,000 | 2,900,000 | $— |
$(1,439,038) | $— | $29,700,000 | 1,320,000 | $— |
$(10,222,705) | $(1,473,002) | $7,800,920 | 1,388,064 | $— |
$(37,167) | $— | $93 | 467,500 | $— |
$(6,375,600) | $— | $7,642,800 | 3,960,000 | $— |
$(12,941,043) | $(202,106) | $10,962,000 | 10,150,000 | $— |
$(48,130) | $— | $33,183 | 176,600 | $— |
$(6,125) | $— | $58,210 | 129,500 | $— |
$66,068,258 | $— | $97,169,028 | 2,390,382 | $— |
$(11,330,409) | $— | $24,174,703 | 6,412,388 | $— |
$(4,559,320) | $— | $1,524,492 | 2,247,188 | $— |
$8,445,609 | $8,757,865 | $17,922,728 | 655,310 | $— |
$116,241,677 | $(1,564,811) | $152,359,118 | 7,629,400 | $— |
$2,557,012 | $— | $2,904,206 | 187,500 | $— |
$(6,659,584) | $(1,893,315) | $6,280,000 | 1,000,000 | $— |
$(2,776,800) | $— | $1,117,840 | 178,000 | $— |
$9,053,321 | $— | $26,960,800 | 1,257,500 | $— |
$24,685,272 | $(312,362) | $53,715,750 | 1,915,000 | $— |
$(7,733,044) | $— | $5,981,360 | 4,272,400 | $— |
$(2,703,456) | $— | $16,406,189 | 873,312 | $— |
$(2,627,000) | $— | $3,727,500 | 1,775,000 | $— |
$(7,897,014) | $— | $10,400,000 | 1,625,000 | $— |
$(2,412,606) | $— | $1,071,090 | 193,334 | $— |
Value as of 10/31/2020 | Purchases at Cost* | Proceeds from Sales* | |
Health Care—continued | |||
Rhythm Pharmaceuticals, Inc. | $25,933,250 | $18,313,614 | $(6,594,259) |
Scynexis, Inc. | $5,943,200 | $1,749,301 | $— |
Scynexis, Inc., Warrants 3/8/2023 | $5,372 | $— | $— |
Ultragenyx Pharmaceutical, Inc. | $145,363,200 | $13,753,887 | $(4,794,830) |
UniQure N.V. | $55,550,820 | $10,594,465 | $(6,885,041) |
Industrials: | |||
Aris Water Solutions, Inc. | $— | $16,469,765 | $— |
Meltwater Holding BV** | $— | $40,171,232 | $(24,431,428) |
Quest Resource Holding Corp. | $4,696,500 | $— | $(6,444,434) |
Information Technology: | |||
Allegro MicroSystems, Inc.** | $8,235,000 | $30,300,000 | $— |
Camtek Ltd.** | $39,337,200 | $5,950,000 | $(17,350,047) |
Domo, Inc. | $31,770,000 | $23,429,921 | $— |
Grid Dynamics Holdings, Inc.** | $21,407,880 | $7,515,000 | $(43,493,356) |
International Money Express, Inc. | $38,948,000 | $— | $(3,854,642) |
Livevox Holdings, Inc. | $— | $20,000,000 | $(4,036,847) |
Magnachip Semiconductor Corp.** | $40,516,979 | $— | $(21,610,092) |
Seeing Machines Ltd. | $22,611,478 | $— | $— |
ShotSpotter, Inc. | $29,016,900 | $4,813,448 | $— |
WM Technology, Inc. | $— | $20,700,000 | $— |
Materials: | |||
Danimer Scientific LLC | $— | $10,000,000 | $— |
Affiliated Issuers no longer in the portfolio at period end | $21,495,160 | $— | $(21,382,860) |
TOTAL OF AFFILIATED COMPANIES TRANSACTIONS | $1,267,029,147 | $617,287,324 | $(233,089,505) |
Change in Unrealized Appreciation/ Depreciation | Net Realized Gain/ (Loss)* | Value as of 10/31/2021 | Shares Held as of 10/31/2021 | Dividend Income* |
$(13,904,459) | $(8,209,646) | $15,538,500 | 1,350,000 | $— |
$303,629 | $— | $7,996,130 | 1,596,034 | $— |
$(3,048) | $— | $2,324 | 15,480 | $— |
$(26,081,927) | $618,830 | $128,859,160 | 1,535,500 | $— |
$(9,587,361) | $(7,014,883) | $42,658,000 | 1,400,000 | $— |
$617,735 | $— | $17,087,500 | 1,250,000 | $— |
$(719,720) | $(1,120,956) | $13,899,128 | 2,998,592 | $— |
$4,746,510 | $3,952,431 | $6,951,007 | 1,194,331 | $— |
$9,837,000 | $— | $48,372,000 | 1,450,000 | $— |
$43,843,926 | $9,845,921 | $81,627,000 | 2,100,000 | $— |
$68,490,079 | $— | $123,690,000 | 1,400,000 | $— |
$38,668,004 | $24,777,472 | $48,875,000 | 1,700,000 | $— |
$7,214,384 | $897,913 | $43,205,655 | 2,580,983 | $— |
$(5,446,317) | $(2,033,953) | $8,482,883 | 1,392,920 | $— |
$7,740,995 | $7,354,698 | $34,002,580 | 1,793,385 | $— |
$29,249,609 | $— | $51,861,087 | 372,000,000 | $— |
$9,748,852 | $— | $43,579,200 | 1,120,000 | $— |
$4,636,800 | $— | $25,336,800 | 2,070,000 | $— |
$4,760,000 | $— | $14,760,000 | 1,000,000 | $— |
$(664,677) | $552,377 | $— | — | $— |
$486,862,366 | $8,114,241 | $2,146,203,573 | 479,546,978 | $2,303,231 |
* | A portion of the amount shown was recorded when the Fund no longer had ownership of at least 5% of the voting shares. |
** | At October 31, 2021, the Fund no longer has ownership of at least 5% of the voting shares. |
Federated Hermes Government Obligations Fund, Premier Shares* | Federated Hermes Institutional Prime Value Obligations Fund, Institutional Shares* | Total of Affiliated Transactions | |
Value as of 10/31/2020 | $172,535,373 | $1,462,347,998 | $1,634,883,371 |
Purchases at Cost | $1,831,023,329 | $3,628,484,495 | $5,459,507,824 |
Proceeds from Sales | $(1,885,327,532) | $(4,415,812,528) | $(6,301,140,060) |
Change in Unrealized Appreciation/ Depreciation | N/A | $(307,729) | $(307,729) |
Net Realized Gain/(Loss) | N/A | $187,071 | $187,071 |
Value as of 10/31/2021 | $118,231,170 | $674,899,307 | $793,130,477 |
Shares Held as of 10/31/2021 | 118,231,170 | 674,811,590 | 793,042,760 |
Dividend Income | $34,848 | $776,719 | $811,567 |
* | All or a portion of the balance/activity for the fund relates to cash collateral received on securities lending transactions. |
1 | Non-income-producing security. |
2 | All or a portion of these securities are temporarily on loan to unaffiliated broker/dealers. |
3 | Denotes a restricted security that either: (a) cannot be offered for public sale without first being registered, or availing of an exemption from registration, under the Securities Act of 1933; or (b) is subject to a contractual restriction on public sales. At October 31, 2021, these restricted securities amounted to $22,934,200, which represented 0.2% of total net assets. |
4 | Market quotations and price evaluations are not available. Fair value determined using significant unobservable inputs in accordance with procedures established by and under the general supervision of the Fund’s Board of Trustees (the “Trustees”). |
5 | 7-day net yield. |
6 | The cost of investments for federal tax purposes amounts to $6,223,546,696. |
7 | Assets, other than investments in securities, less liabilities. See Statement of Assets and Liabilities. |
The following is a summary of the inputs used, as of October 31, 2021, in valuing the Fund’s assets carried at fair value:
Valuation Inputs | ||||
Level 1— Quoted Prices | Level 2— Other Significant Observable Inputs | Level 3— Significant Unobservable Inputs | Total | |
Equity Securities: | ||||
Common Stocks | ||||
Domestic | $8,076,243,120* | $— | $32,736,038 | $8,108,979,158 |
International | 1,018,677,806 | 502,201,745 | 10,921,763 | 1,531,801,314 |
Debt Securities: | ||||
Warrants | 2,278,386 | 13,891,885** | — | 16,170,271 |
Investment Companies | 793,130,477 | — | — | 793,130,477 |
TOTAL SECURITIES | $9,890,329,789 | $516,093,630 | $43,657,801 | $10,450,081,220 |
* | Includes $19,567,792 transferred from Level 3 to Level 1 because fair values were determined using valuation techniques utilizing a quotable price in an active market. This transfer represents the value of the securities at the beginning of the period. |
** | Includes $3,483,696 transferred from Level 3 to Level 2 because fair values were determined using valuation techniques utilizing observable market data. This transfer represents the value of the security at the beginning of the period. |
The following acronym(s) are used throughout this portfolio: | ||
ADR | —American Depositary Receipt | |
Year Ended October 31, | |||||
2021 | 2020 | 2019 | 2018 | 2017 | |
Net Asset Value, Beginning of Period | $49.86 | $40.09 | $36.01 | $32.58 | $23.94 |
Income From Investment Operations: | |||||
Net investment income (loss)1 | (0.58) | (0.29) | 0.01 | (0.13) | (0.27) |
Net realized and unrealized gain (loss) | 21.07 | 10.16 | 6.14 | 5.65 | 9.10 |
Total From Investment Operations | 20.49 | 9.87 | 6.15 | 5.52 | 8.83 |
Less Distributions: | |||||
Distributions from net investment income | — | (0.02) | — | — | — |
Distributions from net realized gain | (0.08) | (0.08) | (2.07) | (2.09) | (0.19) |
Total Distributions | (0.08) | (0.10) | (2.07) | (2.09) | (0.19) |
Net Asset Value, End of Period | $70.27 | $49.86 | $40.09 | $36.01 | $32.58 |
Total Return2 | 41.12% | 24.64% | 17.96% | 18.10% | 37.12% |
Ratios to Average Net Assets: | |||||
Net expenses3 | 1.35% | 1.35% | 1.36% | 1.35% | 1.85% |
Net investment income (loss) | (0.89)% | (0.64)% | 0.03% | (0.37)% | (0.95)% |
Expense waiver/reimbursement4 | 0.12% | 0.15% | 0.16% | 0.17% | 0.13% |
Supplemental Data: | |||||
Net assets, end of period (000 omitted) | $1,452,855 | $1,068,689 | $826,240 | $580,003 | $401,920 |
Portfolio turnover5 | 34% | 20% | 33% | 39% | 46% |
1 | Per share numbers have been calculated using the average shares method. |
2 | Based on net asset value, which does not reflect the sales charge, redemption fee or contingent deferred sales charge, if applicable. |
3 | Amount does not reflect net expenses incurred by investment companies in which the Fund may invest. |
4 | This expense decrease is reflected in both the net expense and the net investment income (loss) ratios shown above. Amount does not reflect expense waiver/reimbursement recorded by investment companies in which the Fund may invest. |
5 | Securities that mature are considered sales for purposes of this calculation. |
Year Ended October 31, | |||||
2021 | 2020 | 2019 | 2018 | 2017 | |
Net Asset Value, Beginning of Period | $42.02 | $33.99 | $31.02 | $28.52 | $21.10 |
Income From Investment Operations: | |||||
Net investment income (loss)1 | (0.81) | (0.47) | (0.21) | (0.31) | (0.37) |
Net realized and unrealized gain (loss) | 17.72 | 8.58 | 5.25 | 4.90 | 7.98 |
Total From Investment Operations | 16.91 | 8.11 | 5.04 | 4.59 | 7.61 |
Less Distributions: | |||||
Distributions from net realized gain | (0.08) | (0.08) | (2.07) | (2.09) | (0.19) |
Net Asset Value, End of Period | $58.85 | $42.02 | $33.99 | $31.02 | $28.52 |
Total Return2 | 40.27% | 23.89% | 17.23% | 17.36% | 36.33% |
Ratios to Average Net Assets: | |||||
Net expenses3 | 1.96% | 1.98% | 1.98% | 1.99% | 2.42% |
Net investment income (loss) | (1.49)% | (1.25)% | (0.62)% | (1.01)% | (1.52)% |
Expense waiver/reimbursement4 | 0.02% | 0.04% | 0.04% | 0.07% | 0.12% |
Supplemental Data: | |||||
Net assets, end of period (000 omitted) | $14,501 | $14,313 | $15,488 | $16,445 | $17,420 |
Portfolio turnover5 | 34% | 20% | 33% | 39% | 46% |
1 | Per share numbers have been calculated using the average shares method. |
2 | Based on net asset value, which does not reflect the sales charge, redemption fee or contingent deferred sales charge, if applicable. |
3 | Amount does not reflect net expenses incurred by investment companies in which the Fund may invest. |
4 | This expense decrease is reflected in both the net expense and the net investment income (loss) ratios shown above. Amount does not reflect expense waiver/reimbursement recorded by investment companies in which the Fund may invest. |
5 | Securities that mature are considered sales for purposes of this calculation. |
Year Ended October 31, | |||||
2021 | 2020 | 2019 | 2018 | 2017 | |
Net Asset Value, Beginning of Period | $42.03 | $34.01 | $31.03 | $28.53 | $21.10 |
Income From Investment Operations: | |||||
Net investment income (loss)1 | (0.83) | (0.49) | (0.19) | (0.31) | (0.37) |
Net realized and unrealized gain (loss) | 17.75 | 8.59 | 5.24 | 4.90 | 7.99 |
Total From Investment Operations | 16.92 | 8.10 | 5.05 | 4.59 | 7.62 |
Less Distributions: | |||||
Distributions from net realized gain | (0.08) | (0.08) | (2.07) | (2.09) | (0.19) |
Net Asset Value, End of Period | $58.87 | $42.03 | $34.01 | $31.03 | $28.53 |
Total Return2 | 40.28% | 23.84% | 17.25% | 17.36% | 36.38% |
Ratios to Average Net Assets: | |||||
Net expenses3 | 1.97% | 1.98% | 1.97% | 1.97% | 2.41% |
Net investment income (loss) | (1.51)% | (1.28)% | (0.57)% | (1.00)% | (1.50)% |
Expense waiver/reimbursement4 | 0.02% | 0.04% | 0.05% | 0.07% | 0.08% |
Supplemental Data: | |||||
Net assets, end of period (000 omitted) | $410,961 | $289,794 | $204,247 | $117,888 | $151,959 |
Portfolio turnover5 | 34% | 20% | 33% | 39% | 46% |
1 | Per share numbers have been calculated using the average shares method. |
2 | Based on net asset value, which does not reflect the sales charge, redemption fee or contingent deferred sales charge, if applicable. |
3 | Amount does not reflect net expenses incurred by investment companies in which the Fund may invest. |
4 | This expense decrease is reflected in both the net expense and the net investment income (loss) ratios shown above. Amount does not reflect expense waiver/reimbursement recorded by investment companies in which the Fund may invest. |
5 | Securities that mature are considered sales for purposes of this calculation. |
Year Ended October 31, | |||||
2021 | 2020 | 2019 | 2018 | 2017 | |
Net Asset Value, Beginning of Period | $50.12 | $40.29 | $36.17 | $32.70 | $24.02 |
Income From Investment Operations: | |||||
Net investment income (loss)1 | (0.57) | (0.28) | 0.03 | (0.12) | (0.25) |
Net realized and unrealized gain (loss) | 21.18 | 10.22 | 6.16 | 5.68 | 9.12 |
Total From Investment Operations | 20.61 | 9.94 | 6.19 | 5.56 | 8.87 |
Less Distributions: | |||||
Distributions from net investment income | — | (0.03) | — | — | — |
Distributions from net realized gain | (0.08) | (0.08) | (2.07) | (2.09) | (0.19) |
Total Distributions | (0.08) | (0.11) | (2.07) | (2.09) | (0.19) |
Net Asset Value, End of Period | $70.65 | $50.12 | $40.29 | $36.17 | $32.70 |
Total Return2 | 41.14% | 24.71% | 17.99% | 18.15% | 37.17% |
Ratios to Average Net Assets: | |||||
Net expenses3 | 1.34% | 1.31% | 1.31% | 1.32% | 1.80% |
Net investment income (loss) | (0.87)% | (0.61)% | 0.08% | (0.33)% | (0.91)% |
Expense waiver/reimbursement4 | 0.32% | 0.34% | 0.34% | 0.37% | 0.32% |
Supplemental Data: | |||||
Net assets, end of period (000 omitted) | $263,675 | $188,549 | $120,487 | $78,387 | $47,497 |
Portfolio turnover5 | 34% | 20% | 33% | 39% | 46% |
1 | Per share numbers have been calculated using the average shares method. |
2 | Based on net asset value. |
3 | Amount does not reflect net expenses incurred by investment companies in which the Fund may invest. |
4 | This expense decrease is reflected in both the net expense and the net investment income (loss) ratios shown above. Amount does not reflect expense waiver/reimbursement recorded by investment companies in which the Fund may invest. |
5 | Securities that mature are considered sales for purposes of this calculation. |
Year Ended October 31, | |||||
2021 | 2020 | 2019 | 2018 | 2017 | |
Net Asset Value, Beginning of Period | $50.90 | $40.86 | $36.50 | $32.85 | $24.03 |
Income From Investment Operations: | |||||
Net investment income (loss)1 | (0.29) | (0.10) | 0.22 | 0.04 | (0.14) |
Net realized and unrealized gain (loss) | 21.54 | 10.37 | 6.21 | 5.70 | 9.15 |
Total From Investment Operations | 21.25 | 10.27 | 6.43 | 5.74 | 9.01 |
Less Distributions: | |||||
Distributions from net investment income | — | (0.15) | — | — | — |
Distributions from net realized gain | (0.08) | (0.08) | (2.07) | (2.09) | (0.19) |
Total Distributions | (0.08) | (0.23) | (2.07) | (2.09) | (0.19) |
Net Asset Value, End of Period | $72.07 | $50.90 | $40.86 | $36.50 | $32.85 |
Total Return2 | 41.77% | 25.20% | 18.51% | 18.65% | 37.74% |
Ratios to Average Net Assets: | |||||
Net expenses3 | 0.89% | 0.89% | 0.90% | 0.89% | 1.35% |
Net investment income (loss) | (0.43)% | (0.21)% | 0.56% | 0.11% | (0.50)% |
Expense waiver/reimbursement4 | 0.10% | 0.12% | 0.12% | 0.12% | 0.10% |
Supplemental Data: | |||||
Net assets, end of period (000 omitted) | $6,454,097 | $5,114,974 | $2,339,131 | $735,235 | $215,907 |
Portfolio turnover5 | 34% | 20% | 33% | 39% | 46% |
1 | Per share numbers have been calculated using the average shares method. |
2 | Based on net asset value. |
3 | Amount does not reflect net expenses incurred by investment companies in which the Fund may invest. |
4 | This expense decrease is reflected in both the net expense and the net investment income (loss) ratios shown above. Amount does not reflect expense waiver/reimbursement recorded by investment companies in which the Fund may invest. |
5 | Securities that mature are considered sales for purposes of this calculation. |
Year Ended October 31, | Period Ended 10/31/20171 | ||||
2021 | 2020 | 2019 | 2018 | ||
Net Asset Value, Beginning of Period | $50.51 | $40.51 | $36.20 | $32.60 | $30.50 |
Income From Investment Operations: | |||||
Net investment income (loss)2 | (0.29) | (0.10) | 0.25 | 0.06 | (0.01) |
Net realized and unrealized gain (loss) | 21.38 | 10.30 | 6.13 | 5.63 | 2.11 |
Total From Investment Operations | 21.09 | 10.20 | 6.38 | 5.69 | 2.10 |
Less Distributions: | |||||
Distributions from net investment income | — | (0.12) | — | — | — |
Distributions from net realized gain | (0.08) | (0.08) | (2.07) | (2.09) | — |
Total Distributions | (0.08) | (0.20) | (2.07) | (2.09) | — |
Net Asset Value, End of Period | $71.52 | $50.51 | $40.51 | $36.20 | $32.60 |
Total Return3 | 41.78% | 25.24% | 18.53% | 18.64% | 6.89% |
Ratios to Average Net Assets: | |||||
Net expenses4 | 0.88% | 0.88% | 0.88% | 0.88% | 0.88%5 |
Net investment income (loss) | (0.43)% | (0.21)% | 0.63% | 0.16% | (0.11)%5 |
Expense waiver/reimbursement6 | 0.02% | 0.04% | 0.04% | 0.07% | 0.12%5 |
Supplemental Data: | |||||
Net assets, end of period (000 omitted) | $1,195,120 | $651,978 | $195,775 | $29,623 | $58 |
Portfolio turnover7 | 34% | 20% | 33% | 39% | 46%8 |
1 | Reflects operations for the period from September 1, 2017 (start of performance) to October 31, 2017. |
2 | Per share numbers have been calculated using the average shares method. |
3 | Based on net asset value. Total returns for periods of less than one year are not annualized. |
4 | Amount does not reflect net expenses incurred by investment companies in which the Fund may invest. |
5 | Computed on an annualized basis. |
6 | This expense decrease is reflected in both the net expense and the net investment income (loss) ratios shown above. Amount does not reflect expense waiver/reimbursement recorded by investment companies in which the Fund may invest. |
7 | Securities that mature are considered sales for purposes of this calculation. |
8 | Portfolio turnover is calculated at the Fund level. Percentage indicated was calculated for the year ended October 31, 2017. |
October 31, 2021
Assets: | |
Investment in securities, at value including $626,544,750 of securities loaned and $793,130,477 of investment in affiliated holdings and $2,146,203,573 of investment in affiliated companies* (identified cost $6,197,232,818) | $10,450,081,220 |
Cash denominated in foreign currencies (identified cost $114,654) | 114,661 |
Income receivable | 214,478 |
Income receivable from affiliated holdings | 5,036 |
Receivable for investments sold | 27,923,789 |
Receivable for shares sold | 3,235,971 |
Total Assets | 10,481,575,155 |
Liabilities: | |
Payable for investments purchased | 29,751,879 |
Payable for shares redeemed | 10,964,092 |
Bank overdraft | 8,621,940 |
Payable for collateral due to broker for securities lending (Note 2) | 637,565,528 |
Payable to adviser (Note 5) | 617,562 |
Payable for administrative fee (Note 5) | 62,726 |
Payable for Directors’/Trustees’ fees (Note 5) | 2,068 |
Payable for distribution services fee (Note 5) | 547,307 |
Payable for other service fees (Notes 2 and 5) | 688,323 |
Accrued expenses (Note 5) | 1,545,010 |
Total Liabilities | 690,366,435 |
Net assets for 137,898,935 shares outstanding | $9,791,208,720 |
Net Assets Consist of: | |
Paid-in capital | $4,894,984,720 |
Total distributable earnings (loss) | 4,896,224,000 |
Total Net Assets | $9,791,208,720 |
Net Asset Value, Offering Price and Redemption Proceeds Per Share: | |
Class A Shares: | |
Net asset value per share ($1,452,855,020 ÷ 20,675,465 shares outstanding), no par value, unlimited shares authorized | $70.27 |
Offering price per share (100/94.50 of $70.27) | $74.36 |
Redemption proceeds per share | $70.27 |
Class B Shares: | |
Net asset value per share ($14,501,392 ÷ 246,428 shares outstanding), no par value, unlimited shares authorized | $58.85 |
Offering price per share | $58.85 |
Redemption proceeds per share (94.50/100 of $58.85) | $55.61 |
Class C Shares: | |
Net asset value per share ($410,961,249 ÷ 6,981,330 shares outstanding), no par value, unlimited shares authorized | $58.87 |
Offering price per share | $58.87 |
Redemption proceeds per share (99.00/100 of $58.87) | $58.28 |
Class R Shares: | |
Net asset value per share ($263,674,512 ÷ 3,732,216 shares outstanding), no par value, unlimited shares authorized | $70.65 |
Offering price per share | $70.65 |
Redemption proceeds per share | $70.65 |
Institutional Shares: | |
Net asset value per share ($6,454,096,562 ÷ 89,553,042 shares outstanding), no par value, unlimited shares authorized | $72.07 |
Offering price per share | $72.07 |
Redemption proceeds per share | $72.07 |
Class R6 Shares: | |
Net asset value per share ($1,195,119,985 ÷ 16,710,454 shares outstanding), no par value, unlimited shares authorized | $71.52 |
Offering price per share | $71.52 |
Redemption proceeds per share | $71.52 |
* | See information listed after the Fund’s Portfolio of Investments. |
Year Ended October 31, 2021
Investment Income: | |
Dividends (including $2,590,284 received from affiliated companies and holdings* and net of foreign taxes withheld of $340,125) | $41,449,783 |
Net income on securities loaned (includes $524,514 received from affiliated holdings related to cash collateral balances*) (Note 2) | 3,965,280 |
Interest | 134,050 |
TOTAL INCOME | 45,549,113 |
Expenses: | |
Investment adviser fee (Note 5) | 78,548,045 |
Administrative fee (Note 5) | 7,676,523 |
Custodian fees | 651,384 |
Transfer agent fees (Note 2) | 8,920,904 |
Directors’/Trustees’ fees (Note 5) | 49,626 |
Auditing fees | 40,800 |
Legal fees | 11,029 |
Portfolio accounting fees | 224,682 |
Distribution services fee (Note 5) | 7,868,806 |
Other service fees (Notes 2 and 5) | 4,521,958 |
Share registration costs | 285,480 |
Printing and postage | 401,525 |
Miscellaneous (Note 5) | 66,224 |
TOTAL EXPENSES | 109,266,986 |
Waivers and Reimbursements: | |
Waiver/reimbursement of investment adviser fee (Note 5) | (2,067,431) |
Waiver/reimbursements of other operating expenses (Notes 2 and 5) | (7,447,387) |
TOTAL WAIVERS AND REIMBURSEMENTS | (9,514,818) |
Net expenses | 99,752,168 |
Net investment loss | $(54,203,055) |
Realized and Unrealized Gain (Loss) on Investments, Foreign Currency Transactions and Foreign Exchange Contracts: | |
Net realized gain on investments (including net realized gain of $8,301,312 on sales of investments in affiliated companies and holdings*) | $710,658,492 |
Net realized gain on foreign currency transactions | 148,519 |
Net realized loss on foreign exchange contracts | (9,698) |
Net change in unrealized appreciation of investments (including net change in unrealized appreciation of $486,554,637 on investments in affiliated companies and holdings*) | 2,432,395,512 |
Net change in unrealized appreciation/depreciation of translation of assets and liabilities in foreign currency | 36,100 |
Net realized and unrealized gain (loss) on investments, foreign currency transactions and foreign exchange contracts | 3,143,228,925 |
Change in net assets resulting from operations | $3,089,025,870 |
* | See information listed after the Fund’s Portfolio of Investments. |
Year Ended October 31 | 2021 | 2020 |
Increase (Decrease) in Net Assets | ||
Operations: | ||
Net investment loss | $(54,203,055) | $(18,957,030) |
Net realized gain (loss) | 710,797,313 | 24,400,954 |
Net change in unrealized appreciation/depreciation | 2,432,431,612 | 1,179,942,081 |
CHANGE IN NET ASSETS RESULTING FROM OPERATIONS | 3,089,025,870 | 1,185,386,005 |
Distributions to Shareholders: | ||
Class A Shares | (1,653,079) | (1,921,096) |
Class B Shares | (25,352) | (33,450) |
Class C Shares | (540,247) | (459,834) |
Class R Shares | (292,074) | (328,807) |
Institutional Shares | (8,076,795) | (13,697,681) |
Class R6 Shares | (1,083,308) | (1,163,761) |
CHANGE IN NET ASSETS RESULTING FROM DISTRIBUTIONS TO SHAREHOLDERS | (11,670,855) | (17,604,629) |
Share Transactions: | ||
Proceeds from sale of shares | 3,022,203,221 | 4,225,873,475 |
Net asset value of shares issued to shareholders in payment of distributions declared | 11,048,509 | 16,764,824 |
Cost of shares redeemed | (3,647,695,450) | (1,783,489,845) |
CHANGE IN NET ASSETS RESULTING FROM SHARE TRANSACTIONS | (614,443,720) | 2,459,148,454 |
Change in net assets | 2,462,911,295 | 3,626,929,830 |
Net Assets: | ||
Beginning of period | 7,328,297,425 | 3,701,367,595 |
End of period | $9,791,208,720 | $7,328,297,425 |
Transfer Agent Fees Incurred | Transfer Agent Fees Reimbursed | |
Class A Shares | $1,171,930 | $(750,156) |
Class B Shares | 13,942 | — |
Class C Shares | 379,579 | — |
Class R Shares | 671,189 | — |
Institutional Shares | 6,579,478 | (5,229,051) |
Class R6 Shares | 104,786 | — |
TOTAL | $8,920,904 | $(5,979,207) |
Other Service Fees Incurred | |
Class A Shares | $3,490,470 |
Class B Shares | 39,831 |
Class C Shares | 991,657 |
TOTAL | $4,521,958 |
Market Value of Securities Loaned | Collateral Received |
$626,544,750 | $637,565,528 |
Security | Acquisition Date | Cost | Value |
Fisker, Inc. | 10/29/2020 | $11,700,000 | $18,778,500 |
Immatics N.V. - Restricted | 6/30/2020 | $2,900,000 | $4,155,700 |
Amount of Realized Gain or (Loss) on Derivatives Recognized in Income | |
Foreign Exchange Contracts | |
Foreign exchange contracts | $(9,698) |
Year Ended 10/31/2021 | Year Ended 10/31/2020 | |||
Class A Shares: | Shares | Amount | Shares | Amount |
Shares sold | 3,590,107 | $230,919,045 | 7,111,333 | $317,394,833 |
Shares issued to shareholders in payment of distributions declared | 26,595 | 1,569,381 | 43,337 | 1,833,335 |
Shares redeemed | (4,375,929) | (283,404,028) | (6,330,060) | (272,874,388) |
NET CHANGE RESULTING FROM CLASS A SHARE TRANSACTIONS | (759,227) | $(50,915,602) | 824,610 | $46,353,780 |
Year Ended 10/31/2021 | Year Ended 10/31/2020 | |||
Class B Shares: | Shares | Amount | Shares | Amount |
Shares sold | 2,705 | $147,595 | 7,410 | $275,745 |
Shares issued to shareholders in payment of distributions declared | 503 | 24,990 | 924 | 32,912 |
Shares redeemed | (97,430) | (5,268,745) | (123,290) | (4,548,639) |
NET CHANGE RESULTING FROM CLASS B SHARE TRANSACTIONS | (94,222) | $(5,096,160) | (114,956) | $(4,239,982) |
Year Ended 10/31/2021 | Year Ended 10/31/2020 | |||
Class C Shares: | Shares | Amount | Shares | Amount |
Shares sold | 1,579,737 | $85,366,029 | 2,712,145 | $102,512,707 |
Shares issued to shareholders in payment of distributions declared | 10,600 | 526,955 | 12,425 | 442,704 |
Shares redeemed | (1,503,198) | (82,300,016) | (1,836,039) | (67,850,294) |
NET CHANGE RESULTING FROM CLASS C SHARE TRANSACTIONS | 87,139 | $3,592,968 | 888,531 | $35,105,117 |
Year Ended 10/31/2021 | Year Ended 10/31/2020 | |||
Class R Shares: | Shares | Amount | Shares | Amount |
Shares sold | 1,149,093 | $74,288,799 | 1,687,248 | $76,320,016 |
Shares issued to shareholders in payment of distributions declared | 4,919 | 291,805 | 7,619 | 325,306 |
Shares redeemed | (1,183,981) | (77,242,320) | (922,867) | (39,931,892) |
NET CHANGE RESULTING FROM CLASS R SHARE TRANSACTIONS | (29,969) | $(2,661,716) | 772,000 | $36,713,430 |
Year Ended 10/31/2021 | Year Ended 10/31/2020 | |||
Institutional Shares: | Shares | Amount | Shares | Amount |
Shares sold | 31,342,177 | $2,036,222,866 | 72,827,049 | $3,263,513,645 |
Shares issued to shareholders in payment of distributions declared | 127,148 | 7,663,239 | 297,030 | 13,010,261 |
Shares redeemed | (42,406,935) | (2,851,405,518) | (29,886,031) | (1,296,657,632) |
NET CHANGE RESULTING FROM INSTITUTIONAL SHARE TRANSACTIONS | (10,937,610) | $(807,519,413) | 43,238,048 | $1,979,866,274 |
Year Ended 10/31/2021 | Year Ended 10/31/2020 | |||
Class R6 Shares: | Shares | Amount | Shares | Amount |
Shares sold | 9,048,037 | $595,258,887 | 10,298,681 | $465,856,529 |
Shares issued to shareholders in payment of distributions declared | 16,254 | 972,139 | 25,829 | 1,120,306 |
Shares redeemed | (5,262,776) | (348,074,823) | (2,248,452) | (101,627,000) |
NET CHANGE RESULTING FROM CLASS R6 SHARE TRANSACTIONS | 3,801,515 | $248,156,203 | 8,076,058 | $365,349,835 |
NET CHANGE RESULTING FROM TOTAL FUND SHARE TRANSACTIONS | (7,932,374) | $(614,443,720) | 53,684,291 | $2,459,148,454 |
2021 | 2020 | |
Ordinary income1 | $4,800,891 | $10,332,482 |
Long-term capital gains | $6,869,964 | $7,272,147 |
1 | For tax purposes, short-term capital gain distributions are considered ordinary income distributions. |
Undistributed ordinary income2 | $141,944,645 |
Net unrealized appreciation | $4,226,534,584 |
Undistributed long-term capital gains | $527,744,771 |
2 | For tax purposes, short-term capital gains are considered ordinary income in determining distributable earnings. |
Administrative Fee | Average Daily Net Assets of the Investment Complex |
0.100% | on assets up to $50 billion |
0.075% | on assets over $50 billion |
Percentage of Average Daily Net Assets of Class | |
Class A Shares | 0.25% |
Class B Shares | 0.75% |
Class C Shares | 0.75% |
Class R Shares | 0.50% |
Distribution Services Fees Incurred | Distribution Services Fees Waived | |
Class A Shares | $3,491,062 | $(698,212) |
Class B Shares | 119,492 | — |
Class C Shares | 2,974,972 | — |
Class R Shares | 1,283,280 | (769,968) |
TOTAL | $7,868,806 | $(1,468,180) |
Purchases | $3,202,639,224 |
Sales | $3,406,760,597 |
December 23, 2021
Beginning Account Value 5/1/2021 | Ending Account Value 10/31/2021 | Expenses Paid During Period1 | |
Actual: | |||
Class A Shares | $1,000 | $1,066.20 | $7.03 |
Class B Shares | $1,000 | $1,063.00 | $10.19 |
Class C Shares | $1,000 | $1,063.00 | $10.30 |
Class R Shares | $1,000 | $1,066.10 | $7.24 |
Institutional Shares | $1,000 | $1,068.70 | $4.64 |
Class R6 Shares | $1,000 | $1,068.70 | $4.59 |
Hypothetical (assuming a 5% return before expenses): | |||
Class A Shares | $1,000 | $1,018.40 | $6.87 |
Class B Shares | $1,000 | $1,015.32 | $9.96 |
Class C Shares | $1,000 | $1,015.22 | $10.06 |
Class R Shares | $1,000 | $1,018.20 | $7.07 |
Institutional Shares | $1,000 | $1,020.72 | $4.53 |
Class R6 Shares | $1,000 | $1,020.77 | $4.48 |
1 | Expenses are equal to the Fund’s annualized net expense ratios, multiplied by the average account value over the period, multiplied by 184/365 (to reflect the one-half-year period). The annualized net expense ratios are as follows: |
Class A Shares | 1.35% |
Class B Shares | 1.96% |
Class C Shares | 1.98% |
Class R Shares | 1.39% |
Institutional Shares | 0.89% |
Class R6 Shares | 0.88% |
Name Birth Date Positions Held with Trust Date Service Began | Principal Occupation(s) for Past Five Years, Other Directorships Held and Previous Position(s) |
J. Christopher Donahue* Birth Date: April 11, 1949 President and Trustee Indefinite Term Began serving: January 2000 | Principal Occupations: Principal Executive Officer and President of certain of the Funds in the Federated Hermes Fund Family; Director or Trustee of the Funds in the Federated Hermes Fund Family; President, Chief Executive Officer and Director, Federated Hermes, Inc.; Chairman and Trustee, Federated Investment Management Company; Trustee, Federated Investment Counseling; Chairman and Director, Federated Global Investment Management Corp.; Chairman and Trustee, Federated Equity Management Company of Pennsylvania; Trustee, Federated Shareholder Services Company; Director, Federated Services Company. Previous Positions: President, Federated Investment Counseling; President and Chief Executive Officer, Federated Investment Management Company, Federated Global Investment Management Corp. and Passport Research, Ltd; Chairman, Passport Research, Ltd. |
Name Birth Date Positions Held with Trust Date Service Began | Principal Occupation(s) for Past Five Years, Other Directorships Held and Previous Position(s) |
John B. Fisher* Birth Date: May 16, 1956 Trustee Indefinite Term Began serving: May 2016 | Principal Occupations: Principal Executive Officer and President of certain of the Funds in the Federated Hermes Fund Family; Director or Trustee of certain of the Funds in the Federated Hermes Fund Family; Vice President, Federated Hermes, Inc.; President, Director/Trustee and CEO, Federated Advisory Services Company, Federated Equity Management Company of Pennsylvania, Federated Global Investment Management Corp., Federated Investment Counseling, Federated Investment Management Company; President of some of the Funds in the Federated Hermes Fund Family and Director, Federated Investors Trust Company. Previous Positions: President and Director of the Institutional Sales Division of Federated Securities Corp.; President and Director of Federated Investment Counseling; President and CEO of Passport Research, Ltd.; Director, Edgewood Securities Corp.; Director, Federated Services Company; Director, Federated Hermes, Inc.; Chairman and Director, Southpointe Distribution Services, Inc. and President, Technology, Federated Services Company. |
Name Birth Date Positions Held with Trust Date Service Began | Principal Occupation(s) for Past Five Years, Other Directorships Held, Previous Position(s) and Qualifications |
John T. Collins Birth Date: January 24, 1947 Trustee Indefinite Term Began serving: October 2013 | Principal Occupations: Director or Trustee, and Chair of the Board of Directors or Trustees, of the Federated Hermes Fund Family; formerly, Chairman and CEO, The Collins Group, Inc. (a private equity firm) (Retired). Other Directorships Held: Chairman of the Board of Directors, Director, KLX Energy Services Holdings, Inc. (oilfield services); former Director of KLX Corp. (aerospace). Qualifications: Mr. Collins has served in several business and financial management roles and directorship positions throughout his career. Mr. Collins previously served as Chairman and CEO of The Collins Group, Inc. (a private equity firm) and as a Director of KLX Corp. Mr. Collins serves as Chairman Emeriti, Bentley University. Mr. Collins previously served as Director and Audit Committee Member, Bank of America Corp.; Director, FleetBoston Financial Corp.; and Director, Beth Israel Deaconess Medical Center (Harvard University Affiliate Hospital). |
Name Birth Date Positions Held with Trust Date Service Began | Principal Occupation(s) for Past Five Years, Other Directorships Held, Previous Position(s) and Qualifications |
G. Thomas Hough Birth Date: February 28, 1955 Trustee Indefinite Term Began serving: August 2015 | Principal Occupations: Director or Trustee, Chair of the Audit Committee of the Federated Hermes Fund Family; formerly, Vice Chair, Ernst & Young LLP (public accounting firm) (Retired). Other Directorships Held: Director, Chair of the Audit Committee, Equifax, Inc.; Director, Member of the Audit Committee, Haverty Furniture Companies, Inc.; formerly, Director, Member of Governance and Compensation Committees, Publix Super Markets, Inc. Qualifications: Mr. Hough has served in accounting, business management and directorship positions throughout his career. Mr. Hough most recently held the position of Americas Vice Chair of Assurance with Ernst & Young LLP (public accounting firm). Mr. Hough serves on the President’s Cabinet and Business School Board of Visitors for the University of Alabama. Mr. Hough previously served on the Business School Board of Visitors for Wake Forest University, and he previously served as an Executive Committee member of the United States Golf Association. |
Maureen Lally-Green Birth Date: July 5, 1949 Trustee Indefinite Term Began serving: August 2009 | Principal Occupations: Director or Trustee of the Federated Hermes Fund Family; Adjunct Professor Emerita of Law, Duquesne University School of Law; formerly, Dean of the Duquesne University School of Law and Professor of Law and Interim Dean of the Duquesne University School of Law; formerly, Associate General Secretary and Director, Office of Church Relations, Diocese of Pittsburgh. Other Directorships Held: Director, CNX Resources Corporation (formerly known as CONSOL Energy Inc.). Qualifications: Judge Lally-Green has served in various legal and business roles and directorship positions throughout her career. Judge Lally-Green previously held the position of Dean of the School of Law of Duquesne University (as well as Interim Dean). Judge Lally-Green previously served as a member of the Superior Court of Pennsylvania and as a Professor of Law, Duquesne University School of Law. Judge Lally-Green was appointed by the Supreme Court of Pennsylvania to serve on the Supreme Court’s Board of Continuing Judicial Education and the Supreme Court’s Appellate Court Procedural Rules Committee. Judge Lally-Green also currently holds the positions on not for profit or for profit boards of directors as follows: Director and Chair, UPMC Mercy Hospital; Regent, Saint Vincent Seminary; Member, Pennsylvania State Board of Education (public); Director, Catholic Charities, Pittsburgh; and Director CNX Resources Corporation (formerly known as CONSOL Energy Inc.). Judge Lally-Green has held the positions of: Director, Auberle; Director, Epilepsy Foundation of Western and Central Pennsylvania; Director, Ireland Institute of Pittsburgh; Director, Saint Thomas More Society; Director and Chair, Catholic High Schools of the Diocese of Pittsburgh, Inc.; Director, Pennsylvania Bar Institute; Director, St. Vincent College; Director and Chair, North Catholic High School, Inc.; and Director and Vice Chair, Our Campaign for the Church Alive!, Inc. |
Name Birth Date Positions Held with Trust Date Service Began | Principal Occupation(s) for Past Five Years, Other Directorships Held, Previous Position(s) and Qualifications |
Thomas M. O’Neill Birth Date: June 14, 1951 Trustee Indefinite Term Began serving: August 2006 | Principal Occupations: Director or Trustee of the Federated Hermes Fund Family; Sole Proprietor, Navigator Management Company (investment and strategic consulting). Other Directorships Held: None. Qualifications: Mr. O’Neill has served in several business, mutual fund and financial management roles and directorship positions throughout his career. Mr. O’Neill serves as Director, Medicines for Humanity and Director, The Golisano Children’s Museum of Naples, Florida. Mr. O’Neill previously served as Chief Executive Officer and President, Managing Director and Chief Investment Officer, Fleet Investment Advisors; President and Chief Executive Officer, Aeltus Investment Management, Inc.; General Partner, Hellman, Jordan Management Co., Boston, MA; Chief Investment Officer, The Putnam Companies, Boston, MA; Credit Analyst and Lending Officer, Fleet Bank; Director and Consultant, EZE Castle Software (investment order management software); and Director, Midway Pacific (lumber). |
Madelyn A. Reilly Birth Date: February 2, 1956 Trustee Indefinite Term Began serving: November 2020 | Principal Occupations: Director or Trustee of the Federated Hermes Fund Family; Senior Vice President for Legal Affairs, General Counsel and Secretary of the Board of Trustees, Duquesne University. Other Directorships Held: None. Qualifications: Ms. Reilly has served in various business and legal management roles throughout her career. Ms. Reilly previously served as Director of Risk Management and Associate General Counsel, Duquesne University. Prior to her work at Duquesne University, Ms. Reilly served as Assistant General Counsel of Compliance and Enterprise Risk as well as Senior Counsel of Environment, Health and Safety, PPG Industries. |
P. Jerome Richey Birth Date: February 23, 1949 Trustee Indefinite Term Began serving: October 2013 | Principal Occupations: Director or Trustee of the Federated Hermes Fund Family; Management Consultant; Retired; formerly, Senior Vice Chancellor and Chief Legal Officer, University of Pittsburgh and Executive Vice President and Chief Legal Officer, CONSOL Energy Inc. (now split into two separate publicly traded companies known as CONSOL Energy Inc. and CNX Resources Corp.). Other Directorships Held: None. Qualifications: Mr. Richey has served in several business and legal management roles and directorship positions throughout his career. Mr. Richey most recently held the positions of Senior Vice Chancellor and Chief Legal Officer, University of Pittsburgh. Mr. Richey previously served as Chairman of the Board, Epilepsy Foundation of Western Pennsylvania and Chairman of the Board, World Affairs Council of Pittsburgh. Mr. Richey previously served as Chief Legal Officer and Executive Vice President, CONSOL Energy Inc. and CNX Gas Company; and Board Member, Ethics Counsel and Shareholder, Buchanan Ingersoll & Rooney PC (a law firm). |
Name Birth Date Positions Held with Trust Date Service Began | Principal Occupation(s) for Past Five Years, Other Directorships Held, Previous Position(s) and Qualifications |
John S. Walsh Birth Date: November 28, 1957 Trustee Indefinite Term Began serving: January 1999 | Principal Occupations: Director or Trustee of the Federated Hermes Fund Family; President and Director, Heat Wagon, Inc. (manufacturer of construction temporary heaters); President and Director, Manufacturers Products, Inc. (distributor of portable construction heaters); President, Portable Heater Parts, a division of Manufacturers Products, Inc. Other Directorships Held: None. Qualifications: Mr. Walsh has served in several business management roles and directorship positions throughout his career. Mr. Walsh previously served as Vice President, Walsh & Kelly, Inc. (paving contractors). |
Name Birth Date Address Positions Held with Trust Date Service Began | Principal Occupation(s) for Past Five Years and Previous Position(s) |
Lori A. Hensler Birth Date: January 6, 1967 TREASURER Officer since: April 2013 | Principal Occupations: Principal Financial Officer and Treasurer of the Federated Hermes Fund Family; Senior Vice President, Federated Administrative Services; Financial and Operations Principal for Federated Securities Corp.; and Assistant Treasurer, Federated Investors Trust Company. Ms. Hensler has received the Certified Public Accountant designation. Previous Positions: Controller of Federated Hermes, Inc.; Senior Vice President and Assistant Treasurer, Federated Investors Management Company; Treasurer, Federated Investors Trust Company; Assistant Treasurer, Federated Administrative Services, Federated Administrative Services, Inc., Federated Securities Corp., Edgewood Services, Inc., Federated Advisory Services Company, Federated Equity Management Company of Pennsylvania, Federated Global Investment Management Corp., Federated Investment Counseling, Federated Investment Management Company, Passport Research, Ltd., and Federated MDTA, LLC; Financial and Operations Principal for Federated Securities Corp., Edgewood Services, Inc. and Southpointe Distribution Services, Inc. |
Name Birth Date Address Positions Held with Trust Date Service Began | Principal Occupation(s) for Past Five Years and Previous Position(s) |
Peter J. Germain Birth Date: September 3, 1959 CHIEF LEGAL OFFICER, SECRETARY and EXECUTIVE VICE PRESIDENT Officer since: January 2005 | Principal Occupations: Mr. Germain is Chief Legal Officer, Secretary and Executive Vice President of the Federated Hermes Fund Family. He is General Counsel, Chief Legal Officer, Secretary and Executive Vice President, Federated Hermes, Inc.; Trustee and Senior Vice President, Federated Investors Management Company; Trustee and President, Federated Administrative Services; Director and President, Federated Administrative Services, Inc.; Director and Vice President, Federated Securities Corp.; Director and Secretary, Federated Private Asset Management, Inc.; Secretary, Federated Shareholder Services Company; and Secretary, Retirement Plan Service Company of America. Mr. Germain joined Federated Hermes, Inc. in 1984 and is a member of the Pennsylvania Bar Association. Previous Positions: Deputy General Counsel, Special Counsel, Managing Director of Mutual Fund Services, Federated Hermes, Inc.; Senior Vice President, Federated Services Company; and Senior Corporate Counsel, Federated Hermes, Inc. |
Stephen Van Meter Birth Date: June 5, 1975 CHIEF COMPLIANCE OFFICER AND SENIOR VICE PRESIDENT Officer since: July 2015 | Principal Occupations: Senior Vice President and Chief Compliance Officer of the Federated Hermes Fund Family; Vice President and Chief Compliance Officer of Federated Hermes, Inc. and Chief Compliance Officer of certain of its subsidiaries. Mr. Van Meter joined Federated Hermes, Inc. in October 2011. He holds FINRA licenses under Series 3, 7, 24 and 66. Previous Positions: Mr. Van Meter previously held the position of Compliance Operating Officer, Federated Hermes, Inc. Prior to joining Federated Hermes, Inc., Mr. Van Meter served at the United States Securities and Exchange Commission in the positions of Senior Counsel, Office of Chief Counsel, Division of Investment Management and Senior Counsel, Division of Enforcement. |
Stephen F. Auth Birth Date: September 13, 1956 101 Park Avenue 41st Floor New York, NY 10178 CHIEF INVESTMENT OFFICER Officer since: November 2002 | Principal Occupations: Stephen F. Auth is Chief Investment Officer of various Funds in the Federated Hermes Fund Family; Executive Vice President, Federated Investment Counseling, Federated Global Investment Management Corp. and Federated Equity Management Company of Pennsylvania. Previous Positions: Executive Vice President, Federated Investment Management Company and Passport Research, Ltd. (investment advisory subsidiary of Federated); Senior Vice President, Global Portfolio Management Services Division; Senior Vice President, Federated Investment Management Company and Passport Research, Ltd.; Senior Managing Director and Portfolio Manager, Prudential Investments. |
Annual Evaluation of Adequacy and Effectiveness
Federated Hermes Funds
4000 Ericsson Drive
Warrendale, PA 15086-7561
or call 1-800-341-7400.
CUSIP 314172628
CUSIP 314172610
CUSIP 314172537
CUSIP 31421N402
CUSIP 31421N683

Share Class | Ticker | A | FGSAX | C | FGSCX | Institutional | FGSIX | R6 | FGSKX |
Federated Hermes MDT Mid Cap Growth Fund
A Portfolio of Federated Hermes Equity Funds
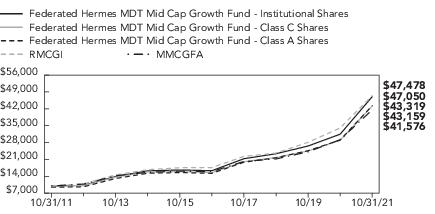
1 Year | 5 Years | 10 Years | |
Class A Shares | 40.89% | 21.86% | 15.79% |
Class C Shares | 46.91% | 22.31% | 15.75% |
Institutional Shares | 49.47% | 23.58% | 16.75% |
Class R6 Shares4 | 49.52% | 23.59% | 16.34% |
RMCGI | 39.43% | 21.90% | 16.86% |
MMCGFA | 41.84% | 21.26% | 15.74% |
Sector Composition | Percentage of Total Net Assets |
Information Technology | 36.2% |
Health Care | 17.3% |
Consumer Discretionary | 15.8% |
Industrials | 13.0% |
Financials | 6.0% |
Communication Services | 3.5% |
Materials | 2.6% |
Consumer Staples | 1.8% |
Real Estate | 1.3% |
Energy | 1.1% |
Securities Lending Collateral2 | 1.4% |
Cash Equivalents3 | 1.6% |
Other Assets and Liabilities—Net4 | (1.6)% |
TOTAL | 100% |
1 | Except for Cash Equivalents, Securities Lending Collateral and Other Assets and Liabilities, sector classifications are based upon, and individual portfolio securities are assigned to, the classifications of the Global Industry Classification Standard (GICS) except that the Adviser assigns a classification to securities not classified by the GICS and to securities for which the Adviser does not have access to the classification made by the GICS. |
2 | Represents cash collateral received for portfolio securities on loan that may be invested in affiliated money market funds, other money market instruments and/or repurchase agreements. |
3 | Cash Equivalents include any investments in money market mutual funds and/or overnight repurchase agreements other than those representing securities lending collateral. |
4 | Assets, other than investments in securities, less liabilities. See Statement of Assets and Liabilities. |
Shares | Value | ||
COMMON STOCKS— 98.6% | |||
Communication Services— 3.5% | |||
11,004 | 1 | AMC Networks, Inc. | $437,849 |
71,840 | 1 | Live Nation Entertainment, Inc. | 7,266,616 |
26,186 | 1 | Match Group, Inc. | 3,948,325 |
33,066 | Nexstar Media Group, Inc., Class A | 4,957,585 | |
7,113 | 1 | Take-Two Interactive Software, Inc. | 1,287,453 |
66,551 | 1 | TripAdvisor, Inc. | 2,194,187 |
73,297 | 1 | Twitter, Inc. | 3,924,321 |
10,788 | World Wrestling Entertainment, Inc. | 659,039 | |
59,018 | 1 | Zynga, Inc. | 435,553 |
TOTAL | 25,110,928 | ||
Consumer Discretionary— 15.8% | |||
53,953 | Bath & Body Works, Inc. | 3,727,613 | |
17,622 | 1 | Boyd Gaming Corp. | 1,123,931 |
35,703 | 1 | Burlington Stores, Inc. | 9,864,382 |
5,482 | 1 | Chipotle Mexican Grill, Inc. | 9,752,642 |
26,589 | Domino’s Pizza, Inc. | 13,001,223 | |
45,185 | 1 | DoorDash, Inc. | 8,802,038 |
25,638 | 1 | Expedia Group, Inc. | 4,215,144 |
88,779 | 1 | Floor & Decor Holdings, Inc. | 12,066,842 |
13,064 | 1 | Lululemon Athletica, Inc. | 6,087,955 |
125,541 | 1 | Nordstrom, Inc. | 3,606,793 |
1,839 | 1 | RH | 1,213,059 |
14,560 | Tapestry, Inc. | 567,549 | |
175,427 | Tempur Sealy International, Inc. | 7,801,239 | |
21,541 | The Wendy’s Co. | 480,364 | |
52,087 | Travel + Leisure Co. | 2,830,408 | |
30,620 | 1 | Ulta Beauty, Inc. | 11,248,563 |
11,991 | Williams-Sonoma, Inc. | 2,227,088 | |
139,345 | 1 | YETI Holdings, Inc. | 13,701,794 |
TOTAL | 112,318,627 | ||
Consumer Staples— 1.8% | |||
245,027 | 2 | Albertsons Cos., Inc. | 7,583,585 |
48,895 | Energizer Holdings, Inc. | 1,783,201 | |
150,862 | 1 | Sprouts Farmers Market, Inc. | 3,340,085 |
TOTAL | 12,706,871 | ||
Energy— 1.1% | |||
96,964 | 2 | Continental Resources, Inc. | 4,732,813 |
Shares | Value | ||
COMMON STOCKS— continued | |||
Energy— continued | |||
79,986 | Occidental Petroleum Corp. | $2,681,931 | |
TOTAL | 7,414,744 | ||
Financials— 6.0% | |||
20,852 | Discover Financial Services | 2,362,949 | |
36,429 | MSCI, Inc., Class A | 24,220,913 | |
12,906 | Synchrony Financial | 599,484 | |
109,075 | Tradeweb Markets, Inc. | 9,718,582 | |
15,162 | 1 | Upstart Holdings, Inc. | 4,882,770 |
48,679 | Virtu Financial, Inc. | 1,211,134 | |
TOTAL | 42,995,832 | ||
Health Care— 17.3% | |||
53,442 | Agilent Technologies, Inc. | 8,416,580 | |
6,680 | 1 | Align Technology, Inc. | 4,170,792 |
33,651 | 1 | Alnylam Pharmaceuticals, Inc. | 5,369,353 |
307,657 | 1 | Avantor, Inc. | 12,423,190 |
115,596 | Bruker Corp. | 9,282,359 | |
22,079 | 1 | Dexcom, Inc. | 13,759,853 |
9,415 | 1 | Horizon Therapeutics PLC | 1,128,953 |
10,362 | 1 | IDEXX Laboratories, Inc. | 6,902,543 |
66,303 | 1 | Incyte Genomics, Inc. | 4,440,975 |
61,992 | 1 | IQVIA Holdings, Inc. | 16,205,949 |
14,544 | 1 | Maravai LifeSciences Holdings, Inc. | 615,066 |
29,971 | McKesson Corp. | 6,230,371 | |
4,411 | 1 | Mettler-Toledo International, Inc. | 6,532,162 |
15,499 | 1 | Molina Healthcare, Inc. | 4,583,364 |
4,310 | 1 | Neurocrine Biosciences, Inc. | 454,317 |
2,825 | 1 | Repligen Corp. | 820,662 |
6,499 | 1 | SAGE Therapeutics, Inc. | 262,300 |
40,020 | 1 | Tandem Diabetes Care, Inc. | 5,455,927 |
45,813 | 1 | Veeva Systems, Inc. | 14,523,179 |
4,604 | 1 | Waters Corp. | 1,692,200 |
TOTAL | 123,270,095 | ||
Industrials— 13.0% | |||
17,010 | Advanced Drainage System, Inc. | 1,918,728 | |
9,952 | AGCO Corp. | 1,216,234 | |
85,265 | Allegion PLC | 10,939,499 | |
38,361 | Allison Transmission Holdings, Inc. | 1,279,723 | |
2,710 | 1 | Axon Enterprise, Inc. | 487,692 |
8,452 | 1 | CACI International, Inc., Class A | 2,431,133 |
245,811 | Carrier Global Corp. | 12,838,709 | |
33,382 | 1 | Generac Holdings, Inc. | 16,642,930 |
Shares | Value | ||
COMMON STOCKS— continued | |||
Industrials— continued | |||
35,506 | Huntington Ingalls Industries, Inc. | $7,198,131 | |
18,889 | Landstar System, Inc. | 3,320,875 | |
50,156 | Nielsen Holdings PLC | 1,015,659 | |
35,233 | Pitney Bowes, Inc. | 244,517 | |
3,553 | Trane Technologies PLC | 642,844 | |
96,895 | TransUnion | 11,171,025 | |
169,272 | Vertiv Holdings Co. | 4,346,905 | |
144,312 | 1 | XPO Logistics, Inc. | 12,381,970 |
33,121 | Xylem, Inc. | 4,325,271 | |
TOTAL | 92,401,845 | ||
Information Technology— 36.2% | |||
12,311 | Alliance Data Systems Corp. | 1,049,513 | |
40,365 | 1 | Arista Networks, Inc. | 16,537,137 |
84,382 | Bentley Systems, Inc. | 4,991,195 | |
80,786 | 1 | CloudFlare, Inc. | 15,730,650 |
11,758 | 1 | CommScope Holdings Co., Inc. | 125,928 |
66,058 | 1 | Crowdstrike Holdings, Inc. | 18,615,144 |
112,371 | 1 | Datadog, Inc. | 18,771,576 |
7,815 | 1 | DocuSign, Inc. | 2,174,836 |
383,089 | 1 | Dropbox, Inc. | 11,680,384 |
155,868 | 1 | Dynatrace Holdings LLC | 11,690,100 |
37,311 | 1 | EPAM Systems, Inc. | 25,119,258 |
60,705 | 1 | Fortinet, Inc. | 20,417,520 |
21,544 | 1 | Globant SA | 6,876,629 |
29,259 | 1 | HubSpot, Inc. | 23,706,520 |
44,429 | Jabil, Inc. | 2,663,963 | |
4,211 | KLA Corp. | 1,569,692 | |
2,001 | MKS Instruments, Inc. | 300,250 | |
23,924 | Monolithic Power Systems | 12,571,105 | |
170,708 | 1 | Nutanix, Inc. | 5,856,991 |
104,001 | 1 | ON Semiconductor Corp. | 4,999,328 |
11,107 | 1 | Palo Alto Networks, Inc. | 5,654,463 |
7,920 | 1 | Paycom Software, Inc. | 4,338,972 |
27,733 | 1 | Paylocity Corp. | 8,462,448 |
211,449 | 1 | Pure Storage, Inc. | 5,679,520 |
20,622 | 1 | Teradata Corp. | 1,166,380 |
381,457 | Western Union Co. | 6,950,146 | |
63,236 | 1 | Zscaler, Inc. | 20,163,431 |
TOTAL | 257,863,079 | ||
Materials— 2.6% | |||
85,265 | 1 | Axalta Coating Systems Ltd. | 2,659,416 |
Shares | Value | ||
COMMON STOCKS— continued | |||
Materials— continued | |||
132,252 | 1 | Berry Global Group, Inc. | $8,667,796 |
17,671 | Celanese Corp. | 2,854,043 | |
125,542 | Chemours Co./The | 3,517,687 | |
7,371 | LyondellBasell Industries N.V. | 684,176 | |
2,630 | Westlake Chemical Corp. | 256,004 | |
TOTAL | 18,639,122 | ||
Real Estate— 1.3% | |||
12,891 | Coresite Realty Corp. | 1,836,452 | |
29,316 | Extra Space Storage, Inc. | 5,786,099 | |
2,583 | SBA Communications, Corp. | 891,987 | |
2,568 | Simon Property Group, Inc. | 376,418 | |
TOTAL | 8,890,956 | ||
TOTAL COMMON STOCKS (IDENTIFIED COST $530,430,933) | 701,612,099 | ||
INVESTMENT COMPANIES— 3.0% | |||
10,000,196 | Federated Hermes Government Obligations Fund, Premier Shares, 0.03%3 | 10,000,196 | |
11,466,128 | Federated Hermes Institutional Prime Value Obligations Fund, Institutional Shares, 0.02%3 | 11,468,936 | |
TOTAL INVESTMENT COMPANIES (IDENTIFIED COST $21,467,986) | 21,469,132 | ||
TOTAL INVESTMENT IN SECURITIES—101.6% (IDENTIFIED COST $551,898,919)4 | 723,081,231 | ||
OTHER ASSETS AND LIABILITIES - NET—(1.6)%5 | (11,402,799) | ||
TOTAL NET ASSETS—100% | $711,678,432 |
Federated Hermes Government Obligations Fund, Premier Shares* | Federated Hermes Institutional Prime Value Obligations Fund, Institutional Shares | Total of Affiliated Transactions | |
Value as of 10/31/2020 | $236,922 | $7,589,529 | $7,826,451 |
Purchases at Cost | $57,009,346 | $95,821,500 | $152,830,846 |
Proceeds from Sales | $(47,246,072) | $(91,941,248) | $(139,187,320) |
Change in Unrealized Appreciation/ Depreciation | N/A | $1,302 | $1,302 |
Net Realized Gain/(Loss) | N/A | $(2,147) | $(2,147) |
Value as of 10/31/2021 | $10,000,196 | $11,468,936 | $21,469,132 |
Shares Held as of 10/31/2021 | 10,000,196 | 11,466,128 | 21,466,324 |
Dividend Income | $515 | $5,727 | $6,242 |
* | All or a portion of the balance/activity for the fund relates to cash collateral received on securities lending transactions. |
1 | Non-income-producing security. |
2 | All or a portion of these securities are temporarily on loan to unaffiliated broker/dealers. |
3 | 7-day net yield. |
4 | The cost of investments for federal tax purposes amounts to $553,342,218. |
5 | Assets, other than investments in securities, less liabilities. See Statement of Assets and Liabilities. |
Year Ended October 31, | |||||
2021 | 2020 | 2019 | 2018 | 2017 | |
Net Asset Value, Beginning of Period | $44.93 | $41.20 | $41.35 | $43.07 | $33.37 |
Income From Investment Operations: | |||||
Net investment income (loss)1 | (0.39) | (0.19) | (0.07) | (0.14) | (0.04) |
Net realized and unrealized gain (loss) | 21.36 | 7.14 | 4.77 | 3.92 | 10.06 |
Total From Investment Operations | 20.97 | 6.95 | 4.70 | 3.78 | 10.02 |
Less Distributions: | |||||
Distributions from net investment income | — | — | — | — | (0.02) |
Distributions from net realized gain | (3.53) | (3.22) | (4.85) | (5.50) | (0.30) |
Total Distributions | (3.53) | (3.22) | (4.85) | (5.50) | (0.32) |
Net Asset Value, End of Period | $62.37 | $44.93 | $41.20 | $41.35 | $43.07 |
Total Return2 | 49.08% | 18.07% | 13.40% | 9.43% | 30.20% |
Ratios to Average Net Assets: | |||||
Net expenses3 | 1.13% | 1.14% | 1.14% | 1.22% | 1.22% |
Net investment income (loss) | (0.73)% | (0.46)% | (0.18)% | (0.33)% | (0.10)% |
Expense waiver/reimbursement4 | 0.08% | 0.11% | 0.11% | 0.06% | 0.10% |
Supplemental Data: | |||||
Net assets, end of period (000 omitted) | $367,018 | $266,252 | $257,818 | $238,586 | $236,955 |
Portfolio turnover5 | 141% | 227% | 179% | 171% | 109% |
1 | Per share number has been calculated using the average shares method. |
2 | Based on net asset value, which does not reflect the sales charge, redemption fee or contingent deferred sales charge, if applicable. |
3 | Amount does not reflect net expenses incurred by investment companies in which the Fund may invest. |
4 | This expense decrease is reflected in both the net expense and the net investment income (loss) ratios shown above. Amount does not reflect expense waiver/reimbursement recorded by investment companies in which the Fund may invest. |
5 | Securities that mature are considered sales for purposes of this calculation. |
Year Ended October 31, | |||||
2021 | 2020 | 2019 | 2018 | 2017 | |
Net Asset Value, Beginning of Period | $28.09 | $27.12 | $29.12 | $32.11 | $25.12 |
Income From Investment Operations: | |||||
Net investment income (loss)1 | (0.48) | (0.31) | (0.25) | (0.33) | (0.25) |
Net realized and unrealized gain (loss) | 12.89 | 4.50 | 3.10 | 2.84 | 7.54 |
Total From Investment Operations | 12.41 | 4.19 | 2.85 | 2.51 | 7.29 |
Less Distributions: | |||||
Distributions from net realized gain | (3.53) | (3.22) | (4.85) | (5.50) | (0.30) |
Net Asset Value, End of Period | $36.97 | $28.09 | $27.12 | $29.12 | $32.11 |
Total Return2 | 47.91% | 17.17% | 12.54% | 8.58% | 29.25% |
Ratios to Average Net Assets: | |||||
Net expenses3 | 1.92% | 1.93% | 1.88% | 1.97% | 1.97% |
Net investment income (loss) | (1.51)% | (1.23)% | (0.94)% | (1.09)% | (0.85)% |
Expense waiver/reimbursement4 | 0.08% | 0.12% | 0.16% | 0.08% | 0.12% |
Supplemental Data: | |||||
Net assets, end of period (000 omitted) | $16,184 | $13,309 | $15,460 | $10,619 | $10,613 |
Portfolio turnover5 | 141% | 227% | 179% | 171% | 109% |
1 | Per share number has been calculated using the average shares method. |
2 | Based on net asset value, which does not reflect the sales charge, redemption fee or contingent deferred sales charge, if applicable. |
3 | Amount does not reflect net expenses incurred by investment companies in which the Fund may invest. |
4 | This expense decrease is reflected in both the net expense and the net investment income (loss) ratios shown above. Amount does not reflect expense waiver/reimbursement recorded by investment companies in which the Fund may invest. |
5 | Securities that mature are considered sales for purposes of this calculation. |
Year Ended October 31, | |||||
2021 | 2020 | 2019 | 2018 | 2017 | |
Net Asset Value, Beginning of Period | $46.74 | $42.60 | $42.48 | $44.01 | $34.09 |
Income From Investment Operations: | |||||
Net investment income (loss)1 | (0.25) | (0.06) | 0.04 | (0.05) | 0.07 |
Net realized and unrealized gain (loss) | 22.28 | 7.42 | 4.93 | 4.02 | 10.25 |
Total From Investment Operations | 22.03 | 7.36 | 4.97 | 3.97 | 10.32 |
Less Distributions: | |||||
Distributions from net investment income | — | — | — | — | (0.10) |
Distributions from net realized gain | (3.53) | (3.22) | (4.85) | (5.50) | (0.30) |
Total Distributions | (3.53) | (3.22) | (4.85) | (5.50) | (0.40) |
Net Asset Value, End of Period | $65.24 | $46.74 | $42.60 | $42.48 | $44.01 |
Total Return2 | 49.47% | 18.46% | 13.71% | 9.69% | 30.52% |
Ratios to Average Net Assets: | |||||
Net expenses3 | 0.84% | 0.84% | 0.84% | 0.95% | 0.97% |
Net investment income (loss) | (0.44)% | (0.13)% | 0.10% | (0.12)% | 0.19% |
Expense waiver/reimbursement4 | 0.15% | 0.19% | 0.21% | 0.07% | 0.11% |
Supplemental Data: | |||||
Net assets, end of period (000 omitted) | $279,045 | $188,839 | $246,222 | $177,959 | $24,559 |
Portfolio turnover5 | 141% | 227% | 179% | 171% | 109% |
1 | Per share number has been calculated using the average shares method. |
2 | Based on net asset value. |
3 | Amount does not reflect net expenses incurred by investment companies in which the Fund may invest. |
4 | This expense decrease is reflected in both the net expense and the net investment income (loss) ratios shown above. Amount does not reflect expense waiver/reimbursement recorded by investment companies in which the Fund may invest. |
5 | Securities that mature are considered sales for purposes of this calculation. |
Year Ended October 31, | |||||
2021 | 2020 | 2019 | 2018 | 2017 | |
Net Asset Value, Beginning of Period | $41.99 | $38.59 | $38.95 | $40.80 | $31.53 |
Income From Investment Operations: | |||||
Net investment income (loss)1 | (0.22) | (0.05) | 0.01 | (0.03) | 0.04 |
Net realized and unrealized gain (loss) | 19.92 | 6.67 | 4.48 | 3.68 | 9.53 |
Total From Investment Operations | 19.70 | 6.62 | 4.49 | 3.65 | 9.57 |
Less Distributions: | |||||
Distributions from net realized gain | (3.53) | (3.22) | (4.85) | (5.50) | (0.30) |
Net Asset Value, End of Period | $58.16 | $41.99 | $38.59 | $38.95 | $40.80 |
Total Return2 | 49.52% | 18.46% | 13.72% | 9.67% | 30.54% |
Ratios to Average Net Assets: | |||||
Net expenses3 | 0.83% | 0.83% | 0.83% | 0.95% | 0.96% |
Net investment income (loss) | (0.43)% | (0.14)% | 0.03% | (0.08)% | 0.12% |
Expense waiver/reimbursement4 | 0.08% | 0.11% | 0.11% | 0.02% | 0.04% |
Supplemental Data: | |||||
Net assets, end of period (000 omitted) | $49,431 | $31,388 | $31,590 | $6,576 | $37,815 |
Portfolio turnover5 | 141% | 227% | 179% | 171% | 109% |
1 | Per share number has been calculated using the average shares method. |
2 | Based on net asset value. |
3 | Amount does not reflect net expenses incurred by investment companies in which the Fund may invest. |
4 | This expense decrease is reflected in both the net expense and the net investment income (loss) ratios shown above. Amount does not reflect expense waiver/reimbursement recorded by investment companies in which the Fund may invest. |
5 | Securities that mature are considered sales for purposes of this calculation. |
October 31, 2021
Assets: | |
Investment in securities, at value including $9,997,037 of securities loaned and $21,469,132 of investments in an affiliated holding* (identified cost $551,898,919) | $723,081,231 |
Income receivable | 82,740 |
Income receivable from an affiliated holding | 425 |
Receivable for investments sold | 1,474,530 |
Receivable for shares sold | 279,481 |
Total Assets | 724,918,407 |
Liabilities: | |
Payable for investments purchased | 1,510,613 |
Payable for shares redeemed | 1,354,115 |
Payable for collateral due to broker for securities lending (Note 2) | 10,000,196 |
Payable for investment adviser fee (Note 5) | 39,369 |
Payable for administrative fee (Note 5) | 4,545 |
Payable for Directors’/Trustees’ fees (Note 5) | 221 |
Payable for distribution services fee (Note 5) | 9,764 |
Payable for other service fees (Notes 2 and 5) | 172,248 |
Accrued expenses (Note 5) | 148,904 |
Total Liabilities | 13,239,975 |
Net assets for 11,449,996 shares outstanding | $711,678,432 |
Net Assets Consist of: | |
Paid-in capital | $401,927,391 |
Total distributable earnings (loss) | 309,751,041 |
Total Net Assets | $711,678,432 |
Net Asset Value, Offering Price and Redemption Proceeds Per Share: | |
Class A Shares: | |
Net asset value per share ($367,018,115 ÷ 5,884,918 shares outstanding), no par value, unlimited shares authorized | $62.37 |
Offering price per share (100/94.50 of $62.37) | $66.00 |
Redemption proceeds per share | $62.37 |
Class C Shares: | |
Net asset value per share ($16,184,190 ÷ 437,819 shares outstanding), no par value, unlimited shares authorized | $36.97 |
Offering price per share | $36.97 |
Redemption proceeds per share (99.00/100 of $36.97) | $36.60 |
Institutional Shares: | |
Net asset value per share ($279,044,755 ÷ 4,277,276 shares outstanding), no par value, unlimited shares authorized | $65.24 |
Offering price per share | $65.24 |
Redemption proceeds per share | $65.24 |
Class R6 Shares: | |
Net asset value per share ($49,431,372 ÷ 849,983 shares outstanding), no par value, unlimited shares authorized | $58.16 |
Offering price per share | $58.16 |
Redemption proceeds per share | $58.16 |
* | See information listed after the Fund’s Portfolio of Investments. |
Year Ended October 31, 2021
Investment Income: | |
Dividends (including $5,727 received from an affiliated holding*) | $2,492,539 |
Net income on securities loaned (includes $515 received from affiliated holdings related to cash collateral balances) (Note 2) | 16,328 |
TOTAL INCOME | 2,508,867 |
Expenses: | |
Investment adviser fee (Note 5) | 4,636,198 |
Administrative fee (Note 5) | 484,861 |
Custodian fees | 45,745 |
Transfer agent fees (Note 2) | 532,348 |
Directors’/Trustees’ fees (Note 5) | 4,008 |
Auditing fees | 26,619 |
Legal fees | 11,029 |
Portfolio accounting fees | 141,422 |
Distribution services fee (Note 5) | 114,531 |
Other service fees (Notes 2 and 5) | 847,808 |
Share registration costs | 79,524 |
Printing and postage | 38,159 |
Miscellaneous (Note 5) | 32,807 |
TOTAL EXPENSES | 6,995,059 |
Waiver and Reimbursements: | |
Waiver/reimbursement of investment adviser fee (Note 5) | (512,341) |
Reimbursement of other operating expenses (Notes 2 and 5) | (160,648) |
TOTAL WAIVER AND REIMBURSEMENTS | (672,989) |
Net expenses | 6,322,070 |
Net investment loss | (3,813,203) |
Realized and Unrealized Gain (Loss) on Investments and Foreign Currency Transactions: | |
Net realized gain on investments (including net realized loss of $(2,147) on sales of investments in an affiliated holding*) | 149,755,928 |
Net realized gain on foreign currency transactions | 1,338 |
Net change in unrealized appreciation of investments (including net change in unrealized depreciation of $1,302 on investments in an affiliated holding*) | 93,172,509 |
Net realized and unrealized gain (loss) on investments and foreign currency transactions | 242,929,775 |
Change in net assets resulting from operations | $239,116,572 |
* | See information listed after the Fund’s Portfolio of Investments. |
Year Ended October 31 | 2021 | 2020 |
Increase (Decrease) in Net Assets | ||
Operations: | ||
Net investment loss | $(3,813,203) | $(1,638,100) |
Net realized gain (loss) | 149,757,266 | 36,640,061 |
Net change in unrealized appreciation/depreciation | 93,172,509 | 44,742,339 |
CHANGE IN NET ASSETS RESULTING FROM OPERATIONS | 239,116,572 | 79,744,300 |
Distributions to Shareholders: | ||
Class A Shares | (20,893,171) | (19,681,770) |
Class C Shares | (1,648,136) | (1,770,911) |
Institutional Shares | (14,320,888) | (18,251,317) |
Class R6 Shares | (2,636,767) | (2,684,427) |
CHANGE IN NET ASSETS RESULTING FROM DISTRIBUTIONS TO SHAREHOLDERS | (39,498,962) | (42,388,425) |
Share Transactions: | ||
Proceeds from sale of shares | 102,437,917 | 84,955,913 |
Net asset value of shares issued to shareholders in payment of distributions declared | 34,268,768 | 37,599,957 |
Cost of shares redeemed | (124,433,468) | (211,214,467) |
CHANGE IN NET ASSETS RESULTING FROM SHARE TRANSACTIONS | 12,273,217 | (88,658,597) |
Change in net assets | 211,890,827 | (51,302,722) |
Net Assets: | ||
Beginning of period | 499,787,605 | 551,090,327 |
End of period | $711,678,432 | $499,787,605 |
Transfer Agent Fees Incurred | Transfer Agent Fees Reimbursed | |
Class A Shares | $253,258 | $— |
Class C Shares | 17,213 | — |
Institutional Shares | 250,277 | (160,648) |
Class R6 Shares | 11,600 | — |
TOTAL | $532,348 | $(160,648) |
Other Service Fees Incurred | |
Class A Shares | $809,631 |
Class C Shares | 38,177 |
TOTAL | $847,808 |
Market Value of Securities Loaned | Collateral Received |
$9,997,037 | $10,000,196 |
Year Ended 10/31/2021 | Year Ended 10/31/2020 | |||
Class A Shares: | Shares | Amount | Shares | Amount |
Shares sold | 344,391 | $18,016,525 | 305,538 | $12,123,319 |
Shares issued to shareholders in payment of distributions declared | 391,700 | 18,723,268 | 452,310 | 17,631,062 |
Shares redeemed | (776,575) | (41,214,639) | (1,090,828) | (43,664,616) |
NET CHANGE RESULTING FROM CLASS A SHARE TRANSACTIONS | (40,484) | $(4,474,846) | (332,980) | $(13,910,235) |
Year Ended 10/31/2021 | Year Ended 10/31/2020 | |||
Class C Shares: | Shares | Amount | Shares | Amount |
Shares sold | 43,381 | $1,367,894 | 61,317 | $1,514,960 |
Shares issued to shareholders in payment of distributions declared | 52,107 | 1,486,605 | 65,613 | 1,610,780 |
Shares redeemed | (131,439) | (4,143,352) | (223,148) | (5,554,957) |
NET CHANGE RESULTING FROM CLASS C SHARE TRANSACTIONS | (35,951) | $(1,288,853) | (96,218) | $(2,429,217) |
Year Ended 10/31/2021 | Year Ended 10/31/2020 | |||
Institutional Shares: | Shares | Amount | Shares | Amount |
Shares sold | 1,175,439 | $66,483,120 | 1,452,412 | $57,400,016 |
Shares issued to shareholders in payment of distributions declared | 253,604 | 12,647,222 | 413,257 | 16,712,098 |
Shares redeemed | (1,192,389) | (66,038,279) | (3,604,668) | (144,236,848) |
NET CHANGE RESULTING FROM INSTITUTIONAL SHARE TRANSACTIONS | 236,654 | $13,092,063 | (1,738,999) | $(70,124,734) |
Year Ended 10/31/2021 | Year Ended 10/31/2020 | |||
Class R6 Shares: | Shares | Amount | Shares | Amount |
Shares sold | 330,951 | $16,570,378 | 368,236 | $13,917,618 |
Shares issued to shareholders in payment of distributions declared | 31,758 | 1,411,673 | 45,307 | 1,646,017 |
Shares redeemed | (260,213) | (13,037,198) | (484,606) | (17,758,046) |
NET CHANGE RESULTING FROM CLASS R6 SHARE TRANSACTIONS | 102,496 | $4,944,853 | (71,063) | $(2,194,411) |
NET CHANGE RESULTING FROM TOTAL FUND SHARE TRANSACTIONS | 262,715 | $12,273,217 | (2,239,260) | $(88,658,597) |
2021 | 2020 | |
Ordinary income1 | $39,498,962 | $9,298,325 |
Long-term capital gains | $— | $33,090,100 |
1 | For tax purposes, short-term capital gains are considered ordinary income in determining distributable earnings. |
Undistributed ordinary income2 | $91,019,954 |
Net unrealized appreciation | $169,739,013 |
Undistributed long-term capital gains | $48,992,074 |
2 | For tax purposes, short-term capital gains are considered ordinary income in determining distributable earnings. |
Administrative Fee | Average Daily Net Assets of the Investment Complex |
0.100% | on assets up to $50 billion |
0.075% | on assets over $50 billion |
Distribution Services Fees Incurred | |
Class C Shares | $114,531 |
Purchases | $846,735,534 |
Sales | $878,495,487 |

December 22, 2021
Beginning Account Value 5/1/2021 | Ending Account Value 10/31/2021 | Expenses Paid During Period1 | |
Actual: | |||
Class A Shares | $1,000 | $1,175.90 | $6.20 |
Class C Shares | $1,000 | $1,171.40 | $10.51 |
Institutional Shares | $1,000 | $1,177.40 | $4.61 |
Class R6 Shares | $1,000 | $1,177.60 | $4.56 |
Hypothetical (assuming a 5% return before expenses): | |||
Class A Shares | $1,000 | $1,019.51 | $5.75 |
Class C Shares | $1,000 | $1,015.53 | $9.75 |
Institutional Shares | $1,000 | $1,020.97 | $4.28 |
Class R6 Shares | $1,000 | $1,021.02 | $4.23 |
1 | Expenses are equal to the Fund’s annualized net expense ratios, multiplied by the average account value over the period, multiplied by 184/365 (to reflect the one-half-year period). The annualized net expense ratios are as follows: |
Class A Shares | 1.13% |
Class C Shares | 1.92% |
Institutional Shares | 0.84% |
Class R6 Shares | 0.83% |
Name Birth Date Positions Held with Trust Date Service Began | Principal Occupation(s) for Past Five Years, Other Directorships Held and Previous Position(s) |
J. Christopher Donahue* Birth Date: April 11, 1949 President and Trustee Indefinite Term Began serving: September 1999 | Principal Occupations: Principal Executive Officer and President of certain of the Funds in the Federated Hermes Fund Family; Director or Trustee of the Funds in the Federated Hermes Fund Family; President, Chief Executive Officer and Director, Federated Hermes, Inc.; Chairman and Trustee, Federated Investment Management Company; Trustee, Federated Investment Counseling; Chairman and Director, Federated Global Investment Management Corp.; Chairman and Trustee, Federated Equity Management Company of Pennsylvania; Trustee, Federated Shareholder Services Company; Director, Federated Services Company. Previous Positions: President, Federated Investment Counseling; President and Chief Executive Officer, Federated Investment Management Company, Federated Global Investment Management Corp. and Passport Research, Ltd; Chairman, Passport Research, Ltd. |
Name Birth Date Positions Held with Trust Date Service Began | Principal Occupation(s) for Past Five Years, Other Directorships Held and Previous Position(s) |
John B. Fisher* Birth Date: May 16, 1956 Trustee Indefinite Term Began serving: May 2016 | Principal Occupations: Principal Executive Officer and President of certain of the Funds in the Federated Hermes Fund Family; Director or Trustee of certain of the Funds in the Federated Hermes Fund Family; Vice President, Federated Hermes, Inc.; President, Director/Trustee and CEO, Federated Advisory Services Company, Federated Equity Management Company of Pennsylvania, Federated Global Investment Management Corp., Federated Investment Counseling, Federated Investment Management Company; President of some of the Funds in the Federated Hermes Fund Family and Director, Federated Investors Trust Company. Previous Positions: President and Director of the Institutional Sales Division of Federated Securities Corp.; President and Director of Federated Investment Counseling; President and CEO of Passport Research, Ltd.; Director, Edgewood Securities Corp.; Director, Federated Services Company; Director, Federated Hermes, Inc.; Chairman and Director, Southpointe Distribution Services, Inc. and President, Technology, Federated Services Company. |
Name Birth Date Positions Held with Trust Date Service Began | Principal Occupation(s) for Past Five Years, Other Directorships Held, Previous Position(s) and Qualifications |
John T. Collins Birth Date: January 24, 1947 Trustee Indefinite Term Began serving: October 2013 | Principal Occupations: Director or Trustee, and Chair of the Board of Directors or Trustees, of the Federated Hermes Fund Family; formerly, Chairman and CEO, The Collins Group, Inc. (a private equity firm) (Retired). Other Directorships Held: Chairman of the Board of Directors, Director, KLX Energy Services Holdings, Inc. (oilfield services); former Director of KLX Corp. (aerospace). Qualifications: Mr. Collins has served in several business and financial management roles and directorship positions throughout his career. Mr. Collins previously served as Chairman and CEO of The Collins Group, Inc. (a private equity firm) and as a Director of KLX Corp. Mr. Collins serves as Chairman Emeriti, Bentley University. Mr. Collins previously served as Director and Audit Committee Member, Bank of America Corp.; Director, FleetBoston Financial Corp.; and Director, Beth Israel Deaconess Medical Center (Harvard University Affiliate Hospital). |
Name Birth Date Positions Held with Trust Date Service Began | Principal Occupation(s) for Past Five Years, Other Directorships Held, Previous Position(s) and Qualifications |
G. Thomas Hough Birth Date: February 28, 1955 Trustee Indefinite Term Began serving: August 2015 | Principal Occupations: Director or Trustee, Chair of the Audit Committee of the Federated Hermes Fund Family; formerly, Vice Chair, Ernst & Young LLP (public accounting firm) (Retired). Other Directorships Held: Director, Chair of the Audit Committee, Equifax, Inc.; Director, Member of the Audit Committee, Haverty Furniture Companies, Inc.; formerly, Director, Member of Governance and Compensation Committees, Publix Super Markets, Inc. Qualifications: Mr. Hough has served in accounting, business management and directorship positions throughout his career. Mr. Hough most recently held the position of Americas Vice Chair of Assurance with Ernst & Young LLP (public accounting firm). Mr. Hough serves on the President’s Cabinet and Business School Board of Visitors for the University of Alabama. Mr. Hough previously served on the Business School Board of Visitors for Wake Forest University, and he previously served as an Executive Committee member of the United States Golf Association. |
Maureen Lally-Green Birth Date: July 5, 1949 Trustee Indefinite Term Began serving: August 2009 | Principal Occupations: Director or Trustee of the Federated Hermes Fund Family; Adjunct Professor Emerita of Law, Duquesne University School of Law; formerly, Dean of the Duquesne University School of Law and Professor of Law and Interim Dean of the Duquesne University School of Law; formerly, Associate General Secretary and Director, Office of Church Relations, Diocese of Pittsburgh. Other Directorships Held: Director, CNX Resources Corporation (formerly known as CONSOL Energy Inc.). Qualifications: Judge Lally-Green has served in various legal and business roles and directorship positions throughout her career. Judge Lally-Green previously held the position of Dean of the School of Law of Duquesne University (as well as Interim Dean). Judge Lally-Green previously served as a member of the Superior Court of Pennsylvania and as a Professor of Law, Duquesne University School of Law. Judge Lally-Green was appointed by the Supreme Court of Pennsylvania to serve on the Supreme Court’s Board of Continuing Judicial Education and the Supreme Court’s Appellate Court Procedural Rules Committee. Judge Lally-Green also currently holds the positions on not for profit or for profit boards of directors as follows: Director and Chair, UPMC Mercy Hospital; Regent, Saint Vincent Seminary; Member, Pennsylvania State Board of Education (public); Director, Catholic Charities, Pittsburgh; and Director CNX Resources Corporation (formerly known as CONSOL Energy Inc.). Judge Lally-Green has held the positions of: Director, Auberle; Director, Epilepsy Foundation of Western and Central Pennsylvania; Director, Ireland Institute of Pittsburgh; Director, Saint Thomas More Society; Director and Chair, Catholic High Schools of the Diocese of Pittsburgh, Inc.; Director, Pennsylvania Bar Institute; Director, St. Vincent College; Director and Chair, North Catholic High School, Inc.; and Director and Vice Chair, Our Campaign for the Church Alive!, Inc. |
Name Birth Date Positions Held with Trust Date Service Began | Principal Occupation(s) for Past Five Years, Other Directorships Held, Previous Position(s) and Qualifications |
Thomas M. O’Neill Birth Date: June 14, 1951 Trustee Indefinite Term Began serving: August 2006 | Principal Occupations: Director or Trustee of the Federated Hermes Fund Family; Sole Proprietor, Navigator Management Company (investment and strategic consulting). Other Directorships Held: None. Qualifications: Mr. O’Neill has served in several business, mutual fund and financial management roles and directorship positions throughout his career. Mr. O’Neill serves as Director, Medicines for Humanity and Director, The Golisano Children’s Museum of Naples, Florida. Mr. O’Neill previously served as Chief Executive Officer and President, Managing Director and Chief Investment Officer, Fleet Investment Advisors; President and Chief Executive Officer, Aeltus Investment Management, Inc.; General Partner, Hellman, Jordan Management Co., Boston, MA; Chief Investment Officer, The Putnam Companies, Boston, MA; Credit Analyst and Lending Officer, Fleet Bank; Director and Consultant, EZE Castle Software (investment order management software); and Director, Midway Pacific (lumber). |
Madelyn A. Reilly Birth Date: February 2, 1956 Trustee Indefinite Term Began serving: November 2020 | Principal Occupations: Director or Trustee of the Federated Hermes Fund Family; Senior Vice President for Legal Affairs, General Counsel and Secretary of the Board of Trustees, Duquesne University. Other Directorships Held: None. Qualifications: Ms. Reilly has served in various business and legal management roles throughout her career. Ms. Reilly previously served as Director of Risk Management and Associate General Counsel, Duquesne University. Prior to her work at Duquesne University, Ms. Reilly served as Assistant General Counsel of Compliance and Enterprise Risk as well as Senior Counsel of Environment, Health and Safety, PPG Industries. |
P. Jerome Richey Birth Date: February 23, 1949 Trustee Indefinite Term Began serving: October 2013 | Principal Occupations: Director or Trustee of the Federated Hermes Fund Family; Management Consultant; Retired; formerly, Senior Vice Chancellor and Chief Legal Officer, University of Pittsburgh and Executive Vice President and Chief Legal Officer, CONSOL Energy Inc. (now split into two separate publicly traded companies known as CONSOL Energy Inc. and CNX Resources Corp.). Other Directorships Held: None. Qualifications: Mr. Richey has served in several business and legal management roles and directorship positions throughout his career. Mr. Richey most recently held the positions of Senior Vice Chancellor and Chief Legal Officer, University of Pittsburgh. Mr. Richey previously served as Chairman of the Board, Epilepsy Foundation of Western Pennsylvania and Chairman of the Board, World Affairs Council of Pittsburgh. Mr. Richey previously served as Chief Legal Officer and Executive Vice President, CONSOL Energy Inc. and CNX Gas Company; and Board Member, Ethics Counsel and Shareholder, Buchanan Ingersoll & Rooney PC (a law firm). |
Name Birth Date Positions Held with Trust Date Service Began | Principal Occupation(s) for Past Five Years, Other Directorships Held, Previous Position(s) and Qualifications |
John S. Walsh Birth Date: November 28, 1957 Trustee Indefinite Term Began serving: January 1999 | Principal Occupations: Director or Trustee of the Federated Hermes Fund Family; President and Director, Heat Wagon, Inc. (manufacturer of construction temporary heaters); President and Director, Manufacturers Products, Inc. (distributor of portable construction heaters); President, Portable Heater Parts, a division of Manufacturers Products, Inc. Other Directorships Held: None. Qualifications: Mr. Walsh has served in several business management roles and directorship positions throughout his career. Mr. Walsh previously served as Vice President, Walsh & Kelly, Inc. (paving contractors). |
Name Birth Date Address Positions Held with Trust Date Service Began | Principal Occupation(s) for Past Five Years and Previous Position(s) |
Lori A. Hensler Birth Date: January 6, 1967 TREASURER Officer since: April 2013 | Principal Occupations: Principal Financial Officer and Treasurer of the Federated Hermes Fund Family; Senior Vice President, Federated Administrative Services; Financial and Operations Principal for Federated Securities Corp.; and Assistant Treasurer, Federated Investors Trust Company. Ms. Hensler has received the Certified Public Accountant designation. Previous Positions: Controller of Federated Hermes, Inc.; Senior Vice President and Assistant Treasurer, Federated Investors Management Company; Treasurer, Federated Investors Trust Company; Assistant Treasurer, Federated Administrative Services, Federated Administrative Services, Inc., Federated Securities Corp., Edgewood Services, Inc., Federated Advisory Services Company, Federated Equity Management Company of Pennsylvania, Federated Global Investment Management Corp., Federated Investment Counseling, Federated Investment Management Company, Passport Research, Ltd., and Federated MDTA, LLC; Financial and Operations Principal for Federated Securities Corp., Edgewood Services, Inc. and Southpointe Distribution Services, Inc. |
Name Birth Date Address Positions Held with Trust Date Service Began | Principal Occupation(s) for Past Five Years and Previous Position(s) |
Peter J. Germain Birth Date: September 3, 1959 CHIEF LEGAL OFFICER, SECRETARY and EXECUTIVE VICE PRESIDENT Officer since: January 2005 | Principal Occupations: Mr. Germain is Chief Legal Officer, Secretary and Executive Vice President of the Federated Hermes Fund Family. He is General Counsel, Chief Legal Officer, Secretary and Executive Vice President, Federated Hermes, Inc.; Trustee and Senior Vice President, Federated Investors Management Company; Trustee and President, Federated Administrative Services; Director and President, Federated Administrative Services, Inc.; Director and Vice President, Federated Securities Corp.; Director and Secretary, Federated Private Asset Management, Inc.; Secretary, Federated Shareholder Services Company; and Secretary, Retirement Plan Service Company of America. Mr. Germain joined Federated Hermes, Inc. in 1984 and is a member of the Pennsylvania Bar Association. Previous Positions: Deputy General Counsel, Special Counsel, Managing Director of Mutual Fund Services, Federated Hermes, Inc.; Senior Vice President, Federated Services Company; and Senior Corporate Counsel, Federated Hermes, Inc. |
Stephen Van Meter Birth Date: June 5, 1975 CHIEF COMPLIANCE OFFICER AND SENIOR VICE PRESIDENT Officer since: July 2015 | Principal Occupations: Senior Vice President and Chief Compliance Officer of the Federated Hermes Fund Family; Vice President and Chief Compliance Officer of Federated Hermes, Inc. and Chief Compliance Officer of certain of its subsidiaries. Mr. Van Meter joined Federated Hermes, Inc. in October 2011. He holds FINRA licenses under Series 3, 7, 24 and 66. Previous Positions: Mr. Van Meter previously held the position of Compliance Operating Officer, Federated Hermes, Inc. Prior to joining Federated Hermes, Inc., Mr. Van Meter served at the United States Securities and Exchange Commission in the positions of Senior Counsel, Office of Chief Counsel, Division of Investment Management and Senior Counsel, Division of Enforcement. |
Stephen F. Auth Birth Date: September 13, 1956 101 Park Avenue 41st Floor New York, NY 10178 CHIEF INVESTMENT OFFICER Officer since: November 2002 | Principal Occupations: Stephen F. Auth is Chief Investment Officer of various Funds in the Federated Hermes Fund Family; Executive Vice President, Federated Investment Counseling, Federated Global Investment Management Corp. and Federated Equity Management Company of Pennsylvania. Previous Positions: Executive Vice President, Federated Investment Management Company and Passport Research, Ltd. (investment advisory subsidiary of Federated); Senior Vice President, Global Portfolio Management Services Division; Senior Vice President, Federated Investment Management Company and Passport Research, Ltd.; Senior Managing Director and Portfolio Manager, Prudential Investments. |
Annual Evaluation of Adequacy and Effectiveness
Federated Hermes Funds
4000 Ericsson Drive
Warrendale, PA 15086-7561
or call 1-800-341-7400.
CUSIP 314172305
CUSIP 314172198
CUSIP 314172529

Share Class | Ticker | A | SVAAX | C | SVACX | Institutional | SVAIX | R6 | SVALX |
Federated Hermes Strategic Value Dividend Fund
A Portfolio of Federated Hermes Equity Funds
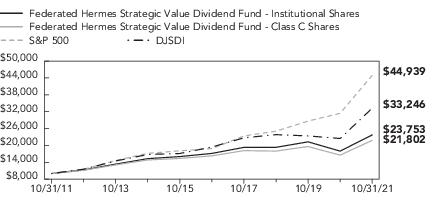
1 Year | 5 Years | 10 Years | |
Class A Shares | 24.56% | 5.24% | 8.14% |
Class C Shares | 29.94% | 5.67% | 8.11% |
Institutional Shares | 32.12% | 6.72% | 9.04% |
R6 Shares5 | 32.14% | 6.74% | 8.99% |
S&P 500 | 42.91% | 18.93% | 16.21% |
DJSDI | 47.99% | 11.33% | 12.76% |
Sector Composition | Percentage of Total Net Assets |
Consumer Staples | 17.5% |
Energy | 17.1% |
Health Care | 16.7% |
Utilities | 16.1% |
Communication Services | 12.0% |
Financials | 11.5% |
Information Technology | 4.4% |
Industrials | 3.0% |
Real Estate | 0.9% |
Cash Equivalents2 | 0.5% |
Other Assets and Liabilities—Net3 | 0.3% |
TOTAL | 100% |
Shares | Dividend Yield (unaudited) | Value in U.S. Dollars | ||
COMMON STOCKS—99.2% | ||||
Communication Services—12.0% | ||||
5,535,059 | AT&T, Inc. | 8.23% | $139,815,590 | |
5,414,710 | BCE, Inc. | 4.67 | 278,742,061 | |
4,648,572 | Verizon Communications, Inc. | 4.83 | 246,327,830 | |
165,160,959 | Vodafone Group PLC | 7.03 | 243,753,982 | |
TOTAL | 908,639,463 | |||
Consumer Staples—17.5% | ||||
8,151,354 | British American Tobacco PLC | 8.47 | 283,493,219 | |
2,449,800 | General Mills, Inc. | 2.98 | 151,397,640 | |
637,480 | Kimberly-Clark Corp. | 3.30 | 82,547,285 | |
1,003,122 | PepsiCo, Inc. | 3.52 | 162,104,515 | |
3,319,947 | Philip Morris International, Inc. | 2.66 | 313,867,789 | |
1,957,956 | The Coca-Cola Co. | 5.29 | 110,369,980 | |
4,170,886 | Unilever PLC | 3.69 | 223,211,902 | |
TOTAL | 1,326,992,330 | |||
Energy—17.1% | ||||
3,320,596 | Chevron Corp. | 4.68 | 380,175,036 | |
7,431,025 | Enbridge, Inc. | 5.48 | 311,267,240 | |
5,565,980 | Exxon Mobil Corp. | 5.46 | 358,838,731 | |
3,194,844 | TC Energy Corp. | 4.42 | 172,830,321 | |
1,556,900 | TotalEnergies SE | 5.17 | 78,061,314 | |
TOTAL | 1,301,172,642 | |||
Financials—11.5% | ||||
1,512,450 | Canadian Imperial Bank of Commerce | 3.31 | 183,520,214 | |
5,883,535 | Huntington Bancshares, Inc. | 3.94 | 92,606,841 | |
9,604,235 | KeyCorp | 3.18 | 223,490,548 | |
361,190 | Morgan Stanley | 2.72 | 37,123,108 | |
2,562,161 | Regions Financial Corp. | 2.87 | 60,671,973 | |
1,591,836 | Truist Financial Corp. | 3.03 | 101,033,831 | |
1,563,516 | U.S. Bancorp | 3.05 | 94,389,461 | |
184,544 | Zurich Insurance Group AG | 4.19 | 81,942,753 | |
TOTAL | 874,778,729 | |||
Health Care—16.7% | ||||
3,118,476 | AbbVie, Inc. | 4.92 | 357,595,643 | |
455,300 | Amgen, Inc. | 3.40 | 94,233,441 | |
Shares | Dividend Yield (unaudited) | Value in U.S. Dollars | ||
COMMON STOCKS—continued | ||||
Health Care—continued | ||||
1,594,175 | Cardinal Health, Inc. | 4.11% | $76,217,507 | |
4,099,421 | Gilead Sciences, Inc. | 4.38 | 265,970,434 | |
3,295,096 | Merck & Co., Inc. | 2.95 | 290,133,203 | |
3,987,545 | Pfizer, Inc. | 3.57 | 174,415,218 | |
140,810 | Sanofi | 3.15 | 14,095,157 | |
TOTAL | 1,272,660,603 | |||
Industrials—3.0% | ||||
584,710 | 3M Co. | 3.31 | 104,475,983 | |
16,705,358 | BAE Systems PLC | 4.39 | 125,957,440 | |
TOTAL | 230,433,423 | |||
Information Technology—4.4% | ||||
284,956 | Broadcom, Inc. | 2.71 | 151,502,557 | |
570,026 | Cisco Systems, Inc. | 2.64 | 31,904,355 | |
659,462 | IBM Corp. | 5.24 | 82,498,696 | |
3,766,264 | Western Union Co. | 5.16 | 68,621,330 | |
TOTAL | 334,526,938 | |||
Real Estate—0.9% | ||||
1,584,764 | National Retail Properties, Inc. | 3.75 | 71,884,895 | |
Utilities—16.1% | ||||
1,178,450 | American Electric Power Co., Inc. | 3.68 | 99,826,499 | |
2,305,421 | Dominion Energy, Inc. | 3.32 | 175,050,616 | |
2,450,404 | Duke Energy Corp. | 3.86 | 249,965,712 | |
13,206,940 | National Grid-SP PLC | 5.26 | 168,943,872 | |
6,322,830 | PPL Corp. | 5.76 | 182,097,504 | |
1,140,025 | Public Service Enterprises Group, Inc. | 3.20 | 72,733,595 | |
4,360,152 | Southern Co. | 4.24 | 271,724,673 | |
TOTAL | 1,220,342,471 | |||
TOTAL COMMON STOCKS (IDENTIFIED COST $6,579,327,327) | 7,541,431,494 | |||
INVESTMENT COMPANY—0.5% | ||||
32,896,518 | 1 | Federated Hermes Institutional Prime Value Obligations Fund, Institutional Shares, 0.02% (IDENTIFIED COST $32,903,750) | 32,906,387 | |
TOTAL INVESTMENT IN SECURITIES—99.7% (IDENTIFIED COST $6,612,231,077)2 | 7,574,337,881 | |||
OTHER ASSETS AND LIABILITIES - NET—0.3%3 | 26,393,153 | |||
TOTAL NET ASSETS—100% | $7,600,731,034 | |||
Federated Hermes Institutional Prime Value Obligations Fund, Institutional Shares | |
Value as of 10/31/2020 | $37,521,862 |
Purchases at Cost | $1,117,357,607 |
Proceeds from Sales | $(1,121,975,992) |
Change in Unrealized Appreciation/Depreciation | $(38,682) |
Net Realized Gain/(Loss) | $41,592 |
Value as of 10/31/2021 | $32,906,387 |
Shares Held as of 10/31/2021 | 32,896,518 |
Dividend Income | $23,523 |
Valuation Inputs | ||||
Level 1— Quoted Prices | Level 2— Other Significant Observable Inputs | Level 3— Significant Unobservable Inputs | Total | |
Equity Securities: | ||||
Common Stocks | ||||
Domestic | $5,375,612,019 | $— | $— | $5,375,612,019 |
International | 946,359,836 | 1,219,459,639 | — | 2,165,819,475 |
Investment Company | 32,906,387 | — | — | 32,906,387 |
TOTAL SECURITIES | $6,354,878,242 | $1,219,459,639 | $— | $7,574,337,881 |
Year Ended October 31 | 2021 | 2020 | 2019 | 2018 | 2017 |
Net Asset Value, Beginning of Period | $4.49 | $5.82 | $5.73 | $6.34 | $5.97 |
Income From Investment Operations: | |||||
Net investment income | 0.20 | 0.21 | 0.21 | 0.21 | 0.21 |
Net realized and unrealized gain (loss) | 1.21 | (1.06) | 0.31 | (0.21) | 0.50 |
TOTAL FROM INVESTMENT OPERATIONS | 1.41 | (0.85) | 0.52 | — | 0.71 |
Less Distributions: | |||||
Distributions from net investment income | (0.20) | (0.21) | (0.21) | (0.20) | (0.21) |
Distributions from net realized gain | — | (0.27) | (0.22) | (0.41) | (0.13) |
TOTAL DISTRIBUTIONS | (0.20) | (0.48) | (0.43) | (0.61) | (0.34) |
Net Asset Value, End of Period | $5.70 | $4.49 | $5.82 | $5.73 | $6.34 |
Total Return1 | 31.78% | (15.65)% | 9.68% | (0.16)% | 12.29% |
Ratios to Average Net Assets: | |||||
Net expenses2 | 1.05% | 1.05%3 | 1.06% | 1.05% | 1.06% |
Net investment income | 3.64% | 4.08% | 3.75% | 3.44% | 3.36% |
Expense waiver/reimbursement4 | 0.12% | 0.13% | 0.12% | 0.12% | 0.13% |
Supplemental Data: | |||||
Net assets, end of period (000 omitted) | $1,366,960 | $1,060,496 | $1,456,023 | $1,603,675 | $2,400,842 |
Portfolio turnover5 | 23% | 38% | 33% | 9% | 19% |
Year Ended October 31 | 2021 | 2020 | 2019 | 2018 | 2017 |
Net Asset Value, Beginning of Period | $4.50 | $5.84 | $5.74 | $6.35 | $5.98 |
Income From Investment Operations: | |||||
Net investment income | 0.16 | 0.17 | 0.17 | 0.16 | 0.16 |
Net realized and unrealized gain (loss) | 1.22 | (1.07) | 0.32 | (0.20) | 0.50 |
TOTAL FROM INVESTMENT OPERATIONS | 1.38 | (0.90) | 0.49 | (0.04) | 0.66 |
Less Distributions: | |||||
Distributions from net investment income | (0.16) | (0.17) | (0.17) | (0.16) | (0.16) |
Distributions from net realized gain | — | (0.27) | (0.22) | (0.41) | (0.13) |
TOTAL DISTRIBUTIONS | (0.16) | (0.44) | (0.39) | (0.57) | (0.29) |
Net Asset Value, End of Period | $5.72 | $4.50 | $5.84 | $5.74 | $6.35 |
Total Return1 | 30.94% | (16.41)% | 9.02% | (0.91)% | 11.43% |
Ratios to Average Net Assets: | |||||
Net expenses2 | 1.80% | 1.80%3 | 1.81% | 1.80% | 1.81% |
Net investment income | 2.92% | 3.34% | 3.00% | 2.69% | 2.65% |
Expense waiver/reimbursement4 | 0.13% | 0.14% | 0.13% | 0.13% | 0.12% |
Supplemental Data: | |||||
Net assets, end of period (000 omitted) | $625,041 | $693,876 | $1,217,811 | $1,472,755 | $1,997,389 |
Portfolio turnover5 | 23% | 38% | 33% | 9% | 19% |
Year Ended October 31 | 2021 | 2020 | 2019 | 2018 | 2017 |
Net Asset Value, Beginning of Period | $4.52 | $5.86 | $5.76 | $6.37 | $6.00 |
Income From Investment Operations: | |||||
Net investment income | 0.21 | 0.22 | 0.23 | 0.22 | 0.23 |
Net realized and unrealized gain (loss) | 1.22 | (1.07) | 0.32 | (0.20) | 0.50 |
TOTAL FROM INVESTMENT OPERATIONS | 1.43 | (0.85) | 0.55 | 0.02 | 0.73 |
Less Distributions: | |||||
Distributions from net investment income | (0.21) | (0.22) | (0.23) | (0.22) | (0.23) |
Distributions from net realized gain | — | (0.27) | (0.22) | (0.41) | (0.13) |
TOTAL DISTRIBUTIONS | (0.21) | (0.49) | (0.45) | (0.63) | (0.36) |
Net Asset Value, End of Period | $5.74 | $4.52 | $5.86 | $5.76 | $6.37 |
Total Return1 | 32.12% | (15.49)% | 10.09% | 0.09% | 12.51% |
Ratios to Average Net Assets: | |||||
Net expenses2 | 0.80% | 0.80%3 | 0.81% | 0.80% | 0.81% |
Net investment income | 3.91% | 4.34% | 3.99% | 3.69% | 3.64% |
Expense waiver/reimbursement4 | 0.13% | 0.13% | 0.12% | 0.12% | 0.13% |
Supplemental Data: | |||||
Net assets, end of period (000 omitted) | $4,589,179 | $4,214,131 | $6,632,015 | $7,027,654 | $9,293,143 |
Portfolio turnover5 | 23% | 38% | 33% | 9% | 19% |
Year Ended October 31 | 2021 | 2020 | 2019 | 2018 | 2017 | |||||
Net Asset Value, Beginning of Period | $4.52 | $5.86 | $5.76 | $6.37 | $6.00 | |||||
Income From Investment Operations: | ||||||||||
Net investment income | 0.21 | 0.22 | 0.23 | 0.22 | 0.23 | |||||
Net realized and unrealized gain (loss) | 1.22 | (1.07) | 0.32 | (0.20) | 0.50 | |||||
TOTAL FROM INVESTMENT OPERATIONS | 1.43 | (0.85) | 0.55 | 0.02 | 0.73 | |||||
Less Distributions: | ||||||||||
Distributions from net investment income | (0.21) | (0.22) | (0.23) | (0.22) | (0.23) | |||||
Distributions from net realized gain | — | (0.27) | (0.22) | (0.41) | (0.13) | |||||
TOTAL DISTRIBUTIONS | (0.21) | (0.49) | (0.45) | (0.63) | (0.36) | |||||
Net Asset Value, End of Period | $5.74 | $4.52 | $5.86 | $5.76 | $6.37 | |||||
Total Return1 | 32.14% | (15.48)% | 10.11% | 0.11% | 12.53% | |||||
Ratios to Average Net Assets: | ||||||||||
Net expenses2 | 0.78% | 0.78%3 | 0.79% | 0.78% | 0.79% | |||||
Net investment income | 3.85% | 4.35% | 4.00% | 3.69% | 3.73% | |||||
Expense waiver/reimbursement4 | 0.07% | 0.07% | 0.07% | 0.07% | 0.07% | |||||
Supplemental Data: | ||||||||||
Net assets, end of period (000 omitted) | $1,019,551 | $575,195 | $500,119 | $452,251 | $242,131 | |||||
Portfolio turnover5 | 23% | 38% | 33% | 9% | 19% | |||||
October 31, 2021
Assets: | ||
Investment in securities, at value including $32,906,387 of investment in an affiliated holding* (identified cost $6,612,231,077) | $7,574,337,881 | |
Cash | 1,854,319 | |
Cash denominated in foreign currencies (identified cost $109) | 108 | |
Income receivable | 27,753,211 | |
Receivable for shares sold | 7,741,643 | |
Income receivable from an affiliated holding | 576 | |
TOTAL ASSETS | 7,611,687,738 | |
Liabilities: | ||
Payable for shares redeemed | $8,331,572 | |
Payable for other service fees (Notes 2 and 5) | 778,555 | |
Payable for transfer agent fees (Note 2) | 702,787 | |
Payable for investment adviser fee (Note 5) | 450,499 | |
Payable for distribution services fee (Note 5) | 397,125 | |
Payable for administrative fee (Note 5) | 48,932 | |
Accrued expenses (Note 5) | 247,234 | |
TOTAL LIABILITIES | 10,956,704 | |
Net assets for 1,326,620,234 shares outstanding | $7,600,731,034 | |
Net Assets Consist of: | ||
Paid-in capital | $6,809,928,811 | |
Total distributable earnings (loss) | 790,802,223 | |
TOTAL NET ASSETS | $7,600,731,034 |
Net Asset Value, Offering Price and Redemption Proceeds Per Share: | ||
Class A Shares: | ||
Net asset value per share ($1,366,960,020 ÷ 239,776,125 shares outstanding), no par value, unlimited shares authorized | $5.70 | |
Offering price per share (100/94.50 of $5.70) | $6.03 | |
Redemption proceeds per share | $5.70 | |
Class C Shares: | ||
Net asset value per share ($625,040,609 ÷ 109,364,321 shares outstanding), no par value, unlimited shares authorized | $5.72 | |
Offering price per share | $5.72 | |
Redemption proceeds per share (99.00/100 of $5.72) | $5.66 | |
Institutional Shares: | ||
Net asset value per share ($4,589,179,359 ÷ 799,777,940 shares outstanding), no par value, unlimited shares authorized | $5.74 | |
Offering price per share | $5.74 | |
Redemption proceeds per share | $5.74 | |
Class R6 Shares: | ||
Net asset value per share ($1,019,551,046 ÷ 177,701,848 shares outstanding), no par value, unlimited shares authorized | $5.74 | |
Offering price per share | $5.74 | |
Redemption proceeds per share | $5.74 |
Year Ended October 31, 2021
Investment Income: | |||
Dividends (including $23,523 received from an affiliated holding* and net of foreign taxes withheld of $9,078,016) | $346,690,190 | ||
Expenses: | |||
Investment adviser fee (Note 5) | $55,301,915 | ||
Administrative fee (Note 5) | 5,762,853 | ||
Custodian fees | 234,990 | ||
Transfer agent fees (Note 2) | 6,059,232 | ||
Directors’/Trustees’ fees (Note 5) | 37,514 | ||
Auditing fees | 20,000 | ||
Legal fees | 12,125 | ||
Distribution services fee (Note 5) | 5,175,736 | ||
Other service fees (Notes 2 and 5) | 4,893,372 | ||
Portfolio accounting fees | 205,714 | ||
Share registration costs | 186,418 | ||
Printing and postage | 245,156 | ||
Miscellaneous (Notes 5) | 52,835 | ||
TOTAL EXPENSES | 78,187,860 | ||
Waiver and Reimbursements: | |||
Waiver/reimbursement of investment adviser fee (Note 5) | $(5,001,969) | ||
Reimbursement of other operating expenses (Notes 2 and 5) | (3,912,242) | ||
TOTAL WAIVER AND REIMBURSEMENTS | (8,914,211) | ||
Net expenses | 69,273,649 | ||
Net investment income | 277,416,541 |
Realized and Unrealized Gain (Loss) on Investments and Foreign Currency Transactions: | |||
Net realized gain on investments (including realized gain of $41,592 on sales of investment in an affiliated holding*) and foreign currency transactions | $335,699,706 | ||
Net change in unrealized depreciation of investments and translation of assets and liabilities in foreign currency (including net change in unrealized appreciation of $(38,682) of investment in an affiliated holding*) | 1,371,791,777 | ||
Net realized and unrealized gain (loss) on investments and foreign currency transactions | 1,707,491,483 | ||
Change in net assets resulting from operations | $1,984,908,024 |
Year Ended October 31 | 2021 | 2020 |
Increase (Decrease) in Net Assets | ||
Operations: | ||
Net investment income | $277,416,541 | $341,263,920 |
Net realized gain (loss) | 335,699,706 | (516,998,394) |
Net change in unrealized appreciation/depreciation | 1,371,791,777 | (1,292,746,267) |
CHANGE IN NET ASSETS RESULTING FROM OPERATIONS | 1,984,908,024 | (1,468,480,741) |
Distributions to Shareholders: | ||
Class A Shares | (46,842,027) | (119,190,294) |
Class C Shares | (20,631,100) | (88,123,083) |
Institutional Shares | (183,796,325) | (540,294,227) |
Class R6 Shares | (29,314,943) | (50,769,205) |
CHANGE IN NET ASSETS RESULTING FROM DISTRIBUTIONS TO SHAREHOLDERS | (280,584,395) | (798,376,809) |
Share Transactions: | ||
Proceeds from sale of shares | 2,052,398,304 | 2,305,508,473 |
Net asset value of shares issued to shareholders in payment of distributions declared | 242,200,846 | 686,495,445 |
Cost of shares redeemed | (2,941,888,715) | (3,987,418,006) |
CHANGE IN NET ASSETS RESULTING FROM SHARE TRANSACTIONS | (647,289,565) | (995,414,088) |
Change in net assets | 1,057,034,064 | (3,262,271,638) |
Net Assets: | ||
Beginning of period | 6,543,696,970 | 9,805,968,608 |
End of period | $7,600,731,034 | $6,543,696,970 |
Transfer Agent Fees Incurred | Transfer Agent Fees Reimbursed | |
Class A Shares | $1,104,085 | $(708,591) |
Class C Shares | 654,494 | (438,339) |
Institutional Shares | 4,220,161 | (2,765,312) |
Class R6 Shares | 80,492 | — |
TOTAL | $6,059,232 | $(3,912,242) |
Other Service Fees Incurred | |
Class A Shares | $3,168,127 |
Class C Shares | 1,725,245 |
TOTAL | $4,893,372 |
Year Ended October 31 | 2021 | 2020 | ||
Class A Shares: | Shares | Amount | Shares | Amount |
Shares sold | 57,623,739 | $312,857,241 | 49,658,543 | $246,407,196 |
Shares issued to shareholders in payment of distributions declared | 7,998,611 | 42,827,107 | 21,138,522 | 112,326,110 |
Shares redeemed | (62,075,330) | (329,153,312) | (84,536,164) | (413,143,778) |
NET CHANGE RESULTING FROM CLASS A SHARE TRANSACTIONS | 3,547,020 | $26,531,036 | (13,739,099) | $(54,410,472) |
Year Ended October 31 | 2021 | 2020 | ||
Class C Shares: | Shares | Amount | Shares | Amount |
Shares sold | 13,712,714 | $73,971,116 | 16,562,399 | $83,983,046 |
Shares issued to shareholders in payment of distributions declared | 3,731,744 | 19,828,658 | 14,897,039 | 79,986,786 |
Shares redeemed | (62,270,117) | (335,461,586) | (85,933,313) | (422,058,898) |
NET CHANGE RESULTING FROM CLASS C SHARE TRANSACTIONS | (44,825,659) | $(241,661,812) | (54,473,875) | $(258,089,066) |
Year Ended October 31 | 2021 | 2020 | ||
Institutional Shares: | Shares | Amount | Shares | Amount |
Shares sold | 209,350,810 | $1,129,699,783 | 314,877,089 | $1,554,626,535 |
Shares issued to shareholders in payment of distributions declared | 29,566,669 | 159,071,153 | 84,522,995 | 451,167,190 |
Shares redeemed | (372,028,948) | (2,002,426,883) | (598,641,509) | (2,898,593,904) |
NET CHANGE RESULTING FROM INSTITUTIONAL SHARE TRANSACTIONS | (133,111,469) | $(713,655,947) | (199,241,425) | $(892,800,179) |
Year Ended October 31 | 2021 | 2020 | ||
Class R6 Shares: | Shares | Amount | Shares | Amount |
Shares sold | 97,288,467 | $535,870,164 | 86,757,508 | $420,491,696 |
Shares issued to shareholders in payment of distributions declared | 3,790,293 | 20,473,928 | 8,091,556 | 43,015,359 |
Shares redeemed | (50,735,201) | (274,846,934) | (52,856,005) | (253,621,426) |
NET CHANGE RESULTING FROM CLASS R6 SHARE TRANSACTIONS | 50,343,559 | $281,497,158 | 41,993,059 | $209,885,629 |
NET CHANGE RESULTING FROM TOTAL FUND SHARE TRANSACTIONS | (124,046,549) | $(647,289,565) | (225,461,340) | $(995,414,088) |
2021 | 2020 | |
Ordinary income1 | $ 280,584,395 | $351,562,329 |
Long-term capital gains | $— | $446,814,480 |
Undistributed ordinary income | $13,446,952 |
Net unrealized appreciation | $962,430,344 |
Capital loss carryforward | $(185,075,073) |
Short-Term | Long-Term | Total |
$(185,075,073) | $— | $(185,075,073) |
Administrative Fee | Average Daily Net Assets of the Investment Complex |
0.100% | on assets up to $50 billion |
0.075% | on assets over $50 billion |
Share Class Name | Percentage of Average Daily Net Assets of Class |
Class A Shares | 0.05% |
Class C Shares | 0.75% |
Distribution Services Fees Incurred | |
Class C Shares | $5,175,736 |
Purchases | $1,655,312,708 |
Sales | $2,306,745,747 |
December 23, 2021
Beginning Account Value 5/1/2021 | Ending Account Value 10/31/2021 | Expenses Paid During Period1 | |
Actual: | |||
Class A Shares | $ 1,000 | $ 1,040.50 | $ 5.40 |
Class C Shares | $1,000 | $ 1,038.20 | $ 9.25 |
Institutional Shares | $ 1,000 | $ 1,041.50 | $ 4.12 |
Class R6 Shares | $ 1,000 | $ 1,043.40 | $ 4.02 |
Hypothetical (assuming a 5% return before expenses): | |||
Class A Shares | $ 1,000 | $ 1,019.91 | $ 5.35 |
Class C Shares | $ 1,000 | $ 1,016.13 | $ 9.15 |
Institutional Shares | $ 1,000 | $ 1,021.17 | $ 4.08 |
Class R6 Shares | $ 1,000 | $ 1,021.27 | $3.97 |
Class A Shares | 1.05% |
Class C Shares | 1.80% |
Institutional Shares | 0.80% |
Class R6 Shares | 0.78% |
Name Birth Date Positions Held with Trust Date Service Began | Principal Occupation(s) for Past Five Years, Other Directorships Held and Previous Position(s) |
J. Christopher Donahue* Birth Date: April 11, 1949 President and Trustee Indefinite Term Began serving: September 1999 | Principal Occupations: Principal Executive Officer and President of certain of the Funds in the Federated Hermes Fund Family; Director or Trustee of the Funds in the Federated Hermes Fund Family; President, Chief Executive Officer and Director, Federated Hermes, Inc.; Chairman and Trustee, Federated Investment Management Company; Trustee, Federated Investment Counseling; Chairman and Director, Federated Global Investment Management Corp.; Chairman and Trustee, Federated Equity Management Company of Pennsylvania; Trustee, Federated Shareholder Services Company; Director, Federated Services Company. Previous Positions: President, Federated Investment Counseling; President and Chief Executive Officer, Federated Investment Management Company, Federated Global Investment Management Corp. and Passport Research, Ltd; Chairman, Passport Research, Ltd. |
Name Birth Date Positions Held with Trust Date Service Began | Principal Occupation(s) for Past Five Years, Other Directorships Held and Previous Position(s) |
John B. Fisher* Birth Date: May 16, 1956 Trustee Indefinite Term Began serving: May 2016 | Principal Occupations: Principal Executive Officer and President of certain of the Funds in the Federated Hermes Fund Family; Director or Trustee of certain of the Funds in the Federated Hermes Fund Family; Vice President, Federated Hermes, Inc.; President, Director/Trustee and CEO, Federated Advisory Services Company, Federated Equity Management Company of Pennsylvania, Federated Global Investment Management Corp., Federated Investment Counseling, Federated Investment Management Company; President of some of the Funds in the Federated Hermes Fund Family and Director, Federated Investors Trust Company. Previous Positions: President and Director of the Institutional Sales Division of Federated Securities Corp.; President and Director of Federated Investment Counseling; President and CEO of Passport Research, Ltd.; Director, Edgewood Securities Corp.; Director, Federated Services Company; Director, Federated Hermes, Inc.; Chairman and Director, Southpointe Distribution Services, Inc. and President, Technology, Federated Services Company. |
Name Birth Date Positions Held with Trust Date Service Began | Principal Occupation(s) for Past Five Years, Other Directorships Held, Previous Position(s) and Qualifications |
John T. Collins Birth Date: January 24, 1947 Trustee Indefinite Term Began serving: October 2013 | Principal Occupations: Director or Trustee, and Chair of the Board of Directors or Trustees, of the Federated Hermes Fund Family; formerly, Chairman and CEO, The Collins Group, Inc. (a private equity firm) (Retired). Other Directorships Held: Chairman of the Board of Directors, Director, KLX Energy Services Holdings, Inc. (oilfield services); former Director of KLX Corp. (aerospace). Qualifications: Mr. Collins has served in several business and financial management roles and directorship positions throughout his career. Mr. Collins previously served as Chairman and CEO of The Collins Group, Inc. (a private equity firm) and as a Director of KLX Corp. Mr. Collins serves as Chairman Emeriti, Bentley University. Mr. Collins previously served as Director and Audit Committee Member, Bank of America Corp.; Director, FleetBoston Financial Corp.; and Director, Beth Israel Deaconess Medical Center (Harvard University Affiliate Hospital). |
Name Birth Date Positions Held with Trust Date Service Began | Principal Occupation(s) for Past Five Years, Other Directorships Held, Previous Position(s) and Qualifications |
G. Thomas Hough Birth Date: February 28, 1955 Trustee Indefinite Term Began serving: August 2015 | Principal Occupations: Director or Trustee, Chair of the Audit Committee of the Federated Hermes Fund Family; formerly, Vice Chair, Ernst & Young LLP (public accounting firm) (Retired). Other Directorships Held: Director, Chair of the Audit Committee, Equifax, Inc.; Director, Member of the Audit Committee, Haverty Furniture Companies, Inc.; formerly, Director, Member of Governance and Compensation Committees, Publix Super Markets, Inc. Qualifications: Mr. Hough has served in accounting, business management and directorship positions throughout his career. Mr. Hough most recently held the position of Americas Vice Chair of Assurance with Ernst & Young LLP (public accounting firm). Mr. Hough serves on the President’s Cabinet and Business School Board of Visitors for the University of Alabama. Mr. Hough previously served on the Business School Board of Visitors for Wake Forest University, and he previously served as an Executive Committee member of the United States Golf Association. |
Maureen Lally-Green Birth Date: July 5, 1949 Trustee Indefinite Term Began serving: August 2009 | Principal Occupations: Director or Trustee of the Federated Hermes Fund Family; Adjunct Professor Emerita of Law, Duquesne University School of Law; formerly, Dean of the Duquesne University School of Law and Professor of Law and Interim Dean of the Duquesne University School of Law; formerly, Associate General Secretary and Director, Office of Church Relations, Diocese of Pittsburgh. Other Directorships Held: Director, CNX Resources Corporation (formerly known as CONSOL Energy Inc.). Qualifications: Judge Lally-Green has served in various legal and business roles and directorship positions throughout her career. Judge Lally-Green previously held the position of Dean of the School of Law of Duquesne University (as well as Interim Dean). Judge Lally-Green previously served as a member of the Superior Court of Pennsylvania and as a Professor of Law, Duquesne University School of Law. Judge Lally-Green was appointed by the Supreme Court of Pennsylvania to serve on the Supreme Court’s Board of Continuing Judicial Education and the Supreme Court’s Appellate Court Procedural Rules Committee. Judge Lally-Green also currently holds the positions on not for profit or for profit boards of directors as follows: Director and Chair, UPMC Mercy Hospital; Regent, Saint Vincent Seminary; Member, Pennsylvania State Board of Education (public); Director, Catholic Charities, Pittsburgh; and Director CNX Resources Corporation (formerly known as CONSOL Energy Inc.). Judge Lally-Green has held the positions of: Director, Auberle; Director, Epilepsy Foundation of Western and Central Pennsylvania; Director, Ireland Institute of Pittsburgh; Director, Saint Thomas More Society; Director and Chair, Catholic High Schools of the Diocese of Pittsburgh, Inc.; Director, Pennsylvania Bar Institute; Director, St. Vincent College; Director and Chair, North Catholic High School, Inc.; and Director and Vice Chair, Our Campaign for the Church Alive!, Inc. |
Name Birth Date Positions Held with Trust Date Service Began | Principal Occupation(s) for Past Five Years, Other Directorships Held, Previous Position(s) and Qualifications |
Thomas M. O’Neill Birth Date: June 14, 1951 Trustee Indefinite Term Began serving: August 2006 | Principal Occupations: Director or Trustee of the Federated Hermes Fund Family; Sole Proprietor, Navigator Management Company (investment and strategic consulting). Other Directorships Held: None. Qualifications: Mr. O’Neill has served in several business, mutual fund and financial management roles and directorship positions throughout his career. Mr. O’Neill serves as Director, Medicines for Humanity and Director, The Golisano Children’s Museum of Naples, Florida. Mr. O’Neill previously served as Chief Executive Officer and President, Managing Director and Chief Investment Officer, Fleet Investment Advisors; President and Chief Executive Officer, Aeltus Investment Management, Inc.; General Partner, Hellman, Jordan Management Co., Boston, MA; Chief Investment Officer, The Putnam Companies, Boston, MA; Credit Analyst and Lending Officer, Fleet Bank; Director and Consultant, EZE Castle Software (investment order management software); and Director, Midway Pacific (lumber). |
Madelyn A. Reilly Birth Date: February 2, 1956 Trustee Indefinite Term Began serving: November 2020 | Principal Occupations: Director or Trustee of the Federated Hermes Fund Family; Senior Vice President for Legal Affairs, General Counsel and Secretary of the Board of Trustees, Duquesne University. Other Directorships Held: None. Qualifications: Ms. Reilly has served in various business and legal management roles throughout her career. Ms. Reilly previously served as Director of Risk Management and Associate General Counsel, Duquesne University. Prior to her work at Duquesne University, Ms. Reilly served as Assistant General Counsel of Compliance and Enterprise Risk as well as Senior Counsel of Environment, Health and Safety, PPG Industries. |
P. Jerome Richey Birth Date: February 23, 1949 Trustee Indefinite Term Began serving: October 2013 | Principal Occupations: Director or Trustee of the Federated Hermes Fund Family; Management Consultant; Retired; formerly, Senior Vice Chancellor and Chief Legal Officer, University of Pittsburgh and Executive Vice President and Chief Legal Officer, CONSOL Energy Inc. (now split into two separate publicly traded companies known as CONSOL Energy Inc. and CNX Resources Corp.). Other Directorships Held: None. Qualifications: Mr. Richey has served in several business and legal management roles and directorship positions throughout his career. Mr. Richey most recently held the positions of Senior Vice Chancellor and Chief Legal Officer, University of Pittsburgh. Mr. Richey previously served as Chairman of the Board, Epilepsy Foundation of Western Pennsylvania and Chairman of the Board, World Affairs Council of Pittsburgh. Mr. Richey previously served as Chief Legal Officer and Executive Vice President, CONSOL Energy Inc. and CNX Gas Company; and Board Member, Ethics Counsel and Shareholder, Buchanan Ingersoll & Rooney PC (a law firm). |
Name Birth Date Positions Held with Trust Date Service Began | Principal Occupation(s) for Past Five Years, Other Directorships Held, Previous Position(s) and Qualifications |
John S. Walsh Birth Date: November 28, 1957 Trustee Indefinite Term Began serving: January 1999 | Principal Occupations: Director or Trustee of the Federated Hermes Fund Family; President and Director, Heat Wagon, Inc. (manufacturer of construction temporary heaters); President and Director, Manufacturers Products, Inc. (distributor of portable construction heaters); President, Portable Heater Parts, a division of Manufacturers Products, Inc. Other Directorships Held: None. Qualifications: Mr. Walsh has served in several business management roles and directorship positions throughout his career. Mr. Walsh previously served as Vice President, Walsh & Kelly, Inc. (paving contractors). |
Name Birth Date Address Positions Held with Trust Date Service Began | Principal Occupation(s) for Past Five Years and Previous Position(s) |
Lori A. Hensler Birth Date: January 6, 1967 TREASURER Officer since: April 2013 | Principal Occupations: Principal Financial Officer and Treasurer of the Federated Hermes Fund Family; Senior Vice President, Federated Administrative Services; Financial and Operations Principal for Federated Securities Corp.; and Assistant Treasurer, Federated Investors Trust Company. Ms. Hensler has received the Certified Public Accountant designation. Previous Positions: Controller of Federated Hermes, Inc.; Senior Vice President and Assistant Treasurer, Federated Investors Management Company; Treasurer, Federated Investors Trust Company; Assistant Treasurer, Federated Administrative Services, Federated Administrative Services, Inc., Federated Securities Corp., Edgewood Services, Inc., Federated Advisory Services Company, Federated Equity Management Company of Pennsylvania, Federated Global Investment Management Corp., Federated Investment Counseling, Federated Investment Management Company, Passport Research, Ltd., and Federated MDTA, LLC; Financial and Operations Principal for Federated Securities Corp., Edgewood Services, Inc. and Southpointe Distribution Services, Inc. |
Name Birth Date Address Positions Held with Trust Date Service Began | Principal Occupation(s) for Past Five Years and Previous Position(s) |
Peter J. Germain Birth Date: September 3, 1959 CHIEF LEGAL OFFICER, SECRETARY and EXECUTIVE VICE PRESIDENT Officer since: January 2005 | Principal Occupations: Mr. Germain is Chief Legal Officer, Secretary and Executive Vice President of the Federated Hermes Fund Family. He is General Counsel, Chief Legal Officer, Secretary and Executive Vice President, Federated Hermes, Inc.; Trustee and Senior Vice President, Federated Investors Management Company; Trustee and President, Federated Administrative Services; Director and President, Federated Administrative Services, Inc.; Director and Vice President, Federated Securities Corp.; Director and Secretary, Federated Private Asset Management, Inc.; Secretary, Federated Shareholder Services Company; and Secretary, Retirement Plan Service Company of America. Mr. Germain joined Federated Hermes, Inc. in 1984 and is a member of the Pennsylvania Bar Association. Previous Positions: Deputy General Counsel, Special Counsel, Managing Director of Mutual Fund Services, Federated Hermes, Inc.; Senior Vice President, Federated Services Company; and Senior Corporate Counsel, Federated Hermes, Inc. |
Stephen Van Meter Birth Date: June 5, 1975 CHIEF COMPLIANCE OFFICER AND SENIOR VICE PRESIDENT Officer since: July 2015 | Principal Occupations: Senior Vice President and Chief Compliance Officer of the Federated Hermes Fund Family; Vice President and Chief Compliance Officer of Federated Hermes, Inc. and Chief Compliance Officer of certain of its subsidiaries. Mr. Van Meter joined Federated Hermes, Inc. in October 2011. He holds FINRA licenses under Series 3, 7, 24 and 66. Previous Positions: Mr. Van Meter previously held the position of Compliance Operating Officer, Federated Hermes, Inc. Prior to joining Federated Hermes, Inc., Mr. Van Meter served at the United States Securities and Exchange Commission in the positions of Senior Counsel, Office of Chief Counsel, Division of Investment Management and Senior Counsel, Division of Enforcement. |
Stephen F. Auth Birth Date: September 13, 1956 101 Park Avenue 41st Floor New York, NY 10178 CHIEF INVESTMENT OFFICER Officer since: November 2002 | Principal Occupations: Stephen F. Auth is Chief Investment Officer of various Funds in the Federated Hermes Fund Family; Executive Vice President, Federated Investment Counseling, Federated Global Investment Management Corp. and Federated Equity Management Company of Pennsylvania. Previous Positions: Executive Vice President, Federated Investment Management Company and Passport Research, Ltd. (investment advisory subsidiary of Federated); Senior Vice President, Global Portfolio Management Services Division; Senior Vice President, Federated Investment Management Company and Passport Research, Ltd.; Senior Managing Director and Portfolio Manager, Prudential Investments. |
Annual Evaluation of Adequacy and Effectiveness
Federated Hermes Funds
4000 Ericsson Drive
Warrendale, PA 15086-7561
or call 1-800-341-7400.
CUSIP 314172578
CUSIP 314172560
CUSIP 31421N881
| Item 2. | Code of Ethics |
(a) As of the end of the period covered by this report, the registrant has adopted a code of ethics (the "Section 406 Standards for Investment Companies - Ethical Standards for Principal Executive and Financial Officers") that applies to the registrant's Principal Executive Officer and Principal Financial Officer; the registrant's Principal Financial Officer also serves as the Principal Accounting Officer.
(c) There was no amendment to the registrant’s code of ethics described in Item 2(a) above during the period covered by the report.
(d) There was no waiver granted, either actual or implicit, from a provision to the registrant’s code of ethics described in Item 2(a) above during the period covered by the report.
(e) Not Applicable
(f)(3) The registrant hereby undertakes to provide any person, without charge, upon request, a copy of the code of ethics. To request a copy of the code of ethics, contact the registrant at 1-800-341-7400, and ask for a copy of the Section 406 Standards for Investment Companies - Ethical Standards for Principal Executive and Financial Officers.
Item 3. Audit Committee Financial Expert
The registrant's Board has determined that each of the following members of the Board's Audit Committee is an “audit committee financial expert,” and is "independent," for purposes of this Item: G. Thomas Hough and Thomas M. O'Neill.
| Item 4. | Principal Accountant Fees and Services |
(a) Audit Fees billed to the registrant for the two most recent fiscal years:
Fiscal year ended 2021 – $285,597
Fiscal year ended 2020 - $321,016
(b) Audit-Related Fees billed to the registrant for the two most recent fiscal years:
Fiscal year ended 2021 - $0
Fiscal year ended 2020 - $0
Amount requiring approval of the registrant’s Audit Committee pursuant to paragraph (c)(7)(ii) of Rule 2-01 of Regulation S-X, $0 and $0 respectively.
(c) Tax Fees billed to the registrant for the two most recent fiscal years:
Fiscal year ended 2021 - $7,625
Fiscal year ended 2020 - $0
Fiscal year ended 2021- International tax advice with respect to exchange of American Depositary Receipt.
Amount requiring approval of the registrant’s Audit Committee pursuant to paragraph (c)(7)(ii) of Rule 2-01 of Regulation S-X, $0 and $0 respectively.
(d) All Other Fees billed to the registrant for the two most recent fiscal years:
Fiscal year ended 2021 - $0
Fiscal year ended 2020 - $0
Amount requiring approval of the registrant’s Audit Committee pursuant to paragraph (c)(7)(ii) of Rule 2-01 of Regulation S-X, $48,979 and $44,125 respectively. Fiscal year ended 2021- Service fees for analysis of potential Passive Foreign Investment Company holdings. Fiscal year ended 2020- Service fees for analysis of potential Passive Foreign Investment Company holdings.
(e)(1) Audit Committee Policies regarding Pre-approval of Services.
The Audit Committee is required to pre-approve audit and non-audit services performed by the independent auditor in order to assure that the provision of such services do not impair the auditor’s independence. Unless a type of service to be provided by the independent auditor has received general pre-approval, it will require specific pre-approval by the Audit Committee. Any proposed services exceeding pre-approved cost levels will require specific pre-approval by the Audit Committee.
Certain services have the general pre-approval of the Audit Committee. The term of the general pre-approval is 12 months from the date of pre-approval, unless the Audit Committee specifically provides for a different period. The Audit Committee will annually review the services that may be provided by the independent auditor without obtaining specific pre-approval from the Audit Committee and may grant general pre-approval for such services. The Audit Committee will revise the list of general pre-approved services from time to time, based on subsequent determinations. The Audit Committee will not delegate to management its responsibilities to pre-approve services performed by the independent auditor.
The Audit Committee has delegated pre-approval authority to its chairman (the “Chairman”) for services that do not exceed a specified dollar threshold. The Chairman or Chief Audit Executive will report any such pre-approval decisions to the Audit Committee at its next scheduled meeting. The Committee will designate another member with such pre-approval authority when the Chairman is unavailable.
AUDIT SERVICES
The annual audit services engagement terms and fees will be subject to the specific pre-approval of the Audit Committee. The Audit Committee will approve, if necessary, any changes in terms, conditions and fees resulting from changes in audit scope, registered investment company (RIC) structure or other matters.
In addition to the annual audit services engagement specifically approved by the Audit Committee, the Audit Committee may grant general pre-approval for other audit services, which are those services that only the independent auditor reasonably can provide. The Audit Committee has pre-approved certain audit services; with limited exception, all other audit services must be specifically pre-approved by the Audit Committee.
AUDIT-RELATED SERVICES
Audit-related services are assurance and related services that are reasonably related to the performance of the audit or review of the RIC’s financial statements or that are traditionally performed by the independent auditor. The Audit Committee believes that the provision of audit-related services does not impair the independence of the auditor, and has pre-approved certain audit-related services; all other audit-related services must be specifically pre-approved by the Audit Committee.
TAX SERVICES
The Audit Committee believes that the independent auditor can provide tax services to the RIC such as tax compliance, tax planning and tax advice without impairing the auditor’s independence. However, the Audit Committee will not permit the retention of the independent auditor in connection with a transaction initially recommended by the independent auditor, the purpose of which may be tax avoidance and the tax treatment of which may not be supported in the Internal Revenue Code and related regulations. The Audit Committee has pre-approved certain tax services; with limited exception, all tax services involving large and complex transactions must be specifically pre-approved by the Audit Committee.
ALL OTHER SERVICES
With respect to the provision of permissible services other than audit, review or attest services the pre-approval requirement is waived if:
| (1) | With respect to such services rendered to the Funds, the aggregate amount of all such services provided constitutes no more than five percent of the total amount of revenues paid by the audit client to its accountant during the fiscal year in which the services are provided; and, |
| (2) | With respect to such services rendered to the Fund’s investment adviser ( the “Adviser”)and any entity controlling, controlled by to under common control with the Adviser such as affiliated non-U.S. and U.S. funds not under the Audit Committee’s purview and which do not fall within a category of service which has been determined by the Audit Committee not to have a direct impact on the operations or financial reporting of the RIC, the aggregate amount of all services provided constitutes no more than five percent of the total amount of revenues paid to the RIC’s auditor by the RIC, its Adviser and any entity controlling, controlled by, or under common control with the Adviser during the fiscal year in which the services are provided; and |
| (3) | Such services were not recognized by the issuer or RIC at the time of the engagement to be non-audit services; and |
| (4) | Such services are promptly brought to the attention of the Audit Committee and approved prior to the completion of the audit by the Audit Committee or by one or more members of the Audit Committee who are members of the Board of Directors to whom authority to grant such approvals has been delegated by the Audit Committee. |
The Audit Committee may grant general pre-approval to those permissible non-audit services which qualify for pre-approval and which it believes are routine and recurring services, and would not impair the independence of the auditor.
The Securities and Exchange Commission’s (the “SEC”) rules and relevant guidance should be consulted to determine the precise definitions of these services and applicability of exceptions to certain of the prohibitions.
PRE-APPROVAL FEE LEVELS
Pre-approval fee levels for all services to be provided by the independent auditor will be established annually by the Audit Committee. Any proposed services exceeding these levels will require specific pre-approval by the Audit Committee.
PROCEDURES
Requests or applications to provide services that require specific approval by the Audit Committee will be submitted to the Audit Committee by the Fund’s Principal Accounting Officer and/or the Chief Audit Executive of Federated Hermes, Inc., only after those individuals have determined that the request or application is consistent with the SEC’s rules on auditor independence.
(e)(2) Percentage of services identified in items 4(b) through 4(d) that were approved by the registrant’s Audit Committee pursuant to paragraph (c)(7)(i)(C) of Rule 2-01 of Regulation S-X:
4(b)
Fiscal year ended 2021 – 0%
Fiscal year ended 2020 - 0%
Percentage of services provided to the registrant’s Adviser and any entity controlling, controlled by, or under common control with the Adviser that provides ongoing services to the registrant that were approved by the registrant’s Audit Committee pursuant to paragraph (c)(7)(i)(C) of Rule 2-01 of Regulation S-X, 0% and 0% respectively.
4(c)
Fiscal year ended 2021 – 0%
Fiscal year ended 2020 – 0%
Percentage of services provided to the registrant’s Adviser and any entity controlling, controlled by, or under common control with the Adviser that provides ongoing services to the registrant that were approved by the registrant’s Audit Committee pursuant to paragraph (c)(7)(i)(C) of Rule 2-01 of Regulation S-X, 0% and 0% respectively.
4(d)
Fiscal year ended 2021 – 0%
Fiscal year ended 2020 – 0%
Percentage of services provided to the registrant’s Adviser and any entity controlling, controlled by, or under common control with the Adviser that provides ongoing services to the registrant that were approved by the registrant’s Audit Committee pursuant to paragraph (c)(7)(i)(C) of Rule 2-01 of Regulation S-X, 0% and 0% respectively.
| (f) | NA |
| (g) | Non-Audit Fees billed to the registrant, the registrant’s Adviser, and certain entities controlling, controlled by or under common control with the Adviser: |
Fiscal year ended 2021 - $118,948
Fiscal year ended 2020 - $131,139
| (h) | The registrant’s Audit Committee has considered that the provision of non-audit services that were rendered to the registrant’s Adviser (not including any sub-adviser whose role is primarily portfolio management and is subcontracted with or overseen by another investment adviser), and any entity controlling, controlled by, or under common control with the Adviser that provides ongoing services to the registrant that were not pre-approved pursuant to paragraph (c)(7)(ii) of Rule 2-01 of Regulation S-X is compatible with maintaining the principal accountant’s independence. |
| Item 5. | Audit Committee of Listed Registrants |
Not Applicable
| Item 6. | Schedule of Investments |
(a) The registrant’s Schedule of Investments is included as part of the Report to Stockholders filed under Item 1 of this form.
(b) Not Applicable; Fund had no divestments during the reporting period covered since the previous Form N-CSR filing.
| Item 7. | Disclosure of Proxy Voting Policies and Procedures for Closed-End Management Investment Companies |
Not Applicable
| Item 8. | Portfolio Managers of Closed-End Management Investment Companies |
Not Applicable
| Item 9. | Purchases of Equity Securities by Closed-End Management Investment Company and Affiliated Purchasers |
Not Applicable
| Item 10. | Submission of Matters to a Vote of Security Holders |
No Changes to Report
| Item 11. | Controls and Procedures |
(a) The registrant’s President and Treasurer have concluded that the
registrant’s disclosure controls and procedures (as defined in rule 30a-3(c) under the Act) are effective in design and operation and are sufficient to form the basis of the certifications required by Rule 30a-(2) under the Act, based on their evaluation of these disclosure controls and procedures within 90 days of the filing date of this report on Form N-CSR.
(b) There were no changes in the registrant’s internal control over financial reporting (as defined in rule 30a-3(d) under the Act) during the registrant’s most recent fiscal half-year (the registrant’s second fiscal half-year in the case of an annual report) that have materially affected, or are reasonably likely to materially affect, the registrant’s internal control over financial reporting.
| Item 12. | Disclosure of Securities Lending Activities for Closed-End Management Investment Companies |
Not Applicable
| Item 13. | Exhibits |
(a)(1) Code of Ethics- Not Applicable to this Report.
(a)(2) Certifications of Principal Executive Officer and Principal Financial Officer.
(a)(3) Not Applicable.
(b) Certifications pursuant to 18 U.S.C. Section 1350.
SIGNATURES
Pursuant to the requirements of the Securities Exchange Act of 1934 and the Investment Company Act of 1940, the registrant has duly caused this report to be signed on its behalf by the undersigned, thereunto duly authorized.
Registrant Federated Hermes Equity Funds
By /S/ Lori A. Hensler
Lori A. Hensler, Principal Financial Officer
Date December 23, 2021
Pursuant to the requirements of the Securities Exchange Act of 1934 and the Investment Company Act of 1940, this report has been signed below by the following persons on behalf of the registrant and in the capacities and on the dates indicated.
By /S/ J. Christopher Donahue
J. Christopher Donahue, Principal Executive Officer
Date December 23, 2021
By /S/ Lori A. Hensler
Lori A. Hensler, Principal Financial Officer
Date December 23, 2021