CHAPTER IV
BORROWING AND DEBT MANAGEMENT
HIGHLIGHTS
| § | The total funding requirement for 2009–10 has declined by $6 billion since the Fall 2009 Ontario Economic Outlook and Fiscal Review, due primarily to the $3.4 billion decline in the projected deficit. |
| § | Long-term public borrowing is forecast at $39.7 billion for 2010–11, down $4.1 billion from $43.8 billion for 2009–10. |
| § | Interest on debt expense is $476 million lower than forecast in the Fall 2009 Ontario Economic Outlook and Fiscal Review, reflecting lower-than-forecast interest rates, more financing at shorter-term maturities and a lower deficit. |
| § | Total debt is projected to be $212.4 billion as at March 31, 2010. |
| § | Net debt is projected to be $193.2 billion as at March 31, 2010. |
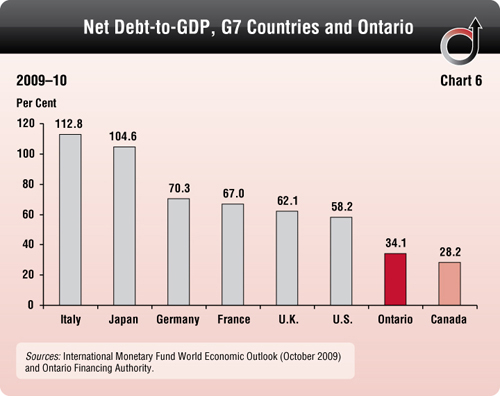
| § | In 2009–10, Canada’s and Ontario’s net debt-to-GDP ratios were well below those of G7 countries. |
| § | Ontario’s net debt-to-GDP level was near the median for Canadian provinces in 2008–09, the most recent year for which data are available. |
| § | For 2010–11, the impact of a one per cent increase in interest rates would be an estimated additional $480 million in interest cost for the Province. |
LONG-TERM PUBLIC BORROWING
Ontario successfully completed its largest annual borrowing program in 2009–10, despite continuing challenges in global financial markets. It did so mainly through greater diversification in international bond markets and by being responsive to its bond investors.
The interim long-term borrowing for 2009–10 is $43.8 billion, compared to $42.6 billion in the Fall 2009 Ontario Economic Outlook and Fiscal Review. The difference is primarily due to a decision to increase cash reserves, partially offset by the $3.4 billion reduction in the deficit.
In 2009–10, 51 per cent ($22.4 billion) was borrowed in international capital markets. Bonds issued in foreign currencies were:
| § | Global bonds in U.S. dollars |
| § | Euro Medium-Term Notes (EMTNs) in euros, Swiss francs and Hong Kong dollars. |
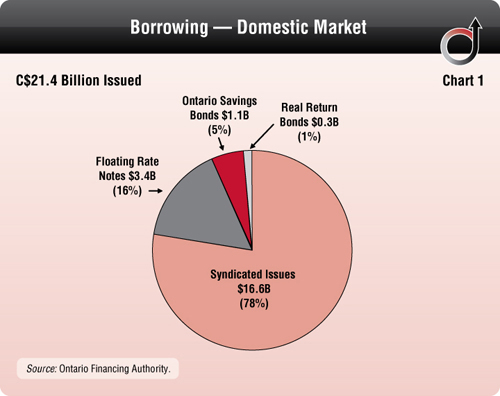
About $21.4 billion, or 49 per cent, of borrowing was completed in the domestic market through a number of instruments, including:
2009–10 Borrowing Program: Table 1 Province and Ontario Electricity Financial Corporation ($ Billions) | |
| | | Fall Outlook | | | Interim | | | In-Year Change | |
| Deficit | | | 24.7 | | | | 21.3 | | | | (3.4 | ) |
| Investment in Capital Assets | | | 9.5 | | | | 8.5 | | | | (1.0 | ) |
| Non-Cash Adjustments | | | 0.5 | | | | (0.6 | ) | | | (1.1 | ) |
| Net Loans/Investments | | | 1.6 | | | | 1.3 | | | | (0.3 | ) |
| Debt Maturities | | | 14.7 | | | | 14.6 | | | | (0.1 | ) |
| Debt Redemptions | | | 0.4 | | | | 0.4 | | | | – | |
| Total Funding Requirement | | | 51.5 | | | | 45.5 | | | | (6.0 | ) |
| Canada Pension Plan Borrowing | | | (1.1 | ) | | | (1.1 | ) | | | – | |
| Decrease/(Increase) in Short-Term Borrowing | | | (7.8 | ) | | | (6.0 | ) | | | 1.8 | |
| Increase/(Decrease) in Cash and Cash Equivalents | | | – | | | | 5.5 | | | | 5.5 | |
| Total Long-Term Public Borrowing | | | 42.6 | | | | 43.8 | | | | 1.2 | |
Note: Numbers may not add due to rounding. | |
The total funding requirement for 2009–10 has declined by $6 billion since the Fall 2009 Ontario Economic Outlook and Fiscal Review, primarily due to the decline in the projected deficit. This has allowed the Province to increase its cash balance, which will provide greater flexibility in meeting its funding requirement for 2010–11.
Interest on debt (IOD) expense, at $8,930 million, is $476 million lower than forecast in the Fall 2009 Ontario Economic Outlook and Fiscal Review. This reduction in IOD reflects the impact of lower-than-forecast interest rates on floating rate debt, more financing at shorter-term maturities, and a lower deficit than forecast in the Fall 2009 Ontario Economic Outlook and Fiscal Review.
Medium-Term Borrowing Outlook: Table 2 Province and Ontario Electricity Financial Corporation ($ Billions) | |
| | | | 2010–11 | | | | 2011–12 | | | | 2012–13 | |
| Deficit | | | 19.7 | | | | 17.3 | | | | 15.9 | |
| Investment in Capital Assets | | | 9.8 | | | | 10.6 | | | | 10.4 | |
| Non-Cash Adjustments | | | (1.7 | ) | | | (3.0 | ) | | | (2.8 | ) |
| Net Loans/Investments | | | 1.9 | | | | 1.8 | | | | 1.0 | |
| Debt Maturities | | | 15.6 | | | | 14.0 | | | | 17.3 | |
| Debt Redemptions | | | 0.4 | | | | 0.4 | | | | 0.5 | |
| Total Funding Requirement | | | 45.6 | | | | 41.1 | | | | 42.2 | |
| Canada Pension Plan Borrowing | | | (0.8 | ) | | | (1.1 | ) | | | (0.8 | ) |
| Decrease/(Increase) in Short-Term Borrowing | | | (1.6 | ) | | | (1.2 | ) | | | (1.2 | ) |
| Increase/(Decrease) in Cash and Cash Equivalents | | | (3.5 | ) | | | – | | | | – | |
| Total Long-Term Public Borrowing | | | 39.7 | | | | 38.8 | | | | 40.2 | |
Note: Numbers may not add due to rounding. | |
The 2010–11 borrowing requirements are primarily the result of the deficit, investments in capital assets and the refinancing of debt maturities. To meet the borrowing requirements, Ontario will continue to be flexible, monitoring domestic and international markets, issuing bonds in different terms and currencies, and responding to investor preferences. Diversification of borrowing sources will continue to be a primary objective in 2010–11. Depending on market conditions, the Province plans to borrow at least 50 per cent in the domestic market.
For fiscal years 2009–10 to 2011–12, the Province’s total funding requirement has declined by a cumulative $8.7 billion from the forecasts included in the Fall 2009 Ontario Economic Outlook and Fiscal Review. This decrease is primarily due to lower-than-forecast deficits in these years.
The government will seek approval from the legislature for borrowing authority to meet the Province’s requirements.
DEBT
Total debt, which represents all borrowing without offsetting financial assets, is projected to be $212.4 billion as at March 31, 2010, compared to $176.9 billion as at March 31, 2009.
Ontario’s net debt is the difference between total liabilities and total financial assets. Starting in 2009–10, the broader public sector’s (BPS) net debt is included in the Province’s net debt because of the adoption of a revised presentation of BPS revenues, expenses, assets and liabilities in the Province’s consolidated financial reports. Broader public-sector organizations include hospitals, school boards and colleges. To be consistent with the presentation used in 2009–10, net debt has been restated for prior years to 2005–06.
Until 2009–10, the Province’s net debt excluded net debt of hospitals, school boards and colleges, which was previously included in the Province’s net assets of BPS organizations in the Province’s consolidated financial statements (see the Addendum to the 2010 Ontario Budget: Ontario’s Plan to Enhance Accountability, Transparency and Financial Management for further details on changes in the Province’s financial presentation of BPS organizations). This change does not impact the Province’s annual surplus/deficit results or accumulated deficit.
Ontario’s net debt is projected to be $193.2 billion as at March 31, 2010. This figure includes BPS net debt of $11.6 billion. As at March 31, 2009, net debt was $165.9 billion, including $10.6 billion related to the BPS.
Interim 2009–10 results for the Ontario Electricity Financial Corporation (OEFC) show a projected excess of revenue over expense of about $1.4 billion, reducing the Corporation’s unfunded liability (or “stranded debt of the electricity sector”) from $16.2 billion as at March 31, 2009 to $14.8 billion as at March 31, 2010. Projected 2010–11 OEFC results are an excess of revenue over expense of about $1.0 billion, which would reduce the unfunded liability to $13.8 billion as at March 31, 2011.
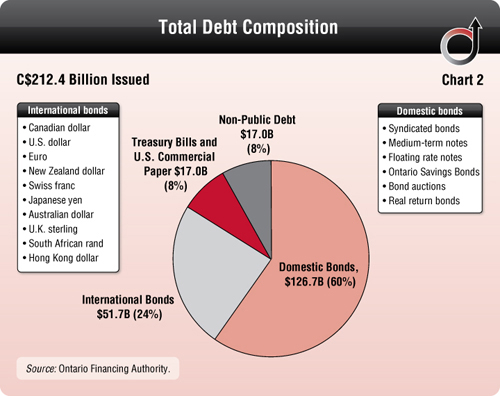
TOTAL DEBT COMPOSITION
Total debt consists of bonds issued in the public capital markets, non-public debt, treasury bills and U.S. commercial paper.
Public debt totals $195.4 billion, primarily consisting of bonds issued in the domestic and international long-term public markets in 10 currencies. Ontario also has $17.0 billion outstanding in non-public debt issued in Canadian dollars. Non-public debt consists of debt instruments issued to public-sector pension funds in Ontario and the Canada Pension Plan Investment Board (CPPIB). This debt is not marketable and cannot be traded.
DEBT-TO-GDP RATIOS
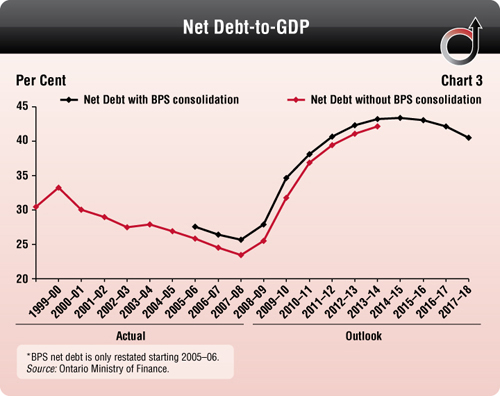
The Province’s debt-to-GDP ratios are expected to increase due to the projected deficits. The ratios stabilize and begin to decline during the period of the recovery plan to balance the budget.
This year, because of changes to the Province’s financial presentation of BPS organizations, the Province’s net debt-to-GDP ratio is shown with and without BPS net debt of hospitals, school boards and colleges for comparison purposes to 2013–14.
Going forward, only the Province’s net debt, including BPS net debt, will be illustrated.
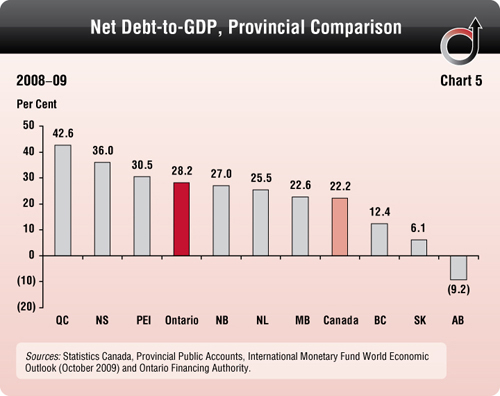
In 2008–09, the most recent year for which data are available for all provinces, Ontario’s net debt-to-GDP level was near the median for the provinces.
In 2009–10, Canada’s and Ontario’s net debt-to-GDP ratios were well below those of G7 countries.
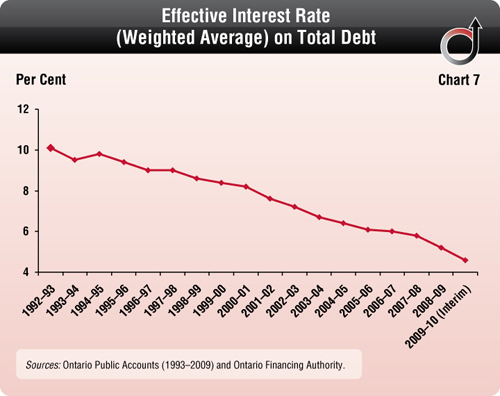
COST OF DEBT
The effective interest rate (on a weighted-average basis) on total debt is estimated to be 4.57 per cent as at March 31, 2010 (March 31, 2009, 5.17 per cent). For comparison, as at March 31, 1993, the effective interest rate on total debt was 10.14 per cent. The effective interest rate on public debt is estimated to be 4.32 per cent as at March 31, 2010 (March 31, 2009, 4.83 per cent).
The effective interest rate on non-public debt is estimated to be 7.38 per cent as at March 31, 2010 (March 31, 2009, 8.05 per cent).
For 2010–11, the impact of a one per cent increase in interest rates would be an estimated additional $480 million in interest cost for the Province.
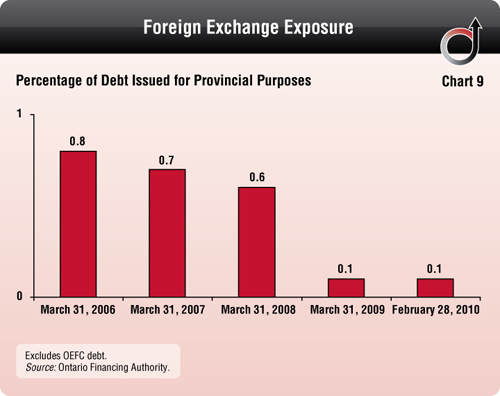
RISK EXPOSURE
The Province limits itself to a maximum net interest-rate resetting exposure of 35 per cent of debt issued for Provincial purposes and a maximum foreign-exchange exposure of five per cent of debt issued for Provincial purposes. As at February 28, 2010, the net interest-rate resetting exposure was 11.1 per cent and foreign-exchange exposure was 0.1 per cent. All exposures remained well below policy limits in 2009–10.
CONSOLIDATED FINANCIAL TABLES
Net Debt and Accumulated Deficit Table 3 Interim 2010 ($ Millions) | |
| | | | 2005–06 | | | | 2006–07 | | | | 2007–08 | | | | 2008–09 | | | Interim 2009–10 | | | Plan 2010–11 | |
Debt1 | | | | | | | | | | | | | | | | | | | | | | |
| Publicly Held Debt | | | | | | | | | | | | | | | | | | | | | | |
Bonds2 | | | 123,129 | | | | 128,666 | | | | 134,362 | | | | 145,398 | | | | 176,020 | | | | 201,702 | |
Treasury Bills | | | 5,215 | | | | 4,249 | | | | 5,092 | | | | 9,044 | | | | 13,616 | | | | 15,216 | |
U.S. Commercial Paper2 | | | 706 | | | | 254 | | | | 644 | | | | 2,006 | | | | 3,471 | | | | 3,471 | |
Infrastructure Ontario (IO)3 | | | 1,323 | | | | 1,262 | | | | 1,632 | | | | 1,695 | | | | 1,890 | | | | 1,890 | |
Other | | | 387 | | | | – | | | | – | | | | 68 | | | | 296 | | | | 294 | |
| | | | 130,760 | | | | 134,431 | | | | 141,730 | | | | 158,211 | | | | 195,293 | | | | 222,573 | |
| Non-Public Debt | | | | | | | | | | | | | | | | | | | | | | | | |
Canada Pension Plan Investment Board | | | 10,233 | | | | 10,233 | | | | 10,233 | | | | 10,233 | | | | 10,233 | | | | 10,233 | |
Ontario Teachers’ Pension Fund | | | 7,596 | | | | 6,411 | | | | 4,466 | | | | 3,001 | | | | 1,765 | | | | 1,205 | |
Public Service Pension Fund | | | 2,705 | | | | 2,502 | | | | 2,260 | | | | 1,991 | | | | 1,713 | | | | 1,403 | |
Ontario Public Service Employees’ Union Pension Fund (OPSEU) | | | 1,285 | | | | 1,188 | | | | 1,074 | | | | 946 | | | | 814 | | | | 667 | |
Canada Mortgage and Housing Corporation | | | 960 | | | | 914 | | | | 863 | | | | 811 | | | | 755 | | | | 696 | |
Other4 | | | 1,367 | | | | 1,314 | | | | 1,430 | | | | 1,632 | | | | 1,702 | | | | 1,541 | |
| | | | 24,146 | | | | 22,562 | | | | 20,326 | | | | 18,614 | | | | 16,982 | | | | 15,745 | |
| | | | 154,906 | | | | 156,993 | | | | 162,056 | | | | 176,825 | | | | 212,275 | | | | 238,318 | |
| Unrealized Foreign Exchange Gains | | | 426 | | | | 318 | | | | 161 | | | | 90 | | | | 112 | | | | 94 | |
| Total Debt | | | 155,332 | | | | 157,311 | | | | 162,217 | | | | 176,915 | | | | 212,387 | | | | 238,412 | |
Net Debt and Accumulated Deficit (cont’d) Table 3 Interim 2010 ($ Millions) | |
| | | | 2005–06 | | | | 2006–07 | | | | 2007–08 | | | | 2008–09 | | | Interim 2009–10 | | | Plan 2010–11 | |
| Total Debt | | | 155,332 | | | | 157,311 | | | | 162,217 | | | | 176,915 | | | | 212,387 | | | | 238,412 | |
Cash and Temporary Investments5 | | | (7,426 | ) | | | (6,622 | ) | | | (8,144 | ) | | | (11,878 | ) | | | (17,492 | ) | | | (13,848 | ) |
| Total Debt Net of Cash and Temporary Investments | | | 147,906 | | | | 150,689 | | | | 154,073 | | | | 165,037 | | | | 194,895 | | | | 224,564 | |
Other Net (Assets)/Liabilities5 | | | (5,852 | ) | | | (8,581 | ) | | | (10,365 | ) | | | (9,735 | ) | | | (13,223 | ) | | | (15,484 | ) |
Broader Public Sector (BPS) Net Debt6 | | | 7,874 | | | | 8,510 | | | | 9,480 | | | | 10,562 | | | | 11,554 | | | | 10,911 | |
Net Debt7 | | | 149,928 | | | | 150,618 | | | | 153,188 | | | | 165,864 | | | | 193,226 | | | | 219,991 | |
Non-Financial Assets8 | | | (40,773 | ) | | | (43,842 | ) | | | (47,571 | ) | | | (52,626 | ) | | | (58,658 | ) | | | (65,733 | ) |
| Accumulated Deficit | | | 109,155 | | | | 106,776 | | | | 105,617 | | | | 113,238 | | | | 134,568 | | | | 154,258 | |
1Includes debt issued by the Province and Government Organizations, including the OEFC. 2All balances are expressed in Canadian dollars. The balances above reflect the effect of related derivative contracts. 3Infrastructure Ontario’s (IO) interim 2009–10 debt is composed of Infrastructure Renewal Bonds ($1,250 million) and short-term commercial paper ($640 million). IO’s debt is not guaranteed by the Province. 4Other non-public debt includes Ontario Immigrant Investor Corporation, Ontario Municipal Employees Retirement Fund, College of Applied Arts and Technology Pension Plan, Ryerson Retirement Pension Plan and indirect debt of school boards (the indirect debt of school boards was incurred in June 2003 to permanently refinance the debt of 55 school boards). 5Other Net (Assets)/Liabilities include accounts receivable, loans receivable, advances and investments in government business enterprises, accounts payable, accrued liabilities, pensions and the liability for power purchase agreements with non-utility generators. Prior periods have been restated to reflect elimination of intercompany balances on consolidation of BPS starting in 2009–10. 6BPS Net Debt includes cash, temporary investments, accounts receivable, loans receivable, other long-term financing, loans payable, accounts payable, accrued liabilities, pensions and other employee future benefits and liability. 7Starting in 2009–10, net debt includes the net debt of hospitals, school boards and colleges (BPS) consistent with changes in accounting standards. For comparative purposes, net debt has been restated from 2005–06 to 2008–09 to conform with this revised presentation. 8Starting in fiscal year 2009–10, this line item now includes the tangible capital assets of BPS and is net of deferred capital contributions. Fiscal years 2005–06 to 2008–09 have been restated to conform with this presentation. Source: Ontario Ministry of Finance. | |
Debt Maturity Schedule Table 4 Interim 2010 ($ Millions) | |
| Currency | |
| | | Canadian Dollar | | | U.S. Dollar | | | Japanese Yen | | | Euro | | | Other Currencies1 | | | Interim 2009–10 Total | | | 2008–09 Total | |
| Fiscal Year Payable | |
| Year 1 | | | 26,924 | | | | 6,832 | | | | – | | | | – | | | | 252 | | | | 34,008 | | | | 25,382 | |
| Year 2 | | | 8,771 | | | | 4,664 | | | | – | | | | – | | | | 47 | | | | 13,482 | | | | 16,394 | |
| Year 3 | | | 7,255 | | | | 9,564 | | | | – | | | | – | | | | 550 | | | | 17,369 | | | | 13,742 | |
| Year 4 | | | 15,250 | | | | 1,010 | | | | 165 | | | | 2,343 | | | | 576 | | | | 19,344 | | | | 11,975 | |
| Year 5 | | | 11,832 | | | | 9,142 | | | | 59 | | | | – | | | | 717 | | | | 21,750 | | | | 16,938 | |
| 1–5 years | | | 70,032 | | | | 31,212 | | | | 224 | | | | 2,343 | | | | 2,142 | | | | 105,953 | | | | 84,431 | |
| 6–10 years | | | 23,201 | | | | 5,483 | | | | 96 | | | | 5,288 | | | | 2,794 | | | | 36,862 | | | | 27,101 | |
| 11–15 years | | | 12,142 | | | | – | | | | – | | | | – | | | | – | | | | 12,142 | | | | 11,097 | |
| 16–20 years | | | 15,602 | | | | – | | | | – | | | | – | | | | – | | | | 15,602 | | | | 16,658 | |
| 21–25 years | | | 9,626 | | | | – | | | | – | | | | – | | | | – | | | | 9,626 | | | | 8,816 | |
26–45 years2 | | | 32,090 | | | | – | | | | – | | | | – | | | | – | | | | 32,090 | | | | 28,722 | |
| Unamortized Foreign Exchange Gains | | | – | | | | 71 | | | | (1 | ) | | | 44 | | | | (2 | ) | | | 112 | | | | 90 | |
Total3 | | | 162,693 | | | | 36,766 | | | | 319 | | | | 7,675 | | | | 4,934 | | | | 212,387 | | | | 176,915 | |
| Debt Issued for Provincial Purposes | | | 139,195 | | | | 34,285 | | | | 319 | | | | 7,496 | | | | 3,713 | | | | 185,008 | | | | 149,247 | |
| OEFC Debt | | | 23,498 | | | | 2,481 | | | | – | | | | 179 | | | | 1,221 | | | | 27,379 | | | | 27,668 | |
| Total | | | 162,693 | | | | 36,766 | | | | 319 | | | | 7,675 | | | | 4,934 | | | | 212,387 | | | | 176,915 | |
1Other currencies includes Australian dollar, New Zealand dollar, U.K. sterling, Swiss franc, Hong Kong dollar and South African rand. 2The longest term to maturity is to June 2, 2054. 3Total foreign currency denominated debt (before unrealized foreign exchange gains) as at March 31, 2010, is projected to be $49.7 billion (2009, $31.5 billion). Of that, $49.2 billion or 99.0 per cent (2009, $31.2 billion or 99.1 per cent) was fully hedged to Canadian dollars. | |
Medium-Term Outlook Table 5 Net Debt and Accumulated Deficit ($ Billions) | |
| | | | 2011–12 | | | | 2012–13 | |
| Total Debt | | | 265.1 | | | | 289.3 | |
| Cash and Temporary Investments | | | (13.8 | ) | | | (13.8 | ) |
| Total Debt Net of Cash and Temporary Investments | | | 251.3 | | | | 275.6 | |
| Other Net (Assets)/Liabilities | | | (17.6 | ) | | | (19.2 | ) |
| Broader Public Sector (BPS) Net Debt | | | 11.4 | | | | 11.4 | |
| Net Debt | | | 245.0 | | | | 267.8 | |
| Non-Financial Assets | | | (73.5 | ) | | | (80.3 | ) |
| Accumulated Deficit | | | 171.6 | | | | 187.5 | |
Note: Numbers may not add due to rounding. | |
Derivative Portfolio Notional Value Table 6 Interim 2010 ($ Millions) | |
Maturity in Fiscal Year | | | 2010–11 | | | | 2011–12 | | | | 2012–13 | | | | 2013–14 | | | | 2014–15 | | | 6–10 Years | | | Over 10 Years | | | Interim 2009–10 Total | | | 2008–09 Total | |
| Swaps: | | | | | | | | | | | | | | | | | | | | | | | | | | | | | | | | |
| Interest rate | | | 9,472 | | | | 10,763 | | | | 12,491 | | | | 6,596 | | | | 24,112 | | | | 22,772 | | | | 6,274 | | | | 92,480 | | | | 74,207 | |
Cross currency | | | 5,877 | | | | 3,992 | | | | 10,396 | | | | 6,068 | | | | 7,602 | | | | 15,692 | | | | – | | | | 49,627 | | | | 31,847 | |
| Forward foreign exchange contracts | | | 3,510 | | | | – | | | | – | | | | – | | | | – | | | | – | | | | – | | | | 3,510 | | | | 8,881 | |
| Caps and floors | | | – | | | | – | | | | – | | | | – | | | | – | | | | – | | | | – | | | | – | | | | 88 | |
| Total | | | 18,859 | | | | 14,755 | | | | 22,887 | | | | 12,664 | | | | 31,714 | | | | 38,464 | | | | 6,274 | | | | 145,617 | | | | 115,023 | |
The table above presents the maturity schedule of the Province’s derivatives by type, interim as at March 31, 2010, based on the notional amounts of the contracts. Notional amounts represent the volume of outstanding derivative contracts and are not indicative of credit risk, market risk or actual cash flows. The Province uses derivatives to hedge and to minimize interest costs. Hedges are created primarily through swaps. Swaps allow the Province to offset existing obligations, effectively converting them into obligations with more desirable characteristics.