UNITED STATES
SECURITIES AND EXCHANGE COMMISSION
Washington, D.C. 20549
FORM N-CSR
CERTIFIED SHAREHOLDER REPORT OF REGISTERED
MANAGEMENT INVESTMENT COMPANIES
|
| | | | | | |
| Investment Company Act file number | 811-04025 |
| | |
| AMERICAN CENTURY MUNICIPAL TRUST |
| (Exact name of registrant as specified in charter) |
| | |
| 4500 MAIN STREET, KANSAS CITY, MISSOURI | 64111 |
| (Address of principal executive offices) | (Zip Code) |
| | |
CHARLES A. ETHERINGTON 4500 MAIN STREET, KANSAS CITY, MISSOURI 64111 |
| (Name and address of agent for service) |
| | |
| Registrant’s telephone number, including area code: | 816-531-5575 |
| | |
| Date of fiscal year end: | 05-31 |
| | |
| Date of reporting period: | 05-31-2016 |
ITEM 1. REPORTS TO STOCKHOLDERS.
|
| |
| | |
| | Annual Report |
| | |
| | May 31, 2016 |
| | |
| | High-Yield Municipal Fund |
|
| | |
| President’s Letter | 2 |
|
| Performance | 3 |
|
| Portfolio Commentary | |
|
| Fund Characteristics | |
|
| Shareholder Fee Example | |
|
| Schedule of Investments | |
|
| Statement of Assets and Liabilities | |
|
| Statement of Operations | |
|
| Statement of Changes in Net Assets | |
|
| Notes to Financial Statements | |
|
| Financial Highlights | |
|
| Report of Independent Registered Public Accounting Firm | |
|
| Management | |
|
| Additional Information | |
|
Any opinions expressed in this report reflect those of the author as of the date of the report, and do not necessarily represent the opinions of American Century Investments® or any other person in the American Century Investments organization. Any such opinions are subject to change at any time based upon market or other conditions and American Century Investments disclaims any responsibility to update such opinions. These opinions may not be relied upon as investment advice and, because investment decisions made by American Century Investments funds are based on numerous factors, may not be relied upon as an indication of trading intent on behalf of any American Century Investments fund. Security examples are used for representational purposes only and are not intended as recommendations to purchase or sell securities. Performance information for comparative indices and securities is provided to American Century Investments by third party vendors. To the best of American Century Investments’ knowledge, such information is accurate at the time of printing.
|
| |
| Dear Investor:
Thank you for reviewing this annual report for the 12 months ended May 31, 2016. It provides investment performance and portfolio information for the reporting period, plus longer-term historical performance data.
Annual reports help convey information about fund performance, including market and economic factors that affected returns during the reporting period. For additional, updated investment and market insights, we encourage you to visit our website, americancentury.com. |
| Jonathan Thomas |
Municipal Bonds (Munis) Extended Their Outperformance During a Continued Volatile Period
The narrative provided six months ago in our semiannual report letter hasn’t changed much—the key conditions described then extended for another half year. As explained then, widespread concerns about global economic growth sparked sharp financial market volatility. The primary catalyst was China, where slowing economic growth, currency devaluations, and massive monetary policy easing sent shock waves through the global markets. These factors re-emerged in January and early February this year, triggering sell-offs in riskier assets such as stocks and high-yield bonds. In the U.S. stock market, relatively defensive sectors such as utilities, telecommunication services, and consumer discretionary performed best. In the U.S. bond market, high-quality sectors including munis and Treasuries were market leaders.
Consistent with the first six months of the reporting period, munis continued to outperform for the full fiscal year. The broad muni market benefited from its comparatively high overall credit quality, despite defaults in Puerto Rico and financial concerns facing Illinois and New Jersey. We continue to view these as isolated incidents running counter to overall muni credit quality trends. Also, as government bond yields fell globally during the last six months of the reporting period, after-tax muni yields looked attractive, especially for investors in top tax brackets.
We expect many of the factors that kept sovereign bond yields low during the reporting period to persist through the end of the year, keeping U.S. government bond yields range-bound, despite the Federal Reserve’s attempts to raise its interest rate target. We believe those attempts will be muted in the face of continuing global economic, political, and market headwinds. Furthermore, conjecture about Federal Reserve policy and the outcome of the U.S. presidential election, among other factors, could lead to further market volatility, presenting both challenges and opportunities for active investment managers. We continue to believe in a disciplined, diversified, risk-aware investment approach, using professionally managed portfolios to meet financial goals. We appreciate your trust in us.
Sincerely,
Jonathan Thomas
President and Chief Executive Officer
American Century Investments
|
| | | | | | |
| Total Returns as of May 31, 2016 |
| | | | Average Annual Returns | |
| | Ticker Symbol | 1 year | 5 years | 10 years | Since Inception | Inception Date |
Investor Class | ABHYX | 7.90% | 7.21% | 4.14% | — | 3/31/98 |
Barclays Municipal Bond Index | — | 5.87% | 5.07% | 4.92% | — | — |
| Institutional Class | AYMIX | 8.12% | 7.42% | — | 6.75% | 3/1/10 |
| A Class | AYMAX | | | | | 1/31/03 |
| No sales charge | | 7.64% | 6.94% | 3.88% | — | |
| With sales charge | | 2.80% | 5.97% | 3.41% | — | |
| C Class | AYMCX | 6.84% | 6.15% | 3.10% | — | 7/24/02 |
Average annual returns since inception are presented when ten years of performance history is not available.
Sales charges include initial sales charges and contingent deferred sales charges (CDSCs), as applicable. A Class shares have a 4.50% maximum initial sales charge and may be subject to a maximum CDSC of 1.00%. C Class shares redeemed within 12 months of purchase are subject to a maximum CDSC of 1.00%. The SEC requires that mutual funds provide performance information net of maximum sales charges in all cases where charges could be applied.
Data presented reflect past performance. Past performance is no guarantee of future results. Current performance may be higher or lower than the performance shown. Total returns for periods less than one year are not annualized. Investment return and principal value will fluctuate, and redemption value may be more or less than original cost. Data assumes reinvestment of dividends and capital gains, and none of the charts reflect the deduction of taxes that a shareholder would pay on fund distributions or the redemption of fund shares. To obtain performance data current to the most recent month end, please call 1-800-345-2021 or visit americancentury.com. For additional information about the fund, please consult the prospectus.
|
|
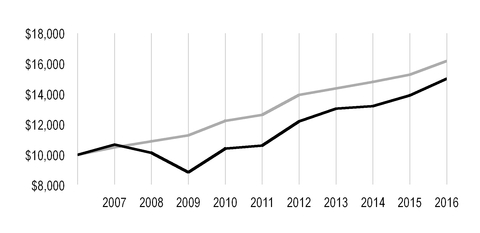
Growth of $10,000 Over 10 Years |
| $10,000 investment made May 31, 2006 |
| Performance for other share classes will vary due to differences in fee structure. |
|
| |
| Value on May 31, 2016 |
| | Investor Class — $15,013 |
| |
| | Barclays Municipal Bond Index — $16,174 |
| |
|
| | | |
Total Annual Fund Operating Expenses |
Investor Class | Institutional Class | A Class | C Class |
| 0.60% | 0.40% | 0.85% | 1.60% |
The total annual fund operating expenses shown is as stated in the fund’s prospectus current as of the date of this report. The prospectus may vary from the expense ratio shown elsewhere in this report because it is based on a different time period, includes acquired fund fees and expenses, and, if applicable, does not include fee waivers or expense reimbursements.
Data presented reflect past performance. Past performance is no guarantee of future results. Current performance may be higher or lower than the performance shown. Total returns for periods less than one year are not annualized. Investment return and principal value will fluctuate, and redemption value may be more or less than original cost. Data assumes reinvestment of dividends and capital gains, and none of the charts reflect the deduction of taxes that a shareholder would pay on fund distributions or the redemption of fund shares. To obtain performance data current to the most recent month end, please call 1-800-345-2021 or visit americancentury.com. For additional information about the fund, please consult the prospectus.
Portfolio Managers: Steven Permut, Joseph Gotelli, and Alan Kruss
Performance Summary
High-Yield Municipal returned 7.90%* for the 12 months ended May 31, 2016. By comparison, the investment-grade Barclays Municipal Bond Index returned 5.87%. Fund returns reflect operating expenses, while index returns do not.
The fund’s return for the reporting period largely reflected the positive overall performance of the municipal bond (muni) market combined with favorable security selection. Of note, high-yield munis generally underperformed their investment-grade counterparts during the 12-month period (returning 4.70%, according to Barclays) as investors favored higher-quality bonds. Despite this broad higher-quality bias working against it, the portfolio performed well, benefiting from security selection and duration positioning (price sensitivity to interest rate changes).
Muni Market Dynamics Aided Performance
Investor concerns about global growth (particularly in China), commodity prices, and central bank monetary decisions created a volatile market climate throughout the reporting period. The U.S. economy continued to exhibit modest growth, but the U.S. Federal Reserve (the Fed) remained focused on the sluggish global landscape and its potential risks to the U.S. economy. This triggered ongoing investor speculation regarding the timing and magnitude of interest rate “normalization” from the Fed. This uncertainty contributed to the period’s market volatility. Ultimately, the Fed delayed its much-anticipated 2015 interest rate hike until the final month of the year, lifting the range for its benchmark short-term interest rate 25 basis points (1 basis point equals 0.01%) to 0.25%-0.50% on December 16. The new year ushered in a fresh round of global growth worries and a severe equity market sell-off. The Fed took an anticipated first-quarter rate hike off the table, and investors gradually curtailed their expectations for additional rate hikes in 2016. The Fed held rates steady through the end of the reporting period, citing concerns about the health of the global economy and weaker-than-expected first-quarter U.S. economic growth as reasons to pursue a “lower for longer” rate strategy. Meanwhile, central banks in Europe, Japan, and China continued to cut interest rates and implement other aggressive stimulus programs in response to weak growth rates and the threat of deflation in those regions.
This environment generally led to positive performance for U.S. Treasuries and most U.S. bond market sectors. Yields on the 10-year Treasury note and the 30-year Treasury bond declined 27 basis points and 23 basis points, respectively, while the yield on the Fed policy-sensitive two-year Treasury note increased 27 basis points. Munis generally tracked the U.S. Treasury market, but factors specific to the municipal market helped munis outperform. In particular, supply and demand dynamics remained favorable, which supported gains. Other than an increase in muni supply early in the period (as issuers rushed to issue or refinance debt ahead of the Fed’s rate hike), supply declined modestly for the period overall. At the same time, demand for munis remained robust largely due to their tax advantages. Investor desire for yield also helped drive demand for high-yield munis. As of May 31, 2016, muni funds experienced 34 consecutive weeks of positive flows, according to Lipper Inc.
Overall, all major sectors of the muni bond market posted positive returns for the 12-month period. Longer-maturity and higher-quality munis generally performed better than shorter-maturity and lower-quality securities, and revenue bonds outperformed GO (general obligation) bonds.
* All fund returns referenced in this commentary are for Investor Class shares. Performance for other share classes will vary due to differences in fee structure; when Investor Class performance exceeds that of the fund's benchmark, other share classes may not. See page 3 for returns for all share classes.
Market Fundamentals Remained Positive Despite Isolated Credit Events
Despite negative credit events for specific issuers in Puerto Rico, Chicago, New Jersey, and other relatively isolated entities, muni market fundamentals generally remained positive and continued to provide support to the broad market. We believe the main problems facing these issuers are due largely to their own individual circumstances and are not indicative of any particular systemic municipal market problem.
From a broad fiscal standpoint, state and local finances across the U.S. remained relatively healthy during the reporting period, even as revenue growth slowed largely due to weak stock market returns. However, spending restraint has enabled most states to maintain stable credit profiles. From a credit rating perspective, muni credit-rating upgrades continued to slightly outpace downgrades, and the muni default rate remained low. We continue to believe it’s unlikely any states will default, but select, isolated state, local, and commonwealth credit ratings may be pressured by special circumstances.
Security Selection, Duration Positioning Aided Results
Our continued bias toward revenue bonds over GO bonds contributed to portfolio performance. Within the revenue sector, we continued to favor essential service (such as those that finance water and sewer projects) revenue bonds, along with transportation and hospital bonds. Within revenue and other sub-sectors, what we didn’t hold in the portfolio was nearly as important to relative fund performance as what we did hold, including minimizing the portfolio’s exposure to key issuers in Puerto Rico and Chicago (Chicago Board of Education). We began reducing the portfolio’s exposure to Puerto Rico munis during the second half of 2014, and we completely exited the position by July 2015. Although the portfolio no longer has direct exposure, we expect Puerto Rico will continue to influence the high-yield market due to the sheer size and prevalence of its outstanding debt. On a different front, Chicago, like Puerto Rico, has multiple issuers, but its stronger issuers face fewer financial hurdles than Puerto Rico does. The portfolio owns Chicago debt, but none issued by Chicago Board of Education.
Overall, our positioning and bottom-up security selection within multiple sectors boosted performance. In the education sector, we added exposure to charter schools (a growing industry) in Arizona and Pennsylvania at what we believe were attractive valuations. We also selectively added tobacco settlement bonds, which contributed to portfolio performance.
During the first half of the reporting period, we generally maintained a neutral duration strategy. In December 2015, we extended the portfolio’s duration in anticipation of favorable technical factors typically prevalent in January. We maintained the slightly longer-than-average duration through the end of May 2016, which aided portfolio performance as yields generally declined through the first five months of 2016. We used U.S. Treasury futures contracts at times as part of our duration strategy.
Market Volatility Likely to Persist
Looking ahead, we believe U.S. economic fundamentals eventually will prompt the Fed to resume interest-rate normalization. But weaker global economic fundamentals, U.S. dollar strength, and geopolitical risks may delay Fed action and keep rates range-bound. We expect market volatility to persist as investors await additional Fed comments and action on short-term interest rates. Volatility also is likely to escalate as the U.S. presidential campaign heats up and the candidates debate tax and other policies prior to the November election. Mounting market volatility may cause credit spreads (the yield differential between high-quality and low-quality munis of similar maturity) to widen, which may present compelling buying opportunities among lower-quality credits. In this environment, we believe fundamental credit research, active management, and security selection will become increasingly important.
|
| |
| MAY 31, 2016 | |
Portfolio at a Glance | |
| Weighted Average Maturity | 19.1 years |
| Average Duration (Modified) | 5.8 years |
| | |
Top Five States and Territories | % of net assets |
| New York | 14.4% |
| California | 11.6% |
| Illinois | 7.6% |
| Florida | 6.6% |
| Pennsylvania | 6.1% |
| | |
Top Five Sectors | % of fund investments |
| Hospital | 17% |
| Special Tax | 10% |
| Higher Education | 8% |
| Industrial Development Revenue/Pollution Control Revenue | 7% |
| Life Care | 7% |
| | |
Types of Investments in Portfolio | % of net assets |
| Municipal Securities | 101.9% |
| Temporary Cash Investments | —* |
| Other Assets and Liabilities | (1.9)% |
*Category is less than 0.05% of total net assets.
Fund shareholders may incur two types of costs: (1) transaction costs, including sales charges (loads) on purchase payments and redemption/exchange fees; and (2) ongoing costs, including management fees; distribution and service (12b-1) fees; and other fund expenses. This example is intended to help you understand your ongoing costs (in dollars) of investing in your fund and to compare these costs with the ongoing cost of investing in other mutual funds.
The example is based on an investment of $1,000 made at the beginning of the period and held for the entire period from December 1, 2015 to May 31, 2016.
Actual Expenses
The table provides information about actual account values and actual expenses for each class. You may use the information, together with the amount you invested, to estimate the expenses that you paid over the period. First, identify the share class you own. Then simply divide your account value by $1,000 (for example, an $8,600 account value divided by $1,000 = 8.6), then multiply the result by the number under the heading “Expenses Paid During Period” to estimate the expenses you paid on your account during this period.
If you hold Investor Class shares of any American Century Investments fund, or Institutional Class shares of the American Century Diversified Bond Fund, in an American Century Investments account (i.e., not a financial intermediary or retirement plan account), American Century Investments may charge you a $12.50 semiannual account maintenance fee if the value of those shares is less than $10,000. We will redeem shares automatically in one of your accounts to pay the $12.50 fee. In determining your total eligible investment amount, we will include your investments in all personal accounts (including American Century Investments Brokerage accounts) registered under your Social Security number. Personal accounts include individual accounts, joint accounts, UGMA/UTMA accounts, personal trusts, Coverdell Education Savings Accounts and IRAs (including traditional, Roth, Rollover, SEP-, SARSEP- and SIMPLE-IRAs), and certain other retirement accounts. If you have only business, business retirement, employer-sponsored or American Century Investments Brokerage accounts, you are currently not subject to this fee. If you are subject to the Account Maintenance Fee, your account value could be reduced by the fee amount.
Hypothetical Example for Comparison Purposes
The table also provides information about hypothetical account values and hypothetical expenses based on the actual expense ratio of each class of your fund and an assumed rate of return of 5% per year before expenses, which is not the actual return of a fund’s share class. The hypothetical account values and expenses may not be used to estimate the actual ending account balance or expenses you paid for the period. You may use this information to compare the ongoing costs of investing in your fund and other funds. To do so, compare this 5% hypothetical example with the 5% hypothetical examples that appear in the shareholder reports of the other funds.
Please note that the expenses shown in the table are meant to highlight your ongoing costs only and do not reflect any transactional costs, such as sales charges (loads) or redemption/exchange fees. Therefore, the table is useful in comparing ongoing costs only, and will not help you determine the relative total costs of owning different funds. In addition, if these transactional costs were included, your costs would have been higher.
|
| | | | |
| | Beginning
Account Value
12/1/15 | Ending
Account Value
5/31/16 | Expenses Paid
During Period(1)
12/1/15 - 5/31/16 |
Annualized
Expense Ratio(1) |
Actual | | | | |
| Investor Class | $1,000 | $1,052.50 | $3.08 | 0.60% |
| Institutional Class | $1,000 | $1,053.50 | $2.05 | 0.40% |
| A Class | $1,000 | $1,051.20 | $4.36 | 0.85% |
| C Class | $1,000 | $1,046.20 | $8.18 | 1.60% |
Hypothetical | | | | |
| Investor Class | $1,000 | $1,022.00 | $3.03 | 0.60% |
| Institutional Class | $1,000 | $1,023.00 | $2.02 | 0.40% |
| A Class | $1,000 | $1,020.75 | $4.29 | 0.85% |
| C Class | $1,000 | $1,017.00 | $8.07 | 1.60% |
| |
| (1) | Expenses are equal to the class's annualized expense ratio listed in the table above, multiplied by the average account value over the period, multiplied by 183, the number of days in the most recent fiscal half-year, divided by 366, to reflect the one-half year period. |
MAY 31, 2016
|
| | | | | | |
| | Principal Amount | Value |
| MUNICIPAL SECURITIES — 101.9% | | |
| Alabama — 1.8% | | |
Birmingham GO, 5.00%, 4/1/18(1) | $ | 1,000,000 |
| $ | 1,066,290 |
|
Birmingham GO, 5.00%, 4/1/20(1) | 715,000 |
| 808,322 |
|
| Industrial Development Board of the City of Mobile Alabama Rev., (Alabama Power Co.), VRDN, 1.625%, 10/2/18 | 2,000,000 |
| 2,019,960 |
|
| Infirmary Health System Special Care Facilities Financing Authority of Mobile Rev., (Infirmary Health System Obligated Group), 5.00%, 2/1/24 | 2,520,000 |
| 3,046,478 |
|
| Jefferson County Sewer Rev., 6.50%, 10/1/53 | 2,000,000 |
| 2,431,640 |
|
| | | 9,372,690 |
|
| Alaska — 0.5% | | |
| Northern Tobacco Securitization Corp. Rev., 5.00%, 6/1/46 | 2,500,000 |
| 2,395,175 |
|
| Arizona — 4.7% | | |
| Arizona Health Facilities Authority Rev., (Banner Health Obligated Group), 5.00%, 1/1/44 | 1,585,000 |
| 1,827,568 |
|
| Arizona School Facilities Board COP, 5.00%, 9/1/23 | 2,500,000 |
| 3,061,050 |
|
| Florence Town, Inc. Industrial Development Authority Rev., (Legacy Traditional School Series 2013 Obligated Group), 6.00%, 7/1/43 | 1,000,000 |
| 1,107,890 |
|
| Industrial Development Authority of the City of Phoenix Rev., (AZ GFF Tiyan LLC), 5.375%, 2/1/41 | 1,000,000 |
| 1,027,090 |
|
Industrial Development Authority of the City of Phoenix Rev., (BASIS Schools, Inc. Obligated Group), 5.00%, 7/1/45(2) | 1,500,000 |
| 1,570,485 |
|
Industrial Development Authority of the City of Phoenix Rev., (BASIS Schools, Inc. Obligated Group), 5.00%, 7/1/46(2) | 1,500,000 |
| 1,570,140 |
|
| Industrial Development Authority of the City of Phoenix Rev., (Great Hearts Academies), 2.95%, 7/1/26 | 2,750,000 |
| 2,749,945 |
|
| Industrial Development Authority of the City of Phoenix Rev., (Great Hearts Academies), 5.00%, 7/1/44 | 1,000,000 |
| 1,090,500 |
|
Industrial Development Authority of the City of Phoenix Rev., (Legacy Traditional School Obligated Group), 6.75%, 7/1/44(2) | 2,000,000 |
| 2,392,740 |
|
| Industrial Development Authority of the City of Phoenix Rev., (Villa Montessori, Inc.), 5.00%, 7/1/35 | 500,000 |
| 548,125 |
|
| Industrial Development Authority of the City of Phoenix Rev., (Villa Montessori, Inc.), 5.00%, 7/1/45 | 1,000,000 |
| 1,074,710 |
|
Industrial Development Authority of the County of Pima Rev., (American Leadership Academy, Inc.), 5.625%, 6/15/45(2) | 2,000,000 |
| 2,049,040 |
|
| Mesa Rev., 5.00%, 7/1/27 | 250,000 |
| 260,803 |
|
| Mohave County Industrial Development Authority Rev., (Mohave Prison LLC), 8.00%, 5/1/25 | 500,000 |
| 560,475 |
|
| Pima County Sewer System Rev., 5.00%, 7/1/26 | 1,000,000 |
| 1,182,230 |
|
| Salt Verde Financial Corp. Rev., 5.00%, 12/1/37 (GA: Citigroup, Inc.) | 1,000,000 |
| 1,251,420 |
|
Sundance Community Facilities District Rev., 7.125%, 7/1/27(2) | 512,000 |
| 513,157 |
|
| Sundance Community Facilities District Special Assessment, 6.50%, 7/1/29 | 271,000 |
| 271,439 |
|
| | | 24,108,807 |
|
| California — 11.6% | | |
| Antelope Valley Healthcare District Rev., 5.00%, 3/1/21 | 3,855,000 |
| 4,307,808 |
|
|
| | | | | | |
| | Principal Amount | Value |
California County Tobacco Securitization Agency Rev., (Alameda County Tobacco Securitization Corp.), 0.00%, 6/1/50(3) | $ | 8,000,000 |
| $ | 790,400 |
|
| California Health Facilities Financing Authority Rev., (Children's Hospital of Orange County), 6.50%, 11/1/38 (GA: Children's Healthcare of California) | 2,000,000 |
| 2,357,840 |
|
California Municipal Finance Authority Rev., (Azusa Pacific University), 8.00%, 4/1/21, Prerefunded at 100% of Par(4) | 800,000 |
| 1,050,512 |
|
California School Finance Authority Rev., (Downtown College Prep Obligated Group), 4.75%, 6/1/36(2) | 1,500,000 |
| 1,536,000 |
|
| California State Public Works Board Rev., 5.00%, 3/1/30 | 1,500,000 |
| 1,796,220 |
|
| California State Public Works Board Rev., 5.00%, 11/1/38 | 1,500,000 |
| 1,799,565 |
|
| California State Public Works Board Rev., 5.00%, 9/1/39 | 3,000,000 |
| 3,580,530 |
|
| California Statewide Communities Development Authority Rev., (CHF-Irvine LLC), 3.25%, 5/15/31 | 2,000,000 |
| 2,029,980 |
|
| California Statewide Communities Development Authority Rev., (Kaiser Credit Group), 5.00%, 4/1/42 | 2,000,000 |
| 2,309,080 |
|
| California Statewide Communities Development Authority Rev., (Lancer Educational Housing LLC), 7.50%, 6/1/42 | 1,950,000 |
| 2,166,196 |
|
California Statewide Communities Development Authority Rev., (Loma Linda University Medical Center Obligated Group), 5.00%, 12/1/36(2) | 500,000 |
| 564,175 |
|
California Statewide Communities Development Authority Rev., (Loma Linda University Medical Center Obligated Group), 5.00%, 12/1/41(2) | 500,000 |
| 557,460 |
|
California Statewide Communities Development Authority Rev., (Loma Linda University Medical Center Obligated Group), 5.00%, 12/1/46(2) | 1,000,000 |
| 1,111,370 |
|
California Statewide Communities Development Authority Rev., (Loma Linda University Medical Center Obligated Group), 5.25%, 12/1/56(2) | 1,000,000 |
| 1,128,580 |
|
Clovis Unified School District GO, Capital Appreciation, 0.00%, 8/1/26 (NATL)(3) | 2,500,000 |
| 1,957,325 |
|
Foothill-Eastern Transportation Corridor Agency Rev., Capital Appreciation, 0.00%, 1/15/24(5) | 500,000 |
| 424,110 |
|
Foothill-Eastern Transportation Corridor Agency Rev., Capital Appreciation, 0.00%, 1/15/33(3) | 750,000 |
| 390,510 |
|
| Foothill-Eastern Transportation Corridor Agency Rev., 6.50%, 1/15/43 | 500,000 |
| 600,865 |
|
| Foothill-Eastern Transportation Corridor Agency Rev., 6.00%, 1/15/49 | 2,250,000 |
| 2,684,790 |
|
| Foothill-Eastern Transportation Corridor Agency Rev., VRDN, 5.50%, 1/15/23 | 500,000 |
| 594,475 |
|
| Golden State Tobacco Securitization Corp. Rev., 5.00%, 6/1/33 | 500,000 |
| 503,280 |
|
| Golden State Tobacco Securitization Corp. Rev., 5.125%, 6/1/47 | 2,000,000 |
| 2,000,020 |
|
| Golden State Tobacco Securitization Corp. Rev., 5.75%, 6/1/47 | 2,500,000 |
| 2,528,975 |
|
| Independent Cities Finance Authority Rev., (Millennium Housing Corp.), 6.15%, 7/15/40 | 2,000,000 |
| 2,229,760 |
|
Long Beach Unified School District GO, Capital Appreciation, 0.00%, 8/1/25 (AGC)(3) | 1,595,000 |
| 1,299,542 |
|
| Los Angeles Unified School District GO, 5.00%, 7/1/20 | 1,000,000 |
| 1,160,520 |
|
Morongo Band of Mission Indians Rev., 6.50%, 3/1/28(2) | 1,000,000 |
| 1,083,540 |
|
| Oakland Unified School District/Alameda County GO, 6.625%, 8/1/38 | 385,000 |
| 470,778 |
|
| Palm Springs Airport Rev., 6.40%, 7/1/23 | 250,000 |
| 250,473 |
|
| Palm Springs Airport Rev., 6.50%, 7/1/27 | 200,000 |
| 200,394 |
|
Poway Unified School District GO, 0.00%, 8/1/32(3) | 2,000,000 |
| 1,223,120 |
|
|
| | | | | | |
| | Principal Amount | Value |
| River Islands Public Financing Authority Special Tax, 5.50%, 9/1/45 | $ | 1,500,000 |
| $ | 1,652,220 |
|
River Rock Entertainment Authority Rev., 8.00%, 11/1/18(6)(7) | 2,931,000 |
| 300,105 |
|
| San Diego Public Facilities Financing Authority Rev., 5.00%, 10/15/44 | 500,000 |
| 599,230 |
|
| San Francisco City & County Airport Comm-San Francisco International Airport Rev., 5.00%, 5/1/23 | 750,000 |
| 909,788 |
|
San Francisco City & County Redevelopment Agency Special Tax, Capital Appreciation, 0.00%, 8/1/43(3) | 3,500,000 |
| 808,185 |
|
San Francisco City & County Redevelopment Agency Tax Allocation, 6.625%, 8/1/19, Prerefunded at 100% of Par(4) | 250,000 |
| 295,023 |
|
San Joaquin Hills Transportation Corridor Agency Rev., Capital Appreciation, 0.00%, 1/15/36 (NATL)(3) | 1,000,000 |
| 470,370 |
|
| San Joaquin Hills Transportation Corridor Agency Rev., 5.25%, 1/15/44 | 3,000,000 |
| 3,352,200 |
|
| Sunnyvale Special Tax, 7.75%, 8/1/32 | 1,500,000 |
| 1,503,870 |
|
| Tejon Ranch Public Facilities Finance Authority Special Tax, 5.00%, 9/1/45 | 2,000,000 |
| 2,240,240 |
|
| | | 58,819,424 |
|
| Colorado — 3.5% | | |
| Central Platte Valley Metropolitan District GO, 5.00%, 12/1/43 | 1,000,000 |
| 1,064,080 |
|
| City & County of Denver Rev., (United Airlines, Inc.), 5.75%, 10/1/32 | 1,500,000 |
| 1,572,300 |
|
Colorado Health Facilities Authority Rev., (Total Longterm Care, Inc.), 6.00%, 11/15/20, Prerefunded at 100% of Par(4) | 500,000 |
| 600,510 |
|
| Denver Health & Hospital Authority Rev., 5.00%, 12/1/39 | 800,000 |
| 894,496 |
|
| Denver Health & Hospital Authority Rev., 5.25%, 12/1/45 | 250,000 |
| 282,955 |
|
| Denver Urban Renewal Authority Tax Allocation, 5.00%, 12/1/25 | 1,500,000 |
| 1,770,990 |
|
| E-470 Public Highway Authority Rev., VRDN, 1.58%, 6/2/16 | 2,200,000 |
| 2,194,940 |
|
| Foothills Metropolitan District Special Assessment, 6.00%, 12/1/38 | 1,000,000 |
| 1,084,050 |
|
| One Horse Business Improvement District Rev., 6.00%, 6/1/24 | 1,290,000 |
| 1,292,696 |
|
| Park Creek Metropolitan District Tax Allocation, 5.00%, 12/1/45 | 1,125,000 |
| 1,284,806 |
|
Plaza Metropolitan District No. 1 Tax Allocation, 5.00%, 12/1/22(2) | 500,000 |
| 548,765 |
|
| Regional Transportation District COP, 5.00%, 6/1/20 | 1,750,000 |
| 2,009,455 |
|
| Regional Transportation District Rev., (Denver Transit Partners LLC), 6.00%, 1/15/41 | 1,000,000 |
| 1,158,570 |
|
| State of Colorado Department of Transportation Rev., 5.00%, 12/15/16 | 2,000,000 |
| 2,048,000 |
|
| | | 17,806,613 |
|
| Connecticut — 0.6% | | |
Connecticut State Health & Educational Facility Authority Rev., (Church Home of Hartford, Inc.), 2.875%, 9/1/20(2) | 700,000 |
| 702,849 |
|
| Connecticut State Health & Educational Facility Authority Rev., (Yale University), VRDN, 1.375%, 7/11/18 | 2,500,000 |
| 2,524,150 |
|
| | | 3,226,999 |
|
| Delaware — 0.3% | | |
| Delaware State Economic Development Authority Rev., (Delmarva Power & Light Co.), 5.40%, 2/1/31 | 1,500,000 |
| 1,687,260 |
|
| District of Columbia — 0.9% | | |
| District of Columbia Rev., (Friendship Public Charter School, Inc.), 5.00%, 6/1/46 | 1,385,000 |
| 1,546,630 |
|
| District of Columbia Rev., (National Law Enforcement Officers Memorial Fund, Inc.), 7.75%, 7/1/49 | 3,000,000 |
| 3,229,590 |
|
| | | 4,776,220 |
|
|
| | | | | | |
| | Principal Amount | Value |
| Florida — 6.6% | | |
| Alachua County Health Facilities Authority Rev., (East Ridge Retirement Village, Inc.), 6.375%, 11/15/49 | $ | 1,500,000 |
| $ | 1,684,215 |
|
| Babcock Ranch Community Independent Special District Special Assessment, 5.25%, 11/1/46 | 250,000 |
| 253,378 |
|
| Brevard County Rev., (University Financing Foundation, Inc.), 6.75%, 11/1/39 | 1,000,000 |
| 1,092,050 |
|
| Brevard County Health Facilities Authority Rev., (Health First, Inc. Obligated Group), 5.00%, 4/1/39 | 2,445,000 |
| 2,799,623 |
|
| Broward County Airport System Rev., 5.00%, 10/1/28 | 2,000,000 |
| 2,410,160 |
|
| Broward County Airport System Rev., 5.25%, 10/1/38 | 500,000 |
| 583,930 |
|
| Celebration Pointe Community Development District Special Assessment, 5.125%, 5/1/45 | 750,000 |
| 773,100 |
|
| Escambia County Rev., (Gulf Power Co.), VRDN, 2.10%, 4/11/19 | 500,000 |
| 511,670 |
|
Florida Development Finance Corp. Rev., (Renaissance Charter School, Inc.), 6.125%, 6/15/46(2) | 1,000,000 |
| 1,027,840 |
|
| Greater Orlando Aviation Authority Rev., (JetBlue Airways Corp.), 5.00%, 11/15/36 | 1,000,000 |
| 1,063,920 |
|
| Halifax Hospital Medical Center Rev., (Halifax Hospital Medical Center Obligated Group), 5.00%, 6/1/21 | 350,000 |
| 407,208 |
|
| Halifax Hospital Medical Center Rev., (Halifax Hospital Medical Center Obligated Group), 5.00%, 6/1/22 | 250,000 |
| 296,273 |
|
| Hillsborough County Industrial Development Authority Rev., (Florida Health Sciences Center, Inc.), 5.00%, 10/1/34 | 1,250,000 |
| 1,432,462 |
|
| Hillsborough County School Board COP, 5.00%, 7/1/22 | 1,250,000 |
| 1,503,062 |
|
| Lakeland Rev., (Lakeland Regional Medical Center Obligated Group), 5.00%, 11/15/45 | 1,500,000 |
| 1,719,555 |
|
| Martin County Health Facilities Authority Rev., (Martin Memorial Medical Center, Inc.), 5.50%, 11/15/42 | 1,500,000 |
| 1,694,250 |
|
| Miami Beach Redevelopment Agency Tax Allocation, 5.00%, 2/1/27 | 1,000,000 |
| 1,206,300 |
|
| Miami-Dade County Rev., 5.00%, 10/1/37 | 1,500,000 |
| 1,740,255 |
|
| Miami-Dade County Educational Facilities Authority Rev., (University of Miami), 5.00%, 4/1/30 | 1,250,000 |
| 1,503,412 |
|
| Miami-Dade County Expressway Authority Rev., 5.00%, 7/1/31 | 1,000,000 |
| 1,193,230 |
|
| Miami-Dade County Industrial Development Authority Rev., (Pinecrest Academy, Inc.), 5.25%, 9/15/44 | 950,000 |
| 1,031,976 |
|
Mid-Bay Bridge Authority Rev., 7.25%, 10/1/21, Prerefunded at 100% of Par(4) | 515,000 |
| 669,289 |
|
| Orange County Health Facilities Authority Rev., (Orlando Health Obligated Group), 5.00%, 10/1/27 | 1,000,000 |
| 1,252,000 |
|
| Orange County Health Facilities Authority Rev., (Presbyterian Retirement Communities, Inc. Obligated Group), 5.00%, 8/1/34 | 1,450,000 |
| 1,640,109 |
|
| South Lake County Hospital District Rev., (Southlake Hospital, Inc.), 6.25%, 4/1/39 | 1,000,000 |
| 1,127,830 |
|
| Tallahassee Rev., (Tallahassee Memorial HealthCare, Inc.), 5.00%, 12/1/24 | 1,225,000 |
| 1,493,998 |
|
| Village Community Development District No. 10 Special Assessment, 6.00%, 5/1/44 | 470,000 |
| 559,544 |
|
| Village Community Development District No. 8 Special Assessment, 6.125%, 5/1/39 | 790,000 |
| 908,397 |
|
| | | 33,579,036 |
|
| Georgia — 1.7% | | |
| Atlanta Department of Aviation Rev., 5.00%, 1/1/29 | 1,000,000 |
| 1,125,140 |
|
Atlanta Water & Wastewater Rev., 6.25%, 11/1/19, Prerefunded at 100% of Par(4) | 3,000,000 |
| 3,532,290 |
|
|
| | | | | | |
| | Principal Amount | Value |
| DeKalb County Water & Sewerage Rev., 5.25%, 10/1/36 | $ | 1,000,000 |
| $ | 1,181,370 |
|
| Marietta Development Authority Rev., (Life University, Inc.), 7.00%, 6/15/39 | 1,000,000 |
| 1,054,350 |
|
| Monroe County Development Authority Rev., (Georgia Power Co.), VRDN, 2.35%, 12/11/20 | 1,500,000 |
| 1,544,340 |
|
| | | 8,437,490 |
|
| Guam — 0.2% | | |
| Guam Government Department of Education COP, 6.625%, 12/1/30 | 1,000,000 |
| 1,096,530 |
|
| Hawaii — 0.7% | | |
State of Hawaii Department of Budget & Finance Rev., (Chaminade University of Honolulu), 5.00%, 1/1/45(2) | 1,500,000 |
| 1,543,170 |
|
| State of Hawaii Department of Budget & Finance Rev., (Craigside Retirement Residence), 9.00%, 11/15/44 | 1,500,000 |
| 1,834,395 |
|
| | | 3,377,565 |
|
| Idaho — 0.6% | | |
| Idaho Health Facilities Authority Rev., (Partners In Healthcare, Inc.), 5.50%, 11/1/45 | 3,000,000 |
| 3,088,710 |
|
| Illinois — 7.6% | | |
| Chicago GO, 5.50%, 1/1/39 | 2,000,000 |
| 2,002,600 |
|
| Chicago GO, 5.00%, 1/1/40 | 2,500,000 |
| 2,469,200 |
|
| Chicago Midway International Airport Rev., 5.00%, 1/1/26 | 2,200,000 |
| 2,572,636 |
|
Chicago Midway International Airport Rev., 5.00%, 1/1/31(1) | 2,000,000 |
| 2,367,540 |
|
| Chicago O'Hare International Airport Rev., 5.00%, 1/1/22 | 3,000,000 |
| 3,504,270 |
|
| Chicago O'Hare International Airport Rev., 5.00%, 1/1/27 | 3,000,000 |
| 3,565,890 |
|
| Chicago Wastewater Transmission Rev., 5.00%, 1/1/34 | 245,000 |
| 277,078 |
|
| Chicago Wastewater Transmission Rev., 5.00%, 1/1/35 | 245,000 |
| 276,296 |
|
| Chicago Wastewater Transmission Rev., 5.00%, 1/1/39 | 1,240,000 |
| 1,391,491 |
|
| Chicago Wastewater Transmission Rev., 5.00%, 1/1/44 | 500,000 |
| 553,070 |
|
| Chicago Waterworks Rev., 5.00%, 11/1/29 | 1,750,000 |
| 2,084,670 |
|
| Chicago Waterworks Rev., 5.00%, 11/1/30 | 1,000,000 |
| 1,183,990 |
|
| Chicago Waterworks Rev., 5.00%, 11/1/31 | 1,000,000 |
| 1,178,740 |
|
| Chicago Waterworks Rev., 5.00%, 11/1/39 | 450,000 |
| 508,280 |
|
| Illinois Finance Authority Rev., 6.25%, 10/1/33 | 1,000,000 |
| 1,155,730 |
|
Illinois Finance Authority Rev., (Intrinsic Schools), 6.00%, 12/1/45(2) | 2,000,000 |
| 2,036,420 |
|
| Illinois Finance Authority Rev., (Northwestern Memorial Healthcare Obligated Group), 5.00%, 8/15/43 | 1,000,000 |
| 1,126,300 |
|
| Illinois Finance Authority Rev., (OSF Healthcare System Obligated Group), 5.00%, 11/15/45 | 1,300,000 |
| 1,501,656 |
|
| Illinois Finance Authority Rev., (Plymouth Place, Inc.), 5.25%, 5/15/50 | 2,000,000 |
| 2,067,780 |
|
Illinois Finance Authority Rev., (Rush University Medical Center Obligated Group), 7.25%, 11/1/18, Prerefunded at 100% of Par(4) | 1,500,000 |
| 1,729,980 |
|
| Illinois Finance Authority Rev., (Rush University Medical Center Obligated Group), 5.00%, 11/15/38 | 500,000 |
| 581,645 |
|
| Illinois Finance Authority Rev., (University of Chicago), VRDN, 1.10%, 2/15/18 | 1,125,000 |
| 1,127,261 |
|
| Illinois State Toll Highway Authority Rev., 5.00%, 12/1/32 | 910,000 |
| 1,103,648 |
|
Metropolitan Pier & Exposition Authority Rev., Capital Appreciation, 0.00%, 12/15/41(3) | 1,000,000 |
| 307,220 |
|
| State of Illinois GO, 5.50%, 7/1/38 | 1,000,000 |
| 1,105,330 |
|
|
| | | | | | |
| | Principal Amount | Value |
| University of Illinois Rev., 5.25%, 4/1/41 | $ | 625,000 |
| $ | 705,200 |
|
| | | 38,483,921 |
|
| Indiana — 0.1% | | |
| Richmond Hospital Authority Rev., (Reid Hospital & Health Care Services, Inc.), 5.00%, 1/1/39 | 500,000 |
| 578,240 |
|
| Iowa — 0.2% | | |
| Iowa Tobacco Settlement Authority Rev., 5.625%, 6/1/46 | 1,000,000 |
| 999,930 |
|
| Kentucky — 0.8% | | |
Paducah Electric Plant Board Rev., 5.00%, 10/1/30 (AGM)(1) | 3,500,000 |
| 4,136,790 |
|
| Louisiana — 1.6% | | |
| Louisiana Public Facilities Authority Rev., (Entergy Louisiana LLC), 3.375%, 9/1/28 | 3,000,000 |
| 3,091,500 |
|
| Louisiana State Citizens Property Insurance Corp. Rev., 5.00%, 6/1/20 | 1,500,000 |
| 1,706,940 |
|
| New Orleans Aviation Board Rev., 6.50%, 1/1/40 | 1,500,000 |
| 1,680,795 |
|
| New Orleans Sewerage Service Rev., 5.00%, 6/1/40 | 695,000 |
| 802,739 |
|
| New Orleans Sewerage Service Rev., 5.00%, 6/1/45 | 640,000 |
| 737,037 |
|
| | | 8,019,011 |
|
| Maryland — 2.0% | | |
| Anne Arundel County Tax Allocation, 6.10%, 7/1/40 | 1,000,000 |
| 1,058,510 |
|
| Baltimore Tax Allocation, 7.00%, 9/1/38 | 2,900,000 |
| 3,086,441 |
|
| Maryland Economic Development Corp. Rev., (Ports America Chesapeake LLC), 5.75%, 6/1/35 | 1,000,000 |
| 1,096,680 |
|
| Maryland Health & Higher Educational Facilities Authority Rev., (LifeBridge Health Obligated Group), 5.00%, 7/1/47 | 2,000,000 |
| 2,332,360 |
|
| Maryland Health & Higher Educational Facilities Authority Rev., (MedStar Health Obligated Group), 5.00%, 8/15/42 | 1,000,000 |
| 1,160,920 |
|
| Maryland Health & Higher Educational Facilities Authority Rev., (Mercy Medical Center Obligated Group), 4.00%, 7/1/42 | 1,405,000 |
| 1,483,188 |
|
| | | 10,218,099 |
|
| Massachusetts — 0.8% | | |
| Massachusetts Development Finance Agency Rev., (Lahey Clinic Obligated Group), 5.00%, 8/15/45 | 910,000 |
| 1,061,879 |
|
| Massachusetts Development Finance Agency Rev., (South Shore Hospital, Inc.), 4.00%, 7/1/36 | 1,185,000 |
| 1,277,252 |
|
| Massachusetts Development Finance Agency Rev., (UMass Memorial Health Care Obligated Group), 4.00%, 7/1/41 | 570,000 |
| 590,834 |
|
| Massachusetts Development Finance Agency Rev., (UMass Memorial Health Care Obligated Group), 5.00%, 7/1/46 | 1,000,000 |
| 1,161,080 |
|
| | | 4,091,045 |
|
| Michigan — 2.8% | | |
| Detroit City School District GO, 5.00%, 5/1/25 (Q-SBLF) | 2,490,000 |
| 2,872,339 |
|
| Flint Hospital Building Authority Rev., (Hurley Medical Center), 7.50%, 7/1/39 | 1,250,000 |
| 1,428,175 |
|
| Kentwood Economic Development Corp. Rev., (Holland Home Obligated Group), 5.625%, 11/15/41 | 1,750,000 |
| 1,899,818 |
|
| Lincoln Consolidated School District GO, 5.00%, 5/1/20 (AGM Q-SBLF) | 1,490,000 |
| 1,687,231 |
|
| Michigan Finance Authority Rev., 5.00%, 5/1/25 (Q-SBLF) | 375,000 |
| 454,976 |
|
| Michigan Finance Authority Rev., (Beaumont Health Obligated Group), 4.00%, 11/1/46 | 2,000,000 |
| 2,121,640 |
|
| Michigan Finance Authority Rev., (MidMichigan Obligated Group), 5.00%, 6/1/39 | 835,000 |
| 962,296 |
|
|
| | | | | | |
| | Principal Amount | Value |
Michigan Finance Authority Rev., (Thomas M Cooley Law School), 6.75%, 7/1/44(2) | $ | 1,000,000 |
| $ | 1,073,550 |
|
| Royal Oak Hospital Finance Authority Rev., (Beaumont Health Obligated Group), 5.00%, 9/1/39 | 1,600,000 |
| 1,827,472 |
|
| | | 14,327,497 |
|
| Minnesota — 0.2% | | |
| Hugo Rev., (CS Property Noble LLC), 5.00%, 7/1/44 | 1,000,000 |
| 1,021,680 |
|
| Mississippi — 0.6% | | |
| Mississippi Development Bank Rev., 5.00%, 3/1/29 (AGM) | 2,640,000 |
| 3,155,724 |
|
| Missouri — 2.7% | | |
| Health & Educational Facilities Authority of the State of Missouri Rev., (Kansas City Art Institute), VRDN, 0.38%, 6/1/16 (LOC: Commerce Bank) | 2,100,000 |
| 2,100,000 |
|
| Health & Educational Facilities Authority of the State of Missouri Rev., (Lutheran Senior Services Obligated Group), 6.00%, 2/1/41 | 1,250,000 |
| 1,397,375 |
|
| Health & Educational Facilities Authority of the State of Missouri Rev., (St. Louis College of Pharmacy), 5.50%, 5/1/43 | 1,000,000 |
| 1,126,470 |
|
| Health & Educational Facilities Authority of the State of Missouri Rev., (St. Louis College of Pharmacy), 5.00%, 5/1/45 | 1,890,000 |
| 2,045,490 |
|
Kansas City Industrial Development Authority Rev., (Kansas City United Methodist Retirement Home, Inc.), 6.00%, 11/15/51(2) | 1,500,000 |
| 1,534,800 |
|
| Kirkwood Industrial Development Authority Rev., (Ashfield Active Living and Wellness Communities, Inc.), 8.25%, 5/15/45 | 3,000,000 |
| 3,388,440 |
|
| St. Louis County Industrial Development Authority Rev., (Nazareth Living Center), 5.125%, 8/15/45 | 1,800,000 |
| 1,864,674 |
|
| | | 13,457,249 |
|
| Nebraska — 1.1% | | |
| Central Plains Energy Project Rev., 5.00%, 9/1/42 | 1,360,000 |
| 1,515,543 |
|
| Douglas County Hospital Authority No. 2 Rev., (Nebraska Methodist Health Obligated Group), 5.00%, 11/1/45 | 1,250,000 |
| 1,438,787 |
|
| Douglas County Hospital Authority No. 3 Rev., (Nebraska Methodist Health Obligated Group), 5.00%, 11/1/45 | 250,000 |
| 287,758 |
|
Santee Sioux Nation Rev., 8.75%, 10/1/20 (Acquired 11/19/09, Cost $2,400,000)(8) | 2,400,000 |
| 2,407,968 |
|
| | | 5,650,056 |
|
| Nevada — 1.4% | | |
| Clark County Special Assessment, 5.00%, 8/1/30 | 1,475,000 |
| 1,558,471 |
|
| Clark County Special Assessment, 5.00%, 8/1/32 | 375,000 |
| 393,026 |
|
| Clark County Special Assessment, 5.00%, 8/1/35 | 700,000 |
| 726,677 |
|
| Henderson Local Improvement Districts Special Assessment, 6.10%, 3/1/24 | 925,000 |
| 931,743 |
|
| Las Vegas Redevelopment Agency Tax Allocation, 3.00%, 6/15/32 | 2,500,000 |
| 2,388,125 |
|
| Las Vegas Special Improvement District No. 812 Special Assessment, 5.00%, 12/1/35 | 1,000,000 |
| 1,034,520 |
|
| | | 7,032,562 |
|
| New Jersey — 3.6% | | |
| New Jersey Economic Development Authority Rev., 5.00%, 6/15/40 | 2,000,000 |
| 2,162,000 |
|
| New Jersey Economic Development Authority Rev., (NYNJ Link Borrower LLC), 5.375%, 1/1/43 | 1,600,000 |
| 1,850,112 |
|
| New Jersey Economic Development Authority Rev., (SJF CCRC, Inc.), 5.25%, 1/1/44 | 1,000,000 |
| 1,054,600 |
|
| New Jersey Economic Development Authority Rev., (United Airlines, Inc.), 5.25%, 9/15/29 | 1,000,000 |
| 1,112,170 |
|
|
| | | | | | |
| | Principal Amount | Value |
| New Jersey Economic Development Authority Rev., (United Airlines, Inc.), 5.50%, 6/1/33 | $ | 500,000 |
| $ | 565,925 |
|
| New Jersey Health Care Facilities Financing Authority Rev., (Barnabas Health Obligated Group), 5.00%, 7/1/44 | 1,000,000 |
| 1,149,170 |
|
| New Jersey Health Care Facilities Financing Authority Rev., (Princeton HealthCare System Obligated Group), 5.00%, 7/1/22 | 1,000,000 |
| 1,190,270 |
|
| New Jersey Health Care Facilities Financing Authority Rev., (Princeton HealthCare System Obligated Group), 5.00%, 7/1/23 | 1,000,000 |
| 1,210,440 |
|
| New Jersey Health Care Facilities Financing Authority Rev., (University Hospital), 5.00%, 7/1/46 (AGM) | 1,800,000 |
| 2,074,284 |
|
| New Jersey Transportation Trust Fund Authority Rev., 5.00%, 6/15/42 | 1,000,000 |
| 1,068,650 |
|
| Tobacco Settlement Financing Corp. Rev., 4.75%, 6/1/34 | 2,000,000 |
| 1,941,580 |
|
| Tobacco Settlement Financing Corp. Rev., 5.00%, 6/1/41 | 3,000,000 |
| 2,921,490 |
|
| | | 18,300,691 |
|
| New Mexico — 0.2% | | |
| Montecito Estates Public Improvement District Special Tax, 7.00%, 10/1/37 | 1,070,000 |
| 1,092,973 |
|
| New York — 14.4% | | |
| Brooklyn Arena Local Development Corp. Rev., 6.25%, 7/15/40 | 800,000 |
| 920,784 |
|
| Buffalo & Erie County Industrial Land Development Corp. Rev., (Orchard Park CCRC, Inc.), 5.00%, 11/15/37 | 1,500,000 |
| 1,685,565 |
|
Build NYC Resource Corp. Rev., (Albert Einstein College of Medicine, Inc.), 5.50%, 9/1/45(2) | 3,000,000 |
| 3,386,940 |
|
| Build NYC Resource Corp. Rev., (Metropolitan College of New York), 5.25%, 11/1/34 | 750,000 |
| 822,292 |
|
| Build NYC Resource Corp. Rev., (Metropolitan College of New York), 5.50%, 11/1/44 | 1,000,000 |
| 1,096,880 |
|
Build NYC Resource Corp. Rev., (Pratt Paper, Inc.), 5.00%, 1/1/35(2) | 1,000,000 |
| 1,093,210 |
|
| Dutchess County Local Development Corp. Rev., (Marist College), 5.00%, 7/1/45 | 3,000,000 |
| 3,515,520 |
|
| Metropolitan Transportation Authority Rev., 5.00%, 11/15/19 | 4,000,000 |
| 4,537,000 |
|
| Nassau County Tobacco Settlement Corp. Rev., 5.00%, 6/1/35 | 2,000,000 |
| 1,990,300 |
|
| New York City GO, 5.00%, 8/1/18 | 3,000,000 |
| 3,269,280 |
|
| New York City GO, 5.00%, 8/1/23 | 750,000 |
| 926,100 |
|
| New York City GO, 5.00%, 8/1/36 | 900,000 |
| 1,074,771 |
|
| New York City GO, VRDN, 0.36%, 6/1/16 (LIQ FAC: Barclays Bank plc) | 8,000,000 |
| 8,000,000 |
|
| New York City Industrial Development Agency Rev., (American Airlines, Inc.), VRDN, 2.00%, 8/1/16 (GA: American Airlines Group) | 3,000,000 |
| 3,004,860 |
|
| New York City Industrial Development Agency Rev., (TrIPs Obligated Group), 5.00%, 7/1/28 | 1,000,000 |
| 1,108,090 |
|
| New York City Transitional Finance Authority Future Tax Secured Rev. VRDN, 0.36%, 6/1/16 (SBBPA: Barclays Bank plc) | 4,500,000 |
| 4,500,000 |
|
New York Liberty Development Corp. Rev., (3 World Trade Center LLC), 5.00%, 11/15/44(2) | 5,000,000 |
| 5,634,450 |
|
| New York Liberty Development Corp. Rev., (Goldman Sachs Headquarters LLC), 5.25%, 10/1/35 | 1,030,000 |
| 1,322,211 |
|
| New York State Dormitory Authority Rev., 5.00%, 3/15/17 | 1,795,000 |
| 1,857,861 |
|
| New York State Dormitory Authority Rev., (New York University), 5.00%, 7/1/26 | 500,000 |
| 610,050 |
|
| New York State Dormitory Authority Rev., (Northwell Health Obligated Group), 5.00%, 5/1/43 | 1,500,000 |
| 1,738,875 |
|
| New York State Dormitory Authority Rev., (Touro College and University System Obligated Group), 5.50%, 1/1/44 | 850,000 |
| 944,469 |
|
|
| | | | | | |
| | Principal Amount | Value |
New York Transportation Development Corp. Rev., (Laguardia Gateway Partners LLC), 5.25%, 1/1/50(1) | $ | 5,000,000 |
| $ | 5,717,200 |
|
| New York Transportation Development Corp. Rev., (Terminal One Group Association LP), 5.00%, 1/1/22 | 1,000,000 |
| 1,177,970 |
|
| New York Transportation Development Corp. Rev., (Terminal One Group Association LP), 5.00%, 1/1/23 | 1,000,000 |
| 1,199,180 |
|
| Newburgh GO, 5.625%, 6/15/33 | 1,400,000 |
| 1,540,252 |
|
| Port Authority of New York & New Jersey Rev., (JFK International Air Terminal LLC), 6.00%, 12/1/36 | 2,000,000 |
| 2,353,960 |
|
| Syracuse Industrial Development Agency Rev., (Syracuse University), VRDN, 0.36%, 6/1/16 (LOC: JPMorgan Chase Bank N.A.) | 1,300,000 |
| 1,300,000 |
|
Triborough Bridge & Tunnel Authority Rev., Capital Appreciation, 0.00%, 11/15/30(3) | 1,500,000 |
| 1,003,215 |
|
| TSASC, Inc. Rev., 5.125%, 6/1/42 | 1,000,000 |
| 985,170 |
|
| Westchester County Local Development Corp. Rev., (Pace University), 5.50%, 5/1/42 | 1,655,000 |
| 1,923,855 |
|
| Westchester County Local Development Corp. Rev., (Westchester County Health Care Corp. Obligated Group), 5.00%, 11/1/21 | 1,565,000 |
| 1,832,161 |
|
| Westchester County Local Development Corp. Rev., (Westchester County Health Care Corp. Obligated Group), 5.00%, 11/1/23 | 1,000,000 |
| 1,208,870 |
|
| | | 73,281,341 |
|
| North Carolina — 0.8% | | |
| Charlotte-Mecklenburg Hospital Authority Rev., (Carolinas Healthcare System Obligated Group), 5.00%, 1/15/39 | 1,250,000 |
| 1,440,425 |
|
| North Carolina Capital Facilities Finance Agency Rev., (Duke Energy Carolinas LLC), 4.375%, 10/1/31 | 1,500,000 |
| 1,631,505 |
|
| North Carolina Medical Care Commission Rev., (Maryfield, Inc.), 5.00%, 10/1/35 | 1,000,000 |
| 1,069,490 |
|
| | | 4,141,420 |
|
| North Dakota — 0.2% | | |
| Grand Forks Rev., (Altru Health System), VRDN, 0.39%, 6/1/16 (LOC: Bank of America N.A.) | 1,200,000 |
| 1,200,000 |
|
| Ohio — 3.0% | | |
| Buckeye Tobacco Settlement Financing Authority Rev., 5.125%, 6/1/24 | 2,000,000 |
| 1,948,960 |
|
| Buckeye Tobacco Settlement Financing Authority Rev., 5.75%, 6/1/34 | 1,000,000 |
| 975,390 |
|
| Buckeye Tobacco Settlement Financing Authority Rev., 5.875%, 6/1/47 | 5,000,000 |
| 4,896,650 |
|
| Cleveland Airport System Rev., 5.00%, 1/1/26 (AGM) | 2,000,000 |
| 2,427,080 |
|
| Hamilton County Rev., (UC Health Obligated Group), 5.00%, 2/1/44 | 1,250,000 |
| 1,413,187 |
|
| Muskingum County Rev., (Genesis Health System Obligated Group), 5.00%, 2/15/44 | 2,500,000 |
| 2,609,725 |
|
| Southeastern Ohio Port Authority Rev., (Marietta Area Health Care, Inc. Obligated Group), 5.00%, 12/1/43 | 250,000 |
| 262,533 |
|
| Southeastern Ohio Port Authority Rev., (Marietta Area Health Care, Inc. Obligated Group), 5.50%, 12/1/43 | 550,000 |
| 613,145 |
|
| | | 15,146,670 |
|
| Oklahoma — 1.9% | | |
| Oklahoma Turnpike Authority Rev., 5.00%, 1/1/28 | 2,000,000 |
| 2,321,420 |
|
| Tulsa Airports Improvement Trust Rev., (American Airlines, Inc.), 5.50%, 12/1/35 (GA: American Airlines Group) | 4,000,000 |
| 4,458,720 |
|
|
| | | | | | |
| | Principal Amount | Value |
| Tulsa County Industrial Authority Rev., (Montereau, Inc.), 7.25%, 11/1/40 | $ | 2,500,000 |
| $ | 2,750,825 |
|
| | | 9,530,965 |
|
| Oregon — 1.1% | | |
Forest Grove Rev., (Oak Tree Foundation, Inc.), 5.50%, 3/1/37 (Acquired 6/28/07, Cost $1,370,000)(8) | 1,370,000 |
| 1,393,304 |
|
| Salem Hospital Facility Authority Rev., (Capital Manor, Inc.), 6.00%, 5/15/42 | 1,000,000 |
| 1,123,040 |
|
| Salem Hospital Facility Authority Rev., (Capital Manor, Inc.), 6.00%, 5/15/47 | 1,250,000 |
| 1,403,800 |
|
State of Oregon GO, 5.00%, 5/1/21, Prerefunded at 100% of Par(4) | 1,250,000 |
| 1,478,425 |
|
| | | 5,398,569 |
|
| Pennsylvania — 6.1% | | |
| Chester County Health & Education Facilities Authority Rev., (Simpson Senior Services Obligated Group), 5.25%, 12/1/45 | 1,400,000 |
| 1,454,110 |
|
| Chester County Industrial Development Authority Rev., (Renaissance Academy Charter School), 5.00%, 10/1/44 | 1,000,000 |
| 1,080,160 |
|
Delaware County Industrial Development Authority Rev., (Chester Fund For Education & the Arts), 5.125%, 6/1/46(2) | 3,000,000 |
| 2,899,620 |
|
| Hospitals & Higher Education Facilities Authority of Philadelphia Rev., (Temple University Health System Obligated Group), 5.625%, 7/1/42 | 2,500,000 |
| 2,758,500 |
|
| Huntingdon County General Authority Rev., (Juniata College), 5.00%, 5/1/46 | 1,500,000 |
| 1,714,140 |
|
| Montgomery County Industrial Development Authority Rev., (Albert Einstein Healthcare Network Obligated Group), 5.25%, 1/15/45 | 1,110,000 |
| 1,245,986 |
|
| Northampton County General Purpose Authority Rev., (Moravian College), 5.00%, 10/1/36 | 2,250,000 |
| 2,603,858 |
|
Pennsylvania Economic Development Financing Authority Rev., (Albert Einstein Healthcare Network Obligated Group), 6.25%, 10/15/19, Prerefunded at 100% of Par(4) | 2,000,000 |
| 2,272,640 |
|
| Pennsylvania Turnpike Commission Rev., 5.00%, 12/1/23 | 265,000 |
| 321,328 |
|
| Pennsylvania Turnpike Commission Rev., 5.00%, 12/1/24 | 890,000 |
| 1,089,636 |
|
| Pennsylvania Turnpike Commission Rev., 5.00%, 12/1/25 | 1,100,000 |
| 1,353,110 |
|
| Pennsylvania Turnpike Commission Rev., 5.25%, 12/1/41 | 2,000,000 |
| 2,292,060 |
|
| Pennsylvania Turnpike Commission Rev., 5.00%, 12/1/44 | 880,000 |
| 1,026,995 |
|
| Philadelphia GO, 5.00%, 7/15/38 | 1,500,000 |
| 1,726,155 |
|
| Philadelphia Authority for Industrial Development Rev., (Frankford Valley Foundation for Literacy), 7.25%, 6/15/43 | 1,500,000 |
| 1,794,660 |
|
| Philadelphia Authority for Industrial Development Rev., (KIPP Philadelphia Charter School), 4.00%, 4/1/26 | 500,000 |
| 509,770 |
|
| Philadelphia Authority for Industrial Development Rev., (KIPP Philadelphia Charter School), 5.00%, 4/1/46 | 3,000,000 |
| 3,107,550 |
|
| Philadelphia Municipal Authority Rev., 6.50%, 4/1/39 | 1,500,000 |
| 1,692,630 |
|
| | | 30,942,908 |
|
| Rhode Island — 0.2% | | |
| Tobacco Settlement Financing Corp. Rev., 5.00%, 6/1/50 | 890,000 |
| 953,938 |
|
| South Carolina — 1.4% | | |
| Greenwood Fifty Schools Facilities, Inc. Rev., 5.00%, 12/1/19 (BAM) | 500,000 |
| 562,915 |
|
| Greenwood Fifty Schools Facilities, Inc. Rev., 5.00%, 12/1/20 (BAM) | 1,000,000 |
| 1,153,240 |
|
| Piedmont Municipal Power Agency Rev., 5.00%, 1/1/25 | 1,245,000 |
| 1,539,318 |
|
|
| | | | | | |
| | Principal Amount | Value |
| South Carolina Jobs-Economic Development Authority Rev., (Palmetto Health), 5.75%, 8/1/39 | $ | 1,475,000 |
| $ | 1,606,157 |
|
| Spartanburg Regional Health Services District Rev., 5.00%, 4/15/37 | 2,000,000 |
| 2,230,360 |
|
| | | 7,091,990 |
|
| Tennessee — 0.7% | | |
| Clarksville Public Building Authority Rev., VRDN, 0.41%, 6/1/16 (LOC: Bank of America N.A.) | 3,635,000 |
| 3,635,000 |
|
| Texas — 5.4% | | |
| Board of Managers Joint Guadalupe County-City of Seguin Hospital Rev., 5.00%, 12/1/40 | 1,000,000 |
| 1,071,860 |
|
| Board of Managers Joint Guadalupe County-City of Seguin Hospital Rev., 5.00%, 12/1/45 | 2,000,000 |
| 2,121,060 |
|
| Central Texas Regional Mobility Authority Rev., 5.00%, 1/1/40 | 1,500,000 |
| 1,746,015 |
|
| Dallas/Fort Worth International Airport Rev., 5.00%, 11/1/26 | 3,000,000 |
| 3,468,360 |
|
| Harris County Cultural Education Facilities Finance Corp. Rev., (Houston Methodist Hospital Obligated Group), VRDN, 0.36%, 6/1/16 | 1,100,000 |
| 1,100,000 |
|
| Houston Rev., 5.00%, 9/1/39 | 1,000,000 |
| 1,157,030 |
|
| Houston Rev., 5.00%, 9/1/40 | 875,000 |
| 1,013,101 |
|
La Vernia Higher Education Finance Corp. Rev., (KIPP, Inc.), 6.25%, 8/15/19, Prerefunded at 100% of Par(4) | 1,000,000 |
| 1,164,260 |
|
| Love Field Airport Modernization Corp. Rev., (Southwest Airlines Co.), 5.25%, 11/1/40 | 500,000 |
| 560,530 |
|
Mission Economic Development Corp. Rev., (Natgasoline LLC), 5.75%, 10/1/31(2) | 1,500,000 |
| 1,585,515 |
|
North East Texas Regional Mobility Authority Rev., 5.00%, 1/1/31(1) | 1,805,000 |
| 2,123,889 |
|
| North Texas Tollway Authority Rev., 5.00%, 1/1/40 | 890,000 |
| 1,031,297 |
|
| Tarrant County Cultural Education Facilities Finance Corp. Rev., (Baylor Scott & White Health Obligated Group), 5.00%, 8/15/43 | 1,000,000 |
| 1,151,770 |
|
| Tarrant County Cultural Education Facilities Finance Corp. Rev., (Methodist Hospitals of Dallas Obligated Group), VRDN, 0.37%, 6/1/16 (LOC: TD Bank N.A.) | 1,000,000 |
| 1,000,000 |
|
| Texas Private Activity Bond Surface Transportation Corp. Rev., (LBJ Infrastructure Group LLC), 7.00%, 6/30/40 | 3,000,000 |
| 3,593,760 |
|
Texas State Public Finance Authority Charter School Finance Corp. Rev., (Harmony Public Schools), 6.20%, 2/15/20, Prerefunded at 100% of Par(4) | 1,500,000 |
| 1,778,505 |
|
| Travis County Health Facilities Development Corp. Rev., (Westminster Manor), 7.125%, 11/1/40 | 1,500,000 |
| 1,721,730 |
|
| | | 27,388,682 |
|
| Vermont — 0.2% | | |
| Vermont Educational & Health Buildings Financing Agency Rev., (University of Vermont Health Network Obligated Group), 5.00%, 12/1/24 | 1,000,000 |
| 1,237,980 |
|
| Virginia — 2.4% | | |
Cherry Hill Community Development Authority Special Assessment, 5.40%, 3/1/45(2) | 1,000,000 |
| 1,047,530 |
|
| Dullles Town Center Community Development Authority Special Assessment, 4.25%, 3/1/26 | 1,750,000 |
| 1,815,223 |
|
| Greater Richmond Convention Center Authority Rev., 5.00%, 6/15/31 | 1,000,000 |
| 1,211,940 |
|
Lower Magnolia Green Community Development Authority Special Assessment, 5.00%, 3/1/45(2) | 1,000,000 |
| 1,004,410 |
|
| Mosaic District Community Development Authority Special Assessment, 6.875%, 3/1/36 | 1,000,000 |
| 1,153,570 |
|
|
| | | | | | |
| | Principal Amount/Shares | Value |
| Tobacco Settlement Financing Corp. Rev., 5.00%, 6/1/47 | $ | 500,000 |
| $ | 472,360 |
|
Virginia College Building Authority Rev., (Marymount University), 5.00%, 7/1/45(2) | 860,000 |
| 926,478 |
|
Virginia College Building Authority Rev., (Marymount University), 5.00%, 7/1/45(2) | 400,000 |
| 430,920 |
|
| Washington County Industrial Development Authority Rev., (Mountain States Health Alliance Obligated Group), 7.75%, 7/1/38 | 1,000,000 |
| 1,140,910 |
|
| Wise County Industrial Development Authority Rev., (Virginia Electric & Power Co.), VRDN, 2.15%, 9/1/20 | 3,000,000 |
| 3,087,690 |
|
| | | 12,291,031 |
|
| Washington — 2.5% | | |
| Port of Seattle Rev., 5.00%, 3/1/18 | 1,000,000 |
| 1,073,680 |
|
| Port of Seattle Industrial Development Corp. Rev., (Delta Air Lines, Inc.), 5.00%, 4/1/30 | 1,000,000 |
| 1,077,190 |
|
| Seattle Municipal Light & Power Rev. VRDN, 1.08%, 6/2/16 | 3,750,000 |
| 3,750,000 |
|
| State of Washington GO, 5.00%, 7/1/27 | 2,500,000 |
| 3,103,275 |
|
Washington State Housing Finance Commission Rev., (Heron's Key Obligated Group), 7.00%, 7/1/50(2) | 1,250,000 |
| 1,313,262 |
|
Washington State Housing Finance Commission Rev., (Spokane United Methodist Homes Obligated Group), 7.50%, 1/1/49(2) | 2,000,000 |
| 2,342,880 |
|
| | | 12,660,287 |
|
| Wisconsin — 1.7% | | |
| Public Finance Authority Rev., (Roseman University of Health Sciences), 5.50%, 4/1/32 | 2,000,000 |
| 2,111,180 |
|
| Wisconsin Department of Transportation Rev., 5.00%, 7/1/30 | 2,500,000 |
| 3,048,325 |
|
| Wisconsin Health & Educational Facilities Authority Rev., (Mile Bluff Medical Center, Inc.), 5.75%, 5/1/39 | 1,000,000 |
| 1,074,510 |
|
Wisconsin Health & Educational Facilities Authority Rev., (St. John's Communities, Inc.), 7.625%, 9/15/19, Prerefunded at 100% of Par(4) | 1,000,000 |
| 1,208,160 |
|
| Wisconsin Health & Educational Facilities Authority Rev., (St. John's Communities, Inc.), 5.00%, 9/15/45 | 1,000,000 |
| 1,088,970 |
|
| | | 8,531,145 |
|
| Wyoming — 0.5% | | |
| Campbell County Rev., (Basin Electric Power Cooperative), 5.75%, 7/15/39 | 2,000,000 |
| 2,259,000 |
|
TOTAL MUNICIPAL SECURITIES
(Cost $484,583,314) | | 518,028,913 |
|
TEMPORARY CASH INVESTMENTS† | | |
Federated Tax-Free Obligations Fund, Wealth Shares
(Cost $176) | 176 |
| 176 |
|
TOTAL INVESTMENT SECURITIES — 101.9%
(Cost $484,583,490) | | 518,029,089 |
|
| OTHER ASSETS AND LIABILITIES — (1.9)% | | (9,573,603) |
|
| TOTAL NET ASSETS — 100.0% | | $ | 508,455,486 |
|
|
| | |
| NOTES TO SCHEDULE OF INVESTMENTS |
| AGC | - | Assured Guaranty Corporation |
| AGM | - | Assured Guaranty Municipal Corporation |
| BAM | - | Build America Mutual Assurance Company |
| COP | - | Certificates of Participation |
| GA | - | Guaranty Agreement |
| GO | - | General Obligation |
| LIQ FAC | - | Liquidity Facilities |
| LOC | - | Letter of Credit |
| NATL | - | National Public Finance Guarantee Corporation |
| Q-SBLF | - | Qualified School Board Loan Fund |
| SBBPA | - | Standby Bond Purchase Agreement |
| VRDN | - | Variable Rate Demand Note. Interest reset date is indicated. Rate shown is effective at the period end. |
| |
| † | Category is less than 0.05% of total net assets. |
| |
| (1) | When-issued security. The issue price and yield are fixed on the date of the commitment, but payment and delivery are scheduled for a future date. |
| |
| (2) | Security was purchased pursuant to Rule 144A under the Securities Act of 1933 and may be sold in transactions exempt from registration, normally to qualified institutional investors. The aggregate value of these securities at the period end was $44,209,296, which represented 8.7% of total net assets. |
| |
| (3) | Security is a zero-coupon bond. Zero-coupon securities are issued at a substantial discount from their value at maturity. |
| |
| (4) | Escrowed to maturity in U.S. government securities or state and local government securities. |
| |
| (5) | Coupon rate adjusts periodically based upon a predetermined schedule. Interest reset date is indicated. Rate shown is effective at the period end. |
| |
| (7) | Security is in default. |
| |
| (8) | Restricted security that may not be offered for public sale without being registered with the Securities and Exchange Commission and/or may be subject to resale, redemption or transferability restrictions. The aggregate value of these securities at the period end was $3,801,272, which represented 0.7% of total net assets. |
See Notes to Financial Statements.
|
|
| Statement of Assets and Liabilities |
|
| | | |
| MAY 31, 2016 | |
| Assets | |
| Investment securities, at value (cost of $484,583,490) | $ | 518,029,089 |
|
| Cash | 528,630 |
|
| Receivable for investments sold | 162,000 |
|
| Receivable for capital shares sold | 867,187 |
|
| Interest receivable | 6,342,892 |
|
| | 525,929,798 |
|
| | |
| Liabilities | |
| Payable for investments purchased | 16,166,488 |
|
| Payable for capital shares redeemed | 831,944 |
|
| Accrued management fees | 247,309 |
|
| Distribution and service fees payable | 41,037 |
|
| Dividends payable | 187,534 |
|
| | 17,474,312 |
|
| | |
| Net Assets | $ | 508,455,486 |
|
| | |
| Net Assets Consist of: | |
| Capital paid in | $ | 512,350,123 |
|
| Distributions in excess of net investment income | (142,774 | ) |
| Accumulated net realized loss | (37,197,462 | ) |
| Net unrealized appreciation | 33,445,599 |
|
| | $ | 508,455,486 |
|
|
| | | | | | |
| | Net Assets | Shares Outstanding | Net Asset Value Per Share |
| Investor Class |
| $357,756,750 |
| 36,779,997 |
| $9.73 |
| Institutional Class |
| $33,659,876 |
| 3,460,666 |
| $9.73 |
| A Class |
| $91,271,395 |
| 9,383,012 |
| $9.73* |
| C Class |
| $25,767,465 |
| 2,650,397 |
| $9.72 |
*Maximum offering price $10.19 (net asset value divided by 0.955).
See Notes to Financial Statements.
|
| | | |
| YEAR ENDED MAY 31, 2016 | |
| Investment Income (Loss) | |
| Income: | |
| Interest | $ | 18,501,282 |
|
| | |
| Expenses: | |
| Management fees | 2,492,883 |
|
| Distribution and service fees: | |
| A Class | 200,999 |
|
| C Class | 254,546 |
|
| Trustees' fees and expenses | 23,070 |
|
| Other expenses | 352 |
|
| | 2,971,850 |
|
| | |
| Net investment income (loss) | 15,529,432 |
|
| | |
| Realized and Unrealized Gain (Loss) | |
| Net realized gain (loss) on: | |
| Investment transactions | 546,560 |
|
| Futures contract transactions | (153,125 | ) |
| | 393,435 |
|
| | |
| Change in net unrealized appreciation (depreciation) on: | |
| Investments | 17,271,970 |
|
| Futures contracts | 96,565 |
|
| | 17,368,535 |
|
| | |
| Net realized and unrealized gain (loss) | 17,761,970 |
|
| | |
| Net Increase (Decrease) in Net Assets Resulting from Operations | $ | 33,291,402 |
|
See Notes to Financial Statements.
|
|
| Statement of Changes in Net Assets |
|
| | | | | | |
| YEARS ENDED MAY 31, 2016 AND MAY 31, 2015 |
| Increase (Decrease) in Net Assets | May 31, 2016 | May 31, 2015 |
| Operations | | |
| Net investment income (loss) | $ | 15,529,432 |
| $ | 14,337,716 |
|
| Net realized gain (loss) | 393,435 |
| (3,830,110 | ) |
| Change in net unrealized appreciation (depreciation) | 17,368,535 |
| 7,396,340 |
|
| Net increase (decrease) in net assets resulting from operations | 33,291,402 |
| 17,903,946 |
|
| | | |
| Distributions to Shareholders | | |
| From net investment income: | | |
| Investor Class | (10,940,795 | ) | (10,220,765 | ) |
| Institutional Class | (1,102,691 | ) | (771,394 | ) |
| A Class | (2,785,168 | ) | (2,558,722 | ) |
| C Class | (695,921 | ) | (786,832 | ) |
| Decrease in net assets from distributions | (15,524,575 | ) | (14,337,713 | ) |
| | | |
| Capital Share Transactions | | |
| Net increase (decrease) in net assets from capital share transactions (Note 5) | 118,751,422 |
| 19,500,831 |
|
| | | |
| Net increase (decrease) in net assets | 136,518,249 |
| 23,067,064 |
|
| | | |
| Net Assets | | |
| Beginning of period | 371,937,237 |
| 348,870,173 |
|
| End of period | $ | 508,455,486 |
| $ | 371,937,237 |
|
| | | |
| Distributions in excess of net investment income | $ | (142,774 | ) | $ | (142,774 | ) |
See Notes to Financial Statements.
|
|
| Notes to Financial Statements |
MAY 31, 2016
1. Organization
American Century Municipal Trust (the trust) is registered under the Investment Company Act of 1940, as amended (the 1940 Act), as an open-end management investment company and is organized as a Massachusetts business trust. High-Yield Municipal Fund (the fund) is one fund in a series issued by the trust. The fund’s investment objective is to seek high current income that is exempt from federal income tax. The fund also seeks capital appreciation as a secondary objective.
The fund offers the Investor Class, the Institutional Class, the A Class and the C Class. The A Class may incur an initial sales charge. The A Class and C Class may be subject to a contingent deferred sales charge. The share classes differ principally in their respective sales charges and distribution and shareholder servicing expenses and arrangements. The Institutional Class is made available to institutional shareholders or through financial intermediaries whose clients do not require the same level of shareholder and administrative services as shareholders of other classes. As a result, the Institutional Class is charged a lower unified management fee.
2. Significant Accounting Policies
The following is a summary of significant accounting policies consistently followed by the fund in preparation of its financial statements. The fund is an investment company and follows accounting and reporting guidance in accordance with accounting principles generally accepted in the United States of America. This may require management to make certain estimates and assumptions at the date of the financial statements. Actual results could differ from these estimates. Management evaluated the impact of events or transactions occurring through the date the financial statements were issued that would merit recognition or disclosure.
Investment Valuations — The fund determines the fair value of its investments and computes its net asset value per share at the close of regular trading (usually 4 p.m. Eastern time) on the New York Stock Exchange (NYSE) on each day the NYSE is open. The Board of Trustees has adopted valuation policies and procedures to guide the investment advisor in the fund’s investment valuation process and to provide methodologies for the oversight of the fund’s pricing function.
Fixed income securities are valued at the evaluated mean as provided by independent pricing services or at the mean of the most recent bid and asked prices as provided by investment dealers. Municipal securities are valued using market models that consider trade data, quotations from dealers and active market makers, relevant yield curve and spread data, creditworthiness, trade data or market information on comparable securities, and other relevant security specific information.
Open-end management investment companies are valued at the reported net asset value per share. Exchange-traded futures contracts are valued at the settlement price as provided by the appropriate clearing corporation.
If the fund determines that the market price for an investment is not readily available or the valuation methods mentioned above do not reflect an investment’s fair value, such investment is valued as determined in good faith by the Board of Trustees or its delegate, in accordance with policies and procedures adopted by the Board of Trustees. In its determination of fair value, the fund may review several factors including, but not limited to, market information regarding the specific investment or comparable investments and correlation with other investment types, futures indices or general market indicators. Circumstances that may cause the fund to use these procedures to value an investment include, but are not limited to: an investment has been declared in default or is distressed; trading in a security has been suspended during the trading day or a security is not actively trading on its principal exchange; prices received from a regular pricing source are deemed unreliable; or there is a foreign market holiday and no trading occurred.
The fund monitors for significant events occurring after the close of an investment’s primary exchange but before the fund’s net asset value per share is determined. Significant events may include, but are not limited to: corporate announcements and transactions; governmental action and political unrest that could impact a specific investment or an investment sector; or armed conflicts, natural disasters and similar events that could affect investments in a specific country or region.
Security Transactions — Security transactions are accounted for as of the trade date. Net realized gains and losses are determined on the identified cost basis, which is also used for federal income tax purposes.
Investment Income — Interest income is recorded on the accrual basis and includes accretion of discounts and amortization of premiums.
Segregated Assets — In accordance with the 1940 Act, the fund segregates assets on its books and records to cover certain types of investments, including, but not limited to, futures contracts and when-issued securities. American Century Investment Management, Inc. (ACIM) (the investment advisor) monitors, on a daily basis, the securities segregated to ensure the fund designates a sufficient amount of liquid assets, marked-to-market daily. The fund may also receive assets or be required to pledge assets at the custodian bank or with a broker for margin requirements on futures contracts.
Income Tax Status — It is the fund’s policy to distribute substantially all net investment income and net realized gains to shareholders and to otherwise qualify as a regulated investment company under provisions of the Internal Revenue Code. Accordingly, no provision has been made for income taxes. The fund files U.S. federal, state, local and non-U.S. tax returns as applicable. The fund's tax returns are subject to examination by the relevant taxing authority until expiration of the applicable statute of limitations, which is generally three years from the date of filing but can be longer in certain jurisdictions. At this time, management believes there are no uncertain tax positions which, based on their technical merit, would not be sustained upon examination and for which it is reasonably possible that the total amounts of unrecognized tax benefits will significantly change in the next twelve months.
Multiple Class — All shares of the fund represent an equal pro rata interest in the net assets of the class to which such shares belong, and have identical voting, dividend, liquidation and other rights and the same terms and conditions, except for class specific expenses and exclusive rights to vote on matters affecting only individual classes. Income, non-class specific expenses, and realized and unrealized capital gains and losses of the fund are allocated to each class of shares based on their relative net assets.
Distributions to Shareholders — Distributions from net investment income, if any, are declared daily and paid monthly. Distributions from net realized gains, if any, are generally declared and paid annually.
Indemnifications — Under the trust’s organizational documents, its officers and trustees are indemnified against certain liabilities arising out of the performance of their duties to the fund. In addition, in the normal course of business, the fund enters into contracts that provide general indemnifications. The maximum exposure under these arrangements is unknown as this would involve future claims that may be made against a fund. The risk of material loss from such claims is considered by management to be remote.
3. Fees and Transactions with Related Parties
Certain officers and trustees of the trust are also officers and/or directors of American Century Companies, Inc. (ACC). The trust's investment advisor, ACIM, the trust's distributor, American Century Investment Services, Inc. (ACIS), and the trust's transfer agent, American Century Services, LLC, are wholly owned, directly or indirectly, by ACC.
Management Fees — The trust has entered into a management agreement with ACIM, under which ACIM provides the fund with investment advisory and management services in exchange for a single, unified management fee (the fee) per class. The agreement provides that all expenses of managing and operating the fund, except distribution and service fees, brokerage expenses, taxes, interest, fees and expenses of the independent trustees (including legal counsel fees), and extraordinary expenses, will be paid by ACIM. The fee is computed and accrued daily based on each class’s daily net assets and paid monthly in arrears. The fee consists of (1) an Investment Category Fee based on the daily net assets of the fund and certain other accounts managed by the investment advisor that are in the same broad investment category as the fund and (2) a Complex Fee based on the assets of all the funds in the American Century Investments family of funds. The rates for the Investment Category Fee range from 0.2925% to 0.4100%. The rates for the Complex Fee range from 0.2500% to 0.3100% for the Investor Class, A Class and C Class. The rates for the Complex Fee range from 0.0500% to 0.1100% for the Institutional Class. The effective annual management fee for each class for the year ended May 31, 2016 was 0.60% for the Investor Class, A Class and C Class and 0.40% for the Institutional Class.
Distribution and Service Fees — The Board of Trustees has adopted a separate Master Distribution and Individual Shareholder Services Plan for each of the A Class and C Class (collectively the plans), pursuant to Rule 12b-1 of the 1940 Act. The plans provide that the A Class will pay ACIS an annual distribution and
service fee of 0.25%. The plans provide that the C Class will pay ACIS an annual distribution and service fee of 1.00%, of which 0.25% is paid for individual shareholder services and 0.75% is paid for distribution services. The fees are computed and accrued daily based on each class’s daily net assets and paid monthly in arrears. The fees are used to pay financial intermediaries for distribution and individual shareholder services. Fees incurred under the plans during the year ended May 31, 2016 are detailed in the Statement of Operations.
Trustees’ Fees and Expenses — The Board of Trustees is responsible for overseeing the investment advisor’s management and operations of the fund. The trustees receive detailed information about the fund and its investment advisor regularly throughout the year, and meet at least quarterly with management of the investment advisor to review reports about fund operations. The fund’s officers do not receive compensation from the fund.
Interfund Transactions — The fund may enter into security transactions with other American Century Investments funds and other client accounts of the investment advisor, in accordance with the 1940 Act rules and procedures adopted by the Board of Trustees. The rules and procedures require, among other things, that these transactions be effected at the independent current market price of the security. During the period, the interfund purchases and sales were $27,300,000 and $12,100,000, respectively.
4. Investment Transactions
Purchases and sales of investment securities, excluding short-term investments, for the year ended May 31, 2016 were $302,371,447 and $173,495,785, respectively.
5. Capital Share Transactions
Transactions in shares of the fund were as follows (unlimited number of shares authorized):
|
| | | | | | | | | | |
| | Year ended
May 31, 2016 | Year ended
May 31, 2015 |
| | Shares | Amount | Shares | Amount |
| Investor Class | | | | |
| Sold | 17,564,776 |
| $ | 166,766,172 |
| 12,096,857 |
| $ | 113,210,879 |
|
| Issued in reinvestment of distributions | 921,622 |
| 8,743,968 |
| 800,926 |
| 7,501,963 |
|
| Redeemed | (8,876,206 | ) | (84,197,259 | ) | (11,107,061 | ) | (103,781,243 | ) |
| | 9,610,192 |
| 91,312,881 |
| 1,790,722 |
| 16,931,599 |
|
| Institutional Class | | | | |
| Sold | 1,508,022 |
| 14,298,251 |
| 1,118,574 |
| 10,444,062 |
|
| Issued in reinvestment of distributions | 116,307 |
| 1,102,691 |
| 82,090 |
| 769,769 |
|
| Redeemed | (601,830 | ) | (5,726,717 | ) | (202,358 | ) | (1,883,769 | ) |
| | 1,022,499 |
| 9,674,225 |
| 998,306 |
| 9,330,062 |
|
| A Class | | | | |
| Sold | 5,037,295 |
| 47,367,145 |
| 2,673,505 |
| 25,082,535 |
|
| Issued in reinvestment of distributions | 273,467 |
| 2,592,053 |
| 240,333 |
| 2,248,964 |
|
| Redeemed | (3,361,789 | ) | (31,699,544 | ) | (3,534,826 | ) | (32,843,057 | ) |
| | 1,948,973 |
| 18,259,654 |
| (620,988 | ) | (5,511,558 | ) |
| C Class | | | | |
| Sold | 362,422 |
| 3,418,554 |
| 299,356 |
| 2,808,283 |
|
| Issued in reinvestment of distributions | 54,024 |
| 511,178 |
| 60,697 |
| 567,867 |
|
| Redeemed | (467,839 | ) | (4,425,070 | ) | (496,611 | ) | (4,625,422 | ) |
| | (51,393 | ) | (495,338 | ) | (136,558 | ) | (1,249,272 | ) |
| Net increase (decrease) | 12,530,271 |
| $ | 118,751,422 |
| 2,031,482 |
| $ | 19,500,831 |
|
6. Fair Value Measurements
The fund’s investments valuation process is based on several considerations and may use multiple inputs to determine the fair value of the investments held by the fund. In conformity with accounting principles generally accepted in the United States of America, the inputs used to determine a valuation are classified into three broad levels.
| |
| • | Level 1 valuation inputs consist of unadjusted quoted prices in an active market for identical investments. |
| |
| • | Level 2 valuation inputs consist of direct or indirect observable market data (including quoted prices for comparable investments, evaluations of subsequent market events, interest rates, prepayment speeds, credit risk, etc.). These inputs also consist of quoted prices for identical investments initially expressed in local currencies that are adjusted through translation into U.S. dollars. |
| |
| • | Level 3 valuation inputs consist of unobservable data (including a fund’s own assumptions). |
The level classification is based on the lowest level input that is significant to the fair valuation measurement. The valuation inputs are not necessarily an indication of the risks associated with investing in these securities or other financial instruments. There were no significant transfers between levels during the period.
The following is a summary of the level classifications as of period end. The Schedule of Investments provides additional information on the fund’s portfolio holdings.
|
| | | | | | | | |
| | Level 1 | Level 2 | Level 3 |
| Assets | | | |
| Investment Securities | | | |
| Municipal Securities | — |
| $ | 518,028,913 |
| — |
|
| Temporary Cash Investments | $ | 176 |
| — |
| — |
|
| | $ | 176 |
| $ | 518,028,913 |
| — |
|
7. Derivative Instruments
Interest Rate Risk — The fund is subject to interest rate risk in the normal course of pursuing its investment objectives. The value of bonds generally declines as interest rates rise. A fund may enter into futures contracts based on a bond index or a specific underlying security. A fund may purchase futures contracts to gain exposure to increases in market value or sell futures contracts to protect against a decline in market value. Upon entering into a futures contract, a fund will segregate cash, cash equivalents or other appropriate liquid securities on its records in amounts sufficient to meet requirements. Subsequent payments (variation margin) are made or received daily, in cash, by a fund. The variation margin is equal to the daily change in the contract value and is recorded as unrealized gains and losses. A fund recognizes a realized gain or loss when the futures contract is closed or expires. Net realized and unrealized gains or losses occurring during the holding period of futures contracts are a component of net realized gain (loss) on futures contract transactions and change in net unrealized appreciation (depreciation) on futures contracts, respectively. One of the risks of entering into futures contracts is the possibility that the change in value of the contract may not correlate with the changes in value of the underlying securities. The fund's average exposure to interest rate risk derivative instruments held during the period was 34 contracts.
At period end, the fund did not have any derivative instruments disclosed on the Statement of Assets and Liabilities. For the year ended May 31, 2016, the effect of interest rate risk derivative instruments on the Statement of Operations was $(153,125) in net realized gain (loss) on futures contract transactions and $96,565 in change in net unrealized appreciation (depreciation) on futures contracts.
8. Risk Factors
The fund invests in lower-rated debt securities, which are subject to substantial risks including liquidity risk and credit risk.
9. Federal Tax Information
The tax character of distributions paid during the years ended May 31, 2016 and May 31, 2015 were as follows:
|
| | | | | | |
| | 2016 | 2015 |
| Distributions Paid From | | |
| Exempt income | $ | 15,524,575 |
| $ | 14,330,376 |
|
| Taxable ordinary income | — |
| $ | 7,337 |
|
| Long-term capital gains | — |
| — |
|
The book-basis character of distributions made during the year from net investment income or net realized gains may differ from their ultimate characterization for federal income tax purposes. These differences reflect the differing character of certain income items and net realized gains and losses for financial statement and tax purposes, and may result in reclassification among certain capital accounts on the financial statements.
As of May 31, 2016, the federal tax cost of investments and the components of distributable earnings on a tax-basis were as follows:
|
| | | |
| Federal tax cost of investments | $ | 484,518,138 |
|
| Gross tax appreciation of investments | $ | 36,148,989 |
|
| Gross tax depreciation of investments | (2,638,038 | ) |
| Net tax appreciation (depreciation) of investments | 33,510,951 |
|
| Net tax appreciation (depreciation) on derivatives | — |
|
| Net tax appreciation (depreciation) | $ | 33,510,951 |
|
| Undistributed exempt income | $ | 113,563 |
|
| Accumulated short-term capital losses | $ | (34,172,259 | ) |
| Accumulated long-term capital losses | $ | (3,346,892 | ) |
The difference between book-basis and tax-basis unrealized appreciation (depreciation) is attributable primarily to the treatment of non-shareholder capital contributions and income from defaulted securities.
Accumulated capital losses represent net capital loss carryovers that may be used to offset future realized capital gains for federal income tax purposes. Any unlimited losses will be required to be utilized prior to the losses which carry an expiration date. Future capital loss carryover utilization in any given year may be subject to Internal Revenue Code limitations. Capital loss carryovers expire as follows:
|
| | | | |
| 2017 | 2018 | 2019 | Unlimited (Short-Term) | Unlimited (Long-Term) |
| $(8,112,975) | $(11,481,481) | $(10,841,523) | $(3,736,280) | $(3,346,892) |
|
| | | | | | | | | | | | | |
| For a Share Outstanding Throughout the Years Ended May 31 (except as noted) |
| Per-Share Data | | | | Ratios and Supplemental Data | | |
| | | Income From Investment Operations: | | | | Ratio to Average Net Assets of: | | |
| | Net Asset Value, Beginning of Period | Net Investment Income (Loss)(1) | Net Realized and Unrealized Gain (Loss) | Total From Investment Operations | Distributions From Net Investment Income | Net Asset Value, End of Period | Total Return(2) | Operating Expenses | Net Investment Income (Loss) | Portfolio Turnover Rate | Net Assets, End of Period (in thousands) |
| Investor Class | | | | | | | | |
| 2016 | $9.36 | 0.35 | 0.37 | 0.72 | (0.35) | $9.73 | 7.90% | 0.60% | 3.72% | 41% |
| $357,757 |
|
| 2015 | $9.25 | 0.39 | 0.11 | 0.50 | (0.39) | $9.36 | 5.43% | 0.60% | 4.12% | 48% |
| $254,276 |
|
| 2014 | $9.55 | 0.39 | (0.30) | 0.09 | (0.39) | $9.25 | 1.21% | 0.60% | 4.40% | 87% |
| $234,790 |
|
| 2013 | $9.32 | 0.40 | 0.23 | 0.63 | (0.40) | $9.55 | 6.85% | 0.60% | 4.16% | 111% |
| $265,529 |
|
| 2012 | $8.50 | 0.44 | 0.82 | 1.26 | (0.44) | $9.32 | 15.16% | 0.61% | 4.89% | 70% |
| $237,949 |
|
| Institutional Class | | | | | | | | |
| 2016 | $9.36 | 0.37 | 0.37 | 0.74 | (0.37) | $9.73 | 8.12% | 0.40% | 3.92% | 41% |
| $33,660 |
|
| 2015 | $9.25 | 0.40 | 0.11 | 0.51 | (0.40) | $9.36 | 5.64% | 0.40% | 4.32% | 48% |
| $22,816 |
|
| 2014 | $9.56 | 0.41 | (0.31) | 0.10 | (0.41) | $9.25 | 1.31% | 0.40% | 4.60% | 87% |
| $13,321 |
|
| 2013 | $9.32 | 0.42 | 0.24 | 0.66 | (0.42) | $9.56 | 7.17% | 0.40% | 4.36% | 111% |
| $4,273 |
|
| 2012 | $8.50 | 0.45 | 0.83 | 1.28 | (0.46) | $9.32 | 15.39% | 0.41% | 5.09% | 70% |
| $7,260 |
|
| A Class | | | | | | | | |
| 2016 | $9.36 | 0.33 | 0.37 | 0.70 | (0.33) | $9.73 | 7.64% | 0.85% | 3.47% | 41% |
| $91,271 |
|
| 2015 | $9.25 | 0.36 | 0.11 | 0.47 | (0.36) | $9.36 | 5.17% | 0.85% | 3.87% | 48% |
| $69,573 |
|
| 2014 | $9.55 | 0.37 | (0.30) | 0.07 | (0.37) | $9.25 | 0.96% | 0.85% | 4.15% | 87% |
| $74,515 |
|
| 2013 | $9.32 | 0.37 | 0.24 | 0.61 | (0.38) | $9.55 | 6.58% | 0.85% | 3.91% | 111% |
| $104,785 |
|
| 2012 | $8.50 | 0.42 | 0.82 | 1.24 | (0.42) | $9.32 | 14.87% | 0.86% | 4.64% | 70% |
| $92,154 |
|
|
| | | | | | | | | | | | | |
| For a Share Outstanding Throughout the Years Ended May 31 (except as noted) |
| Per-Share Data | | | | Ratios and Supplemental Data | | |
| | | Income From Investment Operations: | | | | Ratio to Average Net Assets of: | | |
| | Net Asset Value, Beginning of Period | Net Investment Income (Loss)(1) | Net Realized and Unrealized Gain (Loss) | Total From Investment Operations | Distributions From Net Investment Income | Net Asset Value, End of Period | Total Return(2) | Operating Expenses | Net Investment Income (Loss) | Portfolio Turnover Rate | Net Assets, End of Period (in thousands) |
| C Class | | | | | | | | |
| 2016 | $9.35 | 0.26 | 0.37 | 0.63 | (0.26) | $9.72 | 6.84% | 1.60% | 2.72% | 41% |
| $25,767 |
|
| 2015 | $9.25 | 0.29 | 0.10 | 0.39 | (0.29) | $9.35 | 4.28% | 1.60% | 3.12% | 48% |
| $25,272 |
|
| 2014 | $9.55 | 0.30 | (0.30) | — | (0.30) | $9.25 | 0.21% | 1.60% | 3.40% | 87% |
| $26,244 |
|
| 2013 | $9.32 | 0.30 | 0.24 | 0.54 | (0.31) | $9.55 | 5.91% | 1.60% | 3.16% | 111% |
| $34,865 |
|
| 2012 | $8.49 | 0.35 | 0.83 | 1.18 | (0.35) | $9.32 | 14.03% | 1.61% | 3.89% | 70% |
| $31,344 |
|
|
|
| Notes to Financial Highlights |
| |
| (1) | Computed using average shares outstanding throughout the period. |
| |
| (2) | Total returns are calculated based on the net asset value of the last business day and do not reflect applicable sales charges, if any. Total returns for periods less than one year are not annualized. |
See Notes to Financial Statements.
|
|
| Report of Independent Registered Public Accounting Firm |
To the Trustees of the American Century Municipal Trust and Shareholders of the High-Yield Municipal Fund:
In our opinion, the accompanying statement of assets and liabilities, including the schedule of investments, and the related statements of operations and of changes in net assets and the financial highlights present fairly, in all material respects, the financial position of the High-Yield Municipal Fund (one of the four funds comprising the American Century Municipal Trust, hereafter referred to as the "Fund") at May 31, 2016, the results of its operations for the year then ended, the changes in its net assets for each of the two years in the period then ended and the financial highlights for each of the five years in the period then ended, in conformity with accounting principles generally accepted in the United States of America. These financial statements and financial highlights (hereafter referred to as "financial statements") are the responsibility of the Fund's management. Our responsibility is to express an opinion on these financial statements based on our audits. We conducted our audits of these financial statements in accordance with the standards of the Public Company Accounting Oversight Board (United States). Those standards require that we plan and perform the audit to obtain reasonable assurance about whether the financial statements are free of material misstatement. An audit includes examining, on a test basis, evidence supporting the amounts and disclosures in the financial statements, assessing the accounting principles used and significant estimates made by management, and evaluating the overall financial statement presentation. We believe that our audits, which included confirmation of securities at May 31, 2016 by correspondence with the custodian and brokers, provide a reasonable basis for our opinion.
PricewaterhouseCoopers LLP
Kansas City, Missouri
July 22, 2016
Board of Trustees
The individuals listed below serve as trustees of the funds. Each trustee will continue to serve in this capacity until death, retirement, resignation or removal from office. The board has adopted a mandatory retirement age for trustees who are not “interested persons,” as that term is defined in the Investment Company Act (independent trustees). Independent trustees shall retire on December 31 of the year in which they reach their 75th birthday; provided, however, that on or after January 1, 2022, independent trustees shall retire on December 31 of the year in which they reach their 76th birthday.
Mr. Thomas is an “interested person” because he currently serves as President and Chief Executive Officer of American Century Companies, Inc. (ACC), the parent company of American Century Investment Management, Inc. (ACIM or the advisor). The other trustees (more than three-fourths of the total number) are independent. They are not employees, directors or officers of, and have no financial interest in, ACC or any of its wholly owned, direct or indirect, subsidiaries, including ACIM, American Century Investment Services, Inc. (ACIS) and American Century Services, LLC (ACS), and they do not have any other affiliations, positions or relationships that would cause them to be considered “interested persons” under the Investment Company Act. The trustees serve in this capacity for eight (in the case of Mr. Thomas, 15) registered investment companies in the American Century Investments family of funds.
The following table presents additional information about the trustees. The mailing address for each trustee other than Mr. Thomas is 1665 Charleston Road, Mountain View, California 94043. The mailing address for Mr. Thomas is 4500 Main Street, Kansas City, Missouri 64111.
|
| | | | | |
Name (Year of Birth) | Position(s) Held with Funds | Length of Time Served | Principal Occupation(s) During Past 5 Years | Number of American Century Portfolios Overseen by Trustee | Other Directorships Held During Past 5 Years |
| Independent Trustees |
Tanya S. Beder
(1955) | Trustee | Since 2011 | Chairman and CEO, SBCC Group Inc. (independent advisory services) (2006 to present) | 45 | CYS Investments, Inc. (NYSE mortgage arbitrage REIT) |
Jeremy I. Bulow
(1954) | Trustee | Since 2011 | Professor of Economics, Stanford University, Graduate School of Business (1979 to present) | 45 | None |
Anne Casscells
(1958) | Trustee | Since 2016 | Co-Chief Executive Officer and Chief Investment Officer, Aetos Alternatives Management (investment advisory firm) (2001 to present); Lecturer in Accounting, Stanford University, Graduate School of Business (2009 to present) | 45 | None |
|
| | | | | |
Name (Year of Birth) | Position(s) Held with Funds | Length of Time Served | Principal Occupation(s) During Past 5 Years | Number of American Century Portfolios Overseen by Trustee | Other Directorships Held During Past 5 Years |
| Independent Trustees |
Ronald J. Gilson
(1946) | Trustee and Chairman of the Board | Since 1995
(Chairman since 2005) | Charles J. Meyers Professor of Law and Business, Emeritus, Stanford Law School (1979 to present); Marc and Eva Stern Professor of Law and Business, Columbia University School of Law (1992 to present) | 45 | None |
Frederick L. A. Grauer
(1946) | Trustee | Since 2008 | Senior Advisor, iShares by BlackRock, Inc. (investment management firm) (2010 to 2011, 2013 to present); Senior Advisor, Course Hero (an educational technology company) (2015 to present) | 45 | None |
Jonathan D. Levin
(1972) | Trustee | Since 2016 | Holbrook Working Professor of Price Theory, Standford University, (2000 to present); Chair, Department of Economics, Stanford University (2011 to 2014) | 45 | None |
Peter F. Pervere
(1947) | Trustee | Since 2007 | Retired | 45 | None |
John B. Shoven
(1947) | Trustee | Since 2002 | Charles R. Schwab Professor of Economics, Stanford University (1973 to present) | 45 | Cadence Design Systems; Exponent; Financial Engines |
| Interested Trustee |
Jonathan S. Thomas
(1963) | Trustee and President | Since 2007 | President and Chief Executive Officer, ACC (March 2007 to present). Also serves as Chief Executive Officer, ACS; Executive Vice President, ACIM; Director, ACC, ACIM and other ACC subsidiaries | 128 | BioMed Valley Discoveries, Inc. |
The Statement of Additional Information has additional information about the fund's trustees and is available without charge, upon request, by calling 1-800-345-2021.
Officers
The following table presents certain information about the executive officers of the funds. Each officer serves as an officer for each of the 15 investment companies in the American Century family of funds, unless otherwise noted. No officer is compensated for his or her service as an officer of the funds. The listed officers are interested persons of the funds and are appointed or re-appointed on an annual basis. The mailing address for each of the officers listed below is 4500 Main Street, Kansas City, Missouri 64111.
|
| | |
Name (Year of Birth) | Offices with
the Funds | Principal Occupation(s) During the Past Five Years |
Jonathan S.
Thomas
(1963) | Trustee and
President
since 2007 | President and Chief Executive Officer, ACC (March 2007 to present). Also serves as Chief Executive Officer, ACS; Executive Vice President, ACIM; Director, ACC, ACIM and other ACC subsidiaries |
Amy D. Shelton
(1964) | Chief Compliance
Officer and Vice President since 2014 | Chief Compliance Officer, American Century funds, (March 2014 to present); Chief Compliance Officer, ACIM (February 2014 to present); Chief Compliance Officer, ACIS (October 2009 to present); Vice President, Client Interactions and Marketing, ACIS (February 2013 to January 2014); Director, Client Interactions and Marketing, ACIS (June 2007 to January 2013). Also serves as Vice President, ACIS |
Charles A.
Etherington
(1957) | General Counsel
since 2007 and
Senior Vice
President since 2006 | Attorney, ACC (February 1994 to present); Vice President, ACC (November 2005 to present); General Counsel, ACC (March 2007 to present). Also serves as General Counsel, ACIM, ACS, ACIS and other ACC subsidiaries; and Senior Vice President, ACIM and ACS |
C. Jean Wade
(1964) | Vice President,
Treasurer and
Chief Financial
Officer since 2012 | Vice President, ACS (February 2000 to present) |
Robert J.
Leach
(1966) | Vice President
since 2006 and
Assistant Treasurer
since 2012 | Vice President, ACS (February 2000 to present) |
David H.
Reinmiller
(1963) | Vice President
since 2001 | Attorney, ACC (January 1994 to present); Associate General Counsel, ACC (January 2001 to present). Also serves as Vice President, ACIM and ACS |
Ward D.
Stauffer
(1960) | Secretary
since 2005 | Attorney, ACC (June 2003 to present) |
Proxy Voting Policies
Descriptions of the principles and policies that the fund's investment advisor uses in exercising the voting rights associated with the securities purchased and/or held by the fund are available without charge, upon request, by calling 1-800-345-2021 or visiting the "About Us" page of American Century Investments’ website at americancentury.com. A description of the policies is also available on the Securities and Exchange Commission’s website at sec.gov. Information regarding how the investment advisor voted proxies relating to portfolio securities during the most recent 12-month period ended June 30 is available on the "About Us" page at americancentury.com. It is also available at sec.gov.
Quarterly Portfolio Disclosure
The fund files its complete schedule of portfolio holdings with the Securities and Exchange Commission (SEC) for the first and third quarters of each fiscal year on Form N-Q. The fund’s Forms N-Q are available on the SEC’s website at sec.gov, and may be reviewed and copied at the SEC’s Public Reference Room in Washington, DC. Information on the operation of the Public Reference Room may be obtained by calling 1-800-SEC-0330. The fund also makes its complete schedule of portfolio holdings for the most recent quarter of its fiscal year available on its website at americancentury.com and, upon request, by calling 1-800-345-2021.
Other Tax Information
The following information is provided pursuant to provisions of the Internal Revenue Code.
The fund designates $15,583,662 as exempt interest dividends for the fiscal year ended May 31, 2016.
|
| | |
| |
| | | |
| Contact Us | americancentury.com | |
| Automated Information Line | 1-800-345-8765 | |
| Investor Services Representative | 1-800-345-2021 or 816-531-5575 | |
| Investors Using Advisors | 1-800-378-9878 | |
| Business, Not-For-Profit, Employer-Sponsored Retirement Plans | 1-800-345-3533 | |
| Banks and Trust Companies, Broker-Dealers, Financial Professionals, Insurance Companies | 1-800-345-6488 | |
| Telecommunications Relay Service for the Deaf | 711 | |
| | | |
| American Century Municipal Trust | |
| | | |
Investment Advisor: American Century Investment Management, Inc. Kansas City, Missouri | |
| | | |
| This report and the statements it contains are submitted for the general information of our shareholders. The report is not authorized for distribution to prospective investors unless preceded or accompanied by an effective prospectus. | |
| | | |
©2016 American Century Proprietary Holdings, Inc. All rights reserved.
CL-ANN-89435 1607 | |
|
| |
| | |
| | Annual Report |
| | |
| | May 31, 2016 |
| | |
| | Intermediate-Term Tax-Free Bond Fund |
|
| | |
| President’s Letter | 2 |
|
| Performance | 3 |
|
| Portfolio Commentary | |
|
| Fund Characteristics | |
|
| Shareholder Fee Example | |
|
| Schedule of Investments | |
|
| Statement of Assets and Liabilities | |
|
| Statement of Operations | |
|
| Statement of Changes in Net Assets | |
|
| Notes to Financial Statements | |
|
| Financial Highlights | |
|
| Report of Independent Registered Public Accounting Firm | |
|
| Management | |
|
| Additional Information | |
|
Any opinions expressed in this report reflect those of the author as of the date of the report, and do not necessarily represent the opinions of American Century Investments® or any other person in the American Century Investments organization. Any such opinions are subject to change at any time based upon market or other conditions and American Century Investments disclaims any responsibility to update such opinions. These opinions may not be relied upon as investment advice and, because investment decisions made by American Century Investments funds are based on numerous factors, may not be relied upon as an indication of trading intent on behalf of any American Century Investments fund. Security examples are used for representational purposes only and are not intended as recommendations to purchase or sell securities. Performance information for comparative indices and securities is provided to American Century Investments by third party vendors. To the best of American Century Investments’ knowledge, such information is accurate at the time of printing.
|
| |
| Dear Investor:
Thank you for reviewing this annual report for the 12 months ended May 31, 2016. It provides investment performance and portfolio information for the reporting period, plus longer-term historical performance data.
Annual reports help convey information about fund performance, including market and economic factors that affected returns during the reporting period. For additional, updated investment and market insights, we encourage you to visit our website, americancentury.com. |
| Jonathan Thomas |
Municipal Bonds (Munis) Extended Their Outperformance During a Continued Volatile Period
The narrative provided six months ago in our semiannual report letter hasn’t changed much—the key conditions described then extended for another half year. As explained then, widespread concerns about global economic growth sparked sharp financial market volatility. The primary catalyst was China, where slowing economic growth, currency devaluations, and massive monetary policy easing sent shock waves through the global markets. These factors re-emerged in January and early February this year, triggering sell-offs in riskier assets such as stocks and high-yield bonds. In the U.S. stock market, relatively defensive sectors such as utilities, telecommunication services, and consumer discretionary performed best. In the U.S. bond market, high-quality sectors including munis and Treasuries were market leaders.
Consistent with the first six months of the reporting period, munis continued to outperform for the full fiscal year. The broad muni market benefited from its comparatively high overall credit quality, despite defaults in Puerto Rico and financial concerns facing Illinois and New Jersey. We continue to view these as isolated incidents running counter to overall muni credit quality trends. Also, as government bond yields fell globally during the last six months of the reporting period, after-tax muni yields looked attractive, especially for investors in top tax brackets.
We expect many of the factors that kept sovereign bond yields low during the reporting period to persist through the end of the year, keeping U.S. government bond yields range-bound, despite the Federal Reserve’s attempts to raise its interest rate target. We believe those attempts will be muted in the face of continuing global economic, political, and market headwinds. Furthermore, conjecture about Federal Reserve policy and the outcome of the U.S. presidential election, among other factors, could lead to further market volatility, presenting both challenges and opportunities for active investment managers. We continue to believe in a disciplined, diversified, risk-aware investment approach, using professionally managed portfolios to meet financial goals. We appreciate your trust in us.
Sincerely,
Jonathan Thomas
President and Chief Executive Officer
American Century Investments
|
| | | | | | |
| Total Returns as of May 31, 2016 |
| | | | Average Annual Returns | |
| | Ticker Symbol | 1 year | 5 years | 10 years | Since Inception | Inception Date |
Investor Class | TWTIX | 4.66% | 3.67% | 4.14% | — | 3/2/87 |
| Barclays 7 Year Municipal Bond Index | — | 5.05% | 4.12% | 4.98% | — | — |
| Institutional Class | AXBIX | 4.77% | 3.87% | 4.34% | — | 4/15/03 |
| A Class | TWWOX
| | | | | 3/1/10 |
| No sales charge | | 4.30% | 3.41% | — | 3.44% | |
| With sales charge | | -0.35% | 2.47% | — | 2.68% | |
| C Class | TWTCX | 3.53% | 2.64% | — | 2.65% | 3/1/10 |
Average annual returns since inception are presented when ten years of performance history is not available. Returns would have been lower if a portion of the fees had not been waived.
Sales charges include initial sales charges and contingent deferred sales charges (CDSCs), as applicable. A Class shares have a 4.50% maximum initial sales charge and may be subject to a maximum CDSC of 1.00%. C Class shares redeemed within 12 months of purchase are subject to a maximum CDSC of 1.00%. The SEC requires that mutual funds provide performance information net of maximum sales charges in all cases where charges could be applied.
Data presented reflect past performance. Past performance is no guarantee of future results. Current performance may be higher or lower than the performance shown. Total returns for periods less than one year are not annualized. Investment return and principal value will fluctuate, and redemption value may be more or less than original cost. Data assumes reinvestment of dividends and capital gains, and none of the charts reflect the deduction of taxes that a shareholder would pay on fund distributions or the redemption of fund shares. To obtain performance data current to the most recent month end, please call 1-800-345-2021 or visit americancentury.com. For additional information about the fund, please consult the prospectus.
|
|
Growth of $10,000 Over 10 Years |
| $10,000 investment made May 31, 2006 |
| Performance for other share classes will vary due to differences in fee structure. |
|
| |
| Value on May 31, 2016 |
| | Investor Class — $15,003 |
| |
| | Barclays 7 Year Municipal Bond Index — $16,264 |
| |
Ending value would have been lower if a portion of the fees had not been waived.
|
| | | |
Total Annual Fund Operating Expenses |
Investor Class | Institutional Class | A Class | C Class |
| 0.47% | 0.27% | 0.72% | 1.47% |
The total annual fund operating expenses shown is as stated in the fund’s prospectus current as of the date of this report. The prospectus may vary from the expense ratio shown elsewhere in this report because it is based on a different time period, includes acquired fund fees and expenses, and, if applicable, does not include fee waivers or expense reimbursements.
Data presented reflect past performance. Past performance is no guarantee of future results. Current performance may be higher or lower than the performance shown. Total returns for periods less than one year are not annualized. Investment return and principal value will fluctuate, and redemption value may be more or less than original cost. Data assumes reinvestment of dividends and capital gains, and none of the charts reflect the deduction of taxes that a shareholder would pay on fund distributions or the redemption of fund shares. To obtain performance data current to the most recent month end, please call 1-800-345-2021 or visit americancentury.com. For additional information about the fund, please consult the prospectus.
Portfolio Managers: Alan Kruss, Joseph Gotelli, and Steven Permut
Performance Summary
Intermediate-Term Tax-Free Bond returned 4.66%* for the 12 months ended May 31, 2016. By comparison, the Barclays 7 Year Municipal Bond Index returned 5.05%. Fund returns reflect operating expenses, while index returns do not.
The fund’s return for the reporting period largely reflected the positive overall performance of the municipal bond (muni) market against a backdrop of ongoing capital market volatility. After struggling in June 2015, the broad muni market posted positive monthly gains for the next 11 months, outperforming the U.S. Treasury market and the broad U.S. taxable investment-grade market for the full 12-month period.
Muni Market Dynamics Aided Performance
Investor concerns about global growth (particularly in China), commodity prices, and central bank monetary decisions created a volatile market climate throughout the reporting period. The U.S. economy continued to exhibit modest growth, but the U.S. Federal Reserve (the Fed) remained focused on the sluggish global landscape and its potential risks to the U.S. economy. This triggered ongoing investor speculation regarding the timing and magnitude of interest rate “normalization” from the Fed. This uncertainty contributed to the period’s market volatility. Ultimately, the Fed delayed its much-anticipated 2015 interest rate hike until the final month of the year, lifting the range for its benchmark short-term interest rate 25 basis points (1 basis point equals 0.01%) to 0.25%-0.50% on December 16. The new year ushered in a fresh round of global growth worries and a severe equity market sell-off. The Fed took an anticipated first-quarter rate hike off the table, and investors gradually curtailed their expectations for additional rate hikes in 2016. The Fed held rates steady through the end of the reporting period, citing concerns about the health of the global economy and weaker-than-expected first-quarter U.S. economic growth as reasons to pursue a “lower for longer” rate strategy. Meanwhile, central banks in Europe, Japan, and China continued to cut interest rates and implement other aggressive stimulus programs in response to weak growth rates and the threat of deflation in those regions.
This environment generally led to positive performance for U.S. Treasuries and most U.S. bond market sectors. Yields on the 10-year Treasury note and the 30-year Treasury bond declined 27 basis points and 23 basis points, respectively, while the yield on the Fed policy-sensitive two-year Treasury note increased 27 basis points. Munis generally tracked the U.S. Treasury market, but factors specific to the municipal market helped munis outperform. In particular, supply and demand dynamics remained favorable, which supported gains. Other than an increase in muni supply early in the period (as issuers rushed to issue or refinance debt ahead of the Fed’s rate hike), supply declined modestly for the period overall. At the same time, demand for munis remained robust due to the tax advantages and perceived “safe-haven” munis offered investors. As of May 31, 2016, muni funds experienced 34 consecutive weeks of positive flows, according to Lipper Inc.
Overall, all major sectors of the muni bond market posted positive returns for the 12-month period. Longer-maturity and higher-quality munis generally performed better than shorter-maturity and lower-quality securities, and revenue bonds outperformed GO (general obligation) bonds.
* All fund returns referenced in this commentary are for Investor Class shares. Performance for other share classes will vary due to differences in fee structure; when Investor Class performance exceeds that of the benchmark, other share classes may not. See page 3 for returns for all share classes.
Market Fundamentals Remained Positive Despite Isolated Credit Events
Despite negative credit events for specific issuers in Puerto Rico, Chicago, New Jersey, and other relatively isolated entities, muni market fundamentals generally remained positive and continued to provide support to the broad market. We believe the main problems facing these issuers are due largely to their own individual circumstances and are not indicative of any particular systemic municipal market problem.
From a broad fiscal standpoint, state and local finances across the U.S. remained relatively healthy during the reporting period, even as revenue growth slowed largely due to weak stock market returns. However, spending restraint has enabled most states to maintain stable credit profiles. From a credit rating perspective, muni credit-rating upgrades continued to slightly outpace downgrades, and the muni default rate remained low. We continue to believe it’s unlikely any states will default, but select, isolated state, local, and commonwealth credit ratings may be pressured by special circumstances.
Security Selection Aided Performance; Maturity Strategy Generated Mixed Results
In terms of sector exposure, we continued to favor revenue bonds versus GO bonds. This positioning aided portfolio performance. Within the revenue bond sector, we continued to overweight hospital, transportation (mainly airports and toll roads), and water and sewer bonds. Geographically, we decreased exposure to Connecticut, Louisiana, Pennsylvania, and New Jersey issuers. We added small positions in Chicago water and wastewater bonds and sold a position in Chicago motor fuel tax bonds. Furthermore, as of May 31, 2016, the portfolio had no exposure to troubled munis issued by the City of Chicago, the Chicago Board of Education, or Puerto Rico.
Our maturity positioning generated mixed results. We generally maintain a “laddered” maturity structure, which seeks broad exposure to different muni maturities to achieve the portfolio’s target weighted average maturity. Early in the period, rate-hike speculation caused longer-maturity yields to increase at a greater pace than shorter-maturity yields, and the muni yield curve steepened. In this environment, the portfolio’s exposure to the longer end of the yield curve weighed on performance. But as the period progressed and additional short-term rate hikes from the Fed became less likely in the near term, yields declined across the curve, particularly at the longer end. The yield curve flattened, and the portfolio’s exposure to intermediate- and longer-maturity yields lifted results. In addition, beginning in December 2015, we tactically increased the portfolio’s duration (price sensitivity to interest rate changes), which also aided performance as longer-maturity yields declined. We used U.S. Treasury futures contracts at times as part of our duration strategy.
Market Volatility Likely to Persist
Looking ahead, we believe U.S. economic fundamentals eventually will prompt the Fed to resume interest-rate normalization. But weaker global economic fundamentals, U.S. dollar strength, and geopolitical risks may delay Fed action and keep rates range-bound. We expect market volatility to persist as investors await additional Fed comments and action on short-term interest rates. Volatility also is likely to escalate as the U.S. presidential campaign heats up and the candidates debate tax and other policies prior to the November election. Mounting market volatility may cause credit spreads (the yield differential between high-quality and low-quality munis of similar maturity) to widen, which may present compelling buying opportunities among lower-quality credits. In this environment, we believe fundamental credit research, active management, and security selection will become increasingly important.
|
| |
| MAY 31, 2016 | |
Portfolio at a Glance | |
| Weighted Average Maturity | 9.7 years |
| Average Duration (Modified) | 4.5 years |
| | |
Top Five States and Territories | % of net assets |
| New York | 17.4% |
| California | 16.1% |
| Texas | 8.9% |
| Florida | 6.6% |
| Washington | 5.8% |
| | |
Top Five Sectors | % of fund investments |
| General Obligation (GO) - State | 13% |
| Tollroads | 11% |
| General Obligation (GO) - Local | 10% |
| Special Tax | 10% |
| Hospital | 10% |
| | |
Types of Investments in Portfolio | % of net assets |
| Municipal Securities | 99.7% |
| Temporary Cash Investments | —* |
| Other Assets and Liabilities | 0.3% |
*Category is less than 0.05% of total net assets.
Fund shareholders may incur two types of costs: (1) transaction costs, including sales charges (loads) on purchase payments and redemption/exchange fees; and (2) ongoing costs, including management fees; distribution and service (12b-1) fees; and other fund expenses. This example is intended to help you understand your ongoing costs (in dollars) of investing in your fund and to compare these costs with the ongoing cost of investing in other mutual funds.
The example is based on an investment of $1,000 made at the beginning of the period and held for the entire period from December 1, 2015 to May 31, 2016.
Actual Expenses
The table provides information about actual account values and actual expenses for each class. You may use the information, together with the amount you invested, to estimate the expenses that you paid over the period. First, identify the share class you own. Then simply divide your account value by $1,000 (for example, an $8,600 account value divided by $1,000 = 8.6), then multiply the result by the number under the heading “Expenses Paid During Period” to estimate the expenses you paid on your account during this period.
If you hold Investor Class shares of any American Century Investments fund, or Institutional Class shares of the American Century Diversified Bond Fund, in an American Century Investments account (i.e., not a financial intermediary or retirement plan account), American Century Investments may charge you a $12.50 semiannual account maintenance fee if the value of those shares is less than $10,000. We will redeem shares automatically in one of your accounts to pay the $12.50 fee. In determining your total eligible investment amount, we will include your investments in all personal accounts (including American Century Investments Brokerage accounts) registered under your Social Security number. Personal accounts include individual accounts, joint accounts, UGMA/UTMA accounts, personal trusts, Coverdell Education Savings Accounts and IRAs (including traditional, Roth, Rollover, SEP-, SARSEP- and SIMPLE-IRAs), and certain other retirement accounts. If you have only business, business retirement, employer-sponsored or American Century Investments Brokerage accounts, you are currently not subject to this fee. If you are subject to the Account Maintenance Fee, your account value could be reduced by the fee amount.
Hypothetical Example for Comparison Purposes
The table also provides information about hypothetical account values and hypothetical expenses based on the actual expense ratio of each class of your fund and an assumed rate of return of 5% per year before expenses, which is not the actual return of a fund’s share class. The hypothetical account values and expenses may not be used to estimate the actual ending account balance or expenses you paid for the period. You may use this information to compare the ongoing costs of investing in your fund and other funds. To do so, compare this 5% hypothetical example with the 5% hypothetical examples that appear in the shareholder reports of the other funds.
Please note that the expenses shown in the table are meant to highlight your ongoing costs only and do not reflect any transactional costs, such as sales charges (loads) or redemption/exchange fees. Therefore, the table is useful in comparing ongoing costs only, and will not help you determine the relative total costs of owning different funds. In addition, if these transactional costs were included, your costs would have been higher.
|
| | | | | | |
| | Beginning
Account Value
12/1/15 | Ending
Account Value
5/31/16 | Expenses Paid
During Period(1)
12/1/15 - 5/31/16 |
Annualized
Expense Ratio(1) |
Actual | | | | |
| Investor Class | $1,000 |
| $1,027.70 |
| $2.38 | 0.47% |
| Institutional Class | $1,000 |
| $1,027.90 |
| $1.37 | 0.27% |
| A Class | $1,000 |
| $1,025.50 |
| $3.65 | 0.72% |
| C Class | $1,000 |
| $1,021.70 |
| $7.43 | 1.47% |
Hypothetical | | | | |
| Investor Class | $1,000 |
| $1,022.65 |
| $2.38 | 0.47% |
| Institutional Class | $1,000 |
| $1,023.65 |
| $1.37 | 0.27% |
| A Class | $1,000 |
| $1,021.40 |
| $3.64 | 0.72% |
| C Class | $1,000 |
| $1,017.65 |
| $7.41 | 1.47% |
| |
| (1) | Expenses are equal to the class's annualized expense ratio listed in the table above, multiplied by the average account value over the period, multiplied by 183, the number of days in the most recent fiscal half-year, divided by 366, to reflect the one-half year period. |
MAY 31, 2016
|
| | | | | | |
| | Principal Amount | Value |
| MUNICIPAL SECURITIES — 99.7% | | |
| Alabama — 0.4% | | |
| Alabama 21st Century Authority Rev., 4.00%, 6/1/16 | $ | 1,060,000 |
| $ | 1,060,000 |
|
| Alabama 21st Century Authority Rev., 5.00%, 6/1/17 | 1,500,000 |
| 1,561,365 |
|
| Alabama 21st Century Authority Rev., 5.00%, 6/1/19 | 4,510,000 |
| 5,005,965 |
|
| Infirmary Health System Special Care Facilities Financing Authority of Mobile Rev., (Infirmary Health System Obligated Group), 5.00%, 2/1/26 | 5,925,000 |
| 7,309,080 |
|
| | | 14,936,410 |
|
| Alaska — 0.8% | | |
| Borough of Aleutians East Rev., (Aleutian Pribilof Islands Association, Inc.), 5.00%, 6/1/20 (ACA) | 1,535,000 |
| 1,536,182 |
|
State of Alaska International Airports System Rev., 5.00%, 10/1/32(1) | 3,560,000 |
| 4,222,552 |
|
| Valdez Rev., (BP Pipelines Alaska, Inc.), 5.00%, 1/1/21 (GA: BP plc) | 2,600,000 |
| 2,969,330 |
|
| Valdez Rev., (Exxon Mobil Corp.), VRDN, 0.34%, 6/1/16 | 18,900,000 |
| 18,900,000 |
|
| | | 27,628,064 |
|
| Arizona — 1.5% | | |
| Arizona Health Facilities Authority Rev., (Banner Health Obligated Group), 5.00%, 1/1/25 | 1,980,000 |
| 2,478,227 |
|
| Arizona Health Facilities Authority Rev., (Banner Health Obligated Group), VRDN, 1.23%, 7/1/16 | 7,500,000 |
| 6,807,075 |
|
| Arizona Water Infrastructure Finance Authority Rev., 5.00%, 10/1/18 | 3,000,000 |
| 3,289,560 |
|
| Industrial Development Authority of the City of Phoenix Rev., (Great Hearts Academies), 5.00%, 7/1/36 | 1,875,000 |
| 2,095,688 |
|
| Industrial Development Authority of the City of Phoenix Rev., (Great Hearts Academies), 5.00%, 7/1/41 | 1,200,000 |
| 1,323,540 |
|
| Industrial Development Authority of the City of Phoenix Rev., (Great Hearts Academies), 5.00%, 7/1/46 | 1,300,000 |
| 1,427,517 |
|
| Mesa Rev., 5.00%, 7/1/27 | 2,000,000 |
| 2,086,420 |
|
| Mohave County Industrial Development Authority Rev., (Mohave Prison LLC), 8.00%, 5/1/25 | 5,000,000 |
| 5,604,750 |
|
| Navajo County Unified School District No. 20 Whiteriver Rev., 5.00%, 7/1/17 (NATL) | 1,815,000 |
| 1,892,011 |
|
| Phoenix GO, 6.25%, 7/1/17 | 1,070,000 |
| 1,134,575 |
|
| Phoenix Civic Improvement Corp. Rev., 5.00%, 7/1/21 | 1,000,000 |
| 1,185,750 |
|
| Phoenix Civic Improvement Corp. Rev., 5.00%, 7/1/22 | 1,225,000 |
| 1,485,692 |
|
| Phoenix Civic Improvement Corp. Rev., 5.50%, 7/1/24 | 1,750,000 |
| 1,918,630 |
|
| Phoenix Civic Improvement Corp. Rev., 5.00%, 7/1/40 | 3,000,000 |
| 3,378,810 |
|
Pima County Metropolitan Domestic Water Improvement District Rev., 5.25%, 7/1/18 (Ambac)(2) | 1,065,000 |
| 1,162,362 |
|
| Pima County Metropolitan Domestic Water Improvement District Rev., 5.25%, 7/1/18 (Ambac) | 645,000 |
| 697,884 |
|
Pima County Metropolitan Domestic Water Improvement District Rev., 5.25%, 7/1/19 (Ambac)(2) | 1,120,000 |
| 1,266,171 |
|
| Pima County Metropolitan Domestic Water Improvement District Rev., 5.25%, 7/1/19 (Ambac) | 680,000 |
| 759,383 |
|
| Salt River Project Agricultural Improvement & Power District Rev., 5.00%, 1/1/38 | 4,900,000 |
| 5,203,898 |
|
|
| | | | | | |
| | Principal Amount | Value |
| Salt River Project Agricultural Improvement & Power District Rev., 5.00%, 1/1/39 | $ | 4,060,000 |
| $ | 4,445,781 |
|
| | | 49,643,724 |
|
| California — 16.1% | | |
| Alameda Corridor Transportation Authority Rev., 4.00%, 10/1/21 | 700,000 |
| 791,658 |
|
| Alameda Corridor Transportation Authority Rev., 4.00%, 10/1/23 | 1,000,000 |
| 1,152,340 |
|
| Alameda Corridor Transportation Authority Rev., 5.00%, 10/1/24 | 1,000,000 |
| 1,236,980 |
|
| Alameda Corridor Transportation Authority Rev., 5.00%, 10/1/34 | 6,990,000 |
| 8,423,998 |
|
| Anaheim Public Financing Authority Rev., 5.00%, 5/1/24 | 1,500,000 |
| 1,857,675 |
|
Anaheim Public Financing Authority Rev., Capital Appreciation, 0.00%, 9/1/25 (AGM)(3) | 2,000,000 |
| 1,579,940 |
|
| Anaheim Public Financing Authority Rev., 5.00%, 5/1/26 | 2,000,000 |
| 2,452,640 |
|
| Anaheim Public Financing Authority Rev., 5.00%, 5/1/27 | 1,725,000 |
| 2,123,458 |
|
| Anaheim Public Financing Authority Rev., 5.00%, 5/1/30 | 1,750,000 |
| 2,130,695 |
|
| Anaheim Public Financing Authority Rev., 5.00%, 5/1/31 | 2,000,000 |
| 2,425,840 |
|
| Anaheim Public Financing Authority Rev., 5.00%, 5/1/32 | 2,000,000 |
| 2,427,460 |
|
| Anaheim Public Financing Authority Rev., 5.00%, 5/1/33 | 1,800,000 |
| 2,177,406 |
|
| Bay Area Toll Authority Rev., 5.00%, 4/1/26 | 5,900,000 |
| 7,099,470 |
|
| Bay Area Toll Authority Rev., VRDN, 1.10%, 6/2/16 | 2,000,000 |
| 2,000,480 |
|
| Bay Area Toll Authority Rev., VRDN, 1.50%, 6/2/16 | 3,750,000 |
| 3,727,612 |
|
| Bay Area Toll Authority Rev., VRDN, 1.45%, 8/1/17 | 5,975,000 |
| 6,007,265 |
|
| Bay Area Toll Authority Rev., VRDN, 1.50%, 4/2/18 | 1,970,000 |
| 1,986,410 |
|
| California Educational Facilities Authority Rev., (Pomona College), 5.00%, 1/1/24 | 3,500,000 |
| 3,882,690 |
|
| California Health Facilities Financing Authority Rev., (Adventist Health System/West Obligated Group), 5.75%, 9/1/39 | 2,500,000 |
| 2,847,400 |
|
| California Health Facilities Financing Authority Rev., (Children's Hospital of Orange County), 6.50%, 11/1/38 (GA: Children's Healthcare of California) | 10,000,000 |
| 11,789,200 |
|
| California Health Facilities Financing Authority Rev., (Dignity Health Obligated Group), 5.50%, 7/1/22 | 5,000,000 |
| 5,701,950 |
|
California Health Facilities Financing Authority Rev., (Lucile Salter Packard Children's Hospital at Stanford Obligated Group), VRDN, 1.45%, 3/15/17, Prerefunded at 100% of Par(2) | 1,500,000 |
| 1,509,870 |
|
California Health Facilities Financing Authority Rev., (Lucile Salter Packard Children's Hospital at Stanford Obligated Group), VRDN, 1.45%, 3/15/17, Prerefunded at 100% of Par(2) | 2,200,000 |
| 2,214,476 |
|
California Health Facilities Financing Authority Rev., (Lucile Salter Packard Children's Hospital at Stanford Obligated Group), VRDN, 1.45%, 3/15/17, Prerefunded at 100% of Par(2) | 1,355,000 |
| 1,363,916 |
|
California Health Facilities Financing Authority Rev., (Providence Health & Services Obligated Group), 6.50%, 10/1/18, Prerefunded at 100% of Par(2) | 35,000 |
| 39,659 |
|
California Health Facilities Financing Authority Rev., (Providence Health & Services Obligated Group), 6.50%, 10/1/18, Prerefunded at 100% of Par(2) | 2,090,000 |
| 2,368,200 |
|
| California Health Facilities Financing Authority Rev., (St. Joseph Health System Obligated Group), 5.00%, 7/1/37 | 1,775,000 |
| 2,084,045 |
|
| California Health Facilities Financing Authority Rev., (Sutter Health Obligated Group), 5.00%, 8/15/19 | 1,900,000 |
| 2,145,917 |
|
| California Health Facilities Financing Authority Rev., (Sutter Health Obligated Group), 5.00%, 8/15/24 | 1,250,000 |
| 1,507,500 |
|
| California Municipal Finance Authority COP, (Community Hospitals of Central California Obligated Group), 5.50%, 2/1/39 | 1,450,000 |
| 1,605,455 |
|
|
| | | | | | |
| | Principal Amount | Value |
| California Municipal Finance Authority Rev., (University of La Verne), 6.25%, 6/1/40 | $ | 1,500,000 |
| $ | 1,747,305 |
|
California State Public Works Board Rev., 5.00%, 9/1/22, Prerefunded at 100% of Par(2) | 1,935,000 |
| 2,370,123 |
|
| California State Public Works Board Rev., 5.375%, 11/1/22 | 8,000,000 |
| 9,239,840 |
|
| California State Public Works Board Rev., 5.00%, 4/1/24 | 11,500,000 |
| 13,907,870 |
|
| California State Public Works Board Rev., 5.00%, 4/1/25 | 5,000,000 |
| 6,025,850 |
|
| California State Public Works Board Rev., 5.00%, 5/1/27 | 7,260,000 |
| 9,057,503 |
|
| California State Public Works Board Rev., 6.25%, 4/1/34 | 4,000,000 |
| 4,640,440 |
|
California Statewide Communities Development Authority Rev., 5.25%, 10/1/19 (AGM)(2) | 110,000 |
| 110,447 |
|
| California Statewide Communities Development Authority Rev., (CHF-Irvine LLC), 5.00%, 5/15/25 | 1,500,000 |
| 1,865,820 |
|
| California Statewide Communities Development Authority Rev., (CHF-Irvine LLC), 5.00%, 5/15/26 | 1,500,000 |
| 1,883,865 |
|
| California Statewide Communities Development Authority Rev., (CHF-Irvine LLC), 5.00%, 5/15/27 | 1,000,000 |
| 1,247,140 |
|
| California Statewide Communities Development Authority Rev., (Kaiser Credit Group), 5.00%, 4/1/42 | 10,000,000 |
| 11,545,400 |
|
| California Statewide Communities Development Authority Rev., (Kaiser Credit Group), VRDN, 1.35%, 6/2/16 | 5,000,000 |
| 5,013,550 |
|
| California Statewide Communities Development Authority Rev., (Kaiser Credit Group), VRDN, 5.00%, 5/1/17 | 2,200,000 |
| 2,286,086 |
|
| California Statewide Communities Development Authority Rev., (Kaiser Credit Group), VRDN, 5.00%, 5/1/17 | 2,400,000 |
| 2,493,912 |
|
Clovis Unified School District GO, Capital Appreciation, 0.00%, 8/1/29 (NATL)(3) | 2,230,000 |
| 1,533,861 |
|
| Foothill-De Anza Community College District GO, 5.00%, 8/1/17 (Ambac) | 1,595,000 |
| 1,638,113 |
|
| Foothill-Eastern Transportation Corridor Agency Rev., 6.00%, 1/15/49 | 2,350,000 |
| 2,804,114 |
|
| Foothill-Eastern Transportation Corridor Agency Rev., VRDN, 5.00%, 1/15/18 | 3,750,000 |
| 3,899,625 |
|
| Foothill-Eastern Transportation Corridor Agency Rev., VRDN, 5.50%, 1/15/23 | 3,900,000 |
| 4,636,905 |
|
| Golden State Tobacco Securitization Corp. Rev., 5.00%, 6/1/30 | 1,650,000 |
| 1,965,414 |
|
| Inland Valley Development Agency Tax Allocation, 5.25%, 9/1/37 | 2,225,000 |
| 2,622,674 |
|
| Inland Valley Development Agency Tax Allocation, 5.00%, 9/1/44 | 2,355,000 |
| 2,685,430 |
|
| Jurupa Public Financing Authority Special Tax, 5.00%, 9/1/26 | 1,485,000 |
| 1,805,834 |
|
| Jurupa Public Financing Authority Special Tax, 5.00%, 9/1/28 | 1,250,000 |
| 1,505,375 |
|
| Jurupa Public Financing Authority Special Tax, 5.00%, 9/1/29 | 1,060,000 |
| 1,273,325 |
|
Los Angeles Community College District GO, 5.00%, 8/1/18, Prerefunded at 100% of Par(2) | 2,250,000 |
| 2,456,887 |
|
| Los Angeles County COP, 5.00%, 9/1/20 | 900,000 |
| 1,043,973 |
|
| Los Angeles County COP, 5.00%, 9/1/21 | 1,250,000 |
| 1,485,788 |
|
| Los Angeles Department of Water Rev., 4.00%, 7/1/17 | 100,000 |
| 103,721 |
|
| Los Angeles Department of Water Rev., 5.00%, 7/1/18 | 500,000 |
| 544,385 |
|
| Los Angeles Department of Water Rev., 5.00%, 7/1/19 | 250,000 |
| 281,505 |
|
| Los Angeles Department of Water Rev., 5.00%, 7/1/20 | 5,000,000 |
| 5,648,950 |
|
| Los Angeles Department of Water Rev., 5.00%, 7/1/20 | 1,000,000 |
| 1,160,520 |
|
| Los Angeles Department of Water Rev., 5.00%, 7/1/21 | 500,000 |
| 594,565 |
|
| Los Angeles Unified School District GO, 5.00%, 7/1/18 | 2,300,000 |
| 2,502,676 |
|
| Los Angeles Unified School District GO, 5.00%, 7/1/18 | 3,205,000 |
| 3,487,425 |
|
|
| | | | | | |
| | Principal Amount | Value |
| Los Angeles Unified School District GO, 5.00%, 7/1/20 | $ | 6,065,000 |
| $ | 6,830,403 |
|
| Los Angeles Unified School District GO, 5.00%, 7/1/21 | 6,520,000 |
| 7,339,629 |
|
| Los Angeles Wastewater System Rev., 5.00%, 6/1/27 | 2,400,000 |
| 3,053,208 |
|
| Metropolitan Water District of Southern California Rev., 5.00%, 7/1/35 | 2,300,000 |
| 2,594,768 |
|
| Metropolitan Water District of Southern California Rev., VRDN, 0.78%, 6/2/16 | 7,000,000 |
| 6,993,910 |
|
| Northern California Power Agency Rev., 5.00%, 7/1/19 (AGC) | 2,300,000 |
| 2,500,169 |
|
| Northern California Power Agency Rev., 5.00%, 7/1/20 (AGC) | 2,500,000 |
| 2,714,325 |
|
| Northern California Power Agency Rev., 5.00%, 7/1/21 (AGC) | 5,000,000 |
| 5,425,400 |
|
| Oakland Unified School District/Alameda County GO, 5.00%, 8/1/20 | 5,005,000 |
| 5,668,313 |
|
| Oakland Unified School District/Alameda County GO, 5.00%, 8/1/21 | 1,100,000 |
| 1,270,929 |
|
| Oakland Unified School District/Alameda County GO, 5.00%, 8/1/26 | 1,025,000 |
| 1,250,398 |
|
| Oakland Unified School District/Alameda County GO, 5.00%, 8/1/27 | 1,295,000 |
| 1,576,883 |
|
| Oakland Unified School District/Alameda County GO, 5.00%, 8/1/28 | 1,000,000 |
| 1,208,650 |
|
| Oakland Unified School District/Alameda County GO, 5.00%, 8/1/34 | 1,000,000 |
| 1,180,290 |
|
| Oakland Unified School District/Alameda County GO, 5.00%, 8/1/35 | 800,000 |
| 939,272 |
|
| Oakland Unified School District/Alameda County GO, 6.625%, 8/1/38 | 1,925,000 |
| 2,353,890 |
|
| Palomar Health COP, 6.00%, 11/1/41 | 5,735,000 |
| 6,137,425 |
|
| Plumas Unified School District GO, 5.25%, 8/1/20 (AGM) | 1,000,000 |
| 1,167,650 |
|
Poway Unified School District GO, Capital Appreciation, 0.00%, 8/1/41(3) | 4,610,000 |
| 1,977,782 |
|
| Riverside County Transportation Commission Rev., 5.25%, 6/1/39 | 2,665,000 |
| 3,265,211 |
|
| San Buenaventura Rev., (Community Memorial Health System), 7.50%, 12/1/41 | 3,950,000 |
| 4,884,570 |
|
| San Diego County Water Authority Financing Corp. Rev., 5.00%, 7/1/16 | 5,555,000 |
| 5,555,000 |
|
| San Diego Public Facilities Financing Authority Water Rev., 5.00%, 8/1/22 | 2,000,000 |
| 2,326,780 |
|
| San Diego Public Facilities Financing Authority Water Rev., 5.00%, 8/1/23 | 3,000,000 |
| 3,482,160 |
|
| San Francisco City & County Airport Comm-San Francisco International Airport Rev., 5.00%, 5/1/17 (AGC) | 4,140,000 |
| 4,310,568 |
|
| San Joaquin Hills Transportation Corridor Agency Rev., 5.00%, 1/15/29 | 5,900,000 |
| 6,718,330 |
|
| Southern California Public Power Authority Rev., 5.00%, 7/1/22 | 2,875,000 |
| 3,133,347 |
|
| State of California GO, 5.00%, 10/1/17 | 8,000,000 |
| 8,462,800 |
|
State of California GO, 5.00%, 7/1/18(2) | 870,000 |
| 947,900 |
|
| State of California GO, 5.25%, 9/1/23 | 25,000,000 |
| 30,235,500 |
|
| State of California GO, 5.00%, 9/1/24 | 10,000,000 |
| 12,281,400 |
|
| State of California GO, 5.00%, 8/1/25 | 10,000,000 |
| 12,758,300 |
|
| State of California GO, 5.00%, 3/1/26 | 5,000,000 |
| 6,294,700 |
|
| State of California GO, 5.00%, 8/1/26 | 7,200,000 |
| 9,111,024 |
|
| State of California GO, 5.00%, 12/1/26 | 3,755,000 |
| 4,662,133 |
|
| State of California GO, 5.00%, 2/1/27 | 10,000,000 |
| 12,153,900 |
|
| State of California GO, 5.00%, 11/1/27 | 5,000,000 |
| 6,182,400 |
|
| State of California GO, 5.00%, 2/1/28 | 10,000,000 |
| 12,111,700 |
|
| State of California GO, 5.75%, 4/1/31 | 16,630,000 |
| 18,906,148 |
|
| State of California GO, 4.00%, 9/1/32 | 10,000,000 |
| 11,406,900 |
|
| State of California GO, 5.00%, 11/1/32 | 2,785,000 |
| 2,952,267 |
|
|
| | | | | | |
| | Principal Amount | Value |
| State of California GO, 6.00%, 4/1/38 | $ | 5,000,000 |
| $ | 5,710,200 |
|
| State of California GO, 5.50%, 11/1/39 | 10,000,000 |
| 11,500,400 |
|
| State of California GO, VRN, 1.30%, 6/2/16 | 4,000,000 |
| 4,024,320 |
|
| State of California GO, VRN, 1.40%, 6/2/16 | 1,600,000 |
| 1,613,536 |
|
| State of California GO, VRN, 1.55%, 6/2/16 | 1,920,000 |
| 1,949,683 |
|
State of California Department of Water Resources Rev., 5.00%, 6/1/18, Prerefunded at 100% of Par(2) | 2,795,000 |
| 3,035,622 |
|
| State of California Department of Water Resources Rev., 5.00%, 12/1/22 | 205,000 |
| 222,905 |
|
| State of California Department of Water Resources Rev., 5.00%, 12/1/25 | 10,185,000 |
| 12,649,872 |
|
| State of California Department of Water Resources Power Supply Rev., 5.00%, 5/1/19 | 5,000,000 |
| 5,598,550 |
|
| State of California Department of Water Resources Power Supply Rev., 5.00%, 5/1/21 | 9,760,000 |
| 11,587,170 |
|
| State of California Department of Water Resources Power Supply Rev., 5.00%, 5/1/22 | 6,215,000 |
| 6,705,488 |
|
| Successor Agency to the Richmond County Redevelopment Agency Tax Allocation, 4.00%, 9/1/16 (BAM) | 630,000 |
| 635,128 |
|
| Successor Agency to the Richmond County Redevelopment Agency Tax Allocation, 4.00%, 9/1/17 (BAM) | 395,000 |
| 410,010 |
|
| Successor Agency to the Richmond County Redevelopment Agency Tax Allocation, 4.00%, 9/1/18 (BAM) | 490,000 |
| 521,184 |
|
| Tuolumne Wind Project Authority Rev., 5.625%, 1/1/29 | 2,800,000 |
| 3,125,976 |
|
| Twin Rivers Unified School District COP, VRDN, 3.20%, 6/1/20 (AGM) | 6,250,000 |
| 6,259,562 |
|
| University of California Rev., 5.00%, 5/15/25 | 3,035,000 |
| 3,905,681 |
|
| University of California Rev., 5.00%, 5/15/26 | 2,555,000 |
| 3,258,570 |
|
| University of California Rev., VRDN, 1.40%, 5/15/21 | 3,350,000 |
| 3,356,197 |
|
| | | 538,174,207 |
|
| Colorado — 2.7% | | |
| Adams County COP, 5.00%, 12/1/25 | 2,720,000 |
| 3,447,002 |
|
| Adams County COP, 4.00%, 12/1/26 | 2,250,000 |
| 2,601,405 |
|
| Adams County COP, 4.00%, 12/1/27 | 1,310,000 |
| 1,504,496 |
|
| Aurora Rev., (Children's Hospital Colorado Obligated Group), 5.00%, 12/1/40 | 1,250,000 |
| 1,374,750 |
|
| City & County of Denver Rev., 4.00%, 8/1/46 | 1,500,000 |
| 1,618,260 |
|
| City & County of Denver Airport System Rev., 5.00%, 11/15/21 | 2,500,000 |
| 2,899,450 |
|
| City & County of Denver Airport System Rev., 5.00%, 11/15/43 | 7,400,000 |
| 8,542,338 |
|
| Colorado Educational & Cultural Facilities Authority Rev., (Regis University), 5.00%, 10/1/22 | 1,935,000 |
| 2,273,315 |
|
| Colorado Educational & Cultural Facilities Authority Rev., (Regis University), 5.00%, 10/1/23 | 2,060,000 |
| 2,440,564 |
|
| Colorado Educational & Cultural Facilities Authority Rev., (Regis University), 5.00%, 10/1/24 | 2,165,000 |
| 2,594,103 |
|
| Colorado Health Facilities Authority Rev., (Catholic Health Initiatives), 6.00%, 10/1/23 | 1,500,000 |
| 1,661,790 |
|
| Colorado Health Facilities Authority Rev., (Covenant Retirement Communities Obligated Group), 5.00%, 12/1/35 | 1,000,000 |
| 1,133,520 |
|
Colorado Health Facilities Authority Rev., (Longmont United Hospital), 5.00%, 12/1/16, Prerefunded at 100% of Par (AGC)(2) | 1,000,000 |
| 1,022,160 |
|
| Colorado Health Facilities Authority Rev., (Valley View Hospital Association), 5.00%, 5/15/40 | 1,000,000 |
| 1,160,720 |
|
|
| | | | | | |
| | Principal Amount | Value |
| Colorado Health Facilities Authority Rev., (Valley View Hospital Association), 5.00%, 5/15/45 | $ | 920,000 |
| $ | 1,064,725 |
|
| E-470 Public Highway Authority Rev., VRDN, 1.58%, 6/2/16 | 8,650,000 |
| 8,630,105 |
|
| Jefferson County School District R-1 COP, 5.00%, 12/15/22 | 1,000,000 |
| 1,194,820 |
|
| Jefferson County School District R-1 COP, 5.00%, 12/15/23 | 200,000 |
| 242,974 |
|
| Park Creek Metropolitan District Tax Allocation, 5.00%, 12/1/45 | 3,760,000 |
| 4,294,108 |
|
| Regional Transportation District COP, 5.50%, 6/1/21 | 2,000,000 |
| 2,350,960 |
|
| Regional Transportation District Rev., 5.00%, 11/1/25 | 9,800,000 |
| 11,958,842 |
|
| Regional Transportation District Rev., (Denver Transit Partners LLC), 5.25%, 7/15/19 | 3,600,000 |
| 4,044,240 |
|
| Regional Transportation District Rev., (Denver Transit Partners LLC), 5.25%, 1/15/20 | 4,835,000 |
| 5,470,899 |
|
| Regional Transportation District Rev., (Denver Transit Partners LLC), 5.00%, 7/15/20 | 2,895,000 |
| 3,284,233 |
|
| Regional Transportation District Rev., (Denver Transit Partners LLC), 5.00%, 1/15/21 | 1,400,000 |
| 1,576,302 |
|
| Regional Transportation District Rev., (Denver Transit Partners LLC), 5.00%, 7/15/21 | 1,400,000 |
| 1,570,380 |
|
| Regional Transportation District Rev., (Denver Transit Partners LLC), 5.00%, 1/15/22 | 1,400,000 |
| 1,567,426 |
|
| Regional Transportation District Rev., (Denver Transit Partners LLC), 5.00%, 7/15/22 | 1,500,000 |
| 1,679,385 |
|
| Regional Transportation District Rev., (Denver Transit Partners LLC), 6.00%, 1/15/41 | 1,000,000 |
| 1,158,570 |
|
| State of Colorado Department of Transportation Rev., 5.00%, 12/15/16 | 5,000,000 |
| 5,120,000 |
|
University of Colorado Rev., 5.25%, 6/1/19, Prerefunded at 100% of Par(2) | 1,200,000 |
| 1,353,720 |
|
| | | 90,835,562 |
|
| Connecticut — 1.7% | | |
| Connecticut State Health & Educational Facility Authority Rev., (Ascension Health Credit Group), VRDN, 1.55%, 2/1/17 | 3,000,000 |
| 3,015,240 |
|
| Connecticut State Health & Educational Facility Authority Rev., (Quinnipiac University), 5.00%, 7/1/16 (NATL) | 2,660,000 |
| 2,669,656 |
|
| Connecticut State Health & Educational Facility Authority Rev., (Quinnipiac University), 5.00%, 7/1/28 | 5,270,000 |
| 6,422,022 |
|
| Connecticut State Health & Educational Facility Authority Rev., (Yale University), VRDN, 0.875%, 2/8/18 | 17,900,000 |
| 17,889,081 |
|
| Connecticut State Health & Educational Facility Authority Rev., (Yale University), VRDN, 1.375%, 7/11/18 | 7,500,000 |
| 7,572,450 |
|
| New Haven GO, 5.00%, 8/1/23 (AGM) | 10,000,000 |
| 11,954,800 |
|
| State of Connecticut GO, VRDN, 1.08%, 6/2/16 | 4,000,000 |
| 4,000,960 |
|
| State of Connecticut, Special Tax Rev., 5.00%, 8/1/28 | 1,970,000 |
| 2,434,506 |
|
| | | 55,958,715 |
|
| District of Columbia — 1.2% | | |
| District of Columbia GO, 5.00%, 6/1/20 | 3,000,000 |
| 3,460,650 |
|
| District of Columbia GO, 5.00%, 6/1/22 | 5,000,000 |
| 6,060,800 |
|
| District of Columbia Rev., 5.00%, 12/1/16 | 1,200,000 |
| 1,227,060 |
|
| District of Columbia Rev., 5.00%, 12/1/17 | 5,000,000 |
| 5,321,400 |
|
| District of Columbia Rev., 5.00%, 12/1/19 | 5,000,000 |
| 5,694,850 |
|
District of Columbia Water & Sewer Authority Rev., 5.00%, 10/1/18, Prerefunded at 100% of Par (AGC)(2) | 1,200,000 |
| 1,316,412 |
|
| District of Columbia Water & Sewer Authority Rev., 5.00%, 10/1/28 | 4,710,000 |
| 5,882,460 |
|
|
| | | | | | |
| | Principal Amount | Value |
| Metropolitan Washington Airports Authority Dulles Toll Road Rev., 5.00%, 10/1/39 | $ | 5,000,000 |
| $ | 5,550,850 |
|
| Washington Metropolitan Area Transit Authority Rev., 5.00%, 7/1/17 | 4,600,000 |
| 4,807,460 |
|
| | | 39,321,942 |
|
| Florida — 6.6% | | |
| Broward County Airport System Rev., 5.00%, 10/1/24 | 2,650,000 |
| 3,158,853 |
|
| Broward County Airport System Rev., 5.00%, 10/1/25 | 1,000,000 |
| 1,184,300 |
|
| Broward County Airport System Rev., 5.00%, 10/1/26 | 1,000,000 |
| 1,176,460 |
|
| Central Florida Expressway Authority Rev., 5.00%, 7/1/40 | 3,000,000 |
| 3,385,140 |
|
| Citizens Property Insurance Corp. Rev., 5.00%, 6/1/16 | 3,000,000 |
| 3,000,000 |
|
| Citizens Property Insurance Corp. Rev., 5.50%, 6/1/16 (AGC) | 9,450,000 |
| 9,450,000 |
|
| Citizens Property Insurance Corp. Rev., 6.00%, 6/1/17 | 2,500,000 |
| 2,629,225 |
|
| Citizens Property Insurance Corp. Rev., 5.00%, 6/1/18 | 4,440,000 |
| 4,794,312 |
|
| Citizens Property Insurance Corp. Rev., 5.00%, 6/1/20 | 6,050,000 |
| 6,924,830 |
|
| Escambia County Rev., (Gulf Power Co.), VRDN, 2.10%, 4/11/19 | 1,500,000 |
| 1,535,010 |
|
| Florida Higher Educational Facilities Financial Authority Rev., (Nova Southeastern University, Inc.), 5.00%, 4/1/29 | 1,000,000 |
| 1,215,760 |
|
| Florida Higher Educational Facilities Financial Authority Rev., (Nova Southeastern University, Inc.), 5.00%, 4/1/30 | 750,000 |
| 907,088 |
|
| Florida Higher Educational Facilities Financial Authority Rev., (Nova Southeastern University, Inc.), 5.00%, 4/1/31 | 1,250,000 |
| 1,505,175 |
|
Florida Municipal Power Agency Rev., 5.25%, 10/1/19, Prerefunded at 100% of Par(2) | 2,000,000 |
| 2,271,580 |
|
| Florida's Turnpike Enterprise Rev., 5.00%, 7/1/27 | 7,780,000 |
| 9,735,425 |
|
| Halifax Hospital Medical Center Rev., (Halifax Hospital Medical Center Obligated Group), 5.25%, 6/1/18 | 165,000 |
| 165,000 |
|
Halifax Hospital Medical Center Rev., (Halifax Hospital Medical Center Obligated Group), 5.375%, 6/1/18, Prerefunded at 100% of Par (AGM)(2) | 2,000,000 |
| 2,177,000 |
|
Halifax Hospital Medical Center Rev., (Halifax Hospital Medical Center Obligated Group), 5.50%, 6/1/18, Prerefunded at 100% of Par (AGM)(2) | 1,000,000 |
| 1,090,970 |
|
| Halifax Hospital Medical Center Rev., (Halifax Hospital Medical Center Obligated Group), 5.00%, 6/1/30 | 1,750,000 |
| 2,116,888 |
|
| Halifax Hospital Medical Center Rev., (Halifax Hospital Medical Center Obligated Group), 3.375%, 6/1/31 | 1,500,000 |
| 1,501,905 |
|
| JEA Electric System Rev., 5.00%, 10/1/17 | 1,810,000 |
| 1,913,966 |
|
| JEA Electric System Rev., 5.00%, 10/1/21 | 3,115,000 |
| 3,714,887 |
|
| JEA Electric System Rev., 5.00%, 10/1/22 | 1,750,000 |
| 2,133,775 |
|
| JEA Electric System Rev., 5.00%, 10/1/23 | 1,500,000 |
| 1,832,775 |
|
| Lee County School Board COP, 5.00%, 8/1/17 | 3,170,000 |
| 3,327,993 |
|
| Lee County Transportation Facilities Rev., 5.00%, 10/1/26 (AGM) | 2,250,000 |
| 2,753,122 |
|
| Lee County Transportation Facilities Rev., 5.00%, 10/1/27 (AGM) | 2,550,000 |
| 3,102,789 |
|
Miami-Dade County Aviation Rev., 5.25%, 10/1/17, Prerefunded at 100% of Par (AGM)(2) | 4,650,000 |
| 4,932,813 |
|
| Miami-Dade County Aviation Rev., 5.00%, 10/1/37 | 2,450,000 |
| 2,904,058 |
|
| Miami-Dade County Aviation Rev., 5.00%, 10/1/41 | 3,000,000 |
| 3,356,820 |
|
| Miami-Dade County Expressway Authority Rev., 5.00%, 7/1/26 | 2,000,000 |
| 2,439,120 |
|
| Miami-Dade County Expressway Authority Rev., 5.00%, 7/1/27 | 1,500,000 |
| 1,818,120 |
|
| Miami-Dade County Expressway Authority Rev., 5.00%, 7/1/29 | 800,000 |
| 955,240 |
|
| Miami-Dade County Expressway Authority Rev., 5.00%, 7/1/30 | 1,560,000 |
| 1,855,121 |
|
| Miami-Dade County Expressway Authority Rev., 5.00%, 7/1/30 | 1,835,000 |
| 2,197,779 |
|
|
| | | | | | |
| | Principal Amount | Value |
| Miami-Dade County Expressway Authority Rev., 5.00%, 7/1/31 | $ | 1,000,000 |
| $ | 1,185,140 |
|
| Miami-Dade County Expressway Authority Rev., 5.00%, 7/1/31 | 1,300,000 |
| 1,551,199 |
|
| Miami-Dade County Water & Sewer System Rev., 5.00%, 10/1/42 | 9,335,000 |
| 10,842,136 |
|
| Orange County Health Facilities Authority Rev., (Orlando Health Obligated Group), 3.00%, 10/1/32 | 250,000 |
| 252,548 |
|
| Orange County School Board COP, 5.00%, 8/1/26 | 8,000,000 |
| 9,522,480 |
|
| Orange County School Board COP, 5.00%, 8/1/27 | 6,500,000 |
| 7,725,120 |
|
Orlando Utilities Commission Rev., 6.75%, 10/1/17(2) | 335,000 |
| 350,926 |
|
| Orlando Utilities Commission Rev., 5.00%, 10/1/19 | 1,500,000 |
| 1,696,200 |
|
| Orlando Utilities Commission Rev., 5.00%, 10/1/20 | 5,000,000 |
| 5,811,350 |
|
| Orlando Utilities Commission Rev., 5.00%, 10/1/21 | 4,745,000 |
| 5,654,759 |
|
| Orlando Utilities Commission Rev., 5.00%, 10/1/22 | 1,750,000 |
| 2,132,287 |
|
| Orlando Utilities Commission Rev., 5.00%, 10/1/33 | 2,000,000 |
| 2,219,520 |
|
| Palm Beach County Health Facilities Authority Rev., (Bethesda Healthcare System Obligated Group), 5.25%, 7/1/40 (AGM) | 5,850,000 |
| 6,533,338 |
|
| School District of Broward County COP, 5.00%, 7/1/26 | 11,800,000 |
| 13,821,812 |
|
| South Florida Water Management District COP, 5.00%, 10/1/28 | 3,000,000 |
| 3,745,050 |
|
| South Florida Water Management District COP, 5.00%, 10/1/30 | 3,305,000 |
| 4,093,606 |
|
| South Lake County Hospital District Rev., (Southlake Hospital, Inc.), 6.25%, 4/1/39 | 3,250,000 |
| 3,665,447 |
|
| State of Florida GO, 5.00%, 6/1/22 | 10,000,000 |
| 12,128,000 |
|
| State of Florida GO, 5.00%, 7/1/24 | 10,000,000 |
| 12,607,300 |
|
Sunrise Utility System Rev., 5.20%, 10/1/20, Prerefunded at 100% of Par (Ambac)(2) | 430,000 |
| 491,387 |
|
| Sunrise Utility System Rev., 5.20%, 10/1/22 (Ambac) | 570,000 |
| 623,232 |
|
| Tallahassee Rev., (Tallahassee Memorial HealthCare, Inc.), 5.00%, 12/1/36 | 800,000 |
| 932,488 |
|
| Tallahassee Rev., (Tallahassee Memorial HealthCare, Inc.), 5.00%, 12/1/41 | 1,000,000 |
| 1,149,550 |
|
| Tampa Rev., 6.00%, 10/1/18 (Ambac) | 145,000 |
| 151,044 |
|
| Tampa Rev., (BayCare Obligated Group), 4.00%, 11/15/46 | 3,500,000 |
| 3,726,100 |
|
Tampa Bay Water Rev., 5.00%, 10/1/16(2) | 1,865,000 |
| 1,892,490 |
|
Tampa Bay Water Rev., 5.00%, 10/1/16(2) | 1,730,000 |
| 1,755,500 |
|
| Tampa Bay Water Rev., 5.00%, 10/1/16 | 5,000 |
| 5,075 |
|
Tampa Bay Water Rev., 5.00%, 10/1/17(2) | 1,555,000 |
| 1,643,775 |
|
Tampa Bay Water Rev., 5.00%, 10/1/17(2) | 1,440,000 |
| 1,522,210 |
|
| Tampa Bay Water Rev., 5.00%, 10/1/17 | 5,000 |
| 5,284 |
|
| Tampa Water & Wastewater System Rev., 6.00%, 10/1/17 (AGM) | 1,000,000 |
| 1,070,410 |
|
| | | 219,670,062 |
|
| Georgia — 1.1% | | |
Athens-Clarke County Unified Government Water & Sewerage Rev., 5.625%, 1/1/19, Prerefunded at 100% of Par(2) | 1,200,000 |
| 1,345,272 |
|
| Atlanta Tax Allocation, 5.00%, 1/1/23 | 300,000 |
| 358,932 |
|
| Atlanta Tax Allocation, 5.00%, 1/1/24 | 300,000 |
| 364,914 |
|
| Atlanta Tax Allocation, 5.00%, 1/1/25 | 225,000 |
| 277,792 |
|
| Atlanta Tax Allocation, 5.00%, 1/1/26 | 300,000 |
| 372,804 |
|
| Atlanta Tax Allocation, 5.00%, 1/1/27 | 300,000 |
| 369,594 |
|
| Atlanta Water & Wastewater Rev., 5.00%, 11/1/27 | 2,000,000 |
| 2,495,140 |
|
| Georgia State Road & Tollway Authority Rev., 5.00%, 6/1/16 | 6,350,000 |
| 6,350,000 |
|
| Georgia State Road & Tollway Authority Rev., 5.00%, 6/1/21 | 4,000,000 |
| 4,463,760 |
|
|
| | | | | | |
| | Principal Amount | Value |
| Marietta Development Authority Rev., (Life University, Inc.), 6.25%, 6/15/20 | $ | 495,000 |
| $ | 520,359 |
|
| Municipal Electric Authority of Georgia Rev., 5.50%, 1/1/26 | 4,800,000 |
| 5,252,064 |
|
| Private Colleges & Universities Authority Rev., (Emory University), 5.00%, 9/1/35 | 1,000,000 |
| 1,120,630 |
|
| Private Colleges & Universities Authority Rev., (Savannah College of Art & Design, Inc.), 5.00%, 4/1/44 | 1,300,000 |
| 1,489,046 |
|
| State of Georgia GO, 5.00%, 7/1/16 | 10,000,000 |
| 10,038,000 |
|
| State of Georgia GO, 5.00%, 11/1/16 | 2,000,000 |
| 2,037,660 |
|
| | | 36,855,967 |
|
| Guam — 0.5% | | |
| Guam Government GO, 6.00%, 11/15/19 | 4,115,000 |
| 4,561,519 |
|
| Guam Government Rev., 5.00%, 1/1/27 | 3,185,000 |
| 3,633,129 |
|
| Guam Government Rev., 5.25%, 1/1/36 | 2,000,000 |
| 2,267,080 |
|
| Guam Government Department of Education COP, 6.875%, 12/1/40 | 1,500,000 |
| 1,655,490 |
|
| Guam Government Power Authority Rev., 5.00%, 10/1/26 (AGM) | 2,000,000 |
| 2,388,360 |
|
| Guam Government Power Authority Rev., 5.00%, 10/1/27 (AGM) | 1,000,000 |
| 1,184,620 |
|
| | | 15,690,198 |
|
| Hawaii — 1.0% | | |
| City & County Honolulu Wastewater System Rev., 5.00%, 7/1/23 | 905,000 |
| 1,092,299 |
|
| City & County of Honolulu GO, 5.00%, 10/1/25 | 3,000,000 |
| 3,850,260 |
|
| City & County of Honolulu GO, 5.00%, 10/1/25 | 3,000,000 |
| 3,850,260 |
|
| Hawai'i Pacific Health Rev., (Hawai'i Pacific Health Obligated Group), 5.50%, 7/1/40 | 2,500,000 |
| 2,806,400 |
|
| Hawai'i Pacific Health Rev., (Hawai'i Pacific Health Obligated Group), 5.75%, 7/1/40 | 800,000 |
| 908,136 |
|
| State of Hawaii GO, 5.00%, 8/1/23 | 6,000,000 |
| 7,432,920 |
|
| State of Hawaii GO, 5.00%, 12/1/23 | 10,000,000 |
| 11,923,200 |
|
| | | 31,863,475 |
|
| Idaho — 0.1% | | |
| Idaho Health Facilities Authority Rev., (St. Luke's Health System Obligated Group), 5.00%, 7/1/35 (AGM) | 250,000 |
| 277,088 |
|
| Idaho Housing & Finance Association Rev., 5.00%, 7/15/29 | 3,000,000 |
| 3,453,180 |
|
| | | 3,730,268 |
|
| Illinois — 5.0% | | |
| Chicago Midway International Airport Rev., 5.00%, 1/1/19 | 800,000 |
| 881,832 |
|
| Chicago Midway International Airport Rev., 5.00%, 1/1/21 | 800,000 |
| 932,448 |
|
| Chicago Midway International Airport Rev., 5.00%, 1/1/22 | 600,000 |
| 714,546 |
|
| Chicago O'Hare International Airport Rev., 4.00%, 1/1/17 (AGM) | 600,000 |
| 611,394 |
|
| Chicago O'Hare International Airport Rev., 5.25%, 1/1/18 (NATL) | 5,000,000 |
| 5,339,500 |
|
| Chicago O'Hare International Airport Rev., 5.00%, 1/1/22 | 1,000,000 |
| 1,154,450 |
|
| Chicago O'Hare International Airport Rev., 5.00%, 1/1/23 | 1,455,000 |
| 1,758,877 |
|
| Chicago O'Hare International Airport Rev., 5.00%, 1/1/24 | 3,940,000 |
| 4,826,815 |
|
| Chicago O'Hare International Airport Rev., 5.00%, 1/1/29 | 9,000,000 |
| 10,875,060 |
|
| Chicago O'Hare International Airport Rev., 5.75%, 1/1/39 | 2,000,000 |
| 2,333,560 |
|
| Chicago Wastewater Transmission Rev., 5.00%, 1/1/29 | 1,100,000 |
| 1,251,393 |
|
| Chicago Wastewater Transmission Rev., 5.00%, 1/1/31 | 1,000,000 |
| 1,125,340 |
|
| Chicago Wastewater Transmission Rev., 5.00%, 1/1/32 | 1,000,000 |
| 1,123,190 |
|
| Chicago Wastewater Transmission Rev., 5.00%, 1/1/34 | 725,000 |
| 819,924 |
|
|
| | | | | | |
| | Principal Amount | Value |
| Chicago Wastewater Transmission Rev., 5.00%, 1/1/35 | $ | 725,000 |
| $ | 817,612 |
|
| Chicago Wastewater Transmission Rev., 5.00%, 1/1/39 | 2,200,000 |
| 2,441,252 |
|
| Chicago Wastewater Transmission Rev., 5.00%, 1/1/39 | 1,405,000 |
| 1,576,649 |
|
| Chicago Waterworks Rev., 5.00%, 11/1/23 | 3,750,000 |
| 4,428,225 |
|
| Chicago Waterworks Rev., 5.00%, 11/1/24 | 5,000,000 |
| 5,970,500 |
|
| Chicago Waterworks Rev., 5.00%, 11/1/25 | 5,000,000 |
| 6,022,650 |
|
| Chicago Waterworks Rev., 5.00%, 11/1/26 | 2,000,000 |
| 2,414,860 |
|
| Chicago Waterworks Rev., 5.00%, 11/1/27 | 2,250,000 |
| 2,696,737 |
|
| Chicago Waterworks Rev., 5.00%, 11/1/39 | 2,520,000 |
| 2,846,365 |
|
| Illinois Finance Authority Rev., (Advocate Health Care Network Obligated Group), 5.00%, 5/1/22 | 1,500,000 |
| 1,802,160 |
|
| Illinois Finance Authority Rev., (Carle Foundation Obligated Group), 6.00%, 8/15/41 | 2,000,000 |
| 2,381,560 |
|
| Illinois Finance Authority Rev., (CDH-Delnor Health System), 5.00%, 11/1/27 | 3,475,000 |
| 3,879,976 |
|
| Illinois Finance Authority Rev., (Mercy Health Corp. Obligated Group), 5.00%, 12/1/24 | 2,000,000 |
| 2,449,620 |
|
| Illinois Finance Authority Rev., (Mercy Health Corp. Obligated Group), 5.00%, 12/1/26 | 2,715,000 |
| 3,339,694 |
|
| Illinois Finance Authority Rev., (Mercy Health Corp. Obligated Group), 4.00%, 12/1/30 | 5,000,000 |
| 5,404,500 |
|
| Illinois Finance Authority Rev., (Rush University Medical Center Obligated Group), 5.00%, 11/15/29 | 5,000,000 |
| 6,017,400 |
|
| Illinois Finance Authority Rev., (Rush University Medical Center Obligated Group), 5.00%, 11/15/29 | 5,475,000 |
| 6,589,053 |
|
| Illinois Finance Authority Rev., (University of Chicago), VRDN, 1.10%, 2/15/18 | 3,875,000 |
| 3,882,789 |
|
| Illinois State Toll Highway Authority Rev., 5.00%, 1/1/25 | 5,000,000 |
| 5,608,250 |
|
| Illinois State Toll Highway Authority Rev., 5.00%, 1/1/36 | 15,000,000 |
| 17,639,700 |
|
| Illinois State Toll Highway Authority Rev., 5.00%, 1/1/39 | 2,450,000 |
| 2,848,615 |
|
| Railsplitter Tobacco Settlement Authority Rev., 5.00%, 6/1/17 | 6,000,000 |
| 6,242,520 |
|
| Railsplitter Tobacco Settlement Authority Rev., 5.25%, 6/1/21 | 10,000,000 |
| 11,703,500 |
|
| Regional Transportation Authority Rev., 7.20%, 11/1/20 (Ambac) | 550,000 |
| 627,204 |
|
| Springfield Electric Rev., 5.00%, 3/1/20 | 1,000,000 |
| 1,130,930 |
|
| Springfield Electric Rev., 5.00%, 3/1/21 | 1,000,000 |
| 1,156,390 |
|
| Springfield Electric Rev., 5.00%, 3/1/22 | 1,750,000 |
| 2,066,313 |
|
| Springfield Electric Rev., 5.00%, 3/1/23 | 1,245,000 |
| 1,496,440 |
|
| Springfield Electric Rev., 5.00%, 3/1/24 | 1,750,000 |
| 2,128,893 |
|
| State of Illinois GO, 5.50%, 7/1/38 | 4,900,000 |
| 5,416,117 |
|
| State of Illinois GO, 5.00%, 2/1/39 | 3,000,000 |
| 3,192,150 |
|
| State of Illinois GO, 5.00%, 5/1/39 | 5,880,000 |
| 6,267,198 |
|
| | | 166,234,151 |
|
| Indiana — 1.7% | | |
| Hamilton Southeastern Consolidated School Building Corp. Rev., 4.25%, 7/15/20 (AGM) | 1,000,000 |
| 1,020,830 |
|
| Indiana Bond Bank Rev., 5.00%, 8/1/17 (AGM) | 1,520,000 |
| 1,532,023 |
|
| Indiana Bond Bank Rev., 5.00%, 8/1/18 (AGM) | 1,600,000 |
| 1,612,640 |
|
| Indiana Bond Bank Rev., 5.00%, 8/1/19 (AGM) | 1,680,000 |
| 1,693,272 |
|
| Indiana Finance Authority Rev., 5.00%, 11/1/16 | 5,000,000 |
| 5,090,100 |
|
| Indiana Finance Authority Rev., 5.00%, 2/1/23 | 1,735,000 |
| 2,104,416 |
|
| Indiana Finance Authority Rev., 5.00%, 2/1/24 | 2,200,000 |
| 2,698,872 |
|
|
| | | | | | |
| | Principal Amount | Value |
| Indiana Finance Authority Rev., 5.00%, 2/1/26 | $ | 3,030,000 |
| $ | 3,793,742 |
|
| Indiana Finance Authority Rev., 5.00%, 2/1/27 | 1,120,000 |
| 1,390,032 |
|
| Indiana Finance Authority Rev., 5.25%, 2/1/27 | 2,000,000 |
| 2,527,520 |
|
| Indiana Finance Authority Rev., 5.00%, 2/1/28 | 2,005,000 |
| 2,469,919 |
|
| Indiana Finance Authority Rev., 5.00%, 2/1/29 | 2,500,000 |
| 3,056,450 |
|
| Indiana Finance Authority Rev., (CWA Authority, Inc.), 5.25%, 10/1/23 | 2,645,000 |
| 3,158,262 |
|
| Indiana Finance Authority Rev., (CWA Authority, Inc.), 5.25%, 10/1/24 | 3,025,000 |
| 3,604,711 |
|
| Indiana Finance Authority Rev., (CWA Authority, Inc.), 5.25%, 10/1/25 | 1,650,000 |
| 1,959,919 |
|
| Indiana Finance Authority Rev., (Methodist Hospitals, Inc.), 5.00%, 9/15/16 | 1,055,000 |
| 1,066,985 |
|
| Indiana Finance Authority Rev., (Methodist Hospitals, Inc.), 5.00%, 9/15/20 | 1,000,000 |
| 1,129,650 |
|
| Indiana Finance Authority Rev., (Methodist Hospitals, Inc.), 5.00%, 9/15/22 | 1,300,000 |
| 1,520,857 |
|
| Indiana Finance Authority Rev., (Methodist Hospitals, Inc.), 5.00%, 9/15/24 | 1,000,000 |
| 1,196,700 |
|
| Indiana Finance Authority Rev., (Methodist Hospitals, Inc.), 5.00%, 9/15/25 | 1,150,000 |
| 1,361,681 |
|
| Indiana Finance Authority Rev., (Methodist Hospitals, Inc.), 5.00%, 9/15/27 | 1,250,000 |
| 1,457,113 |
|
| Indiana Finance Authority Rev., (Methodist Hospitals, Inc.), 5.00%, 9/15/29 | 1,465,000 |
| 1,695,430 |
|
| Indiana Finance Authority Rev., (Methodist Hospitals, Inc.), 5.00%, 9/15/31 | 1,250,000 |
| 1,437,650 |
|
| Indiana University Rev., 5.00%, 8/1/16 | 1,000,000 |
| 1,007,550 |
|
| Indiana University Rev., 5.00%, 8/1/17 | 2,000,000 |
| 2,101,280 |
|
| Indiana University Rev., 5.00%, 8/1/19 | 4,200,000 |
| 4,731,174 |
|
| | | 56,418,778 |
|
| Iowa — 0.1% | | |
| Iowa Finance Authority Rev., (Care Initiatives), 5.25%, 7/1/16 | 1,690,000 |
| 1,695,121 |
|
| State of Iowa Rev., 5.00%, 6/1/22 | 2,500,000 |
| 2,797,725 |
|
| | | 4,492,846 |
|
| Kansas — 0.1% | | |
| State of Kansas Department of Transportation Rev., 5.00%, 9/1/16 | 4,500,000 |
| 4,551,165 |
|
| Kentucky — 1.1% | | |
| Kentucky Asset Liability Commission Rev., 5.00%, 9/1/20 | 4,000,000 |
| 4,581,320 |
|
| Kentucky Economic Development Finance Authority Rev., (Baptist Healthcare System Obligated Group), 5.375%, 8/15/24 | 3,000,000 |
| 3,251,460 |
|
| Kentucky Economic Development Finance Authority Rev., (Baptist Healthcare System Obligated Group), 5.625%, 8/15/27 | 1,250,000 |
| 1,359,538 |
|
| Kentucky Public Transportation Infrastructure Authority Rev., 5.00%, 7/1/17 | 8,850,000 |
| 9,204,973 |
|
| Kentucky State Property & Building Commission Rev., 5.25%, 10/1/16 (AGM) | 4,600,000 |
| 4,671,944 |
|
| Kentucky Turnpike Authority Rev., 5.00%, 7/1/19 | 1,000,000 |
| 1,114,680 |
|
| Kentucky Turnpike Authority Rev., 5.00%, 7/1/20 | 1,500,000 |
| 1,716,135 |
|
Paducah Electric Plant Board Rev., 5.00%, 10/1/24 (AGM)(1) | 1,500,000 |
| 1,805,010 |
|
Paducah Electric Plant Board Rev., 5.00%, 10/1/25 (AGM)(1) | 1,500,000 |
| 1,817,910 |
|
Paducah Electric Plant Board Rev., 5.00%, 10/1/26 (AGM)(1) | 1,100,000 |
| 1,338,546 |
|
Paducah Electric Plant Board Rev., 5.00%, 10/1/27 (AGM)(1) | 2,000,000 |
| 2,397,260 |
|
|
| | | | | | |
| | Principal Amount | Value |
Paducah Electric Plant Board Rev., 5.00%, 10/1/28 (AGM)(1) | $ | 2,245,000 |
| $ | 2,673,211 |
|
| | | 35,931,987 |
|
| Louisiana — 1.3% | | |
| Louisiana Public Facilities Authority Rev., (Black & Gold Facilities, Inc.), 5.00%, 7/1/22 (AGC) | 1,465,000 |
| 1,523,761 |
|
| Louisiana Public Facilities Authority Rev., (Entergy Louisiana LLC), 3.375%, 9/1/28 | 10,000,000 |
| 10,305,000 |
|
| Louisiana Public Facilities Authority Rev., (Lafayette General Health System, Inc. Obligated Group), 5.00%, 11/1/41 | 6,000,000 |
| 6,890,340 |
|
| Louisiana Public Facilities Authority Rev., (Ochsner Clinic Foundation), 5.00%, 5/15/29 | 1,000,000 |
| 1,217,640 |
|
| Louisiana Public Facilities Authority Rev., (Ochsner Clinic Foundation), 5.00%, 5/15/30 | 1,000,000 |
| 1,212,730 |
|
| Louisiana Public Facilities Authority Rev., (Ochsner Clinic Foundation), 3.00%, 5/15/31 | 1,500,000 |
| 1,500,630 |
|
| New Orleans GO, 5.00%, 12/1/20 | 4,000,000 |
| 4,605,400 |
|
| New Orleans GO, 5.00%, 12/1/21 | 6,000,000 |
| 7,022,220 |
|
| New Orleans Sewerage Service Rev., 4.00%, 6/1/16 | 500,000 |
| 500,000 |
|
| New Orleans Sewerage Service Rev., 5.00%, 6/1/17 | 750,000 |
| 780,862 |
|
| New Orleans Sewerage Service Rev., 5.00%, 6/1/18 | 500,000 |
| 539,055 |
|
| New Orleans Sewerage Service Rev., 5.00%, 6/1/19 | 350,000 |
| 389,113 |
|
| New Orleans Sewerage Service Rev., 5.00%, 6/1/21 | 400,000 |
| 466,880 |
|
| New Orleans Sewerage Service Rev., 5.00%, 6/1/23 | 250,000 |
| 300,290 |
|
| New Orleans Sewerage Service Rev., 5.00%, 6/1/24 | 200,000 |
| 243,014 |
|
| New Orleans Sewerage Service Rev., 5.00%, 6/1/40 | 1,735,000 |
| 2,003,960 |
|
| New Orleans Sewerage Service Rev., 5.00%, 6/1/45 | 1,595,000 |
| 1,836,834 |
|
| Regional Transit Authority Rev., 5.00%, 12/1/17 (AGM) | 1,000,000 |
| 1,059,740 |
|
| Regional Transit Authority Rev., 5.00%, 12/1/19 (AGM) | 1,000,000 |
| 1,127,660 |
|
| Regional Transit Authority Rev., 5.00%, 12/1/20 (AGM) | 1,250,000 |
| 1,442,725 |
|
| | | 44,967,854 |
|
| Maine — 0.1% | | |
| Portland General Airport Rev., 5.00%, 1/1/40 (AGM) | 1,795,000 |
| 1,951,721 |
|
| Maryland — 0.5% | | |
| Maryland Economic Development Corp. Rev., 4.00%, 7/1/24 (AGM) | 300,000 |
| 343,611 |
|
| Maryland Economic Development Corp. Rev., 4.00%, 7/1/25 (AGM) | 330,000 |
| 379,107 |
|
| Maryland Economic Development Corp. Rev., 4.00%, 7/1/26 (AGM) | 375,000 |
| 430,447 |
|
| Maryland Economic Development Corp. Rev., 5.00%, 6/1/35 (AGM) | 1,230,000 |
| 1,483,663 |
|
| Maryland Economic Development Corp. Rev., 5.00%, 6/1/43 (AGM) | 1,000,000 |
| 1,181,160 |
|
| Maryland Economic Development Corp. Rev., (Ports America Chesapeake LLC), 5.75%, 6/1/35 | 1,000,000 |
| 1,096,680 |
|
| Maryland Health & Higher Educational Facilities Authority Rev., (Johns Hopkins University), 5.25%, 7/1/38 | 1,645,000 |
| 1,781,667 |
|
| Maryland Health & Higher Educational Facilities Authority Rev., (Mercy Medical Center Obligated Group), 4.00%, 7/1/42 | 4,700,000 |
| 4,961,555 |
|
| State of Maryland GO, 5.25%, 8/15/18 | 4,000,000 |
| 4,391,600 |
|
| | | 16,049,490 |
|
| Massachusetts — 2.6% | | |
| Massachusetts GO, 5.00%, 8/1/24 | 10,000,000 |
| 11,921,600 |
|
| Massachusetts GO, 5.00%, 4/1/28 | 10,000,000 |
| 11,694,500 |
|
Massachusetts Bay Transportation Authority Rev., 5.25%, 7/1/18, Prerefunded at 100% of Par(2) | 955,000 |
| 1,042,726 |
|
|
| | | | | | |
| | Principal Amount | Value |
| Massachusetts Bay Transportation Authority Rev., 5.25%, 7/1/34 | $ | 2,345,000 |
| $ | 2,551,501 |
|
| Massachusetts Department of Transportation Rev., 5.00%, 1/1/23 | 1,000,000 |
| 1,135,140 |
|
| Massachusetts Department of Transportation Rev., 5.00%, 1/1/24 | 6,000,000 |
| 6,804,060 |
|
| Massachusetts Development Finance Agency Rev., (Bentley University), 5.00%, 7/1/40 | 2,100,000 |
| 2,513,574 |
|
| Massachusetts Development Finance Agency Rev., (South Shore Hospital, Inc.), 5.00%, 7/1/25 | 250,000 |
| 308,043 |
|
| Massachusetts Development Finance Agency Rev., (South Shore Hospital, Inc.), 5.00%, 7/1/26 | 1,000,000 |
| 1,239,220 |
|
| Massachusetts Development Finance Agency Rev., (South Shore Hospital, Inc.), 5.00%, 7/1/27 | 1,100,000 |
| 1,350,360 |
|
| Massachusetts Development Finance Agency Rev., (UMass Memorial Health Care Obligated Group), 4.00%, 7/1/41 | 1,430,000 |
| 1,482,267 |
|
| Massachusetts Development Finance Agency Rev., (UMass Memorial Health Care Obligated Group), 5.00%, 7/1/41 | 1,850,000 |
| 2,158,450 |
|
| Massachusetts Health & Educational Facilities Authority Rev., (Foundation of Massachusetts Eye & Ear Obligated Group), 5.375%, 7/1/35 | 2,000,000 |
| 2,241,240 |
|
| Massachusetts Health & Educational Facilities Authority Rev., (President and Fellows of Harvard College), 5.50%, 11/15/36 | 6,800,000 |
| 7,598,116 |
|
| Massachusetts Health & Educational Facilities Authority Rev., (UMass Memorial Health Care Obligated Group), 5.00%, 7/1/20 | 1,500,000 |
| 1,711,335 |
|
| Massachusetts Health & Educational Facilities Authority Rev., (UMass Memorial Health Care Obligated Group), 5.00%, 7/1/21 | 1,050,000 |
| 1,193,010 |
|
| Massachusetts Port Authority Rev., 4.00%, 7/1/18 | 1,305,000 |
| 1,390,543 |
|
| Massachusetts Port Authority Rev., 5.00%, 7/1/19 | 250,000 |
| 280,530 |
|
| Massachusetts Port Authority Rev., 4.00%, 7/1/22 | 2,655,000 |
| 3,046,214 |
|
| Massachusetts School Building Authority Rev., 5.00%, 8/15/30 | 7,750,000 |
| 9,369,517 |
|
| Massachusetts School Building Authority Rev., 5.00%, 8/15/30 | 3,575,000 |
| 4,310,306 |
|
| Massachusetts School Building Authority Rev., 5.00%, 10/15/32 | 6,630,000 |
| 7,773,542 |
|
| Massachusetts Transportation Fund Rev., 5.00%, 6/1/28 | 1,000,000 |
| 1,174,590 |
|
| Massachusetts Transportation Fund Rev., 5.00%, 6/1/29 | 1,755,000 |
| 2,046,295 |
|
| | | 86,336,679 |
|
| Michigan — 3.3% | | |
| Detroit City School District GO, 5.00%, 5/1/28 (Q-SBLF) | 6,500,000 |
| 7,399,990 |
|
| Detroit City School District GO, 5.00%, 5/1/31 (Q-SBLF) | 4,750,000 |
| 5,368,545 |
|
| Detroit Sewage Disposal System Rev., 5.25%, 7/1/39 | 19,825,000 |
| 22,171,090 |
|
| Detroit Water Supply System Rev., 5.00%, 7/1/17 | 1,300,000 |
| 1,356,316 |
|
| Detroit Water Supply System Rev., 5.00%, 7/1/36 | 1,000,000 |
| 1,096,090 |
|
| Lansing Board of Water & Light Rev., 5.00%, 7/1/27 | 5,000,000 |
| 5,856,100 |
|
| Lincoln Consolidated School District GO, 5.00%, 5/1/21 (AGM Q-SBLF) | 1,000,000 |
| 1,156,550 |
|
| Lincoln Consolidated School District GO, 5.00%, 5/1/22 (AGM Q-SBLF) | 500,000 |
| 587,990 |
|
| Lincoln Consolidated School District GO, 5.00%, 5/1/23 (AGM Q-SBLF) | 1,000,000 |
| 1,193,360 |
|
| Lincoln Consolidated School District GO, 5.00%, 5/1/24 (AGM Q-SBLF) | 1,000,000 |
| 1,209,140 |
|
| Lincoln Consolidated School District GO, 5.00%, 5/1/25 (AGM Q-SBLF) | 1,000,000 |
| 1,220,460 |
|
| Lincoln Consolidated School District GO, 5.00%, 5/1/33 (AGM Q-SBLF) | 1,480,000 |
| 1,747,554 |
|
| Lincoln Consolidated School District GO, 5.00%, 5/1/34 (AGM Q-SBLF) | 1,630,000 |
| 1,918,510 |
|
|
| | | | | | |
| | Principal Amount | Value |
| Michigan Finance Authority Rev., 5.00%, 10/1/27 | $ | 3,030,000 |
| $ | 3,611,639 |
|
| Michigan Finance Authority Rev., 5.00%, 10/1/28 | 3,465,000 |
| 4,102,872 |
|
| Michigan Finance Authority Rev., 5.00%, 7/1/33 | 2,000,000 |
| 2,306,900 |
|
| Michigan Finance Authority Rev., 5.00%, 7/1/34 | 1,500,000 |
| 1,724,325 |
|
| Michigan Finance Authority Rev., (Ascension Health Credit Group), VRDN, 1.10%, 8/15/19 | 3,000,000 |
| 2,992,200 |
|
| Michigan Finance Authority Rev., (Beaumont Health Obligated Group), 4.00%, 11/1/46 | 5,000,000 |
| 5,304,100 |
|
| Michigan Finance Authority Rev., (MidMichigan Obligated Group), 5.00%, 6/1/25 | 1,000,000 |
| 1,216,310 |
|
| Michigan Finance Authority Rev., (MidMichigan Obligated Group), 5.00%, 6/1/27 | 1,400,000 |
| 1,677,522 |
|
| Michigan Finance Authority Rev., (MidMichigan Obligated Group), 5.00%, 6/1/28 | 1,250,000 |
| 1,490,388 |
|
| Michigan Finance Authority Rev., (MidMichigan Obligated Group), 5.00%, 6/1/29 | 1,565,000 |
| 1,860,722 |
|
| Michigan Finance Authority Rev., (Trinity Health Corp.), 5.00%, 12/1/45 | 5,000,000 |
| 5,905,800 |
|
| Michigan State Building Authority Rev., 5.25%, 10/15/20 | 4,000,000 |
| 4,530,200 |
|
| Michigan State Hospital Finance Authority Rev., (McLaren Health Care Corp.), 5.00%, 6/1/16 | 1,360,000 |
| 1,360,000 |
|
| Michigan State Hospital Finance Authority Rev., (McLaren Health Care Corp.), 5.00%, 6/1/17 | 1,600,000 |
| 1,668,224 |
|
| Michigan State Hospital Finance Authority Rev., VRDN, 1.625%, 11/1/19 | 7,495,000 |
| 7,549,938 |
|
| Wayne County Airport Authority Rev., 5.00%, 12/1/18 (NATL) | 3,000,000 |
| 3,187,620 |
|
| Wayne County Airport Authority Rev., 5.00%, 12/1/19 (NATL) | 2,000,000 |
| 2,124,020 |
|
| Wayne County Airport Authority Rev., 5.00%, 12/1/30 | 1,000,000 |
| 1,177,110 |
|
| Wayne County Airport Authority Rev., 5.00%, 12/1/31 | 650,000 |
| 762,873 |
|
| Wayne County Airport Authority Rev., 5.00%, 12/1/32 | 1,175,000 |
| 1,376,113 |
|
| Wayne County Airport Authority Rev., 5.00%, 12/1/34 | 1,150,000 |
| 1,338,313 |
|
| | | 109,548,884 |
|
| Minnesota — 0.5% | | |
| Minnesota Higher Education Facilities Authority Rev., (College of St. Benedict), 4.00%, 3/1/43 | 1,000,000 |
| 1,060,480 |
|
| Rochester Rev., (Mayo Clinic), VRDN, 4.50%, 11/15/21 | 6,000,000 |
| 6,955,680 |
|
| St. Cloud Rev., (CentraCare Health System Obligated Group), 5.00%, 5/1/28 | 2,000,000 |
| 2,474,680 |
|
| St. Cloud Rev., (CentraCare Health System Obligated Group), 5.00%, 5/1/30 | 1,000,000 |
| 1,227,720 |
|
| State of Minnesota GO, 5.00%, 8/1/19 | 5,000,000 |
| 5,638,500 |
|
| | | 17,357,060 |
|
| Mississippi — 1.0% | | |
Gulfport Rev., (Memorial Hospital at Gulfport), 5.00%, 7/1/20(1) | 645,000 |
| 731,424 |
|
Gulfport Rev., (Memorial Hospital at Gulfport), 5.00%, 7/1/21(1) | 1,000,000 |
| 1,157,060 |
|
Gulfport Rev., (Memorial Hospital at Gulfport), 5.00%, 7/1/22(1) | 1,000,000 |
| 1,177,540 |
|
Gulfport Rev., (Memorial Hospital at Gulfport), 5.00%, 7/1/23(1) | 1,500,000 |
| 1,785,900 |
|
Gulfport Rev., (Memorial Hospital at Gulfport), 5.00%, 7/1/30(1) | 2,000,000 |
| 2,385,040 |
|
Gulfport Rev., (Memorial Hospital at Gulfport), 5.00%, 7/1/31(1) | 1,000,000 |
| 1,187,690 |
|
| Mississippi Development Bank Rev., 5.00%, 11/1/16 (Ambac) | 1,645,000 |
| 1,671,468 |
|
| Mississippi Development Bank Rev., 5.00%, 7/1/19 (Ambac) | 4,160,000 |
| 4,607,699 |
|
| Mississippi Development Bank Rev., 5.25%, 8/1/27 | 5,000,000 |
| 5,700,300 |
|
|
| | | | | | |
| | Principal Amount | Value |
| Mississippi Development Bank Rev., 6.875%, 12/1/40 (AGM) | $ | 4,150,000 |
| $ | 5,581,127 |
|
| State of Mississippi GO, 5.00%, 12/1/27 | 5,000,000 |
| 6,157,900 |
|
| | | 32,143,148 |
|
| Missouri — 0.3% | | |
| Health & Educational Facilities Authority of the State of Missouri Rev., (Kansas City Art Institute), VRDN, 0.38%, 6/1/16 (LOC: Commerce Bank) | 500,000 |
| 500,000 |
|
| Health & Educational Facilities Authority of the State of Missouri Rev., (Washington University in St. Louis), 5.375%, 3/15/39 | 2,000,000 |
| 2,149,820 |
|
| Missouri Highway & Transportation Commission Rev., 5.00%, 5/1/18 | 2,700,000 |
| 2,915,622 |
|
| Missouri State Environmental Improvement & Energy Resources Authority Rev., 5.00%, 1/1/22 | 335,000 |
| 403,745 |
|
| Missouri State Environmental Improvement & Energy Resources Authority Rev., 5.00%, 1/1/23 | 300,000 |
| 368,751 |
|
| Missouri State Environmental Improvement & Energy Resources Authority Rev., 5.00%, 7/1/23 | 400,000 |
| 496,788 |
|
| Missouri State Environmental Improvement & Energy Resources Authority Rev., 5.00%, 1/1/24 | 700,000 |
| 876,127 |
|
| Missouri State Environmental Improvement & Energy Resources Authority Rev., 5.00%, 1/1/25 | 1,000,000 |
| 1,270,740 |
|
| | | 8,981,593 |
|
| Nebraska — 0.3% | | |
| Central Plains Energy Project Rev., 5.00%, 9/1/22 | 2,500,000 |
| 2,916,125 |
|
| Douglas County Hospital Authority No. 3 Rev., (Nebraska Methodist Health Obligated Group), 5.00%, 11/1/45 | 3,900,000 |
| 4,489,017 |
|
Nebraska Public Power District Rev., 5.00%, 1/1/18, Prerefunded at 100% of Par(2) | 2,500,000 |
| 2,666,300 |
|
| | | 10,071,442 |
|
| Nevada — 0.7% | | |
| Las Vegas Valley Water District GO, 5.00%, 6/1/22 | 10,000,000 |
| 12,070,300 |
|
| State of Nevada GO, 5.00%, 3/1/22 | 4,800,000 |
| 5,773,056 |
|
| State of Nevada GO, 5.00%, 4/1/27 | 5,710,000 |
| 7,112,833 |
|
| | | 24,956,189 |
|
| New Jersey — 3.9% | | |
New Jersey Economic Development Authority Rev., 5.00%, 9/1/18, Prerefunded at 100% of Par(2) | 110,000 |
| 120,250 |
|
| New Jersey Economic Development Authority Rev., 5.25%, 12/15/20 (Ambac) | 5,000,000 |
| 5,549,100 |
|
| New Jersey Economic Development Authority Rev., 5.00%, 6/15/23 | 2,335,000 |
| 2,571,022 |
|
| New Jersey Economic Development Authority Rev., 5.00%, 6/15/24 | 4,015,000 |
| 4,442,396 |
|
| New Jersey Economic Development Authority Rev., 5.00%, 6/15/25 | 5,000,000 |
| 5,526,550 |
|
| New Jersey Economic Development Authority Rev., 5.00%, 6/15/26 | 5,000,000 |
| 5,504,500 |
|
| New Jersey Economic Development Authority Rev., 5.25%, 6/15/40 | 3,250,000 |
| 3,591,900 |
|
New Jersey Educational Facilities Authority Rev., (New Jersey City University), 5.00%, 7/1/25 (AGM)(1) | 2,360,000 |
| 2,928,831 |
|
New Jersey Educational Facilities Authority Rev., (New Jersey City University), 5.00%, 7/1/26 (AGM)(1) | 1,500,000 |
| 1,870,290 |
|
New Jersey Educational Facilities Authority Rev., (New Jersey City University), 5.00%, 7/1/27 (AGM)(1) | 1,500,000 |
| 1,848,195 |
|
| New Jersey Health Care Facilities Financing Authority Rev., (Hackensack University Medical Center), 5.00%, 1/1/34 | 1,050,000 |
| 1,157,814 |
|
| New Jersey Health Care Facilities Financing Authority Rev., (Princeton HealthCare System Obligated Group), 5.00%, 7/1/39 | 1,685,000 |
| 1,989,985 |
|
|
| | | | | | |
| | Principal Amount | Value |
| New Jersey Health Care Facilities Financing Authority Rev., (Robert Wood Johnson University Hospital, Inc.), 5.00%, 7/1/31 | $ | 1,725,000 |
| $ | 1,925,238 |
|
New Jersey Sports & Exposition Authority Rev., 5.00%, 9/1/18(2) | 75,000 |
| 81,935 |
|
| New Jersey Transportation Trust Fund Authority Rev., 5.25%, 12/15/21 (NATL) | 6,850,000 |
| 7,813,384 |
|
| New Jersey Transportation Trust Fund Authority Rev., 5.25%, 6/15/23 | 3,000,000 |
| 3,322,500 |
|
| New Jersey Transportation Trust Fund Authority Rev., 5.25%, 12/15/23 (Ambac) | 2,210,000 |
| 2,497,919 |
|
| New Jersey Transportation Trust Fund Authority Rev., 5.25%, 6/15/30 | 5,000,000 |
| 5,448,050 |
|
| New Jersey Transportation Trust Fund Authority Rev., 5.00%, 6/15/38 | 6,800,000 |
| 7,355,696 |
|
| New Jersey Transportation Trust Fund Authority Rev., 5.00%, 6/15/42 | 12,780,000 |
| 13,579,517 |
|
| New Jersey Transportation Trust Fund Authority Rev., 5.00%, 6/15/44 | 4,900,000 |
| 5,282,053 |
|
| New Jersey Turnpike Authority Rev., 5.00%, 1/1/18 | 1,700,000 |
| 1,810,704 |
|
| New Jersey Turnpike Authority Rev., 5.00%, 1/1/20 | 10,000,000 |
| 11,332,600 |
|
| New Jersey Turnpike Authority Rev., 5.00%, 1/1/27 | 5,000,000 |
| 6,110,200 |
|
| New Jersey Turnpike Authority Rev., 5.00%, 1/1/28 | 2,000,000 |
| 2,367,840 |
|
| New Jersey Turnpike Authority Rev., 5.00%, 1/1/29 | 14,940,000 |
| 17,612,318 |
|
| New Jersey Turnpike Authority Rev., 5.00%, 1/1/33 | 5,215,000 |
| 6,243,867 |
|
| | | 129,884,654 |
|
| New Mexico — 0.5% | | |
| New Mexico Finance Authority Rev., 5.00%, 6/15/17 | 1,000,000 |
| 1,045,550 |
|
| New Mexico Finance Authority Rev., 5.00%, 6/15/18 | 3,000,000 |
| 3,257,730 |
|
| New Mexico Finance Authority Rev., 4.00%, 6/15/19 | 2,000,000 |
| 2,186,300 |
|
| New Mexico Hospital Equipment Loan Council Rev., (Presbyterian Healthcare Services Obligated Group), 5.00%, 8/1/22 | 725,000 |
| 871,356 |
|
| New Mexico Hospital Equipment Loan Council Rev., (Presbyterian Healthcare Services Obligated Group), 5.00%, 8/1/23 | 1,625,000 |
| 1,991,714 |
|
| New Mexico Hospital Equipment Loan Council Rev., (Presbyterian Healthcare Services Obligated Group), 5.00%, 8/1/25 | 775,000 |
| 973,694 |
|
| New Mexico Hospital Equipment Loan Council Rev., (Presbyterian Healthcare Services Obligated Group), 5.00%, 8/1/26 | 1,000,000 |
| 1,242,690 |
|
| New Mexico Municipal Energy Acquisition Authority Rev., VRDN, 5.00%, 8/1/19 (SBBPA: Royal Bank of Canada) | 5,000,000 |
| 5,562,100 |
|
| | | 17,131,134 |
|
| New York — 17.4% | | |
| Brooklyn Arena Local Development Corp. Rev., 6.25%, 7/15/40 | 3,700,000 |
| 4,258,626 |
|
| Hempstead Town Local Development Corp. Rev., (Hofstra University), 5.00%, 7/1/24 | 1,465,000 |
| 1,696,748 |
|
| Hempstead Town Local Development Corp. Rev., (Hofstra University), 5.00%, 7/1/26 | 1,130,000 |
| 1,302,811 |
|
| Hempstead Town Local Development Corp. Rev., (Hofstra University), 5.00%, 7/1/27 | 1,320,000 |
| 1,517,710 |
|
| Hudson Yards Infrastructure Corp. Rev., 5.00%, 2/15/47 | 5,000,000 |
| 5,123,400 |
|
| Long Island Power Authority Rev., 5.00%, 5/1/21 | 2,385,000 |
| 2,789,091 |
|
| Long Island Power Authority Rev., 5.00%, 9/1/34 | 11,410,000 |
| 13,514,803 |
|
| Long Island Power Authority Rev., 5.00%, 9/1/35 | 3,500,000 |
| 4,128,495 |
|
| Metropolitan Transportation Authority Rev., 5.00%, 11/15/17 | 2,000,000 |
| 2,125,160 |
|
| Metropolitan Transportation Authority Rev., 5.00%, 11/15/19 | 1,750,000 |
| 1,984,938 |
|
|
| | | | | | |
| | Principal Amount | Value |
| Metropolitan Transportation Authority Rev., 6.25%, 11/15/23 | $ | 1,000,000 |
| $ | 1,133,560 |
|
| Metropolitan Transportation Authority Rev., 5.00%, 11/15/26 | 4,595,000 |
| 5,573,184 |
|
| Metropolitan Transportation Authority Rev., 5.00%, 11/15/26 | 5,000,000 |
| 6,045,550 |
|
| Metropolitan Transportation Authority Rev., 5.00%, 11/15/29 | 10,360,000 |
| 12,446,918 |
|
| Metropolitan Transportation Authority Rev., 5.00%, 11/15/41 | 2,100,000 |
| 2,446,500 |
|
| Metropolitan Transportation Authority Rev., 5.00%, 11/15/43 | 5,000,000 |
| 5,873,650 |
|
| Metropolitan Transportation Authority Rev., VRDN, 0.76%, 6/2/16 | 7,500,000 |
| 7,487,850 |
|
| Metropolitan Transportation Authority Rev., VRDN, 0.77%, 6/2/16 | 1,000,000 |
| 988,150 |
|
Nassau County Interim Finance Authority Rev., 5.00%, 5/15/19, Prerefunded at 100% of Par(2) | 1,680,000 |
| 1,880,710 |
|
Nassau County Interim Finance Authority Rev., 5.00%, 5/15/19, Prerefunded at 100% of Par(2) | 1,400,000 |
| 1,567,258 |
|
| Nassau County Interim Finance Authority Rev., 5.00%, 11/15/21 | 120,000 |
| 134,394 |
|
| Nassau County Interim Finance Authority Rev., 5.00%, 11/15/23 | 100,000 |
| 111,498 |
|
| Nassau County Local Economic Assistance Corp. Rev., (Catholic Health Services of Long Island Obligated Group), 5.00%, 7/1/22 | 750,000 |
| 889,365 |
|
New York City GO, 5.00%, 6/1/16, Prerefunded at 100% of Par(2) | 10,000 |
| 10,000 |
|
| New York City GO, 5.00%, 8/1/16 | 2,600,000 |
| 2,619,656 |
|
| New York City GO, 5.00%, 8/1/16 | 3,705,000 |
| 3,733,010 |
|
| New York City GO, 5.00%, 8/1/16 | 7,720,000 |
| 7,778,363 |
|
| New York City GO, 5.00%, 3/1/17 | 3,000,000 |
| 3,099,540 |
|
| New York City GO, 5.00%, 8/1/17 | 2,190,000 |
| 2,301,405 |
|
| New York City GO, 5.00%, 11/1/17 (AGM) | 5,000 |
| 5,020 |
|
| New York City GO, 5.00%, 8/1/18 | 5,000,000 |
| 5,448,800 |
|
| New York City GO, 5.00%, 8/1/18 | 4,095,000 |
| 4,462,567 |
|
| New York City GO, 5.00%, 8/1/18 | 5,000,000 |
| 5,448,800 |
|
| New York City GO, 5.00%, 8/1/19 | 4,555,000 |
| 5,124,466 |
|
| New York City GO, 5.00%, 10/1/19 | 5,000,000 |
| 5,653,950 |
|
| New York City GO, 5.00%, 8/1/20 | 5,000,000 |
| 5,785,300 |
|
| New York City GO, 5.00%, 3/1/22 | 7,000,000 |
| 7,760,970 |
|
| New York City GO, 5.00%, 5/15/22 | 6,570,000 |
| 7,333,565 |
|
| New York City GO, 5.00%, 8/1/22 | 7,565,000 |
| 9,166,435 |
|
| New York City GO, 5.00%, 8/1/23 | 5,000,000 |
| 5,963,550 |
|
| New York City GO, 5.00%, 8/1/23 | 10,000,000 |
| 12,348,000 |
|
| New York City GO, 5.00%, 8/1/25 | 1,650,000 |
| 2,077,317 |
|
| New York City GO, 5.00%, 8/1/26 | 5,370,000 |
| 6,690,268 |
|
| New York City GO, 5.00%, 8/1/27 | 4,830,000 |
| 6,019,291 |
|
| New York City GO, 5.00%, 8/1/27 | 5,095,000 |
| 6,349,542 |
|
| New York City GO, 5.00%, 8/1/36 | 4,510,000 |
| 5,385,797 |
|
New York City GO, VRDN, 0.36%, 6/1/16 (LIQ FAC: Barclays Bank plc) | 35,000,000 |
| 35,000,000 |
|
| New York City Transitional Finance Authority Building Aid Rev., 5.00%, 7/15/25 | 4,850,000 |
| 5,761,461 |
|
| New York City Transitional Finance Authority Building Aid Rev., 5.00%, 7/15/29 | 6,375,000 |
| 7,808,227 |
|
| New York City Transitional Finance Authority Building Aid Rev., 5.50%, 1/15/39 | 1,700,000 |
| 1,905,292 |
|
New York City Transitional Finance Authority Future Tax Secured Rev., 5.00%, 11/1/16(2) | 445,000 |
| 453,277 |
|
|
| | | | | | |
| | Principal Amount | Value |
New York City Transitional Finance Authority Future Tax Secured Rev., 5.00%, 11/1/16(2) | $ | 3,345,000 |
| $ | 3,407,685 |
|
New York City Transitional Finance Authority Future Tax Secured Rev., 5.00%, 11/1/17(2) | 715,000 |
| 758,207 |
|
| New York City Transitional Finance Authority Future Tax Secured Rev., 5.00%, 11/1/17 | 5,365,000 |
| 5,694,572 |
|
| New York City Transitional Finance Authority Future Tax Secured Rev., 5.00%, 11/1/21 | 4,000,000 |
| 4,783,880 |
|
| New York City Transitional Finance Authority Future Tax Secured Rev., 5.00%, 11/1/24 | 4,000,000 |
| 4,760,840 |
|
| New York City Transitional Finance Authority Future Tax Secured Rev., 5.00%, 11/1/25 | 6,000,000 |
| 7,126,320 |
|
| New York City Transitional Finance Authority Future Tax Secured Rev., 5.00%, 11/1/25 | 3,000,000 |
| 3,823,860 |
|
| New York City Transitional Finance Authority Future Tax Secured Rev., 5.00%, 11/1/26 | 15,000,000 |
| 18,946,800 |
|
| New York City Transitional Finance Authority Future Tax Secured Rev., 5.00%, 5/1/28 | 12,960,000 |
| 15,812,107 |
|
| New York City Transitional Finance Authority Future Tax Secured Rev., 5.00%, 8/1/29 | 10,000,000 |
| 12,459,900 |
|
| New York City Transitional Finance Authority Future Tax Secured Rev., 5.00%, 11/1/39 | 4,000,000 |
| 4,622,600 |
|
New York City Water & Sewer System Rev., 5.00%, 6/15/17(2) | 1,350,000 |
| 1,411,034 |
|
| New York City Water & Sewer System Rev., 5.00%, 6/15/39 | 5,000,000 |
| 5,584,400 |
|
| New York City Water & Sewer System Rev., 5.00%, 6/15/39 | 7,010,000 |
| 7,829,329 |
|
| New York Liberty Development Corp. Rev., (Goldman Sachs Headquarters LLC), 5.25%, 10/1/35 | 9,535,000 |
| 12,240,079 |
|
| New York Power Authority Rev., 5.00%, 11/15/22 | 1,000,000 |
| 1,223,800 |
|
| New York State Dormitory Authority Rev., 5.00%, 3/15/17 | 5,380,000 |
| 5,568,408 |
|
New York State Dormitory Authority Rev., 5.00%, 2/15/19, Prerefunded at 100% of Par(2) | 5,000 |
| 5,552 |
|
New York State Dormitory Authority Rev., 5.25%, 2/15/19, Prerefunded at 100% of Par(2) | 30,000 |
| 33,510 |
|
| New York State Dormitory Authority Rev., 5.00%, 3/15/24 | 6,530,000 |
| 7,645,455 |
|
| New York State Dormitory Authority Rev., 5.25%, 2/15/25 | 8,795,000 |
| 9,805,194 |
|
| New York State Dormitory Authority Rev., 5.00%, 12/15/25 | 8,225,000 |
| 10,105,153 |
|
| New York State Dormitory Authority Rev., 5.00%, 2/15/27 | 8,235,000 |
| 9,885,788 |
|
| New York State Dormitory Authority Rev., 5.75%, 3/15/36 | 10,000,000 |
| 11,364,700 |
|
| New York State Dormitory Authority Rev., 5.00%, 2/15/39 | 3,995,000 |
| 4,416,632 |
|
| New York State Dormitory Authority Rev., (Brooklyn Law School), 5.75%, 7/1/33 | 1,000,000 |
| 1,116,510 |
|
| New York State Dormitory Authority Rev., (New York University), 5.00%, 7/1/20 | 1,300,000 |
| 1,506,401 |
|
| New York State Dormitory Authority Rev., (New York University), 5.00%, 7/1/21 | 1,840,000 |
| 2,190,796 |
|
| New York State Dormitory Authority Rev., (New York University), 5.00%, 7/1/22 | 1,580,000 |
| 1,922,433 |
|
| New York State Dormitory Authority Rev., (New York University), 5.00%, 7/1/23 | 3,190,000 |
| 3,961,884 |
|
New York State Dormitory Authority Rev., (Northwell Health Obligated Group), 5.50%, 5/1/19, Prerefunded at 100% of Par(2) | 1,200,000 |
| 1,358,724 |
|
| New York State Dormitory Authority Rev., (Trustees of Columbia University in the New York City), 5.00%, 10/1/22 | 2,800,000 |
| 3,440,276 |
|
| New York State Environmental Facilities Corp. Rev., 5.00%, 9/15/23 | 7,660,000 |
| 9,570,021 |
|
| New York State Environmental Facilities Corp. Rev., 5.00%, 3/15/24 | 7,340,000 |
| 9,253,538 |
|
|
| | | | | | |
| | Principal Amount | Value |
| New York State Thruway Authority Rev., 5.00%, 5/1/19 | $ | 6,900,000 |
| $ | 7,691,430 |
|
| New York State Thruway Authority Rev., 5.00%, 1/1/24 | 3,330,000 |
| 4,019,343 |
|
| New York State Thruway Authority Rev., 5.00%, 1/1/28 | 5,000,000 |
| 6,151,000 |
|
| New York State Thruway Authority Rev., 5.00%, 1/1/29 | 9,850,000 |
| 12,056,695 |
|
| New York State Thruway Authority Highway & Bridge Trust Fund Rev., 5.00%, 4/1/23 | 3,000,000 |
| 3,359,460 |
|
| New York State Thruway Authority Highway & Bridge Trust Fund Rev., 5.00%, 4/1/25 | 5,865,000 |
| 6,855,833 |
|
| New York State Urban Development Corp. Rev., 5.00%, 3/15/28 | 3,900,000 |
| 4,744,662 |
|
| Niagara Falls Bridge Commission Rev., 4.00%, 10/1/19 (AGC) | 2,585,000 |
| 2,737,050 |
|
| Port Authority of New York & New Jersey Rev., 5.00%, 12/1/27 | 10,000,000 |
| 12,414,500 |
|
| Port Authority of New York & New Jersey Rev., (JFK International Air Terminal LLC), 5.00%, 12/1/20 | 850,000 |
| 968,847 |
|
| Port Authority of New York & New Jersey Rev., (JFK International Air Terminal LLC), 6.00%, 12/1/42 | 2,600,000 |
| 3,054,012 |
|
| State of New York GO, 5.00%, 2/15/39 | 1,700,000 |
| 1,887,136 |
|
| Tobacco Settlement Financing Corp. Rev., 5.00%, 6/1/17 | 10,000,000 |
| 10,433,700 |
|
| Tobacco Settlement Financing Corp. Rev., 5.00%, 6/1/18 | 8,025,000 |
| 8,685,457 |
|
| Tompkins County Development Corp. Rev., (Kendal at Ithaca, Inc.), 4.00%, 7/1/29 | 500,000 |
| 524,485 |
|
| Tompkins County Development Corp. Rev., (Kendal at Ithaca, Inc.), 5.00%, 7/1/29 | 730,000 |
| 839,456 |
|
| Tompkins County Development Corp. Rev., (Kendal at Ithaca, Inc.), 5.00%, 7/1/34 | 1,000,000 |
| 1,129,950 |
|
| Tompkins County Development Corp. Rev., (Kendal at Ithaca, Inc.), 5.00%, 7/1/44 | 1,000,000 |
| 1,118,600 |
|
| Triborough Bridge & Tunnel Authority Rev., 4.00%, 11/15/16 | 3,250,000 |
| 3,304,015 |
|
| Triborough Bridge & Tunnel Authority Rev., 5.00%, 11/15/17 | 3,325,000 |
| 3,538,066 |
|
| Triborough Bridge & Tunnel Authority Rev., 5.00%, 11/15/29 | 700,000 |
| 866,544 |
|
| Triborough Bridge & Tunnel Authority Rev., 5.00%, 11/15/30 | 3,030,000 |
| 3,624,274 |
|
| Triborough Bridge & Tunnel Authority Rev., 5.00%, 11/15/38 | 10,000,000 |
| 10,949,300 |
|
| Westchester County Local Development Corp. Rev., (Pace University), 5.50%, 5/1/42 | 3,310,000 |
| 3,847,710 |
|
| Westchester County Local Development Corp. Rev., (Westchester County Health Care Corp. Obligated Group), 5.00%, 11/1/25 | 1,000,000 |
| 1,237,580 |
|
| Westchester County Local Development Corp. Rev., (Westchester County Health Care Corp. Obligated Group), 5.00%, 11/1/28 | 1,000,000 |
| 1,211,070 |
|
| Westchester County Local Development Corp. Rev., (Westchester County Health Care Corp. Obligated Group), 5.00%, 11/1/29 | 1,000,000 |
| 1,206,250 |
|
| Westchester County Local Development Corp. Rev., (Westchester County Health Care Corp. Obligated Group), 5.00%, 11/1/30 | 1,000,000 |
| 1,200,840 |
|
| Westchester County Local Development Corp. Rev., (Westchester County Health Care Corp. Obligated Group), 5.00%, 11/1/46 | 1,500,000 |
| 1,722,585 |
|
| | | 581,530,476 |
|
| North Carolina — 0.7% | | |
| Charlotte GO, 5.00%, 8/1/19 | 2,000,000 |
| 2,182,020 |
|
| Charlotte Water & Sewer System Rev., 5.00%, 7/1/17 | 1,000,000 |
| 1,047,440 |
|
| Greensboro Combined Water & Sewer System Rev., 5.25%, 6/1/20 | 2,060,000 |
| 2,401,260 |
|
North Carolina Eastern Municipal Power Agency Rev., 5.00%, 1/1/18(2) | 2,955,000 |
| 3,152,039 |
|
| North Carolina Medical Care Commission Rev., (Mission-St Joseph's Health System, Inc.), VRDN, 0.47%, 6/2/16 (SBBPA: Branch Banking & Trust) | 1,000,000 |
| 1,000,000 |
|
|
| | | | | | |
| | Principal Amount | Value |
North Carolina Municipal Power Agency No. 1 Rev., 5.25%, 1/1/18, Prerefunded at 100% of Par(2) | $ | 2,500,000 |
| $ | 2,676,525 |
|
North Carolina Municipal Power Agency No. 1 Rev., 5.25%, 1/1/18, Prerefunded at 100% of Par(2) | 2,000,000 |
| 2,141,220 |
|
North Carolina Municipal Power Agency No. 1 Rev., 5.00%, 1/1/19, Prerefunded at 100% of Par(2) | 1,280,000 |
| 1,414,221 |
|
| North Carolina Municipal Power Agency No. 1 Rev., 5.00%, 1/1/28 | 4,050,000 |
| 4,735,422 |
|
| North Carolina Municipal Power Agency No. 1 Rev., 5.00%, 1/1/30 | 520,000 |
| 570,248 |
|
| Raleigh Durham Airport Authority Rev., 5.00%, 5/1/20 | 450,000 |
| 518,841 |
|
| Raleigh Durham Airport Authority Rev., 5.00%, 5/1/21 | 360,000 |
| 426,067 |
|
| Raleigh Durham Airport Authority Rev., 5.00%, 5/1/22 | 760,000 |
| 915,488 |
|
| | | 23,180,791 |
|
| North Dakota — 0.2% | | |
| Grand Forks Rev., (Altru Health System), VRDN, 0.39%, 6/1/16 (LOC: Bank of America N.A.) | 6,100,000 |
| 6,100,000 |
|
| Ohio — 2.7% | | |
American Municipal Power, Inc. Rev., 5.00%, 2/15/17(2) | 575,000 |
| 592,831 |
|
| Buckeye Tobacco Settlement Financing Authority Rev., 5.875%, 6/1/30 | 5,000,000 |
| 4,979,750 |
|
| Cleveland COP, 5.00%, 11/15/19 | 2,450,000 |
| 2,726,090 |
|
| Cleveland Rev., 5.00%, 5/15/21 | 1,475,000 |
| 1,724,732 |
|
| Cleveland Rev., 5.00%, 5/15/23 | 1,305,000 |
| 1,575,618 |
|
Cleveland Airport System Rev., 5.00%, 1/1/22 (AGM)(1) | 1,635,000 |
| 1,874,364 |
|
Cleveland Airport System Rev., 5.00%, 1/1/23 (AGM)(1) | 1,510,000 |
| 1,757,368 |
|
Cleveland Airport System Rev., 5.00%, 1/1/24 (AGM)(1) | 1,075,000 |
| 1,269,113 |
|
| Cleveland Airport System Rev., 5.00%, 1/1/25 (AGM) | 4,000,000 |
| 4,658,480 |
|
| Cleveland Airport System Rev., 5.00%, 1/1/25 | 2,500,000 |
| 2,890,025 |
|
| Cleveland Airport System Rev., 5.00%, 1/1/26 (AGM) | 3,560,000 |
| 4,119,454 |
|
| Cleveland Airport System Rev., 5.00%, 1/1/26 | 2,530,000 |
| 2,916,027 |
|
| Cleveland Airport System Rev., 5.00%, 1/1/31 (AGM) | 750,000 |
| 885,765 |
|
| Cleveland-Cuyahoga County Port Authority Rev., (Euclid Avenue Development Corp.), 5.00%, 8/1/39 | 4,900,000 |
| 5,624,073 |
|
| Cleveland-Cuyahoga County Port Authority Rev., (Euclid Avenue Development Corp.), 5.00%, 8/1/44 | 2,150,000 |
| 2,347,305 |
|
| Cuyahoga County Rev., 5.00%, 12/1/20 | 1,400,000 |
| 1,620,486 |
|
| Cuyahoga County Rev., 5.00%, 12/1/24 | 500,000 |
| 612,465 |
|
| Cuyahoga County Rev., 5.00%, 12/1/25 | 370,000 |
| 449,532 |
|
| Kent State University Rev., 4.00%, 5/1/23 | 1,800,000 |
| 2,081,394 |
|
| Miami University/Oxford Rev., 5.00%, 9/1/25 | 4,440,000 |
| 5,206,122 |
|
| Ohio Air Quality Development Authority Rev., (FirstEnergy Generation LLC), VRDN, 3.75%, 12/3/18 (GA: FirstEnergy Solutions Corp.) | 24,600,000 |
| 25,167,768 |
|
| Ohio Higher Educational Facility Commission Rev., (Case Western Reserve University), 6.50%, 10/1/20 | 620,000 |
| 688,907 |
|
| Ohio Higher Educational Facility Commission Rev., (Oberlin College), 5.00%, 10/1/19 | 5,000,000 |
| 5,652,200 |
|
| Ohio State University Rev., 5.00%, 12/1/16 | 3,775,000 |
| 3,862,278 |
|
Ohio State University Rev., 5.00%, 12/1/18, Prerefunded at 100% of Par(2) | 200,000 |
| 220,618 |
|
| Ohio State University Rev., 5.00%, 12/1/27 | 1,800,000 |
| 1,975,572 |
|
Ohio Water Development Authority Rev., 5.00%, 6/1/18, Prerefunded at 100% of Par(2) | 2,000,000 |
| 2,167,660 |
|
|
| | | | | | |
| | Principal Amount | Value |
| Putnam County Rev., (Hilty Home, Inc.), VRDN, 0.45%, 6/2/16 (LOC: First Federal Bank of Midwest and FHLB) | $ | 1,600,000 |
| $ | 1,600,000 |
|
| | | 91,245,997 |
|
| Oklahoma — 0.3% | | |
Oklahoma Development Finance Authority Rev., (INTEGRIS Health Obligated Group), 5.50%, 8/15/18, Prerefunded at 100% of Par(2) | 3,000,000 |
| 3,306,930 |
|
| Oklahoma Development Finance Authority Rev., (INTEGRIS Health Obligated Group), 5.00%, 8/15/25 | 1,500,000 |
| 1,886,895 |
|
| Oklahoma Development Finance Authority Rev., (INTEGRIS Health Obligated Group), 5.00%, 8/15/26 | 1,000,000 |
| 1,246,100 |
|
| Oklahoma Development Finance Authority Rev., (INTEGRIS Health Obligated Group), 5.00%, 8/15/27 | 1,000,000 |
| 1,236,520 |
|
| Pottawatomie County Facilities Authority Rev., 5.00%, 9/1/16 | 2,130,000 |
| 2,137,221 |
|
| | | 9,813,666 |
|
| Oregon — 0.4% | | |
Oregon Health & Science University Rev., 5.75%, 7/1/19, Prerefunded at 100% of Par(2) | 2,900,000 |
| 3,325,314 |
|
| State of Oregon GO, 5.00%, 5/1/19 | 1,080,000 |
| 1,206,965 |
|
| State of Oregon GO, 5.00%, 5/1/20 | 1,870,000 |
| 2,153,735 |
|
| State of Oregon GO, 5.00%, 8/1/20 | 1,000,000 |
| 1,160,160 |
|
| State of Oregon GO, 5.00%, 5/1/21 | 1,500,000 |
| 1,776,075 |
|
| State of Oregon GO, 5.00%, 8/1/21 | 750,000 |
| 893,108 |
|
| State of Oregon GO, 5.00%, 8/1/22 | 700,000 |
| 853,076 |
|
| State of Oregon GO, 5.00%, 8/1/23 | 1,340,000 |
| 1,666,973 |
|
| State of Oregon GO, 5.00%, 8/1/24 | 1,000,000 |
| 1,267,690 |
|
| | | 14,303,096 |
|
| Pennsylvania — 3.4% | | |
| Allegheny County Higher Education Building Authority Rev., (Duquesne University of the Holy Spirit), 4.00%, 3/1/30 | 1,230,000 |
| 1,372,569 |
|
| Allegheny County Higher Education Building Authority Rev., (Duquesne University of the Holy Spirit), 4.00%, 3/1/31 | 2,000,000 |
| 2,217,880 |
|
| Allegheny County Higher Education Building Authority Rev., (Duquesne University of the Holy Spirit), 4.00%, 3/1/32 | 600,000 |
| 662,658 |
|
| Allegheny County Higher Education Building Authority Rev., (Duquesne University of the Holy Spirit), 4.00%, 3/1/33 | 400,000 |
| 440,696 |
|
| Allegheny County Hospital Development Authority Rev., (UPMC Obligated Group), 5.00%, 9/1/18 | 1,500,000 |
| 1,635,585 |
|
| Berks County Municipal Authority Rev., (Reading Hospital Obligated Group), VRDN, 1.90%, 6/2/16 | 2,500,000 |
| 2,520,900 |
|
| Capital Region Water Rev., 5.00%, 7/15/24 (BAM) | 750,000 |
| 916,447 |
|
| Capital Region Water Rev., 5.00%, 7/15/29 (BAM) | 400,000 |
| 487,276 |
|
| Centre County Hospital Authority Rev., (Mount Nittany Medical Center Obligated Group), 3.00%, 11/15/31 | 100,000 |
| 101,028 |
|
| Centre County Hospital Authority Rev., (Mount Nittany Medical Center Obligated Group), 4.00%, 11/15/32 | 250,000 |
| 272,058 |
|
| Centre County Hospital Authority Rev., (Mount Nittany Medical Center Obligated Group), 3.125%, 11/15/33 | 275,000 |
| 276,568 |
|
| Centre County Hospital Authority Rev., (Mount Nittany Medical Center Obligated Group), 4.00%, 11/15/34 | 200,000 |
| 215,418 |
|
| Cumberland County Municipal Authority Rev., (Dickinson College), 5.00%, 5/1/28 | 1,000,000 |
| 1,238,850 |
|
| Cumberland County Municipal Authority Rev., (Dickinson College), 5.00%, 5/1/29 | 1,420,000 |
| 1,752,081 |
|
|
| | | | | | |
| | Principal Amount | Value |
| Geisinger Authority Rev., (Geisinger Health System Obligated Group), VRN, 1.20%, 8/1/16 | $ | 5,000,000 |
| $ | 4,335,000 |
|
| General Authority of Southcentral Pennsylvania Rev., (WellSpan Health), 5.00%, 6/1/44 | 4,950,000 |
| 5,698,885 |
|
| Northeastern Pennsylvania Hospital & Education Authority Rev., (Wilkes University), 5.00%, 3/1/37 | 1,275,000 |
| 1,467,015 |
|
| Pennsylvania GO, 5.375%, 7/1/16 (NATL) | 2,795,000 |
| 2,806,432 |
|
| Pennsylvania GO, 5.375%, 7/1/18 (AGM) | 1,070,000 |
| 1,167,670 |
|
| Pennsylvania Economic Development Financing Authority Rev., 5.00%, 7/1/19 | 15,525,000 |
| 17,441,095 |
|
Pennsylvania Economic Development Financing Authority Rev., (Albert Einstein Healthcare Network Obligated Group), 6.25%, 10/15/19, Prerefunded at 100% of Par(2) | 5,000,000 |
| 5,681,600 |
|
| Pennsylvania Higher Educational Facilities Authority Rev., (Temple University), 5.00%, 4/1/25 | 1,000,000 |
| 1,190,470 |
|
| Pennsylvania Higher Educational Facilities Authority Rev., (Temple University), 5.00%, 4/1/26 | 1,000,000 |
| 1,185,270 |
|
| Pennsylvania Higher Educational Facilities Authority Rev., (Temple University), 5.00%, 4/1/27 | 1,150,000 |
| 1,355,861 |
|
| Pennsylvania Higher Educational Facilities Authority Rev., (University of Pennsylvania Health System Obligated Group), 5.00%, 8/15/20 | 1,600,000 |
| 1,845,680 |
|
Pennsylvania Higher Educational Facilities Authority Rev., (University of Pennsylvania), 5.00%, 9/1/19(2) | 1,000,000 |
| 1,129,570 |
|
Pennsylvania Turnpike Commission Rev., Capital Appreciation, 0.00%, 12/1/21(4) | 1,800,000 |
| 1,558,512 |
|
| Pennsylvania Turnpike Commission Rev., 5.00%, 12/1/26 | 1,850,000 |
| 2,280,069 |
|
| Pennsylvania Turnpike Commission Rev., 5.00%, 12/1/27 | 945,000 |
| 1,161,859 |
|
| Pennsylvania Turnpike Commission Rev., 5.00%, 12/1/28 | 1,000,000 |
| 1,222,350 |
|
| Pennsylvania Turnpike Commission Rev., 5.00%, 12/1/32 | 6,505,000 |
| 7,645,392 |
|
| Pennsylvania Turnpike Commission Rev., 5.25%, 12/1/39 | 5,000,000 |
| 5,867,250 |
|
| Pennsylvania Turnpike Commission Rev., VRN, 1.00%, 6/2/16 | 5,000,000 |
| 4,991,450 |
|
| Pennsylvania Turnpike Commission Rev., VRN, 1.08%, 6/2/16 | 3,945,000 |
| 3,932,573 |
|
| Philadelphia Gas Works Co Rev., 5.25%, 8/1/17 | 1,000,000 |
| 1,051,060 |
|
| Philadelphia Water & Wastewater Rev., 5.25%, 1/1/36 | 1,415,000 |
| 1,548,194 |
|
| Pittsburgh GO, 5.25%, 9/1/16 (AGM) | 15,805,000 |
| 15,986,916 |
|
| Pittsburgh GO, 5.00%, 9/1/25 | 3,000,000 |
| 3,578,010 |
|
| Pittsburgh GO, 5.00%, 9/1/26 | 1,000,000 |
| 1,185,730 |
|
| Southeastern Pennsylvania Transportation Authority Rev., 5.00%, 6/1/16 | 1,060,000 |
| 1,060,000 |
|
| Township of Exeter GO, 5.30%, 7/15/19 (Ambac) | 1,830,000 |
| 2,063,581 |
|
| | | 114,547,508 |
|
Rhode Island† | | |
Rhode Island Depositors Economic Protection Corp. Rev., 6.25%, 8/1/16 (NATL)(2) | 1,015,000 |
| 1,024,470 |
|
| South Carolina — 0.9% | | |
| Charleston Educational Excellence Finance Corp. Rev., 5.00%, 12/1/24 | 1,750,000 |
| 2,176,842 |
|
| Charleston Educational Excellence Finance Corp. Rev., 5.00%, 12/1/25 | 2,945,000 |
| 3,644,526 |
|
| Greenwood Fifty Schools Facilities, Inc. Rev., 5.00%, 12/1/21 (BAM) | 1,000,000 |
| 1,175,630 |
|
| Greenwood Fifty Schools Facilities, Inc. Rev., 5.00%, 12/1/27 (BAM) | 5,000,000 |
| 6,177,200 |
|
|
| | | | | | |
| | Principal Amount | Value |
Kershaw County School District Rev., 5.00%, 12/1/16, Prerefunded at 100% of Par (AGC)(2) | $ | 700,000 |
| $ | 715,547 |
|
Kershaw County School District Rev., 5.00%, 12/1/16, Prerefunded at 100% of Par (AGC)(2) | 3,000,000 |
| 3,066,630 |
|
| Piedmont Municipal Power Agency Rev., 5.00%, 1/1/17 | 3,000,000 |
| 3,074,940 |
|
Piedmont Municipal Power Agency Rev., 6.75%, 1/1/19 (FGIC)(2) | 625,000 |
| 717,544 |
|
| Piedmont Municipal Power Agency Rev., 6.75%, 1/1/19 (NATL) | 875,000 |
| 997,010 |
|
| South Carolina Jobs-Economic Development Authority Rev., (Palmetto Health), 5.75%, 8/1/39 | 2,700,000 |
| 2,940,084 |
|
| South Carolina Jobs-Economic Development Authority Rev., (YMCA of Beaufort County), VRDN, 0.44%, 6/2/16 (LOC: Branch Banking & Trust) | 2,510,000 |
| 2,510,000 |
|
| South Carolina Ports Authority Rev., 5.00%, 7/1/16 | 2,695,000 |
| 2,704,594 |
|
| | | 29,900,547 |
|
| Tennessee — 0.2% | | |
| Clarksville Public Building Authority Rev., VRDN, 0.41%, 6/1/16 (LOC: Bank of America N.A.) | 370,000 |
| 370,000 |
|
| Memphis Electric System Rev., 5.00%, 12/1/16 | 1,000,000 |
| 1,022,300 |
|
| Metropolitan Nashville Airport Authority Rev., 4.00%, 7/1/25 | 375,000 |
| 441,105 |
|
| Metropolitan Nashville Airport Authority Rev., 4.00%, 7/1/26 | 650,000 |
| 752,817 |
|
| Metropolitan Nashville Airport Authority Rev., 4.00%, 7/1/27 | 415,000 |
| 476,200 |
|
| Metropolitan Nashville Airport Authority Rev., 5.00%, 7/1/28 | 375,000 |
| 463,451 |
|
| Metropolitan Nashville Airport Authority Rev., 5.00%, 7/1/29 | 475,000 |
| 583,961 |
|
| Metropolitan Nashville Airport Authority Rev., 5.00%, 7/1/30 | 475,000 |
| 580,673 |
|
Tennessee State School Bond Authority Rev., 5.125%, 5/1/18, Prerefunded at 100% of Par(2) | 180,000 |
| 194,843 |
|
Tennessee State School Bond Authority Rev., 5.125%, 5/1/18, Prerefunded at 100% of Par(2) | 820,000 |
| 887,945 |
|
| | | 5,773,295 |
|
| Texas — 8.9% | | |
Allen Independent School District GO, 5.25%, 2/15/19, Prerefunded at 100% of Par(2) | 3,325,000 |
| 3,710,700 |
|
| Austin Electric Utility Rev., 4.00%, 11/15/17 | 500,000 |
| 524,280 |
|
| Austin Electric Utility Rev., 5.00%, 11/15/19 | 500,000 |
| 569,320 |
|
| Austin Water & Wastewater System Rev., 5.00%, 11/15/28 | 5,300,000 |
| 6,311,452 |
|
| Bowie County Industrial Development Corp. VRDN, 0.36%, 6/1/16 | 1,600,000 |
| 1,600,000 |
|
| Central Texas Regional Mobility Authority Rev., 5.00%, 1/1/21 | 860,000 |
| 997,798 |
|
Central Texas Regional Mobility Authority Rev., 6.00%, 1/1/21, Prerefunded at 100% of Par(2) | 2,500,000 |
| 3,032,950 |
|
Central Texas Regional Mobility Authority Rev., 5.00%, 1/1/29(1) | 2,000,000 |
| 2,423,700 |
|
| Central Texas Regional Mobility Authority Rev., 5.00%, 1/1/45 | 1,900,000 |
| 2,201,777 |
|
| Central Texas Turnpike System Rev., 5.00%, 8/15/42 | 1,750,000 |
| 2,023,490 |
|
| City Public Service Board of San Antonio Rev., 5.00%, 2/1/19 | 10,000,000 |
| 11,083,300 |
|
| City Public Service Board of San Antonio Rev., 5.00%, 2/1/43 | 4,300,000 |
| 5,045,577 |
|
| Clifton Higher Education Finance Corp. Rev., (IDEA Public Schools), 5.00%, 8/15/39 (PSF-GTD) | 1,415,000 |
| 1,686,326 |
|
| Dallas Area Rapid Transit Rev., 5.00%, 12/1/19 | 2,250,000 |
| 2,557,665 |
|
| Dallas Independent School District GO, VRDN, 5.00%, 2/15/22 (PSF-GTD) | 10,000,000 |
| 11,916,700 |
|
| Dallas Waterworks & Sewer System Rev., 5.00%, 10/1/25 | 2,750,000 |
| 3,521,238 |
|
| Dallas/Fort Worth International Airport Rev., 5.00%, 11/1/18 | 720,000 |
| 788,890 |
|
|
| | | | | | |
| | Principal Amount | Value |
| Dallas/Fort Worth International Airport Rev., 5.00%, 11/1/20 | $ | 2,900,000 |
| $ | 3,360,375 |
|
| Dallas/Fort Worth International Airport Rev., 5.00%, 11/1/20 | 725,000 |
| 840,094 |
|
| Dallas/Fort Worth International Airport Rev., 5.00%, 11/1/21 | 4,400,000 |
| 5,131,896 |
|
| Dallas/Fort Worth International Airport Rev., 5.00%, 11/1/21 | 500,000 |
| 592,410 |
|
| Dallas/Fort Worth International Airport Rev., 5.00%, 11/1/22 | 400,000 |
| 483,608 |
|
| Dallas/Fort Worth International Airport Rev., 5.00%, 11/1/23 | 645,000 |
| 793,550 |
|
| Fort Worth Water & Sewer System Rev., 5.00%, 2/15/17 | 1,000,000 |
| 1,030,450 |
|
| Fort Worth Water & Sewer System Rev., 5.00%, 2/15/24 | 11,780,000 |
| 14,611,087 |
|
| Frisco Independent School District GO, 5.00%, 8/15/21 (PSF-GTD) | 4,015,000 |
| 4,775,963 |
|
| Frisco Independent School District GO, 5.00%, 8/15/22 (PSF-GTD) | 3,140,000 |
| 3,805,460 |
|
| Garland Independent School District GO, 5.00%, 2/15/22 (PSF-GTD) | 4,125,000 |
| 4,941,544 |
|
| Garland Independent School District GO, 5.00%, 2/15/24 (PSF-GTD) | 7,790,000 |
| 9,744,511 |
|
| Grand Parkway Transportation Corp. Rev., 5.125%, 10/1/43 | 2,205,000 |
| 2,467,704 |
|
| Harris County GO, 5.00%, 10/1/19 | 6,765,000 |
| 7,661,768 |
|
| Harris County Rev., 5.00%, 8/15/17 | 5,000,000 |
| 5,256,250 |
|
| Harris County Rev., (Harris County Toll Road Authority), 5.00%, 8/15/25 | 3,170,000 |
| 4,041,274 |
|
| Harris County Rev., (Harris County Toll Road Authority), 5.00%, 8/15/26 | 1,660,000 |
| 2,095,318 |
|
| Harris County Rev., (Harris County Toll Road Authority), 5.00%, 8/15/27 | 1,500,000 |
| 1,881,090 |
|
| Harris County Rev., (Harris County Toll Road Authority), 5.00%, 8/15/28 | 1,000,000 |
| 1,244,170 |
|
| Harris County Rev., (Harris County Toll Road Authority), 5.00%, 8/15/29 | 1,000,000 |
| 1,239,450 |
|
| Harris County Cultural Education Facilities Finance Corp. Rev., (Houston Methodist Hospital Obligated Group), 5.50%, 12/1/18 | 2,500,000 |
| 2,772,475 |
|
| Harris County Cultural Education Facilities Finance Corp. Rev., (Texas Children's Hospital Obligated Group), 5.00%, 10/1/21 | 2,200,000 |
| 2,612,434 |
|
| Harris County Cultural Education Facilities Finance Corp. Rev., (Texas Children's Hospital Obligated Group), 5.00%, 10/1/22 | 2,500,000 |
| 3,029,675 |
|
| Harris County Cultural Education Facilities Finance Corp. Rev., (Texas Children's Hospital Obligated Group), 5.00%, 10/1/23 | 1,950,000 |
| 2,400,177 |
|
| Harris County-Houston Sports Authority Rev., 5.00%, 11/15/20 | 1,220,000 |
| 1,393,033 |
|
| Harris County-Houston Sports Authority Rev., 5.00%, 11/15/21 | 900,000 |
| 1,044,315 |
|
| Harris County-Houston Sports Authority Rev., 5.00%, 11/15/23 | 850,000 |
| 1,018,725 |
|
| Harris County-Houston Sports Authority Rev., 5.00%, 11/15/24 | 700,000 |
| 850,395 |
|
| Harris County-Houston Sports Authority Rev., 5.00%, 11/15/25 | 760,000 |
| 915,815 |
|
| Harris County-Houston Sports Authority Rev., 5.00%, 11/15/26 | 1,000,000 |
| 1,198,010 |
|
| Harris County-Houston Sports Authority Rev., 5.00%, 11/15/27 | 510,000 |
| 606,635 |
|
| Harris County-Houston Sports Authority Rev., 5.00%, 11/15/29 | 2,300,000 |
| 2,711,792 |
|
| Harris County-Houston Sports Authority Rev., 5.00%, 11/15/30 | 1,000,000 |
| 1,175,510 |
|
| Harris County-Houston Sports Authority Rev., 5.00%, 11/15/32 | 485,000 |
| 565,631 |
|
| Harris County-Houston Sports Authority Rev., 5.00%, 11/15/33 | 1,000,000 |
| 1,162,970 |
|
| Houston Rev., 5.00%, 9/1/25 | 1,000,000 |
| 1,227,930 |
|
| Houston Rev., 5.00%, 9/1/27 | 2,050,000 |
| 2,479,106 |
|
| Houston Rev., 5.00%, 9/1/28 | 710,000 |
| 852,880 |
|
| Houston Airport System Rev., 5.00%, 7/1/23 | 2,560,000 |
| 3,060,992 |
|
| Houston Airport System Rev., 5.00%, 7/1/24 | 4,000,000 |
| 4,780,200 |
|
|
| | | | | | |
| | Principal Amount | Value |
| Houston Airport System Rev., 5.50%, 7/1/39 | $ | 4,000,000 |
| $ | 4,363,240 |
|
| Houston Independent School District GO, VRDN, 1.70%, 6/1/18 (PSF-GTD) | 14,050,000 |
| 14,235,460 |
|
| Lone Star College System GO, 5.00%, 8/15/21 | 1,000,000 |
| 1,124,190 |
|
| Love Field Airport Modernization Corp. Rev., (Southwest Airlines Co.), 5.25%, 11/1/40 | 2,500,000 |
| 2,802,650 |
|
| Lower Colorado River Authority Rev., (LCRA Transmission Services Corp.), 5.00%, 5/15/22 | 1,000,000 |
| 1,144,350 |
|
| Lower Colorado River Authority Rev., (LCRA Transmission Services Corp.), 5.00%, 5/15/23 | 3,435,000 |
| 3,916,896 |
|
| Lower Colorado River Authority Rev., (LCRA Transmission Services Corp.), 5.00%, 5/15/24 | 2,000,000 |
| 2,274,880 |
|
| Mansfield Independent School District GO, VRDN, 1.75%, 8/1/17 (PSF-GTD) | 6,305,000 |
| 6,367,293 |
|
| Metropolitan Transit Authority of Harris County Rev., 5.00%, 11/1/26 | 2,000,000 |
| 2,518,800 |
|
| Metropolitan Transit Authority of Harris County Rev., 5.00%, 11/1/27 | 3,500,000 |
| 4,381,720 |
|
| Mission Economic Development Corp. Rev., (Progressive Waste Solutions of, Inc.), VRDN, 0.45%, 6/2/16 (LOC: Bank of America N.A.) (GA: IESI Corp.) | 1,200,000 |
| 1,200,000 |
|
North East Texas Regional Mobility Authority Rev., 5.00%, 1/1/28(1) | 2,610,000 |
| 3,150,975 |
|
| North Texas Tollway Authority Rev., 5.00%, 1/1/21 | 7,615,000 |
| 8,868,353 |
|
| North Texas Tollway Authority Rev., 5.00%, 1/1/24 | 3,475,000 |
| 4,276,509 |
|
| North Texas Tollway Authority Rev., 5.00%, 1/1/28 | 3,000,000 |
| 3,486,960 |
|
| North Texas Tollway Authority Rev., 5.00%, 1/1/29 | 2,400,000 |
| 2,789,568 |
|
| North Texas Tollway Authority Rev., 5.00%, 1/1/30 | 6,310,000 |
| 7,319,726 |
|
| North Texas Tollway Authority Rev., 5.00%, 1/1/36 | 1,960,000 |
| 2,241,280 |
|
| North Texas Tollway Authority Rev., 5.00%, 1/1/40 | 2,050,000 |
| 2,375,458 |
|
| Northside Independent School District GO, VRDN, 1.00%, 6/1/16 (PSF-GTD) | 6,420,000 |
| 6,420,000 |
|
| San Antonio GO, 5.00%, 2/1/18 | 2,650,000 |
| 2,837,382 |
|
| San Antonio Water System Rev., 5.00%, 5/15/17 | 2,365,000 |
| 2,463,195 |
|
| State of Texas GO, 5.00%, 10/1/16 | 3,355,000 |
| 3,405,828 |
|
| State of Texas GO, 5.00%, 10/1/17 | 2,225,000 |
| 2,353,716 |
|
| Tarrant County Cultural Education Facilities Finance Corp. Rev., (Baylor Scott & White Health Obligated Group), 4.00%, 11/15/34 | 2,000,000 |
| 2,190,860 |
|
| Texas Transportation Commission State Highway Fund Rev., VRDN, 0.75%, 6/2/16 | 4,800,000 |
| 4,795,632 |
|
| Texas Water Development Board Rev., 5.00%, 4/15/28 | 3,570,000 |
| 4,489,489 |
|
| Texas Water Development Board Rev., 5.00%, 10/15/28 | 7,090,000 |
| 8,909,223 |
|
| University of North Texas Rev., 5.00%, 4/15/27 | 5,770,000 |
| 7,118,680 |
|
| Williamson County GO, 5.00%, 2/15/19 (NATL) | 1,000,000 |
| 1,109,050 |
|
| | | 296,783,198 |
|
| Utah — 0.3% | | |
| St. George Electric Rev., 5.00%, 6/1/24 (AGM) | 1,000,000 |
| 1,231,780 |
|
| St. George Electric Rev., 5.00%, 6/1/27 (AGM) | 1,000,000 |
| 1,242,510 |
|
| State of Utah GO, 5.00%, 7/1/18 | 4,000,000 |
| 4,351,600 |
|
| Utah Transit Authority Rev., 5.00%, 6/15/24 | 2,900,000 |
| 3,462,368 |
|
| Utah Transit Authority Rev., 5.00%, 6/15/25 | 1,220,000 |
| 1,449,360 |
|
| | | 11,737,618 |
|
| Vermont — 0.3% | | |
| Burlington Airport Rev., 5.00%, 7/1/24 (AGM) | 500,000 |
| 590,085 |
|
|
| | | | | | |
| | Principal Amount | Value |
| Burlington Airport Rev., 5.00%, 7/1/30 (AGM) | $ | 500,000 |
| $ | 583,400 |
|
| University of Vermont & State Agricultural College Rev., 5.00%, 10/1/19 (Ambac) | 4,290,000 |
| 4,530,798 |
|
| Vermont Educational & Health Buildings Financing Agency Rev., (University of Vermont Health Network Obligated Group), 5.00%, 12/1/31 | 4,000,000 |
| 4,874,040 |
|
| | | 10,578,323 |
|
| Virginia — 0.7% | | |
Fairfax County Economic Development Authority Special Tax, 5.00%, 4/1/20, Prerefunded at 100% of Par(2) | 1,430,000 |
| 1,644,285 |
|
| Fairfax County Industrial Development Authority Rev., (Inova Health System Obligated Group), 5.00%, 5/15/26 | 3,500,000 |
| 4,481,085 |
|
| Greater Richmond Convention Center Authority Rev., 5.00%, 6/15/24 | 3,000,000 |
| 3,722,850 |
|
| Greater Richmond Convention Center Authority Rev., 5.00%, 6/15/25 | 1,660,000 |
| 2,083,981 |
|
| Stafford County Economic Development Authority Rev., (Mary Washington Healthcare Obligated Group), 5.00%, 6/15/24 | 650,000 |
| 795,684 |
|
| Stafford County Economic Development Authority Rev., (Mary Washington Healthcare Obligated Group), 5.00%, 6/15/25 | 1,000,000 |
| 1,232,360 |
|
| Stafford County Economic Development Authority Rev., (Mary Washington Healthcare Obligated Group), 5.00%, 6/15/28 | 1,000,000 |
| 1,214,840 |
|
| Stafford County Economic Development Authority Rev., (Mary Washington Healthcare Obligated Group), 5.00%, 6/15/30 | 700,000 |
| 843,815 |
|
| Virginia Resources Authority Rev., 5.00%, 10/1/16 | 5,120,000 |
| 5,196,954 |
|
| Virginia Small Business Financing Authority Rev., (Hampton University), 5.25%, 10/1/29 | 2,800,000 |
| 3,401,748 |
|
| | | 24,617,602 |
|
| Washington — 5.8% | | |
| Central Puget Sound Regional Transit Authority Rev., 5.00%, 11/1/16 | 2,105,000 |
| 2,144,574 |
|
| Central Puget Sound Regional Transit Authority Rev., 5.00%, 11/1/17 | 5,875,000 |
| 6,232,141 |
|
| Energy Northwest Rev., (Bonneville Power Administration), 5.00%, 7/1/18 | 2,410,000 |
| 2,618,176 |
|
| Energy Northwest Rev., (Bonneville Power Administration), 5.00%, 7/1/18 | 5,115,000 |
| 5,556,834 |
|
| Energy Northwest Rev., (Bonneville Power Administration), 5.25%, 7/1/18 | 3,000,000 |
| 3,274,590 |
|
| Energy Northwest Rev., (Bonneville Power Administration), 5.00%, 7/1/22 | 5,000,000 |
| 5,950,550 |
|
| Energy Northwest Rev., (Bonneville Power Administration), 5.00%, 7/1/28 | 6,945,000 |
| 8,516,098 |
|
| Port of Seattle Rev., 5.00%, 6/1/22 | 1,000,000 |
| 1,150,830 |
|
| Seattle Municipal Light & Power Rev., 5.00%, 2/1/19 | 5,000,000 |
| 5,534,650 |
|
| Seattle Municipal Light & Power Rev. VRDN, 1.08%, 6/2/16 | 11,250,000 |
| 11,250,000 |
|
| Seattle Water System Rev., 5.00%, 5/1/22 | 10,000,000 |
| 12,092,200 |
|
| State of Washington GO, 5.00%, 7/1/20 | 6,105,000 |
| 7,055,732 |
|
| State of Washington GO, 5.00%, 6/1/21 | 1,650,000 |
| 1,952,511 |
|
| State of Washington GO, 5.00%, 7/1/21 | 3,375,000 |
| 4,001,906 |
|
| State of Washington GO, 5.00%, 6/1/22 | 2,000,000 |
| 2,374,720 |
|
| State of Washington GO, 5.00%, 7/1/22 | 5,000,000 |
| 5,950,550 |
|
| State of Washington GO, 5.00%, 7/1/23 | 3,855,000 |
| 4,664,087 |
|
| State of Washington GO, 5.00%, 7/1/26 | 13,800,000 |
| 16,611,474 |
|
|
| | | | | | |
| | Principal Amount/Shares | Value |
| State of Washington GO, 5.00%, 7/1/27 | $ | 10,000,000 |
| $ | 12,413,100 |
|
| State of Washington GO, 5.00%, 8/1/29 | 18,595,000 |
| 23,119,349 |
|
| Tacoma Electric System Rev., 5.00%, 1/1/17 | 1,500,000 |
| 1,538,280 |
|
| Tacoma Electric System Rev., 4.00%, 1/1/18 | 1,000,000 |
| 1,049,270 |
|
| Tacoma Electric System Rev., 4.00%, 1/1/19 | 2,000,000 |
| 2,153,160 |
|
| Tacoma Electric System Rev., 5.00%, 1/1/19 | 1,000,000 |
| 1,102,020 |
|
| Washington Health Care Facilities Authority Rev., (Providence Health & Services Obligated Group), 5.25%, 10/1/33 (AGM) | 4,500,000 |
| 4,908,825 |
|
| Washington Health Care Facilities Authority Rev., (Seattle Children's Hospital Obligated Group), 5.00%, 10/1/29 | 6,500,000 |
| 7,930,325 |
|
| Washington Health Care Facilities Authority Rev., VRDN, 0.34%, 6/1/16 (LOC: Barclays Bank plc) | 32,300,000 |
| 32,300,000 |
|
| | | 193,445,952 |
|
| Wisconsin — 0.8% | | |
| State of Wisconsin GO, 5.00%, 5/1/19 | 5,000,000 |
| 5,591,900 |
|
| State of Wisconsin GO, 5.00%, 5/1/20 | 3,000,000 |
| 3,457,710 |
|
| State of Wisconsin GO, 5.00%, 5/1/21 | 2,500,000 |
| 2,958,825 |
|
| State of Wisconsin GO, 5.00%, 5/1/27 | 2,750,000 |
| 3,469,345 |
|
| Wisconsin Department of Transportation Rev., 5.00%, 7/1/18 | 500,000 |
| 543,625 |
|
| Wisconsin Health & Educational Facilities Authority Rev., (Luther Hospital), 5.50%, 11/15/22 (GA: Mayo Clinic) | 4,655,000 |
| 5,270,670 |
|
| Wisconsin Health & Educational Facilities Authority Rev., (Luther Hospital), 5.75%, 11/15/30 (GA: Mayo Clinic) | 5,800,000 |
| 6,553,362 |
|
| | | 27,845,437 |
|
TOTAL MUNICIPAL SECURITIES
(Cost $3,142,127,263) | | 3,333,745,345 |
|
TEMPORARY CASH INVESTMENTS† | | |
Federated Tax-Free Obligations Fund, Wealth Shares
(Cost $8,072) | 8,072 |
| 8,072 |
|
TOTAL INVESTMENT SECURITIES — 99.7%
(Cost $3,142,135,335) | | 3,333,753,417 |
|
| OTHER ASSETS AND LIABILITIES — 0.3% | | 10,041,343 |
|
| TOTAL NET ASSETS — 100.0% | | $ | 3,343,794,760 |
|
|
| | |
| NOTES TO SCHEDULE OF INVESTMENTS |
| ACA | - | American Capital Access |
| AGC | - | Assured Guaranty Corporation |
| AGM | - | Assured Guaranty Municipal Corporation |
| BAM | - | Build America Mutual Assurance Company |
| COP | - | Certificates of Participation |
| FGIC | - | Financial Guaranty Insurance Company |
| FHLB | - | Federal Home Loan Bank |
| GA | - | Guaranty Agreement |
| GO | - | General Obligation |
| LIQ FAC | - | Liquidity Facilities |
| LOC | - | Letter of Credit |
| NATL | - | National Public Finance Guarantee Corporation |
| PSF-GTD | - | Permanent School Fund Guaranteed |
| Q-SBLF | - | Qualified School Board Loan Fund |
| SBBPA | - | Standby Bond Purchase Agreement |
| VRDN | - | Variable Rate Demand Note. Interest reset date is indicated. Rate shown is effective at the period end. |
| VRN | - | Variable Rate Note. Interest reset date is indicated. Rate shown is effective at the period end. |
| |
| † | Category is less than 0.05% of total net assets. |
| |
| (1) | When-issued security. The issue price and yield are fixed on the date of the commitment, but payment and delivery are scheduled for a future date. |
| |
| (2) | Escrowed to maturity in U.S. government securities or state and local government securities. |
| |
| (3) | Security is a zero-coupon bond. Zero-coupon securities are issued at a substantial discount from their value at maturity. |
| |
| (4) | Coupon rate adjusts periodically based upon a predetermined schedule. Interest reset date is indicated. Rate shown is effective at the period end. |
See Notes to Financial Statements.
|
|
| Statement of Assets and Liabilities |
|
| | | |
| MAY 31, 2016 | |
| Assets | |
| Investment securities, at value (cost of $3,142,135,335) | $ | 3,333,753,417 |
|
| Cash | 6,057 |
|
| Receivable for investments sold | 12,648,215 |
|
| Receivable for capital shares sold | 4,050,910 |
|
| Interest receivable | 39,069,612 |
|
| Other assets | 875 |
|
| | 3,389,529,086 |
|
| | |
| Liabilities | |
| Payable for investments purchased | 39,622,281 |
|
| Payable for capital shares redeemed | 4,274,806 |
|
| Accrued management fees | 1,056,982 |
|
| Distribution and service fees payable | 28,894 |
|
| Dividends payable | 751,363 |
|
| | 45,734,326 |
|
| | |
| Net Assets | $ | 3,343,794,760 |
|
| | |
| Net Assets Consist of: | |
| Capital paid in | $ | 3,189,790,145 |
|
| Distributions in excess of net investment income | (9,955 | ) |
| Accumulated net realized loss | (37,603,512 | ) |
| Net unrealized appreciation | 191,618,082 |
|
| | $ | 3,343,794,760 |
|
|
| | | | |
| | Net Assets | Shares Outstanding | Net Asset Value Per Share |
| Investor Class | $1,624,065,012 | 140,505,486 |
| $11.56 |
| Institutional Class | $1,633,079,906 | 141,261,798 |
| $11.56 |
| A Class | $70,224,409 | 6,074,415 |
| $11.56* |
| C Class | $16,425,433 | 1,421,951 |
| $11.55 |
*Maximum offering price $12.10 (net asset value divided by 0.955).
See Notes to Financial Statements.
|
| | | |
| YEAR ENDED MAY 31, 2016 | |
| Investment Income (Loss) | |
| Income: | |
| Interest | $ | 102,694,601 |
|
| | |
| Expenses: | |
| Management fees | 12,404,844 |
|
| Distribution and service fees: | |
| A Class | 171,048 |
|
| C Class | 166,921 |
|
| Trustees' fees and expenses | 187,222 |
|
| Other expenses | 290 |
|
| | 12,930,325 |
|
| | |
| Net investment income (loss) | 89,764,276 |
|
| | |
| Realized and Unrealized Gain (Loss) | |
| Net realized gain (loss) on: | |
| Investment transactions | 19,829,102 |
|
| Futures contract transactions | 569,130 |
|
| | 20,398,232 |
|
| | |
| Change in net unrealized appreciation (depreciation) on: | |
| Investments | 46,540,771 |
|
| Futures contracts | 390,823 |
|
| | 46,931,594 |
|
| | |
| Net realized and unrealized gain (loss) | 67,329,826 |
|
| | |
| Net Increase (Decrease) in Net Assets Resulting from Operations | $ | 157,094,102 |
|
See Notes to Financial Statements.
|
|
| Statement of Changes in Net Assets |
|
| | | | | | |
| YEARS ENDED MAY 31, 2016 AND MAY 31, 2015 |
| Increase (Decrease) in Net Assets | May 31, 2016 | May 31, 2015 |
| Operations | | |
| Net investment income (loss) | $ | 89,764,276 |
| $ | 91,722,741 |
|
| Net realized gain (loss) | 20,398,232 |
| (24,470,046 | ) |
| Change in net unrealized appreciation (depreciation) | 46,931,594 |
| (8,574,223 | ) |
| Net increase (decrease) in net assets resulting from operations | 157,094,102 |
| 58,678,472 |
|
| | | |
| Distributions to Shareholders | | |
| From net investment income: | | |
| Investor Class | (40,808,375) |
| (44,349,779) |
|
| Institutional Class | (47,124,673) |
| (45,737,990) |
|
| A Class | (1,567,922) |
| (1,351,799) |
|
| C Class | (257,429) |
| (283,183) |
|
| Decrease in net assets from distributions | (89,758,399) |
| (91,722,751) |
|
| | | |
| Capital Share Transactions | | |
| Net increase (decrease) in net assets from capital share transactions (Note 5) | (109,289,313 | ) | 92,005,181 |
|
| | | |
| Net increase (decrease) in net assets | (41,953,610 | ) | 58,960,902 |
|
| | | |
| Net Assets | | |
| Beginning of period | 3,385,748,370 |
| 3,326,787,468 |
|
| End of period | $ | 3,343,794,760 |
| $ | 3,385,748,370 |
|
| | | |
| Distributions in excess of net investment income | $ | (9,955 | ) | $ | (9,955 | ) |
See Notes to Financial Statements.
|
|
| Notes to Financial Statements |
MAY 31, 2016
1. Organization
American Century Municipal Trust (the trust) is registered under the Investment Company Act of 1940, as amended (the 1940 Act), as an open-end management investment company and is organized as a Massachusetts business trust. Intermediate-Term Tax-Free Bond Fund (the fund) is one fund in a series issued by the trust. The fund’s investment objective is to seek safety of principal and high current income that is exempt from federal income tax.
The fund offers the Investor Class, the Institutional Class, the A Class and the C Class. The A Class may incur an initial sales charge. The A Class and C Class may be subject to a contingent deferred sales charge. The share classes differ principally in their respective sales charges and distribution and shareholder servicing expenses and arrangements. The Institutional Class is made available to institutional shareholders or through financial intermediaries whose clients do not require the same level of shareholder and administrative services as shareholders of other classes. As a result, the Institutional Class is charged a lower unified management fee.
2. Significant Accounting Policies
The following is a summary of significant accounting policies consistently followed by the fund in preparation of its financial statements. The fund is an investment company and follows accounting and reporting guidance in accordance with accounting principles generally accepted in the United States of America. This may require management to make certain estimates and assumptions at the date of the financial statements. Actual results could differ from these estimates. Management evaluated the impact of events or transactions occurring through the date the financial statements were issued that would merit recognition or disclosure.
Investment Valuations — The fund determines the fair value of its investments and computes its net asset value per share at the close of regular trading (usually 4 p.m. Eastern time) on the New York Stock Exchange (NYSE) on each day the NYSE is open. The Board of Trustees has adopted valuation policies and procedures to guide the investment advisor in the fund’s investment valuation process and to provide methodologies for the oversight of the fund’s pricing function.
Fixed income securities are valued at the evaluated mean as provided by independent pricing services or at the mean of the most recent bid and asked prices as provided by investment dealers. Municipal securities are valued using market models that consider trade data, quotations from dealers and active market makers, relevant yield curve and spread data, creditworthiness, trade data or market information on comparable securities, and other relevant security specific information.
Open-end management investment companies are valued at the reported net asset value per share. Exchange-traded futures contracts are valued at the settlement price as provided by the appropriate clearing corporation.
If the fund determines that the market price for an investment is not readily available or the valuation methods mentioned above do not reflect an investment’s fair value, such investment is valued as determined in good faith by the Board of Trustees or its delegate, in accordance with policies and procedures adopted by the Board of Trustees. In its determination of fair value, the fund may review several factors including, but not limited to, market information regarding the specific investment or comparable investments and correlation with other investment types, futures indices or general market indicators. Circumstances that may cause the fund to use these procedures to value an investment include, but are not limited to: an investment has been declared in default or is distressed; trading in a security has been suspended during the trading day or a security is not actively trading on its principal exchange; prices received from a regular pricing source are deemed unreliable; or there is a foreign market holiday and no trading occurred.
The fund monitors for significant events occurring after the close of an investment’s primary exchange but before the fund’s net asset value per share is determined. Significant events may include, but are not limited to: corporate announcements and transactions; governmental action and political unrest that could impact a specific investment or an investment sector; or armed conflicts, natural disasters and similar events that could affect investments in a specific country or region.
Security Transactions — Security transactions are accounted for as of the trade date. Net realized gains and losses are determined on the identified cost basis, which is also used for federal income tax purposes.
Investment Income — Interest income is recorded on the accrual basis and includes accretion of discounts and amortization of premiums.
Segregated Assets — In accordance with the 1940 Act, the fund segregates assets on its books and records to cover certain types of investments, including, but not limited to, futures contracts and when-issued securities. American Century Investment Management, Inc. (ACIM) (the investment advisor) monitors, on a daily basis, the securities segregated to ensure the fund designates a sufficient amount of liquid assets, marked-to-market daily. The fund may also receive assets or be required to pledge assets at the custodian bank or with a broker for margin requirements on futures contracts.
Income Tax Status — It is the fund’s policy to distribute substantially all net investment income and net realized gains to shareholders and to otherwise qualify as a regulated investment company under provisions of the Internal Revenue Code. Accordingly, no provision has been made for income taxes. The fund files U.S. federal, state, local and non-U.S. tax returns as applicable. The fund's tax returns are subject to examination by the relevant taxing authority until expiration of the applicable statute of limitations, which is generally three years from the date of filing but can be longer in certain jurisdictions. At this time, management believes there are no uncertain tax positions which, based on their technical merit, would not be sustained upon examination and for which it is reasonably possible that the total amounts of unrecognized tax benefits will significantly change in the next twelve months.
Multiple Class — All shares of the fund represent an equal pro rata interest in the net assets of the class to which such shares belong, and have identical voting, dividend, liquidation and other rights and the same terms and conditions, except for class specific expenses and exclusive rights to vote on matters affecting only individual classes. Income, non-class specific expenses, and realized and unrealized capital gains and losses of the fund are allocated to each class of shares based on their relative net assets.
Distributions to Shareholders — Distributions from net investment income, if any, are declared daily and paid monthly. Distributions from net realized gains, if any, are generally declared and paid annually.
Indemnifications — Under the trust’s organizational documents, its officers and trustees are indemnified against certain liabilities arising out of the performance of their duties to the fund. In addition, in the normal course of business, the fund enters into contracts that provide general indemnifications. The maximum exposure under these arrangements is unknown as this would involve future claims that may be made against a fund. The risk of material loss from such claims is considered by management to be remote.
3. Fees and Transactions with Related Parties
Certain officers and trustees of the trust are also officers and/or directors of American Century Companies, Inc. (ACC). The trust's investment advisor, ACIM, the trust's distributor, American Century Investment Services, Inc. (ACIS), and the trust's transfer agent, American Century Services, LLC, are wholly owned, directly or indirectly, by ACC.
Management Fees — The trust has entered into a management agreement with ACIM, under which ACIM provides the fund with investment advisory and management services in exchange for a single, unified management fee (the fee) per class. The agreement provides that all expenses of managing and operating the fund, except distribution and service fees, brokerage expenses, taxes, interest, fees and expenses of the independent trustees (including legal counsel fees), and extraordinary expenses, will be paid by ACIM. The fee is computed and accrued daily based on each class’s daily net assets and paid monthly in arrears. The fee consists of (1) an Investment Category Fee based on the daily net assets of the fund and certain other accounts managed by the investment advisor that are in the same broad investment category as the fund and (2) a Complex Fee based on the assets of all the funds in the American Century Investments family of funds. The rates for the Investment Category Fee range from 0.1625% to 0.2800%. The rates for the Complex Fee range from 0.2500% to 0.3100% for the Investor Class, A Class and C Class. The rates for the Complex Fee range from 0.0500% to 0.1100% for the Institutional Class. The effective annual management fee for each class for the year ended May 31, 2016 was 0.46% for the Investor Class, A Class and C Class and 0.26% for the Institutional Class.
Distribution and Service Fees — The Board of Trustees has adopted a separate Master Distribution and Individual Shareholder Services Plan for each of the A Class and C Class (collectively the plans), pursuant to Rule 12b-1 of the 1940 Act. The plans provide that the A Class will pay ACIS an annual distribution and service fee of 0.25%. The plans provide that the C Class will pay ACIS an annual distribution and service fee of 1.00%, of which 0.25% is paid for individual shareholder services and 0.75% is paid for distribution services. The fees are computed and accrued daily based on each class’s daily net assets and paid monthly in arrears. The fees are used to pay financial intermediaries for distribution and individual shareholder services. Fees incurred under the plans during the year ended May 31, 2016 are detailed in the Statement of Operations.
Trustees’ Fees and Expenses — The Board of Trustees is responsible for overseeing the investment advisor’s management and operations of the fund. The trustees receive detailed information about the fund and its investment advisor regularly throughout the year, and meet at least quarterly with management of the investment advisor to review reports about fund operations. The fund’s officers do not receive compensation from the fund.
Interfund Transactions — The fund may enter into security transactions with other American Century Investments funds and other client accounts of the investment advisor, in accordance with the 1940 Act rules and procedures adopted by the Board of Trustees. The rules and procedures require, among other things, that these transactions be effected at the independent current market price of the security. During the period, the interfund purchases and sales were $38,860,000 and $30,450,000, respectively.
4. Investment Transactions
Purchases and sales of investment securities, excluding short-term investments, for the year ended May 31, 2016 were $1,066,120,208 and $1,176,239,780, respectively.
5. Capital Share Transactions
Transactions in shares of the fund were as follows (unlimited number of shares authorized):
|
| | | | | | | | | | |
| | Year ended
May 31, 2016 | Year ended May 31, 2015 |
| | Shares | Amount | Shares | Amount |
| Investor Class | | | | |
| Sold | 25,673,146 |
| $ | 293,679,687 |
| 26,427,631 |
| $ | 302,461,859 |
|
| Issued in reinvestment of distributions | 3,218,673 |
| 36,811,671 |
| 3,434,269 |
| 39,309,682 |
|
| Redeemed | (31,746,104 | ) | (362,688,811 | ) | (39,702,795 | ) | (454,522,750 | ) |
| | (2,854,285 | ) | (32,197,453 | ) | (9,840,895 | ) | (112,751,209 | ) |
| Institutional Class | | | | |
| Sold | 37,202,483 |
| 425,080,766 |
| 44,756,588 |
| 511,953,520 |
|
| Issued in reinvestment of distributions | 3,688,901 |
| 42,199,358 |
| 3,590,175 |
| 41,103,949 |
|
| Redeemed | (47,548,158 | ) | (545,525,247 | ) | (32,497,479 | ) | (371,891,886 | ) |
| | (6,656,774 | ) | (78,245,123 | ) | 15,849,284 |
| 181,165,583 |
|
| A Class | | | | |
| Sold | 1,760,497 |
| 20,137,788 |
| 3,806,951 |
| 43,677,589 |
|
| Issued in reinvestment of distributions | 134,297 |
| 1,536,349 |
| 115,268 |
| 1,319,829 |
|
| Redeemed | (1,715,356 | ) | (19,616,783 | ) | (1,807,799 | ) | (20,668,605 | ) |
| | 179,438 |
| 2,057,354 |
| 2,114,420 |
| 24,328,813 |
|
| C Class | | | | |
| Sold | 182,065 |
| 2,079,494 |
| 257,721 |
| 2,944,261 |
|
| Issued in reinvestment of distributions | 17,047 |
| 194,847 |
| 18,449 |
| 211,036 |
|
| Redeemed | (278,379 | ) | (3,178,432 | ) | (340,823 | ) | (3,893,303 | ) |
| | (79,267 | ) | (904,091 | ) | (64,653 | ) | (738,006 | ) |
| Net increase (decrease) | (9,410,888 | ) | $ | (109,289,313 | ) | 8,058,156 |
| $ | 92,005,181 |
|
6. Fair Value Measurements
The fund’s investments valuation process is based on several considerations and may use multiple inputs to determine the fair value of the investments held by the fund. In conformity with accounting principles generally accepted in the United States of America, the inputs used to determine a valuation are classified into three broad levels.
| |
| • | Level 1 valuation inputs consist of unadjusted quoted prices in an active market for identical investments. |
| |
| • | Level 2 valuation inputs consist of direct or indirect observable market data (including quoted prices for comparable investments, evaluations of subsequent market events, interest rates, prepayment speeds, credit risk, etc.). These inputs also consist of quoted prices for identical investments initially expressed in local currencies that are adjusted through translation into U.S. dollars. |
| |
| • | Level 3 valuation inputs consist of unobservable data (including a fund’s own assumptions). |
The level classification is based on the lowest level input that is significant to the fair valuation measurement. The valuation inputs are not necessarily an indication of the risks associated with investing in these securities or other financial instruments. There were no significant transfers between levels during the period.
The following is a summary of the level classifications as of period end. The Schedule of Investments provides additional information on the fund’s portfolio holdings.
|
| | | | | | | | |
| | Level 1 | Level 2 | Level 3 |
| Assets | | | |
| Investment Securities | | | |
| Municipal Securities | — |
| $ | 3,333,745,345 |
| — |
|
| Temporary Cash Investments | $ | 8,072 |
| — |
| — |
|
| | $ | 8,072 |
| $ | 3,333,745,345 |
| — |
|
7. Derivative Instruments
Interest Rate Risk — The fund is subject to interest rate risk in the normal course of pursuing its investment objectives. The value of bonds generally declines as interest rates rise. A fund may enter into futures contracts based on a bond index or a specific underlying security. A fund may purchase futures contracts to gain exposure to increases in market value or sell futures contracts to protect against a decline in market value. Upon entering into a futures contract, a fund will segregate cash, cash equivalents or other appropriate liquid securities on its records in amounts sufficient to meet requirements. Subsequent payments (variation margin) are made or received daily, in cash, by a fund. The variation margin is equal to the daily change in the contract value and is recorded as unrealized gains and losses. A fund recognizes a realized gain or loss when the futures contract is closed or expires. Net realized and unrealized gains or losses occurring during the holding period of futures contracts are a component of net realized gain (loss) on futures contract transactions and change in net unrealized appreciation (depreciation) on futures contracts, respectively. One of the risks of entering into futures contracts is the possibility that the change in value of the contract may not correlate with the changes in value of the underlying securities. The fund's average exposure to interest rate risk derivative instruments held during the period was 270 contracts.
At period end, the fund did not have any derivative instruments disclosed on the Statement of Assets and Liabilities. For the year ended May 31, 2016, the effect of interest rate risk derivative instruments on the Statement of Operations was $569,130 in net realized gain (loss) on futures contract transactions and $390,823 in change in net unrealized appreciation (depreciation) on futures contracts.
8. Federal Tax Information
The tax character of distributions paid during the years ended May 31, 2016 and May 31, 2015 were as follows:
|
| | | | | | |
| | 2016 | 2015 |
| Distributions Paid From | | |
| Exempt income | $ | 89,758,399 |
| $ | 91,722,751 |
|
| Long-term capital gains | — |
| — |
|
The book-basis character of distributions made during the year from net investment income or net realized gains may differ from their ultimate characterization for federal income tax purposes. These differences reflect the differing character of certain income items and net realized gains and losses for financial statement and tax purposes, and may result in reclassification among certain capital accounts on the financial statements.
As of May 31, 2016, the federal tax cost of investments and the components of distributable earnings on a tax-basis were as follows: |
| | | |
| Federal tax cost of investments | $ | 3,142,135,335 |
|
| Gross tax appreciation of investments | $ | 193,982,713 |
|
| Gross tax depreciation of investments | (2,364,631 | ) |
| Net tax appreciation (depreciation) of investments | 191,618,082 |
|
| Net tax appreciation (depreciation) on derivatives | — |
|
| Net tax appreciation (depreciation) | $ | 191,618,082 |
|
| Other book-to-tax adjustments | $ | (364,064 | ) |
| Undistributed exempt income | — |
|
| Accumulated short-term capital losses | $ | (24,325,973 | ) |
| Accumulated long-term capital losses | $ | (12,923,430 | ) |
The cost of investments for federal income tax purposes was the same as the cost for financial reporting purposes. Other book-to-tax adjustments are attributable primarily to the tax deferral of losses on straddle positions.
Accumulated capital losses represent net capital loss carryovers that may be used to offset future realized capital gains for federal income tax purposes. The capital loss carryovers may be carried forward for an unlimited period. Future capital loss carryover utilization in any given year may be subject to Internal Revenue Code limitations.
|
| | | | | | | | | | | | | | | |
| For a Share Outstanding Throughout the Years Ended May 31 (except as noted) | | | | | |
| Per-Share Data | | | | | | Ratios and Supplemental Data | | |
| | | Income From Investment Operations: | Distributions From: | | | Ratio to Average Net Assets of: | | |
| | Net Asset
Value,
Beginning
of Period | Net
Investment
Income
(Loss)(1) | Net
Realized
and
Unrealized
Gain (Loss) | Total From
Investment
Operations | Net
Investment
Income | Net
Realized
Gains | Total
Distributions | Net Asset
Value,
End
of Period | Total
Return(2) | Operating
Expenses | Net
Investment
Income
(Loss) | Portfolio
Turnover
Rate | Net
Assets,
End of
Period (in thousands) |
| Investor Class | | | | | | | | | | | |
| 2016 | $11.33 | 0.29 | 0.23 | 0.52 | (0.29) | — | (0.29) | $11.56 | 4.66% | 0.47% | 2.55% | 32% |
| $1,624,065 |
|
| 2015 | $11.45 | 0.30 | (0.12) | 0.18 | (0.30) | — | (0.30) | $11.33 | 1.59% | 0.47% | 2.64% | 34% |
| $1,624,982 |
|
| 2014 | $11.61 | 0.29 | (0.12) | 0.17 | (0.29) | (0.04) | (0.33) | $11.45 | 1.55% | 0.47% | 2.61% | 41% |
| $1,753,597 |
|
| 2013 | $11.63 | 0.29 | (0.01) | 0.28 | (0.29) | (0.01) | (0.30) | $11.61 | 2.43% | 0.47% | 2.44% | 58% |
| $2,040,120 |
|
| 2012 | $11.06 | 0.33 | 0.57 | 0.90 | (0.33) | — | (0.33) | $11.63 | 8.28% | 0.47% | 2.91% | 62% |
| $1,963,542 |
|
| Institutional Class | | | | | | | | | | |
| 2016 | $11.34 | 0.31 | 0.22 | 0.53 | (0.31) | — | (0.31) | $11.56 | 4.77% | 0.27% | 2.75% | 32% |
| $1,633,080 |
|
| 2015 | $11.45 | 0.32 | (0.11) | 0.21 | (0.32) | — | (0.32) | $11.34 | 1.89% | 0.27% | 2.84% | 34% |
| $1,676,931 |
|
| 2014 | $11.61 | 0.32 | (0.12) | 0.20 | (0.32) | (0.04) | (0.36) | $11.45 | 1.76% | 0.27% | 2.81% | 41% |
| $1,511,995 |
|
| 2013 | $11.64 | 0.31 | (0.02) | 0.29 | (0.31) | (0.01) | (0.32) | $11.61 | 2.55% | 0.27% | 2.64% | 58% |
| $1,939,174 |
|
| 2012 | $11.06 | 0.35 | 0.59 | 0.94 | (0.36) | — | (0.36) | $11.64 | 8.59% | 0.27% | 3.11% | 62% |
| $1,447,044 |
|
|
| | | | | | | | | | | | | | | |
| For a Share Outstanding Throughout the Years Ended May 31 (except as noted) | | | | | |
| Per-Share Data | | | | | | Ratios and Supplemental Data | | |
| | | Income From Investment Operations: | Distributions From: | | | Ratio to Average Net Assets of: | | |
| | Net Asset
Value,
Beginning
of Period | Net
Investment
Income
(Loss)(1) | Net
Realized
and
Unrealized
Gain (Loss) | Total From
Investment
Operations | Net
Investment
Income | Net
Realized
Gains | Total
Distributions | Net Asset
Value,
End
of Period | Total
Return(2) | Operating
Expenses | Net
Investment
Income
(Loss) | Portfolio
Turnover
Rate | Net
Assets,
End of
Period (in thousands) |
| A Class | | | | | | | | | | |
| 2016 | $11.34 | 0.26 | 0.22 | 0.48 | (0.26) | — | (0.26) | $11.56 | 4.30% | 0.72% | 2.30% | 32% |
| $70,224 |
|
| 2015 | $11.45 | 0.27 | (0.11) | 0.16 | (0.27) | — | (0.27) | $11.34 | 1.43% | 0.72% | 2.39% | 34% |
| $66,830 |
|
| 2014 | $11.61 | 0.27 | (0.12) | 0.15 | (0.27) | (0.04) | (0.31) | $11.45 | 1.30% | 0.72% | 2.36% | 41% |
| $43,283 |
|
| 2013 | $11.64 | 0.26 | (0.02) | 0.24 | (0.26) | (0.01) | (0.27) | $11.61 | 2.09% | 0.72% | 2.19% | 58% |
| $78,349 |
|
| 2012 | $11.06 | 0.30 | 0.59 | 0.89 | (0.31) | — | (0.31) | $11.64 | 8.11% | 0.72% | 2.66% | 62% |
| $65,158 |
|
| C Class | | | | | | | | | | |
| 2016 | $11.33 | 0.18 | 0.22 | 0.40 | (0.18) | — | (0.18) | $11.55 | 3.53% | 1.47% | 1.55% | 32% |
| $16,425 |
|
| 2015 | $11.44 | 0.19 | (0.11) | 0.08 | (0.19) | — | (0.19) | $11.33 | 0.67% | 1.47% | 1.64% | 34% |
| $17,005 |
|
| 2014 | $11.60 | 0.18 | (0.12) | 0.06 | (0.18) | (0.04) | (0.22) | $11.44 | 0.54% | 1.47% | 1.61% | 41% |
| $17,912 |
|
| 2013 | $11.63 | 0.17 | (0.02) | 0.15 | (0.17) | (0.01) | (0.18) | $11.60 | 1.33% | 1.47% | 1.44% | 58% |
| $25,592 |
|
| 2012 | $11.05 | 0.22 | 0.58 | 0.80 | (0.22) | — | (0.22) | $11.63 | 7.30% | 1.47% | 1.91% | 62% |
| $19,155 |
|
|
| | | | |
| Notes to Financial Highlights | | |
| |
| (1) | Computed using average shares outstanding throughout the period. |
| |
| (2) | Total returns are calculated based on the net asset value of the last business day and do not reflect applicable sales charges, if any. Total returns for periods less than one year are not annualized. |
See Notes to Financial Statements.
|
|
| Report of Independent Registered Public Accounting Firm |
To the Trustees of the American Century Municipal Trust and Shareholders of the Intermediate-Term Tax-Free Bond Fund:
In our opinion, the accompanying statement of assets and liabilities, including the schedule of investments, and the related statements of operations and of changes in net assets and the financial highlights present fairly, in all material respects, the financial position of the Intermediate-Term Tax-Free Bond Fund (one of the four funds comprising the American Century Municipal Trust, hereafter referred to as the "Fund") at May 31, 2016, the results of its operations for the year then ended, the changes in its net assets for each of the two years in the period then ended and the financial highlights for each of the five years in the period then ended, in conformity with accounting principles generally accepted in the United States of America. These financial statements and financial highlights (hereafter referred to as "financial statements") are the responsibility of the Fund's management. Our responsibility is to express an opinion on these financial statements based on our audits. We conducted our audits of these financial statements in accordance with the standards of the Public Company Accounting Oversight Board (United States). Those standards require that we plan and perform the audit to obtain reasonable assurance about whether the financial statements are free of material misstatement. An audit includes examining, on a test basis, evidence supporting the amounts and disclosures in the financial statements, assessing the accounting principles used and significant estimates made by management, and evaluating the overall financial statement presentation. We believe that our audits, which included confirmation of securities at May 31, 2016 by correspondence with the custodian and brokers, provide a reasonable basis for our opinion.
PricewaterhouseCoopers LLP
Kansas City, Missouri
July 22, 2016
Board of Trustees
The individuals listed below serve as trustees of the funds. Each trustee will continue to serve in this capacity until death, retirement, resignation or removal from office. The board has adopted a mandatory retirement age for trustees who are not “interested persons,” as that term is defined in the Investment Company Act (independent trustees). Independent trustees shall retire on December 31 of the year in which they reach their 75th birthday; provided, however, that on or after January 1, 2022, independent trustees shall retire on December 31 of the year in which they reach their 76th birthday.
Mr. Thomas is an “interested person” because he currently serves as President and Chief Executive Officer of American Century Companies, Inc. (ACC), the parent company of American Century Investment Management, Inc. (ACIM or the advisor). The other trustees (more than three-fourths of the total number) are independent. They are not employees, directors or officers of, and have no financial interest in, ACC or any of its wholly owned, direct or indirect, subsidiaries, including ACIM, American Century Investment Services, Inc. (ACIS) and American Century Services, LLC (ACS), and they do not have any other affiliations, positions or relationships that would cause them to be considered “interested persons” under the Investment Company Act. The trustees serve in this capacity for eight (in the case of Mr. Thomas, 15) registered investment companies in the American Century Investments family of funds.
The following table presents additional information about the trustees. The mailing address for each trustee other than Mr. Thomas is 1665 Charleston Road, Mountain View, California 94043. The mailing address for Mr. Thomas is 4500 Main Street, Kansas City, Missouri 64111.
|
| | | | | |
Name (Year of Birth) | Position(s) Held with Funds | Length of Time Served | Principal Occupation(s) During Past 5 Years | Number of American Century Portfolios Overseen by Trustee | Other Directorships Held During Past 5 Years |
| Independent Trustees |
Tanya S. Beder
(1955) | Trustee | Since 2011 | Chairman and CEO, SBCC Group Inc. (independent advisory services) (2006 to present) | 45 | CYS Investments, Inc. (NYSE mortgage arbitrage REIT) |
Jeremy I. Bulow
(1954) | Trustee | Since 2011 | Professor of Economics, Stanford University, Graduate School of Business (1979 to present) | 45 | None |
Anne Casscells
(1958) | Trustee | Since 2016 | Co-Chief Executive Officer and Chief Investment Officer, Aetos Alternatives Management (investment advisory firm) (2001 to present); Lecturer in Accounting, Stanford University, Graduate School of Business (2009 to present) | 45 | None |
|
| | | | | |
Name (Year of Birth) | Position(s) Held with Funds | Length of Time Served | Principal Occupation(s) During Past 5 Years | Number of American Century Portfolios Overseen by Trustee | Other Directorships Held During Past 5 Years |
| Independent Trustees |
Ronald J. Gilson
(1946) | Trustee and Chairman of the Board | Since 1995
(Chairman since 2005) | Charles J. Meyers Professor of Law and Business, Emeritus, Stanford Law School (1979 to present); Marc and Eva Stern Professor of Law and Business, Columbia University School of Law (1992 to present) | 45 | None |
Frederick L. A. Grauer
(1946) | Trustee | Since 2008 | Senior Advisor, iShares by BlackRock, Inc. (investment management firm) (2010 to 2011, 2013 to present); Senior Advisor, Course Hero (an educational technology company) (2015 to present) | 45 | None |
Jonathan D. Levin
(1972) | Trustee | Since 2016 | Holbrook Working Professor of Price Theory, Standford University, (2000 to present); Chair, Department of Economics, Stanford University (2011 to 2014) | 45 | None |
Peter F. Pervere
(1947) | Trustee | Since 2007 | Retired | 45 | None |
John B. Shoven
(1947) | Trustee | Since 2002 | Charles R. Schwab Professor of Economics, Stanford University (1973 to present) | 45 | Cadence Design Systems; Exponent; Financial Engines |
| Interested Trustee |
Jonathan S. Thomas
(1963) | Trustee and President | Since 2007 | President and Chief Executive Officer, ACC (March 2007 to present). Also serves as Chief Executive Officer, ACS; Executive Vice President, ACIM; Director, ACC, ACIM and other ACC subsidiaries | 128 | BioMed Valley Discoveries, Inc. |
The Statement of Additional Information has additional information about the fund's trustees and is available without charge, upon request, by calling 1-800-345-2021.
Officers
The following table presents certain information about the executive officers of the funds. Each officer serves as an officer for each of the 15 investment companies in the American Century family of funds, unless otherwise noted. No officer is compensated for his or her service as an officer of the funds. The listed officers are interested persons of the funds and are appointed or re-appointed on an annual basis. The mailing address for each of the officers listed below is 4500 Main Street, Kansas City, Missouri 64111.
|
| | |
Name (Year of Birth) | Offices with
the Funds | Principal Occupation(s) During the Past Five Years |
Jonathan S.
Thomas
(1963) | Trustee and
President
since 2007 | President and Chief Executive Officer, ACC (March 2007 to present). Also serves as Chief Executive Officer, ACS; Executive Vice President, ACIM; Director, ACC, ACIM and other ACC subsidiaries |
Amy D. Shelton
(1964) | Chief Compliance
Officer and Vice President since 2014 | Chief Compliance Officer, American Century funds, (March 2014 to present); Chief Compliance Officer, ACIM (February 2014 to present); Chief Compliance Officer, ACIS (October 2009 to present); Vice President, Client Interactions and Marketing, ACIS (February 2013 to January 2014); Director, Client Interactions and Marketing, ACIS (June 2007 to January 2013). Also serves as Vice President, ACIS |
Charles A.
Etherington
(1957) | General Counsel
since 2007 and
Senior Vice
President since 2006 | Attorney, ACC (February 1994 to present); Vice President, ACC (November 2005 to present); General Counsel, ACC (March 2007 to present). Also serves as General Counsel, ACIM, ACS, ACIS and other ACC subsidiaries; and Senior Vice President, ACIM and ACS |
C. Jean Wade
(1964) | Vice President,
Treasurer and
Chief Financial
Officer since 2012 | Vice President, ACS (February 2000 to present) |
Robert J.
Leach
(1966) | Vice President
since 2006 and
Assistant Treasurer
since 2012 | Vice President, ACS (February 2000 to present) |
David H.
Reinmiller
(1963) | Vice President
since 2001 | Attorney, ACC (January 1994 to present); Associate General Counsel, ACC (January 2001 to present). Also serves as Vice President, ACIM and ACS |
Ward D.
Stauffer
(1960) | Secretary
since 2005 | Attorney, ACC (June 2003 to present) |
Proxy Voting Policies
Descriptions of the principles and policies that the fund's investment advisor uses in exercising the voting rights associated with the securities purchased and/or held by the fund are available without charge, upon request, by calling 1-800-345-2021 or visiting the "About Us" page of American Century Investments’ website at americancentury.com. A description of the policies is also available on the Securities and Exchange Commission’s website at sec.gov. Information regarding how the investment advisor voted proxies relating to portfolio securities during the most recent 12-month period ended June 30 is available on the "About Us" page at americancentury.com. It is also available at sec.gov.
Quarterly Portfolio Disclosure
The fund files its complete schedule of portfolio holdings with the Securities and Exchange Commission (SEC) for the first and third quarters of each fiscal year on Form N-Q. The fund’s Forms N-Q are available on the SEC’s website at sec.gov, and may be reviewed and copied at the SEC’s Public Reference Room in Washington, DC. Information on the operation of the Public Reference Room may be obtained by calling 1-800-SEC-0330. The fund also makes its complete schedule of portfolio holdings for the most recent quarter of its fiscal year available on its website at americancentury.com and, upon request, by calling 1-800-345-2021.
Other Tax Information
The following information is provided pursuant to provisions of the Internal Revenue Code.
The fund designates $89,828,076 as exempt interest dividends for the fiscal year ended May 31, 2016.
|
| | |
| |
| | | |
| Contact Us | americancentury.com | |
| Automated Information Line | 1-800-345-8765 | |
| Investor Services Representative | 1-800-345-2021 or 816-531-5575 | |
| Investors Using Advisors | 1-800-378-9878 | |
| Business, Not-For-Profit, Employer-Sponsored Retirement Plans | 1-800-345-3533 | |
| Banks and Trust Companies, Broker-Dealers, Financial Professionals, Insurance Companies | 1-800-345-6488 | |
| Telecommunications Relay Service for the Deaf | 711 | |
| | | |
| American Century Municipal Trust | |
| | | |
Investment Advisor: American Century Investment Management, Inc. Kansas City, Missouri | |
| | | |
| This report and the statements it contains are submitted for the general information of our shareholders. The report is not authorized for distribution to prospective investors unless preceded or accompanied by an effective prospectus. | |
| | | |
©2016 American Century Proprietary Holdings, Inc. All rights reserved.
CL-ANN-89436 1607 | |
|
| |
| | |
| | Annual Report |
| | |
| | May 31, 2016 |
| | |
| | Long-Term Tax-Free Fund |
|
| | |
| President’s Letter | 2 |
|
| Performance | 3 |
|
| Portfolio Commentary | |
|
| Fund Characteristics | |
|
| Shareholder Fee Example | |
|
| Schedule of Investments | |
|
| Statement of Assets and Liabilities | |
|
| Statement of Operations | |
|
| Statement of Changes in Net Assets | |
|
| Notes to Financial Statements | |
|
| Financial Highlights | |
|
| Report of Independent Registered Public Accounting Firm | |
|
| Management | |
|
| Additional Information | |
|
Any opinions expressed in this report reflect those of the author as of the date of the report, and do not necessarily represent the opinions of American Century Investments® or any other person in the American Century Investments organization. Any such opinions are subject to change at any time based upon market or other conditions and American Century Investments disclaims any responsibility to update such opinions. These opinions may not be relied upon as investment advice and, because investment decisions made by American Century Investments funds are based on numerous factors, may not be relied upon as an indication of trading intent on behalf of any American Century Investments fund. Security examples are used for representational purposes only and are not intended as recommendations to purchase or sell securities. Performance information for comparative indices and securities is provided to American Century Investments by third party vendors. To the best of American Century Investments’ knowledge, such information is accurate at the time of printing.
|
| |
| Dear Investor:
Thank you for reviewing this annual report for the 12 months ended May 31, 2016. It provides investment performance and portfolio information for the reporting period, plus longer-term historical performance data.
Annual reports help convey information about fund performance, including market and economic factors that affected returns during the reporting period. For additional, updated investment and market insights, we encourage you to visit our website, americancentury.com. |
| Jonathan Thomas |
Municipal Bonds (Munis) Extended Their Outperformance During a Continued Volatile Period
The narrative provided six months ago in our semiannual report letter hasn’t changed much—the key conditions described then extended for another half year. As explained then, widespread concerns about global economic growth sparked sharp financial market volatility. The primary catalyst was China, where slowing economic growth, currency devaluations, and massive monetary policy easing sent shock waves through the global markets. These factors re-emerged in January and early February this year, triggering sell-offs in riskier assets such as stocks and high-yield bonds. In the U.S. stock market, relatively defensive sectors such as utilities, telecommunication services, and consumer discretionary performed best. In the U.S. bond market, high-quality sectors including munis and Treasuries were market leaders.
Consistent with the first six months of the reporting period, munis continued to outperform for the full fiscal year. The broad muni market benefited from its comparatively high overall credit quality, despite defaults in Puerto Rico and financial concerns facing Illinois and New Jersey. We continue to view these as isolated incidents running counter to overall muni credit quality trends. Also, as government bond yields fell globally during the last six months of the reporting period, after-tax muni yields looked attractive, especially for investors in top tax brackets.
We expect many of the factors that kept sovereign bond yields low during the reporting period to persist through the end of the year, keeping U.S. government bond yields range-bound, despite the Federal Reserve’s attempts to raise its interest rate target. We believe those attempts will be muted in the face of continuing global economic, political, and market headwinds. Furthermore, conjecture about Federal Reserve policy and the outcome of the U.S. presidential election, among other factors, could lead to further market volatility, presenting both challenges and opportunities for active investment managers. We continue to believe in a disciplined, diversified, risk-aware investment approach, using professionally managed portfolios to meet financial goals. We appreciate your trust in us.
Sincerely,
Jonathan Thomas
President and Chief Executive Officer
American Century Investments
|
| | | | | |
| Total Returns as of May 31, 2016 | |
| | | | Average Annual Returns | |
| | Ticker Symbol | 1 year | 5 years | 10 years | Inception Date |
| A Class | MMBAX | | | | 3/31/97 |
| No sales charge | | 5.57% | 4.53% | 4.34% | |
| With sales charge | | 0.81% | 3.57% | 3.87% | |
Barclays Municipal Bond Index | — | 5.87% | 5.07% | 4.92% | — |
| Investor Class | ACLVX | 5.74% | 4.79% | 4.60% | 4/3/06 |
| Institutional Class | ACLSX | 6.04% | 5.01% | 4.82% | 4/3/06 |
| C Class | ACTCX | 4.69% | 3.75% | 3.57% | 4/3/06 |
Sales charges include initial sales charges and contingent deferred sales charges (CDSCs), as applicable. A Class shares have a 4.50% maximum initial sales charge and may be subject to a maximum CDSC of 1.00%. C Class shares redeemed within 12 months of purchase are subject to a maximum CDSC of 1.00%. The SEC requires that mutual funds provide performance information net of maximum sales charges in all cases where charges could be applied.
Data presented reflect past performance. Past performance is no guarantee of future results. Current performance may be higher or lower than the performance shown. Total returns for periods less than one year are not annualized. Investment return and principal value will fluctuate, and redemption value may be more or less than original cost. Data assumes reinvestment of dividends and capital gains, and none of the charts reflect the deduction of taxes that a shareholder would pay on fund distributions or the redemption of fund shares. To obtain performance data current to the most recent month end, please call 1-800-345-2021 or visit americancentury.com. For additional information about the fund, please consult the prospectus.
|
|
Growth of $10,000 Over 10 Years |
| $10,000 investment made May 31, 2006 |
| Performance for other share classes will vary due to differences in fee structure. |
|
| |
| Value on May 31, 2016 |
| | A Class — $14,616 |
| |
| | Barclays Municipal Bond Index — $16,174 |
| |
The A Class’s initial investment is $9,550 to reflect the maximum 4.50% initial sales charge.
|
| | | |
Total Annual Fund Operating Expenses |
Investor Class | Institutional Class | A Class | C Class |
| 0.47% | 0.27% | 0.72% | 1.47% |
The total annual fund operating expenses shown is as stated in the fund’s prospectus current as of the date of this report. The prospectus may vary from the expense ratio shown elsewhere in this report because it is based on a different time period, includes acquired fund fees and expenses, and, if applicable, does not include fee waivers or expense reimbursements.
Data presented reflect past performance. Past performance is no guarantee of future results. Current performance may be higher or lower than the performance shown. Total returns for periods less than one year are not annualized. Investment return and principal value will fluctuate, and redemption value may be more or less than original cost. Data assumes reinvestment of dividends and capital gains, and none of the charts reflect the deduction of taxes that a shareholder would pay on fund distributions or the redemption of fund shares. To obtain performance data current to the most recent month end, please call 1-800-345-2021 or visit americancentury.com. For additional information about the fund, please consult the prospectus.
Portfolio Managers: Alan Kruss, Joseph Gotelli, and Steven Permut
Performance Summary
Long-Term Tax-Free returned 5.74%* for the 12 months ended May 31, 2016. By comparison, the Barclays Municipal Bond Index returned 5.87%. Fund returns reflect operating expenses, while index returns do not.
The fund’s return for the reporting period largely reflected the positive overall performance of the municipal bond (muni) market against a backdrop of ongoing capital market volatility. After struggling in June 2015, the broad muni market posted positive monthly gains for the next 11 months, outperforming the U.S. Treasury market and the broad taxable U.S. investment-grade market for the full 12-month period.
Muni Market Dynamics Aided Performance
Investor concerns about global growth (particularly in China), commodity prices, and central bank monetary decisions created a volatile market climate throughout the reporting period. The U.S. economy continued to exhibit modest growth, but the U.S. Federal Reserve (the Fed) remained focused on the sluggish global landscape and its potential risks to the U.S. economy. This triggered ongoing investor speculation regarding the timing and magnitude of interest rate “normalization” from the Fed. This uncertainty contributed to the period’s market volatility. Ultimately, the Fed delayed its much-anticipated 2015 interest rate hike until the final month of the year, lifting the range for its benchmark short-term interest rate 25 basis points (1 basis point equals 0.01%) to 0.25%-0.50% on December 16. The new year ushered in a fresh round of global growth worries and a severe equity market sell-off. The Fed took an anticipated first-quarter rate hike off the table, and investors gradually curtailed their expectations for additional rate hikes in 2016. The Fed held rates steady through the end of the reporting period, citing concerns about the health of the global economy and weaker-than-expected first-quarter U.S. economic growth as reasons to pursue a “lower for longer” rate strategy. Meanwhile, central banks in Europe, Japan, and China continued to cut interest rates and implement other aggressive stimulus programs in response to weak growth rates and the threat of deflation in those regions.
This environment generally led to positive performance for U.S. Treasuries and most U.S. bond market sectors. Yields on the 10-year Treasury note and the 30-year Treasury bond declined 27 basis points and 23 basis points, respectively, while the yield on the Fed policy-sensitive two-year Treasury note increased 27 basis points. Munis generally tracked the U.S. Treasury market, but factors specific to the municipal market helped munis outperform. In particular, supply and demand dynamics remained favorable, which supported gains. Other than an increase in muni supply early in the period (as issuers rushed to issue or refinance debt ahead of the Fed’s rate hike), supply declined modestly for the period overall. At the same time, demand for munis remained robust due to the tax advantages and perceived “safe-haven” munis offered investors. As of May 31, 2016, muni funds experienced 34 consecutive weeks of positive flows, according to Lipper Inc.
Overall, all major sectors of the muni bond market posted positive returns for the 12-month period. Longer-maturity and higher-quality munis generally performed better than shorter-maturity and lower-quality securities, and revenue bonds outperformed GO (general obligation) bonds.
* All fund returns referenced in this commentary are for Investor Class shares. Performance for other share classes will vary due to differences in fee structure; when Investor Class performance exceeds that of the fund's benchmark, other share classes may not. See page 3 for returns for all share classes.
Market Fundamentals Remained Positive Despite Isolated Credit Events
Despite negative credit events for specific issuers in Puerto Rico, Chicago, New Jersey, and other relatively isolated entities, muni market fundamentals generally remained positive and continued to provide support to the broad market. We believe the main problems facing these issuers are due largely to their own individual circumstances and are not indicative of any particular systemic municipal market problem.
From a broad fiscal standpoint, state and local finances across the U.S. remained relatively healthy during the reporting period, even as revenue growth slowed largely due to weak stock market returns. However, spending restraint has enabled most states to maintain stable credit profiles. From a credit rating perspective, muni credit-rating upgrades continued to slightly outpace downgrades, and the muni default rate remained low. We continue to believe it’s unlikely any states will default, but select, isolated state, local, and commonwealth credit ratings may be pressured by special circumstances.
Security Selection Aided Performance; Yield Curve Positioning Led to Mixed Results
In terms of sector exposure, we continued to favor revenue bonds versus GO bonds. This positioning aided portfolio performance. Within the revenue bond sector, we continued to overweight hospital, transportation (mainly airports and toll roads), and water and sewer bonds. Geographically, we decreased exposure to Connecticut, Louisiana, Pennsylvania, and New Jersey issuers. We added small positions in Chicago water and wastewater bonds and sold a position in Chicago motor fuel tax bonds. Furthermore, as of May 31, 2016, the portfolio had no exposure to troubled munis issued by the Chicago Board of Education or Puerto Rico.
Meanwhile, our positioning along the yield curve generated mixed results. Early in the period, rate-hike speculation caused longer-maturity yields to increase at a greater pace than shorter-maturity yields, and the muni yield curve steepened. In this environment, the portfolio’s exposure to the longer end of the yield curve weighed on performance. But as the period progressed and additional short-term rate hikes from the Fed became less likely in the near term, yields declined across the curve, particularly at the longer end. The yield curve flattened, and the portfolio’s exposure to longer-maturity yields lifted results.
Market Volatility Likely to Persist
Looking ahead, we believe U.S. economic fundamentals eventually will prompt the Fed to resume interest-rate normalization. But weaker global economic fundamentals, U.S. dollar strength, and geopolitical risks may delay Fed action and keep rates range-bound. We expect market volatility to persist as investors await additional Fed comments and action on short-term interest rates. Volatility also is likely to escalate as the U.S. presidential campaign heats up and the candidates debate tax and other policies prior to the November election. Mounting market volatility may cause credit spreads (the yield differential between high-quality and low-quality munis of similar maturity) to widen, which may present compelling buying opportunities among lower-quality credits. In this environment, we believe fundamental credit research, active management, and security selection will become increasingly important.
|
| |
| MAY 31, 2016 | |
Portfolio at a Glance | |
| Weighted Average Maturity | 15.4 years |
| Average Duration (Modified) | 4.6 years |
| | |
Top Five States and Territories | % of net assets |
| California | 21.5% |
| New York | 20.8% |
| Texas | 7.9% |
| New Jersey | 5.2% |
| Illinois | 4.9% |
| | |
Top Five Sectors | % of fund investments |
| Hospital | 14% |
| Tollroads | 11% |
| Prerefunded | 10% |
| General Obligation (GO) - State | 10% |
| Lease Revenue | 8% |
| | |
Types of Investments in Portfolio | % of net assets |
| Municipal Securities | 98.2% |
| Temporary Cash Investments | —* |
| Other Assets and Liabilities | 1.8% |
*Category is less than 0.05% of total net assets.
Fund shareholders may incur two types of costs: (1) transaction costs, including sales charges (loads) on purchase payments and redemption/exchange fees; and (2) ongoing costs, including management fees; distribution and service (12b-1) fees; and other fund expenses. This example is intended to help you understand your ongoing costs (in dollars) of investing in your fund and to compare these costs with the ongoing cost of investing in other mutual funds.
The example is based on an investment of $1,000 made at the beginning of the period and held for the entire period from December 1, 2015 to May 31, 2016.
Actual Expenses
The table provides information about actual account values and actual expenses for each class. You may use the information, together with the amount you invested, to estimate the expenses that you paid over the period. First, identify the share class you own. Then simply divide your account value by $1,000 (for example, an $8,600 account value divided by $1,000 = 8.6), then multiply the result by the number under the heading “Expenses Paid During Period” to estimate the expenses you paid on your account during this period.
If you hold Investor Class shares of any American Century Investments fund, or Institutional Class shares of the American Century Diversified Bond Fund, in an American Century Investments account (i.e., not a financial intermediary or retirement plan account), American Century Investments may charge you a $12.50 semiannual account maintenance fee if the value of those shares is less than $10,000. We will redeem shares automatically in one of your accounts to pay the $12.50 fee. In determining your total eligible investment amount, we will include your investments in all personal accounts (including American Century Investments Brokerage accounts) registered under your Social Security number. Personal accounts include individual accounts, joint accounts, UGMA/UTMA accounts, personal trusts, Coverdell Education Savings Accounts and IRAs (including traditional, Roth, Rollover, SEP-, SARSEP- and SIMPLE-IRAs), and certain other retirement accounts. If you have only business, business retirement, employer-sponsored or American Century Investments Brokerage accounts, you are currently not subject to this fee. If you are subject to the Account Maintenance Fee, your account value could be reduced by the fee amount.
Hypothetical Example for Comparison Purposes
The table also provides information about hypothetical account values and hypothetical expenses based on the actual expense ratio of each class of your fund and an assumed rate of return of 5% per year before expenses, which is not the actual return of a fund’s share class. The hypothetical account values and expenses may not be used to estimate the actual ending account balance or expenses you paid for the period. You may use this information to compare the ongoing costs of investing in your fund and other funds. To do so, compare this 5% hypothetical example with the 5% hypothetical examples that appear in the shareholder reports of the other funds.
Please note that the expenses shown in the table are meant to highlight your ongoing costs only and do not reflect any transactional costs, such as sales charges (loads) or redemption/exchange fees. Therefore, the table is useful in comparing ongoing costs only, and will not help you determine the relative total costs of owning different funds. In addition, if these transactional costs were included, your costs would have been higher.
|
| | | | |
| | Beginning
Account Value
12/1/15 | Ending
Account Value
5/31/16 | Expenses Paid
During Period(1)
12/1/15 - 5/31/16 | Annualized Expense Ratio(1) |
Actual |
| Investor Class | $1,000 | $1,036.20 | $2.39 | 0.47% |
| Institutional Class | $1,000 | $1,038.10 | $1.38 | 0.27% |
| A Class | $1,000 | $1,034.90 | $3.66 | 0.72% |
| C Class | $1,000 | $1,031.00 | $7.46 | 1.47% |
Hypothetical |
| Investor Class | $1,000 | $1,022.65 | $2.38 | 0.47% |
| Institutional Class | $1,000 | $1,023.65 | $1.37 | 0.27% |
| A Class | $1,000 | $1,021.40 | $3.64 | 0.72% |
| C Class | $1,000 | $1,017.65 | $7.41 | 1.47% |
| |
| (1) | Expenses are equal to the class's annualized expense ratio listed in the table above, multiplied by the average account value over the period, multiplied by 183, the number of days in the most recent fiscal half-year, divided by 366, to reflect the one-half year period. |
MAY 31, 2016
|
| | | | | | |
| | Principal Amount | Value |
| MUNICIPAL SECURITIES — 98.2% | | |
| Arizona — 2.5% | | |
| Arizona Health Facilities Authority Rev., (Banner Health Obligated Group), 5.00%, 1/1/25 | $ | 20,000 |
| $ | 25,033 |
|
| Mesa Rev., 5.00%, 7/1/27 | 100,000 |
| 104,321 |
|
| Mohave County Industrial Development Authority Rev., (Mohave Prison LLC), 8.00%, 5/1/25 | 200,000 |
| 224,190 |
|
| Phoenix Civic Improvement Corp. Rev., 5.00%, 7/1/22 | 25,000 |
| 30,320 |
|
| Phoenix Civic Improvement Corp. Rev., 5.50%, 7/1/24 | 250,000 |
| 274,090 |
|
| Phoenix Civic Improvement Corp. Rev., 5.00%, 7/1/40 | 50,000 |
| 56,313 |
|
| Salt River Project Agricultural Improvement & Power District Rev., 5.00%, 1/1/39 | 340,000 |
| 372,307 |
|
University Medical Center Corp. Rev., 6.50%, 7/1/19, Prerefunded at 100% of Par(1) | 300,000 |
| 349,824 |
|
| | | 1,436,398 |
|
| Arkansas — 0.4% | | |
| Pulaski County Public Facilities Board Rev., (Baptist Health Obligated Group), 5.00%, 12/1/42 | 200,000 |
| 231,358 |
|
| California — 21.5% | | |
Alameda Corridor Transportation Authority Rev., 0.00%, 10/1/32 (NATL)(2) | 440,000 |
| 255,121 |
|
| Anaheim Public Financing Authority Rev., 5.25%, 10/1/34 | 200,000 |
| 222,630 |
|
| Anaheim Public Financing Authority Rev., 5.00%, 5/1/46 | 300,000 |
| 354,267 |
|
Bay Area Toll Authority Rev., 5.125%, 4/1/19, Prerefunded at 100% of Par(1) | 200,000 |
| 223,406 |
|
| Bay Area Toll Authority Rev., VRDN, 1.50%, 4/2/18 | 30,000 |
| 30,250 |
|
| California Health Facilities Financing Authority Rev., (Cedars-Sinai Medical Center), 5.00%, 11/15/32 | 100,000 |
| 123,785 |
|
| California Health Facilities Financing Authority Rev., (Dignity Health Obligated Group), 6.00%, 7/1/39 | 300,000 |
| 343,065 |
|
California Health Facilities Financing Authority Rev., (Providence Health & Services Obligated Group), 6.50%, 10/1/18, Prerefunded at 100% of Par(1) | 10,000 |
| 11,331 |
|
California Health Facilities Financing Authority Rev., (Providence Health & Services Obligated Group), 6.50%, 10/1/18, Prerefunded at 100% of Par(1) | 245,000 |
| 277,612 |
|
| California Health Facilities Financing Authority Rev., (Scripps Health Obligated Group), 5.00%, 11/15/40 | 200,000 |
| 227,756 |
|
| California Health Facilities Financing Authority Rev., (St. Joseph Health System Obligated Group), 5.00%, 7/1/37 | 35,000 |
| 41,094 |
|
| California Health Facilities Financing Authority Rev., (Sutter Health Obligated Group), 5.25%, 8/15/31 | 150,000 |
| 181,155 |
|
| California Infrastructure & Economic Development Bank Rev., (Academy of Motion Picture Arts and Sciences Obligated Group), 5.00%, 11/1/41 | 10,000 |
| 11,846 |
|
| California Municipal Finance Authority Rev., (Community Hospitals of Central California Obligated Group), 5.00%, 2/1/27 | 250,000 |
| 301,682 |
|
California State Public Works Board Rev., 5.00%, 9/1/22, Prerefunded at 100% of Par(1) | 100,000 |
| 122,487 |
|
| California State Public Works Board Rev., 5.00%, 5/1/27 | 200,000 |
| 249,518 |
|
|
| | | | | | |
| | Principal Amount | Value |
| California State Public Works Board Rev., 5.00%, 12/1/31 | $ | 250,000 |
| $ | 297,045 |
|
| California State Public Works Board Rev., 5.00%, 4/1/37 | 320,000 |
| 370,880 |
|
California State University Rev., 5.25%, 5/1/19, Prerefunded at 100% of Par(1) | 300,000 |
| 338,115 |
|
| California Statewide Communities Development Authority Rev., (Kaiser Credit Group), 5.00%, 4/1/42 | 400,000 |
| 461,816 |
|
Chaffey Community College District GO, 5.00%, 6/1/17, Prerefunded at 100% of Par (NATL)(1) | 265,000 |
| 276,745 |
|
Clovis Unified School District GO, Capital Appreciation, 0.00%, 8/1/29 (NATL)(2) | 300,000 |
| 206,349 |
|
Foothill-Eastern Transportation Corridor Agency Rev., Capital Appreciation, 0.00%, 1/15/33(2) | 150,000 |
| 78,102 |
|
| Foothill-Eastern Transportation Corridor Agency Rev., 6.00%, 1/15/49 | 100,000 |
| 119,324 |
|
| Foothill-Eastern Transportation Corridor Agency Rev., VRDN, 5.50%, 1/15/23 | 100,000 |
| 118,895 |
|
| Golden State Tobacco Securitization Corp. Rev., 5.00%, 6/1/30 | 100,000 |
| 119,116 |
|
| Inland Valley Development Agency Tax Allocation, 5.00%, 9/1/44 | 200,000 |
| 228,062 |
|
| Los Angeles Department of Airports Rev., 5.00%, 5/15/40 | 120,000 |
| 136,458 |
|
| Los Angeles Department of Water Rev., 5.00%, 7/1/36 | 150,000 |
| 172,451 |
|
| Los Angeles Department of Water & Power Rev., 5.25%, 7/1/38 | 400,000 |
| 434,788 |
|
| Metropolitan Water District of Southern California Rev., 5.00%, 7/1/35 | 100,000 |
| 112,816 |
|
| Northern California Power Agency Rev., 5.25%, 7/1/24 | 200,000 |
| 226,038 |
|
| Oakland Unified School District/Alameda County GO, 6.625%, 8/1/38 | 50,000 |
| 61,140 |
|
| Oakland Unified School District/Alameda County GO, 5.00%, 8/1/40 | 100,000 |
| 116,706 |
|
| Palomar Health COP, 6.00%, 11/1/41 | 250,000 |
| 267,543 |
|
Poway Unified School District GO, Capital Appreciation, 0.00%, 8/1/33(2) | 250,000 |
| 147,310 |
|
Poway Unified School District GO, Capital Appreciation, 0.00%, 8/1/41(2) | 500,000 |
| 214,510 |
|
| Riverside County Transportation Commission Rev., 5.25%, 6/1/39 | 200,000 |
| 245,044 |
|
| San Buenaventura Rev., (Community Memorial Health System), 7.50%, 12/1/41 | 100,000 |
| 123,660 |
|
| San Diego County Regional Transportation Commission Rev., 5.00%, 4/1/48 | 150,000 |
| 175,470 |
|
| San Diego Public Facilities Financing Authority Rev., 5.00%, 10/15/44 | 100,000 |
| 119,846 |
|
| San Diego Public Facilities Financing Authority Water Rev., 5.00%, 8/1/23 | 70,000 |
| 81,250 |
|
San Diego Unified School District GO, Capital Appreciation, 0.00%, 7/1/30(2) | 200,000 |
| 131,312 |
|
| San Joaquin Hills Transportation Corridor Agency Rev., 5.00%, 1/15/29 | 100,000 |
| 113,870 |
|
| State of California GO, 5.00%, 9/1/25 | 150,000 |
| 164,090 |
|
| State of California GO, 5.625%, 4/1/26 | 500,000 |
| 565,940 |
|
| State of California GO, 5.00%, 12/1/26 | 200,000 |
| 248,316 |
|
| State of California GO, 5.75%, 4/1/27 | 500,000 |
| 567,680 |
|
| State of California GO, 5.00%, 2/1/28 (Ambac) | 335,000 |
| 438,629 |
|
| State of California GO, 5.75%, 4/1/28 | 500,000 |
| 567,985 |
|
| State of California GO, 5.25%, 9/1/28 | 200,000 |
| 239,850 |
|
| State of California GO, 5.00%, 10/1/41 | 100,000 |
| 117,313 |
|
|
| | | | | | |
| | Principal Amount | Value |
| State of California GO, 5.00%, 2/1/43 | $ | 250,000 |
| $ | 294,535 |
|
| State of California GO, VRN, 1.55%, 6/2/16 | 200,000 |
| 203,092 |
|
| State of California Department of Water Resources Power Supply Rev., 5.00%, 5/1/21 | 240,000 |
| 284,930 |
|
| Successor Agency to the Richmond County Redevelopment Agency Tax Allocation, 4.00%, 9/1/16 (BAM) | 10,000 |
| 10,081 |
|
| Successor Agency to the Richmond County Redevelopment Agency Tax Allocation, 4.00%, 9/1/17 (BAM) | 5,000 |
| 5,190 |
|
| Successor Agency to the Richmond County Redevelopment Agency Tax Allocation, 4.00%, 9/1/18 (BAM) | 10,000 |
| 10,636 |
|
| Tuolumne Wind Project Authority Rev., 5.875%, 1/1/29 | 250,000 |
| 281,618 |
|
| | | 12,471,551 |
|
| Colorado — 3.5% | | |
| City & County of Denver Airport System Rev., 5.00%, 11/15/25 | 250,000 |
| 303,238 |
|
| City & County of Denver Airport System Rev., 5.00%, 11/15/43 | 100,000 |
| 115,437 |
|
| Colorado Health Facilities Authority Rev., (Catholic Health Initiatives), 6.25%, 10/1/33 | 240,000 |
| 268,303 |
|
| Colorado Health Facilities Authority Rev., (Covenant Retirement Communities Obligated Group), 5.00%, 12/1/35 | 250,000 |
| 283,380 |
|
| Colorado Health Facilities Authority Rev., (Valley View Hospital Association), 5.00%, 5/15/45 | 80,000 |
| 92,585 |
|
| Denver Health & Hospital Authority Rev., 5.00%, 12/1/39 | 200,000 |
| 223,624 |
|
| E-470 Public Highway Authority Rev., VRDN, 1.58%, 6/2/16 | 150,000 |
| 149,655 |
|
| Park Creek Metropolitan District Tax Allocation, 5.00%, 12/1/45 | 115,000 |
| 131,336 |
|
| Regional Transportation District Rev., (Denver Transit Partners LLC), 6.00%, 1/15/41 | 220,000 |
| 254,885 |
|
University of Colorado Rev., 5.25%, 6/1/19, Prerefunded at 100% of Par(1) | 200,000 |
| 225,620 |
|
| | | 2,048,063 |
|
| Connecticut — 0.1% | | |
| State of Connecticut, Special Tax Rev., 5.00%, 8/1/28 | 30,000 |
| 37,074 |
|
| Delaware — 0.2% | | |
New County Castle GO, 5.00%, 7/15/18, Prerefunded at 100% of Par(1) | 100,000 |
| 108,865 |
|
| District of Columbia — 1.3% | | |
| District of Columbia Rev., 5.00%, 12/1/36 | 300,000 |
| 352,230 |
|
| Washington Metropolitan Area Transit Authority Rev., 5.00%, 7/1/17 | 400,000 |
| 418,040 |
|
| | | 770,270 |
|
| Florida — 4.8% | | |
| Brevard County Health Facilities Authority Rev., (Health First, Inc. Obligated Group), 5.00%, 4/1/39 | 250,000 |
| 286,260 |
|
| Broward County Airport System Rev., 5.00%, 10/1/24 | 100,000 |
| 119,202 |
|
| Central Florida Expressway Authority Rev., 5.00%, 7/1/40 | 85,000 |
| 95,912 |
|
| Florida's Turnpike Enterprise Rev., 5.00%, 7/1/27 | 100,000 |
| 125,134 |
|
| Lee County School Board COP, 5.00%, 8/1/17 | 200,000 |
| 209,968 |
|
| Miami-Dade County Aviation Rev., 5.00%, 10/1/37 | 50,000 |
| 59,266 |
|
| Miami-Dade County Expressway Authority Rev., 5.00%, 7/1/30 | 50,000 |
| 59,459 |
|
| Miami-Dade County Expressway Authority Rev., 5.00%, 7/1/31 | 200,000 |
| 238,646 |
|
| Miami-Dade County Water & Sewer System Rev., 5.00%, 10/1/42 | 185,000 |
| 214,868 |
|
| Orlando Utilities Commission Rev., 5.00%, 10/1/33 | 210,000 |
| 233,050 |
|
| School District of Broward County COP, 5.00%, 7/1/26 | 200,000 |
| 234,268 |
|
|
| | | | | | |
| | Principal Amount | Value |
| State of Florida GO, 4.75%, 6/1/37 (NATL) | $ | 250,000 |
| $ | 261,587 |
|
| State of Florida GO, 5.125%, 6/1/40 | 300,000 |
| 343,725 |
|
| Tampa Rev., (BayCare Obligated Group), 4.00%, 11/15/46 | 200,000 |
| 212,920 |
|
Tampa Bay Water Rev., 5.00%, 10/1/17(1) | 50,000 |
| 52,855 |
|
Tampa Bay Water Rev., 5.00%, 10/1/17(1) | 50,000 |
| 52,855 |
|
| | | 2,799,975 |
|
| Georgia — 2.5% | | |
| Atlanta Department of Aviation Rev., 5.75%, 1/1/23 | 250,000 |
| 299,712 |
|
| Atlanta Department of Aviation Rev., 5.25%, 1/1/30 | 200,000 |
| 233,194 |
|
| Gainesville & Hall County Hospital Authority Rev., (Northeast Georgia Health System Obligated Group), 5.50%, 8/15/54 | 200,000 |
| 243,684 |
|
| Metropolitan Atlanta Rapid Transit Authority Rev., 5.00%, 7/1/39 | 400,000 |
| 445,812 |
|
| Private Colleges & Universities Authority Rev., (Savannah College of Art & Design, Inc.), 5.00%, 4/1/44 | 200,000 |
| 229,084 |
|
| | | 1,451,486 |
|
| Guam — 0.6% | | |
| Guam Government Rev., 5.00%, 1/1/31 | 150,000 |
| 168,843 |
|
| Guam Government Power Authority Rev., 5.00%, 10/1/34 | 150,000 |
| 166,542 |
|
| | | 335,385 |
|
| Hawaii — 0.4% | | |
| Hawai'i Pacific Health Rev., (Hawai'i Pacific Health Obligated Group), 5.75%, 7/1/40 | 200,000 |
| 227,034 |
|
| Idaho — 0.9% | | |
| Idaho Health Facilities Authority Rev., (Partners In Healthcare, Inc.), 5.50%, 11/1/45 | 250,000 |
| 257,393 |
|
| Idaho Health Facilities Authority Rev., (St. Luke's Health System Obligated Group), 5.00%, 7/1/35 (AGM) | 250,000 |
| 277,087 |
|
| | | 534,480 |
|
| Illinois — 4.9% | | |
| Chicago Rev., 5.25%, 1/1/38 | 100,000 |
| 107,178 |
|
| Chicago Midway International Airport Rev., 5.00%, 1/1/26 | 300,000 |
| 350,814 |
|
| Chicago O'Hare International Airport Rev., 5.00%, 1/1/23 | 45,000 |
| 54,398 |
|
| Chicago O'Hare International Airport Rev., 5.00%, 1/1/24 | 60,000 |
| 73,505 |
|
| Chicago O'Hare International Airport Rev., 5.00%, 1/1/29 | 200,000 |
| 241,668 |
|
| Chicago Wastewater Transmission Rev., 5.00%, 1/1/34 | 30,000 |
| 33,928 |
|
| Chicago Wastewater Transmission Rev., 5.00%, 1/1/35 | 30,000 |
| 33,832 |
|
| Chicago Wastewater Transmission Rev., 5.00%, 1/1/39 | 100,000 |
| 110,966 |
|
| Chicago Wastewater Transmission Rev., 5.00%, 1/1/39 | 105,000 |
| 117,828 |
|
| Chicago Waterworks Rev., 5.00%, 11/1/39 | 30,000 |
| 33,885 |
|
| Illinois Finance Authority Rev., (OSF Healthcare System Obligated Group), 5.00%, 11/15/45 | 200,000 |
| 231,024 |
|
| Illinois State Toll Highway Authority Rev., 5.00%, 12/1/32 | 90,000 |
| 109,152 |
|
| Illinois State Toll Highway Authority Rev., 5.00%, 1/1/36 | 200,000 |
| 235,196 |
|
| Illinois State Toll Highway Authority Rev., 5.00%, 1/1/39 | 50,000 |
| 58,135 |
|
| Railsplitter Tobacco Settlement Authority Rev., 5.00%, 6/1/17 | 150,000 |
| 156,063 |
|
| Railsplitter Tobacco Settlement Authority Rev., 6.00%, 6/1/28 | 250,000 |
| 298,058 |
|
| Springfield Electric Rev., 5.00%, 3/1/24 | 250,000 |
| 304,127 |
|
| State of Illinois GO, 5.50%, 7/1/38 | 100,000 |
| 110,533 |
|
|
| | | | | | |
| | Principal Amount | Value |
| State of Illinois GO, 5.00%, 5/1/39 | $ | 200,000 |
| $ | 213,170 |
|
| | | 2,873,460 |
|
| Indiana — 0.2% | | |
| Indiana Finance Authority Rev., (CWA Authority, Inc.), 5.25%, 10/1/25 | 100,000 |
| 118,783 |
|
| Kentucky — 1.2% | | |
| Kentucky Asset Liability Commission Rev., 5.00%, 9/1/20 | 135,000 |
| 154,619 |
|
Kentucky State Property & Building Commission Rev., 5.50%, 11/1/18, Prerefunded at 100% of Par(1) | 220,000 |
| 244,163 |
|
| Kentucky State Property & Building Commission Rev., 5.50%, 11/1/28 | 30,000 |
| 32,989 |
|
| Kentucky Turnpike Authority Rev., 5.00%, 7/1/17 | 240,000 |
| 251,064 |
|
| | | 682,835 |
|
| Louisiana — 0.3% | | |
| New Orleans Sewerage Service Rev., 5.00%, 6/1/40 | 70,000 |
| 80,852 |
|
| New Orleans Sewerage Service Rev., 5.00%, 6/1/45 | 65,000 |
| 74,855 |
|
| | | 155,707 |
|
| Maryland — 0.3% | | |
Maryland Economic Development Corp. Rev., 5.00%, 6/1/18, Prerefunded at 100% of Par(1) | 150,000 |
| 162,512 |
|
| Massachusetts — 2.8% | | |
Massachusetts GO, 5.00%, 8/1/18, Prerefunded at 100% of Par(1) | 200,000 |
| 217,808 |
|
Massachusetts Bay Transportation Authority Rev., 5.25%, 7/1/18, Prerefunded at 100% of Par(1) | 60,000 |
| 65,512 |
|
| Massachusetts Bay Transportation Authority Rev., 5.25%, 7/1/34 | 140,000 |
| 152,328 |
|
| Massachusetts Bay Transportation Authority Rev., 5.00%, 7/1/41 | 150,000 |
| 176,595 |
|
| Massachusetts Development Finance Agency Rev., (Lahey Clinic Obligated Group), 5.00%, 8/15/45 | 90,000 |
| 105,021 |
|
| Massachusetts Health & Educational Facilities Authority Rev., (President and Fellows of Harvard College), 5.50%, 11/15/36 | 200,000 |
| 223,474 |
|
| Massachusetts School Building Authority Rev., 5.00%, 8/15/30 | 250,000 |
| 302,242 |
|
| Massachusetts School Building Authority Rev., 5.00%, 5/15/43 | 200,000 |
| 235,510 |
|
| Massachusetts Water Resources Authority Rev., 5.25%, 8/1/42 | 150,000 |
| 175,365 |
|
| | | 1,653,855 |
|
| Michigan — 1.3% | | |
| Detroit City School District GO, 5.00%, 5/1/31 (Q-SBLF) | 250,000 |
| 282,555 |
|
| Detroit Sewage Disposal System Rev., 5.25%, 7/1/39 | 425,000 |
| 475,294 |
|
| | | 757,849 |
|
| Mississippi — 0.7% | | |
| Mississippi Development Bank Rev., 5.00%, 3/1/29 (AGM) | 250,000 |
| 298,837 |
|
| Mississippi Development Bank Rev., 6.875%, 12/1/40 (AGM) | 100,000 |
| 134,485 |
|
| | | 433,322 |
|
| Missouri — 0.9% | | |
| Health & Educational Facilities Authority of the State of Missouri Rev., (Washington University in St. Louis), 5.375%, 3/15/39 | 250,000 |
| 268,727 |
|
| Missouri Joint Municipal Electric Utility Commission Rev., 5.00%, 1/1/34 | 200,000 |
| 235,196 |
|
| | | 503,923 |
|
| Nebraska — 0.7% | | |
| Douglas County Hospital Authority No. 3 Rev., (Nebraska Methodist Health Obligated Group), 5.00%, 11/1/45 | 200,000 |
| 230,206 |
|
|
| | | | | | |
| | Principal Amount | Value |
Nebraska Public Power District Rev., 5.00%, 1/1/18, Prerefunded at 100% of Par(1) | $ | 150,000 |
| $ | 159,978 |
|
| | | 390,184 |
|
| New Jersey — 5.2% | | |
Monmouth County GO, 4.00%, 9/15/17, Prerefunded at 100% of Par(1) | 250,000 |
| 260,555 |
|
| New Jersey Economic Development Authority Rev., 5.00%, 9/1/23 | 70,000 |
| 75,711 |
|
| New Jersey Economic Development Authority Rev., 5.25%, 6/15/40 | 250,000 |
| 276,300 |
|
| New Jersey Health Care Facilities Financing Authority Rev., (Barnabas Health Obligated Group), 5.00%, 7/1/44 | 200,000 |
| 229,834 |
|
| New Jersey Health Care Facilities Financing Authority Rev., (Hackensack University Medical Center), 5.00%, 1/1/34 | 200,000 |
| 220,536 |
|
| New Jersey Health Care Facilities Financing Authority Rev., (Princeton HealthCare System Obligated Group), 5.00%, 7/1/39 | 65,000 |
| 76,765 |
|
| New Jersey Health Care Facilities Financing Authority Rev., (Robert Wood Johnson University Hospital, Inc.), 5.00%, 7/1/31 | 200,000 |
| 223,216 |
|
| New Jersey Health Care Facilities Financing Authority Rev., (University Hospital), 5.00%, 7/1/46 (AGM) | 200,000 |
| 230,476 |
|
| New Jersey Transportation Trust Fund Authority Rev., 5.25%, 12/15/22 (AGM) | 100,000 |
| 116,979 |
|
| New Jersey Transportation Trust Fund Authority Rev., 5.00%, 6/15/38 | 200,000 |
| 216,344 |
|
| New Jersey Transportation Trust Fund Authority Rev., 5.00%, 6/15/42 | 200,000 |
| 212,512 |
|
| New Jersey Transportation Trust Fund Authority Rev., 5.00%, 6/15/44 | 100,000 |
| 107,797 |
|
| New Jersey Turnpike Authority Rev., 5.00%, 1/1/27 | 200,000 |
| 244,408 |
|
| New Jersey Turnpike Authority Rev., 5.00%, 1/1/36 | 250,000 |
| 273,220 |
|
| New Jersey Turnpike Authority Rev., 5.00%, 1/1/45 | 200,000 |
| 233,526 |
|
| | | 2,998,179 |
|
| New York — 20.8% | | |
| Dutchess County Local Development Corp. Rev., (Marist College), 5.00%, 7/1/28 | 100,000 |
| 121,880 |
|
| Hudson Yards Infrastructure Corp. Rev., 5.75%, 2/15/47 | 55,000 |
| 64,704 |
|
Long Island Power Authority Rev., 5.25%, 4/1/19 (AGC-ICC)(1) | 30,000 |
| 33,647 |
|
| Long Island Power Authority Rev., 5.25%, 4/1/19 (AGC-ICC) | 120,000 |
| 133,907 |
|
Long Island Power Authority Rev., 6.00%, 5/1/19, Prerefunded at 100% of Par(1) | 250,000 |
| 286,502 |
|
| Long Island Power Authority Rev., 5.00%, 9/1/44 | 175,000 |
| 204,020 |
|
Metropolitan Transportation Authority Rev., 6.50%, 11/15/18, Prerefunded at 100% of Par(1) | 185,000 |
| 210,249 |
|
| Metropolitan Transportation Authority Rev., 6.50%, 11/15/28 | 65,000 |
| 74,059 |
|
| Metropolitan Transportation Authority Rev., 5.00%, 11/15/41 | 300,000 |
| 353,256 |
|
| Metropolitan Transportation Authority Rev., 5.00%, 11/15/43 | 250,000 |
| 293,682 |
|
| Nassau County Local Economic Assistance Corp. Rev., (Catholic Health Services of Long Island Obligated Group), 5.00%, 7/1/22 | 100,000 |
| 118,582 |
|
| New Rochelle Rev., (Iona College), 5.00%, 7/1/40 | 200,000 |
| 229,536 |
|
| New York City GO, 5.00%, 8/1/23 | 500,000 |
| 561,570 |
|
| New York City GO, 5.00%, 8/1/25 | 50,000 |
| 62,949 |
|
| New York City GO, 5.00%, 8/1/36 | 90,000 |
| 107,477 |
|
| New York City GO, VRDN, 0.36%, 6/30/16 (LIQ FAC: Barclays Bank plc) | 1,000,000 |
| 1,000,000 |
|
|
| | | | | | |
| | Principal Amount | Value |
| New York City Transitional Finance Authority Building Aid Rev., 5.00%, 7/15/25 | $ | 150,000 |
| $ | 178,190 |
|
| New York City Transitional Finance Authority Building Aid Rev., 5.00%, 7/15/29 | 125,000 |
| 153,103 |
|
| New York City Transitional Finance Authority Building Aid Rev., 5.50%, 1/15/39 | 300,000 |
| 336,228 |
|
| New York City Transitional Finance Authority Future Tax Secured Rev., 5.00%, 2/1/28 | 200,000 |
| 242,644 |
|
| New York City Transitional Finance Authority Future Tax Secured Rev., 5.00%, 11/1/39 | 200,000 |
| 231,130 |
|
| New York City Transitional Finance Authority Future Tax Secured Rev., 5.00%, 5/1/42 | 200,000 |
| 235,886 |
|
| New York City Water & Sewer System Rev., 5.00%, 6/15/39 | 70,000 |
| 78,182 |
|
| New York City Water & Sewer System Rev., 5.00%, 6/15/43 | 250,000 |
| 289,465 |
|
| New York City Water & Sewer System Rev., 5.00%, 6/15/45 | 600,000 |
| 698,196 |
|
| New York City Water & Sewer System Rev., VRDN, 0.37%, 6/30/16 (SBBPA: State Street Bank & Trust Co.) | 1,600,000 |
| 1,600,000 |
|
| New York Liberty Development Corp. Rev., (4 World Trade Center LLC), 5.125%, 11/15/44 | 100,000 |
| 116,074 |
|
| New York Liberty Development Corp. Rev., (Goldman Sachs Headquarters LLC), 5.25%, 10/1/35 | 260,000 |
| 333,762 |
|
| New York Power Authority Rev., 5.00%, 11/15/38 | 200,000 |
| 236,420 |
|
| New York State Dormitory Authority Rev., 5.00%, 12/15/25 | 200,000 |
| 245,718 |
|
New York State Dormitory Authority Rev., (Northwell Health Obligated Group), 5.50%, 5/1/19, Prerefunded at 100% of Par(1) | 250,000 |
| 283,067 |
|
| New York State Dormitory Authority Rev., (Northwell Health Obligated Group), 5.00%, 5/1/26 | 300,000 |
| 372,570 |
|
| New York State Dormitory Authority Rev., (Touro College and University System Obligated Group), 5.25%, 1/1/34 | 150,000 |
| 166,617 |
|
| New York State Environmental Facilities Corp. Rev., 5.125%, 6/15/38 | 280,000 |
| 315,566 |
|
| New York State Thruway Authority Rev., 5.00%, 5/1/19 | 100,000 |
| 111,470 |
|
| New York State Thruway Authority Rev., 5.00%, 1/1/29 | 150,000 |
| 183,605 |
|
| New York State Urban Development Corp. Rev., 5.00%, 3/15/28 | 100,000 |
| 121,658 |
|
| Port Authority of New York & New Jersey Rev., (JFK International Air Terminal LLC), 6.00%, 12/1/42 | 250,000 |
| 293,655 |
|
| State of New York GO, 5.00%, 2/15/39 | 300,000 |
| 333,024 |
|
| Tobacco Settlement Financing Corp. Rev., 5.00%, 6/1/17 | 360,000 |
| 375,613 |
|
| Tobacco Settlement Financing Corp. Rev., 5.00%, 6/1/18 | 305,000 |
| 330,101 |
|
| Tompkins County Development Corp. Rev., (Kendal at Ithaca, Inc.), 5.00%, 7/1/44 | 100,000 |
| 111,860 |
|
| Triborough Bridge & Tunnel Authority Rev., 5.00%, 11/15/38 | 200,000 |
| 218,986 |
|
| Westchester County Local Development Corp. Rev., (Pace University), 5.50%, 5/1/42 | 35,000 |
| 40,686 |
|
| | | 12,089,496 |
|
| North Carolina — 0.5% | | |
North Carolina Eastern Municipal Power Agency Rev., 6.75%, 1/1/19, Prerefunded at 100% of Par(1) | 250,000 |
| 287,573 |
|
| Ohio — 1.5% | | |
| Cleveland-Cuyahoga County Port Authority Rev., (Euclid Avenue Development Corp.), 5.00%, 8/1/39 | 100,000 |
| 114,777 |
|
| Cleveland-Cuyahoga County Port Authority Rev., (Euclid Avenue Development Corp.), 5.00%, 8/1/44 | 100,000 |
| 109,177 |
|
|
| | | | | | |
| | Principal Amount | Value |
| Franklin County Rev., (OhioHealth Obligated Group), 5.00%, 11/15/41 | $ | 200,000 |
| $ | 225,676 |
|
| Ohio Air Quality Development Authority Rev., (FirstEnergy Generation LLC), VRDN, 3.75%, 12/3/18 (GA: FirstEnergy Solutions Corp.) | 400,000 |
| 409,232 |
|
| | | 858,862 |
|
| Oklahoma — 0.3% | | |
| Oklahoma Turnpike Authority Rev., 5.00%, 1/1/28 | 150,000 |
| 174,107 |
|
| Oregon — 1.0% | | |
| Clackamas County Hospital Facility Authority Rev., (Legacy Health), 5.50%, 7/15/35 | 200,000 |
| 222,236 |
|
Oregon Health & Science University Rev., 5.75%, 7/1/19, Prerefunded at 100% of Par(1) | 300,000 |
| 343,998 |
|
| | | 566,234 |
|
| Pennsylvania — 3.3% | | |
| General Authority of Southcentral Pennsylvania Rev., (WellSpan Health), 5.00%, 6/1/44 | 50,000 |
| 57,565 |
|
| Montgomery County Industrial Development Authority Rev., (Albert Einstein Healthcare Network Obligated Group), 5.25%, 1/15/45 | 140,000 |
| 157,151 |
|
| Northeastern Pennsylvania Hospital & Education Authority Rev., (Wilkes University), 5.00%, 3/1/37 | 250,000 |
| 287,650 |
|
| Pennsylvania Higher Educational Facilities Authority Rev., (Temple University), 5.00%, 4/1/27 | 100,000 |
| 117,901 |
|
Pennsylvania Turnpike Commission Rev., 6.00%, 6/1/18, Prerefunded at 100% of Par (AGC)(1) | 200,000 |
| 220,728 |
|
Pennsylvania Turnpike Commission Rev., Capital Appreciation, 0.00%, 12/1/21(3) | 200,000 |
| 173,168 |
|
| Pennsylvania Turnpike Commission Rev., 5.25%, 12/1/41 | 150,000 |
| 171,905 |
|
| Pennsylvania Turnpike Commission Rev., 5.00%, 12/1/44 | 120,000 |
| 140,045 |
|
| Philadelphia Gas Works Co Rev., 5.00%, 8/1/16 | 300,000 |
| 302,175 |
|
| Philadelphia Water & Wastewater Rev., 5.25%, 1/1/36 | 250,000 |
| 273,532 |
|
| | | 1,901,820 |
|
| Rhode Island — 0.2% | | |
| Tobacco Settlement Financing Corp. Rev., 5.00%, 6/1/50 | 110,000 |
| 117,902 |
|
| South Carolina — 0.3% | | |
| Piedmont Municipal Power Agency Rev., 5.00%, 1/1/17 | 175,000 |
| 179,372 |
|
| Texas — 7.9% | | |
| Board of Managers Joint Guadalupe County-City of Seguin Hospital Rev., 5.00%, 12/1/45 | 200,000 |
| 212,106 |
|
| Central Texas Regional Mobility Authority Rev., 5.00%, 1/1/45 | 100,000 |
| 115,883 |
|
| Central Texas Turnpike System Rev., 5.00%, 8/15/42 | 300,000 |
| 346,884 |
|
| City Public Service Board of San Antonio Rev., 5.00%, 2/1/43 | 50,000 |
| 58,670 |
|
| Clifton Higher Education Finance Corp. Rev., (IDEA Public Schools), 5.00%, 8/15/39 (PSF-GTD) | 85,000 |
| 101,299 |
|
| Dallas/Fort Worth International Airport Rev., 5.00%, 11/1/20 | 100,000 |
| 115,875 |
|
| Dallas/Fort Worth International Airport Rev., 5.00%, 11/1/20 | 25,000 |
| 28,969 |
|
| Dallas/Fort Worth International Airport Rev., 5.00%, 11/1/21 | 100,000 |
| 116,634 |
|
| Grand Parkway Transportation Corp. Rev., 5.125%, 10/1/43 | 45,000 |
| 50,361 |
|
| Harris County Rev., 5.00%, 8/15/38 | 400,000 |
| 444,468 |
|
Harris County-Houston Sports Authority Rev., Capital Appreciation, 0.00%, 11/15/53 (AGM)(2) | 1,000,000 |
| 188,830 |
|
| Houston Rev., 5.00%, 9/1/40 | 125,000 |
| 144,729 |
|
| Love Field Airport Modernization Corp. Rev., (Southwest Airlines Co.), 5.25%, 11/1/40 | 100,000 |
| 112,106 |
|
|
| | | | | | |
| | Principal Amount | Value |
| New Hope Cultural Education Facilities Corp. Rev., (CHF-Stephenville LLC), 5.00%, 4/1/47 | $ | 250,000 |
| $ | 271,998 |
|
| North Texas Tollway Authority Rev., 5.00%, 1/1/24 | 25,000 |
| 30,766 |
|
| North Texas Tollway Authority Rev., 5.00%, 1/1/29 | 100,000 |
| 116,232 |
|
| North Texas Tollway Authority Rev., 5.00%, 1/1/36 | 40,000 |
| 45,740 |
|
| North Texas Tollway Authority Rev., 6.00%, 1/1/38 | 300,000 |
| 355,335 |
|
| North Texas Tollway Authority Rev., 5.00%, 1/1/40 | 60,000 |
| 69,526 |
|
| North Texas Tollway Authority Rev., 6.00%, 1/1/43 | 150,000 |
| 177,231 |
|
| Northside Independent School District GO, VRDN, 1.00%, 6/1/16 (PSF-GTD) | 290,000 |
| 290,000 |
|
| State of Texas GO, 5.00%, 5/15/25 | 250,000 |
| 319,320 |
|
Tarrant County Cultural Education Facilities Finance Corp. Rev., (Baylor Scott & White Health Obligated Group), 5.50%, 8/15/18, Prerefunded at 100% of Par(1) | 250,000 |
| 275,462 |
|
| Texas Municipal Gas Acquisition & Supply Corp. III Rev., 5.00%, 12/15/30 (GA: Macquaire Group Ltd.) | 100,000 |
| 113,125 |
|
| Texas Transportation Commission State Highway Fund Rev., VRDN, 0.75%, 6/2/16 | 200,000 |
| 199,818 |
|
| University of North Texas Rev., 5.00%, 4/15/32 | 250,000 |
| 276,727 |
|
| | | 4,578,094 |
|
| Utah — 0.4% | | |
| Utah State Board of Regents Rev., 5.25%, 8/1/21 (NATL) | 210,000 |
| 250,427 |
|
| Vermont — 0.5% | | |
| Burlington Airport Rev., 5.00%, 7/1/30 (AGM) | 250,000 |
| 291,700 |
|
| Virginia — 1.1% | | |
| Virginia Resources Authority Rev., 5.00%, 10/1/16 | 200,000 |
| 203,006 |
|
| Virginia Small Business Financing Authority Rev., (Hampton University), 5.25%, 10/1/29 | 200,000 |
| 242,982 |
|
| Washington County Industrial Development Authority Rev., (Mountain States Health Alliance Obligated Group), 7.75%, 7/1/38 | 200,000 |
| 228,182 |
|
| | | 674,170 |
|
| Washington — 2.1% | | |
| Energy Northwest Rev., (Bonneville Power Administration), 5.00%, 7/1/28 | 55,000 |
| 67,442 |
|
| King County Sewer Rev., 5.00%, 1/1/34 | 200,000 |
| 230,700 |
|
| Port of Seattle Rev., 5.00%, 6/1/30 | 200,000 |
| 227,364 |
|
State of Washington GO, 5.00%, 7/1/18, Prerefunded at 100% of Par(1) | 200,000 |
| 217,384 |
|
| State of Washington GO, 5.00%, 7/1/26 | 200,000 |
| 240,746 |
|
| State of Washington GO, 5.00%, 8/1/29 | 200,000 |
| 248,662 |
|
| | | 1,232,298 |
|
| Wisconsin — 1.1% | | |
| Wisconsin Department of Transportation Rev., 5.00%, 7/1/18 | 250,000 |
| 271,812 |
|
Wisconsin Health & Educational Facilities Authority Rev., (ProHealth Care Obligated Group), 6.625%, 2/15/19, Prerefunded at 100% of Par(1) | 300,000 |
| 345,801 |
|
| | | 617,613 |
|
TOTAL MUNICIPAL SECURITIES
(Cost $51,804,305) | | 57,002,216 |
|
|
| | | | | |
| | Shares | Value |
TEMPORARY CASH INVESTMENTS† | | |
Federated Tax-Free Obligations Fund, Wealth Shares
(Cost $153) | 153 |
| $ | 153 |
|
TOTAL INVESTMENT SECURITIES — 98.2%
(Cost $51,804,458) | | 57,002,369 |
|
| OTHER ASSETS AND LIABILITIES — 1.8% | | 1,034,100 |
|
| TOTAL NET ASSETS — 100.0% | | $ | 58,036,469 |
|
|
| | |
| NOTES TO SCHEDULE OF INVESTMENTS |
| AGC | - | Assured Guaranty Corporation |
| AGC-ICC | - | Assured Guarantee Corporation - Insured Custody Certificates |
| AGM | - | Assured Guaranty Municipal Corporation |
| BAM | - | Build America Mutual Assurance Company |
| COP | - | Certificates of Participation |
| GA | - | Guaranty Agreement |
| GO | - | General Obligation |
| LIQ FAC | - | Liquidity Facilities |
| NATL | - | National Public Finance Guarantee Corporation |
| PSF-GTD | - | Permanent School Fund Guaranteed |
| Q-SBLF | - | Qualified School Board Loan Fund |
| SBBPA | - | Standby Bond Purchase Agreement |
| VRDN | - | Variable Rate Demand Note. Interest reset date is indicated. Rate shown is effective at the period end. |
| VRN | - | Variable Rate Note. Interest reset date is indicated. Rate shown is effective at the period end. |
| |
| † | Category is less than 0.05% of total net assets. |
| |
| (1) | Escrowed to maturity in U.S. government securities or state and local government securities. |
| |
| (2) | Security is a zero-coupon bond. Zero-coupon securities are issued at a substantial discount from their value at maturity. |
| |
| (3) | Coupon rate adjusts periodically based upon a predetermined schedule. Interest reset date is indicated. Rate shown is effective at the period end. |
See Notes to Financial Statements.
|
|
| Statement of Assets and Liabilities |
|
| | | |
| MAY 31, 2016 |
| Assets |
| Investment securities, at value (cost of $51,804,458) | $ | 57,002,369 |
|
| Cash | 161,310 |
|
| Receivable for investments sold | 186,988 |
|
| Receivable for capital shares sold | 28,100 |
|
| Interest receivable | 743,698 |
|
| | 58,122,465 |
|
| | |
| Liabilities | |
| Payable for capital shares redeemed | 48,375 |
|
| Accrued management fees | 22,566 |
|
| Distribution and service fees payable | 4,309 |
|
| Dividends payable | 10,746 |
|
| | 85,996 |
|
| | |
| Net Assets | $ | 58,036,469 |
|
| | |
| Net Assets Consist of: | |
| Capital paid in | $ | 54,971,471 |
|
| Distributions in excess of net investment income | (355 | ) |
| Accumulated net realized loss | (2,132,558 | ) |
| Net unrealized appreciation | 5,197,911 |
|
| | $ | 58,036,469 |
|
|
| | | | |
| | Net Assets | Shares Outstanding | Net Asset Value Per Share |
| Investor Class | $42,949,103 | 3,666,258 |
| $11.71 |
| Institutional Class | $1,512,410 | 129,051 |
| $11.72 |
| A Class | $11,322,851 | 966,797 |
| $11.71* |
| C Class | $2,252,105 | 192,255 |
| $11.71 |
*Maximum offering price $12.26 (net asset value divided by 0.955).
See Notes to Financial Statements.
|
| | | |
| YEAR ENDED MAY 31, 2016 |
| Investment Income (Loss) |
| Income: | |
| Interest | $ | 2,162,620 |
|
| | |
| Expenses: | |
| Management fees | 262,446 |
|
| Distribution and service fees: | |
| A Class | 27,938 |
|
| C Class | 23,356 |
|
| Trustees' fees and expenses | 3,127 |
|
| | 316,867 |
|
| | |
| Net investment income (loss) | 1,845,753 |
|
| | |
| Realized and Unrealized Gain (Loss) |
| Net realized gain (loss) on: | |
| Investment transactions | (45,020 | ) |
| Futures contract transactions | (16,332 | ) |
| | (61,352 | ) |
| | |
| Change in net unrealized appreciation (depreciation) on: | |
| Investments | 1,338,126 |
|
| Futures contracts | 14,644 |
|
| | 1,352,770 |
|
| | |
| Net realized and unrealized gain (loss) | 1,291,418 |
|
| | |
| Net Increase (Decrease) in Net Assets Resulting from Operations | $ | 3,137,171 |
|
See Notes to Financial Statements.
|
|
| Statement of Changes in Net Assets |
|
| | | | | | |
| YEARS ENDED MAY 31, 2016 AND MAY 31, 2015 |
| Increase (Decrease) in Net Assets | May 31, 2016 | May 31, 2015 |
| Operations |
| Net investment income (loss) | $ | 1,845,753 |
| $ | 1,971,525 |
|
| Net realized gain (loss) | (61,352 | ) | (589,298 | ) |
| Change in net unrealized appreciation (depreciation) | 1,352,770 |
| 37,021 |
|
| Net increase (decrease) in net assets resulting from operations | 3,137,171 |
| 1,419,248 |
|
| | | |
| Distributions to Shareholders | | |
| From net investment income: | | |
| Investor Class | (1,417,913 | ) | (1,543,092 | ) |
| Institutional Class | (28,258 | ) | (11,596 | ) |
| A Class | (344,855 | ) | (359,238 | ) |
| C Class | (54,588 | ) | (57,599 | ) |
| Decrease in net assets from distributions | (1,845,614 | ) | (1,971,525 | ) |
| | | |
| Capital Share Transactions | | |
| Net increase (decrease) in net assets from capital share transactions (Note 5) | (2,634,521 | ) | (1,072,960 | ) |
| | | |
| Net increase (decrease) in net assets | (1,342,964 | ) | (1,625,237 | ) |
| | | |
| Net Assets | | |
| Beginning of period | 59,379,433 |
| 61,004,670 |
|
| End of period | $ | 58,036,469 |
| $ | 59,379,433 |
|
| | | |
| Distributions in excess of net investment income | $ | (355 | ) | $ | (354 | ) |
See Notes to Financial Statements.
|
|
| Notes to Financial Statements |
MAY 31, 2016
1. Organization
American Century Municipal Trust (the trust) is registered under the Investment Company Act of 1940, as amended (the 1940 Act), as an open-end management investment company and is organized as a Massachusetts business trust. Long-Term Tax-Free Fund (the fund) is one fund in a series issued by the trust. The fund’s investment objective is to seek a high level of current income exempt from federal income taxes, consistent with preservation of capital.
The fund offers the Investor Class, the Institutional Class, the A Class and the C Class. The A Class may incur an initial sales charge. The A Class and C Class may be subject to a contingent deferred sales charge. The share classes differ principally in their respective sales charges and distribution and shareholder servicing expenses and arrangements. The Institutional Class is made available to institutional shareholders or through financial intermediaries whose clients do not require the same level of shareholder and administrative services as shareholders of other classes. As a result, the Institutional Class is charged a lower unified management fee.
2. Significant Accounting Policies
The following is a summary of significant accounting policies consistently followed by the fund in preparation of its financial statements. The fund is an investment company and follows accounting and reporting guidance in accordance with accounting principles generally accepted in the United States of America. This may require management to make certain estimates and assumptions at the date of the financial statements. Actual results could differ from these estimates. Management evaluated the impact of events or transactions occurring through the date the financial statements were issued that would merit recognition or disclosure.
Investment Valuations — The fund determines the fair value of its investments and computes its net asset value per share at the close of regular trading (usually 4 p.m. Eastern time) on the New York Stock Exchange (NYSE) on each day the NYSE is open. The Board of Trustees has adopted valuation policies and procedures to guide the investment advisor in the fund’s investment valuation process and to provide methodologies for the oversight of the fund’s pricing function.
Fixed income securities are valued at the evaluated mean as provided by independent pricing services or at the mean of the most recent bid and asked prices as provided by investment dealers. Municipal securities are valued using market models that consider trade data, quotations from dealers and active market makers, relevant yield curve and spread data, creditworthiness, trade data or market information on comparable securities, and other relevant security specific information.
Open-end management investment companies are valued at the reported net asset value per share. Exchange-traded futures contracts are valued at the settlement price as provided by the appropriate clearing corporation.
If the fund determines that the market price for an investment is not readily available or the valuation methods mentioned above do not reflect an investment’s fair value, such investment is valued as determined in good faith by the Board of Trustees or its delegate, in accordance with policies and procedures adopted by the Board of Trustees. In its determination of fair value, the fund may review several factors including, but not limited to, market information regarding the specific investment or comparable investments and correlation with other investment types, futures indices or general market indicators. Circumstances that may cause the fund to use these procedures to value an investment include, but are not limited to: an investment has been declared in default or is distressed; trading in a security has been suspended during the trading day or a security is not actively trading on its principal exchange; prices received from a regular pricing source are deemed unreliable; or there is a foreign market holiday and no trading occurred.
The fund monitors for significant events occurring after the close of an investment’s primary exchange but before the fund’s net asset value per share is determined. Significant events may include, but are not limited to: corporate announcements and transactions; governmental action and political unrest that could impact a specific investment or an investment sector; or armed conflicts, natural disasters and similar events that could affect investments in a specific country or region.
Security Transactions — Security transactions are accounted for as of the trade date. Net realized gains and losses are determined on the identified cost basis, which is also used for federal income tax purposes.
Investment Income — Interest income is recorded on the accrual basis and includes accretion of discounts and amortization of premiums.
Segregated Assets — In accordance with the 1940 Act, the fund segregates assets on its books and records to cover certain types of investments, including, but not limited to, futures contracts and when-issued securities. American Century Investment Management, Inc. (ACIM) (the investment advisor) monitors, on a daily basis, the securities segregated to ensure the fund designates a sufficient amount of liquid assets, marked-to-market daily. The fund may also receive assets or be required to pledge assets at the custodian bank or with a broker for margin requirements on futures contracts.
Income Tax Status — It is the fund’s policy to distribute substantially all net investment income and net realized gains to shareholders and to otherwise qualify as a regulated investment company under provisions of the Internal Revenue Code. Accordingly, no provision has been made for income taxes. The fund files U.S. federal, state, local and non-U.S. tax returns as applicable. The fund's tax returns are subject to examination by the relevant taxing authority until expiration of the applicable statute of limitations, which is generally three years from the date of filing but can be longer in certain jurisdictions. At this time, management believes there are no uncertain tax positions which, based on their technical merit, would not be sustained upon examination and for which it is reasonably possible that the total amounts of unrecognized tax benefits will significantly change in the next twelve months.
Multiple Class — All shares of the fund represent an equal pro rata interest in the net assets of the class to which such shares belong, and have identical voting, dividend, liquidation and other rights and the same terms and conditions, except for class specific expenses and exclusive rights to vote on matters affecting only individual classes. Income, non-class specific expenses, and realized and unrealized capital gains and losses of the fund are allocated to each class of shares based on their relative net assets.
Distributions to Shareholders — Distributions from net investment income, if any, are declared daily and paid monthly. Distributions from net realized gains, if any, are generally declared and paid annually.
Indemnifications — Under the trust’s organizational documents, its officers and trustees are indemnified against certain liabilities arising out of the performance of their duties to the fund. In addition, in the normal course of business, the fund enters into contracts that provide general indemnifications. The maximum exposure under these arrangements is unknown as this would involve future claims that may be made against a fund. The risk of material loss from such claims is considered by management to be remote.
3. Fees and Transactions with Related Parties
Certain officers and trustees of the trust are also officers and/or directors of American Century Companies, Inc. (ACC). The trust's investment advisor, ACIM, the trust's distributor, American Century Investment Services, Inc. (ACIS), and the trust's transfer agent, American Century Services, LLC, are wholly owned, directly or indirectly, by ACC.
Management Fees — The trust has entered into a management agreement with ACIM, under which ACIM provides the fund with investment advisory and management services in exchange for a single, unified management fee (the fee) per class. The agreement provides that all expenses of managing and operating the fund, except distribution and service fees, brokerage expenses, taxes, interest, fees and expenses of the independent trustees (including legal counsel fees), and extraordinary expenses, will be paid by ACIM. The fee is computed and accrued daily based on each class’s daily net assets and paid monthly in arrears. The fee consists of (1) an Investment Category Fee based on the daily net assets of the fund and certain other accounts managed by the investment advisor that are in the same broad investment category as the fund and (2) a Complex Fee based on the assets of all the funds in the American Century Investments family of funds. The rates for the Investment Category Fee range from 0.1625% to 0.2800%. The rates for the Complex Fee range from 0.2500% to 0.3100% for the Investor Class, A Class and C Class. The rates for the Complex Fee range from 0.0500% to 0.1100% for the Institutional Class. The effective annual management fee for each class for the year ended May 31, 2016 was 0.46% for the Investor Class, A Class and C Class and 0.26% for the Institutional Class.
Distribution and Service Fees — The Board of Trustees has adopted a separate Master Distribution and Individual Shareholder Services Plan for each of the A Class and C Class (collectively the plans), pursuant to Rule 12b-1 of the 1940 Act. The plans provide that the A Class will pay ACIS an annual distribution and
service fee of 0.25%. The plans provide that the C Class will pay ACIS an annual distribution and service fee of 1.00%, of which 0.25% is paid for individual shareholder services and 0.75% is paid for distribution services. The fees are computed and accrued daily based on each class’s daily net assets and paid monthly in arrears. The fees are used to pay financial intermediaries for distribution and individual shareholder services. Fees incurred under the plans during the year ended May 31, 2016 are detailed in the Statement of Operations.
Trustees’ Fees and Expenses — The Board of Trustees is responsible for overseeing the investment advisor’s management and operations of the fund. The trustees receive detailed information about the fund and its investment advisor regularly throughout the year, and meet at least quarterly with management of the investment advisor to review reports about fund operations. The fund’s officers do not receive compensation from the fund.
Interfund Transactions — The fund may enter into security transactions with other American Century Investments funds and other client accounts of the investment advisor, in accordance with the 1940 Act rules and procedures adopted by the Board of Trustees. The rules and procedures require, among other things, that these transactions be effected at the independent current market price of the security. During the period, the interfund purchases and sales were $755,000 and $1,000,000, respectively.
4. Investment Transactions
Purchases and sales of investment securities, excluding short-term investments, for the year ended May 31, 2016 were $10,958,377 and $13,491,410, respectively.
5. Capital Share Transactions
Transactions in shares of the fund were as follows (unlimited number of shares authorized):
|
| | | | | | | | | | |
| | Year ended
May 31, 2016 | Year ended May 31, 2015 |
| | Shares | Amount | Shares | Amount |
| Investor Class | | | | |
| Sold | 698,497 |
| $ | 8,061,099 |
| 662,547 |
| $ | 7,676,403 |
|
| Issued in reinvestment of distributions | 111,695 |
| 1,289,245 |
| 121,481 |
| 1,406,786 |
|
| Redeemed | (1,080,201 | ) | (12,412,524 | ) | (847,558 | ) | (9,794,367 | ) |
| | (270,009 | ) | (3,062,180 | ) | (63,530 | ) | (711,178 | ) |
| Institutional Class | | | | |
| Sold | 128,639 |
| 1,475,677 |
| 2,178 |
| 25,003 |
|
| Issued in reinvestment of distributions | 2,421 |
| 28,185 |
| 993 |
| 11,511 |
|
| Redeemed | (4,224 | ) | (49,282 | ) | (31,504 | ) | (363,816 | ) |
| | 126,836 |
| 1,454,580 |
| (28,333 | ) | (327,302 | ) |
| A Class | | | | |
| Sold | 104,111 |
| 1,201,756 |
| 95,270 |
| 1,100,639 |
|
| Issued in reinvestment of distributions | 29,646 |
| 342,185 |
| 30,263 |
| 350,225 |
|
| Redeemed | (198,580 | ) | (2,281,167 | ) | (135,421 | ) | (1,567,606 | ) |
| | (64,823 | ) | (737,226 | ) | (9,888 | ) | (116,742 | ) |
| C Class | | | | |
| Sold | 7,525 |
| 86,841 |
| 26,408 |
| 307,219 |
|
| Issued in reinvestment of distributions | 4,729 |
| 54,588 |
| 4,960 |
| 57,433 |
|
| Redeemed | (37,526 | ) | (431,124 | ) | (24,356 | ) | (282,390 | ) |
| | (25,272 | ) | (289,695 | ) | 7,012 |
| 82,262 |
|
| Net increase (decrease) | (233,268 | ) | $ | (2,634,521 | ) | (94,739 | ) | $ | (1,072,960 | ) |
6. Fair Value Measurements
The fund’s investments valuation process is based on several considerations and may use multiple inputs to determine the fair value of the investments held by the fund. In conformity with accounting principles generally accepted in the United States of America, the inputs used to determine a valuation are classified into three broad levels.
| |
| • | Level 1 valuation inputs consist of unadjusted quoted prices in an active market for identical investments. |
| |
| • | Level 2 valuation inputs consist of direct or indirect observable market data (including quoted prices for comparable investments, evaluations of subsequent market events, interest rates, prepayment speeds, credit risk, etc.). These inputs also consist of quoted prices for identical investments initially expressed in local currencies that are adjusted through translation into U.S. dollars. |
| |
| • | Level 3 valuation inputs consist of unobservable data (including a fund’s own assumptions). |
The level classification is based on the lowest level input that is significant to the fair valuation measurement. The valuation inputs are not necessarily an indication of the risks associated with investing in these securities or other financial instruments. There were no significant transfers between levels during the period.
The following is a summary of the level classifications as of period end. The Schedule of Investments provides additional information on the fund’s portfolio holdings.
|
| | | | | | | | |
| | Level 1 | Level 2 | Level 3 |
| Assets | | | |
| Investment Securities | | | |
| Municipal Securities | — |
| $ | 57,002,216 |
| — |
|
| Temporary Cash Investments | $ | 153 |
| — |
| — |
|
| | $ | 153 |
| $ | 57,002,216 |
| — |
|
7. Derivative Instruments
Interest Rate Risk — The fund is subject to interest rate risk in the normal course of pursuing its investment objectives. The value of bonds generally declines as interest rates rise. A fund may enter into futures contracts based on a bond index or a specific underlying security. A fund may purchase futures contracts to gain exposure to increases in market value or sell futures contracts to protect against a decline in market value. Upon entering into a futures contract, a fund will segregate cash, cash equivalents or other appropriate liquid securities on its records in amounts sufficient to meet requirements. Subsequent payments (variation margin) are made or received daily, in cash, by a fund. The variation margin is equal to the daily change in the contract value and is recorded as unrealized gains and losses. A fund recognizes a realized gain or loss when the futures contract is closed or expires. Net realized and unrealized gains or losses occurring during the holding period of futures contracts are a component of net realized gain (loss) on futures contract transactions and change in net unrealized appreciation (depreciation) on futures contracts, respectively. One of the risks of entering into futures contracts is the possibility that the change in value of the contract may not correlate with the changes in value of the underlying securities. The fund's average exposure to interest rate risk derivative instruments held during the period was 10 contracts.
At period end, the fund did not have any derivative instruments disclosed on the Statement of Assets and Liabilities. For the year ended May 31, 2016, the effect of interest rate risk derivative instruments on the Statement of Operations was $(16,332) in net realized gain (loss) on futures contract transactions and $14,644 in change in net unrealized appreciation (depreciation) on futures contracts.
8. Federal Tax Information
The tax character of distributions paid during the years ended May 31, 2016 and May 31, 2015 were as follows:
|
| | | | | | |
| | 2016 | 2015 |
| Distributions Paid From | | |
| Exempt income | $ | 1,845,614 |
| $ | 1,971,525 |
|
| Long-term capital gains | — |
| — |
|
The book-basis character of distributions made during the year from net investment income or net realized gains may differ from their ultimate characterization for federal income tax purposes. These differences reflect the differing character of certain income items and net realized gains and losses for financial statement and tax purposes, and may result in reclassification among certain capital accounts on the financial statements.
As of May 31, 2016, the federal tax cost of investments and the components of distributable earnings on a tax-basis were as follows:
|
| | | |
| Federal tax cost of investments | $ | 51,807,386 |
|
| Gross tax appreciation of investments | $ | 5,195,511 |
|
| Gross tax depreciation of investments | (528 | ) |
| Net tax appreciation (depreciation) of investments | 5,194,983 |
|
| Net tax appreciation (depreciation) on derivatives | — |
|
| Net tax appreciation (depreciation) | $ | 5,194,983 |
|
| Other book-to-tax adjustments | $ | (5,463 | ) |
| Undistributed exempt income | — |
|
| Accumulated short-term capital losses | $ | (1,204,391 | ) |
| Accumulated long-term capital losses | $ | (920,131 | ) |
The difference between book-basis and tax-basis unrealized appreciation (depreciation) is attributable primarily to the tax deferral of losses on wash sales. Other book-to-tax adjustments are attributable primarily to the tax deferral of losses on straddle positions.
Accumulated capital losses represent net capital loss carryovers that may be used to offset future realized capital gains for federal income tax purposes. Any unlimited losses will be required to be utilized prior to the losses which carry an expiration date. Future capital loss carryover utilization in any given year may be subject to Internal Revenue Code limitations. Capital loss carryovers expire as follows:
|
| | | | |
| 2017 | 2018 | 2019 | Unlimited
(Short-Term) | Unlimited
(Long-Term) |
| $(175,946) | $(72,593) | $(71,439) | $(884,413) | $(920,131) |
9. Subsequent Events
On June 14, 2016, the Board of Trustees approved an agreement and plan of reorganization (the reorganization), whereby the net assets of the fund will be transferred to Intermediate-Term Tax-Free Bond Fund, one fund in a series issued by the trust, in exchange for shares of Intermediate-Term Tax-Free Bond Fund. The financial statements and performance history of Intermediate-Term Tax-Free Bond Fund will survive after the reorganization. The reorganization is expected to be effective as of the close of the NYSE on August 19, 2016.
|
| | | | | | | | | | | | | |
| For a Share Outstanding Throughout the Years Ended May 31 (except as noted) |
| Per-Share Data | Ratios and Supplemental Data |
| | | Income From Investment Operations: | | | | Ratio to Average Net Assets of: | | |
| | Net Asset
Value,
Beginning
of Period | Net
Investment
Income
(Loss)(1) | Net Realized
and Unrealized
Gain (Loss) | Total From
Investment
Operations | Distributions From Net
Investment
Income | Net Asset
Value, End
of Period | Total
Return(2) | Operating
Expenses | Net
Investment
Income
(Loss) | Portfolio
Turnover
Rate | Net Assets,
End of Period
(in thousands) |
| Investor Class |
| 2016 | $11.45 | 0.39 | 0.26 | 0.65 | (0.39) | $11.71 | 5.74% | 0.47% | 3.34% | 20% |
| $42,949 |
|
| 2015 | $11.55 | 0.39 | (0.10) | 0.29 | (0.39) | $11.45 | 2.51% | 0.47% | 3.36% | 27% |
| $45,058 |
|
| 2014 | $11.74 | 0.36 | (0.19) | 0.17 | (0.36) | $11.55 | 1.60% | 0.47% | 3.22% | 36% |
| $46,195 |
|
| 2013 | $11.70 | 0.33 | 0.04 | 0.37 | (0.33) | $11.74 | 3.17% | 0.47% | 2.78% | 49% |
| $65,026 |
|
| 2012 | $10.89 | 0.39 | 0.81 | 1.20 | (0.39) | $11.70 | 11.22% | 0.48% | 3.42% | 38% |
| $49,255 |
|
| Institutional Class |
| 2016 | $11.45 | 0.41 | 0.27 | 0.68 | (0.41) | $11.72 | 6.04% | 0.27% | 3.54% | 20% |
| $1,512 |
|
| 2015 | $11.54 | 0.41 | (0.09) | 0.32 | (0.41) | $11.45 | 2.81% | 0.27% | 3.56% | 27% |
| $25 |
|
| 2014 | $11.73 | 0.38 | (0.19) | 0.19 | (0.38) | $11.54 | 1.81% | 0.27% | 3.42% | 36% |
| $353 |
|
| 2013 | $11.69 | 0.35 | 0.04 | 0.39 | (0.35) | $11.73 | 3.38% | 0.27% | 2.98% | 49% |
| $430 |
|
| 2012 | $10.89 | 0.42 | 0.79 | 1.21 | (0.41) | $11.69 | 11.35% | 0.28% | 3.62% | 38% |
| $280 |
|
| A Class |
| 2016 | $11.44 | 0.36 | 0.27 | 0.63 | (0.36) | $11.71 | 5.57% | 0.72% | 3.09% | 20% |
| $11,323 |
|
| 2015 | $11.55 | 0.36 | (0.11) | 0.25 | (0.36) | $11.44 | 2.17% | 0.72% | 3.11% | 27% |
| $11,806 |
|
| 2014 | $11.73 | 0.33 | (0.18) | 0.15 | (0.33) | $11.55 | 1.44% | 0.72% | 2.97% | 36% |
| $12,026 |
|
| 2013 | $11.70 | 0.30 | 0.03 | 0.33 | (0.30) | $11.73 | 2.91% | 0.72% | 2.53% | 49% |
| $18,444 |
|
| 2012 | $10.89 | 0.36 | 0.81 | 1.17 | (0.36) | $11.70 | 10.85% | 0.73% | 3.17% | 38% |
| $20,645 |
|
|
| | | | | | | | | | | | | |
| For a Share Outstanding Throughout the Years Ended May 31 (except as noted) |
| Per-Share Data | Ratios and Supplemental Data |
| | | Income From Investment Operations: | | | | Ratio to Average Net Assets of: | | |
| | Net Asset
Value,
Beginning
of Period | Net
Investment
Income
(Loss)(1) | Net Realized
and Unrealized
Gain (Loss) | Total From
Investment
Operations | Distributions From Net
Investment
Income | Net Asset
Value, End
of Period | Total
Return(2) | Operating
Expenses | Net
Investment
Income
(Loss) | Portfolio
Turnover
Rate | Net Assets,
End of Period
(in thousands) |
| C Class |
| 2016 | $11.45 | 0.27 | 0.26 | 0.53 | (0.27) | $11.71 | 4.69% | 1.47% | 2.34% | 20% |
| $2,252 |
|
| 2015 | $11.55 | 0.27 | (0.10) | 0.17 | (0.27) | $11.45 | 1.49% | 1.47% | 2.36% | 27% |
| $2,490 |
|
| 2014 | $11.74 | 0.25 | (0.19) | 0.06 | (0.25) | $11.55 | 0.60% | 1.47% | 2.22% | 36% |
| $2,431 |
|
| 2013 | $11.70 | 0.21 | 0.04 | 0.25 | (0.21) | $11.74 | 2.15% | 1.47% | 1.78% | 49% |
| $3,355 |
|
| 2012 | $10.89 | 0.28 | 0.81 | 1.09 | (0.28) | $11.70 | 10.12% | 1.48% | 2.42% | 38% |
| $4,087 |
|
|
| | | | |
| Notes to Financial Highlights | | |
| |
| (1) | Computed using average shares outstanding throughout the period. |
| |
| (2) | Total returns are calculated based on the net asset value of the last business day and do not reflect applicable sales charges, if any. Total returns for periods less than one year are not annualized. |
See Notes to Financial Statements.
|
|
| Report of Independent Registered Public Accounting Firm |
To the Trustees of the American Century Municipal Trust and Shareholders of the Long-Term Tax-Free Fund:
In our opinion, the accompanying statement of assets and liabilities, including the schedule of investments, and the related statements of operations and of changes in net assets and the financial highlights present fairly, in all material respects, the financial position of the Long-Term Tax-Free Fund (one of the four funds comprising the American Century Municipal Trust, hereafter referred to as the "Fund") at May 31, 2016, the results of its operations for the year then ended, the changes in its net assets for each of the two years in the period then ended and the financial highlights for each of the five years in the period then ended, in conformity with accounting principles generally accepted in the United States of America. These financial statements and financial highlights (hereafter referred to as "financial statements") are the responsibility of the Fund's management. Our responsibility is to express an opinion on these financial statements based on our audits. We conducted our audits of these financial statements in accordance with the standards of the Public Company Accounting Oversight Board (United States). Those standards require that we plan and perform the audit to obtain reasonable assurance about whether the financial statements are free of material misstatement. An audit includes examining, on a test basis, evidence supporting the amounts and disclosures in the financial statements, assessing the accounting principles used and significant estimates made by management, and evaluating the overall financial statement presentation. We believe that our audits, which included confirmation of securities at May 31, 2016 by correspondence with the custodian and brokers, provide a reasonable basis for our opinion.
As disclosed in Note 9 of the Notes to Financial Statements, the American Century Long-Term Tax-Free Fund is expected to reorganize into the American Century Intermediate-Term Tax-Free Bond Fund on August 19, 2016.
PricewaterhouseCoopers LLP
Kansas City, Missouri
July 22, 2016
Board of Trustees
The individuals listed below serve as trustees of the funds. Each trustee will continue to serve in this capacity until death, retirement, resignation or removal from office. The board has adopted a mandatory retirement age for trustees who are not “interested persons,” as that term is defined in the Investment Company Act (independent trustees). Independent trustees shall retire on December 31 of the year in which they reach their 75th birthday; provided, however, that on or after January 1, 2022, independent trustees shall retire on December 31 of the year in which they reach their 76th birthday.
Mr. Thomas is an “interested person” because he currently serves as President and Chief Executive Officer of American Century Companies, Inc. (ACC), the parent company of American Century Investment Management, Inc. (ACIM or the advisor). The other trustees (more than three-fourths of the total number) are independent. They are not employees, directors or officers of, and have no financial interest in, ACC or any of its wholly owned, direct or indirect, subsidiaries, including ACIM, American Century Investment Services, Inc. (ACIS) and American Century Services, LLC (ACS), and they do not have any other affiliations, positions or relationships that would cause them to be considered “interested persons” under the Investment Company Act. The trustees serve in this capacity for eight (in the case of Mr. Thomas, 15) registered investment companies in the American Century Investments family of funds.
The following table presents additional information about the trustees. The mailing address for each trustee other than Mr. Thomas is 1665 Charleston Road, Mountain View, California 94043. The mailing address for Mr. Thomas is 4500 Main Street, Kansas City, Missouri 64111.
|
| | | | | |
Name (Year of Birth) | Position(s) Held with Funds | Length of Time Served | Principal Occupation(s) During Past 5 Years | Number of American Century Portfolios Overseen by Trustee | Other Directorships Held During Past 5 Years |
| Independent Trustees |
Tanya S. Beder
(1955) | Trustee | Since 2011 | Chairman and CEO, SBCC Group Inc. (independent advisory services) (2006 to present) | 45 | CYS Investments, Inc. (NYSE mortgage arbitrage REIT) |
Jeremy I. Bulow
(1954) | Trustee | Since 2011 | Professor of Economics, Stanford University, Graduate School of Business (1979 to present) | 45 | None |
Anne Casscells
(1958) | Trustee | Since 2016 | Co-Chief Executive Officer and Chief Investment Officer, Aetos Alternatives Management (investment advisory firm) (2001 to present); Lecturer in Accounting, Stanford University, Graduate School of Business (2009 to present) | 45 | None |
|
| | | | | |
Name (Year of Birth) | Position(s) Held with Funds | Length of Time Served | Principal Occupation(s) During Past 5 Years | Number of American Century Portfolios Overseen by Trustee | Other Directorships Held During Past 5 Years |
| Independent Trustees |
Ronald J. Gilson
(1946) | Trustee and Chairman of the Board | Since 1995
(Chairman since 2005) | Charles J. Meyers Professor of Law and Business, Emeritus, Stanford Law School (1979 to present); Marc and Eva Stern Professor of Law and Business, Columbia University School of Law (1992 to present) | 45 | None |
Frederick L. A. Grauer
(1946) | Trustee | Since 2008 | Senior Advisor, iShares by BlackRock, Inc. (investment management firm) (2010 to 2011, 2013 to present); Senior Advisor, Course Hero (an educational technology company) (2015 to present) | 45 | None |
Jonathan D. Levin
(1972) | Trustee | Since 2016 | Holbrook Working Professor of Price Theory, Standford University, (2000 to present); Chair, Department of Economics, Stanford University (2011 to 2014) | 45 | None |
Peter F. Pervere
(1947) | Trustee | Since 2007 | Retired | 45 | None |
John B. Shoven
(1947) | Trustee | Since 2002 | Charles R. Schwab Professor of Economics, Stanford University (1973 to present) | 45 | Cadence Design Systems; Exponent; Financial Engines |
| Interested Trustee |
Jonathan S. Thomas
(1963) | Trustee and President | Since 2007 | President and Chief Executive Officer, ACC (March 2007 to present). Also serves as Chief Executive Officer, ACS; Executive Vice President, ACIM; Director, ACC, ACIM and other ACC subsidiaries | 128 | BioMed Valley Discoveries, Inc. |
The Statement of Additional Information has additional information about the fund's trustees and is available without charge, upon request, by calling 1-800-345-2021.
Officers
The following table presents certain information about the executive officers of the funds. Each officer serves as an officer for each of the 15 investment companies in the American Century family of funds, unless otherwise noted. No officer is compensated for his or her service as an officer of the funds. The listed officers are interested persons of the funds and are appointed or re-appointed on an annual basis. The mailing address for each of the officers listed below is 4500 Main Street, Kansas City, Missouri 64111.
|
| | |
Name (Year of Birth) | Offices with
the Funds | Principal Occupation(s) During the Past Five Years |
Jonathan S.
Thomas
(1963) | Trustee and
President
since 2007 | President and Chief Executive Officer, ACC (March 2007 to present). Also serves as Chief Executive Officer, ACS; Executive Vice President, ACIM; Director, ACC, ACIM and other ACC subsidiaries |
Amy D. Shelton
(1964) | Chief Compliance
Officer and Vice President since 2014 | Chief Compliance Officer, American Century funds, (March 2014 to present); Chief Compliance Officer, ACIM (February 2014 to present); Chief Compliance Officer, ACIS (October 2009 to present); Vice President, Client Interactions and Marketing, ACIS (February 2013 to January 2014); Director, Client Interactions and Marketing, ACIS (June 2007 to January 2013). Also serves as Vice President, ACIS |
Charles A.
Etherington
(1957) | General Counsel
since 2007 and
Senior Vice
President since 2006 | Attorney, ACC (February 1994 to present); Vice President, ACC (November 2005 to present); General Counsel, ACC (March 2007 to present). Also serves as General Counsel, ACIM, ACS, ACIS and other ACC subsidiaries; and Senior Vice President, ACIM and ACS |
C. Jean Wade
(1964) | Vice President,
Treasurer and
Chief Financial
Officer since 2012 | Vice President, ACS (February 2000 to present) |
Robert J.
Leach
(1966) | Vice President
since 2006 and
Assistant Treasurer
since 2012 | Vice President, ACS (February 2000 to present) |
David H.
Reinmiller
(1963) | Vice President
since 2001 | Attorney, ACC (January 1994 to present); Associate General Counsel, ACC (January 2001 to present). Also serves as Vice President, ACIM and ACS |
Ward D.
Stauffer
(1960) | Secretary
since 2005 | Attorney, ACC (June 2003 to present) |
Proxy Voting Policies
Descriptions of the principles and policies that the fund's investment advisor uses in exercising the voting rights associated with the securities purchased and/or held by the fund are available without charge, upon request, by calling 1-800-345-2021 or visiting the "About Us" page of American Century Investments’ website at americancentury.com. A description of the policies is also available on the Securities and Exchange Commission’s website at sec.gov. Information regarding how the investment advisor voted proxies relating to portfolio securities during the most recent 12-month period ended June 30 is available on the "About Us" page at americancentury.com. It is also available at sec.gov.
Quarterly Portfolio Disclosure
The fund files its complete schedule of portfolio holdings with the Securities and Exchange Commission (SEC) for the first and third quarters of each fiscal year on Form N-Q. The fund’s Forms N-Q are available on the SEC’s website at sec.gov, and may be reviewed and copied at the SEC’s Public Reference Room in Washington, DC. Information on the operation of the Public Reference Room may be obtained by calling 1-800-SEC-0330. The fund also makes its complete schedule of portfolio holdings for the most recent quarter of its fiscal year available on its website at americancentury.com and, upon request, by calling 1-800-345-2021.
Other Tax Information
The following information is provided pursuant to provisions of the Internal Revenue Code.
The fund designates $1,846,769 as exempt interest dividends for the fiscal year ended May 31, 2016.
|
| | |
| |
| | | |
| Contact Us | americancentury.com | |
| Automated Information Line | 1-800-345-8765 | |
| Investor Services Representative | 1-800-345-2021 or 816-531-5575 | |
| Investors Using Advisors | 1-800-378-9878 | |
| Business, Not-For-Profit, Employer-Sponsored Retirement Plans | 1-800-345-3533 | |
| Banks and Trust Companies, Broker-Dealers, Financial Professionals, Insurance Companies | 1-800-345-6488 | |
| Telecommunications Relay Service for the Deaf | 711 | |
| | | |
| American Century Municipal Trust | |
| | | |
Investment Advisor: American Century Investment Management, Inc. Kansas City, Missouri | |
| | | |
| This report and the statements it contains are submitted for the general information of our shareholders. The report is not authorized for distribution to prospective investors unless preceded or accompanied by an effective prospectus. | |
| | | |
©2016 American Century Proprietary Holdings, Inc. All rights reserved.
CL-ANN-89434 1607 | |
|
| |
| | |
| | Annual Report |
| | |
| | May 31, 2016 |
| | |
| | Tax-Free Money Market Fund |
|
| | |
| President’s Letter | 2 |
|
| Performance | 3 |
|
| Fund Characteristics | |
|
| Shareholder Fee Example | |
|
| Schedule of Investments | |
|
| Statement of Assets and Liabilities | |
|
| Statement of Operations | |
|
| Statement of Changes in Net Assets | |
|
| Notes to Financial Statements | |
|
| Financial Highlights | |
|
| Report of Independent Registered Public Accounting Firm | |
|
| Management | |
|
| Additional Information | |
|
Any opinions expressed in this report reflect those of the author as of the date of the report, and do not necessarily represent the opinions of American Century Investments® or any other person in the American Century Investments organization. Any such opinions are subject to change at any time based upon market or other conditions and American Century Investments disclaims any responsibility to update such opinions. These opinions may not be relied upon as investment advice and, because investment decisions made by American Century Investments funds are based on numerous factors, may not be relied upon as an indication of trading intent on behalf of any American Century Investments fund. Security examples are used for representational purposes only and are not intended as recommendations to purchase or sell securities. Performance information for comparative indices and securities is provided to American Century Investments by third party vendors. To the best of American Century Investments’ knowledge, such information is accurate at the time of printing.
|
| |
| Dear Investor:
Thank you for reviewing this annual report for the 12 months ended May 31, 2016. It provides investment performance and portfolio information for the reporting period, plus longer-term historical performance data.
Annual reports help convey information about fund performance, including market and economic factors that affected returns during the reporting period. For additional, updated investment and market insights, we encourage you to visit our website, americancentury.com. |
| Jonathan Thomas |
Municipal Bonds (Munis) Extended Their Outperformance During a Continued Volatile Period
The narrative provided six months ago in our semiannual report letter hasn’t changed much—the key conditions described then extended for another half year. As explained then, widespread concerns about global economic growth sparked sharp financial market volatility. The primary catalyst was China, where slowing economic growth, currency devaluations, and massive monetary policy easing sent shock waves through the global markets. These factors re-emerged in January and early February this year, triggering sell-offs in riskier assets such as stocks and high-yield bonds. In the U.S. stock market, relatively defensive sectors such as utilities, telecommunication services, and consumer discretionary performed best. In the U.S. bond market, high-quality sectors including munis and Treasuries were market leaders.
Consistent with the first six months of the reporting period, munis continued to outperform for the full fiscal year. The broad muni market benefited from its comparatively high overall credit quality, despite defaults in Puerto Rico and financial concerns facing Illinois and New Jersey. We continue to view these as isolated incidents running counter to overall muni credit quality trends. Also, as government bond yields fell globally during the last six months of the reporting period, after-tax muni yields looked attractive, especially for investors in top tax brackets.
We expect many of the factors that kept sovereign bond yields low during the reporting period to persist through the end of the year, keeping U.S. government bond yields range-bound, despite the Federal Reserve’s attempts to raise its interest rate target. We believe those attempts will be muted in the face of continuing global economic, political, and market headwinds. Furthermore, conjecture about Federal Reserve policy and the outcome of the U.S. presidential election, among other factors, could lead to further market volatility, presenting both challenges and opportunities for active investment managers. We continue to believe in a disciplined, diversified, risk-aware investment approach, using professionally managed portfolios to meet financial goals. We appreciate your trust in us.
Sincerely,
Jonathan Thomas
President and Chief Executive Officer
American Century Investments
|
| | | | | |
| Total Returns as of May 31, 2016 |
| | | | Average Annual Returns | |
| | Ticker Symbol | 1 year | 5 years | 10 years | Inception Date |
| Investor Class | BNTXX | 0.02% | 0.02% | 0.80% | 7/31/84 |
Returns would have been lower if a portion of the fees had not been waived.
|
| |
Total Annual Fund Operating Expenses |
| Investor Class | 0.50% |
The total annual fund operating expenses shown is as stated in the fund’s prospectus current as of the date of this report. The prospectus may vary from the expense ratio shown elsewhere in this report because it is based on a different time period, includes acquired fund fees and expenses, and, if applicable, does not include fee waivers or expense reimbursements.
Data presented reflect past performance. Past performance is no guarantee of future results. Current performance may be higher or lower than the performance shown. Total returns for periods less than one year are not annualized. To obtain performance data current to the most recent month end, please call 1-800-345-2021 or visit americancentury.com. For additional information about the fund, please consult the prospectus.
An investment in the fund is neither insured nor guaranteed by the Federal Deposit Insurance Corporation or any other government agency. Although the fund seeks to preserve the value of your investment at $1.00 per share, it is possible to lose money by investing in the fund.
The 7-day current yield more closely reflects the current earnings of the fund than the total return.
|
| |
| MAY 31, 2016 | |
7-Day Current Yield | |
After waiver(1) | 0.03% |
| Before waiver | 0.03% |
7-Day Effective Yield | |
After waiver(1) | 0.03% |
| (1) Yields would have been lower if a portion of the fees had not been waived. |
| | |
Portfolio at a Glance | |
| Weighted Average Maturity | 25 days |
| Weighted Average Life | 57 days |
| | |
Portfolio Composition by Maturity | % of fund investments |
| 1-30 days | 87% |
| 31-90 days | 6% |
| 91-180 days | 2% |
| More than 180 days | 5% |
Fund shareholders may incur two types of costs: (1) transaction costs, including sales charges (loads) on purchase payments and redemption/exchange fees; and (2) ongoing costs, including management fees; distribution and service (12b-1) fees; and other fund expenses. This example is intended to help you understand your ongoing costs (in dollars) of investing in your fund and to compare these costs with the ongoing cost of investing in other mutual funds.
The example is based on an investment of $1,000 made at the beginning of the period and held for the entire period from December 1, 2015 to May 31, 2016.
Actual Expenses
The table provides information about actual account values and actual expenses for each class. You may use the information, together with the amount you invested, to estimate the expenses that you paid over the period. First, identify the share class you own. Then simply divide your account value by $1,000 (for example, an $8,600 account value divided by $1,000 = 8.6), then multiply the result by the number under the heading “Expenses Paid During Period” to estimate the expenses you paid on your account during this period.
If you hold Investor Class shares of any American Century Investments fund, or Institutional Class shares of the American Century Diversified Bond Fund, in an American Century Investments account (i.e., not a financial intermediary or retirement plan account), American Century Investments may charge you a $12.50 semiannual account maintenance fee if the value of those shares is less than $10,000. We will redeem shares automatically in one of your accounts to pay the $12.50 fee. In determining your total eligible investment amount, we will include your investments in all personal accounts (including American Century Investments Brokerage accounts) registered under your Social Security number. Personal accounts include individual accounts, joint accounts, UGMA/UTMA accounts, personal trusts, Coverdell Education Savings Accounts and IRAs (including traditional, Roth, Rollover, SEP-, SARSEP- and SIMPLE-IRAs), and certain other retirement accounts. If you have only business, business retirement, employer-sponsored or American Century Investments Brokerage accounts, you are currently not subject to this fee. If you are subject to the Account Maintenance Fee, your account value could be reduced by the fee amount.
Hypothetical Example for Comparison Purposes
The table also provides information about hypothetical account values and hypothetical expenses based on the actual expense ratio of each class of your fund and an assumed rate of return of 5% per year before expenses, which is not the actual return of a fund’s share class. The hypothetical account values and expenses may not be used to estimate the actual ending account balance or expenses you paid for the period. You may use this information to compare the ongoing costs of investing in your fund and other funds. To do so, compare this 5% hypothetical example with the 5% hypothetical examples that appear in the shareholder reports of the other funds.
Please note that the expenses shown in the table are meant to highlight your ongoing costs only and do not reflect any transactional costs, such as sales charges (loads) or redemption/exchange fees. Therefore, the table is useful in comparing ongoing costs only, and will not help you determine the relative total costs of owning different funds. In addition, if these transactional costs were included, your costs would have been higher.
|
| | | | |
| | Beginning
Account Value
12/1/15 | Ending
Account Value
5/31/16 | Expenses Paid
During Period(1)
12/1/15 - 5/31/16 | Annualized
Expense Ratio(1) |
Actual | | | | |
| Investor Class (after waiver) | $1,000 | $1,000.10 | $1.50 | 0.30% |
| Investor Class (before waiver) | $1,000 | $1,000.10(2) | $2.50 | 0.50% |
Hypothetical | | | | |
| Investor Class (after waiver) | $1,000 | $1,023.50 | $1.52 | 0.30% |
| Investor Class (before waiver) | $1,000 | $1,022.50 | $2.53 | 0.50% |
| |
| (1) | Expenses are equal to the class's annualized expense ratio listed in the table above, multiplied by the average account value over the period, multiplied by 183, the number of days in the most recent fiscal half-year, divided by 366, to reflect the one-half year period. |
| |
| (2) | Ending account value assumes the return earned after waiver and would have been lower if a portion of the fees had not been waived. |
MAY 31, 2016
|
| | | | | | |
| | Principal Amount | Value |
| MUNICIPAL SECURITIES — 98.8% | | |
| California — 23.4% | | |
| California Infrastructure & Economic Development Bank Rev., (Randall Grahm), VRDN, 0.65%, 6/2/16 (LOC: Comerica Bank) | $ | 2,420,000 |
| $ | 2,420,000 |
|
| Eastern Municipal Water District Rev., VRN, 0.49%, 6/2/16 | 3,000,000 |
| 3,000,000 |
|
Elsinore Valley Municipal Water District COP, 4.25%, 7/1/16 (NATL-RE)(1) | 750,000 |
| 752,450 |
|
| Irvine Ranch Water District Special Assessment, VRN, 0.48%, 6/2/16 | 2,000,000 |
| 2,000,000 |
|
| Los Angeles GO, 2.00%, 6/30/16 | 3,000,000 |
| 3,003,989 |
|
| Metropolitan Water District of Southern California Rev., VRN, 0.48%, 6/2/16 | 6,000,000 |
| 6,000,000 |
|
| Riverside County Rev., 2.00%, 10/12/16 | 2,500,000 |
| 2,515,392 |
|
| Riverside Water Rev. VRN, 0.55%, 6/2/16 | 7,000,000 |
| 7,000,000 |
|
Tender Option Bond Trust Receipts/Certificates Rev., VRDN, 0.48%, 6/2/16 (AGM)(LIQ FAC: JPMorgan Chase Bank N.A.)(2) | 850,000 |
| 850,000 |
|
| Victorville Joint Powers Finance Authority Rev., VRDN, 1.15%, 6/2/16 (LOC: BNP Paribas) | 8,440,000 |
| 8,440,000 |
|
| | | 35,981,831 |
|
| Colorado — 1.5% | | |
| Colorado Educational & Cultural Facilities Authority Rev., (Telluride Mountain School, Inc.), VRDN, 0.47%, 6/2/16 (LOC: Wells Fargo Bank N.A.) | 1,260,000 |
| 1,260,000 |
|
| Midcities Metropolitan District No. 1 Rev., VRDN, 0.43%, 6/2/16 (LOC: BNP Paribas) | 1,000,000 |
| 1,000,000 |
|
| | | 2,260,000 |
|
| District of Columbia — 3.2% | | |
| District of Columbia Rev., VRN, 0.52%, 6/2/16 | 5,000,000 |
| 5,000,000 |
|
| Florida — 6.2% | | |
| Florida Department of Management Services COP, 5.00%, 8/1/16 | 4,875,000 |
| 4,912,283 |
|
Tender Option Bond Trust Receipts/Certificates Rev., VRDN, 0.50%, 6/2/16 (AGM-CR and XLCA)(LIQ FAC: JPMorgan Chase Bank N.A.)(2) | 3,700,000 |
| 3,700,000 |
|
| Venice Rev., (Bon Secours Health System, Inc.), VRDN, 0.45%, 6/2/16 (AGM)(LOC: JPMorgan Chase Bank N.A.) | 1,000,000 |
| 1,000,000 |
|
| | | 9,612,283 |
|
| Georgia — 4.5% | | |
| Stephens County Development Authority Rev., (Caterpillar, Inc.), VRDN, 0.55%, 6/2/16 | 1,520,000 |
| 1,520,000 |
|
Tender Option Bond Trust Receipts/Certificates Rev., VRDN, 0.55%, 6/2/16 (LIQ FAC: JPMorgan Chase Bank N.A.)(2) | 1,600,000 |
| 1,600,000 |
|
| Valdosta-Lowndes County Industrial Development Authority Rev., (Steeda Autosports, Inc.), VRDN, 0.56%, 6/2/16 (LOC: Bank of America N.A.) | 2,360,000 |
| 2,360,000 |
|
| Walton County Development Authority Rev., (Walton Press, Inc.), VRDN, 0.56%, 6/2/16 (LOC: Bank of America N.A.) | 1,400,000 |
| 1,400,000 |
|
| | | 6,880,000 |
|
| Hawaii — 2.4% | | |
| State of Hawaii GO, 5.00%, 12/1/16 | 3,555,000 |
| 3,635,581 |
|
|
| | | | | | |
| | Principal Amount | Value |
| Idaho — 1.9% | | |
| State of Idaho GO, 2.00%, 6/30/16 | $ | 3,000,000 |
| $ | 3,004,052 |
|
| Illinois — 8.8% | | |
| East Moline Rev., (Elliott Aviation of the Quad Cities, Inc.), VRDN, 0.62%, 6/1/16 (LOC: U.S. Bank N.A.) | 1,120,000 |
| 1,120,000 |
|
| Illinois Finance Authority Rev., (Lake Towers Associates II LP), VRDN, 0.71%, 6/2/16 (LIQ FAC: FHLMC) | 4,565,000 |
| 4,565,000 |
|
Illinois Finance Authority Rev., (Radiological Society of North America, Inc.), VRDN, 0.50%, 6/2/16 (LOC: JPMorgan Chase Bank N.A.)(Acquired 8/23/11, Cost $170,000)(3) | 170,000 |
| 170,000 |
|
| Illinois Finance Authority Rev., (Teacher's Academy for Mathematics and Science), VRDN, 0.69%, 6/1/16 (LOC: JPMorgan Chase Bank N.A.) | 955,000 |
| 955,000 |
|
| Illinois Finance Authority Rev., (Uniform Law Foundation), VRDN, 0.49%, 6/2/16 (LOC: PNC Bank N.A.) | 2,740,000 |
| 2,740,000 |
|
| Illinois Housing Development Authority Rev., (Rome Meadows Associates III LP), VRDN, 0.79%, 6/2/16 (LOC: First National Bank and FHLB) | 1,725,000 |
| 1,725,000 |
|
| Rock Island County Metropolitan Airport Authority Rev., (Elliott Aviation of the Quad Cities, Inc.), VRDN, 0.60%, 6/1/16 (LOC: U.S. Bank N.A.) | 615,000 |
| 615,000 |
|
| Village of McCook Rev., (Illinois State Andrew Society), VRDN, 0.46%, 6/2/16 (LOC: Northern Trust Company) | 1,700,000 |
| 1,700,000 |
|
| | | 13,590,000 |
|
| Indiana — 2.8% | | |
Crawfordsville Rev., (Acuity Brands, Inc.), VRDN, 0.47%, 6/2/16 (LOC: Wells Fargo Bank N.A.)(Acquired 3/9/16, Cost $4,000,000)(3) | 4,000,000 |
| 4,000,000 |
|
| University of Southern Indiana Rev., VRDN, 0.50%, 6/1/16 (LOC: JPMorgan Chase Bank N.A.) | 250,000 |
| 250,000 |
|
| | | 4,250,000 |
|
| Iowa — 0.3% | | |
| Iowa Finance Authority Rev., (Embria Health Sciences LLC), VRDN, 0.52%, 6/2/16 (LOC: Wells Fargo Bank N.A.) | 500,000 |
| 500,000 |
|
| Louisiana — 2.6% | | |
| Terrebonne Economic Development Authority Rev., (Buquet Distributing Co., Inc.), VRDN, 0.52%, 6/2/16 (LOC: Community Bank and FHLB) | 3,955,000 |
| 3,955,000 |
|
| Maryland — 1.0% | | |
| Montgomery County Rev., (American Gastroenterological Association, Inc.), VRDN, 0.47%, 6/2/16 (LOC: Wells Fargo Bank N.A.) | 1,510,000 |
| 1,510,000 |
|
| Massachusetts — 0.2% | | |
| Massachusetts Industrial Finance Agency Rev., VRDN, 0.70%, 6/1/16 (LOC: TD Bank N.A.) | 240,000 |
| 240,000 |
|
| Minnesota — 3.3% | | |
| Minnetonka Rev., (Brier Creek Apartments Partnership LLP), VRDN, 0.47%, 6/2/16 (LOC: Wells Fargo Bank N.A.) | 200,000 |
| 200,000 |
|
| St. Paul Port Authority Rev., (Bigos-Sibley Tower LLC), VRDN, 0.52%, 6/2/16 (LIQ FAC: FHLMC) | 4,845,000 |
| 4,844,951 |
|
| | | 5,044,951 |
|
| Missouri — 1.8% | | |
| Health & Educational Facilities Authority of the State of Missouri Rev., (Kansas City Art Institute), VRDN, 0.38%, 6/1/16 (LOC: Commerce Bank) | 2,800,000 |
| 2,800,000 |
|
|
| | | | | | |
| | Principal Amount | Value |
| Nevada — 0.6% | | |
| Nevada Housing Division Rev., (L'Octaine LP), VRDN, 0.49%, 6/2/16 (LOC: Citibank N.A.) | $ | 1,000,000 |
| $ | 1,000,000 |
|
| New Mexico — 0.3% | | |
Albuquerque Rev., (CVI Laser LLC), VRDN, 0.61%, 6/2/16 (LOC: Bank of America N.A.)(Acquired 1/29/15, Cost $400,000)(3) | 400,000 |
| 400,000 |
|
| New York — 2.1% | | |
| North Amityville Fire Co, Inc. Rev., VRDN, 0.58%, 6/2/16 (LOC: Citibank N.A.) | 2,455,000 |
| 2,455,000 |
|
| Suffolk County Industrial Development Agency Rev., (JBC Realty LLC), VRDN, 0.65%, 6/1/16 (LOC: JPMorgan Chase Bank N.A.) | 790,000 |
| 790,000 |
|
| | | 3,245,000 |
|
| North Carolina — 7.8% | | |
Austin Trust Rev., VRDN, 0.54%, 6/2/16 (LIQ FAC: Bank of America N.A.)(2) | 4,000,000 |
| 4,000,000 |
|
| North Carolina Capital Facilities Finance Agency Rev., (Lees-McRae College, Inc.), VRDN, 0.47%, 6/2/16 (LOC: Branch Banking & Trust) | 4,340,000 |
| 4,340,000 |
|
| North Carolina Medical Care Commission Rev., (Mission-St Joseph's Health System, Inc.), VRDN, 0.47%, 6/2/16 (SBBPA: Branch Banking & Trust) | 3,655,000 |
| 3,655,000 |
|
| | | 11,995,000 |
|
| Ohio — 1.1% | | |
| Putnam County Rev., (Hilty Home, Inc.), VRDN, 0.45%, 6/2/16 (LOC: First Federal Bank of Midwest and FHLB) | 1,665,000 |
| 1,665,000 |
|
| Pennsylvania — 1.7% | | |
| Pennsylvania Economic Development Financing Authority Rev., (Gish Logging, Inc.), VRDN, 0.73%, 6/2/16 (LOC: PNC Bank N.A.) | 200,000 |
| 200,000 |
|
| Pennsylvania Economic Development Financing Authority Rev., (John C Helfrick), VRDN, 0.63%, 6/2/16 (LOC: PNC Bank N.A.) | 500,000 |
| 500,000 |
|
| Pennsylvania Economic Development Financing Authority Rev., (Miquon School), VRDN, 0.53%, 6/2/16 (LOC: PNC Bank N.A.) | 400,000 |
| 400,000 |
|
| Pennsylvania Economic Development Financing Authority Rev., (Pittsburgh Allegheny County Thermal Ltd.), VRDN, 0.73%, 6/2/16 (LOC: PNC Bank N.A.) | 500,000 |
| 500,000 |
|
| Pennsylvania Economic Development Financing Authority Rev., (Private Industry Council of Westmoreland/Fayette, Inc.), VRDN, 0.55%, 6/2/16 (LOC: PNC Bank N.A.) | 300,000 |
| 300,000 |
|
| Pennsylvania Economic Development Financing Authority Rev., VRDN, 0.53%, 6/2/16 (LOC: PNC Bank N.A.) | 650,000 |
| 650,000 |
|
| | | 2,550,000 |
|
| South Carolina — 2.3% | | |
| South Carolina Jobs-Economic Development Authority Rev., (Franco Manufacturing Co, Inc.), VRDN, 0.67%, 6/1/16 (LOC: Bank of America N.A.) | 1,500,000 |
| 1,500,000 |
|
| South Carolina Jobs-Economic Development Authority Rev., (Medical University of South Carolina Foundation), VRDN, 0.47%, 6/2/16 (LOC: Wells Fargo Bank N.A.) | 2,100,000 |
| 2,100,000 |
|
| | | 3,600,000 |
|
| Texas — 12.6% | | |
| Allen Independent School District GO, 5.00%, 2/15/17 (PSF-GTD) | 1,360,000 |
| 1,402,059 |
|
| Eanes Independent School District GO, 2.00%, 8/1/16 (PSF-GTD) | 2,320,000 |
| 2,325,955 |
|
| Gregg County Housing Finance Corp. Rev., (Bailey Properties LLC), VRDN, 0.55%, 6/2/16 (LIQ FAC: FNMA) | 4,175,000 |
| 4,175,000 |
|
| Gregg County Housing Finance Corp. Rev., (Summer Green LLC), VRDN, 0.55%, 6/2/16 (LIQ FAC: FNMA) | 2,150,000 |
| 2,150,000 |
|
Harlandale Independent School District GO, 4.75%, 8/15/16, Prerefunded at 100% of Par (PSF-GTD)(1) | 1,810,000 |
| 1,826,508 |
|
|
| | | | | | |
| | Principal Amount | Value |
| Mission Economic Development Corp. Rev., VRDN, 0.52%, 6/2/16 (LOC: Wells Fargo Bank N.A.) | $ | 1,735,000 |
| $ | 1,735,000 |
|
Tender Option Bond Trust Receipts/Certificates Rev., VRDN, 0.50%, 6/2/16 (LIQ FAC: Bank of America N.A.)(2) | 3,125,000 |
| 3,125,000 |
|
| Texas A&M University Rev., 5.00%, 5/15/17 | 2,500,000 |
| 2,604,104 |
|
| | | 19,343,626 |
|
| Utah — 0.3% | | |
| Ogden City Redevelopment Agency Tax Allocation, VRDN, 0.47%, 6/2/16 (LOC: Wells Fargo Bank N.A.) | 445,000 |
| 445,000 |
|
| Virginia — 2.2% | | |
Barclays Capital Municipal Trust Receipts Rev., VRDN, 0.48%, 6/2/16 (LIQ FAC: Barclays Bank plc)(2) | 3,335,000 |
| 3,335,000 |
|
| Washington — 3.9% | | |
| Washington Economic Development Finance Authority Rev., (Canam Steel Corp.), VRDN, 0.62%, 6/2/16 (LOC: Wells Fargo Bank N.A.) | 1,900,000 |
| 1,900,000 |
|
| Washington Economic Development Finance Authority Rev., (DVF LLC), VRDN, 0.55%, 6/2/16 (LOC: U.S. Bank N.A.) | 2,745,000 |
| 2,745,000 |
|
| Washington State Housing Finance Commission Rev., (Evergreen School), VRDN, 0.47%, 6/2/16 (LOC: Wells Fargo Bank N.A.) | 1,340,000 |
| 1,340,000 |
|
| | | 5,985,000 |
|
| TOTAL INVESTMENT SECURITIES — 98.8% | | 151,827,324 |
|
| OTHER ASSETS AND LIABILITIES — 1.2% | | 1,858,441 |
|
| TOTAL NET ASSETS — 100.0% | | $ | 153,685,765 |
|
|
| | |
| NOTES TO SCHEDULE OF INVESTMENTS |
| AGM | - | Assured Guaranty Municipal Corporation |
| AGM-CR | - | Assured Guaranty Municipal Corporation - Custodian Receipts |
| COP | - | Certificates of Participation |
| FHLB | - | Federal Home Loan Bank |
| FHLMC | - | Federal Home Loan Mortgage Corporation |
| FNMA | - | Federal National Mortgage Association |
| GO | - | General Obligation |
| LIQ FAC | - | Liquidity Facilities |
| LOC | - | Letter of Credit |
| NATL-RE | - | National Public Finance Guarantee Corporation - Reinsured |
| PSF-GTD | - | Permanent School Fund Guaranteed |
| SBBPA | - | Standby Bond Purchase Agreement |
| VRDN | - | Variable Rate Demand Note. Interest reset date is indicated. Rate shown is effective at the period end. |
| VRN | - | Variable Rate Note. Interest reset date is indicated. Rate shown is effective at the period end. |
| XLCA | - | XL Capital Ltd. |
| |
| (1) | Escrowed to maturity in U.S. government securities or state and local government securities. |
| |
| (2) | Security was purchased pursuant to Rule 144A under the Securities Act of 1933 and may be sold in transactions exempt from registration, normally to qualified institutional investors. The aggregate value of these securities at the period end was $16,610,000, which represented 10.8% of total net assets. |
| |
| (3) | Restricted security that may not be offered for public sale without being registered with the Securities and Exchange Commission and/or may be subject to resale, redemption or transferability restrictions. The aggregate value of these securities at the period end was $4,570,000, which represented 3.0% of total net assets. |
See Notes to Financial Statements.
|
|
| Statement of Assets and Liabilities |
|
| | | |
| MAY 31, 2016 |
| Assets |
| Investment securities, at value (amortized cost and cost for federal income tax purposes) | $ | 151,827,324 |
|
| Cash | 636,525 |
|
| Receivable for investments sold | 790,000 |
|
| Receivable for capital shares sold | 127,961 |
|
| Interest receivable | 457,529 |
|
| | 153,839,339 |
|
| | |
| Liabilities | |
| Payable for capital shares redeemed | 89,003 |
|
| Accrued management fees | 64,571 |
|
| | 153,574 |
|
| | |
| Net Assets | $ | 153,685,765 |
|
| | |
| Investor Class Capital Shares | |
| Shares outstanding (unlimited number of shares authorized) | 153,699,333 |
|
| | |
| Net Asset Value Per Share | $ | 1.00 |
|
| | |
| Net Assets Consist of: | |
| Capital paid in | $ | 153,679,503 |
|
| Undistributed net investment income | 600 |
|
| Undistributed net realized gain | 5,662 |
|
| | $ | 153,685,765 |
|
See Notes to Financial Statements.
|
| | | |
| YEAR ENDED MAY 31, 2016 |
| Investment Income (Loss) |
| Income: | |
| Interest | $ | 391,189 |
|
| | |
| Expenses: | |
| Management fees | 772,005 |
|
| Trustees' fees and expenses | 8,632 |
|
| Other expenses | 215 |
|
| | 780,852 |
|
| Fees waived | (415,770 | ) |
| | 365,082 |
|
| | |
| Net investment income (loss) | 26,107 |
|
| | |
| Net realized gain (loss) on investment transactions | 4,477 |
|
| | |
| Net Increase (Decrease) in Net Assets Resulting from Operations | $ | 30,584 |
|
See Notes to Financial Statements.
|
|
| Statement of Changes in Net Assets |
|
| | | | | | |
| YEARS ENDED MAY 31, 2016 AND MAY 31, 2015 |
| Increase (Decrease) in Net Assets | May 31, 2016 | May 31, 2015 |
| Operations | | |
| Net investment income (loss) | $ | 26,107 |
| $ | 16,301 |
|
| Net realized gain (loss) | 4,477 |
| 600 |
|
| Net increase (decrease) in net assets resulting from operations | 30,584 |
| 16,901 |
|
| | | |
| Distributions to Shareholders | | |
| From net investment income | (24,922 | ) | (16,301 | ) |
| From net realized gains | — |
| (17,565 | ) |
| Decrease in net assets from distributions | (24,922 | ) | (33,866 | ) |
| | | |
| Capital Share Transactions | | |
| Proceeds from shares sold | 67,634,930 |
| 68,526,214 |
|
| Proceeds from reinvestment of distributions | 24,512 |
| 33,543 |
|
| Payments for shares redeemed | (74,293,711 | ) | (75,394,148 | ) |
| Net increase (decrease) in net assets from capital share transactions | (6,634,269 | ) | (6,834,391 | ) |
| | | |
| Net increase (decrease) in net assets | (6,628,607 | ) | (6,851,356 | ) |
| | | |
| Net Assets | | |
| Beginning of period | 160,314,372 |
| 167,165,728 |
|
| End of period | $ | 153,685,765 |
| $ | 160,314,372 |
|
| | | |
| Undistributed net investment income | $ | 600 |
| $ | 600 |
|
| | | |
| Transactions in Shares of the Fund | | |
| Sold | 67,634,930 |
| 68,526,214 |
|
| Issued in reinvestment of distributions | 24,512 |
| 33,543 |
|
| Redeemed | (74,293,711 | ) | (75,394,148 | ) |
| Net increase (decrease) in shares of the fund | (6,634,269 | ) | (6,834,391 | ) |
See Notes to Financial Statements.
|
|
| Notes to Financial Statements |
MAY 31, 2016
1. Organization
American Century Municipal Trust (the trust) is registered under the Investment Company Act of 1940, as amended (the 1940 Act), as an open-end management investment company and is organized as a Massachusetts business trust. Tax-Free Money Market Fund (the fund) is one fund in a series issued by the trust. The fund’s investment objective is to seek safety of principal and high current income that is exempt from federal income tax.
2. Significant Accounting Policies
The following is a summary of significant accounting policies consistently followed by the fund in preparation of its financial statements. The fund is an investment company and follows accounting and reporting guidance in accordance with accounting principles generally accepted in the United States of America. This may require management to make certain estimates and assumptions at the date of the financial statements. Actual results could differ from these estimates. Management evaluated the impact of events or transactions occurring through the date the financial statements were issued that would merit recognition or disclosure.
Investment Valuations — The fund determines the fair value of its investments and computes its net asset value per share (NAV) at the close of regular trading (usually 4 p.m. Eastern time) on the New York Stock Exchange (NYSE) on each day the NYSE is open. Investments are generally valued at amortized cost, which approximates fair value. Open-end management investment companies are valued at the reported NAV per share. If the fund determines that the valuation methods do not reflect an investment’s fair value, such investment is valued as determined in good faith by the Board of Trustees or its delegate, in accordance with policies and procedures adopted by the Board of Trustees.
Security Transactions — Security transactions are accounted for as of the trade date. Net realized gains and losses are determined on the identified cost basis, which is also used for federal income tax purposes.
Investment Income — Interest income is recorded on the accrual basis and includes accretion of discounts and amortization of premiums.
Income Tax Status — It is the fund’s policy to distribute substantially all net investment income and net realized gains to shareholders and to otherwise qualify as a regulated investment company under provisions of the Internal Revenue Code. Accordingly, no provision has been made for income taxes. The fund files U.S. federal, state, local and non-U.S. tax returns as applicable. The fund's tax returns are subject to examination by the relevant taxing authority until expiration of the applicable statute of limitations, which is generally three years from the date of filing but can be longer in certain jurisdictions. At this time, management believes there are no uncertain tax positions which, based on their technical merit, would not be sustained upon examination and for which it is reasonably possible that the total amounts of unrecognized tax benefits will significantly change in the next twelve months.
Distributions to Shareholders — Distributions from net investment income, if any, are declared daily and paid monthly. The fund may make capital gains distributions to comply with the distribution requirements of the Internal Revenue Code.
Indemnifications — Under the trust’s organizational documents, its officers and trustees are indemnified against certain liabilities arising out of the performance of their duties to the fund. In addition, in the normal course of business, the fund enters into contracts that provide general indemnifications. The maximum exposure under these arrangements is unknown as this would involve future claims that may be made against a fund. The risk of material loss from such claims is considered by management to be remote.
3. Fees and Transactions with Related Parties
Certain officers and trustees of the trust are also officers and/or directors of American Century Companies, Inc. (ACC). The trust's investment advisor, American Century Investment Management, Inc. (ACIM), the trust's distributor, American Century Investment Services, Inc., and the trust's transfer agent, American Century Services, LLC, are wholly owned, directly or indirectly, by ACC.
Management Fees — The trust has entered into a management agreement with ACIM, under which ACIM provides the fund with investment advisory and management services in exchange for a single, unified management fee (the fee). The agreement provides that all expenses of managing and operating the fund, except distribution and service fees, brokerage expenses, taxes, interest, fees and expenses of the independent trustees (including legal counsel fees), and extraordinary expenses, will be paid by ACIM. The fee is computed and accrued daily based on the daily net assets of the fund and paid monthly in arrears. The fee consists of (1) an Investment Category Fee based on the daily net assets of the fund and certain other accounts managed by the investment advisor that are in the same broad investment category as the fund and (2) a Complex Fee based on the assets of all the funds in the American Century Investments family of funds. The rates for the Investment Category Fee range from 0.1570% to 0.2700%. The rates for the Complex Fee range from 0.2500% to 0.3100%. In order to maintain a positive yield, ACIM may voluntarily waive a portion of the management fee on a daily basis. The fee waiver may be revised or terminated at any time by the investment advisor without notice. The effective annual management fee for the year ended May 31, 2016 was 0.49% before waiver and 0.22% after waiver.
Trustees’ Fees and Expenses — The Board of Trustees is responsible for overseeing the investment advisor’s management and operations of the fund. The trustees receive detailed information about the fund and its investment advisor regularly throughout the year, and meet at least quarterly with management of the investment advisor to review reports about fund operations. The fund’s officers do not receive compensation from the fund.
Interfund Transactions — The fund may enter into security transactions with other American Century Investments funds and other client accounts of the investment advisor, in accordance with the 1940 Act rules and procedures adopted by the Board of Trustees. The rules and procedures require, among other things, that these transactions be effected at the independent current market price of the security. During the period, the interfund purchases and sales were $27,380,000 and $24,005,000, respectively.
4. Fair Value Measurements
The fund’s investments valuation process is based on several considerations and may use multiple inputs to determine the fair value of the investments held by the fund. In conformity with accounting principles generally accepted in the United States of America, the inputs used to determine a valuation are classified into three broad levels.
| |
| • | Level 1 valuation inputs consist of unadjusted quoted prices in an active market for identical investments. |
| |
| • | Level 2 valuation inputs consist of direct or indirect observable market data (including quoted prices for comparable investments, evaluations of subsequent market events, interest rates, prepayment speeds, credit risk, etc.). These inputs also consist of quoted prices for identical investments initially expressed in local currencies that are adjusted through translation into U.S. dollars. |
| |
| • | Level 3 valuation inputs consist of unobservable data (including a fund’s own assumptions). |
The level classification is based on the lowest level input that is significant to the fair valuation measurement. The valuation inputs are not necessarily an indication of the risks associated with investing in these securities or other financial instruments. There were no significant transfers between levels during the period.
As of period end, the fund’s investment securities were classified as Level 2. The Schedule of Investments provides additional information on the fund’s portfolio holdings.
5. Federal Tax Information
The tax character of distributions paid during the years ended May 31, 2016 and May 31, 2015 were as follows:
|
| | | | | | |
| | 2016 | 2015 |
| Distributions Paid From | | |
| Exempt income | $ | 24,922 |
| $ | 15,701 |
|
| Taxable ordinary income | — |
| $ | 17,565 |
|
| Long-term capital gains | — |
| $ | 600 |
|
The book-basis character of distributions made during the year from net investment income or net realized gains may differ from their ultimate characterization for federal income tax purposes. These differences reflect the differing character of certain income items and net realized gains and losses for financial statement and tax purposes, and may result in reclassification among certain capital accounts on the financial statements.
As of May 31, 2016, the fund had undistributed ordinary income, undistributed exempt income and accumulated long-term gains for federal tax income purposes of $4,477, $600, and $1,185, respectively.
6. Money Market Fund Reform
In July 2014, the Securities and Exchange Commission adopted amendments to the rules that govern money market mutual funds. The amendments consist of structural and operational reforms intended to make money market funds more resilient for investors. In response to the amendments to the rules, as of July 8, 2016, the fund is only available for purchase by accounts that are beneficially owned by natural persons. Beginning October 14, 2016, the board will have the ability to impose a liquidity fee or suspend redemptions in times of severe market stress. The fund will continue to seek to maintain a stable NAV. Management anticipates there will be no changes to the financial statement disclosures.
|
| | | | | | | | | | | | | | |
| For a Share Outstanding Throughout the Years Ended May 31 (except as noted) | | | |
| Per-Share Data | | | | | | Ratios and Supplemental Data | |
| | | | Distributions From: | | | Ratio to Average Net Assets of: | |
| | Net Asset Value, Beginning of Period | Income From Investment Operations: Net Investment Income (Loss) | Net Investment Income | Net Realized Gains | Total Distributions | Net Asset Value, End of Period | Total Return(1) | Operating Expenses | Operating Expenses (before expense waiver) | Net Investment Income (Loss) | Net Investment Income (Loss) (before expense waiver) | Net Assets, End of Period (in thousands) |
| Investor Class | | | | | | | | | | | |
| 2016 | $1.00 | —(2) | —(2) | — | —(2) | $1.00 | 0.02% | 0.23% | 0.50% | 0.02% | (0.25)% |
| $153,686 |
|
| 2015 | $1.00 | —(2) | —(2) | —(2) | —(2) | $1.00 | 0.02% | 0.17% | 0.50% | 0.01% | (0.32)% |
| $160,314 |
|
| 2014 | $1.00 | —(2) | —(2) | —(2) | —(2) | $1.00 | 0.04% | 0.24% | 0.50% | 0.01% | (0.25)% |
| $167,166 |
|
| 2013 | $1.00 | —(2) | —(2) | — | —(2) | $1.00 | 0.01% | 0.40% | 0.50% | 0.01% | (0.09)% |
| $182,944 |
|
| 2012 | $1.00 | —(2) | —(2) | — | —(2) | $1.00 | 0.01% | 0.43% | 0.50% | 0.01% | (0.06)% |
| $208,238 |
|
|
|
| Notes to Financial Highlights |
| |
| (1) | Total returns are calculated based on the net asset value of the last business day. Total returns for periods less than one year are not annualized. |
| |
| (2) | Per-share amount was less than $0.005. |
See Notes to Financial Statements.
|
|
| Report of Independent Registered Public Accounting Firm |
To the Trustees of the American Century Municipal Trust and Shareholders of the Tax-Free Money Market Fund:
In our opinion, the accompanying statement of assets and liabilities, including the schedule of investments, and the related statements of operations and of changes in net assets and the financial highlights present fairly, in all material respects, the financial position of the Tax-Free Money Market Fund (one of the four funds comprising the American Century Municipal Trust, hereafter referred to as the "Fund") at May 31, 2016, the results of its operations for the year then ended, the changes in its net assets for each of the two years in the period then ended and the financial highlights for each of the five years in the period then ended, in conformity with accounting principles generally accepted in the United States of America. These financial statements and financial highlights (hereafter referred to as "financial statements") are the responsibility of the Fund's management. Our responsibility is to express an opinion on these financial statements based on our audits. We conducted our audits of these financial statements in accordance with the standards of the Public Company Accounting Oversight Board (United States). Those standards require that we plan and perform the audit to obtain reasonable assurance about whether the financial statements are free of material misstatement. An audit includes examining, on a test basis, evidence supporting the amounts and disclosures in the financial statements, assessing the accounting principles used and significant estimates made by management, and evaluating the overall financial statement presentation. We believe that our audits, which included confirmation of securities at May 31, 2016 by correspondence with the custodian and brokers, provide a reasonable basis for our opinion.
PricewaterhouseCoopers LLP
Kansas City, Missouri
July 22, 2016
Board of Trustees
The individuals listed below serve as trustees of the funds. Each trustee will continue to serve in this capacity until death, retirement, resignation or removal from office. The board has adopted a mandatory retirement age for trustees who are not “interested persons,” as that term is defined in the Investment Company Act (independent trustees). Independent trustees shall retire on December 31 of the year in which they reach their 75th birthday; provided, however, that on or after January 1, 2022, independent trustees shall retire on December 31 of the year in which they reach their 76th birthday.
Mr. Thomas is an “interested person” because he currently serves as President and Chief Executive Officer of American Century Companies, Inc. (ACC), the parent company of American Century Investment Management, Inc. (ACIM or the advisor). The other trustees (more than three-fourths of the total number) are independent. They are not employees, directors or officers of, and have no financial interest in, ACC or any of its wholly owned, direct or indirect, subsidiaries, including ACIM, American Century Investment Services, Inc. (ACIS) and American Century Services, LLC (ACS), and they do not have any other affiliations, positions or relationships that would cause them to be considered “interested persons” under the Investment Company Act. The trustees serve in this capacity for eight (in the case of Mr. Thomas, 15) registered investment companies in the American Century Investments family of funds.
The following table presents additional information about the trustees. The mailing address for each trustee other than Mr. Thomas is 1665 Charleston Road, Mountain View, California 94043. The mailing address for Mr. Thomas is 4500 Main Street, Kansas City, Missouri 64111.
|
| | | | | |
Name (Year of Birth) | Position(s) Held with Funds | Length of Time Served | Principal Occupation(s) During Past 5 Years | Number of American Century Portfolios Overseen by Trustee | Other Directorships Held During Past 5 Years |
| Independent Trustees |
Tanya S. Beder
(1955) | Trustee | Since 2011 | Chairman and CEO, SBCC Group Inc. (independent advisory services) (2006 to present) | 45 | CYS Investments, Inc. (NYSE mortgage arbitrage REIT) |
Jeremy I. Bulow
(1954) | Trustee | Since 2011 | Professor of Economics, Stanford University, Graduate School of Business (1979 to present) | 45 | None |
Anne Casscells
(1958) | Trustee | Since 2016 | Co-Chief Executive Officer and Chief Investment Officer, Aetos Alternatives Management (investment advisory firm) (2001 to present); Lecturer in Accounting, Stanford University, Graduate School of Business (2009 to present) | 45 | None |
|
| | | | | |
Name (Year of Birth) | Position(s) Held with Funds | Length of Time Served | Principal Occupation(s) During Past 5 Years | Number of American Century Portfolios Overseen by Trustee | Other Directorships Held During Past 5 Years |
| Independent Trustees |
Ronald J. Gilson
(1946) | Trustee and Chairman of the Board | Since 1995
(Chairman since 2005) | Charles J. Meyers Professor of Law and Business, Emeritus, Stanford Law School (1979 to present); Marc and Eva Stern Professor of Law and Business, Columbia University School of Law (1992 to present) | 45 | None |
Frederick L. A. Grauer
(1946) | Trustee | Since 2008 | Senior Advisor, iShares by BlackRock, Inc. (investment management firm) (2010 to 2011, 2013 to present); Senior Advisor, Course Hero (an educational technology company) (2015 to present) | 45 | None |
Jonathan D. Levin
(1972) | Trustee | Since 2016 | Holbrook Working Professor of Price Theory, Standford University, (2000 to present); Chair, Department of Economics, Stanford University (2011 to 2014) | 45 | None |
Peter F. Pervere
(1947) | Trustee | Since 2007 | Retired | 45 | None |
John B. Shoven
(1947) | Trustee | Since 2002 | Charles R. Schwab Professor of Economics, Stanford University (1973 to present) | 45 | Cadence Design Systems; Exponent; Financial Engines |
| Interested Trustee |
Jonathan S. Thomas
(1963) | Trustee and President | Since 2007 | President and Chief Executive Officer, ACC (March 2007 to present). Also serves as Chief Executive Officer, ACS; Executive Vice President, ACIM; Director, ACC, ACIM and other ACC subsidiaries | 128 | BioMed Valley Discoveries, Inc. |
The Statement of Additional Information has additional information about the fund's trustees and is available without charge, upon request, by calling 1-800-345-2021.
Officers
The following table presents certain information about the executive officers of the funds. Each officer serves as an officer for each of the 15 investment companies in the American Century family of funds, unless otherwise noted. No officer is compensated for his or her service as an officer of the funds. The listed officers are interested persons of the funds and are appointed or re-appointed on an annual basis. The mailing address for each of the officers listed below is 4500 Main Street, Kansas City, Missouri 64111.
|
| | |
Name (Year of Birth) | Offices with
the Funds | Principal Occupation(s) During the Past Five Years |
Jonathan S.
Thomas
(1963) | Trustee and
President
since 2007 | President and Chief Executive Officer, ACC (March 2007 to present). Also serves as Chief Executive Officer, ACS; Executive Vice President, ACIM; Director, ACC, ACIM and other ACC subsidiaries |
Amy D. Shelton
(1964) | Chief Compliance
Officer and Vice President since 2014 | Chief Compliance Officer, American Century funds, (March 2014 to present); Chief Compliance Officer, ACIM (February 2014 to present); Chief Compliance Officer, ACIS (October 2009 to present); Vice President, Client Interactions and Marketing, ACIS (February 2013 to January 2014); Director, Client Interactions and Marketing, ACIS (June 2007 to January 2013). Also serves as Vice President, ACIS |
Charles A.
Etherington
(1957) | General Counsel
since 2007 and
Senior Vice
President since 2006 | Attorney, ACC (February 1994 to present); Vice President, ACC (November 2005 to present); General Counsel, ACC (March 2007 to present). Also serves as General Counsel, ACIM, ACS, ACIS and other ACC subsidiaries; and Senior Vice President, ACIM and ACS |
C. Jean Wade
(1964) | Vice President,
Treasurer and
Chief Financial
Officer since 2012 | Vice President, ACS (February 2000 to present) |
Robert J.
Leach
(1966) | Vice President
since 2006 and
Assistant Treasurer
since 2012 | Vice President, ACS (February 2000 to present) |
David H.
Reinmiller
(1963) | Vice President
since 2001 | Attorney, ACC (January 1994 to present); Associate General Counsel, ACC (January 2001 to present). Also serves as Vice President, ACIM and ACS |
Ward D.
Stauffer
(1960) | Secretary
since 2005 | Attorney, ACC (June 2003 to present) |
Proxy Voting Policies
Descriptions of the principles and policies that the fund's investment advisor uses in exercising the voting rights associated with the securities purchased and/or held by the fund are available without charge, upon request, by calling 1-800-345-2021 or visiting the "About Us" page of American Century Investments’ website at americancentury.com. A description of the policies is also available on the Securities and Exchange Commission’s website at sec.gov. Information regarding how the investment advisor voted proxies relating to portfolio securities during the most recent 12-month period ended June 30 is available on the "About Us" page at americancentury.com. It is also available at sec.gov.
Quarterly Portfolio Disclosure
The fund files its complete schedule of portfolio holdings with the Securities and Exchange Commission (SEC) for the first and third quarters of each fiscal year on Form N-Q. The fund’s Forms N-Q are available on the SEC’s website at sec.gov, and may be reviewed and copied at the SEC’s Public Reference Room in Washington, DC. Information on the operation of the Public Reference Room may be obtained by calling 1-800-SEC-0330. The fund also makes its complete schedule of portfolio holdings for the most recent quarter of its fiscal year available on its website at americancentury.com and, upon request, by calling 1-800-345-2021.
Other Tax Information
The following information is provided pursuant to provisions of the Internal Revenue Code.
The fund designates $24,922 as exempt interest dividends for the fiscal year ended May 31, 2016.
|
| | |
| |
| | | |
| Contact Us | americancentury.com | |
| Automated Information Line | 1-800-345-8765 | |
| Investor Services Representative | 1-800-345-2021 or 816-531-5575 | |
| Investors Using Advisors | 1-800-378-9878 | |
| Business, Not-For-Profit, Employer-Sponsored Retirement Plans | 1-800-345-3533 | |
| Banks and Trust Companies, Broker-Dealers, Financial Professionals, Insurance Companies | 1-800-345-6488 | |
| Telecommunications Relay Service for the Deaf | 711 | |
| | | |
| American Century Municipal Trust | |
| | | |
Investment Advisor: American Century Investment Management, Inc. Kansas City, Missouri | |
| | | |
| This report and the statements it contains are submitted for the general information of our shareholders. The report is not authorized for distribution to prospective investors unless preceded or accompanied by an effective prospectus. | |
| | | |
©2016 American Century Proprietary Holdings, Inc. All rights reserved.
CL-ANN-89437 1607 | |
ITEM 2. CODE OF ETHICS.
| |
| (a) | The registrant has adopted a Code of Ethics for Senior Financial Officers that applies to the registrant’s principal executive officer, principal financial officer, principal accounting officer, and persons performing similar functions. |
| |
| (f) | The registrant’s Code of Ethics for Senior Financial Officers was filed as Exhibit 12 (a)(1) to American Century Asset Allocation Portfolios, Inc.’s Annual Certified Shareholder Report on Form N-CSR, File No. 811-21591, on September 29, 2005, and is incorporated herein by reference. |
ITEM 3. AUDIT COMMITTEE FINANCIAL EXPERT.
| |
| (a)(1) | The registrant's board has determined that the registrant has at least one audit committee financial expert serving on its audit committee. |
| |
| (a)(2) | Tanya S. Beder, Anne Casscells, Peter F. Pervere and Ronald J. Gilson are the registrant's designated audit committee financial experts. They are "independent" as defined in Item 3 of Form N-CSR. |
ITEM 4. PRINCIPAL ACCOUNTANT FEES AND SERVICES.
The aggregate fees billed for each of the last two fiscal years for professional services rendered by the principal accountant for the audit of the registrant’s annual financial statements or services that are normally provided by the accountant in connection with statutory and regulatory filings or engagements for those fiscal years were as follows:
FY 2015: $108,494
FY 2016: $113,985
The aggregate fees billed in each of the last two fiscal years for assurance and related services by the principal accountant that are reasonably related to the performance of the audit of the registrant’s financial statements and are not reported under paragraph (a) of this Item were as follows:
For services rendered to the registrant:
FY 2015: $0
FY 2016: $0
Fees required to be approved pursuant to paragraph (c)(7)(ii) of Rule 2-01 of Regulation S-X (relating to certain engagements for non-audit services with the registrant’s investment adviser and its affiliates):
FY 2015: $0
FY 2016: $0
The aggregate fees billed in each of the last two fiscal years for professional services rendered by the principal accountant for tax compliance, tax advice, and tax planning were as follows:
For services rendered to the registrant:
FY 2015: $0
FY 2016 $0
Fees required to be approved pursuant to paragraph (c)(7)(ii) of Rule 2-01 of Regulation S-X (relating to certain engagements for non-audit services with the registrant’s investment adviser and its affiliates):
FY 2015: $0
FY 2016: $0
(d)All Other Fees.
The aggregate fees billed in each of the last two fiscal years for products and services provided by the principal accountant, other than the services reported in paragraphs (a) through (c) of this Item were as follows:
For services rendered to the registrant:
FY 2015: $0
FY 2016: $0
Fees required to be approved pursuant to paragraph (c)(7)(ii) of Rule 2-01 of Regulation S-X (relating to certain engagements for non-audit services with the registrant’s investment adviser and its affiliates):
FY 2015: $0
FY 2016: $0
| |
| (e)(1) | In accordance with paragraph (c)(7)(i)(A) of Rule 2-01 of Regulation S-X, before the accountant is engaged by the registrant to render audit or non-audit services, the engagement is approved by the registrant’s audit committee. Pursuant to paragraph (c)(7)(ii) of Rule 2-01 of Regulation S-X, the registrant’s audit committee also pre-approves its accountant’s engagements for non-audit services with the registrant’s investment adviser, its parent company, and any entity controlled by, or under common control with the investment adviser that provides ongoing services to the registrant, if the engagement relates directly to the operations and financial reporting of the registrant. |
| |
| (e)(2) | All services described in each of paragraphs (b) through (d) of this Item were pre-approved before the engagement by the registrant’s audit committee pursuant to paragraph (c)(7)(i)(A) of Rule 2-01 of Regulation S-X. Consequently, none of such services were required to be approved by the audit committee pursuant to paragraph (c)(7)(i)(C). |
| |
| (f) | The percentage of hours expended on the principal accountant’s engagement to audit the registrant’s financial statements for the most recent fiscal year that were attributed to work performed by persons other than the principal accountant’s full-time, permanent employees was less than 50%. |
| |
| (g) | The aggregate non-audit fees billed by the registrant’s accountant for services rendered to the registrant, and rendered to the registrant’s investment adviser (not including any sub-adviser whose role is primarily portfolio management and is subcontracted with or overseen by another investment adviser), and any entity controlling, controlled by, or under common control with the adviser that provides ongoing services to the registrant for each of the last two fiscal years of the registrant were as follows: |
FY 2015: $310,094
FY 2016: $167,395
| |
| (h) | The registrant’s investment adviser and accountant have notified the registrant’s audit committee of all non-audit services that were rendered by the registrant’s accountant to the registrant’s investment adviser, its parent company, and any entity controlled by, or under common control with the investment adviser that provides services to the registrant, which services were not required to be pre-approved pursuant to paragraph (c)(7)(ii) of Rule 2-01 of Regulation S-X. The notification provided to the registrant’s audit committee included sufficient details regarding such services to allow the registrant’s audit committee to consider the continuing independence of its principal accountant. |
ITEM 5. AUDIT COMMITTEE OF LISTED REGISTRANTS.
Not applicable.
ITEM 6. INVESTMENTS.
| |
| (a) | The schedule of investments is included as part of the report to stockholders filed under Item 1 of this Form. |
ITEM 7. DISCLOSURE OF PROXY VOTING POLICIES AND PROCEDURES FOR CLOSED-END MANAGEMENT INVESTMENT COMPANIES.
Not applicable.
ITEM 8. PORTFOLIO MANAGERS OF CLOSED-END MANAGEMENT INVESTMENT COMPANIES.
Not applicable.
ITEM 9. PURCHASES OF EQUITY SECURITIES BY CLOSED-END MANAGEMENT INVESTMENT COMPANY AND AFFILIATED PURCHASERS.
Not applicable.
ITEM 10. SUBMISSION OF MATTERS TO A VOTE OF SECURITY HOLDERS.
During the reporting period, there were no material changes to the procedures by which shareholders may recommend nominees to the registrant’s board.
ITEM 11. CONTROLS AND PROCEDURES.
| |
| (a) | The registrant's principal executive officer and principal financial officer have concluded that the registrant's disclosure controls and procedures (as defined in Rule 30a-3(c) under the Investment Company Act of 1940) are effective based on their evaluation of these controls and procedures as of a date within 90 days of the filing date of this report. |
| |
| (b) | There were no changes in the registrant's internal control over financial reporting (as defined in Rule 30a-3(d) under the Investment Company Act of 1940) that occurred during the registrant's second fiscal quarter of the period covered by this report that have materially affected, or are reasonably likely to materially affect, the registrant's internal control over financial reporting. |
ITEM 12. EXHIBITS.
| |
| (a)(1) | Registrant’s Code of Ethics for Senior Financial Officers, which is the subject of the disclosure required by Item 2 of Form N-CSR, was filed as Exhibit 12(a)(1) to American Century Asset Allocation Portfolios, Inc.’s Certified Shareholder Report on Form N-CSR, File No. 811-21591, on September 29, 2005. |
| |
| (a)(2) | Separate certifications by the registrant’s principal executive officer and principal financial officer, pursuant to Section 302 of the Sarbanes-Oxley Act of 2002 and Rule 30a-2(a) under the Investment Company Act of 1940, are filed and attached hereto as EX-99.CERT. |
| |
| (b) | A certification by the registrant’s chief executive officer and chief financial officer, pursuant to Section 906 of the Sarbanes-Oxley Act of 2002, is furnished and attached hereto as EX-99.906CERT. |
SIGNATURES
Pursuant to the requirements of the Securities Exchange Act of 1934 and the Investment Company Act of 1940, the registrant has duly caused this report to be signed on its behalf by the undersigned, thereunto duly authorized.
|
| | | | |
| Registrant: | American Century Municipal Trust | |
| | | | |
| By: | /s/ Jonathan S. Thomas | |
| | Name: | Jonathan S. Thomas | |
| | Title: | President | |
| | | | |
| Date: | July 28, 2016 | |
Pursuant to the requirements of the Securities Exchange Act of 1934 and the Investment Company Act of 1940, this report has been signed below by the following persons on behalf of the registrant and in the capacities and on the dates indicated.
|
| | | |
| By: | /s/ Jonathan S. Thomas | |
| | Name: | Jonathan S. Thomas | |
| | Title: | President | |
| | | (principal executive officer) | |
| | | | |
| Date: | July 28, 2016 | |
|
| | | |
| By: | /s/ C. Jean Wade | |
| | Name: | C. Jean Wade | |
| | Title: | Vice President, Treasurer, and | |
| | | Chief Financial Officer | |
| | | (principal financial officer) | |
| | | | |
| Date: | July 28, 2016 | |