UNITED STATES
SECURITIES AND EXCHANGE COMMISSION
Washington, D.C. 20549
FORM N-CSR
CERTIFIED SHAREHOLDER REPORT OF REGISTERED
MANAGEMENT INVESTMENT COMPANIES
Investment Company Act file number | 811-04025 |
| | |
| | |
| | |
AMERICAN CENTURY MUNICIPAL TRUST |
(Exact name of registrant as specified in charter) |
| | |
| | |
| | |
4500 MAIN STREET, KANSAS CITY, MISSOURI | 64111 |
(Address of principal executive offices) | (Zip Code) |
| | |
| | |
| | |
CHARLES A. ETHERINGTON 4500 MAIN STREET, KANSAS CITY, MISSOURI 64111 |
(Name and address of agent for service) |
| | |
| | |
Registrant’s telephone number, including area code: | 816-531-5575 |
| | |
| | |
Date of fiscal year end: | 05-31 |
| | |
| | |
Date of reporting period: | 05-31-2013 |
ITEM 1. REPORTS TO STOCKHOLDERS.
ANNUAL REPORT MAY 31, 2013


High-Yield Municipal Fund
President’s Letter | 2 |
Market Perspective | 3 |
Performance | 4 |
Portfolio Commentary | 6 |
Fund Characteristics | 8 |
Shareholder Fee Example | 9 |
Schedule of Investments | 11 |
Statement of Assets and Liabilities | 22 |
Statement of Operations | 23 |
Statement of Changes in Net Assets | 24 |
Notes to Financial Statements | 25 |
Financial Highlights | 30 |
Report of Independent Registered Public Accounting Firm | 32 |
Management | 33 |
Additional Information | 36 |
Any opinions expressed in this report reflect those of the author as of the date of the report, and do not necessarily represent the opinions of American Century Investments® or any other person in the American Century Investments organization. Any such opinions are subject to change at any time based upon market or other conditions and American Century Investments disclaims any responsibility to update such opinions. These opinions may not be relied upon as investment advice and, because investment decisions made by American Century Investments funds are based on numerous factors, may not be relied upon as an indication of trading intent on behalf of any American Century Investments fund. Security examples are used for representational purposes only and are not intended as recommendations to purchase or sell securities. Performance information for comparative indices and securities is provided to American Century Investments by third party vendors. To the best of American Century Investments’ knowledge, such information is accurate at the time of printing.

Jonathan Thomas
Dear Investor:
Thank you for reviewing this annual report for the 12 months ended May 31, 2013. It provides investment performance, market analysis, and portfolio information, presented with the expert perspective of our portfolio management team.
Annual reports remain important vehicles for conveying information about fund returns, including key factors that affected fund performance. For additional, updated investment and market insights, we encourage you to visit our website, americancentury.com.
Positive Fiscal-Year Returns for Stocks and Municipal Bonds
The 12-month reporting period ended May 31, 2013 started with softening global economic conditions and growing uncertainty in the summer of 2012 as the U.S. elections and dreaded U.S. fiscal deadlines loomed ahead. These factors, and the recession fears they represented, helped provoke aggressive monetary intervention by central banks, which encouraged investors to take more risk.
In this “risk-on” investing environment, stocks generally outperformed bonds, broad non-U.S. stock measures outperformed their broad U.S. stock counterparts, and U.S. municipal bonds generally outperformed U.S. Treasury bonds.
Non-U.S., U.S. mid-cap, small-cap, and value stock indices achieved performance leadership during the period, outpacing the S&P 500 Index’s 27.28% return. The MSCI EAFE Index, for example, returned 31.62%. U.S. bond index returns ranged from roughly 15% gains for corporate high-yield indices all the way down to negative returns for longer-maturity U.S. Treasury benchmarks. For example, the 10-year U.S. Treasury note returned –2.17%, according to Barclays, as its yield rose over half a percentage point, from 1.56% to 2.13%.
Municipal bonds, which enjoyed strong demand for much of the period, generally fit more in the middle of the U.S. bond return spectrum. The Barclays Municipal Bond Index advanced 3.05%.
The U.S. economy is showing signs of improvement in 2013, particularly the long-depressed housing market. However, U.S. economic growth remains subpar compared with past recession recoveries, and is still vulnerable to fiscal, financial, and overseas threats that could trigger further slowdowns and market volatility.
Under these conditions, we continue to believe in a disciplined, diversified, long-term investment approach, using professionally managed stock and bond portfolios—as appropriate—for meeting financial goals. We appreciate your continued trust in us in this challenging environment.
Sincerely,

Jonathan Thomas
President and Chief Executive Officer
American Century Investments

By David MacEwen, Chief Investment Officer, Fixed Income
Municipals Outpaced Treasuries
For the 12-month period ended May 31, 2013, municipal bonds (munis) posted positive performance. Munis were among the fixed income market’s leading performers for the period, outpacing U.S. Treasury securities and the broad taxable investment-grade bond benchmark (Barclays U.S. Aggregate Bond Index) in an environment of generally improving state finances and stable-to-improving credit trends. Furthermore, in the ongoing low-yield environment, muni yields looked relatively attractive, particularly to high-tax-bracket investors on an after-tax basis.
Once again, investors wavered between risk taking and risk aversion. Throughout the period, mixed economic data and political uncertainty (which emerged prior to and following November’s presidential election and as Congress debated tax policy and the federal budget) influenced market sentiment. But, overall, the modest economic gains were sufficient for risk taking to prevail, and lower-quality, higher-yielding securities drove performance in the fixed income market.
Throughout the period, demand for munis remained relatively strong and supply was generally robust, primarily due to continued refinancings from municipalities taking advantage of low interest rates. The Federal Reserve (the Fed) continued to support the low-rate environment, keeping its overnight interest rate target near 0%. In addition, the Fed launched its third and most aggressive quantitative easing program (QE3), which has the Fed purchasing $40 billion of mortgage-backed securities and $45 billion in Treasury securities each month until economic growth and employment improve.
Conditions Favored Longer-Maturity and High-Yield Munis
Against this low-rate backdrop, investors’ demand for yield led to solid results from longer-maturity and lower-quality munis, which outperformed the broad muni benchmark for the 12-month period. Additionally, May 2013 marked the 18th-consecutive month of positive performance for high-yield munis.
Volatility Likely on the Rise
In the final month of the reporting period, Treasury yields increased sharply (putting upward pressure on muni yields as well) in anticipation that the Fed may start scaling back its bond purchases later in 2013. This speculation sparked a selloff among bonds, but this spike in rates largely retraced an earlier decline in yields.
U.S. Fixed-Income Total Returns |
For the 12 months ended May 31, 2013 |
Barclays Municipal Market Indices | | Barclays U.S. Taxable Market Indices |
Municipal High Yield Bond | 11.88% | | Aggregate Bond | 0.92% |
Long-Term Municipal Bond | 4.69% | | Treasury Bond | -0.89% |
Municipal Bond | 3.05% | | | |
7 Year Municipal Bond | 2.07% | | | |
Total Returns as of May 31, 2013 |
| | | | Average Annual Returns | |
| | Ticker Symbol | 1 year | 5 years | 10 years | Since Inception | Inception Date |
Investor Class | ABHYX | 6.85% | 5.16% | 4.47% | 5.02%(1) | 3/31/98 |
Barclays Municipal
Bond Index | — | 3.05% | 5.69% | 4.68% | 5.29% | — |
Institutional Class | AYMIX | 7.17% | — | — | 8.42% | 3/1/10 |
A Class No sales charge* With sales charge* | AYMAX | 6.58% 1.78% | 4.90% 3.95% | 4.21% 3.73% | 4.42% 3.96% | 1/31/03 |
C Class | AYMCX | 5.91% | 4.12% | 3.44% | 3.74% | 7/24/02 |
*Sales charges include initial sales charges and contingent deferred sales charges (CDSCs), as applicable. A Class shares have a 4.50% maximum initial sales charge and may be subject to a maximum CDSC of 1.00%. C Class shares redeemed within 12 months of purchase are subject to a maximum CDSC of 1.00%. The SEC requires that mutual funds provide performance information net of maximum sales charges in all cases where charges could be applied.
(1) | Returns would have been lower if a portion of the management fee had not been waived. |
Data presented reflect past performance. Past performance is no guarantee of future results. Current performance may be higher or lower than the performance shown. Investment return and principal value will fluctuate, and redemption value may be more or less than original cost. To obtain performance data current to the most recent month end, please call 1-800-345-2021 or visit americancentury.com. As interest rates rise, bond values will decline. In addition, the lower-rated securities in which the fund invests are subject to greater liquidity risk and credit risk. The fund’s investment process may result in high portfolio turnover, which could mean high transaction costs, affecting both performance and capital gains tax liabilities to investors. Investment income may be subject to certain state and local taxes and, depending on your tax status, the federal alternative minimum tax (AMT). Capital gains are not exempt from state and federal income tax.
Unless otherwise indicated, performance reflects Investor Class shares; performance for other share classes will vary due to differences in fee structure. For information about other share classes available, please consult the prospectus. Data assumes reinvestment of dividends and capital gains, and none of the charts reflect the deduction of taxes that a shareholder would pay on fund distributions or the redemption of fund shares. Returns for the index are provided for comparison. The fund’s total returns include operating expenses (such as transaction costs and management fees) that reduce returns, while the total returns of the index do not.
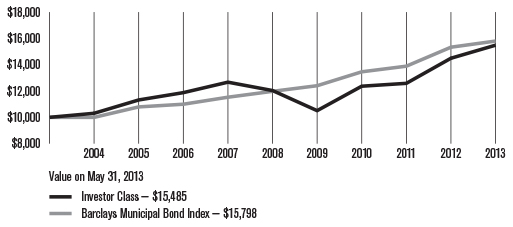
Growth of $10,000 Over 10 Years |
$10,000 investment made May 31, 2003 |
Total Annual Fund Operating Expenses |
Investor Class | Institutional Class | A Class | C Class |
0.61% | 0.41% | 0.86% | 1.61% |
The total annual fund operating expenses shown is as stated in the fund’s prospectus current as of the date of this report. The prospectus may vary from the expense ratio shown elsewhere in this report because it is based on a different time period, includes acquired fund fees and expenses, and, if applicable, does not include fee waivers or expense reimbursements.
Data presented reflect past performance. Past performance is no guarantee of future results. Current performance may be higher or lower than the performance shown. Investment return and principal value will fluctuate, and redemption value may be more or less than original cost. To obtain performance data current to the most recent month end, please call 1-800-345-2021 or visit americancentury.com. As interest rates rise, bond values will decline. In addition, the lower-rated securities in which the fund invests are subject to greater liquidity risk and credit risk. The fund’s investment process may result in high portfolio turnover, which could mean high transaction costs, affecting both performance and capital gains tax liabilities to investors. Investment income may be subject to certain state and local taxes and, depending on your tax status, the federal alternative minimum tax (AMT). Capital gains are not exempt from state and federal income tax.
Unless otherwise indicated, performance reflects Investor Class shares; performance for other share classes will vary due to differences in fee structure. For information about other share classes available, please consult the prospectus. Data assumes reinvestment of dividends and capital gains, and none of the charts reflect the deduction of taxes that a shareholder would pay on fund distributions or the redemption of fund shares. Returns for the index are provided for comparison. The fund’s total returns include operating expenses (such as transaction costs and management fees) that reduce returns, while the total returns of the index do not.
Portfolio Managers: Steven Permut, Joseph Gotelli, and Alan Kruss
Performance Summary
High-Yield Municipal returned 6.85%* for the fiscal year ended May 31, 2013. By comparison, the Barclays Municipal Bond Index (representing investment-grade municipal bonds) returned 3.05%, while the Barclays Municipal High Yield Bond Index (representing non-investment-grade municipal bonds) returned 11.88%.** Fund returns reflect operating expenses, while index returns do not. (See pages 4 and 5 and footnotes below for additional performance comparisons.)
The fund’s absolute return for the reporting period reflected the positive performance of high-yield municipal bonds (high-yield munis). The main contributor to the fund’s outperformance relative to the investment-grade benchmark was the portfolio’s greater focus on lower-quality securities, which outperformed investment-grade munis during the period. Relative to the high-yield index, the fund was more conservatively positioned, with a greater emphasis on higher-quality bonds and lower weightings in riskier sectors. This approach led to lagging results versus the high-yield index.
Credit Environment
In general, credit trends in the muni market were stable to improving throughout the period. Muni credit-rating downgrades continued to outpace upgrades, but the overall default rate remained low. We continue to believe it’s unlikely any states will default, but select state credit ratings are likely to remain under downward pressure. Also, more downgrades and defaults may occur at the local level due to lingering effects of the slow recovery from the Great Recession.
The financial stresses at the local level were highlighted early in the period, when the California cities of Stockton, Mammoth Lakes, and San Bernardino filed for bankruptcy protection. Long-term structural budget problems led to the Stockton and San Bernardino filings, while an unfavorable legal judgment pushed Mammoth Lakes into bankruptcy. In addition, California’s elimination of certain local funding programs and state spending cuts also contributed by forcing local municipalities to deal with their financial problems with less state assistance.
We believe these incidents represent isolated events that had little impact on overall municipal credit quality. Most local governments we have reviewed remain in good financial condition despite the slow-growth economy. Meanwhile, state and local tax revenues generally increased during the reporting period, due to improving local economies and/or higher tax rates.
Portfolio Positioning
In addition to an emphasis on lower-quality bonds (relative to the investment-grade benchmark), security selection contributed to the fund’s outperformance
* | All fund returns referenced in this commentary are for Investor Class shares. |
| | |
| ** | The Barclays Municipal High Yield Bond Index’s average returns were 7.24% and 6.91% for the five- and 10-year periods ended May 31, 2013, respectively. |
for the 12-month period. In particular, the fund’s holdings among tobacco, hospital, higher education, and industrial development/pollution control revenue (IDR/PCR) bonds helped performance.
We also continued to favor revenue bonds, which outperformed general obligation (GO) bonds during the period. Specifically, positions in airport, toll road, public power, resource recovery, and water/sewer bonds contributed favorably to performance. Among tax-supported bonds, the portfolio’s holdings in state and local GO bonds generally outperformed.
Our current views about valuations and overall market conditions generally drive our strategic shifts in the fund’s overweight and underweight positions. During the 12-month period, these views led to a larger weighting in higher-quality bonds. Overall, lower-rated bonds outperformed their higher-quality counterparts, which caused the fund’s return to lag that of the high-yield index.
Outlook
In the final month of the reporting period, some confusing comments from the Federal Reserve about potential reductions in quantitative easing—a program that has helped fuel financial market gains—sparked a selloff among most bond market sectors, particularly lower-quality securities.
We already had been increasing exposure to more liquid, higher-quality munis. We believe if the recent selloff among risk assets continues, the fund will be well positioned to add back riskier securities, including tobacco and IDR/PCR bonds, at more attractive prices. Additionally, if interest rates rise further and bond fund outflows increase, we believe our higher-quality positions can potentially soften the blow. Overall, we expect to maintain our preference for revenue bonds, including public power, transportation, and other essential services bonds.
MAY 31, 2013 | |
Portfolio at a Glance | |
Weighted Average Maturity | 18.1 years |
Average Duration (Modified) | 5.7 years |
| | |
Top Five States and Territories | % of net assets |
California | 12.6% |
New York | 8.6% |
Puerto Rico | 7.1% |
New Jersey | 6.0% |
Florida | 5.8% |
| | |
Top Five Sectors | % of fund investments |
General Obligation (GO) | 15% |
Hospital Revenue | 12% |
Transportation Revenue | 11% |
Special Tax Revenue/Severance Tax | 9% |
Water/Sewer/Gas Revenue | 8% |
| | |
Types of Investments in Portfolio | % of net assets |
Municipal Securities | 101.0% |
Other Assets and Liabilities | (1.0)% |
Fund shareholders may incur two types of costs: (1) transaction costs, including sales charges (loads) on purchase payments and redemption/exchange fees; and (2) ongoing costs, including management fees; distribution and service (12b-1) fees; and other fund expenses. This example is intended to help you understand your ongoing costs (in dollars) of investing in your fund and to compare these costs with the ongoing cost of investing in other mutual funds.
The example is based on an investment of $1,000 made at the beginning of the period and held for the entire period from December 1, 2012 to May 31, 2013.
Actual Expenses
The table provides information about actual account values and actual expenses for each class. You may use the information, together with the amount you invested, to estimate the expenses that you paid over the period. First, identify the share class you own. Then simply divide your account value by $1,000 (for example, an $8,600 account value divided by $1,000 = 8.6), then multiply the result by the number under the heading “Expenses Paid During Period” to estimate the expenses you paid on your account during this period.
If you hold Investor Class shares of any American Century Investments fund, or Institutional Class shares of the American Century Diversified Bond Fund, in an American Century Investments account (i.e., not a financial intermediary or retirement plan account), American Century Investments may charge you a $12.50 semiannual account maintenance fee if the value of those shares is less than $10,000. We will redeem shares automatically in one of your accounts to pay the $12.50 fee. In determining your total eligible investment amount, we will include your investments in all personal accounts (including American Century Investments Brokerage accounts) registered under your Social Security number. Personal accounts include individual accounts, joint accounts, UGMA/UTMA accounts, personal trusts, Coverdell Education Savings Accounts and IRAs (including traditional, Roth, Rollover, SEP-, SARSEP- and SIMPLE-IRAs), and certain other retirement accounts. If you have only business, business retirement, employer-sponsored or American Century Investments Brokerage accounts, you are currently not subject to this fee. If you are subject to the Account Maintenance Fee, your account value could be reduced by the fee amount.
Hypothetical Example for Comparison Purposes
The table also provides information about hypothetical account values and hypothetical expenses based on the actual expense ratio of each class of your fund and an assumed rate of return of 5% per year before expenses, which is not the actual return of a fund’s share class. The hypothetical account values and expenses may not be used to estimate the actual ending account balance or expenses you paid for the period. You may use this information to compare the ongoing costs of investing in your fund and other funds. To do so, compare this 5% hypothetical example with the 5% hypothetical examples that appear in the shareholder reports of the other funds.
Please note that the expenses shown in the table are meant to highlight your ongoing costs only and do not reflect any transactional costs, such as sales charges (loads) or redemption/exchange fees. Therefore, the table is useful in comparing ongoing costs only, and will not help you determine the relative total costs of owning different funds. In addition, if these transactional costs were included, your costs would have been higher.
| | | | | |
| | Beginning
Account Value 12/1/12 | Ending
Account Value 5/31/13 | Expenses Paid During Period(1) 12/1/12 - 5/31/13 | Annualized
Expense Ratio(1) |
Actual | | | | |
Investor Class | $1,000 | $999.90 | $2.99 | 0.60% |
Institutional Class | $1,000 | $1,002.00 | $2.00 | 0.40% |
A Class | $1,000 | $998.70 | $4.24 | 0.85% |
C Class | $1,000 | $996.00 | $7.96 | 1.60% |
Hypothetical | | | | |
Investor Class | $1,000 | $1,021.94 | $3.02 | 0.60% |
Institutional Class | $1,000 | $1,022.94 | $2.02 | 0.40% |
A Class | $1,000 | $1,020.69 | $4.28 | 0.85% |
C Class | $1,000 | $1,016.95 | $8.05 | 1.60% |
(1) | Expenses are equal to the class’s annualized expense ratio listed in the table above, multiplied by the average account value over the period, multiplied by 182, the number of days in the most recent fiscal half-year, divided by 365, to reflect the one-half year period. |
MAY 31, 2013
| | | | | | | |
| | | Principal Amount | | | Value | |
Municipal Securities — 101.0% | |
ALABAMA — 0.9% | |
Courtland Industrial Development Board Environmental Improvement Rev., Series 2003 B, (International Paper Co.), 6.25%, 8/1/25 | | $2,500,000 | | | $2,520,775 | |
Mobile Industrial Development Board Pollution Control Rev., (Alabama Power Co.), VRDN, 1.65%, 3/20/17 | | 1,000,000 | | | 1,024,590 | |
| | | | | | 3,545,365 | |
ALASKA — 0.2% | |
Northern Tobacco Securitization Corp. Settlement Rev., Series 2006 A, (Asset Backed), 5.00%, 6/1/46 | | 1,000,000 | | | 888,980 | |
ARIZONA — 1.0% | |
City of Mesa Excise Tax Rev., 5.00%, 7/1/27 | | 250,000 | | | 278,110 | |
Florence Town Inc. Industrial Development Authority Education Rev., (Legacy Traditional Charter School), 6.00%, 7/1/43 | | 1,000,000 | | | 1,013,530 | |
Mohave County Industrial Development Authority Correctional Facilities Contract Rev., (Mohave Prison, LLC Expansion), 8.00%, 5/1/25 | | 500,000 | | | 633,970 | |
Pima County Sewer System Rev., Series 2011 B, 5.00%, 7/1/26 | | 1,000,000 | | | 1,146,070 | |
Sundance Community Facilities District No. 2 Special Assessment Rev., 7.125%, 7/1/27(1) | | 677,000 | | | 677,501 | |
Sundance Community Facilities District No. 3 Special Assessment Rev., 6.50%, 7/1/29 | | 426,000 | | | 427,555 | |
| | | | | | 4,176,736 | |
CALIFORNIA — 12.6% | |
California GO, 4.00%, 10/1/15 | | 3,605,000 | | | 3,892,463 | |
California GO, 5.00%, 4/1/37 | | 1,000,000 | | | 1,110,210 | |
California GO, 5.00%, 4/1/42 | | 1,450,000 | | | 1,577,759 | |
California Health Facilities Financing Authority Rev., Series 2009 A, (Children’s Hospital of Orange County), 6.50%, 11/1/38 | | 2,000,000 | | | 2,415,480 | |
California Health Facilities Financing Authority Rev., Series 2012 A, (Scripps Health), 5.00%, 11/15/40 | | 400,000 | | | 437,000 | |
California Mobilehome Park Financing Authority Rev., Series 2003 B, (Palomar Estates E&W), 7.00%, 9/15/36 | | 2,000,000 | | | 2,042,240 | |
California Municipal Finance Authority Rev., Series 2011 B, (Azusa Pacific University), 8.00%, 4/1/41 | | 800,000 | | | 949,336 | |
California State Public Works Board Rev., Series 2013 A, (Judicial Council Projects), 5.00%, 3/1/30 | | 1,500,000 | | | 1,665,450 | |
California State Public Works Board Rev., Series 2013 A, (Judicial Council Projects), 5.00%, 3/1/38 | | 1,500,000 | | | 1,608,135 | |
California Statewide Communities Development Authority Rev., (Lancer Educational Student Housing), 7.50%, 6/1/42 | | 2,000,000 | | | 2,328,420 | |
Chula Vista Rev., Series 2006 A, (San Diego Gas and Electric), 1.65%, 7/1/18 | | 760,000 | | | 767,828 | |
El Camino Community College District GO, Capital Appreciation, Series 2012 C, (Election of 2002), 0.00%, 8/1/33(2) | | 1,655,000 | | | 706,619 | |
Golden State Tobacco Securitization Corp. Settlement Rev., Series 2007 A1, 5.125%, 6/1/47 | | 4,000,000 | | | 3,515,680 | |
Independent Cities Finance Authority Mobilehome Park Rev., Series 2010 A, (Lamplighter Salinas), 6.15%, 7/15/40 | | 4,000,000 | | | 4,345,960 | |
Los Angeles Department of Water & Power Rev., Series 2012 C, (Power System), 5.00%, 1/1/16 | | 5,000,000 | | | 5,526,800 | |
Los Angeles Department of Water & Power Rev., Series 2013 B, 5.00%, 7/1/32(3) | | 1,000,000 | | | 1,144,320 | |
Morongo Band of Mission Indians Rev., Series 2008 B, (Enterprise Casino Services), 6.50%, 3/1/28(1) | | $1,000,000 | | | $1,125,510 | |
Oakland Redevelopment Agency Rev., 5.00%, 9/1/36 (Ambac) | | 3,350,000 | | | 3,374,187 | |
Palm Springs Airport Passenger Facility Charge Rev., (Palm Springs International Airport), 6.40%, 7/1/23 | | 250,000 | | | 255,718 | |
Palm Springs Airport Passenger Facility Charge Rev., (Palm Springs International Airport), 6.50%, 7/1/27 | | 260,000 | | | 264,836 | |
River Rock Entertainment Authority (The) Rev., Series 2011 B, 8.00%, 11/1/18 | | 3,221,000 | | | 3,176,840 | |
San Diego Unified School District GO, Capital Appreciation, Series 2012 E, (Election of 2008), 0.00%, 7/1/49(2) | | 1,000,000 | | | 168,600 | |
San Francisco City and County Redevelopment Financing Authority Tax Allocation Rev., Series 2009 D, (Mission Bay South Redevelopment), 6.625%, 8/1/39 | | 250,000 | | | 282,532 | |
San Mateo Special Tax Rev., (Community Facilities District No. 2008-1-Bay Meadows), 5.00%, 9/1/42 | | 2,000,000 | | | 2,033,940 | |
San Mateo Special Tax Rev., (Community Facilities District No. 2008-1-Bay Meadows), 6.00%, 9/1/42 | | 500,000 | | | 545,520 | |
Soledad Improvement Bond Act of 1915 District No. 2002-01 Special Assessment Rev., (Diamond Ridge), 6.75%, 9/2/33 | | 1,000,000 | | | 1,004,290 | |
Southern Kern Unified School District GO, Capital Appreciation, Series 2010 B, (Election of 2008), 0.00%, 11/1/40 (AGM)(2) | | 2,800,000 | | | 671,748 | |
Successor Agency to the Redevelopment Agency of the City & County of San Francisco Communities Facilities District No. 6 Special Tax Rev., Capital Appreciation, Series 2013 C, (Mission Bay South Public Improvements), 0.00%, 8/1/43(2) | | 3,500,000 | | | 622,195 | |
Sunnyvale Community Facilities District No. 1 Special Tax Rev., 7.75%, 8/1/32 | | 1,500,000 | | | 1,501,800 | |
Vallejo Multifamily Housing Rev., Series 1998 B, (Solano Affordable Housing), 8.25%, 4/1/39 | | 1,505,000 | | | 1,545,530 | |
Ventura County Public Financing Authority Rev., Series 2013 A, 5.00%, 11/1/43 | | 1,000,000 | | | 1,078,200 | |
| | | | | | 51,685,146 | |
COLORADO — 5.0% | |
Colorado Department of Transportation Rev., (Transportation Revenue Anticipation Notes), 5.00%, 12/15/16 | | 2,000,000 | | | 2,302,380 | |
Colorado Health Facilities Authority Rev., Series 2010 A (Total Longterm Care), 6.00%, 11/15/30 | | 500,000 | | | 560,995 | |
Denver Health & Hospital Authority Healthcare Rev., Series 2009 A, 6.25%, 12/1/33 | | 2,925,000 | | | 3,286,881 | |
Denver Urban Renewal Authority Tax Increment Rev., Series 2013 A1, 5.00%, 12/1/25 | | 1,500,000 | | | 1,712,850 | |
E-470 Public Highway Authority Rev., Capital Appreciation, Series 2000 B, (Capital Appreciation Projects), 0.00%, 9/1/20 (NATL-RE)(2) | | 2,000,000 | | | 1,566,100 | |
Granby Ranch Metropolitan District GO, 6.75%, 12/1/36 | | 1,851,000 | | | 1,882,356 | |
One Horse Business Improvement District Rev., (Sales Tax Sharing), 6.00%, 6/1/24 | | 3,000,000 | | | 3,024,840 | |
Plaza Metropolitan District No. 1 Tax Allocation Rev., 5.00%, 12/1/22 | | $500,000 | | | $552,510 | |
Plaza Metropolitan District No. 1 Tax Increment Allocation Rev., (Public Improvement Fee), 8.00%, 6/1/14, Prerefunded at 101% of Par(4) | | 1,500,000 | | | 1,629,480 | |
Regional Transportation District COP, Series 2013 A, 5.00%, 6/1/21 | | 1,000,000 | | | 1,181,460 | |
Regional Transportation District Private Activity Rev., (Denver Transit Partners), 6.00%, 1/15/41 | | 1,000,000 | | | 1,139,750 | |
Todd Creek Farms Metropolitan District No. 1 Rev., 5.60%, 12/1/14(5) | | 1,800,000 | | | 898,506 | |
Todd Creek Farms Metropolitan District No. 1 Rev., 6.125%, 12/1/19(5) | | 1,500,000 | | | 749,355 | |
| | | | | | 20,487,463 | |
DELAWARE — 0.4% | |
Delaware State Economic Development Authority Gas Facilities Rev., (Delmarva Power & Light Co.), 5.40%, 2/1/31 | | 1,500,000 | | | 1,664,445 | |
FLORIDA — 5.8% | |
Brevard County Industrial Development Rev., (TUFF Florida Institute of Technology), 6.75%, 11/1/39 | | 3,000,000 | | | 3,352,080 | |
Dupree Lakes Community Development District Special Assessment Rev., 6.83%, 11/1/15 | | 960,000 | | | 970,848 | |
Greater Orlando Aviation Authority Rev., (JetBlue Airways Corp.), 5.00%, 11/15/36 | | 1,000,000 | | | 1,028,420 | |
Hillsborough County Industrial Development Authority Rev., Series 2013 A, (Tampa General Hospital), 5.00%, 10/1/34 | | 1,250,000 | | | 1,342,287 | |
JEA Electric System Rev., Series 2013 A, 5.00%, 10/1/23 | | 500,000 | | | 599,090 | |
Martin County Health Facilities Authority Rev., (Martin Memorial Medical Center), 5.50%, 11/15/42 | | 1,500,000 | | | 1,629,210 | |
Martin County Industrial Development Authority Rev., (Indiantown Cogeneration), 4.20%, 12/15/25 | | 2,500,000 | | | 2,514,350 | |
Miami Beach Health Facilities Authority Rev., (Mount Sinai Medical Center), 5.00%, 11/15/29 | | 1,000,000 | | | 1,067,110 | |
Miami-Dade County Rev., Series 2012 B, 5.00%, 10/1/37 | | 1,500,000 | | | 1,633,485 | |
Miami-Dade County Health Facilities Authority Rev., Series 2008 A2, (Miami Children’s Hospital), VRDN, 4.55%, 8/1/13 (NATL-RE) | | 2,000,000 | | | 2,011,160 | |
Mid-Bay Bridge Authority Springing Lien Rev., Series 2011 A, 7.25%, 10/1/40 | | 2,000,000 | | | 2,489,580 | |
Putnam County Development Authority Pollution Control Rev., Series 2007 B, (Seminole Electric Cooperative, Inc.), VRDN, 5.35%, 5/1/18 (Ambac) | | 1,500,000 | | | 1,752,345 | |
South Lake County Hospital District Rev., Series 2010 A, (South Lake Hospital), 6.25%, 4/1/39 | | 1,000,000 | | | 1,129,560 | |
South-Dade Venture Community Development District Special Assessment Rev., 6.125%, 5/1/34 | | 1,245,000 | | | 1,283,757 | |
Village Community Development District No. 8 Special Assessment Rev., 6.125%, 5/1/39 | | 885,000 | | | 1,033,689 | |
| | | | | | 23,836,971 | |
GEORGIA — 3.9% | |
Atlanta Airport Rev., Series 2011 B, 5.00%, 1/1/29 | | 1,000,000 | | | 1,099,470 | |
Atlanta Water & Wastewater Rev., Series 2009 A, 6.25%, 11/1/39 | | 3,000,000 | | | 3,616,650 | |
DeKalb County Hospital Authority Rev., (DeKalb Medical Center, Inc.), 6.125%, 9/1/40 | | 800,000 | | | 923,152 | |
DeKalb County Water and Sewer Rev., Series 2011 A, 5.25%, 10/1/36 | | 1,000,000 | | | 1,138,280 | |
DeKalb County Water and Sewer Rev., Series 2011 A, 5.25%, 10/1/41 | | 1,000,000 | | | 1,128,970 | |
Georgia Municipal Electric Authority Rev., Series 2008 D, (General Resolution), 6.00%, 1/1/23 | | $3,000,000 | | | $3,616,620 | |
Marietta Development Authority Rev., (Life University, Inc.), 7.00%, 6/15/39 | | 4,000,000 | | | 4,289,840 | |
| | | | | | 15,812,982 | |
GUAM — 2.2% | |
Guam Government Department of Education COP, Series 2010 A, (John F. Kennedy High School), 6.625%, 12/1/30 | | 1,000,000 | | | 1,096,180 | |
Guam Government GO, Series 2007 A, 5.25%, 11/15/37 | | 1,800,000 | | | 1,821,312 | |
Guam Government GO, Series 2009 A, 7.00%, 11/15/39 | | 3,905,000 | | | 4,365,478 | |
Guam Government Waterworks Authority Rev., 6.00%, 7/1/25 | | 1,500,000 | | | 1,557,810 | |
| | | | | | 8,840,780 | |
HAWAII — 0.7% | |
Hawaii State Department of Budget & Finance Rev., (Special Purpose/Kahala Nui), 5.25%, 11/15/37 | | 1,000,000 | | | 1,083,250 | |
Hawaii State Department of Budget & Finance Rev., Series 2009 A, (15 Craigside), 9.00%, 11/15/44 | | 1,500,000 | | | 1,794,600 | |
| | | | | | 2,877,850 | |
IDAHO — 0.3% | |
Boise City Independent School District GO, Series 2012 B, 5.00%, 8/1/22 | | 1,000,000 | | | 1,236,420 | |
ILLINOIS — 3.4% | |
Bedford Park Tax Allocation Rev., 5.125%, 12/30/18 | | 1,325,000 | | | 1,330,181 | |
Chicago Tax Increment Allocation Rev., Series 2004 B, (Pilsen Redevelopment), (Junior Lien), 6.75%, 6/1/22 | | 3,000,000 | | | 3,101,310 | |
Cook County GO, Series 2011 A, 5.25%, 11/15/28 | | 800,000 | | | 922,880 | |
Hampshire Special Service Area No. 13 Special Tax Rev., (Tuscany Woods), 5.75%, 3/1/37(5)(6) | | 4,966,000 | | | 2,224,569 | |
Illinois Educational Facilities Authority Rev., Series 2001 B1, (University of Chicago), VRDN, 1.10%, 2/15/18 | | 1,125,000 | | | 1,135,215 | |
Illinois Finance Authority Rev., (Northwestern Memorial Healthcare), 5.00%, 8/15/43 | | 1,000,000 | | | 1,105,930 | |
Illinois Finance Authority Rev., Series 2009 A, (Rush University Medical Center Obligation Group), 7.25%, 11/1/30 | | 1,500,000 | | | 1,878,090 | |
Illinois GO, 5.00%, 8/1/25 | | 1,000,000 | | | 1,103,650 | |
Metropolitan Pier & Exposition Authority Rev., Capital Appreciation, Series 2012 B, (McCormick Place Project), 0.00%, 12/15/41(2) | | 2,500,000 | | | 611,575 | |
University of Illinois Rev., Series 2011 A, (Auxiliary Facilities System), 5.25%, 4/1/41 | | 625,000 | | | 685,206 | |
| | | | | | 14,098,606 | |
INDIANA — 0.6% | |
Indiana Finance Authority Rev., (Community Foundation of Northwest Indiana), 5.00%, 3/1/19 | | 1,000,000 | | | 1,167,600 | |
Indiana Finance Authority Rev., Series 2013, (Ohio River Bridges East End Crossing Project), 5.00%, 7/1/48 | | 1,100,000 | | | 1,128,886 | |
| | | | | | 2,296,486 | |
IOWA — 1.2% | |
Iowa Finance Authority Midwestern Disaster Area Rev., (Alcoa, Inc.), 4.75%, 8/1/42 | | 1,000,000 | | | 951,470 | |
Iowa Finance Authority Midwestern Disaster Area Rev., (Iowa Fertilizer Co.), 5.00%, 12/1/19 | | 1,000,000 | | | 1,032,460 | |
Iowa Finance Authority Midwestern Disaster Area Rev., (Iowa Fertilizer Co.), 5.50%, 12/1/22 | | 1,000,000 | | | 1,043,300 | |
Iowa Finance Authority Midwestern Disaster Area Rev., (Iowa Fertilizer Co.), 5.25%, 12/1/25 | | 1,000,000 | | | 1,032,610 | |
Iowa Tobacco Settlement Authority Rev., Series 2005 C, 5.625%, 6/1/46 | | 1,000,000 | | | 980,160 | |
| | | | | | 5,040,000 | |
KANSAS — 0.3% | |
Olathe Health Facilities Rev., (Olathe Medical Center), VRDN, 0.15%, 6/3/13 (LOC: Bank of America N.A.) | | $1,400,000 | | | $1,400,000 | |
LOUISIANA — 0.9% | |
New Orleans Aviation Board Rev., Series 2009 A, (Consolidated Rental Car), 6.50%, 1/1/40 | | 1,500,000 | | | 1,752,465 | |
New Orleans GO, 5.00%, 12/1/32 | | 500,000 | | | 544,350 | |
New Orleans GO, 5.00%, 12/1/33 | | 1,250,000 | | | 1,360,875 | |
| | | | | | 3,657,690 | |
MARYLAND — 2.9% | |
Anne Arundel County Special Obligation Tax Allocation Rev., (National Business Park), 6.10%, 7/1/40 | | 1,000,000 | | | 1,085,030 | |
Baltimore Special Obligation Tax Allocation Rev., Series 2008 A, (Resh Park), 7.00%, 9/1/38 | | 2,900,000 | | | 3,149,284 | |
Maryland Economic Development Corp. Rev., Series 2010 A, (Transportation Facilities), 5.75%, 6/1/35 | | 1,000,000 | | | 1,132,320 | |
Maryland Economic Development Corp. Facilities Rev., (CNX Marine Terminals, Inc.), 5.75%, 9/1/25 | | 1,000,000 | | | 1,108,790 | |
Maryland Health & Higher Educational Facilities Authority Rev., (Mercy Medical Center), 5.00%, 7/1/31 | | 1,500,000 | | | 1,636,530 | |
Maryland Health & Higher Educational Facilities Authority Rev., Series 2012 A, (Carroll Hospital), 5.00%, 7/1/37 | | 1,000,000 | | | 1,088,610 | |
Maryland Health & Higher Educational Facilities Authority Rev., Series 2013 A, (University of Maryland Medical System), 5.00%, 7/1/43 | | 1,500,000 | | | 1,606,755 | |
Maryland Industrial Development Financing Authority Rev., Series 2005 A, (Our Lady of Good Counsel High School), 6.00%, 5/1/35 | | 1,000,000 | | | 1,037,630 | |
| | | | | | 11,844,949 | |
MASSACHUSETTS — 1.6% | |
Massachusetts Development Finance Agency Rev., Series 2012 C, (Covanta Energy Project), 5.25%, 11/1/42 | | 1,000,000 | | | 1,021,190 | |
Massachusetts GO, Series 2012 A, VRN, 0.50%, 6/6/13 | | 3,000,000 | | | 3,005,790 | |
Massachusetts School Building Authority Sales Tax Rev., Series 2012 B, 5.00%, 8/15/28 | | 2,000,000 | | | 2,350,360 | |
| | | | | | 6,377,340 | |
MICHIGAN — 4.6% | |
Detroit City School District GO, Series 2012 A, (School Building & Site Improvement), 5.00%, 5/1/25 (Q-SBLF) | | 2,490,000 | | | 2,812,928 | |
Detroit Water and Sewerage Department Disposal Sewage System Rev., Series 2012 A, (Senior Lien), 5.25%, 7/1/26 | | 770,000 | | | 855,070 | |
Detroit Water and Sewerage Department Disposal Sewage System Rev., Series 2012 A, (Senior Lien), 5.00%, 7/1/32 | | 2,250,000 | | | 2,373,390 | |
Detroit Water and Sewerage Department Disposal Sewage System Rev., Series 2012 A, (Senior Lien), 5.25%, 7/1/39 | | 3,750,000 | | | 4,002,337 | |
Detroit Water Supply System Rev., Series 2011 A, (Senior Lien), 5.75%, 7/1/37 | | 1,000,000 | | | 1,102,750 | |
Flint Hospital Building Authority Rev., (Hurley Medical Center), 7.50%, 7/1/39 | | 1,250,000 | | | 1,456,275 | |
Kentwood Economic Development Corp. Rev., (Limited Obligation/Holland Home), 5.625%, 11/15/41 | | 1,750,000 | | | 1,836,503 | |
Michigan Finance Authority Rev., (Detroit School District), 5.50%, 6/1/21 | | 1,850,000 | | | 2,173,805 | |
Michigan Tobacco Settlement Finance Authority Rev., Series 2007 A, 6.00%, 6/1/48 | | 1,000,000 | | | 929,980 | |
Wayne County GO, Series 2009 A, (Building Improvement), 6.75%, 11/1/39 | | 960,000 | | | 1,085,472 | |
| | | | | | 18,628,510 | |
MISSOURI — 1.2% | |
Kirkwood Industrial Development Authority Rev., Series 2010 A, (Aberdeen Heights), 8.25%, 5/15/45 | | $3,000,000 | | | $3,561,930 | |
Missouri State Health & Educational Facilities Authority Rev., (Lutheran Senior Services), 6.00%, 2/1/41 | | 1,250,000 | | | 1,396,538 | |
| | | | | | 4,958,468 | |
NEBRASKA — 1.1% | |
Central Plains Energy Project Rev., 5.00%, 9/1/42 | | 1,360,000 | | | 1,462,802 | |
Santee Sioux Nation Tribal Health Care Rev., (Indian Health Service Joint Venture), 8.75%, 10/1/20 | | 3,000,000 | | | 3,223,320 | |
| | | | | | 4,686,122 | |
NEVADA — 0.5% | |
Henderson Local Improvement District No. T-15 Special Assessment Rev., 6.10%, 3/1/24 | | 980,000 | | | 1,009,214 | |
Las Vegas Improvement District No. 607 Special Assessment Rev., 5.50%, 6/1/13 | | 1,185,000 | | | 1,185,000 | |
| | | | | | 2,194,214 | |
NEW JERSEY — 6.0% | |
Mercer County Improvement Authority Rev., (Atlantic Foundation), VRDN, 0.13%, 6/3/13 (LOC: Bank of America N.A.) | | 550,000 | | | 550,000 | |
New Jersey Economic Development Authority Rev., (Continental Airlines, Inc.), 5.25%, 9/15/29 | | 1,000,000 | | | 1,063,430 | |
New Jersey Economic Development Authority Rev., Series 2006 B, (Gloucester Marine Terminal), 6.875%, 1/1/37 | | 3,000,000 | | | 3,043,890 | |
New Jersey Economic Development Authority Rev., Series 2006 C, (Gloucester Marine Terminal), 6.50%, 1/1/15 | | 1,405,000 | | | 1,416,521 | |
New Jersey Economic Development Authority Rev., Series 2013 NN, (School Facilities Construction), 5.00%, 3/1/19 | | 1,500,000 | | | 1,766,490 | |
New Jersey Educational Facilities Authority Rev., Series 2009 B, (University of Medicine & Dentistry), 7.50%, 12/1/32 | | 1,200,000 | | | 1,466,832 | |
New Jersey Rev., Series 2012 C, 2.50%, 6/27/13 | | 6,000,000 | | | 6,010,080 | |
New Jersey State Turnpike Authority Rev., Series 2012 A, 5.00%, 1/1/35 | | 2,000,000 | | | 2,182,740 | |
New Jersey Transportation Trust Fund Authority Rev., Series 2012 A, 5.00%, 6/15/42 | | 1,000,000 | | | 1,077,970 | |
New Jersey Transportation Trust Fund Authority Rev., Capital Appreciation, Series 2010 A, 0.00%, 12/15/32(2) | | 6,420,000 | | | 2,652,744 | |
Tobacco Settlement Financing Corp. Rev., Series 2007 1A, 4.75%, 6/1/34 | | 4,000,000 | | | 3,511,440 | |
| | | | | | 24,742,137 | |
NEW MEXICO — 0.9% | |
Cabezon Public Improvement District Special Tax Rev., 6.30%, 9/1/34 | | 1,490,000 | | | 1,542,448 | |
Montecito Estates Public Improvement District Levy Special Tax Rev., (City of Albuquerque), 7.00%, 10/1/37 | | 1,145,000 | | | 1,176,155 | |
Ventana West Public Improvement District Levy Special Tax Rev., 6.875%, 8/1/33 | | 1,000,000 | | | 1,009,830 | |
| | | | | | 3,728,433 | |
NEW YORK — 8.6% | |
Brooklyn Arena Local Development Corp. Rev., (Barclays Center), 6.25%, 7/15/40 | | 800,000 | | | 931,048 | |
Metropolitan Transportation Authority Rev., Series 2013 A, 5.00%, 11/15/43 | | 2,000,000 | | | 2,151,820 | |
Metropolitan Transportation Authority Rev., Series 2013 C, 5.00%, 11/15/23(3) | | 1,000,000 | | | 1,193,960 | |
Monroe County Industrial Development Corp. Rev., (Nazareth College Rochester), 5.50%, 10/1/41 | | 1,295,000 | | | 1,405,153 | |
New York City GO, Series 2013 F1, 5.00%, 3/1/37 | | 1,000,000 | | | 1,128,680 | |
New York City GO, Series 2013 J, 5.00%, 8/1/23(3) | | 750,000 | | | 917,895 | |
New York City Industrial Development Agency Rev., Series 2012 A, 5.00%, 7/1/28 | | $1,000,000 | | | $1,054,450 | |
New York City Municipal Water Finance Authority Rev., Series 2012 BB 5.00%, 6/15/47 | | 4,000,000 | | | 4,365,440 | |
New York City Transitional Finance Authority Rev., Series 2011 E, (Future Tax Secured Bonds), 5.00%, 11/1/18(7) | | 2,000,000 | | | 2,414,100 | |
New York City Transitional Finance Authority Rev., Series 2013 F1, (Future Tax Secured Bonds), 5.00%, 2/1/22 | | 1,000,000 | | | 1,219,350 | |
New York Liberty Development Corp. Rev., (Goldman Sachs Headquarters), 5.25%, 10/1/35 | | 2,030,000 | | | 2,367,609 | |
New York State Dormitory Authority Rev., (Orange Regional Medical Center), 6.25%, 12/1/37 | | 2,250,000 | | | 2,482,560 | |
New York State Dormitory Authority Rev., Series 2012 A, (State University of New York), 5.00%, 7/1/42 | | 1,100,000 | | | 1,229,679 | |
New York State Dormitory Authority Rev., Series 2012 B, 5.00%, 3/15/42 | | 2,500,000 | | | 2,768,525 | |
New York State Urban Development Corp. Rev., Series 2013 A1, (State Personal Income Tax), 5.00%, 3/15/43 | | 1,000,000 | | | 1,116,770 | |
Newburgh GO, Series 2012 A, 5.625%, 6/15/33 | | 1,400,000 | | | 1,456,308 | |
Port Authority of New York & New Jersey Special Obligation Rev., (John F. Kennedy International Airport Terminal), 6.00%, 12/1/36 | | 2,000,000 | | | 2,334,500 | |
Triborough Bridge & Tunnel Authority Rev., Series 2011 A, 5.00%, 1/1/28 | | 3,000,000 | | | 3,474,360 | |
Triborough Bridge & Tunnel Authority Rev., Capital Appreciation, Series 2013 A, 0.00%, 11/15/30(2) | | 2,500,000 | | | 1,250,950 | |
| | | | | | 35,263,157 | |
NORTH CAROLINA — 1.9% | |
Charlotte-Mecklenburg Hospital Authority Rev., Series 2013 A, (Carolinas Health Care System), 5.00%, 1/15/39 | | 1,250,000 | | | 1,375,713 | |
North Carolina Capital Facilities Finance Agency Rev., (Duke Energy Carolinas LLC), 4.375%, 10/1/31 | | 1,500,000 | | | 1,580,205 | |
North Carolina Municipal Power Agency No. 1 Catawba Electric Rev., Series 2008 A, 5.25%, 1/1/17 | | 4,000,000 | | | 4,616,000 | |
| | | | | | 7,571,918 | |
NORTH DAKOTA — 0.3% | |
Grand Forks Health Care Facilities Rev., Series 1996 A, (The United Hospital Obligation Group), VRDN, 0.12%, 6/3/13 (LOC: Bank of America N.A.) | | 1,300,000 | | | 1,300,000 | |
OHIO — 4.6% | |
Buckeye Tobacco Settlement Financing Authority Rev., Series 2007 A2, (Asset Backed Senior Turbo), 5.125%, 6/1/24 | | 3,000,000 | | | 2,816,100 | |
Buckeye Tobacco Settlement Financing Authority Rev., Series 2007 A2, (Asset Backed Senior Turbo), 5.875%, 6/1/30 | | 4,000,000 | | | 3,721,720 | |
Cleveland Airport System Rev., Series 2012 A, 5.00%, 1/1/30 | | 1,000,000 | | | 1,099,840 | |
JobsOhio Beverage System Rev., Series 2013 A, (Senior Lien), 5.00%, 1/1/20 | | 2,000,000 | | | 2,388,080 | |
Muskingum County Hospital Facilities Rev., (Genesis Health System), 5.00%, 2/15/21 | | 1,365,000 | | | 1,478,199 | |
Ohio Air Quality Development Authority Rev., Series 2009 D, (Pollution Control/First Energy), VRDN, 2.25%, 9/15/16 | | 2,000,000 | | | 2,018,360 | |
Pinnacle Community Infrastructure Financing Authority Rev., Series 2004 A, 6.25%, 12/1/36 | | 1,800,000 | | | 1,819,854 | |
Southeastern Ohio Port Authority Rev., (Memorial Health System), 6.00%, 12/1/42 | | 3,000,000 | | | 3,310,590 | |
| | | | | | 18,652,743 | |
OKLAHOMA — 1.8% | |
Oklahoma County Finance Authority Rev., Series 2012 A, (Epworth Villa), 5.00%, 4/1/23 | | $1,000,000 | | | $1,064,680 | |
Oklahoma Development Finance Authority Rev., (Inverness Village Community), 6.00%, 1/1/32 | | 1,250,000 | | | 1,363,638 | |
Oklahoma Turnpike Authority Rev., Series 2011 A, (Second Series), 5.00%, 1/1/28 | | 2,000,000 | | | 2,309,780 | |
Tulsa County Industrial Authority Senior Living Community Rev., Series 2010 A, (Montereau, Inc.), 7.25%, 11/1/40 | | 2,500,000 | | | 2,809,050 | |
| | | | | | 7,547,148 | |
OREGON — 1.3% | |
Forest Grove Student Housing Rev., (Oak Tree Foundation), 5.50%, 3/1/37 | | 1,400,000 | | | 1,429,778 | |
Oregon GO, Series 2011 J, 5.00%, 5/1/36 | | 1,250,000 | | | 1,431,137 | |
Salem Hospital Facility Authority Rev., (Capital Manor, Inc.), 6.00%, 5/15/42 | | 1,000,000 | | | 1,076,690 | |
Salem Hospital Facility Authority Rev., (Capital Manor, Inc.), 6.00%, 5/15/47 | | 1,250,000 | | | 1,342,738 | |
| | | | | | 5,280,343 | |
PENNSYLVANIA — 3.4% | |
Allegheny County Industrial Development Authority Rev., (Environmental Improvement), 6.75%, 11/1/24 | | 1,000,000 | | | 1,153,630 | |
Allegheny County Industrial Development Authority Rev., (Environmental Improvement), 6.875%, 5/1/30 | | 1,000,000 | | | 1,148,450 | |
Allegheny County Redevelopment Authority Tax Allocation Rev., (Pittsburgh Mills), 5.60%, 7/1/23 | | 1,500,000 | | | 1,542,165 | |
Delaware River Port Authority Rev., (Port District Project), 5.00%, 1/1/27 | | 1,835,000 | | | 2,034,538 | |
Pennsylvania Economic Development Financing Authority Rev., Series 2009 A, (Albert Einstein Healthcare Network), 6.25%, 10/15/23 | | 2,000,000 | | | 2,321,680 | |
Pennsylvania Higher Educational Facilities Authority Rev., (Shippensburg University Student Services, Inc.), 5.00%, 10/1/44 | | 300,000 | | | 321,711 | |
Pennsylvania Turnpike Commission Rev., Series 2011 B, 5.25%, 12/1/41 | | 2,000,000 | | | 2,173,400 | |
Philadelphia Gas Works Rev., Series 2009 A, (1998 General Ordinance), 5.00%, 8/1/16 | | 1,440,000 | | | 1,585,627 | |
Philadelphia Municipal Authority Lease Rev., 6.50%, 4/1/39 | | 1,500,000 | | | 1,693,695 | |
| | | | | | 13,974,896 | |
PUERTO RICO — 7.1% | |
Puerto Rico Aqueduct & Sewer Authority Rev., Series 2012 A, (Senior Lien), 5.00%, 7/1/21 | | 1,760,000 | | | 1,761,672 | |
Puerto Rico Aqueduct & Sewer Authority Rev., Series 2012 A, (Senior Lien), 5.25%, 7/1/24 | | 3,250,000 | | | 3,264,982 | |
Puerto Rico Aqueduct & Sewer Authority Rev., Series 2012 A, (Senior Lien), 5.25%, 7/1/29 | | 5,000,000 | | | 4,964,900 | |
Puerto Rico GO, Series 2001 A, (Public Improvement), 5.50%, 7/1/19 | | 2,405,000 | | | 2,564,620 | |
Puerto Rico GO, Series 2001 A, (Public Improvement), 5.50%, 7/1/20 (NATL-RE) | | 1,400,000 | | | 1,485,386 | |
Puerto Rico GO, Series 2008 A, 6.00%, 7/1/38 | | 1,500,000 | | | 1,550,565 | |
Puerto Rico GO, Series 2012 A, (Public Improvement), 5.50%, 7/1/39 | | 2,285,000 | | | 2,310,112 | |
Puerto Rico Government Development Bank Rev., Series 2006 B, (Senior Notes), 5.00%, 12/1/15 | | 2,950,000 | | | 3,083,871 | |
Puerto Rico Public Buildings Authority Rev., Series 2007 M, (Government Facilities), 5.75%, 7/1/16 | | 4,555,000 | | | 4,849,891 | |
Puerto Rico Public Finance Corp. Rev., Series 2011 B, (Commonwealth Appropriation), 5.50%, 8/1/31 (SBBPA: Government Development Bank for Puerto Rico) | | $400,000 | | | $399,056 | |
Puerto Rico Sales Tax Financing Corp. Rev., Series 2011 C, 5.00%, 8/1/40 | | 2,500,000 | | | 2,639,575 | |
| | | | | | 28,874,630 | |
SOUTH CAROLINA — 0.9% | |
South Carolina Jobs-Economic Development Authority Hospital Rev., (Palmetto Health), 5.75%, 8/1/39 | | 1,475,000 | | | 1,627,028 | |
Spartanburg County Regional Health Services District Rev., Series 2012 A, 5.00%, 4/15/37 | | 2,000,000 | | | 2,172,180 | |
| | | | | | 3,799,208 | |
TENNESSEE — 2.1% | |
Clarksville Public Building Authority Rev., (Adjusted Financing Morristown Loans), VRDN, 0.17%, 6/3/13 (LOC: Bank of America N.A.) | | 2,000,000 | | | 2,000,000 | |
Clarksville Public Building Authority Rev., (Adjusted Financing Tennessee Municipal Bond), VRDN, 0.17%, 6/3/13 (LOC: Bank of America N.A.) | | 1,020,000 | | | 1,020,000 | |
Clarksville Public Building Authority Rev., (Adjusted Financing Tennessee Municipal Bond), VRDN, 0.17%, 6/3/13 (LOC: Bank of America N.A.) | | 1,115,000 | | | 1,115,000 | |
Montgomery County Public Building Authority Rev., (Tennessee County Loan Pool), VRDN, 0.17%, 6/3/13 (LOC: Bank of America N.A.) | | 4,180,000 | | | 4,180,000 | |
Montgomery County Public Building Authority Rev., (Tennessee County Loan Pool), VRDN, 0.17%, 6/3/13 (LOC: Bank of America N.A.) | | 390,000 | | | 390,000 | |
| | | | | | 8,705,000 | |
TEXAS — 4.0% | |
Central Texas Regional Mobility Authority Rev., Series 2013 A, 5.00%, 1/1/17 | | 500,000 | | | 556,010 | |
Central Texas Regional Mobility Authority Rev., Series 2013 A, 5.00%, 1/1/18 | | 250,000 | | | 283,155 | |
Dallas-Fort Worth International Airport Rev., Series 2012 G, 3.00%, 11/1/14 | | 400,000 | | | 415,012 | |
Dallas-Fort Worth International Airport Rev., Series 2012 G, 4.00%, 11/1/15 | | 500,000 | | | 542,130 | |
Dallas-Fort Worth International Airport Facilities Improvement Corp. Rev., Series 2012 B, 5.00%, 11/1/26 | | 3,000,000 | | | 3,385,260 | |
La Vernia Higher Education Finance Corp. Rev., Series 2009 A, (Kipp, Inc.), 6.25%, 8/15/39 | | 1,000,000 | | | 1,156,360 | |
Love Field Airport Modernization Corp. Special Facilities Rev., (Southwest Airlines Co.), 5.25%, 11/1/40 | | 1,000,000 | | | 1,076,840 | |
Tarrant County Cultural Education Facilities Finance Corp. Rev., (Scott & White Healthcare Obligated Group), 5.00%, 8/15/43 | | 1,000,000 | | | 1,090,510 | |
Texas Private Activity Bond Surface Transportation Corp. Rev., (Senior Lien/LBJ Infrastructure), 7.00%, 6/30/40 | | 3,000,000 | | | 3,643,080 | |
Texas Public Finance Authority Charter School Finance Corp. Rev., Series 2010 A, (Cosmos Foundation, Inc.), 6.20%, 2/15/40 | | 1,500,000 | | | 1,766,385 | |
Texas Transportation Commission Turnpike System Rev., Series 2012 B, (First Tier), VRDN, 1.25%, 2/15/15 | | 600,000 | | | 604,410 | |
Travis County Health Facilities Development Corp. Rev., (Westminster Manor Health), 7.125%, 11/1/40 | | 1,500,000 | | | 1,769,715 | |
| | | | | | 16,288,867 | |
U.S. VIRGIN ISLANDS — 1.0% | |
Virgin Islands Public Finance Authority Rev., Series 2009 A, (Diageo Matching Fund Bonds), 6.75%, 10/1/37 | | $2,000,000 | | | $2,331,040 | |
Virgin Islands Public Finance Authority Rev., Series 2010 B, (Subordinated Lien), 5.25%, 10/1/29 | | 1,500,000 | | | 1,623,525 | |
| | | | | | 3,954,565 | |
VIRGINIA — 2.3% | |
Chesapeake Expressway Toll Road Rev., Capital Appreciation, Series 2012 B, 0.00%, 7/15/23(8) | | 1,380,000 | | | 783,923 | |
Dulles Town Center Community Development Authority Special Assessment Rev., 4.25%, 3/1/26 | | 750,000 | | | 737,632 | |
Fairfax County Economic Development Authority Rev., (Silver Line Phase I), 5.00%, 4/1/36 | | 570,000 | | | 627,542 | |
Mosaic Community Development Authority Tax Allocation Rev., Series 2011 A, 6.875%, 3/1/36 | | 1,000,000 | | | 1,151,030 | |
Route 460 Funding Corp. Rev., Capital Appreciation, Series 2012 B, 0.00%, 7/1/35(2) | | 1,075,000 | | | 355,427 | |
Virginia Resources Authority Clean Water Rev., (State Revolving Fund), 5.00%, 10/1/23(3) | | 2,000,000 | | | 2,490,940 | |
Virginia Small Business Financing Authority Rev., (Senior Lien/Express Lanes LLC Project), 5.00%, 1/1/40 | | 2,000,000 | | | 2,064,720 | |
Washington County Industrial Development Authority Hospital Facility Rev., Series 2009 C, (Mountain States Health Alliance), 7.75%, 7/1/38 | | 1,000,000 | | | 1,215,790 | |
| | | | | | 9,427,004 | |
WASHINGTON — 0.6% | |
Port of Seattle Rev., Series 2000 B, 6.00%, 2/1/15 (NATL-RE) | | 250,000 | | | 272,343 | |
Port of Seattle Industrial Development Corp. Rev., (Delta Airlines, Inc.), 5.00%, 4/1/30 | | 1,000,000 | | | 1,028,100 | |
Tacoma Electric System Rev., Series 2013 A, 5.00%, 1/1/38(3) | | 1,000,000 | | | 1,118,820 | |
| | | | | | 2,419,263 | |
WISCONSIN — 2.4% | |
Public Finance Authority Rev., (Roseman University Health Sciences), 5.50%, 4/1/32 | | 2,000,000 | | | 2,060,480 | |
Wisconsin Department of Transportation Rev., Series 1, 5.00%, 7/1/30 | | 2,500,000 | | | 2,933,400 | |
Wisconsin Health & Educational Facilities Authority Rev., (Luther Hospital), 5.75%, 11/15/30 | | 1,200,000 | | | 1,401,888 | |
Wisconsin Health & Educational Facilities Authority Rev., Series 2004 A, (Southwest Health Center), 6.25%, 4/1/14, Prerefunded at 100% of Par(4) | | 2,000,000 | | | 2,096,020 | |
Wisconsin Health & Educational Facilities Authority Rev., Series 2009 A, (St. John’s Communities, Inc.), 7.625%, 9/15/39 | | 1,000,000 | | | 1,150,810 | |
| | | | | | 9,642,598 | |
WYOMING — 0.5% | |
Campbell County Solid Waste Facilities Rev., Series 2009 A, (Basin Electric Power Cooperative), 5.75%, 7/15/39 | | 2,000,000 | | | 2,239,540 | |
TOTAL INVESTMENT SECURITIES — 101.0% (Cost $396,235,084) | | | 413,646,973 | |
OTHER ASSETS AND LIABILITIES — (1.0)% | | | (4,194,305 | ) |
TOTAL NET ASSETS — 100.0% | | | $409,452,668 | |
Futures Contracts |
Contracts Purchased | Expiration Date | Underlying Face
Amount at Value | Unrealized Gain (Loss) |
52 | U.S. Treasury 30-Year Bonds | September 2013 | $7,281,625 | $(94,367) |
Notes to Schedule of Investments
AGM = Assured Guaranty Municipal Corporation
COP = Certificates of Participation
GO = General Obligation
LOC = Letter of Credit
NATL-RE = National Public Finance Guarantee Corporation - Reinsured
Q-SBLF = Qualified School Board Loan Fund
SBBPA = Standby Bond Purchase Agreement
VRDN = Variable Rate Demand Note. Interest reset date is indicated. Rate shown is effective at the period end.
VRN = Variable Rate Note. Interest reset date is indicated. Rate shown is effective at the period end.
(1) | Security was purchased under Rule 144A of the Securities Act of 1933 or is a private placement and, unless registered under the Act or exempted from registration, may only be sold to qualified institutional investors. The aggregate value of these securities at the period end was $1,803,011, which represented 0.4% of total net assets. |
(2) | Security is a zero-coupon bond. Zero-coupon securities are issued at a substantial discount from their value at maturity. |
(3) | When-issued security. The issue price and yield are fixed on the date of the commitment, but payment and delivery are scheduled for a future date. |
(4) | Escrowed to maturity in U.S. government securities or state and local government securities. |
(5) | Security is in default. |
(7) | Security, or a portion thereof, has been pledged at the custodian bank or with a broker for margin requirements on futures contracts. At the period end, the aggregate value of securities pledged was $235,375. |
(8) | Coupon rate adjusts periodically based upon a predetermined schedule. Interest reset date is indicated. Rate shown is effective at the period end. |
See Notes to Financial Statements.
Statement of Assets and Liabilities |
MAY 31, 2013 | |
Assets | |
Investment securities, at value (cost of $396,235,084) | | $413,646,973 | |
Cash | | 23,221 | |
Receivable for investments sold | | 4,966,941 | |
Receivable for capital shares sold | | 327,584 | |
Interest receivable | | 5,996,068 | |
| | | 424,960,787 | |
| | | | |
Liabilities | |
Payable for investments purchased | | 9,132,838 | |
Payable for capital shares redeemed | | 5,822,349 | |
Payable for variation margin on futures contracts | | 24,375 | |
Accrued management fees | | 213,175 | |
Distribution and service fees payable | | 52,826 | |
Dividends payable | | 262,556 | |
| | | 15,508,119 | |
| | | | |
Net Assets | | $409,452,668 | |
| | | | |
| | | | |
Net Assets Consist of: | |
Capital paid in | | $422,450,725 | |
Distributions in excess of net investment income | | (143,992 | ) |
Accumulated net realized loss | | (30,171,587 | ) |
Net unrealized appreciation | | 17,317,522 | |
| | | $409,452,668 | |
| | | | | | | | | | |
| | | Net assets | | | Shares outstanding | | | Net asset value per share | |
Investor Class | | $265,528,690 | | | 27,795,287 | | | $9.55 | |
Institutional Class | | $4,273,377 | | | 447,101 | | | $9.56 | |
A Class | | $104,785,490 | | | 10,968,998 | | | $9.55* | |
C Class | | $34,865,111 | | | 3,651,662 | | | $9.55 | |
*Maximum offering price $10.00 (net asset value divided by 0.955).
See Notes to Financial Statements.
YEAR ENDED MAY 31, 2013 | |
Investment Income (Loss) | |
Income: | | | |
Interest | | $19,408,543 | |
| | | | |
Expenses: | | | |
Management fees | | 2,407,978 | |
Distribution and service fees: | | | |
A Class | | 250,199 | |
C Class | | 343,128 | |
Trustees’ fees and expenses | | 26,327 | |
Other expenses | | 25 | |
| | | 3,027,657 | |
| | | | |
Net investment income (loss) | | 16,380,886 | |
| | | | |
Realized and Unrealized Gain (Loss) | |
Net realized gain (loss) on: | | | |
Investment transactions | | 11,465,241 | |
Futures contract transactions | | 302,920 | |
| | | 11,768,161 | |
| | | | |
Change in net unrealized appreciation (depreciation) on: | | | |
Investments | | (2,450,419 | ) |
Futures contracts | | (31,017 | ) |
| | | (2,481,436 | ) |
| | | | |
Net realized and unrealized gain (loss) | | 9,286,725 | |
| | | | |
Net Increase (Decrease) in Net Assets Resulting from Operations | | $25,667,611 | |
See Notes to Financial Statements.
Statement of Changes in Net Assets |
YEARS ENDED MAY 31, 2013 AND MAY 31, 2012 | |
Increase (Decrease) in Net Assets | | May 31, 2013 | | | May 31, 2012 | |
Operations | |
Net investment income (loss) | | $16,380,886 | | | $13,780,567 | |
Net realized gain (loss) | | 11,768,161 | | | 1,088,552 | |
Change in net unrealized appreciation (depreciation) | | (2,481,436 | ) | | 25,977,697 | |
Net increase (decrease) in net assets resulting from operations | | 25,667,611 | | | 40,846,816 | |
| | | | | | | |
Distributions to Shareholders | |
From net investment income: | | | | | | |
Investor Class | | (11,069,521 | ) | | (8,479,155 | ) |
Institutional Class | | (410,861 | ) | | (280,244 | ) |
A Class | | (3,947,892 | ) | | (3,914,438 | ) |
B Class | | — | | | (28,573 | ) |
C Class | | (1,096,604 | ) | | (1,078,182 | ) |
Decrease in net assets from distributions | | (16,524,878 | ) | | (13,780,592 | ) |
| | | | | | | |
Capital Share Transactions | |
Net increase (decrease) in net assets from capital share transactions | | 31,602,469 | | | 105,503,686 | |
| | | | | | | |
Net increase (decrease) in net assets | | 40,745,202 | | | 132,569,910 | |
| | | | | | | |
Net Assets | |
Beginning of period | | 368,707,466 | | | 236,137,556 | |
End of period | | $409,452,668 | | | $368,707,466 | |
| | | | | | | |
Distributions in excess of net investment income | | $(143,992 | ) | | — | |
See Notes to Financial Statements.
Notes to Financial Statements |
MAY 31, 2013
1. Organization
American Century Municipal Trust (the trust) is registered under the Investment Company Act of 1940, as amended (the 1940 Act), as an open-end management investment company and is organized as a Massachusetts business trust. High-Yield Municipal Fund (the fund) is one fund in a series issued by the trust. The fund is nondiversified as defined under the 1940 Act. The fund’s investment objective is to seek high current income that is exempt from federal income tax. Capital appreciation is a secondary objective.
The fund offers the Investor Class, the Institutional Class, the A Class and the C Class. The A Class may incur an initial sales charge. The A Class and C Class may be subject to a contingent deferred sales charge. The share classes differ principally in their respective sales charges and distribution and shareholder servicing expenses and arrangements. The Institutional Class is made available to institutional shareholders or through financial intermediaries whose clients do not require the same level of shareholder and administrative services as shareholders of other classes. As a result, the Institutional Class is charged a lower unified management fee. On October 21, 2011, all outstanding B Class shares were converted to A Class shares and the fund discontinued offering the B Class.
2. Significant Accounting Policies
The following is a summary of significant accounting policies consistently followed by the fund in preparation of its financial statements. The financial statements are prepared in conformity with accounting principles generally accepted in the United States of America, which may require management to make certain estimates and assumptions at the date of the financial statements. Actual results could differ from these estimates.
Investment Valuations — The fund determines the fair value of its investments and computes its net asset value per share as of the close of regular trading (usually 4 p.m. Eastern time) on the New York Stock Exchange (NYSE) on each day the NYSE is open.
Debt securities maturing in greater than 60 days at the time of purchase are valued at the evaluated mean as provided by independent pricing services or at the mean of the most recent bid and asked prices as provided by investment dealers. Debt securities maturing within 60 days at the time of purchase may be valued at cost, plus or minus any amortized discount or premium or at the evaluated mean as provided by an independent pricing service. Evaluated mean prices are commonly derived through utilization of market models, which may consider, among other factors, trade data, quotations from dealers and active market makers, relevant yield curve and spread data, related sector levels, creditworthiness, and other relevant market information on the same or comparable securities.
Exchange-traded futures contracts are valued at the settlement price as provided by the appropriate clearing corporation.
If the fund determines that the market price for a portfolio security is not readily available or the valuation methods mentioned above do not reflect a security’s fair value, such security is valued as determined in good faith by the Board of Trustees or its designee, in accordance with procedures adopted by the Board of Trustees. Circumstances that may cause the fund to use these procedures to value a security include, but are not limited to: a security has been declared in default; trading in a security has been halted during the trading day; there is a foreign market holiday and no trading occurred; or an event occurred between the close of a foreign exchange and the NYSE that may affect the value of a security.
Security Transactions — Security transactions are accounted for as of the trade date. Net realized gains and losses are determined on the identified cost basis, which is also used for federal income tax purposes.
Investment Income — Interest income is recorded on the accrual basis and includes accretion of discounts and amortization of premiums.
Segregated Assets — In accordance with the 1940 Act, the fund segregates assets on its books and records to cover certain types of investments, including, but not limited to, futures contracts and when-issued securities. American Century Investment Management, Inc. (ACIM) (the investment advisor) monitors, on a daily basis, the securities segregated to ensure the fund designates a sufficient amount of liquid assets, marked-to-market daily. The fund may also receive assets or be required to pledge assets at the custodian bank or with a broker for margin requirements on futures contracts.
Income Tax Status — It is the fund’s policy to distribute substantially all net investment income and net realized gains to shareholders and to otherwise qualify as a regulated investment company under provisions of the Internal Revenue Code. Accordingly, no provision has been made for income taxes. The fund files U.S. federal, state, local and non-U.S. tax returns as applicable. The fund’s tax returns are subject to examination by the relevant taxing authority until expiration of the applicable statute of limitations, which is generally three years from the date of filing but can be longer in certain jurisdictions. At this time, management believes there are no uncertain tax positions which, based on their technical merit, would not be sustained upon examination and for which it is reasonably possible that the total amounts of unrecognized tax benefits will significantly change in the next twelve months.
Multiple Class — All shares of the fund represent an equal pro rata interest in the net assets of the class to which such shares belong, and have identical voting, dividend, liquidation and other rights and the same terms and conditions, except for class specific expenses and exclusive rights to vote on matters affecting only individual classes. Income, non-class specific expenses, and realized and unrealized capital gains and losses of the fund are allocated to each class of shares based on their relative net assets.
Distributions to Shareholders — Distributions from net investment income are declared daily and paid monthly. Distributions from net realized gains, if any, are generally declared and paid annually.
Indemnifications — Under the trust’s organizational documents, its officers and trustees are indemnified against certain liabilities arising out of the performance of their duties to the fund. In addition, in the normal course of business, the fund enters into contracts that provide general indemnifications. The maximum exposure under these arrangements is unknown as this would involve future claims that may be made against a fund. The risk of material loss from such claims is considered by management to be remote.
3. Fees and Transactions with Related Parties
Management Fees — The trust has entered into a management agreement with ACIM, under which ACIM provides the fund with investment advisory and management services in exchange for a single, unified management fee (the fee) per class. The agreement provides that all expenses of managing and operating the fund, except distribution and service fees, brokerage expenses, taxes, interest, fees and expenses of the independent trustees (including legal counsel fees), and extraordinary expenses, will be paid by ACIM. The fee is computed and accrued daily based on each class’s daily net assets and paid monthly in arrears. The fee consists of (1) an Investment Category Fee based on the daily net assets of the fund and certain other accounts managed by the investment advisor that are in the same broad investment category as the fund and (2) a Complex Fee based on the assets of all the funds in the American Century Investments family of funds. The rates for the Investment Category Fee range from 0.2925% to 0.4100%. The rates for the Complex Fee range from 0.2500% to 0.3100% for the Investor Class, A Class and C Class. The Institutional Class is 0.2000% less at each point within the Complex Fee range. The effective annual management fee for each class for the year ended May 31, 2013 was 0.59% for the Investor Class, A Class and C Class and 0.39% for the Institutional Class.
Distribution and Service Fees — The Board of Trustees has adopted a separate Master Distribution and Individual Shareholder Services Plan for each of the A Class and C Class (collectively the plans), pursuant to Rule 12b-1 of the 1940 Act. The plans provide that the A Class will pay American Century Investment Services, Inc. (ACIS) an annual distribution and service fee of 0.25%. The plans provide that the C Class will pay ACIS an annual distribution and service fee of 1.00%, of which 0.25% is paid for individual
shareholder services and 0.75% is paid for distribution services. The fees are computed and accrued daily based on each class’s daily net assets and paid monthly in arrears. The fees are used to pay financial intermediaries for distribution and individual shareholder services. Fees incurred under the plans during the year ended May 31, 2013 are detailed in the Statement of Operations.
Related Parties — Certain officers and trustees of the trust are also officers and/or directors of American Century Companies, Inc. (ACC). The trust’s investment advisor, ACIM, the trust’s distributor, ACIS, and the trust’s transfer agent, American Century Services, LLC are wholly owned, directly or indirectly, by ACC.
4. Investment Transactions
Purchases and sales of investment securities, excluding short-term investments, for the year ended May 31, 2013 were $477,085,063 and $448,046,620, respectively.
5. Capital Share Transactions
Transactions in shares of the fund were as follows (unlimited number of shares authorized):
| | | | | | | |
| | | Year ended May 31, 2013 | | | Year ended May 31, 2012 | |
| | | Shares | | | Amount | | | Shares | | | Amount | |
Investor Class | |
Sold | | 15,632,861 | | | $149,509,037 | | | 18,336,008 | | | $164,017,104 | |
Issued in reinvestment of distributions | | 880,935 | | | 8,434,100 | | | 708,750 | | | 6,342,774 | |
Redeemed | | (14,246,298 | ) | | (136,184,513 | ) | | (8,382,904 | ) | | (74,862,804 | ) |
| | | 2,267,498 | | | 21,758,624 | | | 10,661,854 | | | 95,497,074 | |
Institutional Class | | | | | | | | | | | | |
Sold | | 2,065,386 | | | 19,671,089 | | | 267,756 | | | 2,413,077 | |
Issued in reinvestment of distributions | | 38,052 | | | 364,054 | | | 31,359 | | | 280,164 | |
Redeemed | | (2,434,993 | ) | | (23,334,364 | ) | | (88,544 | ) | | (773,194 | ) |
| | | (331,555 | ) | | (3,299,221 | ) | | 210,571 | | | 1,920,047 | |
A Class | | | | | | | | | | | | |
Sold | | 4,337,611 | | | 41,591,587 | | | 3,255,978 | | | 29,011,830 | |
Issued in reinvestment of distributions | | 317,467 | | | 3,038,930 | | | 349,024 | | | 3,110,865 | |
Redeemed | | (3,573,119 | ) | | (34,213,774 | ) | | (2,935,800 | ) | | (26,108,582 | ) |
| | | 1,081,959 | | | 10,416,743 | | | 669,202 | | | 6,014,113 | |
B Class | | N/A | | | | | | | | | | |
Sold | | | | | | | | 6,951 | | | 59,477 | |
Issued in reinvestment of distributions | | | | | | | | 1,813 | | | 15,716 | |
Redeemed | | | | | | | | (217,240 | ) | | (1,902,063 | ) |
| | | | | | | | | (208,476 | ) | | (1,826,870 | ) |
C Class | | | | | | | | | | | | |
Sold | | 957,241 | | | 9,141,670 | | | 1,017,945 | | | 9,113,560 | |
Issued in reinvestment of distributions | | 61,344 | | | 587,049 | | | 58,740 | | | 523,189 | |
Redeemed | | (731,536 | ) | | (7,002,396 | ) | | (642,179 | ) | | (5,737,427 | ) |
| | | 287,049 | | | 2,726,323 | | | 434,506 | | | 3,899,322 | |
Net increase (decrease) | | 3,304,951 | | | $31,602,469 | | | 11,767,657 | | | $105,503,686 | |
6. Fair Value Measurements
The fund’s securities valuation process is based on several considerations and may use multiple inputs to determine the fair value of the positions held by the fund. In conformity with accounting principles generally accepted in the United States of America, the inputs used to determine a valuation are classified into three broad levels as follows:
• | Level 1 valuation inputs consist of unadjusted quoted prices in an active market for identical securities; |
• | Level 2 valuation inputs consist of direct or indirect observable market data (including quoted prices for similar securities, evaluations of subsequent market events, interest rates, prepayment speeds, credit risk, etc.); or |
• | Level 3 valuation inputs consist of unobservable data (including a fund’s own assumptions). |
The level classification is based on the lowest level input that is significant to the fair valuation measurement. The valuation inputs are not necessarily an indication of the risks associated with investing in these securities or other financial instruments.
As of period end, the fund’s investment securities and unrealized gain (loss) on futures contracts were classified as Level 2 and Level 1, respectively. The Schedule of Investments provides additional information on the fund’s portfolio holdings.
7. Derivative Instruments
Interest Rate Risk — The fund is subject to interest rate risk in the normal course of pursuing its investment objectives. The value of bonds generally declines as interest rates rise. A fund may enter into futures contracts based on a bond index or a specific underlying security. A fund may purchase futures contracts to gain exposure to increases in market value or sell futures contracts to protect against a decline in market value. Upon entering into a futures contract, a fund will segregate cash, cash equivalents or other appropriate liquid securities on its records in amounts sufficient to meet requirements. Subsequent payments (variation margin) are made or received daily, in cash, by a fund. The variation margin is equal to the daily change in the contract value and is recorded as unrealized gains and losses. A fund recognizes a realized gain or loss when the futures contract is closed or expires. Net realized and unrealized gains or losses occurring during the holding period of futures contracts are a component of net realized gain (loss) on futures contract transactions and change in net unrealized appreciation (depreciation) on futures contracts, respectively. One of the risks of entering into futures contracts is the possibility that the change in value of the contract may not correlate with the changes in value of the underlying securities. The fund regularly purchased and sold interest rate risk derivative instruments throughout the reporting period and the instruments held at period end as disclosed on the Schedule of Investments are indicative of the fund’s typical volume.
The value of interest rate risk derivative instruments as of May 31, 2013, is disclosed on the Statement of Assets and Liabilities as a liability of $24,375 in payable for variation margin on futures contracts.* For the year ended May 31, 2013, the effect of interest rate risk derivative instruments on the Statement of Operations was $302,920 in net realized gain (loss) on futures contract transactions and $(31,017) in change in net unrealized appreciation (depreciation) on futures contracts.
*Included in the unrealized gain (loss) on futures contracts as reported in the Schedule of Investments.
8. Risk Factors
The fund invests in lower-rated debt securities, which are subject to substantial risks including liquidity risk and credit risk.
The fund’s investment process may result in high portfolio turnover, which could mean high transaction costs, affecting both performance and capital gains tax liabilities to investors.
9. Federal Tax Information
The tax character of distributions paid during the years ended May 31, 2013 and May 31, 2012 were as follows:
| | | | | | | |
| | | 2013 | | | 2012 | |
Distributions Paid From | |
Exempt income | | $16,471,235 | | | $13,778,051 | |
Taxable ordinary income | | $53,643 | | | $2,541 | |
Long-term capital gains | | — | | | — | |
The book-basis character of distributions made during the year from net investment income or net realized gains may differ from their ultimate characterization for federal income tax purposes. These differences reflect the differing character of certain income items and net realized gains and losses for financial statement and tax purposes, and may result in reclassification among certain capital accounts on the financial statements.
As of May 31, 2013, the federal tax cost of investments and the components of distributable earnings on a tax-basis were as follows:
| | | | |
Federal tax cost of investments | | $396,089,919 | |
Gross tax appreciation of investments | | $23,635,016 | |
Gross tax depreciation of investments | | (6,077,962 | ) |
Net tax appreciation (depreciation) of investments | | $17,557,054 | |
Undistributed tax-exempt income | | $32,532 | |
Accumulated short-term capital losses | | $(30,587,643 | ) |
The difference between book-basis and tax-basis unrealized appreciation (depreciation) is attributable primarily to the treatment of non-shareholder capital contributions and income from defaulted securities.
Accumulated capital losses represent net capital loss carryovers that may be used to offset future realized capital gains for federal income tax purposes. Future capital loss carryover utilization in any given year may be subject to Internal Revenue Code limitations. Capital loss carryovers expire as follows:
| | | | |
2016 | 2017 | 2018 | 2019 |
$(151,664) | $(8,112,975) | $(11,481,481) | $(10,841,523) |
| |
For a Share Outstanding Throughout the Years Ended May 31 (except as noted) |
Per-Share Data | | Ratios and Supplemental Data | |
| | | | | | Income From Investment Operations: | | | | | | | | | | | | Ratio to Average Net Assets of: | | | | | | | |
| | | Net
Asset Value, Beginning
of Period | | | Net
Investment
Income
(Loss) | | | Net
Realized and
Unrealized
Gain (Loss) | | | Total From
Investment
Operations | | | Distributions
From Net
Investment
Income | | | Net
Asset Value,
End of Period | | | Total
Return(1) | | | Operating
Expenses | | | Net
Investment Income
(Loss) | | | Portfolio
Turnover
Rate | | | Net Assets,
End of Period
(in thousands) | |
Investor Class |
2013 | | $9.32 | | | 0.40 | (2) | | 0.23 | | | 0.63 | | | (0.40 | ) | | $9.55 | | | 6.85 | % | | 0.60 | % | | 4.16 | % | | 111 | % | | $265,529 | |
2012 | | $8.50 | | | 0.44 | (2) | | 0.82 | | | 1.26 | | | (0.44 | ) | | $9.32 | | | 15.16 | % | | 0.61 | % | | 4.89 | % | | 70 | % | | $237,949 | |
2011 | | $8.82 | | | 0.47 | (2) | | (0.32 | ) | | 0.15 | | | (0.47 | ) | | $8.50 | | | 1.76 | % | | 0.61 | % | | 5.41 | % | | 27 | % | | $126,327 | |
2010 | | $7.91 | | | 0.45 | (2) | | 0.92 | | | 1.37 | | | (0.46 | ) | | $8.82 | | | 17.68 | % | | 0.61 | % | | 5.40 | % | | 25 | % | | $132,196 | |
2009 | | $9.63 | | | 0.50 | | | (1.72 | ) | | (1.22 | ) | | (0.50 | ) | | $7.91 | | | (12.70 | )% | | 0.62 | % | | 5.97 | % | | 44 | % | | $82,547 | |
Institutional Class |
2013 | | $9.32 | | | 0.42 | (2) | | 0.24 | | | 0.66 | | | (0.42 | ) | | $9.56 | | | 7.17 | % | | 0.40 | % | | 4.36 | % | | 111 | % | | $4,273 | |
2012 | | $8.50 | | | 0.45 | (2) | | 0.83 | | | 1.28 | | | (0.46 | ) | | $9.32 | | | 15.39 | % | | 0.41 | % | | 5.09 | % | | 70 | % | | $7,260 | |
2011 | | $8.82 | | | 0.49 | (2) | | (0.32 | ) | | 0.17 | | | (0.49 | ) | | $8.50 | | | 1.97 | % | | 0.41 | % | | 5.61 | % | | 27 | % | | $4,829 | |
| 2010(3) | | $8.66 | | | 0.12 | (2) | | 0.15 | | | 0.27 | | | (0.11 | ) | | $8.82 | | | 3.13 | % | | 0.41 | %(4) | | 5.50 | %(4) | | 25 | %(5) | | $26 | |
A Class |
2013 | | $9.32 | | | 0.37 | (2) | | 0.24 | | | 0.61 | | | (0.38 | ) | | $9.55 | | | 6.58 | % | | 0.85 | % | | 3.91 | % | | 111 | % | | $104,785 | |
2012 | | $8.50 | | | 0.42 | (2) | | 0.82 | | | 1.24 | | | (0.42 | ) | | $9.32 | | | 14.87 | % | | 0.86 | % | | 4.64 | % | | 70 | % | | $92,154 | |
2011 | | $8.82 | | | 0.45 | (2) | | (0.32 | ) | | 0.13 | | | (0.45 | ) | | $8.50 | | | 1.51 | % | | 0.86 | % | | 5.16 | % | | 27 | % | | $78,325 | |
2010 | | $7.91 | | | 0.43 | (2) | | 0.91 | | | 1.34 | | | (0.43 | ) | | $8.82 | | | 17.39 | % | | 0.86 | % | | 5.15 | % | | 25 | % | | $130,266 | |
2009 | | $9.63 | | | 0.48 | | | (1.72 | ) | | (1.24 | ) | | (0.48 | ) | | $7.91 | | | (12.92 | )% | | 0.87 | % | | 5.72 | % | | 44 | % | | $111,293 | |
| |
For a Share Outstanding Throughout the Years Ended May 31 (except as noted) |
Per-Share Data | | Ratios and Supplemental Data | |
| | | | | | Income From Investment Operations: | | | | | | | | | | | | Ratio to Average Net Assets of: | | | | | | | |
| | | Net
Asset Value, Beginning
of Period | | | Net
Investment
Income
(Loss) | | | Net
Realized and
Unrealized
Gain (Loss) | | | Total From
Investment
Operations | | | Distributions
From Net
Investment
Income | | | Net
Asset Value, End of Period | | | Total
Return(1) | | | Operating
Expenses | | | Net
Investment Income
(Loss) | | | Portfolio
Turnover
Rate | | | Net Assets,
End of Period
(in thousands) | |
C Class |
2013 | | $9.32 | | | 0.30 | (2) | | 0.24 | | | 0.54 | | | (0.31 | ) | | $9.55 | | | 5.91 | % | | 1.60 | % | | 3.16 | % | | 111 | % | | $34,865 | |
2012 | | $8.49 | | | 0.35 | (2) | | 0.83 | | | 1.18 | | | (0.35 | ) | | $9.32 | | | 14.03 | % | | 1.61 | % | | 3.89 | % | | 70 | % | | $31,344 | |
2011 | | $8.81 | | | 0.38 | (2) | | (0.32 | ) | | 0.06 | | | (0.38 | ) | | $8.49 | | | 0.75 | % | | 1.61 | % | | 4.41 | % | | 27 | % | | $24,885 | |
2010 | | $7.91 | | | 0.37 | (2) | | 0.90 | | | 1.27 | | | (0.37 | ) | | $8.81 | | | 16.39 | % | | 1.61 | % | | 4.40 | % | | 25 | % | | $29,313 | |
2009 | | $9.63 | | | 0.41 | | | (1.72 | ) | | (1.31 | ) | | (0.41 | ) | | $7.91 | | | (13.58 | )% | | 1.62 | % | | 4.97 | % | | 44 | % | | $25,176 | |
Notes to Financial Highlights
(1) | Total returns are calculated based on the net asset value of the last business day and do not reflect applicable sales charges, if any. Total returns for periods less than one year are not annualized. |
(2) | Computed using average shares outstanding throughout the period. |
(3) | March 1, 2010 (commencement of sale) through May 31, 2010. |
(5) | Portfolio turnover is calculated at the fund level. Percentage indicated was calculated for the year ended May 31, 2010. |
See Notes to Financial Statements.
Report of Independent Registered Public Accounting Firm |
To the Trustees of the American Century Municipal Trust and Shareholders
of the High-Yield Municipal Fund:
In our opinion, the accompanying statement of assets and liabilities, including the schedule of investments, and the related statements of operations and of changes in net assets and the financial highlights present fairly, in all material respects, the financial position of the High-Yield Municipal Fund (one of the four funds comprising the American Century Municipal Trust, hereafter referred to as the “Fund”) at May 31, 2013, the results of its operations for the year then ended, the changes in its net assets for each of the two years in the period then ended and the financial highlights for the periods presented, in conformity with accounting principles generally accepted in the United States of America. These financial statements and financial highlights (hereafter referred to as “financial statements”) are the responsibility of the Fund’s management; our responsibility is to express an opinion on these financial statements based on our audits. We conducted our audits of these financial statements in accordance with the standards of the Public Company Accounting Oversight Board (United States). Those standards require that we plan and perform the audit to obtain reasonable assurance about whether the financial statements are free of material misstatement. An audit includes examining, on a test basis, evidence supporting the amounts and disclosures in the financial statements, assessing the accounting principles used and significant estimates made by management, and evaluating the overall financial statement presentation. We believe that our audits, which included confirmation of securities at May 31, 2013 by correspondence with the custodian and brokers, provide a reasonable basis for our opinion.
PricewaterhouseCoopers LLP
Kansas City, Missouri
July 22, 2013
Board of Trustees
The individuals listed below serve as trustees of the funds. Each trustee will continue to serve in this capacity until death, retirement, resignation or removal from office. The board has adopted a mandatory retirement age for trustees who are not “interested persons,” as that term is defined in the Investment Company Act (independent trustees). Independent trustees shall retire on December 31 of the year in which they reach their 75th birthday; provided, however, that on or after January 1, 2022, independent trustees shall retire on December 31 of the year in which they reach their 76th birthday.
Mr. Thomas is the only trustee who is an “interested person” because he currently serves as President and Chief Executive Officer of American Century Companies, Inc. (ACC), the parent company of American Century Investment Management, Inc. (ACIM or the advisor).
The other trustees (more than three-fourths of the total number) are independent; that is, they have never been employees, directors or officers of, and have no financial interest in, ACC or any of its wholly owned, direct or indirect, subsidiaries, including ACIM, American Century Investment Services, Inc. (ACIS) and American Century Services, LLC (ACS). The trustees serve in this capacity for eight (in the case of Mr. Thomas, 15) registered investment companies in the American Century Investments family of funds.
The following table presents additional information about the trustees. The mailing address for each trustee other than Mr. Thomas is 1665 Charleston Road, Mountain View, California 94043. The mailing address for Mr. Thomas is 4500 Main Street, Kansas City, Missouri 64111.
| | | | | | | |
Name
(Year of Birth) | Position(s) Held with Funds | Length of Time Served | Principal Occupation(s) During Past 5 Years | | Number of American Century Portfolios Overseen by Trustee | Other Directorships Held During Past 5 Years |
Independent Trustees |
Tanya S. Beder
(1955) | Trustee | Since 2011 | Chairman, SBCC Group Inc. (independent advisory services) (2006 to present) | | 41 | CYS Investments, Inc. (specialty finance company) |
Jeremy I. Bulow
(1954) | Trustee | Since 2011 | Professor of Economics, Stanford University,
Graduate School of Business (1979 to present) | | 41 | None |
Ronald J. Gilson
(1946) | Trustee and Chairman of the Board | Since 1995 | Charles J. Meyers Professor of Law and Business, Stanford Law School (1979 to present); Marc and Eva Stern Professor of Law and Business, Columbia University School of Law
(1992 to present) | | 41 | None |
Frederick L. A. Grauer
(1946) | Trustee | Since 2008 | Senior Advisor, BlackRock, Inc. (investment management firm) (2010 to 2011); Senior Advisor, Barclays Global Investors (investment management firm) (2003 to 2009) | | 41 | None |
| | | | | | | |
Name
(Year of Birth) | Position(s) Held with Funds | Length of Time Served | Principal Occupation(s) During Past 5 Years | | Number of American Century Portfolios Overseen by Trustee | Other Directorships Held During Past 5 Years |
Independent Trustees |
Peter F. Pervere
(1947) | Trustee | Since 2007 | Retired | | 41 | Intraware, Inc. (2003 to 2009) |
Myron S. Scholes
(1941) | Trustee | Since 1980 | Chairman, Platinum Grove Asset Management, L.P. (asset manager) (1999 to 2009); Frank E. Buck Professor of Finance-Emeritus, Stanford Graduate School of Business (1996 to present) | | 41 | Dimensional Fund Advisors (investment advisor); CME Group, Inc. (futures and options exchange) |
John B. Shoven
(1947) | Trustee | Since 2002 | Professor of Economics, Stanford University
(1973 to present) | | 41 | Cadence Design Systems; Exponent; Financial Engines |
| |
Interested Trustee |
Jonathan S. Thomas
(1963) | Trustee and President | Since 2007 | President and Chief Executive Officer, ACC (March 2007 to present). Also serves as Chief Executive Officer and Manager, ACS; Executive Vice President, ACIM; Director, ACC, ACIM and other ACC subsidiaries | | 106 | None |
Officers
The following table presents certain information about the executive officers of the funds. Each officer serves as an officer for each of the 15 investment companies in the American Century family of funds, unless otherwise noted. No officer is compensated for his or her service as an officer of the funds. The listed officers are interested persons of the funds and are appointed or re-appointed on an annual basis. The mailing address for each of the officers listed below is 4500 Main Street, Kansas City, Missouri 64111.
| | | | |
Name
(Year of Birth) | Offices with the Funds | | Principal Occupation(s) During the Past Five Years |
Jonathan S. Thomas
(1963) | Trustee and President since 2007 | | President and Chief Executive Officer, ACC (March 2007 to present). Also serves as Chief Executive Officer and Manager, ACS; Executive Vice President, ACIM; Director, ACC, ACIM and other ACC subsidiaries |
Maryanne L. Roepke
(1956) | Chief Compliance Officer since 2006 and Senior Vice President since 2000 | | Chief Compliance Officer, American Century funds, ACIM and ACS (August 2006 to present). Also serves as Senior Vice President, ACS |
Charles A. Etherington
(1957) | General Counsel since 2007 and Senior Vice President since 2006 | | Attorney, ACC (February 1994 to present); Vice President, ACC (November 2005 to present); General Counsel, ACC (March 2007 to present). Also serves as General Counsel, ACIM, ACS, ACIS and other ACC subsidiaries; and Senior Vice President, ACIM and ACS |
C. Jean Wade
(1964) | Vice President, Treasurer and Chief Financial Officer since 2012 | | Vice President, ACS (February 2000 to present) |
Robert J. Leach
(1966) | Vice President since 2006 and Assistant Treasurer since 2012 | | Vice President, ACS (February 2000 to present) |
David H. Reinmiller
(1963) | Vice President since 2001 | | Attorney, ACC (January 1994 to present); Associate General Counsel, ACC (January 2001 to present). Also serves as Vice President, ACIM and ACS |
Ward D. Stauffer
(1960) | Secretary since 2005 | | Attorney, ACC (June 2003 to present) |
The Statement of Additional Information has additional information about the fund’s trustees and is available without charge, upon request, by calling 1-800-345-2021.
Proxy Voting Guidelines
American Century Investment Management, Inc., the fund’s investment advisor, is responsible for exercising the voting rights associated with the securities purchased and/or held by the fund. A description of the policies and procedures the advisor uses in fulfilling this responsibility is available without charge, upon request, by calling 1-800-345-2021. It is also available on American Century Investments’ website at americancentury.com and on the Securities and Exchange Commission’s website at sec.gov. Information regarding how the investment advisor voted proxies relating to portfolio securities during the most recent 12-month period ended June 30 is available on the “About Us” page at americancentury.com. It is also available at sec.gov.
Quarterly Portfolio Disclosure
The fund files its complete schedule of portfolio holdings with the Securities and Exchange Commission (SEC) for the first and third quarters of each fiscal year on Form N-Q. The fund’s Forms N-Q are available on the SEC’s website at sec.gov, and may be reviewed and copied at the SEC’s Public Reference Room in Washington, DC. Information on the operation of the Public Reference Room may be obtained by calling 1-800-SEC-0330. The fund also makes its complete schedule of portfolio holdings for the most recent quarter of its fiscal year available on its website at americancentury.com and, upon request, by calling 1-800-345-2021.
Other Tax Information
The following information is provided pursuant to provisions of the Internal Revenue Code.
The fund designates $16,517,723 as exempt interest dividends for the fiscal year ended May 31, 2013.
Contact Us | americancentury.com |
Automated Information Line | 1-800-345-8765 |
Investor Services Representative | 1-800-345-2021
or 816-531-5575 |
Investors Using Advisors | 1-800-378-9878 |
Business, Not-For-Profit, Employer-Sponsored Retirement Plans | 1-800-345-3533 |
Banks and Trust Companies, Broker-Dealers, Financial Professionals, Insurance Companies | 1-800-345-6488 |
Telecommunications Device for the Deaf | 1-800-634-4113 |
American Century Municipal Trust
Investment Advisor:
American Century Investment Management, Inc.
Kansas City, Missouri
This report and the statements it contains are submitted for the general information of our shareholders. The report is not authorized for distribution to prospective investors unless preceded or accompanied by an effective prospectus.
©2013 American Century Proprietary Holdings, Inc. All rights reserved.
CL-ANN-78952 1307
ANNUAL REPORT MAY 31, 2013
Intermediate-Term Tax-Free Bond Fund
President’s Letter | 2 |
Market Perspective | 3 |
Performance | 4 |
Portfolio Commentary | 6 |
Fund Characteristics | 8 |
Shareholder Fee Example | 9 |
Schedule of Investments | 11 |
Statement of Assets and Liabilities | 42 |
Statement of Operations | 43 |
Statement of Changes in Net Assets | 44 |
Notes to Financial Statements | 45 |
Financial Highlights | 50 |
Report of Independent Registered Public Accounting Firm | 52 |
Management | 53 |
Additional Information | 56 |
Any opinions expressed in this report reflect those of the author as of the date of the report, and do not necessarily represent the opinions of American Century Investments® or any other person in the American Century Investments organization. Any such opinions are subject to change at any time based upon market or other conditions and American Century Investments disclaims any responsibility to update such opinions. These opinions may not be relied upon as investment advice and, because investment decisions made by American Century Investments funds are based on numerous factors, may not be relied upon as an indication of trading intent on behalf of any American Century Investments fund. Security examples are used for representational purposes only and are not intended as recommendations to purchase or sell securities. Performance information for comparative indices and securities is provided to American Century Investments by third party vendors. To the best of American Century Investments’ knowledge, such information is accurate at the time of printing.
Jonathan Thomas
Dear Investor:
Thank you for reviewing this annual report for the 12 months ended May 31, 2013. It provides investment performance, market analysis, and portfolio information, presented with the expert perspective of our portfolio management team.
Annual reports remain important vehicles for conveying information about fund returns, including key factors that affected fund performance. For additional, updated investment and market insights, we encourage you to visit our website, americancentury.com.
Positive Fiscal-Year Returns for Stocks and Municipal Bonds
The 12-month reporting period ended May 31, 2013 started with softening global economic conditions and growing uncertainty in the summer of 2012 as the U.S. elections and dreaded U.S. fiscal deadlines loomed ahead. These factors, and the recession fears they represented, helped provoke aggressive monetary intervention by central banks, which encouraged investors to take more risk.
In this “risk-on” investing environment, stocks generally outperformed bonds, broad non-U.S. stock measures outperformed their broad U.S. stock counterparts, and U.S. municipal bonds generally outperformed U.S. Treasury bonds.
Non-U.S., U.S. mid-cap, small-cap, and value stock indices achieved performance leadership during the period, outpacing the S&P 500 Index’s 27.28% return. The MSCI EAFE Index, for example, returned 31.62%. U.S. bond index returns ranged from roughly 15% gains for corporate high-yield indices all the way down to negative returns for longer-maturity U.S. Treasury benchmarks. For example, the 10-year U.S. Treasury note returned –2.17%, according to Barclays, as its yield rose over half a percentage point, from 1.56% to 2.13%.
Municipal bonds, which enjoyed strong demand for much of the period, generally fit more in the middle of the U.S. bond return spectrum. The Barclays Municipal Bond Index advanced 3.05%.
The U.S. economy is showing signs of improvement in 2013, particularly the long-depressed housing market. However, U.S. economic growth remains subpar compared with past recession recoveries, and is still vulnerable to fiscal, financial, and overseas threats that could trigger further slowdowns and market volatility.
Under these conditions, we continue to believe in a disciplined, diversified, long-term investment approach, using professionally managed stock and bond portfolios—as appropriate—for meeting financial goals. We appreciate your continued trust in us in this challenging environment.
Sincerely,
Jonathan Thomas
President and Chief Executive Officer
American Century Investments
By David MacEwen, Chief Investment Officer, Fixed Income
Municipals Outpaced Treasuries
For the 12-month period ended May 31, 2013, municipal bonds (munis) posted positive performance. Munis were among the fixed income market’s leading performers for the period, outpacing U.S. Treasury securities and the broad taxable investment-grade bond benchmark (Barclays U.S. Aggregate Bond Index) in an environment of generally improving state finances and stable-to-improving credit trends. Furthermore, in the ongoing low-yield environment, muni yields looked relatively attractive, particularly to high-tax-bracket investors on an after-tax basis.
Once again, investors wavered between risk taking and risk aversion. Throughout the period, mixed economic data and political uncertainty (which emerged prior to and following November’s presidential election and as Congress debated tax policy and the federal budget) influenced market sentiment. But, overall, the modest economic gains were sufficient for risk taking to prevail, and lower-quality, higher-yielding securities drove performance in the fixed income market.
Throughout the period, demand for munis remained relatively strong and supply was generally robust, primarily due to continued refinancings from municipalities taking advantage of low interest rates. The Federal Reserve (the Fed) continued to support the low-rate environment, keeping its overnight interest rate target near 0%. In addition, the Fed launched its third and most aggressive quantitative easing program (QE3), which has the Fed purchasing $40 billion of mortgage-backed securities and $45 billion in Treasury securities each month until economic growth and employment improve.
Conditions Favored Longer-Maturity and High-Yield Munis
Against this low-rate backdrop, investors’ demand for yield led to solid results from longer-maturity and lower-quality munis, which outperformed the broad muni benchmark for the 12-month period. Additionally, May 2013 marked the 18th-consecutive month of positive performance for high-yield munis.
Volatility Likely on the Rise
In the final month of the reporting period, Treasury yields increased sharply (putting upward pressure on muni yields as well) in anticipation that the Fed may start scaling back its bond purchases later in 2013. This speculation sparked a selloff among bonds, but this spike in rates largely retraced an earlier decline
in yields.
U.S. Fixed-Income Total Returns |
For the 12 months ended May 31, 2013 |
Barclays Municipal Market Indices | | Barclays U.S. Taxable Market Indices |
Municipal High Yield Bond | 11.88% | | Aggregate Bond | 0.92% |
Long-Term Municipal Bond | 4.69% | | Treasury Bond | -0.89% |
Municipal Bond | 3.05% | | | |
7 Year Municipal Bond | 2.07% | | | |
Total Returns as of May 31, 2013 |
| | | | Average Annual Returns | |
| | Ticker Symbol | 1 year | 5 years | 10 years | Since Inception | Inception Date |
Investor Class | TWTIX | 2.43% | 4.98% | 3.97% | 5.26% | 3/2/87 |
Barclays 7 Year
Municipal Bond Index | — | 2.07% | 5.82% | 4.59% | N/A(1) | — |
Institutional Class | AXBIX | 2.55% | 5.19% | 4.18% | 4.44% | 4/15/03 |
A Class No sales charge* With sales charge* | TWWOX | 2.09% -2.52% | — — | — — | 4.46% 3.00% | 3/1/10 |
C Class | TWTCX | 1.33% | — | — | 3.66% | 3/1/10 |
*Sales charges include initial sales charges and contingent deferred sales charges (CDSCs), as applicable. A Class shares have a 4.50% maximum initial sales charge and may be subject to a maximum CDSC of 1.00%. C Class shares redeemed within 12 months of purchase are subject to a maximum CDSC of 1.00%. The SEC requires that mutual funds provide performance information net of maximum sales charges in all cases where charges could be applied.
(1) | Benchmark data first available January 1990. |
Data presented reflect past performance. Past performance is no guarantee of future results. Current performance may be higher or lower than the performance shown. Investment return and principal value will fluctuate, and redemption value may be more or less than original cost. To obtain performance data current to the most recent month end, please call 1-800-345-2021 or visit americancentury.com. As interest rates rise, bond values will decline. Investment income may be subject to certain state and local taxes and, depending on your tax status, the federal alternative minimum tax (AMT). Capital gains are not exempt from state and federal income tax.
Unless otherwise indicated, performance reflects Investor Class shares; performance for other share classes will vary due to differences in fee structure. For information about other share classes available, please consult the prospectus. Data assumes reinvestment of dividends and capital gains, and none of the charts reflect the deduction of taxes that a shareholder would pay on fund distributions or the redemption of fund shares. Returns for the index are provided for comparison. The fund’s total returns include operating expenses (such as transaction costs and management fees) that reduce returns, while the total returns of the index do not.
Growth of $10,000 Over 10 Years |
$10,000 investment made May 31, 2003 |

Total Annual Fund Operating Expenses |
Investor Class | Institutional Class | A Class | C Class |
0.47% | 0.27% | 0.72% | 1.47% |
The total annual fund operating expenses shown is as stated in the fund’s prospectus current as of the date of this report. The prospectus may vary from the expense ratio shown elsewhere in this report because it is based on a different time period, includes acquired fund fees and expenses, and, if applicable, does not include fee waivers or expense reimbursements.
Data presented reflect past performance. Past performance is no guarantee of future results. Current performance may be higher or lower than the performance shown. Investment return and principal value will fluctuate, and redemption value may be more or less than original cost. To obtain performance data current to the most recent month end, please call 1-800-345-2021 or visit americancentury.com. As interest rates rise, bond values will decline. Investment income may be subject to certain state and local taxes and, depending on your tax status, the federal alternative minimum tax (AMT). Capital gains are not exempt from state and federal income tax.
Unless otherwise indicated, performance reflects Investor Class shares; performance for other share classes will vary due to differences in fee structure. For information about other share classes available, please consult the prospectus. Data assumes reinvestment of dividends and capital gains, and none of the charts reflect the deduction of taxes that a shareholder would pay on fund distributions or the redemption of fund shares. Returns for the index are provided for comparison. The fund’s total returns include operating expenses (such as transaction costs and management fees) that reduce returns, while the total returns of the index do not.
Portfolio Managers: Alan Kruss, Joseph Gotelli, and Steven Permut
Performance Summary
Intermediate-Term Tax-Free Bond returned 2.43%* for the fiscal year ended May 31, 2013. By comparison, the Barclays 7 Year Municipal Bond Index returned 2.07%. Fund returns reflect operating expenses, while index returns do not. (See pages 4 and 5 for additional performance comparisons.)
The fund’s absolute return for the reporting period reflected the positive performance of municipal bond (muni) indices (see page 3). The fund outperformed the Barclays 7 Year Municipal Bond Index due primarily to sector allocation and security selection (described in Portfolio Positioning).
Credit Environment
In general, credit trends in the muni market were stable to improving throughout the period. Muni credit-rating downgrades continued to outpace upgrades, but the overall default rate remained low. We continue to believe it’s unlikely any states will default, but select state credit ratings are likely to remain under downward pressure. Also, more downgrades and defaults may occur at the local level due to lingering effects of the slow recovery from the Great Recession.
The financial stresses at the local level were highlighted early in the period, when the California cities of Stockton, Mammoth Lakes, and San Bernardino filed for bankruptcy protection. Long-term structural budget problems led to the Stockton and San Bernardino filings, while an unfavorable legal judgment pushed Mammoth Lakes into bankruptcy. In addition, California’s elimination of certain local funding programs and state spending cuts also contributed by forcing local municipalities to deal with their financial problems with less state assistance.
We believe these incidents represent isolated events that had little impact on overall municipal credit quality. Most local governments we have reviewed remain in good financial condition despite the slow-growth economy. Meanwhile, state and local tax revenues generally increased during the reporting period, due to improving local economies and/or higher tax rates.
Portfolio Positioning
Favorable security selection, combined with a continued emphasis on revenue bonds over general obligation (GO) bonds, aided the fund’s relative performance during the 12-month period. In particular, we favored essential service (such as those that finance water and sewer projects) revenue bonds, which tend to be higher-quality securities, along with transportation and sales-tax-secured bonds. Overall, revenue bonds outpaced GO bonds during the period.
An overweight position and security selection among lower-quality munis (those with credit ratings of BBB) also lifted the fund’s performance relative to the benchmark. In particular, selections within the hospital and higher education sectors contributed favorably to the fund’s results.
*All fund returns referenced in this commentary are for Investor Class shares.
A position designed to benefit when the gap between Treasury and muni yields narrows also aided performance. At two different times—once early in the period, and once late in the period—the fund took advantage of a higher-than-normal yield ratio (greater than 100%) between 10-year Treasuries and 10-year AAA-rated munis. This strategy was effective as the yield ratio eventually returned to normal (less than 100%) and we exited the strategy.
Outlook
In the final month of the reporting period, some confusing comments from the Federal Reserve about potential reductions in its “quantitative easing” activity—a bond-buying program that has helped fuel financial market gains—sparked a selloff among most bond market sectors, particularly lower-quality, less liquid securities.
We already had been increasing exposure to more liquid, higher-quality munis. We believe if the recent selloff among risk assets continues, the fund will be well positioned to add back riskier securities at much more attractive prices. Additionally, if interest rates rise further and bond fund outflows increase, our higher-quality bias potentially can protect our investors more than a lower-quality bias. As always, we expect our fundamental credit research and risk management capabilities should continue to drive results.
MAY 31, 2013 | |
Portfolio at a Glance | |
Weighted Average Maturity | 9.0 years |
Average Duration (Modified) | 4.6 years |
| | |
Top Five States and Territories | % of net assets |
California | 18.0% |
New York | 11.6% |
Florida | 6.7% |
New Jersey | 6.2% |
Texas | 6.1% |
| | |
Top Five Sectors | % of fund investments |
General Obligation (GO) | 32% |
Transportation Revenue | 13% |
Certificates of Participation (COPs)/Leases | 10% |
Special Tax Revenue/Severance Tax | 9% |
Electric Revenue | 9% |
| | |
Types of Investments in Portfolio | % of net assets |
Municipal Securities | 100.6% |
Other Assets and Liabilities | (0.6)% |
Fund shareholders may incur two types of costs: (1) transaction costs, including sales charges (loads) on purchase payments and redemption/exchange fees; and (2) ongoing costs, including management fees; distribution and service (12b-1) fees; and other fund expenses. This example is intended to help you understand your ongoing costs (in dollars) of investing in your fund and to compare these costs with the ongoing cost of investing in other mutual funds.
The example is based on an investment of $1,000 made at the beginning of the period and held for the entire period from December 1, 2012 to May 31, 2013.
Actual Expenses
The table provides information about actual account values and actual expenses for each class. You may use the information, together with the amount you invested, to estimate the expenses that you paid over the period. First, identify the share class you own. Then simply divide your account value by $1,000 (for example, an $8,600 account value divided by $1,000 = 8.6), then multiply the result by the number under the heading “Expenses Paid During Period” to estimate the expenses you paid on your account during this period.
If you hold Investor Class shares of any American Century Investments fund, or Institutional Class shares of the American Century Diversified Bond Fund, in an American Century Investments account (i.e., not a financial intermediary or retirement plan account), American Century Investments may charge you a $12.50 semiannual account maintenance fee if the value of those shares is less than $10,000. We will redeem shares automatically in one of your accounts to pay the $12.50 fee. In determining your total eligible investment amount, we will include your investments in all personal accounts (including American Century Investments Brokerage accounts) registered under your Social Security number. Personal accounts include individual accounts, joint accounts, UGMA/UTMA accounts, personal trusts, Coverdell Education Savings Accounts and IRAs (including traditional, Roth, Rollover, SEP-, SARSEP- and SIMPLE-IRAs), and certain other retirement accounts. If you have only business, business retirement, employer-sponsored or American Century Investments Brokerage accounts, you are currently not subject to this fee. If you are subject to the Account Maintenance Fee, your account value could be reduced by the fee amount.
Hypothetical Example for Comparison Purposes
The table also provides information about hypothetical account values and hypothetical expenses based on the actual expense ratio of each class of your fund and an assumed rate of return of 5% per year before expenses, which is not the actual return of a fund’s share class. The hypothetical account values and expenses may not be used to estimate the actual ending account balance or expenses you paid for the period. You may use this information to compare the ongoing costs of investing in your fund and other funds. To do so, compare this 5% hypothetical example with the 5% hypothetical examples that appear in the shareholder reports of the other funds.
Please note that the expenses shown in the table are meant to highlight your ongoing costs only and do not reflect any transactional costs, such as sales charges (loads) or redemption/exchange fees. Therefore, the table is useful in comparing ongoing costs only, and will not help you determine the relative total costs of owning different funds. In addition, if these transactional costs were included, your costs would have been higher.
| | | | | |
| | Beginning
Account Value 12/1/12 | Ending
Account Value 5/31/13 | Expenses Paid During Period(1) 12/1/12 – 5/31/13 | Annualized
Expense Ratio(1) |
Actual | | | | |
Investor Class | $1,000 | $989.10 | $2.33 | 0.47% |
Institutional Class | $1,000 | $990.10 | $1.34 | 0.27% |
A Class | $1,000 | $987.90 | $3.57 | 0.72% |
C Class | $1,000 | $984.20 | $7.27 | 1.47% |
Hypothetical | | | | |
Investor Class | $1,000 | $1,022.59 | $2.37 | 0.47% |
Institutional Class | $1,000 | $1,023.59 | $1.36 | 0.27% |
A Class | $1,000 | $1,021.34 | $3.63 | 0.72% |
C Class | $1,000 | $1,017.60 | $7.39 | 1.47% |
(1) | Expenses are equal to the class’s annualized expense ratio listed in the table above, multiplied by the average account value over the period, multiplied by 182, the number of days in the most recent fiscal half-year, divided by 365, to reflect the one-half year period. |
MAY 31, 2013
| | | | | | | |
| | | Principal Amount | | | Value | |
Municipal Securities — 100.6% | |
ALABAMA — 0.2% | |
Alabama 21st Century Authority Rev., Series 2012 A, (Tobacco Settlement Revenue), 4.00%, 6/1/16 | | $1,060,000 | | | $1,146,517 | |
Alabama 21st Century Authority Rev., Series 2012 A, (Tobacco Settlement Revenue), 5.00%, 6/1/17 | | 1,500,000 | | | 1,714,710 | |
Alabama 21st Century Authority Rev., Series 2012 A, (Tobacco Settlement Revenue), 5.00%, 6/1/19 | | 4,510,000 | | | 5,316,884 | |
East Central Industrial Development Authority Rev., 5.25%, 9/1/13 (Ambac) | | 810,000 | | | 813,216 | |
| | | | | | 8,991,327 | |
ALASKA† | |
Aleutians East Borough Project Rev., (Aleutian Pribilof Islands, Inc.), 5.00%, 6/1/20 (ACA) | | 1,875,000 | | | 1,900,519 | |
ARIZONA — 2.1% | |
Arizona Board of Regents COP, Series 2006 A, (University of Arizona), 5.00%, 6/1/18 (Ambac) | | 1,935,000 | | | 2,167,452 | |
Arizona Department of Transportation State Highway Fund Rev., Series 2011 A, (Sub Highway Revenue), 5.00%, 7/1/22 | | 12,400,000 | | | 14,963,452 | |
Arizona Health Facilities Authority Rev., Series 2007 B, (Banner Health), VRN, 1.00%, 7/1/13 | | 7,500,000 | | | 7,123,650 | |
Arizona Health Facilities Authority Rev., Series 2008 D, (Banner Health), 5.00%, 1/1/15 | | 3,000,000 | | | 3,219,810 | |
Arizona Tourism & Sports Authority Rev., (Baseball Training Facilities), 5.00%, 7/1/13 | | 1,880,000 | | | 1,885,339 | |
Arizona Tourism & Sports Authority Rev., Series 2003 A, (Multipurpose Stadium Facility), 5.25%, 7/1/13, Prerefunded at 100% of Par (NATL-RE)(1) | | 2,000,000 | | | 2,008,380 | |
Arizona Transportation Board Rev., 4.00%, 7/1/15 | | 6,500,000 | | | 7,001,215 | |
Arizona Water Infrastructure Finance Authority Rev., Series 2010 A, 5.00%, 10/1/18 | | 3,000,000 | | | 3,607,830 | |
City of Mesa Excise Tax Rev., 5.00%, 7/1/27 | | 2,000,000 | | | 2,224,880 | |
Mohave County Industrial Development Authority Correctional Facilities Contract Rev., (Mohave Prison, LLC Expansion), 8.00%, 5/1/25 | | 5,000,000 | | | 6,339,700 | |
Mohave County Industrial Development Authority Rev., Series 2004 A, (Mohave Prison), 5.00%, 4/1/14 (XLCA)(1) | | 1,655,000 | | | 1,719,760 | |
Navajo County Pollution Control Corp. Rev., Series 2009 A, VRDN, 1.25%, 6/1/14 | | 6,500,000 | | | 6,537,440 | |
Navajo County Unified School District No. 20 Rev., Series 2006 A, 5.00%, 7/1/17 (NATL-RE) | | 1,815,000 | | | 2,065,307 | |
Phoenix Civic Improvement Corp. Airport Rev., Series 2010 A, (Junior Lien), 5.00%, 7/1/40 | | 3,000,000 | | | 3,216,810 | |
Phoenix Civic Improvement Corp. Wastewater System Rev., (Senior Lien), 5.50%, 7/1/24 | | 1,750,000 | | | 2,093,682 | |
Phoenix GO, Series 1995 A, 6.25%, 7/1/17 | | 1,070,000 | | | 1,301,409 | |
Phoenix Industrial Development Authority Government Office Lease Rev., (Capitol Mall LLC), 5.00%, 9/15/26 (Ambac) | | 1,750,000 | | | 1,799,928 | |
Pima County Metropolitan Domestic Water Improvement District Rev., 5.25%, 7/1/18 (Ambac)(1) | | 1,065,000 | | | 1,282,931 | |
Pima County Metropolitan Domestic Water Improvement District Rev., 5.25%, 7/1/18 (Ambac) | | 645,000 | | | 752,805 | |
Pima County Metropolitan Domestic Water Improvement District Rev., 5.25%, 7/1/19 (Ambac)(1) | | 1,120,000 | | | 1,372,829 | |
Pima County Metropolitan Domestic Water Improvement District Rev., 5.25%, 7/1/19 (Ambac) | | 680,000 | | | 802,584 | |
Pinal County Apache Junction Unified School District No. 43 GO, Series 2006 B, (School Improvements), 5.00%, 7/1/16, Prerefunded at 100% of Par (FGIC)(1) | | $775,000 | | | $880,423 | |
Queen Creek Improvement District No. 1 Special Assessment Rev., 5.00%, 1/1/16 | | 1,000,000 | | | 1,003,860 | |
Salt River Project Agricultural Improvement & Power District Rev., Series 2009 A, (Electric System Distribution), 5.00%, 1/1/39 | | 4,060,000 | | | 4,523,936 | |
Salt River Project Agricultural Improvement & Power District Rev., Series 2008 A, (Electric System Distribution), 5.00%, 1/1/38 | | 4,900,000 | | | 5,489,274 | |
| | | | | | 85,384,686 | |
ARKANSAS — 0.1% | |
Valdez Marine Terminal Rev., Series 2003 C, (BP Pipelines, Inc.), 5.00%, 1/1/21 (GA: BP PLC) | | 3,400,000 | | | 4,060,212 | |
CALIFORNIA — 18.0% | |
Bay Area Toll Authority Toll Bridge Rev., (San Francisco Bay Area), 5.00%, 4/1/26 | | 4,900,000 | | | 5,759,264 | |
Bay Area Toll Authority Toll Bridge Rev., Series 2006 C4, (San Francisco Bay Area), VRDN, 1.45%, 8/1/17 | | 5,975,000 | | | 6,061,458 | |
Bay Area Toll Authority Toll Bridge Rev., Series 2006 F, (San Francisco Bay Area), 5.00%, 4/1/16, Prerefunded at 100% of Par(1) | | 11,780,000 | | | 13,262,277 | |
Bay Area Toll Authority Toll Bridge Rev., Series 2007 A1, (San Francisco Bay Area), VRDN, 0.82%, 6/6/13 | | 2,175,000 | | | 2,192,161 | |
Bay Area Toll Authority Toll Bridge Rev., Series 2008 G1, (San Francisco Bay Area), VRDN, 1.22%, 6/6/13 | | 3,750,000 | | | 3,790,575 | |
California Department of Water Resources Power Supply Rev., Series 2005 F5, 5.00%, 5/1/22 | | 6,215,000 | | | 7,244,888 | |
California Department of Water Resources Power Supply Rev., Series 2005 G4, 5.00%, 5/1/16 | | 2,450,000 | | | 2,769,725 | |
California Department of Water Resources Power Supply Rev., Series 2008 AE, (Central Valley) 5.00%, 12/1/22 | | 3,000,000 | | | 3,527,100 | |
California Department of Water Resources Power Supply Rev., Series 2010 L, 5.00%, 5/1/16 | | 5,000,000 | | | 5,652,500 | |
California Department of Water Resources Power Supply Rev., Series 2010 L, 5.00%, 5/1/19 | | 5,000,000 | | | 6,045,650 | |
California Department of Water Resources Power Supply Rev., Series 2010 M, 5.00%, 5/1/15 | | 3,750,000 | | | 4,085,962 | |
California Economic Recovery GO, Series 2009 A, 5.00%, 7/1/18 | | 3,890,000 | | | 4,623,226 | |
California Economic Recovery GO, Series 2009 A, 4.60%, 7/1/19 | | 4,320,000 | | | 5,106,931 | |
California Economic Recovery GO, Series 2009 A, 5.00%, 7/1/20 | | 12,160,000 | | | 14,446,566 | |
California Economic Recovery GO, Series 2009 B, VRDN, 5.00%, 7/1/14 | | 35,000,000 | | | 36,764,000 | |
California Educational Facilities Authority Rev., Series 2009 A, (Pomona College), 5.00%, 1/1/24 | | 3,500,000 | | | 4,007,255 | |
California GO, 5.00%, 3/1/15 | | 6,500,000 | | | 7,014,020 | |
California GO, 5.00%, 5/1/15 | | 6,000,000 | | | 6,515,400 | |
California GO, 5.00%, 9/1/16 | | 8,435,000 | | | 9,571,532 | |
California GO, 5.00%, 9/1/16 | | 5,000,000 | | | 5,673,700 | |
California GO, 5.00%, 10/1/16 | | 10,000,000 | | | 11,378,600 | |
California GO, 5.00%, 10/1/17 | | 8,000,000 | | | 9,353,600 | |
California GO, 5.00%, 10/1/18 | | 10,000,000 | | | 11,917,400 | |
California GO, 5.25%, 9/1/23 | | 25,000,000 | | | 30,057,500 | |
California GO, 5.00%, 9/1/24 | | 10,000,000 | | | 11,845,600 | |
California GO, 5.00%, 2/1/27 | | 10,000,000 | | | 11,516,700 | |
California GO, 5.00%, 2/1/28 | | 10,000,000 | | | 11,454,700 | |
California GO, 5.00%, 10/1/29 | | 9,000,000 | | | 9,959,670 | |
California GO, 5.75%, 4/1/31 | | 16,630,000 | | | 19,354,825 | |
California GO, 5.00%, 6/1/32 | | 11,805,000 | | | 12,706,194 | |
California GO, 5.00%, 11/1/32 | | 2,785,000 | | | 3,015,904 | |
California GO, 6.00%, 4/1/38 | | 5,000,000 | | | 5,924,850 | |
California GO, 5.50%, 11/1/39 | | $10,000,000 | | | $11,527,900 | |
California GO, Series 2012 B, VRN, 1.02%, 6/6/13 | | 4,000,000 | | | 4,026,000 | |
California GO, Series 2012 B, VRN, 1.12%, 6/6/13 | | 1,600,000 | | | 1,614,528 | |
California GO, Series 2012 B, VRN, 1.27%, 6/6/13 | | 1,920,000 | | | 1,953,005 | |
California Health Facilities Financing Authority Rev., Series 2008 A, (Lucile Salter Packard Children’s Hospital), VRDN, 1.45%, 3/15/17 | | 1,500,000 | | | 1,525,395 | |
California Health Facilities Financing Authority Rev., Series 2008 B, (Lucile Salter Packard Children’s Hospital), VRDN, 1.45%, 3/15/17 | | 2,200,000 | | | 2,237,246 | |
California Health Facilities Financing Authority Rev., Series 2008 C, (Lucile Salter Packard Children’s Hospital), VRDN, 1.45%, 3/15/17 | | 1,500,000 | | | 1,525,395 | |
California Health Facilities Financing Authority Rev., Series 2008 C, (Providence Health & Services), 6.50%, 10/1/18, Prerefunded at 100% of Par(1) | | 35,000 | | | 44,769 | |
California Health Facilities Financing Authority Rev., Series 2008 C, (Providence Health & Services), 6.50%, 10/1/38 | | 2,090,000 | | | 2,508,084 | |
California Health Facilities Financing Authority Rev., Series 2008 I, (Catholic Healthcare West), 5.125%, 7/1/22 | | 3,835,000 | | | 4,172,825 | |
California Health Facilities Financing Authority Rev., Series 2009 A, (Adventist Health System West), 5.75%, 9/1/39 | | 2,500,000 | | | 2,872,900 | |
California Health Facilities Financing Authority Rev., Series 2009 A, (Catholic Healthcare West), 5.50%, 7/1/22 | | 5,000,000 | | | 5,880,150 | |
California Health Facilities Financing Authority Rev., Series 2009 A, (Children’s Hospital of Orange County), 6.50%, 11/1/38 | | 10,000,000 | | | 12,077,400 | |
California Health Facilities Financing Authority Rev., Series 2011 D, (Sutter Health), 5.00%, 8/15/19 | | 1,900,000 | | | 2,302,211 | |
California Health Facilities Financing Authority Rev., Series 2011 D, (Sutter Health), 5.00%, 8/15/24 | | 1,250,000 | | | 1,477,450 | |
California Infrastructure & Economic Development Bank Rev., Series 2003 A, (Bay Area Toll Bridge), (First Lien), 5.00%, 7/1/26 (FGIC)(1) | | 4,825,000 | | | 6,210,788 | |
California Municipal Finance Authority Rev., (Emerson College), 5.00%, 1/1/28 | | 5,290,000 | | | 5,904,910 | |
California Municipal Finance Authority Rev., Series 2010 A, (University of La Verne), 6.25%, 6/1/40 | | 1,500,000 | | | 1,694,040 | |
California Municipal Finance Authority COP, (Community Hospitals of Central California Obligated Group), 5.50%, 2/1/39 | | 1,450,000 | | | 1,545,222 | |
California Public Works Board Lease Rev., Series 2009 A, (Department of General Services – Building 8 & 9), 6.25%, 4/1/34 | | 4,000,000 | | | 4,808,720 | |
California Public Works Board Lease Rev., Series 2009 G1, (Various Capital Projects), 5.00%, 10/1/16 | | 10,000,000 | | | 11,360,900 | |
California Public Works Board Lease Rev., Series 2009 I1, (Various Capital Projects), 5.375%, 11/1/22 | | 8,000,000 | | | 9,473,520 | |
California Public Works Board Lease Rev., Series 2012 A, (Various Capital Projects), 5.00%, 4/1/22 | | 6,600,000 | | | 7,821,396 | |
California Public Works Board Lease Rev., Series 2012 A, (Various Capital Projects), 5.00%, 4/1/23 | | 11,250,000 | | | 13,155,525 | |
California Public Works Board Lease Rev., Series 2012 A, (Various Capital Projects), 5.00%, 4/1/24 | | 11,500,000 | | | 13,239,030 | |
California Public Works Board Lease Rev., Series 2012 A, (Various Capital Projects), 5.00%, 4/1/25 | | 5,000,000 | | | 5,667,050 | |
California Rev., Series 2012 A-2, 2.50%, 6/20/13 | | 32,000,000 | | | 32,040,320 | |
California State University Rev., Series 2011 A, (Systemwide), 5.00%, 11/1/15 | | 3,315,000 | | | 3,678,954 | |
California Statewide Communities Development Authority Rev., (Proposition 1A Receivables), 5.00%, 6/15/13 | | $26,245,000 | | | $26,293,816 | |
California Statewide Communities Development Authority Rev., Series 2001 B, (Kaiser Permanente), VRDN, 3.90%, 7/1/14 | | 2,000,000 | | | 2,061,340 | |
California Statewide Communities Development Authority Rev., Series 2002 C, (Kaiser Permanente), VRDN, 5.00%, 11/1/17 | | 2,400,000 | | | 2,771,664 | |
California Statewide Communities Development Authority Rev., Series 2009 A, (Kaiser Permanente), 5.00%, 4/1/16 | | 8,000,000 | | | 8,975,360 | |
California Statewide Communities Development Authority Rev., Series 2009 E2, (Kaiser Permanente), VRDN, 5.00%, 5/1/17 | | 2,200,000 | | | 2,540,692 | |
California Statewide Communities Development Authority Rev., Series 2012 B, (Kaiser Permanente), VRDN, 1.07%, 6/6/13 | | 5,000,000 | | | 5,037,900 | |
California Statewide Communities Development Authority Water & Waste Rev., Series 2004 A, (Pooled Financing Program), 5.25%, 10/1/13, Prerefunded at 101% of Par (AGM)(1) | | 430,000 | | | 441,593 | |
California Statewide Communities Development Authority Water & Waste Rev., Series 2004 A, (Pooled Financing Program), 5.25%, 10/1/13, Partially Prerefunded at 101% of Par (AGM)(1) | | 1,570,000 | | | 1,608,905 | |
Chula Vista Rev., Series 2006 A, (San Diego Gas and Electric), 1.65%, 7/1/18 | | 7,605,000 | | | 7,683,331 | |
Foothill-De Anza Community College District GO, Series 2007 B, 5.00%, 8/1/17 (Ambac) | | 3,210,000 | | | 3,520,246 | |
Foothill/Eastern Transportation Corridor Agency Toll Road Rev., Capital Appreciation, 5.875%, 1/15/27 | | 5,000,000 | | | 5,116,300 | |
Golden State Tobacco Securitization Corp. Rev., Series 2007 A1, 5.00%, 6/1/15 | | 5,000,000 | | | 5,385,750 | |
Golden State Tobacco Securitization Corp. Settlement Rev., Series 2013 A, 5.00%, 6/1/30 | | 1,650,000 | | | 1,825,758 | |
Hesperia Unified School District COP, (2007 Capital Improvement), 5.00%, 2/1/17 (Ambac) | | 670,000 | | | 734,742 | |
Los Angeles Community College District GO, Series 2008 E1, (Election of 2001), 5.00%, 8/1/20 | | 2,250,000 | | | 2,638,530 | |
Los Angeles County COP, (Disney Concert Hall), 5.00%, 9/1/20 | | 900,000 | | | 1,072,071 | |
Los Angeles County COP, (Disney Concert Hall), 5.00%, 9/1/21 | | 1,250,000 | | | 1,491,363 | |
Los Angeles Department of Water & Power Rev., Series 2011 A, (Power System), 5.00%, 7/1/14 | | 5,000,000 | | | 5,260,400 | |
Los Angeles Department of Water & Power Rev., Series 2012 C, (Power System), 4.00%, 1/1/16 | | 25,000,000 | | | 27,005,750 | |
Los Angeles Department of Water & Power Waterworks Rev., Series 2009 B, 5.00%, 7/1/20 | | 5,000,000 | | | 6,039,350 | |
Los Angeles Department of Water & Power Waterworks Rev., Series 2011 A, 4.00%, 7/1/17 | | 100,000 | | | 112,659 | |
Los Angeles Department of Water & Power Waterworks Rev., Series 2011 A, 5.00%, 7/1/18 | | 500,000 | | | 596,565 | |
Los Angeles Department of Water & Power Waterworks Rev., Series 2011 A, 5.00%, 7/1/19 | | 250,000 | | | 301,745 | |
Los Angeles Department of Water & Power Waterworks Rev., Series 2011 A, 5.00%, 7/1/20 | | 1,000,000 | | | 1,218,980 | |
Los Angeles Department of Water & Power Waterworks Rev., Series 2011 A, 5.00%, 7/1/21 | | 500,000 | | | 609,980 | |
Los Angeles Department of Water & Power Waterworks Rev., Series 2011 A, 5.00%, 7/1/21 | | $10,000,000 | | | $12,283,500 | |
Los Angeles Unified School District GO, Series 2009 D, 5.00%, 7/1/18 | | 2,300,000 | | | 2,748,569 | |
Los Angeles Unified School District GO, Series 2009 D, 5.00%, 7/1/20 | | 6,065,000 | | | 7,306,505 | |
Los Angeles Unified School District GO, Series 2009 I, 5.00%, 7/1/21 | | 6,520,000 | | | 7,764,798 | |
Los Angeles Unified School District GO, Series 2011 A1, 5.00%, 7/1/18 | | 3,205,000 | | | 3,830,071 | |
Los Angeles Unified School District GO, Series 2011 A2, 5.00%, 7/1/21 | | 10,070,000 | | | 12,420,338 | |
Manteca Unified School District GO, 5.25%, 8/1/14, Prerefunded at 100% of Par (AGM)(1) | | 2,200,000 | | | 2,327,204 | |
Metropolitan Water District of Southern California Rev., Series 2009 C, 5.00%, 7/1/35 | | 2,300,000 | | | 2,613,122 | |
Metropolitan Water District of Southern California Rev., Series 2011 A2, VRDN, 0.27%, 6/6/13 | | 5,000,000 | | | 4,999,950 | |
Northern California Power Agency Rev., Series 2008 C, (Hydroelectric Project Number One), 5.00%, 7/1/19 (AGC) | | 2,300,000 | | | 2,684,008 | |
Northern California Power Agency Rev., Series 2008 C, (Hydroelectric Project Number One), 5.00%, 7/1/20 (AGC) | | 2,500,000 | | | 2,904,675 | |
Northern California Power Agency Rev., Series 2008 C, (Hydroelectric Project Number One), 5.00%, 7/1/21 (AGC) | | 5,000,000 | | | 5,796,100 | |
Northern California Power Agency Rev., Series 2010 A, 5.00%, 7/1/16 | | 1,000,000 | | | 1,130,610 | |
Northern California Power Agency Rev., Series 2010 A, 5.00%, 7/1/17 | | 1,500,000 | | | 1,735,905 | |
Palomar Pomerado Health Care District COP, 6.00%, 11/1/41 | | 5,735,000 | | | 6,180,323 | |
Plumas Unified School District GO, 5.25%, 8/1/20 (AGM) | | 1,000,000 | | | 1,195,130 | |
Poway Unified School District Rev., Capital Appreciation, (School Facilities Improvement), 0.00%, 8/1/41(3) | | 4,610,000 | | | 1,163,887 | |
San Bernardino Community College District GO, Series 2008 A, (Election of 2002), 6.25%, 8/1/18, Prerefunded at 100% of Par(1) | | 4,700,000 | | | 5,950,482 | |
San Buenaventura Rev., (Community Memorial Health System), 7.50%, 12/1/41 | | 3,950,000 | | | 4,812,127 | |
San Diego County Water Authority Rev., Series 2011 S1, (Subordinate Lien), 5.00%, 7/1/16 | | 5,555,000 | | | 6,274,428 | |
San Diego Public Facilities Financing Sewer Authority Rev., Series 2010 A, 5.25%, 5/15/24 | | 6,600,000 | | | 7,852,548 | |
San Diego Public Facilities Financing Water Authority Rev., Series 2010 A, 5.00%, 8/1/22 | | 2,000,000 | | | 2,393,540 | |
San Diego Public Facilities Financing Water Authority Rev., Series 2010 A, 5.00%, 8/1/23 | | 3,000,000 | | | 3,585,360 | |
San Francisco City and County Airports Commission Rev., Series 2008-34F 5.00%, 5/1/17 (AGC) | | 4,140,000 | | | 4,804,843 | |
San Marcos Public Facilities Authority Tax Allocation Rev., Series 2006 A, (Project Area No. 3), 5.00%, 8/1/20 (Ambac) | | 1,525,000 | | | 1,609,836 | |
Southern California Public Power Authority Rev., Series 2008 A, (Southern Transmission), 5.00%, 7/1/22 | | 2,875,000 | | | 3,332,758 | |
Tuolumne Wind Project Authority Rev., Series 2009 A, 5.625%, 1/1/29 | | 2,800,000 | | | 3,274,740 | |
Twin Rivers Unified School District COP, (Facility Bridge Program), VRDN, 3.20%, 6/1/13 (AGM) | | 6,250,000 | | | 6,207,062 | |
Twin Rivers Unified School District COP, (School Facilities Bridge Funding Program), VRDN, 3.50%, 6/3/13 (AGM) | | $10,000,000 | | | $10,000,000 | |
| | | | | | 734,472,575 | |
COLORADO — 1.9% | |
Aurora Hospital Rev., (Children’s Hospital Association), 5.00%, 12/1/40 | | 1,250,000 | | | 1,349,813 | |
Colorado Department of Transportation Rev., (Transportation Revenue Anticipation Notes), 5.00%, 12/15/16 | | 5,000,000 | | | 5,755,950 | |
Colorado Educational & Cultural Facilities Authority Rev., (Northwest Nazarene University Facilities), 4.60%, 11/1/16 | | 760,000 | | | 761,383 | |
Colorado Health Facilities Authority Rev., (Catholic Health Initiatives), 6.00%, 10/1/23 | | 1,500,000 | | | 1,801,095 | |
Colorado Health Facilities Authority Rev., Series 2006 B, (Longmont Unified Hospital), 5.00%, 12/1/20 (Radian) | | 1,000,000 | | | 1,051,810 | |
Colorado Water Resources & Power Development Authority Rev., Series 2000 A, 6.25%, 9/1/16 | | 50,000 | | | 50,251 | |
Denver City and County Airport Rev., Series 2010 A, 5.00%, 11/15/21 | | 2,500,000 | | | 2,973,250 | |
Denver City and County Airport Rev., Series 2012 B, 5.00%, 11/15/25 | | 9,750,000 | | | 11,495,542 | |
E-470 Public Highway Authority Rev., Series 2011 A, VRN, 2.84%, 6/6/13 | | 3,000,000 | | | 3,011,460 | |
Regional Transportation District Rev., Series 2012 A, (Fastracks Project), 5.00%, 11/1/25 | | 9,800,000 | | | 11,718,350 | |
Regional Transportation District Rev., Series 2012 A, (Fastracks Project), 5.00%, 11/1/26 | | 9,800,000 | | | 11,625,544 | |
Regional Transportation District COP, Series 2010 A, 5.50%, 6/1/21 | | 2,000,000 | | | 2,385,280 | |
Regional Transportation District Private Activity Rev., (Denver Transit Partners), 5.25%, 7/15/19 | | 3,600,000 | | | 4,152,204 | |
Regional Transportation District Private Activity Rev., (Denver Transit Partners), 5.25%, 1/15/20 | | 4,835,000 | | | 5,600,042 | |
Regional Transportation District Private Activity Rev., (Denver Transit Partners), 5.00%, 7/15/20 | | 2,895,000 | | | 3,323,692 | |
Regional Transportation District Private Activity Rev., (Denver Transit Partners), 5.00%, 1/15/21 | | 1,400,000 | | | 1,590,848 | |
Regional Transportation District Private Activity Rev., (Denver Transit Partners), 5.00%, 7/15/21 | | 1,400,000 | | | 1,585,094 | |
Regional Transportation District Private Activity Rev., (Denver Transit Partners), 5.00%, 1/15/22 | | 1,400,000 | | | 1,572,690 | |
Regional Transportation District Private Activity Rev., (Denver Transit Partners), 5.00%, 7/15/22 | | 1,500,000 | | | 1,679,955 | |
Regional Transportation District Private Activity Rev., (Denver Transit Partners), 6.00%, 1/15/41 | | 1,000,000 | | | 1,139,750 | |
University of Colorado Enterprise System Rev., Series 2009 A, 5.25%, 6/1/30 | | 1,200,000 | | | 1,393,320 | |
| | | | | | 76,017,323 | |
CONNECTICUT — 2.7% | |
Bridgeport GO, Series 2004 A, 5.25%, 8/15/14, Prerefunded at 100% of Par (NATL-RE)(1) | | 2,150,000 | | | 2,279,452 | |
Connecticut Economic Recovery GO, Series 2009 A, 5.00%, 1/1/14 | | 3,900,000 | | | 4,009,902 | |
Connecticut GO, Series 2001 C, 5.50%, 12/15/13 (NATL-RE-IBC) | | 4,000,000 | | | 4,115,360 | |
Connecticut GO, Series 2004 D, 5.00%, 12/1/14 (NATL-RE) | | 5,000,000 | | | 5,354,050 | |
Connecticut GO, Series 2005 A, VRDN, 0.82%, 6/6/13 | | 5,000,000 | | | 5,025,500 | |
Connecticut GO, Series 2006 C, 5.00%, 6/1/14 | | 5,000,000 | | | 5,238,850 | |
Connecticut GO, Series 2006 D, 5.00%, 11/1/15 | | $1,595,000 | | | $1,770,099 | |
Connecticut GO, Series 2009 A, 5.00%, 1/1/16 | | 8,375,000 | | | 9,319,281 | |
Connecticut GO, Series 2012 A, VRDN, 0.34%, 6/6/13 | | 7,500,000 | | | 7,513,725 | |
Connecticut GO, Series 2012 A, VRDN, 0.52%, 6/6/13 | | 4,500,000 | | | 4,511,205 | |
Connecticut GO, Series 2012 A, VRDN, 0.65%, 6/6/13 | | 4,300,000 | | | 4,324,725 | |
Connecticut GO, Series 2012 A, VRDN, 0.80%, 6/6/13 | | 4,000,000 | | | 4,019,240 | |
Connecticut GO, Series 2012 A, VRDN, 1.00%, 6/6/13 | | 4,500,000 | | | 4,523,895 | |
Connecticut GO, Series 2012 A, VRDN, 1.22%, 6/6/13 | | 5,500,000 | | | 5,608,845 | |
Connecticut GO, Series 2012 A, VRDN, 1.37%, 6/6/13 | | 7,000,000 | | | 7,133,910 | |
Connecticut Health & Educational Facilities Authority Rev., Series 1999 G (Ascension Health Center), VRDN, 1.55%, 2/1/17 | | 3,315,000 | | | 3,392,936 | |
Connecticut Health & Educational Facilities Authority Rev., Series 2007 I, (Quinnipiac University), 5.00%, 7/1/16 (NATL-RE) | | 2,660,000 | | | 2,963,346 | |
Connecticut Health & Educational Facilities Authority Rev., Series 2010 A3, (Yale University), VRDN, 0.875%, 2/8/18 | | 27,600,000 | | | 27,493,188 | |
| | | | | | 108,597,509 | |
DISTRICT OF COLUMBIA — 1.3% | |
District of Columbia Rev., Series 2010 A, (Income Tax Secured), 5.00%, 12/1/19 | | 5,000,000 | | | 6,055,200 | |
District of Columbia Rev., Series 2011 B, (Income Tax Secured), VRN, 0.42%, 6/6/13 | | 14,970,000 | | | 14,980,479 | |
District of Columbia Rev., Series 2012 A, (Income Tax Secured), 5.00%, 12/1/16 | | 1,200,000 | | | 1,381,464 | |
District of Columbia Rev., Series 2012 A, (Income Tax Secured), 5.00%, 12/1/17 | | 5,000,000 | | | 5,898,600 | |
District of Columbia Rev., Series 2012 C, (Income Tax Secured), 4.00%, 12/1/15 | | 4,500,000 | | | 4,899,600 | |
District of Columbia Rev., Series 2012 C, (Income Tax Secured), 4.00%, 12/1/16 | | 3,000,000 | | | 3,348,870 | |
District of Columbia Water & Sewer Authority Public Utility Rev., Series 2008 A, (Subordinated Lien) 5.00%, 10/1/34 (AGC) | | 1,200,000 | | | 1,367,076 | |
District of Columbia Water & Sewer Authority Public Utility Rev., Series 2012 B1, VRDN, 0.60%, 6/6/13 | | 2,500,000 | | | 2,502,250 | |
Metropolitan Washington Airports Authority Rev., Series 2009 A, (First Senior Lien), 5.00%, 10/1/39 | | 5,000,000 | | | 5,468,550 | |
Washington Metropolitan Area Transit Authority Rev., Series 2009 A, 5.00%, 7/1/17 | | 4,600,000 | | | 5,319,440 | |
| | | | | | 51,221,529 | |
FLORIDA — 6.7% | |
Broward County Airport System Rev., Series 2012 Q-1, 5.00%, 10/1/24 | | 2,650,000 | | | 3,077,975 | |
Broward County Airport System Rev., Series 2012 Q-1, 5.00%, 10/1/25 | | 1,000,000 | | | 1,153,360 | |
Broward County Airport System Rev., Series 2012 Q-1, 5.00%, 10/1/26 | | 1,000,000 | | | 1,148,550 | |
Broward County School Board COP, Series 2012 A, 5.00%, 7/1/26 | | 11,800,000 | | | 13,452,590 | |
Citizens Property Insurance Corp. Rev., Series 2009 A1, (Senior Secured), 5.50%, 6/1/17 | | 3,625,000 | | | 4,227,801 | |
Citizens Property Insurance Corp. Rev., Series 2009 A1, (Senior Secured), 5.50%, 6/1/16 (AGC) | | 9,450,000 | | | 10,774,323 | |
Citizens Property Insurance Corp. Rev., Series 2009 A1, (Senior Secured), 6.00%, 6/1/17 | | 2,500,000 | | | 2,962,225 | |
Citizens Property Insurance Corp. Rev., Series 2010 A1, (Second High Risk Notes), 5.25%, 6/1/17 | | 5,800,000 | | | 6,708,048 | |
Citizens Property Insurance Corp. Rev., Series 2011 A1, (Senior Secured), 5.00%, 6/1/16 | | 3,000,000 | | | 3,366,510 | |
Citizens Property Insurance Corp. Rev., Series 2011 A1, (Senior Secured), 5.00%, 6/1/18 | | 4,440,000 | | | 5,173,710 | |
Citizens Property Insurance Corp. Rev., Series 2012 A1, (Senior Secured), 5.00%, 6/1/17 | | $4,260,000 | | | $4,885,496 | |
Citizens Property Insurance Corp. Rev., Series 2012 A1, (Senior Secured), 5.00%, 6/1/18 | | 9,700,000 | | | 11,302,925 | |
Florida Board of Public Education GO, Series 2011 B, (Capital Outlay of 2011), 5.00%, 6/1/18 | | 7,250,000 | | | 8,624,600 | |
Florida Hurricane Catastrophe Fund Finance Corp. Rev., Series 2008 A, 5.00%, 7/1/13 | | 10,000,000 | | | 10,040,400 | |
Florida Municipal Power Agency Rev., Series 2008 C, (All Requirements Supply), VRDN, 0.12%, 6/3/13 (LOC: Bank of America N.A.) | | 35,300,000 | | | 35,300,000 | |
Florida Municipal Power Agency Rev., Series 2009 A, (All Requirements Power), 5.25%, 10/1/20 | | 2,000,000 | | | 2,373,020 | |
Florida Municipal Power Agency Rev., Series 2009 A, (All Requirements Power), 5.25%, 10/1/21 | | 3,470,000 | | | 4,048,831 | |
Florida State Board of Education GO, Series 2013 A, 5.00%, 6/1/22 | | 10,000,000 | | | 12,288,900 | |
Halifax Hospital Medical Center Rev., Series 2006 A, 5.25%, 6/1/16 | | 1,000,000 | | | 1,118,460 | |
Halifax Hospital Medical Center Rev., Series 2006 A, 5.25%, 6/1/18 | | 575,000 | | | 635,260 | |
Halifax Hospital Medical Center Rev., Series 2006 B1, 5.50%, 6/1/38 (AGM) | | 1,000,000 | | | 1,061,090 | |
Halifax Hospital Medical Center Rev., Series 2006 B2, 5.375%, 6/1/31 (AGM) | | 2,000,000 | | | 2,155,900 | |
Indian River County Rev., (Spring Training Facility), 5.25%, 4/1/15 (NATL-RE/FGIC) | | 1,235,000 | | | 1,240,002 | |
JEA Electric System Rev., Series 2009 A, 5.50%, 10/1/39 | | 10,000,000 | | | 10,337,900 | |
JEA Electric System Rev., Series 2013 A, 5.00%, 10/1/15 | | 3,000,000 | | | 3,316,470 | |
JEA Electric System Rev., Series 2013 A, 5.00%, 10/1/17 | | 1,810,000 | | | 2,120,886 | |
JEA Electric System Rev., Series 2013 A, 5.00%, 10/1/20 | | 5,945,000 | | | 7,259,974 | |
JEA Electric System Rev., Series 2013 A, 5.00%, 10/1/21 | | 3,115,000 | | | 3,824,940 | |
JEA Electric System Rev., Series 2013 A, 5.00%, 10/1/22 | | 1,750,000 | | | 2,150,155 | |
JEA Electric System Rev., Series 2013 A, 5.00%, 10/1/23 | | 1,500,000 | | | 1,826,430 | |
Lee County School Board COP, Series 2012 B, 5.00%, 8/1/17 | | 3,170,000 | | | 3,649,050 | |
Miami Beach Health Facilities Authority Rev., (Mount Sinai Medical Center), 3.00%, 11/15/14 | | 1,200,000 | | | 1,231,332 | |
Miami Parking Facilities Rev., 5.25%, 10/1/15 (NATL-RE) | | 650,000 | | | 694,967 | |
Miami-Dade County Rev., Series 2012 B, 5.00%, 10/1/37 | | 900,000 | | | 980,091 | |
Miami-Dade County Aviation Department Rev., Series 2007 D, (Miami International Airport), 5.25%, 10/1/26 (AGM) | | 4,650,000 | | | 5,363,775 | |
Miami-Dade County Aviation Department Rev., Series 2010 B, 5.00%, 10/1/41 | | 3,000,000 | | | 3,271,470 | |
Miami-Dade County Transit Sales Surtax Rev., (Sales Tax), 5.00%, 7/1/42 | | 6,175,000 | | | 6,707,408 | |
Orange County School Board COP, Series 2012 B, 5.00%, 8/1/26 | | 8,000,000 | | | 9,199,920 | |
Orange County School Board COP, Series 2012 B, 5.00%, 8/1/27 | | 6,500,000 | | | 7,435,870 | |
Orlando & Orange County Expressway Authority Rev., Series 2010 A, 5.00%, 7/1/40 | | 3,000,000 | | | 3,240,000 | |
Orlando Utilities Commission System Rev., Series 2009 B, 5.00%, 10/1/33 | | 2,000,000 | | | 2,313,840 | |
Orlando Utilities Commission System Rev., Series 2011 C, 5.00%, 10/1/19 | | 1,500,000 | | | 1,817,550 | |
Orlando Utilities Commission System Rev., Series 2011 C, 5.00%, 10/1/20 | | 5,000,000 | | | 6,100,200 | |
Orlando Utilities Commission System Rev., Series 2011 C, 5.00%, 10/1/21 | | $4,745,000 | | | $5,816,231 | |
Orlando Utilities Commission System Rev., Series 2011 C, 5.00%, 10/1/22 | | 1,750,000 | | | 2,152,220 | |
Orlando Utilities Commission Water & Electric Rev., Series 1989 D, 6.75%, 10/1/17(1) | | 760,000 | | | 870,740 | |
Palm Beach County Health Facilities Authority Rev., Series 2010 A, (Bethesda Healthcare System), 5.25%, 7/1/40 (AGM) | | 5,850,000 | | | 6,254,176 | |
Palm Beach County School Board COP, Series 2011 A, VRDN, 5.00%, 8/1/16 | | 7,000,000 | | | 7,888,090 | |
Putnam County Development Authority Pollution Control Rev., Series 2007 B, (Seminole Electric Cooperative, Inc.), VRDN, 5.35%, 5/1/18 (Ambac) | | 1,500,000 | | | 1,752,345 | |
South Lake County Hospital District Rev., Series 2010 A, (South Lake Hospital), 6.25%, 4/1/39 | | 3,250,000 | | | 3,671,070 | |
St. Petersburg Health Facilities Authority Rev., Series 2009 A, (All Children’s Health Facilities), 6.50%, 11/15/39 | | 4,700,000 | | | 5,503,888 | |
Sunrise Florida Utilities System Rev., 5.20%, 10/1/20, Prerefunded at 100% of Par (Ambac)(1) | | 430,000 | | | 529,708 | |
Sunrise Florida Utilities System Rev., 5.20%, 10/1/22 (Ambac) | | 570,000 | | | 641,826 | |
Tampa Bay Water Regional Water Supply Authority Utility System Rev., Series 2011 A, 5.00%, 10/1/16 | | 3,600,000 | | | 4,109,724 | |
Tampa Bay Water Regional Water Supply Authority Utility System Rev., Series 2011 A, 5.00%, 10/1/17 | | 3,000,000 | | | 3,514,230 | |
Tampa Guaranteed Entitlement Rev., 6.00%, 10/1/18 (Ambac) | | 270,000 | | | 296,571 | |
Tampa Water & Sewer Rev., 6.00%, 10/1/17 (AGM) | | 1,000,000 | | | 1,213,280 | |
| | | | | | 274,176,303 | |
GEORGIA — 2.7% | |
Athens-Clarke County Unified Government Water & Sewer Rev., 5.625%, 1/1/28 | | 1,200,000 | | | 1,438,884 | |
Atlanta Rev., Series 2009 A, 6.00%, 11/1/27 | | 5,000,000 | | | 6,066,100 | |
Atlanta Rev., Series 2009 A, 6.00%, 11/1/28 | | 3,000,000 | | | 3,633,690 | |
Burke County Development Authority Rev., (Georgia Power Co. Plant Vogtle Project), VRDN, 1.75%, 6/1/17 | | 5,000,000 | | | 5,120,250 | |
Burke County Development Authority Rev., (Georgia Power Co. Plant Vogtle Project), VRDN, 1.75%, 6/1/17 | | 5,000,000 | | | 5,120,250 | |
DeKalb County Hospital Authority Rev., (DeKalb Medical Center, Inc.), 6.125%, 9/1/40 | | 2,450,000 | | | 2,827,153 | |
Floyd County Development Authority Rev., (Power Company Plant Hammond), VRDN, 0.85%, 11/19/15 | | 2,300,000 | | | 2,313,202 | |
Georgia GO, Series 2009 G, 5.00%, 11/1/16 | | 2,000,000 | | | 2,301,160 | |
Georgia GO, Series 2009 I, 5.00%, 7/1/16 | | 10,000,000 | | | 11,373,500 | |
Georgia GO, Series 2013 C, 5.00%, 10/1/20 | | 18,485,000 | | | 22,853,006 | |
Georgia Municipal Electric Authority Rev., Series 2008 A, (Project 1), 5.25%, 1/1/17 | | 5,000,000 | | | 5,745,150 | |
Georgia Municipal Electric Authority Rev., Series 2008 D, (Project 1), 5.50%, 1/1/26 | | 4,800,000 | | | 5,634,624 | |
Georgia Road & Tollway Authority Rev., Series 2008 A, (Federal Highway Grant Anticipation Bonds), 5.00%, 6/1/16 | | 6,350,000 | | | 7,147,433 | |
Georgia Road & Tollway Authority Rev., Series 2009 A, (Federal Highway Grant Anticipation Bonds), 5.00%, 6/1/21 | | 4,000,000 | | | 4,669,640 | |
Marietta Development Authority Rev., (Life University, Inc.), 6.25%, 6/15/20 | | 790,000 | | | 830,258 | |
Metropolitan Atlanta Rapid Transit Authority Rev., Series 2000 A, VRDN, 0.37%, 6/6/13 | | 10,000,000 | | | 10,000,200 | |
Private Colleges & Universities Authority Rev., Series 2009 B, (Emory University), 5.00%, 9/1/35 | | $1,000,000 | | | $1,132,040 | |
Private Colleges & Universities Authority Rev., Series 2011 A, 5.00%, 9/1/16 | | 10,000,000 | | | 11,408,600 | |
| | | | | | 109,615,140 | |
GUAM — 0.8% | |
Guam Government Business Privilege Tax GO, Series 2011 A, 5.00%, 1/1/27 | | 3,185,000 | | | 3,565,289 | |
Guam Government Business Privilege Tax GO, Series 2011 A, 5.25%, 1/1/36 | | 2,000,000 | | | 2,205,260 | |
Guam Government Department of Education COP, Series 2010 A, (John F. Kennedy High School), 6.875%, 12/1/40 | | 1,500,000 | | | 1,659,060 | |
Guam Government GO, Series 2009 A, 6.00%, 11/15/19 | | 5,000,000 | | | 5,445,200 | |
Guam Government GO, Series 2009 A, 6.75%, 11/15/29 | | 13,320,000 | | | 14,785,866 | |
Guam Power Authority Rev., Series 2012 A, 5.00%, 10/1/26 (AGM) | | 2,000,000 | | | 2,297,540 | |
Guam Power Authority Rev., Series 2012 A, 5.00%, 10/1/27 (AGM) | | 1,000,000 | | | 1,139,870 | |
| | | | | | 31,098,085 | |
HAWAII — 0.7% | |
Hawaii GO, Series 2007 DJ 5.00%, 4/1/26 (Ambac) | | 5,000,000 | | | 5,625,550 | |
Hawaii GO, Series 2010 DY, 5.00%, 2/1/15 | | 1,000,000 | | | 1,077,810 | |
Hawaii GO, Series EA, 5.00%, 12/1/23 | | 10,000,000 | | | 12,092,400 | |
Hawaii Pacific Health Rev., Series 2010 A, 5.50%, 7/1/40 | | 2,500,000 | | | 2,717,200 | |
Hawaii Pacific Health Special Purpose Rev., Series 2010 B, 5.75%, 7/1/40 | | 800,000 | | | 890,016 | |
Honolulu City and County GO, Series 2009 A, 5.00%, 4/1/21 | | 3,000,000 | | | 3,548,850 | |
Honolulu City and County Wastewater System Rev., Series 2012 A, (First Bond Resolution), 5.00%, 7/1/23 | | 905,000 | | | 1,098,073 | |
Honolulu City and County Wastewater System Rev., Series 2012 A, (First Bond Resolution), 5.00%, 7/1/26 | | 1,555,000 | | | 1,840,669 | |
| | | | | | 28,890,568 | |
IDAHO — 0.1% | |
Idaho Health Facilities Authority Rev., (St. Luke’s Regional Medical Center), 5.00%, 7/1/35 (AGM) | | 250,000 | | | 269,515 | |
Idaho Housing & Finance Association Rev., Series 2011 A, 5.00%, 7/15/29 | | 3,000,000 | | | 3,366,330 | |
| | | | | | 3,635,845 | |
ILLINOIS — 4.1% | |
Bedford Park GO, Series 2004 A, 5.25%, 12/15/20 (AGM) | | 2,000,000 | | | 2,146,640 | |
Bourbonnais Industrial Project Rev., (Olivet Nazarene University), 5.00%, 11/1/20 | | 1,235,000 | | | 1,421,893 | |
Chicago Board of Education GO, Series 2008 C, 5.25%, 12/1/23 | | 5,000,000 | | | 5,639,450 | |
Chicago Board of Education GO, Series 2010 F, 5.00%, 12/1/14 | | 1,050,000 | | | 1,122,082 | |
Chicago Board of Education GO, Series 2010 F, 5.00%, 12/1/15 | | 1,250,000 | | | 1,385,637 | |
Chicago Board of Education GO, Series 2010 F, 5.00%, 12/1/16 | | 1,300,000 | | | 1,480,778 | |
Chicago Metropolitan Water Reclamation District GO, Series 2007 C, 5.25%, 12/1/32 | | 5,345,000 | | | 6,602,999 | |
Chicago O’Hare International Airport Rev., Series 2005 B, 5.25%, 1/1/18 (NATL-RE) | | 5,000,000 | | | 5,879,600 | |
Chicago O’Hare International Airport Rev., Series 2008 A, 5.00%, 1/1/14 (AGM) | | 4,000,000 | | | 4,112,480 | |
Chicago O’Hare International Airport Rev., Series 2008 C, 4.00%, 1/1/17 (AGM) | | 600,000 | | | 662,862 | |
Chicago O’Hare International Airport Rev., Series 2011 A, (Third Lien), 5.75%, 1/1/39 | | 2,000,000 | | | 2,298,100 | |
Chicago O’Hare International Airport Rev., Series 2011 B, (Third Lien), 5.00%, 1/1/16 | | 1,000,000 | | | 1,109,480 | |
Chicago O’Hare International Airport Rev., Series 2011 B, (Third Lien), 5.00%, 1/1/22 | | 1,000,000 | | | 1,174,340 | |
Chicago Wastewater Transmission Rev., (Second Lien), 5.00%, 1/1/42 | | $1,000,000 | | | $1,086,780 | |
Chicago Waterworks Rev., 5.00%, 11/1/42 | | 2,300,000 | | | 2,523,376 | |
Chicago Waterworks Rev., Series 2006 A, (Second Lien), 5.00%, 11/1/13 (Ambac) | | 1,015,000 | | | 1,035,209 | |
Cicero GO, Series 2005 A, 5.25%, 1/1/20 (XLCA) | | 1,250,000 | | | 1,297,675 | |
Cicero GO, Series 2005 A, 5.25%, 1/1/21 (XLCA) | | 1,000,000 | | | 1,034,830 | |
Cook County GO, Series 2010 A, 5.25%, 11/15/22 | | 5,000,000 | | | 5,876,050 | |
Illinois Dedicated Tax Rev., (Civic Center), 6.25%, 12/15/20 (Ambac) | | 1,830,000 | | | 2,074,543 | |
Illinois Educational Facilities Authority Rev., Series 2001 B1, (University of Chicago), VRDN, 1.10%, 2/15/18 | | 3,875,000 | | | 3,910,185 | |
Illinois Finance Authority Rev., (Central DuPage Health), 5.00%, 11/1/27 | | 3,595,000 | | | 4,003,967 | |
Illinois Finance Authority Rev., (Little Co. Mary Hospital Health), 5.375%, 8/15/40 | | 1,000,000 | | | 1,075,510 | |
Illinois Finance Authority Rev., Series 2008 D, (Advocate Health Care Network), 6.25%, 11/1/28 | | 5,000,000 | | | 5,945,150 | |
Illinois Finance Authority Rev., Series 2009 C, (Rush University Medical Center), 6.375%, 11/1/29 | | 5,000,000 | | | 5,984,850 | |
Illinois Finance Authority Rev., Series 2010 A, (Provena Health), 5.00%, 5/1/14 | | 1,000,000 | | | 1,030,580 | |
Illinois Finance Authority Rev., Series 2010 A, (Provena Health), 5.25%, 5/1/16 | | 1,000,000 | | | 1,095,540 | |
Illinois Finance Authority Rev., Series 2011 A, (Carle Foundation), 6.00%, 8/15/41 | | 2,000,000 | | | 2,359,300 | |
Illinois GO, 5.00%, 1/1/15 | | 15,000,000 | | | 15,965,850 | |
Illinois GO, 5.50%, 8/1/15 (NATL-RE) | | 1,795,000 | | | 1,971,233 | |
Illinois GO, 5.00%, 1/1/17 (AGM) | | 9,800,000 | | | 11,015,886 | |
Illinois GO, 4.00%, 9/1/17 | | 5,000,000 | | | 5,493,550 | |
Illinois GO, 5.00%, 1/1/20 | | 1,000,000 | | | 1,136,240 | |
Illinois GO, 5.00%, 8/1/23 | | 5,000,000 | | | 5,658,450 | |
Illinois GO, 5.00%, 8/1/24 | | 2,000,000 | | | 2,224,440 | |
Illinois GO, 5.00%, 3/1/37 | | 900,000 | | | 937,809 | |
Illinois Sales Tax Rev., 5.00%, 6/15/17 | | 3,000,000 | | | 3,485,550 | |
Illinois State Unemployment Insurance Fund Building Receipts Rev., Series 2012 A, 5.00%, 6/15/14 | | 5,000,000 | | | 5,249,400 | |
Illinois State Unemployment Insurance Fund Building Receipts Rev., Series 2012 A, 5.00%, 6/15/15 | | 4,000,000 | | | 4,379,560 | |
Illinois Toll Highway Authority Rev., Series 2010 A1, 5.00%, 1/1/25 | | 5,000,000 | | | 5,733,100 | |
Kane County Community Unit School District No. 304 GO, 6.20%, 1/1/15, Prerefunded at 100% of Par (AGM)(1) | | 930,000 | | | 1,015,904 | |
Metropolitan Pier & Exposition Authority Rev., Series 2010 B2, (McCormick Place Expansion), 5.00%, 6/15/50 | | 2,750,000 | | | 2,921,545 | |
Railsplitter Tobacco Settlement Authority Rev., 5.00%, 6/1/17 | | 6,000,000 | | | 6,834,720 | |
Railsplitter Tobacco Settlement Authority Rev., 5.25%, 6/1/21 | | 10,000,000 | | | 11,945,600 | |
Regional Transportation Authority Rev., Series 1990 A, 7.20%, 11/1/20 (Ambac) | | 800,000 | | | 954,024 | |
Southwestern Illinois Development Authority Rev., (Triad School District No. 2), 5.00%, 10/1/18 (NATL-RE) | | 1,000,000 | | | 1,095,310 | |
University of Illinois COP, Series 2006 A, (Academic Facilities), 5.00%, 3/15/16 (Ambac) | | 3,270,000 | | | 3,560,834 | |
| | | | | | 166,948,891 | |
INDIANA — 0.8% | |
Hamilton Southeastern Consolidated School Building Corp. Rev., (Hamilton County), 4.25%, 7/15/20 (AGM) | | 1,000,000 | | | 1,078,190 | |
Indiana Bond Bank Rev., Series 2006 A, 5.00%, 8/1/17 (AGM) | | 1,520,000 | | | 1,711,535 | |
Indiana Bond Bank Rev., Series 2006 A, 5.00%, 8/1/18 (AGM) | | 1,600,000 | | | 1,808,160 | |
Indiana Bond Bank Rev., Series 2006 A, 5.00%, 8/1/19 (AGM) | | $1,680,000 | | | $1,898,568 | |
Indiana Finance Authority Lease Rev., Series 2008 A1, 5.00%, 11/1/16 | | 5,000,000 | | | 5,701,450 | |
Indiana Finance Authority Wastewater Utility Rev., Series 2011 A, (First Lien), 5.25%, 10/1/23 | | 2,645,000 | | | 3,201,191 | |
Indiana Finance Authority Wastewater Utility Rev., Series 2011 A, (First Lien), 5.25%, 10/1/24 | | 3,025,000 | | | 3,631,422 | |
Indiana Finance Authority Wastewater Utility Rev., Series 2011 A, (First Lien), 5.25%, 10/1/25 | | 1,650,000 | | | 1,965,430 | |
Indiana Health Facility Financing Authority Rev., Series 2011 A1, (Ascension Health Credit Group), VRDN, 1.50%, 8/1/14 | | 3,500,000 | | | 3,541,965 | |
Indiana Transportation Finance Authority Rev., Series 1990 A, 7.25%, 6/1/15 | | 340,000 | | | 360,043 | |
Indiana University Rev., Series 2011 U, 5.00%, 8/1/16 | | 1,000,000 | | | 1,137,970 | |
Indiana University Rev., Series 2011 U, 5.00%, 8/1/17 | | 2,000,000 | | | 2,338,980 | |
Indiana University Rev., Series 2011 U, 5.00%, 8/1/19 | | 4,200,000 | | | 5,076,918 | |
| | | | | | 33,451,822 | |
IOWA — 0.2% | |
Iowa Rev., Series 2009 A, (I-Jobs Program), 5.00%, 6/1/22 | | 2,500,000 | | | 2,972,100 | |
Iowa Finance Authority Health Facilities Rev., Series 2006 A, (Development Care Initiatives), 5.25%, 7/1/13 | | 1,485,000 | | | 1,488,831 | |
Iowa Finance Authority Health Facilities Rev., Series 2006 A, (Development Care Initiatives), 5.25%, 7/1/14 | | 1,950,000 | | | 2,011,152 | |
Iowa Finance Authority Health Facilities Rev., Series 2006 A, (Development Care Initiatives), 5.25%, 7/1/16 | | 1,690,000 | | | 1,816,632 | |
Iowa Higher Education Loan Authority Rev., (Cornell College), VRDN, 0.14%, 6/3/13 (LOC: JPMorgan Chase Bank N.A.) | | 1,025,000 | | | 1,025,000 | |
| | | | | | 9,313,715 | |
KANSAS — 0.9% | |
Kansas State Department of Transportation Rev., Series 2009 A, 5.00%, 9/1/16 | | 4,500,000 | | | 5,148,000 | �� |
Kansas State Department of Transportation Highway Rev., Series 2012 A2, VRN, 0.35%, 6/6/13 | | 24,500,000 | | | 24,532,585 | |
Olathe Health Facilities Rev., Series 2010 B, (Olathe Medical Center), VRDN, 0.15%, 6/3/13 (LOC: Bank of America N.A.) | | 6,000,000 | | | 6,000,000 | |
| | | | | | 35,680,585 | |
KENTUCKY — 0.6% | |
Kentucky Asset/Liability Commission Agency Fund Rev., Series 2010 A, (Federal Highway Trust), 5.00%, 9/1/20 | | 4,000,000 | | | 4,841,440 | |
Kentucky Economic Development Finance Authority Rev., Series 2009 A, (Baptist Healthcare System), 5.375%, 8/15/24 | | 3,000,000 | | | 3,468,690 | |
Kentucky Economic Development Finance Authority Rev., Series 2009 A, (Baptist Healthcare System), 5.625%, 8/15/27 | | 1,250,000 | | | 1,420,712 | |
Kentucky State Property & Buildings Commission Rev., (Project No. 82), 5.25%, 10/1/16 (AGM) | | 4,600,000 | | | 5,276,016 | |
Kentucky State Property & Buildings Commission Rev., Series 2011 A, (Project No. 100), 5.00%, 8/1/18 | | 7,000,000 | | | 8,292,970 | |
| | | | | | 23,299,828 | |
LOUISIANA — 1.1% | |
Louisiana Gasoline & Fuels Tax Rev., Series 2013 B1, (Second Lien), VRDN, 0.61%, 7/1/13 | | 7,500,000 | | | 7,500,750 | |
Louisiana GO, Series 2010 A, 5.00%, 11/15/18 | | 3,225,000 | | | 3,876,450 | |
Louisiana GO, Series 2013 C, 5.00%, 7/15/25 | | 3,000,000 | | | 3,638,160 | |
Louisiana GO, Series 2013 C, 5.00%, 7/15/26 | | $4,215,000 | | | $5,066,135 | |
Louisiana Public Facilities Authority Rev., Series 2006 A, (Black & Gold Facilities), 4.00%, 7/1/13 (CIFG) | | 1,105,000 | | | 1,105,497 | |
Louisiana Public Facilities Authority Rev., Series 2006 A, (Black & Gold Facilities), 5.00%, 7/1/15 (CIFG) | | 1,205,000 | | | 1,233,173 | |
Louisiana Public Facilities Authority Rev., Series 2007 A, (Black & Gold Facilities), 5.00%, 7/1/22 (AGC) | | 1,465,000 | | | 1,575,915 | |
New Orleans GO, 5.00%, 12/1/19 | | 5,000,000 | | | 5,848,000 | |
New Orleans GO, 5.00%, 12/1/20 | | 4,000,000 | | | 4,693,920 | |
New Orleans GO, 5.00%, 12/1/21 | | 6,000,000 | | | 7,014,960 | |
Regional Transit Authority Sales Tax Rev., 5.00%, 12/1/17 (AGM) | | 1,000,000 | | | 1,160,970 | |
Regional Transit Authority Sales Tax Rev., 5.00%, 12/1/19 (AGM) | | 1,000,000 | | | 1,191,910 | |
Regional Transit Authority Sales Tax Rev., 5.00%, 12/1/20 (AGM) | | 1,250,000 | | | 1,499,038 | |
| | | | | | 45,404,878 | |
MAINE† | |
Portland Airport Rev., 5.00%, 1/1/40 (AGM) | | 1,795,000 | | | 1,945,995 | |
MARYLAND — 0.8% | |
Maryland Economic Development Corp. Rev., Series 2010 A, (Transportation Facilities), 5.75%, 6/1/35 | | 1,000,000 | | | 1,132,320 | |
Maryland GO, Series 2005 A, (Capital Improvement & Local Facilities), 5.25%, 2/15/15 | | 10,000,000 | | | 10,845,900 | |
Maryland GO, Series 2011 B, 5.00%, 8/1/19 | | 5,000,000 | | | 6,100,050 | |
Maryland GO, Series 2013 A, 5.00%, 3/1/23 | | 10,000,000 | | | 12,073,400 | |
Maryland Health & Higher Educational Facilities Authority Rev., (Lifebridge Health Issue), 5.00%, 7/1/13 | | 1,215,000 | | | 1,219,787 | |
Maryland Health & Higher Educational Facilities Authority Rev., Series 2008 A, (Johns Hopkins University), 5.25%, 7/1/38 | | 1,645,000 | | | 1,899,597 | |
| | | | | | 33,271,054 | |
MASSACHUSETTS — 4.0% | |
Massachusetts Bay Transportation Authority Rev., Series 2008 A, (Assessment Bonds), 5.25%, 7/1/34 | | 3,300,000 | | | 3,774,705 | |
Massachusetts Development Finance Agency Rev., (Suffolk University), 5.125%, 7/1/40 | | 1,750,000 | | | 1,865,342 | |
Massachusetts Development Finance Agency Rev., Series 2007 C, (Wheelock College), 5.00%, 10/1/17 | | 1,620,000 | | | 1,823,602 | |
Massachusetts Development Finance Agency Rev., Series 2009 V2, (Boston University), 2.875%, 10/1/14 | | 5,000,000 | | | 5,166,100 | |
Massachusetts GO, Series 2006 D, (Consolidated Loan of 2002), 5.00%, 8/1/14 | | 2,500,000 | | | 2,639,350 | |
Massachusetts GO, Series 2011 A, 5.00%, 4/1/28 | | 10,000,000 | | | 11,617,600 | |
Massachusetts GO, Series 2011 B, (Consolidated Loan), 5.00%, 8/1/22 | | 9,635,000 | | | 11,690,049 | |
Massachusetts GO, Series 2012 A, VRN, 0.37%, 6/6/13 | | 9,800,000 | | | 9,803,136 | |
Massachusetts GO, Series 2013 A, 5.00%, 4/1/19 | | 14,600,000 | | | 17,568,472 | |
Massachusetts Health & Educational Facilities Authority Rev., Series 2008 A, (Massachusetts Institute of Technology), 5.00%, 7/1/14 | | 5,000,000 | | | 5,262,100 | |
Massachusetts Health & Educational Facilities Authority Rev., Series 2008 T3 (Northeastern University), VRDN, 2.70%, 2/20/14 | | 8,500,000 | | | 8,632,770 | |
Massachusetts Health & Educational Facilities Authority Rev., Series 2009 A, (Harvard University), 5.50%, 11/15/36(4) | | 6,800,000 | | | 8,063,372 | |
Massachusetts Health & Educational Facilities Authority Rev., Series 2009 O, (Massachusetts Institute of Technology), 5.75%, 7/1/26 | | $10,000,000 | | | $12,311,900 | |
Massachusetts Health & Educational Facilities Authority Rev., Series 2010 C, (Massachusetts Eye and Ear Infirmary), 5.375%, 7/1/35 | | 2,000,000 | | | 2,155,960 | |
Massachusetts Health & Educational Facilities Authority Rev., Series 2010 G, (Umass Memorial), 5.00%, 7/1/20 | | 1,500,000 | | | 1,702,935 | |
Massachusetts Health & Educational Facilities Authority Rev., Series 2010 G, (Umass Memorial), 5.00%, 7/1/21 | | 1,050,000 | | | 1,172,104 | |
Massachusetts Municipal Wholesale Electric Co. Rev., Series 2012 A, 5.00%, 7/1/15 | | 3,000,000 | | | 3,279,780 | |
Massachusetts Port Authority Rev., Series 2012 B, 4.00%, 7/1/18 | | 1,305,000 | | | 1,484,346 | |
Massachusetts Port Authority Rev., Series 2012 B, 5.00%, 7/1/19 | | 250,000 | | | 300,133 | |
Massachusetts Port Authority Rev., Series 2012 B, 4.00%, 7/1/22 | | 2,655,000 | | | 3,028,957 | |
Massachusetts School Building Authority Sales Tax Rev., Series 2012 A, (Senior Lien), 5.00%, 8/15/30 | | 7,750,000 | | | 9,018,907 | |
Massachusetts School Building Authority Sales Tax Rev., Series 2012 B, 5.00%, 8/15/30 | | 20,205,000 | | | 23,513,165 | |
Massachusetts State Department of Transportation Metropolitan Highway Rev., Series 2010 B, (Metropolitan Senior), 5.00%, 1/1/23 | | 1,000,000 | | | 1,155,130 | |
Massachusetts State Department of Transportation Metropolitan Highway Rev., Series 2010 B, (Metropolitan Senior), 5.00%, 1/1/24 | | 6,000,000 | | | 6,864,060 | |
Massachusetts Water Resources Authority Rev., Series 2011 B, (Charlestown Navy Yard), 5.00%, 8/1/23 | | 1,000,000 | | | 1,202,300 | |
Massachusetts Water Resources Authority Rev., Series 2011 B, (Charlestown Navy Yard), 5.00%, 8/1/24 | | 1,815,000 | | | 2,177,292 | |
Massachusetts Water Resources Authority Rev., Series 2011 B, (Charlestown Navy Yard), 5.00%, 8/1/25 | | 4,215,000 | | | 5,016,904 | |
Massachusetts Water Resources Authority Rev., Series 2011 B, (Charlestown Navy Yard), 5.00%, 8/1/26 | | 1,000,000 | | | 1,181,450 | |
| | | | | | 163,471,921 | |
MICHIGAN — 2.5% | |
Detroit City School District GO, Series 2012 A, (Building & Site), 4.00%, 5/1/14 (Q-SBLF) | | 2,500,000 | | | 2,577,100 | |
Detroit City School District GO, Series 2012 A, (Building & Site), 5.00%, 5/1/18 (Q-SBLF) | | 3,500,000 | | | 4,012,610 | |
Detroit City School District GO, Series 2012 A, (Building & Site), 5.00%, 5/1/28 (Q-SBLF) | | 6,500,000 | | | 7,206,940 | |
Detroit City School District GO, Series 2012 A, (Building & Site), 5.00%, 5/1/31 (Q-SBLF) | | 4,750,000 | | | 5,262,762 | |
Detroit Water and Sewerage Department Disposal Sewage System Rev., Series 2012 A, (Senior Lien), 5.25%, 7/1/26 | | 4,300,000 | | | 4,775,064 | |
Detroit Water and Sewerage Department Disposal Sewage System Rev., Series 2012 A, (Senior Lien), 5.00%, 7/1/32 | | 12,500,000 | | | 13,185,500 | |
Detroit Water and Sewerage Department Disposal Sewage System Rev., Series 2012 A, (Senior Lien), 5.25%, 7/1/39 | | 19,825,000 | | | 21,159,024 | |
Detroit Water Supply System Rev., Series 2011 A, (Senior Lien), 5.00%, 7/1/15 | | 1,650,000 | | | 1,758,702 | |
Detroit Water Supply System Rev., Series 2011 A, (Senior Lien), 5.00%, 7/1/17 | | 1,300,000 | | | 1,426,477 | |
Detroit Water Supply System Rev., Series 2011 A, (Senior Lien), 5.00%, 7/1/36 | | $1,000,000 | | | $1,034,560 | |
Detroit Water Supply System Rev., Series 2011 C, (Senior Lien), 5.00%, 7/1/41 | | 850,000 | | | 876,758 | |
Kalamazoo Public Schools GO, (Building & Site), 5.25%, 5/1/16 (AGM) | | 1,545,000 | | | 1,743,363 | |
Lansing Board of Water & Light Utility System Rev., Series 2011 A, 5.00%, 7/1/27 | | 5,000,000 | | | 5,707,200 | |
Michigan Finance Authority Rev., (Detroit School District), 5.50%, 6/1/21 | | 6,000,000 | | | 7,050,180 | |
Michigan Higher Education Facilities Authority Rev., (Limited Obligation-Hillsdale College), 5.00%, 3/1/26 | | 2,345,000 | | | 2,369,482 | |
Michigan State Building Authority Rev., Series 2009 I, (Facilities Program), 5.25%, 10/15/20 | | 4,000,000 | | | 4,717,560 | |
Michigan State Hospital Finance Authority Rev., Series 2012 A, (Mclaren Health Care Corporation), 4.00%, 6/1/14 | | 595,000 | | | 616,378 | |
Michigan State Hospital Finance Authority Rev., Series 2012 A, (Mclaren Health Care Corporation), 5.00%, 6/1/15 | | 700,000 | | | 761,950 | |
Michigan State Hospital Finance Authority Rev., Series 2012 A, (Mclaren Health Care Corporation), 5.00%, 6/1/16 | | 1,360,000 | | | 1,527,756 | |
Michigan State Hospital Finance Authority Rev., Series 2012 A, (Mclaren Health Care Corporation), 5.00%, 6/1/17 | | 1,600,000 | | | 1,849,488 | |
Michigan State Hospital Finance Authority Rev., Series 2012 A-4, (Ascension Health Credit Group), VRDN, 1.625%, 11/1/19 | | 8,000,000 | | | 7,900,960 | |
Wayne County Airport Authority Rev., (Detroit Metropolitan Airport), 5.00%, 12/1/18 (NATL-RE/FGIC) | | 3,000,000 | | | 3,410,850 | |
Wayne County Airport Authority Rev., (Detroit Metropolitan Airport), 5.00%, 12/1/19 (NATL-RE/FGIC) | | 2,000,000 | | | 2,242,700 | |
| | | | | | 103,173,364 | |
MINNESOTA — 0.9% | |
Minnesota GO, 5.00%, 11/1/16 | | 6,455,000 | | | 7,426,994 | |
Minnesota GO, Series 2008 A, 5.00%, 6/1/13(1) | | 10,000,000 | | | 10,000,000 | |
Minnesota GO, Series 2010 D, 5.00%, 8/1/19 | | 5,000,000 | | | 6,096,700 | |
Minnesota Higher Education Facilities Authority Rev., Series 2010-7B, (Gustavus Adolfus), 5.00%, 10/1/17 | | 2,740,000 | | | 3,153,904 | |
Minnesota Higher Education Facilities Authority Rev., Series 2010-7B, (Gustavus Adolfus), 5.00%, 10/1/20 | | 2,680,000 | | | 3,192,845 | |
Minnesota Higher Education Facilities Authority Rev., Series 2010-7B, (Gustavus Adolfus), 5.00%, 10/1/22 | | 1,250,000 | | | 1,456,025 | |
Rochester Health Care Facilities Rev., Series 2011 C, (Mayo Clinic), VRDN, 4.50%, 11/15/21 | | 6,000,000 | | | 7,152,600 | |
| | | | | | 38,479,068 | |
MISSISSIPPI — 0.7% | |
Mississippi Development Bank Special Obligation Rev., (Marshall County Industrial Development Authority), 5.00%, 1/1/27 | | 10,000,000 | | | 11,474,800 | |
Mississippi Development Bank Special Obligation Rev., Series 2006 A, (Biloxi, Mississippi), 5.00%, 11/1/15 (Ambac) | | 1,565,000 | | | 1,703,002 | |
Mississippi Development Bank Special Obligation Rev., Series 2006 A, (Biloxi, Mississippi), 5.00%, 11/1/16 (Ambac) | | 1,645,000 | | | 1,831,313 | |
Mississippi Development Bank Special Obligation Rev., Series 2006 A, (Municipal Energy Agency Power Supply), 5.00%, 3/1/17 (XLCA) | | 1,000,000 | | | 1,087,990 | |
Mississippi Development Bank Special Obligation Rev., Series 2007 A, (Mississippi Development Bank), 5.00%, 7/1/19 (Ambac) | | $4,620,000 | | | $5,317,297 | |
Mississippi Development Bank Special Obligation Rev., Series 2010 D, (Department of Corrections), 5.25%, 8/1/27 | | 5,000,000 | | | 5,663,000 | |
University of Southern Mississippi Educational Building Co. Rev., Series 2006 A, 5.00%, 3/1/17 (AGM) | | 1,195,000 | | | 1,328,254 | |
University of Southern Mississippi Educational Building Co. Rev., Series 2006 A, 5.00%, 3/1/18 (AGM) | | 1,940,000 | | | 2,158,754 | |
| | | | | | 30,564,410 | |
MISSOURI — 0.3% | |
Jackson County Public Building Corp. Rev., Series 2006 A, (Capital Improvements), 5.00%, 12/1/15 (NATL-RE) | | 1,425,000 | | | 1,554,761 | |
Missouri Health & Educational Facilities Authority Rev., Series 2008 A, (The Washington University), 5.375%, 3/15/39 | | 2,000,000 | | | 2,304,260 | |
Missouri Highway & Transportation Commission Rev., Series 2010 A, 5.00%, 5/1/18 | | 2,700,000 | | | 3,208,140 | |
Missouri Joint Municipal Electric Utility Commission Rev., (Plum Point), 5.00%, 1/1/16 (NATL-RE) | | 3,145,000 | | | 3,403,267 | |
St. Louis Municipal Finance Corp. Rev., Series 2006 A, (Carnahan Courthouse), 4.00%, 2/15/17 (Ambac) | | 1,000,000 | | | 1,072,090 | |
| | | | | | 11,542,518 | |
NEBRASKA — 0.6% | |
Central Plains Energy Project Rev., 5.00%, 9/1/22 | | 2,500,000 | | | 2,875,500 | |
Nebraska Public Power District Rev., Series 2008 B, 5.00%, 1/1/20 | | 2,500,000 | | | 2,902,400 | |
Nebraska Public Power District Rev., Series 2012 A, 5.00%, 1/1/25 | | 750,000 | | | 883,553 | |
Nebraska Public Power District Rev., Series 2012 C, 5.00%, 1/1/14 | | 2,510,000 | | | 2,580,581 | |
Nebraska Public Power District Rev., Series 2012 C, 5.00%, 1/1/15 | | 2,500,000 | | | 2,683,600 | |
Nebraska Public Power District Rev., Series 2012 C, 5.00%, 1/1/16 | | 2,000,000 | | | 2,228,800 | |
Nebraska Public Power District Rev., Series 2012 C, 5.00%, 1/1/17 | | 1,500,000 | | | 1,719,510 | |
Nebraska Public Power District Rev., Series 2012 C, 5.00%, 1/1/18 | | 5,000,000 | | | 5,868,000 | |
Omaha Public Power District Electric System Rev., Series 2007 A, 5.00%, 2/1/21 | | 3,000,000 | | | 3,405,720 | |
| | | | | | 25,147,664 | |
NEVADA — 0.1% | |
Nevada GO, Series 2013 D1, 5.00%, 3/1/22 | | 4,800,000 | | | 5,837,472 | |
NEW HAMPSHIRE — 0.1% | |
New Hampshire Health & Education Facilities Authority Rev., Series 2004 A, (Kendal at Hanover), 5.00%, 10/1/13 | | 1,030,000 | | | 1,041,722 | |
New Hampshire Health & Education Facilities Authority Rev., Series 2004 A, (Kendal at Hanover), 5.00%, 10/1/18 | | 1,160,000 | | | 1,213,615 | |
| | | | | | 2,255,337 | |
NEW JERSEY — 6.2% | |
New Jersey Economic Development Authority Rev., 5.00%, 6/15/14 | | 4,100,000 | | | 4,288,395 | |
New Jersey Economic Development Authority Rev., Series 2008 W, (School Facilities Construction), 5.00%, 9/1/15 | | 3,475,000 | | | 3,829,207 | |
New Jersey Economic Development Authority Rev., Series 2008 Y, (School Facility Construction), 5.00%, 9/1/33 | | 110,000 | | | 120,161 | |
New Jersey Economic Development Authority Rev., Series 2010 DD1, (School Facility Construction), 5.00%, 12/15/18 | | 5,000,000 | | | 5,933,100 | |
New Jersey Economic Development Authority Rev., Series 2011 GG, (School Facility Construction), 5.00%, 9/1/19 | | $5,000,000 | | | $5,936,750 | |
New Jersey Economic Development Authority Rev., Series 2011 GG, (School Facility Construction), 5.00%, 9/1/21 | | 10,000,000 | | | 11,910,100 | |
New Jersey Economic Development Authority Rev., Series 2012 G, (School Facilities Construction), VRDN, 0.70%, 6/6/13 | | 7,000,000 | | | 7,022,890 | |
New Jersey GO, 5.00%, 8/1/14 | | 5,000,000 | | | 5,281,250 | |
New Jersey GO, 5.00%, 6/1/17 | | 4,500,000 | | | 5,229,270 | |
New Jersey GO, Series 2010 Q, 5.00%, 8/15/15 | | 7,000,000 | | | 7,709,450 | |
New Jersey Health Care Facilities Financing Authority Rev., (Hackensack University Medical Center), 5.00%, 1/1/34 | | 1,050,000 | | | 1,101,838 | |
New Jersey Health Care Facilities Financing Authority Rev., (The Robert Wood Johnson Foundation), 5.00%, 7/1/31 | | 1,725,000 | | | 1,878,559 | |
New Jersey Health Care Facilities Financing Authority Rev., Series 2012 A, (Saint Barnabas Corp.), 5.00%, 7/1/24 | | 1,800,000 | | | 2,059,704 | |
New Jersey Health Care Facilities Financing Authority Rev., Series 2012 A, (Saint Barnabas Corp.), 5.00%, 7/1/25 | | 1,000,000 | | | 1,131,210 | |
New Jersey Institute of Technology Rev., Series 2012 A, 5.00%, 7/1/32 | | 1,250,000 | | | 1,424,525 | |
New Jersey Rev., Series 2012 C, 2.50%, 6/27/13 | | 75,000,000 | | | 75,126,000 | |
New Jersey Sports & Exposition Authority Rev., Series 2008 B, 5.00%, 9/1/18(1) | | 75,000 | | | 89,930 | |
New Jersey Sports & Exposition Authority Rev., Series 2008 B, 5.00%, 9/1/18 | | 7,225,000 | | | 8,439,161 | |
New Jersey State Turnpike Authority Rev., Series 2009 G, 5.00%, 1/1/18 | | 1,700,000 | | | 1,985,991 | |
New Jersey State Turnpike Authority Rev., Series 2012 B, 5.00%, 1/1/28 | | 14,000,000 | | | 15,972,320 | |
New Jersey State Turnpike Authority Rev., Series 2013 A, 5.00%, 1/1/28 | | 2,000,000 | | | 2,269,120 | |
New Jersey Transit Corp. COP, 5.00%, 10/1/13 (AGM) | | 5,595,000 | | | 5,677,246 | |
New Jersey Transportation Trust Fund Authority Rev., Series 2003 B2, 5.00%, 12/15/16 | | 10,000,000 | | | 11,451,200 | |
New Jersey Transportation Trust Fund Authority Rev., Series 2005 B, 5.50%, 12/15/21 (NATL-RE) | | 9,600,000 | | | 11,902,176 | |
New Jersey Transportation Trust Fund Authority Rev., Series 2005 B, 5.25%, 12/15/23 (Ambac) | | 2,210,000 | | | 2,698,565 | |
New Jersey Transportation Trust Fund Authority Rev., Series 2006 A, 5.25%, 12/15/20 | | 15,000,000 | | | 18,326,550 | |
New Jersey Transportation Trust Fund Authority Rev., Series 2006 A, 5.25%, 12/15/21 (NATL-RE) | | 6,850,000 | | | 8,361,110 | |
New Jersey Transportation Trust Fund Authority Rev., Series 2010 D, 5.00%, 12/15/17 | | 4,750,000 | | | 5,549,757 | |
New Jersey Transportation Trust Fund Authority Rev., Series 2011 A, 5.25%, 6/15/30 | | 5,000,000 | | | 5,715,700 | |
New Jersey Transportation Trust Fund Authority Rev., Series 2011 B, 5.25%, 6/15/22 | | 4,975,000 | | | 5,979,801 | |
New Jersey Transportation Trust Fund Authority Rev., Series 2011 B, 5.25%, 6/15/23 | | 3,000,000 | | | 3,575,430 | |
New Jersey Transportation Trust Fund Authority Rev., Capital Appreciation, Series 2010 A, 0.00%, 12/15/31(3) | | 11,420,000 | | | 4,990,997 | |
| | | | | | 252,967,463 | |
NEW MEXICO — 0.2% | |
New Mexico Finance Authority State Transportation Rev., 5.00%, 6/15/17 | | 1,000,000 | | | 1,166,620 | |
New Mexico Finance Authority State Transportation Rev., 5.00%, 6/15/18 | | $3,000,000 | | | $3,580,350 | |
New Mexico Finance Authority State Transportation Rev., 4.00%, 6/15/19 | | 2,000,000 | | | 2,304,160 | |
| | | | | | 7,051,130 | |
NEW YORK — 11.6% | |
Brooklyn Arena Local Development Corp. Rev., (Barclays Center), 6.25%, 7/15/40 | | 3,700,000 | | | 4,306,097 | |
City of New York GO, Series 2008 J-1, 5.00%, 8/1/13(1) | | 780,000 | | | 786,295 | |
City of New York GO, Series 2008 J-1, 5.00%, 8/1/13 | | 5,075,000 | | | 5,116,006 | |
Hempstead Town Local Development Corp. Rev., (Hofstra University), 5.00%, 7/1/24 | | 1,465,000 | | | 1,659,288 | |
Hempstead Town Local Development Corp. Rev., (Hofstra University), 5.00%, 7/1/26 | | 1,130,000 | | | 1,264,866 | |
Hempstead Town Local Development Corp. Rev., (Hofstra University), 5.00%, 7/1/27 | | 1,320,000 | | | 1,471,602 | |
Hudson Yards Infrastructure Corp. Rev., Series 2006 A, 5.00%, 2/15/47 | | 5,000,000 | | | 5,232,100 | |
Long Island Power Authority Electric System Rev., Series 2006 F, 5.00%, 5/1/17 (NATL-RE) | | 7,090,000 | | | 8,086,145 | |
Long Island Power Authority Electric System Rev., Series 2011 A, 5.00%, 5/1/21 | | 2,385,000 | | | 2,815,588 | |
Metropolitan Transportation Authority Rev., Series 2005 G, 5.00%, 11/15/19 | | 1,750,000 | | | 2,086,770 | |
Metropolitan Transportation Authority Rev., Series 2008 B, VRDN, 0.80%, 6/6/13 | | 5,000,000 | | | 5,018,900 | |
Metropolitan Transportation Authority Rev., Series 2008 B, VRDN, 5.00%, 11/15/13 | | 4,000,000 | | | 4,084,800 | |
Metropolitan Transportation Authority Rev., Series 2008 C, 6.25%, 11/15/23 | | 5,000,000 | | | 6,122,400 | |
Metropolitan Transportation Authority Rev., Series 2011 A, 5.00%, 11/15/41 | | 2,100,000 | | | 2,278,374 | |
Metropolitan Transportation Authority Rev., Series 2012 E, 4.00%, 11/15/14 | | 2,490,000 | | | 2,625,307 | |
Metropolitan Transportation Authority Rev., Series 2012 E, 4.00%, 11/15/15 | | 1,000,000 | | | 1,084,800 | |
Metropolitan Transportation Authority Rev., Series 2012 E, 5.00%, 11/15/17 | | 2,000,000 | | | 2,338,260 | |
Metropolitan Transportation Authority Rev., Series 2012 E, 5.00%, 11/15/26 | | 5,000,000 | | | 5,790,050 | |
Metropolitan Transportation Authority Rev., Series 2012 E, 5.00%, 11/15/42 | | 5,000,000 | | | 5,408,750 | |
Metropolitan Transportation Authority Rev., Series 2013 A, 5.00%, 11/15/26 | | 4,595,000 | | | 5,319,769 | |
Metropolitan Transportation Authority Rev., Series 2013 B, 5.00%, 11/15/29 | | 10,360,000 | | | 11,679,864 | |
Nassau County Interim Finance Authority Rev., Series 2009 A, (Sales Tax Secured Bond), 5.00%, 11/15/21 | | 1,800,000 | | | 2,133,828 | |
Nassau County Interim Finance Authority Rev., Series 2009 A, (Sales Tax Secured Bond), 5.00%, 11/15/23 | | 1,500,000 | | | 1,770,735 | |
New York City GO, Series 2004 D, 5.00%, 11/1/14, Prerefunded at 100% of Par (AGM)(1) | | 4,025,000 | | | 4,293,105 | |
New York City GO, Series 2004 D, 5.00%, 11/1/17 (AGM) | | 1,170,000 | | | 1,245,149 | |
New York City GO, Series 2013 F1, 5.00%, 3/1/37 | | 10,000,000 | | | 11,286,800 | |
New York City GO, Series 2013 J, 5.00%, 8/1/18(5) | | 4,095,000 | | | 4,857,571 | |
New York City GO, Series 2013 J, 5.00%, 8/1/23(5) | | 10,000,000 | | | 12,238,600 | |
New York City GO, VRN, 0.50%, 6/6/13 | | 3,500,000 | | | 3,529,610 | |
New York City Municipal Water Finance Authority Water & Sewer Rev., Series 2008 C, 5.00%, 6/15/17 | | 1,350,000 | | | 1,576,584 | |
New York City Municipal Water Finance Authority Water & Sewer Rev., Series 2009 EE, 5.00%, 6/15/39 | | 7,010,000 | | | 7,690,951 | |
New York City Municipal Water Finance Authority Water & Sewer Rev., Series 2009 GG-1, (Second General Resolution), 5.00%, 6/15/39 | | $5,000,000 | | | $5,485,700 | |
New York City Transitional Finance Authority Rev., Series 2007 B, (Future Tax Secured Bonds), 5.00%, 5/1/17, Prerefunded at 100% of Par(1) | | 2,555,000 | | | 2,965,665 | |
New York City Transitional Finance Authority Rev., Series 2007 B, (Future Tax Secured Bonds), 5.00%, 11/1/19 | | 5,445,000 | | | 6,270,026 | |
New York City Transitional Finance Authority Rev., Series 2009 S4, 5.50%, 1/15/39 | | 1,700,000 | | | 1,969,314 | |
New York City Transitional Finance Authority Rev., Series 2011 1A, 5.00%, 7/15/25 | | 4,850,000 | | | 5,683,084 | |
New York City Transitional Finance Authority Rev., Series 2011 A, (Future Tax Secured Bonds), 5.00%, 11/1/16(1) | | 115,000 | | | 132,248 | |
New York City Transitional Finance Authority Rev., Series 2011 A, (Future Tax Secured Bonds), 5.00%, 11/1/16 | | 3,675,000 | | | 4,228,198 | |
New York City Transitional Finance Authority Rev., Series 2011 A, (Future Tax Secured Bonds), 5.00%, 11/1/17 | | 6,080,000 | | | 7,185,405 | |
New York City Transitional Finance Authority Rev., Series 2011 A-1, (Future Tax Secured Bonds) 5.00%, 11/1/21 | | 4,000,000 | | | 4,913,600 | |
New York City Transitional Finance Authority Rev., Series 2011 C, (Future Tax Secured Bonds), 5.00%, 11/1/39 | | 4,000,000 | | | 4,423,240 | |
New York City Transitional Finance Authority Rev., Series 2011 D-1, (Future Tax Secured Bonds) 5.00%, 11/1/24 | | 4,000,000 | | | 4,766,920 | |
New York City Transitional Finance Authority Rev., Series 2011 D-1, (Future Tax Secured Bonds) 5.00%, 11/1/25 | | 6,000,000 | | | 7,117,800 | |
New York City Trust for Cultural Resources Rev., Series 2009 B, (Julliard School), VRDN, 1.35%, 8/1/17 | | 6,750,000 | | | 6,911,122 | |
New York GO, Series 1993 E-3, 5.00%, 8/1/23 | | 5,000,000 | | | 5,945,150 | |
New York GO, Series 2006 J1, 5.00%, 6/1/18 | | 4,000,000 | | | 4,503,320 | |
New York GO, Series 2009 A, 5.00%, 2/15/39 | | 1,700,000 | | | 1,926,457 | |
New York GO, Series 2009 E, 5.00%, 8/1/16 | | 2,600,000 | | | 2,947,828 | |
New York GO, Series 2009 H1, 5.00%, 3/1/17 | | 3,000,000 | | | 3,449,580 | |
New York GO, Series 2009 H1, 5.00%, 3/1/22 | | 7,000,000 | | | 8,197,420 | |
New York GO, Series 2009 J1, 5.00%, 5/15/22 | | 6,570,000 | | | 7,719,290 | |
New York GO, Series 2010 A, 5.00%, 8/1/17 | | 2,190,000 | | | 2,549,051 | |
New York GO, Series 2010 E, 5.00%, 8/1/19 | | 4,555,000 | | | 5,454,749 | |
New York GO, Series 2011 A1, 5.00%, 8/1/18 | | 5,000,000 | | | 5,931,100 | |
New York GO, Series 2011 B, 5.00%, 8/1/15 | | 1,000,000 | | | 1,098,250 | |
New York GO, Series 2011 B, 5.00%, 8/1/16 | | 3,705,000 | | | 4,200,655 | |
New York GO, Series 2011 D-1, 5.00%, 10/1/19 | | 5,000,000 | | | 6,005,750 | |
New York GO, Series 2012 F, 5.00%, 8/1/16 | | 7,720,000 | | | 8,752,782 | |
New York Liberty Development Corp. Rev., (Goldman Sachs Headquarters), 5.25%, 10/1/35 | | 9,535,000 | | | 11,120,766 | |
New York Power Authority Rev., Series 2011 A, 5.00%, 11/15/22 | | 1,000,000 | | | 1,246,560 | |
New York State Dormitory Authority Personal Income Tax Rev., Series 2012 A, (General Purpose), 5.00%, 12/15/25 | | 8,225,000 | | | 9,811,602 | |
New York State Dormitory Authority Rev., (Brooklyn Law School), 5.75%, 7/1/33 | | 1,000,000 | | | 1,126,670 | |
New York State Dormitory Authority Rev., (Columbia University), 4.00%, 7/1/13(1) | | $3,500,000 | | | $3,511,060 | |
New York State Dormitory Authority Rev., Series 2008 B, 5.75%, 3/15/36 | | 10,000,000 | | | 11,922,300 | |
New York State Dormitory Authority Rev., Series 2009 A, 5.25%, 2/15/25 | | 8,825,000 | | | 10,503,515 | |
New York State Dormitory Authority Rev., Series 2009 A, 5.00%, 2/15/39 | | 4,000,000 | | | 4,492,080 | |
New York State Dormitory Authority Rev., Series 2009 A, (North Shore Long Island Jewish Health System), 5.50%, 5/1/37 | | 1,200,000 | | | 1,341,156 | |
New York State Dormitory Authority Rev., Series 2010 A, (Mount Sinai School of Medicine), 5.00%, 7/1/14 | | 1,100,000 | | | 1,152,184 | |
New York State Dormitory Authority Rev., Series 2012 A, (Columbia University), 5.00%, 10/1/22 | | 2,800,000 | | | 3,510,500 | |
New York State Dormitory Authority Rev., Series 2012 A, (State University of New York), 5.00%, 7/1/42 | | 2,300,000 | | | 2,571,147 | |
New York State Dormitory Authority Rev., Series 2012 D, (General Purpose), 5.00%, 2/15/27 | | 10,535,000 | | | 12,274,328 | |
New York State Dormitory Authority State Personal Income Tax Rev., Series 2011 C, (General Purpose), 5.00%, 3/15/24 | | 6,530,000 | | | 7,734,916 | |
New York State Thruway Authority Rev., Series 2009 A1, 5.00%, 4/1/23 | | 3,000,000 | | | 3,451,260 | |
New York State Thruway Authority Rev., Series 2012 A, (Local Highway & Bridge), 4.00%, 4/1/14 | | 30,000,000 | | | 30,952,500 | |
New York State Thruway Authority Rev., Series 2012 I, 5.00%, 1/1/24 | | 3,330,000 | | | 3,953,875 | |
New York State Thruway Authority Second General Highway & Bridge Trust Fund Rev., Series 2011 A1, 5.00%, 4/1/25 | | 5,865,000 | | | 6,836,303 | |
New York State Urban Development Corp. Rev., Series 2009 C, (State Personal Income Tax), 5.00%, 12/15/15 | | 3,000,000 | | | 3,350,550 | |
New York State Urban Development Corp. Rev., Series 2013 A1, (State Personal Income Tax), 5.00%, 3/15/28 | | 3,900,000 | | | 4,548,219 | |
Niagara Area Development Corp. Solid Waste Disposal Facility Rev., Series 2012 B, (Covanta Holding Corp.), 4.00%, 11/1/24 | | 1,800,000 | | | 1,843,164 | |
Niagara Falls Bridge Commission Toll Rev., Series 1993 A, (Bridge System), 4.00%, 10/1/19 (AGC) | | 3,150,000 | | | 3,448,872 | |
Niagara Falls Bridge Commission Toll Rev., Series 1993 B, 5.25%, 10/1/15 (NATL-RE/FGIC) | | 390,000 | | | 402,457 | |
Port Authority of New York & New Jersey Special Obligation Rev., (John F. Kennedy International Airport Terminal), 5.00%, 12/1/20 | | 850,000 | | | 972,009 | |
Port Authority of New York & New Jersey Special Obligation Rev., (John F. Kennedy International Airport Terminal), 6.00%, 12/1/42 | | 2,600,000 | | | 3,026,816 | |
Suffolk County Industrial Development Agency Rev., (New York Institute of Technology), 5.25%, 3/1/17 | | 1,000,000 | | | 1,056,430 | |
Suffolk County Industrial Development Agency Rev., (New York Institute of Technology), 5.25%, 3/1/18 | | 1,000,000 | | | 1,051,110 | |
Suffolk County Industrial Development Agency Rev., (New York Institute of Technology), 5.25%, 3/1/20 | | 1,250,000 | | | 1,304,550 | |
Suffolk County Industrial Development Agency Rev., (New York Institute of Technology), 5.00%, 3/1/26 | | 1,175,000 | | | 1,200,592 | |
Tobacco Settlement Financing Corp. Rev., Series 2011 A, 5.00%, 6/1/17 | | 10,000,000 | | | 11,562,600 | |
Tobacco Settlement Financing Corp. Rev., Series 2011 A, 5.00%, 6/1/18 | | 8,025,000 | | | 9,467,574 | |
Triborough Bridge & Tunnel Authority Rev., Series 2008 B3, VRDN, 5.00%, 11/15/15 | | $5,000,000 | | | $5,526,400 | |
Triborough Bridge & Tunnel Authority Rev., Series 2008 C, 5.00%, 11/15/38 | | 10,000,000 | | | 11,106,300 | |
Triborough Bridge & Tunnel Authority Rev., Series 2012 B, 4.00%, 11/15/16 | | 3,250,000 | | | 3,621,280 | |
Triborough Bridge & Tunnel Authority Rev., Series 2012 B, 5.00%, 11/15/17 | | 3,325,000 | | | 3,926,260 | |
Triborough Bridge & Tunnel Authority Rev., Series 2013 A, 5.00%, 11/15/30 | | 3,030,000 | | | 3,484,833 | |
Triborough Bridge & Tunnel Authority Rev., Capital Appreciation, Series 2012 B, 0.00%, 11/15/32(3) | | 2,650,000 | | | 1,283,554 | |
Westchester County GO, Series 2011 A, 4.00%, 10/15/15 | | 5,650,000 | | | 6,140,985 | |
| | | | | | 471,769,945 | |
NORTH CAROLINA — 2.6% | |
Charlotte GO, 5.00%, 8/1/19 | | 2,000,000 | | | 2,370,980 | |
Charlotte Water & Sewer System Rev., 5.00%, 7/1/17 | | 1,000,000 | | | 1,169,940 | |
Greensboro Rev., (Combined Enterprise System), 5.25%, 6/1/20 | | 2,060,000 | | | 2,541,978 | |
North Carolina Eastern Municipal Power Agency Rev., Series 2009 A, 5.00%, 1/1/17 | | 2,790,000 | | | 3,184,478 | |
North Carolina Eastern Municipal Power Agency Rev., Series 2009 A, 5.00%, 1/1/18 | | 2,955,000 | | | 3,447,805 | |
North Carolina Eastern Municipal Power Agency Rev., Series 2009 B, 5.00%, 1/1/26 | | 7,400,000 | | | 8,246,042 | |
North Carolina Eastern Municipal Power Agency Rev., Series 2010 A, 5.00%, 1/1/15 | | 3,000,000 | | | 3,216,840 | |
North Carolina GO, Series 2010 C, 5.00%, 5/1/21 | | 7,135,000 | | | 8,847,471 | |
North Carolina GO, Series 2013 C, 5.00%, 5/1/24 | | 11,000,000 | | | 13,935,790 | |
North Carolina Grant Anticipation Rev., VRDN, 4.00%, 3/1/18 | | 5,670,000 | | | 6,331,405 | |
North Carolina Medical Care Commission Health Care Facilities Rev., Series 2012 C, (Wake Forest Baptist), VRDN, 0.86%, 6/6/13 | | 3,750,000 | | | 3,750,938 | |
North Carolina Municipal Power Agency No. 1 Catawba Electric Rev., Series 2008 A, 5.25%, 1/1/17 | | 6,305,000 | | | 7,275,970 | |
North Carolina Municipal Power Agency No. 1 Catawba Electric Rev., Series 2008 C, 5.25%, 1/1/19 | | 2,500,000 | | | 2,911,900 | |
North Carolina Municipal Power Agency No. 1 Catawba Electric Rev., Series 2008 C, 5.25%, 1/1/20 | | 2,000,000 | | | 2,299,840 | |
North Carolina Municipal Power Agency No. 1 Catawba Electric Rev., Series 2009 A, 5.00%, 1/1/30 | | 1,800,000 | | | 1,986,192 | |
North Carolina Municipal Power Agency No. 1 Catawba Electric Rev., Series 2010 B, 5.00%, 1/1/21 | | 3,780,000 | | | 4,451,933 | |
North Carolina Municipal Power Agency No. 1 Catawba Electric Rev., Series 2012 A, 5.00%, 1/1/15 | | 3,050,000 | | | 3,272,986 | |
North Carolina Municipal Power Agency No. 1 Catawba Electric Rev., Series 2012 A, 5.00%, 1/1/16 | | 2,550,000 | | | 2,837,513 | |
North Carolina Municipal Power Agency No. 1 Catawba Electric Rev., Series 2012 B, 5.00%, 1/1/28 | | 4,050,000 | | | 4,663,818 | |
University of North Carolina at Chapel Hill Rev., Series 2012 A, VRDN, 0.58%, 6/3/13 | | 11,000,000 | | | 11,020,790 | |
University of North Carolina at Chapel Hill Rev., Series 2012 B, VRDN, 0.88%, 6/3/13 | | 10,000,000 | | | 9,999,300 | |
| | | | | | 107,763,909 | |
NORTH DAKOTA — 0.2% | |
Grand Forks Health Care Facilities Rev., Series 1996 A, (The United Hospital Obligation Group), VRDN, 0.12%, 6/3/13 (LOC: Bank of America N.A.) | | $6,600,000 | | | $6,600,000 | |
OHIO — 1.3% | |
American Municipal Power-Ohio, Inc. Rev., Series 2008 A, (Prairie State Energy Campus), 5.00%, 2/15/17 | | 1,000,000 | | | 1,136,920 | |
Cleveland Airport System Rev., Series 2012 A, 5.00%, 1/1/25 (AGM) | | 4,000,000 | | | 4,560,720 | |
Cleveland Airport System Rev., Series 2012 A, 5.00%, 1/1/25 | | 2,500,000 | | | 2,844,400 | |
Cleveland Airport System Rev., Series 2012 A, 5.00%, 1/1/26 (AGM) | | 3,560,000 | | | 4,027,535 | |
Cleveland Airport System Rev., Series 2012 A, 5.00%, 1/1/26 | | 2,530,000 | | | 2,856,218 | |
Cleveland COP, Series 2010 A, (Cleveland Stadium), 5.00%, 11/15/19 | | 2,450,000 | | | 2,802,065 | |
Miami University/Oxford Rev., 5.00%, 9/1/25 | | 4,440,000 | | | 5,189,960 | |
Ohio GO, Series 2011 A, (Infrastructure Improvement), 5.00%, 9/15/16 | | 6,000,000 | | | 6,854,220 | |
Ohio Higher Educational Facility Commission Rev., (Oberlin College), 5.00%, 10/1/19 | | 5,000,000 | | | 6,045,050 | |
Ohio Higher Educational Facility Commission Rev., Series 1990 B, (Case Western Reserve University), 6.50%, 10/1/20 | | 750,000 | | | 902,063 | |
Ohio State University (The) Rev., Series 2009 A, 5.00%, 12/1/18, Prerefunded at 100% of Par(1) | | 200,000 | | | 242,160 | |
Ohio State University (The) Rev., Series 2009 A, 5.00%, 12/1/27 | | 1,800,000 | | | 2,111,580 | |
Ohio State University (The) Rev., Series 2010 A, 5.00%, 12/1/16(1) | | 225,000 | | | 259,083 | |
Ohio State University (The) Rev., Series 2010 A, 5.00%, 12/1/16 | | 3,775,000 | | | 4,343,024 | |
Ohio State Water Development Authority Rev., (Drinking Water Assistance Fund), 5.00%, 6/1/18, Prerefunded at 100% of Par(1) | | 2,000,000 | | | 2,384,840 | |
Ohio State Water Development Authority Rev., (Water Pollution Control Loan Fund), 5.00%, 12/1/13 | | 5,895,000 | | | 6,037,718 | |
| | | | | | 52,597,556 | |
OKLAHOMA — 0.3% | |
Oklahoma Development Finance Authority Health Facilities Rev., (Duncan Regional Hospital, Inc.), VRDN, 0.14%, 6/3/13 (LOC: JP Morgan Chase Bank N.A.) | | 1,100,000 | | | 1,100,000 | |
Oklahoma Development Finance Authority Health System Rev., Series 2008 C, 5.50%, 8/15/22 (Obligated Group Consisting of INTEGRIS Baptist Medical Center, Inc., INTEGRIS South Oklahoma City Hospital Corp. and INTEGRIS Rural Health, Inc.) | | 3,000,000 | | | 3,456,720 | |
Pottawatomie County Facilities Authority Rev., (Shawnee Public Schools), 5.00%, 9/1/13 | | 1,610,000 | | | 1,624,216 | |
Pottawatomie County Facilities Authority Rev., (Shawnee Public Schools), 5.00%, 9/1/14 | | 1,730,000 | | | 1,744,515 | |
Pottawatomie County Facilities Authority Rev., (Shawnee Public Schools), 5.00%, 9/1/15 | | 1,710,000 | | | 1,723,937 | |
Pottawatomie County Facilities Authority Rev., (Shawnee Public Schools), 5.00%, 9/1/16 | | 2,130,000 | | | 2,146,699 | |
| | | | | | 11,796,087 | |
OREGON — 0.2% | |
Oregon GO, Series 2011 J, 5.00%, 5/1/19 | | 1,080,000 | | | 1,305,634 | |
Oregon GO, Series 2011 J, 5.00%, 5/1/20 | | 1,870,000 | | | 2,286,355 | |
Oregon GO, Series 2011 J, 5.00%, 5/1/21 | | 1,500,000 | | | 1,850,040 | |
Oregon Health & Science University Rev., Series 2009 A, 5.75%, 7/1/39 | | 2,900,000 | | | 3,378,558 | |
| | | | | | 8,820,587 | |
PENNSYLVANIA — 5.5% | |
Allegheny County Hospital Development Authority Rev., Series 2008 A, (University of Pittsburgh Medical Center), 5.00%, 9/1/18 | | $1,500,000 | | | $1,783,665 | |
Allegheny County Industrial Development Authority Rev., (Residential Resources, Inc.), 4.75%, 9/1/14 | | 1,535,000 | | | 1,573,129 | |
Beaver County Industrial Development Authority Rev., Series 2006 B, (Pollution Control), VRDN, 2.50%, 6/1/17 (GA: First Energy Solutions Corp./First Energy Generation Corp.) | | 15,310,000 | | | 15,414,720 | |
Berks County Municipal Authority Rev., Series 2012 B, (Reading Hospital Medical Center), VRDN, 1.62%, 6/6/13 | | 2,500,000 | | | 2,564,075 | |
Central Dauphin School District GO, 7.00%, 2/1/16, Prerefunded at 100% of Par (NATL-RE)(1) | | 1,150,000 | | | 1,347,696 | |
Delaware River Port Authority Rev., (Port District Project), 4.00%, 1/1/15 | | 1,000,000 | | | 1,046,280 | |
Delaware River Port Authority Rev., (Port District Project), 5.00%, 1/1/16 | | 1,200,000 | | | 1,312,584 | |
East Stroudsburg Area School District GO, 7.75%, 9/1/16, Prerefunded at 100% of Par (AGM)(1) | | 2,580,000 | | | 3,177,657 | |
Exeter Township GO, 5.25%, 7/15/15 (Ambac) | | 1,155,000 | | | 1,268,860 | |
Exeter Township GO, 5.30%, 7/15/19 (Ambac) | | 1,830,000 | | | 2,225,646 | |
Geisinger Authority Health System Rev., VRN, 0.95%, 8/1/13 | | 5,000,000 | | | 4,339,250 | |
Pennsylvania Economic Development Financing Authority Rev., Series 2009 A, (Albert Einstein Healthcare Network), 6.25%, 10/15/23 | | 5,000,000 | | | 5,804,200 | |
Pennsylvania Economic Development Financing Authority Unemployment Compensation Rev., Series 2012 A, 5.00%, 7/1/18 | | 5,430,000 | | | 6,490,533 | |
Pennsylvania Economic Development Financing Authority Unemployment Compensation Rev., Series 2012 A, 5.00%, 7/1/19 | | 15,525,000 | | | 18,798,757 | |
Pennsylvania Economic Development Financing Authority Unemployment Compensation Rev., Series 2012 B, 5.00%, 7/1/20 | | 7,250,000 | | | 8,675,785 | |
Pennsylvania GO, 5.375%, 7/1/16 (NATL-RE) | | 2,795,000 | | | 3,205,334 | |
Pennsylvania GO, 5.00%, 4/15/17 | | 3,325,000 | | | 3,857,465 | |
Pennsylvania GO, 5.375%, 7/1/18 (AGM) | | 1,070,000 | | | 1,297,033 | |
Pennsylvania GO, 5.00%, 7/1/19 | | 15,000,000 | | | 18,133,800 | |
Pennsylvania GO, 5.00%, 11/15/22 | | 7,900,000 | | | 9,591,469 | |
Pennsylvania GO, 5.00%, 4/1/24 | | 10,000,000 | | | 12,277,300 | |
Pennsylvania GO, Series 2010 A, 5.00%, 5/1/16 | | 4,000,000 | | | 4,514,120 | |
Pennsylvania GO, Series 2010 A, 5.00%, 7/15/16 | | 8,310,000 | | | 9,447,639 | |
Pennsylvania Higher Educational Facilities Authority Rev., (Shippensburg University Student Services, Inc.), 5.00%, 10/1/44 | | 1,100,000 | | | 1,179,607 | |
Pennsylvania Higher Educational Facilities Authority Rev., Series 2009 A, (University of Pennsylvania), 5.00%, 9/1/19 | | 1,000,000 | | | 1,209,910 | |
Pennsylvania Higher Educational Facilities Authority Rev., Series 2012 1, (Temple University) 5.00%, 4/1/25 | | 1,000,000 | | | 1,163,010 | |
Pennsylvania Higher Educational Facilities Authority Rev., Series 2012 1, (Temple University) 5.00%, 4/1/26 | | 1,000,000 | | | 1,153,310 | |
Pennsylvania Higher Educational Facilities Authority Rev., Series 2012 1, (Temple University) 5.00%, 4/1/27 | | 1,150,000 | | | 1,318,625 | |
Pennsylvania Turnpike Commission Rev., Series 2009 B, 5.00%, 12/1/16 | | 5,000,000 | | | 5,718,550 | |
Pennsylvania Turnpike Commission Rev., Series 2009 B, 5.25%, 6/1/22 | | $10,000,000 | | | $11,458,500 | |
Pennsylvania Turnpike Commission Rev., Series 2013 A, VRN, 0.72%, 6/6/13 | | 5,000,000 | | | 5,032,100 | |
Pennsylvania Turnpike Commission Rev., Series 2013 A, VRN, 0.80%, 6/6/13 | | 3,945,000 | | | 3,973,917 | |
Philadelphia Rev., Series 2009 A, (1998 General Ordinance), 5.25%, 8/1/17 | | 1,000,000 | | | 1,126,620 | |
Philadelphia Water & Wastewater Rev., Series 2009 A, 5.25%, 1/1/36 | | 1,415,000 | | | 1,542,930 | |
Philadelphia Water & Wastewater Rev., Series 2010 A, 5.00%, 6/15/16 | | 10,000,000 | | | 11,289,000 | |
Philadelphia Water & Wastewater Rev., Series 2010 A, 5.00%, 6/15/17 (AGM) | | 5,000,000 | | | 5,792,000 | |
Pittsburgh GO, Series 2006 B, 5.25%, 9/1/16 (AGM) | | 15,805,000 | | | 17,877,668 | |
Pittsburgh GO, Series 2012 B, 5.00%, 9/1/25 | | 3,000,000 | | | 3,441,780 | |
Pittsburgh GO, Series 2012 B, 5.00%, 9/1/26 | | 1,000,000 | | | 1,138,360 | |
Southeastern Pennsylvania Transportation Authority, (Capital Guarantee Receipts), 5.00%, 6/1/14 | | 250,000 | | | 261,013 | |
Southeastern Pennsylvania Transportation Authority, (Capital Guarantee Receipts), 5.00%, 6/1/15 | | 500,000 | | | 542,140 | |
Southeastern Pennsylvania Transportation Authority, (Capital Guarantee Receipts), 5.00%, 6/1/16 | | 1,060,000 | | | 1,184,645 | |
State Public School Building Authority Lease Rev., (School District of Philadelphia), 5.00%, 4/1/23 | | 2,400,000 | | | 2,751,936 | |
State Public School Building Authority Lease Rev., (School District of Philadelphia), 5.00%, 4/1/25 | | 1,900,000 | | | 2,123,288 | |
Westmoreland County Municipal Authority Rev., 5.25%, 8/15/15, Prerefunded at 100% of Par (AGM)(1) | | 4,500,000 | | | 4,981,680 | |
| | | | | | 224,407,586 | |
PUERTO RICO — 4.1% | |
Puerto Rico Aqueduct & Sewer Authority Rev., Series 2008 A, (Senior Lien), 5.00%, 7/1/14 | | 12,550,000 | | | 12,771,633 | |
Puerto Rico Aqueduct & Sewer Authority Rev., Series 2008 A, (Senior Lien), 6.00%, 7/1/44 | | 1,750,000 | | | 1,794,082 | |
Puerto Rico Aqueduct & Sewer Authority Rev., Series 2012 A, (Senior Lien), 5.00%, 7/1/17 | | 9,800,000 | | | 10,154,368 | |
Puerto Rico Aqueduct & Sewer Authority Rev., Series 2012 A, (Senior Lien), 5.00%, 7/1/19 | | 3,335,000 | | | 3,419,242 | |
Puerto Rico Aqueduct & Sewer Authority Rev., Series 2012 A, (Senior Lien), 5.25%, 7/1/24 | | 11,590,000 | | | 11,643,430 | |
Puerto Rico Electric Power Authority Rev., Series 2010 XX, 5.25%, 7/1/40 | | 2,625,000 | | | 2,615,471 | |
Puerto Rico Electric Power Authority Rev., Series 2010 ZZ, 5.25%, 7/1/25 | | 5,000,000 | | | 5,107,950 | |
Puerto Rico Electric Power Authority Rev., Series 2010 ZZ, 5.25%, 7/1/26 | | 2,100,000 | | | 2,142,210 | |
Puerto Rico Electric Power Authority Rev., Series 2011 NN, 5.50%, 7/1/20 | | 7,080,000 | | | 7,677,056 | |
Puerto Rico Electric Power Authority Rev., Series 2012 A, 5.00%, 7/1/42 | | 8,795,000 | | | 8,424,379 | |
Puerto Rico GO, Series 2006 A, (Public Improvement), 5.25%, 7/1/23 | | 1,975,000 | | | 2,015,132 | |
Puerto Rico GO, Series 2006 B, (Public Improvement), 5.25%, 7/1/17 | | 5,000,000 | | | 5,214,900 | |
Puerto Rico GO, Series 2007 A, (Public Improvement), 5.50%, 7/1/17 | | 3,235,000 | | | 3,446,181 | |
Puerto Rico GO, Series 2007 A, (Public Improvement), 5.50%, 7/1/18 | | 1,550,000 | | | 1,658,903 | |
Puerto Rico GO, Series 2008 A, 5.50%, 7/1/16 | | 3,020,000 | | | 3,203,616 | |
Puerto Rico GO, Series 2008 A, 5.125%, 7/1/28 | | 3,000,000 | | | 2,953,440 | |
Puerto Rico GO, Series 2011 C, (Public Improvement), 5.75%, 7/1/36 | | 2,085,000 | | | 2,149,385 | |
Puerto Rico GO, Series 2012 A, (Public Improvement), 5.50%, 7/1/39 | | $5,000,000 | | | $5,054,950 | |
Puerto Rico GO, Series 2012 A, (Public Improvement), 5.00%, 7/1/41 | | 3,500,000 | | | 3,325,280 | |
Puerto Rico Government Development Bank Rev., 4.75%, 12/1/15 (NATL-RE) | | 17,750,000 | | | 18,137,482 | |
Puerto Rico Government Development Bank Rev., Series 2006 B, (Senior Notes), 5.00%, 12/1/14 | | 4,000,000 | | | 4,147,760 | |
Puerto Rico Government Development Bank Rev., Series 2006 B, (Senior Notes), 5.00%, 12/1/16 | | 2,000,000 | | | 2,101,600 | |
Puerto Rico Public Buildings Authority Rev., Series 2004 I, (Government Facilities), 5.50%, 7/1/14, Prerefunded at 100% of Par(1) | | 5,000,000 | | | 5,282,400 | |
Puerto Rico Public Buildings Authority Rev., Series 2007 M, (Government Facilities), VRDN, 5.75%, 7/1/17 | | 5,000,000 | | | 5,297,550 | |
Puerto Rico Public Buildings Authority Rev., Series 2007 M2, (Government Facilities), VRDN, 5.50%, 7/1/17 (Ambac) | | 2,000,000 | | | 2,100,420 | |
Puerto Rico Public Buildings Authority Rev., Series 2009 P, (Government Facilities), 6.75%, 7/1/36 | | 6,700,000 | | | 7,309,968 | |
Puerto Rico Public Finance Corp. Rev., Series 2011 B, (Commonwealth Appropriation), 6.00%, 8/1/24 (SBBPA: Government Development Bank for Puerto Rico) | | 5,000,000 | | | 5,205,600 | |
Puerto Rico Public Finance Corp. Rev., Series 2011 B, (Commonwealth Appropriation), 5.50%, 8/1/31 (SBBPA: Government Development Bank for Puerto Rico) | | 3,850,000 | | | 3,840,914 | |
Puerto Rico Sales Tax Financing Corp. Rev., Series 2010 A, 5.50%, 8/1/42 | | 5,000,000 | | | 5,286,350 | |
Puerto Rico Sales Tax Financing Corp. Rev., Series 2010 C, 5.25%, 8/1/41 | | 1,350,000 | | | 1,408,415 | |
Puerto Rico Sales Tax Financing Corp. Rev., Series 2011 C, 5.00%, 8/1/22 | | 10,450,000 | | | 12,148,020 | |
Puerto Rico Sales Tax Financing Corp. Rev., Capital Appreciation, Series 2011 A1, 0.00%, 8/1/41(3) | | 5,725,000 | | | 1,081,453 | |
| | | | | | 168,119,540 | |
RHODE ISLAND — 0.1% | |
Rhode Island Depositors Economic Protection Corp. Rev., Series 1993 A, 6.25%, 8/1/16 (NATL-RE)(1) | | 2,000,000 | | | 2,293,680 | |
SOUTH CAROLINA — 0.8% | |
Charleston Educational Excellence Finance Corp. Rev., (Charleston County Schools), 5.00%, 12/1/24 | | 1,750,000 | | | 2,082,202 | |
Charleston Educational Excellence Finance Corp. Rev., (Charleston County Schools), 5.00%, 12/1/25 | | 2,945,000 | | | 3,474,570 | |
Kershaw County Public Schools Foundation Installment Purchase Rev., (School Improvements), 5.00%, 12/1/17 (AGC) | | 1,060,000 | | | 1,197,842 | |
Kershaw County Public Schools Foundation Installment Purchase Rev., (School Improvements), 5.00%, 12/1/18 (AGC) | | 2,260,000 | | | 2,553,913 | |
Kershaw County Public Schools Foundation Installment Purchase Rev., (School Improvements), 5.00%, 12/1/19 (AGC) | | 700,000 | | | 785,911 | |
Kershaw County Public Schools Foundation Installment Purchase Rev., (School Improvements), 5.00%, 12/1/20 (AGC) | | 3,000,000 | | | 3,357,270 | |
Piedmont Municipal Power Agency Rev., 6.75%, 1/1/19 (FGIC)(1) | | 625,000 | | | 807,275 | |
Piedmont Municipal Power Agency Rev., 6.75%, 1/1/19 (NATL-RE/FGIC) | | 875,000 | | | 1,103,813 | |
Piedmont Municipal Power Agency Rev., Series 1991 A, 6.50%, 1/1/16 (FGIC)(1) | | 140,000 | | | 161,083 | |
Piedmont Municipal Power Agency Rev., Series 1991 A, 6.50%, 1/1/16 (FGIC)(1) | | 485,000 | | | 558,036 | |
Piedmont Municipal Power Agency Rev., Series 1991 A, 6.50%, 1/1/16 (FGIC) | | 375,000 | | | 427,361 | |
Piedmont Municipal Power Agency Rev., Series 2009 A3, 5.00%, 1/1/16 | | $5,000,000 | | | $5,522,950 | |
Piedmont Municipal Power Agency Electric Rev., Series 2009 A3, 5.00%, 1/1/17 | | 3,000,000 | | | 3,402,600 | |
South Carolina Jobs-Economic Development Authority Hospital Rev., (Palmetto Health), 5.75%, 8/1/39 | | 2,700,000 | | | 2,978,289 | |
South Carolina Ports Authority Rev., 4.00%, 7/1/15 | | 1,000,000 | | | 1,071,260 | |
South Carolina Ports Authority Rev., 5.00%, 7/1/16 | | 2,695,000 | | | 3,032,899 | |
| | | | | | 32,517,274 | |
TENNESSEE — 0.5% | |
Chattanooga Health Educational & Housing Facility Board Rev., Series 2005 A, (Campus Development Foundation, Inc. Phase I LLC), 5.00%, 10/1/15 | | 1,265,000 | | | 1,325,340 | |
Clarksville Public Building Authority Rev., (Adjusted Financing Morristown Loans), VRDN, 0.17%, 6/3/13 (LOC: Bank of America N.A.) | | 12,175,000 | | | 12,175,000 | |
Memphis Electric System Rev., 5.00%, 12/1/15 | | 2,500,000 | | | 2,787,425 | |
Memphis Electric System Rev., 5.00%, 12/1/16 | | 1,000,000 | | | 1,152,730 | |
Tennessee State School Board Authority Rev., Series 2008 B, (Higher Educational Facilities), 5.125%, 5/1/33 | | 1,000,000 | | | 1,128,050 | |
| | | | | | 18,568,545 | |
TEXAS — 6.1% | |
Allen Independent School District GO, (School Building), 5.25%, 2/15/34 | | 3,325,000 | | | 3,911,696 | |
Austin Water & Wastewater System Rev., 5.00%, 11/15/28 | | 5,300,000 | | | 6,161,568 | |
Canadian River Municipal Water Authority Rev., (Conjunctive Use Groundwater Supply Project), 5.00%, 2/15/15 | | 500,000 | | | 539,345 | |
Canadian River Municipal Water Authority Rev., (Conjunctive Use Groundwater Supply Project), 5.00%, 2/15/16 | | 350,000 | | | 391,479 | |
Canadian River Municipal Water Authority Rev., (Conjunctive Use Groundwater Supply Project), 5.00%, 2/15/19 (Ambac) | | 1,000,000 | | | 1,109,380 | |
Cash Special Utility District Rev., 5.25%, 9/1/24 (NATL-RE) | | 2,035,000 | | | 2,084,064 | |
Central Texas Regional Mobility Authority Rev., (Senior Lien), 6.00%, 1/1/41 | | 2,500,000 | | | 2,884,250 | |
Central Texas Regional Mobility Authority Rev., Series 2013 A, 5.00%, 1/1/21 | | 860,000 | | | 997,359 | |
City of Austin Electric Utility Rev., 4.00%, 11/15/17 | | 500,000 | | | 567,315 | |
City of Austin Electric Utility Rev., 5.00%, 11/15/18 | | 750,000 | | | 896,730 | |
City of Austin Electric Utility Rev., 5.00%, 11/15/19 | | 500,000 | | | 603,325 | |
Cypress-Fairbanks Independent School District GO, (Schoolhouse), 5.00%, 2/15/16 (PSF-GTD) | | 1,000,000 | | | 1,120,340 | |
Dallas Area Rapid Transit Sales Tax Rev., Series 2010 A, (Senior Lien), 5.00%, 12/1/14 | | 680,000 | | | 728,470 | |
Dallas Area Rapid Transit Sales Tax Rev., Series 2010 A, (Senior Lien), 5.00%, 12/1/15 | | 2,185,000 | | | 2,434,483 | |
Dallas Area Rapid Transit Sales Tax Rev., Series 2010 A, (Senior Lien), 5.00%, 12/1/19 | | 2,250,000 | | | 2,734,155 | |
Dallas Independent School District GO, 4.00%, 8/15/16 (PSF-GTD) | | 6,365,000 | | | 7,059,676 | |
Dallas Independent School District GO, 5.00%, 8/15/18 (PSF-GTD) | | 5,715,000 | | | 6,846,570 | |
Dallas Independent School District GO, 5.00%, 8/15/19 (PSF-GTD) | | 5,000,000 | | | 6,071,700 | |
Dallas-Fort Worth International Airport Rev., Series 2011 D, 5.00%, 11/1/20 | | 2,900,000 | | | 3,474,316 | |
Dallas-Fort Worth International Airport Rev., Series 2011 D, 5.00%, 11/1/21 | | $4,400,000 | | | $5,187,556 | |
Dallas-Fort Worth International Airport Facilities Improvement Corp. Rev., Series 2009 A, 5.00%, 11/1/24 | | 1,000,000 | | | 1,116,630 | |
Donna Independent School District GO, 5.00%, 2/15/15 (PSF-GTD) | | 2,000,000 | | | 2,157,640 | |
Edcouch-Elsa Independent School District GO, 5.00%, 2/15/14 (PSF-GTD) | | 1,115,000 | | | 1,152,676 | |
Fort Worth Water & Sewer Rev., 4.00%, 2/15/14 | | 2,540,000 | | | 2,607,742 | |
Fort Worth Water & Sewer Rev., 4.00%, 2/15/15 | | 1,200,000 | | | 1,273,992 | |
Fort Worth Water & Sewer Rev., 5.00%, 2/15/17 | | 1,000,000 | | | 1,151,800 | |
Gregg County Health Facilities Development Corp. Rev., Series 2006 A, (Good Shepherd Medical Center), 5.00%, 10/1/16 | | 1,000,000 | | | 1,100,830 | |
Harris County Rev., Series 2009 C, 5.00%, 8/15/17 | | 5,000,000 | | | 5,840,550 | |
Harris County Cultural Education Facilities Finance Corp. Rev., Series 2008 B, (The Methodist Hospital System), 5.50%, 12/1/18 | | 2,500,000 | | | 3,050,375 | |
Houston Airport System Rev., Series 2009 A, (Senior Lien), 5.50%, 7/1/39 | | 4,000,000 | | | 4,581,760 | |
Houston Airport System Rev., Series 2012 B, (Subordinate Lien), 5.00%, 7/1/23 | | 2,560,000 | | | 3,023,565 | |
Houston Airport System Rev., Series 2012 B, (Subordinate Lien), 5.00%, 7/1/24 | | 4,000,000 | | | 4,683,920 | |
Houston Independent School District GO, VRDN, 2.50%, 6/1/15 (PSF-GTD) | | 9,750,000 | | | 10,104,217 | |
Live Oak GO, 5.25%, 8/1/22 (NATL-RE) | | 1,630,000 | | | 1,677,482 | |
Lone Star College System GO, 5.00%, 8/15/21 | | 1,000,000 | | | 1,195,370 | |
Lone Star College System GO, 5.00%, 8/15/22 | | 2,650,000 | | | 3,147,696 | |
Love Field Airport Modernization Corp. Special Facilities Rev., (Southwest Airlines Co.), 5.25%, 11/1/40 | | 2,500,000 | | | 2,692,100 | |
Lower Colorado River Authority Rev., 5.00%, 5/15/15(1) | | 5,000 | | | 5,446 | |
Lower Colorado River Authority Rev., 5.00%, 5/15/15 | | 795,000 | | | 865,811 | |
Lower Colorado River Authority Rev., (LCRA Transportation Services), 5.00%, 5/15/22 | | 1,000,000 | | | 1,164,550 | |
Lower Colorado River Authority Rev., (LCRA Transportation Services), 5.00%, 5/15/23 | | 3,435,000 | | | 3,953,032 | |
Lower Colorado River Authority Rev., (LCRA Transportation Services), 5.00%, 5/15/24 | | 2,000,000 | | | 2,283,980 | |
Lubbock Electric Light & Power System Rev., 4.00%, 4/15/14 | | 2,000,000 | | | 2,063,380 | |
Lubbock Electric Light & Power System Rev., 5.00%, 4/15/15 | | 1,000,000 | | | 1,083,960 | |
Lubbock Electric Light & Power System Rev., 5.00%, 4/15/16 | | 2,000,000 | | | 2,238,240 | |
Lubbock Health Facilities Development Corp. Rev., Series 2008 A, (St. Joseph Health System), VRDN, 1.125%, 10/18/16 | | 18,500,000 | | | 18,667,425 | |
Mansfield Independent School District GO, VRDN, 1.75%, 8/1/17 (PSF-GTD) | | 6,305,000 | | | 6,479,459 | |
Montgomery County GO, (Road), 5.50%, 3/1/14, Prerefunded at 100% of Par (Ambac)(1) | | 1,740,000 | | | 1,807,930 | |
North East Independent School District GO, (School Building), 5.00%, 8/1/15 (PSF-GTD) | | 8,700,000 | | | 9,573,393 | |
North Texas Tollway Authority Rev., Series 2012 A, (First Tier), 5.00%, 1/1/29 | | 2,400,000 | | | 2,697,984 | |
North Texas Tollway Authority Rev., Series 2012 B, 5.00%, 1/1/21 | | 7,615,000 | | | 9,006,184 | |
North Texas Tollway Authority Rev., Series 2012 B, 5.00%, 1/1/28 | | $3,000,000 | | | $3,391,590 | |
North Texas Tollway Authority Rev., Series 2012 B, 5.00%, 1/1/30 | | 6,810,000 | | | 7,628,494 | |
Northside Independent School District GO, (School Building), VRDN, 1.00%, 6/1/16 (PSF-GTD) | | 6,700,000 | | | 6,755,409 | |
Pasadena Independent School District GO, Series 1996 A, 6.05%, 2/15/16 (PSF-GTD) | | 550,000 | | | 631,010 | |
San Antonio Electric & Gas Rev., Series 2012 A, (Junior Lien), VRDN, 2.00%, 12/1/14 | | 8,750,000 | | | 8,948,275 | |
San Antonio Electric & Gas Rev., Series 2012 B, (Junior Lien), VRDN, 2.00%, 12/1/15 | | 3,250,000 | | | 3,360,240 | |
San Antonio Water System Rev., 3.00%, 5/15/14 | | 1,100,000 | | | 1,129,557 | |
San Antonio Water System Rev., 4.00%, 5/15/15 | | 1,000,000 | | | 1,071,290 | |
San Antonio Water System Rev., 5.00%, 5/15/17 | | 2,365,000 | | | 2,747,681 | |
Southside Independent School District GO, Series 2004 A, 5.25%, 8/15/25 (PSF-GTD) | | 2,120,000 | | | 2,241,773 | |
Tarrant County Cultural Education Facilities Finance Corp. Retirement Facility Rev., (Air Force Village Obligated Group), 5.00%, 5/15/16 | | 1,000,000 | | | 1,067,190 | |
Texas GO, 5.00%, 10/1/15 | | 3,500,000 | | | 3,879,995 | |
Texas GO, 5.00%, 10/1/16 | | 3,355,000 | | | 3,849,225 | |
Texas GO, 5.00%, 10/1/17 | | 2,225,000 | | | 2,622,986 | |
Texas Municipal Power Agency Rev., (Subordinated Lien-Transmission), 5.00%, 9/1/15 | | 1,000,000 | | | 1,096,010 | |
Texas Municipal Power Agency Rev., (Subordinated Lien-Transmission), 5.00%, 9/1/20 | | 1,500,000 | | | 1,796,805 | |
Texas Public Finance Authority Rev., Series 2010 A, (Unemployment Compensation), 5.00%, 7/1/14 | | 5,000,000 | | | 5,258,750 | |
Texas Transportation Commission Rev., Series 2006 A, (First Tier), 4.50%, 4/1/16 | | 5,000,000 | | | 5,555,200 | |
Texas Transportation Commission Turnpike System Rev., Series 2012 B, (First Tier), VRDN, 1.25%, 2/15/15 | | 15,000,000 | | | 15,110,250 | |
University of North Texas Rev., Series 2009 A, (Financing System), 5.00%, 4/15/16 | | 1,125,000 | | | 1,263,397 | |
West Oso Independent School District GO, 5.50%, 8/15/13, Prerefunded at 100% of Par (PSF-GTD)(1) | | 1,265,000 | | | 1,278,877 | |
Williamson County GO, Series 2004 A, (Unlimited Tax Road & Refunding Bonds), 5.00%, 2/15/19 (NATL-RE) | | 1,000,000 | | | 1,197,050 | |
| | | | | | 250,133,950 | |
U.S. VIRGIN ISLANDS — 0.5% | |
Virgin Islands Public Finance Authority Rev., Series 2009 B, (Senior Lien), 5.00%, 10/1/17 | | 6,950,000 | | | 7,798,873 | |
Virgin Islands Public Finance Authority Rev., Series 2010 A, (Matching Fund Loan Note, Senior Lien), 5.00%, 10/1/25 | | 7,250,000 | | | 8,069,105 | |
Virgin Islands Public Finance Authority Rev., Series 2012 A, (Matching Fund Loan Note), 5.00%, 10/1/32 | | 5,500,000 | | | 6,016,505 | |
| | | | | | 21,884,483 | |
UTAH — 0.5% | |
Eagle Mountain City Gas & Electric Rev., 5.00%, 6/1/19 (Radian) | | 2,550,000 | | | 2,664,980 | |
Intermountain Power Agency Rev., Series 2008 A, 5.25%, 7/1/13, Prerefunded at 100% of Par(1) | | 3,500,000 | | | 3,514,665 | |
Salt Lake City Hospital Rev., Series 1988 A, (Intermountain Healthcare), 8.125%, 5/15/15(1) | | 200,000 | | | 217,800 | |
Utah GO, Series 2009 C, 5.00%, 7/1/18 | | 4,000,000 | | | 4,798,840 | |
Utah Transit Authority Sales Tax Rev., 5.00%, 6/15/24 | | 2,900,000 | | | 3,379,225 | |
Utah Transit Authority Sales Tax Rev., 5.00%, 6/15/25 | | $1,220,000 | | | $1,414,724 | |
Utah Transit Authority Sales Tax Rev., 5.00%, 6/15/42 | | 5,000,000 | | | 5,485,400 | |
| | | | | | 21,475,634 | |
VERMONT — 0.1% | |
University of Vermont & State Agricultural College Rev., 5.00%, 10/1/19 (Ambac) | | 4,290,000 | | | 4,939,506 | |
VIRGINIA — 0.6% | |
Chesapeake Expressway Toll Road Rev., Capital Appreciation, Series 2012 B, 0.00%, 7/15/23(2) | | 1,800,000 | | | 1,090,728 | |
Chesapeake Expressway Toll Road Rev., Capital Appreciation, Series 2012 B, 0.00%, 7/15/23(2) | | 1,420,000 | | | 806,645 | |
Fairfax County Economic Development Authority Rev., (Silver Line Phase I), 5.00%, 4/1/36 | | 1,430,000 | | | 1,574,359 | |
Virginia College Building Authority Education Facilities Rev., Series 2012 A, (Christopher Newport University), 5.00%, 9/1/16 | | 9,350,000 | | | 10,663,768 | |
Virginia Resources Authority Clean Water Rev., (State Revolving Fund), 5.00%, 10/1/16 | | 5,120,000 | | | 5,861,376 | |
Virginia Resources Authority Clean Water Rev., (State Revolving Fund), 5.00%, 10/1/22 | | 4,150,000 | | | 5,018,927 | |
| | | | | | 25,015,803 | |
WASHINGTON — 2.8% | |
Central Puget Sound Regional Transportation Authority Rev., Series 2012 P-1, 5.00%, 2/1/14 | | 5,000,000 | | | 5,160,400 | |
Central Puget Sound Regional Transportation Authority Rev., Series 2012 P-1, 5.00%, 2/1/17 | | 2,750,000 | | | 3,166,928 | |
Central Puget Sound Regional Transportation Authority Rev., Series 2012 S-1, 5.00%, 11/1/16 | | 2,105,000 | | | 2,410,414 | |
Central Puget Sound Regional Transportation Authority Rev., Series 2012 S-1, 5.00%, 11/1/17 | | 5,875,000 | | | 6,900,716 | |
Energy Northwest Electric Rev., Series 2005 A, (Project 3), 5.00%, 7/1/15 (Ambac) | | 4,000,000 | | | 4,382,680 | |
Energy Northwest Electric Rev., Series 2009 A, (Project 3), 5.25%, 7/1/18 | | 3,000,000 | | | 3,611,430 | |
Energy Northwest Electric Rev., Series 2010 A, (Project 3), 5.00%, 7/1/18 | | 5,115,000 | | | 6,094,471 | |
Energy Northwest Electric Rev., Series 2011 A, (Columbia Generating), 5.00%, 7/1/22 | | 5,000,000 | | | 6,009,050 | |
Energy Northwest Wind Rev., 4.75%, 7/1/20 (NATL-RE) | | 1,750,000 | | | 1,820,630 | |
King County Public Hospital District No. 2 GO, (Evergreen Healthcare), 5.00%, 12/1/14 (NATL-RE) | | 1,000,000 | | | 1,070,260 | |
King County Sewer Rev., Series 2011 B, 5.00%, 1/1/16 | | 4,850,000 | | | 5,402,173 | |
Kitsap County School District No. 303 Bainbridge Island GO, 5.00%, 12/1/17 (NATL-RE/School Board Guarantee) | | 1,000,000 | | | 1,122,850 | |
Port Seattle Rev., Series 2010 B, (Intermediate Lien), 5.00%, 6/1/22 | | 1,000,000 | | | 1,173,610 | |
Seattle Municipal Light & Power Rev., Series 2010 B, 5.00%, 2/1/19 | | 5,000,000 | | | 5,977,600 | |
Snohomish County Edmonds School District No. 15 GO, 5.00%, 6/1/16, Prerefunded at 100% of Par (NATL-RE/FGIC/School Bond Guarantee)(1) | | 6,690,000 | | | 7,568,865 | |
Tacoma Electric System Rev., Series 2013 A, 5.00%, 1/1/16(5) | | 1,905,000 | | | 2,121,351 | |
Tacoma Electric System Rev., Series 2013 A, 5.00%, 1/1/17(5) | | 1,500,000 | | | 1,720,095 | |
Tacoma Electric System Rev., Series 2013 A, 4.00%, 1/1/18(5) | | 1,000,000 | | | 1,128,070 | |
Tacoma Electric System Rev., Series 2013 A, 4.00%, 1/1/19(5) | | 2,000,000 | | | 2,274,280 | |
Tacoma Electric System Rev., Series 2013 A, 5.00%, 1/1/19(5) | | 1,000,000 | | | 1,190,610 | |
Washington Federal Highway Grant Anticipation Rev., Series 2012-F, (Senior 520 Corridor Program), 5.00%, 9/1/15 | | $16,585,000 | | | $18,271,695 | |
Washington GO, Series 1990 A, 6.75%, 2/1/15 | | 435,000 | | | 465,567 | |
Washington GO, Series 2011 A, 5.00%, 7/1/21 | | 3,375,000 | | | 4,125,904 | |
Washington GO, Series 2011 A, 5.00%, 7/1/22 | | 5,000,000 | | | 6,058,400 | |
Washington GO, Series 2011 C, (Motor Vehicle Tax-Senior 520), 5.00%, 6/1/21 | | 1,650,000 | | | 2,015,211 | |
Washington GO, Series 2011 C, (Motor Vehicle Tax-Senior 520), 5.00%, 6/1/22 | | 2,000,000 | | | 2,421,020 | |
Washington GO, Series 2012 R, 5.00%, 7/1/23 | | 3,855,000 | | | 4,677,426 | |
Washington Health Care Facilities Authority Rev., (Kadlec Regional Medical Center), 5.00%, 12/1/42 | | 850,000 | | | 868,598 | |
Washington Health Care Facilities Authority Rev., Series 2006 D, (Providence Health & Services), 5.25%, 10/1/33 (AGM) | | 4,500,000 | | | 4,878,270 | |
Yakima County School District No. 208 West Valley GO, 5.00%, 12/1/18 (NATL-RE/School Board Guarantee) | | 1,675,000 | | | 1,913,905 | |
| | | | | | 116,002,479 | |
WISCONSIN — 1.4% | |
Wisconsin Department of Transportation Rev., Series 1, 5.00%, 7/1/25 | | 10,000,000 | | | 12,131,500 | |
Wisconsin Department of Transportation Rev., Series 1, 5.00%, 7/1/26 | | 8,700,000 | | | 10,460,184 | |
Wisconsin GO, Series 2011 B, 5.00%, 5/1/15 | | 5,000,000 | | | 5,445,250 | |
Wisconsin GO, Series 2011-1, 5.00%, 5/1/19 | | 5,000,000 | | | 6,013,000 | |
Wisconsin GO, Series 2011-1, 5.00%, 5/1/20 | | 3,000,000 | | | 3,646,020 | |
Wisconsin GO, Series 2011-1, 5.00%, 5/1/21 | | 2,500,000 | | | 3,056,575 | |
Wisconsin Health & Educational Facilities Authority Rev., (Luther Hospital), 5.50%, 11/15/22 | | 4,655,000 | | | 5,493,459 | |
Wisconsin Health & Educational Facilities Authority Rev., (Luther Hospital), 5.75%, 11/15/30 | | 5,800,000 | | | 6,775,792 | |
Wisconsin Health & Educational Facilities Authority Rev., Series 2010 B, (Aurora Health Care), 5.00%, 7/15/13 | | 2,000,000 | | | 2,011,400 | |
Wisconsin Transportation Rev., Series 2008 A, 5.00%, 7/1/18 | | 500,000 | | | 594,925 | |
| | | | | | 55,628,105 | |
TOTAL INVESTMENT SECURITIES — 100.6% (Cost $3,923,788,572) | | | 4,108,203,405 | |
OTHER ASSETS AND LIABILITIES — (0.6)% | | | (24,968,421 | ) |
TOTAL NET ASSETS — 100.0% | | | $4,083,234,984 | |
Futures Contracts |
Contracts Purchased | Expiration Date | Underlying Face Amount at Value | Unrealized Gain (Loss) |
253 | U.S. Treasury 30-Year Bonds | September 2013 | $35,427,906 | $(459,132) |
Notes to Schedule of Investments
ACA = American Capital Access
AGC = Assured Guaranty Corporation
AGM = Assured Guaranty Municipal Corporation
CIFG = CDC IXIS Financial Guaranty North America
COP = Certificates of Participation
FGIC = Financial Guaranty Insurance Company
GA = Guaranty Agreement
GO = General Obligation
LOC = Letter of Credit
NATL-RE = National Public Finance Guarantee Corporation — Reinsured
NATL-RE-IBC = National Public Finance Guarantee Corporation — Reinsured — Insured Bond Certificates
PSF-GTD = Permanent School Fund Guaranteed
Q-SBLF = Qualified School Board Loan Fund
SBBPA = Standby Bond Purchase Agreement
VRDN = Variable Rate Demand Note. Interest reset date is indicated. Rate shown is effective at the period end.
VRN = Variable Rate Note. Interest reset date is indicated. Rate shown is effective at the period end.
XLCA = XL Capital Ltd.
| † | Category is less than 0.05% of total net assets. |
(1) | Escrowed to maturity in U.S. government securities or state and local government securities. |
(2) | Coupon rate adjusts periodically based upon a predetermined schedule. Interest reset date is indicated. Rate shown is effective at the period end. |
(3) | Security is a zero-coupon bond. Zero-coupon securities are issued at a substantial discount from their value at maturity. |
(4) | Security, or a portion thereof, has been pledged at the custodian bank or with a broker for margin requirements on futures contracts. At the period end, the aggregate value of securities pledged was $1,719,396. |
(5) | When-issued security. The issue price and yield are fixed on the date of the commitment, but payment and delivery are scheduled for a future date. |
See Notes to Financial Statements.
Statement of Assets and Liabilities |
MAY 31, 2013 | |
Assets | |
Investment securities, at value (cost of $3,923,788,572) | | $4,108,203,405 | |
Cash | | 53,524 | |
Receivable for investments sold | | 3,762,065 | |
Receivable for capital shares sold | | 8,476,449 | |
Interest receivable | | 51,119,182 | |
| | | 4,171,614,625 | |
| | | | |
Liabilities | | | |
Payable for investments purchased | | 74,403,491 | |
Payable for capital shares redeemed | | 11,950,065 | |
Payable for variation margin on futures contracts | | 118,594 | |
Accrued management fees | | 1,289,066 | |
Distribution and service fees payable | | 39,046 | |
Dividends payable | | 579,379 | |
| | | 88,379,641 | |
| | | | |
Net Assets | | $4,083,234,984 | |
| | | | |
Net Assets Consist of: | | | |
Capital paid in | | $3,889,430,569 | |
Distributions in excess of net investment income | | (9,974 | ) |
Undistributed net realized gain | | 9,858,688 | |
Net unrealized appreciation | | 183,955,701 | |
| | | $4,083,234,984 | |
| | | | | | | | | | |
| | | Net assets | | | Shares outstanding | | | Net asset value per share | |
Investor Class | | $2,040,120,439 | | | 175,788,383 | | | $11.61 | |
Institutional Class | | $1,939,174,132 | | | 167,057,576 | | | $11.61 | |
A Class | | $78,348,728 | | | 6,749,784 | | | $11.61 | * |
C Class | | $25,591,685 | | | 2,206,491 | | | $11.60 | |
*Maximum offering price $12.16 (net asset value divided by 0.955).
See Notes to Financial Statements.
YEAR ENDED MAY 31, 2013 | |
Investment Income (Loss) | |
Income: | | | |
Interest | | $111,492,068 | |
| | | | |
Expenses: | | | |
Management fees | | 14,352,972 | |
Distribution and service fees: | | | |
A Class | | 192,109 | |
C Class | | 241,688 | |
Trustees’ fees and expenses | | 179,759 | |
Other expenses | | 336 | |
| | | 14,966,864 | |
| | | | |
Net investment income (loss) | | 96,525,204 | |
| | | | |
Realized and Unrealized Gain (Loss) | | | |
Net realized gain (loss) on: | | | |
Investment transactions | | 23,116,290 | |
Futures contract transactions | | 3,132,017 | |
| | | 26,248,307 | |
| | | | |
Change in net unrealized appreciation (depreciation) on: | | | |
Investments | | (37,288,391 | ) |
Futures contracts | | 147,512 | |
| | | (37,140,879 | ) |
| | | | |
Net realized and unrealized gain (loss) | | (10,892,572 | ) |
| | | | |
Net Increase (Decrease) in Net Assets Resulting from Operations | | $85,632,632 | |
See Notes to Financial Statements.
Statement of Changes in Net Assets |
YEARS ENDED MAY 31, 2013 AND MAY 31, 2012 | |
Increase (Decrease) in Net Assets | | May 31, 2013 | | | May 31, 2012 | |
Operations | |
Net investment income (loss) | | $96,525,204 | | | $88,153,034 | |
Net realized gain (loss) | | 26,248,307 | | | 12,453,169 | |
Change in net unrealized appreciation (depreciation) | | (37,140,879 | ) | | 138,567,633 | |
Net increase (decrease) in net assets resulting from operations | | 85,632,632 | | | 239,173,836 | |
| | | | | | | |
Distributions to Shareholders | | | | | | |
From net investment income: | | | | | | |
Investor Class | | (49,166,661 | ) | | (53,402,739 | ) |
Institutional Class | | (45,328,572 | ) | | (33,320,942 | ) |
A Class | | (1,690,838 | ) | | (1,164,027 | ) |
C Class | | (349,107 | ) | | (265,357 | ) |
From net realized gains: | | | | | | |
Investor Class | | (2,471,564 | ) | | — | |
Institutional Class | | (2,267,527 | ) | | — | |
A Class | | (102,078 | ) | | — | |
C Class | | (31,631 | ) | | — | |
Decrease in net assets from distributions | | (101,407,978 | ) | | (88,153,065 | ) |
| | | | | | | |
Capital Share Transactions | | | | | | |
Net increase (decrease) in net assets from capital share transactions | | 604,111,246 | | | 1,340,254,893 | |
| | | | | | | |
Net increase (decrease) in net assets | | 588,335,900 | | | 1,491,275,664 | |
| | | | | | | |
Net Assets | | | | | | |
Beginning of period | | 3,494,899,084 | | | 2,003,623,420 | |
End of period | | $4,083,234,984 | | | $3,494,899,084 | |
| | | | | | | |
Distributions in excess of net investment income | | $(9,974 | ) | | — | |
See Notes to Financial Statements.
Notes to Financial Statements |
MAY 31, 2013
1. Organization
American Century Municipal Trust (the trust) is registered under the Investment Company Act of 1940, as amended (the 1940 Act), as an open-end management investment company and is organized as a Massachusetts business trust. Intermediate-Term Tax-Free Bond Fund (the fund) is one fund in a series issued by the trust. The fund is diversified as defined under the 1940 Act. The fund’s investment objectives are to seek safety of principal and high current income that is exempt from federal income tax.
The fund offers the Investor Class, the Institutional Class, the A Class and the C Class. The A Class may incur an initial sales charge. The A Class and C Class may be subject to a contingent deferred sales charge. The share classes differ principally in their respective sales charges and distribution and shareholder servicing expenses and arrangements. The Institutional Class is made available to institutional shareholders or through financial intermediaries whose clients do not require the same level of shareholder and administrative services as shareholders of other classes. As a result, the Institutional Class is charged a lower unified management fee.
2. Significant Accounting Policies
The following is a summary of significant accounting policies consistently followed by the fund in preparation of its financial statements. The financial statements are prepared in conformity with accounting principles generally accepted in the United States of America, which may require management to make certain estimates and assumptions at the date of the financial statements. Actual results could differ from these estimates.
Investment Valuations — The fund determines the fair value of its investments and computes its net asset value per share as of the close of regular trading (usually 4 p.m. Eastern time) on the New York Stock Exchange (NYSE) on each day the NYSE is open.
Debt securities maturing in greater than 60 days at the time of purchase are valued at the evaluated mean as provided by independent pricing services or at the mean of the most recent bid and asked prices as provided by investment dealers. Debt securities maturing within 60 days at the time of purchase may be valued at cost, plus or minus any amortized discount or premium or at the evaluated mean as provided by an independent pricing service. Evaluated mean prices are commonly derived through utilization of market models, which may consider, among other factors, trade data, quotations from dealers and active market makers, relevant yield curve and spread data, related sector levels, creditworthiness, and other relevant market information on the same or comparable securities.
Exchange-traded futures contracts are valued at the settlement price as provided by the appropriate clearing corporation.
If the fund determines that the market price for a portfolio security is not readily available or the valuation methods mentioned above do not reflect a security’s fair value, such security is valued as determined in good faith by the Board of Trustees or its designee, in accordance with procedures adopted by the Board of Trustees. Circumstances that may cause the fund to use these procedures to value a security include, but are not limited to: a security has been declared in default; trading in a security has been halted during the trading day; there is a foreign market holiday and no trading occurred; or an event occurred between the close of a foreign exchange and the NYSE that may affect the value of a security.
Security Transactions — Security transactions are accounted for as of the trade date. Net realized gains and losses are determined on the identified cost basis, which is also used for federal income tax purposes.
Investment Income — Interest income is recorded on the accrual basis and includes accretion of discounts and amortization of premiums.
Segregated Assets — In accordance with the 1940 Act, the fund segregates assets on its books and records to cover certain types of investments, including, but not limited to, futures contracts and when-issued securities. American Century Investment Management, Inc. (ACIM) (the investment advisor) monitors, on a daily basis, the securities segregated to ensure the fund designates a sufficient amount of liquid assets, marked-to-market daily. The fund may also receive assets or be required to pledge assets at the custodian bank or with a broker for margin requirements on futures contracts.
Income Tax Status — It is the fund’s policy to distribute substantially all net investment income and net realized gains to shareholders and to otherwise qualify as a regulated investment company under provisions of the Internal Revenue Code. Accordingly, no provision has been made for income taxes. The fund files U.S. federal, state, local and non-U.S. tax returns as applicable. The fund’s tax returns are subject to examination by the relevant taxing authority until expiration of the applicable statute of limitations, which is generally three years from the date of filing but can be longer in certain jurisdictions. At this time, management believes there are no uncertain tax positions which, based on their technical merit, would not be sustained upon examination and for which it is reasonably possible that the total amounts of unrecognized tax benefits will significantly change in the next twelve months.
Multiple Class — All shares of the fund represent an equal pro rata interest in the net assets of the class to which such shares belong, and have identical voting, dividend, liquidation and other rights and the same terms and conditions, except for class specific expenses and exclusive rights to vote on matters affecting only individual classes. Income, non-class specific expenses, and realized and unrealized capital gains and losses of the fund are allocated to each class of shares based on their relative net assets.
Distributions to Shareholders — Distributions from net investment income are declared daily and paid monthly. Distributions from net realized gains, if any, are generally declared and paid annually.
Indemnifications — Under the trust’s organizational documents, its officers and trustees are indemnified against certain liabilities arising out of the performance of their duties to the fund. In addition, in the normal course of business, the fund enters into contracts that provide general indemnifications. The maximum exposure under these arrangements is unknown as this would involve future claims that may be made against a fund. The risk of material loss from such claims is considered by management to be remote.
3. Fees and Transactions with Related Parties
Management Fees — The trust has entered into a management agreement with ACIM, under which ACIM provides the fund with investment advisory and management services in exchange for a single, unified management fee (the fee) per class. The agreement provides that all expenses of managing and operating the fund, except distribution and service fees, brokerage expenses, taxes, interest, fees and expenses of the independent trustees (including legal counsel fees), and extraordinary expenses, will be paid by ACIM. The fee is computed and accrued daily based on each class’s daily net assets and paid monthly in arrears. The fee consists of (1) an Investment Category Fee based on the daily net assets of the fund and certain other accounts managed by the investment advisor that are in the same broad investment category as the fund and (2) a Complex Fee based on the assets of all the funds in the American Century Investments family of funds. The rates for the Investment Category Fee range from 0.1625% to 0.2800%. The rates for the Complex Fee range from 0.2500% to 0.3100% for the Investor Class, A Class and C Class. The Institutional Class is 0.2000% less at each point within the Complex Fee range. The effective annual management fee for each class for the year ended May 31, 2013 was 0.46% for the Investor Class, A Class and C Class and 0.26% for the Institutional Class.
Distribution and Service Fees — The Board of Trustees has adopted a separate Master Distribution and Individual Shareholder Services Plan for each of the A Class and C Class (collectively the plans), pursuant to Rule 12b-1 of the 1940 Act. The plans provide that the A Class will pay American Century Investment Services, Inc. (ACIS) an annual distribution and service fee of 0.25%. The plans provide that the C Class will pay ACIS an annual distribution and service fee of 1.00%, of which 0.25% is paid for individual shareholder services and 0.75% is paid for distribution services. The fees are computed and accrued daily based on each class’s daily net assets and paid monthly in arrears. The fees are used to pay financial intermediaries for distribution and individual shareholder services. Fees incurred under the plans during the year ended May 31, 2013 are detailed in the Statement of Operations.
Related Parties — Certain officers and trustees of the trust are also officers and/or directors of American Century Companies, Inc. (ACC). The trust’s investment advisor, ACIM, the trust’s distributor, ACIS, and the trust’s transfer agent, American Century Services, LLC are wholly owned, directly or indirectly, by ACC.
4. Investment Transactions
Purchases and sales of investment securities, excluding short-term investments, for the year ended May 31, 2013 were $2,706,727,329 and $2,167,857,179, respectively.
5. Capital Share Transactions
Transactions in shares of the fund were as follows (unlimited number of shares authorized):
| | | | | | | |
| | | Year ended May 31, 2013 | | | Year ended May 31, 2012 | |
| | | Shares | | | Amount | | | Shares | | | Amount | |
Investor Class | | | | | | | | | | | | |
Sold | | 47,019,450 | | | $551,218,612 | | | 40,871,530 | | | $465,461,518 | |
Issued in reinvestment of distributions | | 3,787,870 | | | 44,422,612 | | | 4,084,424 | | | 46,446,530 | |
Redeemed | | (43,785,744 | ) | | (513,088,452 | ) | | (31,582,968 | ) | | (358,854,987 | ) |
| | | 7,021,576 | | | 82,552,772 | | | 13,372,986 | | | 153,053,061 | |
Institutional Class | | | | | | | | | | | | |
Sold | | 91,497,846 | | | 1,073,345,186 | | | 134,507,494 | | | 1,515,717,799 | |
Issued in reinvestment of distributions | | 3,634,765 | | | 42,634,056 | | | 2,607,783 | | | 29,793,153 | |
Redeemed | | (52,427,916 | ) | | (614,440,212 | ) | | (34,989,246 | ) | | (399,807,764 | ) |
| | | 42,704,695 | | | 501,539,030 | | | 102,126,031 | | | 1,145,703,188 | |
A Class | | | | | | | | | | | | |
Sold | | 3,743,406 | | | 43,876,794 | | | 4,137,852 | | | 47,170,553 | |
Issued in reinvestment of distributions | | 111,279 | | | 1,305,587 | | | 68,595 | | | 782,695 | |
Redeemed | | (2,704,248 | ) | | (31,705,784 | ) | | (1,404,109 | ) | | (15,900,109 | ) |
| | | 1,150,437 | | | 13,476,597 | | | 2,802,338 | | | 32,053,139 | |
C Class | | | | | | | | | | | | |
Sold | | 978,614 | | | 11,456,972 | | | 1,089,035 | | | 12,382,410 | |
Issued in reinvestment of distributions | | 22,131 | | | 259,490 | | | 16,873 | | | 192,128 | |
Redeemed | | (441,709 | ) | | (5,173,615 | ) | | (273,540 | ) | | (3,129,033 | ) |
| | | 559,036 | | | 6,542,847 | | | 832,368 | | | 9,445,505 | |
Net increase (decrease) | | 51,435,744 | | | $604,111,246 | | | 119,133,723 | | | $1,340,254,893 | |
6. Fair Value Measurements
The fund’s securities valuation process is based on several considerations and may use multiple inputs to determine the fair value of the positions held by the fund. In conformity with accounting principles generally accepted in the United States of America, the inputs used to determine a valuation are classified into three broad levels as follows:
• | Level 1 valuation inputs consist of unadjusted quoted prices in an active market for identical securities; |
• | Level 2 valuation inputs consist of direct or indirect observable market data (including quoted prices for similar securities, evaluations of subsequent market events, interest rates, prepayment speeds, credit risk, etc.); or |
• | Level 3 valuation inputs consist of unobservable data (including a fund’s own assumptions). |
The level classification is based on the lowest level input that is significant to the fair valuation measurement. The valuation inputs are not necessarily an indication of the risks associated with investing in these securities or other financial instruments.
As of period end, the fund’s investment securities and unrealized gain (loss) on futures contracts were classified as Level 2 and Level 1, respectively. The Schedule of Investments provides additional information on the fund’s portfolio holdings.
7. Derivative Instruments
Interest Rate Risk — The fund is subject to interest rate risk in the normal course of pursuing its investment objectives. The value of bonds generally declines as interest rates rise. A fund may enter into futures contracts based on a bond index or a specific underlying security. A fund may purchase futures contracts to gain exposure to increases in market value or sell futures contracts to protect against a decline in market value. Upon entering into a futures contract, a fund will segregate cash, cash equivalents or other appropriate liquid securities on its records in amounts sufficient to meet requirements. Subsequent payments (variation margin) are made or received daily, in cash, by a fund. The variation margin is equal to the daily change in the contract value and is recorded as unrealized gains and losses. A fund recognizes a realized gain or loss when the futures contract is closed or expires. Net realized and unrealized gains or losses occurring during the holding period of futures contracts are a component of net realized gain (loss) on futures contract transactions and change in net unrealized appreciation (depreciation) on futures contracts, respectively. One of the risks of entering into futures contracts is the possibility that the change in value of the contract may not correlate with the changes in value of the underlying securities. The fund regularly purchased and sold interest rate risk derivative instruments throughout the reporting period, though the amounts held at period end as disclosed on the Schedule of Investments were lower than the fund’s typical volume during the period.
The value of interest rate risk derivative instruments as of May 31, 2013, is disclosed on the Statement of Assets and Liabilities as a liability of $118,594 in payable for variation margin on futures contracts.* For the year ended May 31, 2013, the effect of interest rate risk derivative instruments on the Statement of Operations was $3,132,017 in net realized gain (loss) on futures contract transactions and $147,512 in change in net unrealized appreciation (depreciation) on futures contracts.
*Included in the unrealized gain (loss) on futures contracts as reported in the Schedule of Investments.
8. Federal Tax Information
The tax character of distributions paid during the years ended May 31, 2013 and May 31, 2012 were as follows:
| | | | | | | |
| | | 2013 | | | 2012 | |
Distributions Paid From | | | | | | |
Exempt income | | $96,535,178 | | | $88,116,587 | |
Taxable ordinary income | | — | | | $36,478 | |
Long-term capital gains | | $4,872,800 | | | — | |
The book-basis character of distributions made during the year from net investment income or net realized gains may differ from their ultimate characterization for federal income tax purposes. These differences reflect the differing character of certain income items and net realized gains and losses for financial statement and tax purposes, and may result in reclassification among certain capital accounts on the financial statements.
As of May 31, 2013, the federal tax cost of investments and the components of distributable earnings on a tax-basis were as follows:
| | | | |
Federal tax cost of investments | | $3,923,788,572 | |
Gross tax appreciation of investments | | $197,147,378 | |
Gross tax depreciation of investments | | (12,732,545 | ) |
Net tax appreciation (depreciation) of investments | | $184,414,833 | |
Net tax appreciation (depreciation) on derivatives | | — | |
Net tax appreciation (depreciation) | | $184,414,833 | |
Other book-to-tax adjustments | | $(1,351,349 | ) |
Undistributed tax-exempt income | | $(9,974 | ) |
Accumulated long-term gains | | $10,750,905 | |
The cost of investments for federal income tax purposes was the same as the cost for financial reporting purposes. The difference between book-basis and tax-basis unrealized appreciation (depreciation) is attributable primarily to the realization for tax purposes of unrealized gains (losses) on futures contracts. Other book-to-tax adjustments are attributable primarily to the tax deferral of losses on straddle positions.
| |
For a Share Outstanding Throughout the Years Ended May 31 (except as noted) |
Per-Share Data | | Ratios and Supplemental Data | |
| | | | | | Income From Investment Operations: | | | Distributions From: | | | | | | | | | Ratio to Average Net Assets of: | | | | | | | |
| | | Net Asset Value, Beginning
of Period | | | Net Investment Income
(Loss) | | | Net
Realized
and Unrealized Gain (Loss) | | | Total From Investment Operations | | | Net Investment Income | | | Net
Realized Gains | | | Total Distributions | | | Net Asset Value, End
of Period | | | Total
Return(1) | | Operating Expenses | | Operating Expenses (before expense waiver) | | Net Investment Income
(Loss) | | Net Investment Income
(Loss)
(before expense waiver) | | Portfolio Turnover Rate | | Net
Assets,
End of
Period
(in thousands) | |
Investor Class |
2013 | | $11.63 | | | 0.29 | (2) | | (0.01 | ) | | 0.28 | | | (0.29 | ) | | (0.01 | ) | | (0.30 | ) | | $11.61 | | | 2.43 | % | | 0.47 | % | | 0.47 | % | | 2.44 | % | | 2.44 | % | | 58 | % | | $2,040,120 | |
2012 | | $11.06 | | | 0.33 | (2) | | 0.57 | | | 0.90 | | | (0.33 | ) | | — | | | (0.33 | ) | | $11.63 | | | 8.28 | % | | 0.47 | % | | 0.47 | % | | 2.91 | % | | 2.91 | % | | 62 | % | | $1,963,542 | |
2011 | | $11.09 | | | 0.39 | (2) | | (0.03 | ) | | 0.36 | | | (0.39 | ) | | — | | | (0.39 | ) | | $11.06 | | | 3.31 | % | | 0.47 | % | | 0.48 | % | | 3.53 | % | | 3.52 | % | | 14 | % | | $1,717,930 | |
2010 | | $10.70 | | | 0.40 | (2) | | 0.39 | | | 0.79 | | | (0.40 | ) | | — | | | (0.40 | ) | | $11.09 | | | 7.48 | % | | 0.48 | % | | 0.48 | % | | 3.61 | % | | 3.61 | % | | 14 | % | | $1,705,065 | |
2009 | | $10.74 | | | 0.41 | | | (0.04 | ) | | 0.37 | | | (0.41 | ) | | — | | | (0.41 | ) | | $10.70 | | | 3.58 | % | | 0.49 | % | | 0.49 | % | | 3.89 | % | | 3.89 | % | | 37 | % | | $1,198,419 | |
Institutional Class |
2013 | | $11.64 | | | 0.31 | (2) | | (0.02 | ) | | 0.29 | | | (0.31 | ) | | (0.01 | ) | | (0.32 | ) | | $11.61 | | | 2.55 | % | | 0.27 | % | | 0.27 | % | | 2.64 | % | | 2.64 | % | | 58 | % | | $1,939,174 | |
2012 | | $11.06 | | | 0.35 | (2) | | 0.59 | | | 0.94 | | | (0.36 | ) | | — | | | (0.36 | ) | | $11.64 | | | 8.59 | % | | 0.27 | % | | 0.27 | % | | 3.11 | % | | 3.11 | % | | 62 | % | | $1,447,044 | |
2011 | | $11.09 | | | 0.41 | (2) | | (0.03 | ) | | 0.38 | | | (0.41 | ) | | — | | | (0.41 | ) | | $11.06 | | | 3.51 | % | | 0.27 | % | | 0.28 | % | | 3.73 | % | | 3.72 | % | | 14 | % | | $245,759 | |
2010 | | $10.70 | | | 0.42 | (2) | | 0.39 | | | 0.81 | | | (0.42 | ) | | — | | | (0.42 | ) | | $11.09 | | | 7.69 | % | | 0.28 | % | | 0.28 | % | | 3.81 | % | | 3.81 | % | | 14 | % | | $221,014 | |
2009 | | $10.74 | | | 0.43 | | | (0.04 | ) | | 0.39 | | | (0.43 | ) | | — | | | (0.43 | ) | | $10.70 | | | 3.78 | % | | 0.29 | % | | 0.29 | % | | 4.09 | % | | 4.09 | % | | 37 | % | | $111,882 | |
| |
For a Share Outstanding Throughout the Years Ended May 31 (except as noted) |
Per-Share Data | | Ratios and Supplemental Data | |
| | | | | | Income From Investment Operations: | | | Distributions From: | | | | | | | | | Ratio to Average Net Assets of: | | | | | | | |
| | | Net Asset Value, Beginning
of Period | | | Net Investment Income
(Loss) | | | Net
Realized
and Unrealized Gain (Loss) | | | Total From Investment Operations | | | Net Investment Income | | | Net
Realized Gains | | | Total Distributions | | | Net Asset Value, End
of Period | | | Total
Return(1) | | Operating Expenses | | Operating Expenses (before expense waiver) | | Net Investment Income
(Loss) | | Net Investment Income
(Loss)
(before expense waiver) | | Portfolio Turnover Rate | | Net
Assets,
End of
Period
(in thousands) | |
A Class |
2013 | | $11.64 | | | 0.26 | (2) | | (0.02 | ) | | 0.24 | | | (0.26 | ) | | (0.01 | ) | | (0.27 | ) | | $11.61 | | | 2.09 | % | | 0.72 | % | | 0.72 | % | | 2.19 | % | | 2.19 | % | | 58 | % | | $78,349 | |
2012 | | $11.06 | | | 0.30 | (2) | | 0.59 | | | 0.89 | | | (0.31 | ) | | — | | | (0.31 | ) | | $11.64 | | | 8.11 | % | | 0.72 | % | | 0.72 | % | | 2.66 | % | | 2.66 | % | | 62 | % | | $65,158 | |
2011 | | $11.09 | | | 0.36 | (2) | | (0.03 | ) | | 0.33 | | | (0.36 | ) | | — | | | (0.36 | ) | | $11.06 | | | 3.05 | % | | 0.72 | % | | 0.73 | % | | 3.28 | % | | 3.27 | % | | 14 | % | | $30,930 | |
| 2010(3) | | $11.03 | | | 0.09 | (2) | | 0.06 | | | 0.15 | | | (0.09 | ) | | — | | | (0.09 | ) | | $11.09 | | | 1.35 | % | | 0.73 | %(4) | | 0.73 | %(4) | | 3.19 | %(4) | | 3.19 | %(4) | | 14 | %(5) | | $3,951 | |
C Class |
2013 | | $11.63 | | | 0.17 | (2) | | (0.02 | ) | | 0.15 | | | (0.17 | ) | | (0.01 | ) | | (0.18 | ) | | $11.60 | | | 1.33 | % | | 1.47 | % | | 1.47 | % | | 1.44 | % | | 1.44 | % | | 58 | % | | $25,592 | |
2012 | | $11.05 | | | 0.22 | (2) | | 0.58 | | | 0.80 | | | (0.22 | ) | | — | | | (0.22 | ) | | $11.63 | | | 7.30 | % | | 1.47 | % | | 1.47 | % | | 1.91 | % | | 1.91 | % | | 62 | % | | $19,155 | |
2011 | | $11.08 | | | 0.28 | (2) | | (0.03 | ) | | 0.25 | | | (0.28 | ) | | — | | | (0.28 | ) | | $11.05 | | | 2.28 | % | | 1.47 | % | | 1.48 | % | | 2.53 | % | | 2.52 | % | | 14 | % | | $9,005 | |
| 2010(3) | | $11.03 | | | 0.06 | (2) | | 0.06 | | | 0.12 | | | (0.07 | ) | | — | | | (0.07 | ) | | $11.08 | | | 1.07 | % | | 1.48 | %(4) | | 1.48 | %(4) | | 2.33 | %(4) | | 2.33 | %(4) | | 14 | %(5) | | $1,673 | |
Notes to Financial Highlights
(1) | Total returns are calculated based on the net asset value of the last business day and do not reflect applicable sales charges, if any. Total returns for periods less than one year are not annualized. |
(2) | Computed using average shares outstanding throughout the period. |
(3) | March 1, 2010 (commencement of sale) through May 31, 2010. |
(5) | Portfolio turnover is calculated at the fund level. Percentage indicated was calculated for the year ended May 31, 2010. |
See Notes to Financial Statements.
Report of Independent Registered Public Accounting Firm |
To the Trustees of the American Century Municipal Trust
and Shareholders of the Intermediate-Term Tax-Free Bond Fund:
In our opinion, the accompanying statement of assets and liabilities, including the schedule of investments, and the related statements of operations and of changes in net assets and the financial highlights present fairly, in all material respects, the financial position of the Intermediate-Term Tax-Free Bond Fund (one of the four funds comprising the American Century Municipal Trust, hereafter referred to as the “Fund”) at May 31, 2013, the results of its operations for the year then ended, the changes in its net assets for each of the two years in the period then ended and the financial highlights for the periods presented, in conformity with accounting principles generally accepted in the United States of America. These financial statements and financial highlights (hereafter referred to as “financial statements”) are the responsibility of the Fund’s management; our responsibility is to express an opinion on these financial statements based on our audits. We conducted our audits of these financial statements in accordance with the standards of the Public Company Accounting Oversight Board (United States). Those standards require that we plan and perform the audit to obtain reasonable assurance about whether the financial statements are free of material misstatement. An audit includes examining, on a test basis, evidence supporting the amounts and disclosures in the financial statements, assessing the accounting principles used and significant estimates made by management, and evaluating the overall financial statement presentation. We believe that our audits, which included confirmation of securities at May 31, 2013 by correspondence with the custodian and brokers, provide a reasonable basis for our opinion.
PricewaterhouseCoopers LLP
Kansas City, Missouri
July 22, 2013
Board of Trustees
The individuals listed below serve as trustees of the funds. Each trustee will continue to serve in this capacity until death, retirement, resignation or removal from office. The board has adopted a mandatory retirement age for trustees who are not “interested persons,” as that term is defined in the Investment Company Act (independent trustees). Independent trustees shall retire on December 31 of the year in which they reach their 75th birthday; provided, however, that on or after January 1, 2022, independent trustees shall retire on December 31 of the year in which they reach their 76th birthday.
Mr. Thomas is the only trustee who is an “interested person” because he currently serves as President and Chief Executive Officer of American Century Companies, Inc. (ACC), the parent company of American Century Investment Management, Inc. (ACIM or the advisor).
The other trustees (more than three-fourths of the total number) are independent; that is, they have never been employees, directors or officers of, and have no financial interest in, ACC or any of its wholly owned, direct or indirect, subsidiaries, including ACIM, American Century Investment Services, Inc. (ACIS) and American Century Services, LLC (ACS). The trustees serve in this capacity for eight (in the case of Mr. Thomas, 15) registered investment companies in the American Century Investments family of funds.
The following table presents additional information about the trustees. The mailing address for each trustee other than Mr. Thomas is 1665 Charleston Road, Mountain View, California 94043. The mailing address for Mr. Thomas is 4500 Main Street, Kansas City, Missouri 64111.
| | | | | | | |
Name
(Year of Birth) | Position(s) Held with Funds | Length
of Time Served | Principal Occupation(s) During Past 5 Years | | Number of American Century Portfolios Overseen
by Trustee | Other Directorships Held During Past 5 Years |
Independent Trustees |
Tanya S. Beder (1955) | Trustee | Since 2011 | Chairman, SBCC Group Inc. (independent advisory services) (2006 to present) | | 41 | CYS Investments, Inc. (specialty finance company) |
Jeremy I. Bulow (1954) | Trustee | Since 2011 | Professor of Economics, Stanford University,
Graduate School of
Business (1979 to present) | | 41 | None |
Ronald J. Gilson (1946) | Trustee and Chairman of the Board | Since 1995 | Charles J. Meyers Professor of Law and Business, Stanford Law School (1979 to present); Marc and Eva Stern Professor of Law and Business, Columbia University School of Law
(1992 to present) | | 41 | None |
Frederick L. A. Grauer
(1946) | Trustee | Since 2008 | Senior Advisor, BlackRock, Inc. (investment management firm) (2010 to 2011); Senior Advisor, Barclays Global Investors (investment management firm) (2003 to 2009) | | 41 | None |
| | | | | | | |
Name
(Year of Birth) | Position(s) Held with Funds | Length
of Time Served | Principal Occupation(s) During Past 5 Years | | Number of American Century Portfolios Overseen
by Trustee | Other Directorships Held During Past 5 Years |
Independent Trustees |
Peter F. Pervere (1947) | Trustee | Since 2007 | Retired | | 41 | Intraware, Inc. (2003 to 2009) |
Myron S. Scholes (1941) | Trustee | Since 1980 | Chairman, Platinum Grove Asset Management, L.P. (asset manager) (1999 to 2009); Frank E. Buck Professor of Finance-Emeritus, Stanford Graduate School of Business (1996 to present) | | 41 | Dimensional Fund Advisors (investment advisor); CME Group, Inc. (futures and options exchange) |
John B. Shoven (1947) | Trustee | Since 2002 | Professor of Economics, Stanford University
(1973 to present) | | 41 | Cadence Design Systems; Exponent; Financial Engines |
| |
Interested Trustee |
Jonathan S. Thomas
(1963) | Trustee and President | Since 2007 | President and Chief Executive Officer, ACC (March 2007 to present). Also serves as Chief Executive Officer and Manager, ACS; Executive Vice President, ACIM; Director, ACC, ACIM and other ACC subsidiaries | | 106 | None |
Officers
The following table presents certain information about the executive officers of the funds. Each officer serves as an officer for each of the 15 investment companies in the American Century family of funds, unless otherwise noted. No officer is compensated for his or her service as an officer of the funds. The listed officers are interested persons of the funds and are appointed or re-appointed on an annual basis. The mailing address for each of the officers listed below is 4500 Main Street, Kansas City, Missouri 64111.
| | | | |
Name
(Year of Birth) | Offices with the Funds | | Principal Occupation(s) During the Past Five Years |
Jonathan S. Thomas
(1963) | Trustee and President since 2007 | | President and Chief Executive Officer, ACC (March 2007 to present). Also serves as Chief Executive Officer and Manager, ACS; Executive Vice President, ACIM; Director, ACC, ACIM and other ACC subsidiaries |
Maryanne L. Roepke
(1956) | Chief Compliance Officer since 2006 and Senior Vice President since 2000 | | Chief Compliance Officer, American Century funds, ACIM and ACS
(August 2006 to present). Also serves as Senior Vice President, ACS |
Charles A. Etherington (1957) | General Counsel since 2007 and Senior Vice President since 2006 | | Attorney, ACC (February 1994 to present); Vice President, ACC (November 2005 to present); General Counsel, ACC (March 2007 to present). Also serves as General Counsel, ACIM, ACS, ACIS and other ACC subsidiaries; and Senior Vice President, ACIM and ACS |
C. Jean Wade (1964) | Vice President, Treasurer and Chief Financial Officer since 2012 | | Vice President, ACS (February 2000 to present) |
Robert J. Leach (1966) | Vice President since 2006 and Assistant Treasurer since 2012 | | Vice President, ACS (February 2000 to present) |
David H. Reinmiller (1963) | Vice President since 2001 | | Attorney, ACC (January 1994 to present); Associate General Counsel, ACC (January 2001 to present). Also serves as Vice President, ACIM and ACS |
Ward D. Stauffer (1960) | Secretary since 2005 | | Attorney, ACC (June 2003 to present) |
The Statement of Additional Information has additional information about the fund’s trustees and is available without charge, upon request, by calling 1-800-345-2021.
Proxy Voting Guidelines
American Century Investment Management, Inc., the fund’s investment advisor, is responsible for exercising the voting rights associated with the securities purchased and/or held by the fund. A description of the policies and procedures the advisor uses in fulfilling this responsibility is available without charge, upon request, by calling 1-800-345-2021. It is also available on American Century Investments’ website at americancentury.com and on the Securities and Exchange Commission’s website at sec.gov. Information regarding how the investment advisor voted proxies relating to portfolio securities during the most recent 12-month period ended June 30 is available on the “About Us” page at americancentury.com. It is also available at sec.gov.
Quarterly Portfolio Disclosure
The fund files its complete schedule of portfolio holdings with the Securities and Exchange Commission (SEC) for the first and third quarters of each fiscal year on Form N-Q. The fund’s Forms N-Q are available on the SEC’s website at sec.gov, and may be reviewed and copied at the SEC’s Public Reference Room in Washington, DC. Information on the operation of the Public Reference Room may be obtained by calling 1-800-SEC-0330. The fund also makes its complete schedule of portfolio holdings for the most recent quarter of its fiscal year available on its website at americancentury.com and, upon request, by calling 1-800-345-2021.
Other Tax Information
The following information is provided pursuant to provisions of the Internal Revenue Code.
The fund designates $96,988,900 as exempt interest dividends for the fiscal year ended May 31, 2013.
The fund hereby designates $4,872,800, or up to the maximum amount allowable, as long-term capital gain distributions for the fiscal year ended May 31, 2013.
Contact Us | americancentury.com |
Automated Information Line | 1-800-345-8765 |
Investor Services Representative | 1-800-345-2021
or 816-531-5575 |
Investors Using Advisors | 1-800-378-9878 |
Business, Not-For-Profit, Employer-Sponsored Retirement Plans | 1-800-345-3533 |
Banks and Trust Companies, Broker-Dealers, Financial Professionals, Insurance Companies | 1-800-345-6488 |
Telecommunications Device for the Deaf | 1-800-634-4113 |
American Century Municipal Trust
Investment Advisor:
American Century Investment Management, Inc.
Kansas City, Missouri
This report and the statements it contains are submitted for the general information of our shareholders. The report is not authorized for distribution to prospective investors unless preceded or accompanied by an effective prospectus.
©2013 American Century Proprietary Holdings, Inc. All rights reserved.
CL-ANN-78954 1307
ANNUAL REPORT MAY 31, 2013
Long-Term Tax-Free Fund
President’s Letter | 2 |
Market Perspective | 3 |
Performance | 4 |
Portfolio Commentary | 6 |
Fund Characteristics | 8 |
Shareholder Fee Example | 9 |
Schedule of Investments | 11 |
Statement of Assets and Liabilities | 23 |
Statement of Operations | 24 |
Statement of Changes in Net Assets | 25 |
Notes to Financial Statements | 26 |
Financial Highlights | 31 |
Report of Independent Registered Public Accounting Firm | 33 |
Management | 34 |
Additional Information | 37 |
Any opinions expressed in this report reflect those of the author as of the date of the report, and do not necessarily represent the opinions of American Century Investments® or any other person in the American Century Investments organization. Any such opinions are subject to change at any time based upon market or other conditions and American Century Investments disclaims any responsibility to update such opinions. These opinions may not be relied upon as investment advice and, because investment decisions made by American Century Investments funds are based on numerous factors, may not be relied upon as an indication of trading intent on behalf of any American Century Investments fund. Security examples are used for representational purposes only and are not intended as recommendations to purchase or sell securities. Performance information for comparative indices and securities is provided to American Century Investments by third party vendors. To the best of American Century Investments’ knowledge, such information is accurate at the time of printing.
Jonathan Thomas
Dear Investor:
Thank you for reviewing this annual report for the 12 months ended May 31, 2013. It provides investment performance, market analysis, and portfolio information, presented with the expert perspective of our portfolio management team.
Annual reports remain important vehicles for conveying information about fund returns, including key factors that affected fund performance. For additional, updated investment and market insights, we encourage you to visit our website, americancentury.com.
Positive Fiscal-Year Returns for Stocks and Municipal Bonds
The 12-month reporting period ended May 31, 2013 started with softening global economic conditions and growing uncertainty in the summer of 2012 as the U.S. elections and dreaded U.S. fiscal deadlines loomed ahead. These factors, and the recession fears they represented, helped provoke aggressive monetary intervention by central banks, which encouraged investors to take more risk.
In this “risk-on” investing environment, stocks generally outperformed bonds, broad non-U.S. stock measures outperformed their broad U.S. stock counterparts, and U.S. municipal bonds generally outperformed U.S. Treasury bonds.
Non-U.S., U.S. mid-cap, small-cap, and value stock indices achieved performance leadership during the period, outpacing the S&P 500 Index’s 27.28% return. The MSCI EAFE Index, for example, returned 31.62%. U.S. bond index returns ranged from roughly 15% gains for corporate high-yield indices all the way down to negative returns for longer-maturity U.S. Treasury benchmarks. For example, the 10-year U.S. Treasury note returned –2.17%, according to Barclays, as its yield rose over half a percentage point, from 1.56% to 2.13%.
Municipal bonds, which enjoyed strong demand for much of the period, generally fit more in the middle of the U.S. bond return spectrum. The Barclays Municipal Bond Index advanced 3.05%.
The U.S. economy is showing signs of improvement in 2013, particularly the long-depressed housing market. However, U.S. economic growth remains subpar compared with past recession recoveries, and is still vulnerable to fiscal, financial, and overseas threats that could trigger further slowdowns and market volatility.
Under these conditions, we continue to believe in a disciplined, diversified, long-term investment approach, using professionally managed stock and bond portfolios—as appropriate—for meeting financial goals. We appreciate your continued trust in us in this challenging environment.
Sincerely,
Jonathan Thomas
President and Chief Executive Officer
American Century Investments
By David MacEwen, Chief Investment Officer, Fixed Income
Municipals Outpaced Treasuries
For the 12-month period ended May 31, 2013, municipal bonds (munis) posted positive performance. Munis were among the fixed income market’s leading performers for the period, outpacing U.S. Treasury securities and the broad taxable investment-grade bond benchmark (Barclays U.S. Aggregate Bond Index) in an environment of generally improving state finances and stable-to-improving credit trends. Furthermore, in the ongoing low-yield environment, muni yields looked relatively attractive, particularly to high-tax-bracket investors on an after-tax basis.
Once again, investors wavered between risk taking and risk aversion. Throughout the period, mixed economic data and political uncertainty (which emerged prior to and following November’s presidential election and as Congress debated tax policy and the federal budget) influenced market sentiment. But, overall, the modest economic gains were sufficient for risk taking to prevail, and lower-quality, higher-yielding securities drove performance in the fixed income market.
Throughout the period, demand for munis remained relatively strong and supply was generally robust, primarily due to continued refinancings from municipalities taking advantage of low interest rates. The Federal Reserve (the Fed) continued to support the low-rate environment, keeping its overnight interest rate target near 0%. In addition, the Fed launched its third and most aggressive quantitative easing program (QE3), which has the Fed purchasing $40 billion of mortgage-backed securities and $45 billion in Treasury securities each month until economic growth and employment improve.
Conditions Favored Longer-Maturity and High-Yield Munis
Against this low-rate backdrop, investors’ demand for yield led to solid results from longer-maturity and lower-quality munis, which outperformed the broad muni benchmark for the 12-month period. Additionally, May 2013 marked the 18th-consecutive month of positive performance for high-yield munis.
Volatility Likely on the Rise
In the final month of the reporting period, Treasury yields increased sharply (putting upward pressure on muni yields as well) in anticipation that the Fed may start scaling back its bond purchases later in 2013. This speculation sparked a selloff among bonds, but this spike in rates largely retraced an earlier decline in yields.
U.S. Fixed-Income Total Returns |
For the 12 months ended May 31, 2013 |
Barclays Municipal Market Indices | | Barclays U.S. Taxable Market Indices |
Municipal High Yield Bond | 11.88% | | Aggregate Bond | 0.92% |
Long-Term Municipal Bond | 4.69% | | Treasury Bond | -0.89% |
Municipal Bond | 3.05% | | |
7 Year Municipal Bond | 2.07% | | |
Total Returns as of May 31, 2013 |
| | | | Average Annual Returns | |
| | Ticker Symbol | 1 year | 5 years | 10 years | Since Inception | Inception Date |
A Class No sales charge* With sales charge* | MMBAX | 2.91% -1.71% | 5.63% 4.65% | 4.12%(1) 3.64%(1) | 5.41%(1) 5.11%(1) | 3/31/97 |
Barclays Municipal
Bond Index | — | 3.05% | 5.69% | 4.68% | 5.62% | — |
Investor Class | ACLVX | 3.17% | 5.91% | — | 5.13% | 4/3/06 |
Institutional Class | ACLSX | 3.38% | 6.10% | — | 5.32% | 4/3/06 |
C Class | ACTCX | 2.15% | 4.86% | — | 4.09% | 4/3/06 |
*Sales charges include initial sales charges and contingent deferred sales charges (CDSCs), as applicable. A Class shares have a 4.50% maximum initial sales charge and may be subject to a maximum CDSC of 1.00%. C Class shares redeemed within 12 months of purchase are subject to a maximum CDSC of 1.00%. The SEC requires that mutual funds provide performance information net of maximum sales charges in all cases where charges could be applied.
Long-Term Tax-Free acquired all the net assets of the Mason Street Municipal Bond Fund on March 31, 2006, pursuant to a plan of reorganization approved by the acquired fund’s shareholders on March 15, 2006. Performance information prior to April 1, 2006, is that of the Mason Street Municipal Bond Fund.
(1) | Returns would have been lower if a portion of the fees had not been waived. |
Data presented reflect past performance. Past performance is no guarantee of future results. Current performance may be higher or lower than the performance shown. Investment return and principal value will fluctuate, and redemption value may be more or less than original cost. To obtain performance data current to the most recent month end, please call 1-800-345-2021 or visit americancentury.com. As interest rates rise, bond values will decline. Investment income may be subject to certain state and local taxes and, depending on your tax status, the federal alternative minimum tax (AMT). Capital gains are not exempt from state and federal income tax.
Unless otherwise indicated, performance reflects A Class shares; performance for other share classes will vary due to differences in fee structure. For information about other share classes available, please consult the prospectus. Data assumes reinvestment of dividends and capital gains, and none of the charts reflect the deduction of taxes that a shareholder would pay on fund distributions or the redemption of fund shares. Returns for the index are provided for comparison. The fund’s total returns include operating expenses (such as transaction costs and management fees) that reduce returns, while the total returns of the index do not.
Growth of $10,000 Over 10 Years |
$10,000 investment made May 31, 2003* |

* | The A Class’s initial investment is $9,550 to reflect the maximum 4.50% initial sales charge. |
** | Ending value may have been lower if fees had not been waived. |
Total Annual Fund Operating Expenses |
Investor Class | Institutional Class | A Class | C Class |
0.48% | 0.28% | 0.73% | 1.48% |
The total annual fund operating expenses shown is as stated in the fund’s prospectus current as of the date of this report. The prospectus may vary from the expense ratio shown elsewhere in this report because it is based on a different time period, includes acquired fund fees and expenses, and, if applicable, does not include fee waivers or expense reimbursements.
Data presented reflect past performance. Past performance is no guarantee of future results. Current performance may be higher or lower than the performance shown. Investment return and principal value will fluctuate, and redemption value may be more or less than original cost. To obtain performance data current to the most recent month end, please call 1-800-345-2021 or visit americancentury.com. As interest rates rise, bond values will decline. Investment income may be subject to certain state and local taxes and, depending on your tax status, the federal alternative minimum tax (AMT). Capital gains are not exempt from state and federal income tax.
Unless otherwise indicated, performance reflects A Class shares; performance for other share classes will vary due to differences in fee structure. For information about other share classes available, please consult the prospectus. Data assumes reinvestment of dividends and capital gains, and none of the charts reflect the deduction of taxes that a shareholder would pay on fund distributions or the redemption of fund shares. Returns for the index are provided for comparison. The fund’s total returns include operating expenses (such as transaction costs and management fees) that reduce returns, while the total returns of the index do not.
Portfolio Managers: Alan Kruss, Joseph Gotelli, and Steven Permut
Performance Summary
Long-Term Tax-Free returned 2.91%* for the fiscal year ended May 31, 2013. By comparison, the Barclays Municipal Bond Index returned 3.05%. Fund returns reflect operating expenses, while index returns do not. (See pages 4 and 5 for additional performance comparisons.)
The fund’s absolute return for the reporting period reflected the positive performance of municipal bond (muni) indices (see page 3). See the Portfolio Positioning section for relative return factors.
Credit Environment
In general, credit trends in the muni market were stable to improving throughout the period. Muni credit-rating downgrades continued to outpace upgrades, but the overall default rate remained low. We continue to believe it’s unlikely any states will default, but select state credit ratings are likely to remain under downward pressure. Also, more downgrades and defaults may occur at the local level due to lingering effects of the slow recovery from the Great Recession.
The financial stresses at the local level were highlighted early in the period, when the California cities of Stockton, Mammoth Lakes, and San Bernardino filed for bankruptcy protection. Long-term structural budget problems led to the Stockton and San Bernardino filings, while an unfavorable legal judgment pushed Mammoth Lakes into bankruptcy. In addition, California’s elimination of certain local funding programs and state spending cuts also contributed by forcing local municipalities to deal with their financial problems with less state assistance.
We believe these incidents represent isolated events that had little impact on overall municipal credit quality. Most local governments we have reviewed remain in good financial condition despite the slow-growth economy. Meanwhile, state and local tax revenues generally increased during the reporting period, due to improving local economies and/or higher tax rates.
Portfolio Positioning
The fund’s continued emphasis on revenue bonds over general obligation (GO) bonds aided relative performance during the period. In particular, we favored essential service (such as those that finance water and sewer projects) revenue bonds, which tend to be higher-quality securities, along with transportation, and sales-tax secured bonds. These securities generally outperformed GO bonds during the fund’s fiscal year.
Security selection among lower-quality munis (those with credit ratings of BBB) slightly detracted from performance relative to the benchmark. In particular, selections within the industrial development revenue/pollution control revenue (IDR/PCR) and tobacco sectors weighed on the fund’s relative results. Meanwhile, selections within the hospital sector contributed favorably to performance.
* | All fund returns referenced in this commentary are for A Class shares and are not reduced by sales charges. A Class shares are subject to a maximum sales charge of 4.50%. Had the sales charge been applied, returns would have been lower than those shown. |
A position designed to benefit when the gap between Treasury and muni yields narrows also aided performance. At two different times—once early in the period, and once late in the period—the fund took advantage of a higher-than-normal yield ratio (greater than 100%) between 10-year Treasuries and 10-year AAA-rated munis. This strategy was effective as the yield ratio eventually returned to normal (less than 100%) and we exited the strategy.
Outlook
In the final month of the reporting period, some confusing comments from the Federal Reserve about potential reductions in its “quantitative easing” activity—a bond-buying program that has helped fuel financial market gains—sparked a selloff among most bond market sectors, particularly lower-quality, less liquid securities.
We already had been increasing exposure to more liquid, higher-quality munis. We believe if the recent selloff among risk assets continues, the fund will be well positioned to add back riskier securities at much more attractive prices. Additionally, if interest rates rise further and bond fund outflows increase, our higher-quality bias potentially can protect our investors more than a lower-quality bias. As always, we expect our fundamental credit research and risk management capabilities should continue to drive results.
MAY 31, 2013 | |
Portfolio at a Glance | |
Weighted Average Maturity | 14.1 years |
Average Duration (Modified) | 5.2 years |
| | |
Top Five Sectors | % of fund investments |
General Obligation (GO) | 25% |
Transportation Revenue | 15% |
Water/Sewer/Gas Revenue | 9% |
Hospital Revenue | 9% |
Lease/Certificate of Participation | 9% |
| | |
Top Five States and Territories | % of net assets |
California | 19.9% |
New York | 15.4% |
Texas | 7.3% |
New Jersey | 5.7% |
Puerto Rico | 5.5% |
| | |
Types of Investments in Portfolio | % of net assets |
Municipal Securities | 99.8% |
Other Assets and Liabilities | 0.2% |
Fund shareholders may incur two types of costs: (1) transaction costs, including sales charges (loads) on purchase payments and redemption/exchange fees; and (2) ongoing costs, including management fees; distribution and service (12b-1) fees; and other fund expenses. This example is intended to help you understand your ongoing costs (in dollars) of investing in your fund and to compare these costs with the ongoing cost of investing in other mutual funds.
The example is based on an investment of $1,000 made at the beginning of the period and held for the entire period from December 1, 2012 to May 31, 2013.
Actual Expenses
The table provides information about actual account values and actual expenses for each class. You may use the information, together with the amount you invested, to estimate the expenses that you paid over the period. First, identify the share class you own. Then simply divide your account value by $1,000 (for example, an $8,600 account value divided by $1,000 = 8.6), then multiply the result by the number under the heading “Expenses Paid During Period” to estimate the expenses you paid on your account during this period.
If you hold Investor Class shares of any American Century Investments fund, or Institutional Class shares of the American Century Diversified Bond Fund, in an American Century Investments account (i.e., not a financial intermediary or retirement plan account), American Century Investments may charge you a $12.50 semiannual account maintenance fee if the value of those shares is less than $10,000. We will redeem shares automatically in one of your accounts to pay the $12.50 fee. In determining your total eligible investment amount, we will include your investments in all personal accounts (including American Century Investments Brokerage accounts) registered under your Social Security number. Personal accounts include individual accounts, joint accounts, UGMA/UTMA accounts, personal trusts, Coverdell Education Savings Accounts and IRAs (including traditional, Roth, Rollover, SEP-, SARSEP- and SIMPLE-IRAs), and certain other retirement accounts. If you have only business, business retirement, employer-sponsored or American Century Investments Brokerage accounts, you are currently not subject to this fee. If you are subject to the Account Maintenance Fee, your account value could be reduced by the fee amount.
Hypothetical Example for Comparison Purposes
The table also provides information about hypothetical account values and hypothetical expenses based on the actual expense ratio of each class of your fund and an assumed rate of return of 5% per year before expenses, which is not the actual return of a fund’s share class. The hypothetical account values and expenses may not be used to estimate the actual ending account balance or expenses you paid for the period. You may use this information to compare the ongoing costs of investing in your fund and other funds. To do so, compare this 5% hypothetical example with the 5% hypothetical examples that appear in the shareholder reports of the other funds.
Please note that the expenses shown in the table are meant to highlight your ongoing costs only and do not reflect any transactional costs, such as sales charges (loads) or redemption/exchange fees. Therefore, the table is useful in comparing ongoing costs only, and will not help you determine the relative total costs of owning different funds. In addition, if these transactional costs were included, your costs would have been higher.
| | | | | |
| | Beginning
Account Value
12/1/12 | Ending
Account Value
5/31/13 | Expenses Paid During Period(1) 12/1/12 – 5/31/13 | Annualized
Expense Ratio(1) |
Actual |
Investor Class | $1,000 | $985.20 | $2.33 | 0.47% |
Institutional Class | $1,000 | $985.30 | $1.34 | 0.27% |
A Class | $1,000 | $983.10 | $3.56 | 0.72% |
C Class | $1,000 | $980.30 | $7.26 | 1.47% |
Hypothetical |
Investor Class | $1,000 | $1,022.59 | $2.37 | 0.47% |
Institutional Class | $1,000 | $1,023.59 | $1.36 | 0.27% |
A Class | $1,000 | $1,021.34 | $3.63 | 0.72% |
C Class | $1,000 | $1,017.60 | $7.39 | 1.47% |
(1) | Expenses are equal to the class’s annualized expense ratio listed in the table above, multiplied by the average account value over the period, multiplied by 182, the number of days in the most recent fiscal half-year, divided by 365, to reflect the one-half year period. |
MAY 31, 2013
| | | | | | | |
| | | Principal Amount | | | Value | |
Municipal Securities — 99.8% | |
ALABAMA — 0.9% | |
East Alabama Health Care Facilities Authority Rev., Series 2008 B, VRDN, 5.00%, 9/1/13, Prerefunded at 100% of Par(1) | | $ 500,000 | | | $505,940 | |
Eutaw Industrial Development Board Pollution Control Rev., (Mississippi Power Co.), VRDN, 0.13%, 6/3/13 | | 300,000 | | | 300,000 | |
| | | | | | 805,940 | |
ARIZONA — 2.4% | |
Arizona Department of Transportation State Highway Fund Rev., Series 2011 A, (Sub Highway Revenue), 5.00%, 7/1/22 | | 100,000 | | | 120,673 | |
Arizona Transportation Board Rev., 4.00%, 7/1/15 | | 500,000 | | | 538,555 | |
City of Mesa Excise Tax Rev., 5.00%, 7/1/27 | | 100,000 | | | 111,244 | |
Mohave County Industrial Development Authority Correctional Facilities Contract Rev., (Mohave Prison, LLC Expansion), 8.00%, 5/1/25 | | 200,000 | | | 253,588 | |
Phoenix Civic Improvement Corp. Airport Rev., Series 2010 A, (Junior Lien), 5.00%, 7/1/40 | | 50,000 | | | 53,614 | |
Phoenix Civic Improvement Corp. Wastewater System Rev., (Senior Lien), 5.50%, 7/1/24 | | 250,000 | | | 299,097 | |
Salt River Project Agricultural Improvement & Power District Rev., Series 2009 A, (Electric System Distribution), 5.00%, 1/1/39 | | 340,000 | | | 378,852 | |
University Medical Center Corp. Rev., 6.50%, 7/1/39 | | 300,000 | | | 343,002 | |
| | | | | | 2,098,625 | |
CALIFORNIA — 19.9% | |
Alameda Corridor Transportation Authority Rev., Capital Appreciation, Series 1999 A, 0.00%, 10/1/32 (NATL-RE)(2) | | 440,000 | | | 182,120 | |
Anaheim Public Financing Authority Rev., (Electric System Distribution), 5.25%, 10/1/34 | | 200,000 | | | 229,294 | |
Bay Area Toll Authority Toll Bridge Rev., (San Francisco Bay Area), 5.00%, 4/1/26 | | 100,000 | | | 117,536 | |
Bay Area Toll Authority Toll Bridge Rev., Series 2006 F, (San Francisco Bay Area), 5.00%, 4/1/16, Prerefunded at 100% of Par(1) | | 270,000 | | | 303,974 | |
Bay Area Toll Authority Toll Bridge Rev., Series 2007 A1, (San Francisco Bay Area), VRDN, 0.82%, 6/6/13 | | 200,000 | | | 201,578 | |
Bay Area Toll Authority Toll Bridge Rev., Series 2008 F1, (San Francisco Bay Area), 5.00%, 4/1/39 | | 300,000 | | | 328,452 | |
Bay Area Toll Authority Toll Bridge Rev., Series 2009 F1, (San Francisco Bay Area), 5.125%, 4/1/39 | | 200,000 | | | 224,184 | |
California Department of Water Resources Power Supply Rev., Series 2005 G4, 5.00%, 5/1/16 | | 100,000 | | | 113,050 | |
California Department of Water Resources Power Supply Rev., Series 2008 H, 5.00%, 5/1/22 | | 120,000 | | | 139,885 | |
California Economic Recovery GO, Series 2009 B, VRDN, 5.00%, 7/1/14 | | 690,000 | | | 724,776 | |
California Educational Facilities Authority Rev., Series 2012 U-2, (Stanford University), 5.00%, 10/1/32 | | 300,000 | | | 379,641 | |
California GO, 5.00%, 3/1/15 | | 500,000 | | | 539,540 | |
California GO, 5.00%, 9/1/16 | | 250,000 | | | 283,685 | |
California GO, 4.00%, 9/1/18 | | 400,000 | | | 455,900 | |
California GO, 5.00%, 9/1/24 | | 200,000 | | | 236,912 | |
California GO, 5.00%, 6/1/25 | | 130,000 | | | 137,994 | |
California GO, 5.00%, 9/1/25 | | 150,000 | | | 171,375 | |
California GO, 5.625%, 4/1/26 | | 500,000 | | | 587,050 | |
California GO, 5.75%, 4/1/27 | | 500,000 | | | 587,310 | |
California GO, 5.00%, 2/1/28 (Ambac) | | 335,000 | | | 403,601 | |
California GO, 5.75%, 4/1/28 | | 500,000 | | | 585,160 | |
California GO, 5.25%, 9/1/28 | | 200,000 | | | 232,582 | |
California GO, 5.00%, 10/1/29 | | 200,000 | | | 221,326 | |
California GO, 5.00%, 10/1/41 | | 100,000 | | | 108,535 | |
California GO, 5.00%, 2/1/43 | | 250,000 | | | 273,540 | |
California GO, Series 2012 B, VRN, 1.27%, 6/6/13 | | 200,000 | | | 203,438 | |
California Health Facilities Financing Authority Rev., Series 2008 C, (Providence Health & Services), 6.50%, 10/1/18, Prerefunded at 100% of Par(1) | | $ 10,000 | | | $12,791 | |
California Health Facilities Financing Authority Rev., Series 2008 C, (Providence Health & Services), 6.50%, 10/1/38 | | 245,000 | | | 294,010 | |
California Health Facilities Financing Authority Rev., Series 2009 A, (Catholic Healthcare West), 6.00%, 7/1/39 | | 300,000 | | | 356,763 | |
California Health Facilities Financing Authority Rev., Series 2011 D, (Sutter Health), 5.25%, 8/15/31 | | 150,000 | | | 171,972 | |
California Health Facilities Financing Authority Rev., Series 2012 A, (Scripps Health), 5.00%, 11/15/40 | | 200,000 | | | 218,500 | |
California Infrastructure & Economic Development Bank Rev., Series 2012 B1, (J. Paul Getty Trust), VRDN, 0.42%, 6/6/13 | | 750,000 | | | 750,810 | |
California Municipal Finance Authority Rev., (Emerson College), 5.00%, 1/1/28 | | 275,000 | | | 306,966 | |
California Public Works Board Lease Rev., Series 2005 A, (Department of General Services - Butterfield), 5.00%, 6/1/15 | | 110,000 | | | 119,703 | |
California Public Works Board Lease Rev., Series 2011 D, (Judicial Council Projects), 5.00%, 12/1/31 | | 500,000 | | | 546,845 | |
California Public Works Board Lease Rev., Series 2012 A, (Various Capital Projects), 5.00%, 4/1/37 | | 400,000 | | | 427,500 | |
California Public Works Board Lease Rev., Series 2012 G, (Various Capital Projects), 5.00%, 11/1/37 | | 200,000 | | | 214,504 | |
California Statewide Communities Development Authority Rev., (Proposition 1A Receivables), 5.00%, 6/15/13 | | 750,000 | | | 751,395 | |
California Statewide Communities Development Authority Rev., Series 2009 A, (Kaiser Permanente), 5.00%, 4/1/16 | | 250,000 | | | 280,480 | |
California University Systemwide Rev., Series 2009 A, 5.25%, 11/1/34 | | 300,000 | | | 337,341 | |
Chaffey Community College District GO, Series 2007 C, (Election of 2002), 5.00%, 6/1/32 (NATL-RE) | | 265,000 | | | 291,725 | |
Chula Vista Rev., Series 2006 A, (San Diego Gas and Electric), 1.65%, 7/1/18 | | 300,000 | | | 303,090 | |
Golden State Tobacco Securitization Corp. Settlement Rev., Series 2013 A, 5.00%, 6/1/30 | | 100,000 | | | 110,652 | |
Long Beach Bond Finance Authority Natural Gas Purchase Rev., Series 2007 A, 5.00%, 11/15/35 | | 200,000 | | | 225,638 | |
Los Angeles Department of Airports Rev., Series 2010 A, (Los Angeles International Airport), 5.00%, 5/15/40 | | 120,000 | | | 133,175 | |
Los Angeles Department of Airports Rev., Series 2010 B, (Los Angeles International Airport), 5.00%, 5/15/21 | | 250,000 | | | 296,525 | |
Los Angeles Department of Water & Power Rev., Series 2008 A1, (Power System), 5.25%, 7/1/38 | | 400,000 | | | 448,560 | |
Los Angeles Department of Water & Power Waterworks Rev., Series 2011 A, 5.00%, 7/1/36 | | 150,000 | | | 166,290 | |
Los Angeles Unified School District GO, Series 2011 A2, 5.00%, 7/1/21 | | 300,000 | | | 370,020 | |
Metropolitan Water District of Southern California Rev., Series 2009 C, 5.00%, 7/1/35 | | 100,000 | | | 113,614 | |
Northern California Power Agency Rev., Series 2009 A, (Geothermal Project No. 3), 5.25%, 7/1/24 | | 200,000 | | | 229,518 | |
Palomar Pomerado Health Care District COP, 6.00%, 11/1/41 | | 250,000 | | | 269,413 | |
Poway Unified School District Rev., Capital Appreciation, (School Facilities Improvement), 0.00%, 8/1/41(2) | | 500,000 | | | 126,235 | |
San Bernardino Community College District GO, Series 2008 A, (Election of 2002), 6.25%, 8/1/18, Prerefunded at 100% of Par(1) | | 290,000 | | | 367,158 | |
San Buenaventura Rev., (Community Memorial Health System), 7.50%, 12/1/41 | | $ 100,000 | | | $121,826 | |
San Diego County Regional Transportation Commission Rev., Series 2012 A, 5.00%, 4/1/48 | | 150,000 | | | 166,872 | |
San Diego Public Facilities Financing Sewer Authority Rev., Series 2010 A, 5.25%, 5/15/24 | | 50,000 | | | 59,489 | |
San Diego Public Facilities Financing Water Authority Rev., Series 2010 A, 5.00%, 8/1/23 | | 70,000 | | | 83,658 | |
San Diego Unified School District GO, Capital Appreciation, Series 2012 R-1, 0.00%, 7/1/30(2) | | 200,000 | | | 95,486 | |
Tuolumne Wind Project Authority Rev., Series 2009 A, 5.875%, 1/1/29 | | 250,000 | | | 295,640 | |
Yosemite Community College District GO, Capital Appreciation, Series 2010 D, (Election of 2004), 0.00%, 8/1/38(2) | | 1,000,000 | | | 296,100 | |
| | | | | | 17,332,702 | |
COLORADO — 2.1% | |
Colorado Educational & Cultural Facilities Authority Rev., Series 2008 A12, (National Jewish Federation Bond), VRDN, 0.10%, 6/3/13 (LOC: Bank of America N.A.) | | 300,000 | | | 300,000 | |
Colorado Health Facilities Authority Rev., Series 2008 D, (Catholic Health Initiatives), 6.25%, 10/1/33 | | 240,000 | | | 286,354 | |
Denver City and County Airport Rev., Series 2012 B, 5.00%, 11/15/25 | | 250,000 | | | 294,757 | |
Regional Transportation District Rev., Series 2012 A, (Fastracks Project), 5.00%, 11/1/25 | | 200,000 | | | 239,150 | |
Regional Transportation District Rev., Series 2012 A, (Fastracks Project), 5.00%, 11/1/26 | | 200,000 | | | 237,256 | |
Regional Transportation District Private Activity Rev., (Denver Transit Partners), 6.00%, 1/15/41 | | 220,000 | | | 250,745 | |
University of Colorado Enterprise System Rev., Series 2009 A, 5.25%, 6/1/30 | | 200,000 | | | 232,220 | |
| | | | | | 1,840,482 | |
CONNECTICUT — 2.0% | |
Connecticut GO, Series 2012 A, VRDN, 0.34%, 6/6/13 | | 1,000,000 | | | 1,001,830 | |
Connecticut GO, Series 2012 E, 5.00%, 9/15/26 | | 200,000 | | | 237,396 | |
Connecticut Health & Educational Facilities Authority Rev., Series 2007 I, (Quinnipiac University), 5.00%, 7/1/17 (NATL-RE) | | 200,000 | | | 227,242 | |
Connecticut Health & Educational Facilities Authority Rev., Series 2010 A3, (Yale University), VRDN, 0.875%, 2/8/18 | | 300,000 | | | 298,839 | |
| | | | | | 1,765,307 | |
DELAWARE — 0.1% | |
New Castle County GO, Series 2009 A, 5.00%, 7/15/27 | | 100,000 | | | 116,271 | |
DISTRICT OF COLUMBIA — 1.5% | |
District of Columbia Rev., Series 2011 G, (Income Tax Secured), 5.00%, 12/1/36 | | 300,000 | | | 337,416 | |
District of Columbia Water & Sewer Authority Public Utility Rev., Series 2012 B1, VRDN, 0.60%, 6/6/13 | | 500,000 | | | 500,450 | |
Washington Metropolitan Area Transit Authority Rev., Series 2009 A, 5.00%, 7/1/17 | | 400,000 | | | 462,560 | |
| | | | | | 1,300,426 | |
FLORIDA — 3.6% | |
Broward County Airport System Rev., Series 2012 Q-1, 5.00%, 10/1/24 | | 100,000 | | | 116,150 | |
Broward County School Board COP, Series 2012 A, 5.00%, 7/1/26 | | 200,000 | | | 228,010 | |
Citizens Property Insurance Corp. Rev., Series 2010 A1, (Second High Risk Notes), 5.25%, 6/1/17 | | 200,000 | | | 231,312 | |
Citizens Property Insurance Corp. Rev., Series 2012 A1, (Senior Secured), 5.00%, 6/1/18 | | 300,000 | | | 349,575 | |
Florida Board of Education Capital Outlay GO, Series 2007 G, 4.75%, 6/1/37 (NATL-RE) | | 250,000 | | | 275,733 | |
Florida Board of Education Capital Outlay GO, Series 2011 B, 5.125%, 6/1/40 | | 300,000 | | | 332,187 | |
Lee County School Board COP, Series 2012 B, 5.00%, 8/1/17 | | 200,000 | | | 230,224 | |
Miami-Dade County Rev., Series 2012 B, 5.00%, 10/1/37 | | 100,000 | | | 108,899 | |
Miami-Dade County Educational Facilities Authority Rev., Series 2008 A, (University of Miami), 5.50%, 4/1/38 | | $ 200,000 | | | $218,272 | |
Miami-Dade County Transit Sales Surtax Rev., (Sales Tax), 5.00%, 7/1/42 | | 250,000 | | | 271,555 | |
Orlando & Orange County Expressway Authority Rev., Series 2010 A, 5.00%, 7/1/40 | | 85,000 | | | 91,800 | |
Orlando Utilities Commission System Rev., Series 2009 B, 5.00%, 10/1/33 | | 210,000 | | | 242,953 | |
St. Petersburg Health Facilities Authority Rev., Series 2009 A, (All Children’s Health Facilities), 6.50%, 11/15/39 | | 300,000 | | | 351,312 | |
Tampa Bay Water Regional Water Supply Authority Utility System Rev., Series 2011 A, 5.00%, 10/1/17 | | 100,000 | | | 117,141 | |
| | | | | | 3,165,123 | |
GEORGIA — 1.9% | |
Atlanta Airport Rev., Series 2010 C, 5.75%, 1/1/23 | | 250,000 | | | 303,590 | |
Atlanta Airport Rev., Series 2010 C, 5.25%, 1/1/30 | | 200,000 | | | 226,186 | |
Burke County Development Authority Rev., (Georgia Power Co. Plant Vogtle Project), VRDN, 1.75%, 6/1/17 | | 100,000 | | | 102,405 | |
Burke County Development Authority Rev., (Georgia Power Co. Plant Vogtle Project), VRDN, 1.75%, 6/1/17 | | 100,000 | | | 102,405 | |
Floyd County Development Authority Rev., (Power Company Plant Hammond), VRDN, 0.85%, 11/19/15 | | 200,000 | | | 201,148 | |
Georgia GO, Series 2013 C, 5.00%, 10/1/20 | | 250,000 | | | 309,075 | |
Metropolitan Atlanta Rapid Transit Authority Rev., Series 2009 A, (Third Indenture), 5.00%, 7/1/39 | | 400,000 | | | 447,592 | |
| | | | | | 1,692,401 | |
GUAM — 0.7% | |
Guam Government Business Privilege Tax Rev., Series 2011 A, 5.00%, 1/1/31 | | 150,000 | | | 164,628 | |
Guam Government GO, Series 2009 A, 6.75%, 11/15/29 | | 250,000 | | | 277,512 | |
Guam Power Authority Rev., Series 2012 A, 5.00%, 10/1/34 | | 150,000 | | | 163,287 | |
| | | | | | 605,427 | |
HAWAII — 0.4% | |
Hawaii Pacific Health Special Purpose Rev., Series 2010 B, 5.75%, 7/1/40 | | 200,000 | | | 222,504 | |
Honolulu City and County Wastewater System Rev., Series 2012 A, (First Bond Resolution), 5.00%, 7/1/26 | | 100,000 | | | 118,371 | |
| | | | | | 340,875 | |
IDAHO — 0.3% | |
Idaho Health Facilities Authority Rev., (St. Luke’s Regional Medical Center), 5.00%, 7/1/35 (AGM) | | 250,000 | | | 269,515 | |
ILLINOIS — 4.5% | |
Chicago Board of Education GO, Series 2010 F, 5.00%, 12/1/14 | | 200,000 | | | 213,730 | |
Chicago Board of Education GO, Series 2010 F, 5.00%, 12/1/15 | | 200,000 | | | 221,702 | |
Chicago Board of Education GO, Series 2010 F, 5.00%, 12/1/16 | | 200,000 | | | 227,812 | |
Chicago Metropolitan Water Reclamation District GO, Series 2007 C, 5.25%, 12/1/32 | | 250,000 | | | 308,840 | |
Chicago Sales Tax Rev., Series 2011 A, 5.25%, 1/1/38 | | 100,000 | | | 111,892 | |
Chicago Waterworks Rev., 5.00%, 11/1/42 | | 200,000 | | | 219,424 | |
Cook County GO, Series 2011 A, 5.25%, 11/15/28 | | 200,000 | | | 230,720 | |
Illinois Finance Authority Rev., Series 2008 D, (Advocate Health Care Network), 6.25%, 11/1/28 | | 200,000 | | | 237,806 | |
Illinois GO, 5.00%, 1/1/15 | | 295,000 | | | 313,995 | |
Illinois GO, 5.00%, 1/1/17 (AGM) | | 200,000 | | | 224,814 | |
Illinois GO, 5.00%, 3/1/37 | | 100,000 | | | 104,201 | |
Illinois GO, Series 2006 A, 5.00%, 6/1/13 | | 475,000 | | | 475,000 | |
Metropolitan Pier & Exposition Authority Rev., Series 2010 B2, (McCormick Place Expansion), 5.00%, 6/15/50 | | 250,000 | | | 265,595 | |
Railsplitter Tobacco Settlement Authority Rev., 5.00%, 6/1/15 | | 250,000 | | | 270,550 | |
Railsplitter Tobacco Settlement Authority Rev., 5.00%, 6/1/17 | | 150,000 | | | 170,868 | |
Railsplitter Tobacco Settlement Authority Rev., 6.00%, 6/1/28 | | $ 250,000 | | | $298,575 | |
| | | | | | 3,895,524 | |
INDIANA — 0.5% | |
Indiana Bond Bank Rev., Series 2006 A, (Special Program), 5.00%, 8/1/20 (AGM) | | 250,000 | | | 282,525 | |
Indiana Finance Authority Wastewater Utility Rev., Series 2011 A, (First Lien), 5.25%, 10/1/25 | | 100,000 | | | 119,117 | |
| | | | | | 401,642 | |
KANSAS — 0.9% | |
Kansas State Department of Transportation Highway Rev., Series 2012 A2, VRN, 0.35%, 6/6/13 | | 500,000 | | | 500,665 | |
Valdez Marine Terminal Rev., Series 2003 C, (BP Pipelines, Inc.), 5.00%, 1/1/21 (GA: BP PLC) | | 200,000 | | | 238,836 | |
| | | | | | 739,501 | |
KENTUCKY — 0.8% | |
Kentucky Asset/Liability Commission Agency Fund Rev., Series 2010 A, (Federal Highway Trust), 5.00%, 9/1/20 | | 135,000 | | | 163,399 | |
Kentucky Property & Buildings Community Rev., 5.50%, 11/1/28 | | 250,000 | | | 290,840 | |
Kentucky Turnpike Authority Economic Development Road Rev., Series 2008 A, (Revitalization), 5.00%, 7/1/17 | | 240,000 | | | 279,576 | |
| | | | | | 733,815 | |
LOUISIANA — 0.9% | |
Louisiana Gasoline & Fuels Tax Rev., Series 2013 B1, (Second Lien), VRDN, 0.61%, 7/1/13 | | 500,000 | | | 500,050 | |
Louisiana GO, Series 2013 C, 5.00%, 7/15/26 | | 200,000 | | | 240,386 | |
| | | | | | 740,436 | |
MARYLAND — 0.2% | |
Maryland Economic Development Corp. Student Housing Rev., (University of Maryland, College Park), 5.00%, 6/1/19 | | 150,000 | | | 167,189 | |
MASSACHUSETTS — 3.4% | |
Massachusetts Bay Transportation Authority Rev., Series 2008 A, (Assessment Bonds), 5.25%, 7/1/34 | | 200,000 | | | 228,770 | |
Massachusetts Bay Transportation Authority Rev., Series 2012 A, (Assessment Bonds), 5.00%, 7/1/41 | | 150,000 | | | 168,305 | |
Massachusetts Development Finance Agency Rev., (Suffolk University), 5.125%, 7/1/40 | | 250,000 | | | 266,477 | |
Massachusetts GO, Series 2008 A, (Consolidated Loan), 5.00%, 8/1/24 | | 200,000 | | | 232,642 | |
Massachusetts GO, Series 2012 A, VRN, 0.37%, 6/6/13 | | 200,000 | | | 200,064 | |
Massachusetts GO, Series 2013 A, 5.00%, 4/1/19 | | 400,000 | | | 481,328 | |
Massachusetts Health & Educational Facilities Authority Rev., Series 2009 A, (Harvard University), 5.50%, 11/15/36(3) | | 200,000 | | | 237,158 | |
Massachusetts Port Authority Rev., Series 2012 B, 5.00%, 7/1/19 | | 250,000 | | | 300,132 | |
Massachusetts Port Authority Rev., Series 2012 B, 5.00%, 7/1/33 | | 250,000 | | | 283,430 | |
Massachusetts School Building Authority Sales Tax Rev., Series 2012 A, (Senior Lien), 5.00%, 8/15/30 | | 250,000 | | | 290,932 | |
Massachusetts School Building Authority Sales Tax Rev., Series 2012 B, 5.00%, 8/15/30 | | 100,000 | | | 116,373 | |
Massachusetts Water Resources Authority Rev., Series 2011 C, 5.25%, 8/1/42 | | 150,000 | | | 171,881 | |
| | | | | | 2,977,492 | |
MICHIGAN — 1.7% | |
Detroit City School District GO, Series 2012 A, (Building & Site), 5.00%, 5/1/31 (Q-SBLF) | | 250,000 | | | 276,987 | |
Detroit Water and Sewerage Department Disposal Sewage System Rev., Series 2012 A, (Senior Lien), 5.25%, 7/1/26 | | 100,000 | | | 111,048 | |
Detroit Water and Sewerage Department Disposal Sewage System Rev., Series 2012 A, (Senior Lien), 5.00%, 7/1/32 | | 250,000 | | | 263,710 | |
Detroit Water and Sewerage Department Disposal Sewage System Rev., Series 2012 A, (Senior Lien), 5.25%, 7/1/39 | | 425,000 | | | 453,598 | |
Detroit Water Supply System Rev., Series 2011 C, (Senior Lien), 5.00%, 7/1/41 | | 150,000 | | | 154,722 | |
Michigan Finance Authority Rev., (Detroit School District), 5.50%, 6/1/21 | | $ 150,000 | | | $176,255 | |
| | | | | | 1,436,320 | |
MINNESOTA — 0.6% | |
Minneapolis-St. Paul Metropolitan Airports Commission Rev., Series 2007 B, 5.00%, 1/1/25 (NATL-RE/FGIC) | | 300,000 | | | 334,548 | |
Minnesota GO, 5.00%, 6/1/18 | | 200,000 | | | 225,548 | |
| | | | | | 560,096 | |
MISSISSIPPI — 0.3% | |
Mississippi Development Bank Special Obligation Rev., (Marshall County Industrial Development Authority), 5.00%, 1/1/27 | | 250,000 | | | 286,870 | |
MISSOURI — 0.3% | |
Missouri Health & Educational Facilities Authority Rev., Series 2008 A, (Washington University), 5.375%, 3/15/39 | | 250,000 | | | 288,033 | |
NEBRASKA — 0.2% | |
Nebraska Public Power District Rev., Series 2008 B, 5.00%, 1/1/24 | | 150,000 | | | 172,056 | |
NEVADA — 0.5% | |
Clark County Airport System Rev., Series 2008 E, 5.00%, 7/1/14 | | 200,000 | | | 209,968 | |
Nevada GO, Series 2013 D1, 5.00%, 3/1/22 | | 200,000 | | | 243,228 | |
| | | | | | 453,196 | |
NEW JERSEY — 5.7% | |
Monmouth County GO, (County College Bonds), 4.00%, 9/15/19 | | 250,000 | | | 277,645 | |
New Jersey Economic Development Authority Rev., 5.00%, 6/15/15 | | 250,000 | | | 270,770 | |
New Jersey Economic Development Authority Rev., Series 2011 EE, (School Facilities Construction), 5.00%, 9/1/23 | | 70,000 | | | 81,622 | |
New Jersey Educational Facilities Authority Rev., Series 2012 B, (Rampano College), 5.00%, 7/1/37 | | 200,000 | | | 221,116 | |
New Jersey GO, 5.00%, 6/1/17 | | 200,000 | | | 232,412 | |
New Jersey GO, Series 2010 Q, 5.00%, 8/15/15 | | 250,000 | | | 275,337 | |
New Jersey Health Care Facilities Financing Authority Rev., (Hackensack University Medical Center), 5.00%, 1/1/34 | | 200,000 | | | 209,874 | |
New Jersey Health Care Facilities Financing Authority Rev., (The Robert Wood Johnson Foundation), 5.00%, 7/1/31 | | 200,000 | | | 217,804 | |
New Jersey Health Care Facilities Financing Authority Rev., Series 2012 A, (Saint Barnabas Corp.), 5.00%, 7/1/24 | | 200,000 | | | 228,856 | |
New Jersey Institute of Technology Rev., Series 2012 A, 5.00%, 7/1/42 | | 200,000 | | | 221,770 | |
New Jersey Sports & Exposition Authority Rev., Series 2008 B, 5.00%, 9/1/18 | | 150,000 | | | 175,208 | |
New Jersey State Turnpike Authority Rev., Series 2009 H, 5.00%, 1/1/36 | | 250,000 | | | 269,718 | |
New Jersey Transportation Trust Fund Authority Rev., Series 2005 B, 5.50%, 12/15/21 (NATL-RE) | | 400,000 | | | 495,924 | |
New Jersey Transportation Trust Fund Authority Rev., Series 2006 A, 5.25%, 12/15/20 (AGM) | | 225,000 | | | 275,252 | |
New Jersey Transportation Trust Fund Authority Rev., Series 2006 A, 5.25%, 12/15/20 | | 250,000 | | | 305,442 | |
New Jersey Transportation Trust Fund Authority Rev., Series 2006 A, 5.25%, 12/15/21 (NATL-RE) | | 210,000 | | | 256,326 | |
New Jersey Transportation Trust Fund Authority Rev., Series 2006 A, 5.25%, 12/15/22 (AGM) | | 100,000 | | | 121,773 | |
New Jersey Transportation Trust Fund Authority Rev., Series 2010 D, 5.25%, 12/15/23 | | 275,000 | | | 335,794 | |
New Jersey Transportation Trust Fund Authority Rev., Series 2010 D, 5.00%, 12/15/24 | | 265,000 | | | 318,294 | |
New Jersey Transportation Trust Fund Authority Rev., Capital Appreciation, Series 2010 A, 0.00%, 12/15/31(2) | | 400,000 | | | 174,816 | |
| | | | | | 4,965,753 | |
NEW YORK — 15.4% | |
Hudson Yards Infrastructure Corp. Rev., Series 2011 A, 5.75%, 2/15/47 | | $ 55,000 | | | $63,542 | |
Long Island Power Authority Electric System Rev., Series 2006 F, 5.00%, 5/1/17 (NATL-RE) | | 425,000 | | | 484,712 | |
Long Island Power Authority Electric System Rev., Series 2008 A, 6.00%, 5/1/33 | | 250,000 | | | 297,360 | |
Long Island Power Authority Electric System Rev., Series 2008 B, 5.25%, 4/1/19 (AGC-ICC) | | 150,000 | | | 177,166 | |
Metropolitan Transportation Authority Rev., Series 2005 G, 5.00%, 11/15/19 | | 250,000 | | | 298,110 | |
Metropolitan Transportation Authority Rev., Series 2008 C, 6.50%, 11/15/28 | | 250,000 | | | 309,785 | |
Metropolitan Transportation Authority Rev., Series 2012 C, 5.00%, 11/15/41 | | 300,000 | | | 325,017 | |
Metropolitan Transportation Authority Rev., Series 2012 E, 5.00%, 11/15/42 | | 250,000 | | | 270,437 | |
New York City GO, Series 2013 F1, 5.00%, 3/1/37 | | 100,000 | | | 112,868 | |
New York City GO, Series 2013 J, 5.00%, 8/1/23(4) | | 250,000 | | | 305,965 | |
New York City Municipal Water Finance Authority Rev., Series 2012 BB 5.00%, 6/15/47 | | 600,000 | | | 654,816 | |
New York City Municipal Water Finance Authority Water & Sewer Rev., Series 2009 GG-1, (Second General Resolution), 5.00%, 6/15/39 | | 70,000 | | | 76,800 | |
New York City Municipal Water Finance Authority Water & Sewer System Rev., Series 2004 C, 5.00%, 6/15/14, Prerefunded at 100% of Par(1) | | 15,000 | | | 15,728 | |
New York City Municipal Water Finance Authority Water & Sewer System Rev., Series 2004 C, 5.00%, 6/15/35 | | 235,000 | | | 244,212 | |
New York City Municipal Water Finance Authority Water & Sewer System Rev., Series 2011 GG, (Second General Resolution), 5.00%, 6/15/43 | | 250,000 | | | 273,417 | |
New York City Transitional Finance Authority Rev., Series 2009 S4, 5.50%, 1/15/39 | | 300,000 | | | 347,526 | |
New York City Transitional Finance Authority Rev., Series 2011 1A, 5.00%, 7/15/25 | | 150,000 | | | 175,766 | |
New York City Transitional Finance Authority Rev., Series 2011 C, (Future Tax Secured Bonds), 5.00%, 11/1/39 | | 200,000 | | | 221,162 | |
New York City Transitional Finance Authority Rev., Series 2013 F1, (Future Tax Secured), 5.00%, 2/1/28 | | 200,000 | | | 233,798 | |
New York GO, Series 2009 A, 5.00%, 2/15/39 | | 300,000 | | | 339,963 | |
New York GO, Series 2009 C, 5.00%, 8/1/23 | | 500,000 | | | 586,480 | |
New York GO, Series 2009 E, 5.00%, 8/1/16 | | 400,000 | | | 453,512 | |
New York Liberty Development Corp. Rev., (Goldman Sachs Headquarters), 5.25%, 10/1/35 | | 460,000 | | | 536,503 | |
New York Liberty Development Corp. Rev., (World Trade Center), 5.125%, 11/15/44 | | 100,000 | | | 108,562 | |
New York State Dormitory Authority Personal Income Tax Rev., Series 2012 A, (General Purpose), 5.00%, 12/15/25 | | 200,000 | | | 238,580 | |
New York State Dormitory Authority Rev., (Columbia University), 4.00%, 7/1/13(1) | | 250,000 | | | 250,790 | |
New York State Dormitory Authority Rev., (Mental Health Services Facilities Improvement), 5.50%, 2/15/18 | | 300,000 | | | 359,091 | |
New York State Dormitory Authority Rev., Series 2009 A, (North Shore Long Island Jewish Health System), 5.50%, 5/1/37 | | 250,000 | | | 279,407 | |
New York State Dormitory Authority Rev., Series 2010 A, (Mount Sinai School of Medicine), 5.00%, 7/1/14 | | 400,000 | | | 418,976 | |
New York State Dormitory Authority Rev., Series 2012 A, (State University of New York), 5.00%, 7/1/42 | | 100,000 | | | 111,789 | |
New York State Dormitory Authority Rev., Series 2012 D, (General Purpose), 5.00%, 2/15/27 | | 300,000 | | | 349,530 | |
New York State Dormitory Authority State Personal Income Tax Rev., Series 2008 A, (General Purpose), 5.00%, 3/15/19 | | $ 300,000 | | | $353,061 | |
New York State Environmental Facilities Corp. Rev., Series 2009 A, 5.125%, 6/15/38 | | 280,000 | | | 321,720 | |
New York State Power Authority Rev., Series 2011 A, 5.00%, 11/15/38 | | 200,000 | | | 225,298 | |
New York State Thruway Authority Rev., Series 2012 A, (Local Highway & Bridge), 4.00%, 4/1/14 | | 500,000 | | | 515,875 | |
New York State Urban Development Corp. Rev., Series 2009 C, (State Personal Income Tax), 5.00%, 12/15/15 | | 120,000 | | | 134,022 | |
New York State Urban Development Corp. Rev., Series 2013 A1, (State Personal Income Tax), 5.00%, 3/15/28 | | 100,000 | | | 116,621 | |
New York Urban Development Corp. State Personal Income Tax Rev., Series 2008 A1, (Economic Development & Housing), 5.00%, 12/15/22 | | 340,000 | | | 394,828 | |
Niagara Area Development Corp. Solid Waste Disposal Facility Rev., Series 2012 B, (Covanta Holding Corp.), 4.00%, 11/1/24 | | 100,000 | | | 102,398 | |
Port Authority of New York & New Jersey Special Obligation Rev., (John F. Kennedy International Airport Terminal), 6.00%, 12/1/42 | | 250,000 | | | 291,040 | |
Tobacco Settlement Financing Corp. Rev., Series 2011 A, 5.00%, 6/1/17 | | 360,000 | | | 416,254 | |
Tobacco Settlement Financing Corp. Rev., Series 2011 A, 5.00%, 6/1/18 | | 305,000 | | | 359,827 | |
Triborough Bridge & Tunnel Authority Rev., Series 2008 B3, VRDN, 5.00%, 11/15/15 | | 350,000 | | | 386,848 | |
Triborough Bridge & Tunnel Authority Rev., Series 2008 C, 5.00%, 11/15/38 | | 200,000 | | | 222,126 | |
Triborough Bridge & Tunnel Authority Rev., Series 2011 A, 5.00%, 1/1/28 | | 200,000 | | | 231,624 | |
Triborough Bridge & Tunnel Authority Rev., Series 2012 B, 4.00%, 11/15/18 | | 200,000 | | | 229,930 | |
Triborough Bridge & Tunnel Authority Rev., Capital Appreciation, Series 2012 B, 0.00%, 11/15/32(2) | | 500,000 | | | 242,180 | |
| | | | | | 13,465,022 | |
NORTH CAROLINA — 3.1% | |
Charlotte-Mecklenburg Hospital Authority Rev., Series 2012 A, 5.00%, 1/15/43 | | 250,000 | | | 272,735 | |
North Carolina Eastern Municipal Power Agency Rev., Series 2008 C, 6.75%, 1/1/24 | | 250,000 | | | 305,005 | |
North Carolina Eastern Municipal Power Agency Rev., Series 2009 B, 5.00%, 1/1/26 | | 200,000 | | | 222,866 | |
North Carolina GO, Series 2013 C, 5.00%, 5/1/24 | | 225,000 | | | 285,050 | |
North Carolina Grant Anticipation Rev., VRDN, 4.00%, 3/1/18 | | 200,000 | | | 223,330 | |
North Carolina Medical Care Commission Facilities Rev., Series 2012 A, (Duke University Health System), 5.00%, 6/1/42 | | 300,000 | | | 332,895 | |
North Carolina Medical Care Commission Health Care Facilities Rev., Series 2012 C, (Wake Forest Baptist), VRDN, 0.86%, 6/6/13 | | 250,000 | | | 250,063 | |
North Carolina Municipal Power Agency No. 1 Catawba Electric Rev., Series 2008 A, 5.25%, 1/1/16 | | 300,000 | | | 335,745 | |
North Carolina Municipal Power Agency No. 1 Catawba Electric Rev., Series 2012 A, 5.00%, 1/1/15 | | 200,000 | | | 214,622 | |
North Carolina Municipal Power Agency No. 1 Catawba Electric Rev., Series 2012 A, 5.00%, 1/1/16 | | 200,000 | | | 222,550 | |
| | | | | | 2,664,861 | |
OHIO — 0.3% | |
Franklin County Hospital Rev., Series 2011 A, (Ohio Health Corp.), 5.00%, 11/15/41 | | 200,000 | | | 218,196 | |
OKLAHOMA — 0.2% | |
Oklahoma Turnpike Authority Rev., Series 2011 A, (Second Series), 5.00%, 1/1/28 | | 150,000 | | | 173,234 | |
OREGON — 1.0% | |
Clackamas County Hospital Facility Authority Rev., Series 2009 A, (Legacy Health System), 5.50%, 7/15/35 | | 200,000 | | | 220,300 | |
Oregon GO, Series 2009 A, (State Board of Higher Education), 5.00%, 8/1/38 | | $ 300,000 | | | $337,944 | |
Oregon Health & Science University Rev., Series 2009 A, 5.75%, 7/1/39 | | 300,000 | | | 349,506 | |
| | | | | | 907,750 | |
PENNSYLVANIA — 4.4% | |
Beaver County Industrial Development Authority Rev., Series 2006 B, (Pollution Control), VRDN, 2.50%, 6/1/17 (GA: First Energy Solutions Corp./First Energy Generation Corp.) | | 200,000 | | | 201,368 | |
Central Dauphin School District GO, 7.00%, 2/1/16, Prerefunded at 100% of Par (NATL-RE)(1) | | 500,000 | | | 585,955 | |
Pennsylvania Economic Development Financing Authority Unemployment Compensation Rev., Series 2012 A, 5.00%, 7/1/18 | | 250,000 | | | 298,827 | |
Pennsylvania Economic Development Financing Authority Unemployment Compensation Rev., Series 2012 B, 5.00%, 7/1/20 | | 250,000 | | | 299,165 | |
Pennsylvania GO, 5.00%, 11/15/22 | | 100,000 | | | 121,411 | |
Pennsylvania GO, 5.00%, 4/1/24 | | 200,000 | | | 245,546 | |
Pennsylvania GO, Series 2010 A, 5.00%, 5/1/16 | | 400,000 | | | 451,412 | |
Pennsylvania Higher Educational Facilities Authority Rev., (Shippensburg University Student Services, Inc.), 5.00%, 10/1/44 | | 100,000 | | | 107,237 | |
Pennsylvania Higher Educational Facilities Authority Rev., Series 2012 1, (Temple University) 5.00%, 4/1/27 | | 100,000 | | | 114,663 | |
Pennsylvania Turnpike Commission Rev., Series 2008 C, 6.00%, 6/1/28 (AGC) | | 200,000 | | | 237,196 | |
Pennsylvania Turnpike Commission Rev., Series 2011 B, 5.25%, 12/1/41 | | 150,000 | | | 163,005 | |
Philadelphia Gas Works Rev., Series 2009 A, (1998 General Ordinance), 5.00%, 8/1/16 | | 300,000 | | | 330,339 | |
Philadelphia Water & Wastewater Rev., Series 2009 A, 5.25%, 1/1/36 | | 250,000 | | | 272,603 | |
Pittsburgh GO, Series 2012 B, 5.00%, 9/1/25 | | 150,000 | | | 172,089 | |
State Public School Building Authority Lease Rev., (School District of Philadelphia), 5.00%, 4/1/23 | | 100,000 | | | 114,664 | |
State Public School Building Authority Lease Rev., (School District of Philadelphia), 5.00%, 4/1/25 | | 100,000 | | | 111,752 | |
| | | | | | 3,827,232 | |
PUERTO RICO — 5.5% | |
Puerto Rico Aqueduct & Sewer Authority Rev., Series 2008 A, (Senior Lien), 5.00%, 7/1/14 | | 500,000 | | | 508,830 | |
Puerto Rico Aqueduct & Sewer Authority Rev., Series 2012 A, (Senior Lien), 5.00%, 7/1/17 | | 230,000 | | | 238,317 | |
Puerto Rico Aqueduct & Sewer Authority Rev., Series 2012 A, (Senior Lien), 5.00%, 7/1/21 | | 200,000 | | | 200,190 | |
Puerto Rico Aqueduct & Sewer Authority Rev., Series 2012 A, (Senior Lien), 5.25%, 7/1/24 | | 200,000 | | | 200,922 | |
Puerto Rico Electric Power Authority Rev., Series 2010 DDD, 5.00%, 7/1/21 | | 175,000 | | | 181,706 | |
Puerto Rico Electric Power Authority Rev., Series 2010 ZZ, 5.00%, 7/1/19 | | 100,000 | | | 106,183 | |
Puerto Rico Electric Power Authority Rev., Series 2010 ZZ, 5.25%, 7/1/22 | | 300,000 | | | 311,667 | |
Puerto Rico Electric Power Authority Rev., Series 2012 A, 5.00%, 7/1/42 | | 200,000 | | | 191,572 | |
Puerto Rico GO, Series 2002 A, (Public Improvement), 5.50%, 7/1/19 (FGIC) | | 100,000 | | | 106,637 | |
Puerto Rico GO, Series 2007 A, (Public Improvement), 5.50%, 7/1/18 | | 200,000 | | | 214,052 | |
Puerto Rico GO, Series 2008 A, 5.125%, 7/1/28 | | 200,000 | | | 196,896 | |
Puerto Rico GO, Series 2011 C, (Public Improvement), 5.75%, 7/1/36 | | 385,000 | | | 396,889 | |
Puerto Rico GO, Series 2012 A, (Public Improvement), 5.00%, 7/1/41 | | 100,000 | | | 95,008 | |
Puerto Rico Highway & Transportation Authority Rev., Series 2007 N, 5.25%, 7/1/30 (Ambac) | | 325,000 | | | 322,273 | |
Puerto Rico Public Buildings Authority Rev., Series 2009 Q, 5.625%, 7/1/39 | | $ 200,000 | | | $202,246 | |
Puerto Rico Public Finance Corp. Rev., Series 2011 B, (Commonwealth Appropriation), 6.00%, 8/1/24 (SBBPA: Government Development Bank for Puerto Rico) | | 75,000 | | | 78,084 | |
Puerto Rico Public Finance Corp. Rev., Series 2011 B, (Commonwealth Appropriation), 5.50%, 8/1/31 (SBBPA: Government Development Bank for Puerto Rico) | | 150,000 | | | 149,646 | |
Puerto Rico Sales Tax Financing Corp. Rev., Series 2010 A, 5.50%, 8/1/42 | | 350,000 | | | 370,044 | |
Puerto Rico Sales Tax Financing Corp. Rev., Series 2010 C, 5.25%, 8/1/41 | | 150,000 | | | 156,491 | |
Puerto Rico Sales Tax Financing Corp. Rev., Series 2011 C, 5.00%, 8/1/22 | | 300,000 | | | 348,747 | |
Puerto Rico Sales Tax Financing Corp. Rev., Capital Appreciation, Series 2010 A, 0.00%, 8/1/33(2) | | 390,000 | | | 124,207 | |
Puerto Rico Sales Tax Financing Corp. Rev., Capital Appreciation, Series 2011 A1, 0.00%, 8/1/41(2) | | 700,000 | | | 132,230 | |
| | | | | | 4,832,837 | |
SOUTH CAROLINA — 0.4% | |
Piedmont Municipal Power Agency Electric Rev., Series 2009 A3, 5.00%, 1/1/17 | | 175,000 | | | 198,485 | |
South Carolina State Public Service Authority Rev., Series 2012 D, 5.00%, 12/1/43 | | 100,000 | | | 108,480 | |
| | | | | | 306,965 | |
TENNESSEE — 0.3% | |
Metropolitan Government Nashville & Davidson County Health & Educational Facilities Board Rev., Series 2008 A, (Vanderbilt University), 5.00%, 10/1/15 | | 225,000 | | | 249,428 | |
TEXAS — 7.3% | |
Canadian River Municipal Water Authority Rev., (Conjunctive Use Groundwater Supply Project), 5.00%, 2/15/15 | | 300,000 | | | 323,607 | |
Canadian River Municipal Water Authority Rev., (Conjunctive Use Groundwater Supply Project), 5.00%, 2/15/16 | | 300,000 | | | 335,553 | |
Dallas Area Rapid Transit Sales Tax Rev., Series 2010 A, (Senior Lien), 5.00%, 12/1/14 | | 250,000 | | | 267,820 | |
Dallas Area Rapid Transit Sales Tax Rev., Series 2010 A, (Senior Lien), 5.00%, 12/1/19 | | 250,000 | | | 303,795 | |
Dallas-Fort Worth International Airport Rev., Series 2011 D, 5.00%, 11/1/20 | | 100,000 | | | 119,804 | |
Dallas-Fort Worth International Airport Rev., Series 2011 D, 5.00%, 11/1/21 | | 100,000 | | | 117,899 | |
Harris County Toll Road Rev., Series 2009 A, (Senior Lien), 5.00%, 8/15/38 | | 400,000 | | | 452,080 | |
Houston Independent School District GO, VRDN, 2.50%, 6/1/15 (PSF-GTD) | | 250,000 | | | 259,082 | |
Love Field Airport Modernization Corp. Special Facilities Rev., (Southwest Airlines Co.), 5.25%, 11/1/40 | | 100,000 | | | 107,684 | |
Lower Colorado River Authority Rev., 5.00%, 5/15/15 | | 200,000 | | | 217,814 | |
Lubbock Health Facilities Development Corp. Rev., Series 2008 A, (St. Joseph Health System), VRDN, 1.125%, 10/18/16 | | 500,000 | | | 504,525 | |
North East Independent School District GO, (School Building), 5.00%, 8/1/15 (PSF-GTD) | | 300,000 | | | 330,117 | |
North Texas Tollway Authority Rev., (First Tier), 6.00%, 1/1/38 | | 300,000 | | | 342,801 | |
North Texas Tollway Authority Rev., (First Tier), 6.00%, 1/1/43 | | 150,000 | | | 170,238 | |
North Texas Tollway Authority Rev., Series 2012 A, (First Tier), 5.00%, 1/1/29 | | 100,000 | | | 112,416 | |
Northside Independent School District GO, (School Building), VRDN, 1.00%, 6/1/16 (PSF-GTD) | | 300,000 | | | 302,481 | |
San Antonio Electric & Gas Rev., Series 2012 A, (Junior Lien), VRDN, 2.00%, 12/1/14 | | 250,000 | | | 255,665 | |
San Antonio Electric & Gas Rev., Series 2012 B, (Junior Lien), VRDN, 2.00%, 12/1/15 | | 250,000 | | | 258,480 | |
San Antonio Water System Rev., 4.00%, 5/15/16 | | $ 500,000 | | | $549,965 | |
Tarrant County Cultural Education Facilities Finance Corp. Rev., (Scott & White Memorial Hospital and Scott, Sherwood & Brindley Foundation), 5.50%, 8/15/31 | | 250,000 | | | 277,675 | |
Texas Municipal Gas Acquisition & Supply Corp. III Rev., 5.00%, 12/15/30 | | 100,000 | | | 106,358 | |
Texas Transportation Commission Turnpike System Rev., Series 2012 B, (First Tier), VRDN, 1.25%, 2/15/15 | | 400,000 | | | 402,940 | |
University of North Texas Rev., Series 2009 A, 5.00%, 4/15/32 | | 250,000 | | | 290,225 | |
| | | | | | 6,409,024 | |
U.S. VIRGIN ISLANDS — 0.3% | |
Virgin Islands Public Finance Authority Rev., Series 2010 A, (Matching Fund Loan Note, Senior Lien), 5.00%, 10/1/25 | | 250,000 | | | 278,245 | |
UTAH — 0.8% | |
Utah State Board of Regents Rev., Series 2006 A, (University of Utah Hospital), 5.25%, 8/1/21 (NATL-RE) | | 250,000 | | | 308,882 | |
Utah Transit Authority Sales Tax Rev., 5.00%, 6/15/42 | | 100,000 | | | 109,708 | |
Utah Transit Authority Sales Tax Rev., Series 2008 A, 5.00%, 6/15/20 | | 250,000 | | | 292,588 | |
| | | | | | 711,178 | |
VIRGINIA — 0.7% | |
Chesapeake Expressway Toll Road Rev., Capital Appreciation, Series 2012 B, 0.00%, 7/15/23(5) | | 200,000 | | | 121,192 | |
Virginia Resources Authority Clean Water Rev., (State Revolving Fund), 5.00%, 10/1/16 | | 200,000 | | | 228,960 | |
Washington County Industrial Development Authority Hospital Facility Rev., Series 2009 C, (Mountain States Health Alliance), 7.75%, 7/1/38 | | 200,000 | | | 243,158 | |
| | | | | | 593,310 | |
WASHINGTON — 2.1% | |
Central Puget Sound Regional Transportation Authority Rev., Series 2012 P-1, 5.00%, 2/1/17 | | 250,000 | | | 287,902 | |
King County Sewer Rev., Series 2011 B, 5.00%, 1/1/16 | | 150,000 | | | 167,078 | |
King County Sewer Rev., Series 2011 B, 5.00%, 1/1/34 | | 200,000 | | | 224,280 | |
Port of Seattle Rev., Series 2010 B, (Intermediate Lien), 5.00%, 6/1/30 | | 200,000 | | | 226,368 | |
Tacoma Electric System Rev., Series 2013 A, 5.00%, 1/1/16(4) | | 250,000 | | | 278,392 | |
Washington GO, Series 2008 A, 5.00%, 7/1/20 | | 200,000 | | | 236,766 | |
Washington Federal Highway Grant Anticipation Rev., Series 2012-F, (Senior 520 Corridor Program), 5.00%, 9/1/15 | | 250,000 | | | 275,425 | |
Washington Health Care Facilities Authority Rev., (Kadlec Regional Medical Center), 5.00%, 12/1/42 | | 150,000 | | | 153,282 | |
| | | | | | 1,849,493 | |
WISCONSIN — 1.7% | |
Milwaukee Redevelopment Authority Rev., (Milwaukee Public Schools - Neighborhood Schools Initiative), 5.125%, 8/1/13, Prerefunded at 100% of Par (Ambac)(1) | | 475,000 | | | 478,862 | |
Wisconsin Department of Transportation Rev., Series 1, 5.00%, 7/1/26 | | 300,000 | | | 360,696 | |
Wisconsin Health & Educational Facilities Authority Rev., (ProHealth Care, Inc. Obligated Group), 6.625%, 2/15/39 | | 300,000 | | | 346,326 | |
Wisconsin Transportation Rev., Series 2008 A, 5.00%, 7/1/18 | | 250,000 | | | 297,462 | |
| | | | | | 1,483,346 | |
TOTAL INVESTMENT SECURITIES — 99.8% (Cost $82,233,995) | | | 87,121,138 | |
OTHER ASSETS AND LIABILITIES — 0.2% | | | 133,801 | |
TOTAL NET ASSETS — 100.0% | | | $87,254,939 | |
Futures Contracts |
Contracts Purchased | Expiration Date | Underlying Face
Amount at Value | Unrealized Gain (Loss) |
11 | U.S. Treasury 30-Year Bonds | September 2013 | $1,540,344 | $(19,962) |
Notes to Schedule of Investments
AGC = Assured Guaranty Corporation
AGC-ICC = Assured Guarantee Corporation - Insured Custody Certificates
AGM = Assured Guaranty Municipal Corporation
COP = Certificates of Participation
FGIC = Financial Guaranty Insurance Company
GA = Guaranty Agreement
GO = General Obligation
LOC = Letter of Credit
NATL-RE = National Public Finance Guarantee Corporation - Reinsured
PSF-GTD = Permanent School Fund Guaranteed
Q-SBLF = Qualified School Board Loan Fund
SBBPA = Standby Bond Purchase Agreement
VRDN = Variable Rate Demand Note. Interest reset date is indicated. Rate shown is effective at the period end.
VRN = Variable Rate Note. Interest reset date is indicated. Rate shown is effective at the period end.
(1) | Escrowed to maturity in U.S. government securities or state and local government securities. |
(2) | Security is a zero-coupon bond. Zero-coupon securities are issued at a substantial discount from their value at maturity. |
(3) | Security, or a portion thereof, has been pledged at the custodian bank or with a broker for margin requirements on futures contracts. At the period end, the aggregate value of securities pledged was $94,863. |
(4) | When-issued security. The issue price and yield are fixed on the date of the commitment, but payment and delivery are scheduled for a future date. |
(5) | Coupon rate adjusts periodically based upon a predetermined schedule. Interest reset date is indicated. Rate shown is effective at the period end. |
See Notes to Financial Statements.
Statement of Assets and Liabilities |
MAY 31, 2013 | |
Assets | |
Investment securities, at value (cost of $82,233,995) | | $87,121,138 | |
Cash | | 65,617 | |
Receivable for capital shares sold | | 29,238 | |
Interest receivable | | 1,162,584 | |
| | | 88,378,577 | |
| | | | |
Liabilities | | | |
Payable for investments purchased | | 922,311 | |
Payable for capital shares redeemed | | 153,694 | |
Payable for variation margin on futures contracts | | 5,156 | |
Accrued management fees | | 34,850 | |
Distribution and service fees payable | | 6,833 | |
Dividends payable | | 794 | |
| | | 1,123,638 | |
| | | | |
Net Assets | | $87,254,939 | |
| | | | |
Net Assets Consist of: | | | |
Capital paid in | | $82,906,362 | |
Distributions in excess of net investment income | | (560 | ) |
Accumulated net realized loss | | (518,044 | ) |
Net unrealized appreciation | | 4,867,181 | |
| | | $87,254,939 | |
| | | | | | | | | | |
| | | Net assets | | | Shares outstanding | | | Net asset value per share | |
Investor Class | | $65,026,154 | | | 5,540,416 | | | $11.74 | |
Institutional Class | | $429,525 | | | 36,612 | | | $11.73 | |
A Class | | $18,444,495 | | | 1,571,920 | | | $11.73 | * |
C Class | | $3,354,765 | | | 285,851 | | | $11.74 | |
*Maximum offering price $12.28 (net asset value divided by 0.955).
See Notes to Financial Statements.
YEAR ENDED MAY 31, 2013 | |
Investment Income (Loss) | |
Income: | | | |
Interest | | $2,756,582 | |
| | | | |
Expenses: | | | |
Management fees | | 394,073 | |
Distribution and service fees: | | | |
A Class | | 50,048 | |
C Class | | 41,580 | |
Trustees’ fees and expenses | | 5,173 | |
| | | 490,874 | |
| | | | |
Net investment income (loss) | | 2,265,708 | |
| | | | |
Realized and Unrealized Gain (Loss) | | | |
Net realized gain (loss) on: | | | |
Investment transactions | | 750,328 | |
Futures contract transactions | | 79,248 | |
| | | 829,576 | |
| | | | |
Change in net unrealized appreciation (depreciation) on: | | | |
Investments | | (719,307 | ) |
Futures contracts | | (6,703 | ) |
| | | (726,010 | ) |
| | | | |
Net realized and unrealized gain (loss) | | 103,566 | |
| | | | |
Net Increase (Decrease) in Net Assets Resulting from Operations | | $2,369,274 | |
See Notes to Financial Statements.
Statement of Changes in Net Assets |
YEARS ENDED MAY 31, 2013 AND MAY 31, 2012 | |
Increase (Decrease) in Net Assets | | May 31, 2013 | | | May 31, 2012 | |
Operations | |
Net investment income (loss) | | $2,265,708 | | | $1,858,467 | |
Net realized gain (loss) | | 829,576 | | | 218,456 | |
Change in net unrealized appreciation (depreciation) | | (726,010 | ) | | 3,706,185 | |
Net increase (decrease) in net assets resulting from operations | | 2,369,274 | | | 5,783,108 | |
| | | | | | | |
Distributions to Shareholders | | | | | | |
From net investment income: | | | | | | |
Investor Class | | (1,677,268 | ) | | (1,167,007 | ) |
Institutional Class | | (6,164 | ) | | (10,090 | ) |
A Class | | (508,115 | ) | | (595,246 | ) |
B Class | | — | | | (3,834 | ) |
C Class | | (74,366 | ) | | (82,096 | ) |
Decrease in net assets from distributions | | (2,265,913 | ) | | (1,858,273 | ) |
| | | | | | | |
Capital Share Transactions | | | | | | |
Net increase (decrease) in net assets from capital share transactions | | 12,883,755 | | | 26,013,036 | |
| | | | | | | |
Net increase (decrease) in net assets | | 12,987,116 | | | 29,937,871 | |
| | | | | | | |
Net Assets | | | | | | |
Beginning of period | | 74,267,823 | | | 44,329,952 | |
End of period | | $87,254,939 | | | $74,267,823 | |
| | | | | | | |
Distributions in excess of net investment income | | $(560 | ) | | $(193 | ) |
See Notes to Financial Statements.
Notes to Financial Statements |
MAY 31, 2013
1. Organization
American Century Municipal Trust (the trust) is registered under the Investment Company Act of 1940, as amended (the 1940 Act), as an open-end management investment company and is organized as a Massachusetts business trust. Long-Term Tax-Free Fund (the fund) is one fund in a series issued by the trust. The fund is diversified as defined under the 1940 Act. The fund’s investment objective is to seek high current income that is exempt from federal income taxes consistent with preservation of capital.
The fund offers the Investor Class, the Institutional Class, the A Class and the C Class. The A Class may incur an initial sales charge. The A Class and C Class may be subject to a contingent deferred sales charge. The share classes differ principally in their respective sales charges and distribution and shareholder servicing expenses and arrangements. The Institutional Class is made available to institutional shareholders or through financial intermediaries whose clients do not require the same level of shareholder and administrative services as shareholders of other classes. As a result, the Institutional Class is charged a lower unified management fee. On October 21, 2011, all outstanding B Class shares were converted to A Class shares and the fund discontinued offering the B Class.
2. Significant Accounting Policies
The following is a summary of significant accounting policies consistently followed by the fund in preparation of its financial statements. The financial statements are prepared in conformity with accounting principles generally accepted in the United States of America, which may require management to make certain estimates and assumptions at the date of the financial statements. Actual results could differ from these estimates.
Investment Valuations — The fund determines the fair value of its investments and computes its net asset value per share as of the close of regular trading (usually 4 p.m. Eastern time) on the New York Stock Exchange (NYSE) on each day the NYSE is open.
Debt securities maturing in greater than 60 days at the time of purchase are valued at the evaluated mean as provided by independent pricing services or at the mean of the most recent bid and asked prices as provided by investment dealers. Debt securities maturing within 60 days at the time of purchase may be valued at cost, plus or minus any amortized discount or premium or at the evaluated mean as provided by an independent pricing service. Evaluated mean prices are commonly derived through utilization of market models, which may consider, among other factors, trade data, quotations from dealers and active market makers, relevant yield curve and spread data, related sector levels, creditworthiness, and other relevant market information on the same or comparable securities.
Exchange-traded futures contracts are valued at the settlement price as provided by the appropriate clearing corporation.
If the fund determines that the market price for a portfolio security is not readily available or the valuation methods mentioned above do not reflect a security’s fair value, such security is valued as determined in good faith by the Board of Trustees or its designee, in accordance with procedures adopted by the Board of Trustees. Circumstances that may cause the fund to use these procedures to value a security include, but are not limited to: a security has been declared in default; trading in a security has been halted during the trading day; there is a foreign market holiday and no trading occurred; or an event occurred between the close of a foreign exchange and the NYSE that may affect the value of a security.
Security Transactions — Security transactions are accounted for as of the trade date. Net realized gains and losses are determined on the identified cost basis, which is also used for federal income tax purposes.
Investment Income — Interest income is recorded on the accrual basis and includes accretion of discounts and amortization of premiums.
Segregated Assets — In accordance with the 1940 Act, the fund segregates assets on its books and records to cover certain types of investments, including, but not limited to, futures contracts and when-issued securities. American Century Investment Management, Inc. (ACIM) (the investment advisor) monitors, on a daily basis, the securities segregated to ensure the fund designates a sufficient amount of liquid assets, marked-to-market daily. The fund may also receive assets or be required to pledge assets at the custodian bank or with a broker for margin requirements on futures contracts.
Income Tax Status — It is the fund’s policy to distribute substantially all net investment income and net realized gains to shareholders and to otherwise qualify as a regulated investment company under provisions of the Internal Revenue Code. Accordingly, no provision has been made for income taxes. The fund files U.S. federal, state, local and non-U.S. tax returns as applicable. The fund’s tax returns are subject to examination by the relevant taxing authority until expiration of the applicable statute of limitations, which is generally three years from the date of filing but can be longer in certain jurisdictions. At this time, management believes there are no uncertain tax positions which, based on their technical merit, would not be sustained upon examination and for which it is reasonably possible that the total amounts of unrecognized tax benefits will significantly change in the next twelve months.
Multiple Class — All shares of the fund represent an equal pro rata interest in the net assets of the class to which such shares belong, and have identical voting, dividend, liquidation and other rights and the same terms and conditions, except for class specific expenses and exclusive rights to vote on matters affecting only individual classes. Income, non-class specific expenses, and realized and unrealized capital gains and losses of the fund are allocated to each class of shares based on their relative net assets.
Distributions to Shareholders — Distributions from net investment income are declared daily and paid monthly. Distributions from net realized gains, if any, are generally declared and paid annually.
Indemnifications — Under the trust’s organizational documents, its officers and trustees are indemnified against certain liabilities arising out of the performance of their duties to the fund. In addition, in the normal course of business, the fund enters into contracts that provide general indemnifications. The maximum exposure under these arrangements is unknown as this would involve future claims that may be made against a fund. The risk of material loss from such claims is considered by management to be remote.
3. Fees and Transactions with Related Parties
Management Fees — The trust has entered into a management agreement with ACIM, under which ACIM provides the fund with investment advisory and management services in exchange for a single, unified management fee (the fee) per class. The agreement provides that all expenses of managing and operating the fund, except distribution and service fees, brokerage expenses, taxes, interest, fees and expenses of the independent trustees (including legal counsel fees), and extraordinary expenses, will be paid by ACIM. The fee is computed and accrued daily based on each class’s daily net assets and paid monthly in arrears. The fee consists of (1) an Investment Category Fee based on the daily net assets of the fund and certain other accounts managed by the investment advisor that are in the same broad investment category as the fund and (2) a Complex Fee based on the assets of all the funds in the American Century Investments family of funds. The rates for the Investment Category Fee range from 0.1625% to 0.2800%. The rates for the Complex Fee range from 0.2500% to 0.3100% for the Investor Class, A Class and C Class. The Institutional Class is 0.2000% less at each point within the Complex Fee range. The effective annual management fee for each class for the year ended May 31, 2013 was 0.46% for the Investor Class, A Class and C Class and 0.26% for the Institutional Class.
Distribution and Service Fees — The Board of Trustees has adopted a separate Master Distribution and Individual Shareholder Services Plan for each of the A Class and C Class (collectively the plans), pursuant to Rule 12b-1 of the 1940 Act. The plans provide that the A Class will pay American Century Investment Services, Inc. (ACIS) an annual distribution and service fee of 0.25%. The plans provide that the C Class will pay ACIS an annual distribution and service fee of 1.00%, of which 0.25% is paid for individual shareholder services and 0.75% is paid for distribution services. The fees are computed
and accrued daily based on each class’s daily net assets and paid monthly in arrears. The fees are used to pay financial intermediaries for distribution and individual shareholder services. Fees incurred under the plans during the year ended May 31, 2013 are detailed in the Statement of Operations.
Related Parties — Certain officers and trustees of the trust are also officers and/or directors of American Century Companies, Inc. (ACC). The trust’s investment advisor, ACIM, the trust’s distributor, ACIS, and the trust’s transfer agent, American Century Services, LLC are wholly owned, directly or indirectly, by ACC.
4. Investment Transactions
Purchases and sales of investment securities, excluding short-term investments, for the year ended May 31, 2013 were $53,320,086 and $40,670,901, respectively.
5. Capital Share Transactions
Transactions in shares of the fund were as follows (unlimited number of shares authorized):
| | | | | | | |
| | | Year ended May 31, 2013 | | | Year ended May 31, 2012 | |
| | | Shares | | | Amount | | | Shares | | | Amount | |
Investor Class | | | | | | | | | | | | |
Sold | | 2,961,003 | | | $ 35,128,378 | | | 2,990,503 | | | $ 33,983,506 | |
Issued in reinvestment of distributions | | 135,094 | | | 1,602,406 | | | 96,965 | | | 1,102,333 | |
Redeemed | | (1,766,279 | ) | | (20,953,231 | ) | | (1,050,425 | ) | | (11,844,987 | ) |
| | | 1,329,818 | | | 15,777,553 | | | 2,037,043 | | | 23,240,852 | |
Institutional Class | | | | | | | | | | | | |
Sold | | 21,922 | | | 260,071 | | | — | | | — | |
Issued in reinvestment of distributions | | 527 | | | 6,164 | | | 887 | | | 10,029 | |
Redeemed | | (9,820 | ) | | (115,874 | ) | | (2,517 | ) | | (28,194 | ) |
| | | 12,629 | | | 150,361 | | | (1,630 | ) | | (18,165 | ) |
A Class | | | | | | | | | | | | |
Sold | | 308,323 | | | 3,653,454 | | | 472,627 | | | 5,362,857 | |
Issued in reinvestment of distributions | | 36,732 | | | 435,498 | | | 43,841 | | | 496,625 | |
Redeemed | | (538,379 | ) | | (6,370,502 | ) | | (295,820 | ) | | (3,361,258 | ) |
| | | (193,324 | ) | | (2,281,550 | ) | | 220,648 | | | 2,498,224 | |
B Class | | N/A | | | | | | | | | | |
Issued in reinvestment of distributions | | | | | | | | 281 | | | 3,104 | |
Redeemed | | | | | | | | (33,025 | ) | | (367,834 | ) |
| | | | | | | | | (32,744 | ) | | (364,730 | ) |
C Class | | | | | | | | | | | | |
Sold | | 52,832 | | | 621,789 | | | 135,345 | | | 1,559,761 | |
Issued in reinvestment of distributions | | 4,897 | | | 58,060 | | | 6,825 | | | 77,157 | |
Redeemed | | (121,279 | ) | | (1,442,458 | ) | | (86,654 | ) | | (980,063 | ) |
| | | (63,550 | ) | | (762,609 | ) | | 55,516 | | | 656,855 | |
Net increase (decrease) | | 1,085,573 | | | $ 12,883,755 | | | 2,278,833 | | | $ 26,013,036 | |
6. Fair Value Measurements
The fund’s securities valuation process is based on several considerations and may use multiple inputs to determine the fair value of the positions held by the fund. In conformity with accounting principles generally accepted in the United States of America, the inputs used to determine a valuation are classified into three broad levels as follows:
• | Level 1 valuation inputs consist of unadjusted quoted prices in an active market for identical securities; |
• | Level 2 valuation inputs consist of direct or indirect observable market data (including quoted prices for similar securities, evaluations of subsequent market events, interest rates, prepayment speeds, credit risk, etc.); or |
• | Level 3 valuation inputs consist of unobservable data (including a fund’s own assumptions). |
The level classification is based on the lowest level input that is significant to the fair valuation measurement. The valuation inputs are not necessarily an indication of the risks associated with investing in these securities or other financial instruments.
As of period end, the fund’s investment securities and unrealized gain (loss) on futures contracts were classified as Level 2 and Level 1, respectively. The Schedule of Investments provides additional information on the fund’s portfolio holdings.
7. Derivative Instruments
Interest Rate Risk — The fund is subject to interest rate risk in the normal course of pursuing its investment objectives. The value of bonds generally declines as interest rates rise. A fund may enter into futures contracts based on a bond index or a specific underlying security. A fund may purchase futures contracts to gain exposure to increases in market value or sell futures contracts to protect against a decline in market value. Upon entering into a futures contract, a fund will segregate cash, cash equivalents or other appropriate liquid securities on its records in amounts sufficient to meet requirements. Subsequent payments (variation margin) are made or received daily, in cash, by a fund. The variation margin is equal to the daily change in the contract value and is recorded as unrealized gains and losses. A fund recognizes a realized gain or loss when the futures contract is closed or expires. Net realized and unrealized gains or losses occurring during the holding period of futures contracts are a component of net realized gain (loss) on futures contract transactions and change in net unrealized appreciation (depreciation) on futures contracts, respectively. One of the risks of entering into futures contracts is the possibility that the change in value of the contract may not correlate with the changes in value of the underlying securities. The fund regularly purchased and sold interest rate risk derivative instruments throughout the reporting period and the instruments held at period end as disclosed on the Schedule of Investments are indicative of the fund’s typical volume.
The value of interest rate risk derivative instruments as of May 31, 2013, is disclosed on the Statement of Assets and Liabilities as a liability of $5,156 in payable for variation margin on futures contracts.* For the year ended May 31, 2013, the effect of interest rate risk derivative instruments on the Statement of Operations was $79,248 in net realized gain (loss) on futures contract transactions and $(6,703) in change in net unrealized appreciation (depreciation) on futures contracts.
* Included in the unrealized gain (loss) on futures contracts as reported in the Schedule of Investments.
8. Federal Tax Information
The tax character of distributions paid during the years ended May 31, 2013 and May 31, 2012 were as follows:
| | | | | | | |
| | | 2013 | | | 2012 | |
Distributions Paid From | |
Exempt income | | $2,265,544 | | | $1,855,130 | |
Taxable ordinary income | | $369 | | | $3,143 | |
Long-term capital gains | | — | | | — | |
The book-basis character of distributions made during the year from net investment income or net realized gains may differ from their ultimate characterization for federal income tax purposes. These differences reflect the differing character of certain income items and net realized gains and losses for financial statement and tax purposes, and may result in reclassification among certain capital accounts on the financial statements.
As of May 31, 2013, the federal tax cost of investments and the components of distributable earnings on a tax-basis were as follows:
| | | | |
Federal tax cost of investments | | $82,233,995 | |
Gross tax appreciation of investments | | $5,097,119 | |
Gross tax depreciation of investments | | (209,976 | ) |
Net tax appreciation (depreciation) of investments | | $4,887,143 | |
Net tax appreciation (depreciation) on derivatives | | — | |
Net tax appreciation (depreciation) | | $4,887,143 | |
Other book-to-tax adjustments | | $(40,194 | ) |
Accumulated short-term capital losses | | $(498,372 | ) |
The cost of investments for federal income tax purposes was the same as the cost for financial reporting purposes. The difference between book-basis and tax-basis unrealized appreciation (depreciation) is attributable primarily to the realization for tax purposes of unrealized gains (losses) on futures contracts. Other book-to-tax adjustments are attributable primarily to the tax deferral of losses on straddle positions.
Accumulated capital losses represent net capital loss carryovers that may be used to offset future realized capital gains for federal income tax purposes. Future capital loss carryover utilization in any given year may be subject to Internal Revenue Code limitations. Capital loss carryovers expire as follows:
| | | | |
2016 | 2017 | 2018 | 2019 |
$(178,394) | $(175,946) | $(72,593) | $(71,439) |
| | |
For a Share Outstanding Throughout the Years Ended May 31 (except as noted) | |
Per-Share Data | | | Ratios and Supplemental Data | |
| | | | | | Income From Investment Operations: | | | | | | | | | | | | Ratio to Average Net Assets of: | | | | | | | |
| | | Net Asset
Value,
Beginning
of Period | | | Net
Investment
Income
(Loss) | | | Net Realized
and Unrealized
Gain (Loss) | | | Total From
Investment
Operations | | | Distributions
From Net
Investment
Income | | | Net Asset
Value, End
of Period | | | Total
Return(1) | | | Operating
Expenses | | | Net
Investment
Income
(Loss) | | | Portfolio
Turnover
Rate | | | Net Assets,
End of Period
(in thousands) | |
Investor Class | |
2013 | | $11.70 | | | 0.33 | (2) | | 0.04 | | | 0.37 | | | (0.33 | ) | | $11.74 | | | 3.17 | % | | 0.47 | % | | 2.78 | % | | 49 | % | | $65,026 | |
2012 | | $10.89 | | | 0.39 | (2) | | 0.81 | | | 1.20 | | | (0.39 | ) | | $11.70 | | | 11.22 | % | | 0.48 | % | | 3.42 | % | | 38 | % | | $49,255 | |
2011 | | $11.02 | | | 0.43 | (2) | | (0.13 | ) | | 0.30 | | | (0.43 | ) | | $10.89 | | | 2.77 | % | | 0.48 | % | | 3.94 | % | | 23 | % | | $23,674 | |
2010 | | $10.60 | | | 0.44 | (2) | | 0.42 | | | 0.86 | | | (0.44 | ) | | $11.02 | | | 8.32 | % | | 0.48 | % | | 4.04 | % | | 50 | % | | $9,824 | |
2009 | | $10.56 | | | 0.39 | | | 0.04 | | | 0.43 | | | (0.39 | ) | | $10.60 | | | 4.32 | % | | 0.49 | % | | 3.84 | % | | 40 | % | | $3,622 | |
Institutional Class | |
2013 | | $11.69 | | | 0.35 | (2) | | 0.04 | | | 0.39 | | | (0.35 | ) | | $11.73 | | | 3.38 | % | | 0.27 | % | | 2.98 | % | | 49 | % | | $430 | |
2012 | | $10.89 | | | 0.42 | (2) | | 0.79 | | | 1.21 | | | (0.41 | ) | | $11.69 | | | 11.35 | % | | 0.28 | % | | 3.62 | % | | 38 | % | | $280 | |
2011 | | $11.02 | | | 0.45 | (2) | | (0.13 | ) | | 0.32 | | | (0.45 | ) | | $10.89 | | | 2.97 | % | | 0.28 | % | | 4.14 | % | | 23 | % | | $279 | |
2010 | | $10.60 | | | 0.45 | (2) | | 0.44 | | | 0.89 | | | (0.47 | ) | | $11.02 | | | 8.53 | % | | 0.28 | % | | 4.24 | % | | 50 | % | | $118 | |
2009 | | $10.56 | | | 0.42 | | | 0.04 | | | 0.46 | | | (0.42 | ) | | $10.60 | | | 4.53 | % | | 0.29 | % | | 4.04 | % | | 40 | % | | $18,460 | |
A Class | |
2013 | | $11.70 | | | 0.30 | (2) | | 0.03 | | | 0.33 | | | (0.30 | ) | | $11.73 | | | 2.91 | % | | 0.72 | % | | 2.53 | % | | 49 | % | | $18,444 | |
2012 | | $10.89 | | | 0.36 | (2) | | 0.81 | | | 1.17 | | | (0.36 | ) | | $11.70 | | | 10.85 | % | | 0.73 | % | | 3.17 | % | | 38 | % | | $20,645 | |
2011 | | $11.02 | | | 0.40 | (2) | | (0.13 | ) | | 0.27 | | | (0.40 | ) | | $10.89 | | | 2.52 | % | | 0.73 | % | | 3.69 | % | | 23 | % | | $16,820 | |
2010 | | $10.60 | | | 0.41 | (2) | | 0.43 | | | 0.84 | | | (0.42 | ) | | $11.02 | | | 8.05 | % | | 0.73 | % | | 3.79 | % | | 50 | % | | $23,618 | |
2009 | | $10.56 | | | 0.37 | | | 0.04 | | | 0.41 | | | (0.37 | ) | | $10.60 | | | 4.06 | % | | 0.74 | % | | 3.59 | % | | 40 | % | | $20,619 | |
| | |
For a Share Outstanding Throughout the Years Ended May 31 (except as noted) | |
Per-Share Data | | | Ratios and Supplemental Data | |
| | | | | | Income From Investment Operations: | | | | | | | | | | | | Ratio to Average Net Assets of: | | | | | | | |
| | | Net Asset
Value,
Beginning
of Period | | | Net
Investment
Income
(Loss) | | | Net Realized
and Unrealized
Gain (Loss) | | | Total From
Investment
Operations | | | Distributions
From Net
Investment
Income | | | Net Asset
Value, End
of Period | | | Total
Return(1) | | | Operating
Expenses | | | Net
Investment
Income
(Loss) | | | Portfolio
Turnover
Rate | | | Net Assets,
End of Period
(in thousands) | |
C Class | |
2013 | | $11.70 | | | 0.21 | (2) | | 0.04 | | | 0.25 | | | (0.21 | ) | | $11.74 | | | 2.15 | % | | 1.47 | % | | 1.78 | % | | 49 | % | | $3,355 | |
2012 | | $10.89 | | | 0.28 | (2) | | 0.81 | | | 1.09 | | | (0.28 | ) | | $11.70 | | | 10.12 | % | | 1.48 | % | | 2.42 | % | | 38 | % | | $4,087 | |
2011 | | $11.02 | | | 0.32 | (2) | | (0.13 | ) | | 0.19 | | | (0.32 | ) | | $10.89 | | | 1.76 | % | | 1.48 | % | | 2.94 | % | | 23 | % | | $3,201 | |
2010 | | $10.60 | | | 0.33 | (2) | | 0.43 | | | 0.76 | | | (0.34 | ) | | $11.02 | | | 7.25 | % | | 1.48 | % | | 3.04 | % | | 50 | % | | $4,325 | |
2009 | | $10.56 | | | 0.29 | | | 0.04 | | | 0.33 | | | (0.29 | ) | | $10.60 | | | 3.28 | % | | 1.49 | % | | 2.84 | % | | 40 | % | | $3,749 | |
Notes to Financial Highlights
(1) | Total returns are calculated based on the net asset value of the last business day and do not reflect applicable sales charges, if any. Total returns for periods less than one year are not annualized. |
(2) | Computed using average shares outstanding throughout the period. |
See Notes to Financial Statements.
Report of Independent Registered Public Accounting Firm |
To the Trustees of the American Century Municipal Trust and Shareholders
of the Long-Term Tax-Free Fund:
In our opinion, the accompanying statement of assets and liabilities, including the schedule of investments, and the related statements of operations and of changes in net assets and the financial highlights present fairly, in all material respects, the financial position of the Long-Term Tax-Free Fund (one of the four funds comprising the American Century Municipal Trust, hereafter referred to as the “Fund”) at May 31, 2013, the results of its operations for the year then ended, the changes in its net assets for each of the two years in the period then ended and the financial highlights for each of the five years in the period then ended, in conformity with accounting principles generally accepted in the United States of America. These financial statements and financial highlights (hereafter referred to as “financial statements”) are the responsibility of the Fund’s management; our responsibility is to express an opinion on these financial statements based on our audits. We conducted our audits of these financial statements in accordance with the standards of the Public Company Accounting Oversight Board (United States). Those standards require that we plan and perform the audit to obtain reasonable assurance about whether the financial statements are free of material misstatement. An audit includes examining, on a test basis, evidence supporting the amounts and disclosures in the financial statements, assessing the accounting principles used and significant estimates made by management, and evaluating the overall financial statement presentation. We believe that our audits, which included confirmation of securities at May 31, 2013 by correspondence with the custodian and brokers, provide a reasonable basis for our opinion.
PricewaterhouseCoopers LLP
Kansas City, Missouri
July 22, 2013
Board of Trustees
The individuals listed below serve as trustees of the funds. Each trustee will continue to serve in this capacity until death, retirement, resignation or removal from office. The board has adopted a mandatory retirement age for trustees who are not “interested persons,” as that term is defined in the Investment Company Act (independent trustees). Independent trustees shall retire on December 31 of the year in which they reach their 75th birthday; provided, however, that on or after January 1, 2022, independent trustees shall retire on December 31 of the year in which they reach their 76th birthday.
Mr. Thomas is the only trustee who is an “interested person” because he currently serves as President and Chief Executive Officer of American Century Companies, Inc. (ACC), the parent company of American Century Investment Management, Inc. (ACIM or the advisor).
The other trustees (more than three-fourths of the total number) are independent; that is, they have never been employees, directors or officers of, and have no financial interest in, ACC or any of its wholly owned, direct or indirect, subsidiaries, including ACIM, American Century Investment Services, Inc. (ACIS) and American Century Services, LLC (ACS). The trustees serve in this capacity for eight (in the case of Mr. Thomas, 15) registered investment companies in the American Century Investments family of funds.
The following table presents additional information about the trustees. The mailing address for each trustee other than Mr. Thomas is 1665 Charleston Road, Mountain View, California 94043. The mailing address for Mr. Thomas is 4500 Main Street, Kansas City, Missouri 64111.
| | | | | | | |
Name
(Year of Birth) | Position(s) Held with Funds | Length of Time Served | Principal Occupation(s) During Past 5 Years | | Number of American Century Portfolios Overseen
by Trustee | Other Directorships Held During Past 5 Years |
Independent Trustees |
Tanya S. Beder (1955) | Trustee | Since 2011 | Chairman, SBCC Group Inc. (independent advisory services) (2006 to present) | | 41 | CYS Investments, Inc. (specialty finance company) |
Jeremy I. Bulow (1954) | Trustee | Since 2011 | Professor of Economics, Stanford University, Graduate School of Business (1979
to present) | | 41 | None |
Ronald J. Gilson (1946) | Trustee and Chairman of the Board | Since 1995 | Charles J. Meyers Professor of Law and Business, Stanford Law School (1979 to present); Marc and Eva Stern Professor of Law and Business, Columbia University School of Law (1992 to present) | | 41 | None |
Frederick L. A. Grauer
(1946) | Trustee | Since 2008 | Senior Advisor, BlackRock, Inc. (investment management firm) (2010 to 2011); Senior Advisor, Barclays Global Investors (investment management firm) (2003 to 2009) | | 41 | None |
| | | | | | | |
Name
(Year of Birth) | Position(s) Held with Funds | Length of Time Served | Principal Occupation(s) During Past 5 Years | | Number of American Century Portfolios Overseen
by Trustee | Other Directorships Held During Past 5 Years |
Independent Trustees |
Peter F. Pervere (1947) | Trustee | Since 2007 | Retired | | 41 | Intraware, Inc. (2003 to 2009) |
Myron S. Scholes (1941) | Trustee | Since 1980 | Chairman, Platinum Grove Asset Management, L.P. (asset manager) (1999 to 2009); Frank E. Buck Professor of Finance-Emeritus, Stanford Graduate School of Business (1996 to present) | | 41 | Dimensional Fund Advisors (investment advisor); CME Group, Inc. (futures and options exchange) |
John B. Shoven (1947) | Trustee | Since 2002 | Professor of Economics, Stanford University
(1973 to present) | | 41 | Cadence Design Systems; Exponent; Financial Engines |
| |
Interested Trustee |
Jonathan S. Thomas
(1963) | Trustee and President | Since 2007 | President and Chief Executive Officer, ACC (March 2007 to present). Also serves as Chief Executive Officer and Manager, ACS; Executive Vice President, ACIM; Director, ACC, ACIM and other ACC subsidiaries | | 106 | None |
Officers
The following table presents certain information about the executive officers of the funds. Each officer serves as an officer for each of the 15 investment companies in the American Century family of funds, unless otherwise noted. No officer is compensated for his or her service as an officer of the funds. The listed officers are interested persons of the funds and are appointed or re-appointed on an annual basis. The mailing address for each of the officers listed below is 4500 Main Street, Kansas City, Missouri 64111.
| | | | |
Name
(Year of Birth) | Offices with the Funds | | Principal Occupation(s) During the Past Five Years |
Jonathan S. Thomas
(1963) | Trustee and President since 2007 | | President and Chief Executive Officer, ACC (March 2007 to present). Also serves as Chief Executive Officer and Manager, ACS; Executive Vice President, ACIM; Director, ACC, ACIM and other ACC subsidiaries |
Maryanne L. Roepke
(1956) | Chief Compliance Officer since 2006 and Senior Vice President since 2000 | | Chief Compliance Officer, American Century funds, ACIM and ACS (August 2006 to present). Also serves as Senior Vice President, ACS |
Charles A. Etherington (1957) | General Counsel since 2007 and Senior Vice President since 2006 | | Attorney, ACC (February 1994 to present); Vice President, ACC (November 2005 to present); General Counsel, ACC (March 2007 to present). Also serves as General Counsel, ACIM, ACS, ACIS and other ACC subsidiaries; and Senior Vice President, ACIM and ACS |
C. Jean Wade (1964) | Vice President, Treasurer and Chief Financial Officer since 2012 | | Vice President, ACS (February 2000 to present) |
Robert J. Leach (1966) | Vice President since 2006 and Assistant Treasurer since 2012 | | Vice President, ACS (February 2000 to present) |
David H. Reinmiller (1963) | Vice President since 2001 | | Attorney, ACC (January 1994 to present); Associate General Counsel, ACC (January 2001 to present). Also serves as Vice President, ACIM and ACS |
Ward D. Stauffer (1960) | Secretary since 2005 | | Attorney, ACC (June 2003 to present) |
The Statement of Additional Information has additional information about the fund’s trustees and is available without charge, upon request, by calling 1-800-345-2021.
Proxy Voting Guidelines
American Century Investment Management, Inc., the fund’s investment advisor, is responsible for exercising the voting rights associated with the securities purchased and/or held by the fund. A description of the policies and procedures the advisor uses in fulfilling this responsibility is available without charge, upon request, by calling 1-800-345-2021. It is also available on American Century Investments’ website at americancentury.com and on the Securities and Exchange Commission’s website at sec.gov. Information regarding how the investment advisor voted proxies relating to portfolio securities during the most recent 12-month period ended June 30 is available on the “About Us” page at americancentury.com. It is also available at sec.gov.
Quarterly Portfolio Disclosure
The fund files its complete schedule of portfolio holdings with the Securities and Exchange Commission (SEC) for the first and third quarters of each fiscal year on Form N-Q. The fund’s Forms N-Q are available on the SEC’s website at sec.gov, and may be reviewed and copied at the SEC’s Public Reference Room in Washington, DC. Information on the operation of the Public Reference Room may be obtained by calling 1-800-SEC-0330. The fund also makes its complete schedule of portfolio holdings for the most recent quarter of its fiscal year available on its website at americancentury.com and, upon request, by calling 1-800-345-2021.
Other Tax Information
The following information is provided pursuant to provisions of the Internal Revenue Code.
The fund designates $2,278,113 as exempt interest dividends for the fiscal year ended May 31, 2013.
Contact Us | americancentury.com |
Automated Information Line | 1-800-345-8765 |
Investor Services Representative | 1-800-345-2021
or 816-531-5575 |
Investors Using Advisors | 1-800-378-9878 |
Business, Not-For-Profit, Employer-Sponsored Retirement Plans | 1-800-345-3533 |
Banks and Trust Companies, Broker-Dealers, Financial Professionals, Insurance Companies | 1-800-345-6488 |
Telecommunications Device for the Deaf | 1-800-634-4113 |
American Century Municipal Trust
Investment Advisor:
American Century Investment Management, Inc.
Kansas City, Missouri
This report and the statements it contains are submitted for the general information of our shareholders. The report is not authorized for distribution to prospective investors unless preceded or accompanied by an effective prospectus.
©2013 American Century Proprietary Holdings, Inc. All rights reserved.
CL-ANN-78951 1307
ANNUAL REPORT May 31, 2013
Tax-Free Money Market Fund
President’s Letter | 2 |
Market Perspective | 3 |
Performance | 4 |
Fund Characteristics | 5 |
Shareholder Fee Example | 6 |
Schedule of Investments | 8 |
Statement of Assets and Liabilities | 13 |
Statement of Operations | 14 |
Statement of Changes in Net Assets | 15 |
Notes to Financial Statements | 16 |
Financial Highlights | 19 |
Report of Independent Registered Public Accounting Firm | 20 |
Management | 21 |
Additional Information | 24 |
Any opinions expressed in this report reflect those of the author as of the date of the report, and do not necessarily represent the opinions of American Century Investments® or any other person in the American Century Investments organization. Any such opinions are subject to change at any time based upon market or other conditions and American Century Investments disclaims any responsibility to update such opinions. These opinions may not be relied upon as investment advice and, because investment decisions made by American Century Investments funds are based on numerous factors, may not be relied upon as an indication of trading intent on behalf of any American Century Investments fund. Security examples are used for representational purposes only and are not intended as recommendations to purchase or sell securities. Performance information for comparative indices and securities is provided to American Century Investments by third party vendors. To the best of American Century Investments’ knowledge, such information is accurate at the time of printing.
Jonathan Thomas
Dear Investor:
Thank you for reviewing this annual report for the 12 months ended May 31, 2013. It provides investment performance, market analysis, and portfolio information, presented with the expert perspective of our portfolio management team.
Annual reports remain important vehicles for conveying information about fund returns, including key factors that affected fund performance. For additional, updated investment and market insights, we encourage you to visit our website, americancentury.com.
Positive Fiscal-Year Returns for Stocks and Municipal Bonds
The 12-month reporting period ended May 31, 2013 started with softening global economic conditions and growing uncertainty in the summer of 2012 as the U.S. elections and dreaded U.S. fiscal deadlines loomed ahead. These factors, and the recession fears they represented, helped provoke aggressive monetary intervention by central banks, which encouraged investors to take more risk.
In this “risk-on” investing environment, stocks generally outperformed bonds, broad non-U.S. stock measures outperformed their broad U.S. stock counterparts, and U.S. municipal bonds generally outperformed U.S. Treasury bonds.
Non-U.S., U.S. mid-cap, small-cap, and value stock indices achieved performance leadership during the period, outpacing the S&P 500 Index’s 27.28% return. The MSCI EAFE Index, for example, returned 31.62%. U.S. bond index returns ranged from roughly 15% gains for corporate high-yield indices all the way down to negative returns for longer-maturity U.S. Treasury benchmarks. For example, the 10-year U.S. Treasury note returned –2.17%, according to Barclays, as its yield rose over half a percentage point, from 1.56% to 2.13%.
Municipal bonds, which enjoyed strong demand for much of the period, generally fit more in the middle of the U.S. bond return spectrum. The Barclays Municipal Bond Index advanced 3.05%.
The U.S. economy is showing signs of improvement in 2013, particularly the long-depressed housing market. However, U.S. economic growth remains subpar compared with past recession recoveries, and is still vulnerable to fiscal, financial, and overseas threats that could trigger further slowdowns and market volatility.
Under these conditions, we continue to believe in a disciplined, diversified, long-term investment approach, using professionally managed stock and bond portfolios—as appropriate—for meeting financial goals. We appreciate your continued trust in us in this challenging environment.
Sincerely,
Jonathan Thomas
President and Chief Executive Officer
American Century Investments
By David MacEwen, Chief Investment Officer, Fixed Income
Municipals Outpaced Treasuries
For the 12-month period ended May 31, 2013, municipal bonds (munis) posted positive performance. Munis were among the fixed income market’s leading performers for the period, outpacing U.S. Treasury securities and the broad taxable investment-grade bond benchmark (Barclays U.S. Aggregate Bond Index) in an environment of generally improving state finances and stable-to-improving credit trends. Furthermore, in the ongoing low-yield environment, muni yields looked relatively attractive, particularly to high-tax-bracket investors on an after-tax basis.
Once again, investors wavered between risk taking and risk aversion. Throughout the period, mixed economic data and political uncertainty (which emerged prior to and following November’s presidential election and as Congress debated tax policy and the federal budget) influenced market sentiment. But, overall, the modest economic gains were sufficient for risk taking to prevail, and lower-quality, higher-yielding securities drove performance in the fixed income market.
Throughout the period, demand for munis remained relatively strong and supply was generally robust, primarily due to continued refinancings from municipalities taking advantage of low interest rates. The Federal Reserve (the Fed) continued to support the low-rate environment, keeping its overnight interest rate target near 0%. In addition, the Fed launched its third and most aggressive quantitative easing program (QE3), which has the Fed purchasing $40 billion of mortgage-backed securities and $45 billion in Treasury securities each month until economic growth and employment improve.
Conditions Favored Longer-Maturity and High-Yield Munis
Against this low-rate backdrop, investors’ demand for yield led to solid results from longer-maturity and lower-quality munis, which outperformed the broad muni benchmark for the 12-month period. Additionally, May 2013 marked the 18th-consecutive month of positive performance for high-yield munis.
Volatility Likely on the Rise
In the final month of the reporting period, Treasury yields increased sharply (putting upward pressure on muni yields as well) in anticipation that the Fed may start scaling back its bond purchases later in 2013. This speculation sparked a selloff among bonds, but this spike in rates largely retraced an earlier decline in yields.
U.S. Fixed-Income Total Returns |
For the 12 months ended May 31, 2013 |
Barclays Municipal Market Indices | | Barclays U.S. Taxable Market Indices |
Municipal High Yield Bond | 11.88% | | Aggregate Bond | 0.92% |
Long-Term Municipal Bond | 4.69% | | Treasury Bond | -0.89% |
Municipal Bond | 3.05% | | | |
7 Year Municipal Bond | 2.07% | | | |
Total Returns as of May 31, 2013 |
| | | | Average Annual Returns | |
| | Ticker Symbol | 1 year | 5 years | 10 years | Since Inception | Inception Date |
Investor Class(1) | BNTXX | 0.01% | 0.35% | 1.24% | 2.78% | 7/31/84 |
(1) | Returns would have been lower if a portion of the management fee had not been waived. |
Total Annual Fund Operating Expenses |
Investor Class 0.50% |
The total annual fund operating expenses shown is as stated in the fund’s prospectus current as of the date of this report. The prospectus may vary from the expense ratio shown elsewhere in this report because it is based on a different time period, includes acquired fund fees and expenses, and, if applicable, does not include fee waivers or expense reimbursements.
Data presented reflect past performance. Past performance is no guarantee of future results. Current performance may be higher or lower than the performance shown. To obtain performance data current to the most recent month end, please call 1-800-345-2021 or visit americancentury.com. Investment income may be subject to certain state and local taxes and, depending on your tax status, the federal alternative minimum tax (AMT). Capital gains are not exempt from state and federal income tax.
An investment in the fund is not insured or guaranteed by the Federal Deposit Insurance Corporation or any other government agency. Although the fund seeks to preserve the value of your investment at $1.00 per share, it is possible to lose money by investing in the fund.
The 7-day current yield more closely reflects the current earnings of the fund than the total return.
May 31, 2013 | |
7-Day Current Yield | |
After waiver(1) | 0.01% |
Before waiver | -0.17% |
7-Day Effective Yield | |
After waiver(1) | 0.01% |
(1) Yields would have been lower if a portion of the management fee had not been waived. |
| | |
Portfolio at a Glance | |
Weighted Average Maturity | 25 days |
Weighted Average Life | 25 days |
| | |
Portfolio Composition by Maturity | % of fund investments |
1-30 days | 87% |
31-90 days | 3% |
91-180 days | 8% |
More than 180 days | 2% |
Fund shareholders may incur two types of costs: (1) transaction costs, including sales charges (loads) on purchase payments and redemption/exchange fees; and (2) ongoing costs, including management fees; distribution and service (12b-1) fees; and other fund expenses. This example is intended to help you understand your ongoing costs (in dollars) of investing in your fund and to compare these costs with the ongoing cost of investing in other mutual funds.
The example is based on an investment of $1,000 made at the beginning of the period and held for the entire period from December 1, 2012 to May 31, 2013.
Actual Expenses
The table provides information about actual account values and actual expenses for each class. You may use the information, together with the amount you invested, to estimate the expenses that you paid over the period. First, identify the share class you own. Then simply divide your account value by $1,000 (for example, an $8,600 account value divided by $1,000 = 8.6), then multiply the result by the number under the heading “Expenses Paid During Period” to estimate the expenses you paid on your account during this period.
If you hold Investor Class shares of any American Century Investments fund, or Institutional Class shares of the American Century Diversified Bond Fund, in an American Century Investments account (i.e., not a financial intermediary or retirement plan account), American Century Investments may charge you a $12.50 semiannual account maintenance fee if the value of those shares is less than $10,000. We will redeem shares automatically in one of your accounts to pay the $12.50 fee. In determining your total eligible investment amount, we will include your investments in all personal accounts (including American Century Investments Brokerage accounts) registered under your Social Security number. Personal accounts include individual accounts, joint accounts, UGMA/UTMA accounts, personal trusts, Coverdell Education Savings Accounts and IRAs (including traditional, Roth, Rollover, SEP-, SARSEP- and SIMPLE-IRAs), and certain other retirement accounts. If you have only business, business retirement, employer-sponsored or American Century Investments Brokerage accounts, you are currently not subject to this fee. If you are subject to the Account Maintenance Fee, your account value could be reduced by the fee amount.
Hypothetical Example for Comparison Purposes
The table also provides information about hypothetical account values and hypothetical expenses based on the actual expense ratio of each class of your fund and an assumed rate of return of 5% per year before expenses, which is not the actual return of a fund’s share class. The hypothetical account values and expenses may not be used to estimate the actual ending account balance or expenses you paid for the period. You may use this information to compare the ongoing costs of investing in your fund and other funds. To do so, compare this 5% hypothetical example with the 5% hypothetical examples that appear in the shareholder reports of the other funds.
Please note that the expenses shown in the table are meant to highlight your ongoing costs only and do not reflect any transactional costs, such as sales charges (loads) or redemption/exchange fees. Therefore, the table is useful in comparing ongoing costs only, and will not help you determine the relative total costs of owning different funds. In addition, if these transactional costs were included, your costs would have been higher.
| | | | | |
| | Beginning
Account Value 12/1/12 | Ending
Account Value 5/31/13 | Expenses Paid During Period(1) 12/1/12 – 5/31/13 | Annualized
Expense Ratio(1) |
Actual | | | | |
Investor Class
(after waiver) | $1,000 | $1,000.00 | $1.80 | 0.36% |
Investor Class
(before waiver) | $1,000 | $1,000.00(2) | $2.49 | 0.50% |
Hypothetical | | | | |
Investor Class
(after waiver) | $1,000 | $1,023.14 | $1.82 | 0.36% |
Investor Class
(before waiver) | $1,000 | $1,022.44 | $2.52 | 0.50% |
(1) | Expenses are equal to the class’s annualized expense ratio listed in the table above, multiplied by the average account value over the period, multiplied by 182, the number of days in the most recent fiscal half-year, divided by 365, to reflect the one-half year period. |
(2) | Ending account value assumes the return earned after waiver and would have been lower if a portion of the management fee had not been waived. |
MAY 31, 2013
| | | | | | | |
| | | Principal Amount | | | Value | |
Municipal Securities — 98.9% | |
ALABAMA — 1.0% | |
Troy Health Care Authority Rev., (Southeast Rural Health), VRDN, 0.22%, 6/6/13 (LOC: Troy Bank and Trust Co. and FHLB) | | $ 1,925,000 | | | $ 1,925,000 | |
ARIZONA — 0.7% | | | | | | |
Phoenix Industrial Development Authority Rev., (Southwestern College of Phoenix), VRDN, 0.15%, 6/6/13 (LOC: Comerica Bank) | | 1,210,000 | | | 1,210,000 | |
CALIFORNIA — 11.6% | | | | | | |
Alameda County Industrial Development Authority Rev., (Bat Properties LLC), VRDN, 0.35%, 6/6/13 (LOC: Bank of the West) | | 500,000 | | | 500,000 | |
California Economic Development Financing Authority Rev., Series 1996 A, (Joseph Schmidt), VRDN, 0.35%, 6/6/13 (LOC: Bank of the West and BNP Paribas) | | 2,800,000 | | | 2,800,000 | |
California Infrastructure & Economic Development Bank Rev., (Haig Precision Manufacturing Corp.), VRDN, 0.35%, 6/6/13 (LOC: Bank of the West) | | 1,010,000 | | | 1,010,000 | |
California Infrastructure & Economic Development Bank Rev., Series 2011 A, (Bay Photo, Inc.), VRDN, 0.22%, 6/6/13 (LOC: Comerica Bank) | | 1,675,000 | | | 1,675,000 | |
Golden State Tobacco Securitization Corp. Rev., Series 2003 B, 5.50%, 6/1/43 | | 1,075,000 | | | 1,075,000 | |
Town of Hillsborough COP, Series 2003 A, (Water & Sewer System), VRDN, 0.19%, 6/6/13 (SBBPA: JP Morgan Chase Bank N.A.) | | 5,800,000 | | | 5,800,000 | |
Victorville Joint Powers Finance Authority Lease Rev., Series 2007 A, (Cogeneration Facility), VRDN, 1.62%, 6/6/13 (LOC: BNP Paribas) | | 8,440,000 | | | 8,440,000 | |
| | | | | | 21,300,000 | |
COLORADO — 2.7% | | | | | | |
Colorado Educational & Cultural Facilities Authority Rev., (YMCA Metro Denver), VRDN, 0.23%, 6/6/13 (LOC: Wells Fargo Bank N.A.) | | 875,000 | | | 875,000 | |
Colorado Health Facilities Authority Rev., Series 2008 D2, (Catholic Health Initiatives), VRN, 5.25%, 11/12/13 | | 1,155,000 | | | 1,180,694 | |
County of Boulder Rev., (Mental Health Center), VRDN, 0.23%, 6/6/13 (LOC: Wells Fargo Bank N.A.) | | 1,275,000 | | | 1,275,000 | |
Midcities Metropolitan District No. 1 Rev., Series 2004 B, VRDN, 0.40%, 6/6/13 (LOC: BNP Paribas) | | 1,540,000 | | | 1,540,000 | |
| | | | | | 4,870,694 | |
FLORIDA — 6.5% | | | | | | |
County of DeSoto Industrial Development Rev., (Tremron, Inc.), VRDN, 0.22%, 6/6/13 (LOC: Branch Banking & Trust) | | 1,200,000 | | | 1,200,000 | |
County of Escambia Rev., (Daws Manufacturing Co., Inc.), VRDN, 0.60%, 6/6/13 (LOC: Bank of America N.A.) | | 1,335,000 | | | 1,335,000 | |
JP Morgan Chase PUTTERs/DRIVERs Trust Rev., Series 2009-3439, VRDN, 0.22%, 6/6/13 (AGM-CR XLCA) (LIQ FAC: JP Morgan Chase Bank N.A.)(1) | | 3,695,000 | | | 3,695,000 | |
Sarasota County Health Facilities Authority Rev., (Bay Village Health Care Facilities), VRDN, 0.26%, 6/6/13 (LOC: Bank of America N.A.) | | 4,100,000 | | | 4,100,000 | |
State of Florida Education System University System Improvement Rev., Series 2003 A, 5.00%, 7/1/13 (Ambac) | | 1,475,000 | | | 1,480,759 | |
| | | | | | 11,810,759 | |
GEORGIA — 0.8% | | | | | | |
Stephens County Development Authority Solid Waste Disposable Facilities Rev., (Caterpillar, Inc.), VRDN, 0.47%, 6/6/13 | | 1,520,000 | | | 1,520,000 | |
IDAHO — 3.0% | | | | | | |
Idaho Housing & Finance Association Multifamily Housing Rev., Series 2011 A, (Traditions At Boise Apartments), VRDN, 0.14%, 6/5/13 (LOC: East West Bank and FHLMC) (SBBPA: FHLB) | | $ 5,500,000 | | | $ 5,500,000 | |
ILLINOIS — 5.4% | | | | | | |
Chicago Industrial Development Rev., (Evans Food Products Company, Inc.), VRDN, 0.40%, 6/6/13 (LOC: Bank of America N.A.) | | 1,770,000 | | | 1,770,000 | |
Illinois Finance Authority Rev., (Radiological Society), VRDN, 0.23%, 6/6/13 (LOC: JP Morgan Chase Bank N.A.) | | 690,000 | | | 690,000 | |
Illinois Finance Authority Rev., (The Uniform Law Foundation), VRDN, 0.16%, 6/6/13 (LOC: PNC Bank N.A.) | | 2,740,000 | | | 2,740,000 | |
Illinois Housing Development Authority Multi-Family Housing Rev., (Rome Meadows), VRDN, 0.51%, 6/6/13 (LOC: First National Bank and FHLB) | | 1,845,000 | | | 1,845,000 | |
Rock Island County Metropolitan Airport Authority Rev., (Elliott Aviation), VRDN, 0.26%, 6/5/13 (LOC: U.S. Bank N.A.) | | 1,795,000 | | | 1,795,000 | |
State of Illinois Unemployment Insurance Fund Building Receipts Rev., Series 2012 A, 2.00%, 6/15/13 | | 1,000,000 | | | 1,000,657 | |
| | | | | | 9,840,657 | |
INDIANA — 0.5% | | | | | | |
Indiana Health Facility Financing Authority Rev., (Stone Belt Arc, Inc.), VRDN, 0.23%, 6/5/13 (LOC: JP Morgan Chase Bank N.A.) | | 400,000 | | | 400,000 | |
University of Southern Indiana Rev., Series 1999 G, (Student Fee), VRDN, 0.23%, 6/5/13 (LOC: JP Morgan Chase Bank N.A.) | | 450,000 | | | 450,000 | |
| | | | | | 850,000 | |
IOWA — 4.1% | | | | | | |
Grinnell Hospital Rev., (Grinnell Regional Medical Center), VRDN, 0.13%, 6/3/13 (LOC: U.S. Bank N.A.) | | 2,900,000 | | | 2,900,000 | |
Iowa Finance Authority Economic Development Rev., Series 2009 B, (Midwestern Disaster Area), VRDN, 0.17%, 6/6/13 | | 4,000,000 | | | 4,000,000 | |
Iowa Finance Authority Industrial Development Rev., (Embria Health Sciences), VRDN, 0.28%, 6/6/13 (LOC: Wells Fargo Bank N.A.) | | 675,000 | | | 675,000 | |
| | | | | | 7,575,000 | |
KENTUCKY — 1.4% | | | | | | |
City of Middletown Educational Building Rev., (Christian Academy of Louisville, Inc.), VRDN, 0.18%, 6/6/13 (LOC: JP Morgan Chase Bank N.A.) | | 2,500,000 | | | 2,500,000 | |
LOUISIANA — 1.8% | | | | | | |
Terrebonne Economic Development Authority Gulf Opportunity Zone Rev., (Buquet Distribution Co.), VRDN, 0.38%, 6/6/13 (LOC: Community Bank and FHLB) | | 3,335,000 | | | 3,335,000 | |
MARYLAND — 4.8% | | | | | | |
Baltimore Industrial Development Authority Rev., (Baltimore Cap Acquisition), VRDN, 0.17%, 6/5/13 (LOC: Bayerische Landesbank) | | 7,300,000 | | | 7,300,000 | |
Howard County Economic Development Rev., (Eight P CPL LLC), VRDN, 0.34%, 6/6/13 (LOC: Sovereign Bank N.A. and U.S. Bank N.A.) | | 1,500,000 | | | 1,500,000 | |
| | | | | | 8,800,000 | |
MASSACHUSETTS — 3.3% | |
Massachusetts Bay Transportation Authority Rev., (General Transportation System), VRDN, 0.15%, 6/5/13 (SBBPA: Landesbank Baden-Wurttemberg) | | 4,910,000 | | | 4,910,000 | |
Massachusetts Industrial Finance Agency Rev., (Cambridge Isotope Labs, Inc.), VRDN, 0.73%, 6/5/13 (LOC: Bank of America N.A.) | | 605,000 | | | 605,000 | |
Massachusetts Industrial Finance Agency Rev., (Hi-Tech Mold & Tool, Inc.), VRDN, 0.26%, 6/5/13 (LOC: TD Bank N.A.) | | $ 600,000 | | | $ 600,000 | |
| | | | | | 6,115,000 | |
MINNESOTA — 0.8% | | | | | | |
City of Cohasset Rev., Series 1997 C, (Minnesota Power & Light Co.), VRDN, 0.20%, 6/6/13 (LOC: JP Morgan Chase Bank N.A.) | | 1,450,000 | | | 1,450,000 | |
MISSISSIPPI — 0.9% | | | | | | |
Mississippi Business Finance Corp. Rev., Series 2004 B, VRDN, 0.24%, 6/6/13 (LOC: U.S. Bank N.A. and BancorpSouth Bank) | | 1,580,000 | | | 1,580,000 | |
MISSOURI — 0.7% | | | | | | |
Missouri State Health & Educational Facilities Authority Rev., (Academie Lafayette), VRDN, 0.31%, 6/6/13 (LOC: Bank of America N.A.) | | 1,235,000 | | | 1,235,000 | |
NEVADA — 3.9% | | | | | | |
Clark County Airport System Rev., Series 2013 C2, (Junior Lien) 2.00%, 7/1/14 | | 3,500,000 | | | 3,557,575 | |
Nevada Housing Division Rev., (Multi Unit Housing), VRDN, 0.23%, 6/6/13 (LOC: Citibank N.A.) | | 2,465,000 | | | 2,465,000 | |
Nevada Housing Division Rev., (Multi Unit Housing), VRDN, 0.23%, 6/6/13 (LOC: Citibank N.A.) | | 1,065,000 | | | 1,065,000 | |
| | | | | | 7,087,575 | |
NEW YORK — 6.1% | | | | | | |
New York State Dormitory Authority Lease Rev., Series 2003 B, VRN, 5.25%, 7/1/13 (XLCA) | | 4,000,000 | | | 4,016,286 | |
North Amityville Fire Co., Inc. Rev., VRDN, 0.35%, 6/6/13 (LOC: Citibank N.A.) | | 3,165,000 | | | 3,165,000 | |
Rockland County Industrial Development Agency Rev., (Jawonio, Inc., Project), VRDN, 0.17%, 6/5/13 (LOC: TD Bank N.A.) | | 2,290,000 | | | 2,290,000 | |
Suffolk County Industrial Development Agency Rev., (JBC Realty LLC), VRDN, 0.41%, 6/5/13 (LOC: JP Morgan Chase Bank N.A.) | | 1,660,000 | | | 1,660,000 | |
| | | | | | 11,131,286 | |
NORTH CAROLINA — 3.0% | |
North Carolina Capital Facilities Finance Agency Rev., (Lees-McRae College, Inc.), VRDN, 0.23%, 6/6/13 (LOC: Branch Banking & Trust) | | 4,720,000 | | | 4,720,000 | |
North Carolina Medical Care Commission Healthcare Facilities Rev., (Stanley Total Living Center), VRDN, 0.23%, 6/6/13 (LOC: Wells Fargo Bank N.A.) | | 705,000 | | | 705,000 | |
| | | | | | 5,425,000 | |
NORTH DAKOTA — 0.2% | | | | | | |
Grand Forks Health Care Facilities Rev., Series 1996 A, (The United Hospital Obligation Group), VRDN, 0.12%, 6/3/13 (LOC: Bank of America N.A.) | | 300,000 | | | 300,000 | |
OHIO — 6.2% | | | | | | |
County of Montgomery Rev., Series 2008 D2, (Catholic Health Initiatives), VRN, 5.25%, 11/12/13 | | 7,500,000 | | | 7,665,689 | |
County of Putnam Healthcare Facilities Rev., (Hilty Memorial Home), VRDN, 0.17%, 6/6/13 (LOC: First Federal Bank of Midwest and FHLB) | | 3,740,000 | | | 3,740,000 | |
| | | | | | 11,405,689 | |
OKLAHOMA — 2.2% | | | | | | |
Oklahoma Development Finance Authority Health Facilities Rev., (Duncan Regional Hospital, Inc.), VRDN, 0.14%, 6/3/13 (LOC: JP Morgan Chase Bank N.A.) | | 4,000,000 | | | 4,000,000 | |
PENNSYLVANIA — 2.0% | | | | | | |
Chambersburg Municipal Authority Rev., (Wilson College Project), VRDN, 0.16%, 6/6/13 (LOC: Bank of America N.A.) | | 1,700,000 | | | 1,700,000 | |
Philadelphia Authority for Industrial Development Rev., Series 2007 B, (Chestnut Hill College), VRDN, 0.23%, 6/6/13 (LOC: Wells Fargo Bank N.A.) | | $ 2,000,000 | | | $ 2,000,000 | |
| | | | | | 3,700,000 | |
SOUTH DAKOTA — 1.0% | | | | | | |
South Dakota Housing Development Authority Rev., Series 2003 C-1, (Home Ownership Mortgage), VRDN, 0.21%, 6/6/13 (SBBPA: Landesbank Hessen-Thuringen Girozentrale) | | 1,900,000 | | | 1,900,000 | |
TENNESSEE — 1.7% | | | | | | |
Clarksville Public Building Authority Rev., (Adjusted Financing Morristown Loans), VRDN, 0.17%, 6/3/13 (LOC: Bank of America N.A.) | | 645,000 | | | 645,000 | |
Montgomery County Public Building Authority Rev., (Tennessee County Loan Pool), VRDN, 0.17%, 6/3/13 (LOC: Bank of America N.A.) | | 2,485,000 | | | 2,485,000 | |
| | | | | | 3,130,000 | |
TEXAS — 14.4% | | | | | | |
Brazos Harbor Industrial Development Corp. Rev., (BASF Corp.), VRDN, 0.23%, 6/5/13 | | 10,500,000 | | | 10,500,000 | |
DeSoto Industrial Development Authority Rev., (National Service Industries, Inc.), VRDN, 0.23%, 6/6/13 (LOC: Wells Fargo Bank N.A.) | | 2,000,000 | | | 2,000,000 | |
Mission Economic Development Corp. Industrial Development Rev., (CMI Project), VRDN, 0.28%, 6/6/13 (LOC: Wells Fargo Bank N.A.) | | 3,200,000 | | | 3,200,000 | |
Muleshoe Economic Development Corps. Industrial Development Rev., (John Lyle & Grace Ajean), VRDN, 0.42%, 6/6/13 (LOC: Wells Fargo Bank N.A.) | | 4,570,000 | | | 4,570,000 | |
State of Texas Rev., 2.50%, 8/30/13 | | 6,000,000 | | | 6,033,643 | |
| | | | | | 26,303,643 | |
UTAH — 1.4% | | | | | | |
City of Logan Industrial Development Rev., (Scientific Technology), VRDN, 0.54%, 6/6/13 (LOC: Bank of the West) | | 1,350,000 | | | 1,350,000 | |
Duchesne County School District Rev., VRDN, 0.23%, 6/6/13 (LOC: U.S. Bank N.A.) | | 515,000 | | | 515,000 | |
Ogden City Redevelopment Agency Tax Increment Rev., Series 2005 A, VRDN, 0.23%, 6/6/13 (LOC: Wells Fargo Bank N.A.) | | 730,000 | | | 730,000 | |
| | | | | | 2,595,000 | |
VIRGINIA — 0.5% | | | | | | |
Orange County Industrial Development Authority Rev., (Montpelier Foundation), VRDN, 0.18%, 6/6/13 (LOC: Wells Fargo Bank N.A.) | | 1,000,000 | | | 1,000,000 | |
WASHINGTON — 4.3% | | | | | | |
Snohomish County Housing Authority Rev., (Autumn Chase Apartments Project), VRDN, 0.17%, 6/6/13 (LOC: Bank of America N.A.) | | 1,500,000 | | | 1,500,000 | |
Washington Health Care Facilities Authority Rev., Series 2012 C, (Providence Health & Services), VRDN, 0.14%, 6/6/13 (SBBPA: U.S. Bank N.A.) | | 1,400,000 | | | 1,400,000 | |
Washington State Housing Finance Commission Rev., Series 2000 A, (St. Vincent De Paul Project), VRDN, 0.19%, 6/6/13 (LOC: Wells Fargo Bank N.A.) | | 960,000 | | | 960,000 | |
Washington State Housing Finance Commission Rev., Series 2009 B, (Pioneer Human Services), VRDN, 0.17%, 6/5/13 (LOC: U.S. Bank N.A.) | | 800,000 | | | 800,000 | |
Yakima County Public Corps. Rev., (Macro Plastics, Inc.), VRDN, 0.40%, 6/5/13 (LOC: Bank of the West) | | 3,200,000 | | | 3,200,000 | |
| | | | | | 7,860,000 | |
WEST VIRGINIA — 1.0% | | | | | | |
Harrison County Industrial Development Rev., (Fox Grocery Company), VRDN, 0.15%, 6/6/13 (LOC: U.S. Bank N.A.) | | 1,900,000 | | | 1,900,000 | |
WISCONSIN — 1.0% | | | | | | |
Milwaukee Redevelopment Authority Rev., (La Causa, Inc.), VRDN, 0.24%, 6/5/13 (LOC: U.S. Bank N.A.) | | $ 1,790,000 | | | $ 1,790,000 | |
TOTAL MUNICIPAL SECURITIES | | | 180,945,303 | |
Commercial Paper — 1.9% | |
San Diego County Water Authority, 0.16%, 6/5/13(2) | | 3,500,000 | | | 3,500,000 | |
TOTAL INVESTMENT SECURITIES — 100.8% | | | | | 184,445,303 | |
OTHER ASSETS AND LIABILITIES — (0.8)% | | | | | (1,501,711 | ) |
TOTAL NET ASSETS — 100.0% | | | $182,943,592 | |
Notes to Schedule of Investments
AGM-CR = Assured Guaranty Municipal Corporation - Custodian Receipts
COP = Certificates of Participation
DRIVERs = Derivative Inverse Tax-Exempt Receipts
FHLB = Federal Home Loan Bank
FHLMC = Federal Home Loan Mortgage Corporation
LIQ FAC = Liquidity Facilities
LOC = Letter of Credit
PUTTERs = Puttable Tax-Exempt Receipts
SBBPA = Standby Bond Purchase Agreement
VRDN = Variable Rate Demand Note. Interest reset date is indicated. Rate shown is effective at the period end.
VRN = Variable Rate Note. Interest reset date is indicated. Rate shown is effective at the period end.
XLCA = XL Capital Ltd.
(1) | Security was purchased under Rule 144A or Section 4(2) of the Securities Act of 1933 or is a private placement and, unless registered under the Act or exempted from registration, may only be sold to qualified institutional investors. The aggregate value of these securities at the period end was $3,695,000, which represented 2.0% of total net assets. |
(2) | The rate indicated is the yield to maturity at purchase. |
See Notes to Financial Statements.
Statement of Assets and Liabilities |
MAY 31, 2013 | |
Assets | |
Investment securities, at value (amortized cost and cost for federal income tax purposes) | | $184,445,303 | |
Cash | | 259,814 | |
Receivable for investments sold | | 1,300,000 | |
Receivable for capital shares sold | | 594,563 | |
Interest receivable | | 406,372 | |
| | | 187,006,052 | |
| | | | |
Liabilities | | | |
Payable for investments purchased | | 3,557,575 | |
Payable for capital shares redeemed | | 453,193 | |
Accrued management fees | | 51,692 | |
| | | 4,062,460 | |
| | | | |
Net Assets | | $182,943,592 | |
| | | | |
Investor Class Capital Shares | | | |
Shares outstanding (unlimited number of shares authorized) | | 182,963,876 | |
| | | | |
Net Asset Value Per Share | | $1.00 | |
| | | | |
Net Assets Consist of: | | | |
Capital paid in | | $182,944,046 | |
Accumulated net realized loss | | (454 | ) |
| | | $182,943,592 | |
See Notes to Financial Statements.
YEAR ENDED MAY 31, 2013 | |
Investment Income (Loss) | |
Income: | | | |
Interest | | $ 813,543 | |
| | | | |
Expenses: | | | |
Management fees | | 978,964 | |
Trustees’ fees and expenses | | 9,242 | |
Other expenses | | 769 | |
| | | 988,975 | |
Fees waived | | (194,986 | ) |
| | | 793,989 | |
| | | | |
Net investment income (loss) | | 19,554 | |
| | | | |
Net realized gain (loss) on investment transactions | | 1,599 | |
| | | | |
Net Increase (Decrease) in Net Assets Resulting from Operations | | $ 21,153 | |
See Notes to Financial Statements.
Statement of Changes in Net Assets |
YEARS ENDED MAY 31, 2013 AND MAY 31, 2012 | |
Increase (Decrease) in Net Assets | | May 31, 2013 | | | May 31, 2012 | |
Operations | |
Net investment income (loss) | | $ 19,554 | | | $ 29,005 | |
Net realized gain (loss) | | 1,599 | | | 1,202 | |
Net increase (decrease) in net assets resulting from operations | | 21,153 | | | 30,207 | |
| | | | | | | |
Distributions to Shareholders | | | | | | |
From net investment income | | (19,554 | ) | | (29,005 | ) |
| | | | | | | |
Capital Share Transactions | | | | | | |
Proceeds from shares sold | | 87,899,338 | | | 94,230,260 | |
Proceeds from reinvestment of distributions | | 19,421 | | | 28,530 | |
Payments for shares redeemed | | (113,214,332 | ) | | (123,411,215 | ) |
Net increase (decrease) in net assets from capital share transactions | | (25,295,573 | ) | | (29,152,425 | ) |
| | | | | | | |
Net increase (decrease) in net assets | | (25,293,974 | ) | | (29,151,223 | ) |
| | | | | | | |
Net Assets | | | | | | |
Beginning of period | | 208,237,566 | | | 237,388,789 | |
End of period | | $ 182,943,592 | | | $ 208,237,566 | |
| | | | | | | |
Transactions in Shares of the Fund | | | | | | |
Sold | | 87,899,338 | | | 94,230,260 | |
Issued in reinvestment of distributions | | 19,421 | | | 28,530 | |
Redeemed | | (113,214,332 | ) | | (123,411,215 | ) |
Net increase (decrease) in shares of the fund | | (25,295,573 | ) | | (29,152,425 | ) |
See Notes to Financial Statements.
Notes to Financial Statements |
May 31, 2013
1. Organization
American Century Municipal Trust (the trust) is registered under the Investment Company Act of 1940, as amended (the 1940 Act), as an open-end management investment company and is organized as a Massachusetts business trust. Tax-Free Money Market Fund (the fund) is one fund in a series issued by the trust. The fund is diversified as defined under Rule 2a-7 of the 1940 Act. The fund’s investment objective is to seek safety of principal and high current income that is exempt from federal income tax.
2. Significant Accounting Policies
The following is a summary of significant accounting policies consistently followed by the fund in preparation of its financial statements. The financial statements are prepared in conformity with accounting principles generally accepted in the United States of America, which may require management to make certain estimates and assumptions at the date of the financial statements. Actual results could differ from these estimates.
Investment Valuations — The fund determines the fair value of its investments and computes its net asset value per share as of the close of regular trading (usually 4 p.m. Eastern time) on the New York Stock Exchange (NYSE) on each day the NYSE is open. Securities are generally valued at amortized cost, which approximates fair value. When such valuations do not reflect fair value, securities are valued as determined in good faith by the Board of Trustees or its designee, in accordance with procedures adopted by the Board of Trustees.
Security Transactions — Security transactions are accounted for as of the trade date. Net realized gains and losses are determined on the identified cost basis, which is also used for federal income tax purposes.
Investment Income — Interest income is recorded on the accrual basis and includes accretion of discounts and amortization of premiums.
Income Tax Status — It is the fund’s policy to distribute substantially all net investment income and net realized gains to shareholders and to otherwise qualify as a regulated investment company under provisions of the Internal Revenue Code. Accordingly, no provision has been made for income taxes. The fund files U.S. federal, state, local and non-U.S. tax returns as applicable. The fund’s tax returns are subject to examination by the relevant taxing authority until expiration of the applicable statute of limitations, which is generally three years from the date of filing but can be longer in certain jurisdictions. At this time, management believes there are no uncertain tax positions which, based on their technical merit, would not be sustained upon examination and for which it is reasonably possible that the total amounts of unrecognized tax benefits will significantly change in the next twelve months.
Distributions to Shareholders — Distributions from net investment income are declared daily and paid monthly. The fund may make short-term capital gains distributions to comply with the distribution requirements of the Internal Revenue Code. The fund does not expect to realize any long-term capital gains, and accordingly, does not expect to pay any long-term capital gains distributions.
Indemnifications — Under the trust’s organizational documents, its officers and trustees are indemnified against certain liabilities arising out of the performance of their duties to the fund. In addition, in the normal course of business, the fund enters into contracts that provide general indemnifications. The maximum exposure under these arrangements is unknown as this would involve future claims that may be made against a fund. The risk of material loss from such claims is considered by management to be remote.
3. Fees and Transactions with Related Parties
Management Fees — The trust has entered into a management agreement with American Century Investment Management, Inc. (ACIM) (the investment advisor), under which ACIM provides the fund with investment advisory and management services in exchange for a single, unified management fee (the fee). The agreement provides that all expenses of managing and operating the fund, except distribution and service fees, brokerage expenses, taxes, interest, fees and expenses of the independent trustees (including legal counsel fees), and extraordinary expenses, will be paid by ACIM. The fee is computed and accrued daily based on the daily net assets of the fund and paid monthly in arrears. The fee consists of (1) an Investment Category Fee based on the daily net assets of the fund and certain other accounts managed by the investment advisor that are in the same broad investment category as the fund and (2) a Complex Fee based on the assets of all the funds in the American Century Investments family of funds. The rates for the Investment Category Fee range from 0.1570% to 0.2700%. The rates for the Complex Fee range from 0.2500% to 0.3100%. In order to maintain a positive yield, ACIM may voluntarily waive a portion of its management fee on a daily basis. The fee waiver may be revised or terminated at any time without notice. The effective annual management fee for the year ended May 31, 2013 was 0.49% before waiver and 0.39% after waiver.
Related Parties — Certain officers and trustees of the trust are also officers and/or directors of American Century Companies, Inc. (ACC). The trust’s investment advisor, ACIM, the trust’s distributor, American Century Investment Services, Inc., and the trust’s transfer agent, American Century Services, LLC are wholly owned, directly or indirectly, by ACC.
4. Fair Value Measurements
The fund’s securities valuation process is based on several considerations and may use multiple inputs to determine the fair value of the positions held by the fund. In conformity with accounting principles generally accepted in the United States of America, the inputs used to determine a valuation are classified into three broad levels as follows:
• | Level 1 valuation inputs consist of unadjusted quoted prices in an active market for identical securities; |
• | Level 2 valuation inputs consist of direct or indirect observable market data (including quoted prices for similar securities, evaluations of subsequent market events, interest rates, prepayment speeds, credit risk, etc.); or |
• | Level 3 valuation inputs consist of unobservable data (including a fund’s own assumptions). |
The level classification is based on the lowest level input that is significant to the fair valuation measurement. The valuation inputs are not necessarily an indication of the risks associated with investing in these securities or other financial instruments.
As of period end, the fund’s investment securities were classified as Level 2. The Schedule of Investments provides additional information on the fund’s portfolio holdings.
5. Federal Tax Information
The tax character of distributions paid during the years ended May 31, 2013 and May 31, 2012 were as follows:
| | | | | | | |
| | | 2013 | | | 2012 | |
Distributions Paid From | | | | | | |
Exempt income | | $19,554 | | | $29,005 | |
Long-term capital gains | | — | | | — | |
The book-basis character of distributions made during the year from net investment income or net realized gains may differ from their ultimate characterization for federal income tax purposes. These differences reflect the differing character of certain income items and net realized gains and losses for financial statement and tax purposes, and may result in reclassification among certain capital accounts on the financial statements.
As of May 31, 2013, the fund had accumulated short-term capital losses of $(454), which represent net capital loss carryovers that may be used to offset future realized capital gains for federal income tax purposes. Future capital loss carryover utilization in any given year may be subject to Internal Revenue Code limitations. Capital loss carryovers expire in 2018.
| | |
For a Share Outstanding Throughout the Years Ended May 31 (except as noted) | |
Per-Share Data | | | Ratios and Supplemental Data | |
| | | | | | | | | | | | | | | | | | Ratio to Average Net Assets of: | | | | |
| | | Net
Asset Value, Beginning
of Period | | | Income From Investment Operations:
Net Investment Income (Loss) | | | Distributions
From
Net Investment Income | | | Net
Asset Value,
End of Period | | | Total Return(1) | | | Operating
Expenses | | | Operating
Expenses
(before
expense waiver) | | | Net
Investment
Income
(Loss) | | | Net Investment Income (Loss) (before
expense waiver) | | | Net Assets,
End of Period
(in thousands) | |
Investor Class | |
2013 | | $1.00 | | | — | (2) | | — | (2) | | $1.00 | | | 0.01 | % | | 0.40 | % | | 0.50 | % | | 0.01 | % | | (0.09 | )% | | $182,944 | |
2012 | | $1.00 | | | — | (2) | | — | (2) | | $1.00 | | | 0.01 | % | | 0.43 | % | | 0.50 | % | | 0.01 | % | | (0.06 | )% | | $208,238 | |
2011 | | $1.00 | | | — | (2) | | — | (2) | | $1.00 | | | 0.07 | % | | 0.45 | % | | 0.50 | % | | 0.07 | % | | 0.02 | % | | $237,389 | |
2010 | | $1.00 | | | — | (2) | | — | (2) | | $1.00 | | | 0.20 | % | | 0.46 | % | | 0.51 | % | | 0.20 | % | | 0.15 | % | | $280,874 | |
2009 | | $1.00 | | | 0.01 | | | (0.01 | ) | | $1.00 | | | 1.47 | % | | 0.50 | % | | 0.53 | % | | 1.45 | % | | 1.42 | % | | $334,768 | |
Notes to Financial Highlights
(1) | Total returns are calculated based on the net asset value of the last business day. Total returns for periods less than one year are not annualized. |
(2) | Per-share amount was less than $0.005. |
See Notes to Financial Statements.
Report of Independent Registered Public Accounting Firm |
To the Trustees of the American Century Municipal Trust
and Shareholders of the Tax-Free Money Market Fund:
In our opinion, the accompanying statement of assets and liabilities, including the schedule of investments, and the related statements of operations and of changes in net assets and the financial highlights present fairly, in all material respects, the financial position of the Tax-Free Money Market Fund (one of the four funds comprising the American Century Municipal Trust, hereafter referred to as the “Fund”) at May 31, 2013, the results of its operations for the year then ended, the changes in its net assets for each of the two years in the period then ended and the financial highlights for each of the five years in the period then ended, in conformity with accounting principles generally accepted in the United States of America. These financial statements and financial highlights (hereafter referred to as “financial statements”) are the responsibility of the Fund’s management; our responsibility is to express an opinion on these financial statements based on our audits. We conducted our audits of these financial statements in accordance with the standards of the Public Company Accounting Oversight Board (United States). Those standards require that we plan and perform the audit to obtain reasonable assurance about whether the financial statements are free of material misstatement. An audit includes examining, on a test basis, evidence supporting the amounts and disclosures in the financial statements, assessing the accounting principles used and significant estimates made by management, and evaluating the overall financial statement presentation We believe that our audits, which included confirmation of securities at May 31, 2013 by correspondence with the custodian and brokers, provide a reasonable basis for our opinion.
PricewaterhouseCoopers LLP
Kansas City, Missouri
July 22, 2013
Board of Trustees
The individuals listed below serve as trustees of the funds. Each trustee will continue to serve in this capacity until death, retirement, resignation or removal from office. The board has adopted a mandatory retirement age for trustees who are not “interested persons,” as that term is defined in the Investment Company Act (independent trustees). Independent trustees shall retire on December 31 of the year in which they reach their 75th birthday; provided, however, that on or after January 1, 2022, independent trustees shall retire on December 31 of the year in which they reach their 76th birthday.
Mr. Thomas is the only trustee who is an “interested person” because he currently serves as President and Chief Executive Officer of American Century Companies, Inc. (ACC), the parent company of American Century Investment Management, Inc. (ACIM or the advisor).
The other trustees (more than three-fourths of the total number) are independent; that is, they have never been employees, directors or officers of, and have no financial interest in, ACC or any of its wholly owned, direct or indirect, subsidiaries, including ACIM, American Century Investment Services, Inc. (ACIS) and American Century Services, LLC (ACS). The trustees serve in this capacity for eight (in the case of Mr. Thomas, 15) registered investment companies in the American Century Investments family of funds.
The following table presents additional information about the trustees. The mailing address for each trustee other than Mr. Thomas is 1665 Charleston Road, Mountain View, California 94043. The mailing address for Mr. Thomas is 4500 Main Street, Kansas City, Missouri 64111.
| | | | | | | |
Name
(Year of Birth) | Position(s) Held with Funds | Length of Time Served | Principal Occupation(s) During Past 5 Years | | Number of American Century Portfolios Overseen by Trustee | Other Directorships Held During Past 5 Years |
Independent Trustees |
Tanya S. Beder (1955) | Trustee | Since 2011 | Chairman, SBCC Group Inc. (independent advisory services) (2006 to present) | | 41 | CYS Investments, Inc. (specialty finance company) |
Jeremy I. Bulow (1954) | Trustee | Since 2011 | Professor of Economics, Stanford University, Graduate School of Business (1979 to present) | | 41 | None |
Ronald J. Gilson (1946) | Trustee and Chairman of the Board | Since 1995 | Charles J. Meyers Professor of Law and Business, Stanford Law School (1979 to present); Marc and Eva Stern Professor of Law and Business, Columbia University School of Law (1992 to present) | | 41 | None |
Frederick L. A. Grauer
(1946) | Trustee | Since 2008 | Senior Advisor, BlackRock, Inc. (investment management firm) (2010 to 2011); Senior Advisor, Barclays Global Investors (investment management firm) (2003 to 2009) | | 41 | None |
| | | | | | | |
Name
(Year of Birth) | Position(s) Held with Funds | Length of Time Served | Principal Occupation(s) During Past 5 Years | | Number of American Century Portfolios Overseen by Trustee | Other Directorships Held During Past 5 Years |
Independent Trustees |
Peter F. Pervere (1947) | Trustee | Since 2007 | Retired | | 41 | Intraware, Inc. (2003 to 2009) |
Myron S. Scholes (1941) | Trustee | Since 1980 | Chairman, Platinum Grove Asset Management, L.P. (asset manager) (1999 to 2009); Frank E. Buck Professor of Finance-Emeritus, Stanford Graduate School of Business (1996 to present) | | 41 | Dimensional Fund Advisors (investment advisor); CME Group, Inc. (futures and options exchange) |
John B. Shoven (1947) | Trustee | Since 2002 | Professor of Economics, Stanford University (1973 to present) | | 41 | Cadence Design Systems; Exponent; Financial Engines |
| |
Interested Trustee |
Jonathan S. Thomas
(1963) | Trustee and President | Since 2007 | President and Chief Executive Officer, ACC (March 2007 to present). Also serves as Chief Executive Officer and Manager, ACS; Executive Vice President, ACIM; Director, ACC, ACIM and other ACC subsidiaries | | 106 | None |
Officers
The following table presents certain information about the executive officers of the funds. Each officer serves as an officer for each of the 15 investment companies in the American Century family of funds, unless otherwise noted. No officer is compensated for his or her service as an officer of the funds. The listed officers are interested persons of the funds and are appointed or re-appointed on an annual basis. The mailing address for each of the officers listed below is 4500 Main Street, Kansas City, Missouri 64111.
| | | | |
Name
(Year of Birth) | Offices with the Funds | | Principal Occupation(s) During the Past Five Years |
Jonathan S.Thomas
(1963) | Trustee and President since 2007 | | President and Chief Executive Officer, ACC (March 2007 to present). Also serves as Chief Executive Officer and Manager, ACS; Executive Vice President, ACIM; Director, ACC, ACIM and other ACC subsidiaries |
Maryanne L. Roepke
(1956) | Chief Compliance Officer since 2006 and Senior Vice President since 2000 | | Chief Compliance Officer, American Century funds, ACIM and ACS (August 2006 to present). Also serves as Senior Vice President, ACS |
Charles A. Etherington (1957) | General Counsel since 2007 and Senior Vice President since 2006 | | Attorney, ACC (February 1994 to present); Vice President, ACC (November 2005 to present); General Counsel, ACC (March 2007 to present). Also serves as General Counsel, ACIM, ACS, ACIS and other ACC subsidiaries; and Senior Vice President, ACIM and ACS |
C. Jean Wade (1964) | Vice President, Treasurer and Chief Financial Officer since 2012 | | Vice President, ACS (February 2000 to present) |
Robert J. Leach (1966) | Vice President since 2006 and Assistant Treasurer since 2012 | | Vice President, ACS (February 2000 to present) |
David H. Reinmiller (1963) | Vice President since 2001 | | Attorney, ACC (January 1994 to present); Associate General Counsel, ACC (January 2001 to present). Also serves as Vice President, ACIM and ACS |
Ward D. Stauffer (1960) | Secretary since 2005 | | Attorney, ACC (June 2003 to present) |
The Statement of Additional Information has additional information about the fund’s trustees and is available without charge, upon request, by calling 1-800-345-2021.
Proxy Voting Guidelines
American Century Investment Management, Inc., the fund’s investment advisor, is responsible for exercising the voting rights associated with the securities purchased and/or held by the fund. A description of the policies and procedures the advisor uses in fulfilling this responsibility is available without charge, upon request, by calling 1-800-345-2021. It is also available on American Century Investments’ website at americancentury.com and on the Securities and Exchange Commission’s website at sec.gov. Information regarding how the investment advisor voted proxies relating to portfolio securities during the most recent 12-month period ended June 30 is available on the “About Us” page at americancentury.com. It is also available at sec.gov.
Quarterly Portfolio Disclosure
The fund files its complete schedule of portfolio holdings with the Securities and Exchange Commission (SEC) for the first and third quarters of each fiscal year on Form N-Q. The fund’s Forms N-Q are available on the SEC’s website at sec.gov, and may be reviewed and copied at the SEC’s Public Reference Room in Washington, DC. Information on the operation of the Public Reference Room may be obtained by calling 1-800-SEC-0330. The fund also makes its complete schedule of portfolio holdings for the most recent quarter of its fiscal year available on its website at americancentury.com and, upon request, by calling 1-800-345-2021.
Other Tax Information
The following information is provided pursuant to provisions of the Internal Revenue Code.
The fund designates $19,582 as exempt interest dividends for the fiscal year ended May 31, 2013.
Contact Us | americancentury.com |
Automated Information Line | 1-800-345-8765 |
Investor Services Representative | 1-800-345-2021
or 816-531-5575 |
Investors Using Advisors | 1-800-378-9878 |
Business, Not-For-Profit, Employer-Sponsored Retirement Plans | 1-800-345-3533 |
Banks and Trust Companies, Broker-Dealers, Financial Professionals, Insurance Companies | 1-800-345-6488 |
Telecommunications Device for the Deaf | 1-800-634-4113 |
American Century Municipal Trust
Investment Advisor:
American Century Investment Management, Inc.
Kansas City, Missouri
This report and the statements it contains are submitted for the general information of our shareholders. The report is not authorized for distribution to prospective investors unless preceded or accompanied by an effective prospectus.
©2013 American Century Proprietary Holdings, Inc. All rights reserved.
CL-ANN-78955 1307
ITEM 2. CODE OF ETHICS.
(a) | The registrant has adopted a Code of Ethics for Senior Financial Officers that applies to the registrant’s principal executive officer, principal financial officer, principal accounting officer, and persons performing similar functions. |
(f) | The registrant’s Code of Ethics for Senior Financial Officers was filed as Exhibit 12 (a)(1) to American Century Asset Allocation Portfolios, Inc.’s Annual Certified Shareholder Report on Form N-CSR, File No. 811-21591, on September 29, 2005, and is incorporated herein by reference. |
ITEM 3. AUDIT COMMITTEE FINANCIAL EXPERT.
(a)(1) | The registrant's board has determined that the registrant has at least one audit committee financial expert serving on its audit committee. |
(a)(2) | Tanya S. Beder, Peter F. Pervere and Ronald J. Gilson are the registrant's designated audit committee financial experts. They are "independent" as defined in Item 3 of Form N-CSR. |
ITEM 4. PRINCIPAL ACCOUNTANT FEES AND SERVICES.
The aggregate fees billed for each of the last two fiscal years for professional services rendered by the principal accountant for the audit of the registrant’s annual financial statements or services that are normally provided by the accountant in connection with statutory and regulatory filings or engagements for those fiscal years were as follows:
FY 2012: $111,658
FY 2013: $ 99,952
The aggregate fees billed in each of the last two fiscal years for assurance and related services by the principal accountant that are reasonably related to the performance of the audit of the registrant’s financial statements and are not reported under paragraph (a) of this Item were as follows:
For services rendered to the registrant:
Fees required to be approved pursuant to paragraph (c)(7)(ii) of Rule 2-01 of Regulation S-X (relating to certain engagements for non-audit services with the registrant’s investment adviser and its affiliates):
The aggregate fees billed in each of the last two fiscal years for professional services rendered by the principal accountant for tax compliance, tax advice, and tax planning were as follows:
For services rendered to the registrant:
FY 2012: $0
FY 2013: $0
Fees required to be approved pursuant to paragraph (c)(7)(ii) of Rule 2-01 of Regulation S-X (relating to certain engagements for non-audit services with the registrant’s investment adviser and its affiliates):
FY 2012: $0
FY 2013: $0
The aggregate fees billed in each of the last two fiscal years for products and services provided by the principal accountant, other than the services reported in paragraphs (a) through (c) of this Item were as follows:
For services rendered to the registrant:
Fees required to be approved pursuant to paragraph (c)(7)(ii) of Rule 2-01 of Regulation S-X (relating to certain engagements for non-audit services with the registrant’s investment adviser and its affiliates):
(e)(1) | In accordance with paragraph (c)(7)(i)(A) of Rule 2-01 of Regulation S-X, before the accountant is engaged by the registrant to render audit or non-audit services, the engagement is approved by the registrant’s audit committee. Pursuant to paragraph (c)(7)(ii) of Rule 2-01 of Regulation S-X, the registrant’s audit committee also pre-approves its accountant’s engagements for non-audit services with the registrant’s investment adviser, its parent company, and any entity controlled by, or under common control with the investment adviser that provides ongoing services to the registrant, if the engagement relates directly to the operations and financial reporting of the registrant. |
(e)(2) | All services described in each of paragraphs (b) through (d) of this Item were pre-approved before the engagement by the registrant’s audit committee pursuant to paragraph (c)(7)(i)(A) of Rule 2-01 of Regulation S-X. Consequently, none of such services were required to be approved by the audit committee pursuant to paragraph (c)(7)(i)(C). |
(f) | The percentage of hours expended on the principal accountant’s engagement to audit the registrant’s financial statements for the most recent fiscal year that were attributed to work performed by persons other than the principal accountant’s full-time, permanent employees was less than 50%. |
(g) | The aggregate non-audit fees billed by the registrant’s accountant for services rendered to the registrant, and rendered to the registrant’s investment adviser (not including any sub-adviser whose role is primarily portfolio management and is subcontracted with or overseen by another investment adviser), and any entity controlling, controlled by, or under common control with the adviser that provides ongoing services to the registrant for each of the last two fiscal years of the registrant were as follows: |
FY 2012: $203,506
FY 2013: $136,896
(h) | The registrant’s investment adviser and accountant have notified the registrant’s audit committee of all non-audit services that were rendered by the registrant’s accountant to the registrant’s investment adviser, its parent company, and any entity controlled by, or under common control with the investment adviser that provides services to the registrant, which services were not required to be pre-approved pursuant to paragraph (c)(7)(ii) of Rule 2-01 of Regulation S-X. The notification provided to the registrant’s audit committee included sufficient details regarding such services to allow the registrant’s audit committee to consider the continuing independence of its principal accountant. |
ITEM 5. AUDIT COMMITTEE OF LISTED REGISTRANTS.
Not applicable.
ITEM 6. INVESTMENTS.
(a) | The schedule of investments is included as part of the report to stockholders filed under Item 1 of this Form. |
ITEM 7. DISCLOSURE OF PROXY VOTING POLICIES AND PROCEDURES FOR CLOSED-END MANAGEMENT INVESTMENT COMPANIES.
Not applicable.
ITEM 8. PORTFOLIO MANAGERS OF CLOSED-END MANAGEMENT INVESTMENT COMPANIES.
Not applicable.
ITEM 9. PURCHASES OF EQUITY SECURITIES BY CLOSED-END MANAGEMENT INVESTMENT COMPANY AND AFFILIATED PURCHASERS.
Not applicable.
ITEM 10. SUBMISSION OF MATTERS TO A VOTE OF SECURITY HOLDERS.
During the reporting period, there were no material changes to the procedures by which shareholders may recommend nominees to the registrant’s board.
ITEM 11. CONTROLS AND PROCEDURES.
(a) | The registrant's principal executive officer and principal financial officer have concluded that the registrant's disclosure controls and procedures (as defined in Rule 30a-3(c) under the Investment Company Act of 1940) are effective based on their evaluation of these controls and procedures as of a date within 90 days of the filing date of this report. |
(b) | There were no changes in the registrant's internal control over financial reporting (as defined in Rule 30a-3(d) under the Investment Company Act of 1940) that occurred during the registrant's second fiscal quarter of the period covered by this report that have materially affected, or are reasonably likely to materially affect, the registrant's internal control over financial reporting. |
ITEM 12. EXHIBITS.
(a)(1) | Registrant’s Code of Ethics for Senior Financial Officers, which is the subject of the disclosure required by Item 2 of Form N-CSR, was filed as Exhibit 12(a)(1) to American Century Asset Allocation Portfolios, Inc.’s Certified Shareholder Report on Form N-CSR, File No. 811-21591, on September 29, 2005. |
(a)(2) | Separate certifications by the registrant’s principal executive officer and principal financial officer, pursuant to Section 302 of the Sarbanes-Oxley Act of 2002 and Rule 30a-2(a) under the Investment Company Act of 1940, are filed and attached hereto as EX-99.CERT. |
(b) | A certification by the registrant’s chief executive officer and chief financial officer, pursuant to Section 906 of the Sarbanes-Oxley Act of 2002, is furnished and attached hereto as EX-99.906CERT. |
SIGNATURES
Pursuant to the requirements of the Securities Exchange Act of 1934 and the Investment Company Act of 1940, the registrant has duly caused this report to be signed on its behalf by the undersigned, thereunto duly authorized.
Registrant: | American Century Municipal Trust | |
| | | | |
| | | | |
By: | /s/ Jonathan S. Thomas | |
| | Name: | Jonathan S. Thomas | |
| | Title: | President | |
| | | | |
Date: | July 30, 2013 | |
| | | |
Pursuant to the requirements of the Securities Exchange Act of 1934 and the Investment Company Act of 1940, this report has been signed below by the following persons on behalf of the registrant and in the capacities and on the dates indicated.
By: | /s/ Jonathan S. Thomas | |
| | Name: | Jonathan S. Thomas | |
| | Title: | President | |
| | | (principal executive officer) | |
| | | | |
| | | | |
Date: | July 30, 2013 | |
By: | /s/ C. Jean Wade | |
| | Name: | C. Jean Wade | |
| | Title: | Vice President, Treasurer, and | |
| | | Chief Financial Officer | |
| | | (principal financial officer) | |
| | | | |
Date: | July 30, 2013 | |