| | |
| UNITED STATES |
| SECURITIES AND EXCHANGE COMMISSION |
| Washington, D.C. 20549 |
| |
| FORM N-CSR |
| |
| CERTIFIED SHAREHOLDER REPORT OF REGISTERED |
| MANAGEMENT INVESTMENT COMPANIES |
| |
| Investment Company Act file number | 811-04025 |
| |
| AMERICAN CENTURY MUNICIPAL TRUST |
| (Exact name of registrant as specified in charter) |
| |
| 4500 MAIN STREET, KANSAS CITY, MISSOURI | 64111 |
| (Address of principal executive offices) | (Zip Code) |
| |
| CHARLES A. ETHERINGTON |
| 4500 MAIN STREET, KANSAS CITY, MISSOURI 64111 |
| (Name and address of agent for service) |
|
| Registrant’s telephone number, including area code: | 816-531-5575 |
| | |
| Date of fiscal year end: | 05-31 |
| | |
| Date of reporting period: | 05-31-2010 |
| |
| |
| |
| | |
| |
| ITEM 1. REPORTS TO STOCKHOLDERS. |
|
| Annual Report | |
| May 31, 2010 | |

|
| American Century Investments® |
Long-Term Tax-Free Fund
| |
| President’s Letter | 2 |
| Market Perspective | 3 |
| U.S. Fixed-Income Total Returns | 3 |
| |
| Long-Term Tax-Free | |
| |
| Performance | 4 |
| Portfolio Commentary | 6 |
| Portfolio at a Glance | 8 |
| Yields | 8 |
| Top Five Sectors | 8 |
| |
| Shareholder Fee Example | 9 |
| |
| Financial Statements | |
| |
| Schedule of Investments | 11 |
| Statement of Assets and Liabilities | 17 |
| Statement of Operations | 18 |
| Statement of Changes in Net Assets | 19 |
| Notes to Financial Statements | 20 |
| Financial Highlights | 26 |
| Report of Independent Registered Public Accounting Firm | 31 |
| |
| Other Information | |
| |
| Management | 32 |
| Board Approval of Management Agreements | 36 |
| Additional Information | 42 |
| Index Definitions | 43 |
Any opinions expressed in this report reflect those of the author as of the date of the report, and do not necessarily represent the opinions of American Century Investments or any other person in the American Century Investments organization. Any such opinions are subject to change at any time based upon market or other conditions and American Century Investments disclaims any responsibility to update such opinions. These opinions may not be relied upon as investment advice and, because investment decisions made by American Century Investments funds are based on numerous factors, may not be relied upon as an indication of trading intent on behalf of any American Century Investments fund. Security examples are used for representational purposes only and are not intended as recommendations to purchase or sell securities. Performance information for comparative indices and securities is provided to American Century Investments by third party vendors. To the best of American Century Investments’ knowledge, such information is accurate at the time of printing.

Dear Investor:
To learn more about the capital markets, your investment, and the portfolio management strategies American Century Investments provides, we encourage you to review this shareholder report for the financial reporting period ended May 31, 2010.
On the following pages, you will find investment performance and portfolio information, presented with the expert perspective and commentary of our portfolio management team. This report remains one of our most important vehicles for conveying the information you need about your investment performance, and about the market factors and strategies that affect fund returns. For additional information on the markets, we encourage you to visit the “Insights & News” tab at our Web site, americancentury.com, for updates and further expert commentary.
The top of our Web site’s home page also provides a link to “Our Story,” which, first and foremost, outlines our commitment—since 1958—to helping clients reach their financial goals. We believe strongly that we will only be successful when our clients are successful. That’s who we are.
Another important, unique facet of our story and who we are is “Profits with a Purpose,” which describes our bond with the Stowers Institute for Medical Research (SIMR). SIMR is a world-class biomedical organization—founded by our company founder James E. Stowers, Jr. and his wife Virginia—that is dedicated to researching the causes, treatment, and prevention of gene-based diseases, including cancer. Through American Century Investments’ private ownership structure, more than 40% of our profits support SIMR.
Mr. Stowers’ example of achieving financial success and using that platform to help humanity motivates our entire American Century Investments team. His story inspires us to help each of our clients achieve success. Thank you for sharing your financial journey with us.
Sincerely,

Jonathan Thomas
President and Chief Executive Officer
American Century Investments
2

By David MacEwen, Chief Investment Officer, Fixed Income
Economic and Market Rebound
The municipal bond market witnessed a wide dispersion of returns in the 12 months ended May 31, 2010 (see the accompanying table), which closely coincided with the rebound of the U.S. economy from the depths of the recession and credit crisis. This dramatic turnaround can be attributed to the government’s extraordinary monetary and fiscal stimulus policies taken in response to the financial crisis in late 2008. However, financial market volatility in May related to the European debt crisis led many to worry about a potential slowdown in U.S. growth. Despite a return to positive economic growth in the second half of 2009 and so far in 2010, the unemployment rate stood at 9.7% in May 2010, while the housing market and consumer debt levels remained concerns.
Municipal Market Review
Better economic and market conditions caused a reversal of the trading that colored the credit crisis, when the lowest-rated bonds performed worst and higher-quality bonds did best. For the 12 months ended in May, this reversal meant that high-yield (below-investment-grade) and long-term municipal bonds did better than high-quality and shorter-term securities. Similarly, credit-sensitive municipal bonds outperformed Treasury securities for the 12 months after lagging during the credit crisis.
In addition to better economic and market conditions, municipal bonds benefited from improving technical factors—the Build America Bonds program limited the supply of tax-exempt bonds. This federal program, designed to help ease municipal borrowing costs, meant many newly minted municipal bonds were instead issued in the taxable bond universe. Demand for municipal bonds was helped by attractive tax-equivalent yields and the outlook for higher marginal tax rates going forward.
And despite the continuing flood of negative press about budget challenges for states and local governments, we continue to believe that municipal defaults will be relatively rare, especially compared with corporate defaults. Indeed, during the reporting period, the major credit rating agencies revamped their ratings systems to better recognize the superior credit quality and vastly lower default risk of municipal securities relative to corporate-backed bonds.
| | | | |
| U.S. Fixed-Income Total Returns | | | | |
| For the 12 months ended May 31, 2010 | | | | |
| Barclays Capital Municipal Market Indices | | Barclays Capital U.S. Taxable Market Indices |
| Municipal Bond | 8.52% | | Aggregate Index | 8.42% |
| 5-Year General Obligation Bond | 6.15% | | Treasury Index | 4.50% |
| Long-Term Municipal Bond | 13.53% | | | |
| Non-Investment-Grade Municipal Bond | 21.01% | | | |
3
| | | | | | | |
| Long-Term Tax-Free | | | | | |
| |
| Total Returns as of May 31, 2010 | | | | | |
| | | | | Average Annual Returns | |
| | | Ticker | | | | Since | Inception |
| | | Symbol | 1 year | 5 years | 10 years | Inception | Date |
| A Class | MMBAX | | | | | 3/31/97 |
| No sales charge* | | 8.05% | 3.89%(1) | 5.51%(1) | 5.42%(1) | |
| With sales charge* | | 3.18% | 2.95%(1) | 5.02%(1) | 5.06%(1) | |
| Barclays Capital | | | | | | |
| Municipal Bond Index | — | 8.52% | 4.52% | 5.90% | 5.65% | — |
| Lipper General | | | | | | |
| Municipal Debt Funds | | | | | | |
| Average Returns(2) | — | 9.82% | 3.18% | 4.80% | 4.55% | — |
| A Class’s Lipper Ranking | | | | | | |
| as of May 31, 2010(2) | — | 187 of 241 | 49 of 196 | 39 of 156 | 10 of 118 | — |
| as of June 30, 2010(2) | — | 186 of 244 | 51 of 196 | 36 of 158 | 11 of 118 | — |
| Investor Class | ACLVX | 8.32% | — | — | 4.75% | 4/3/06 |
| Institutional Class | ACLSX | 8.53% | — | — | 4.96% | 4/3/06 |
| B Class | MMDBX | | | | | 3/31/97 |
| No sales charge* | | 7.24% | 3.13%(1) | 4.78%(1) | 4.70%(1) | |
| With sales charge* | | 3.24% | 2.95%(1) | 4.78%(1) | 4.70%(1) | |
| C Class | ACTCX | 7.25% | — | — | 3.72% | 4/3/06 |
| |
| *Sales charges include initial sales charges and contingent deferred sales charges (CDSCs), as applicable. A Class shares have a 4.50% |
| maximum initial sales charge for fixed-income funds and may be subject to a maximum CDSC of 1.00%. B Class shares redeemed |
| within six years of purchase are subject to a CDSC that declines from 5.00% during the first year after purchase to 0.00% the sixth year |
| after purchase. C Class shares redeemed within 12 months of purchase are subject to a maximum CDSC of 1.00%. The SEC requires |
| that mutual funds provide performance information net of maximum sales charges in all cases where charges could be applied. |
| |
| (1) | Class returns would have been lower if fees had not been waived. | | | | |
| (2) | Data provided by Lipper Inc. — A Reuters Company. © 2010 Reuters. All rights reserved. Any copying, republication or redistribution of Lipper |
| | content, including by caching, framing or similar means, is expressly prohibited without the prior written consent of Lipper. Lipper shall not be |
| | liable for any errors or delays in the content, or for any actions taken in reliance thereon. | | | |
| | Lipper Fund Performance — Performance data is total return, and is preliminary and subject to revision. | | |
| | Lipper Rankings — Rankings are based only on the universe shown and are based on average annual total returns. This listing might not |
| | represent the complete universe of funds tracked by Lipper. | | | | |
| | The data contained herein has been obtained from company reports, financial reporting services, periodicals and other resources believed to be |
| | reliable. Although carefully verified, data on compilations is not guaranteed by Lipper and may be incomplete. No offer or solicitations to buy or |
| | sell any of the securities herein is being made by Lipper. | | | | |
Data presented reflect past performance. Past performance is no guarantee of future results. Current performance may be higher or lower than the performance shown. Investment return and principal value will fluctuate, and redemption value may be more or less than original cost. To obtain performance data current to the most recent month end, please call 1-800-345-2021 or visit americancentury.com. As interest rates rise, bond values will decline. Investment income may be subject to certain state and local taxes and, depending on your tax status, the federal alternative minimum tax (AMT). Capital gains are not exempt from state and federal income tax.
Unless otherwise indicated, performance reflects A Class shares; performance for other share classes will vary due to differences in fee structure. For information about other share classes available, please consult the prospectus. Data assumes reinvestment of dividends and capital gains, and none of the charts reflect the deduction of taxes that a shareholder would pay on fund distributions or the redemption of fund shares. Returns for the index are provided for comparison. The fund’s total returns include operating expenses (such as transaction costs and management fees) that reduce returns, while the total returns of the index do not.
4
Long-Term Tax-Free

| | | | |
| * The A Class’s initial investment is $9,550 to reflect the maximum 4.50% initial sales charge. | | |
| **Ending value may have been lower if fees had not been waived. | | | |
| |
| Total Annual Fund Operating Expenses | | | |
| Investor Class | Institutional Class | A Class | B Class | C Class |
| 0.49% | 0.29% | 0.74% | 1.49% | 1.49% |
The total annual fund operating expenses shown is as stated in the fund’s prospectus current as of the date of this report. The prospectus may vary from the expense ratio shown elsewhere in this report because it is based on a different time period, includes acquired fund fees and expenses, and, if applicable, does not include fee waivers or expense reimbursements.
Data presented reflect past performance. Past performance is no guarantee of future results. Current performance may be higher or lower than the performance shown. Investment return and principal value will fluctuate, and redemption value may be more or less than original cost. To obtain performance data current to the most recent month end, please call 1-800-345-2021 or visit americancentury.com. As interest rates rise, bond values will decline. Investment income may be subject to certain state and local taxes and, depending on your tax status, the federal alternative minimum tax (AMT). Capital gains are not exempt from state and federal income tax.
Unless otherwise indicated, performance reflects A Class shares; performance for other share classes will vary due to differences in fee structure. For information about other share classes available, please consult the prospectus. Data assumes reinvestment of dividends and capital gains, and none of the charts reflect the deduction of taxes that a shareholder would pay on fund distributions or the redemption of fund shares. Returns for the index are provided for comparison. The fund’s total returns include operating expenses (such as transaction costs and management fees) that reduce returns, while the total returns of the index do not.
5
Long-Term Tax-Free
Portfolio Managers: Alan Kruss, Joseph Gotelli, and Steven Permut
Performance Summary
Long-Term Tax-Free returned 8.05%* for the 12 months ended May 31, 2010 By comparison, the Barclays Capital Municipal Bond Index returned 8.52% The average return of the general municipal debt funds tracked by Lipper Inc. was 9.82% for the same period. Despite recent underperformance, the portfolio’s average annual returns exceed those of its Lipper group average for the five- and 10-year periods ended in May (see page 4).
The portfolio’s absolute returns reflect the positive performance of municipal bonds during the reporting period, despite budget concerns for many municipalities (see the Market Perspective on page 3). Some of the key contri butions to the portfolio’s return came from our credit and sector allocation decisions. That said, we believe the portfolio underperformed the Lipper group average and Barclays Index primarily because of our relatively short duration (resulting in less share price sensitivity to interest rate changes) at a time when long-term bonds did best.
Portfolio Positioning
Rather than make big bets on the direction of interest rates—which can introduce unwanted share price volatility—we tend to keep duration close to that of our benchmark and attempt to add value through our credit, sector, and individual security selection decisions. That approach to duration management can detract from performance in the short-run, but it has tended to provide our shareholders attractive long-term risk-adjusted returns.
Looking at contribution to return from our credit allocation, it helped performance to add what we considered attractively valued bonds rated A and BBB. Nevertheless, we believe we held fewer lower-rated bonds than our peers, so this credit positioning detracted from relative results in a year when the lowest-quality bonds did best.
In terms of sector allocation, we tended to hold underweight positions in tax-backed bonds (such as state and local general obligation (GO) debt) in favor of revenue bonds (such as utilities, education, and health care debt). This positioning helped because revenue bonds—particularly our health care holdings—outperformed GO securities. However, it hurt relative performance to hold an underweight stake in volatile corporate-backed airline and tobacco bonds and industrial development revenue bonds.
Other Trades
We also implemented a “ratio” trade designed to benefit from the changing yield relationship between like-maturity municipals and Treasuries. This positioning benefited performance as demand for the municipal asset class drove outperformance versus Treasuries.
*All fund returns referenced in this commentary are for A Class shares and are not reduced by sales charges. A Class shares are subject to a maximum sales charge of 4.50%. Had the sales charge been applied, returns would have been lower than those shown.
6
Long-Term Tax-Free
Municipal Credit Comment
The period saw a number of negative headlines about the financial health of state and local governments. Steven Permut, who leads American Century Investments’ municipal bond team, recognizes these concerns but does not believe a wave of municipal defaults is imminent: “We think defaults, while increasing, will continue to be relatively isolated events due to credit-specific issues. And as we’ve said repeatedly, we believe the 50 states are highly unlikely to default. That’s because state general obligation bonds typically have a first or second claim on all general fund revenues, their debt service typically represents a comparatively small percentage of available income, and the states have broad powers to ensure their debts are repaid. In looking at local tax-backed credits, we have found that most cities/school districts/counties are fairly well managed and have continued to maintain reserv es during the downturn.”
Permut continues: “Instead, the real risks to municipal bonds will be more market driven, relating to (1) downgrades, (2) headlines, and (3) liquidity, which can negatively impact a bond’s value. It’s worth remembering that municipal bonds as a whole are second only to Treasuries in terms of credit quality. Indeed, as a result of recent changes to credit ratings by the big rating agencies to reflect the high quality and low likelihood of default by municipal bonds relative to corporate securities, many categories of municipal debt have recently seen their credit ratings recalibrated higher by Moody’s and Fitch.”
Outlook
“We expect modest economic growth going forward, because of three big headwinds for consumer spending (a key driver of growth): high unemployment, too much household debt, and a weak housing market,” said Permut. “While municipal credit conditions are likely to remain challenging in the near term, we think demand for municipal bonds will be fairly healthy—tax rates are widely expected to rise going forward, and investors looking for higher yields are stepping out the maturity spectrum from money market funds. At the same time, the supply of tax-free municipal bonds is likely to be constrained by the Build America Bonds program—a federal government program intended to help lower municipal borrowing costs.”
In terms of the portfolio, Permut indicates that Long-Term Tax-Free will remain “underweight the tax-supported sector (which includes state and local general obligation bonds) because of the possibility of credit rating downgrades in that sector going forward. Instead, we are overweight less economically sensitive sectors, such as essential service revenue bonds (public power and water and sewer), hospitals, and higher education.”
7
| |
| Long-Term Tax-Free | |
| |
| Portfolio at a Glance | |
| | As of 5/31/10 |
| Weighted Average Maturity | 15.9 years |
| Average Duration (Modified) | 6.0 years |
| |
| Yields as of May 31, 2010 | |
| 30-Day SEC Yield | |
| Investor Class | 3.40% |
| Institutional Class | 3.60% |
| A Class | 3.00% |
| B Class | 2.40% |
| C Class | 2.40% |
| A Class 30-Day Tax-Equivalent Yields(1) |
| 25.00% Tax Bracket | 4.00% |
| 28.00% Tax Bracket | 4.17% |
| 33.00% Tax Bracket | 4.48% |
| 35.00% Tax Bracket | 4.62% |
| (1) The tax brackets indicated are for federal taxes only. Actual tax-equivalent yields may be lower, if alternative minimum tax is applicable. |
| |
| Top Five Sectors as of May 31, 2010 |
| | % of fund investments |
| General Obligation (GO) | 24% |
| Hospital Revenue | 17% |
| Electric Revenue | 12% |
| Higher Education | 9% |
| Transportation Revenue | 8% |
8
|
| Shareholder Fee Example (Unaudited) |
Fund shareholders may incur two types of costs: (1) transaction costs, including sales charges (loads) on purchase payments and redemption/ exchange fees; and (2) ongoing costs, including management fees; distribution and service (12b-1) fees; and other fund expenses. This example is intended to help you understand your ongoing costs (in dollars) of investing in your fund and to compare these costs with the ongoing cost of investing in other mutual funds.
The example is based on an investment of $1,000 made at the beginning of the period and held for the entire period from December 1, 2009 to May 31, 2010.
Actual Expenses
The table provides information about actual account values and actual expenses for each class. You may use the information, together with the amount you invested, to estimate the expenses that you paid over the period. First, identify the share class you own. Then simply divide your account value by $1,000 (for example, an $8,600 account value divided by $1,000 = 8.6), then multiply the result by the number under the heading “Expenses Paid During Period” to estimate the expenses you paid on your account during this period.
If you hold Investor Class shares of any American Century Investments fund, or Institutional Class shares of the American Century Diversified Bond Fund, in an American Century Investments account (i.e., not a financial intermediary or retirement plan account), American Century Investments may charge you a $12.50 semiannual account maintenance fee if the value of those shares is less than $10,000. We will redeem shares automatically in one of your accounts to pay the $12.50 fee. In determining your total eligible investment amount, we will include your investments in all personal accounts (including American Century Investments Brokerage accounts) registered under your Social Security number. Personal accounts include individual accounts, joint accounts, UGMA/UTMA accounts, personal trusts, Coverdell Education Savings Accounts and IRAs (including traditional, Roth, Rollover, SEP-, SARSEP- and SIMPLE-IRAs), and certain other retirement accounts. If you have only business, business retirement, employer-sponsored or American Century Investments Brokerage accounts, you are currently not subject to this fee. We will not charge the fee as long as you choose to manage your accounts exclusively online. If you are subject to the Account Maintenance Fee, your account value could be reduced by the fee amount.
Hypothetical Example for Comparison Purposes
The table also provides information about hypothetical account values and hypothetical expenses based on the actual expense ratio of each class of your fund and an assumed rate of return of 5% per year before expenses, which is not the actual return of a fund’s share class. The hypothetical account values and expenses may not be used to estimate the actual ending account balance or expenses you paid for the period. You may use this information to compare the ongoing costs of investing in your fund and other funds. To do so, compare this 5% hypothetical example with the 5% hypothetical examples that appear in the shareholder reports of the other funds.
9
Please note that the expenses shown in the table are meant to highlight your ongoing costs only and do not reflect any transactional costs, such as sales charges (loads) or redemption/exchange fees. Therefore, the table is useful in comparing ongoing costs only, and will not help you determine the relative total costs of owning different funds. In addition, if these transactional costs were included, your costs would have been higher.
| | | | |
| | Beginning | Ending | Expenses Paid | |
| | Account Value | Account Value | During Period* | Annualized |
| | 12/1/09 | 5/31/10 | 12/1/09 – 5/31/10 | Expense Ratio* |
| Actual | | | | |
| Investor Class | $1,000 | $1,041.00 | $2.44 | 0.48% |
| Institutional Class | $1,000 | $1,042.00 | $1.43 | 0.28% |
| A Class | $1,000 | $1,039.70 | $3.71 | 0.73% |
| B Class | $1,000 | $1,035.80 | $7.51 | 1.48% |
| C Class | $1,000 | $1,035.80 | $7.51 | 1.48% |
| Hypothetical | | | | |
| Investor Class | $1,000 | $1,022.54 | $2.42 | 0.48% |
| Institutional Class | $1,000 | $1,023.54 | $1.41 | 0.28% |
| A Class | $1,000 | $1,021.29 | $3.68 | 0.73% |
| B Class | $1,000 | $1,017.55 | $7.44 | 1.48% |
| C Class | $1,000 | $1,017.55 | $7.44 | 1.48% |
| * Expenses are equal to the class’s annualized expense ratio listed in the table above, multiplied by the average account value over the period, |
| multiplied by 182, the number of days in the most recent fiscal half-year, divided by 365, to reflect the one-half year period. |
10
| | | | | | |
| Long-Term Tax-Free | | | | | |
| |
| MAY 31, 2010 | | | | | | |
| | Principal | | | | Principal | |
| | Amount | Value | | | Amount | Value |
| Municipal Securities — 97.9% | | | California Health Facilities | | |
| | | | | Financing Auth. Rev., | | |
| ALABAMA — 1.4% | | | | Series 2008 C, (Providence | | |
| East Alabama Health | | | | Health & Services), | | |
| Care Facilities Auth. Rev., | | | | 6.50%, 10/1/38(1) | $ 250,000 | $ 283,508 |
| Series 2008 B, VRDN, | | | | California Health Facilities | | |
| 5.00%, 9/1/13(1) | $ 500,000 | $ 522,035 | | Financing Auth. Rev., Series | | |
| ARIZONA — 3.4% | | | | 2009 A, (Catholic Healthcare | | |
| Mohave County Industrial | | | | West), 6.00%, 7/1/39(1) | 300,000 | 323,733 |
| Development Auth. | | | | California Municipal Finance | | |
| Correctional Facilities Contract | | | | Auth. Rev., (Community | | |
| Rev., (Mohave Prison, LLC | | | | Hospital of Central California), | | |
| Expansion), 8.00%, 5/1/25(1) | 200,000 | 225,066 | | 5.50%, 2/1/39(1) | 200,000 | 185,576 |
| Phoenix Civic Improvement | | | | California Statewide | | |
| Corp. Wastewater System | | | | Communities Development | | |
| Rev., (Senior Lien), | | | | Auth. Rev., (Proposition | | |
| 5.50%, 7/1/24(1) | 250,000 | 282,890 | | 1A Receivables), | | |
| Salt River Agricultural | | | | 5.00%, 6/15/13(1) | 250,000 | 272,217 |
| Improvement & Power Rev., | | | | California University | | |
| Series 2009 A, (Electric | | | | Systemwide Rev., Series 2009 | | |
| System Distribution), | | | | A, 5.25%, 11/1/34(1) | 300,000 | 315,702 |
| 5.00%, 1/1/39(1) | 445,000 | 468,634 | | Chaffey Community College | | |
| University Medical Center | | | | District GO, Series 2007 C, | | |
| Corp. Rev., 6.50%, 7/1/39(1) | 300,000 | 321,885 | | (Election of 2002), | | |
| | | 1,298,475 | | 5.00%, 6/1/32 (NATL)(1) | 265,000 | 271,927 |
| CALIFORNIA — 18.1% | | | | Desert Sands Unified School | | |
| | | | | District COP, (Financing), | | |
| Anaheim Public Financing | | | | 5.00%, 3/1/18(1) | 50,000 | 52,993 |
| Auth. Rev., (Electric | | | | | | |
| System Distribution), | | | | Golden State Tobacco | | |
| 5.25%, 10/1/34(1) | 400,000 | 419,280 | | Securitization Corp. Settlement | | |
| | | | | Rev., Series 2007 A1, | | |
| Bay Area Toll Auth. Toll Bridge | | | | 5.00%, 6/1/17(1) | 225,000 | 225,659 |
| Rev., Series 2008 F1, (San | | | | | | |
| Francisco Bay Area), 5.00%, | | | | Golden State Tobacco | | |
| 4/1/39(1) | 300,000 | 308,403 | | Securitization Corp. Settlement | | |
| | | | | Rev., Series 2007 A1, | | |
| California Department of | | | | 5.75%, 6/1/47(1) | 500,000 | 366,635 |
| Water Resources Power | | | | | | |
| Supply Rev., Series 2005 F5, | | | | Metropolitan Water District | | |
| 5.00%, 5/1/22(1) | 300,000 | 328,077 | | of Southern California Rev., | | |
| | | | | Series 2004 B3, 3.25%, | | |
| California Department of | | | | 10/1/11 (NATL)(1) | 150,000 | 155,601 |
| Water Resources Power | | | | | | |
| Supply Rev., Series 2005 G4, | | | | Metropolitan Water District | | |
| 5.00%, 5/1/16(1) | 100,000 | 113,433 | | of Southern California | | |
| | | | | Rev., Series 2009 C, | | |
| California Department of | | | | 5.00%, 7/1/35(1) | 400,000 | 425,360 |
| Water Resources Power | | | | | | |
| Supply Rev., Series 2008 H, | | | | Northern California Power | | |
| 5.00%, 5/1/22(1) | 100,000 | 109,359 | | Agency Rev., Series 2009 A, | | |
| | | | | (Geothermal Project No. 3), | | |
| California GO, | | | | 5.25%, 7/1/24(1) | 200,000 | 214,476 |
| 5.625%, 4/1/26(1) | 500,000 | 538,735 | | | | |
| | | | | Sacramento County COP, | | |
| California GO, | | | | 5.75%, 2/1/30(1) | 100,000 | 100,803 |
| 5.75%, 4/1/27(1) | 500,000 | 540,220 | | | | |
| | | | | San Bernardino Community | | |
| California GO, | | | | College District GO, Series | | |
| 5.75%, 4/1/28(1) | 500,000 | 543,245 | | 2008 A, (Election of 2002), | | |
| | | | | 6.25%, 8/1/33(1) | 290,000 | 328,184 |
11
| | | | | | |
| Long-Term Tax-Free | | | | | |
| |
| | Principal | | | | Principal | |
| | Amount | Value | | | Amount | Value |
| San Diego Public Facilities | | | | Orlando Utilities Commission | | |
| Financing Sewer Auth. | | | | System Rev., Series 2009 B, | | |
| Rev., Series 2010 A, | | | | 5.00%, 10/1/33(1) | $ 100,000 | $ 105,625 |
| 5.25%, 5/15/24(1) | $ 50,000 | $ 55,967 | | Palm Beach County Health | | |
| Vernon Electric System | | | | Facilities Auth. Rev., | | |
| Rev., Series 2009 A, | | | | Series 2010 A, (Bethesda | | |
| 5.50%, 8/1/15(1) | 420,000 | 472,861 | | Healthcare System), | | |
| | | 6,951,954 | | 5.25%, 7/1/40 (AGM)(1) | 200,000 | 201,392 |
| COLORADO — 1.3% | | | | St. Petersburg Health Facilities | | |
| | | | | Auth. Rev., Series 2009 A, (All | | |
| Colorado Health Facility | | | | Children’s Health Facilities), | | |
| Auth. Rev., Series 2008 D, | | | | 6.50%, 11/15/39 | 300,000 | 333,117 |
| (Catholic Health Initiatives), | | | | | | |
| 6.25%, 10/1/33(1) | 240,000 | 266,633 | | | | 1,312,223 |
| University of Colorado | | | | GEORGIA — 1.5% | | |
| Rev., Series 2009 A, | | | | Fulton County Development | | |
| 5.25%, 6/1/30(1) | 200,000 | 217,100 | | Auth. Rev., Series 2001 A, | | |
| | | 483,733 | | (TUFF/Atlanta Housing, | | |
| | | | | LLC Project at Georgia | | |
| CONNECTICUT — 1.3% | | | | State University), 5.50%, | | |
| Connecticut Health & | | | | 9/1/18 (Ambac)(1) | 500,000 | 523,700 |
| Educational Facilities Auth. | | | | Municipal Electric Authority | | |
| Rev., Series 2003 X3, (Yale | | | | of Georgia Rev., Series 1998 | | |
| University), 4.85%, 7/1/37(1) | 250,000 | 261,320 | | | | |
| | | | | Y, (Project One Special | | |
| Connecticut Health & | | | | Obligation), 6.40%, | | |
| Educational Facilities | | | | 1/1/13 (Ambac)(1) | 40,000 | 42,988 |
| Auth. Rev., Series 2007 I, | | | | | | 566,688 |
| (Quinnipiac University), | | | | | | |
| 5.00%, 7/1/17 (NATL)(1) | 200,000 | 225,104 | | GUAM — 0.7% | | |
| | | 486,424 | | Guam Government GO, Series | | |
| | | | | 2009 A, 6.75%, 11/15/29(1) | 250,000 | 267,667 |
| DELAWARE — 0.3% | | | | | | |
| New Castle County GO, Series | | | | ILLINOIS — 3.1% | | |
| 2009 A, 5.00%, 7/15/27(1) | 100,000 | 110,941 | | Illinois Finance Auth. Rev., | | |
| | | | | Series 2008 D, (Advocate | | |
| DISTRICT OF COLUMBIA — 1.2% | | | Health Care Network), | | |
| Washington Metropolitan | | | | 6.25%, 11/1/28(1) | 200,000 | 224,012 |
| Area Transit Auth. Rev., | | | | Illinois Finance Auth. Rev., | | |
| Series 2009 A, | | | | Series 2010 A, (Provena | | |
| 5.00%, 7/1/17(1) | 400,000 | 458,452 | | | | |
| | | | | Health), 5.00%, 5/1/13(1) | 400,000 | 418,460 |
| FLORIDA — 3.4% | | | | Metropolitan Pier & Exposition | | |
| Citizens Property Insurance | | | | Auth. Rev., Series 2002 | | |
| Corp. Rev., Series 2010 A1, | | | | A, (Capital Appreciation - | | |
| (Second High Risk Notes), | | | | McCormick Place Exposition), | | |
| 5.25%, 6/1/17(1) | 200,000 | 211,168 | | 5.81%, 12/15/31 (NATL)(1)(2) | 1,825,000 | 531,276 |
| Florida Board of Education | | | | | | 1,173,748 |
| Capital Outlay GO, | | | | INDIANA — 1.3% | | |
| Series 2007 G, 4.75%, | | | | | | |
| 6/1/37 (NATL)(1) | 250,000 | 255,005 | | Indiana Bond Bank Rev., Series | | |
| | | | | 2006 A, (Special Program), | | |
| Miami-Dade County | | | | 5.00%, 8/1/20 (AGM)(1) | 250,000 | 274,977 |
| Educational Facilities | | | | | | |
| Auth. Rev., Series 2008 A, | | | | Indiana Municipal Power | | |
| (University of Miami), | | | | Agency Rev., Series 2009 | | |
| 5.50%, 4/1/38(1) | 200,000 | 205,916 | | B, (Power Supply System), | | |
| | | | | 5.375%, 1/1/25(1) | 200,000 | 217,698 |
| | | | | | | 492,675 |
12
| | | | | | |
| Long-Term Tax-Free | | | | | |
| |
| | Principal | | | | Principal | |
| | Amount | Value | | | Amount | Value |
| KENTUCKY — 1.4% | | | | MISSOURI — 1.8% | | |
| Kentucky Property & | | | | Missouri Health & Educational | | |
| Buildings Community Rev., | | | | Facilities Auth. Rev., | | |
| 5.50%, 11/1/28(1) | $ 250,000 | $ 274,900 | | Series 2008 A, (The | | |
| Kentucky Turnpike Auth. | | | | Washington University), | | |
| Economic Development | | | | 5.375%, 3/15/39(1) | $ 250,000 | $ 273,780 |
| Road Rev., Series 2008 A, | | | | Missouri Health & Educational | | |
| (Revitalization), | | | | Facilities Auth. Rev., Series | | |
| 5.00%, 7/1/17(1) | 240,000 | 277,500 | | 2009 A, (The Washington | | |
| | | 552,400 | | University), 5.00%, 11/15/39(1) | 400,000 | 429,132 |
| MARYLAND — 2.4% | | | | | | 702,912 |
| Maryland Economic | | | | NEBRASKA — 0.4% | | |
| Development Corp. Student | | | | Nebraska Public Power | | |
| Housing Rev., (University | | | | District Rev., Series 2008 B, | | |
| of Maryland, College Park), | | | | 5.00%, 1/1/24(1) | 150,000 | 161,564 |
| 5.00%, 6/1/19(1) | 150,000 | 156,121 | | NEVADA — 2.3% | | |
| Maryland GO, Series 2005 B, | | | | Clark County School District | | |
| (State & Local Facilities Loan), | | | | GO, Series 2001 A, VRDN, | | |
| 5.25%, 2/15/12(1) | 250,000 | 270,440 | | 0.33%, 6/1/10 (AGM) | | |
| Maryland Health & Higher | | | | (SBBPA: State Street | | |
| Educational Facilities Auth. | | | | Bank and Trust Co.)(1) | 900,000 | 900,000 |
| Rev., (LifeBridge Health Issue), | | | | NEW JERSEY — 3.0% | | |
| 4.75%, 7/1/11(1) | 250,000 | 259,790 | | | | |
| | | | | Monmouth County GO, | | |
| Maryland Health & Higher | | | | (County College Bonds), | | |
| Educational Facilities Auth. | | | | 4.00%, 9/15/19(1) | 250,000 | 272,755 |
| Rev., Series 2008 A, | | | | | | |
| (Johns Hopkins University), | | | | New Jersey GO, | | |
| | | | | 5.00%, 6/1/17(1) | 200,000 | 231,822 |
| 5.00%, 7/1/18(1) | 200,000 | 236,178 | | | | |
| | | 922,529 | | New Jersey Transportation | | |
| | | | | Trust Fund Auth. Rev., Series | | |
| MASSACHUSETTS — 2.2% | | | | 2006 A, 5.25%, 12/15/20(1) | 205,000 | 232,191 |
| Massachusetts Bay | | | | New Jersey Turnpike Auth. | | |
| Transportation Auth. Rev., | | | | Rev., Series 2009 H, | | |
| Series 2008 A, | | | | 5.00%, 1/1/36(1) | 250,000 | 260,080 |
| 5.25%, 7/1/34(1) | 200,000 | 216,770 | | | | |
| | | | | Tobacco Settlement Financing | | |
| Massachusetts GO, Series | | | | Corp. Rev., Series 2007 1A, | | |
| 2008 A, 5.00%, 8/1/24(1) | 200,000 | 222,406 | | 5.00%, 6/1/41(1) | 250,000 | 169,470 |
| Massachusetts Health & | | | | | | 1,166,318 |
| Educational Facilities Auth. | | | | | | |
| Rev., (Boston Medical Center), | | | | NEW YORK — 14.1% | | |
| 5.25%, 7/1/38(1) | 200,000 | 177,516 | | Long Island Power Auth. | | |
| Massachusetts Health & | | | | Electric System Rev., Series | | |
| | | | | 2008 A, 6.00%, 5/1/33(1) | 250,000 | 284,995 |
| Educational Facilities Auth. | | | | | | |
| Rev., Series 2009 A, (Harvard | | | | Long Island Power Auth. | | |
| University), 5.50%, 11/15/36(1) | 200,000 | 228,184 | | Electric System Rev., | | |
| | | 844,876 | | Series 2008 B, 5.25%, | | |
| | | | | 4/1/19 (AGC-ICC)(1) | 150,000 | 173,262 |
| MINNESOTA — 1.4% | | | | Metropolitan Transportation | | |
| Minneapolis-St. Paul | | | | Auth. Rev., Series 2008 C, | | |
| Metropolitan Airports | | | | 6.50%, 11/15/28(1) | 250,000 | 293,515 |
| Commission Rev., Series 2007 | | | | | | |
| B, 5.00%, 1/1/25 | | | | New York City Municipal Water | | |
| (NATL/FGIC)(1) | 300,000 | 313,683 | | Finance Auth. Water & Sewer | | |
| | | | | System Rev., Series 2004 C, | | |
| Minnesota GO, | | | | 5.00%, 6/15/35(1) | 250,000 | 257,650 |
| 5.00%, 6/1/18(1) | 200,000 | 228,632 | | | | |
| | | 542,315 | | | | |
13
| | | | | | |
| Long-Term Tax-Free | | | | | |
| |
| | Principal | | | | Principal | |
| | Amount | Value | | | Amount | Value |
| New York City Transitional | | | | North Carolina Eastern | | |
| Finance Auth. Rev., Series | | | | Municipal Power Agency Rev., | | |
| 2004 D2, 5.00%, 11/1/12(1) | $ 215,000 | $ 236,822 | | Series 2009 A, 5.00%, 1/1/18(1) | $ 300,000 | $ 330,393 |
| New York City Transitional | | | | North Carolina Municipal | | |
| Finance Auth. Rev., Series | | | | Power Agency No. 1 Catawba | | |
| 2009 S4, 5.50%, 1/15/39(1) | 300,000 | 327,066 | | Electric Rev., Series 2003 A, | | |
| New York GO, Series 2009 A, | | | | 5.50%, 1/1/13(1) | 150,000 | 165,759 |
| 5.00%, 2/15/39(1) | 300,000 | 317,793 | | North Carolina Municipal | | |
| New York GO, Series 2009 C, | | | | Power Agency No. 1 Catawba | | |
| 5.00%, 8/1/23(1) | 250,000 | 275,690 | | Electric Rev., Series 2008 A, | | |
| | | | | 5.25%, 1/1/16(1) | 300,000 | 340,785 |
| New York GO, Series 2009 E, | | | | | | |
| 5.00%, 8/1/16(1) | 400,000 | 456,804 | | | | 1,133,497 |
| New York Local Government | | | | OHIO — 1.1% | | |
| Assistance Corp. Rev., Series | | | | Buckeye Tobacco Settlement | | |
| 2003 A5/6, 5.00%, 4/1/18(1) | 250,000 | 292,173 | | Financing Auth. Rev., Series | | |
| New York State Dormitory | | | | 2007 A2, (Asset-Backed Senior | | |
| Auth. Rev., (Columbia | | | | Current Interest Turbo Term), | | |
| University), 4.00%, 7/1/13(1) | 250,000 | 273,455 | | 5.875%, 6/1/30(1) | 500,000 | 405,015 |
| New York State Dormitory | | | | OREGON — 2.2% | | |
| Auth. Rev., (Mental | | | | Clackamas County Hospital | | |
| Health Services Facilities | | | | Facility Auth. Rev., Series 2009 | | |
| Improvement), | | | | A, (Legacy Health System), | | |
| 5.50%, 2/15/18(1) | 300,000 | 346,464 | | 5.50%, 7/15/35(1) | 200,000 | 209,036 |
| New York State Dormitory | | | | Oregon GO, Series 2009 | | |
| Auth. Rev., Series 2009 A, | | | | A, (State Board of Higher | | |
| (North Shore Long Island | | | | Education), 5.00%, 8/1/38(1) | 300,000 | 317,616 |
| Jewish Health System), | | | | Oregon Health & Science | | |
| 5.50%, 5/1/37(1) | 400,000 | 412,788 | | University Rev., Series 2009 A, | | |
| New York State Dormitory | | | | 5.75%, 7/1/39(1) | 300,000 | 319,872 |
| Auth. State Personal Income | | | | | | 846,524 |
| Tax Rev., Series 2008 A, | | | | | | |
| 5.00%, 3/15/19(1) | 300,000 | 344,889 | | PENNSYLVANIA — 6.2% | | |
| New York State Environmental | | | | Allegheny County Industrial | | |
| Facilities Corp. Rev., Series | | | | Development Auth. Rev., | | |
| 2009 A, 5.125%, 6/15/38(1) | 280,000 | 300,194 | | (Residential Resources, Inc.), | | |
| | | | | 4.50%, 9/1/11(1) | 675,000 | 690,755 |
| New York Troy Capital | | | | | | |
| Resource Corp. Rev., | | | | Central Dauphin School | | |
| Series 2010 A, (Rensselaer | | | | District GO, 7.00%, 2/1/16, | | |
| Polytechnic), | | | | Prerefunded at 100% | | |
| | | | | of Par (NATL)(1)(3) | 500,000 | 637,015 |
| 5.125%, 9/1/40(1) | 250,000 | 255,690 | | | | |
| New York Urban Development | | | | Pennsylvania Turnpike | | |
| Corp. State Personal Income | | | | Commission Rev., | | |
| Tax Rev., Series 2008 A1, | | | | Series 2008 C, 6.00%, | | |
| | | | | 6/1/28 (AGC)(1) | 200,000 | 223,834 |
| (Economic Development & | | | | | | |
| Housing), 5.00%, 12/15/22(1) | 340,000 | 379,559 | | Philadelphia Gas Works Rev., | | |
| Triborough Bridge & Tunnel | | | | Series 2009 A, (1998 General | | |
| | | | | Ordinance), 5.00%, 8/1/16(1) | 300,000 | 312,951 |
| Auth. Rev., Series 2008 C, | | | | | | |
| 5.00%, 11/15/38(1) | 200,000 | 210,566 | | Philadelphia Water & | | |
| | | 5,439,375 | | Wastewater Rev., Series 2009 | | |
| | | | | A, 5.25%, 1/1/36(1) | 250,000 | 259,258 |
| NORTH CAROLINA — 2.9% | | | | Westmoreland County | | |
| North Carolina Eastern | | | | Industrial Development Auth. | | |
| Municipal Power Agency Rev., | | | | Rev., (Excela Health Project), | | |
| Series 2008 C, | | | | 5.125%, 7/1/30(4) | 250,000 | 247,667 |
| 6.75%, 1/1/24(1) | 250,000 | 296,560 | | | | |
| | | | | | | 2,371,480 |
14
| | | | | | |
| Long-Term Tax-Free | | | | | |
| |
| | Principal | | | | Principal | |
| | Amount | Value | | | Amount | Value |
| PUERTO RICO — 5.4% | | | | UTAH — 1.5% | | |
| Puerto Rico Aqueduct & Sewer | | | | Utah State Board of Regents | | |
| Auth. Rev., Series 2008 A, | | | | Hospital Rev., Series 2006 A, | | |
| (Senior Lien), 5.00%, 7/1/14(1) | $ 500,000 | $ 540,925 | | (University of Utah), 5.25%, | | |
| Puerto Rico GO, Series 2006 A, | | | | 8/1/21 (NATL)(1) | $ 250,000 | $ 287,615 |
| (Public Improvement), | | | | Utah Transit Auth. Sales | | |
| 5.25%, 7/1/23(1) | 250,000 | 257,200 | | Tax Rev., Series 2008 A, | | |
| Puerto Rico GO, Series 2008 A, | | | | 5.00%, 6/15/20(1) | 250,000 | 286,605 |
| 5.125%, 7/1/28(1) | 200,000 | 203,502 | | | | 574,220 |
| Puerto Rico Government | | | | VIRGINIA — 1.2% | | |
| Development Bank Rev., | | | | Virginia Resources Auth. Clean | | |
| 4.75%, 12/1/15 (NATL)(1) | 250,000 | 259,623 | | Water Rev., 5.00%, 10/1/16(1) | 200,000 | 234,458 |
| Puerto Rico Highway & | | | | Washington County Industrial | | |
| Transportation Auth. Rev., | | | | Development Auth. Hospital | | |
| Series 2007 N, 5.25%, | | | | Facility Rev., Series 2009 | | |
| 7/1/30 (Ambac)(1) | 400,000 | 415,664 | | C, (Mountain States Health | | |
| Puerto Rico Public Buildings | | | | Alliance), 7.75%, 7/1/38(1) | 200,000 | 229,142 |
| Auth. Rev., Series 2009 Q, | | | | | | 463,600 |
| 5.625%, 7/1/39(1) | 400,000 | 415,992 | | | | |
| | | | | WASHINGTON — 2.4% | | |
| | | 2,092,906 | | Redmond GO, | | |
| SOUTH CAROLINA — 1.0% | | | | 5.00%, 12/1/21(1) | 250,000 | 284,222 |
| South Carolina Jobs-Economic | | | | Washington GO, Series 2008 | | |
| Development Auth. Hospital | | | | A, 5.00%, 7/1/20(1) | 200,000 | 228,466 |
| Rev., (Palmetto Health), | | | | | | |
| 5.75%, 8/1/39(1) | 400,000 | 400,812 | | Washington Health Care | | |
| | | | | Facilities Auth. Rev., Series | | |
| TENNESSEE — 0.7% | | | | 2009 A, (Swedish Health | | |
| Metropolitan Government | | | | Services), 6.50%, 11/15/33 | 400,000 | 420,144 |
| Nashville & Davidson County | | | | | | 932,832 |
| Health & Educational Facilities | | | | | | |
| Board Rev., Series 2008 A, | | | | WISCONSIN — 3.0% | | |
| (Vanderbilt University), | | | | Milwaukee Redevelopment | | |
| 5.00%, 10/1/15(1) | 225,000 | 262,006 | | Auth. Rev., (Milwaukee Public | | |
| TEXAS — 4.3% | | | | Schools - Neighborhood | | |
| | | | | Schools Initiative), 5.125%, | | |
| Harris County Rev., Series | | | | 8/1/13, Prerefunded at 100% | | |
| 2009 A, (Toll Road), | | | | of Par (Ambac)(1)(3) | 475,000 | 534,612 |
| 5.00%, 8/15/38(1) | 400,000 | 416,760 | | | | |
| | | | | Wisconsin Health & | | |
| Lower Colorado River Auth. | | | | Educational Facilities Auth. | | |
| Rev., 5.00%, 5/15/15(1) | 200,000 | 227,224 | | Rev., (ProHealth Care, Inc. | | |
| North Texas Thruway Auth. | | | | Obligated Group), | | |
| Rev., Series 2008 H, (First | | | | 6.625%, 2/15/39(1) | 300,000 | 326,769 |
| Tier), VRDN, 5.00%, 1/1/13(1) | 225,000 | 241,902 | | Wisconsin Transportation | | |
| Tarrant County Cultural | | | | Rev., Series 2008 A, | | |
| Education Facilities Finance | | | | 5.00%, 7/1/18(1) | 250,000 | 290,455 |
| Corp. Hospital Rev., (Scott | | | | | | 1,151,836 |
| & White Memorial Hospital | | | | | | |
| and Scott, Sherwood & | | | | TOTAL MUNICIPAL SECURITIES | |
| Brindley Foundation), | | | | (Cost $35,366,094) | | 37,658,583 |
| 5.50%, 8/15/31(1) | 250,000 | 262,957 | | | | |
| University of North Texas Rev., | | | | | | |
| Series 2009 A, 5.00%, 4/15/32 | 250,000 | 264,685 | | | | |
| West Harris County | | | | | | |
| Regional Water Auth. Rev., | | | | | | |
| 5.00%, 12/15/35(1) | 250,000 | 253,023 | | | | |
| | | 1,666,551 | | | | |
15
| | |
| Long-Term Tax-Free | |
| | Principal | |
| | Amount | Value |
| Municipal Inverse Floaters(5) — 1.0% |
| TEXAS — 1.0% | | |
| Texas GO, VRN, Inverse | | |
| Floater, 8.91%, 9/30/11(1) | | |
| (Cost $377,633) | $ 360,000 | $ 382,169 |
| TOTAL INVESTMENT | | |
| SECURITIES — 98.9% | | |
| (Cost $35,743,727) | | 38,040,752 |
| OTHER ASSETS | | |
| AND LIABILITIES — 1.1% | | 437,238 |
| TOTAL NET ASSETS — 100.0% | $38,477,990 |
| | | | | |
| Futures Contracts | | | |
| | | | | Underlying Face | |
| | Contracts Purchased | Expiration Date | Amount at Value | Unrealized Gain (Loss) |
| | 6 | U.S. Long Bond | September 2010 | $735,938 | $(6,577) |
| |
| | | | | Underlying Face | |
| | Contracts Sold | Expiration Date | Amount at Value | Unrealized Gain (Loss) |
| | 34 | U.S. Treasury 2-Year Notes | September 2010 | $7,416,781 | $(9,107) |
| |
| Notes to Schedule of Investments | | |
| AGC = Assured Guaranty Corporation | | | |
| AGC-ICC = Assured Guaranty Corporation - Insured Custody Certificates | | |
| AGM = Assured Guaranty Municipal Corporation | | | |
| Ambac = Ambac Assurance Corporation | | | |
| COP = Certificates of Participation | | | |
| FGIC = Financial Guaranty Insurance Company | | | |
| GO = General Obligation | | | |
| NATL = National Public Finance Guarantee Corporation | | |
| SBBPA = Standby Bond Purchase Agreement | | | |
| VRDN = Variable Rate Demand Note. Interest reset date is indicated. Rate shown is effective at the period end. | |
| VRN = Variable Rate Note. Interest reset date is indicated. Rate shown is effective at the period end. | |
| (1) | Security, or a portion thereof, has been segregated for when-issued securities and/or futures contracts. At the period end, the aggregate value of |
| | securities pledged was $8,401,000. | | | |
| (2) | Security is a zero-coupon municipal bond. The rate indicated is the yield to maturity at purchase. Zero-coupon securities are issued at a |
| | substantial discount from their value at maturity. | | |
| (3) | Escrowed to maturity in U.S. government securities or state and local government securities. | |
| (4) | When-issued security. | | | |
| (5) | Inverse floaters have interest rates that move inversely to market interest rates. Inverse floaters typically have durations longer than long-term |
| | bonds, which may cause their value to be more volatile than long-term bonds when interest rates change. Final maturity is indicated. |
Geographic classifications are unaudited.
See Notes to Financial Statements.
16
|
| Statement of Assets and Liabilities |
| | | |
| MAY 31, 2010 | | | |
| Assets | | | |
| Investment securities, at value (cost of $35,743,727) | | $38,040,752 |
| Cash | | | 207,441 |
| Receivable for investments sold | | | 51,822 |
| Receivable for capital shares sold | | | 389 |
| Receivable for variation margin on futures contracts | | 1,312 |
| Interest receivable | | | 552,943 |
| | | | 38,854,659 |
| | | | |
| Liabilities | | | |
| Payable for investments purchased | | | 244,922 |
| Payable for capital shares redeemed | | | 82,098 |
| Payable for variation margin on futures contracts | | 14,344 |
| Accrued management fees | | | 15,347 |
| Service fees (and distribution fees — A Class) payable | | 6,061 |
| Distribution fees payable | | | 3,156 |
| Dividends payable | | | 10,741 |
| | | | 376,669 |
| | | | |
| Net Assets | | | $38,477,990 |
| | | | |
| Net Assets Consist of: | | | |
| Capital paid in | | | $37,454,684 |
| Accumulated net realized loss on investment transactions | | (1,258,035) |
| Net unrealized appreciation on investments | | | 2,281,341 |
| | | | $38,477,990 |
| |
| | Net assets | Shares outstanding | Net asset value per share |
| Investor Class | $9,823,765 | 891,659 | $11.02 |
| Institutional Class | $118,249 | 10,733 | $11.02 |
| A Class | $23,618,445 | 2,143,974 | $11.02* |
| B Class | $592,267 | 53,768 | $11.02 |
| C Class | $4,325,264 | 392,612 | $11.02 |
| * Maximum offering price $11.54 (net asset value divided by 0.955) | | |
| |
| |
| See Notes to Financial Statements. | | | |
17
| |
| YEAR ENDED MAY 31, 2010 | |
| Investment Income (Loss) | |
| Income: | |
| Interest | $1,698,589 |
| | |
| Expenses: | |
| Management fees | 174,931 |
| Distribution fees: | |
| B Class | 5,456 |
| C Class | 33,842 |
| Service fees: | |
| B Class | 1,819 |
| C Class | 11,281 |
| Distribution and service fees — A Class | 58,290 |
| Trustees’ fees and expenses | 1,657 |
| Other expenses | 663 |
| | 287,939 |
| | |
| Net investment income (loss) | 1,410,650 |
| | |
| Realized and Unrealized Gain (Loss) | |
| Net realized gain (loss) on: | |
| Investment transactions | 258,446 |
| Futures contract transactions | 12,993 |
| | 271,439 |
| | |
| Change in net unrealized appreciation (depreciation) on: | |
| Investments | 977,090 |
| Futures contracts | (14,582) |
| | 962,508 |
| | |
| Net realized and unrealized gain (loss) | 1,233,947 |
| | |
| Net Increase (Decrease) in Net Assets Resulting from Operations | $2,644,597 |
| |
| |
| See Notes to Financial Statements. | |
18
|
| Statement of Changes in Net Assets |
| | |
| YEARS ENDED MAY 31, 2010 AND MAY 31, 2009 | | |
| Increase (Decrease) in Net Assets | 2010 | 2009 |
| Operations | | |
| Net investment income (loss) | $ 1,410,650 | $ 1,331,096 |
| Net realized gain (loss) | 271,439 | (568,082) |
| Change in net unrealized appreciation (depreciation) | 962,508 | 1,186,428 |
| Net increase (decrease) in net assets resulting from operations | 2,644,597 | 1,949,442 |
| | | |
| Distributions to Shareholders | | |
| From net investment income: | | |
| Investor Class | (274,892) | (80,690) |
| Institutional Class | (97,171) | (709,440) |
| A Class | (900,601) | (454,165) |
| B Class | (22,829) | (26,373) |
| C Class | (140,522) | (62,062) |
| Decrease in net assets from distributions | (1,436,015) | (1,332,730) |
| | | |
| Capital Share Transactions | | |
| Net increase (decrease) in net assets from capital share transactions | (10,048,893) | 16,338,631 |
| | | |
| Net increase (decrease) in net assets | (8,840,311) | 16,955,343 |
| | | |
| Net Assets | | |
| Beginning of period | 47,318,301 | 30,362,958 |
| End of period | $38,477,990 | $47,318,301 |
| | | |
| Undistributed net investment income | — | $25,365 |
| |
| |
| See Notes to Financial Statements. | | |
19
|
| Notes to Financial Statements |
MAY 31, 2010
1. Organization and Summary of Significant Accounting Policies
Organization — American Century Municipal Trust (the trust) is registered under the Investment Company Act of 1940 (the 1940 Act) as an open-end management investment company. Long-Term Tax-Free Fund (the fund) is one fund in a series issued by the trust. The fund is diversified under the 1940 Act. The fund’s investment objective is to seek high current income that is exempt from federal income taxes consistent with preservation of capital. The fund pursues its objective by investing primarily in long-term investment-grade municipal obligations. The following is a summary of the fund’s significant accounting policies.
Multiple Class — The fund is authorized to issue the Investor Class, the Institutional Class, the A Class, the B Class and the C Class. The A Class may incur an initial sales charge. The A Class, B Class and C Class may be subject to a contingent deferred sales charge. The share classes differ principally in their respective sales charges and distribution and shareholder servicing expenses and arrangements. All shares of the fund represent an equal pro rata interest in the net assets of the class to which such shares belong, and have identical voting, dividend, liquidation and other rights and the same terms and conditions, except for class specific expenses and exclusive rights to vote on matters affecting only individual classes. Income, non-class specific expenses, and realized and unrealized capital gains and losses of th e fund are allocated to each class of shares based on their relative net assets.
Security Valuations — Debt securities maturing in greater than 60 days at the time of purchase are valued at current market value as provided by a commercial pricing service or at the mean of the most recent bid and asked prices. Debt securities maturing within 60 days at the time of purchase may be valued at cost, plus or minus any amortized discount or premium. If an event occurs after the value of a security was established but before the net asset value per share was determined that was likely to materially change the net asset value, that security would be valued as determined in accordance with procedures adopted by the Board of Trustees. If the fund determines that the market price of a portfolio security is not readily available, or that the valuation methods mentioned above do not reflect the security’s fair val ue, such security is valued as determined by the Board of Trustees or its designee, in accordance with procedures adopted by the Board of Trustees, if such determination would materially impact a fund’s net asset value. Certain other circumstances may cause the fund to use alternative procedures to value a security such as: a security has been declared in default; trading in a security has been halted during the trading day; or there is a foreign market holiday and no trading will commence.
Security Transactions — For financial reporting purposes, security transactions are accounted for as of the trade date. Net realized gains and losses are determined on the identified cost basis, which is also used for federal income tax purposes.
Investment Income — Interest income is recorded on the accrual basis and includes accretion of discounts and amortization of premiums.
When-Issued — The fund may engage in securities transactions on a when-issued basis. Under these arrangements, the securities’ prices and yields are fixed on the date of the commitment, but payment and delivery are scheduled for a future date. During this period, securities are subject to market fluctuations. The fund will segregate cash, cash equivalents or other appropriate liquid securities on its records in amounts sufficient to meet the purchase price.
20
Income Tax Status — It is the fund’s policy to distribute substantially all net investment income and net realized gains to shareholders and to otherwise qualify as a regulated investment company under provisions of the Internal Revenue Code. The fund is no longer subject to examination by tax authorities for years prior to 2007. At this time, management believes there are no uncertain tax positions which, based on their technical merit, would not be sustained upon examination and for which it is reasonably possible that the total amounts of unrecognized tax benefits will significantly change in the next twelve months. Accordingly, no provision has been made for federal or state income taxes.
Distributions to Shareholders — Distributions from net investment income are declared daily and paid monthly. Distributions from net realized gains, if any, are generally declared and paid annually.
Indemnifications — Under the trust’s organizational documents, its officers and trustees are indemnified against certain liabilities arising out of the performance of their duties to the fund. In addition, in the normal course of business, the fund enters into contracts that provide general indemnifications. The maximum exposure under these arrangements is unknown as this would involve future claims that may be made against a fund. The risk of material loss from such claims is considered by management to be remote.
Use of Estimates — The financial statements are prepared in conformity with accounting principles generally accepted in the United States of America, which may require management to make certain estimates and assumptions at the date of the financial statements. Actual results could differ from these estimates.
Subsequent Events — In preparing the financial statements, management evaluated the impact of events or transactions occurring through the date the financial statements were issued that would merit recognition or disclosure.
2. Fees and Transactions with Related Parties
Management Fees — The trust has entered into a Management Agreement with American Century Investment Management, Inc. (ACIM) (the investment advisor), under which ACIM provides the fund with investment advisory and management services in exchange for a single, unified management fee (the fee) per class. The Agreement provides that all expenses of managing and operating the fund, except brokerage expenses, taxes, interest, fees and expenses of the independent trustees (including legal counsel fees), and extraordinary expenses, will be paid by ACIM. The fee is computed and accrued daily based on the daily net assets of the specific class of shares of the fund and paid monthly in arrears. The fee consists of (1) an Investment Category Fee based on the daily net assets of the fund and certain other accounts managed by the inv estment advisor that are in the same broad investment category as the fund and (2) a Complex Fee based on the assets of all the funds in the American Century Investments family of funds. The rates for the Investment Category Fee range from 0.1625% to 0.2800%. The rates for the Complex Fee range from 0.2500% to 0.3100% for the Investor Class, A Class, B Class and C Class. The Institutional Class is 0.2000% less at each point within the Complex Fee range. The effective annual management fee for each class for the year ended May 31, 2010 was 0.48% for the Investor Class, A Class, B Class and C Class and 0.28% for the Institutional Class.
Distribution and Service Fees — The Board of Trustees has adopted a separate Master Distribution and Individual Shareholder Services Plan for each of the A Class, B Class and C Class (collectively the plans), pursuant to Rule 12b-1 of the 1940 Act. The plans provide that the A Class will pay American Century Investment Services, Inc. (ACIS) an annual distribution and service fee of 0.25%. The plans provide that the B Class and the C Class will each pay ACIS an annual distribution fee of 0.75% and service fee of 0.25%. The fees are computed and accrued daily based on each class’s daily net assets and paid monthly in arrears. The fees are used to pay financial intermediaries for distribution and individual shareholder services. Fees incurred under the plans during the year ended May 31, 2010, are detailed in the Statem ent of Operations.
21
Related Parties — Certain officers and trustees of the trust are also officers and/or directors of American Century Companies, Inc. (ACC), the parent of the trust’s investment advisor, ACIM, the distributor of the trust, ACIS, and the trust’s transfer agent, American Century Services, LLC.
The fund has a Mutual Funds Services Agreement with J.P. Morgan Investor Services Co. (JPMIS). JPMorgan Chase Bank (JPMCB) is a custodian of the fund. JPMIS and JPMCB are wholly owned subsidiaries of JPMorgan Chase & Co. (JPM). JPM is an equity investor in ACC.
3. Investment Transactions
Purchases and sales of investment securities, excluding short-term investments, for the year ended May 31, 2010, were $17,506,506 and $26,164,080, respectively.
4. Capital Share Transactions
Transactions in shares of the fund were as follows (unlimited number of shares authorized):
| | | | |
| | Year ended May 31, 2010 | Year ended May 31, 2009 |
| | Shares | Amount | Shares | Amount |
| Investor Class | | | | |
| Sold | 811,413 | $ 8,827,225 | 285,606 | $ 2,979,888 |
| Issued in reinvestment of distributions | 23,733 | 257,652 | 7,436 | 76,437 |
| Redeemed | (285,292) | (3,092,653) | (52,676) | (541,689) |
| | 549,854 | 5,992,224 | 240,366 | 2,514,636 |
| Institutional Class | | | | |
| Sold | 11,253 | 121,300 | — | — |
| Issued in reinvestment of distributions | 9,047 | 95,125 | 68,952 | 707,443 |
| Redeemed | (1,751,597) | (18,437,296) | — | — |
| | (1,731,297) | (18,220,871) | 68,952 | 707,443 |
| A Class | | | | |
| Sold | 900,790 | 9,699,547 | 1,367,415 | 14,092,087 |
| Issued in reinvestment of distributions | 69,793 | 755,696 | 37,500 | 385,499 |
| Redeemed | (772,429) | (8,367,857) | (341,991) | (3,510,785) |
| | 198,154 | 2,087,386 | 1,062,924 | 10,966,801 |
| B Class | | | | |
| Sold | 1,035 | 11,150 | 12,884 | 130,191 |
| Issued in reinvestment of distributions | 1,871 | 20,217 | 2,162 | 22,178 |
| Redeemed | (31,186) | (340,312) | (42,744) | (439,394) |
| | (28,280) | (308,945) | (27,698) | (287,025) |
| C Class | | | | |
| Sold | 202,429 | 2,174,348 | 353,965 | 3,540,893 |
| Issued in reinvestment of distributions | 10,166 | 110,117 | 4,636 | 47,655 |
| Redeemed | (173,723) | (1,883,152) | (114,028) | (1,151,772) |
| | 38,872 | 401,313 | 244,573 | 2,436,776 |
| Net increase (decrease) | (972,697) | $(10,048,893) | 1,589,117 | $16,338,631 |
22
5. Fair Value Measurements
The fund’s securities valuation process is based on several considerations and may use multiple inputs to determine the fair value of the positions held by the fund. In conformity with accounting principles generally accepted in the United States of America, the inputs used to determine a valuation are classified into three broad levels as follows:
• Level 1 valuation inputs consist of unadjusted quoted prices in an active market for identical securities;
• Level 2 valuation inputs consist of significant direct or indirect observable market data (including quoted prices for similar securities, evaluations of subsequent market events, interest rates, prepayment speeds, credit risk, etc.); or
• Level 3 valuation inputs consist of significant unobservable inputs (including a fund’s own assumptions).
The level classification is based on the lowest level input that is significant to the fair valuation measurement. The valuation inputs are not an indication of the risks associated with investing in these securities or other financial instruments.
As of May 31, 2010, the valuation inputs used to determine the fair value of the fund’s investment securities and unrealized gain (loss) on futures contracts were classified as Level 2 and Level 1, respectively. The Schedule of Investments provides additional details on the fund’s portfolio holdings.
6. Derivative Instruments
Interest Rate Risk — The fund is subject to interest rate risk in the normal course of pursuing its investment objectives. The value of bonds generally declines as interest rates rise. A fund may enter into futures contracts based on a bond index or a specific underlying security. A fund may purchase futures contracts to gain exposure to increases in market value or sell futures contracts to protect against a decline in market value. Upon entering into a futures contract, a fund will segregate cash, cash equivalents or other appropriate liquid securities on its records in amounts sufficient to meet requirements. Subsequent payments (variation margin) are made or received daily, in cash, by a fund. The variation margin is equal to the daily change in the contract value and is recorded as unrealized gains and losses. A fund rec ognizes a realized gain or loss when the futures contract is closed or expires. Net realized and unrealized gains or losses occurring during the holding period of futures contracts are a component of net realized gain (loss) on futures contract transactions and change in net unrealized appreciation (depreciation) on futures contracts, respectively. One of the risks of entering into futures contracts is the possibility that the change in value of the contract may not correlate with the changes in value of the underlying securities. The interest rate risk derivative instruments held at period end as disclosed on the Schedule of Investments are indicative of the fund’s typical volume during the period.
The value of interest rate risk derivative instruments as of May 31, 2010, is disclosed on the Statement of Assets and Liabilities as of asset of $1,312 in receivable for variation margin on futures contracts and as a liability of $14,344 in payable for variation margin on futures contracts. For the year ended May 31, 2010, the effect of interest rate risk derivative instruments on the Statement of Operations was $12,993 in net realized gain (loss) on futures contract transactions and $(14,582) in change in net unrealized appreciation (depreciation) on futures contracts.
23
7. Interfund Lending
The fund, along with certain other funds in the American Century Investments family of funds, may participate in an interfund lending program, pursuant to an Exemptive Order issued by the Securities and Exchange Commission (SEC). This program provides an alternative credit facility allowing the fund to borrow from or lend to other funds in the American Century Investments family of funds that permit such transactions. Interfund lending transactions are subject to each fund’s investment policies and borrowing and lending limits. The interfund loan rate earned/paid on interfund lending transactions is determined daily based on the average of certain current market rates. Interfund lending transactions normally extend only overnight, but can have a maximum duration of seven days. The program is subject to annual approval by the Board of Trustees. During the year ended May 31, 2010, the fund did not utilize the p rogram
8. Federal Tax Information
The tax character of distributions paid during the years ended May 31, 2010 and May 31, 2009 were as follows:
| | |
| | 2010 | 2009 |
| Distributions Paid From | | |
| Exempt income | $1,436,015 | $1,332,730 |
| Long-term capital gains | — | — |
The book-basis character of distributions made during the year from net investment income or net realized gains may differ from their ultimate characterization for federal income tax purposes. These differences reflect the differing character of certain income items and net realized gains and losses for financial statement and tax purposes, and may result in reclassification among certain capital accounts on the financial statements.
As of May 31, 2010, the federal tax cost of investments and the components of distributive earnings on a tax-basis were as follows:
| | |
| Federal tax cost of investments | $35,743,727 |
| Gross tax appreciation of investments | $2,369,633 |
| Gross tax depreciation of investments | (72,608) |
| Net tax appreciation (depreciation) of investments | $2,297,025 |
| Other book-to-tax adjustments | $ (69,387) |
| Net tax appreciation (depreciation) | $2,227,638 |
| Accumulated capital losses | $(1,204,332) |
The difference between book-basis and tax-basis cost and unrealized appreciation (depreciation) is attributable primarily to the realization for tax purposes of unrealized gain (loss) on certain futures contracts. Other book-to-tax adjustments are attributable primarily to the tax deferral of losses on straddle positions.
The accumulated capital losses listed above represent net capital loss carryovers that may be used to offset future realized capital gains for federal income tax purposes. Future capital loss carryover utilization in any given year may be subject to Internal Revenue Code limitations. The capital loss carryovers expire as follows:
| | | | | | |
| 2012 | 2013 | 2014 | 2015 | 2016 | 2017 | 2018 |
| $(8,266) | $(142,310) | $(389,668) | — | $(415,549) | $(175,946) | $(72,593) |
24
9. Corporate Event
As part of a long-standing estate and business succession plan established by ACC Co-Chairman James E. Stowers, Jr., the founder of American Century Investments, ACC Co-Chairman Richard W. Brown succeeded Mr. Stowers as trustee of a trust that holds a greater-than-25% voting interest in ACC, the parent corporation of each fund’s advisor. Under the 1940 Act, this is presumed to represent control of ACC even though it is less than a majority interest. The change of trustee may technically be considered a “change of control” of ACC and therefore also a change of control of each fund’s advisor even though there has been no change to their management and none is anticipated. The “change of control” resulted in the assignment of each fund’s investment advisory agreement. Under the 1940 Act, an assignment automatically terminated such agreement, making the approval of a new agreement necessary.
On February 18, 2010, the Board of Trustees approved interim investment advisory agreements under which each fund will be managed until new agreements are approved by fund shareholders. On April 1, 2010, the Board of Trustees approved new investment advisory agreements. The interim agreements and the new agreements are substantially identical to the terminated agreements (with the exception of different effective and termination dates) and will not result in changes in the management of American Century Investments, the funds, their investment objectives, fees or services provided. The new agreement for the fund was approved by shareholders at a Special Meeting of Shareholders on June 16, 2010. The new agreement went into effect on July 16, 2010.
10. Other Tax Information (Unaudited)
The following information is provided pursuant to provisions of the Internal Revenue Code.
The fund designates exempt interest dividends of $1,440,528 for the fiscal year ended May 31, 2010.
25
| | | | | | |
| Long-Term Tax-Free | | | | | |
| |
| Investor Class | | | | | |
| For a Share Outstanding Throughout the Years Ended May 31 (except as noted) | | |
| | | 2010 | 2009 | 2008 | 2007 | 2006(1) |
| Per-Share Data | | | | | |
| Net Asset Value, Beginning of Period | $10.60 | $10.56 | $10.78 | $10.70 | $10.72 |
| Income From Investment Operations | | | | | |
| Net Investment Income (Loss) | 0.44(2) | 0.39 | 0.43 | 0.43 | 0.06 |
| Net Realized and Unrealized Gain (Loss) | 0.42 | 0.04 | (0.22) | 0.08 | (0.02) |
| Total From Investment Operations | 0.86 | 0.43 | 0.21 | 0.51 | 0.04 |
| Distributions | | | | | |
| From Net Investment Income | (0.44) | (0.39) | (0.43) | (0.43) | (0.06) |
| Net Asset Value, End of Period | $11.02 | $10.60 | $10.56 | $10.78 | $10.70 |
| |
| Total Return(3) | 8.32% | 4.32% | 1.99% | 4.84% | 0.42% |
| | | | | | |
| Ratios/Supplemental Data | | | | | |
| Ratio of Operating Expenses | | | | | |
| to Average Net Assets | 0.48% | 0.49% | 0.49% | 0.49% | 0.49%(4) |
| Ratio of Net Investment Income (Loss) | | | | | |
| to Average Net Assets | 4.04% | 3.84% | 4.02% | 4.00% | 3.85%(4) |
| Portfolio Turnover Rate | 50% | 40% | 257% | 101% | 62% |
| Net Assets, End of Period (in thousands) | $9,824 | 3,622 | $1,071 | $222 | $25 |
| (1) | April 3, 2006 (commencement of sale) through May 31, 2006. | | | | |
| (2) | Computed using average shares outstanding throughout the period. | | | | |
| (3) | Total return assumes reinvestment of net investment income and capital gains distributions, if any. Total returns for periods less than one year |
| | are not annualized. Total returns are calculated based on the net asset value of the last business day. The total return of the classes may not |
| | precisely reflect the class expense differences because of the impact of calculating the net asset values to two decimal places. If net asset |
| | values were calculated to three decimal places, the total return differences would more closely reflect the class expense differences. The |
| | calculation of net asset values to two decimal places is made in accordance with SEC guidelines and does not result in any gain or loss of value |
| | between one class and another. | | | | | |
| (4) | Annualized. | | | | | |
See Notes to Financial Statements.
26
| | | | | | |
| Long-Term Tax-Free | | | | | |
| |
| Institutional Class | | | | | |
| For a Share Outstanding Throughout the Years Ended May 31 (except as noted) | | |
| | | 2010 | 2009 | 2008 | 2007 | 2006(1) |
| Per-Share Data | | | | | |
| Net Asset Value, Beginning of Period | $10.60 | $10.56 | $10.78 | $10.70 | $10.72 |
| Income From Investment Operations | | | | | |
| Net Investment Income (Loss) | 0.45(2) | 0.42 | 0.45 | 0.45 | 0.07 |
| Net Realized and Unrealized Gain (Loss) | 0.44 | 0.04 | (0.22) | 0.08 | (0.02) |
| Total From Investment Operations | 0.89 | 0.46 | 0.23 | 0.53 | 0.05 |
| Distributions | | | | | |
| From Net Investment Income | (0.47) | (0.42) | (0.45) | (0.45) | (0.07) |
| Net Asset Value, End of Period | $11.02 | $10.60 | $10.56 | $10.78 | $10.70 |
| |
| Total Return(3) | 8.53% | 4.53% | 2.19% | 5.05% | 0.45% |
| | | | | | |
| Ratios/Supplemental Data | | | | | |
| Ratio of Operating Expenses | | | | | |
| to Average Net Assets | 0.28% | 0.29% | 0.29% | 0.29% | 0.29%(4) |
| Ratio of Net Investment Income (Loss) | | | | | |
| to Average Net Assets | 4.24% | 4.04% | 4.22% | 4.20% | 4.05%(4) |
| Portfolio Turnover Rate | 50% | 40% | 257% | 101% | 62% |
| Net Assets, End of Period (in thousands) | $118 | $18,460 | $17,661 | $17,285 | $16,456 |
| (1) | April 3, 2006 (commencement of sale) through May 31, 2006. | | | | |
| (2) | Computed using average shares outstanding throughout the period. | | | | |
| (3) | Total return assumes reinvestment of net investment income and capital gains distributions, if any. Total returns for periods less than one year |
| | are not annualized. Total returns are calculated based on the net asset value of the last business day. The total return of the classes may not |
| | precisely reflect the class expense differences because of the impact of calculating the net asset values to two decimal places. If net asset |
| | values were calculated to three decimal places, the total return differences would more closely reflect the class expense differences. The |
| | calculation of net asset values to two decimal places is made in accordance with SEC guidelines and does not result in any gain or loss of value |
| | between one class and another. | | | | | |
| (4) | Annualized. | | | | | |
See Notes to Financial Statements.
27
| | | | | | | |
| Long-Term Tax-Free | | | | | |
| |
| A Class | | | | | | |
| For a Share Outstanding Throughout the Years Ended May 31 (except as noted) | | |
| | | 2010 | 2009 | 2008 | 2007 | 2006(1) | 2006 |
| Per-Share Data | | | | | | |
| Net Asset Value, | | | | | | |
| Beginning of Period | $10.60 | $10.56 | $10.78 | $10.70 | $10.72 | $10.74 |
| Income From | | | | | | |
| Investment Operations | | | | | | |
| Net Investment | | | | | | |
| Income (Loss) | 0.41(2) | 0.37 | 0.40 | 0.41 | 0.06 | 0.35(2) |
| Net Realized and | | | | | | |
| Unrealized Gain (Loss) | 0.43 | 0.04 | (0.22) | 0.08 | (0.02) | (0.03) |
| Total From | | | | | | |
| Investment Operations | 0.84 | 0.41 | 0.18 | 0.49 | 0.04 | 0.32 |
| Distributions | | | | | | |
| From Net | | | | | | |
| Investment Income | (0.42) | (0.37) | (0.40) | (0.41) | (0.06) | (0.34) |
| Net Asset Value, | | | | | | |
| End of Period | $11.02 | $10.60 | $10.56 | $10.78 | $10.70 | $10.72 |
| |
| Total Return(3) | 8.05% | 4.06% | 1.73% | 4.58% | 0.40% | 3.01% |
| | | | | | | |
| Ratios/Supplemental Data | | | | | | |
| Ratio of Operating | | | | | | |
| Expenses to Average | | | | | | |
| Net Assets | 0.73% | 0.74% | 0.74% | 0.74% | 0.74%(4) | 0.82% |
| Ratio of Net Investment | | | | | | |
| Income (Loss) to | | | | | | |
| Average Net Assets | 3.79% | 3.59% | 3.77% | 3.75% | 3.60%(4) | 3.21% |
| Portfolio Turnover Rate | 50% | 40% | 257% | 101% | 62% | 27% |
| Net Assets, End of Period | | | | | | |
| (in thousands) | $23,618 | $20,619 | $9,320 | $12,233 | $19,288 | $36,834 |
| (1) | April 1, 2006 through May 31, 2006. Long-Term Tax-Free’s fiscal year end was changed from March 31 to May 31, resulting in a two-month |
| | annual reporting period. For the years before May 31, 2006, Long-Term Tax-Free’s fiscal year end was March 31. | |
| (2) | Computed using average shares outstanding throughout the period. | | | | |
| (3) | Total return assumes reinvestment of net investment income and capital gains distributions, if any, and does not reflect applicable sales charges |
| | Total returns for periods less than one year are not annualized. Total returns are calculated based on the net asset value of the last business day |
| | The total return of the classes may not precisely reflect the class expense differences because of the impact of calculating the net asset values |
| | to two decimal places. If net asset values were calculated to three decimal places, the total return differences would more closely reflect the |
| | class expense differences. The calculation of net asset values to two decimal places is made in accordance with SEC guidelines and does not |
| | result in any gain or loss of value between one class and another. | | | | |
| (4) | Annualized. | | | | | | |
See Notes to Financial Statements.
28
| | | | | | | |
| Long-Term Tax-Free | | | | | |
| |
| B Class | | | | | | |
| For a Share Outstanding Throughout the Years Ended May 31 (except as noted) | | |
| | | 2010 | 2009 | 2008 | 2007 | 2006(1) | 2006 |
| Per-Share Data | | | | | | |
| Net Asset Value, | | | | | | |
| Beginning of Period | $10.60 | $10.56 | $10.78 | $10.70 | $10.72 | $10.73 |
| Income From | | | | | | |
| Investment Operations | | | | | | |
| Net Investment | | | | | | |
| Income (Loss) | 0.33(2) | 0.29 | 0.32 | 0.32 | 0.05 | 0.27(2) |
| Net Realized and | | | | | | |
| Unrealized Gain (Loss) | 0.43 | 0.04 | (0.22) | 0.08 | (0.02) | (0.01) |
| Total From | | | | | | |
| Investment Operations | 0.76 | 0.33 | 0.10 | 0.40 | 0.03 | 0.26 |
| Distributions | | | | | | |
| From Net | | | | | | |
| Investment Income | (0.34) | (0.29) | (0.32) | (0.32) | (0.05) | (0.27) |
| Net Asset Value, | | | | | | |
| End of Period | $11.02 | $10.60 | $10.56 | $10.78 | $10.70 | $10.72 |
| |
| Total Return(3) | 7.24% | 3.38% | 0.87% | 3.80% | 0.28% | 2.42% |
| | | | | | | |
| Ratios/Supplemental Data | | | | | | |
| Ratio of Operating | | | | | | |
| Expenses to Average | | | | | | |
| Net Assets | 1.48% | 1.49% | 1.49% | 1.49% | 1.49%(4) | 1.50% |
| Ratio of Operating | | | | | | |
| Expenses to Average | | | | | | |
| Net Assets (Before | | | | | | |
| Expense Waiver) | 1.48% | 1.49% | 1.49% | 1.49% | 1.49%(4) | 1.54% |
| Ratio of Net Investment | | | | | | |
| Income (Loss) to | | | | | | |
| Average Net Assets | 3.04% | 2.84% | 3.02% | 3.00% | 2.85%(4) | 2.49% |
| Ratio of Net Investment | | | | | | |
| Income (Loss) to | | | | | | |
| Average Net Assets | | | | | | |
| (Before Expense Waiver) | 3.04% | 2.84% | 3.02% | 3.00% | 2.85%(4) | 2.45% |
| Portfolio Turnover Rate | 50% | 40% | 257% | 101% | 62% | 27% |
| Net Assets, End of Period | | | | | | |
| (in thousands) | $592 | $869 | $1,158 | $1,416 | $2,046 | $2,081 |
| (1) | April 1, 2006 through May 31, 2006. Long-Term Tax-Free’s fiscal year end was changed from March 31 to May 31, resulting in a two-month |
| | annual reporting period. For the years before May 31, 2006, Long-Term Tax-Free’s fiscal year end was March 31. | |
| (2) | Computed using average shares outstanding throughout the period. | | | | |
| (3) | Total return assumes reinvestment of net investment income and capital gains distributions, if any, and does not reflect applicable sales charges. |
| | Total returns for periods less than one year are not annualized. Total returns are calculated based on the net asset value of the last business day. |
| | The total return of the classes may not precisely reflect the class expense differences because of the impact of calculating the net asset values |
| | to two decimal places. If net asset values were calculated to three decimal places, the total return differences would more closely reflect the |
| | class expense differences. The calculation of net asset values to two decimal places is made in accordance with SEC guidelines and does not |
| | result in any gain or loss of value between one class and another. | | | | |
| (4) | Annualized. | | | | | | |
See Notes to Financial Statements.
29
| | | | | | |
| Long-Term Tax-Free | | | | | |
| |
| C Class | | | | | |
| For a Share Outstanding Throughout the Years Ended May 31 (except as noted) | | |
| | | 2010 | 2009 | 2008 | 2007 | 2006(1) |
| Per-Share Data | | | | | |
| Net Asset Value, Beginning of Period | $10.60 | $10.56 | $10.78 | $10.70 | $10.72 |
| Income From Investment Operations | | | | | |
| Net Investment Income (Loss) | 0.33(2) | 0.29 | 0.32 | 0.32 | 0.05 |
| Net Realized and Unrealized Gain (Loss) | 0.43 | 0.04 | (0.22) | 0.08 | (0.02) |
| Total From Investment Operations | 0.76 | 0.33 | 0.10 | 0.40 | 0.03 |
| Distributions | | | | | |
| From Net Investment Income | (0.34) | (0.29) | (0.32) | (0.32) | (0.05) |
| Net Asset Value, End of Period | $11.02 | $10.60 | $10.56 | $10.78 | $10.70 |
| |
| Total Return(3) | 7.25% | 3.28% | 0.98% | 3.80% | 0.26% |
| | | | | | |
| Ratios/Supplemental Data | | | | | |
| Ratio of Operating Expenses | | | | | |
| to Average Net Assets | 1.48% | 1.49% | 1.49% | 1.49% | 1.49%(4) |
| Ratio of Net Investment Income (Loss) | | | | | |
| to Average Net Assets | 3.04% | 2.84% | 3.02% | 3.00% | 2.85%(4) |
| Portfolio Turnover Rate | 50% | 40% | 257% | 101% | 62% |
| Net Assets, End of Period (in thousands) | $4,325 | $3,749 | $1,152 | $41 | $25 |
| (1) | April 3, 2006 (commencement of sale) through May 31, 2006. | | | | |
| (2) | Computed using average shares outstanding throughout the period. | | | | |
| (3) | Total return assumes reinvestment of net investment income and capital gains distributions, if any, and does not reflect applicable sales charges |
| | Total returns for periods less than one year are not annualized. Total returns are calculated based on the net asset value of the last business day. |
| | The total return of the classes may not precisely reflect the class expense differences because of the impact of calculating the net asset values |
| | to two decimal places. If net asset values were calculated to three decimal places, the total return differences would more closely reflect the |
| | class expense differences. The calculation of net asset values to two decimal places is made in accordance with SEC guidelines and does not |
| | result in any gain or loss of value between one class and another. | | | | |
| (4) | Annualized. | | | | | |
See Notes to Financial Statements.
30
|
| Report of Independent Registered Public Accounting Firm |
To the Trustees of the American Century Municipal Trust
and Shareholders of the Long-Term Tax-Free Fund:
In our opinion, the accompanying statement of assets and liabilities, including the schedule of investments, and the related statements of operations and of changes in net assets and the financial highlights present fairly, in all material respects, the financial position of the Long-Term Tax-Free Fund (one of the five funds comprising the American Century Municipal Trust, hereafter referred to as the “Fund”) at May 31, 2010, the results of its operations for the year then ended, the changes in its net assets for each of the two years in the period then ended and the financial highlights for each of the periods presented, in conformity with accounting principles generally accepted in the United States of America. These financial statements and financial highlights (hereafter referred to as “financial statements”) are the responsibility of the Fund’s management; our responsibility is to exp ress an opinion on these financial statements based on our audits. We conducted our audits of these financial statements in accordance with the standards of the Public Company Accounting Oversight Board (United States). Those standards require that we plan and perform the audit to obtain reasonable assurance about whether the financial statements are free of material misstatement. An audit includes examining, on a test basis, evidence supporting the amounts and disclosures in the financial statements, assessing the accounting principles used and significant estimates made by management, and evaluating the overall financial statement presentation. We believe that our audits, which included confirmation of securities at May 31, 2010 by correspondence with the custodian and brokers, provide a reasonable basis for our opinion.
PricewaterhouseCoopers LLP
Kansas City, Missouri
July 22, 2010
31
The Board of Trustees
The individuals listed below serve as trustees of the fund. Each trustee will continue to serve in this capacity until death, retirement, resignation or removal from office. The mandatory retirement age for trustees who are not “interested persons,” as that term is defined in the Investment Company Act (independent trustees), is 73. However, the mandatory retirement age may be extended for a period not to exceed two years with the approval of the remaining independent trustees.
Mr. Thomas is the only trustee who is an “interested person” because he currently serves as President and Chief Executive Officer of American Century Companies, Inc. (ACC), the parent company of American Century Investment Management, Inc. (ACIM or the advisor).
The other trustees (more than three-fourths of the total number) are independent; that is, they have never been employees, directors or officers of, and have no financial interest in, ACC or any of its wholly owned, direct or indirect, subsidiaries, including ACIM, American Century Investment Services, Inc. (ACIS) and American Century Services, LLC (ACS). The trustees serve in this capacity for eight (in the case of Mr. Thomas, 15) registered investment companies in the American Century Investments family of funds.
The following presents additional information about the trustees. The mailing address for each trustee other than Mr. Thomas is 1665 Charleston Road, Mountain View, California 94043. The mailing address for Mr. Thomas is 4500 Main Street, Kansas City, Missouri 64111.
Independent Trustees
John Freidenrich
Year of Birth: 1937
Position(s) with the Fund: Trustee
Length of Time Served: Since 2005
Principal Occupation(s) During the Past Five Years: Founder, Member and Manager, Regis
Management Company, LLC (investment management firm) (April 2004 to present)
Number of Funds in Fund Complex Overseen by Trustee: 41
Other Directorships Held by Trustee: None
Education/Other Professional Experience: AB in Economics, Stanford University; LLB,
Stanford Law School; formerly, partner and founder, Ware and Freidenrich Law
Firm and Bay Partners; formerly, President, Board of Trustees, Stanford University
Ronald J. Gilson
Year of Birth: 1946
Position(s) with the Fund: Trustee and Chairman of the Board
Length of Time Served: Since 1995
Principal Occupation(s) During the Past Five Years: Charles J. Meyers Professor of Law and
Business, Stanford Law School (1979 to present); Marc and Eva Stern Professor of
Law and Business, Columbia University School of Law (1992 to present)
Number of Funds in Fund Complex Overseen by Trustee: 41
Other Directorships Held by Trustee: None
Education/Other Professional Experience: BA, Washington University; JD, Yale Law School;
formerly, attorney, Steinhart, Goldberg, Feigenbaum & Ladar
32
Frederick L. A. Grauer
Year of Birth: 1946
Position(s) with the Fund: Trustee
Length of Time Served: Since 2008
Principal Occupation(s) During the Past Five Years: Senior Advisor, BlackRock, Inc. (investment
management firm) (2010 to present); Senior Advisor, Barclays Global Investors
(investment management firm) (2003 to 2009)
Number of Funds in Fund Complex Overseen by Trustee: 41
Other Directorships Held by Trustee: None
Education/Other Professional Experience: BA in Economics, University of British Columbia;
MA in Economics, University of Chicago; PhD in Business, Stanford University;
formerly, Executive Chairman, Barclays Global Investors; Chairman and Chief
Executive Officer, Wells Fargo Nikko Investment Advisors; and Vice President,
Merrill Lynch Capital Markets Group; formerly, Director, New York Stock Exchange,
Chicago Mercantile Exchange and Columbia University; formerly, faculty member,
Graduate School of Business, Columbia University and Alfred P. Sloan School of
Management, Massachusetts Institute of Technology
Peter F. Pervere
Year of Birth: 1947
Position(s) with the Fund: Trustee
Length of Time Served: Since 2007
Principal Occupation(s) During the Past Five Years: Retired
Number of Funds in Fund Complex Overseen by Trustee: 41
Other Directorships Held by Trustee: Intraware, Inc. (2003 to 2009); Digital Impact, Inc.
(2003 to 2005)
Education/Other Professional Experience: BA in History, Stanford University; CPA; formerly,
Vice President and Chief Financial Officer, Commerce One, Inc. (software and
services provider); formerly, Vice President and Corporate Controller, Sybase, Inc.;
formerly with accounting firm of Arthur Young & Co.
Myron S. Scholes
Year of Birth: 1941
Position(s) with the Fund: Trustee
Length of Time Served: Since 1980
Principal Occupation(s) During the Past Five Years: Chairman, Platinum Grove Asset
Management, L.P. (asset manager) (1999 to 2009); Frank E. Buck Professor of
Finance-Emeritus, Stanford Graduate School of Business (1996 to present)
Number of Funds in Fund Complex Overseen by Trustee: 41
Other Directorships Held by Trustee: Dimensional Fund Advisors (investment advisor); CME
Group, Inc. (futures and options exchange)
Education/Other Professional Experience: BA in Economics, McMaster University (Ontario);
MBA and PhD, University of Chicago; formerly, Senior Research Fellow at the
Hoover Institute; formerly, Edward Eagle Brown Professor of Finance, University of
Chicago; recipient of the Alfred Nobel Memorial Prize in Economic Sciences
33
John B. Shoven
Year of Birth: 1947
Position(s) with the Fund: Trustee
Length of Time Served: Since 2002
Principal Occupation(s) During the Past Five Years: Professor of Economics, Stanford University
(1973 to present)
Number of Funds in Fund Complex Overseen by Trustee: 41
Other Directorships Held by Trustee: Cadence Design Systems; Exponent; Financial Engines;
PalmSource, Inc. (2002 to 2005); Watson Wyatt Worldwide (2002 to 2006)
Education/Other Professional Experience: BA in Physics, University of California; PhD in
Economics, Yale University; Director of the Stanford Institute for Economic Policy
Research (1999 to present); formerly, Chair of Economics and Dean of Humanities
and Sciences, Stanford University
Interested Trustee
Jonathan S. Thomas
Year of Birth: 1963
Position(s) with the Fund: Trustee and President
Length of Time Served: Since 2007
Principal Occupation(s) During the Past Five Years: President and Chief Executive Officer,
ACC (March 2007 to present); Chief Administrative Officer, ACC (February 2006 to
February 2007); Executive Vice President, ACC (November 2005 to February 2007).
Also serves as: Chief Executive Officer and Manager, ACS; Executive Vice President,
ACIM; Director, ACC, ACIM and other ACC subsidiaries. Global Chief Operating
Officer and Managing Director, Morgan Stanley (investment management) (March
2000 to November 2005)
Number of Funds in Fund Complex Overseen by Trustee: 104
Other Directorships Held by Trustee: None
Education/Other Professional Experience: BA in Economics, University of Massachusetts;
MBA, Boston College; formerly held senior leadership roles with Fidelity
Investments, Boston Financial Services and Bank of America; serves on the Board of
Governors of the Investment Company Institute
34
Officers
The following table presents certain information about the executive officers of the fund. Each officer serves as an officer for each of the 15 investment companies in the American Century family of funds, unless otherwise noted. No officer is compensated for his or her service as an officer of the fund. The listed officers are interested persons of the fund and are appointed or re-appointed on an annual basis. The mailing address for each of the officers listed below is 4500 Main Street, Kansas City, Missouri 64111.
| | |
| Name | Offices with | |
| (Year of Birth) | the Fund | Principal Occupation(s) During the Past Five Years |
| Jonathan S. | Trustee and | President and Chief Executive Officer, ACC (March 2007 to present); Chief |
| Thomas | President | Administrative Officer, ACC (February 2006 to March 2007); Executive |
| (1963) | since 2007 | Vice President, ACC (November 2005 to February 2007). Also serves as: |
| | | Chief Executive Officer and Manager, ACS; Executive Vice President, |
| | | ACIM; Director, ACC, ACIM and other ACC subsidiaries. Global Chief |
| | | Operating Officer and Managing Director, Morgan Stanley (March 2000 |
| | | to November 2005) |
| Barry Fink | Executive | Chief Operating Officer and Executive Vice President, ACC (September 2007 |
| (1955) | Vice President | to present); President, ACS (October 2007 to present); Managing Director, |
| | since 2007 | Morgan Stanley (2000 to 2007); Global General Counsel, Morgan Stanley |
| | | (2000 to 2006). Also serves as: Manager, ACS, and Director, ACC and |
| | | certain ACC subsidiaries |
| Maryanne L. | Chief Compliance | Chief Compliance Officer, American Century funds, ACIM and ACS (August |
| Roepke | Officer since 2006 | 2006 to present); Assistant Treasurer, ACC (January 1995 to August 2006); |
| (1956) | and Senior Vice | and Treasurer and Chief Financial Officer, various American Century funds |
| | President | (July 2000 to August 2006). Also serves as: Senior Vice President, ACS |
| | since 2000 | |
| Charles A. | General Counsel | Attorney, ACC (February 1994 to present); Vice President, ACC (November |
| Etherington | since 2007 and | 2005 to present); General Counsel, ACC (March 2007 to present); Also |
| (1957) | Senior Vice | serves as General Counsel, ACIM, ACS, ACIS and other ACC subsidiaries; |
| | President | and Senior Vice President, ACIM and ACS |
| | since 2006 | |
| Robert J. Leach | Vice President, | Vice President, ACS (February 2000 to present); and Controller, various |
| (1966) | Treasurer and | American Century funds (1997 to September 2006) |
| | Chief Financial | |
| | Officer since 2006 | |
| David H. Reinmiller | Vice President | Attorney, ACC (January 1994 to present); Associate General Counsel, ACC |
| (1963) | since 2001 | (January 2001 to present); Chief Compliance Officer, American Century |
| | | funds and ACIM (January 2001 to February 2005). Also serves as: Vice |
| | | President, ACIM and ACS |
| Ward D. Stauffer | Secretary | Attorney, ACC (June 2003 to Present) |
| (1960) | since 2005 | |
The SAI has additional information about the fund’s trustees and is available without charge, upon request, by calling 1-800-345-2021.
35
|
| Board Approval of Management Agreements |
American Century Investment Management, Inc. (“ACIM” or the “Advisor”) currently serves as investment advisor to the Fund under an interim management agreement (the “Interim Management Agreement”) between the Advisor and the Fund approved by the Fund’s Board of Trustees (the “Board”). The Advisor previously served as investment advisor to the Fund pursuant to a management agreement (the “Prior Management Agreement”) that terminated in accordance with its terms on February 16, 2010, as a result of a change of control of the Advisor’s parent company, American Century Companies, Inc. (“ACC”). The change in control occurred as the result of a change in the trustee of a trust created by James E. Stowers, Jr., the founder of American Century Investments that holds shares representing a significant interest in ACC stock. Mr. Stowers previously served a s the trustee of the trust. On February 16, 2010, Richard W. Brown, Co-Chairman of ACC with Mr. Stowers, became the trustee in accordance with the terms of the trust and Mr. Stowers’ long-standing estate and succession plan.
On February 18, 2010, the Board approved the Interim Management Agreement in accordance with Rule 15a-4 under the Investment Company Act to ensure continued management of the Fund by the Advisor after the termination of the Prior Management Agreement and until shareholder approval of a new management agreement (the “Proposed Management Agreement”) as required under the Act. The Board approved the Proposed Management Agreement and recommended its approval to shareholders. Fund shareholders approved the Proposed Management Agreement at a meeting on June 16, 2010.
The Interim Management Agreement and the Proposed Management Agreement are substantially identical to the Prior Management Agreement except for their effective dates and the termination provisions of the Interim Management Agreement. Under the Interim and Proposed Management Agreements, the Advisor will provide the same services to the Fund and receive the same compensation rate as under the Prior Management Agreement.
Basis for Board Approval of Interim Management Agreement
In considering the approval of the Interim Management Agreement, Rule 15a-4 requires the Board to approve the contract within ten business days of the termination of the prior agreement and to determine that the compensation to be received under the interim agreement is no greater than would have been received under the prior agreement. In connection with the approval, the Board noted that it oversees on a continuous basis and evaluates at its quarterly meetings, directly and through the committees of the Board, the nature and quality of significant services provided by the Advisor, the investment performance of the Fund, shareholder services, audit and compliance functions and a variety of other matters relating to the Fund’s operations.
In evaluating the Interim Management Agreement, the Board, assisted by the advice of its independent legal counsel, considered a number of factors in addition to those required by the rule with no one factor being determinative to its analysis. Among the factors considered by the Board were the circumstances and effect of the change of control, the fact that the Advisor will provide the same services and receive the same compensation rate as
36
under the Prior Management Agreements, and that the change of control did not result in a change of the personnel managing the Fund. Upon completion of its analysis, the Board approved the Interim Management Agreement, determining that the continued management of the Fund by the Advisor was in the best interests of the Fund and Fund shareholders.
Basis for Board Approval of Proposed Management Agreement
At a meeting held on April 1, 2010, after considering all information presented, the Board approved, and determined to recommend that shareholders approve, the Proposed Management Agreement. In connection with that approval, the Board requested and reviewed extensive data and information compiled by the Advisor and certain independent providers of evaluation data concerning the Fund and services provided to the Fund by the Advisor. The Board oversees on a continuous basis and evaluates at its quarterly meetings, directly and through the committees of the Board, the nature and quality of significant services provided by the Advisor, the investment performance of the Fund, shareholder services, audit and compliance functions and a variety of other matters relating to the Fund’s operations. The information considered and the discussions held at the meetings included, but were not limited to:
• the nature, extent and quality of investment management, shareholder services and other services provided to the Fund;
• the wide range of programs and services the Advisor provides to the Fund and its shareholders on a routine and non-routine basis;
• the compliance policies, procedures, and regulatory experience of the Advisor;
• data comparing the cost of owning the Fund to the cost of owning similar funds;
• the fact that there will be no changes to the fees, services, or personnel who provide such services as compared to the Prior Management Agreement;
• data comparing the Fund’s performance to appropriate benchmarks and/or a peer group of other mutual funds with similar investment objectives and strategies;
• financial data showing the profitability of the Fund to the Advisor and the overall profitability of the Advisor;
• data comparing services provided and charges to the Fund with those for other non-fund investment management clients of the Advisor; and
• consideration of collateral or “fall-out” benefits derived by the Advisor from the management of the Fund and potential sharing of economies of scale in connection with the management of the Fund.
37
The Board also considered whether there was any reason for not continuing the existing arrangement with the Advisor. In particular, the Board recognized that shareholders may have invested in the Fund on the strength of the Advisor’s industry standing and reputation and in the expectation that the Advisor will have a continuing role in providing advisory services to the Fund.
The Board considered all of the information provided by the Advisor, the independent data providers, and the Board’s independent legal counsel, and evaluated such information for the Fund. The Board did not identify any single factor as being all-important or controlling, and each Board member may have attributed different levels of importance to different factors. In deciding to approve the Proposed Management Agreement under the terms ultimately determined by the Board to be appropriate, the Board based its decision on a number of factors, including the following:
Nature, Extent and Quality of Services — Generally. Under the Proposed Management Agreement, the Advisor is responsible for providing or arranging for all services necessary for the operation of the Fund. The Board noted that under the Proposed Management Agreement, the Advisor provides or arranges at its own expense a wide variety of services including:
• constructing and designing the Fund
• portfolio research and security selection
• initial capitalization/funding
• securities trading
• Fund administration
• custody of Fund assets
• daily valuation of the Fund’s portfolio
• shareholder servicing and transfer agency, including shareholder
confirmations, recordkeeping and communications
• legal services
• regulatory and portfolio compliance
• financial reporting
• marketing and distribution
The Board noted that many of these services have expanded over time both in terms of quantity and complexity in response to shareholder demands, competition in the industry, changing distribution channels and the changing regulatory environment.
38
Investment Management Services. The investment management services provided to the Fund are complex and provide Fund shareholders access to professional money management, instant diversification of their investments within an asset class, the opportunity to easily diversify among asset classes, and liquidity. As a part of its general oversight and in evaluating investment performance, the Board expects the Advisor to manage the Fund in accordance with its investment objectives and approved strategies. In providing these services, the Advisor utilizes teams of investment professionals who require extensive information technology, research, training, compliance and other systems to conduct their business. The Board, directly and through its Portfolio Committee, regularly reviews investment performance information for the Fund, t ogether with comparative information for appropriate benchmarks and/or peer groups of similarly-managed funds, over different time horizons. If performance concerns are identified, the underperforming Fund receives special reviews until performance improves, during which time the Board discusses with the Advisor the reasons for such underperformance and any efforts being undertaken to improve performance.
Shareholder and Other Services. Under the Proposed Management Agreement, the Advisor will also provide the Fund with a comprehensive package of transfer agency, shareholder, and other services. The Board, directly and through the various committees of the Board, regularly reviews reports and evaluations of such services. These reports include, but are not limited to, information regarding the operational efficiency and accuracy of the shareholder and transfer agency services provided, staffing levels, shareholder satisfaction (as measured by external as well as internal sources), technology support, new products and services offered to Fund shareholders, securities trading activities, portfolio valuation services, auditing services, and legal and operational compliance activities. Certain aspects of shareholder and transfer ag ency service level efficiency and the quality of securities trading activities are measured by independent third party providers and are presented in comparison to other fund groups not managed by the Advisor.
Costs of Services Provided and Profitability. The Advisor provided detailed information concerning its cost of providing various services to the Fund, its profitability in managing the Fund, its overall profitability, and its financial condition. The Board reviewed with the Advisor the methodology used to prepare this financial information. The Board has also reviewed with the Advisor its methodology for compensating the investment professionals that provide services to the Fund as well as compensation to the five highest paid personnel of the Advisor. This financial information regarding the Advisor is considered in order to evaluate the Advisor’s financial condition, its ability to continue to provide services under the Proposed Management Agreement, and the reasonableness of the proposed management fees.
Ethics. The Board generally considers the Advisor’s commitment to providing quality services to shareholders and to conducting its business ethically. It noted that the Advisor’s practices generally meet or exceed industry best practices.
39
Economies of Scale. The Board also reviewed information provided by the Advisor regarding the possible existence of economies of scale in connection with the management of the Fund. The Board concluded that economies of scale are difficult to measure and predict with precision, especially on a fund-by-fund basis. The analysis of economies of scale is further complicated by the additional services and content provided by the Advisor and its reinvestment in its ability to provide and expand those services. Accordingly, the Board seeks to evaluate economies of scale by reviewing information, such as year-over-year profitability of the Advisor generally, the profitability of its management of the Fund specifically, and the expenses incurred by the Advisor in providing various functions to the Fund. The Board believes the Advisor i s appropriately sharing economies of scale through its competitive fee structure, offering competitive fees from fund inception, fee breakpoints as the fund complex and the Fund increases in size, and through reinvestment in its business to provide shareholders additional services and enhancements to existing services. In particular, separate breakpoint schedules based on the size of the entire fund complex and on the size of the Fund reflect the complexity of assessing economies of scale.
Comparison to Fees of Funds not Managed by the Advisor. Both the Prior and Proposed Management Agreements provide that the Fund pays the Advisor a single, all-inclusive (or unified) management fee for providing all services necessary for the management and operation of the Fund, other than brokerage expenses, taxes, interest, extraordinary expenses, and the fees and expenses of the Fund’s Independent Trustees (including their independent legal counsel) and expenses incurred in connection with the provision of shareholder services and distribution services under a plan adopted pursuant to Rule 12b-1 under the 1940 Act. Under the unified fee structure, the Advisor is responsible for providing all investment advisory, custody, audit, administrative, compliance, recordkeeping, marketing and shareholder services, or arranging and supervising third parties that provide such services. By contrast, most other funds are charged a variety of fees, including an investment advisory fee, a transfer agency fee, an administrative fee, distribution charges and other expenses. Other than their investment advisory fees and any applicable Rule 12b-1 distribution fees, the components of the total fees charged by these other funds may be increased without shareholder approval. The Board believes the unified fee structure is a benefit to Fund shareholders because it clearly discloses to shareholders the cost of owning Fund shares, and, since the unified fee cannot be increased without a vote of Fund shareholders, it shifts to the Advisor the risk of increased costs of operating the Fund and provides a direct incentive to minimize administrative inefficiencies. Part of the Board’s analysis of fee levels involves reviewing certain evaluative data compiled by an independent provider comparing the Fund’s unified fee to the total expense rat ios of similar funds not managed by the Advisor. The Board concluded that the management fee to be paid by the Fund to the Advisor under the Proposed Management Agreement is reasonable in light of the services to be provided to the Fund.
40
Comparison to Fees and Services Provided to Other Clients of the Advisor. The Board also requested and received information from the Advisor concerning the nature and extent of the services, fees, and profitability of its advisory services to advisory clients other than the Fund. They observed that these varying types of client accounts require different services and involve different regulatory and entrepreneurial risks than the management of the Fund. The Board analyzed this information and concluded that the fees charged and services provided to the Fund were reasonable by comparison.
Collateral or “Fall-Out” Benefits Derived by the Advisor. The Board considered the existence of collateral benefits the Advisor may receive as a result of its relationship with the Fund. The Board concluded that the Advisor’s primary business is managing mutual funds and it generally does not use Fund or shareholder information to generate profits in other lines of business, and therefore does not derive any significant collateral benefits from them. The Board noted that the Advisor receives proprietary research from broker-dealers that execute Fund portfolio transactions and concluded that this research is likely to benefit Fund shareholders. The Board also determined that the Advisor is able to provide investment management services to certain clients other than the Fund, at least in part, due to its existing infrastructure built to serve the fund complex. The Board concluded, however, that the assets of those other clients are not material to the analysis and, in any event, are included with the assets of the Fund to determine breakpoints in the Fund’s fee schedule, provided they are managed using the same investment team and strategy.
Conclusion of the Board. As a result of this process, the Board, in the absence of particular circumstances and assisted by the advice of its independent legal counsel, taking into account all of the factors discussed above and the information provided by the Advisor and others, concluded that the Proposed Management Agreement be approved and recommended its approval to Fund shareholders.
41
Proxy Voting Guidelines
American Century Investment Management, Inc., the fund’s investment advisor, is responsible for exercising the voting rights associated with the securities purchased and/or held by the fund. A description of the policies and procedures the advisor uses in fulfilling this responsibility is available without charge, upon request, by calling 1-800-345-2021. It is also available on American Century Investments’ website at americancentury.com and on the Securities and Exchange Commission’s website at sec.gov. Information regarding how the investment advisor voted proxies relating to portfolio securities during the most recent 12-month period ended June 30 is available on the “About Us” page at americancentury.com. It is also available at sec.gov.
Quarterly Portfolio Disclosure
The fund files its complete schedule of portfolio holdings with the Securities and Exchange Commission (SEC) for the first and third quarters of each fiscal year on Form N-Q. The fund’s Forms N-Q are available on the SEC’s website at sec.gov, and may be reviewed and copied at the SEC’s Public Reference Room in Washington, DC. Information on the operation of the Public Reference Room may be obtained by calling 1-800-SEC-0330. The fund also makes its complete schedule of portfolio holdings for the most recent quarter of its fiscal year available on its website at americancentury.com and, upon request, by calling 1-800-345-2021.
42
The following indices are used to illustrate investment market, sector, or style performance or to serve as fund performance comparisons. They are not investment products available for purchase.
The Barclays Capital 5-Year General Obligation (GO) Bond Index is composed of investment-grade U.S. municipal securities, with maturities of four to six years, that are general obligations of a state or local government.
The Barclays Capital Long-Term Municipal Bond Index is composed of those securities included in the Barclays Capital Municipal Bond Index that have maturities greater than 22 years.
The Barclays Capital Municipal Bond Index is a market value-weighted index designed for the long-term tax-exempt bond market.
The Barclays Capital Non-Investment-Grade Municipal Bond Index is composed of non-investment grade U.S. municipal securities with a remaining maturity of one year or more.
The Barclays Capital U.S. Aggregate Index represents securities that are taxable, registered with the Securities and Exchange Commission, and U.S. dollar-denominated. The index covers the U.S. investment-grade fixed-rate bond market, with index components for government and corporate securities, mortgage pass-through securities, and asset-backed securities.
The Barclays Capital U.S. Treasury Index is composed of those securities included in the Barclays Capital U.S. Aggregate Index that are public obligations of the U.S. Treasury with a remaining maturity of one year or more.
43
44

| |
| |
| Contact Us | |
| americancentury.com | |
| Automated Information Line | 1-800-345-8765 |
| Investor Services Representative | 1-800-345-2021 or |
| | 816-531-5575 |
| Investors Using Advisors | 1-800-378-9878 |
| Business, Not-For-Profit, Employer-Sponsored | |
| Retirement Plans | 1-800-345-3533 |
| Banks and Trust Companies, Broker-Dealers, | |
| Financial Professionals, Insurance Companies | 1-800-345-6488 |
| Telecommunications Device for the Deaf | 1-800-634-4113 |
| American Century Municipal Trust | |
| Investment Advisor: | |
| American Century Investment Management, Inc. | |
| Kansas City, Missouri | |
This report and the statements it contains are submitted for the general
information of our shareholders. The report is not authorized for distribution to
prospective investors unless preceded or accompanied by an effective prospectus.
American Century Investment Services, Inc., Distributor
©2010 American Century Proprietary Holdings, Inc. All rights reserved.
1007
CL-ANN-68680
|
| Annual Report |
| May 31, 2010 |

|
| American Century Investments® |
High-Yield Municipal Fund
| |
| President’s Letter | 2 |
| Market Perspective | 3 |
| U.S. Fixed-Income Total Returns | 3 |
| |
| High-Yield Municipal | |
| |
| Performance | 4 |
| Portfolio Commentary | 6 |
| Portfolio at a Glance | 8 |
| Yields | 8 |
| Top Five Sectors | 8 |
| |
| Shareholder Fee Example | 9 |
| |
| Financial Statements | |
| |
| Schedule of Investments | 11 |
| Statement of Assets and Liabilities | 19 |
| Statement of Operations | 20 |
| Statement of Changes in Net Assets | 21 |
| Notes to Financial Statements | 22 |
| Financial Highlights | 28 |
| Report of Independent Registered Public Accounting Firm | 33 |
| |
| Other Information | |
| |
| Management | 34 |
| Board Approval of Management Agreements | 38 |
| Additional Information | 44 |
| Index Definitions | 45 |
Any opinions expressed in this report reflect those of the author as of the date of the report, and do not necessarily represent the opinions of American Century Investments or any other person in the American Century Investments organization. Any such opinions are subject to change at any time based upon market or other conditions and American Century Investments disclaims any responsibility to update such opinions. These opinions may not be relied upon as investment advice and, because investment decisions made by American Century Investments funds are based on numerous factors, may not be relied upon as an indication of trading intent on behalf of any American Century Investments fund. Security examples are used for representational purposes only and are not intended as recommendations to purchase or sell securities. Performance information for comparative indices and securities is provided to American Century Investments by third party vendors. To the best of American Century Investments’ knowledge, such information is accurate at the time of printing.

Dear Investor:
To learn more about the capital markets, your investment, and the portfolio management strategies American Century Investments provides, we encourage you to review this shareholder report for the financial reporting period ended May 31, 2010.
On the following pages, you will find investment performance and portfolio information, presented with the expert perspective and commentary of our portfolio management team. This report remains one of our most important vehicles for conveying the information you need about your investment performance, and about the market factors and strategies that affect fund returns. For additional information on the markets, we encourage you to visit the “Insights & News” tab at our Web site, americancentury.com, for updates and further expert commentary.
The top of our Web site’s home page also provides a link to “Our Story,” which, first and foremost, outlines our commitment—since 1958—to helping clients reach their financial goals. We believe strongly that we will only be successful when our clients are successful. That’s who we are.
Another important, unique facet of our story and who we are is “Profits with a Purpose,” which describes our bond with the Stowers Institute for Medical Research (SIMR). SIMR is a world-class biomedical organization—founded by our company founder James E. Stowers, Jr. and his wife Virginia—that is dedicated to researching the causes, treatment, and prevention of gene-based diseases, including cancer. Through American Century Investments’ private ownership structure, more than 40% of our profits support SIMR.
Mr. Stowers’ example of achieving financial success and using that platform to help humanity motivates our entire American Century Investments team. His story inspires us to help each of our clients achieve success. Thank you for sharing your financial journey with us.
Sincerely,

Jonathan Thomas
President and Chief Executive Officer
American Century Investments
2

By David MacEwen, Chief Investment Officer, Fixed Income
Economic and Market Rebound
The municipal bond market witnessed a wide dispersion of returns in the 12 months ended May 31, 2010 (see the accompanying table), which closely coincided with the rebound of the U.S. economy from the depths of the recession and credit crisis. This dramatic turnaround can be attributed to the government’s extraordinary monetary and fiscal stimulus policies taken in response to the financial crisis in late 2008. However, financial market volatility in May related to the European debt crisis led many to worry about a potential slowdown in U.S. growth. Despite a return to positive economic growth in the second half of 2009 and so far in 2010, the unemployment rate stood at 9.7% in May 2010, while the housing market and consumer debt levels remained concerns.
Municipal Market Review
Better economic and market conditions caused a reversal of the trading that colored the credit crisis, when the lowest-rated bonds performed worst and higher-quality bonds did best. For the 12 months ended in May, this reversal meant that high-yield (below-investment-grade) and long-term municipal bonds did better than high-quality and shorter-term securities. Similarly, credit-sensitive municipal bonds outperformed Treasury securities for the 12 months after lagging during the credit crisis.
In addition to better economic and market conditions, municipal bonds benefited from improving technical factors—the Build America Bonds program limited the supply of tax-exempt bonds. This federal program, designed to help ease municipal borrowing costs, meant many newly minted municipal bonds were instead issued in the taxable bond universe. Demand for municipal bonds was helped by attractive tax-equivalent yields and the outlook for higher marginal tax rates going forward.
And despite the continuing flood of negative press about budget challenges for states and local governments, we continue to believe that municipal defaults will be relatively rare, especially compared with corporate defaults. Indeed, during the reporting period, the major credit rating agencies revamped their ratings systems to better recognize the superior credit quality and vastly lower default risk of municipal securities relative to corporate-backed bonds.
| | | | |
| U.S. Fixed-Income Total Returns | | | | |
| For the 12 months ended May 31, 2010 | | | | |
| Barclays Capital Municipal Market Indices | | Barclays Capital U.S. Taxable Market Indices |
| Municipal Bond | 8.52% | | Aggregate Index | 8.42% |
| 5-Year General Obligation Bond | 6.15% | | Treasury Index | 4.50% |
| Long-Term Municipal Bond | 13.53% | | | |
| Non-Investment-Grade Municipal Bond | 21.01% | | | |
3
| | | | | | | |
| High-Yield Municipal | | | | | |
| |
| Total Returns as of May 31, 2010 | | | | | |
| | | | | Average Annual Returns | |
| | | Ticker | | | | Since | Inception |
| | | Symbol | 1 year | 5 years | 10 years | Inception | Date |
| Investor Class | ABHYX | 17.68% | 1.78% | 4.80% | 4.35%(1) | 3/31/98 |
| Barclays Capital | | | | | | |
| Long-Term Municipal | | | | | | |
| Bond Index | — | 13.53% | 3.86% | 6.51% | 5.41% | — |
| Lipper High-Yield | | | | | | |
| Municipal Debt Funds | | | | | | |
| Average Returns(2) | — | 17.75% | 1.76% | 4.28% | 3.44% | — |
| Investor Class’s | | | | | | |
| Lipper Ranking | | | | | | |
| as of May 31, 2010(2) | — | 55 of 115 | 46 of 78 | 18 of 65 | 5 of 45 | — |
| as of June 30, 2010(2) | — | 52 of 115 | 46 of 78 | 17 of 65 | 5 of 45 | — |
| Institutional Class | AYMIX | — | — | — | 3.13%(3) | 3/1/10 |
| A Class | AYMAX | | | | | 1/31/03 |
| No sales charge* | | 17.39% | 1.53% | — | 3.19% | |
| With sales charge* | | 12.14% | 0.61% | — | 2.55% | |
| B Class | AYMBX | | | | | 1/31/03 |
| No sales charge* | | 16.52% | 0.77% | — | 2.43% | |
| With sales charge* | | 12.52% | 0.58% | — | 2.43% | |
| C Class | AYMCX | 16.39% | 0.75% | — | 2.61% | 7/24/02 |
| |
| *Sales charges include initial sales charges and contingent deferred sales charges (CDSCs), as applicable. A Class shares have a 4.50% |
| maximum initial sales charge for fixed-income funds and may be subject to a maximum CDSC of 1.00%. B Class shares redeemed |
| within six years of purchase are subject to a CDSC that declines from 5.00% during the first year after purchase to 0.00% the sixth year |
| after purchase. C Class shares redeemed within 12 months of purchase are subject to a maximum CDSC of 1.00%. The SEC requires |
| that mutual funds provide performance information net of maximum sales charges in all cases where charges could be applied. |
| (1) | Class returns and rankings would have been lower if fees had not been waived. | | | |
| (2) | Data provided by Lipper Inc. — A Reuters Company. © 2010 Reuters. All rights reserved. Any copying, republication or redistribution of Lipper |
| | content, including by caching, framing or similar means, is expressly prohibited without the prior written consent of Lipper. Lipper shall not be |
| | liable for any errors or delays in the content, or for any actions taken in reliance thereon. | | | |
| | Lipper Fund Performance — Performance data is total return, and is preliminary and subject to revision. | | |
| | Lipper Rankings — Rankings are based only on the universe shown and are based on average annual total returns. This listing might not |
| | represent the complete universe of funds tracked by Lipper. | | | | |
| | The data contained herein has been obtained from company reports, financial reporting services, periodicals and other resources believed to be |
| | reliable. Although carefully verified, data on compilations is not guaranteed by Lipper and may be incomplete. No offer or solicitations to buy or |
| | sell any of the securities herein is being made by Lipper. | | | | |
| (3) | Total returns for periods less than one year are not annualized. | | | | |
Data presented reflect past performance. Past performance is no guarantee of future results. Current performance may be higher or lower than the performance shown. Investment return and principal value will fluctuate, and redemption value may be more or less than original cost. To obtain performance data current to the most recent month end, please call 1-800-345-2021 or visit americancentury.com. As interest rates rise, bond values will decline. In addition, the lower-rated securities in which the fund invests are subject to greater credit risk, default risk and liquidity risk. Investment income may be subject to certain state and local taxes and, depending on your tax status, the federal alternative minimum tax (AMT). Capital gains are not exempt from state and federal income tax.
Unless otherwise indicated, performance reflects Investor Class shares; performance for other share classes will vary due to differences in fee structure. For information about other share classes available, please consult the prospectus. Data assumes reinvestment of dividends and capital gains, and none of the charts reflect the deduction of taxes that a shareholder would pay on fund distributions or the redemption of fund shares. Returns for the index are provided for comparison. The fund’s total returns include operating expenses (such as transaction costs and management fees) that reduce returns, while the total returns of the index do not.
4
High-Yield Municipal

| | | | |
| Total Annual Fund Operating Expenses | | | |
| Investor Class | Institutional Class | A Class | B Class | C Class |
| 0.62% | 0.42% | 0.87% | 1.62% | 1.62% |
The total annual fund operating expenses shown is as stated in the fund’s prospectus current as of the date of this report. The prospectus may vary from the expense ratio shown elsewhere in this report because it is based on a different time period, includes acquired fund fees and expenses, and, if applicable, does not include fee waivers or expense reimbursements.
Data presented reflect past performance. Past performance is no guarantee of future results. Current performance may be higher or lower than the performance shown. Investment return and principal value will fluctuate, and redemption value may be more or less than original cost. To obtain performance data current to the most recent month end, please call 1-800-345-2021 or visit americancentury.com. As interest rates rise, bond values will decline. In addition, the lower-rated securities in which the fund invests are subject to greater credit risk, default risk and liquidity risk. In vestment income may be subject to certain state and local taxes and, depending on your tax status, the federal alternative minimum tax (AMT). Capital gains are not exempt from state and federal income tax.
Unless otherwise indicated, performance reflects Investor Class shares; performance for other share classes will vary due to differences in fee structure. For information about other share classes available, please consult the prospectus. Data assumes reinvestment of dividends and capital gains, and none of the charts reflect the deduction of taxes that a shareholder would pay on fund distributions or the redemption of fund shares. Returns for the index are provided for comparison. The fund’s total returns include operating expenses (such as transaction costs and management fees) that reduce returns, while the total returns of the index do not.
5
High-Yield Municipal
Portfolio Manager: Steven Permut
Performance Summary
High-Yield Municipal returned 17.68%* for the 12 months ended May 31, 2010. By comparison, the Barclays Capital Long-Term Municipal Bond Index—an investment-grade municipal index—and the Barclays Capital Non-Investment-Grade Municipal Bond Index, a municipal high-yield measure, gained 13.53% and 21.01%,** respectively. At the same time, the High-Yield Municipal Debt Funds tracked by Lipper had an average return of 17.75%. See page 4 for additional performance comparisons. The portfolio’s average annual returns continued to exceed those of its Lipper group average for the 10 years ended in May (see page 4).
High Yield Outperforms
The key driver of the portfolio’s performance relative to the Barclays indices was its credit allocation. The portfolio holds about a third of its assets in securities rated A or higher, with the other two-thirds in bonds rated BBB and below. High-yield bonds outperformed investment-grade securities, and within the high-grade universe, BBB securities outperformed those rated A and higher, explaining the portfolio’s outperformance of the investment-grade Long-Term Municipal Bond Index. But when compared with the Non-Investment-Grade Municipal Bond Index, our stake in higher-rated bonds lagged.
Sector Allocation Mixed
In terms of sector allocation within the investment-grade slice, we tended to avoid tax-backed bonds (such as state and local general obligation (GO) debt) in favor of revenue bonds (such as utilities, education, and health care debt). This positioning helped because revenue bonds—particularly our health care holdings—performed well. However, it hurt relative performance to hold an underweight stake in volatile corporate-backed airline and tobacco bonds and industrial development revenue bonds.
Security Selection Helped
The portfolio also enjoyed a significant contribution to return from bonds that had lagged in the initial rebound from the credit crisis. The key example here is land-secured debt—the portfolio holds about 19% of assets in land-based deals. These securities underperformed not only during the crisis, but also during the early stages of the recovery in 2009. That’s because these tend to be lower-volatility securities that lag more liquid (easily bought and sold), higher-beta securities. But they did much better in late 2009 and 2010 as the economy and housing market stabilized. It’s also worth pointing out that we tend to favor what we consider to be higher-quality, well structured, “seasoned” land deals that are largely built out (not undeveloped land) and therefore supported by taxpaying residents.
|
| * All fund returns referenced in this commentary are for Investor Class shares. |
| **The Barclays Capital Non-Investment-Grade Municipal Bond Index’s average returns were 2.94% and 5.47% for the five- and 10-year periods |
| ended May 31, 2010, respectively, and 4.73% since the fund’s inception. |
6
High-Yield Municipal
Municipal Credit Comment
The period saw a number of negative headlines about the financial health of state and local governments. Steven Permut, who leads American Century Investments’ municipal bond team, recognizes these concerns but does not believe a wave of municipal defaults is imminent: “We think defaults, while increasing, will continue to be relatively isolated events due to credit-specific issues. And as we’ve said repeatedly, we believe the 50 states are highly unlikely to default. That’s because state general obligation bonds typically have a first or second claim on all general fund revenues, their debt service typically represents a comparatively small percentage of available income, and the states have broad powers to ensure their debts are repaid. In looking at local tax-backed credits, we have found that most cities/school districts/counties are fairly well managed and have continued to maintain reserv es during the downturn.”
Permut continues: “Instead, the real risks to municipal bonds will be more market driven, relating to (1) downgrades, (2) headlines, and (3) liquidity, which can negatively impact a bond’s value. It’s worth remembering that municipal bonds as a whole are second only to Treasuries in terms of credit quality. Indeed, as a result of recent changes to credit ratings by the big rating agencies to reflect the high quality and low likelihood of default by municipal bonds relative to corporate securities, many categories of municipal debt have recently seen their credit ratings recalibrated higher by Moody’s and Fitch.”
Outlook
“We expect modest economic growth going forward, because of three big headwinds for consumer spending (a key driver of growth): high unemployment, too much household debt, and a weak housing market,” said Permut. “While municipal credit conditions are likely to remain challenging in the near term, we think demand for municipal bonds will be fairly healthy—tax rates are widely expected to rise going forward, and investors looking for higher yields are stepping out the maturity spectrum from money market funds. At the same time, the supply of tax-free municipal bonds is likely to be constrained by the Build America Bonds program—a federal government program intended to help lower municipal borrowing costs.”
In terms of the portfolio, Permut expects to continue to “underweight lower-quality and corporate-backed bonds most sensitive to economic challenges. Instead, we favor less economically sensitive sectors, such as essential service revenue bonds (public power and water and sewer), hospitals, and higher education. We will also work to increase our exposure to higher-coupon bonds likely to be refunded and benefit from rating upgrades.”
7
| |
| High-Yield Municipal | |
| |
| Portfolio at a Glance | |
| | As of 5/31/10 |
| Weighted Average Maturity | 20.3 years |
| Average Duration (Modified) | 7.4 years |
| |
| Yields as of May 31, 2010 | |
| 30-Day SEC Yield | |
| Investor Class | 5.27% |
| Institutional Class | 5.47% |
| A Class | 4.79% |
| B Class | 4.27% |
| C Class | 4.27% |
| Investor Class 30-Day Tax Equivalent Yields(1) |
| 25.00% Tax Bracket | 7.03% |
| 28.00% Tax Bracket | 7.32% |
| 33.00% Tax Bracket | 7.87% |
| 35.00% Tax Bracket | 8.11% |
| (1) The tax brackets indicated are for federal taxes only. Actual tax-equivalent yields may be lower, if alternative minimum tax is applicable. |
| |
| Top Five Sectors as of May 31, 2010 |
| | % of fund investments |
| Land Based | 19% |
| Hospital Revenue | 18% |
| Electric Revenue | 14% |
| Transportation Revenue | 9% |
| Higher Education | 8% |
8
|
| Shareholder Fee Example (Unaudited) |
Fund shareholders may incur two types of costs: (1) transaction costs, including sales charges (loads) on purchase payments and redemption/ exchange fees; and (2) ongoing costs, including management fees; distribution and service (12b-1) fees; and other fund expenses. This example is intended to help you understand your ongoing costs (in dollars) of investing in your fund and to compare these costs with the ongoing cost of investing in other mutual funds.
The example is based on an investment of $1,000 made at the beginning of the period and held for the entire period from December 1, 2009 to May 31, 2010 (except as noted).
Actual Expenses
The table provides information about actual account values and actual expenses for each class. You may use the information, together with the amount you invested, to estimate the expenses that you paid over the period. First, identify the share class you own. Then simply divide your account value by $1,000 (for example, an $8,600 account value divided by $1,000 = 8.6), then multiply the result by the number under the heading “Expenses Paid During Period” to estimate the expenses you paid on your account during this period.
If you hold Investor Class shares of any American Century Investments fund, or Institutional Class shares of the American Century Diversified Bond Fund, in an American Century Investments account (i.e., not a financial intermediary or retirement plan account), American Century Investments may charge you a $12.50 semiannual account maintenance fee if the value of those shares is less than $10,000. We will redeem shares automatically in one of your accounts to pay the $12.50 fee. In determining your total eligible investment amount, we will include your investments in all personal accounts (including American Century Investments Brokerage accounts) registered under your Social Security number. Personal accounts include individual accounts, joint accounts, UGMA/UTMA accounts, personal trusts, Coverdell Education Savings Accounts and IRAs (including traditional, Roth, Rollover, SEP-, SARSEP- and SIMPLE-IRAs), and certain other retirement accounts. If you have only business, business retirement, employer-sponsored or American Century Investments Brokerage accounts, you are currently not subject to this fee. We will not charge the fee as long as you choose to manage your accounts exclusively online. If you are subject to the Account Maintenance Fee, your account value could be reduced by the fee amount.
Hypothetical Example for Comparison Purposes
The table also provides information about hypothetical account values and hypothetical expenses based on the actual expense ratio of each class of your fund and an assumed rate of return of 5% per year before expenses, which is not the actual return of a fund’s share class. The hypothetical account values and expenses may not be used to estimate the actual ending account balance or expenses you paid for the period. You may use this information
9
to compare the ongoing costs of investing in your fund and other funds. To do so, compare this 5% hypothetical example with the 5% hypothetical examples that appear in the shareholder reports of the other funds.
Please note that the expenses shown in the table are meant to highlight your ongoing costs only and do not reflect any transactional costs, such as sales charges (loads) or redemption/exchange fees. Therefore, the table is useful in comparing ongoing costs only, and will not help you determine the relative total costs of owning different funds. In addition, if these transactional costs were included, your costs would have been higher.
| | | | | |
| | | Beginning | Ending | Expenses Paid | |
| | | Account Value | Account Value | During Period(1) | Annualized |
| | | 12/1/09 | 5/31/10 | 12/1/09 - 5/31/10 | Expense Ratio(1) |
| Actual | | | | |
| Investor Class | $1,000 | $1,066.60 | $3.14 | 0.61% |
| Institutional Class | $1,000 | $1,031.30(2) | $1.04(3) | 0.41% |
| A Class | $1,000 | $1,065.30 | $4.43 | 0.86% |
| B Class | $1,000 | $1,061.40 | $8.27 | 1.61% |
| C Class | $1,000 | $1,060.20 | $8.27 | 1.61% |
| Hypothetical | | | | |
| Investor Class | $1,000 | $1,021.89 | $3.07 | 0.61% |
| Institutional Class | $1,000 | $1,022.89(4) | $2.07(4) | 0.41% |
| A Class | $1,000 | $1,020.64 | $4.33 | 0.86% |
| B Class | $1,000 | $1,016.90 | $8.10 | 1.61% |
| C Class | $1,000 | $1,016.90 | $8.10 | 1.61% |
| (1) | Expenses are equal to the class’s annualized expense ratio listed in the table above, multiplied by the average account value over the period, |
| | multiplied by 182, the number of days in the most recent fiscal half-year, divided by 365, to reflect the one-half year period. |
| (2) | Ending account value based on actual return from March 1, 2010 (commencement of sale) through May 31, 2010. | |
| (3) | Expenses are equal to the class’s annualized expense ratio listed in the table above, multiplied by the average account value over the period, |
| | multiplied by 91, the number of days in the period from March 1, 2010 (commencement of sale) through May 31, 2010, divided by 365, to |
| | reflect the period. Had the class been available for the full period, the expenses paid during the period would have been higher. |
| (4) | Ending account value and expenses paid during period assumes the class had been available throughout the entire period and are calculated |
| | using the class’s annualized expense ratio listed in the table above. | | |
10
| | | | | | |
| High-Yield Municipal | | | | | |
| |
| MAY 31, 2010 | | | | | | |
| | Principal | | | | Principal | |
| | Amount | Value | | | Amount | Value |
| Municipal Securities — 99.6% | | | Sundance Community | | |
| | | | | Facilities District No. 3 | | |
| ALABAMA — 1.4% | | | | Special Assessment Rev., | | |
| Courtland Industrial | | | | 6.50%, 7/1/29 | $ 575,000 | $ 498,289 |
| Development Board | | | | | | 15,010,489 |
| Environmental Improvement | | | | CALIFORNIA — 6.1% | | |
| Rev., Series 2003 B, | | | | | | |
| (International Paper Co.), | | | | California Health Facilities | | |
| 6.25%, 8/1/25(1) | $ 2,500,000 | $ 2,533,900 | | Financing Auth. Rev., Series | | |
| | | | | 2009 A, (Children’s Hospital | | |
| Selma Industrial | | | | of Orange County), | | |
| Development Board Gulf | | | | 6.50%, 11/1/38(1) | 2,000,000 | 2,130,320 |
| Opportunity Zone Rev., Series | | | | | | |
| 2010 A, (International Paper | | | | California Mobilehome Park | | |
| Co.), 5.80%, 5/1/34(1) | 1,500,000 | 1,523,325 | | Financing Auth. Rev., Series | | |
| | | 4,057,225 | | 2003 B, (Palomar Estates | | |
| | | | | E&W), 7.00%, 9/15/36(1) | 2,000,000 | 2,003,740 |
| ARIZONA — 5.1% | | | | California Municipal Finance | | |
| Arizona Health Facilities Auth. | | | | Auth. Rev., (Community | | |
| Rev., Series 2007 B, (Banner | | | | Hospital of Central | | |
| Health), VRN, 1.01%, 7/1/10, | | | | California), 5.50%, 2/1/39(1) | 1,450,000 | 1,345,426 |
| resets quarterly at 67% of the | | | | California Statewide | | |
| 3-month LIBOR plus 0.81% | | | | Communities Development | | |
| with no caps(1) | 2,500,000 | 1,665,625 | | | | |
| | | | | Auth. Rev., (Lancer | | |
| Mohave County Industrial | | | | Educational Student | | |
| Development Auth. | | | | Housing), 7.50%, 6/1/42 | 2,000,000 | 2,052,560 |
| Correctional Facilities | | | | Golden State Tobacco | | |
| Contract Rev., (Mohave | | | | Securitization Corp. | | |
| Prison, LLC Expansion), | | | | Settlement Rev., Series 2007 | | |
| 8.00%, 5/1/25(1) | 500,000 | 562,665 | | | | |
| | | | | A1, 5.75%, 6/1/47(1) | 2,075,000 | 1,521,535 |
| Phoenix Civic Improvement | | | | Golden State Tobacco | | |
| Corp. Airport Rev., Series | | | | Securitization Corp. | | |
| 2008 D, (Senior Lien), | | | | Settlement Rev., Series 2007 | | |
| 5.25%, 7/1/17(1) | 4,050,000 | 4,450,221 | | | | |
| | | | | A1, 5.125%, 6/1/47(1) | 2,000,000 | 1,319,020 |
| Phoenix Civic Improvement | | �� | | Morongo Band of Mission | | |
| Corp. Airport Rev., Series | | | | Indians Rev., Series 2008 B, | | |
| 2008 D, (Senior Lien), | | | | (Enterprise Casino Services), | | |
| 5.25%, 7/1/18(1) | 1,000,000 | 1,092,870 | | | | |
| | | | | 6.50%, 3/1/28(1)(2) | 1,000,000 | 940,790 |
| Pronghorn Ranch Community | | | | Palm Springs Airport | | |
| Facilities District GO, | | | | Passenger Facility Charge | | |
| 6.40%, 7/15/29(1) | 3,015,000 | 2,763,308 | | | | |
| | | | | Rev., (Palm Springs | | |
| Quailwood Meadows | | | | International Airport), | | |
| Community Facilities District | | | | 6.40%, 7/1/23 | 250,000 | 235,523 |
| GO, 6.00%, 7/15/22(2) | 1,120,000 | 1,050,191 | | | | |
| | | | | Palm Springs Airport | | |
| Quailwood Meadows | | | | Passenger Facility Charge | | |
| Community Facilities District | | | | Rev., (Palm Springs | | |
| GO, 6.125%, 7/15/29(2) | 2,000,000 | 1,776,460 | | International Airport), | | |
| Sundance Community | | | | 6.50%, 7/1/27 | 275,000 | 256,041 |
| Facilities District GO, | | | | Soledad Improvement Bond | | |
| 6.25%, 7/15/29(2) | 395,000 | 390,193 | | Act of 1915 District No. | | |
| Sundance Community | | | | 2002-01 Special Assessment | | |
| Facilities District No. 2 | | | | Rev., (Diamond Ridge), | | |
| Special Assessment Rev., | | | | 6.75%, 9/2/33 | 1,000,000 | 983,740 |
| 7.125%, 7/1/27(2) | 808,000 | 760,667 | | | | |
11
| | | | | | |
| High-Yield Municipal | | | | | |
| |
| | Principal | | | | Principal | |
| | Amount | Value | | | Amount | Value |
| Sunnyvale Community | | | | FLORIDA — 11.5% | | |
| Facilities District No. 1 Special | | | | Brevard County Industrial | | |
| Tax Rev., 7.75%, 8/1/32 | $1,500,000 | $ 1,505,895 | | Development Rev., | | |
| Vallejo Multifamily Housing | | | | (TUFF Florida Institute of | | |
| Rev., Series 1998 B, (Solano | | | | Technology), 6.75%, 11/1/39(1) | $3,000,000 | $ 3,087,150 |
| Affordable Housing), | | | | Broward County Airport | | |
| 8.25%, 4/1/39(2) | 1,550,000 | 1,596,035 | | System Rev., Series 2009 O, | | |
| Vernon Electric System | | | | 5.375%, 10/1/29(1) | 1,175,000 | 1,240,706 |
| Rev., Series 2009 A, | | | | Dupree Lakes Community | | |
| 5.125%, 8/1/21(1) | 2,000,000 | 2,104,200 | | Development District | | |
| | | 17,994,825 | | Special Assessment Rev., | | |
| COLORADO — 5.6% | | | | 5.00%, 11/1/10 | 1,680,000 | 1,520,568 |
| Colorado Springs Hospital | | | | Escambia County Health | | |
| Rev., (Memorial Health | | | | Facilities Auth. Rev., Series | | |
| System), 6.25%, 12/15/33(1) | 2,000,000 | 2,139,320 | | 2003 A, (Azalea Trace, | | |
| | | | | Inc.), VRDN, 0.28%, 6/1/10 | | |
| Denver City & County Airport | | | | (Radian) (LOC: Bank of | | |
| System Rev., Series 2010 A, | | | | America N.A.) (SBBPA: Bank | | |
| 5.00%, 11/15/22(1) | 1,000,000 | 1,093,220 | | of America N.A.)(1) | 1,200,000 | 1,200,000 |
| Denver Health & Hospital | | | | Escambia County Solid | | |
| Auth. Healthcare Rev., Series | | | | Waste Disposal System Rev., | | |
| 2009 A, 6.25%, 12/1/33(1) | 4,000,000 | 4,065,840 | | (Gulf Power Co.), VRDN, | | |
| Granby Ranch Metropolitan | | | | 0.33%, 6/1/10(1) | 4,600,000 | 4,600,000 |
| District GO, 6.75%, 12/1/36 | 4,000,000 | 3,346,880 | | Florida Municipal Power | | |
| One Horse Business | | | | Agency Rev., Series 2008 | | |
| Improvement District Rev., | | | | A, (All-Requirements Power | | |
| (Sales Tax Sharing), | | | | Supply), 5.25%, 10/1/19(1) | 5,000,000 | 5,715,450 |
| 6.00%, 6/1/24(1) | 3,000,000 | 2,692,920 | | Hillsborough County | | |
| Plaza Metropolitan | | | | Industrial Development | | |
| District No. 1 Tax | | | | Health Facilities Auth. Rev., | | |
| Increment Allocation Rev., | | | | Series 2008 B, (University | | |
| (Improvement Fee), | | | | Community Hospital), | | |
| 8.00%, 12/1/25 | 1,500,000 | 1,527,705 | | 8.00%, 8/15/32(1) | 1,500,000 | 1,717,335 |
| Todd Creek Farms | | | | JEA Electric System | | |
| Metropolitan District No. 1 | | | | Rev., Series 2009 A, | | |
| Rev., 5.60%, 12/1/14(3) | 1,800,000 | 897,300 | | 5.50%, 10/1/39(1) | 5,000,000 | 5,345,150 |
| Todd Creek Farms | | | | Miami-Dade County Aviation | | |
| Metropolitan District No. 1 | | | | Rev., Series 2009 A, | | |
| Rev., 6.125%, 12/1/19(3) | 1,500,000 | 747,885 | | 5.50%, 10/1/36(1) | 1,785,000 | 1,844,101 |
| | | 16,511,070 | | Miami-Dade County Health | | |
| | | | | Facilities Auth. Rev., Series | | |
| CONNECTICUT — 0.3% | | | | 2008 A2, (Miami Children’s | | |
| Connecticut Development | | | | Hospital), VRDN, 4.55%, | | |
| Auth. Industrial Rev., (AFCO | | | | 8/1/13 (NATL)(1) | 2,000,000 | 2,093,760 |
| Cargo Buildings LLC), | | | | Orange County School Board | | |
| 8.00%, 4/1/30 | 1,000,000 | 953,190 | | COP, Series 2008 E, VRDN, | | |
| DELAWARE — 0.5% | | | | 0.29%, 6/1/10 (LOC: Wells | | |
| Delaware State Economic | | | | Fargo N.A.)(1) | 1,300,000 | 1,300,000 |
| Development Auth. Rev., | | | | Orlando Utilities Commission | | |
| (Delmarva Power & Light | | | | System Rev., Series 2009 B, | | |
| Co.), 5.40%, 2/1/31(1) | 1,500,000 | 1,540,050 | | 5.00%, 10/1/33(1) | 400,000 | 422,500 |
| | | | | Putnam County Development | | |
| | | | | Auth. Pollution Control | | |
| | | | | Rev., Series 2007 B, | | |
| | | | | (Seminole Electric | | |
| | | | | Cooperative, Inc.), VRDN, | | |
| | | | | 5.35%, 5/1/18 (Ambac)(1) | 1,500,000 | 1,627,845 |
12
| | | | | | |
| High-Yield Municipal | | | | | |
| |
| | Principal | | | | Principal | |
| | Amount | Value | | | Amount | Value |
| South Lake County Hospital | | | | ILLINOIS — 9.5% | | |
| District Rev., Series 2010 | | | | Bedford Park Tax Allocation | | |
| A, (South Lake Hospital), | | | | Rev., 5.125%, 12/30/18 | $ 1,325,000 | $ 1,191,493 |
| 6.25%, 4/1/39 | $ 1,000,000 | $ 1,036,850 | | Chicago Tax Increment | | |
| South-Dade Venture | | | | Allocation Rev., Series | | |
| Community Development | | | | 2004 B, (Pilsen | | |
| District Special Assessment | | | | Redevelopment), (Junior | | |
| Rev., 6.125%, 5/1/34 | 1,245,000 | 1,221,196 | | Lien), 6.75%, 6/1/22(1) | 3,000,000 | 3,017,700 |
| | | 33,972,611 | | Hampshire Special Service | | |
| GEORGIA — 4.8% | | | | Area No. 13 Special Tax | | |
| Atlanta Tax Allocation Rev., | | | | Rev., (Tuscany Woods), | | |
| (Princeton Lakes), | | | | 5.75%, 3/1/37 | 4,966,000 | 3,236,044 |
| 5.50%, 1/1/31(2) | 1,060,000 | 946,050 | | Hampshire Special Service | | |
| Atlanta Water & Wastewater | | | | Area No. 16 Special Tax | | |
| Rev., Series 2009 A, | | | | Rev., Series 2007 A, (Crown | | |
| 6.25%, 11/1/39(1) | 3,000,000 | 3,276,600 | | Development - Prairie Ridge | | |
| De Kalb County Hospital | | | | West), 6.00%, 3/1/46 | 4,230,000 | 3,255,704 |
| Auth. Rev., (De Kalb Medical | | | | Illinois Finance Auth. Rev., | | |
| Center Inc.), 6.125%, 9/1/40 | 800,000 | 806,272 | | Series 2007 A, (Sedgebrook, | | |
| | | | | Inc.), 6.00%, 11/15/42(3)(4) | 5,000,000 | 1,995,000 |
| Gainsville & Hall County | | | | | | |
| Hospital Auth. Rev., Series | | | | Illinois Finance Auth. Rev., | | |
| 2008 A, (Health System), | | | | Series 2009 A, (Rush | | |
| VRDN, 0.29%, 6/1/10 (LOC: | | | | University Medical Center | | |
| Wells Fargo N.A.)(1) | 500,000 | 500,000 | | Obligation Group), | | |
| | | | | 7.25%, 11/1/30(1) | 1,500,000 | 1,717,455 |
| Georgia Municipal Electric | | | | | | |
| Auth. Rev., Series 2008 A, | | | | Illinois Health Facilities | | |
| (General Resolution), | | | | Auth. Rev., (Memorial Health | | |
| 5.25%, 1/1/19(1) | 1,000,000 | 1,143,210 | | System), VRDN, 0.32%, | | |
| | | | | 6/1/10 (LOC: Bank | | |
| Georgia Municipal Electric | | | | One N.A.) | 2,200,000 | 2,200,000 |
| Auth. Rev., Series 2008 D, | | | | | | |
| (General Resolution), | | | | Metropolitan Pier & | | |
| 6.00%, 1/1/23(1) | 3,000,000 | 3,435,690 | | Exposition Auth. Rev., | | |
| | | | | Series 2002 A, (Capital | | |
| Marietta Development Auth. | | | | Appreciation – McCormick | | |
| Rev., (Life University, Inc.), | | | | Place Exposition), 5.81%, | | |
| 7.00%, 6/15/39(1) | 4,000,000 | 3,960,600 | | | | |
| | | | | 12/15/31 (NATL)(1)(5) | 2,100,000 | 611,331 |
| | | 14,068,422 | | Pingree Grove Special | | |
| GUAM — 1.1% | | | | Service Area No. 7 Special | | |
| Guam Government GO, | | | | Tax Rev., Series 2006-1, | | |
| Series 2009 A, | | | | (Cambridge Lakes), | | |
| 7.00%, 11/15/39(1) | 1,700,000 | 1,827,313 | | 6.00%, 3/1/36 | 3,320,000 | 2,814,829 |
| Guam Government | | | | Volo Village Special Service | | |
| Waterworks Auth. Rev., | | | | Area No. 3 Special Tax Rev., | | |
| 6.00%, 7/1/25(1) | 1,500,000 | 1,538,835 | | Series 2006-1, (Symphony | | |
| | | 3,366,148 | | Meadows), 6.00%, 3/1/36 | 3,400,000 | 2,724,216 |
| HAWAII — 1.3% | | | | Yorkville Special Service Area | | |
| | | | | No. 2005-109 | | |
| Hawaii State Airports | | | | Special Tax Rev., Series | | |
| System Rev., Series 2010 A, | | | | 2006-105, (Bristol Bay I), | | |
| 5.00%, 7/1/34(1) | 2,000,000 | 2,018,860 | | 5.875%, 3/1/36 | 5,925,000 | 5,315,021 |
| Hawaii State Department | | | | | | 28,078,793 |
| of Budget & Finance | | | | | | |
| Rev., Series 2009 A, (15 | | | | | | |
| Craigside), 9.00%, 11/15/44 | 1,500,000 | 1,686,435 | | | | |
| | | 3,705,295 | | | | |
13
| | | | | | |
| High-Yield Municipal | | | | | |
| |
| | Principal | | | | Principal | |
| | Amount | Value | | | Amount | Value |
| INDIANA — 1.1% | | | | MICHIGAN — 0.8% | | |
| Indiana Finance Auth. Rev., | | | | Flint Hospital Building | | |
| (United States Steel Corp.), | | | | Auth. Rev., (Hurley Medical | | |
| 6.00%, 12/1/26(1) | $ 1,250,000 | $ 1,281,750 | | Center), 7.50%, 7/1/39 | $ 1,250,000 | $ 1,274,650 |
| Indiana Finance Auth. Rev., | | | | Wayne County GO, Series 2009 | | |
| Series 2009 A, (Drexel | | | | A, (Building Improvement), | | |
| Foundation Educational | | | | 6.75%, 11/1/39(1) | 1,000,000 | 1,062,670 |
| Facility), 7.00%, 10/1/39(1) | 1,000,000 | 1,053,800 | | | | |
| | | | | | | 2,337,320 |
| Purdue University Rev., | | | | MISSOURI — 1.3% | | |
| Series 2009 B, (Student | | | | | | |
| Facilities System), | | | | 370/Missouri Bottom Road/ | | |
| 5.00%, 7/1/35(1) | 750,000 | 794,640 | | Taussig Road Transportation | | |
| | | 3,130,190 | | Development District Rev., | | |
| | | | | 7.20%, 5/1/33 | 860,000 | 830,794 |
| KENTUCKY — 0.7% | | | | Kirkwood Industrial | | |
| Louisville & Jefferson County | | | | Development Auth. Rev., | | |
| Visitors and Convention | | | | Series 2010 A, (Aberdeen | | |
| Commission Rev., Series 2004 | | | | Heights), 8.25%, 5/15/45 | 3,000,000 | 2,996,430 |
| B, (Kentucky International | | | | | | |
| Convention), VRDN, 0.32%, | | | | | | 3,827,224 |
| 6/1/10 (AGM) (SBBPA: | | | | NEBRASKA — 1.0% | | |
| JPMorgan Chase Bank N.A.)(1) | 2,125,000 | 2,125,000 | | Santee Sioux Nation Tribal | | |
| LOUISIANA — 0.5% | | | | Health Care Rev., (Indian | | |
| New Orleans Aviation | | | | Health Service Joint | | |
| Board Rev., Series 2009 A, | | | | Venture), 8.75%, 10/1/20(2) | 3,000,000 | 3,047,040 |
| (Consolidated Rental Car), | | | | NEVADA — 3.2% | | |
| 6.50%, 1/1/40(1) | 1,500,000 | 1,574,295 | | Clark County Improvement | | |
| MARYLAND — 3.6% | | | | District No. 108 & 124 | | |
| Baltimore Special Obligation | | | | Special Assessment | | |
| Tax Allocation Rev., Series | | | | Rev., Series 2003 B, | | |
| 2008 A, (Resh Park), | | | | 5.25%, 2/1/12 | 640,000 | 598,688 |
| 7.00%, 9/1/38 | 5,000,000 | 5,067,950 | | Clark County Improvement | | |
| Maryland Economic | | | | District No. 108 & 124 | | |
| Development Corp. | | | | Special Assessment | | |
| Rev., Series 2010 A, | | | | Rev., Series 2003 B, | | |
| (Transportation Facilities), | | | | 5.375%, 2/1/13 | 665,000 | 597,961 |
| 5.75%, 6/1/35 | 1,000,000 | 1,024,450 | | Clark County Improvement | | |
| Maryland Health & Higher | | | | District No. 108 & 124 | | |
| Educational Facilities Auth. | | | | Special Assessment | | |
| Rev., (Doctors Community | | | | Rev., Series 2003 B, | | |
| Hospital), 5.75%, 7/1/38 | 3,655,000 | 3,536,212 | | 5.40%, 2/1/14 | 640,000 | 551,539 |
| Maryland Industrial | | | | Henderson Local | | |
| Development Financing Auth. | | | | Improvement District No. | | |
| Rev., Series 2005 A, (Our | | | | T-15 Special Assessment | | |
| Lady of Good Counsel High | | | | Rev., 6.10%, 3/1/24 | 1,335,000 | 1,168,833 |
| School), 6.00%, 5/1/35 | 1,000,000 | 964,900 | | Henderson Redevelopment | | |
| | | 10,593,512 | | Agency Tax Allocation | | |
| MASSACHUSETTS — 1.0% | | | | Rev., Series 2002 B, | | |
| Massachusetts Development | | | | 7.10%, 10/1/22(1) | 1,105,000 | 1,094,491 |
| Finance Agency Rev., Series | | | | Henderson Redevelopment | | |
| 2009 A, (The Groves in | | | | Agency Tax Allocation | | |
| Lincoln), 7.875%, 6/1/44 | 1,000,000 | 1,038,000 | | Rev., Series 2002 B, | | |
| Massachusetts Health & | | | | 7.20%, 10/1/25(1) | 350,000 | 342,591 |
| Educational Facilities Auth. | | | | Las Vegas Improvement | | |
| Rev., Series 2010 G, (UMass | | | | District No. 607 Special | | |
| Memorial), 5.00%, 7/1/21(1) | 1,950,000 | 1,968,388 | | Assessment Rev., | | |
| | | 3,006,388 | | 5.50%, 6/1/13(1) | 1,225,000 | 1,213,657 |
14
| | | | | | |
| High-Yield Municipal | | | | | |
| |
| | Principal | | | | Principal | |
| | Amount | Value | | | Amount | Value |
| Las Vegas Improvement | | | | Nassau County Industrial | | |
| District No. 808 & 810 | | | | Development Agency | | |
| Special Assessment Rev., | | | | Continuing Care Retirement | | |
| (Summerlin Village 23B), | | | | Community Rev., Series | | |
| 6.125%, 6/1/31 | $3,500,000 | $ 2,542,365 | | 2007 A, (Amsterdam at | | |
| Reno District No. 4 Special | | | | Harborside), 6.50%, 1/1/27 | $2,500,000 | $ 2,487,275 |
| Assessment Rev., (Somersett | | | | New York GO, Series 1994 | | |
| Parkway), 5.20%, 12/1/10 | 645,000 | 646,496 | | H3, VRDN, 0.26%, 6/3/10 | | |
| Reno District No. 4 Special | | | | (AGM) (SBBPA: State Street | | |
| Assessment Rev., (Somersett | | | | Bank & Trust Co.)(1) | 500,000 | 500,000 |
| Parkway), 5.45%, 12/1/11 | 680,000 | 681,748 | | New York State Dormitory | | |
| | | 9,438,369 | | Auth. Rev., (Orange | | |
| | | | | Regional Medical Center), | | |
| NEW JERSEY — 3.3% | | | | 6.25%, 12/1/37(1) | 4,250,000 | 4,151,868 |
| New Jersey Economic | | | | Onondaga County Industrial | | |
| Development Auth. Rev., | | | | Development Agency Rev., | | |
| Series 2006 B, (Gloucester | | | | (Air Cargo), 7.25%, 1/1/32(1) | 1,000,000 | 932,380 |
| Marine Terminal), | | | | | | |
| 6.875%, 1/1/37 | 5,000,000 | 4,330,000 | | Suffolk County Industrial | | |
| | | | | Development Agency | | |
| New Jersey Economic | | | | Rev., (New York Institute | | |
| Development Auth. Rev., Series | | | | of Technology), | | |
| 2006 C, (Gloucester Marine | | | | 5.00%, 3/1/26(1) | 325,000 | 327,710 |
| Terminal), 6.50%, 1/1/15(2) | 2,000,000 | 1,933,080 | | | | |
| | | | | Triborough Bridge & Tunnel | | |
| New Jersey Educational | | | | Auth. Rev., Series 2009 A2, | | |
| Facilities Auth. Rev., Series | | | | 5.25%, 11/15/34(1) | 1,000,000 | 1,081,530 |
| 2009 B, (University of | | | | | | |
| Medicine & Dentistry), | | | | Troy Capital Resource | | |
| 7.50%, 12/1/32 | 1,200,000 | 1,386,228 | | Corp. Rev., Series 2010 A, | | |
| | | | | (Rensselaer Polytechnic | | |
| Rutgers State University | | | | Institute), 5.125%, 9/1/40(1) | 485,000 | 496,039 |
| Rev., Series 2009 F, | | | | | | |
| 5.00%, 5/1/39(1) | 2,000,000 | 2,124,120 | | | | 10,801,826 |
| | | 9,773,428 | | NORTH CAROLINA — 4.9% | | |
| NEW MEXICO — 1.1% | | | | North Carolina Eastern | | |
| | | | | Municipal Power Agency | | |
| Cabezon Public Improvement | | | | Rev., Series 2009 A, | | |
| District Special Tax Rev., | | | | 5.50%, 1/1/26(1) | 2,000,000 | 2,167,800 |
| 6.30%, 9/1/34 | 1,490,000 | 1,309,323 | | | | |
| | | | | North Carolina Eastern | | |
| Montecito Estates Public | | | | Municipal Power Agency | | |
| Improvement District Levy | | | | Rev., Series 2009 B, | | |
| Special Tax Rev., (City of | | | | 5.00%, 1/1/26(1) | 1,900,000 | 1,997,413 |
| Albuquerque), | | | | | | |
| 7.00%, 10/1/37 | 1,190,000 | 1,056,101 | | North Carolina Municipal | | |
| | | | | Power Agency No. 1 Catawba | | |
| Ventana West Public | | | | Electric Rev., Series 2008 A, | | |
| Improvement District Levy | | | | 5.25%, 1/1/16(1) | 4,645,000 | 5,276,488 |
| Special Tax Rev., | | | | | | |
| 6.875%, 8/1/33(1) | 1,000,000 | 882,050 | | North Carolina Municipal | | |
| | | | | Power Agency No. 1 Catawba | | |
| | | 3,247,474 | | Electric | | |
| NEW YORK — 3.7% | | | | Rev., Series 2008 A, | | |
| Brooklyn Arena Local | | | | 5.25%, 1/1/17(1) | 4,000,000 | 4,557,640 |
| Development Corp. Rev., | | | | North Carolina Municipal | | |
| (Barclays Center), | | | | Power Agency No. 1 Catawba | | |
| 6.25%, 7/15/40(1) | 800,000 | 825,024 | | Electric | | |
| | | | | Rev., Series 2009 A, | | |
| | | | | 5.00%, 1/1/30(1) | 300,000 | 310,794 |
| | | | | | | 14,310,135 |
15
| | | | | | |
| High-Yield Municipal | | | | | |
| |
| | Principal | | | | Principal | |
| | Amount | Value | | | Amount | Value |
| OHIO — 3.1% | | | | Pennsylvania Economic | | |
| Buckeye Tobacco Settlement | | | | Development Financing | | |
| Financing Auth. Rev., Series | | | | Auth. Rev., Series 2009 A, | | |
| 2007 A2, 6.50%, 6/1/47(1) | $7,255,000 | $ 5,738,850 | | (Albert Einstein Healthcare | | |
| Ohio Higher Educational | | | | Network), 6.25%, 10/15/23 | $2,000,000 | $ 2,179,920 |
| Facility Commission Rev., | | | | Philadelphia Gas Works Rev., | | |
| (Ashland University), | | | | Series 2009 A, (1998 General | | |
| 6.25%, 9/1/24(6) | 1,925,000 | 1,927,657 | | Ordinance), | | |
| | | | | 5.00%, 8/1/16(1) | 1,440,000 | 1,502,165 |
| Pinnacle Community | | | | | | |
| Infrastructure Financing | | | | Philadelphia Municipal Auth. | | |
| Facilities Auth. Rev., Series | | | | Lease Rev., 6.50%, 4/1/39(1) | 1,500,000 | 1,616,625 |
| 2004 A, 6.25%, 12/1/36(1) | 1,800,000 | 1,448,820 | | Philadelphia Water & | | |
| | | 9,115,327 | | Wastewater Rev., Series | | |
| | | | | 2009 A, 5.25%, 1/1/33(1) | 1,000,000 | 1,044,220 |
| OKLAHOMA — 1.1% | | | | | | |
| | | | | Westmoreland County | | |
| Oklahoma City Industrial & | | | | Industrial Development | | |
| Cultural Facilities Trust Rev., | | | | Auth. Rev., (Excela Health), | | |
| 6.75%, 1/1/23(1) | 750,000 | 682,463 | | | | |
| | | | | 5.125%, 7/1/30(6) | 465,000 | 460,661 |
| Tulsa County Industrial Auth. | | | | | | 10,340,676 |
| Senior Living Community | | | | | | |
| Rev., Series 2010 A, | | | | PUERTO RICO — 1.7% | | |
| (Montereau, Inc.), | | | | Puerto Rico Electric Power | | |
| 7.25%, 11/1/40 | 2,500,000 | 2,503,300 | | Auth. Rev., Series 2010 XX, | | |
| | | 3,185,763 | | 5.25%, 7/1/40(1) | 3,250,000 | 3,290,495 |
| OREGON — 1.3% | | | | Puerto Rico GO, Series 2008 | | |
| | | | | A, 6.00%, 7/1/38(1) | 1,500,000 | 1,584,435 |
| Forest Grove Student | | | | | | |
| Housing Rev., (Oak | | | | | | 4,874,930 |
| Tree Foundation), | | | | RHODE ISLAND — 0.3% | | |
| 5.50%, 3/1/37(2) | 2,330,000 | 2,135,049 | | Rhode Island Health & | | |
| Oregon Health & Science | | | | Educational Building Corp. | | |
| University Rev., Series 2009 | | | | Rev., (Portsmouth Abbey | | |
| A, 5.75%, 7/1/39(1) | 1,300,000 | 1,386,112 | | School), VRDN, 0.28%, | | |
| Redmond Airport Rev., | | | | 6/1/10 (LOC: Bank of | | |
| 6.25%, 6/1/39 | 200,000 | 207,466 | | America N.A.)(1) | 1,000,000 | 1,000,000 |
| | | 3,728,627 | | SOUTH CAROLINA — 0.8% | | |
| PENNSYLVANIA — 3.5% | | | | South Carolina Jobs- | | |
| | | | | Economic Development Auth. | | |
| Allegheny County Industrial | | | | Hospital Rev., (Palmetto | | |
| Development Auth. | | | | Health), 5.75%, 8/1/39(1) | 2,300,000 | 2,304,669 |
| Rev., (Environmental | | | | | | |
| Improvments), | | | | TENNESSEE — 2.5% | | |
| 6.75%, 11/1/24(1) | 1,000,000 | 1,067,950 | | Chattanooga Health | | |
| Allegheny County | | | | Educational & Housing | | |
| Industrial Development | | | | Facility Board Rev., | | |
| Auth. Rev., (Environmental | | | | Series 2005 B, (Campus | | |
| Improvments), | | | | Development Foundation, Inc. | | |
| 6.875%, 5/1/30(1) | 1,000,000 | 1,075,800 | | Phase I LLC), | | |
| | | | | 6.00%, 10/1/35(1) | 3,565,000 | 3,286,645 |
| Allegheny County | | | | | | |
| Redevelopment Auth. Tax | | | | Shelby County Health | | |
| Allocation Rev., (Pittsburgh | | | | Educational & Housing | | |
| Mills), 5.60%, 7/1/23 | 1,500,000 | 1,393,335 | | Facilities Board Rev., Series | | |
| | | | | 2008 C, 5.25%, 6/1/17(1) | 3,695,000 | 4,033,794 |
| | | | | | | 7,320,439 |
16
| | | | | | |
| High-Yield Municipal | | | | | |
| |
| | Principal | | | | Principal | |
| | Amount | Value | | | Amount | Value |
| TEXAS — 6.1% | | | | WASHINGTON — 0.4% | | |
| La Vernia Higher Education | | | | Port of Seattle Rev., | | |
| Finance Corp. Rev., Series | | | | Series 2000 B, 6.00%, | | |
| 2009 A, (Kipp, Inc.), | | | | 2/1/15 (NATL)(1) | $ 250,000 | $ 281,662 |
| 6.25%, 8/15/39(1) | $1,000,000 | $ 1,038,890 | | Washington Health Care | | |
| Lower Colorado River Auth. | | | | Facilities Auth. Rev., Series | | |
| Rev., 5.75%, 5/15/37(1) | 2,250,000 | 2,370,758 | | 2009 A, (Swedish Health | | |
| North Texas Thruway Auth. | | | | Services), 6.50%, 11/15/33 | 1,000,000 | 1,050,360 |
| Rev., Series 2008 H, | | | | | | 1,332,022 |
| (First Tier), VRDN, | | | | WEST VIRGINIA — 0.5% | | |
| 5.00%, 1/1/13(1) | 5,300,000 | 5,698,136 | | | | |
| | | | | West Virginia Economic | | |
| Tarrant County Cultural | | | | Development Auth. Solid | | |
| Education Facilities Finance | | | | Waste Disposal Facilities | | |
| Corp. Rev., (Air Force | | | | Rev., Series 2010 A, | | |
| Village), 6.375%, 11/15/44 | 2,500,000 | 2,518,275 | | (Appalachian Power Co.), | | |
| Texas Private Activity Bond | | | | 5.375%, 12/1/38(1) | 1,500,000 | 1,505,370 |
| Surface Transportation Corp. | | | | WISCONSIN — 1.5% | | |
| Rev., (Senior Lien/Note | | | | | | |
| Mobility), 6.875%, 12/31/39 | 3,000,000 | 3,166,710 | | Wisconsin Health & | | |
| | | | | Educational Facilities Auth. | | |
| Texas Public Finance Auth. | | | | Rev., (Luther Hospital), | | |
| Charter School Finance Corp. | | | | 5.75%, 11/15/30(1) | 1,200,000 | 1,294,020 |
| Rev., Series 2010 A, | | | | | | |
| 6.20%, 2/15/40(1) | 1,500,000 | 1,521,675 | | Wisconsin Health & | | |
| | | | | Educational Facilities | | |
| Travis County Health | | | | Auth. Rev., Series 2004 A, | | |
| Facilities Development Corp. | | | | (Southwest Health Center), | | |
| Rev., (Westminster Manor | | | | 6.25%, 4/1/34 | 2,000,000 | 1,965,740 |
| Health), 7.125%, 11/1/40 | 1,500,000 | 1,525,245 | | Wisconsin Health & | | |
| | | 17,839,689 | | Educational Facilities Auth. | | |
| U.S. VIRGIN ISLANDS — 0.9% | | | | Rev., Series 2009 A, (Saint | | |
| Virgin Islands Public Finance | | | | John’s Communities, Inc.), | | |
| Auth. Rev., Series 2009 A, | | | | 7.625%, 9/15/39 | 1,000,000 | 1,046,340 |
| (Diageo Matching Fund | | | | | | 4,306,100 |
| Bonds), 6.75%, 10/1/37 | 2,000,000 | 2,236,340 | | WYOMING — 0.7% | | |
| Virgin Islands Public Finance | | | | Campbell County Solid | | |
| Auth. Rev., Series 2009 | | | | Waste Facilities Rev., Series | | |
| A1, (Senior Lien/Capital | | | | 2009 A, (Basin Electric | | |
| Projects), 5.00%, 10/1/39(1) | 400,000 | 400,268 | | Power Cooperative), | | |
| | | 2,636,608 | | 5.75%, 7/15/39(1) | 2,000,000 | 2,166,680 |
| VIRGINIA — 1.8% | | | | TOTAL INVESTMENT | | |
| Peninsula Town Center | | | | SECURITIES — 99.6% | | |
| Community Development | | | | (Cost $299,548,054) | | 293,305,829 |
| Auth. Rev., 6.45%, 9/1/37 | 3,000,000 | 2,943,030 | | OTHER ASSETS | | |
| Virginia College Building & | | | | AND LIABILITIES — 0.4% | | 1,132,988 |
| Education Facilities Auth. | | | | TOTAL NET ASSETS — 100.0% | $294,438,817 |
| Rev., Series 2009 A, (Public | | | | | | |
| Higher Education Financing | | | | | | |
| Program), 5.00%, 9/1/28(1) | 1,000,000 | 1,089,870 | | | | |
| Washington County Industrial | | | | | | |
| Development Auth. Hospital | | | | | | |
| Facility Rev., Series 2009 | | | | | | |
| C, (Mountain States Health | | | | | | |
| Alliance), 7.75%, 7/1/38(1) | 1,000,000 | 1,145,710 | | | | |
| | | 5,178,610 | | | | |
17
| | | | |
| High-Yield Municipal | | |
| Futures Contracts | | | |
| | Contracts Purchased | Expiration Date | Underlying Face Amount at Value | Unrealized Gain (Loss) |
| 73 | U.S. Long Bond | September 2010 | $ 8,953,906 | $(80,020) |
| | | | | |
| | Contracts Sold | Expiration Date | Underlying Face Amount at Value | Unrealized Gain (Loss) |
| 232 | U.S. Treasury 2-Year Notes | September 2010 | $50,608,625 | $(62,145) |
| |
| Notes to Schedule of Investments |
| AGM = Assured Guaranty Municipal Corporation |
| Ambac = Ambac Assurance Corporation |
| COP = Certificates of Participation |
| GO = General Obligation |
| LIBOR = London Interbank Offered Rate |
| LOC = Letter of Credit |
| NATL = National Public Finance Guarantee Corporation |
| Radian = Radian Asset Assurance, Inc. |
| resets = The frequency with which a security’s coupon changes, based on current market conditions or an underlying index. The more frequently a |
| security resets, the less risk the investor is taking that the coupon will vary significantly from current market rates. |
| SBBPA = Standby Bond Purchase Agreement |
| VRDN = Variable Rate Demand Note. Interest reset date is indicated. Rate shown is effective at the period end. |
| VRN = Variable Rate Note. Interest reset date is indicated. Rate shown is effective at the period end. |
| (1) | Security, or a portion thereof, has been segregated for when-issued securities, and/or futures contracts. At the period end, the aggregate value |
| | of securities pledged was $61,951,000. |
| (2) | Security was purchased under Rule 144A of the Securities Act of 1933 or is a private placement and, unless registered under the Act or |
| | exempted from registration, may only be sold to qualified institutional investors. The aggregate value of these securities at the period end was |
| | $14,575,555, which represented 5.0% of total net assets. |
| (3) | Security is in default. |
| (4) | Non-income producing. |
| (5) | Security is a zero-coupon municipal bond. The rate indicated is the yield to maturity at purchase. Zero-coupon securities are issued at a |
| | substantial discount from their value at maturity. |
| (6) | When-issued security. |
Geographic classifications are unaudited.
See Notes to Financial Statements.
18
|
| Statement of Assets and Liabilities |
| | | |
| MAY 31, 2010 | | | |
| Assets | | | |
| Investment securities, at value (cost of $299,548,054) | | $293,305,829 |
| Cash | | | 26,029 |
| Receivable for investments sold | | | 150,560 |
| Receivable for capital shares sold | | | 263,875 |
| Receivable for variation margin on futures contracts | | 15,969 |
| Interest receivable | | | 5,057,296 |
| | | | 298,819,558 |
| | | | |
| Liabilities | | | |
| Payable for investments purchased | | | 2,380,556 |
| Payable for capital shares redeemed | | | 1,431,388 |
| Payable for variation margin on futures contracts | | 97,875 |
| Accrued management fees | | | 149,782 |
| Service fees (and distribution fees — A Class) payable | | 34,289 |
| Distribution fees payable | | | 20,163 |
| Dividends payable | | | 266,688 |
| | | | 4,380,741 |
| | | | |
| Net Assets | | | $294,438,817 |
| | | | |
| Net Assets Consist of: | | | |
| Capital paid in | | | $332,855,398 |
| Accumulated net realized loss on investment transactions | | (32,032,191) |
| Net unrealized depreciation on investments | | | (6,384,390) |
| | | | $294,438,817 |
| |
| | Net assets | Shares outstanding | Net asset value per share |
| Investor Class | $132,196,245 | 14,989,674 | $8.82 |
| Institutional Class | $25,783 | 2,923 | $8.82 |
| A Class | $130,265,578 | 14,770,248 | $8.82* |
| B Class | $2,638,470 | 299,173 | $8.82 |
| C Class | $29,312,741 | 3,325,421 | $8.81 |
| *Maximum offering price $9.24 (net asset value divided by 0.955) | | |
| |
| |
| See Notes to Financial Statements. | | | |
19
| |
| YEAR ENDED MAY 31, 2010 | |
| Investment Income (Loss) | |
| Income: | |
| Interest | $ 15,477,395 |
| | |
| Expenses: | |
| Management fees | 1,565,003 |
| Distribution fees: | |
| B Class | 21,515 |
| C Class | 200,371 |
| Service fees: | |
| B Class | 7,171 |
| C Class | 66,790 |
| Distribution and service fees — A Class | 303,561 |
| Trustees’ fees and expenses | 10,898 |
| Other expenses | 4,288 |
| | 2,179,597 |
| | |
| Net investment income (loss) | 13,297,798 |
| | |
| Realized and Unrealized Gain (Loss) | |
| Net realized gain (loss) on: | |
| Investment transactions | (15,421,651) |
| Futures contract transactions | 90,084 |
| | (15,331,567) |
| | |
| Change in net unrealized appreciation (depreciation) on: | |
| Investments | 42,936,548 |
| Futures contracts | (113,837) |
| | 42,822,711 |
| | |
| Net realized and unrealized gain (loss) | 27,491,144 |
| | |
| Net Increase (Decrease) in Net Assets Resulting from Operations | $40,788,942 |
| |
| |
| See Notes to Financial Statements. | |
20
|
| Statement of Changes in Net Assets |
| | |
| YEARS ENDED MAY 31, 2010 AND MAY 31, 2009 | | |
| Increase (Decrease) in Net Assets | 2010 | 2009 |
| Operations | | |
| Net investment income (loss) | $ 13,297,798 | $ 12,747,265 |
| Net realized gain (loss) | (15,331,567) | (7,084,901) |
| Change in net unrealized appreciation (depreciation) | 42,822,711 | (39,345,173) |
| Net increase (decrease) in net assets resulting from operations | 40,788,942 | (33,682,809) |
| | | |
| Distributions to Shareholders | | |
| From net investment income: | | |
| Investor Class | (5,707,098) | (4,679,203) |
| Institutional Class | (319) | — |
| A Class | (6,284,384) | (6,531,632) |
| B Class | (127,227) | (151,804) |
| C Class | (1,179,101) | (1,384,288) |
| Decrease in net assets from distributions | (13,298,129) | (12,746,927) |
| | | |
| Capital Share Transactions | | |
| Net increase (decrease) in net assets from capital share transactions | 45,154,745 | 3,181,386 |
| | | |
| Net increase (decrease) in net assets | 72,645,558 | (43,248,350) |
| | | |
| Net Assets | | |
| Beginning of period | 221,793,259 | 265,041,609 |
| End of period | $294,438,817 | $221,793,259 |
| | | |
| Undistributed net investment income | — | $338 |
| |
| |
| See Notes to Financial Statements. | | |
21
|
| Notes to Financial Statements |
MAY 31, 2010
1. Organization and Summary of Significant Accounting Policies
Organization — American Century Municipal Trust (the trust) is registered under the Investment Company Act of 1940 (the 1940 Act) as an open-end management investment company. High-Yield Municipal Fund (the fund) is one fund in a series issued by the trust. The fund is nondiversified under the 1940 Act. The fund’s investment objective is to seek high current income that is exempt from federal income taxes. Capital appreciation is a secondary objective. The fund pursues its objectives by investing primarily in long-term and intermediate-term municipal obligations. The following is a summary of the fund’s significant accounting policies.
Multiple Class — The fund is authorized to issue the Investor Class, the Institutional Class, the A Class, the B Class and the C Class. The A Class may incur an initial sales charge. The A Class, B Class and C Class may be subject to a contingent deferred sales charge. The share classes differ principally in their respective sales charges and distribution and shareholder servicing expenses and arrangements. All shares of the fund represent an equal pro rata interest in the net assets of the class to which such shares belong, and have identical voting, dividend, liquidation and other rights and the same terms and conditions, except for class specific expenses and exclusive rights to vote on matters affecting only individual classes. Income, non-class specific expenses, and realized and unrealized capital gains and losses of th e fund are allocated to each class of shares based on their relative net assets. Sale of the Institutional Class commenced on March 1, 2010.
Security Valuations — Debt securities maturing in greater than 60 days at the time of purchase are valued at current market value as provided by a commercial pricing service or at the mean of the most recent bid and asked prices. Debt securities maturing within 60 days at the time of purchase may be valued at cost, plus or minus any amortized discount or premium. If an event occurs after the value of a security was established but before the net asset value per share was determined that was likely to materially change the net asset value, that security would be valued as determined in accordance with procedures adopted by the Board of Trustees. If the fund determines that the market price of a portfolio security is not readily available, or that the valuation methods mentioned above do not reflect the security’s fair val ue, such security is valued as determined by the Board of Trustees or its designee, in accordance with procedures adopted by the Board of Trustees, if such determination would materially impact a fund’s net asset value. Certain other circumstances may cause the fund to use alternative procedures to value a security such as: a security has been declared in default; trading in a security has been halted during the trading day; or there is a foreign market holiday and no trading will commence.
Security Transactions — For financial reporting purposes, security transactions are accounted for as of the trade date. Net realized gains and losses are determined on the identified cost basis, which is also used for federal income tax purposes.
Investment Income — Interest income is recorded on the accrual basis and includes accretion of discounts and amortization of premiums.
When-Issued — The fund may engage in securities transactions on a when-issued basis. Under these arrangements, the securities’ prices and yields are fixed on the date of the commitment, but payment and delivery are scheduled for a future date. During this period, securities are subject to market fluctuations. The fund will segregate cash, cash equivalents or other appropriate liquid securities on its records in amounts sufficient to meet the purchase price.
22
Income Tax Status — It is the fund’s policy to distribute substantially all net investment income and net realized gains to shareholders and to otherwise qualify as a regulated investment company under provisions of the Internal Revenue Code. The fund is no longer subject to examination by tax authorities for years prior to 2007. At this time, management believes there are no uncertain tax positions which, based on their technical merit, would not be sustained upon examination and for which it is reasonably possible that the total amounts of unrecognized tax benefits will significantly change in the next twelve months. Accordingly, no provision has been made for federal or state income taxes.
Distributions to Shareholders — Distributions from net investment income are declared daily and paid monthly. Distributions from net realized gains, if any, are generally declared and paid annually.
Indemnifications — Under the trust’s organizational documents, its officers and trustees are indemnified against certain liabilities arising out of the performance of their duties to the fund. In addition, in the normal course of business, the fund enters into contracts that provide general indemnifications. The maximum exposure under these arrangements is unknown as this would involve future claims that may be made against a fund. The risk of material loss from such claims is considered by management to be remote.
Use of Estimates — The financial statements are prepared in conformity with accounting principles generally accepted in the United States of America, which may require management to make certain estimates and assumptions at the date of the financial statements. Actual results could differ from these estimates.
Subsequent Events — In preparing the financial statements, management evaluated the impact of events or transactions occurring through the date the financial statements were issued that would merit recognition or disclosure.
2. Fees and Transactions with Related Parties
Management Fees — The trust has entered into a Management Agreement with American Century Investment Management, Inc. (ACIM) (the investment advisor), under which ACIM provides the fund with investment advisory and management services in exchange for a single, unified management fee (the fee) per class. The Agreement provides that all expenses of managing and operating the fund, except brokerage expenses, taxes, interest, fees and expenses of the independent trustees (including legal counsel fees), and extraordinary expenses, will be paid by ACIM. The fee is computed and accrued daily based on the daily net assets of the specific class of shares of the fund and paid monthly in arrears. The fee consists of (1) an Investment Category Fee based on the daily net assets of the fund and certain other accounts managed by the inv estment advisor that are in the same broad investment category as the fund and (2) a Complex Fee based on the assets of all the funds in the American Century Investments family of funds. The rates for the Investment Category Fee range from 0.2925% to 0.4100%. The rates for the Complex Fee range from 0.2500% to 0.3100% for the Investor Class, A Class, B Class and C Class. The Institutional Class is 0.2000% less at each point within the Complex Fee range. The effective annual management fee for each class for the year ended May 31, 2010 was 0.61% for the Investor Class, A Class, B Class and C Class and 0.41% for the Institutional Class.
Distribution and Service Fees — The Board of Trustees has adopted a separate Master Distribution and Individual Shareholder Services Plan for each of the A Class, B Class and C Class (collectively the plans), pursuant to Rule 12b-1 of the 1940 Act. The plans provide that the A Class will pay American Century Investment Services, Inc. (ACIS) an annual distribution and service fee of 0.25%. The plans provide that the B Class and the C Class will each pay ACIS an annual distribution fee of 0.75% and service fee of 0.25%. The fees are computed and accrued daily based on each class’s daily net assets and paid monthly in arrears. The fees are used to pay financial intermediaries for distribution and individual shareholder services. Fees incurred under the plans during the year ended May 31, 2010, are detailed in the Statem ent of Operations.
23
Related Parties — Certain officers and trustees of the trust are also officers and/or directors of American Century Companies, Inc. (ACC), the parent of the trust’s investment advisor, ACIM, the distributor of the trust, ACIS, and the trust’s transfer agent, American Century Services, LLC.
The fund has a Mutual Funds Services Agreement with J.P. Morgan Investor Services Co. (JPMIS). JPMorgan Chase Bank (JPMCB) is a custodian of the fund. JPMIS and JPMCB are wholly owned subsidiaries of JPMorgan Chase & Co. (JPM). JPM is an equity investor in ACC.
3. Investment Transactions
Purchases and sales of investment securities, excluding short-term investments, for the year ended May 31, 2010, were $99,509,084 and $59,414,431, respectively.
4. Capital Share Transactions
Transactions in shares of the fund were as follows (unlimited number of shares authorized):
| | | | |
| | Year ended May 31, 2010(1) | Year ended May 31, 2009 |
| | Shares | Amount | Shares | Amount |
| Investor Class | | | | |
| Sold | 8,211,992 | $ 69,589,486 | 6,547,168 | $ 54,267,569 |
| Issued in reinvestment of distributions | 522,768 | 4,429,056 | 403,898 | 3,300,074 |
| Redeemed | (4,182,197) | (35,613,780) | (5,560,644) | (45,922,788) |
| | 4,552,563 | 38,404,762 | 1,390,422 | 11,644,855 |
| Institutional Class | | | N/A | N/A |
| Sold | 2,886 | 25,000 | | |
| Issued in reinvestment of distributions | 37 | 319 | | |
| | 2,923 | 25,319 | | |
| A Class | | | | |
| Sold | 4,398,679 | 37,187,350 | 5,879,016 | 48,139,060 |
| Issued in reinvestment of distributions | 551,204 | 4,645,556 | 651,804 | 5,359,830 |
| Redeemed | (4,250,762) | (35,933,107) | (6,999,366) | (58,876,820) |
| | 699,121 | 5,899,799 | (468,546) | (5,377,930) |
| B Class | | | | |
| Sold | 29,502 | 236,485 | 41,874 | 333,324 |
| Issued in reinvestment of distributions | 7,014 | 59,236 | 7,952 | 65,402 |
| Redeemed | (88,495) | (753,378) | (93,706) | (769,385) |
| | (51,979) | (457,657) | (43,880) | (370,659) |
| C Class | | | | |
| Sold | 989,274 | 8,350,837 | 914,702 | 7,627,639 |
| Issued in reinvestment of distributions | 67,471 | 568,633 | 76,204 | 625,818 |
| Redeemed | (915,936) | (7,636,948) | (1,345,727) | (10,968,337) |
| | 140,809 | 1,282,522 | (354,821) | (2,714,880) |
| Net increase (decrease) | 5,343,437 | $ 45,154,745 | 523,175 | $ 3,181,386 |
| (1) March 1, 2010 (commencement of sale) through May 31, 2010 for the Institutional Class. | | |
24
5. Fair Value Measurements
The fund’s securities valuation process is based on several considerations and may use multiple inputs to determine the fair value of the positions held by the fund. In conformity with accounting principles generally accepted in the United States of America, the inputs used to determine a valuation are classified into three broad levels as follows:
• Level 1 valuation inputs consist of unadjusted quoted prices in an active market for identical securities;
• Level 2 valuation inputs consist of significant direct or indirect observable market data (including quoted prices for similar securities, evaluations of subsequent market events, interest rates, prepayment speeds, credit risk, etc.); or
• Level 3 valuation inputs consist of significant unobservable inputs (including a fund’s own assumptions).
The level classification is based on the lowest level input that is significant to the fair valuation measurement. The valuation inputs are not an indication of the risks associated with investing in these securities or other financial instruments.
As of May 31, 2010, the valuation inputs used to determine the fair value of the fund’s investment securities and unrealized gain (loss) on futures contracts were classified as Level 2 and Level 1, respectively. The Schedule of Investments provides additional details on the fund’s portfolio holdings.
6. Derivative Instruments
Interest Rate Risk — The fund is subject to interest rate risk in the normal course of pursuing its investment objectives. The value of bonds generally declines as interest rates rise. A fund may enter into futures contracts based on a bond index or a specific underlying security. A fund may purchase futures contracts to gain exposure to increases in market value or sell futures contracts to protect against a decline in market value. Upon entering into a futures contract, a fund will segregate cash, cash equivalents or other appropriate liquid securities on its records in amounts sufficient to meet requirements. Subsequent payments (variation margin) are made or received daily, in cash, by a fund. The variation margin is equal to the daily change in the contract value and is recorded as unrealized gains and losses. A fund rec ognizes a realized gain or loss when the futures contract is closed or expires. Net realized and unrealized gains or losses occurring during the holding period of futures contracts are a component of net realized gain (loss) on futures contract transactions and change in net unrealized appreciation (depreciation) on futures contracts, respectively. One of the risks of entering into futures contracts is the possibility that the change in value of the contract may not correlate with the changes in value of the underlying securities. The interest rate risk derivative instruments held at period end as disclosed on the Schedule of Investments are indicative of the fund’s typical volume during the period.
The value of interest rate risk derivative instruments as of May 31, 2010, is disclosed on the Statement of Assets and Liabilities as an asset of $15,969 in receivable for variation margin on futures contracts and as a liability of $97,875 in payable for variation margin on futures contracts. For the year ended May 31, 2010, the effect of interest rate risk derivative instruments on the Statement of Operations was $90,084 in net realized gain (loss) on futures contract transactions and $(113,837) in change in net unrealized appreciation (depreciation) on futures contracts.
25
7. Interfund Lending
The fund, along with certain other funds in the American Century Investments family of funds, may participate in an interfund lending program, pursuant to an Exemptive Order issued by the Securities and Exchange Commission (SEC). This program provides an alternative credit facility allowing the fund to borrow from or lend to other funds in the American Century Investments family of funds that permit such transactions. Interfund lending transactions are subject to each fund’s investment policies and borrowing and lending limits. The interfund loan rate earned/paid on interfund lending transactions is determined daily based on the average of certain current market rates. Interfund lending transactions normally extend only overnight, but can have a maximum duration of seven days. The program is subject to annual approval by the Board of Trustees. During the year ended May 31, 2010, the fund did not utilize the p rogram.
8. Risk Factors
The fund invests primarily in lower-rated debt securities, which are subject to substantial risks including price volatility, liquidity and default risk.
9. Federal Tax Information
The tax character of distributions paid during the years ended May 31, 2010 and May 31, 2009 were as follows:
| | |
| | 2010 | 2009 |
| Distributions Paid From | | |
| Exempt income | $13,298,129 | $12,746,927 |
| Long-term capital gains | — | — |
The book-basis character of distributions made during the year from net investment income or net realized gains may differ from their ultimate characterization for federal income tax purposes. These differences reflect the differing character of certain income items and net realized gains and losses for financial statement and tax purposes, and may result in reclassification among certain capital accounts on the financial statements.
As of May 31, 2010, the federal tax cost of investments and the components of distributable earnings on a tax-basis were as follows:
| | |
| Federal tax cost of investments | $298,993,418 |
| Gross tax appreciation of investments | $10,141,583 |
| Gross tax depreciation of investments | (15,829,172) |
| Net tax appreciation (depreciation) of investments | $ (5,687,589) |
| Other book-to-tax adjustments | $(183,232) |
| Net tax appreciation (depreciation) | $(5,870,821) |
| Undistributed exempt income | — |
| Accumulated capital losses | $(24,667,919) |
| Capital loss deferral | $(7,877,841) |
The difference between book-basis and tax-basis cost and unrealized appreciation (depreciation) is attributable primarily to the treatment of non-shareholder capital contributions and the realization for tax purposes of unrealized gain (loss) on certain futures contracts. Other book-to-tax adjustments are attributable primarily to the tax deferral of losses on straddle positions.
26
The accumulated capital losses listed on the previous page represent net capital loss carryovers that may be used to offset future realized capital gains for federal income tax purposes. Future capital loss carryover utilization in any given year may be subject to Internal Revenue Code limitations. The capital loss carryovers expire as follows:
| | | | | | |
| 2012 | 2013 | 2014 | 2015 | 2016 | 2017 | 2018 |
| $(145,918) | $(700,317) | — | — | $(4,227,228) | $(8,112,975) | $(11,481,481) |
The capital loss deferral listed on the previous page represents net capital losses incurred in the seven-month period ended May 31, 2010. The fund has elected to treat such losses as having been incurred in the following fiscal year for federal income tax purposes.
10. Corporate Event
As part of a long-standing estate and business succession plan established by ACC Co-Chairman James E. Stowers, Jr., the founder of American Century Investments, ACC Co-Chairman Richard W. Brown succeeded Mr. Stowers as trustee of a trust that holds a greater-than-25% voting interest in ACC, the parent corporation of each fund’s advisor. Under the 1940 Act, this is presumed to represent control of ACC even though it is less than a majority interest. The change of trustee may technically be considered a “change of control” of ACC and therefore also a change of control of each fund’s advisor even though there has been no change to their management and none is anticipated. The “change of control” resulted in the assignment of each fund’s investment advisory agreement. Under the 1940 Act, an assignment automatically terminated such agreement, making the approval of a new agreement ne cessary.
On February 18, 2010, the Board of Trustees approved interim investment advisory agreements under which each fund will be managed until new agreements are approved by fund shareholders. On April 1, 2010, the Board of Trustees approved new investment advisory agreements. The interim agreements and the new agreements are substantially identical to the terminated agreements (with the exception of different effective and termination dates) and will not result in changes in the management of American Century Investments, the funds, their investment objectives, fees or services provided. The new agreement for the fund was approved by shareholders at a Special Meeting of Shareholders on June 16, 2010. The new agreement went into effect on July 16, 2010. Management agreements for new share classes of the funds that were launched after February 16, 2010 did not terminate, have not been replaced by interim agreements, and d o not require approval of new agreements.
11. Other Tax Information (Unaudited)
The following information is provided pursuant to provisions of the Internal Revenue Code.
The fund designates $13,314,469 as exempt interest dividends for the fiscal year ended May 31, 2010.
27
| | | | | | |
| High-Yield Municipal | | | | | |
| |
| Investor Class | | | | | |
| For a Share Outstanding Throughout the Years Ended May 31 | | | |
| | | 2010 | 2009 | 2008 | 2007 | 2006 |
| Per-Share Data | | | | | |
| Net Asset Value, Beginning of Period | $7.91 | $9.63 | $10.68 | $10.50 | $10.50 |
| Income From Investment Operations | | | | | |
| Net Investment Income (Loss) | 0.45(1) | 0.50 | 0.52 | 0.51 | 0.50 |
| Net Realized and Unrealized Gain (Loss) | 0.92 | (1.72) | (1.05) | 0.18 | —(2) |
| Total From Investment Operations | 1.37 | (1.22) | (0.53) | 0.69 | 0.50 |
| Distributions | | | | | |
| From Net Investment Income | (0.46) | (0.50) | (0.52) | (0.51) | (0.50) |
| Net Asset Value, End of Period | $8.82 | $7.91 | $9.63 | $10.68 | $10.50 |
| |
| Total Return(3) | 17.68% | (12.70)% | (5.01)% | 6.70% | 4.91% |
| | | | | | |
| Ratios/Supplemental Data | | | | | |
| Ratio of Operating Expenses | | | | | |
| to Average Net Assets | 0.61% | 0.62% | 0.62% | 0.62% | 0.62% |
| Ratio of Net Investment Income (Loss) | | | | | |
| to Average Net Assets | 5.40% | 5.97% | 5.16% | 4.80% | 4.80% |
| Portfolio Turnover Rate | 25% | 44% | 69% | 36% | 16% |
| Net Assets, End of Period (in thousands) | $132,196 | $82,547 | $87,127 | $97,254 | $84,896 |
| (1) | Computed using average shares outstanding throughout the period. | | | | |
| (2) | Per-share amount was less than $0.005. | | | | | |
| (3) | Total return assumes reinvestment of net investment income and capital gains distributions, if any. Total returns for periods less than one year |
| | are not annualized. Total returns are calculated based on the net asset value of the last business day. The total return of the classes may not |
| | precisely reflect the class expense differences because of the impact of calculating the net asset values to two decimal places. If net asset |
| | values were calculated to three decimal places, the total return differences would more closely reflect the class expense differences. The |
| | calculation of net asset values to two decimal places is made in accordance with SEC guidelines and does not result in any gain or loss of value |
| | between one class and another. | | | | | |
See Notes to Financial Statements.
28
| | |
| High-Yield Municipal | |
| |
| Institutional Class | |
| For a Share Outstanding Throughout the Years Ended May 31 (except as noted) | |
| | | 2010(1) |
| Per-Share Data | |
| Net Asset Value, Beginning of Period | $8.66 |
| Income From Investment Operations | |
| Net Investment Income (Loss)(2) | 0.12 |
| Net Realized and Unrealized Gain (Loss) | 0.15 |
| Total From Investment Operations | 0.27 |
| Distributions | |
| From Net Investment Income | (0.11) |
| Net Asset Value, End of Period | $8.82 |
| |
| Total Return(3) | 3.13% |
| | |
| Ratios/Supplemental Data | |
| Ratio of Operating Expenses to Average Net Assets | 0.41%(4) |
| Ratio of Net Investment Income (Loss) to Average Net Assets | 5.50%(4) |
| Portfolio Turnover Rate | 25%(5) |
| Net Assets, End of Period (in thousands) | $26 |
| (1) | March 1, 2010 (commencement of sale) through May 31, 2010. | |
| (2) | Computed using average shares outstanding throughout the period. | |
| (3) | Total return assumes reinvestment of net investment income and capital gains distributions, if any. Total returns for periods less than one year |
| | are not annualized. Total returns are calculated based on the net asset value of the last business day. The total return of the classes may not |
| | precisely reflect the class expense differences because of the impact of calculating the net asset values to two decimal places. If net asset |
| | values were calculated to three decimal places, the total return differences would more closely reflect the class expense differences. The |
| | calculation of net asset values to two decimal places is made in accordance with SEC guidelines and does not result in any gain or loss of value |
| | between one class and another. | |
| (4) | Annualized. | |
| (5) | Portfolio turnover is calculated at the fund level. Percentage indicated was calculated for the year ended May 31, 2010. | |
See Notes to Financial Statements.
29
| | | | | | |
| High-Yield Municipal | | | | | |
| |
| A Class | | | | | |
| For a Share Outstanding Throughout the Years Ended May 31 | | | |
| | | 2010 | 2009 | 2008 | 2007 | 2006 |
| Per-Share Data | | | | | |
| Net Asset Value, Beginning of Period | $7.91 | $9.63 | $10.68 | $10.50 | $10.50 |
| Income From Investment Operations | | | | | |
| Net Investment Income (Loss) | 0.43(1) | 0.48 | 0.50 | 0.48 | 0.48 |
| Net Realized and Unrealized Gain (Loss) | 0.91 | (1.72) | (1.05) | 0.18 | —(2) |
| Total From Investment Operations | 1.34 | (1.24) | (0.55) | 0.66 | 0.48 |
| Distributions | | | | | |
| From Net Investment Income | (0.43) | (0.48) | (0.50) | (0.48) | (0.48) |
| Net Asset Value, End of Period | $8.82 | $7.91 | $9.63 | $10.68 | $10.50 |
| |
| Total Return(3) | 17.39% | (12.92)% | (5.25)% | 6.43% | 4.65% |
| | | | | | |
| Ratios/Supplemental Data | | | | | |
| Ratio of Operating Expenses | | | | | |
| to Average Net Assets | 0.86% | 0.87% | 0.87% | 0.87% | 0.87% |
| Ratio of Net Investment Income (Loss) | | | | | |
| to Average Net Assets | 5.15% | 5.72% | 4.91% | 4.55% | 4.55% |
| Portfolio Turnover Rate | 25% | 44% | 69% | 36% | 16% |
| Net Assets, End of Period (in thousands) | $130,266 | $111,293 | $140,037 | $158,622 | $129,681 |
| (1) | Computed using average shares outstanding throughout the period. | | | | |
| (2) | Per-share amount was less than $0.005. | | | | | |
| (3) | Total return assumes reinvestment of net investment income and capital gains distributions, if any, and does not reflect applicable sales charges. |
| | Total returns for periods less than one year are not annualized. Total returns are calculated based on the net asset value of the last business day. |
| | The total return of the classes may not precisely reflect the class expense differences because of the impact of calculating the net asset values |
| | to two decimal places. If net asset values were calculated to three decimal places, the total return differences would more closely reflect the |
| | class expense differences. The calculation of net asset values to two decimal places is made in accordance with SEC guidelines and does not |
| | result in any gain or loss of value between one class and another. | | | | |
See Notes to Financial Statements.
30
| | | | | | |
| High-Yield Municipal | | | | | |
| |
| B Class | | | | | |
| For a Share Outstanding Throughout the Years Ended May 31 | | | |
| | | 2010 | 2009 | 2008 | 2007 | 2006 |
| Per-Share Data | | | | | |
| Net Asset Value, Beginning of Period | $7.91 | $9.63 | $10.68 | $10.50 | $10.50 |
| Income From Investment Operations | | | | | |
| Net Investment Income (Loss) | 0.37(1) | 0.42 | 0.42 | 0.40 | 0.40 |
| Net Realized and Unrealized Gain (Loss) | 0.91 | (1.72) | (1.05) | 0.18 | —(2) |
| Total From Investment Operations | 1.28 | (1.30) | (0.63) | 0.58 | 0.40 |
| Distributions | | | | | |
| From Net Investment Income | (0.37) | (0.42) | (0.42) | (0.40) | (0.40) |
| Net Asset Value, End of Period | $8.82 | $7.91 | $9.63 | $10.68 | $10.50 |
| |
| Total Return(3) | 16.52% | (13.58)% | (5.96)% | 5.64% | 3.87% |
| | | | | | |
| Ratios/Supplemental Data | | | | | |
| Ratio of Operating Expenses | | | | | |
| to Average Net Assets | 1.61% | 1.62% | 1.62% | 1.62% | 1.62% |
| Ratio of Net Investment Income (Loss) | | | | | |
| to Average Net Assets | 4.40% | 4.97% | 4.16% | 3.80% | 3.80% |
| Portfolio Turnover Rate | 25% | 44% | 69% | 36% | 16% |
| Net Assets, End of Period (in thousands) | $2,638 | $2,777 | $3,805 | $4,790 | $4,468 |
| (1) | Computed using average shares outstanding throughout the period. | | | | |
| (2) | Per-share amount was less than $0.005. | | | | | |
| (3) | Total return assumes reinvestment of net investment income and capital gains distributions, if any, and does not reflect applicable sales charges. |
| | Total returns for periods less than one year are not annualized. Total returns are calculated based on the net asset value of the last business day. |
| | The total return of the classes may not precisely reflect the class expense differences because of the impact of calculating the net asset values |
| | to two decimal places. If net asset values were calculated to three decimal places, the total return differences would more closely reflect the |
| | class expense differences. The calculation of net asset values to two decimal places is made in accordance with SEC guidelines and does not |
| | result in any gain or loss of value between one class and another. | | | | |
See Notes to Financial Statements.
31
| | | | | | |
| High-Yield Municipal | | | | | |
| |
| C Class | | | | | |
| For a Share Outstanding Throughout the Years Ended May 31 | | | |
| | | 2010 | 2009 | 2008 | 2007 | 2006 |
| Per-Share Data | | | | | |
| Net Asset Value, Beginning of Period | $7.91 | $9.63 | $10.68 | $10.50 | $10.50 |
| Income From Investment Operations | | | | | |
| Net Investment Income (Loss) | 0.37(1) | 0.41 | 0.42 | 0.40 | 0.40 |
| Net Realized and Unrealized Gain (Loss) | 0.90 | (1.72) | (1.05) | 0.18 | —(2) |
| Total From Investment Operations | 1.27 | (1.31) | (0.63) | 0.58 | 0.40 |
| Distributions | | | | | |
| From Net Investment Income | (0.37) | (0.41) | (0.42) | (0.40) | (0.40) |
| Net Asset Value, End of Period | $8.81 | $7.91 | $9.63 | $10.68 | $10.50 |
| |
| Total Return(3) | 16.39% | (13.58)% | (5.96)% | 5.64% | 3.86% |
| | | | | | |
| Ratios/Supplemental Data | | | | | |
| Ratio of Operating Expenses | | | | | |
| to Average Net Assets | 1.61% | 1.62% | 1.62% | 1.62% | 1.62% |
| Ratio of Net Investment Income (Loss) | | | | | |
| to Average Net Assets | 4.40% | 4.97% | 4.16% | 3.80% | 3.80% |
| Portfolio Turnover Rate | 25% | 44% | 69% | 36% | 16% |
| Net Assets, End of Period (in thousands) | $29,313 | $25,176 | $34,072 | $38,287 | $29,862 |
| (1) | Computed using average shares outstanding throughout the period. | | | | |
| (2) | Per-share amount was less than $0.005. | | | | | |
| (3) | Total return assumes reinvestment of net investment income and capital gains distributions, if any, and does not reflect applicable sales charges. |
| | Total returns for periods less than one year are not annualized. Total returns are calculated based on the net asset value of the last business day. |
| | The total return of the classes may not precisely reflect the class expense differences because of the impact of calculating the net asset values |
| | to two decimal places. If net asset values were calculated to three decimal places, the total return differences would more closely reflect the |
| | class expense differences. The calculation of net asset values to two decimal places is made in accordance with SEC guidelines and does not |
| | result in any gain or loss of value between one class and another. | | | | |
See Notes to Financial Statements.
32
|
| Report of Independent Registered Public Accounting Firm |
To the Trustees of the American Century Municipal Trust
and Shareholders of the High-Yield Municipal Fund:
In our opinion, the accompanying statement of assets and liabilities, including the schedule of investments, and the related statements of operations and of changes in net assets and the financial highlights present fairly, in all material respects, the financial position of the High-Yield Municipal Fund (one of the five funds comprising the American Century Municipal Trust, hereafter referred to as the “Fund”) at May 31, 2010, the results of its operations for the year then ended, the changes in its net assets for each of the two years in the period then ended and the financial highlights for each of the periods presented, in conformity with accounting principles generally accepted in the United States of America. These financial statements and financial highlights (hereafter referred to as “financial statements”) are the responsibility of the Fund’s management; our responsibility is to e xpress an opinion on these financial statements based on our audits. We conducted our audits of these financial statements in accordance with the standards of the Public Company Accounting Oversight Board (United States). Those standards require that we plan and perform the audit to obtain reasonable assurance about whether the financial statements are free of material misstatement. An audit includes examining, on a test basis, evidence supporting the amounts and disclosures in the financial statements, assessing the accounting principles used and significant estimates made by management, and evaluating the overall financial statement presentation. We believe that our audits, which included confirmation of securities at May 31, 2010 by correspondence with the custodian and brokers, provide a reasonable basis for our opinion.
PricewaterhouseCoopers LLP
Kansas City, Missouri
July 22, 2010
33
The Board of Trustees
The individuals listed below serve as trustees of the fund. Each trustee will continue to serve in this capacity until death, retirement, resignation or removal from office. The mandatory retirement age for trustees who are not “interested persons,” as that term is defined in the Investment Company Act (independent trustees), is 73. However, the mandatory retirement age may be extended for a period not to exceed two years with the approval of the remaining independent trustees.
Mr. Thomas is the only trustee who is an “interested person” because he currently serves as President and Chief Executive Officer of American Century Companies, Inc. (ACC), the parent company of American Century Investment Management, Inc. (ACIM or the advisor).
The other trustees (more than three-fourths of the total number) are independent; that is, they have never been employees, directors or officers of, and have no financial interest in, ACC or any of its wholly owned, direct or indirect, subsidiaries, including ACIM, American Century Investment Services, Inc. (ACIS) and American Century Services, LLC (ACS). The trustees serve in this capacity for eight (in the case of Mr. Thomas, 15) registered investment companies in the American Century Investments family of funds.
The following presents additional information about the trustees. The mailing address for each trustee other than Mr. Thomas is 1665 Charleston Road, Mountain View, California 94043. The mailing address for Mr. Thomas is 4500 Main Street, Kansas City, Missouri 64111.
Independent Trustees
John Freidenrich
Year of Birth: 1937
Position(s) with the Fund: Trustee
Length of Time Served: Since 2005
Principal Occupation(s) During the Past Five Years: Founder, Member and Manager, Regis
Management Company, LLC (investment management firm) (April 2004 to present)
Number of Funds in Fund Complex Overseen by Trustee: 41
Other Directorships Held by Trustee: None
Education/Other Professional Experience: AB in Economics, Stanford University; LLB,
Stanford Law School; formerly, partner and founder, Ware and Freidenrich Law
Firm and Bay Partners; formerly, President, Board of Trustees, Stanford University
Ronald J. Gilson
Year of Birth: 1946
Position(s) with the Fund: Trustee and Chairman of the Board
Length of Time Served: Since 1995
Principal Occupation(s) During the Past Five Years: Charles J. Meyers Professor of Law and
Business, Stanford Law School (1979 to present); Marc and Eva Stern Professor of
Law and Business, Columbia University School of Law (1992 to present)
Number of Funds in Fund Complex Overseen by Trustee: 41
Other Directorships Held by Trustee: None
Education/Other Professional Experience: BA, Washington University; JD, Yale Law School;
formerly, attorney, Steinhart, Goldberg, Feigenbaum & Ladar
34
Frederick L. A. Grauer
Year of Birth: 1946
Position(s) with the Fund: Trustee
Length of Time Served: Since 2008
Principal Occupation(s) During the Past Five Years: Senior Advisor, BlackRock, Inc. (investment
management firm) (2010 to present); Senior Advisor, Barclays Global Investors
(investment management firm) (2003 to 2009)
Number of Funds in Fund Complex Overseen by Trustee: 41
Other Directorships Held by Trustee: None
Education/Other Professional Experience: BA in Economics, University of British Columbia;
MA in Economics, University of Chicago; PhD in Business, Stanford University;
formerly, Executive Chairman, Barclays Global Investors; Chairman and Chief
Executive Officer, Wells Fargo Nikko Investment Advisors; and Vice President,
Merrill Lynch Capital Markets Group; formerly, Director, New York Stock Exchange,
Chicago Mercantile Exchange and Columbia University; formerly, faculty member,
Graduate School of Business, Columbia University and Alfred P. Sloan School of
Management, Massachusetts Institute of Technology
Peter F. Pervere
Year of Birth: 1947
Position(s) with the Fund: Trustee
Length of Time Served: Since 2007
Principal Occupation(s) During the Past Five Years: Retired
Number of Funds in Fund Complex Overseen by Trustee: 41
Other Directorships Held by Trustee: Intraware, Inc. (2003 to 2009); Digital Impact, Inc. (2003
to 2005)
Education/Other Professional Experience: BA in History, Stanford University; CPA; formerly,
Vice President and Chief Financial Officer, Commerce One, Inc. (software and
services provider); formerly, Vice President and Corporate Controller, Sybase, Inc.;
formerly with accounting firm of Arthur Young & Co.
Myron S. Scholes
Year of Birth: 1941
Position(s) with the Fund: Trustee
Length of Time Served: Since 1980
Principal Occupation(s) During the Past Five Years: Chairman, Platinum Grove Asset
Management, L.P. (asset manager) (1999 to 2009); Frank E. Buck Professor of
Finance-Emeritus, Stanford Graduate School of Business (1996 to present)
Number of Funds in Fund Complex Overseen by Trustee: 41
Other Directorships Held by Trustee: Dimensional Fund Advisors (investment advisor); CME
Group, Inc. (futures and options exchange)
Education/Other Professional Experience: BA in Economics, McMaster University (Ontario);
MBA and PhD, University of Chicago; formerly, Senior Research Fellow at the
Hoover Institute; formerly, Edward Eagle Brown Professor of Finance, University of
Chicago; recipient of the Alfred Nobel Memorial Prize in Economic Sciences
35
John B. Shoven
Year of Birth: 1947
Position(s) with the Fund: Trustee
Length of Time Served: Since 2002
Principal Occupation(s) During the Past Five Years: Professor of Economics, Stanford University
(1973 to present)
Number of Funds in Fund Complex Overseen by Trustee: 41
Other Directorships Held by Trustee: Cadence Design Systems; Exponent; Financial Engines;
PalmSource, Inc. (2002 to 2005); Watson Wyatt Worldwide (2002 to 2006)
Education/Other Professional Experience: BA in Physics, University of California; PhD in
Economics, Yale University; Director of the Stanford Institute for Economic Policy
Research (1999 to present); formerly, Chair of Economics and Dean of Humanities
and Sciences, Stanford University
Interested Trustee
Jonathan S. Thomas
Year of Birth: 1963
Position(s) with the Fund: Trustee and President
Length of Time Served: Since 2007
Principal Occupation(s) During the Past Five Years: President and Chief Executive Officer,
ACC (March 2007 to present); Chief Administrative Officer, ACC (February 2006 to
February 2007); Executive Vice President, ACC (November 2005 to February 2007).
Also serves as: Chief Executive Officer and Manager, ACS; Executive Vice President,
ACIM; Director, ACC, ACIM and other ACC subsidiaries. Global Chief Operating
Officer and Managing Director, Morgan Stanley (investment management) (March
2000 to November 2005)
Number of Funds in Fund Complex Overseen by Trustee: 104
Other Directorships Held by Trustee: None
Education/Other Professional Experience: BA in Economics, University of Massachusetts;
MBA, Boston College; formerly held senior leadership roles with Fidelity
Investments, Boston Financial Services and Bank of America; serves on the Board of
Governors of the Investment Company Institute
36
Officers
The following table presents certain information about the executive officers of the fund. Each officer serves as an officer for each of the 15 investment companies in the American Century family of funds, unless otherwise noted. No officer is compensated for his or her service as an officer of the fund. The listed officers are interested persons of the fund and are appointed or re-appointed on an annual basis. The mailing address for each of the officers listed below is 4500 Main Street, Kansas City, Missouri 64111.
| | |
| Name | Offices with | |
| (Year of Birth) | the Fund | Principal Occupation(s) During the Past Five Years |
| Jonathan S. | Trustee and | President and Chief Executive Officer, ACC (March 2007 to present); |
| Thomas | President | Chief Administrative Officer, ACC (February 2006 to March 2007); |
| (1963) | since 2007 | Executive Vice President, ACC (November 2005 to February 2007). Also |
| | | serves as: Chief Executive Officer and Manager, ACS; Executive Vice |
| | | President, ACIM; Director, ACC, ACIM and other ACC subsidiaries. Global |
| | | Chief Operating Officer and Managing Director, Morgan Stanley (March |
| | | 2000 to November 2005) |
| Barry Fink | Executive | Chief Operating Officer and Executive Vice President, ACC (September 2007 |
| (1955) | Vice President | to present); President, ACS (October 2007 to present); Managing Director, |
| | since 2007 | Morgan Stanley (2000 to 2007); Global General Counsel, Morgan Stanley |
| | | (2000 to 2006). Also serves as: Manager, ACS, and Director, ACC and |
| | | certain ACC subsidiaries |
| Maryanne L. | Chief Compliance | Chief Compliance Officer, American Century funds, ACIM and ACS (August |
| Roepke | Officer since 2006 | 2006 to present); Assistant Treasurer, ACC (January 1995 to August 2006); |
| (1956) | and Senior | and Treasurer and Chief Financial Officer, various American Century funds |
| | Vice President | (July 2000 to August 2006). Also serves as: Senior Vice President, ACS |
| | since 2000 | |
| Charles A. | General Counsel | Attorney, ACC (February 1994 to present); Vice President, ACC (November |
| Etherington | since 2007 and | 2005 to present); General Counsel, ACC (March 2007 to present); Also |
| (1957) | Senior Vice | serves as General Counsel, ACIM, ACS, ACIS and other ACC subsidiaries; |
| | President | and Senior Vice President, ACIM and ACS |
| | since 2006 | |
| Robert J. Leach | Vice President, | Vice President, ACS (February 2000 to present); and Controller, various |
| (1966) | Treasurer and | American Century funds (1997 to September 2006) |
| | Chief Financial | |
| | Officer since 2006 | |
| David H. Reinmiller | Vice President | Attorney, ACC (January 1994 to present); Associate General Counsel, ACC |
| (1963) | since 2001 | (January 2001 to present); Chief Compliance Officer, American Century |
| | | funds and ACIM (January 2001 to February 2005). Also serves as: Vice |
| | | President, ACIM and ACS |
| Ward D. Stauffer | Secretary | Attorney, ACC (June 2003 to Present) |
| (1960) | since 2005 | |
The SAI has additional information about the fund’s trustees and is available without charge, upon request, by calling 1-800-345-2021.
37
|
| Board Approval of Management Agreements |
American Century Investment Management, Inc. (“ACIM” or the “Advisor”) currently serves as investment advisor to the Fund under an interim management agreement (the “Interim Management Agreement”) between the Advisor and the Fund approved by the Fund’s Board of Trustees (the “Board”). The Advisor previously served as investment advisor to the Fund pursuant to a management agreement (the “Prior Management Agreement”) that terminated in accordance with its terms on February 16, 2010, as a result of a change of control of the Advisor’s parent company, American Century Companies, Inc. (“ACC”). The change in control occurred as the result of a change in the trustee of a trust created by James E. Stowers, Jr., the founder of American Century Investments that holds shares representing a significant interest in ACC stock. Mr. Stowers previously served a s the trustee of the trust. On February 16, 2010, Richard W. Brown, Co-Chairman of ACC with Mr. Stowers, became the trustee in accordance with the terms of the trust and Mr. Stowers’ long-standing estate and succession plan.
On February 18, 2010, the Board approved the Interim Management Agreement in accordance with Rule 15a-4 under the Investment Company Act to ensure continued management of the Fund by the Advisor after the termination of the Prior Management Agreement and until shareholder approval of a new management agreement (the “Proposed Management Agreement”) as required under the Act. The Board approved the Proposed Management Agreement and recommended its approval to shareholders. Fund shareholders approved the Proposed Management Agreement at a meeting on June 16, 2010.*
The Interim Management Agreement and the Proposed Management Agreement are substantially identical to the Prior Management Agreement except for their effective dates and the termination provisions of the Interim Management Agreement. Under the Interim and Proposed Management Agreements, the Advisor will provide the same services to the Fund and receive the same compensation rate as under the Prior Management Agreement.
Basis for Board Approval of Interim Management Agreement
In considering the approval of the Interim Management Agreement, Rule 15a-4 requires the Board to approve the contract within ten business days of the termination of the prior agreement and to determine that the compensation to be received under the interim agreement is no greater than would have been received under the prior agreement. In connection with the approval, the Board noted that it oversees on a continuous basis and evaluates at its quarterly meetings, directly and through the committees of the Board, the nature and quality of significant services provided by the Advisor, the investment performance of the Fund, shareholder services, audit and compliance functions and a variety of other matters relating to the Fund’s operations.
|
| *Management agreements for new share classes of the Fund launched after February 16, 2010, did not terminate, have not been replaced by Interim |
| Management Agreements, and do not require Board or shareholder approval at this time. |
38
In evaluating the Interim Management Agreement, the Board, assisted by the advice of its independent legal counsel, considered a number of factors in addition to those required by the rule with no one factor being determinative to its analysis. Among the factors considered by the Board were the circumstances and effect of the change of control, the fact that the Advisor will provide the same services and receive the same compensation rate as under the Prior Management Agreements, and that the change of control did not result in a change of the personnel managing the Fund. Upon completion of its analysis, the Board approved the Interim Management Agreement, determining that the continued management of the Fund by the Advisor was in the best interests of the Fund and Fund shareholders.
Basis for Board Approval of Proposed Management Agreement
At a meeting held on April 1, 2010, after considering all information presented, the Board approved, and determined to recommend that shareholders approve, the Proposed Management Agreement. In connection with that approval, the Board requested and reviewed extensive data and information compiled by the Advisor and certain independent providers of evaluation data concerning the Fund and services provided to the Fund by the Advisor. The Board oversees on a continuous basis and evaluates at its quarterly meetings, directly and through the committees of the Board, the nature and quality of significant services provided by the Advisor, the investment performance of the Fund, shareholder services, audit and compliance functions and a variety of other matters relating to the Fund’s operations. The information considered and the discussions held at the meetings included, but were not limited to:
• the nature, extent and quality of investment management, shareholder services and other services provided to the Fund;
• the wide range of programs and services the Advisor provides to the Fund and its shareholders on a routine and non-routine basis;
• the compliance policies, procedures, and regulatory experience of the Advisor;
• data comparing the cost of owning the Fund to the cost of owning similar funds;
• the fact that there will be no changes to the fees, services, or personnel who provide such services as compared to the Prior Management Agreement;
• data comparing the Fund’s performance to appropriate benchmarks and/ or a peer group of other mutual funds with similar investment objectives and strategies;
• financial data showing the profitability of the Fund to the Advisor and the overall profitability of the Advisor;
• data comparing services provided and charges to the Fund with those for other non-fund investment management clients of the Advisor; and
39
• consideration of collateral or “fall-out” benefits derived by the Advisor from the management of the Fund and potential sharing of economies of scale in connection with the management of the Fund.
The Board also considered whether there was any reason for not continuing the existing arrangement with the Advisor. In particular, the Board recognized that shareholders may have invested in the Fund on the strength of the Advisor’s industry standing and reputation and in the expectation that the Advisor will have a continuing role in providing advisory services to the Fund.
The Board considered all of the information provided by the Advisor, the independent data providers, and the Board’s independent legal counsel, and evaluated such information for the Fund. The Board did not identify any single factor as being all-important or controlling, and each Board member may have attributed different levels of importance to different factors. In deciding to approve the Proposed Management Agreement under the terms ultimately determined by the Board to be appropriate, the Board based its decision on a number of factors, including the following:
Nature, Extent and Quality of Services – Generally. Under the Proposed Management Agreement, the Advisor is responsible for providing or arranging for all services necessary for the operation of the Fund. The Board noted that under the Proposed Management Agreement, the Advisor provides or arranges at its own expense a wide variety of services including:
• constructing and designing the Fund
• portfolio research and security selection
• initial capitalization/funding
• securities trading
• Fund administration
• custody of Fund assets
• daily valuation of the Fund’s portfolio
• shareholder servicing and transfer agency, including shareholder confir-
mations, recordkeeping and communications
• legal services
• regulatory and portfolio compliance
• financial reporting
• marketing and distribution
40
The Board noted that many of these services have expanded over time both in terms of quantity and complexity in response to shareholder demands, competition in the industry, changing distribution channels and the changing regulatory environment.
Investment Management Services. The investment management services provided to the Fund are complex and provide Fund shareholders access to professional money management, instant diversification of their investments within an asset class, the opportunity to easily diversify among asset classes, and liquidity. As a part of its general oversight and in evaluating investment performance, the Board expects the Advisor to manage the Fund in accordance with its investment objectives and approved strategies. In providing these services, the Advisor utilizes teams of investment professionals who require extensive information technology, research, training, compliance and other systems to conduct their business. The Board, directly and through its Portfolio Committee, regularly reviews investment performance information for the Fund, t ogether with comparative information for appropriate benchmarks and/or peer groups of similarly-managed funds, over different time horizons. If performance concerns are identified, the underperforming Fund receives special reviews until performance improves, during which time the Board discusses with the Advisor the reasons for such underperformance and any efforts being undertaken to improve performance.
Shareholder and Other Services. Under the Proposed Management Agreement, the Advisor will also provide the Fund with a comprehensive package of transfer agency, shareholder, and other services. The Board, directly and through the various committees of the Board, regularly reviews reports and evaluations of such services. These reports include, but are not limited to, information regarding the operational efficiency and accuracy of the shareholder and transfer agency services provided, staffing levels, shareholder satisfaction (as measured by external as well as internal sources), technology support, new products and services offered to Fund shareholders, securities trading activities, portfolio valuation services, auditing services, and legal and operational compliance activities. Certain aspects of shareholder and transfer ag ency service level efficiency and the quality of securities trading activities are measured by independent third party providers and are presented in comparison to other fund groups not managed by the Advisor.
Costs of Services Provided and Profitability. The Advisor provided detailed information concerning its cost of providing various services to the Fund, its profitability in managing the Fund, its overall profitability, and its financial condition. The Board reviewed with the Advisor the methodology used to prepare this financial information. The Board has also reviewed with the Advisor its methodology for compensating the investment professionals that provide services to the Fund as well as compensation to the five highest paid personnel of the Advisor. This financial information regarding the Advisor is considered in order to evaluate the Advisor’s financial condition, its ability to continue to provide services under the Proposed Management Agreement, and the reasonableness of the proposed management fees.
41
Ethics. The Board generally considers the Advisor’s commitment to providing quality services to shareholders and to conducting its business ethically. It noted that the Advisor’s practices generally meet or exceed industry best practices.
Economies of Scale. The Board also reviewed information provided by the Advisor regarding the possible existence of economies of scale in connection with the management of the Fund. The Board concluded that economies of scale are difficult to measure and predict with precision, especially on a fund-by-fund basis. The analysis of economies of scale is further complicated by the additional services and content provided by the Advisor and its reinvestment in its ability to provide and expand those services. Accordingly, the Board seeks to evaluate economies of scale by reviewing information, such as year-over-year profitability of the Advisor generally, the profitability of its management of the Fund specifically, and the expenses incurred by the Advisor in providing various functions to the Fund. The Board believes the Advisor i s appropriately sharing economies of scale through its competitive fee structure, offering competitive fees from fund inception, fee breakpoints as the fund complex and the Fund increases in size, and through reinvestment in its business to provide shareholders additional services and enhancements to existing services. In particular, separate breakpoint schedules based on the size of the entire fund complex and on the size of the Fund reflect the complexity of assessing economies of scale.
Comparison to Fees of Funds not Managed by the Advisor. Both the Prior and Proposed Management Agreements provide that the Fund pays the Advisor a single, all-inclusive (or unified) management fee for providing all services necessary for the management and operation of the Fund, other than brokerage expenses, taxes, interest, extraordinary expenses, and the fees and expenses of the Fund’s Independent Trustees (including their independent legal counsel) and expenses incurred in connection with the provision of shareholder services and distribution services under a plan adopted pursuant to Rule 12b-1 under the 1940 Act. Under the unified fee structure, the Advisor is responsible for providing all investment advisory, custody, audit, administrative, compliance, recordkeeping, marketing and shareholder services, or arranging and supervising third parties that provide such services. By contrast, most other funds are charged a variety of fees, including an investment advisory fee, a transfer agency fee, an administrative fee, distribution charges and other expenses. Other than their investment advisory fees and any applicable Rule 12b-1 distribution fees, the components of the total fees charged by these other funds may be increased without shareholder approval. The Board believes the unified fee structure is a benefit to Fund shareholders because it clearly discloses to shareholders the cost of owning Fund shares, and, since the unified fee cannot be increased without a vote of Fund shareholders, it shifts to the Advisor the risk of increased costs of operating the Fund and provides a direct incentive to minimize administrative inefficiencies. Part of the Board’s analysis of fee levels involves reviewing certain evaluative data
42
compiled by an independent provider comparing the Fund’s unified fee to the total expense ratios of similar funds not managed by the Advisor. The Board concluded that the management fee to be paid by the Fund to the Advisor under the Proposed Management Agreement is reasonable in light of the services to be provided to the Fund.
Comparison to Fees and Services Provided to Other Clients of the Advisor. The Board also requested and received information from the Advisor concerning the nature and extent of the services, fees, and profitability of its advisory services to advisory clients other than the Fund. They observed that these varying types of client accounts require different services and involve different regulatory and entrepreneurial risks than the management of the Fund. The Board analyzed this information and concluded that the fees charged and services provided to the Fund were reasonable by comparison.
Collateral or “Fall-Out” Benefits Derived by the Advisor. The Board considered the existence of collateral benefits the Advisor may receive as a result of its relationship with the Fund. The Board concluded that the Advisor’s primary business is managing mutual funds and it generally does not use Fund or shareholder information to generate profits in other lines of business, and therefore does not derive any significant collateral benefits from them. The Board noted that the Advisor receives proprietary research from broker-dealers that execute Fund portfolio transactions and concluded that this research is likely to benefit Fund shareholders. The Board also determined that the Advisor is able to provide investment management services to certain clients other than the Fund, at least in part, due to its existing infrastructure built to serve the fund complex. The Board concluded, however, that the assets of those other clients are not material to the analysis and, in any event, are included with the assets of the Fund to determine breakpoints in the Fund’s fee schedule, provided they are managed using the same investment team and strategy.
Conclusion of the Board. As a result of this process, the Board, in the absence of particular circumstances and assisted by the advice of its independent legal counsel, taking into account all of the factors discussed above and the information provided by the Advisor and others, concluded that the Proposed Management Agreement be approved and recommended its approval to Fund shareholders.
43
Proxy Voting Guidelines
American Century Investment Management, Inc., the fund’s investment advisor, is responsible for exercising the voting rights associated with the securities purchased and/or held by the fund. A description of the policies and procedures the advisor uses in fulfilling this responsibility is available without charge, upon request, by calling 1-800-345-2021. It is also available on American Century Investments’ website at americancentury.com and on the Securities and Exchange Commission’s website at sec.gov. Information regarding how the investment advisor voted proxies relating to portfolio securities during the most recent 12-month period ended June 30 is available on the “About Us” page at americancentury.com. It is also available at sec.gov.
Quarterly Portfolio Disclosure
The fund files its complete schedule of portfolio holdings with the Securities and Exchange Commission (SEC) for the first and third quarters of each fiscal year on Form N-Q. The fund’s Forms N-Q are available on the SEC’s website at sec.gov, and may be reviewed and copied at the SEC’s Public Reference Room in Washington, DC. Information on the operation of the Public Reference Room may be obtained by calling 1-800-SEC-0330. The fund also makes its complete schedule of portfolio holdings for the most recent quarter of its fiscal year available on its website at americancentury.com and, upon request, by calling 1-800-345-2021.
44
The following indices are used to illustrate investment market, sector, or style performance or to serve as fund performance comparisons. They are not investment products available for purchase.
The Barclays Capital 5-Year General Obligation (GO) Bond Index is composed of investment-grade U.S. municipal securities, with maturities of four to six years, that are general obligations of a state or local government.
The Barclays Capital Long-Term Municipal Bond Index is composed of those securities included in the Barclays Capital Municipal Bond Index that have maturities greater than 22 years.
The Barclays Capital Municipal Bond Index is a market value-weighted index designed for the long-term tax-exempt bond market.
The Barclays Capital Non-Investment-Grade Municipal Bond Index is composed of non-investment grade U.S. municipal securities with a remaining maturity of one year or more.
The Barclays Capital U.S. Aggregate Index represents securities that are taxable, registered with the Securities and Exchange Commission, and U.S. dollar-denominated. The index covers the U.S. investment-grade fixed-rate bond market, with index components for government and corporate securities, mortgage pass-through securities, and asset-backed securities.
The Barclays Capital U.S. Treasury Index is composed of those securities included in the Barclays Capital U.S. Aggregate Index that are public obligations of the U.S. Treasury with a remaining maturity of one year or more.
45
46
47
48

| |
| |
| Contact Us | |
| americancentury.com | |
| Automated Information Line | 1-800-345-8765 |
| Investor Services Representative | 1-800-345-2021 or |
| | 816-531-5575 |
| Investors Using Advisors | 1-800-378-9878 |
| Business, Not-For-Profit, Employer-Sponsored | |
| Retirement Plans | 1-800-345-3533 |
| Banks and Trust Companies, Broker-Dealers, | |
| Financial Professionals, Insurance Companies | 1-800-345-6488 |
| Telecommunications Device for the Deaf | 1-800-634-4113 |
| American Century Municipal Trust | |
| Investment Advisor: | |
| American Century Investment Management, Inc. | |
| Kansas City, Missouri | |
This report and the statements it contains are submitted for the general
information of our shareholders. The report is not authorized for distribution to
prospective investors unless preceded or accompanied by an effective prospectus.
American Century Investment Services, Inc., Distributor
©2010 American Century Proprietary Holdings, Inc. All rights reserved.
1007
CL-ANN-68681
|
| Annual Report |
| May 31, 2010 |

|
| American Century Investments® |
Tax-Free Bond Fund
| |
| President’s Letter | 2 |
| Market Perspective | 3 |
| U.S. Fixed-Income Total Returns | 3 |
| |
| Tax-Free Bond | |
| |
| Performance | 4 |
| Portfolio Commentary | 6 |
| Portfolio at a Glance | 8 |
| Yields | 8 |
| Top Five States & Territories. | 8 |
| |
| Shareholder Fee Example | 9 |
| |
| Financial Statements | |
| |
| Schedule of Investments | 11 |
| Statement of Assets and Liabilities | 35 |
| Statement of Operations | 36 |
| Statement of Changes in Net Assets | 37 |
| Notes to Financial Statements | 38 |
| Financial Highlights | 44 |
| Report of Independent Registered Public Accounting Firm | 48 |
| |
| Other Information | |
| |
| Management | 49 |
| Board Approval of Management Agreements | 53 |
| Additional Information | 59 |
| Index Definitions | 60 |
Any opinions expressed in this report reflect those of the author as of the date of the report, and do not necessarily represent the opinions of American Century Investments or any other person in the American Century Investments organization. Any such opinions are subject to change at any time based upon market or other conditions and American Century Investments disclaims any responsibility to update such opinions. These opinions may not be relied upon as investment advice and, because investment decisions made by American Century Investments funds are based on numerous factors, may not be relied upon as an indication of trading intent on behalf of any American Century Investments fund. Security examples are used for representational purposes only and are not intended as recommendations to purchase or sell securities. Performance information for comparative indices and securities is provided to American Century Investments by third party vendors. To the best of American Century Investments’ knowledge, such information is accurate at the time of printing.
Dear Investor:
To learn more about the capital markets, your investment, and the portfolio management strategies American Century Investments provides, we encourage you to review this shareholder report for the financial reporting period ended May 31, 2010.
On the following pages, you will find investment performance and portfolio information, presented with the expert perspective and commentary of our portfolio management team. This report remains one of our most important vehicles for conveying the information you need about your investment performance, and about the market factors and strategies that affect fund returns. For additional information on the markets, we encourage you to visit the “Insights & News” tab at our Web site, americancentury.com, for updates and further expert commentary.
The top of our Web site’s home page also provides a link to “Our Story,” which, first and foremost, outlines our commitment—since 1958—to helping clients reach their financial goals. We believe strongly that we will only be successful when our clients are successful. That’s who we are.
Another important, unique facet of our story and who we are is “Profits with a Purpose,” which describes our bond with the Stowers Institute for Medical Research (SIMR). SIMR is a world-class biomedical organization—founded by our company founder James E. Stowers, Jr. and his wife Virginia—that is dedicated to researching the causes, treatment, and prevention of gene-based diseases, including cancer. Through American Century Investments’ private ownership structure, more than 40% of our profits support SIMR.
Mr. Stowers’ example of achieving financial success and using that platform to help humanity motivates our entire American Century Investments team. His story inspires us to help each of our clients achieve success. Thank you for sharing your financial journey with us.
Sincerely,

Jonathan Thomas
President and Chief Executive Officer
American Century Investments
2

By David MacEwen, Chief Investment Officer, Fixed Income
Economic and Market Rebound
The municipal bond market witnessed a wide dispersion of returns in the 12 months ended May 31, 2010 (see the accompanying table), which closely coincided with the rebound of the U.S. economy from the depths of the recession and credit crisis. This dramatic turnaround can be attributed to the government’s extraordinary monetary and fiscal stimulus policies taken in response to the financial crisis in late 2008. However, financial market volatility in May related to the European debt crisis led many to worry about a potential slowdown in U.S. growth. Despite a return to positive economic growth in the second half of 2009 and so far in 2010, the unemployment rate stood at 9.7% in May 2010, while the housing market and consumer debt levels remained concerns.
Municipal Market Review
Better economic and market conditions caused a reversal of the trading that colored the credit crisis, when the lowest-rated bonds performed worst and higher-quality bonds did best. For the 12 months ended in May, this reversal meant that high-yield (below-investment-grade) and long-term municipal bonds did better than high-quality and shorter-term securities. Similarly, credit-sensitive municipal bonds outperformed Treasury securities for the 12 months after lagging during the credit crisis.
In addition to better economic and market conditions, municipal bonds benefited from improving technical factors—the Build America Bonds program limited the supply of tax-exempt bonds. This federal program, designed to help ease municipal borrowing costs, meant many newly minted municipal bonds were instead issued in the taxable bond universe. Demand for municipal bonds was helped by attractive tax-equivalent yields and the outlook for higher marginal tax rates going forward.
And despite the continuing flood of negative press about budget challenges for states and local governments, we continue to believe that municipal defaults will be relatively rare, especially compared with corporate defaults. Indeed, during the reporting period, the major credit rating agencies revamped their ratings systems to better recognize the superior credit quality and vastly lower default risk of municipal securities relative to corporate-backed bonds.
| | | | |
| U.S. Fixed-Income Total Returns | | | | |
| For the 12 months ended May 31, 2010 | | | | |
| Barclays Capital Municipal Market Indices | | Barclays Capital U.S. Taxable Market Indices |
| Municipal Bond | 8.52% | | Aggregate Index | 8.42% |
| 5-Year General Obligation Bond | 6.15% | | Treasury Index | 4.50% |
| Long-Term Municipal Bond | 13.53% | | | |
| Non-Investment-Grade Municipal Bond | 21.01% | | | |
3
| | | | | | | |
| Tax-Free Bond | | | | | | |
| |
| Total Returns as of May 31, 2010 | | | | | |
| | | | | Average Annual Returns | |
| | | Ticker | | | | Since | Inception |
| | | Symbol | 1 year | 5 years | 10 years | Inception | Date |
| Investor Class | TWTIX | 7.48% | 4.31% | 5.20% | 5.34% | 3/2/87 |
| Barclays Capital 5-Year | | | | | | |
| GO Bond Index | — | 6.15% | 4.88% | 5.35% | 5.60%(1) | — |
| Average Return of Lipper’s | | | | | | |
| Intermediate Municipal | | | | | | |
| Debt Funds(2) | — | 7.04% | 3.71% | 4.76% | 5.46%(3) | — |
| Investor Class’s Lipper Ranking | — | | | | | — |
| as of May 31, 2010(2) | | 57 of 155 | 17 of 121 | 14 of 74 | 7 of 11 | |
| as of June 30, 2010(2) | | 65 of 150 | 17 of 118 | 15 of 73 | 7 of 11 | |
| Institutional Class | AXBIX | 7.69% | 4.52% | — | 4.27% | 4/15/03 |
| A Class | TWWOX | | | | | 3/1/10 |
| No sales charge* | | — | — | — | 1.35%(4) | |
| With sales charge* | | — | — | — | -3.21%(4) | |
| C Class | TWTCX | | | | | 3/1/10 |
| No sales charge* | | — | — | — | 1.07%(4) | |
| With sales charge* | | — | — | — | 0.07%(4) | |
| *Sales charges include initial sales charges and contingent deferred sales charges (CDSCs), as applicable. A Class shares have a |
| 4.50% maximum initial sales charge for fixed-income funds and may be subject to a maximum CDSC of 1.00%. C Class shares |
| redeemed within 12 months of purchase are subject to a maximum CDSC of 1.00%. The SEC requires that mutual funds provide |
| performance information net of maximum sales charges in all cases where charges could be applied. | | |
| |
| (1) | Since 2/28/87, the date nearest the Investor Class’s inception for which data are available. | | | |
| (2) | Data provided by Lipper Inc. — A Reuters Company. © 2010 Reuters. All rights reserved. Any copying, republication or redistribution of Lipper |
| | content, including by caching, framing or similar means, is expressly prohibited without the prior written consent of Lipper. Lipper shall not be |
| | liable for any errors or delays in the content, or for any actions taken in reliance thereon. | | | |
| | Lipper Fund Performance — Performance data is total return, and is preliminary and subject to revision. | | |
| | Lipper Rankings — Rankings are based only on the universe shown and are based on average annual total returns. This listing might not |
| | represent the complete universe of funds tracked by Lipper. | | | | |
| | The data contained herein has been obtained from company reports, financial reporting services, periodicals and other resources believed to be |
| | reliable. Although carefully verified, data on compilations is not guaranteed by Lipper and may be incomplete. No offer or solicitations to buy or |
| | sell any of the securities herein is being made by Lipper. | | | | | |
| (3) | Since 3/31/87, the date nearest the Investor Class’s inception for which data are available. | | | |
| (4) | Total returns for periods less than one year are not annualized. | | | | |
Data presented reflect past performance. Past performance is no guarantee of future results. Current performance may be higher or lower than the performance shown. Investment return and principal value will fluctuate, and redemption value may be more or less than original cost. To obtain performance data current to the most recent month end, please call 1-800-345-2021 or visit americancentury.com. As interest rates rise, bond values will decline. Investment income may be subject to certain state and local taxes and, depending on your tax status, the federal alternative minimum tax (AMT). Capital gains are not exempt from state and federal income tax.
Unless otherwise indicated, performance reflects Investor Class shares; performance for other share classes will vary due to differences in fee structure. For information about other share classes available, please consult the prospectus. Data assumes reinvestment of dividends and capital gains, and none of the charts reflect the deduction of taxes that a shareholder would pay on fund distributions or the redemption of fund shares. Returns for the index are provided for comparison. The fund’s total returns include operating expenses (such as transaction costs and management fees) that reduce returns, while the total returns of the index do not.
4
Tax-Free Bond
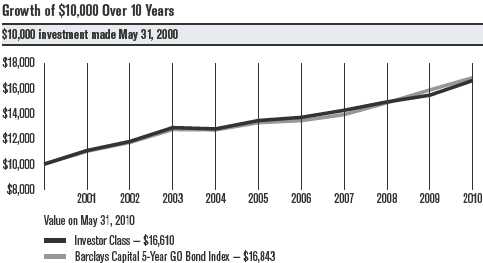
| | | |
| Total Annual Fund Operating Expenses | | |
| Investor Class | Institutional Class | A Class | C Class |
| 0.49% | 0.29% | 0.74% | 1.49% |
The total annual fund operating expenses shown is as stated in the fund’s prospectus current as of the date of this report. The prospectus may vary from the expense ratio shown elsewhere in this report because it is based on a different time period, includes acquired fund fees and expenses, and, if applicable, does not include fee waivers or expense reimbursements.
Data presented reflect past performance. Past performance is no guarantee of future results. Current performance may be higher or lower than the performance shown. Investment return and principal value will fluctuate, and redemption value may be more or less than original cost. To obtain performance data current to the most recent month end, please call 1-800-345-2021 or visit americancentury.com. As interest rates rise, bond values will decline. Investment income may be subject to certain state and local taxes and, depending on your tax status, the federal alternative minimum tax (AMT). Capital gains are not exempt from state and federal income tax.
Unless otherwise indicated, performance reflects Investor Class shares; performance for other share classes will vary due to differences in fee structure. For information about other share classes available, please consult the prospectus. Data assumes reinvestment of dividends and capital gains, and none of the charts reflect the deduction of taxes that a shareholder would pay on fund distributions or the redemption of fund shares. Returns for the index are provided for comparison. The fund’s total returns include operating expenses (such as transaction costs and management fees) that reduce returns, while the total returns of the index do not.
5
Tax-Free Bond
Portfolio Managers: Alan Kruss, Joseph Gotelli, and Steven Permut
Performance Summary
Tax-Free Bond returned 7.48%* for the 12 months ended May 31, 2010. By comparison, the Barclays Capital 5-Year GO Bond Index returned 6.15%. The average return of the intermediate municipal debt funds tracked by Lipper Inc. was 7.04% for the same period. The portfolio’s average annual returns also exceeded those of its Lipper group average for the five- and 10-year periods ended in May (see page 4).
The portfolio’s absolute returns reflect the positive performance of municipal bonds during the reporting period, despite budget concerns for many municipalities (see the Market Perspective on page 3). Some of the key contributions to the portfolio’s return came from our credit and sector allocation decisions. Our yield curve positioning and municipal/Treasury ratio trades also helped performance.
Credit, Sector Positioning Helped
In a period when lower-rated bonds outperformed, it helped to favor what we considered attractively valued bonds rated A and BBB. We worked hard during the fiscal year to add securities we thought were trading out of line with their actual risks.
In terms of sector allocation, we tended to hold underweight positions in tax-backed bonds (such as state and local general obligation (GO) debt) in favor of revenue bonds (such as utilities, education, and health care debt). This positioning helped because revenue bonds—particularly our health care holdings—outperformed GO securities. However, an underweight to corporate-backed, tobacco, and industrial development revenue bonds detracted from performance.
Other Trades
During the second half of 2009, we initiated a yield curve flattening trade designed to benefit as the yield difference between two- and 30-year securities declined. We added to this trade again in 2010 as this spread approached the widest levels on record. This trade benefited the portfolio as the yield curve proceeded to flatten toward the end of the reporting period.
Additionally, we implemented a “ratio” trade designed to benefit from the changing yield relationship between like-maturity municipals and Treasuries. This positioning benefited performance as demand for the municipal asset class drove outperformance versus Treasuries.
*All fund returns referenced in this commentary are for Investor Class shares.
6
Tax-Free Bond
Municipal Credit Comment
The period saw a number of negative headlines about the financial health of state and local governments. Steven Permut, who leads American Century Investments’ municipal bond team, recognizes these concerns but does not believe a wave of municipal defaults is imminent: “We think defaults, while increasing, will continue to be relatively isolated events due to credit-specific issues. And as we’ve said repeatedly, we believe the 50 states are highly unlikely to default. That’s because state general obligation bonds typically have a first or second claim on all general fund revenues, their debt service typically represents a comparatively small percentage of available income, and the states have broad powers to ensure their debts are repaid. In looking at local tax-backed credits, we have found that most cities/school districts/counties are fairly well managed and have continued to maintain rese rves during the downturn.”
Permut continues: “Instead, the real risks to municipal bonds will be more market driven, relating to (1) downgrades, (2) headlines, and (3) liquidity, which can negatively impact a bond’s value. It’s worth remembering that municipal bonds as a whole are second only to Treasuries in terms of credit quality. Indeed, as a result of recent changes to credit ratings by the big rating agencies to reflect the high quality and low likelihood of default by municipal bonds relative to corporate securities, many categories of municipal debt have recently seen their credit ratings recalibrated higher by Moody’s and Fitch.”
Outlook
“We expect modest economic growth going forward, because of three big headwinds for consumer spending (a key driver of growth): high unemployment, too much household debt, and a weak housing market,” said Permut. “While municipal credit conditions are likely to remain challenging in the near term, we think demand for municipal bonds will be fairly healthy—tax rates are widely expected to rise going forward, and investors looking for higher yields are stepping out the maturity spectrum from money market funds. At the same time, the supply of tax-free municipal bonds is likely to be constrained by the Build America Bonds program—a federal government program intended to help lower municipal borrowing costs.”
In terms of the portfolio, Permut indicates that Tax-Free Bond will remain “underweight the tax-supported sector (which includes state and local general obligation bonds) because of the possibility of credit rating downgrades in that sector going forward. Instead, we are overweight less economically sensitive sectors, such as essential service revenue bonds (public power and water and sewer), hospitals, and higher education.”
7
| |
| Tax-Free Bond | |
| |
| Portfolio at a Glance | |
| | As of 5/31/10 |
| Weighted Average Maturity | 10.0 years |
| Average Duration (Modified) | 5.0 years |
| |
| Yields as of May 31, 2010 | |
| 30-Day SEC Yield | |
| Investor Class | 2.59% |
| Institutional Class | 2.79% |
| A Class | 2.23% |
| C Class | 1.61% |
| Investor Class 30-Day Tax-Equivalent Yields(1) | |
| 25.00% Tax Bracket | 3.45% |
| 28.00% Tax Bracket | 3.59% |
| 33.00% Tax Bracket | 3.86% |
| 35.00% Tax Bracket | 3.98% |
| (1) The tax brackets indicated are for federal taxes only. Actual tax-equivalent yields may be lower, if alternative minimum tax is applicable. |
| |
| Top Five States & Territories | |
| | % of net assets as of 5/31/10 |
| California | 16.3% |
| New York | 10.9% |
| Pennsylvania | 6.1% |
| Texas | 5.1% |
| Florida | 5.0% |
8
|
| Shareholder Fee Example (Unaudited) |
Fund shareholders may incur two types of costs: (1) transaction costs, including sales charges (loads) on purchase payments and redemption/ exchange fees; and (2) ongoing costs, including management fees; distribution and service (12b-1) fees; and other fund expenses. This example is intended to help you understand your ongoing costs (in dollars) of investing in your fund and to compare these costs with the ongoing cost of investing in other mutual funds.
The example is based on an investment of $1,000 made at the beginning of the period and held for the entire period from December 1, 2009 to May 31, 2010 (except as noted).
Actual Expenses
The table provides information about actual account values and actual expenses for each class. You may use the information, together with the amount you invested, to estimate the expenses that you paid over the period. First, identify the share class you own. Then simply divide your account value by $1,000 (for example, an $8,600 account value divided by $1,000 = 8.6), then multiply the result by the number under the heading “Expenses Paid During Period” to estimate the expenses you paid on your account during this period.
If you hold Investor Class shares of any American Century Investments fund, or Institutional Class shares of the American Century Diversified Bond Fund, in an American Century Investments account (i.e., not a financial intermediary or retirement plan account), American Century Investments may charge you a $12.50 semiannual account maintenance fee if the value of those shares is less than $10,000. We will redeem shares automatically in one of your accounts to pay the $12.50 fee. In determining your total eligible investment amount, we will include your investments in all personal accounts (including American Century Investments Brokerage accounts) registered under your Social Security number. Personal accounts include individual accounts, joint accounts, UGMA/UTMA accounts, personal trusts, Coverdell Education Savings Accounts and IRAs (including traditional, Roth, Rollover, SEP-, SARSEP- and SIMPLE-IRAs), and certain other retirement accounts. If you have only business, business retirement, employer-sponsored or American Century Investments Brokerage accounts, you are currently not subject to this fee. We will not charge the fee as long as you choose to manage your accounts exclusively online. If you are subject to the Account Maintenance Fee, your account value could be reduced by the fee amount.
Hypothetical Example for Comparison Purposes
The table also provides information about hypothetical account values and hypothetical expenses based on the actual expense ratio of each class of your fund and an assumed rate of return of 5% per year before expenses, which is not the actual return of a fund’s share class. The hypothetical account values and expenses may not be used to estimate the actual ending account balance or expenses you paid for the period. You may use this information to compare the ongoing costs of investing in your fund and other funds. To do so, compare this 5% hypothetical example with the 5% hypothetical examples that appear in the shareholder reports of the other funds.
9
Please note that the expenses shown in the table are meant to highlight your ongoing costs only and do not reflect any transactional costs, such as sales charges (loads) or redemption/exchange fees. Therefore, the table is useful in comparing ongoing costs only, and will not help you determine the relative total costs of owning different funds. In addition, if these transactional costs were included, your costs would have been higher.
| | | | | |
| | | Beginning | Ending | Expenses Paid | |
| | | Account Value | Account Value | During Period(1) | Annualized |
| | | 12/1/09 | 5/31/10 | 12/1/09 – 5/31/10 | Expense Ratio(1) |
| Actual | | | | |
| Investor Class | $1,000 | $1,030.60 | $2.43 | 0.48% |
| Institutional Class | $1,000 | $1,031.60 | $1.42 | 0.28% |
| A Class | $1,000 | $1,013.50(2) | $1.83(3) | 0.73% |
| C Class | $1,000 | $1,010.70(2) | $3.71(3) | 1.48% |
| Hypothetical | | | | |
| Investor Class | $1,000 | $1,022.54 | $2.42 | 0.48% |
| Institutional Class | $1,000 | $1,023.54 | $1.41 | 0.28% |
| A Class | $1,000 | $1,021.29(4) | $3.68(4) | 0.73% |
| C Class | $1,000 | $1,017.55(4) | $7.44(4) | 1.48% |
| (1) | Expenses are equal to the class’s annualized expense ratio listed in the table above, multiplied by the average account value over the period, |
| | multiplied by 182, the number of days in the most recent fiscal half-year, divided by 365, to reflect the one-half year period. |
| (2) | Ending account value based on actual return from March 1, 2010 (commencement of sale) through May 31, 2010. | |
| (3) | Expenses are equal to the class’s annualized expense ratio listed in the table above, multiplied by the average account value over the period, |
| | multiplied by 91, the number of days in the period from March 1, 2010 (commencement of sale) through May 31, 2010, divided by 365, to |
| | reflect the period. Had the class been available for the full period, the expenses paid during the period would have been higher. |
| (4) | Ending account value and expenses paid during period assumes the class had been available throughout the entire period and are calculated |
| | using the class’s annualized expense ratio listed in the table above. | | |
10
| | | | | | |
| Tax-Free Bond | | | | | | |
| |
| MAY 31, 2010 | | | | | | |
| | Principal | | | | Principal | |
| | Amount | Value | | | Amount | Value |
| Municipal Securities — 99.0% | | | Arizona Tourism & Sports | | |
| | | | | Auth. Rev., (Baseball | | |
| ALABAMA — 0.2% | | | | Training Facilities), | | |
| East Central Industrial | | | | 5.00%, 7/1/11(1) | $ 1,000,000 | $ 1,030,350 |
| Development Auth. Rev., | | | | Arizona Tourism & Sports | | |
| 5.25%, 9/1/13 (Ambac)(1) | $ 810,000 | $ 812,503 | | Auth. Rev., (Baseball | | |
| Helena Utilities Board Rev., | | | | Training Facilities), | | |
| 5.75%, 4/1/12, Prerefunded | | | | 5.00%, 7/1/12(1) | 1,000,000 | 1,047,490 |
| at 101% of Par (NATL)(1)(2) | 645,000 | 711,803 | | Arizona Tourism & Sports | | |
| Helena Utilities Board Rev., | | | | Auth. Rev., (Baseball | | |
| 5.75%, 4/1/12, Prerefunded | | | | Training Facilities), | | |
| at 101% of Par (NATL)(1)(2) | 790,000 | 871,820 | | 5.00%, 7/1/13(1) | 1,880,000 | 1,995,319 |
| Helena Utilities Board Rev., | | | | Arizona Tourism & Sports | | |
| 5.75%, 4/1/12, Prerefunded | | | | Auth. Rev., Series 2003 A, | | |
| at 101% of Par (NATL)(1)(2) | 840,000 | 926,999 | | (Multipurpose Stadium | | |
| Helena Utilities Board Rev., | | | | Facility), 5.25%, 7/1/17, | | |
| 5.75%, 4/1/12, Prerefunded | | | | Partially Prerefunded at | | |
| at 101% of Par (NATL)(1)(2) | 1,035,000 | 1,142,195 | | 100% of Par (NATL)(1)(2) | 2,000,000 | 2,091,500 |
| | | 4,465,320 | | Energy Management | | |
| | | | | Services LLC Rev., | | |
| ALASKA — 0.1% | | | | (Arizona State University – | | |
| Aleutians East Borough | | | | Main Campus), 4.50%, | | |
| Project Rev., (Aleutian | | | | 7/1/11 (NATL)(1) | 1,910,000 | 1,995,969 |
| Pribilof Islands, Inc.), | | | | Energy Management | | |
| 5.00%, 6/1/20 (ACA)(1) | 1,875,000 | 1,721,644 | | Services LLC Rev., | | |
| ARIZONA — 4.4% | | | | (Arizona State University – | | |
| Arizona Health Facilities | | | | Main Campus), 4.50%, | | |
| Auth. Rev., (Blood | | | | 7/1/12 (NATL)(1) | 2,130,000 | 2,301,231 |
| Systems, Inc.), | | | | Glendale Industrial | | |
| 4.00%, 4/1/12(1) | 1,275,000 | 1,327,097 | | Development Auth. Rev., | | |
| Arizona Health Facilities | | | | Series 2001 A, (Midwestern | | |
| Auth. Rev., (Blood | | | | University), 5.75%, 5/15/11, | | |
| Systems, Inc.), | | | | Prerefunded at 101% | | |
| 5.00%, 4/1/21(1) | 1,000,000 | 1,017,750 | | of Par(1)(2) | 500,000 | 530,515 |
| Arizona Health Facilities | | | | Maricopa County Gilbert | | |
| Auth. Rev., Series | | | | Unified School District | | |
| 2007 B, (Banner Health), | | | | No. 41 GO, 5.75%, | | |
| VRN, 1.01%, 7/1/10, | | | | 7/1/11 (AGM)(1) | 1,155,000 | 1,222,302 |
| resets quarterly at 67% of | | | | Maricopa County Phoenix | | |
| the 3-month LIBOR plus | | | | Union High School District | | |
| 0.81% with no caps(1) | 7,500,000 | 4,996,875 | | No. 210 GO, 4.75%, | | |
| Arizona Health Facilities | | | | 7/1/11 (AGM)(1) | 1,445,000 | 1,512,583 |
| Auth. Rev., Series 2008 D, | | | | Maricopa County Saddle | | |
| (Banner Health), 5.00%, | | | | Mountain Unified School | | |
| 1/1/15(1) | 3,000,000 | 3,264,900 | | District No. 90 GO, | | |
| Arizona School Facilities | | | | Series 2003 A, (School | | |
| Board Rev., (State School | | | | Improvements), | | |
| Improvement), 5.50%, | | | | 5.00%, 7/1/10(1) | 1,955,000 | 1,960,122 |
| 7/1/11, Prerefunded at | | | | Maricopa County Saddle | | |
| 100% of Par(1)(2) | 1,750,000 | 1,847,405 | | Mountain Unified School | | |
| Arizona State University | | | | District No. 90 GO, | | |
| COP, Series 2006 A, | | | | Series 2003 A, (School | | |
| (University of Arizona), | | | | Improvements), | | |
| 5.00%, 6/1/18 (Ambac)(1) | 1,935,000 | 2,108,105 | | 5.25%, 7/1/11(1) | 2,415,000 | 2,492,377 |
11
| | | | | | |
| Tax-Free Bond | | | | | | |
| |
| | Principal | | | | Principal | |
| | Amount | Value | | | Amount | Value |
| Maricopa County Saddle | | | | Pima County Metropolitan | | |
| Mountain Unified School | | | | Domestic Water | | |
| District No. 90 GO, | | | | Improvement District Rev., | | |
| Series 2003 A, (School | | | | 5.25%, 7/1/18 (Ambac)(1) | $ 1,710,000 | $ 1,927,580 |
| Improvements), | | | | Pima County Metropolitan | | |
| 5.25%, 7/1/12(1) | $ 2,000,000 | $ 2,114,720 | | Domestic Water | | |
| Maricopa County Scottsdale | | | | Improvement District Rev., | | |
| Unified School District | | | | 5.25%, 7/1/19 (Ambac)(1) | 1,800,000 | 2,024,028 |
| No. 48 GO, 6.60%, 7/1/12(1) | 1,000,000 | 1,120,100 | | Pima County Tucson Unified | | |
| Mohave County Community | | | | School District No. 1 GO, | | |
| College District Rev., 5.75%, | | | | 4.625%, 7/1/13 (AGM)(1) | 2,600,000 | 2,795,156 |
| 3/1/14 (Ambac)(1) | 1,265,000 | 1,269,567 | | Pinal County Apache | | |
| Mohave County Industrial | | | | Junction Unified School | | |
| Development Auth. | | | | District No. 43 GO, | | |
| Correctional Facilities | | | | Series 2006 B, (School | | |
| Contract Rev., (Mohave | | | | Improvements), 5.00%, | | |
| Prison, LLC Expansion), | | | | 7/1/16, Prerefunded at 100% | | |
| 8.00%, 5/1/25(1) | 5,000,000 | 5,626,650 | | of Par (FGIC)(1)(2) | 775,000 | 907,951 |
| Mohave County Industrial | | | | Pinal County COP, 4.75%, | | |
| Development Auth. | | | | 6/1/13 (Ambac)(1) | 820,000 | 853,423 |
| Rev., Series 2004 A, | | | | Pinal County COP, | | |
| (Mohave Prison), 5.00%, | | | | 5.00%, 12/1/25(1) | 3,920,000 | 3,949,831 |
| 4/1/14 (XLCA)(1)(2) | 1,655,000 | 1,879,716 | | | | |
| | | | | Queen Creek Improvement | | |
| Navajo County Unified | | | | District No. 1 Special | | |
| School District No. 20 Rev., | | | | Assessment Rev., | | |
| Series 2006 A, 5.00%, | | | | 5.00%, 1/1/16(1) | 1,000,000 | 1,013,320 |
| 7/1/17 (NATL)(1) | 1,815,000 | 2,050,242 | | | | |
| | | | | Salt River Agricultural | | |
| Phoenix Civic Improvement | | | | Improvement & Power Rev., | | |
| Corp. Waste System Rev., | | | | Series 2009 A, (Electric | | |
| (Junior Lien), 6.25%, | | | | System Distribution), | | |
| 7/1/10, Prerefunded at 101% | | | | 5.00%, 1/1/39(1) | 10,000,000 | 10,531,100 |
| of Par (FGIC)(1)(2) | 1,000,000 | 1,015,470 | | | | |
| | | | | South Tucson Municipal | | |
| Phoenix Civic Improvement | | | | Property Corp. Rev., 5.50%, | | |
| Corp. Wastewater System | | | | 6/1/11, Prerefunded at | | |
| Rev., (Senior Lien), | | | | 100% of Par(1)(2) | 3,085,000 | 3,240,299 |
| 5.50%, 7/1/24(1) | 1,750,000 | 1,980,230 | | | | |
| | | | | University of Arizona COP, | | |
| Phoenix Civic Improvement | | | | Series 2002 A, 5.50%, | | |
| Corp. Water System Rev., | | | | 6/1/12, Prerefunded at | | |
| (Junior Lien), 5.50%, | | | | 100% of Par (Ambac)(1)(2) | 1,505,000 | 1,645,386 |
| 7/1/19 (NATL/FGIC)(1) | 1,000,000 | 1,077,960 | | | | |
| | | | | | | 85,286,611 |
| Phoenix GO, Series 1995 A, | | | | | | |
| 6.25%, 7/1/17(1) | 1,070,000 | 1,330,823 | | CALIFORNIA — 16.3% | | |
| Phoenix Industrial | | | | ABAG Finance Auth. for | | |
| Development Auth. | | | | Nonprofit Corps. Rev., | | |
| Government Office Lease | | | | (Brandeis Hillel Day School), | | |
| Rev., (Capitol Mall LLC), | | | | VRDN, 2.75%, 6/3/10 | | |
| 5.00%, 9/15/26 (Ambac)(1) | 1,750,000 | 1,772,610 | | (LOC: Allied Irish Bank plc) | 8,545,000 | 8,545,000 |
| Pima County Indian Oasis- | | | | California Department of | | |
| Baboquivari Unified School | | | | Water Resources Power | | |
| District No. 40 Rev., | | | | Supply Rev., Series 2005 F5, | | |
| | | | | 5.00%, 5/1/22(1) | 6,215,000 | 6,796,662 |
| Series 2002 A, 4.60%, | | | | | | |
| 7/1/13 (NATL)(1) | 1,200,000 | 1,278,000 | | California Department of | | |
| Pima County Marana | | | | Water Resources Power | | |
| Unified School District | | | | Supply Rev., Series 2005 G4, | | |
| | | | | 5.00%, 5/1/16(1) | 2,450,000 | 2,779,108 |
| No. 6 GO, 5.50%, 7/1/15 | | | | | | |
| (NATL/FGIC)(1) | 1,125,000 | 1,140,559 | | | | |
12
| | | | | | |
| Tax-Free Bond | | | | | | |
| |
| | Principal | | | | Principal | |
| | Amount | Value | | | Amount | Value |
| California Department of | | | | California Health Facilities | | |
| Water Resources Power | | | | Financing Auth. Rev., | | |
| Supply Rev., Series 2008 H, | | | | Series 2009 A, (Children’s | | |
| 5.00%, 5/1/21(1) | $10,000,000 | $ 11,003,900 | | Hospital of Orange County), | | |
| California Department of | | | | 6.50%, 11/1/38(1) | $10,000,000 | $ 10,651,600 |
| Water Resources Rev., | | | | California Infrastructure | | |
| Series 2008 AE, (Central | | | | & Economic Development | | |
| Valley), 5.00%, 12/1/22(1) | 3,000,000 | 3,384,930 | | Bank Rev., (St. Margarets | | |
| California Department of | | | | Epicopal School), VRDN, | | |
| Water Resources Rev., | | | | 2.75%, 6/3/10 (LOC: Allied | | |
| Series 2009 AF, (Central | | | | Irish Bank plc)(1) | 3,400,000 | 3,400,000 |
| Valley), 5.00%, 12/1/22(1) | 10,000,000 | 11,353,000 | | California Municipal Finance | | |
| California Educational | | | | Auth. Rev., (Community | | |
| Facilities Auth. Rev., | | | | Hospital of Central | | |
| Series 2009 A, (Pomona | | | | California), 5.50%, 2/1/39(1) | 1,450,000 | 1,345,426 |
| College), 5.00%, 1/1/24(1) | 3,500,000 | 3,957,240 | | California Public Works | | |
| California GO, | | | | Board Lease Rev., Series | | |
| 5.00%, 10/1/16(1) | 10,000,000 | 11,128,500 | | 2009 A, (Department | | |
| | | | | General Services – | | |
| California GO, | | | | Buildings 8 & 9), | | |
| 5.00%, 10/1/18(1) | 10,000,000 | 11,061,300 | | | | |
| | | | | 6.25%, 4/1/34(1) | 4,000,000 | 4,216,080 |
| California GO, | | | | California Public Works | | |
| 5.75%, 4/1/31(1) | 16,630,000 | 17,731,571 | | | | |
| | | | | Board Rev., Series 2009 G1, | | |
| California GO, | | | | 5.00%, 10/1/16(1) | 10,000,000 | 10,805,800 |
| 6.00%, 4/1/38(1) | 5,000,000 | 5,457,900 | | | | |
| | | | | California Statewide | | |
| California GO, | | | | Communities Development | | |
| 5.50%, 11/1/39(1) | 10,000,000 | 10,273,300 | | Auth. Rev., (Centre For Early | | |
| California GO, Series 2009 | | | | Education), VRDN, 2.75%, | | |
| B, VRDN, 5.00%, 7/1/14(1) | 8,000,000 | 8,868,480 | | 6/3/10 (LOC: Allied Irish | | |
| California Health Facilities | | | | Bank plc)(1) | 7,100,000 | 7,100,000 |
| Financing Auth. Rev., | | | | California Statewide | | |
| Series 2008 A3, | | | | Communities Development | | |
| (Stanford Hospital), | | | | Auth. Rev., (Proposition | | |
| VRDN, 3.45%, 6/15/11(1) | 2,300,000 | 2,354,119 | | 1A Receivables), 5.00%, | | |
| California Health Facilities | | | | 6/15/13(1) | 14,500,000 | 15,788,615 |
| Financing Auth. Rev., | | | | California Statewide | | |
| Series 2008 C, (Providence | | | | Communities Development | | |
| Health & Services), | | | | Auth. Rev., Series 2001 B, | | |
| 6.50%, 10/1/38(1) | 2,125,000 | 2,409,814 | | (Kaiser Permanente), VRDN, | | |
| California Health Facilities | | | | 3.90%, 7/1/14(1) | 2,000,000 | 2,040,160 |
| Financing Auth. Rev., Series | | | | California Statewide | | |
| 2008 I, (Catholic Healthcare | | | | Communities Development | | |
| West), 5.125%, 7/1/22(1) | 5,725,000 | 5,983,713 | | Auth. Rev., Series 2009 A, | | |
| California Health Facilities | | | | (Kaiser Permanente), | | |
| Financing Auth. Rev., | | | | 5.00%, 4/1/16(1) | 8,000,000 | 8,855,680 |
| Series 2009 A, (Adventist | | | | California Statewide | | |
| Health System West), | | | | Communities Development | | |
| 5.75%, 9/1/39(1) | 2,500,000 | 2,614,750 | | Auth. Water & Waste Rev., | | |
| California Health Facilities | | | | Series 2004 A, (Pooled | | |
| Financing Auth. Rev., Series | | | | Financing Program), 5.00%, | | |
| 2009 A, (Catholic Healthcare | | | | 10/1/12 (AGM)(1)(2) | 230,000 | 252,844 |
| West), 5.50%, 7/1/22(1) | 5,000,000 | 5,455,250 | | California Statewide | | |
| | | | | Communities Development | | |
| | | | | Auth. Water & Waste Rev., | | |
| | | | | Series 2004 A, (Pooled | | |
| | | | | Financing Program), 5.00%, | | |
| | | | | 10/1/12 (AGM)(1) | 845,000 | 917,577 |
13
| | | | | | |
| Tax-Free Bond | | | | | | |
| |
| | Principal | | | | Principal | |
| | Amount | Value | | | Amount | Value |
| California Statewide | | | | Los Angeles Unified School | | |
| Communities Development | | | | District GO, Series 2009 I, | | |
| Auth. Water & Waste Rev., | | | | 5.00%, 7/1/21(1) | $ 6,520,000 | $ 7,275,733 |
| Series 2004 A, (Pooled | | | | Manteca Unified School | | |
| Financing Program), 5.25%, | | | | District GO, 5.25%, 8/1/14, | | |
| 10/1/13, Prerefunded at | | | | Prerefunded at 100% of | | |
| 101% of Par (AGM)(1)(2) | $ 430,000 | $ 494,143 | | Par (AGM)(1)(2) | 2,200,000 | 2,559,876 |
| California Statewide | | | | Metropolitan Water | | |
| Communities Development | | | | District of Southern | | |
| Auth. Water & Waste Rev., | | | | California Rev., Series | | |
| Series 2004 A, (Pooled | | | | 2009 C, 5.00%, 7/1/35(1) | 2,300,000 | 2,445,820 |
| Financing Program), 5.25%, | | | | | | |
| 10/1/19 (AGM)(1) | 1,570,000 | 1,724,535 | | Northern California Power | | |
| | | | | Agency Rev., Series | | |
| Foothill-De Anza Community | | | | 2008 C, (Hydroelectric | | |
| College District GO, | | | | Project Number One), | | |
| Series 2007 B, 5.00%, | | | | 5.00%, 7/1/19 (AGC)(1) | 2,300,000 | 2,571,285 |
| 8/1/17 (Ambac)(1) | 3,510,000 | 4,091,502 | | | | |
| | | | | Northern California Power | | |
| Foothill-De Anza Community | | | | Agency Rev., Series | | |
| College District GO, Series | | | | 2008 C, (Hydroelectric | | |
| 2007 B, (Election of 2006), | | | | Project Number One), | | |
| 5.00%, 8/1/27 (Ambac)(1) | 1,875,000 | 1,990,838 | | 5.00%, 7/1/20 (AGC)(1) | 2,500,000 | 2,758,475 |
| Golden State Tobacco | | | | Northern California Power | | |
| Securitization Corp. | | | | Agency Rev., Series | | |
| Settlement Rev., Series | | | | 2008 C, (Hydroelectric | | |
| 2007 A1, 5.75%, 6/1/47(1) | 5,000,000 | 3,666,350 | | Project Number One), | | |
| Hesperia Unified School | | | | 5.00%, 7/1/21 (AGC)(1) | 5,000,000 | 5,465,400 |
| District COP, (2007 Capital | | | | Northern California Power | | |
| Improvement), 5.00%, | | | | Agency Rev., Series 2010 A, | | |
| 2/1/17 (Ambac)(1) | 1,070,000 | 1,135,045 | | 5.00%, 7/1/16(1) | 1,000,000 | 1,123,290 |
| Imperial Irrigation District | | | | Northern California Power | | |
| COP, (Water System), | | | | Agency Rev., Series 2010 A, | | |
| 5.50%, 7/1/29 (Ambac)(1) | 3,000,000 | 3,053,940 | | 5.00%, 7/1/17(1) | 1,500,000 | 1,677,105 |
| Los Angeles Community | | | | Plumas Unified School | | |
| College District GO, Series | | | | District GO, 5.25%, | | |
| 2008 E1, (Election of 2001), | | | | 8/1/20 (AGM)(1) | 1,000,000 | 1,142,870 |
| 5.00%, 8/1/20(1) | 2,250,000 | 2,521,507 | | | | |
| | | | | Sacramento County COP, | | |
| Los Angeles COP Rev., | | | | 5.75%, 2/1/30(1) | 1,600,000 | 1,612,848 |
| Series 2007 A, (Laurence | | | | | | |
| School), VRDN, 2.75%, | | | | San Bernardino Community | | |
| 6/3/10 (LOC: Allied Irish | | | | College District GO, Series | | |
| Bank plc)(1) | 2,930,000 | 2,930,000 | | 2008 A, (Election of 2002), | | |
| | | | | 6.25%, 8/1/33(1) | 4,700,000 | 5,318,849 |
| Los Angeles COP Rev., | | | | | | |
| Series 2007 A, (Windward | | | | San Diego Public Facilities | | |
| School), VRDN, 2.75%, | | | | Financing Sewer Auth. | | |
| 6/3/10 (LOC: Allied Irish | | | | Rev., Series 2010 A, | | |
| | | | | 5.25%, 5/15/24(1) | 6,600,000 | 7,387,578 |
| Bank plc)(1) | 6,000,000 | 6,000,000 | | | | |
| Los Angeles Department of | | | | San Francisco City & County | | |
| Water & Power Waterworks | | | | Airports Commission Rev., | | |
| Rev., Series 2009 B, | | | | Series 2008-34F, 5.00%, | | |
| | | | | 5/1/17 (AGC)(1) | 4,140,000 | 4,721,960 |
| 5.00%, 7/1/20(1) | 5,000,000 | 5,732,600 | | | | |
| Los Angeles Unified School | | | | San Francisco Uptown | | |
| District GO, Series 2009 D, | | | | Parking Corp. Rev., | | |
| 5.00%, 7/1/18(1) | 2,300,000 | 2,617,630 | | (Union Square), 5.50%, | | |
| | | | | 7/1/15 (NATL)(1) | 1,830,000 | 1,915,790 |
| Los Angeles Unified School | | | | | | |
| District GO, Series 2009 D, | | | | | | |
| 5.00%, 7/1/20(1) | 6,065,000 | 6,838,530 | | | | |
14
| | | | | | |
| Tax-Free Bond | | | | | | |
| |
| | Principal | | | | Principal | |
| | Amount | Value | | | Amount | Value |
| San Francisco Uptown | | | | Colorado Educational & | | |
| Parking Corp. Rev., | | | | Cultural Facilities Auth. | | |
| (Union Square), 6.00%, | | | | Rev., (Northwest Nazarene | | |
| 7/1/20 (NATL)(1) | $ 1,000,000 | $ 1,070,210 | | University Facilities), | | |
| San Francisco Uptown | | | | 4.60%, 11/1/16(1) | $ 760,000 | $ 759,225 |
| Parking Corp. Rev., | | | | Colorado Health Facilities | | |
| (Union Square), 6.00%, | | | | Auth. Rev., (Catholic | | |
| 7/1/31 (NATL)(1) | 2,000,000 | 2,110,880 | | Health Initiatives), | | |
| San Marcos Public Facilities | | | | 6.00%, 10/1/23(1) | 1,500,000 | 1,695,015 |
| Auth. Tax Allocation Rev., | | | | Colorado Health Facilities | | |
| Series 2006 A, (Project | | | | Auth. Rev., (Yampa | | |
| Area No. 3), 5.00%, | | | | Valley Medical Center), | | |
| 8/1/20 (Ambac)(1) | 1,525,000 | 1,566,526 | | 5.00%, 9/15/11(1) | 1,280,000 | 1,325,542 |
| Southern California Public | | | | Colorado Health Facilities | | |
| Power Auth. Rev., Series | | | | Auth. Rev., Series 2006 B, | | |
| 2008 A, (Transmission), | | | | (Longmont United Hospital), | | |
| 5.00%, 7/1/22(1) | 2,875,000 | 3,136,309 | | 5.00%, 12/1/20 (Radian)(1) | 1,000,000 | 958,180 |
| Tuolumne Wind Project | | | | Colorado Water Resources | | |
| Auth. Rev., Series 2009 A, | | | | & Power Development Auth. | | |
| 5.625%, 1/1/29(1) | 2,800,000 | 3,030,580 | | Rev., Series 2000 A, 6.25%, | | |
| Vernon Electric System Rev., | | | | 9/1/10, Prerefunded at | | |
| Series 2009 A, 5.125%, | | | | 100% of Par(1)(2) | 450,000 | 456,948 |
| 8/1/21(1) | 10,000,000 | 10,521,000 | | Colorado Water Resources | | |
| Vista COP, (Community | | | | & Power Development Auth. | | |
| Projects), 5.00%, | | | | Rev., Series 2000 A, | | |
| 5/1/37 (NATL)(1) | 5,850,000 | 5,559,430 | | 6.25%, 9/1/16(1) | 50,000 | 50,775 |
| | | 314,300,753 | | Compark Business Campus | | |
| | | | | Metropolitan District GO, | | |
| COLORADO — 1.1% | | | | Series 2007 A, 5.30%, | | |
| Arapahoe County Water | | | | 12/1/22 (Radian)(1) | 1,195,000 | 1,017,734 |
| & Wastewater Public | | | | Denver City and County | | |
| Improvement District GO, | | | | Airport Rev., Series 2010 A, | | |
| Series 2002 B, 5.75%, | | | | 5.00%, 11/15/21(1) | 2,500,000 | 2,759,950 |
| 12/1/17 (NATL)(1) | 1,100,000 | 1,185,778 | | | | |
| | | | | Douglas & Elbert Counties | | |
| Aurora Hospital Rev., | | | | School District No. Re-1 | | |
| (Childrens Hospital | | | | GO, Series 2002 B, 5.75%, | | |
| Association), | | | | 12/15/12, Prerefunded at | | |
| 5.00%, 12/1/40(1) | 1,250,000 | 1,250,975 | | | | |
| | | | | 100% of Par (AGM)(1)(2) | 1,000,000 | 1,124,720 |
| Colorado Educational & | | | | El Paso County School | | |
| Cultural Facilities Auth. | | | | District No. 8 & Fountain- | | |
| Rev., (Northwest Nazarene | | | | Fort Carson School District | | |
| University Facilities), 4.60%, | | | | Finance Corp. COP, 4.25%, | | |
| 11/1/10, Prerefunded at | | | | 12/15/13 (Ambac)(1) | 1,020,000 | 1,043,287 |
| 102% of Par(1)(2) | 40,000 | 41,510 | | | | |
| | | | | SBC Metropolitan District | | |
| Colorado Educational & | | | | GO, 5.00%, 12/1/20 (ACA)(1) | 175,000 | 180,864 |
| Cultural Facilities Auth. | | | | | | |
| Rev., (Northwest Nazarene | | | | University of Colorado | | |
| University Facilities), | | | | Regents COP, 6.00%, | | |
| 4.75%, 11/1/10(1)(2) | 170,000 | 173,133 | | 12/1/22 (NATL-IBC)(1) | 5,000,000 | 5,190,700 |
| Colorado Educational & | | | | University of Colorado Rev., | | |
| Cultural Facilities Auth. | | | | Series 2009 A, 5.25%, | | |
| Rev., (Northwest Nazarene | | | | 6/1/30(1) | 1,200,000 | 1,302,600 |
| University Facilities), | | | | | | 21,253,353 |
| 4.75%, 11/1/10(1) | 730,000 | 736,417 | | | | |
15
| | | | | | |
| Tax-Free Bond | | | | | | |
| |
| | Principal | | | | Principal | |
| | Amount | Value | | | Amount | Value |
| CONNECTICUT — 1.7% | | | | FLORIDA — 5.0% | | |
| Bridgeport GO, Series | | | | Citizens Property Insurance | | |
| 2004 A, 5.25%, 8/15/14, | | | | Corp. Rev., Series 2008 A1, | | |
| Prerefunded at 100% | | | | (Second High Risk Notes), | | |
| of Par (NATL)(1)(2) | $ 2,150,000 | $ 2,498,537 | | 5.00%, 6/1/11(1) | $ 2,500,000 | $ 2,597,850 |
| Connecticut Economic | | | | Citizens Property Insurance | | |
| Recovery GO, Series 2009 A, | | | | Corp. Rev., Series 2010 A1, | | |
| 5.00%, 1/1/13(1) | 5,000,000 | 5,524,600 | | (Second High Risk Notes), | | |
| Connecticut Economic | | | | 5.25%, 6/1/17(1) | 5,800,000 | 6,123,872 |
| Recovery GO, Series 2009 A, | | | | Collier County School | | |
| 5.00%, 1/1/14(1) | 3,900,000 | 4,408,365 | | Board COP, 5.50%, | | |
| Connecticut GO, Series | | | | 2/15/12 (AGM)(1) | 1,475,000 | 1,574,681 |
| 2001 C, 5.50%, 12/15/13 | | | | Escambia County Solid | | |
| (NATL-IBC)(1) | 4,000,000 | 4,614,080 | | Waste Disposal System Rev., | | |
| Connecticut GO, Series | | | | (Gulf Power Co.), VRDN, | | |
| 2006 C, 5.00%, 6/1/14(1) | 5,000,000 | 5,709,750 | | 0.33%, 6/1/10(1) | 11,600,000 | 11,600,000 |
| Connecticut GO, Series | | | | Florida Hurricane | | |
| 2006 D, 5.00%, 11/1/15(1) | 1,595,000 | 1,858,015 | | Catastrophe Fund Finance | | |
| | | | | Corp. Rev., Series 2008 A, | | |
| Connecticut Health & | | | | 5.00%, 7/1/13(1) | 10,000,000 | 10,673,000 |
| Educational Facilities Auth. | | | | | | |
| Rev., Series 2003 X3, (Yale | | | | Florida Municipal Power | | |
| University), 4.85%, 7/1/37(1) | 4,500,000 | 4,703,760 | | Agency Rev., Series 2009 A, | | |
| | | | | (All Requirements Power), | | |
| Connecticut Health & | | | | 5.25%, 10/1/20 | 2,000,000 | 2,261,760 |
| Educational Facilities | | | | | | |
| Auth. Rev., Series 2007 I, | | | | Florida Municipal Power | | |
| (Quinnipiac University), | | | | Agency Rev., Series 2009 A, | | |
| 5.00%, 7/1/16 (NATL)(1) | 2,660,000 | 3,001,464 | | (All Requirements Power), | | |
| | | 32,318,571 | | 5.25%, 10/1/21 | 3,470,000 | 3,895,734 |
| | | | | Florida Rural Utility | | |
| DISTRICT OF COLUMBIA — 1.5% | | | Financing Commission | | |
| District of Columbia Rev., | | | | Rev., (Public Project | | |
| (Gonzaga College High | | | | Construction), 3.25%, | | |
| School), 5.20%, | | | | 2/1/11(1) | 2,070,000 | 2,071,511 |
| 7/1/12 (AGM)(1) | 1,155,000 | 1,169,518 | | | | |
| | | | | Halifax Hospital Medical | | |
| District of Columbia Rev., | | | | Center Rev., Series 2006 A, | | |
| Series 2010 A, 5.00%, | | | | 5.25%, 6/1/16(1) | 1,000,000 | 1,073,180 |
| 12/1/19(1) | 5,000,000 | 5,849,900 | | | | |
| | | | | Halifax Hospital Medical | | |
| District of Columbia Rev., | | | | Center Rev., Series 2006 A, | | |
| Series 2010 C, VRN, | | | | 5.25%, 6/1/18(1) | 900,000 | 939,033 |
| 0.47%, 6/3/10(1) | 10,000,000 | 10,028,400 | | | | |
| | | | | Halifax Hospital Medical | | |
| District of Columbia Water | | | | Center Rev., Series 2006 B1, | | |
| & Sewer Auth. Public | | | | 5.50%, 6/1/38 (AGM)(1) | 1,000,000 | 1,018,130 |
| Utility Rev., Series 2008 A, | | | | Halifax Hospital Medical | | |
| (Subordinate Lien), 5.00%, | | | | Center Rev., Series 2006 B2, | | |
| 10/1/34 (AGC)(1) | 1,200,000 | 1,247,196 | | | | |
| | | | | 5.375%, 6/1/31 (AGM)(1) | 2,000,000 | 2,045,020 |
| Metropolitan Washington | | | | Indian River County Rev., | | |
| Airports Auth. Rev., Series | | | | (Spring Training | | |
| 2009 A, (First Senior Lien), | | | | Facility), 5.25%, | | |
| 5.00%, 10/1/39(1) | 5,000,000 | 5,204,150 | | | | |
| | | | | 4/1/15 (NATL/FGIC)(1) | 1,235,000 | 1,290,624 |
| Washington Metropolitan | | | | JEA Electric System Rev., | | |
| Area Transit Auth. Rev., | | | | Series 2009 A, 5.50%, | | |
| Series 2009 A, 5.00%, | | | | 10/1/39(1) | 10,000,000 | 10,690,300 |
| 7/1/17(1) | 4,600,000 | 5,272,198 | | | | |
| | | 28,771,362 | | | | |
16
| | | | | | |
| Tax-Free Bond | | | | | | |
| |
| | Principal | | | | Principal | |
| | Amount | Value | | | Amount | Value |
| Miami Beach Stormwater | | | | St. Petersburg Health | | |
| Rev., 5.75%, 9/1/10, | | | | Facilities Auth. Rev., Series | | |
| Prerefunded at 101% | | | | 2009 A, (All Children’s | | |
| of Par (NATL/FGIC)(1)(2) | $ 1,000,000 | $ 1,024,040 | | Health Facilities), | | |
| Miami Beach Water & | | | | 6.50%, 11/15/39 | $ 4,700,000 | $ 5,218,833 |
| Sewer Rev., 5.625%, 9/1/10, | | | | Sumter County School | | |
| Prerefunded at 101% of | | | | Board COP, 5.50%, 7/1/12, | | |
| Par (Ambac)(1)(2) | 1,910,000 | 1,955,133 | | Prerefunded at 100% of | | |
| Miami Parking Facilities | | | | Par (NATL)(1)(2) | 1,000,000 | 1,100,810 |
| Rev., 5.25%, 10/1/15 | | | | Sunrise Rev., 5.20%, | | |
| (NATL)(1) | 650,000 | 737,100 | | 10/1/22 (Ambac)(1) | 1,000,000 | 1,057,940 |
| Miami-Dade County Aviation | | | | Tampa Bay Water Utility | | |
| Department Rev., | | | | System Rev., 5.00%, | | |
| Series 2007 D, (Miami | | | | 10/1/38(1) | 1,690,000 | 1,769,684 |
| International Airport), | | | | Tampa Guaranteed | | |
| 5.25%, 10/1/26 (AGM)(1) | 4,650,000 | 5,028,650 | | Entitlement Rev., 6.00%, | | |
| Miami-Dade County GO, | | | | 10/1/18 (Ambac)(1) | 375,000 | 438,922 |
| (Double Barreled Aviation), | | | | Tampa Water & Sewer Rev., | | |
| 5.00%, 7/1/17(1) | 1,000,000 | 1,133,710 | | 6.00%, 10/1/17 (AGM)(1) | 1,000,000 | 1,205,310 |
| Miami-Dade County School | | | | | | 96,729,549 |
| Board COP, Series 2001 C, | | | | | | |
| 5.50%, 10/1/11, Prerefunded | | | | GEORGIA — 3.3% | | |
| at 100% of Par (AGM)(1)(2) | 1,000,000 | 1,064,460 | | Athens-Clarke County | | |
| Orange County School Board | | | | Unified Government | | |
| COP, Series 2002 A, 5.50%, | | | | Water & Sewer Rev., | | |
| | | | | 5.625%, 1/1/28(1) | 1,200,000 | 1,348,908 |
| 8/1/12, Prerefunded at | | | | | | |
| 100% of Par (NATL)(1)(2) | 1,875,000 | 2,069,812 | | Atlanta Rev., Series 2009 A, | | |
| | | | | 6.00%, 11/1/27(1) | 5,000,000 | 5,490,150 |
| Orlando & Orange County | | | | | | |
| Expressway Auth. Rev., | | | | Atlanta Rev., Series 2009 A, | | |
| (Junior Lien), 6.50%, | | | | 6.00%, 11/1/28(1) | 3,000,000 | 3,279,750 |
| 7/1/11 (NATL/FGIC)(1) | 450,000 | 475,862 | | Burke County Development | | |
| Orlando Utilities Commission | | | | Auth. Pollution Control Rev., | | |
| System Rev., Series 2009 B, | | | | Series 2007 B, (Oglethorpe | | |
| 5.00%, 10/1/33(1) | 2,000,000 | 2,112,500 | | Power Corp. Vogtle), VRDN, | | |
| | | | | 4.75%, 4/1/11 (NATL)(1) | 3,210,000 | 3,309,350 |
| Orlando Utilities Commission | | | | | | |
| Water & Electric Rev., Series | | | | De Kalb County Hospital | | |
| 1989 D, 6.75%, 10/1/17(1)(2) | 1,000,000 | 1,190,980 | | Antic Auth. Rev., (De Kalb | | |
| Palm Beach County Health | | | | Medical Center, Inc.), | | |
| Facilities Auth. Rev., | | | | 6.125%, 9/1/40 | 2,450,000 | 2,469,208 |
| Series 2010 A, (Bethesda | | | | Fulton County Development | | |
| Healthcare System), | | | | Auth. Rev., Series 2001 A, | | |
| 5.25%, 7/1/40 (AGM)(1) | 6,250,000 | 6,293,500 | | (TUFF/Atlanta Housing, LLC | | |
| Putnam County | | | | Project at Georgia State | | |
| Development Auth. Pollution | | | | University), 5.50%, | | |
| | | | | 9/1/18 (Ambac)(1) | 1,250,000 | 1,309,250 |
| Control Rev., Series | | | | | | |
| 2007 B, (Seminole Electric | | | | Georgia GO, Series 2009 G, | | |
| Cooperative, Inc.), VRDN, | | | | 5.00%, 11/1/16(1) | 2,000,000 | 2,358,460 |
| 5.35%, 5/1/18 (Ambac)(1) | 1,500,000 | 1,627,845 | | Georgia GO, Series 2009 I, | | |
| South Lake County Hospital | | | | 5.00%, 7/1/16(1) | 10,000,000 | 11,746,800 |
| District Rev., Series 2010 A, | | | | Georgia GO, Series 2009 I, | | |
| (South Lake Hospital), | | | | 5.00%, 7/1/19(1) | 10,000,000 | 11,918,500 |
| 6.25%, 4/1/39 | 3,250,000 | 3,369,763 | | Georgia Municipal Electric | | |
| | | | | Auth. Rev., Series 2008 A, | | |
| | | | | (Project 1), 5.25%, 1/1/17(1) | 5,000,000 | 5,697,050 |
17
| | | | | | |
| Tax-Free Bond | | | | | | |
| |
| | Principal | | | | Principal | |
| | Amount | Value | | | Amount | Value |
| Georgia Municipal Electric | | | | ILLINOIS — 4.1% | | |
| Auth. Rev., Series 2008 D, | | | | Bedford Park GO, | | |
| (General Resolution), | | | | Series 2004 A, 5.25%, | | |
| 5.50%, 1/1/26(1) | $ 4,800,000 | $ 5,255,136 | | 12/15/20 (AGM)(1) | $ 2,000,000 | $ 2,194,380 |
| Georgia Municipal Electric | | | | Chicago Board of Education | | |
| Power Auth. Rev., Series | | | | GO, Series 2008 C, | | |
| 1991 V, 6.50%, 1/1/11, | | | | 5.25%, 12/1/23(1) | 5,000,000 | 5,432,700 |
| Prerefunded at 100 % | | | | | | |
| of Par (NATL-IBC) | | | | Chicago O’Hare International | | |
| (Bank of New York)(1)(2) | 10,000 | 10,324 | | Airport Rev., Series 1993 A, | | |
| | | | | (Senior Lien), 5.00%, | | |
| Georgia Municipal Electric | | | | 1/1/12 (NATL-IBC)(1) | 4,000,000 | 4,252,640 |
| Power Auth. Rev., Series | | | | | | |
| 1991 V, 6.50%, 1/1/12 | | | | Chicago O’Hare International | | |
| (NATL-IBC) (Bank of | | | | Airport Rev., Series 2008 A, | | |
| | | | | 5.00%, 1/1/12 (AGM)(1) | 2,310,000 | 2,454,768 |
| New York)(1)(2) | 90,000 | 95,190 | | | | |
| Georgia Municipal Electric | | | | Chicago O’Hare International | | |
| Power Auth. Rev., Series | | | | Airport Rev., Series 2008 A, | | |
| | | | | 5.00%, 1/1/13 (AGM)(1) | 2,350,000 | 2,560,160 |
| 1991 V, 6.50%, 1/1/12 | | | | | | |
| (NATL-IBC) (Bank of | | | | Chicago O’Hare International | | |
| New York)(1) | 345,000 | 364,237 | | Airport Rev., Series 2008 A, | | |
| | | | | 5.00%, 1/1/14 (AGM)(1) | 4,000,000 | 4,421,120 |
| Georgia Road & Tollway | | | | | | |
| Auth. Rev., Series 2009 A, | | | | Chicago O’Hare International | | |
| (Federal Highway | | | | Airport Rev., Series 2008 C, | | |
| Grant Antic Bonds), | | | | 4.00%, 1/1/17 (AGM)(1) | 600,000 | 632,688 |
| 5.00%, 6/1/21(1) | 4,000,000 | 4,565,320 | | Chicago Rev., Series 2006 A, | | |
| LaGrange Water & | | | | (Second Lien), 5.00%, | | |
| Sewerage Rev., 5.00%, | | | | 11/1/13 (Ambac)(1) | 1,015,000 | 1,133,521 |
| 1/1/12 (Ambac)(1) | 2,000,000 | 2,122,720 | | Cicero GO, Series 2005 A, | | |
| Marietta Development Auth. | | | | 5.25%, 1/1/20 (XLCA)(1) | 1,250,000 | 1,254,987 |
| Rev., (Life University, Inc.), | | | | Cicero GO, Series 2005 A, | | |
| 6.25%, 6/15/20(1) | 1,035,000 | 1,013,099 | | 5.25%, 1/1/21 (XLCA)(1) | 1,000,000 | 999,950 |
| Private Colleges & | | | | Cook County Township High | | |
| Universities Auth. Rev., | | | | School District No. 211 GO, | | |
| Series 2009 B, (Emory | | | | (Palantine & Schaumburg | | |
| University), 5.00%, 9/1/35(1) | 1,000,000 | 1,067,500 | | Townships), 5.00%, | | |
| | | 63,420,952 | | 12/1/10 (AGM)(1) | 4,915,000 | 5,031,387 |
| GUAM — 0.2% | | | | Illinois Dedicated Tax Rev., | | |
| Guam Government GO, | | | | (Civic Center), 6.25%, | | |
| | | | | 12/15/20 (Ambac)(1) | 2,000,000 | 2,274,540 |
| Series 2009 A, | | | | | | |
| 6.75%, 11/15/29(1) | 2,850,000 | 3,051,410 | | Illinois Development | | |
| HAWAII — 0.4% | | | | Finance Auth. Rev., Series | | |
| | | | | 2001 B, (Midwestern | | |
| Hawaii GO, Series 2010 DY, | | | | University), 5.75%, 5/15/11, | | |
| 5.00%, 2/1/15(1) | 1,000,000 | 1,151,470 | | Prerefunded at 101% | | |
| Hawaii Pacific Health Rev., | | | | of Par(1)(2) | 400,000 | 423,288 |
| Series 2010 A, 5.50%, | | | | Illinois Finance Auth. Rev., | | |
| 7/1/40(3) | 3,500,000 | 3,479,420 | | (Central DuPage Health), | | |
| Honolulu City and County | | | | 5.00%, 11/1/27 | 3,595,000 | 3,670,747 |
| GO, Series 2009 A, | | | | Illinois Finance Auth. Rev., | | |
| 5.00%, 4/1/21(1) | 3,000,000 | 3,452,760 | | Series 2008 D, (Advocate | | |
| | | 8,083,650 | | Health Care Network), | | |
| IDAHO(4) | | | | 6.25%, 11/1/28(1) | 5,000,000 | 5,600,300 |
| Blaine County Hailey | | | | Illinois Finance Auth. Rev., | | |
| School District No. 61 GO, | | | | Series 2009 C, (Rush | | |
| 5.00%, 7/30/10 (School | | | | University Medical Center), | | |
| Bond Guarantee)(1) | 1,000,000 | 1,008,240 | | 6.375%, 11/1/29(1) | 5,000,000 | 5,407,600 |
18
| | | | | | |
| Tax-Free Bond | | | | | | |
| |
| | Principal | | | | Principal | |
| | Amount | Value | | | Amount | Value |
| Illinois Finance Auth. Rev., | | | | Southwestern Illinois | | |
| Series 2010 A, (Provena | | | | Development Auth. Rev., | | |
| Health), 5.00%, 5/1/13(1) | $ 1,665,000 | $ 1,741,840 | | (Triad School District No. 2), | | |
| Illinois Finance Auth. Rev., | | | | 5.00%, 10/1/18 (NATL)(1) | $ 1,000,000 | $ 1,103,320 |
| Series 2010 A, (Provena | | | | University of Illinois | | |
| Health), 5.00%, 5/1/14(1) | 1,000,000 | 1,046,460 | | COP, Series 2006 A, | | |
| Illinois Finance Auth. Rev., | | | | (Academic Facilities), | | |
| Series 2010 A, (Provena | | | | 5.00%, 3/15/16 (Ambac)(1) | 3,270,000 | 3,631,302 |
| Health), 5.25%, 5/1/16 | 1,000,000 | 1,035,590 | | | | 78,545,254 |
| Illinois Finance Auth. | | | | INDIANA — 1.3% | | |
| Student Housing Rev., | | | | Hamilton Southeastern | | |
| Series 2006 B, (Educational | | | | Consolidated School | | |
| Advancement Fund, Inc.), | | | | Building Corp. Rev., | | |
| 5.00%, 5/1/11(1) | 1,800,000 | 1,823,652 | | (Hamilton County), | | |
| Illinois Health Facilities | | | | 4.25%, 7/15/20 (AGM)(1) | 1,000,000 | 1,030,790 |
| Auth. Rev., Series 1992 C, | | | | Indiana Bond Bank Rev., | | |
| (Evangelical Hospital), | | | | Series 2006 A, 5.00%, | | |
| 6.75%, 4/15/12(1)(2) | 500,000 | 500,515 | | 8/1/17 (AGM)(1) | 1,520,000 | 1,723,482 |
| Kane County Community | | | | Indiana Bond Bank Rev., | | |
| Unit School District | | | | Series 2006 A, 5.00%, | | |
| No. 304 GO, 6.20%, 1/1/15, | | | | 8/1/18 (AGM)(1) | 1,600,000 | 1,792,304 |
| Prerefunded at 100% of | | | | | | |
| Par (AGM)(1)(2) | 930,000 | 1,118,874 | | Indiana Bond Bank Rev., | | |
| | | | | Series 2006 A, 5.00%, | | |
| Metropolitan Pier & | | | | 8/1/19 (AGM)(1) | 1,680,000 | 1,863,339 |
| Exposition Auth. Rev., | | | | | | |
| Series 2002 A, (Capital | | | | Indiana Finance Auth. Lease | | |
| Appreciation – McCormick | | | | Rev., Series 2008 A1, | | |
| | | | | 5.00%, 11/1/16(1) | 5,000,000 | 5,625,700 |
| Place Exposition), 5.81%, | | | | | | |
| 12/15/31 (NATL)(1)(5) | 48,370,000 | 14,080,991 | | Indiana Finance Auth. Rev., | | |
| Ogle Lee & De Kalb Counties | | | | (United States Steel Corp.), | | |
| | | | | 6.00%, 12/1/26(1) | 1,250,000 | 1,281,750 |
| Township High School | | | | | | |
| District No. 212 GO, 6.00%, | | | | Indiana Municipal Power | | |
| 12/1/11, Prerefunded at | | | | Agency Rev., Series 2009 B, | | |
| 100% of Par (NATL)(1)(2) | 1,035,000 | 1,120,067 | | (Power Supply System), | | |
| | | | | 5.25%, 1/1/24(1) | 2,545,000 | 2,764,659 |
| Ogle Lee & De Kalb Counties | | | | | | |
| Township High School | | | | Indiana Municipal Power | | |
| District No. 212 GO, 6.00%, | | | | Agency Rev., Series 2009 B, | | |
| 12/1/11, Prerefunded at | | | | (Power Supply System), | | |
| 100% of Par (NATL)(1)(2) | 1,145,000 | 1,239,107 | | 5.375%, 1/1/25(1) | 1,600,000 | 1,741,584 |
| Ogle Lee & De Kalb Counties | | | | Indiana Transportation | | |
| Township High School | | | | Finance Auth. Rev., | | |
| District No. 212 GO, 6.00%, | | | | Series 1990 A, 7.25%, | | |
| 12/1/18 (NATL)(1) | 75,000 | 80,140 | | 6/1/10, Prerefunded at | | |
| | | | | 100% of Par(1)(2) | 75,000 | 77,484 |
| Regional Transportation | | | | | | |
| Auth. Rev., Series 1990 A, | | | | Indiana Transportation | | |
| 7.20%, 11/1/20 (Ambac)(1) | 1,000,000 | 1,232,820 | | Finance Auth. Rev., Series | | |
| | | | | 1990 A, 7.25%, 6/1/15(1) | 690,000 | 791,368 |
| Rock Island-Mercer et al | | | | | | |
| Counties Community | | | | Indianapolis Local Public | | |
| College District No. 503 GO, | | | | Improvement Bond Bank | | |
| Series 2008 A, (Black | | | | Rev., Series 2002 A, | | |
| Hawk College), 4.00%, | | | | (Water Works), 5.00%, | | |
| 12/1/11 (Ambac)(1) | 1,000,000 | 1,045,800 | | 7/1/12 (NATL)(1) | 1,435,000 | 1,548,537 |
19
| | | | | | |
| Tax-Free Bond | | | | | | |
| |
| | Principal | | | | Principal | |
| | Amount | Value | | | Amount | Value |
| Mount Vernon of Hancock | | | | Kentucky Economic | | |
| County Multi-School | | | | Development Finance Auth. | | |
| Building Corp. Rev., | | | | Rev., Series 2009 A, | | |
| Series 2001 B, (First | | | | (Baptist Healthcare | | |
| Mortgage), 5.75%, 7/15/11, | | | | System), 5.375%, 8/15/24 | $ 3,000,000 | $ 3,251,220 |
| Prerefunded at 100% of | | | | Kentucky Economic | | |
| Par (Ambac)(1)(2) | $ 1,500,000 | $ 1,588,095 | | Development Finance Auth. | | |
| Valparaiso Middle Schools | | | | Rev., Series 2009 A, | | |
| Building Corp. Rev., (First | | | | (Baptist Healthcare | | |
| Mortgage), 5.75%, 7/15/11, | | | | System), 5.625%, 8/15/27 | 1,250,000 | 1,365,312 |
| Prerefunded at 100% of | | | | | | 9,254,252 |
| Par (FGIC)(1)(2) | 1,650,000 | 1,749,429 | | | | |
| | | | | LOUISIANA — 0.3% | | |
| Zionsville Community | | | | | | |
| Schools Building Corp. Rev., | | | | Louisiana Public Facilities | | |
| (First Mortgage), 5.75%, | | | | Auth. Rev., Series 2006 A, | | |
| 1/15/12, Prerefunded at | | | | (Black & Gold Facilities), | | |
| | | | | 4.00%, 7/1/13 (CIFG)(1) | 1,105,000 | 1,109,752 |
| 100% of Par (FGIC)(1)(2) | 1,000,000 | 1,083,290 | | | | |
| | | 24,661,811 | | Louisiana Public Facilities | | |
| | | | | Auth. Rev., Series 2006 A, | | |
| IOWA — 0.4% | | | | (Black & Gold Facilities), | | |
| Iowa Finance Auth. Health | | | | 5.00%, 7/1/15 (CIFG)(1) | 1,205,000 | 1,242,042 |
| Facilities Rev., Series | | | | Louisiana Public Facilities | | |
| 2006 A, (Development Care | | | | Auth. Rev., Series 2007 A, | | |
| Initiatives), 5.25%, 7/1/13(1) | 1,485,000 | 1,472,838 | | (Black & Gold Facilities), | | |
| Iowa Finance Auth. Health | | | | 5.00%, 7/1/22 (CIFG)(1) | 1,465,000 | 1,483,693 |
| Facilities Rev., Series | | | | New Orleans Aviation | | |
| 2006 A, (Development Care | | | | Board Gulf Opportunity | | |
| Initiatives), 5.25%, 7/1/14(1) | 1,950,000 | 1,909,927 | | Zone Rev., Series 2010 A, | | |
| Iowa Finance Auth. Health | | | | (Passenger Facility Charge), | | |
| Facilities Rev., Series | | | | 5.25%, 1/1/41(1) | 2,000,000 | 2,005,880 |
| 2006 A, (Development Care | | | | | | 5,841,367 |
| Initiatives), 5.25%, 7/1/16(1) | 1,690,000 | 1,576,162 | | | | |
| | | | | MAINE — 0.1% | | |
| Iowa Rev., Series 2009 A, | | | | Portland Airport Rev., | | |
| (I-Jobs Program), | | | | 5.00%, 1/1/40 (AGM) (1) | 1,795,000 | 1,809,899 |
| 5.00%, 6/1/22(1) | 2,500,000 | 2,792,100 | | | | |
| | | 7,751,027 | | MARYLAND — 2.5% | | |
| KANSAS — 0.4% | | | | Baltimore Industrial | | |
| | | | | Development Auth. | | |
| Kansas State Department of | | | | Rev., (Baltimore Capital | | |
| Transportation Rev., Series | | | | Acquisition), VRDN, | | |
| 2009 A, 5.00%, 9/1/16(1) | 4,500,000 | 5,276,115 | | 0.37%, 6/2/10 (LOC: | | |
| Wichita Hospital Facilities | | | | Bayerische Landesbank)(1) | 5,445,000 | 5,445,000 |
| Rev., Series 2001 III, | | | | Maryland Economic | | |
| 5.25%, 11/15/13(1) | 1,280,000 | 1,347,469 | | Development Corp. | | |
| Wichita Hospital Facilities | | | | Rev., Series 2010 A, | | |
| Rev., Series 2001 III, | | | | (Transportation Facilities), | | |
| 5.50%, 11/15/16(1) | 1,195,000 | 1,239,633 | | 5.75%, 6/1/35 | 1,000,000 | 1,024,450 |
| | | 7,863,217 | | Maryland GO, Series | | |
| KENTUCKY — 0.5% | | | | 2005 A, (Capital | | |
| | | | | Improvement & Local | | |
| Kentucky Asset/Liability | | | | Facilities), 5.25%, 2/15/15(1) | 10,000,000 | 11,696,800 |
| Commission Agency Fund | | | | | | |
| Rev., Series 2010 A, | | | | Maryland GO, Series 2005 A, | | |
| (Federal Highway Trust), | | | | (State & Local Facilities | | |
| 5.00%, 9/1/20(1) | 4,000,000 | 4,637,720 | | Loan), 5.00%, 8/1/11(1) | 10,000,000 | 10,544,800 |
| | | | | Maryland GO, Series 2009 C, | | |
| | | | | (State & Local Facilities | | |
| | | | | Loan), 5.00%, 11/1/16(1) | 10,000,000 | 11,792,300 |
20
| | | | | | |
| Tax-Free Bond | | | | | | |
| |
| | Principal | | | | Principal | |
| | Amount | Value | | | Amount | Value |
| Maryland Health & Higher | | | | Massachusetts Health & | | |
| Educational Facilities Auth. | | | | Educational Facilities Auth. | | |
| Rev., (Doctors Community | | | | Rev., (Boston Medical | | |
| Hospital), 5.75%, 7/1/38 | $ 2,400,000 | $ 2,322,000 | | Center), 5.25%, 7/1/38(1) | $ 5,000,000 | $ 4,437,900 |
| Maryland Health & Higher | | | | Massachusetts Health | | |
| Educational Facilities Auth. | | | | & Educational Facilities | | |
| Rev., (Johns Hopkins | | | | Auth. Rev., Series 1992 F, | | |
| University), VRDN, | | | | (Massachusetts General | | |
| 3.65%, 11/15/11(1) | 1,000,000 | 1,034,010 | | Hospital), 6.25%, | | |
| Maryland Health & Higher | | | | 7/1/12 (Ambac)(1) | 490,000 | 508,547 |
| Educational Facilities Auth. | | | | Massachusetts Health | | |
| Rev., (Lifebridge Health | | | | & Educational Facilities | | |
| Issue), 5.00%, 7/1/12(1) | 270,000 | 290,255 | | Auth. Rev., Series 2008 A, | | |
| Maryland Health & Higher | | | | (Massachusetts | | |
| Educational Facilities Auth. | | | | Institute of Technology), | | |
| Rev., (Lifebridge Health | | | | 5.00%, 7/1/14(1) | 5,000,000 | 5,748,800 |
| Issue), 5.00%, 7/1/13(1) | 1,565,000 | 1,710,968 | | Massachusetts Health | | |
| Maryland Health & Higher | | | | & Educational Facilities | | |
| Educational Facilities Auth. | | | | Auth. Rev., Series 2009 A, | | |
| Rev., Series 2008 A, | | | | (Harvard University), | | |
| (Johns Hopkins University), | | | | 5.50%, 11/15/36(1) | 6,800,000 | 7,758,256 |
| 5.25%, 7/1/38(1) | 1,645,000 | 1,780,564 | | Massachusetts Health | | |
| | | 47,641,147 | | & Educational Facilities | | |
| | | | | Auth. Rev., Series 2009 O, | | |
| MASSACHUSETTS — 4.0% | | | | (Massachusetts | | |
| Macon Trust Various States | | | | Institute of Technology), | | |
| Rev., Series 2007-344, | | | | 5.75%, 7/1/26(1) | 10,000,000 | 11,731,000 |
| VRDN, 0.38%, 6/1/10 | | | | Massachusetts Health | | |
| (LOC: Bank of America N.A.) | | | | & Educational Facilities | | |
| (LIQ FAC: Bank of | | | | Auth. Rev., Series 2010 A, | | |
| America N.A.)(6) | 5,305,000 | 5,305,000 | | | | |
| | | | | (Northeastern University), | | |
| Massachusetts Bay | | | | 5.00%, 10/1/35 | 2,900,000 | 2,934,858 |
| Transportation Auth. Rev., | | | | Massachusetts Health & | | |
| Series 2008 A, 5.25%, | | | | Educational Facilities Auth. | | |
| 7/1/34(1) | 3,300,000 | 3,576,705 | | | | |
| | | | | Rev., Series 2010 G, (Umass | | |
| Massachusetts Development | | | | Memorial), 5.00%, 7/1/20(1) | 1,500,000 | 1,524,915 |
| Finance Agency Rev., Series | | | | Massachusetts Health & | | |
| 2007 C, (Wheelock College), | | | | Educational Facilities Auth. | | |
| 5.00%, 10/1/17(1) | 1,760,000 | 1,791,258 | | | | |
| | | | | Rev., Series 2010 G, (Umass | | |
| Massachusetts Development | | | | Memorial), 5.00%, 7/1/21(1) | 1,050,000 | 1,059,901 |
| Finance Agency Rev., | | | | Massachusetts | | |
| Series 2009 V2, | | | | State Department of | | |
| (Boston University), | | | | Transportation Metropolitan | | |
| 2.875%, 10/1/14(1) | 5,000,000 | 5,185,850 | | | | |
| | | | | Highway Rev., Series | | |
| Massachusetts GO, Series | | | | 2010 B, (Metropolitan | | |
| 2002 C, (Consolidated | | | | Senior), 5.00%, 1/1/23(1) | 1,000,000 | 1,080,630 |
| Loan of 2002), 5.50%, | | | | Massachusetts | | |
| 11/1/12 (AGM)(1) | 10,000,000 | 11,131,800 | | | | |
| | | | | State Department of | | |
| Massachusetts GO, Series | | | | Transportation Metropolitan | | |
| 2006 D, (Consolidated Loan | | | | Highway Rev., Series | | |
| of 2002), 5.00%, 8/1/14(1) | 2,500,000 | 2,859,650 | | 2010 B, (Metropolitan | | |
| Massachusetts GO, | | | | Senior), 5.00%, 1/1/24(1) | 6,000,000 | 6,414,660 |
| Series 2010 A, VRN, | | | | | | 78,057,880 |
| 0.67%, 6/3/10(1) | 5,000,000 | 5,008,150 | | | | |
21
| | | | | | |
| Tax-Free Bond | | | | | | |
| |
| | Principal | | | | Principal | |
| | Amount | Value | | | Amount | Value |
| MICHIGAN — 2.6% | | | | Wayne Charter County | | |
| Grand Rapids Economic | | | | Airport Rev., Series | | |
| Development Corp. Rev., | | | | 2002 C, 5.375%, | | |
| (St. Dominic Grand Rapids), | | | | 12/1/13 (NATL/FGIC)(1) | $ 2,215,000 | $ 2,407,439 |
| VRDN, 2.60%, 6/3/10 (LOC: | | | | Wayne Charter County | | |
| Allied Irish Bank plc)(1) | $ 10,420,000 | $ 10,420,000 | | Airport Rev., Series | | |
| Grand Valley State University | | | | 2002 C, 5.375%, | | |
| Rev., 5.75%, 12/1/10, | | | | 12/1/14 (NATL/FGIC)(1) | 2,335,000 | 2,512,694 |
| Prerefunded at 100% of | | | | Wayne County Airport Auth. | | |
| Par (FGIC)(1)(2) | 1,485,000 | 1,526,268 | | Rev., (Detroit Metropolitan | | |
| Kalamazoo Public Schools | | | | Airport), 5.00%, 12/1/18 | | |
| GO, (Building & Site), | | | | (NATL/FGIC)(1) | 3,000,000 | 3,127,860 |
| 4.00%, 5/1/13 (AGM)(1) | 1,265,000 | 1,355,688 | | Wayne County Airport Auth. | | |
| Kalamazoo Public Schools | | | | Rev., (Detroit Metropolitan | | |
| GO, (Building & Site), | | | | Airport), 5.00%, 12/1/19 | | |
| 5.25%, 5/1/16 (AGM)(1) | 1,545,000 | 1,763,617 | | (NATL/FGIC)(1) | 2,000,000 | 2,066,720 |
| Michigan Building Auth. | | | | | | 51,237,367 |
| Rev., Series 2003 I, | | | | MINNESOTA — 0.7% | | |
| (Facilities Program), 5.25%, | | | | Minnesota GO, Series | | |
| 10/15/11 (AGM)(1) | 5,000,000 | 5,273,900 | | 2008 A, 5.00%, 6/1/13(1) | 10,000,000 | 11,220,500 |
| Michigan Building Auth. | | | | Minnesota Higher Education | | |
| Rev., Series 2009 I, | | | | Facilities Auth. Rev., | | |
| (Facilities Program), | | | | Series 2005-6G, | | |
| 5.25%, 10/15/20(1) | 4,000,000 | 4,421,000 | | (Saint John University), | | |
| Michigan Higher Education | | | | 5.00%, 10/1/12(1) | 1,500,000 | 1,616,730 |
| Facilities Auth. Rev., | | | | | | 12,837,230 |
| (Limited Obligation – | | | | | | |
| Hillsdale College), | | | | MISSISSIPPI — 0.7% | | |
| 5.00%, 3/1/26(1) | 2,345,000 | 2,372,038 | | Mississippi Development | | |
| Oakland County Economic | | | | Bank Special Obligation | | |
| Development Corp. Rev., | | | | Rev., Series 2006 A, | | |
| (Lourdes Assisted Living), | | | | (Biloxi, Mississippi), | | |
| | | | | 5.00%, 11/1/15 (Ambac)(1) | 1,565,000 | 1,756,744 |
| VRDN, 2.60%, 6/3/10 (LOC: | | | | | | |
| Allied Irish Bank plc)(1) | 5,325,000 | 5,325,000 | | Mississippi Development | | |
| Pontiac City School District | | | | Bank Special Obligation | | |
| GO, 5.00%, 5/1/13 (XLCA)(1) | 695,000 | 721,764 | | Rev., Series 2006 A, | | |
| | | | | (Biloxi, Mississippi), | | |
| Pontiac City School District | | | | 5.00%, 11/1/16 (Ambac)(1) | 1,645,000 | 1,841,117 |
| GO, 5.00%, 5/1/14 (XLCA)(1) | 1,010,000 | 1,019,989 | | | | |
| | | | | Mississippi Development | | |
| Pontiac City School District | | | | Bank Special Obligation | | |
| GO, 5.00%, 5/1/15 (XLCA)(1) | 1,260,000 | 1,261,588 | | Rev., Series 2006 A, | | |
| Pontiac City School District | | | | (Municipal Energy Agency | | |
| GO, 5.00%, 5/1/16 (XLCA)(1) | 1,425,000 | 1,396,358 | | Power Supply), 5.00%, | | |
| Pontiac City School District | | | | 3/1/17 (XLCA)(1) | 1,000,000 | 1,035,820 |
| GO, 5.00%, 5/1/17 (XLCA)(1) | 1,595,000 | 1,536,192 | | Mississippi Development | | |
| Taylor GO, 5.00%, | | | | Bank Special Obligation | | |
| 9/1/11 (NATL)(1) | 575,000 | 605,044 | | Rev., Series 2007 A, | | |
| �� | | | | (Mississippi Development | | |
| Wayne Charter County | | | | Bank), 5.00%, 7/1/19 | | |
| Airport Rev., Series | | | | (Ambac)(1) | 4,620,000 | 4,965,437 |
| 2002 C, 5.00%, 12/1/11 | | | | | | |
| (NATL/FGIC)(1) | 2,010,000 | 2,124,208 | | University of Southern | | |
| | | | | Mississippi Educational | | |
| | | | | Building Co. Rev., | | |
| | | | | Series 2006 A, 5.00%, | | |
| | | | | 3/1/17 (AGM)(1) | 1,195,000 | 1,345,988 |
22
| | | | | | |
| Tax-Free Bond | | | | | | |
| |
| | Principal | | | | Principal | |
| | Amount | Value | | | Amount | Value |
| University of Southern | | | | Nebraska Public Power | | |
| Mississippi Educational | | | | District Rev., Series 2008 B, | | |
| Building Co. Rev., | | | | 5.00%, 1/1/20(1) | $ 2,500,000 | $ 2,765,600 |
| Series 2006 A, 5.00%, | | | | Omaha Public Power District | | |
| 3/1/18 (AGM)(1) | $ 1,940,000 | $ 2,161,839 | | Electric System Rev., Series | | |
| | | 13,106,945 | | 2007 A, 5.00%, 2/1/21(1) | 3,000,000 | 3,310,350 |
| MISSOURI — 1.2% | | | | | | 8,274,150 |
| Jackson County Public | | | | NEVADA — 0.2% | | |
| Building Corp. Rev., | | | | Clark County Economic | | |
| Series 2006 A, (Capital | | | | Development Rev., | | |
| Improvements), 5.00%, | | | | (University of Southern | | |
| 12/1/15 (NATL)(1) | 1,425,000 | 1,615,337 | | Nevada), 5.00%, | | |
| Missouri Development | | | | 4/1/22 (Radian)(1) | 1,000,000 | 947,660 |
| Finance Board Infrastructure | | | | Reno Sales & Room | | |
| Facilities Rev., Series | | | | Tax Rev., (ReTrac-Reno | | |
| 2000 C, (St. Louis | | | | Transportation Rail Access | | |
| Convention Center), | | | | Corridor) (Senior Lien), | | |
| VRDN, 0.30%, 6/1/10 | | | | 5.50%, 6/1/12, Prerefunded | | |
| (LOC: U.S. Bank N.A.) | 3,700,000 | 3,700,000 | | at 100% of Par (Ambac)(1)(2) | 1,550,000 | 1,696,227 |
| Missouri Health & | | | | Reno Sales & Room | | |
| Educational Facilities Auth. | | | | Tax Rev., (ReTrac-Reno | | |
| Rev., Series 2008 A, (The | | | | Transportation Rail Access | | |
| Washington University), | | | | Corridor) (Senior Lien), | | |
| 5.375%, 3/15/39(1) | 2,000,000 | 2,190,240 | | 5.50%, 6/1/12, Prerefunded | | |
| Missouri Joint Municipal | | | | at 100% of Par (Ambac)(1)(2) | 1,865,000 | 2,040,944 |
| Electric Utility Commission | | | | | | 4,684,831 |
| Rev., (Plum Point), 5.00%, | | | | | | |
| 1/1/16 (NATL)(1) | 3,145,000 | 3,322,032 | | NEW HAMPSHIRE — 0.3% | | |
| Missouri State Highways & | | | | New Hampshire Health & | | |
| Transportation Commission | | | | Education Facilities Auth. | | |
| Rev., Series 2006 A, (First | | | | Rev., Series 2004 A, | | |
| Lien), 5.00%, 5/1/13(1) | 3,030,000 | 3,388,661 | | (Kendal at Hanover), | | |
| | | | | 5.00%, 10/1/11(1) | 1,660,000 | 1,707,692 |
| Missouri State Highways & | | | | | | |
| Transportation Commission | | | | New Hampshire Health & | | |
| Rev., Series 2010 A, | | | | Education Facilities Auth. | | |
| 5.00%, 5/1/18(1) | 2,700,000 | 3,168,720 | | Rev., Series 2004 A, | | |
| | | | | (Kendal at Hanover), | | |
| Platte County Industrial | | | | 5.00%, 10/1/12(1) | 305,000 | 317,630 |
| Development Auth. Rev., | | | | | | |
| (Zona Rosa Retail), | | | | New Hampshire Health & | | |
| 5.00%, 12/1/32(1) | 1,000,000 | 1,036,710 | | Education Facilities Auth. | | |
| | | | | Rev., Series 2004 A, | | |
| St. Louis County Industrial | | | | (Kendal at Hanover), | | |
| Development Educational | | | | 5.00%, 10/1/13(1) | 1,030,000 | 1,072,992 |
| Facilities Auth. Rev., | | | | | | |
| (Gateway Academy), | | | | New Hampshire Health & | | |
| VRDN, 0.37%, 6/3/10(1) | 2,800,000 | 2,800,000 | | Education Facilities Auth. | | |
| | | | | Rev., Series 2004 A, | | |
| St. Louis Municipal Finance | | | | (Kendal at Hanover), | | |
| Corp. Rev., Series 2006 A, | | | | 5.00%, 10/1/18(1) | 2,060,000 | 2,122,191 |
| (Carnahan Courthouse), | | | | | | |
| 4.00%, 2/15/17 (Ambac)(1) | 1,000,000 | 1,050,130 | | | | 5,220,505 |
| | | 22,271,830 | | NEW JERSEY — 3.7% | | |
| NEBRASKA — 0.4% | | | | New Jersey Economic | | |
| | | | | Development Auth. Rev., | | |
| Nebraska Public Power | | | | Series 2008 Y, (School | | |
| District Rev., Series 2007 B, | | | | Facility Construction), | | |
| 5.00%, 1/1/13 (AGM)(1) | 2,000,000 | 2,198,200 | | 5.00%, 9/1/33(1) | 220,000 | 231,691 |
23
| | | | | | |
| Tax-Free Bond | | | | | | |
| |
| | Principal | | | | Principal | |
| | Amount | Value | | | Amount | Value |
| New Jersey GO, | | | | Metropolitan Transportation | | |
| 5.00%, 8/1/14(1) | $ 5,000,000 | $ 5,705,550 | | Auth. Rev., Series 2008 B, | | |
| New Jersey GO, | | | | VRDN, 5.00%, 11/15/13(1) | $ 4,000,000 | $ 4,413,040 |
| 5.00%, 6/1/17(1) | 4,500,000 | 5,215,995 | | Metropolitan Transportation | | |
| New Jersey Sports & | | | | Auth. Rev., Series 2008 C, | | |
| Exposition Auth. Rev., Series | | | | 6.25%, 11/15/23(1) | 5,000,000 | 5,914,400 |
| 2008 B, 5.00%, 9/1/18(1) | 7,300,000 | 8,180,818 | | Nassau County Interim | | |
| New Jersey State Turnpike | | | | Finance Auth. Rev., | | |
| Auth. Rev., Series 2009 G, | | | | Series 2009 A, (Sales Tax), | | |
| 5.00%, 1/1/18(1) | 1,700,000 | 1,915,730 | | 5.00%, 11/15/21(1) | 1,800,000 | 2,078,496 |
| New Jersey Transit Corp. | | | | Nassau County Interim | | |
| COP, 5.00%, 10/1/12 | | | | Finance Auth. Rev., | | |
| (AGM)(1) | 4,235,000 | 4,568,845 | | Series 2009 A, (Sales Tax), | | |
| | | | | 5.00%, 11/15/23(1) | 1,500,000 | 1,705,560 |
| New Jersey Transit Corp. | | | | | | |
| COP, 5.00%, 10/1/13 | | | | New York City Municipal | | |
| (AGM)(1) | 5,595,000 | 6,151,590 | | Water Finance Auth. Water | | |
| | | | | & Sewer Rev., Series | | |
| New Jersey Transportation | | | | 2008 C, 5.00%, 6/15/17(1) | 1,350,000 | 1,568,808 |
| Trust Fund Auth. Rev., | | | | | | |
| Series 2003 B2, 5.00%, | | | | New York City Municipal | | |
| 12/15/16(1) | 10,000,000 | 11,180,700 | | Water Finance Auth. Water | | |
| | | | | & Sewer Rev., Series | | |
| New Jersey Transportation | | | | 2009 EE, 5.00%, 6/15/39(1) | 10,000,000 | 10,596,800 |
| Trust Fund Auth. Rev., | | | | | | |
| Series 2004 B, 5.25%, | | | | New York City Transitional | | |
| 12/15/12 (NATL/FGIC)(1) | 7,400,000 | 8,187,212 | | Finance Auth. Rev., Series | | |
| | | | | 2004 D2, 5.00%, 11/1/12(1) | 8,500,000 | 9,362,750 |
| New Jersey Transportation | | | | | | |
| Trust Fund Auth. Rev., Series | | | | New York City Transitional | | |
| 2006 A, 5.25%, 12/15/20(1) | 15,000,000 | 16,989,600 | | Finance Auth. Rev., Series | | |
| | | | | 2005 A1, 5.00%, 11/1/10(1) | 2,000,000 | 2,040,320 |
| Tobacco Settlement | | | | | | |
| Financing Corp. Rev., Series | | | | New York City Transitional | | |
| 2007 1A, 5.00%, 6/1/41(1) | 3,500,000 | 2,372,580 | | Finance Auth. Rev., Series | | |
| | | | | 2007 B, 5.00%, 11/1/19(1) | 8,000,000 | 9,048,640 |
| | | 70,700,311 | | | | |
| | | | | New York City Transitional | | |
| NEW MEXICO — 0.5% | | | | Finance Auth. Rev., Series | | |
| Clayton Rev., (Jail Project), | | | | 2009 S4, 5.50%, 1/15/39(1) | 1,700,000 | 1,853,374 |
| 5.00%, 11/1/10 (CIFG)(1) | 2,040,000 | 2,063,746 | | | | |
| | | | | New York GO, Series 2003 I, | | |
| Los Alamos County, Inc. | | | | 5.75%, 3/1/13, Prerefunded | | |
| Utility System Rev., | | | | at 100% of Par(1)(2) | 5,000,000 | 5,663,800 |
| Series 2004 A, 5.00%, | | | | New York GO, Series 2004 D, | | |
| 7/1/11 (AGM)(1) | 6,675,000 | 6,994,799 | | | | |
| | | | | 5.00%, 11/1/17 (AGM)(1) | 5,195,000 | 5,688,993 |
| San Juan County Gross | | | | New York GO, Series | | |
| Receipts Tax Rev., | | | | 2006 J1, 5.00%, 6/1/18(1) | 4,000,000 | 4,431,720 |
| Series 2001 A, 5.75%, | | | | | | |
| 9/15/11, Prerefunded at | | | | New York GO, Series | | |
| 101% of Par (Ambac)(1)(2) | 1,415,000 | 1,525,441 | | 2008 J1, 5.00%, 8/1/13(1) | 5,855,000 | 6,544,251 |
| | | 10,583,986 | | New York GO, Series 2009 A, | | |
| | | | | 5.00%, 2/15/39(1) | 1,700,000 | 1,800,827 |
| NEW YORK — 10.9% | | | | | | |
| | | | | New York GO, Series 2009 E, | | |
| Brooklyn Arena Local | | | | 5.00%, 8/1/16(1) | 2,600,000 | 2,969,226 |
| Development Corp. Rev., | | | | | | |
| (Barclays Center), | | | | New York GO, Series | | |
| 6.25%, 7/15/40(1) | 3,700,000 | 3,815,736 | | 2009 H1, 5.00%, 3/1/17(1) | 3,000,000 | 3,414,600 |
| Franklin County Industrial | | | | New York GO, Series | | |
| Development Agency Rev., | | | | 2009 H1, 5.00%, 3/1/22(1) | 7,000,000 | 7,756,840 |
| (Trudeau Institute, Inc.), | | | | New York GO, Series | | |
| VRDN, 0.40%, 6/1/10 | | | | 2009 J1, 5.00%, 5/15/22(1) | 6,570,000 | 7,293,751 |
| (LOC: HSBC Bank N.A.)(1) | 500,000 | 500,000 | | | | |
24
| | | | | | |
| Tax-Free Bond | | | | | | |
| |
| | Principal | | | | Principal | |
| | Amount | Value | | | Amount | Value |
| New York Local Government | | | | New York State Urban | | |
| Assistance Corp. Rev., Series | | | | Development Corp. Rev., | | |
| 2003 A5/6, 5.00%, 4/1/18(1) | $ 10,000,000 | $ 11,686,900 | | Series 2009 C, (Personal | | |
| New York State Dormitory | | | | Income Tax), 5.00%, | | |
| Auth. Rev., (Brooklyn Law | | | | 12/15/17(1) | $ 7,000,000 | $ 8,173,690 |
| School), 5.75%, 7/1/33(1) | 1,000,000 | 1,086,940 | | Niagara Falls Bridge | | |
| New York State Dormitory | | | | Commission Toll Rev., Series | | |
| Auth. Rev., (Columbia | | | | 1993 A, (Bridge System), | | |
| University), 4.00%, 7/1/13(1) | 3,500,000 | 3,828,370 | | 4.00%, 10/1/19 (AGC)(1) | 3,150,000 | 3,350,687 |
| New York State Dormitory | | | | Niagara Falls Bridge | | |
| Auth. Rev., Series 1990 A, | | | | Commission Toll Rev., Series | | |
| (UNIC Educational | | | | 1993 B, 5.25%, 10/1/15 | | |
| Facilities), 7.50%, | | | | (NATL/FGIC)(1) | 855,000 | 910,678 |
| 5/15/13 (NATL-IBC)(1) | 1,440,000 | 1,671,998 | | Suffolk County Industrial | | |
| New York State Dormitory | | | | Development Agency | | |
| Auth. Rev., Series 2005 B, | | | | Rev., (New York | | |
| (Court Facilities Lease), | | | | Institute of Technology), | | |
| VRDN, 0.34%, 6/2/10 (LOC: | | | | 5.25%, 3/1/17(1) | 1,000,000 | 1,058,360 |
| Bayerische Landesbank)(1) | 9,500,000 | 9,500,000 | | Suffolk County Industrial | | |
| New York State Dormitory | | | | Development Agency | | |
| Auth. Rev., Series 2005 F, | | | | Rev., (New York | | |
| 5.00%, 3/15/12 (AGM)(1) | 1,000,000 | 1,078,470 | | Institute of Technology), | | |
| | | | | 5.25%, 3/1/18(1) | 1,000,000 | 1,048,270 |
| New York State Dormitory | | | | | | |
| Auth. Rev., Series 2008 B, | | | | Suffolk County Industrial | | |
| 5.75%, 3/15/36(1) | 10,000,000 | 11,389,800 | | Development Agency | | |
| | | | | Rev., (New York | | |
| New York State Dormitory | | | | Institute of Technology), | | |
| Auth. Rev., Series 2009 A, | | | | 5.25%, 3/1/20(1) | 1,250,000 | 1,291,400 |
| 5.25%, 2/15/25(1) | 8,825,000 | 9,989,988 | | | | |
| | | | | Suffolk County Industrial | | |
| New York State Dormitory | | | | Development Agency | | |
| Auth. Rev., Series 2009 A, | | | | Rev., (New York | | |
| 5.00%, 2/15/39(1) | 4,000,000 | 4,249,240 | | | | |
| | | | | Institute of Technology), | | |
| New York State Dormitory | | | | 5.00%, 3/1/26(1) | 1,175,000 | 1,184,799 |
| Auth. Rev., Series 2009 A, | | | | Triborough Bridge & Tunnel | | |
| (North Shore Long Island | | | | Auth. Rev., Series 2008 B3, | | |
| Jewish Health System), | | | | VRDN, 5.00%, 11/15/15(1) | 5,000,000 | 5,651,850 |
| 5.50%, 5/1/37(1) | 1,200,000 | 1,238,364 | | | | |
| | | | | Triborough Bridge & Tunnel | | |
| New York State Dormitory | | | | Auth. Rev., Series 2008 C, | | |
| Auth. Rev., Series 2010 A, | | | | 5.00%, 11/15/38(1) | 10,000,000 | 10,528,300 |
| (Mount Sinai Hospital), | | | | | | |
| 5.00%, 7/1/21(3) | 1,785,000 | 1,892,386 | | Triborough Bridge & Tunnel | | |
| | | | | Auth. Rev., Series 2010 A1, | | |
| New York State Dormitory | | | | VRDN, 4.00%, 11/15/12(1) | 8,000,000 | 8,566,000 |
| Auth. Rev., Series 2010 A, | | | | | | |
| (Mount Sinai Hospital), | | | | Troy Capital Resource Corp. | | |
| 5.00%, 7/1/22(3) | 2,750,000 | 2,892,395 | | Rev., Series 2010 A, | | |
| | | | | (Rensselaer Polytechnic), | | |
| New York State Thruway | | | | 5.125%, 9/1/40(1) | 3,040,000 | 3,109,190 |
| Auth. Rev., Series 2009 A1, | | | | | | |
| 5.00%, 4/1/23(1) | 3,000,000 | 3,335,910 | | | | 210,671,937 |
| New York State Urban | | | | NORTH CAROLINA — 1.4% | | |
| Development Corp. Rev., | | | | Charlotte GO, | | |
| Series 2009 C, (Personal | | | | 5.00%, 8/1/19(1) | 2,000,000 | 2,344,640 |
| Income Tax), 5.00%, | | | | Charlotte Water & | | |
| 12/15/15(1) | 3,000,000 | 3,496,020 | | Sewer System Rev., | | |
| | | | | 5.00%, 7/1/17(1) | 1,000,000 | 1,176,080 |
25
| | | | | | |
| Tax-Free Bond | | | | | | |
| |
| | Principal | | | | Principal | |
| | Amount | Value | | | Amount | Value |
| Greensboro Rev., | | | | Cleveland COP, Series 2010 | | |
| (Combined Enterprise | | | | A, (Cleveland Stadium), | | |
| System), 5.25%, 6/1/20(1) | $ 2,060,000 | $ 2,485,472 | | 5.00%, 11/15/19(1) | $ 2,450,000 | $ 2,540,258 |
| North Carolina Eastern | | | | Mad River Local School | | |
| Municipal Power Agency | | | | District GO, (Classroom | | |
| Rev., Series 2009 A, | | | | Facilities), 5.75%, 12/1/12, | | |
| 5.00%, 1/1/17(1) | 2,790,000 | 3,074,050 | | Prerefunded at 100% of | | |
| North Carolina Eastern | | | | Par (FGIC)(1)(2) | 1,150,000 | 1,291,853 |
| Municipal Power Agency | | | | Milford Exempt Village | | |
| Rev., Series 2009 A, | | | | School District GO, (School | | |
| 5.00%, 1/1/18(1) | 2,955,000 | 3,254,371 | | Improvements), 6.00%, | | |
| North Carolina Eastern | | | | 12/1/11, Prerefunded at | | |
| Municipal Power Agency | | | | 100% of Par (AGM)(1)(2) | 1,700,000 | 1,837,921 |
| Rev., Series 2009 B, | | | | Ohio GO, Series 2005 A, | | |
| 5.00%, 1/1/26(1) | 5,600,000 | 5,887,112 | | (Infrastructure | | |
| North Carolina Municipal | | | | Improvement), | | |
| Power Agency No. 1 | | | | 5.00%, 9/1/11(1) | 1,005,000 | 1,062,285 |
| Catawba Electric Rev., | | | | Ohio GO, Series 2005 A, | | |
| Series 2003 A, | | | | (Infrastructure | | |
| 5.50%, 1/1/13(1) | 2,000,000 | 2,210,120 | | Improvement), | | |
| North Carolina Municipal | | | | 5.00%, 9/1/12(1) | 1,365,000 | 1,496,845 |
| Power Agency No. 1 | | | | Ohio Higher Educational | | |
| Catawba Electric Rev., | | | | Facility Commission Rev., | | |
| Series 2008 C, | | | | (Oberlin College), | | |
| 5.25%, 1/1/19(1) | 2,500,000 | 2,817,775 | | 5.00%, 10/1/19(1) | 5,000,000 | 5,787,150 |
| North Carolina Municipal | | | | Ohio Higher Educational | | |
| Power Agency No. 1 | | | | Facility Commission Rev., | | |
| Catawba Electric Rev., | | | | Series 1990 B, (Case | | |
| Series 2008 C, | | | | Western Reserve University), | | |
| 5.25%, 1/1/20(1) | 2,000,000 | 2,234,340 | | 6.50%, 10/1/20(1) | 750,000 | 905,220 |
| North Carolina Municipal | | | | Ohio State University (The) | | |
| Power Agency No. 1 | | | | Rev., Series 2009 A, | | |
| Catawba Electric Rev., | | | | 5.00%, 12/1/27(1) | 2,000,000 | 2,184,480 |
| Series 2009 A, | | | | Ohio State University (The) | | |
| 5.00%, 1/1/30(1) | 1,800,000 | 1,864,764 | | Rev., Series 2010 A, | | |
| | | 27,348,724 | | 5.00%, 12/1/16(1) | 4,000,000 | 4,654,880 |
| NORTH DAKOTA — 0.1% | | | | Ohio Water Development | | |
| Grand Forks Health Care | | | | Auth. Rev., (Drinking | | |
| System Rev., (Altru | | | | Water Assistance Fund), | | |
| Health System Obligation | | | | 5.00%, 6/1/28(1) | 2,000,000 | 2,173,720 |
| Group), 7.125%, 8/15/10, | | | | Ohio Water Development | | |
| Prerefunded at 101% | | | | Auth. Rev., (Water Pollution | | |
| of Par(1)(2) | 1,500,000 | 1,536,450 | | Control Loan Fund), | | |
| OHIO — 2.0% | | | | 5.00%, 12/1/13(1) | 5,895,000 | 6,699,373 |
| American Municipal | | | | Summit County GO, 5.75%, | | |
| Power-Ohio, Inc. Rev., | | | | 12/1/12, Prerefunded at | | |
| Series 2008 A, | | | | 101% of Par (FGIC)(1)(2) | 1,505,000 | 1,705,391 |
| (Prairie State Energy | | | | Tri Valley Local School | | |
| Campus), 5.00%, 2/15/17(1) | 1,000,000 | 1,120,310 | | District GO, 5.75%, 6/1/12, | | |
| Buckeye Tobacco Settlement | | | | Prerefunded at 100% of | | |
| Financing Auth. Rev., | | | | Par (FGIC)(1)(2) | 1,550,000 | 1,707,867 |
| Series 2007 A2, (Asset- | | | | | | 39,432,361 |
| Backed Senior Current | | | | | | |
| Interest Turbo Term), | | | | | | |
| 5.875%, 6/1/30(1) | 5,265,000 | 4,264,808 | | | | |
26
| | | | | | |
| Tax-Free Bond | | | | | | |
| |
| | Principal | | | | Principal | |
| | Amount | Value | | | Amount | Value |
| OKLAHOMA — 0.7% | | | | PENNSYLVANIA — 6.1% | | |
| Comanche County Hospital | | | | Allegheny County Hospital | | |
| Auth. Rev., 5.00%, | | | | Development Auth. Rev., | | |
| 7/1/11 (Radian)(1) | $ 855,000 | $ 879,256 | | Series 2008 A, (University of | | |
| Comanche County Hospital | | | | Pittsburgh Medical Center), | | |
| Auth. Rev., 5.00%, | | | | 5.00%, 9/1/11(1) | $ 4,000,000 | $ 4,202,600 |
| 7/1/12 (Radian)(1) | 1,425,000 | 1,493,557 | | Allegheny County Hospital | | |
| Oklahoma County Finance | | | | Development Auth. Rev., | | |
| Auth. Rev., (Western Heights | | | | Series 2008 A, (University of | | |
| Public Schools), 4.00%, | | | | Pittsburgh Medical Center), | | |
| 9/1/10 (AGC)(1) | 1,300,000 | 1,311,141 | | 5.00%, 9/1/12(1) | 6,210,000 | 6,703,695 |
| Oklahoma Development | | | | Allegheny County Hospital | | |
| Finance Auth. Health System | | | | Development Auth. Rev., | | |
| Rev., Series 2008 C, 5.50%, | | | | Series 2008 A, (University of | | |
| 8/15/22 (Obligated Group | | | | Pittsburgh Medical Center), | | |
| Consisting of INTEGRIS | | | | 5.00%, 9/1/18(1) | 1,500,000 | 1,637,595 |
| Baptist Medical Center, Inc., | | | | Allegheny County Industrial | | |
| INTEGRIS South Oklahoma | | | | Development Auth. Rev., | | |
| City Hospital Corp. | | | | (Residential Resources, | | |
| and INTEGRIS Rural | | | | Inc.), 4.75%, 9/1/14(1) | 2,250,000 | 2,343,060 |
| Heath, Inc.)(1) | 3,000,000 | 3,288,000 | | Central Dauphin School | | |
| Pottawatomie County | | | | District GO, 7.00%, 2/1/16, | | |
| Facilities Auth. Rev., | | | | Prerefunded at 100% of | | |
| (Shawnee Public Schools), | | | | Par (NATL)(1)(2) | 1,150,000 | 1,465,135 |
| 5.00%, 9/1/13(1) | 1,610,000 | 1,707,276 | | Commonwealth of | | |
| Pottawatomie County | | | | Pennsylvania GO, | | |
| Facilities Auth. Rev., | | | | 5.00%, 7/1/19(1) | 15,000,000 | 17,652,000 |
| (Shawnee Public Schools), | | | | East Stroudsburg Area | | |
| 5.00%, 9/1/14(1) | 1,730,000 | 1,817,313 | | School District GO, 7.75%, | | |
| Pottawatomie County | | | | 9/1/16, Prerefunded at | | |
| Facilities Auth. Rev., | | | | 100% of Par (AGM)(1)(2) | 2,580,000 | 3,428,975 |
| (Shawnee Public Schools), | | | | Exeter Township GO, 5.25%, | | |
| 5.00%, 9/1/15(1) | 1,710,000 | 1,784,830 | | 7/15/15 (Ambac)(1) | 1,155,000 | 1,335,861 |
| Pottawatomie County | | | | Exeter Township GO, 5.30%, | | |
| Facilities Auth. Rev., | | | | 7/15/19 (Ambac)(1) | 1,830,000 | 2,145,895 |
| (Shawnee Public Schools), | | | | | | |
| 5.00%, 9/1/16(1) | 2,130,000 | 2,204,316 | | Geisinger Auth. Health | | |
| | | | | System Rev., VRN, resets | | |
| | | 14,485,689 | | quarterly at 67% of the | | |
| OREGON — 0.4% | | | | 3-month LIBOR plus | | |
| Clackamas County School | | | | 0.77% with no caps, | | |
| District No. 62 GO, | | | | 1.00%, 8/1/10(1) | 5,000,000 | 3,681,250 |
| 5.50%, 6/15/10 (School | | | | Oxford Area School District | | |
| Bond Guarantee)(1) | 2,015,000 | 2,019,937 | | GO, Series 2001 A, 5.50%, | | |
| Oregon Health & Science | | | | 2/15/12, Prerefunded at | | |
| University Rev., Series | | | | 100% of Par (FGIC)(1)(2) | 1,000,000 | 1,083,150 |
| 2009 A, 5.75%, 7/1/39(1) | 2,900,000 | 3,092,096 | | Pennsylvania Economic | | |
| Oregon State Department | | | | Development Financing | | |
| of Administrative Services | | | | Auth. Rev., Series 2009 A, | | |
| COP, Series 2008 A, 5.00%, | | | | (Albert Einstein Healthcare | | |
| 5/1/13 (AGM)(1) | 2,840,000 | 3,154,814 | | Network), 6.25%, 10/15/23 | 5,000,000 | 5,449,800 |
| | | 8,266,847 | | Pennsylvania GO, 5.375%, | | |
| | | | | 7/1/18 (AGM)(1) | 1,070,000 | 1,284,096 |
27
| | | | | | |
| Tax-Free Bond | | | | | | |
| |
| | Principal | | | | Principal | |
| | Amount | Value | | | Amount | Value |
| Pennsylvania Higher | | | | Puerto Rico Electric Power | | |
| Educational Facilities | | | | Auth. Rev., Series 2010 ZZ, | | |
| Auth. Rev., Series 2009 A, | | | | 5.25%, 7/1/25(1) | $ 5,000,000 | $ 5,263,950 |
| (University of Pennsylvania), | | | | Puerto Rico Electric Power | | |
| 5.00%, 9/1/19(1) | $ 1,000,000 | $ 1,174,010 | | Auth. Rev., Series 2010 ZZ, | | |
| Pennsylvania Turnpike | | | | 5.25%, 7/1/26(1) | 2,100,000 | 2,202,207 |
| Commission Rev., Series | | | | Puerto Rico GO, Series 2006 | | |
| 2009 B, 5.00%, 12/1/16(1) | 5,000,000 | 5,720,000 | | A, (Public Improvement), | | |
| Pennsylvania Turnpike | | | | 5.25%, 7/1/23(1) | 1,975,000 | 2,031,880 |
| Commission Rev., Series | | | | Puerto Rico GO, Series 2006 | | |
| 2009 B, 5.25%, 6/1/22(1) | 10,000,000 | 10,896,600 | | B, (Public Improvement), | | |
| Philadelphia Rev., Series | | | | 5.25%, 7/1/17(1) | 5,000,000 | 5,326,700 |
| 2009 A, (1998 General | | | | Puerto Rico GO, Series 2007 | | |
| Ordinance), 5.25%, 8/1/17(1) | 1,000,000 | 1,061,730 | | A, (Public Improvement), | | |
| Philadelphia School District | | | | 5.50%, 7/1/17(1) | 2,675,000 | 2,915,536 |
| GO, Series 2002 A, 5.25%, | | | | Puerto Rico GO, Series | | |
| 2/1/11 (AGM)(1) | 2,975,000 | 3,070,884 | | 2008 A, 5.50%, 7/1/16(1) | 3,020,000 | 3,314,812 |
| Philadelphia Water & | | | | Puerto Rico GO, Series | | |
| Wastewater Rev., Series | | | | 2008 A, 5.125%, 7/1/28(1) | 3,000,000 | 3,052,530 |
| 2009 A, 5.25%, 1/1/36(1) | 1,415,000 | 1,467,397 | | | | |
| | | | | Puerto Rico Government | | |
| Philadelphia Water & | | | | Development Bank Rev., | | |
| Wastewater Rev., Series | | | | 4.75%, 12/1/15 (NATL)(1) | 20,000,000 | 20,769,800 |
| 2010 A, 5.00%, 6/15/16(1) | 10,000,000 | 11,186,400 | | | | |
| | | | | Puerto Rico Government | | |
| Philadelphia Water & | | | | Development Bank Rev., | | |
| Wastewater Rev., | | | | Series 2006 B, (Senior | | |
| Series 2010 A, 5.00%, | | | | Notes), 5.00%, 12/1/14(1) | 4,000,000 | 4,325,360 |
| 6/15/17 (AGM)(1) | 5,000,000 | 5,646,800 | | | | |
| | | | | Puerto Rico Government | | |
| Pittsburgh GO, Series 2006 | | | | Development Bank Rev., | | |
| B, 5.25%, 9/1/16 (AGM)(1) | 15,805,000 | 17,640,909 | | Series 2006 B, (Senior | | |
| Scranton Parking Auth. Rev., | | | | Notes), 5.00%, 12/1/16(1) | 2,000,000 | 2,153,600 |
| 5.00%, 6/1/22 (Radian)(1) | 1,270,000 | 1,255,331 | | Puerto Rico Highway & | | |
| Westmoreland County | | | | Transportation Auth. | | |
| Industrial Development | | | | Rev., Series 2007 CC, | | |
| Auth. Rev., (Excela Health), | | | | 5.00%, 7/1/14(1) | 475,000 | 512,663 |
| 5.125%, 7/1/30(3) | 465,000 | 460,662 | | Puerto Rico Infrastructure | | |
| Westmoreland County | | | | Financing Auth. Special Tax | | |
| Municipal Auth. Rev., 5.25%, | | | | Rev., Series 2006 B, | | |
| 8/15/15, Prerefunded at | | | | 5.00%, 7/1/13(1) | 2,000,000 | 2,119,700 |
| 100% of Par (AGM)(1)(2) | 4,500,000 | 5,294,475 | | Puerto Rico Municipal | | |
| | | 117,288,310 | | Finance Agency GO, Series | | |
| PUERTO RICO — 4.8% | | | | 2005 A, 5.00%, 8/1/11(1) | 3,700,000 | 3,848,037 |
| Puerto Rico Aqueduct & | | | | Puerto Rico Public Buildings | | |
| Sewer Auth. Rev., Series | | | | Auth. Rev., Series 2004 I, | | |
| 2008 A, (Senior Lien), | | | | (Government Facilities), | | |
| 5.00%, 7/1/12(1) | 4,000,000 | 4,229,360 | | 5.50%, 7/1/14, Prerefunded | | |
| | | | | at 100% of Par(1)(2) | 5,000,000 | 5,783,250 |
| Puerto Rico Aqueduct & | | | | | | |
| Sewer Auth. Rev., Series | | | | Puerto Rico Public Buildings | | |
| 2008 A, (Senior Lien), | | | | Auth. Rev., Series 2007 M, | | |
| 5.00%, 7/1/14(1) | 12,550,000 | 13,577,218 | | (Government Facilities), | | |
| | | | | 5.50%, 7/1/12(1) | 2,000,000 | 2,133,300 |
| Puerto Rico Aqueduct & | | | | | | |
| Sewer Auth. Rev., Series | | | | Puerto Rico Public Buildings | | |
| 2008 A, (Senior Lien), | | | | Auth. Rev., Series 2009 P, | | |
| 6.00%, 7/1/44(1) | 1,750,000 | 1,834,350 | | (Government Facilities), | | |
| | | | | 6.75%, 7/1/36(1) | 6,700,000 | 7,501,052 |
| | | | | | | 92,895,305 |
28
| | | | | | |
| Tax-Free Bond | | | | | | |
| |
| | Principal | | | | Principal | |
| | Amount | Value | | | Amount | Value |
| RHODE ISLAND — 0.2% | | | | Piedmont Municipal Power | | |
| Rhode Island Depositors | | | | Agency Rev., Series | | |
| Economic Protection Corp. | | | | 2009 A3, 5.00%, 1/1/17(1) | $ 3,000,000 | $ 3,327,960 |
| Rev., Series 1993 A, 6.25%, | | | | South Carolina Jobs- | | |
| 8/1/16 (NATL)(1)(2) | $ 2,000,000 | $ 2,479,300 | | Economic Development | | |
| Rhode Island Health & | | | | Auth. Hospital Rev., | | |
| Educational Building Corp. | | | | (Palmetto Health), | | |
| Rev., (Landmark | | | | 5.75%, 8/1/39(1) | 2,700,000 | 2,705,481 |
| Medical Center), 5.00%, | | | | Spartanburg County | | |
| 10/1/17 (Radian)(1) | 1,215,000 | 1,019,203 | | Health Services District, | | |
| | | 3,498,503 | | Inc. Hospital Rev., 5.50%, | | |
| | | | | 4/15/16 (AGM)(1) | 1,095,000 | 1,140,267 |
| SOUTH CAROLINA — 1.6% | | | | | | |
| | | | | Sumter Waterworks | | |
| Charleston Educational | | | | and Sewer System | | |
| Excellence Finance Corp. | | | | Improvement Rev., | | |
| Rev., (Charleston | | | | 5.00%, 12/1/22 (XLCA)(1) | 350,000 | 376,785 |
| County School District), | | | | | | |
| 5.00%, 12/1/19(1) | 5,455,000 | 5,979,771 | | Tobacco Settlement Revenue | | |
| | | | | Management Auth. Rev., | | |
| Kershaw County Public | | | | 5.00%, 6/1/18(1) | 990,000 | 991,000 |
| Schools Foundation | | | | | | |
| Installment Purchase Rev., | | | | | | 31,314,502 |
| (School Improvements), | | | | TENNESSEE — 0.5% | | |
| 5.00%, 12/1/17 (CIFG)(1) | 1,060,000 | 1,135,387 | | Chattanooga Health | | |
| Kershaw County Public | | | | Educational & Housing | | |
| Schools Foundation | | | | Facility Board Rev., | | |
| Installment Purchase Rev., | | | | Series 2005 A, (Campus | | |
| (School Improvements), | | | | Development Foundation, | | |
| 5.00%, 12/1/18 (CIFG)(1) | 2,260,000 | 2,396,210 | | Inc. Phase I LLC), | | |
| Kershaw County Public | | | | 5.00%, 10/1/15(1) | 2,780,000 | 2,879,885 |
| Schools Foundation | | | | Johnson City Health & | | |
| Installment Purchase Rev., | | | | Educational Facilities Board | | |
| (School Improvements), | | | | Hospital Rev., (Mountain | | |
| 5.00%, 12/1/19 (CIFG)(1) | 1,450,000 | 1,523,370 | | States Health Alliance), | | |
| Kershaw County Public | | | | 6.00%, 7/1/38(1) | 1,750,000 | 1,776,338 |
| Schools Foundation | | | | Memphis Electric System | | |
| Installment Purchase Rev., | | | | Rev., 5.00%, 12/1/15(1) | 2,500,000 | 2,900,650 |
| (School Improvements), | | | | Memphis Electric System | | |
| 5.00%, 12/1/20 (CIFG)(1) | 3,000,000 | 3,125,370 | | Rev., 5.00%, 12/1/16(1) | 1,000,000 | 1,163,720 |
| Piedmont Municipal Power | | | | Tennessee State School | | |
| Agency Rev., 6.75%, | | | | Board Auth. Rev., Series | | |
| 1/1/19 (FGIC)(1)(2) | 625,000 | 795,075 | | 2008 B, (Higher Educational | | |
| Piedmont Municipal Power | | | | Facilities), 5.125%, 5/1/33(1) | 1,000,000 | 1,071,310 |
| Agency Rev., 6.75%, | | | | | | 9,791,903 |
| 1/1/19 (NATL/FGIC)(1) | 875,000 | 1,060,518 | | | | |
| | | | | TEXAS — 5.1% | | |
| Piedmont Municipal Power | | | | | | |
| Agency Rev., Series 1991 A, | | | | Allen Independent School | | |
| 6.50%, 1/1/16 (FGIC)(1)(2) | 140,000 | 171,549 | | District GO, (School | | |
| | | | | Building), 5.25%, 2/15/34(1) | 3,325,000 | 3,608,955 |
| Piedmont Municipal Power | | | | | | |
| Agency Rev., Series 1991 A, | | | | Brazos Harbor Industrial | | |
| 6.50%, 1/1/16 (FGIC)(1) | 375,000 | 439,564 | | Development Corp. Rev., | | |
| | | | | (BASF Corp.), VRDN, | | |
| Piedmont Municipal Power | | | | 0.40%, 6/1/10(1) | 500,000 | 500,000 |
| Agency Rev., Series 1991 A, | | | | | | |
| 6.50%, 1/1/16 (FGIC)(1)(2) | 485,000 | 594,295 | | Canadian River | | |
| | | | | Municipal Water Auth. | | |
| Piedmont Municipal Power | | | | Rev., (Conjunctive Use | | |
| Agency Rev., Series | | | | Groundwater), 5.00%, | | |
| 2009 A3, 5.00%, 1/1/16(1) | 5,000,000 | 5,551,900 | | 2/15/19 (Ambac)(1) | 1,000,000 | 1,083,380 |
29
| | | | | | |
| Tax-Free Bond | | | | | | |
| |
| | Principal | | | | Principal | |
| | Amount | Value | | | Amount | Value |
| Cash Special Utility | | | | Hays Consolidated | | |
| District Rev., 5.25%, | | | | Independent School | | |
| 9/1/24 (NATL)(1) | $ 2,035,000 | $ 2,079,160 | | District GO, 6.32%, | | |
| Clint Independent School | | | | 8/15/11 (PSF-GTD)(1)(2)(5) | $ 700,000 | $ 694,904 |
| District GO, (Unlimited | | | | Hays Consolidated | | |
| Tax School Building and | | | | Independent School | | |
| Refunding Bonds), 6.00%, | | | | District GO, 6.32%, | | |
| 2/15/11, Prerefunded at | | | | 8/15/11 (PSF-GTD)(1)(5) | 2,300,000 | 2,282,129 |
| 100% of Par (PSF-GTD)(1)(2) | 340,000 | 353,807 | | Hidalgo County GO, 5.50%, | | |
| Clint Independent School | | | | 8/15/12, Prerefunded at | | |
| District GO, (Unlimited | | | | 100% of Par (FGIC)(1)(2) | 1,295,000 | 1,431,480 |
| Tax School Building and | | | | Hidalgo County GO, 5.50%, | | |
| Refunding Bonds), 6.00%, | | | | 8/15/12, Prerefunded at | | |
| 2/15/17 (PSF-GTD)(1) | 1,475,000 | 1,532,436 | | 100% of Par (FGIC)(1)(2) | 1,750,000 | 1,934,433 |
| Cypress-Fairbanks | | | | Houston Airport System | | |
| Independent School District | | | | Rev., Series 2009 A, (Senior | | |
| GO, (Schoolhouse), 5.00%, | | | | Lien), 5.50%, 7/1/39(1) | 4,000,000 | 4,299,480 |
| 2/15/16 (PSF-GTD)(1) | 1,000,000 | 1,160,320 | | | | |
| | | | | Houston GO, Series 2009 A, | | |
| Dallas-Fort Worth | | | | (Public Improvement), | | |
| International Airport | | | | 5.00%, 3/1/21(1) | 10,000,000 | 11,366,600 |
| Facilities Improvement Corp. | | | | | | |
| Rev., Series 2009 A, | | | | Laredo Community College | | |
| 5.00%, 11/1/24(1) | 1,000,000 | 1,050,930 | | District Combined Fee Rev., | | |
| | | | | 5.25%, 8/1/35 (AGM)(1) | 1,845,000 | 1,896,125 |
| Donna Independent School | | | | | | |
| District GO, 5.00%, | | | | Live Oak GO, 5.25%, | | |
| | | | | 8/1/22 (NATL)(1) | 1,630,000 | 1,700,709 |
| 2/15/15 (PSF-GTD)(1) | 2,000,000 | 2,306,540 | | | | |
| Edcouch-Elsa Independent | | | | Lone Star College System | | |
| | | | | GO, 5.00%, 8/15/21(1) | 1,000,000 | 1,145,440 |
| School District GO, 5.00%, | | | | | | |
| 2/15/14 (PSF-GTD)(1) | 1,115,000 | 1,265,380 | | Lone Star College System | | |
| | | | | GO, 5.00%, 8/15/22(1) | 2,650,000 | 3,010,480 |
| Garza County Public Facility | | | | | | |
| Corp. Rev., 4.75%, 10/1/10(1) | 585,000 | 589,118 | | Lower Colorado River Auth. | | |
| | | | | Rev., 5.00%, 5/15/13(1) | 1,040,000 | 1,151,998 |
| Garza County Public Facility | | | | | | |
| Corp. Rev., 5.00%, 10/1/11(1) | 610,000 | 626,470 | | Lower Colorado River Auth. | | |
| | | | | Rev., 5.00%, 5/15/15(1) | 800,000 | 908,896 |
| Garza County Public Facility | | | | | | |
| Corp. Rev., 5.00%, 10/1/13(1) | 2,015,000 | 2,095,882 | | Lower Colorado River Auth. | | |
| Garza County Public Facility | | | | Rev., (LCRA Transportation | | |
| | | | | Services), 5.00%, 5/15/22(1) | 1,000,000 | 1,101,280 |
| Corp. Rev., 5.25%, 10/1/14(1) | 1,115,000 | 1,169,077 | | | | |
| Garza County Public Facility | | | | Lower Colorado River Auth. | | |
| Corp. Rev., 5.25%, 10/1/15(1) | 1,225,000 | 1,279,941 | | Rev., (LCRA Transportation | | |
| | | | | Services), 5.00%, 5/15/23(1) | 3,435,000 | 3,751,260 |
| Garza County Public Facility | | | | | | |
| Corp. Rev., 5.25%, 10/1/16(1) | 1,145,000 | 1,180,381 | | Lower Colorado River Auth. | | |
| | | | | Rev., (LCRA Transportation | | |
| Garza County Public Facility | | | | Services), 5.00%, 5/15/24(1) | 2,000,000 | 2,163,000 |
| Corp. Rev., 5.50%, 10/1/16(1) | 1,000,000 | 1,095,540 | | | | |
| | | | | Montgomery County GO, | | |
| Gregg County Health | | | | (Road), 5.50%, 3/1/14, | | |
| Facilities Development Corp. | | | | Prerefunded at 100% of | | |
| Rev., Series 2006 A, (Good | | | | Par (Ambac)(1)(2) | 1,740,000 | 2,003,366 |
| Shepherd Medical Center), | | | | | | |
| 5.00%, 10/1/16(1) | 1,000,000 | 1,035,910 | | North Texas Thruway Auth. | | |
| | | | | Rev., Series 2008 H, | | |
| Harris County Cultural | | | | (First Tier), VRDN, | | |
| Education Facilities Finance | | | | 5.00%, 1/1/13(1) | 9,500,000 | 10,213,640 |
| Corp. Rev., Series 2008 B, | | | | | | |
| (The Methodist Hospital | | | | Pasadena Independent | | |
| System), 5.50%, 12/1/18(1) | 2,500,000 | 2,825,900 | | School District GO, | | |
| | | | | Series 1996 A, 6.05%, | | |
| Harris County Rev., Series | | | | 2/15/16 (PSF-GTD)(1) | 550,000 | 665,753 |
| 2009 C, 5.00%, 8/15/17(1) | 5,000,000 | 5,745,150 | | | | |
30
| | | | | | |
| Tax-Free Bond | | | | | | |
| |
| | Principal | | | | Principal | |
| | Amount | Value | | | Amount | Value |
| Southside Independent | | | | Salt Lake City Hospital | | |
| School District GO, | | | | Rev., Series 1988 A, | | |
| Series 2004 A, 5.25%, | | | | (Intermountain Health | | |
| 8/15/25 (PSF-GTD)(1) | $ 2,120,000 | $ 2,318,390 | | Corporation), 8.125%, | | |
| Tarrant County Cultural | | | | 5/15/15(1)(2) | $ 645,000 | $ 753,270 |
| Education Facilities Finance | | | | Utah County Municipal | | |
| Corp. Retirement Facility | | | | Building Auth. Lease Rev., | | |
| Rev., (Air Force Village | | | | 5.25%, 11/1/11, Prerefunded | | |
| Obligated Group), | | | | at 100% of Par (Ambac)(1)(2) | 1,820,000 | 1,941,539 |
| 5.00%, 5/15/16(1) | 1,000,000 | 1,013,870 | | Utah County Municipal | | |
| Texas Public Finance Auth. | | | | Building Auth. Lease Rev., | | |
| Rev., Series 2006 A, | | | | 5.25%, 11/1/11, Prerefunded | | |
| (KIPP, Inc.), 5.25%, | | | | at 100% of Par (Ambac)(1)(2) | 1,915,000 | 2,042,884 |
| 2/15/14 (ACA)(1) | 400,000 | 416,092 | | Utah County Municipal | | |
| Texas State Transportation | | | | Building Auth. Lease Rev., | | |
| Commission Rev., Series | | | | 5.50%, 11/1/11, Prerefunded | | |
| 2006 A, (First Tier), | | | | at 100% of Par (Ambac)(1)(2) | 1,000,000 | 1,070,320 |
| 4.50%, 4/1/16(1) | 5,000,000 | 5,649,000 | | Utah GO, Series 2009 C, | | |
| University of North Texas | | | | 5.00%, 7/1/18(1) | 4,000,000 | 4,749,320 |
| Rev., Series 2009 A, | | | | West Valley City Municipal | | |
| (Financing System), | | | | Building Auth. Lease Rev., | | |
| 5.00%, 4/15/13 | 1,000,000 | 1,111,930 | | Series 2002 A, 5.00%, | | |
| University of North Texas | | | | 8/1/10 (Ambac)(1) | 1,130,000 | 1,138,351 |
| Rev., Series 2009 A, | | | | West Valley City Sales Tax | | |
| (Financing System), | | | | Rev., Series 2001 A, 5.50%, | | |
| 5.00%, 4/15/16 | 1,125,000 | 1,294,088 | | 7/15/11, Prerefunded at | | |
| West Harris County | | | | 100% of Par (NATL)(1)(2) | 1,305,000 | 1,379,959 |
| Regional Water Auth. Rev., | | | | | | 19,442,061 |
| 5.00%, 12/15/35(1) | 750,000 | 759,068 | | | | |
| | | | | VERMONT — 0.2% | | |
| West Oso Independent | | | | | | |
| School District GO, 5.50%, | | | | University of Vermont & | | |
| 8/15/13, Prerefunded at | | | | State Agricultural | | |
| 100% of Par (PSF-GTD)(1)(2) | 1,265,000 | 1,443,112 | | College Rev., 5.00%, | | |
| | | | | 10/1/19 (Ambac)(1) | 4,290,000 | 4,739,806 |
| Williamson County GO, | | | | | | |
| Series 2004 A, (Unlimited | | | | VIRGINIA — 1.0% | | |
| Tax Road & Refunding | | | | Fairfax County COP., | | |
| Bonds), 5.00%, | | | | 5.30%, 4/15/23(1) | 1,500,000 | 1,656,840 |
| 2/15/19 (NATL)(1) | 1,000,000 | 1,167,760 | | Pittsylvania County GO, | | |
| | | 99,478,560 | | Series 2001 B, 5.75%, | | |
| U.S. VIRGIN ISLANDS — 0.5% | | | 3/1/11, Prerefunded at | | |
| | | | | 102% of Par (NATL/School | | |
| Virgin Islands Public | | | | Bond Reserve Fund)(1)(2) | 1,115,000 | 1,183,349 |
| Finance Auth. Rev., Series | | | | | | |
| 2009 B, (Senior Lien), | | | | Virginia College Building & | | |
| 5.00%, 10/1/17(1) | 6,950,000 | 7,504,124 | | Education Facilities Auth. | | |
| | | | | Rev., Series 2009 A, (Public | | |
| Virgin Islands Water & | | | | Higher Education Financing | | |
| Power Auth. Rev., Series | | | | Program), 5.00%, 9/1/28(1) | 5,100,000 | 5,558,337 |
| 2007 A, 5.00%, 7/1/24(1) | 1,500,000 | 1,530,435 | | | | |
| | | | | Virginia Resources Auth. | | |
| | | 9,034,559 | | Clean Water Rev., | | |
| UTAH — 1.0% | | | | (State Revolving Fund), | | |
| Eagle Mountain City Gas & | | | | 5.00%, 10/1/16(1) | 5,120,000 | 6,002,125 |
| Electric Rev., 5.00%, | | | | Virginia Resources Auth. | | |
| 6/1/19 (Radian)(1) | 2,550,000 | 2,581,518 | | Clean Water Rev., | | |
| Intermountain Power | | | | (State Revolving Fund), | | |
| Agency Rev., Series 2008 A, | | | | 5.00%, 10/1/22(1) | 4,150,000 | 4,781,464 |
| 5.25%, 7/1/20(1) | 3,500,000 | 3,784,900 | | | | 19,182,115 |
31
| | | | | | |
| Tax-Free Bond | | | | | | |
| |
| | Principal | | | | Principal | |
| | Amount | Value | | | Amount | Value |
| WASHINGTON — 3.5% | | | | Metropolitan Park District of | | |
| Benton County Public Utility | | | | Tacoma GO, 6.00%, 12/1/11, | | |
| District No. 1 Electric Rev., | | | | Prerefunded at 100% of | | |
| Series 2001 A, 5.625%, | | | | Par (Ambac)(1)(2) | $ 1,120,000 | $ 1,212,053 |
| 11/1/19 (AGM)(1) | $ 1,000,000 | $ 1,059,030 | | Seattle Municipal Light & | | |
| Cowlitz County Kelso School | | | | Power Rev., Series 2010 B, | | |
| District No. 458 GO, 5.75%, | | | | 5.00%, 2/1/19(1) | 5,000,000 | 5,795,050 |
| 6/1/12, Prerefunded at | | | | Snohomish County | | |
| 100% of Par (AGM/School | | | | Edmonds School District | | |
| Bond Guarantee)(1)(2) | 1,000,000 | 1,101,850 | | No. 15 GO, 5.00%, 12/1/17 | | |
| Energy Northwest Electric | | | | (NATL/FGIC/School | | |
| Rev., Series 2002 A, | | | | Bond Guarantee)(1) | 6,690,000 | 7,617,702 |
| (Columbia Generating), | | | | University of Washington | | |
| 5.75%, 7/1/18 (NATL)(1) | 3,500,000 | 3,801,350 | | Rev., (Student Facilities | | |
| Energy Northwest Electric | | | | Fee), 5.875%, 6/1/10, | | |
| Rev., Series 2002 B, | | | | Prerefunded at 101% of | | |
| (Columbia Generating), | | | | Par (AGM)(1)(2) | 1,720,000 | 1,738,008 |
| 6.00%, 7/1/18 (Ambac)(1) | 10,000,000 | 10,947,000 | | Washington GO, Series | | |
| Energy Northwest Electric | | | | 1990 A, 6.75%, 2/1/15(1) | 1,000,000 | 1,127,250 |
| Rev., Series 2008 D, | | | | Washington Health Care | | |
| (Columbia Generating), | | | | Facilities Auth. Rev., | | |
| 5.00%, 7/1/12(1) | 2,375,000 | 2,589,534 | | Series 2006 D, (Providence | | |
| Energy Northwest Electric | | | | Health & Services), 5.25%, | | |
| Rev., Series 2009 A, | | | | 10/1/33 (AGM)(1) | 4,500,000 | 4,703,805 |
| (Project 3), 5.25%, 7/1/18(1) | 3,000,000 | 3,561,030 | | Washington Health Care | | |
| Energy Northwest Electric | | | | Facilities Auth. Rev., Series | | |
| Rev., Series 2010 A, | | | | 2009 A, (Swedish Health | | |
| (Project 3), 5.00%, 7/1/18(1) | 5,115,000 | 5,979,077 | | Services), 6.50%, 11/15/33 | 4,000,000 | 4,201,440 |
| Energy Northwest | | | | Whitman County Pullman | | |
| Wind Rev., 4.75%, | | | | School District No. 267 | | |
| 7/1/20 (NATL)(1) | 1,750,000 | 1,818,110 | | GO, 5.625%, 6/1/12, | | |
| | | | | Prerefunded at 100% | | |
| King County Public | | | | of Par (AGM/School | | |
| Hospital District No. 2 GO, | | | | Bond Guarantee)(1)(2) | 1,500,000 | 1,646,820 |
| (Evergreen Healthcare), | | | | | | |
| 5.00%, 12/1/14 (NATL)(1) | 1,000,000 | 1,106,860 | | Yakima County School | | |
| | | | | District No. 208 West | | |
| King County School District | | | | Valley GO, 5.00%, | | |
| No. 414 Lake Washington | | | | 12/1/18 (NATL/School | | |
| GO, 5.75%, 12/1/12, | | | | Bond Guarantee)(1) | 1,675,000 | 1,885,648 |
| Prerefunded at 100% | | | | | | |
| of Par(1)(2) | 1,555,000 | 1,744,865 | | | | 67,201,568 |
| Kitsap County School | | | | WISCONSIN — 0.9% | | |
| District No. 303 Bainbridge | | | | Wisconsin Clean Water | | |
| Island GO, 5.00%, | | | | Rev., Series 1991-1, | | |
| 12/1/17 (NATL/School | | | | 6.875%, 6/1/11(1) | 710,000 | 731,328 |
| Bond Guarantee)(1) | 1,000,000 | 1,128,610 | | Wisconsin Health & | | |
| Mason County School | | | | Educational Facilities | | |
| District No. 309 Shelton | | | | Auth. Rev., (Aurora | | |
| GO, 5.625%, 12/1/11, | | | | Medical Group), 6.00%, | | |
| Prerefunded at 100% | | | | 11/15/10 (AGM)(1) | 2,590,000 | 2,640,661 |
| of Par (FGIC/School | | | | Wisconsin Health & | | |
| Bond Guarantee)(1)(2) | 1,260,000 | 1,354,286 | | Educational Facilities Auth. | | |
| Metropolitan Park District of | | | | Rev., (Luther Hospital), | | |
| Tacoma GO, 6.00%, 12/1/11, | | | | 5.50%, 11/15/22(1) | 4,655,000 | 5,070,412 |
| Prerefunded at 100% of | | | | | | |
| Par (Ambac)(1)(2) | 1,000,000 | 1,082,190 | | | | |
32
| | |
| Tax-Free Bond | | |
| |
| | Principal | |
| | Amount | Value |
| Wisconsin Health & | | |
| Educational Facilities Auth. | | |
| Rev., (Luther Hospital), | | |
| 5.75%, 11/15/30(1) | $ 5,800,000 | $ 6,254,430 |
| Wisconsin Health & | | |
| Educational Facilities Auth. | | |
| Rev., (National Regency of | | |
| New Berlin), VRDN, 0.32%, | | |
| 6/1/10 (LOC: JPMorgan | | |
| Chase Bank)(1) | 1,200,000 | 1,200,000 |
| Wisconsin Transportation | | |
| Rev., Series 2008 A, | | |
| 5.00%, 7/1/18(1) | 500,000 | 580,910 |
| | | 16,477,741 |
| TOTAL INVESTMENT | | |
| SECURITIES — 99.0% | | |
| (Cost $1,824,787,234) | | 1,912,841,365 |
| OTHER ASSETS | | |
| AND LIABILITIES — 1.0% | | 18,860,538 |
| TOTAL NET ASSETS — 100.0% | $1,931,701,903 |
| | | | |
| Futures Contracts | | | |
| | Contracts Purchased | Expiration Date | Underlying Face Amount at Value | Unrealized Gain (Loss) |
| 366 | U.S. Long Bond | September 2010 | $44,892,187 | $(401,198) |
| |
| | Contracts Sold | Expiration Date | Underlying Face Amount at Value | Unrealized Gain (Loss) |
| 1,480 | U.S. Treasury 2-Year Notes | September 2010 | $322,848,125 | $(396,440) |
33
| |
| Tax-Free Bond |
| |
| Notes to Schedule of Investments |
| ABAG = Association of Bay Area Governments |
| ACA = American Capital Access |
| AGC = Assured Guaranty Corporation |
| AGM = Assured Guaranty Municipal Corporation |
| Ambac = Ambac Assurance Corporation |
| CIFG = CDC IXIS Financial Guaranty North America |
| COP = Certificates of Participation |
| FGIC = Financial Guaranty Insurance Company |
| GO = General Obligation |
| LIBOR = London Interbank Offered Rate |
| LIQ FAC = Liquidity Facilities |
| LOC = Letter of Credit |
| NATL = National Public Finance Guarantee Corporation |
| NATL-IBC = National Public Finance Guarantee Corporation - Insured Bond Certificates |
| PSF-GTD = Permanent School Fund Guaranteed |
| Radian = Radian Asset Assurance, Inc. |
| resets = The frequency with which a security’s coupon changes, based on current market conditions or an underlying index. The more frequently a |
| security resets, the less risk the investor is taking that the coupon will vary significantly from current market rates. |
| VRDN = Variable Rate Demand Note. Interest reset date is indicated. Rate shown is effective at the period end. |
| VRN = Variable Rate Note. Interest reset date is indicated. Rate shown is effective at the period end. |
| XLCA = XL Capital Ltd. |
| (1) | Security, or a portion thereof, has been segregated for when-issued securities and/or futures contracts. At the period end, the aggregate value of |
| | securities pledged was $376,466,000. |
| (2) | Escrowed to maturity in U.S. government securities or state and local government securities. |
| (3) | When-issued security. |
| (4) | Category is less than 0.05% of total net assets. |
| (5) | Security is a zero-coupon municipal bond. The rate indicated is the yield to maturity at purchase. Zero-coupon securities are issued at a |
| | substantial discount from their value at maturity. |
| (6) | Security was purchased under Rule 144A of the Securities Act of 1933 or is a private placement and, unless registered under the Act or |
| | exempted from registration, may only be sold to qualified institutional investors. The aggregate value of these securities at the period end was |
| | $5,305,000, which represented 0.3% of total net assets. |
Geographic classifications are unaudited.
See Notes to Financial Statements.
34
|
| Statement of Assets and Liabilities |
| | | |
| MAY 31, 2010 | | | |
| Assets | | | |
| Investment securities, at value (cost of $1,824,787,234) | | $1,912,841,365 |
| Cash | | | 34,836 |
| Receivable for investments sold | | | 3,397,240 |
| Receivable for capital shares sold | | | 4,304,625 |
| Receivable for variation margin on futures contracts | | 80,062 |
| Interest receivable | | | 25,336,608 |
| | | | 1,945,994,736 |
| | | | |
| Liabilities | | | |
| Payable for investments purchased | | | 8,620,454 |
| Payable for capital shares redeemed | | | 3,684,169 |
| Payable for variation margin on futures contracts | | 624,375 |
| Accrued management fees | | | 726,717 |
| Service fees (and distribution fees — A Class) payable | | 1,058 |
| Distribution fees payable | | | 701 |
| Dividends payable | | | 635,359 |
| | | | 14,292,833 |
| | | | |
| Net Assets | | | $1,931,701,903 |
| | | | |
| Net Assets Consist of: | | | |
| Capital paid in | | | $1,860,725,834 |
| Accumulated net realized loss on investment transactions | | (16,280,424) |
| Net unrealized appreciation on investments | | | 87,256,493 |
| | | | $1,931,701,903 |
| |
| | Net assets | Shares outstanding | Net asset value per share |
| Investor Class | $1,705,064,538 | 153,770,017 | $11.09 |
| Institutional Class | $221,013,900 | 19,929,915 | $11.09 |
| A Class | $3,950,594 | 356,252 | $11.09* |
| C Class | $1,672,871 | 150,954 | $11.08 |
| *Maximum offering price $11.61 (net asset value divided by 0.955) | | |
| |
| |
| See Notes to Financial Statements. | | | |
35
| |
| YEAR ENDED MAY 31, 2010 | |
| Investment Income (Loss) | |
| Income: | |
| Interest | $ 66,305,560 |
| | |
| Expenses: | |
| Management fees | 7,394,334 |
| Distribution fees — C Class | 965 |
| Service fees — C Class | 320 |
| Distribution and service fees — A Class | 1,679 |
| Trustees’ fees and expenses | 68,020 |
| Other expenses | 26,289 |
| | 7,491,607 |
| | |
| Net investment income (loss) | 58,813,953 |
| | |
| Realized and Unrealized Gain (Loss) | |
| Net realized gain (loss) on: | |
| Investment transactions | (405,059) |
| Futures contract transactions | 545,735 |
| | 140,676 |
| | |
| Change in net unrealized appreciation (depreciation) on: | |
| Investments | 56,568,965 |
| Futures contracts | (669,492) |
| | 55,899,473 |
| | |
| Net realized and unrealized gain (loss) | 56,040,149 |
| | |
| Net Increase (Decrease) in Net Assets Resulting from Operations | $114,854,102 |
| |
| |
| See Notes to Financial Statements. | |
36
|
| Statement of Changes in Net Assets |
| | |
| YEARS ENDED MAY 31, 2010 AND MAY 31, 2009 | | |
| Increase (Decrease) in Net Assets | 2010 | 2009 |
| Operations | | |
| Net investment income (loss) | $ 58,813,953 | $ 44,331,658 |
| Net realized gain (loss) | 140,676 | (14,634,990) |
| Change in net unrealized appreciation (depreciation) | 55,899,473 | 13,616,149 |
| Net increase (decrease) in net assets resulting from operations | 114,854,102 | 43,312,817 |
| | | |
| Distributions to Shareholders | | |
| From net investment income: | | |
| Investor Class | (52,623,677) | (40,900,161) |
| Institutional Class | (6,221,372) | (3,374,968) |
| A Class | (21,617) | — |
| C Class | (3,075) | — |
| Decrease in net assets from distributions | (58,869,741) | (44,275,129) |
| | | |
| Capital Share Transactions | | |
| Net increase (decrease) in net assets from capital share transactions | 565,416,373 | 240,719,969 |
| | | |
| Net increase (decrease) in net assets | 621,400,734 | 239,757,657 |
| | | |
| Net Assets | | |
| Beginning of period | 1,310,301,169 | 1,070,543,512 |
| End of period | $1,931,701,903 | $1,310,301,169 |
| | | |
| Undistributed net investment income | — | $56,529 |
See Notes to Financial Statements.
37
|
| Notes to Financial Statements |
MAY 31, 2010
1. Organization and Summary of Significant Accounting Policies
Organization — American Century Municipal Trust (the trust) is registered under the Investment Company Act of 1940 (the 1940 Act) as an open-end management investment company. Tax-Free Bond Fund (the fund) is one fund in a series issued by the trust. The fund is diversified under the 1940 Act. The fund’s investment objective is to seek safety of principal and high current income that is exempt from federal income tax. The fund pursues its objective by investing primarily in investment-grade municipal obligations. The following is a summary of the fund’s significant accounting policies.
Multiple Class — The fund is authorized to issue the Investor Class, the Institutional Class, the A Class and the C Class. The A Class may incur an initial sales charge. The A Class and C Class may be subject to a contingent deferred sales charge. The share classes differ principally in their respective sales charges and distribution and shareholder servicing expenses and arrangements. All shares of the fund represent an equal pro rata interest in the net assets of the class to which such shares belong, and have identical voting, dividend, liquidation and other rights and the same terms and conditions, except for class specific expenses and exclusive rights to vote on matters affecting only individual classes. Income, non-class specific expenses, and realized and unrealized capital gains and losses of the fund are allocated t o each class of shares based on their relative net assets. Sale of the A Class and C Class commenced on March 1, 2010.
Security Valuations — Debt securities maturing in greater than 60 days at the time of purchase are valued at current market value as provided by a commercial pricing service or at the mean of the most recent bid and asked prices. Debt securities maturing within 60 days at the time of purchase may be valued at cost, plus or minus any amortized discount or premium. If an event occurs after the value of a security was established but before the net asset value per share was determined that was likely to materially change the net asset value, that security would be valued as determined in accordance with procedures adopted by the Board of Trustees. If the fund determines that the market price of a portfolio security is not readily available, or that the valuation methods mentioned above do not reflect the security’s fair val ue, such security is valued as determined by the Board of Trustees or its designee, in accordance with procedures adopted by the Board of Trustees, if such determination would materially impact a fund’s net asset value. Certain other circumstances may cause the fund to use alternative procedures to value a security such as: a security has been declared in default; trading in a security has been halted during the trading day; or there is a foreign market holiday and no trading will commence.
Security Transactions — For financial reporting purposes, security transactions are accounted for as of the trade date. Net realized gains and losses are determined on the identified cost basis, which is also used for federal income tax purposes.
Investment Income — Interest income is recorded on the accrual basis and includes accretion of discounts and amortization of premiums.
When-Issued — The fund may engage in securities transactions on a when-issued basis. Under these arrangements, the securities’ prices and yields are fixed on the date of the commitment, but payment and delivery are scheduled for a future date. During this period, securities are subject to market fluctuations. The fund will segregate cash, cash equivalents or other appropriate liquid securities on its records in amounts sufficient to meet the purchase price.
38
Income Tax Status — It is the fund’s policy to distribute substantially all net investment income and net realized gains to shareholders and to otherwise qualify as a regulated investment company under provisions of the Internal Revenue Code. The fund is no longer subject to examination by tax authorities for years prior to 2007. At this time, management believes there are no uncertain tax positions which, based on their technical merit, would not be sustained upon examination and for which it is reasonably possible that the total amounts of unrecognized tax benefits will significantly change in the next twelve months. Accordingly, no provision has been made for federal or state income taxes.
Distributions to Shareholders — Distributions from net investment income are declared daily and paid monthly. Distributions from net realized gains, if any, are generally declared and paid annually.
Indemnifications — Under the trust’s organizational documents, its officers and trustees are indemnified against certain liabilities arising out of the performance of their duties to the fund. In addition, in the normal course of business, the fund enters into contracts that provide general indemnifications. The maximum exposure under these arrangements is unknown as this would involve future claims that may be made against a fund. The risk of material loss from such claims is considered by management to be remote.
Use of Estimates — The financial statements are prepared in conformity with accounting principles generally accepted in the United States of America, which may require management to make certain estimates and assumptions at the date of the financial statements. Actual results could differ from these estimates.
Subsequent Events — In preparing the financial statements, management evaluated the impact of events or transactions occurring through the date the financial statements were issued that would merit recognition or disclosure.
2. Fees and Transactions with Related Parties
Management Fees — The trust has entered into a Management Agreement with American Century Investment Management, Inc. (ACIM) (the investment advisor), under which ACIM provides the fund with investment advisory and management services in exchange for a single, unified management fee (the fee) per class. The Agreement provides that all expenses of managing and operating the fund, except brokerage expenses, taxes, interest, fees and expenses of the independent trustees (including legal counsel fees), and extraordinary expenses, will be paid by ACIM. The fee is computed and accrued daily based on the daily net assets of the specific class of shares of the fund and paid monthly in arrears. The fee consists of (1) an Investment Category Fee based on the daily net assets of the funds and certain other accounts managed by the in vestment advisor that are in the same broad investment category as the fund and (2) a Complex Fee based on the assets of all the funds in the American Century Investments family of funds. The rates for the Investment Category Fee range from 0.1625% to 0.2800%. The rates for the Complex Fee range from 0.2500% to 0.3100% for the Investor Class, A Class and C Class. The Institutional Class is 0.2000% less at each point within the Complex Fee range. The effective annual management fee for each class for the year ended May 31, 2010 was 0.48% for the Investor Class, A Class and C Class and 0.28% for the Institutional Class.
Distribution and Service Fees — The Board of Trustees has adopted a separate Master Distribution and Individual Shareholder Services Plan for the A Class and C Class (collectively the plans), pursuant to Rule 12b-1 of the 1940 Act. The plans provide that the A Class will pay American Century Investment Services, Inc. (ACIS) an annual distribution and service fee of 0.25%. The plans provide that the C Class will pay ACIS an annual distribution fee of 0.75% and service fee of 0.25%. The fees are computed and accrued daily based on each class’s daily net assets and paid monthly in arrears. The fees are used to pay financial intermediaries for distribution and individual shareholder services. Fees incurred under the plans during the year ended May 31, 2010, are detailed in the Statement of Operations.
39
Related Parties — Certain officers and trustees of the trust are also officers and/or directors of American Century Companies, Inc. (ACC), the parent of the trust’s investment advisor, ACIM, the distributor of the trust, ACIS, and the trust’s transfer agent, American Century Services, LLC.
The fund has a Mutual Funds Services Agreement with J.P. Morgan Investor Services Co. (JPMIS). JPMorgan Chase Bank (JPMCB) is a custodian of the fund. JPMIS and JPMCB are wholly owned subsidiaries of JPMorgan Chase & Co. (JPM). JPM is an equity investor in ACC.
3. Investment Transactions
Purchases and sales of investment securities, excluding short-term investments, for the year ended May 31, 2010, were $681,943,646 and $204,739,294, respectively.
4. Capital Share Transactions
Transactions in shares of the fund were as follows (unlimited number of shares authorized):
| | | | |
| | Year ended May 31, 2010(1) | Year ended May 31, 2009 |
| | Shares | Amount | Shares | Amount |
| Investor Class | | | | |
| Sold | 73,822,029 | $ 806,596,776 | 55,526,950 | $582,342,548 |
| Issued in reinvestment of distributions | 4,214,681 | 46,089,491 | 3,307,002 | 34,708,153 |
| Redeemed | (36,255,147) | (396,539,550) | (40,219,830) | (419,767,975) |
| | 41,781,563 | 456,146,717 | 18,614,122 | 197,282,726 |
| Institutional Class | | | | |
| Sold | 12,249,630 | 134,096,397 | 8,392,238 | 87,738,781 |
| Issued in reinvestment of distributions | 509,099 | 5,570,113 | 307,123 | 3,226,047 |
| Redeemed | (3,283,012) | (35,975,904) | (4,568,092) | (47,527,585) |
| | 9,475,717 | 103,690,606 | 4,131,269 | 43,437,243 |
| A Class | | | N/A | N/A |
| Sold | 354,426 | 3,895,639 | | |
| Issued in reinvestment of distributions | 1,829 | 20,231 | | |
| Redeemed | (3) | (37) | | |
| | 356,252 | 3,915,833 | | |
| C Class | | | N/A | N/A |
| Sold | 150,727 | 1,660,703 | | |
| Issued in reinvestment of distributions | 255 | 2,825 | | |
| Redeemed | (28) | (311) | | |
| | 150,954 | 1,663,217 | | |
| Net increase (decrease) | 51,764,486 | $ 565,416,373 | 22,745,391 | $240,719,969 |
| (1) March 1, 2010 (commencement of sale) through May 31, 2010 for the A Class and C Class. | | |
40
5. Fair Value Measurements
The fund’s securities valuation process is based on several considerations and may use multiple inputs to determine the fair value of the positions held by the fund. In conformity with accounting principles generally accepted in the United States of America, the inputs used to determine a valuation are classified into three broad levels as follows:
• Level 1 valuation inputs consist of unadjusted quoted prices in an active market for identical securities;
• Level 2 valuation inputs consist of significant direct or indirect observable market data (including quoted prices for similar securities, evaluations of subsequent market events, interest rates, prepayment speeds, credit risk, etc.); or
• Level 3 valuation inputs consist of significant unobservable inputs (including a fund’s own assumptions).
The level classification is based on the lowest level input that is significant to the fair valuation measurement. The valuation inputs are not an indication of the risks associated with investing in these securities or other financial instruments.
As of May 31, 2010, the valuation inputs used to determine the fair value of the fund’s investment securities and unrealized gain (loss) on futures contracts were classified as Level 2 and Level 1, respectively. The Schedule of Investments provides additional details on the fund’s portfolio holdings.
6. Derivative Instruments
Interest Rate Risk — The fund is subject to interest rate risk in the normal course of pursuing its investment objectives. The value of bonds generally declines as interest rates rise. A fund may enter into futures contracts based on a bond index or a specific underlying security. A fund may purchase futures contracts to gain exposure to increases in market value or sell futures contracts to protect against a decline in market value. Upon entering into a futures contract, a fund will segregate cash, cash equivalents or other appropriate liquid securities on its records in amounts sufficient to meet requirements. Subsequent payments (variation margin) are made or received daily, in cash, by a fund. The variation margin is equal to the daily change in th e contract value and is recorded as unrealized gains and losses. A fund recognizes a realized gain or loss when the futures contract is closed or expires. Net realized and unrealized gains or losses occurring during the holding period of futures contracts are a component of net realized gain (loss) on futures contract transactions and change in net unrealized appreciation (depreciation) on futures contracts, respectively. One of the risks of entering into futures contracts is the possibility that the change in value of the contract may not correlate with the changes in value of the underlying securities. The interest rate risk derivative instruments held at period end as disclosed on the Schedule of Investments are indicative of the fund’s typical volume during the period.
The value of interest rate risk derivative instruments as of May 31, 2010, is disclosed on the Statement of Assets and Liabilities as an asset of $80,062 in receivable for variation margin on futures contracts and as a liability of $624,375 in payable for variation margin on futures contracts. For the year ended May 31, 2010, the effect of interest rate risk derivative instruments on the Statement of Operations was $545,735 in net realized gain (loss) on futures contract transactions and $(669,492) in change in net unrealized appreciation (depreciation) on futures contracts.
41
7. Interfund Lending
The fund, along with certain other funds in the American Century Investments family of funds, may participate in an interfund lending program, pursuant to an Exemptive Order issued by the Securities and Exchange Commission (SEC). This program provides an alternative credit facility allowing the fund to borrow from or lend to other funds in the American Century Investments family of funds that permit such transactions. Interfund lending transactions are subject to each fund’s investment policies and borrowing and lending limits. The interfund loan rate earned/paid on interfund lending transactions is determined daily based on the average of certain current market rates. Interfund lending transactions normally extend only overnight, but can have a maximum duration of seven days. The program is subject to annual approval by the Board of Trustees. During the year ended May 31, 2010, the fund did not utilize the p rogram.
8. Federal Tax Information
The tax character of distributions paid during the years ended May 31, 2010 and May 31, 2009 were as follows:
| | |
| | 2010 | 2009 |
| Distributions Paid From | | |
| Exempt income | $58,869,741 | $44,275,129 |
| Long-term capital gains | — | — |
The book-basis character of distributions made during the year from net investment income or net realized gains may differ from their ultimate characterization for federal income tax purposes. These differences reflect the differing character of certain income items and net realized gains and losses for financial statement and tax purposes, and may result in reclassification among certain capital accounts on the financial statements.
As of May 31, 2010, the federal tax cost of investments and the components of distributable earnings on a tax-basis were as follows:
| | |
| Federal tax cost of investments | $1,824,787,234 |
| Gross tax appreciation of investments | $94,794,223 |
| Gross tax depreciation of investments | (6,740,092) |
| Net tax appreciation (depreciation) of investments | $88,054,131 |
| Other book-to-tax adjustments | $(2,379,803) |
| Net tax appreciation (depreciation) | $85,674,328 |
| Accumulated capital losses | $(14,120,092) |
| Capital loss deferral | $(578,167) |
The difference between book-basis and tax-basis cost and unrealized appreciation (depreciation) is attributable primarily to the realization for tax purposes of unrealized gain (loss) on certain futures contracts. Other book-to-tax adjustments are attributable primarily to the tax deferral of losses on straddle positions.
42
The accumulated capital losses listed on the previous page represent net capital loss carryovers that may be used to offset future realized capital gains for federal income tax purposes. Future capital loss carryover utilization in any given year may be subject to Internal Revenue Code limitations. The capital loss carryovers expire as follows:
| | | |
| 2015 | 2016 | 2017 | 2018 |
| $(1,643,796) | — | $(3,280,979) | $(9,195,317) |
The capital loss deferral listed on the previous page represents net capital losses incurred in the seven-month period ended May 31, 2010. The fund has elected to treat such losses as having been incurred in the following fiscal year for federal income tax purposes.
9. Corporate Event
As part of a long-standing estate and business succession plan established by ACC Co-Chairman James E. Stowers, Jr., the founder of American Century Investments, ACC Co-Chairman Richard W. Brown succeeded Mr. Stowers as trustee of a trust that holds a greater-than-25% voting interest in ACC, the parent corporation of each fund’s advisor. Under the 1940 Act, this is presumed to represent control of ACC even though it is less than a majority interest. The change of trustee may technically be considered a “change of control” of ACC and therefore also a change of control of each fund’s advisor even though there has been no change to their management and none is anticipated. The “change of control” resulted in the assignment of each fund’s investment advisory agreement. Under the 1940 Act, an assignment automatically terminated such agreement, making the approval of a new agreement ne cessary.
On February 18, 2010, the Board of Trustees approved interim investment advisory agreements under which each fund will be managed until new agreements are approved by fund shareholders. On April 1, 2010, the Board of Trustees approved new investment advisory agreements. The interim agreements and the new agreements are substantially identical to the terminated agreements (with the exception of different effective and termination dates) and will not result in changes in the management of American Century Investments, the funds, their investment objectives, fees or services provided. The new agreement for the fund was approved by shareholders at a Special Meeting of Shareholders on June 16, 2010. The new agreement went into effect on July 16, 2010. Management agreements for new share classes of the funds that were launched after February 16, 2010 did not terminate, have not been replaced by interim agreements, and d o not require approval of new agreements.
10. Other Tax Information (Unaudited)
The following information is provided pursuant to provisions of the Internal Revenue Code.
The fund designates $58,782,521 as exempt interest dividends for the fiscal year ended May 31, 2010.
43
| | | | | | |
| Tax-Free Bond | | | | | |
| |
| Investor Class | | | | | |
| For a Share Outstanding Throughout the Years Ended May 31 | | | |
| | | 2010 | 2009 | 2008 | 2007 | 2006 |
| Per-Share Data | | | | | |
| Net Asset Value, Beginning of Period | $10.70 | $10.74 | $10.68 | $10.67 | $10.88 |
| Income From Investment Operations | | | | | |
| Net Investment Income (Loss) | 0.40(1) | 0.41 | 0.43 | 0.42 | 0.40 |
| Net Realized and Unrealized Gain (Loss) | 0.39 | (0.04) | 0.06 | 0.01 | (0.20) |
| Total From Investment Operations | 0.79 | 0.37 | 0.49 | 0.43 | 0.20 |
| Distributions | | | | | |
| From Net Investment Income | (0.40) | (0.41) | (0.43) | (0.42) | (0.40) |
| From Net Realized Gains | — | — | — | — | (0.01) |
| Total Distributions | (0.40) | (0.41) | (0.43) | (0.42) | (0.41) |
| Net Asset Value, End of Period | $11.09 | $10.70 | $10.74 | $10.68 | $10.67 |
| |
| Total Return(2) | 7.48% | 3.58% | 4.66% | 4.08% | 1.87% |
| | | | | | |
| Ratios/Supplemental Data | | | | | |
| Ratio of Operating Expenses | | | | | |
| to Average Net Assets | 0.48% | 0.49% | 0.49% | 0.49% | 0.49% |
| Ratio of Net Investment Income (Loss) | | | | | |
| to Average Net Assets | 3.61% | 3.89% | 4.00% | 3.91% | 3.73% |
| Portfolio Turnover Rate | 14% | 37% | 62% | 43% | 79% |
| Net Assets, End of Period (in thousands) | $1,705,065 | $1,198,419 | $1,002,648 | $709,988 | $665,458 |
| (1) | Computed using average shares outstanding throughout the period. | | | | |
| (2) | Total return assumes reinvestment of net investment income and capital gains distributions, if any. Total returns for periods less than one year |
| | are not annualized. Total returns are calculated based on the net asset value of the last business day. The total return of the classes may not |
| | precisely reflect the class expense differences because of the impact of calculating the net asset values to two decimal places. If net asset |
| | values were calculated to three decimal places, the total return differences would more closely reflect the class expense differences. The |
| | calculation of net asset values to two decimal places is made in accordance with SEC guidelines and does not result in any gain or loss of value |
| | between one class and another. | | | | | |
See Notes to Financial Statements.
44
| | | | | | |
| Tax-Free Bond | | | | | |
| |
| Institutional Class | | | | | |
| For a Share Outstanding Throughout the Years Ended May 31 | | | |
| | | 2010 | 2009 | 2008 | 2007 | 2006 |
| Per-Share Data | | | | | |
| Net Asset Value, Beginning of Period | $10.70 | $10.74 | $10.68 | $10.67 | $10.88 |
| Income From Investment Operations | | | | | |
| Net Investment Income (Loss) | 0.42(1) | 0.43 | 0.45 | 0.44 | 0.42 |
| Net Realized and Unrealized Gain (Loss) | 0.39 | (0.04) | 0.06 | 0.01 | (0.20) |
| Total From Investment Operations | 0.81 | 0.39 | 0.51 | 0.45 | 0.22 |
| Distributions | | | | | |
| From Net Investment Income | (0.42) | (0.43) | (0.45) | (0.44) | (0.42) |
| From Net Realized Gains | — | — | — | — | (0.01) |
| Total Distributions | (0.42) | (0.43) | (0.45) | (0.44) | (0.43) |
| Net Asset Value, End of Period | $11.09 | $10.70 | $10.74 | $10.68 | $10.67 |
| |
| Total Return(2) | 7.69% | 3.78% | 4.88% | 4.28% | 2.07% |
| | | | | | |
| Ratios/Supplemental Data | | | | | |
| Ratio of Operating Expenses | | | | | |
| to Average Net Assets | 0.28% | 0.29% | 0.29% | 0.29% | 0.29% |
| Ratio of Net Investment Income (Loss) | | | | | |
| to Average Net Assets | 3.81% | 4.09% | 4.20% | 4.11% | 3.93% |
| Portfolio Turnover Rate | 14% | 37% | 62% | 43% | 79% |
| Net Assets, End of Period (in thousands) | $221,014 | $111,882 | $67,895 | $10,567 | $7,815 |
| (1) | Computed using average shares outstanding throughout the period. | | | | |
| (2) | Total return assumes reinvestment of net investment income and capital gains distributions, if any. Total returns for periods less than one year |
| | are not annualized. Total returns are calculated based on the net asset value of the last business day. The total return of the classes may not |
| | precisely reflect the class expense differences because of the impact of calculating the net asset values to two decimal places. If net asset |
| | values were calculated to three decimal places, the total return differences would more closely reflect the class expense differences. The |
| | calculation of net asset values to two decimal places is made in accordance with SEC guidelines and does not result in any gain or loss of value |
| | between one class and another. | | | | | |
See Notes to Financial Statements.
45
| | |
| Tax-Free Bond | |
| |
| A Class | |
| For a Share Outstanding Throughout the Years Ended May 31 (except as noted) | |
| | | 2010(1) |
| Per-Share Data | |
| Net Asset Value, Beginning of Period | $11.03 |
| Income From Investment Operations | |
| Net Investment Income (Loss)(2) | 0.09 |
| Net Realized and Unrealized Gain (Loss) | 0.06 |
| Total From Investment Operations | 0.15 |
| Distributions | |
| From Net Investment Income | (0.09) |
| Net Asset Value, End of Period | $11.09 |
| |
| Total Return(3) | 1.35% |
| | |
| Ratios/Supplemental Data | |
| Ratio of Operating Expenses to Average Net Assets | 0.73%(4) |
| Ratio of Net Investment Income (Loss) to Average Net Assets | 3.19%(4) |
| Portfolio Turnover Rate | 14%(5) |
| Net Assets, End of Period (in thousands) | $3,951 |
| (1) | March 1, 2010 (commencement of sale) through May 31, 2010. | |
| (2) | Computed using average shares outstanding throughout the period. | |
| (3) | Total return assumes reinvestment of net investment income and capital gains distributions, if any, and does not reflect applicable sales charges. |
| | Total returns for periods less than one year are not annualized. Total returns are calculated based on the net asset value of the last business day. |
| | The total return of the classes may not precisely reflect the class expense differences because of the impact of calculating the net asset values |
| | to two decimal places. If net asset values were calculated to three decimal places, the total return differences would more closely reflect the |
| | class expense differences. The calculation of net asset values to two decimal places is made in accordance with SEC guidelines and does not |
| | result in any gain or loss of value between one class and another. | |
| (4) | Annualized. | |
| (5) | Portfolio turnover is calculated at the fund level. Percentage indicated was calculated for the year ended May 31, 2010. | |
See Notes to Financial Statements.
46
| | |
| Tax-Free Bond | |
| |
| C Class | |
| For a Share Outstanding Throughout the Years Ended May 31 (except as noted) | |
| | | 2010(1) |
| Per-Share Data | |
| Net Asset Value, Beginning of Period | $11.03 |
| Income From Investment Operations | |
| Net Investment Income (Loss)(2) | 0.06 |
| Net Realized and Unrealized Gain (Loss) | 0.06 |
| Total From Investment Operations | 0.12 |
| Distributions | |
| From Net Investment Income | (0.07) |
| Net Asset Value, End of Period | $11.08 |
| |
| Total Return(3) | 1.07% |
| | |
| Ratios/Supplemental Data | |
| Ratio of Operating Expenses to Average Net Assets | 1.48%(4) |
| Ratio of Net Investment Income (Loss) to Average Net Assets | 2.33%(4) |
| Portfolio Turnover Rate | 14%(5) |
| Net Assets, End of Period (in thousands) | $1,673 |
| (1) | March 1, 2010 (commencement of sale) through May 31, 2010. | |
| (2) | Computed using average shares outstanding throughout the period. | |
| (3) | Total return assumes reinvestment of net investment income and capital gains distributions, if any, and does not reflect applicable sales charges. |
| | Total returns for periods less than one year are not annualized. Total returns are calculated based on the net asset value of the last business day. |
| | The total return of the classes may not precisely reflect the class expense differences because of the impact of calculating the net asset values |
| | to two decimal places. If net asset values were calculated to three decimal places, the total return differences would more closely reflect the |
| | class expense differences. The calculation of net asset values to two decimal places is made in accordance with SEC guidelines and does not |
| | result in any gain or loss of value between one class and another. | |
| (4) | Annualized. | |
| (5) | Portfolio turnover is calculated at the fund level. Percentage indicated was calculated for the year ended May 31, 2010. | |
See Notes to Financial Statements.
47
|
| Report of Independent Registered Public Accounting Firm |
To the Trustees of the American Century Municipal Trust
and Shareholders of the Tax-Free Bond Fund:
In our opinion, the accompanying statement of assets and liabilities, including the schedule of investments, and the related statements of operations and of changes in net assets and the financial highlights present fairly, in all material respects, the financial position of the Tax-Free Bond Fund (one of the five funds comprising the American Century Municipal Trust, hereafter referred to as the “Fund”) at May 31, 2010, the results of its operations for the year then ended, the changes in its net assets for each of the two years in the period then ended and the financial highlights for each of the periods presented, in conformity with accounting principles generally accepted in the United States of America. These financial statements and financial highlights (hereafter referred to as “financial statements”) are the responsibility of the Fund’s management; our responsibility is to express an opinion on these financial statements based on our audits. We conducted our audits of these financial statements in accordance with the standards of the Public Company Accounting Oversight Board (United States). Those standards require that we plan and perform the audit to obtain reasonable assurance about whether the financial statements are free of material misstatement. An audit includes examining, on a test basis, evidence supporting the amounts and disclosures in the financial statements, assessing the accounting principles used and significant estimates made by management, and evaluating the overall financial statement presentation. We believe that our audits, which included confirmation of securities at May 31, 2010 by correspondence with the custodian and brokers, provide a reasonable basis for our opinion.
PricewaterhouseCoopers LLP
Kansas City, Missouri
July 22, 2010
48
The Board of Trustees
The individuals listed below serve as trustees of the fund. Each trustee will continue to serve in this capacity until death, retirement, resignation or removal from office. The mandatory retirement age for trustees who are not “interested persons,” as that term is defined in the Investment Company Act (independent trustees), is 73. However, the mandatory retirement age may be extended for a period not to exceed two years with the approval of the remaining independent trustees.
Mr. Thomas is the only trustee who is an “interested person” because he currently serves as President and Chief Executive Officer of American Century Companies, Inc. (ACC), the parent company of American Century Investment Management, Inc. (ACIM or the advisor).
The other trustees (more than three-fourths of the total number) are independent; that is, they have never been employees, directors or officers of, and have no financial interest in, ACC or any of its wholly owned, direct or indirect, subsidiaries, including ACIM, American Century Investment Services, Inc. (ACIS) and American Century Services, LLC (ACS). The trustees serve in this capacity for eight (in the case of Mr. Thomas, 15) registered investment companies in the American Century Investments family of funds.
The following presents additional information about the trustees. The mailing address for each trustee other than Mr. Thomas is 1665 Charleston Road, Mountain View, California 94043. The mailing address for Mr. Thomas is 4500 Main Street, Kansas City, Missouri 64111.
Independent Trustees
John Freidenrich
Year of Birth: 1937
Position(s) with the Fund: Trustee
Length of Time Served: Since 2005
Principal Occupation(s) During the Past Five Years: Founder, Member and Manager, Regis
Management Company, LLC (investment management firm) (April 2004 to present)
Number of Funds in Fund Complex Overseen by Trustee: 41
Other Directorships Held by Trustee: None
Education/Other Professional Experience: AB in Economics, Stanford University; LLB,
Stanford Law School; formerly, partner and founder, Ware and Freidenrich Law
Firm and Bay Partners; formerly, President, Board of Trustees, Stanford University
49
Ronald J. Gilson
Year of Birth: 1946
Position(s) with the Fund: Trustee and Chairman of the Board
Length of Time Served: Since 1995
Principal Occupation(s) During the Past Five Years: Charles J. Meyers Professor of Law and
Business, Stanford Law School (1979 to present); Marc and Eva Stern Professor of
Law and Business, Columbia University School of Law (1992 to present)
Number of Funds in Fund Complex Overseen by Trustee: 41
Other Directorships Held by Trustee: None
Education/Other Professional Experience: BA, Washington University; JD, Yale Law School;
formerly, attorney, Steinhart, Goldberg, Feigenbaum & Ladar
Frederick L. A. Grauer
Year of Birth: 1946
Position(s) with the Fund: Trustee
Length of Time Served: Since 2008
Principal Occupation(s) During the Past Five Years: Senior Advisor, BlackRock, Inc. (investment
management firm) (2010 to present); Senior Advisor, Barclays Global Investors
(investment management firm) (2003 to 2009)
Number of Funds in Fund Complex Overseen by Trustee: 41
Other Directorships Held by Trustee: None
Education/Other Professional Experience: BA in Economics, University of British Columbia;
MA in Economics, University of Chicago; PhD in Business, Stanford University;
formerly, Executive Chairman, Barclays Global Investors; Chairman and Chief
Executive Officer, Wells Fargo Nikko Investment Advisors; and Vice President,
Merrill Lynch Capital Markets Group; formerly, Director, New York Stock Exchange,
Chicago Mercantile Exchange and Columbia University; formerly, faculty member,
Graduate School of Business, Columbia University and Alfred P. Sloan School of
Management, Massachusetts Institute of Technology
Peter F. Pervere
Year of Birth: 1947
Position(s) with the Fund: Trustee
Length of Time Served: Since 2007
Principal Occupation(s) During the Past Five Years: Retired
Number of Funds in Fund Complex Overseen by Trustee: 41
Other Directorships Held by Trustee: Intraware, Inc. (2003 to 2009); Digital Impact, Inc.
(2003 to 2005)
Education/Other Professional Experience: BA in History, Stanford University; CPA; formerly,
Vice President and Chief Financial Officer, Commerce One, Inc. (software and
services provider); formerly, Vice President and Corporate Controller, Sybase, Inc.;
formerly with accounting firm of Arthur Young & Co.
50
Myron S. Scholes
Year of Birth: 1941
Position(s) with the Fund: Trustee
Length of Time Served: Since 1980
Principal Occupation(s) During the Past Five Years: Chairman, Platinum Grove Asset
Management, L.P. (asset manager) (1999 to 2009); Frank E. Buck Professor of
Finance-Emeritus, Stanford Graduate School of Business (1996 to present)
Number of Funds in Fund Complex Overseen by Trustee: 41
Other Directorships Held by Trustee: Dimensional Fund Advisors (investment advisor);
CME Group, Inc. (futures and options exchange)
Education/Other Professional Experience: BA in Economics, McMaster University (Ontario);
MBA and PhD, University of Chicago; formerly, Senior Research Fellow at the
Hoover Institute; formerly, Edward Eagle Brown Professor of Finance, University of
Chicago; recipient of the Alfred Nobel Memorial Prize in Economic Sciences
John B. Shoven
Year of Birth: 1947
Position(s) with the Fund: Trustee
Length of Time Served: Since 2002
Principal Occupation(s) During the Past Five Years: Professor of Economics, Stanford University
(1973 to present)
Number of Funds in Fund Complex Overseen by Trustee: 41
Other Directorships Held by Trustee: Cadence Design Systems; Exponent; Financial Engines;
PalmSource, Inc. (2002 to 2005); Watson Wyatt Worldwide (2002 to 2006)
Education/Other Professional Experience: BA in Physics, University of California; PhD in
Economics, Yale University; Director of the Stanford Institute for Economic Policy
Research (1999 to present); formerly, Chair of Economics and Dean of Humanities
and Sciences, Stanford University
Interested Trustee
Jonathan S. Thomas
Year of Birth: 1963
Position(s) with the Fund: Trustee and President
Length of Time Served: Since 2007
Principal Occupation(s) During the Past Five Years: President and Chief Executive Officer,
ACC (March 2007 to present); Chief Administrative Officer, ACC (February 2006 to
February 2007); Executive Vice President, ACC (November 2005 to February 2007).
Also serves as: Chief Executive Officer and Manager, ACS; Executive Vice President,
ACIM; Director, ACC, ACIM and other ACC subsidiaries. Global Chief Operating
Officer and Managing Director, Morgan Stanley (investment management)
(March 2000 to November 2005)
Number of Funds in Fund Complex Overseen by Trustee: 104
Other Directorships Held by Trustee: None
Education/Other Professional Experience: BA in Economics, University of Massachusetts;
MBA, Boston College; formerly held senior leadership roles with Fidelity
Investments, Boston Financial Services and Bank of America; serves on the Board of
Governors of the Investment Company Institute
51
Officers
The following table presents certain information about the executive officers of the fund. Each officer serves as an officer for each of the 15 investment companies in the American Century family of funds, unless otherwise noted. No officer is compensated for his or her service as an officer of the fund. The listed officers are interested persons of the fund and are appointed or re-appointed on an annual basis. The mailing address for each of the officers listed below is 4500 Main Street, Kansas City, Missouri 64111.
| | |
| Name | Offices with | |
| (Year of Birth) | the Fund | Principal Occupation(s) During the Past Five Years |
| Jonathan S. | Trustee and | President and Chief Executive Officer, ACC (March 2007 to present); Chief |
| Thomas | President | Administrative Officer, ACC (February 2006 to March 2007); Executive Vice |
| (1963) | since 2007 | President, ACC (November 2005 to February 2007). Also serves as: Chief |
| | | Executive Officer and Manager, ACS; Executive Vice President, ACIM; Director, |
| | | ACC, ACIM and other ACC subsidiaries. Global Chief Operating Officer and |
| | | Managing Director, Morgan Stanley (March 2000 to November 2005) |
| Barry Fink | Executive | Chief Operating Officer and Executive Vice President, ACC (September 2007 |
| (1955) | Vice President | to present); President, ACS (October 2007 to present); Managing Director, |
| | since 2007 | Morgan Stanley (2000 to 2007); Global General Counsel, Morgan Stanley |
| | | (2000 to 2006). Also serves as: Manager, ACS, and Director, ACC and |
| | | certain ACC subsidiaries |
| Maryanne L. | Chief Compliance | Chief Compliance Officer, American Century funds, ACIM and ACS (August |
| Roepke | Officer since 2006 | 2006 to present); Assistant Treasurer, ACC (January 1995 to August 2006); |
| (1956) | and Senior | and Treasurer and Chief Financial Officer, various American Century funds |
| | Vice President | (July 2000 to August 2006). Also serves as: Senior Vice President, ACS |
| | since 2000 | |
| Charles A. | General Counsel | Attorney, ACC (February 1994 to present); Vice President, ACC (November |
| Etherington | since 2007 and | 2005 to present); General Counsel, ACC (March 2007 to present); Also |
| (1957) | Senior Vice | serves as General Counsel, ACIM, ACS, ACIS and other ACC subsidiaries; |
| | President | and Senior Vice President, ACIM and ACS |
| | since 2006 | |
| Robert J. Leach | Vice President, | Vice President, ACS (February 2000 to present); and Controller, various |
| (1966) | Treasurer and | American Century funds (1997 to September 2006) |
| | Chief Financial | |
| | Officer since 2006 | |
| David H. Reinmiller | Vice President | Attorney, ACC (January 1994 to present); Associate General Counsel, ACC |
| (1963) | since 2001 | (January 2001 to present); Chief Compliance Officer, American Century |
| | | funds and ACIM (January 2001 to February 2005). Also serves as: Vice |
| | | President, ACIM and ACS |
| Ward D. Stauffer | Secretary | Attorney, ACC (June 2003 to Present) |
| (1960) | since 2005 | |
| |
| The SAI has additional information about the fund’s trustees and is available without charge, upon request, by calling 1-800-345-2021. |
52
|
| Board Approval of Management Agreements |
American Century Investment Management, Inc. (“ACIM” or the “Advisor”) currently serves as investment advisor to the Fund under an interim management agreement (the “Interim Management Agreement”) between the Advisor and the Fund approved by the Fund’s Board of Trustees (the “Board”). The Advisor previously served as investment advisor to the Fund pursuant to a management agreement (the “Prior Management Agreement”) that terminated in accordance with its terms on February 16, 2010, as a result of a change of control of the Advisor’s parent company, American Century Companies, Inc. (“ACC”). The change in control occurred as the result of a change in the trustee of a trust created by James E. Stowers, Jr., the founder of American Century Investments that holds shares representing a significant interest in ACC stock. Mr. Stowers previously served a s the trustee of the trust. On February 16, 2010, Richard W. Brown, Co-Chairman of ACC with Mr. Stowers, became the trustee in accordance with the terms of the trust and Mr. Stowers’ long-standing estate and succession plan.
On February 18, 2010, the Board approved the Interim Management Agreement in accordance with Rule 15a-4 under the Investment Company Act to ensure continued management of the Fund by the Advisor after the termination of the Prior Management Agreement and until shareholder approval of a new management agreement (the “Proposed Management Agreement”) as required under the Act. The Board approved the Proposed Management Agreement and recommended its approval to shareholders. Fund shareholders approved the Proposed Management Agreement at a meeting on June 16, 2010.*
The Interim Management Agreement and the Proposed Management Agreement are substantially identical to the Prior Management Agreement except for their effective dates and the termination provisions of the Interim Management Agreement. Under the Interim and Proposed Management Agreements, the Advisor will provide the same services to the Fund and receive the same compensation rate as under the Prior Management Agreement.
Basis for Board Approval of Interim Management Agreement
In considering the approval of the Interim Management Agreement, Rule 15a-4 requires the Board to approve the contract within ten business days of the termination of the prior agreement and to determine that the compensation to be received under the interim agreement is no greater than would have been received under the prior agreement. In connection with the approval, the Board noted that it oversees on a continuous basis and evaluates at its quarterly meetings, directly and through the committees of the Board, the nature and quality of significant services provided by the Advisor, the investment performance of the Fund, shareholder services, audit and compliance functions and a variety of other matters relating to the Fund’s operations.
|
| *Management agreements for new share classes of the Fund launched after February 16, 2010, did not terminate, have not been replaced by Interim |
| Management Agreements, and do not require Board or shareholder approval at this time. |
53
In evaluating the Interim Management Agreement, the Board, assisted by the advice of its independent legal counsel, considered a number of factors in addition to those required by the rule with no one factor being determinative to its analysis. Among the factors considered by the Board were the circumstances and effect of the change of control, the fact that the Advisor will provide the same services and receive the same compensation rate as under the Prior Management Agreements, and that the change of control did not result in a change of the personnel managing the Fund. Upon completion of its analysis, the Board approved the Interim Management Agreement, determining that the continued management of the Fund by the Advisor was in the best interests of the Fund and Fund shareholders.
Basis for Board Approval of Proposed Management Agreement
At a meeting held on April 1, 2010, after considering all information presented, the Board approved, and determined to recommend that shareholders approve, the Proposed Management Agreement. In connection with that approval, the Board requested and reviewed extensive data and information compiled by the Advisor and certain independent providers of evaluation data concerning the Fund and services provided to the Fund by the Advisor. The Board oversees on a continuous basis and evaluates at its quarterly meetings, directly and through the committees of the Board, the nature and quality of significant services provided by the Advisor, the investment performance of the Fund, shareholder services, audit and compliance functions and a variety of other matters relating to the Fund’s operations. The information considered and the discussions held at the meetings included, but were not limited to:
• the nature, extent and quality of investment management, shareholder services and other services provided to the Fund;
• the wide range of programs and services the Advisor provides to the Fund and its shareholders on a routine and non-routine basis;
• the compliance policies, procedures, and regulatory experience of the Advisor;
• data comparing the cost of owning the Fund to the cost of owning similar funds;
• the fact that there will be no changes to the fees, services, or personnel who provide such services as compared to the Prior Management Agreement;
• data comparing the Fund’s performance to appropriate benchmarks and/ or a peer group of other mutual funds with similar investment objectives and strategies;
• financial data showing the profitability of the Fund to the Advisor and the overall profitability of the Advisor;
• data comparing services provided and charges to the Fund with those for other non-fund investment management clients of the Advisor; and
54
• consideration of collateral or “fall-out” benefits derived by the Advisor from the management of the Fund and potential sharing of economies of scale in connection with the management of the Fund.
The Board also considered whether there was any reason for not continuing the existing arrangement with the Advisor. In particular, the Board recognized that shareholders may have invested in the Fund on the strength of the Advisor’s industry standing and reputation and in the expectation that the Advisor will have a continuing role in providing advisory services to the Fund.
The Board considered all of the information provided by the Advisor, the independent data providers, and the Board’s independent legal counsel, and evaluated such information for the Fund. The Board did not identify any single factor as being all-important or controlling, and each Board member may have attributed different levels of importance to different factors. In deciding to approve the Proposed Management Agreement under the terms ultimately determined by the Board to be appropriate, the Board based its decision on a number of factors, including the following:
Nature, Extent and Quality of Services — Generally. Under the Proposed Management Agreement, the Advisor is responsible for providing or arranging for all services necessary for the operation of the Fund. The Board noted that under the Proposed Management Agreement, the Advisor provides or arranges at its own expense a wide variety of services including:
• constructing and designing the Fund
• portfolio research and security selection
• initial capitalization/funding
• securities trading
• Fund administration
• custody of Fund assets
• daily valuation of the Fund’s portfolio
• shareholder servicing and transfer agency, including shareholder
confirmations, recordkeeping and communications
• legal services
• regulatory and portfolio compliance
• financial reporting
• marketing and distribution
55
The Board noted that many of these services have expanded over time both in terms of quantity and complexity in response to shareholder demands, competition in the industry, changing distribution channels and the changing regulatory environment.
Investment Management Services. The investment management services provided to the Fund are complex and provide Fund shareholders access to professional money management, instant diversification of their investments within an asset class, the opportunity to easily diversify among asset classes, and liquidity. As a part of its general oversight and in evaluating investment performance, the Board expects the Advisor to manage the Fund in accordance with its investment objectives and approved strategies. In providing these services, the Advisor utilizes teams of investment professionals who require extensive information technology, research, training, compliance and other systems to conduct their business. The Board, directly and through its Portfolio Committee, regularly reviews investment performance information for the Fund, t ogether with comparative information for appropriate benchmarks and/or peer groups of similarly-managed funds, over different time horizons. If performance concerns are identified, the underperforming Fund receives special reviews until performance improves, during which time the Board discusses with the Advisor the reasons for such underperformance and any efforts being undertaken to improve performance.
Shareholder and Other Services. Under the Proposed Management Agreement, the Advisor will also provide the Fund with a comprehensive package of transfer agency, shareholder, and other services. The Board, directly and through the various committees of the Board, regularly reviews reports and evaluations of such services. These reports include, but are not limited to, information regarding the operational efficiency and accuracy of the shareholder and transfer agency services provided, staffing levels, shareholder satisfaction (as measured by external as well as internal sources), technology support, new products and services offered to Fund shareholders, securities trading activities, portfolio valuation services, auditing services, and legal and operational compliance activities. Certain aspects of shareholder and transfer ag ency service level efficiency and the quality of securities trading activities are measured by independent third party providers and are presented in comparison to other fund groups not managed by the Advisor.
Costs of Services Provided and Profitability. The Advisor provided detailed information concerning its cost of providing various services to the Fund, its profitability in managing the Fund, its overall profitability, and its financial condition. The Board reviewed with the Advisor the methodology used to prepare this financial information. The Board has also reviewed with the Advisor its methodology for compensating the investment professionals that provide services to the Fund as well as compensation to the five highest paid personnel of the Advisor. This financial information regarding the Advisor is considered in order to evaluate the Advisor’s financial condition, its ability to continue to provide services under the Proposed Management Agreement, and the reasonableness of the proposed management fees.
56
Ethics. The Board generally considers the Advisor’s commitment to providing quality services to shareholders and to conducting its business ethically. It noted that the Advisor’s practices generally meet or exceed industry best practices.
Economies of Scale. The Board also reviewed information provided by the Advisor regarding the possible existence of economies of scale in connection with the management of the Fund. The Board concluded that economies of scale are difficult to measure and predict with precision, especially on a fund-by-fund basis. The analysis of economies of scale is further complicated by the additional services and content provided by the Advisor and its reinvestment in its ability to provide and expand those services. Accordingly, the Board seeks to evaluate economies of scale by reviewing information, such as year-over-year profitability of the Advisor generally, the profitability of its management of the Fund specifically, and the expenses incurred by the Advisor in providing various functions to the Fund. The Board believes the Advisor i s appropriately sharing economies of scale through its competitive fee structure, offering competitive fees from fund inception, fee breakpoints as the fund complex and the Fund increases in size, and through reinvestment in its business to provide shareholders additional services and enhancements to existing services. In particular, separate breakpoint schedules based on the size of the entire fund complex and on the size of the Fund reflect the complexity of assessing economies of scale.
Comparison to Fees of Funds not Managed by the Advisor. Both the Prior and Proposed Management Agreements provide that the Fund pays the Advisor a single, all-inclusive (or unified) management fee for providing all services necessary for the management and operation of the Fund, other than brokerage expenses, taxes, interest, extraordinary expenses, and the fees and expenses of the Fund’s Independent Trustees (including their independent legal counsel) and expenses incurred in connection with the provision of shareholder services and distribution services under a plan adopted pursuant to Rule 12b-1 under the 1940 Act. Under the unified fee structure, the Advisor is responsible for providing all investment advisory, custody, audit, administrative, compliance, recordkeeping, marketing and shareholder services, or arranging and supervising third parties that provide such services. By contrast, most other funds are charged a variety of fees, including an investment advisory fee, a transfer agency fee, an administrative fee, distribution charges and other expenses. Other than their investment advisory fees and any applicable Rule 12b-1 distribution fees, the components of the total fees charged by these other funds may be increased without shareholder approval. The Board believes the unified fee structure is a benefit to Fund shareholders because it clearly discloses to shareholders the cost of owning Fund shares, and, since the unified fee cannot be increased without a vote of Fund shareholders, it shifts to the Advisor the risk of increased costs of operating the Fund and provides a direct incentive to minimize administrative inefficiencies. Part of the Board’s analysis of fee levels involves reviewing certain evaluative data compiled by an independent provider comparing the Fund’s unified fee to the total expense rat ios of similar funds not managed by the Advisor. The Board concluded that the management fee to be paid by the Fund to the Advisor under the Proposed Management Agreement is reasonable in light of the services to be provided to the Fund.
57
Comparison to Fees and Services Provided to Other Clients of the Advisor. The Board also requested and received information from the Advisor concerning the nature and extent of the services, fees, and profitability of its advisory services to advisory clients other than the Fund. They observed that these varying types of client accounts require different services and involve different regulatory and entrepreneurial risks than the management of the Fund. The Board analyzed this information and concluded that the fees charged and services provided to the Fund were reasonable by comparison.
Collateral or “Fall-Out” Benefits Derived by the Advisor. The Board considered the existence of collateral benefits the Advisor may receive as a result of its relationship with the Fund. The Board concluded that the Advisor’s primary business is managing mutual funds and it generally does not use Fund or shareholder information to generate profits in other lines of business, and therefore does not derive any significant collateral benefits from them. The Board noted that the Advisor receives proprietary research from broker-dealers that execute Fund portfolio transactions and concluded that this research is likely to benefit Fund shareholders. The Board also determined that the Advisor is able to provide investment management services to certain clients other than the Fund, at least in part, due to its existing infrastructure built to serve the fund complex. The Board concluded, however, that the assets of those other clients are not material to the analysis and, in any event, are included with the assets of the Fund to determine breakpoints in the Fund’s fee schedule, provided they are managed using the same investment team and strategy.
Conclusion of the Board. As a result of this process, the Board, in the absence of particular circumstances and assisted by the advice of its independent legal counsel, taking into account all of the factors discussed above and the information provided by the Advisor and others, concluded that the Proposed Management Agreement be approved and recommended its approval to Fund shareholders.
58
Proxy Voting Guidelines
American Century Investment Management, Inc., the fund’s investment advisor, is responsible for exercising the voting rights associated with the securities purchased and/or held by the fund. A description of the policies and procedures the advisor uses in fulfilling this responsibility is available without charge, upon request, by calling 1-800-345-2021. It is also available on American Century Investments’ website at americancentury.com and on the Securities and Exchange Commission’s website at sec.gov. Information regarding how the investment advisor voted proxies relating to portfolio securities during the most recent 12-month period ended June 30 is available on the “About Us” page at americancentury.com. It is also available at sec.gov.
Quarterly Portfolio Disclosure
The fund files its complete schedule of portfolio holdings with the Securities and Exchange Commission (SEC) for the first and third quarters of each fiscal year on Form N-Q. The fund’s Forms N-Q are available on the SEC’s website at sec.gov, and may be reviewed and copied at the SEC’s Public Reference Room in Washington, DC. Information on the operation of the Public Reference Room may be obtained by calling 1-800-SEC-0330. The fund also makes its complete schedule of portfolio holdings for the most recent quarter of its fiscal year available on its website at americancentury.com and, upon request, by calling 1-800-345-2021.
59
The following indices are used to illustrate investment market, sector, or style performance or to serve as fund performance comparisons. They are not investment products available for purchase.
The Barclays Capital 5-Year General Obligation (GO) Bond Index is composed of investment-grade U.S. municipal securities, with maturities of four to six years, that are general obligations of a state or local government.
The Barclays Capital Long-Term Municipal Bond Index is composed of those securities included in the Barclays Capital Municipal Bond Index that have maturities greater than 22 years.
The Barclays Capital Municipal Bond Index is a market value-weighted index designed for the long-term tax-exempt bond market.
The Barclays Capital Non-Investment-Grade Municipal Bond Index is composed of non-investment grade U.S. municipal securities with a remaining maturity of one year or more.
The Barclays Capital U.S. Aggregate Index represents securities that are taxable, registered with the Securities and Exchange Commission, and U.S. dollar-denominated. The index covers the U.S. investment-grade fixed-rate bond market, with index components for government and corporate securities, mortgage pass-through securities, and asset-backed securities.
The Barclays Capital U.S. Treasury Index is composed of those securities included in the Barclays Capital U.S. Aggregate Index that are public obligations of the U.S. Treasury with a remaining maturity of one year or more.
60

| |
| |
| Contact Us | |
| americancentury.com | |
| Automated Information Line | 1-800-345-8765 |
| Investor Services Representative | 1-800-345-2021 or |
| | 816-531-5575 |
| Investors Using Advisors | 1-800-378-9878 |
| Business, Not-For-Profit, Employer-Sponsored | |
| Retirement Plans | 1-800-345-3533 |
| Banks and Trust Companies, Broker-Dealers, | |
| Financial Professionals, Insurance Companies | 1-800-345-6488 |
| Telecommunications Device for the Deaf | 1-800-634-4113 |
| American Century Municipal Trust | |
| Investment Advisor: | |
| American Century Investment Management, Inc. | |
| Kansas City, Missouri | |
This report and the statements it contains are submitted for the general
information of our shareholders. The report is not authorized for distribution to
prospective investors unless preceded or accompanied by an effective prospectus.
American Century Investment Services, Inc., Distributor
©2010 American Century Proprietary Holdings, Inc. All rights reserved.
1007
CL-ANN-68682
|
| Annual Report |
| May 31, 2010 |

|
| American Century Investments® |
Tax-Free Money Market Fund
| |
| President’s Letter | 2 |
| Market Perspective | 3 |
| U.S. Fixed-Income Total Returns | 3 |
| |
| Tax-Free Money Market | |
| |
| Performance | 4 |
| Yields | 5 |
| Portfolio Composition by Maturity. | 5 |
| |
| Shareholder Fee Example | 6 |
| |
| Financial Statements | |
| |
| Schedule of Investments | 8 |
| Statement of Assets and Liabilities | 13 |
| Statement of Operations | 14 |
| Statement of Changes in Net Assets | 15 |
| Notes to Financial Statements | 16 |
| Financial Highlights | 20 |
| Report of Independent Registered Public Accounting Firm | 21 |
| |
| Other Information | |
| |
| Management | 22 |
| Board Approval of Management Agreements | 26 |
| Additional Information | 32 |
| Index Definitions | 33 |
Any opinions expressed in this report reflect those of the author as of the date of the report, and do not necessarily represent the opinions of American Century Investments or any other person in the American Century Investments organization. Any such opinions are subject to change at any time based upon market or other conditions and American Century Investments disclaims any responsibility to update such opinions. These opinions may not be relied upon as investment advice and, because investment decisions made by American Century Investments funds are based on numerous factors, may not be relied upon as an indication of trading intent on behalf of any American Century Investments fund. Security examples are used for representational purposes only and are not intended as recommendations to purchase or sell securities. Performance information for comparative indices and securities is provided to American Cent ury Investments by third party vendors. To the best of American Century Investments’ knowledge, such information is accurate at the time of printing.
Dear Investor:
To learn more about the capital markets, your investment, and the portfolio management strategies American Century Investments provides, we encourage you to review this shareholder report for the financial reporting period ended May 31, 2010.
On the following pages, you will find investment performance and portfolio information, presented with the expert perspective and commentary of our portfolio management team. This report remains one of our most important vehicles for conveying the information you need about your investment performance, and about the market factors and strategies that affect fund returns. For additional information on the markets, we encourage you to visit the “Insights & News” tab at our Web site, americancentury.com, for updates and further expert commentary.
The top of our Web site’s home page also provides a link to “Our Story,” which, first and foremost, outlines our commitment—since 1958—to helping clients reach their financial goals. We believe strongly that we will only be successful when our clients are successful. That’s who we are.
Another important, unique facet of our story and who we are is “Profits with a Purpose,” which describes our bond with the Stowers Institute for Medical Research (SIMR). SIMR is a world-class biomedical organization—founded by our company founder James E. Stowers, Jr. and his wife Virginia—that is dedicated to researching the causes, treatment, and prevention of gene-based diseases, including cancer. Through American Century Investments’ private ownership structure, more than 40% of our profits support SIMR.
Mr. Stowers’ example of achieving financial success and using that platform to help humanity motivates our entire American Century Investments team. His story inspires us to help each of our clients achieve success. Thank you for sharing your financial journey with us.
Sincerely,

Jonathan Thomas
President and Chief Executive Officer
American Century Investments
2

By David MacEwen, Chief Investment Officer, Fixed Income
Economic and Market Rebound
The municipal bond market witnessed a wide dispersion of returns in the 12 months ended May 31, 2010 (see the accompanying table), which closely coincided with the rebound of the U.S. economy from the depths of the recession and credit crisis. This dramatic turnaround can be attributed to the government’s extraordinary monetary and fiscal stimulus policies taken in response to the financial crisis in late 2008. However, financial market volatility in May related to the European debt crisis led many to worry about a potential slowdown in U.S. growth. Despite a return to positive economic growth in the second half of 2009 and so far in 2010, the unemployment rate stood at 9.7% in May 2010, while the housing market and consumer debt levels remained concerns.
Municipal Market Review
Better economic and market conditions caused a reversal of the trading that colored the credit crisis, when the lowest-rated bonds performed worst and higher-quality bonds did best. For the 12 months ended in May, this reversal meant that high-yield (below-investment-grade) and long-term municipal bonds did better than high-quality and shorter-term securities. Similarly, credit-sensitive municipal bonds outperformed Treasury securities for the 12 months after lagging during the credit crisis.
In addition to better economic and market conditions, municipal bonds benefited from improving technical factors—the Build America Bonds program limited the supply of tax-exempt bonds. This federal program, designed to help ease municipal borrowing costs, meant many newly minted municipal bonds were instead issued in the taxable bond universe. Demand for municipal bonds was helped by attractive tax-equivalent yields and the outlook for higher marginal tax rates going forward.
And despite the continuing flood of negative press about budget challenges for states and local governments, we continue to believe that municipal defaults will be relatively rare, especially compared with corporate defaults. Indeed, during the reporting period, the major credit rating agencies revamped their ratings systems to better recognize the superior credit quality and vastly lower default risk of municipal securities relative to corporate-backed bonds.
| | | | |
| U.S. Fixed-Income Total Returns | | | | |
| For the 12 months ended May 31, 2010 | | | | |
| Barclays Capital Municipal Market Indices | | Barclays Capital U.S. Taxable Market Indices |
| Municipal Bond | 8.52% | | Aggregate Index | 8.42% |
| 5-Year General Obligation Bond | 6.15% | | Treasury Index | 4.50% |
| Long-Term Municipal Bond | 13.53% | | | |
| Non-Investment-Grade Municipal Bond | 21.01% | | | |
3
| | | | | | | |
| Tax-Free Money Market | | | | | |
| |
| Total Returns as of May 31, 2010 | | | | | |
| | | | | Average Annual Returns | |
| | | Ticker | | | | Since | Inception |
| | | Symbol | 1 year | 5 years | 10 years | Inception | Date |
| Investor Class | BNTXX | 0.20%(1) | 2.07% | 1.87% | 3.10%(1) | 7/31/84 |
| Average Return of Lipper’s | | | | | | |
| Tax-Exempt Money | | | | | | |
| Market Funds(2) | — | 0.05% | 1.78% | 1.62% | 2.99%(3) | 8/31/84 |
| Fund’s Lipper Ranking | — | | | | | — |
| as of May 31, 2010(2) | | 5 of 99 | 5 of 81 | 4 of 61 | 5 of 20(1) | |
| as of June 30, 2010(2) | | 5 of 98 | 5 of 80 | 4 of 61 | 5 of 20(1) | |
| (1) | Class returns and rankings would have been lower if American Century Investments had not voluntarily waived a portion of its management fees. |
| (2) | Data provided by Lipper Inc. — A Reuters Company. © 2010 Reuters. All rights reserved. Any copying, republication or redistribution of Lipper |
| | content, including by caching, framing or similar means, is expressly prohibited without the prior written consent of Lipper. Lipper shall not be |
| | liable for any errors or delays in the content, or for any actions taken in reliance thereon. | | | |
| | Lipper Fund Performance — Performance data is total return, and is preliminary and subject to revision. | | |
| | Lipper Rankings — Rankings are based only on the universe shown and are based on average annual total returns. This listing might not |
| | represent the complete universe of funds tracked by Lipper. | | | | |
| | The data contained herein has been obtained from company reports, financial reporting services, periodicals and other resources believed to be |
| | reliable. Although carefully verified, data on compilations is not guaranteed by Lipper and may be incomplete. No offer or solicitations to buy or |
| | sell any of the securities herein is being made by Lipper. | | | | |
| (3) | Since 8/31/84, the date nearest the fund’s inception for which data are available. | | | |
| |
| Total Annual Fund Operating Expenses |
| Investor Class | 0.53% |
The total annual fund operating expenses shown is as stated in the fund’s prospectus current as of the date of this report. The prospectus may vary from the expense ratio shown elsewhere in this report because it is based on a different time period, includes acquired fund fees and expenses, and, if applicable, does not include fee waivers or expense reimbursements.
Data presented reflect past performance. Past performance is no guarantee of future results. Current performance may be higher or lower than the performance shown. To obtain performance data current to the most recent month end, please call 1-800-345-2021 or visit ammericancentury.com. Investment income may be subject to certain state and local taxes and, depending on your tax status, the federal alternative minimum tax (AMT). Capital gains are not exempt from state and federal income tax.
An investment in the fund is not insured or guaranteed by the Federal Deposit Insurance Corporation or any other government agency. Although the fund seeks to preserve the value of your investment at $1.00 per share, it is possible to lose money by investing in the fund.
The 7-day current yield more closely reflects the current earnings of the fund than the total return.
4
| | |
| Tax-Free Money Market |
| |
| Yields as of May 31, 2010 |
| 7-Day Current Yield | |
| After waiver(1) | 0.07% |
| Before waiver | 0.02% |
| 7-Day Effective Yield(1) | |
| | | 0.07% |
| 7-Day Tax-Equivalent Current Yields(1)(2) |
| 25.00% Tax Bracket | 0.09% |
| 28.00% Tax Bracket | 0.10% |
| 33.00% Tax Bracket | 0.10% |
| 35.00% Tax Bracket | 0.11% |
| (1) | The yields presented reflect the waiver of a portion of the fund’s management fees. Without such waiver, the 7-day yields would have been lower. |
| (2) | The tax brackets indicated are for federal taxes only. Actual tax-equivalent yields may be lower, if alternative minimum tax is applicable. |
| |
| Portfolio Composition by Maturity |
| | | % of fund investments |
| | | as of 5/31/10 |
| 1-30 days | 93% |
| 31-90 days | 2% |
| 91-180 days | 5% |
| More than 180 days | — |
Data presented reflect past performance. Past performance is no guarantee of future results. Current performance may be higher or lower than the performance shown. To obtain performance data current to the most recent month end, please call 1-800-345-2021 or visit ammericancentury.com. Investment income may be subject to certain state and local taxes and, depending on your tax status, the federal alternative minimum tax (AMT). Capital gains are not exempt from state and federal income tax.
An investment in the fund is not insured or guaranteed by the Federal Deposit Insurance Corporation or any other government agency. Although the fund seeks to preserve the value of your investment at $1.00 per share, it is possible to lose money by investing in the fund.
The 7-day current yield more closely reflects the current earnings of the fund than the total return.
5
|
| Shareholder Fee Example (Unaudited) |
Fund shareholders may incur two types of costs: (1) transaction costs, including sales charges (loads) on purchase payments and redemption/ exchange fees; and (2) ongoing costs, including management fees; distribution and service (12b-1) fees; and other fund expenses. This example is intended to help you understand your ongoing costs (in dollars) of investing in your fund and to compare these costs with the ongoing cost of investing in other mutual funds.
The example is based on an investment of $1,000 made at the beginning of the period and held for the entire period from December 1, 2009 to May 31, 2010.
Actual Expenses
The table provides information about actual account values and actual expenses for each class. You may use the information, together with the amount you invested, to estimate the expenses that you paid over the period. First, identify the share class you own. Then simply divide your account value by $1,000 (for example, an $8,600 account value divided by $1,000 = 8.6), then multiply the result by the number under the heading “Expenses Paid During Period” to estimate the expenses you paid on your account during this period.
If you hold Investor Class shares of any American Century Investments fund, or Institutional Class shares of the American Century Diversified Bond Fund, in an American Century Investments account (i.e., not a financial intermediary or retirement plan account), American Century Investments may charge you a $12.50 semiannual account maintenance fee if the value of those shares is less than $10,000. We will redeem shares automatically in one of your accounts to pay the $12.50 fee. In determining your total eligible investment amount, we will include your investments in all personal accounts (including American Century Investments Brokerage accounts) registered under your Social Security number. Personal accounts include individual accounts, joint accounts, UGMA/UTMA accounts, personal trusts, Coverdell Education Savings Accounts and IRAs (including traditional, Roth, Rollover, SEP-, SARSEP- and SIMPLE-IRAs), and certain other retirement accounts. If you have only business, business retirement, employer-sponsored or American Century Investments Brokerage accounts, you are currently not subject to this fee. We will not charge the fee as long as you choose to manage your accounts exclusively online. If you are subject to the Account Maintenance Fee, your account value could be reduced by the fee amount.
Hypothetical Example for Comparison Purposes
The table also provides information about hypothetical account values and hypothetical expenses based on the actual expense ratio of each class of your fund and an assumed rate of return of 5% per year before expenses, which is not the actual return of a fund’s share class. The hypothetical account values and expenses may not be used to estimate the actual ending account balance or expenses you paid for the period. You may use this information
6
to compare the ongoing costs of investing in your fund and other funds. To do so, compare this 5% hypothetical example with the 5% hypothetical examples that appear in the shareholder reports of the other funds.
Please note that the expenses shown in the table are meant to highlight your ongoing costs only and do not reflect any transactional costs, such as sales charges (loads) or redemption/exchange fees. Therefore, the table is useful in comparing ongoing costs only, and will not help you determine the relative total costs of owning different funds. In addition, if these transactional costs were included, your costs would have been higher.
| | | | | |
| | | Beginning | Ending | Expenses Paid | |
| | | Account Value | Account Value | During Period(1) | Annualized |
| | | 12/1/09 | 5/31/10 | 12/1/09 - 5/31/10 | Expense Ratio(1) |
| Actual | | | | |
| Investor Class | $1,000 | $1,000.40 | $2.19 | 0.44% |
| (after waiver)(2) | | | | |
| Investor Class | $1,000 | $1,000.40(3) | $2.49 | 0.50% |
| (before waiver) | | | | |
| Hypothetical | | | | |
| Investor Class | $1,000 | $1,022.74 | $2.22 | 0.44% |
| (after waiver)(2) | | | | |
| Investor Class | $1,000 | $1,022.44 | $2.52 | 0.50% |
| (before waiver) | | | | |
| (1) | Expenses are equal to the fund’s annualized expense ratio listed in the table above, multiplied by the average account value over the period, |
| | multiplied by 182, the number of days in the most recent fiscal half-year, divided by 365, to reflect the one-half year period. |
| (2) | During the six months ended May 31, 2010, American Century Investments voluntarily waived a portion of its management fees. |
| (3) | Ending account value assumes the return earned after waiver. The return would have been lower had fees not been waived and would have |
| | resulted in a lower ending account value. | | | |
7
| | | | | | |
| Tax-Free Money Market | | | | | |
| |
| MAY 31, 2010 | | | | | | |
| | Principal | | | | Principal | |
| | Amount | Value | | | Amount | Value |
| Municipal Securities — 99.3% | | | Colorado Educational & | | |
| | | | | Cultural Facilities Auth. Rev., | | |
| ALABAMA — 0.8% | | | | (Capital Christian School), | | |
| Troy Health Care Auth. Rev., | | | | VRDN, 0.42%, 6/3/10 (LOC: | | |
| (Southeast Rural Health), | | | | Stockmans Bank and Union | | |
| VRDN, 0.34%, 6/3/10 | | | | Bank of California N.A.) | $ 5,250,000 | $ 5,250,000 |
| (LOC: Troy Bank and Trust | | | | Hotchkiss Industrial | | |
| Co. and FHLB) | $ 2,150,000 | $ 2,150,000 | | Development Rev., (Kroger | | |
| CALIFORNIA — 9.8% | | | | Co.), VRDN, 0.39%, 6/7/10 | | |
| Alameda County Industrial | | | | (LOC: U.S. Bank N.A.) | 1,500,000 | 1,500,000 |
| Development Auth. Rev., | | | | Thornton Industrial | | |
| (BAT Properties LLC), | | | | Development Rev., (Kroger | | |
| VRDN, 0.45%, 6/3/10 (LOC: | | | | Co.), VRDN, 0.39%, 6/7/10 | | |
| Bank of the West) | 4,200,000 | 4,200,000 | | (LOC: U.S. Bank N.A.) | 2,900,000 | 2,900,000 |
| California Statewide | | | | | | 12,395,000 |
| Communities Development | | | | DELAWARE — 6.1% | | |
| Auth. Rev., (Trinity Children | | | | Delaware Health Facilities | | |
| & Family), VRDN, 0.37%, | | | | Auth. Rev., (Beebe Medical | | |
| 6/2/10 (LOC: Citizens | | | | Center), VRDN, 0.71%, | | |
| Business Bank and | | | | 6/3/10 (LOC: PNC | | |
| California State Teacher’s | | | | Bank N.A.) | 17,125,000 | 17,125,000 |
| Retirement) | 320,000 | 320,000 | | | | |
| Highland Redevelopment | | | | FLORIDA — 5.2% | | |
| Agency Multi-Family | | | | DeSoto County Industrial | | |
| Housing Rev., (Jeffrey Court | | | | Development Rev., (Tremron, | | |
| Senior Apartments), VRDN, | | | | Inc.), VRDN, 0.37%, 6/3/10 | | |
| 0.52%, 6/3/10 (LOC: East | | | | (LOC: Branch Banking | | |
| West Bank and FHLB) | 3,500,000 | 3,500,000 | | & Trust) | 2,400,000 | 2,400,000 |
| Los Angeles Unified | | | | Escambia County Health | | |
| School District Tax & Rev. | | | | Facilities Auth. Rev., Series | | |
| Anticipation Notes GO, | | | | 2003 A, (Azalea Trace, | | |
| 2.00%, 8/12/10 | 5,070,000 | 5,083,709 | | Inc.), VRDN, 0.28%, 6/1/10 | | |
| | | | | (Radian) (LOC: Bank of | | |
| Riverside County Industrial | | | | America N.A.) (SBBPA: | | |
| Development Auth. Rev., | | | | Bank of America N.A.) | 600,000 | 600,000 |
| (Cal-Mold, Inc.), VRDN, | | | | | | |
| 0.46%, 6/2/10 (LOC: Bank | | | | Escambia County Solid | | |
| of the West) | 2,030,000 | 2,030,000 | | Waste Disposal System Rev., | | |
| | | | | (Gulf Power Co.), VRDN, | | |
| Santa Rosa Wastewater | | | | 0.33%, 6/1/10 | 2,400,000 | 2,400,000 |
| Rev., Series 2004 A, VRDN, | | | | | | |
| 0.44%, 6/3/10 (LOC: | | | | JP Morgan Chase Trust | | |
| Landesbank Baden- | | | | Rev., Series 2009-3359, | | |
| Wurttemberg) | 12,400,000 | 12,400,000 | | (PUTTERs/DRIVERs), | | |
| | | | | VRDN, 0.34%, 6/3/10 | | |
| | | 27,533,709 | | (NATL/FGIC) (LIQ FAC: | | |
| COLORADO — 4.4% | | | | JPMorgan Chase | | |
| Avon Industrial Development | | | | Bank N.A.)(1) | 5,390,000 | 5,390,000 |
| Rev., (Kroger Co.), VRDN, | | | | JP Morgan Chase Trust | | |
| 0.39%, 6/7/10 (LOC: U.S. | | | | Rev., Series 2009-3439, | | |
| Bank N.A.) | 2,745,000 | 2,745,000 | | (PUTTERs/DRIVERs), | | |
| | | | | VRDN, 0.39%, 6/3/10 | | |
| | | | | AGM-CR/XLCA) (LIQ FAC: | | |
| | | | | JPMorgan Chase | | |
| | | | | Bank N.A.)(1) | 3,695,000 | 3,695,000 |
| | | | | | | 14,485,000 |
8
| | | | | | |
| Tax-Free Money Market | | | | | |
| |
| | Principal | | | | Principal | |
| | Amount | Value | | | Amount | Value |
| GEORGIA — 6.8% | | | | McCook Rev., Series 1996 | | |
| Carroll County Water & | | | | B, (St. Andrew Society), | | |
| Sewer Auth. Rev., (Temple), | | | | VRDN, 0.42%, 6/3/10 (LOC: | | |
| VRDN, 0.38%, 6/3/10 (LOC: | | | | Northern Trust Company) | $ 1,700,000 | $ 1,700,000 |
| Bank of America N.A.) | $ 1,825,000 | $ 1,825,000 | | Rock Island County | | |
| Clayton County Multi-Family | | | | Metropolitan Airport Auth. | | |
| Housing Auth. Rev., Series | | | | Rev., (Elliott Aviation), | | |
| 1990 B, (Kimberly Forest), | | | | VRDN, 0.42%, 6/2/10 (LOC: | | |
| VRDN, 1.16%, 6/2/10 | | | | U.S. Bank N.A.) | 2,155,000 | 2,155,000 |
| (AGM) (SBBPA: | | | | | | 15,960,979 |
| Societe Generale) | 6,155,000 | 6,155,000 | | INDIANA — 1.8% | | |
| Clayton County Multi- | | | | Indiana Development | | |
| Family Housing Auth. Rev., | | | | Finance Auth. Rev., (TTP, | | |
| Series 1990 C, (Villa Rouge | | | | Inc.), VRDN, 0.42%, 6/3/10 | | |
| Apartments), VRDN, 1.16%, | | | | (LOC: LaSalle Bank N.A.)(1) | 2,135,000 | 2,135,000 |
| 6/2/10 (AGM) (SBBPA: | | | | | | |
| Societe Generale) | 6,955,000 | 6,955,000 | | Jasper County Industrial | | |
| | | | | Development Rev., | | |
| Clayton County Multi-Family | | | | (Newberry Farms LLC), | | |
| Housing Auth. Rev., Series | | | | VRDN, 0.59%, 6/7/10 | | |
| 1990 D, (Kings Arms | | | | (LOC: Farm Credit Services | | |
| Apartments), VRDN, 1.16%, | | | | of America and Bank of | | |
| 6/2/10 (AGM) (SBBPA: | | | | the West) | 2,800,000 | 2,800,000 |
| Societe Generale) | 3,315,000 | 3,315,000 | | | | 4,935,000 |
| Middle Coastal Unified | | | | | | |
| Development Auth. Rev., | | | | IOWA — 5.2% | | |
| (YMCA of Coastal Georgia), | | | | Buffalo Pollution Control | | |
| VRDN, 0.38%, 6/3/10 (LOC: | | | | Rev., Series 1991 B, | | |
| Bank of America N.A.) | 1,000,000 | 1,000,000 | | (Lafarge Corp.), VRDN, | | |
| | | 19,250,000 | | 0.55%, 6/1/10 (LOC: | | |
| | | | | BNP Paribas) | 5,250,000 | 5,250,000 |
| HAWAII — 0.3% | | | | Iowa Finance Auth. | | |
| Hawaii State Department of | | | | Economic Development Rev., | | |
| Budget & Finance Special | | | | Series 2009 B, (Midwestern | | |
| Purpose Rev., Series 1999 A, | | | | Disaster Area), VRDN, | | |
| (Palama Meat Co.), VRDN, | | | | 0.36%, 6/7/10 | 8,000,000 | 8,000,000 |
| 0.44%, 6/3/10 (LOC: Wells | | | | | | |
| Fargo Bank N.A.) | 1,000,000 | 1,000,000 | | Iowa Finance Auth. | | |
| | | | | Industrial Development Rev., | | |
| ILLINOIS — 5.7% | | | | (Embria Health Sciences), | | |
| Illinois Development Finance | | | | VRDN, 0.44%, 6/1/10 (LOC: | | |
| Auth. Rev., (Solomon | | | | Wells Fargo Bank N.A.) | 1,300,000 | 1,300,000 |
| Schechter Day School), | | | | | | 14,550,000 |
| VRDN, 0.42%, 6/3/10 (LOC: | | | | | | |
| LaSalle Bank N.A.)(1) | 4,250,000 | 4,250,000 | | KANSAS — 0.8% | | |
| Illinois Finance Auth. Rev., | | | | Hutchinson Industrial | | |
| (Merit School of Music), | | | | Development Rev., (Kroger | | |
| VRDN, 0.42%, 6/3/10 (LOC: | | | | Co.), VRDN, 0.39%, 6/7/10 | | |
| LaSalle Bank N.A.) | 1,900,000 | 1,900,000 | | (LOC: U.S. Bank N.A.) | 1,000,000 | 1,000,000 |
| Illinois GO, 2.00%, 6/10/10 | 4,000,000 | 4,000,979 | | Shawnee Private Activity | | |
| | | | | Rev., (Simmons Co.), VRDN, | | |
| Illinois Housing Development | | | | 0.55%, 6/2/10 (LOC: | | |
| Auth. Multi-Family Housing | | | | Deutsche Bank AG)(1) | 1,310,000 | 1,310,000 |
| Rev., (Rome Meadows), | | | | | | |
| VRDN, 0.68%, 6/3/10 | | | | | | 2,310,000 |
| (LOC: First National Bank | | | | | | |
| and FHLB) | 1,955,000 | 1,955,000 | | | | |
9
| | | | | | |
| Tax-Free Money Market | | | | | |
| |
| | Principal | | | | Principal | |
| | Amount | Value | | | Amount | Value |
| KENTUCKY — 0.7% | | | | MINNESOTA — 1.2% | | |
| Murray Industrial Building | | | | Owatonna Housing Rev., | | |
| Rev., (Kroger Co.), VRDN, | | | | Series 2003 A, (Second | | |
| 0.39%, 6/7/10 (LOC: U.S. | | | | Century Housing), VRDN, | | |
| Bank N.A.) | $ 1,000,000 | $ 1,000,000 | | 0.49%, 6/3/10 (LOC: | | |
| Winchester Industrial | | | | American Bank of St. Paul | | |
| Building Rev., (Kroger Co.), | | | | and FHLB) | $ 3,360,000 | $ 3,360,000 |
| VRDN, 0.39%, 6/7/10 (LOC: | | | | MISSISSIPPI — 0.6% | | |
| U.S. Bank N.A.) | 1,000,000 | 1,000,000 | | Mississippi Business Finance | | |
| | | 2,000,000 | | Corp. Rev., Series 2004 B, | | |
| LOUISIANA — 1.7% | | | | VRDN, 0.41%, 6/7/10 (LOC: | | |
| Louisiana Local Government | | | | Wells Fargo Bank N.A.) | 1,780,000 | 1,780,000 |
| Environmental Facilities & | | | | MISSOURI — 6.4% | | |
| Community Development | | | | Jackson County Industrial | | |
| Auth. Rev., (Hollybrook | | | | Development Auth. Rev., | | |
| Enterprises LLC), VRDN, | | | | (Linda Hall Library), VRDN, | | |
| 0.59%, 6/1/10 (LOC: First | | | | 0.33%, 6/3/10 (LOC: | | |
| South Farm Credit and Wells | | | | Commerce Bank N.A.) | 9,000,000 | 9,000,000 |
| Fargo Bank N.A.) | 1,920,000 | 1,920,000 | | Missouri Health & | | |
| Terrebonne Economic | | | | Educational Facilities | | |
| Development Auth. Gulf | | | | Auth. Rev., (Pembroke Hill | | |
| Opportunity Zone Rev., | | | | School), VRDN, 0.33%, | | |
| (Buquet Distribution Co.), | | | | 6/3/10 (LOC: Commerce | | |
| VRDN, 0.55%, 6/3/10 (LOC: | | | | Bank N.A.) | 7,400,000 | 7,400,000 |
| Community Bank and FHLB) | 2,800,000 | 2,800,000 | | University City Industrial | | |
| | | 4,720,000 | | Development Rev., (Winco | | |
| MAINE — 0.5% | | | | Redevelopment Corp., Inc.), | | |
| | | | | VRDN, 0.41%, 6/3/10 (LOC: | | |
| Dover-Foxcroft Rev., | | | | Commerce Bank N.A.) | 1,730,000 | 1,730,000 |
| (Pleasant River), VRDN, | | | | | | |
| 0.61%, 6/4/10 (LOC: | | | | | | 18,130,000 |
| CoBANK ACB and Wells | | | | NEW YORK — 0.3% | | |
| Fargo Bank N.A.) | 1,305,000 | 1,305,000 | | New York City Industrial | | |
| MARYLAND — 1.4% | | | | Development Agency Civic | | |
| Baltimore Industrial | | | | Facility Rev., (Peninsula | | |
| Development Auth. | | | | Hospital Center), VRDN, | | |
| Rev., (Baltimore Capital | | | | 0.85%, 6/3/10 (LOC: | | |
| Acquisition), VRDN, | | | | JPMorgan Chase Bank N.A.) | 895,000 | 895,000 |
| 0.37%, 6/2/10 (LOC: | | | | NORTH CAROLINA — 3.2% | | |
| Bayerische Landesbank) | 2,650,000 | 2,650,000 | | Buncombe County GO, | | |
| Maryland Economic | | | | Series 2002 B, VRDN, | | |
| Development Corp. | | | | 0.37%, 6/3/10 (SBBPA: | | |
| Rev., (Blind Industries & | | | | Wells Fargo Bank N.A.) | 1,050,000 | 1,050,000 |
| Services), VRDN, 0.38%, | | | | Iredell County Industrial | | |
| 6/3/10 (LOC: Bank of | | | | Facilities & Pollution Control | | |
| America N.A.) | 1,215,000 | 1,215,000 | | Financing Auth. Rev., | | |
| | | 3,865,000 | | (Valspar Corp.), VRDN, | | |
| MASSACHUSETTS — 0.4% | | | | 0.44%, 6/3/10 (LOC: Wells | | |
| | | | | Fargo Bank N.A.)(1) | 1,100,000 | 1,100,000 |
| Macon Trust Various States | | | | | | |
| Rev., Series 2007-344, VRDN, | | | | North Carolina Capital | | |
| 0.38%, 6/7/10 (LOC: Bank | | | | Facilities Finance Agency | | |
| of America N.A.) (LIQ FAC: | | | | Rev., (Montessori Childrens | | |
| Bank of America N.A.)(1) | 1,066,000 | 1,066,000 | | Center), VRDN, 0.42%, | | |
| | | | | 6/3/10 (LOC: Bank of | | |
| MICHIGAN — 2.9% | | | | America N.A.) | 1,200,000 | 1,200,000 |
| Michigan GO, Series 2009 A, | | | | | | |
| 2.00%, 9/30/10 | 8,000,000 | 8,038,819 | | | | |
10
| | | | | | |
| Tax-Free Money Market | | | | | |
| |
| | Principal | | | | Principal | |
| | Amount | Value | | | Amount | Value |
| North Carolina Educational | | | | PUERTO RICO — 2.1% | | |
| Facilities Finance Agency | | | | Austin Trust Various States | | |
| Rev., (Cape Fear Academy), | | | | GO, Series 2008-355, VRDN, | | |
| VRDN, 0.37%, 6/3/10 (LOC: | | | | 0.38%, 6/7/10 (LOC: Bank | | |
| Wells Fargo Bank N.A.) | $ 1,200,000 | $ 1,200,000 | | of America N.A.) (SBBPA: | | |
| North Carolina Housing | | | | Bank of America N.A.)(1) | $ 6,000,000 | $ 6,000,000 |
| Finance Agency Rev., Series | | | | TENNESSEE — 2.8% | | |
| 2000 A, (Appalachian | | | | | | |
| Student Housing Corp.), | | | | Bradley County Industrial | | |
| VRDN, 0.37%, 6/2/10 (LOC: | | | | Development Board Rev., | | |
| Wells Fargo Bank N.A.) | 980,000 | 980,000 | | (Kroger Co.), VRDN, | | |
| | | | | 0.39%, 6/7/10 (LOC: U.S. | | |
| North Carolina Medical Care | | | | Bank N.A.) | 7,880,000 | 7,880,000 |
| Commission Health Care | | | | | | |
| Facilities Rev., (Carolina | | | | TEXAS — 17.1% | | |
| Village, Inc.), VRDN, 0.37%, | | | | Brazos Harbor Industrial | | |
| 6/3/10 (LOC: First Citizens | | | | Development Corp. Rev., | | |
| Bank and Trust Co. and | | | | (BASF Corp.), VRDN, | | |
| Wells Fargo Bank N.A.) | 1,500,000 | 1,500,000 | | 0.40%, 6/1/10 | 13,900,000 | 13,900,000 |
| North Carolina Medical Care | | | | Crawford Education | | |
| Commission Health Care | | | | Facilities Corp. Rev., Series | | |
| Facilities Rev., (Stanley | | | | 2004 A, (University Parking | | |
| Total Living Center), VRDN, | | | | System), VRDN, 0.90%, | | |
| 0.37%, 6/3/10 (LOC: Wells | | | | 6/3/10 (LOC: BNP Paribas) | 9,800,000 | 9,800,000 |
| Fargo Bank N.A.)(1) | 2,010,000 | 2,010,000 | | Hale County Industrial | | |
| | | 9,040,000 | | Development Corp. Rev., | | |
| OHIO — 2.1% | | | | (Struikmans), VRDN, 0.59%, | | |
| | | | | 6/7/10 (LOC: Farm Credit | | |
| Allen County Health Care | | | | Services of America and | | |
| Facilities Rev., (Mennonite | | | | Bank of the West) | 3,000,000 | 3,000,000 |
| Memorial Home), VRDN, | | | | | | |
| 0.37%, 6/3/10 (LOC: Wells | | | | Muleshoe Economic | | |
| Fargo Bank N.A.) | 1,680,000 | 1,680,000 | | Development Corp. Industrial | | |
| | | | | Development Rev., (John | | |
| Putnam County Health Care | | | | Lyle & Grace Ajean), VRDN, | | |
| Facilities Rev., (Refunding | | | | 0.54%, 6/3/10 (LOC: Wells | | |
| and Improvement Hilty | | | | Fargo Bank N.A.) | 4,930,000 | 4,930,000 |
| Memorial Home, Inc.), | | | | | | |
| VRDN, 0.36%, 6/3/10 | | | | Port of Corpus Christi Auth. | | |
| (LOC: First Federal Bank of | | | | of Nueces County Solid | | |
| Midwest and FHLB) | 4,160,000 | 4,160,000 | | Waste Disposal Rev., (Flint | | |
| | | | | Hills Resources, LP), VRDN, | | |
| | | 5,840,000 | | 0.41%, 6/2/10 | 4,500,000 | 4,500,000 |
| PENNSYLVANIA — 4.0% | | | | Port of Corpus Christi Auth. | | |
| Berks County Municipal | | | | of Nueces County Solid | | |
| Auth. Rev., Series 2009 A5, | | | | Waste Disposal Rev., (Flint | | |
| (Reading Hospital & | | | | Hills Resources, LP), VRDN, | | |
| Medical Center), VRDN, | | | | 0.41%, 6/2/10 | 6,000,000 | 6,000,000 |
| 0.53%, 6/3/10 | 9,685,000 | 9,685,000 | | Texas Tax & Revenue | | |
| Chester County Industrial | | | | Anticipation Notes Rev., | | |
| Development Auth. Rev., | | | | 2.50%, 8/31/10 | 6,000,000 | 6,030,675 |
| (Delaware Valley Friends | | | | | | 48,160,675 |
| School), VRDN, 0.37%, | | | | | | |
| 6/2/10 (LOC: Wells Fargo | | | | | | |
| Bank N.A.)(1) | 1,485,000 | 1,485,000 | | | | |
| | | 11,170,000 | | | | |
11
| | | | |
| Tax-Free Money Market | | |
| |
| | Principal | | | Notes to Schedule of Investments |
| | Amount | Value | | AGM = Assured Guaranty Municipal Corporation |
| WASHINGTON — 1.8% | | | | AGM-CR = Assured Guaranty Municipal Corporation-Custodian Receipts |
| Washington Economic | | | | DRIVERs = Derivative Inverse Tax-Exempt Receipts |
| Development Finance Auth. | | | | |
| Rev., Series 2007 E, (Mesa | | | | FHLB = Federal Home Loan Bank |
| Dairy LLC.), VRDN, 0.59%, | | | | FGIC = Financial Guaranty Insurance Company |
| 6/3/10 (LOC: Citizens | | | | GO = General Obligation |
| Business Bank and Wells | | | | LIQ FAC = Liquidity Facilities |
| Fargo Bank N.A.) | $ 3,990,000 | $ 3,990,000 | | |
| Washington Finance | | | | LOC = Letter of Credit |
| Commission Nonprofit | | | | NATL = National Public Finance Guarantee Corporation |
| Housing Rev., (Nikkei | | | | PUTTERs = Puttable Tax-Exempt Receipts |
| Manor), VRDN, 0.40%, | | | | Radian = Radian Asset Assurance, Inc. |
| 6/1/10 (LOC: Bank of | | | | |
| America N.A.) | 1,100,000 | 1,100,000 | | SBBPA = Standby Bond Purchase Agreement |
| | | 5,090,000 | | VRDN = Variable Rate Demand Note. Interest reset date is indicated. |
| WISCONSIN — 3.2% | | | | Rate shown is effective at the period end. |
| Verona Industrial | | | | XLCA = XL Capital Ltd. |
| Development Rev., (Latitude | | | | (1) Security was purchased under Rule 144A or Section 4(2) of |
| Corp.), VRDN, 0.39%, | | | | the Securities Act of 1933 or is a private placement and, unless |
| 6/3/10 (LOC: U.S. | | | | registered under the Act or exempted from registration, may only |
| Bank N.A.) | 3,965,000 | 3,965,000 | | be sold to qualified institutional investors. The aggregate value |
| | | | | of these securities at the period end was $28,441,000, which |
| Wisconsin Health & | | | | represented 10.1% of total net assets. None of these securities |
| Educational Facilities Auth. | | | | were considered illiquid. |
| Rev., (National Regency of | | | | |
| New Berlin, Inc.), VRDN, | | | | |
| 0.24%, 6/1/10 (LOC: | | | | Geographic classifications are unaudited. |
| JPMorgan Chase Bank N.A.) | 5,000,000 | 5,000,000 | | |
| | | 8,965,000 | | |
| TOTAL INVESTMENT | | | | See Notes to Financial Statements. |
| SECURITIES — 99.3% | | 279,000,182 | | |
| OTHER ASSETS | | | | |
| AND LIABILITIES — 0.7% | | 1,874,102 | | |
| TOTAL NET ASSETS — 100.0% | $280,874,284 | | |
12
|
| Statement of Assets and Liabilities |
| |
| MAY 31, 2010 | |
| Assets | |
| Investment securities, at value (amortized cost and cost for federal income tax purposes) | $279,000,182 |
| Cash | 778,681 |
| Receivable for investments sold | 774,000 |
| Receivable for capital shares sold | 196,041 |
| Interest receivable | 459,387 |
| | 281,208,291 |
| | |
| Liabilities | |
| Payable for capital shares redeemed | 228,520 |
| Accrued management fees | 104,986 |
| Dividends payable | 501 |
| | 334,007 |
| | |
| Net Assets | $280,874,284 |
| | |
| Capital Shares | |
| Outstanding (unlimited number of shares authorized) | 280,908,794 |
| | |
| Net Asset Value Per Share | $1.00 |
| | |
| Net Assets Consist of: | |
| Capital paid in | $280,888,964 |
| Accumulated net realized loss on investment transactions | (14,680) |
| | $280,874,284 |
| |
| |
| See Notes to Financial Statements. | |
13
| |
| YEAR ENDED MAY 31, 2010 | |
| Investment Income (Loss) | |
| Income: | |
| Interest | $2,057,986 |
| | |
| Expenses: | |
| Management fees | 1,529,842 |
| Temporary guarantee program fees | 35,439 |
| Trustees’ fees and expenses | 13,638 |
| Other expenses | 2,606 |
| | 1,581,525 |
| Fees waived | (159,715) |
| | 1,421,810 |
| | |
| Net investment income (loss) | 636,176 |
| | |
| Net realized gain (loss) on investment transactions | 1,777 |
| | |
| Net Increase (Decrease) in Net Assets Resulting from Operations | $ 637,953 |
| |
| |
| See Notes to Financial Statements. | |
14
|
| Statement of Changes in Net Assets |
| | |
| YEARS ENDED MAY 31, 2010 AND MAY 31, 2009 | | |
| Increase (Decrease) in Net Assets | 2010 | 2009 |
| Operations | | |
| Net investment income (loss) | $ 636,176 | $ 4,601,317 |
| Net realized gain (loss) | 1,777 | 17,166 |
| Net increase (decrease) in net assets resulting from operations | 637,953 | 4,618,483 |
| | | |
| Distributions to Shareholders | | |
| From net investment income | (636,176) | (4,603,543) |
| | | |
| Capital Share Transactions | | |
| Proceeds from shares sold | 202,106,984 | 283,675,396 |
| Proceeds from reinvestment of distributions | 606,100 | 4,370,332 |
| Payments for shares redeemed | (256,608,412) | (266,834,956) |
| Net increase (decrease) in net assets from capital share transactions | (53,895,328) | 21,210,772 |
| | | |
| Net increase (decrease) in net assets | (53,893,551) | 21,225,712 |
| | | |
| Net Assets | | |
| Beginning of period | 334,767,835 | 313,542,123 |
| End of period | $280,874,284 | $334,767,835 |
| | | |
| Transactions in Shares of the Fund | | |
| Sold | 202,106,984 | 283,675,396 |
| Issued in reinvestment of distributions | 606,100 | 4,370,332 |
| Redeemed | (256,608,412) | (266,834,956) |
| Net increase (decrease) in shares of the fund | (53,895,328) | 21,210,772 |
| |
| |
| See Notes to Financial Statements. | | |
15
|
| Notes to Financial Statements |
MAY 31, 2010
1. Organization and Summary of Significant Accounting Policies
Organization — American Century Municipal Trust (the trust) is registered under the Investment Company Act of 1940 (the 1940 Act) as an open-end management investment company. Tax-Free Money Market Fund (the fund) is one fund in a series issued by the trust. The fund is diversified under Rule 2a-7 of the 1940 Act. The fund’s investment objective is to seek safety of principal and high current income that is exempt from federal income tax. The fund pursues its objective by investing primarily in cash-equivalent, high-quality municipal obligations. The following is a summary of the fund’s significant accounting policies.
Security Valuations — Securities are generally valued at amortized cost, which approximates current market value. When such valuations do not reflect market value, securities may be valued as determined by the Board of Trustees or its designee, in accordance with procedures adopted by the Board of Trustees.
Security Transactions — For financial reporting purposes, security transactions are accounted for as of the trade date. Net realized gains and losses are determined on the identified cost basis, which is also used for federal income tax purposes.
Investment Income — Interest income is recorded on the accrual basis and includes accretion of discounts and amortization of premiums.
When-Issued — The fund may engage in securities transactions on a when-issued basis. Under these arrangements, the securities’ prices and yields are fixed on the date of the commitment, but payment and delivery are scheduled for a future date. During this period, securities are subject to market fluctuations. The fund will segregate cash, cash equivalents or other appropriate liquid securities on its records in amounts sufficient to meet the purchase price.
Income Tax Status — It is the fund’s policy to distribute substantially all net investment income and net realized gains to shareholders and to otherwise qualify as a regulated investment company under provisions of the Internal Revenue Code. The fund is no longer subject to examination by tax authorities for years prior to 2007. At this time, management believes there are no uncertain tax positions which, based on their technical merit, would not be sustained upon examination and for which it is reasonably possible that the total amounts of unrecognized tax benefits will significantly change in the next twelve months. Accordingly, no provision has been made for federal or state income taxes.
Distributions to Shareholders — Distributions from net investment income are declared daily and paid monthly. The fund does not generally expect to realize any long-term capital gains, and accordingly, does not expect to pay any capital gains distributions.
Indemnifications — Under the trust’s organizational documents, its officers and trustees are indemnified against certain liabilities arising out of the performance of their duties to the fund. In addition, in the normal course of business, the fund enters into contracts that provide general indemnifications. The maximum exposure under these arrangements is unknown as this would involve future claims that may be made against a fund. The risk of material loss from such claims is considered by management to be remote.
Use of Estimates — The financial statements are prepared in conformity with accounting principles generally accepted in the United States of America, which may require management to make certain estimates and assumptions at the date of the financial statements. Actual results could differ from these estimates.
16
Subsequent Events — In preparing the financial statements, management evaluated the impact of events or transactions occurring through the date the financial statements were issued that would merit recognition or disclosure.
2. Fees and Transactions with Related Parties
Management Fees — The trust has entered into a Management Agreement with American Century Investment Management, Inc. (ACIM) (the investment advisor), under which ACIM provides the fund with investment advisory and management services in exchange for a single, unified management fee (the fee) per class. The Agreement provides that all expenses of managing and operating the fund, except brokerage expenses, taxes, interest, fees and expenses of the independent trustees (including legal counsel fees), and extraordinary expenses, will be paid by ACIM. The fee is computed and accrued daily based on the daily net assets of the specific class of shares of the fund and paid monthly in arrears. The fee consists of (1) an Investment Category Fee based on the daily net assets of the funds and certain other accounts managed by the in vestment advisor that are in the same broad investment category as the fund and (2) a Complex Fee based on the assets of all the funds in the American Century Investments family of funds. The rates for the Investment Category Fee range from 0.1570% to 0.2700%. The rates for the Complex Fee range from 0.2500% to 0.3100%. From June 1, 2009 to July 31, 2009, the investment advisor voluntarily agreed to waive 0.038% of its management fee. Effective August 1, 2009, the investment advisor voluntarily agreed to waive 0.054% of its management fee. The investment advisor expects the fee waiver to continue for one year and cannot terminate it without consulting the Board of Trustees. The effective annual management fee for the year ended May 31, 2010 was 0.49% before waiver and 0.44% after waiver.
Temporary Guarantee Program — On October 3, 2008, the Board of Trustees approved the fund to participate in the U.S. Treasury Department’s Temporary Guarantee Program for Money Market Funds (the program). The program provides coverage to guarantee the account values of shareholders in the event the fund’s net asset value falls below $0.995 and the Trustees liquidate the fund. The program covers the lesser of a shareholder’s account value on September 19, 2008, or on the date of liquidation. Participation in the program requires the fund to pay a fee based on the net assets of the fund as of the close of business on September 19, 2008, which is amortized daily over the period. The fund participated in the program from September 19, 2008 through December 19, 2008 and paid a fee of 0.01% of its net assets as of September 19, 2008. The fund continued its participation in the program from December 20, 2008 through April 30, 2009 and paid a fee of 0.015% of its net assets as of September 19, 2008. The fund continued its participation in a program extension from May 1, 2009 through September 18, 2009 and paid a fee of 0.015% of its net assets as of September 19, 2008. The program expired on September 18, 2009. For the year ended May 31, 2010, the annualized ratio of the program fee to average net assets was 0.01%.
Related Parties — Certain officers and trustees of the trust are also officers and/or directors of American Century Companies, Inc. (ACC), the parent of the trust’s investment advisor, ACIM, the distributor of the trust, American Century Investment Services, Inc. and the trust’s transfer agent, American Century Services, LLC.
The fund has a Mutual Funds Services Agreement with J.P. Morgan Investor Services Co. (JPMIS). JPMorgan Chase Bank (JPMCB) is a custodian of the fund. JPMIS and JPMCB are wholly owned subsidiaries of JPMorgan Chase & Co. (JPM). JPM is an equity investor in ACC.
17
3. Fair Value Measurements
The fund’s securities valuation process is based on several considerations and may use multiple inputs to determine the fair value of the positions held by the fund. In conformity with accounting principles generally accepted in the United States of America, the inputs used to determine a valuation are classified into three broad levels as follows:
• Level 1 valuation inputs consist of unadjusted quoted prices in an active market for identical securities;
• Level 2 valuation inputs consist of significant direct or indirect observable market data (including quoted prices for similar securities, evaluations of subsequent market events, interest rates, prepayment speeds, credit risk, etc.); or
• Level 3 valuation inputs consist of significant unobservable inputs (including a fund’s own assumptions).
The level classification is based on the lowest level input that is significant to the fair valuation measurement. The valuation inputs are not an indication of the risks associated with investing in these securities or other financial instruments.
As of May 31, 2010, the valuation inputs used to determine the fair value of the fund’s municipal securities were classified as Level 2. The Schedule of Investments provides additional details on the fund’s portfolio holdings.
4. Interfund Lending
The fund, along with certain other funds in the American Century Investments family of funds, may participate in an interfund lending program, pursuant to an Exemptive Order issued by the Securities and Exchange Commission (SEC). This program provides an alternative credit facility allowing the fund to borrow from or lend to other funds in the American Century Investments family of funds that permit such transactions. Interfund lending transactions are subject to each fund’s investment policies and borrowing and lending limits. The interfund loan rate earned/paid on interfund lending transactions is determined daily based on the average of certain current market rates. Interfund lending transactions normally extend only overnight, but can have a maximum duration of seven days. The program is subject to annual approval by the Board of Trustees. During the year ended May 31, 2010, the fund did not utilize the p rogram.
5. Federal Tax Information
The tax character of distributions paid during the years ended May 31, 2010 and May 31, 2009 were as follows:
| | |
| | 2010 | 2009 |
| Distributions Paid From | | |
| Exempt income | $636,176 | $4,603,543 |
| Long-term capital gains | — | — |
The book-basis character of distributions made during the year from net investment income or net realized gains may differ from their ultimate characterization for federal income tax purposes. These differences reflect the differing character of certain income items and net realized gains and losses for financial statement and tax purposes, and may result in reclassification among certain capital accounts on the financial statements.
18
As of May 31, 2010, the fund had accumulated net realized capital loss carryovers for federal income tax purposes of $(14,642), which may be used to offset future taxable gains. Future capital loss carryover utilization in any given year may be subject to Internal Revenue Code limitations. The capital loss carryovers expire as follows:
| | | | | | |
| 2012 | 2013 | 2014 | 2015 | 2016 | 2017 | 2018 |
| $(3,706) | $(1,346) | — | $(1,691) | $(2,918) | — | $(4,981) |
The fund had a capital loss deferral of $(38) that represents net capital losses incurred in the seven-month period ended May 31, 2010. The fund has elected to treat such losses as having been incurred in the following fiscal year for federal income tax purposes.
6. Corporate Event
As part of a long-standing estate and business succession plan established by ACC Co-Chairman James E. Stowers, Jr., the founder of American Century Investments, ACC Co-Chairman Richard W. Brown succeeded Mr. Stowers as trustee of a trust that holds a greater-than-25% voting interest in ACC, the parent corporation of each fund’s advisor. Under the 1940 Act, this is presumed to represent control of ACC even though it is less than a majority interest. The change of trustee may technically be considered a “change of control” of ACC and therefore also a change of control of each fund’s advisor even though there has been no change to their management and none is anticipated. The “change of control” resulted in the assignment of each fund’s investment advisory agreement. Under the 1940 Act, an assignment automatically terminated such agreement, making the approval of a new agreement ne cessary.
On February 18, 2010, the Board of Trustees approved interim investment advisory agreements under which each fund will be managed until new agreements are approved by fund shareholders. On April 1, 2010, the Board of Trustees approved new investment advisory agreements. The interim agreements and the new agreements are substantially identical to the terminated agreements (with the exception of different effective and termination dates) and will not result in changes in the management of American Century Investments, the funds, their investment objectives, fees or services provided. The new agreement for the fund was approved by shareholders at a Special Meeting of Shareholders on June 16, 2010. The new agreement went into effect on July 16, 2010.
7. Other Tax Information (Unaudited)
The following information is provided pursuant to provisions of the Internal Revenue Code.
The fund designates $642,043 as exempt interest dividends for the fiscal year ended May 31, 2010.
19
| | | | | | |
| Tax-Free Money Market | | | | |
| |
| Investor Class | | | | | |
| For a Share Outstanding Throughout the Years Ended May 31 | | | |
| | | 2010 | 2009 | 2008 | 2007 | 2006 |
| Per-Share Data | | | | | |
| Net Asset Value, Beginning of Period | $1.00 | $1.00 | $1.00 | $1.00 | $1.00 |
| Income From Investment Operations | | | | | |
| Net Investment Income (Loss) | —(1) | 0.01 | 0.03 | 0.03 | 0.02 |
| Distributions | | | | | |
| From Net Investment Income | —(1) | (0.01) | (0.03) | (0.03) | (0.02) |
| Net Asset Value, End of Period | $1.00 | $1.00 | $1.00 | $1.00 | $1.00 |
| |
| Total Return(2) | 0.20% | 1.47% | 2.97% | 3.26% | 2.51% |
| | | | | | |
| Ratios/Supplemental Data | | | | | |
| Ratio of Operating Expenses to | | | | | |
| Average Net Assets | 0.46%(3) | 0.50%(3) | 0.51% | 0.52% | 0.52% |
| Ratio of Operating Expenses to Average | | | | | |
| Net Assets (Before Expense Waiver) | 0.51% | 0.53% | 0.51% | 0.52% | 0.52% |
| Ratio of Net Investment Income (Loss) | | | | | |
| to Average Net Assets | 0.20%(3) | 1.45%(3) | 2.91% | 3.22% | 2.47% |
| Ratio of Net Investment Income (Loss) | | | | | |
| to Average Net Assets (Before | | | | | |
| Expense Waiver) | 0.15% | 1.42% | 2.91% | 3.22% | 2.47% |
| Net Assets, End of Period (in thousands) | $280,874 | $334,768 | $313,542 | $275,733 | $272,208 |
| (1) | Per-share amount was less than $0.005. | | | | | |
| (2) | Total return assumes reinvestment of net investment income and capital gains distributions, if any. Total returns for periods less than one year |
| | are not annualized. Total returns are calculated based on the net asset value of the last business day. | | |
| (3) | Effective August 1, 2008, the investment advisor voluntarily agreed to waive a portion of its management fee. | | |
See Notes to Financial Statements.
20
|
| Report of Independent Registered Public Accounting Firm |
To the Trustees of the American Century Municipal Trust
and Shareholders of the Tax-Free Money Market Fund:
In our opinion, the accompanying statement of assets and liabilities, including the schedule of investments, and the related statements of operations and of changes in net assets and the financial highlights present fairly, in all material respects, the financial position of the Tax-Free Money Market Fund (one of the five funds comprising the American Century Municipal Trust, hereafter referred to as the “Fund”) at May 31, 2010, the results of its operations for the year then ended, the changes in its net assets for each of the two years in the period then ended and the financial highlights for each of the five years in the period then ended, in conformity with accounting principles generally accepted in the United States of America. These financial statements and financial highlights (hereafter referred to as “financial statements”) are the responsibility of the Fund’s management; our res ponsibility is to express an opinion on these financial statements based on our audits. We conducted our audits of these financial statements in accordance with the standards of the Public Company Accounting Oversight Board (United States). Those standards require that we plan and perform the audit to obtain reasonable assurance about whether the financial statements are free of material misstatement. An audit includes examining, on a test basis, evidence supporting the amounts and disclosures in the financial statements, assessing the accounting principles used and significant estimates made by management, and evaluating the overall financial statement presentation. We believe that our audits, which included confirmation of securities at May 31, 2010 by correspondence with the custodian, provide a reasonable basis for our opinion.
PricewaterhouseCoopers LLP
Kansas City, Missouri
July 22, 2010
21
The Board of Trustees
The individuals listed below serve as trustees of the fund. Each trustee will continue to serve in this capacity until death, retirement, resignation or removal from office. The mandatory retirement age for trustees who are not “interested persons,” as that term is defined in the Investment Company Act (independent trustees), is 73. However, the mandatory retirement age may be extended for a period not to exceed two years with the approval of the remaining independent trustees.
Mr. Thomas is the only trustee who is an “interested person” because he currently serves as President and Chief Executive Officer of American Century Companies, Inc. (ACC), the parent company of American Century Investment Management, Inc. (ACIM or the advisor).
The other trustees (more than three-fourths of the total number) are independent; that is, they have never been employees, directors or officers of, and have no financial interest in, ACC or any of its wholly owned, direct or indirect, subsidiaries, including ACIM, American Century Investment Services, Inc. (ACIS) and American Century Services, LLC (ACS). The trustees serve in this capacity for eight (in the case of Mr. Thomas, 15) registered investment companies in the American Century Investments family of funds.
The following presents additional information about the trustees. The mailing address for each trustee other than Mr. Thomas is 1665 Charleston Road, Mountain View, California 94043. The mailing address for Mr. Thomas is 4500 Main Street, Kansas City, Missouri 64111.
Independent Trustees
John Freidenrich
Year of Birth: 1937
Position(s) with the Fund: Trustee
Length of Time Served: Since 2005
Principal Occupation(s) During the Past Five Years: Founder, Member and Manager, Regis
Management Company, LLC (investment management firm) (April 2004 to present)
Number of Funds in Fund Complex Overseen by Trustee: 41
Other Directorships Held by Trustee: None
Education/Other Professional Experience: AB in Economics, Stanford University; LLB,
Stanford Law School; formerly, partner and founder, Ware and Freidenrich Law
Firm and Bay Partners; formerly, President, Board of Trustees, Stanford University
Ronald J. Gilson
Year of Birth: 1946
Position(s) with the Fund: Trustee and Chairman of the Board
Length of Time Served: Since 1995
Principal Occupation(s) During the Past Five Years: Charles J. Meyers Professor of Law and
Business, Stanford Law School (1979 to present); Marc and Eva Stern Professor of
Law and Business, Columbia University School of Law (1992 to present)
Number of Funds in Fund Complex Overseen by Trustee: 41
Other Directorships Held by Trustee: None
Education/Other Professional Experience: BA, Washington University; JD, Yale Law School;
formerly, attorney, Steinhart, Goldberg, Feigenbaum & Ladar
22
Frederick L. A. Grauer
Year of Birth: 1946
Position(s) with the Fund: Trustee
Length of Time Served: Since 2008
Principal Occupation(s) During the Past Five Years: Senior Advisor, BlackRock, Inc. (investment
management firm) (2010 to present); Senior Advisor, Barclays Global Investors
(investment management firm) (2003 to 2009)
Number of Funds in Fund Complex Overseen by Trustee: 41
Other Directorships Held by Trustee: None
Education/Other Professional Experience: BA in Economics, University of British Columbia;
MA in Economics, University of Chicago; PhD in Business, Stanford University;
formerly, Executive Chairman, Barclays Global Investors; Chairman and Chief
Executive Officer, Wells Fargo Nikko Investment Advisors; and Vice President,
Merrill Lynch Capital Markets Group; formerly, Director, New York Stock Exchange,
Chicago Mercantile Exchange and Columbia University; formerly, faculty member,
Graduate School of Business, Columbia University and Alfred P. Sloan School of
Management, Massachusetts Institute of Technology
Peter F. Pervere
Year of Birth: 1947
Position(s) with the Fund: Trustee
Length of Time Served: Since 2007
Principal Occupation(s) During the Past Five Years: Retired
Number of Funds in Fund Complex Overseen by Trustee: 41
Other Directorships Held by Trustee: Intraware, Inc. (2003 to 2009); Digital Impact, Inc. (2003
to 2005)
Education/Other Professional Experience: BA in History, Stanford University; CPA; formerly,
Vice President and Chief Financial Officer, Commerce One, Inc. (software and
services provider); formerly, Vice President and Corporate Controller, Sybase, Inc.;
formerly with accounting firm of Arthur Young & Co.
Myron S. Scholes
Year of Birth: 1941
Position(s) with the Fund: Trustee
Length of Time Served: Since 1980
Principal Occupation(s) During the Past Five Years: Chairman, Platinum Grove Asset
Management, L.P. (asset manager) (1999 to 2009); Frank E. Buck Professor of
Finance-Emeritus, Stanford Graduate School of Business (1996 to present)
Number of Funds in Fund Complex Overseen by Trustee: 41
Other Directorships Held by Trustee: Dimensional Fund Advisors (investment advisor); CME
Group, Inc. (futures and options exchange)
Education/Other Professional Experience: BA in Economics, McMaster University (Ontario);
MBA and PhD, University of Chicago; formerly, Senior Research Fellow at the
Hoover Institute; formerly, Edward Eagle Brown Professor of Finance, University of
Chicago; recipient of the Alfred Nobel Memorial Prize in Economic Sciences
23
John B. Shoven
Year of Birth: 1947
Position(s) with the Fund: Trustee
Length of Time Served: Since 2002
Principal Occupation(s) During the Past Five Years: Professor of Economics, Stanford University
(1973 to present)
Number of Funds in Fund Complex Overseen by Trustee: 41
Other Directorships Held by Trustee: Cadence Design Systems; Exponent; Financial Engines;
PalmSource, Inc. (2002 to 2005); Watson Wyatt Worldwide (2002 to 2006)
Education/Other Professional Experience: BA in Physics, University of California; PhD in
Economics, Yale University; Director of the Stanford Institute for Economic Policy
Research (1999 to present); formerly, Chair of Economics and Dean of Humanities
and Sciences, Stanford University
Interested Trustee
Jonathan S. Thomas
Year of Birth: 1963
Position(s) with the Fund: Trustee and President
Length of Time Served: Since 2007
Principal Occupation(s) During the Past Five Years: President and Chief Executive Officer,
ACC (March 2007 to present); Chief Administrative Officer, ACC (February 2006 to
February 2007); Executive Vice President, ACC (November 2005 to February 2007).
Also serves as: Chief Executive Officer and Manager, ACS; Executive Vice President,
ACIM; Director, ACC, ACIM and other ACC subsidiaries. Global Chief Operating
Officer and Managing Director, Morgan Stanley (investment management)(March
2000 to November 2005)
Number of Funds in Fund Complex Overseen by Trustee: 104
Other Directorships Held by Trustee: None
Education/Other Professional Experience: BA in Economics, University of Massachusetts;
MBA, Boston College; formerly held senior leadership roles with Fidelity
Investments, Boston Financial Services and Bank of America; serves on the Board of
Governors of the Investment Company Institute
24
Officers
The following table presents certain information about the executive officers of the fund. Each officer serves as an officer for each of the 15 investment companies in the American Century family of funds, unless otherwise noted. No officer is compensated for his or her service as an officer of the fund. The listed officers are interested persons of the fund and are appointed or re-appointed on an annual basis. The mailing address for each of the officers listed below is 4500 Main Street, Kansas City, Missouri 64111.
| | |
| Name | Offices with | |
| (Year of Birth) | the Fund | Principal Occupation(s) During the Past Five Years |
| Jonathan S. | Trustee and | President and Chief Executive Officer, ACC (March 2007 to present); |
| Thomas | President | Chief Administrative Officer, ACC (February 2006 to March 2007); |
| (1963) | since 2007 | Executive Vice President, ACC (November 2005 to February 2007). |
| | | Also serves as: Chief Executive Officer and Manager, ACS; Executive |
| | | Vice President, ACIM; Director, ACC, ACIM and other ACC subsidiaries. |
| | | Global Chief Operating Officer and Managing Director, Morgan Stanley |
| | | (March 2000 to November 2005) |
| Barry Fink | Executive | Chief Operating Officer and Executive Vice President, ACC (September 2007 |
| (1955) | Vice President | to present); President, ACS (October 2007 to present); Managing Director, |
| | since 2007 | Morgan Stanley (2000 to 2007); Global General Counsel, Morgan Stanley |
| | | (2000 to 2006). Also serves as: Manager, ACS, and Director, ACC and |
| | | certain ACC subsidiaries |
| Maryanne L. | Chief Compliance | Chief Compliance Officer, American Century funds, ACIM and ACS (August |
| Roepke | Officer since 2006 | 2006 to present); Assistant Treasurer, ACC (January 1995 to August 2006); |
| (1956) | and Senior | and Treasurer and Chief Financial Officer, various American Century funds |
| | Vice President | (July 2000 to August 2006). Also serves as: Senior Vice President, ACS |
| | since 2000 | |
| Charles A. | General Counsel | Attorney, ACC (February 1994 to present); Vice President, ACC (November |
| Etherington | since 2007 and | 2005 to present); General Counsel, ACC (March 2007 to present); Also |
| (1957) | Senior Vice | serves as General Counsel, ACIM, ACS, ACIS and other ACC subsidiaries; |
| | President | and Senior Vice President, ACIM and ACS |
| | since 2006 | |
| Robert J. Leach | Vice President, | Vice President, ACS (February 2000 to present); and Controller, various |
| (1966) | Treasurer and | American Century funds (1997 to September 2006) |
| | Chief Financial | |
| | Officer since 2006 | |
| David H. Reinmiller | Vice President | Attorney, ACC (January 1994 to present); Associate General Counsel, ACC |
| (1963) | since 2001 | (January 2001 to present); Chief Compliance Officer, American Century |
| | | funds and ACIM (January 2001 to February 2005). Also serves as: Vice |
| | | President, ACIM and ACS |
| Ward D. Stauffer | Secretary | Attorney, ACC (June 2003 to Present) |
| (1960) | since 2005 | |
The SAI has additional information about the fund’s trustees and is available without charge, upon request, by calling 1-800-345-2021.
25
|
| Board Approval of Management Agreements |
American Century Investment Management, Inc. (“ACIM” or the “Advisor”) currently serves as investment advisor to the Fund under an interim management agreement (the “Interim Management Agreement”) between the Advisor and the Fund approved by the Fund’s Board of Trustees (the “Board”). The Advisor previously served as investment advisor to the Fund pursuant to a management agreement (the “Prior Management Agreement”) that terminated in accordance with its terms on February 16, 2010, as a result of a change of control of the Advisor’s parent company, American Century Companies, Inc. (“ACC”). The change in control occurred as the result of a change in the trustee of a trust created by James E. Stowers, Jr., the founder of American Century Investments that holds shares representing a significant interest in ACC stock. Mr. Stowers previously served a s the trustee of the trust. On February 16, 2010, Richard W. Brown, Co-Chairman of ACC with Mr. Stowers, became the trustee in accordance with the terms of the trust and Mr. Stowers’ long-standing estate and succession plan.
On February 18, 2010, the Board approved the Interim Management Agreement in accordance with Rule 15a-4 under the Investment Company Act to ensure continued management of the Fund by the Advisor after the termination of the Prior Management Agreement and until shareholder approval of a new management agreement (the “Proposed Management Agreement”) as required under the Act. The Board approved the Proposed Management Agreement and recommended its approval to shareholders. Fund shareholders approved the Proposed Management Agreement at a meeting on June 16, 2010.
The Interim Management Agreement and the Proposed Management Agreement are substantially identical to the Prior Management Agreement except for their effective dates and the termination provisions of the Interim Management Agreement. Under the Interim and Proposed Management Agreements, the Advisor will provide the same services to the Fund and receive the same compensation rate as under the Prior Management Agreement.
Basis for Board Approval of Interim Management Agreement
In considering the approval of the Interim Management Agreement, Rule 15a-4 requires the Board to approve the contract within ten business days of the termination of the prior agreement and to determine that the compensation to be received under the interim agreement is no greater than would have been received under the prior agreement. In connection with the approval, the Board noted that it oversees on a continuous basis and evaluates at its quarterly meetings, directly and through the committees of the Board, the nature and quality of significant services provided by the Advisor, the investment performance of the Fund, shareholder services, audit and compliance functions and a variety of other matters relating to the Fund’s operations.
In evaluating the Interim Management Agreement, the Board, assisted by the advice of its independent legal counsel, considered a number of factors in addition to those required by the rule with no one factor being determinative to its analysis. Among the factors considered by the Board were the circumstances and effect of the change of control, the fact that the Advisor
26
will provide the same services and receive the same compensation rate as under the Prior Management Agreements, and that the change of control did not result in a change of the personnel managing the Fund. Upon completion of its analysis, the Board approved the Interim Management Agreement, determining that the continued management of the Fund by the Advisor was in the best interests of the Fund and Fund shareholders.
Basis for Board Approval of Proposed Management Agreement
At a meeting held on April 1, 2010, after considering all information presented, the Board approved, and determined to recommend that shareholders approve, the Proposed Management Agreement. In connection with that approval, the Board requested and reviewed extensive data and information compiled by the Advisor and certain independent providers of evaluation data concerning the Fund and services provided to the Fund by the Advisor. The Board oversees on a continuous basis and evaluates at its quarterly meetings, directly and through the committees of the Board, the nature and quality of significant services provided by the Advisor, the investment performance of the Fund, shareholder services, audit and compliance functions and a variety of other matters relating to the Fund’s operations. The information considered and the discussions held at the meetings included, but were not limited to:
• the nature, extent and quality of investment management, shareholder services and other services provided to the Fund;
• the wide range of programs and services the Advisor provides to the Fund and its shareholders on a routine and non-routine basis;
• the compliance policies, procedures, and regulatory experience of the Advisor;
• data comparing the cost of owning the Fund to the cost of owning similar funds;
• the fact that there will be no changes to the fees, services, or personnel who provide such services as compared to the Prior Management Agreement;
• data comparing the Fund’s performance to appropriate benchmarks and/ or a peer group of other mutual funds with similar investment objectives and strategies;
• financial data showing the profitability of the Fund to the Advisor and the overall profitability of the Advisor;
• data comparing services provided and charges to the Fund with those for other non-fund investment management clients of the Advisor; and
• consideration of collateral or “fall-out” benefits derived by the Advisor from the management of the Fund and potential sharing of economies of scale in connection with the management of the Fund.
27
The Board also considered whether there was any reason for not continuing the existing arrangement with the Advisor. In particular, the Board recognized that shareholders may have invested in the Fund on the strength of the Advisor’s industry standing and reputation and in the expectation that the Advisor will have a continuing role in providing advisory services to the Fund.
The Board considered all of the information provided by the Advisor, the independent data providers, and the Board’s independent legal counsel, and evaluated such information for the Fund. The Board did not identify any single factor as being all-important or controlling, and each Board member may have attributed different levels of importance to different factors. In deciding to approve the Proposed Management Agreement under the terms ultimately determined by the Board to be appropriate, the Board based its decision on a number of factors, including the following:
Nature, Extent and Quality of Services – Generally. Under the Proposed Management Agreement, the Advisor is responsible for providing or arranging for all services necessary for the operation of the Fund. The Board noted that under the Proposed Management Agreement, the Advisor provides or arranges at its own expense a wide variety of services including:
• constructing and designing the Fund
• portfolio research and security selection
• initial capitalization/funding
• securities trading
• Fund administration
• custody of Fund assets
• daily valuation of the Fund’s portfolio
• shareholder servicing and transfer agency, including shareholder confir-
mations, recordkeeping and communications
• legal services
• regulatory and portfolio compliance
• financial reporting
• marketing and distribution
The Board noted that many of these services have expanded over time both in terms of quantity and complexity in response to shareholder demands, competition in the industry, changing distribution channels and the changing regulatory environment.
28
Investment Management Services. The investment management services provided to the Fund are complex and provide Fund shareholders access to professional money management, instant diversification of their investments within an asset class, the opportunity to easily diversify among asset classes, and liquidity. As a part of its general oversight and in evaluating investment performance, the Board expects the Advisor to manage the Fund in accordance with its investment objectives and approved strategies. In providing these services, the Advisor utilizes teams of investment professionals who require extensive information technology, research, training, compliance and other systems to conduct their business. The Board, directly and through its Portfolio Committee, regularly reviews investment performance information for the Fund, t ogether with comparative information for appropriate benchmarks and/or peer groups of similarly-managed funds, over different time horizons. If performance concerns are identified, the underperforming Fund receives special reviews until performance improves, during which time the Board discusses with the Advisor the reasons for such underperformance and any efforts being undertaken to improve performance.
Shareholder and Other Services. Under the Proposed Management Agreement, the Advisor will also provide the Fund with a comprehensive package of transfer agency, shareholder, and other services. The Board, directly and through the various committees of the Board, regularly reviews reports and evaluations of such services. These reports include, but are not limited to, information regarding the operational efficiency and accuracy of the shareholder and transfer agency services provided, staffing levels, shareholder satisfaction (as measured by external as well as internal sources), technology support, new products and services offered to Fund shareholders, securities trading activities, portfolio valuation services, auditing services, and legal and operational compliance activities. Certain aspects of shareholder and transfer ag ency service level efficiency and the quality of securities trading activities are measured by independent third party providers and are presented in comparison to other fund groups not managed by the Advisor.
Costs of Services Provided and Profitability. The Advisor provided detailed information concerning its cost of providing various services to the Fund, its profitability in managing the Fund, its overall profitability, and its financial condition. The Board reviewed with the Advisor the methodology used to prepare this financial information. The Board has also reviewed with the Advisor its methodology for compensating the investment professionals that provide services to the Fund as well as compensation to the five highest paid personnel of the Advisor. This financial information regarding the Advisor is considered in order to evaluate the Advisor’s financial condition, its ability to continue to provide services under the Proposed Management Agreement, and the reasonableness of the proposed management fees.
Ethics. The Board generally considers the Advisor’s commitment to providing quality services to shareholders and to conducting its business ethically. It noted that the Advisor’s practices generally meet or exceed industry best practices.
29
Economies of Scale. The Board also reviewed information provided by the Advisor regarding the possible existence of economies of scale in connection with the management of the Fund. The Board concluded that economies of scale are difficult to measure and predict with precision, especially on a fund-by-fund basis. The analysis of economies of scale is further complicated by the additional services and content provided by the Advisor and its reinvestment in its ability to provide and expand those services. Accordingly, the Board seeks to evaluate economies of scale by reviewing information, such as year-over-year profitability of the Advisor generally, the profitability of its management of the Fund specifically, and the expenses incurred by the Advisor in providing various functions to the Fund. The Board believes the Advisor i s appropriately sharing economies of scale through its competitive fee structure, offering competitive fees from fund inception, fee breakpoints as the fund complex and the Fund increases in size, and through reinvestment in its business to provide shareholders additional services and enhancements to existing services. In particular, separate breakpoint schedules based on the size of the entire fund complex and on the size of the Fund reflect the complexity of assessing economies of scale.
Comparison to Fees of Funds not Managed by the Advisor. Both the Prior and Proposed Management Agreements provide that the Fund pays the Advisor a single, all-inclusive (or unified) management fee for providing all services necessary for the management and operation of the Fund, other than brokerage expenses, taxes, interest, extraordinary expenses, and the fees and expenses of the Fund’s Independent Trustees (including their independent legal counsel) and expenses incurred in connection with the provision of shareholder services and distribution services under a plan adopted pursuant to Rule 12b-1 under the 1940 Act. Under the unified fee structure, the Advisor is responsible for providing all investment advisory, custody, audit, administrative, compliance, recordkeeping, marketing and shareholder services, or arranging and supervising third parties that provide such services. By contrast, most other funds are charged a variety of fees, including an investment advisory fee, a transfer agency fee, an administrative fee, distribution charges and other expenses. Other than their investment advisory fees and any applicable Rule 12b-1 distribution fees, the components of the total fees charged by these other funds may be increased without shareholder approval. The Board believes the unified fee structure is a benefit to Fund shareholders because it clearly discloses to shareholders the cost of owning Fund shares, and, since the unified fee cannot be increased without a vote of Fund shareholders, it shifts to the Advisor the risk of increased costs of operating the Fund and provides a direct incentive to minimize administrative inefficiencies. Part of the Board’s analysis of fee levels involves reviewing certain evaluative data compiled by an independent provider comparing the Fund’s unified fee to the total expense rat ios of similar funds not managed by the Advisor. The Board concluded that the management fee to be paid by the Fund to the Advisor under the Proposed Management Agreement is reasonable in light of the services to be provided to the Fund.
30
Comparison to Fees and Services Provided to Other Clients of the Advisor. The Board also requested and received information from the Advisor concerning the nature and extent of the services, fees, and profitability of its advisory services to advisory clients other than the Fund. They observed that these varying types of client accounts require different services and involve different regulatory and entrepreneurial risks than the management of the Fund. The Board analyzed this information and concluded that the fees charged and services provided to the Fund were reasonable by comparison.
Collateral or “Fall-Out” Benefits Derived by the Advisor. The Board considered the existence of collateral benefits the Advisor may receive as a result of its relationship with the Fund. The Board concluded that the Advisor’s primary business is managing mutual funds and it generally does not use Fund or shareholder information to generate profits in other lines of business, and therefore does not derive any significant collateral benefits from them. The Board noted that the Advisor receives proprietary research from broker-dealers that execute Fund portfolio transactions and concluded that this research is likely to benefit Fund shareholders. The Board also determined that the Advisor is able to provide investment management services to certain clients other than the Fund, at least in part, due to its existing infrastructure built to serve the fund complex. The Board concluded, however, that the assets of those other clients are not material to the analysis and, in any event, are included with the assets of the Fund to determine breakpoints in the Fund’s fee schedule, provided they are managed using the same investment team and strategy.
Conclusion of the Board. As a result of this process, the Board, in the absence of particular circumstances and assisted by the advice of its independent legal counsel, taking into account all of the factors discussed above and the information provided by the Advisor and others, concluded that the Proposed Management Agreement be approved and recommended its approval to Fund shareholders.
31
Proxy Voting Guidelines
American Century Investment Management, Inc., the fund’s investment advisor, is responsible for exercising the voting rights associated with the securities purchased and/or held by the fund. A description of the policies and procedures the advisor uses in fulfilling this responsibility is available without charge, upon request, by calling 1-800-345-2021. It is also available on American Century Investments’ website at americancentury.com and on the Securities and Exchange Commission’s website at sec.gov. Information regarding how the investment advisor voted proxies relating to portfolio securities during the most recent 12-month period ended June 30 is available on the “About Us” page at americancentury.com. It is also available at sec.gov.
Quarterly Portfolio Disclosure
The fund files its complete schedule of portfolio holdings with the Securities and Exchange Commission (SEC) for the first and third quarters of each fiscal year on Form N-Q. The fund’s Forms N-Q are available on the SEC’s website at sec.gov, and may be reviewed and copied at the SEC’s Public Reference Room in Washington, DC. Information on the operation of the Public Reference Room may be obtained by calling 1-800-SEC-0330. The fund also makes its complete schedule of portfolio holdings for the most recent quarter of its fiscal year available on its website at americancentury.com and, upon request, by calling 1-800-345-2021.
32
The following indices are used to illustrate investment market, sector, or style performance or to serve as fund performance comparisons. They are not investment products available for purchase.
The Barclays Capital 5-Year General Obligation (GO) Bond Index is composed of investment-grade U.S. municipal securities, with maturities of four to six years, that are general obligations of a state or local government.
The Barclays Capital Long-Term Municipal Bond Index is composed of those securities included in the Barclays Capital Municipal Bond Index that have maturities greater than 22 years.
The Barclays Capital Municipal Bond Index is a market value-weighted index designed for the long-term tax-exempt bond market.
The Barclays Capital Non-Investment-Grade Municipal Bond Index is composed of non-investment grade U.S. municipal securities with a remaining maturity of one year or more.
The Barclays Capital U.S. Aggregate Index represents securities that are taxable, registered with the Securities and Exchange Commission, and U.S. dollar-denominated. The index covers the U.S. investment-grade fixed-rate bond market, with index components for government and corporate securities, mortgage pass-through securities, and asset-backed securities.
The Barclays Capital U.S. Treasury Index is composed of those securities included in the Barclays Capital U.S. Aggregate Index that are public obligations of the U.S. Treasury with a remaining maturity of one year or more.
33
34
35
36

| |
| |
| Contact Us | |
| americancentury.com | |
| Automated Information Line | 1-800-345-8765 |
| Investor Services Representative | 1-800-345-2021 or |
| | 816-531-5575 |
| Investors Using Advisors | 1-800-378-9878 |
| Business, Not-For-Profit, Employer-Sponsored | |
| Retirement Plans | 1-800-345-3533 |
| Banks and Trust Companies, Broker-Dealers, | |
| Financial Professionals, Insurance Companies | 1-800-345-6488 |
| Telecommunications Device for the Deaf | 1-800-634-4113 |
| American Century Municipal Trust | |
| Investment Advisor: | |
| American Century Investment Management, Inc. | |
| Kansas City, Missouri | |
This report and the statements it contains are submitted for the general
information of our shareholders. The report is not authorized for distribution to
prospective investors unless preceded or accompanied by an effective prospectus.
American Century Investment Services, Inc., Distributor
©2010 American Century Proprietary Holdings, Inc. All rights reserved.
1007
CL-ANN-68683
|
| Annual Report |
| May 31, 2010 |

|
| American Century Investments® |
New York Tax-Free Fund
| |
| President’s Letter | 2 |
| Market Perspective | 3 |
| U.S. Fixed-Income Total Returns | 3 |
| |
| New York Tax-Free | |
| |
| Performance | 4 |
| Portfolio Commentary | 6 |
| Portfolio at a Glance | 8 |
| Yields | 8 |
| Top Five Sectors | 8 |
| |
| Shareholder Fee Example | 9 |
| |
| Financial Statements | |
| |
| Schedule of Investments | 11 |
| Statement of Assets and Liabilities | 16 |
| Statement of Operations | 17 |
| Statement of Changes in Net Assets | 18 |
| Notes to Financial Statements | 19 |
| Financial Highlights | 25 |
| Report of Independent Registered Public Accounting Firm | 29 |
| |
| Other Information | |
| |
| Proxy Voting Results | 30 |
| Management | 31 |
| Board Approval of Management Agreements | 35 |
| Additional Information | 41 |
| Index Definitions | 42 |
Any opinions expressed in this report reflect those of the author as of the date of the report, and do not necessarily represent the opinions of American Century Investments or any other person in the American Century Investments organization. Any such opinions are subject to change at any time based upon market or other conditions and American Century Investments disclaims any responsibility to update such opinions. These opinions may not be relied upon as investment advice and, because investment decisions made by American Century Investments funds are based on numerous factors, may not be relied upon as an indication of trading intent on behalf of any American Century Investments fund. Security examples are used for representational purposes only and are not intended as recommendations to purchase or sell securities. Performance information for comparative indices and securities is provided to American Century Investments by third party vendors. To the best of American Century Investments’ knowledge, such information is accurate at the time of printing.

Dear Investor:
To learn more about the capital markets, your investment, and the portfolio management strategies American Century Investments provides, we encourage you to review this shareholder report for the financial reporting period ended May 31, 2010.
On the following pages, you will find investment performance and portfolio information, presented with the expert perspective and commentary of our portfolio management team. This report remains one of our most important vehicles for conveying the information you need about your investment performance, and about the market factors and strategies that affect fund returns. For additional information on the markets, we encourage you to visit the “Insights & News” tab at our Web site, americancentury.com, for updates and further expert commentary.
The top of our Web site’s home page also provides a link to “Our Story,” which, first and foremost, outlines our commitment—since 1958—to helping clients reach their financial goals. We believe strongly that we will only be successful when our clients are successful. That’s who we are.
Another important, unique facet of our story and who we are is “Profits with a Purpose,” which describes our bond with the Stowers Institute for Medical Research (SIMR). SIMR is a world-class biomedical organization—founded by our company founder James E. Stowers, Jr. and his wife Virginia—that is dedicated to researching the causes, treatment, and prevention of gene-based diseases, including cancer. Through American Century Investments’ private ownership structure, more than 40% of our profits support SIMR.
Mr. Stowers’ example of achieving financial success and using that platform to help humanity motivates our entire American Century Investments team. His story inspires us to help each of our clients achieve success. Thank you for sharing your financial journey with us.
Sincerely,

Jonathan Thomas
President and Chief Executive Officer
American Century Investments
2

By David MacEwen, Chief Investment Officer, Fixed Income
Economic and Market Rebound
The municipal bond market witnessed a wide dispersion of returns in the period since the June 30, 2009, inception of New York Tax-Free to May 31, 2010 (see the accompanying table), which closely coincided with the rebound of the U.S. economy from the depths of the recession and credit crisis. This dramatic turnaround can be attributed to the government’s extraordinary monetary and fiscal stimulus policies taken in response to the financial crisis in late 2008. However, financial market volatility in May related to the European debt crisis led many to worry about a potential slowdown in U.S. growth. Despite a return to positive economic growth in the second half of 2009 and so far in 2010, the unemployment rate stood at 9.7% in May 2010, while the housing market and consumer debt levels remained concerns.
Municipal Market Review
Better economic and market conditions caused a reversal of the trading that colored the credit crisis, when the lowest-rated bonds performed worst and higher-quality bonds did best. For the current reporting period, this reversal meant that high-yield (below-investment-grade) and long-term municipal bonds did better than high-quality and shorter-term securities. Similarly, credit-sensitive municipal bonds outperformed Treasury securities after lagging during the credit crisis.
In addition to better economic and market conditions, municipal bonds benefited from improving technical factors—the Build America Bonds program limited the supply of tax-exempt bonds. This federal program, designed to help ease municipal borrowing costs, meant many newly minted municipal bonds were instead issued in the taxable bond universe. Demand for municipal bonds was helped by attractive tax-equivalent yields and the outlook for higher marginal tax rates going forward.
And despite the continuing flood of negative press about budget challenges for states and local governments, we continue to believe that municipal defaults will be relatively rare, especially compared with corporate defaults. Indeed, during the reporting period, the major credit rating agencies revamped their ratings systems to better recognize the superior credit quality and vastly lower default risk of municipal securities relative to corporate-backed bonds.
| | | | |
| U.S. Fixed-Income Total Returns | | | | |
| For the period June 30, 2009 (fund inception) through May 31, 2010* | |
| Barclays Capital Municipal Market Indices | | Barclays Capital U.S. Taxable Market Indices |
| Municipal Bond | 9.55% | | Aggregate Index | 7.81% |
| 5-Year General Obligation Bond | 6.62% | | Treasury Index | 4.72% |
| Long-Term Municipal Bond | 15.21% | | *Total returns for periods less than one year are not annualized. |
| Non-Investment-Grade Municipal Bond | 21.31% | | | |
3
| | | | |
| New York Tax-Free | | | |
| |
| Total Returns as of May 31, 2010 | | | |
| | | Ticker Symbol | Since Inception(1) | Inception Date |
| Investor Class(2) | ANYIX | 10.39% | 6/30/09 |
| Barclays Capital | | | |
| Municipal Bond Index | — | 9.55% | — |
| Institutional Class(2) | ANYOX | 2.05% | 3/1/10 |
| A Class(2) | ANYAX | | 6/30/09 |
| No sales charge* | | 10.16% | |
| With sales charge* | | 5.22% | |
| C Class(2) | ANTCX | | 6/30/09 |
| No sales charge* | | 9.41% | |
| With sales charge* | | 8.41% | |
| *Sales charges include initial sales charges and contingent deferred sales charges (CDSCs), as applicable. A Class shares have a |
| 4.50% maximum initial sales charge for fixed-income funds and may be subject to a maximum CDSC of 1.00%. C Class shares |
| redeemed within 12 months of purchase are subject to a maximum CDSC of 1.00%. The SEC requires that mutual funds provide |
| performance information net of maximum sales charges in all cases where charges could be applied. | |
| (1) | Total returns for periods less than one year are not annualized. | | |
| (2) | Class returns would have been lower if American Century Investments had not voluntarily waived its management fees. |
Data presented reflect past performance. Past performance is no guarantee of future results. Current performance may be higher or lower than the performance shown. Investment return and principal value will fluctuate, and redemption value may be more or less than original cost. To obtain performance data current to the most recent month end, please call 1-800-345-2021 or visit americancentury.com. As interest rates rise, bond values will decline. The fund concentrates its investments in a single state and therefore may have more exposure to credit risk related to the state of New York than a fund with a broader geographical diversification. Investment income may be subject to certain state and local taxes and, depending on your tax status, the federal alternative minimum tax (AMT). Capital gains are not exempt from state and federal incom e tax.
Unless otherwise indicated, performance reflects Investor Class shares; performance for other share classes will vary due to differences in fee structure. For information about other share classes available, please consult the prospectus. Data assumes reinvestment of dividends and capital gains, and none of the charts reflect the deduction of taxes that a shareholder would pay on fund distributions or the redemption of fund shares. Returns for the index are provided for comparison. The fund’s total returns include operating expenses (such as transaction costs and management fees) that reduce returns, while the total returns of the index do not.
4
New York Tax-Free

| | | |
| * From 6/30/09, the Investor Class’s inception date. Not annualized. | | |
| **Ending value would have been lower if management fees had not been waived. | | |
| |
| Total Annual Fund Operating Expenses | | |
| Investor Class | Institutional Class | A Class | C Class |
| 0.66% | 0.46% | 0.91% | 1.66% |
The total annual fund operating expenses shown is as stated in the fund’s prospectus current as of the date of this report. The prospectus may vary from the expense ratio shown elsewhere in this report because it is based on a different time period, includes acquired fund fees and expenses, and, if applicable, does not include fee waivers or expense reimbursements.
Data presented reflect past performance. Past performance is no guarantee of future results. Current performance may be higher or lower than the performance shown. Investment return and principal value will fluctuate, and redemption value may be more or less than original cost. To obtain performance data current to the most recent month end, please call 1-800-345-2021 or visit americancentury.com. As interest rates rise, bond values will decline. The fund concentrates its investments in a single state and therefore may have more exposure to credit risk related to the state of New York than a fund with a broader geographical diversification. Investment income may be subject to certain state and local taxes and, depending on your tax status, the federal alternative minimum tax (AMT). Capital gains are not exempt from state and fed eral income tax.
Unless otherwise indicated, performance reflects Investor Class shares; performance for other share classes will vary due to differences in fee structure. For information about other share classes available, please consult the prospectus. Data assumes reinvestment of dividends and capital gains, and none of the charts reflect the deduction of taxes that a shareholder would pay on fund distributions or the redemption of fund shares. Returns for the index are provided for comparison. The fund’s total returns include operating expenses (such as transaction costs and management fees) that reduce returns, while the total returns of the index do not.
5
New York Tax-Free
Portfolio Managers: Joseph Gotelli, Alan Kruss, and Steven Permut
Performance Summary
New York Tax-Free returned 10.39%* in the period from the portfolio’s June 30, 2009, inception to May 31, 2010. By comparison, the Barclays Capital Municipal Bond Index, a broad, multiple-state market index, returned 9.55% for the same period. See pages 4 and 5 for additional performance comparisons.
Credit, Sector Positioning Helped
In a period when lower-rated bonds outperformed, it helped to favor what we considered attractively valued bonds rated A and BBB. We worked hard during the fiscal year to add securities we thought were trading out of line with their actual risks.
In terms of sector allocation, we tended to hold underweight positions in tax-backed bonds (such as state and local general obligation (GO) debt) in favor of revenue bonds (such as utilities, education, and health care debt). This positioning helped because revenue bonds—particularly our health care holdings—outperformed GO securities. However, an underweight to corporate-backed, tobacco, and industrial development revenue bonds detracted from performance.
Other Trades
During the second half of 2009, we initiated a yield curve flattening trade designed to benefit as the yield difference between two- and 30-year securities declined. We added to this trade again in 2010 as this spread approached the widest levels on record. This trade benefited the portfolio as the yield curve proceeded to flatten toward the end of the reporting period.
Additionally, we implemented a “ratio” trade designed to benefit from the changing yield relationship between like-maturity municipals and Treasuries. This positioning benefited performance as demand for the municipal asset class drove outperformance versus Treasuries.
Temporary Fee Waiver Expired June 30, 2010
As a result of temporary management fee waivers in effect since fund inception, the effective annual management fee for all fund share classes for the period June 30, 2009, through May 31, 2010, was 0.00%, which increased absolute and relative fund performance for the period.
One of two temporary management fee waivers for New York Tax-Free ended June 30, 2010. The discontinued waiver totaled 57 basis points (a basis point equals 0.01%, so 57 basis points equal 0.57%) in management fees on the fund’s Investor Class, A Class, and C Class shares, and 37 basis points (0.37%) in management fees on the fund’s Institutional Class shares.
|
| *All fund returns referenced in this commentary are for Investor Class shares. Class returns would have been lower had management fees not been |
| waived. Total returns for periods less than one year are not annualized. |
6
New York Tax-Free
American Century Investments instituted the temporary waiver to help raise awareness of New York Tax-Free and our municipal bond investment management expertise. Please note that American Century Investments will continue its other voluntary management fee waiver of 7 basis points (0.07%) through July 31, 2011.
New York Credit Comment
The period saw a number of negative headlines about municipal credit quality in general and New York in particular. Steven Permut, who leads American Century Investments’ municipal bond team, recognizes these concerns but does not believe a wave of municipal bond defaults is imminent. Permut notes that “while there is issuer risk, we are managing that through our experienced credit research team. More importantly, municipal bonds as a whole are second only to Treasuries in terms of credit quality. Indeed, as a result of changes to credit ratings by the big rating agencies to reflect the high quality and low likelihood of default by municipal bonds relative to corporate securities, New York State’s credit rating was actually just recalibrated higher by Moody’s and Fitch.”
Permut continues: “It’s important to note that the state’s general obligation bonds have a constitutional first lien on all general fund revenues and represent a small portion of its total debt. Also, the rating agencies give New York State a lot of leeway because it has more options to balance its budget than California. As a result, we think a New York State default is extremely unlikely. To be sure though, if economic conditions remain weak, we could see credit rating downgrades in the next few years.”
Outlook
“We expect modest economic growth going forward, because of three big headwinds for consumer spending (a key driver of growth): high unemployment, too much household debt, and a weak housing market,” said Permut. “While municipal credit conditions are likely to remain challenging in the near term, we think demand for municipal bonds will be fairly healthy—tax rates are widely expected to rise going forward, and investors looking for higher yields are stepping out the maturity spectrum from money market funds. At the same time, the supply of tax-free municipal bonds is likely to be constrained by the Build America Bonds program—a federal government program intended to help lower municipal borrowing costs.”
In terms of the portfolio, Permut indicates that New York Tax-Free will remain “underweight the tax-supported sector (which includes state and local general obligation bonds) because of the possibility of credit rating downgrades in that sector going forward. Instead, we are overweight less economically sensitive sectors, such as essential service revenue bonds (public power and water and sewer), hospitals, and higher education.”
7
| | |
| New York Tax-Free | |
| |
| Portfolio at a Glance | |
| | | As of 5/31/10 |
| Weighted Average Maturity | 13.3 years |
| Average Duration (Modified) | 5.6 years |
| |
| Yields as of May 31, 2010(1) | |
| 30-Day SEC Yield | |
| Investor Class | 3.22% |
| Institutional Class | 3.24% |
| A Class | 2.85% |
| C Class | 2.24% |
| Investor Class 30-Day Tax-Equivalent Yields(2) | |
| 30.14% Tax Bracket | 4.61% |
| 32.93% Tax Bracket | 4.80% |
| 38.26% Tax Bracket | 5.22% |
| 40.83% Tax Bracket | 5.44% |
| (1) | Yields would have been lower if management fees had not been waived. | |
| (2) | The tax brackets indicated are for combined state and federal income tax. Actual tax-equivalent yields may be lower, if alternative minimum tax |
| | is applicable. | |
| |
| Top Five Sectors as of May 31, 2010 | |
| | | % of fund investments |
| General Obligation (GO) | 20% |
| Transportation Revenue | 15% |
| Special Tax Revenue/Severance Tax | 13% |
| Water/Sewer/Gas Revenue | 10% |
| Higher Education | 10% |
8
|
| Shareholder Fee Example (Unaudited) |
Fund shareholders may incur two types of costs: (1) transaction costs, including sales charges (loads) on purchase payments and redemption/ exchange fees; and (2) ongoing costs, including management fees; distribution and service (12b-1) fees; and other fund expenses. This example is intended to help you understand your ongoing costs (in dollars) of investing in your fund and to compare these costs with the ongoing cost of investing in other mutual funds.
The example is based on an investment of $1,000 made at the beginning of the period and held for the entire period from December 1, 2009 to May 31, 2010 (except as noted).
Actual Expenses
The table provides information about actual account values and actual expenses for each class. You may use the information, together with the amount you invested, to estimate the expenses that you paid over the period. First, identify the share class you own. Then simply divide your account value by $1,000 (for example, an $8,600 account value divided by $1,000 = 8.6), then multiply the result by the number under the heading “Expenses Paid During Period” to estimate the expenses you paid on your account during this period.
If you hold Investor Class shares of any American Century Investments fund, or Institutional Class shares of the American Century Diversified Bond Fund, in an American Century Investments account (i.e., not a financial intermediary or retirement plan account), American Century Investments may charge you a $12.50 semiannual account maintenance fee if the value of those shares is less than $10,000. We will redeem shares automatically in one of your accounts to pay the $12.50 fee. In determining your total eligible investment amount, we will include your investments in all personal accounts (including American Century Investments Brokerage accounts) registered under your Social Security number. Personal accounts include individual accounts, joint accounts, UGMA/UTMA accounts, personal trusts, Coverdell Education Savings Accounts and IRAs (including traditional, Roth, Rollover, SEP-, SARSEP- and SIMPLE-IRAs), and certain other retirement accounts. If you have only business, business retirement, employer-sponsored or American Century Investments Brokerage accounts, you are currently not subject to this fee. We will not charge the fee as long as you choose to manage your accounts exclusively online. If you are subject to the Account Maintenance Fee, your account value could be reduced by the fee amount.
Hypothetical Example for Comparison Purposes
The table also provides information about hypothetical account values and hypothetical expenses based on the actual expense ratio of each class of your fund and an assumed rate of return of 5% per year before expenses, which is not the actual return of a fund’s share class. The hypothetical account values and expenses may not be used to estimate the actual ending account balance or expenses you paid for the period. You may use this information to compare the ongoing costs of investing in your fund and other funds. To do so, compare this 5% hypothetical example with the 5% hypothetical examples that appear in the shareholder reports of the other funds.
9
Please note that the expenses shown in the table are meant to highlight your ongoing costs only and do not reflect any transactional costs, such as sales charges (loads) or redemption/exchange fees. Therefore, the table is useful in comparing ongoing costs only, and will not help you determine the relative total costs of owning different funds. In addition, if these transactional costs were included, your costs would have been higher.
| | | | | |
| | | Beginning | Ending | Expenses Paid | |
| | | Account Value | Account Value | During Period(1) | Annualized |
| | | 12/1/09 | 5/31/10 | 12/1/09 – 5/31/10 | Expense Ratio(1) |
| Actual | | | | |
| Investor Class (after waiver)(2) | $1,000 | $1,045.00 | $0.05 | 0.01% |
| Investor Class (before waiver) | $1,000 | $1,045.00(3) | $3.26 | 0.64% |
| Institutional Class (after waiver)(2) | $1,000 | $1,020.50(4) | $0.00(5) | 0.00%(7) |
| Institutional Class (before waiver) | $1,000 | $1,020.50(3)(4) | $1.11(5) | 0.44% |
| A Class (after waiver)(2) | $1,000 | $1,043.70 | $1.32 | 0.26% |
| A Class (before waiver) | $1,000 | $1,043.70(3) | $4.53 | 0.89% |
| C Class (after waiver)(2) | $1,000 | $1,039.80 | $5.14 | 1.01% |
| C Class (before waiver) | $1,000 | $1,039.80(3) | $8.34 | 1.64% |
| Hypothetical | | | | |
| Investor Class (after waiver)(2) | $1,000 | $1,024.88 | $0.05 | 0.01% |
| Investor Class (before waiver) | $1,000 | $1,021.74 | $3.23 | 0.64% |
| Institutional Class (after waiver)(2) | $1,000 | $1,024.93(6) | $0.00(6) | 0.00%(7) |
| Institutional Class (before waiver) | $1,000 | $1,022.74(6) | $2.22(6) | 0.44% |
| A Class (after waiver)(2) | $1,000 | $1,023.64 | $1.31 | 0.26% |
| A Class (before waiver) | $1,000 | $1,020.49 | $4.48 | 0.89% |
| C Class (after waiver)(2) | $1,000 | $1,019.90 | $5.09 | 1.01% |
| C Class (before waiver) | $1,000 | $1,016.75 | $8.25 | 1.64% |
| (1) | Expenses are equal to the class’s annualized expense ratio listed in the table above, multiplied by the average account value over the period, |
| | multiplied by 182, the number of days in the most recent fiscal half-year divided by 365, to reflect the one-half year period. |
| (2) | During the period ended May 31, 2010, the investment advisor waived the fund’s management fee. | |
| (3) | Ending account value assumes the return earned after waiver. The return would have been lower had fees not been waived and would have |
| | resulted in a lower ending account value. | | | | |
| (4) | Ending account value based on actual return from March 1, 2010 (commencement of sale) through May 31, 2010. | |
| (5) | Expenses are equal to the class’s annualized expense ratio listed in the table above, multiplied by the average account value over the period, |
| | multiplied by 91, the number of days in the period from March 1, 2010 (commencement of sale) through May 31, 2010, divided by 365, to |
| | reflect the period. Had the class been available for the full period, the expenses paid during the period would have been higher. |
| (6) | Ending account value and expenses paid during period assumes the class had been available throughout the entire period and are calculated |
| | using the class’s annualized expense ratio listed in the table above. | | | |
| (7) | Other expenses, which include the fees and expenses of the fund’s independent trustees and its legal counsel, as well as interest, did not |
| | exceed 0.005%. | | | | |
10
| | | | | | |
| New York Tax-Free | | | | | |
| |
| MAY 31, 2010 | | | | | | |
| | Principal | | | | Principal | |
| | Amount | Value | | | Amount | Value |
| Municipal Securities — 105.9% | | | Metropolitan Transportation | | |
| | | | | Auth. Rev., Series 2002 A, | | |
| GUAM — 0.2% | | | | 5.50%, 11/15/14 (Ambac)(1) | $ 200,000 | $ 228,252 |
| Guam Government GO, | | | | Metropolitan Transportation | | |
| Series 2009 A, | | | | Auth. Rev., Series 2003 B, | | |
| 7.00%, 11/15/39(1) | $ 50,000 | $ 53,745 | | 5.25%, 11/15/21 | | |
| NEW YORK — 102.7% | | | | (NATL/FGIC)(1) | 300,000 | 343,512 |
| Babylon Industrial | | | | Metropolitan Transportation | | |
| Development Agency | | | | Auth. Rev., Series 2005 B, | | |
| Resource Recovery Rev., | | | | 5.25%, 11/15/23 (Ambac)(1) | 105,000 | 119,535 |
| Series 2009 A, (Covanta | | | | Metropolitan Transportation | | |
| Babylon), 5.00%, 1/1/14(1) | 100,000 | 109,581 | | Auth. Rev., Series 2005 B, | | |
| Brooklyn Arena Local | | | | 5.00%, 11/15/26 (Ambac)(1) | 100,000 | 104,314 |
| Development Corp. Rev., | | | | Metropolitan Transportation | | |
| (Barclays Center), | | | | Auth. Rev., Series 2005 F, | | |
| 6.25%, 7/15/40(1) | 250,000 | 257,820 | | 5.00%, 11/15/15(1) | 175,000 | 197,594 |
| Erie County Fiscal Stability | | | | Metropolitan Transportation | | |
| Auth. Rev., Series 2010 B, | | | | Auth. Rev., Series 2006 A, | | |
| (Sales Tax and State | | | | 5.00%, 11/15/19(1) | 100,000 | 109,050 |
| Aid Secured Bond), | | | | Metropolitan Transportation | | |
| 5.00%, 7/1/17(2) | 300,000 | 349,410 | | | | |
| | | | | Auth. Service Contract | | |
| Erie County Tobacco | | | | Rev., Series 2002 A, | | |
| Asset Securitization Corp. | | | | 5.125%, 1/1/29(1) | 200,000 | 204,950 |
| Rev., Series 2005 A, | | | | Nassau County Bridge Auth. | | |
| 5.00%, 6/1/38(1) | 130,000 | 107,013 | | | | |
| | | | | Rev., 5.00%, 10/1/40 | 200,000 | 202,080 |
| Erie County Water Auth. | | | | Nassau County GO, | | |
| Rev., 5.00%, 12/1/18(1) | 100,000 | 117,123 | | | | |
| | | | | Series 2009 C, | | |
| Franklin County Industrial | | | | (General Improvement), | | |
| Development Agency Rev., | | | | 5.25%, 10/1/17(1) | 200,000 | 235,398 |
| (Trudeau Institute, Inc.), | | | | Nassau County GO, Series | | |
| VRDN, 0.40%, 6/1/10 | | | | 2009 E, 4.00%, 6/1/13(1) | 100,000 | 108,704 |
| (LOC: HSBC Bank | | | | | | |
| USA N.A.)(1) | 500,000 | 500,000 | | Nassau County Industrial | | |
| | | | | Development Agency Rev., | | |
| Hudson Yards Infrastructure | | | | Series 2010 A, (New York | | |
| Corp. Rev., Series 2006 A, | | | | Institute of Technology), | | |
| 5.00%, 2/15/47(1) | 300,000 | 293,169 | | | | |
| | | | | 5.25%, 3/1/20(1) | 200,000 | 213,160 |
| Long Island Power Auth. | | | | Nassau County Interim | | |
| Electric System Rev., Series | | | | Finance Auth. Rev., | | |
| 2003 B, 5.25%, 6/1/13(1) | 145,000 | 161,775 | | | | |
| | | | | Series 2005 D, (Sales Tax | | |
| Long Island Power Auth. | | | | Secured Bond), 5.00%, | | |
| Electric System Rev., | | | | 11/15/12 (NATL)(1) | 100,000 | 110,758 |
| Series 2006 F, 5.00%, | | | | Nassau County Interim | | |
| 5/1/11 (NATL)(1) | 125,000 | 130,022 | | | | |
| | | | | Finance Auth. Rev., | | |
| Long Island Power Auth. | | | | Series 2005 D, (Sales | | |
| Electric System Rev., | | | | Tax Secured Bond), | | |
| Series 2006 F, 5.00%, | | | | 4.00%, 11/15/16 (NATL)(1) | 110,000 | 120,705 |
| 5/1/17 (NATL)(1) | 100,000 | 111,982 | | | | |
| | | | | Nassau County Tobacco | | |
| Long Island Power Auth. | | | | Settlement Corp. Rev., | | |
| Electric System Rev., Series | | | | Series 2006 A3, | | |
| 2008 A, 6.00%, 5/1/33(1) | 385,000 | 438,892 | | 5.125%, 6/1/46(1) | 100,000 | 81,428 |
| Metropolitan Transportation | | | | New York City Industrial | | |
| Auth. Dedicated Tax Fund | | | | Development Agency Rev., | | |
| Rev., Series 2009 B, | | | | (Queens Baseball Stadium), | | |
| 5.00%, 11/15/34(1) | 200,000 | 211,106 | | 5.00%, 1/1/12 (Ambac)(1) | 115,000 | 119,493 |
11
| | | | | | |
| New York Tax-Free | | | | | |
| |
| | Principal | | | | Principal | |
| | Amount | Value | | | Amount | Value |
| New York City Industrial | | | | New York City Trust for | | |
| Development Agency Rev., | | | | Cultural Resources Rev., | | |
| (Queens Baseball Stadium), | | | | Series 2008 A1, (Lincoln | | |
| 5.00%, 1/1/20 (Ambac)(1) | $ 185,000 | $ 186,854 | | Center), VRDN, 0.25%, | | |
| New York City Municipal | | | | 6/1/10 (LOC: Bank of | | |
| Water Finance Auth. Water | | | | America N.A.) | $1,000,000 | $ 1,000,000 |
| & Sewer Rev., Series | | | | New York City Trust for | | |
| 2007 A, 5.00%, 6/15/38(1) | 100,000 | 104,338 | | Cultural Resources Rev., | | |
| New York City Municipal | | | | Series 2009 A, (American | | |
| Water Finance Auth. | | | | Museum of Natural History), | | |
| Water & Sewer Rev., | | | | 5.00%, 4/1/20(1) | 150,000 | 174,978 |
| Series 2008 DD, (Second | | | | New York City Trust for | | |
| General Resolution), | | | | Cultural Resources Rev., | | |
| 6.00%, 6/15/40(1) | 225,000 | 260,219 | | Series 2009 A, (Carnegie | | |
| New York City Municipal | | | | Hall), 5.00%, 12/1/29(1) | 100,000 | 105,736 |
| Water Finance Auth. Water | | | | New York GO, Series 1994 | | |
| & Sewer Rev., Series | | | | H3, VRDN, 0.26%, 6/1/10 | | |
| 2009 BB, 5.00%, 6/15/27(1) | 400,000 | 440,636 | | (AGM) (SBBPA: State Street | | |
| New York City Municipal | | | | Bank & Trust Co.)(1) | 700,000 | 700,000 |
| Water Finance Auth. Water | | | | New York GO, Series 2004 G, | | |
| & Sewer Rev., Series | | | | 5.00%, 8/1/14(1) | 150,000 | 170,436 |
| 2009 EE, 5.00%, 6/15/16(1) | 115,000 | 133,272 | | New York GO, Series 2005 | | |
| New York City Municipal | | | | M, 5.00%, 4/1/15 (AGM)(1) | 325,000 | 371,709 |
| Water Finance Auth. Water | | | | New York GO, Series | | |
| & Sewer Rev., Series | | | | 2006 I8, VRDN, 0.30%, | | |
| 2009 GG2, (Second | | | | 6/1/10 (LOC: Bank of | | |
| General Resolution), | | | | America N.A.)(1) | 950,000 | 950,000 |
| 5.00%, 6/15/35(1) | 400,000 | 424,800 | | | | |
| | | | | New York GO, Series 2008 A, | | |
| New York City Municipal | | | | 4.00%, 3/1/13(1) | 125,000 | 135,450 |
| Water Finance Auth. Water | | | | | | |
| & Sewer Rev., Series | | | | 2008 New York B1, 5.25%, GO, Series 9/1/22(1) | 100,000 | 112,246 |
| 2010 FF, (Second | | | | | | |
| General Resolution), | | | | New York GO, Series 2008 C, | | |
| 5.00%, 6/15/25(1) | 315,000 | 355,014 | | 5.25%, 8/1/17(1) | 295,000 | 342,047 |
| New York City Transitional | | | | New York GO, Series 2009 E, | | |
| Finance Auth. Building Aid | | | | 5.00%, 8/1/20(1) | 100,000 | 113,715 |
| Rev., Series 2009 S5, | | | | New York GO, Series | | |
| 5.25%, 1/15/39(1) | 100,000 | 106,710 | | 2009 I1, 5.00%, 4/1/24(1) | 200,000 | 218,972 |
| New York City Transitional | | | | New York GO, Series | | |
| Finance Auth. Rev., Series | | | | 2009 I1, 5.30%, 4/1/27(1) | 100,000 | 110,254 |
| 2009 A, (Future Tax Secured | | | | New York GO, Series | | |
| Bonds), 5.00%, 5/1/38(1) | 200,000 | 211,800 | | 2009 I1, 5.375%, 4/1/36(1) | 200,000 | 219,052 |
| New York City Transitional | | | | New York GO, Series | | |
| Finance Auth. Rev., Series | | | | 2009 J1, 5.00%, 5/15/31(1) | 200,000 | 213,232 |
| 2009 B, (Future Tax Secured | | | | | | |
| Bonds), 5.00%, 11/1/23(1) | 200,000 | 224,980 | | New York GO, Series | | |
| | | | | 2009 J1, 5.00%, 5/15/36(1) | 105,000 | 110,657 |
| New York City Transitional | | | | | | |
| Finance Auth. Rev., Series | | | | New York Liberty | | |
| 2010 I2, (Future Tax Secured | | | | Development Corp. | | |
| Bonds), 5.00%, 11/1/27(2) | 300,000 | 329,526 | | Rev., (Goldman | | |
| | | | | Sachs Headquarters), | | |
| New York City Trust for | | | | 5.25%, 10/1/35(1) | 200,000 | 202,174 |
| Cultural Resources Rev., | | | | | | |
| Series 2008 1A, | | | | New York State Dormitory | | |
| (Museum of Modern | | | | Auth. Personal Income Tax | | |
| Art), 5.00%, 4/1/25(1) | 100,000 | 110,842 | | Rev., Series 2009 B, | | |
| | | | | 5.00%, 2/15/18(1) | 200,000 | 232,224 |
12
| | | | | | |
| New York Tax-Free | | | | | |
| |
| | Principal | | | | Principal | |
| | Amount | Value | | | Amount | Value |
| New York State Dormitory | | | | New York State Dormitory | | |
| Auth. Personal Income Tax | | | | Auth. Rev., Series 2009 A, | | |
| Rev., Series 2009 D, | | | | (North Shore Long Island | | |
| 5.00%, 6/15/20(1) | $ 180,000 | $ 208,058 | | Jewish Health System), | | |
| New York State Dormitory | | | | 5.50%, 5/1/30(1) | $ 100,000 | $ 104,145 |
| Auth. Rev., (Brooklyn Law | | | | New York State Dormitory | | |
| School), 5.75%, 7/1/33(1) | 200,000 | 217,388 | | Auth. Rev., Series 2009 A, | | |
| New York State Dormitory | | | | (North Shore Long Island | | |
| Auth. Rev., (Interfaith | | | | Jewish Health System), | | |
| Medical Center), | | | | 5.50%, 5/1/37(1) | 400,000 | 412,788 |
| 5.00%, 2/15/14(1) | 250,000 | 276,558 | | New York State Dormitory | | |
| New York State Dormitory | | | | Auth. Rev., Series 2009 A, | | |
| Auth. Rev., (Manhattan | | | | (University of Rochester), | | |
| Marymount), 5.00%, 7/1/14 | 200,000 | 216,460 | | 5.00%, 7/1/21(1) | 100,000 | 111,591 |
| New York State Dormitory | | | | New York State Dormitory | | |
| Auth. Rev., (Memorial Sloan- | | | | Auth. Rev., Series 2010 A, | | |
| Kettering Cancer Center), | | | | (Cornell University), | | |
| 5.25%, 7/1/13 (NATL)(1) | 100,000 | 112,222 | | 5.00%, 7/1/40(2) | 350,000 | 372,383 |
| New York State Dormitory | | | | New York State Dormitory | | |
| Auth. Rev., (Mount Sinai | | | | Auth. Rev., Series 2010 A, | | |
| School of Medicine), | | | | (Mount Sinai Hospital), | | |
| 5.25%, 7/1/24(1) | 200,000 | 208,354 | | 5.00%, 7/1/21(2) | 250,000 | 265,040 |
| New York State Dormitory | | | | New York State Dormitory | | |
| Auth. Rev., (Municipal | | | | Auth. Rev., Series 2010 A, | | |
| Health Facilities | | | | (Mount Sinai Hospital), | | |
| Improvement Program | | | | 5.00%, 7/1/22(2) | 250,000 | 262,945 |
| Lease Revenue Bonds), | | | | New York State | | |
| 5.00%, 1/15/20(1) | 100,000 | 108,556 | | Environmental Facilities | | |
| New York State Dormitory | | | | Corp. Clean Water & | | |
| Auth. Rev., (Yeshiva | | | | Drinking Rev., Series | | |
| University), 5.00%, 9/1/38(1) | 200,000 | 208,106 | | 2006 C, (Revolving | | |
| | | | | Fund-Pooled Financing), | | |
| New York State Dormitory | | | | 5.00%, 10/15/22(1) | 170,000 | 190,664 |
| Auth. Rev., Series | | | | | | |
| 2005 A, (State University | | | | New York State | | |
| Educational Facilities), | | | | Environmental Facilities | | |
| 5.50%, 5/15/17 | | | | Corp. Clean Water & | | |
| (NATL/FGIC)(1) | 100,000 | 115,659 | | Drinking Rev., Series | | |
| | | | | 2009 A, 5.00%, 6/15/29(1) | 130,000 | 141,120 |
| New York State Dormitory | | | | | | |
| Auth. Rev., Series 2005 B, | | | | New York State Local | | |
| (Court Facilities Lease), | | | | Government Assistance | | |
| VRDN, 0.34%, 6/2/10 | | | | Corp. Rev., Series | | |
| (LOC: Bayerische | | | | 2008 A, (Senior Lien), | | |
| Landesbank)(1) | 525,000 | 525,000 | | 5.00%, 4/1/20(1) | 200,000 | 229,262 |
| New York State Dormitory | | | | New York State Power Auth. | | |
| Auth. Rev., Series 2008 A2, | | | | Rev., Series 2007 C, 5.00%, | | |
| (Memorial Sloan-Kettering | | | | 11/15/14 (NATL)(1) | 130,000 | 149,713 |
| Cancer Center), 5.00%, | | | | New York State Thruway | | |
| 7/1/26(1) | 300,000 | 322,701 | | Auth. Highway & Bridge | | |
| New York State Dormitory | | | | Trust Fund Rev., Series | | |
| Auth. Rev., Series | | | | 2002 A, 5.25%, 4/1/12, | | |
| 2008 B, (New York | | | | Prerefunded at 100% | | |
| University), 5.00%, 7/1/22(1) | 100,000 | 110,711 | | of Par (AGM)(1)(3) | 100,000 | 108,532 |
| New York State Dormitory | | | | | | |
| Auth. Rev., Series | | | | | | |
| 2009 A, (New York | | | | | | |
| University), 5.00%, 7/1/23(1) | 100,000 | 111,757 | | | | |
13
| | | | | | |
| New York Tax-Free | | | | | |
| |
| | Principal | | | | Principal | |
| | Amount | Value | | | Amount | Value |
| New York State Thruway | | | | Sales Tax Asset Receivable | | |
| Auth. Highway & Bridge | | | | Corp. Rev., Series 2004 A, | | |
| Trust Fund Rev., Series | | | | 5.00%, 10/15/32 (Ambac)(1) | $ 300,000 | $ 314,859 |
| 2005 B, 5.00%, 4/1/13 | | | | Saratoga County Water | | |
| (NATL/FGIC)(1) | $ 170,000 | $ 188,901 | | Auth. Rev., (Water System), | | |
| New York State Thruway | | | | 5.00%, 9/1/33(1) | 200,000 | 210,912 |
| Auth. Rev., Series 2007 H, | | | | South Colonie Central School | | |
| 5.00%, 1/1/14 (NATL)(1) | 100,000 | 111,783 | | District GO, 5.00%, 6/15/17 | 100,000 | 111,562 |
| New York State Thruway | | | | Tobacco Settlement | | |
| Auth. Second General | | | | Financing Corp. Rev., Series | | |
| Highway & Bridge Trust | | | | 2003 B1C, 5.50%, 6/1/21(1) | 400,000 | 432,984 |
| Fund Rev., Series 2008 B, | | | | | | |
| 5.00%, 4/1/21(1) | 200,000 | 224,220 | | Town of Hempstead Local | | |
| | | | | Development Corp. Rev., | | |
| New York State Thruway | | | | Series 2009 B, (Adelphi | | |
| Auth. Second General | | | | University), 5.25%, 2/1/39(1) | 200,000 | 208,764 |
| Highway & Bridge Trust | | | | | | |
| Fund Rev., Series 2010 A, | | | | Triborough Bridge & | | |
| 5.00%, 4/1/26(1) | 200,000 | 220,234 | | Tunnel Auth. Rev., | | |
| | | | | 5.00%, 11/15/20(1) | 200,000 | 226,858 |
| New York State Urban | | | | | | |
| Development Corp. | | | | Triborough Bridge & | | |
| Rev., Series 2008 D, | | | | Tunnel Auth. Rev., | | |
| | | | | 5.00%, 11/15/33(1) | 250,000 | 263,763 |
| 5.25%, 1/1/21(1) | 100,000 | 112,412 | | | | |
| New York State Urban | | | | Triborough Bridge & Tunnel | | |
| Development Corp. Rev., | | | | Auth. Rev., Series 2009 A2, | | |
| | | | | 4.00%, 11/15/15(1) | 100,000 | 110,959 |
| Series 2009 A1, (State | | | | | | |
| Personal Income Tax), | | | | Triborough Bridge & Tunnel | | |
| 5.00%, 12/15/28(1) | 275,000 | 299,305 | | Auth. Rev., Series 2010 A1, | | |
| | | | | VRDN, 4.00%, 11/15/12(1) | 250,000 | 267,688 |
| Niagara Falls Bridge | | | | | | |
| Commission Toll Rev., Series | | | | Troy Capital Resource | | |
| 1993 A, (Bridge System), | | | | Corp. Rev., Series 2010 A, | | |
| 4.00%, 10/1/19 (AGC)(1) | 200,000 | 212,742 | | (Rensselaer Polytechnic | | |
| | | | | Institute), 5.125%, 9/1/40(1) | 300,000 | 306,828 |
| Onondaga County Trust | | | | | | |
| for Cultural Resources | | | | United Nations Development | | |
| Rev., Series 2010 B, | | | | Corp. Rev., Series 2009 A, | | |
| (Syracuse University), | | | | 5.00%, 7/1/25 | 100,000 | 107,319 |
| 5.00%, 12/1/15(1) | 170,000 | 195,899 | | | | 23,787,584 |
| Plainview Old Bethpage | | | | PUERTO RICO — 3.0% | | |
| Central School District GO, | | | | Puerto Rico Electric Power | | |
| 4.75%, 12/15/15(1) | 200,000 | 232,160 | | Auth. Rev., Series 2003 NN, | | |
| Port Auth. of New York | | | | 5.25%, 7/1/23 (NATL)(1) | 250,000 | 270,577 |
| & New Jersey Rev., | | | | Puerto Rico Public Buildings | | |
| (Consolidated Bonds-One | | | | Auth. Rev., Series 2009 Q, | | |
| Hundred Fifty-Third Series), | | | | 5.625%, 7/1/39(1) | 200,000 | 207,996 |
| 5.00%, 7/15/35(1) | 200,000 | 212,330 | | | | |
| | | | | Puerto Rico Sales Tax | | |
| Port Auth. of New York | | | | Financing Corp. Rev., Series | | |
| & New Jersey Rev., | | | | 2009 A, 5.75%, 8/1/37(1) | 200,000 | 213,340 |
| (Consolidated Bonds-One | | | | | | |
| Hundred Fifty-Third Series), | | | | | | 691,913 |
| 5.00%, 7/15/38(1) | 235,000 | 248,654 | | TOTAL INVESTMENT | | |
| Rome City School District | | | | SECURITIES — 105.9% | | |
| GO, 5.00%, 6/15/13 | | | | (Cost $23,840,109) | | 24,533,242 |
| (NATL/FGIC) | 100,000 | 110,415 | | OTHER ASSETS | | |
| Sales Tax Asset Receivable | | | | AND LIABILITIES — (5.9)% | | (1,373,493) |
| Corp. Rev., Series 2004 A, | | | | TOTAL NET ASSETS — 100.0% | | $ 23,159,749 |
| 5.00%, 10/15/29 (Ambac)(1) | 100,000 | 107,621 | | | | |
14
| | | |
| New York Tax-Free | | | |
| Futures Contracts | | | |
| Contracts Sold | Expiration Date | Underlying Face Amount at Value | Unrealized Gain (Loss) |
| 12 U.S. Treasury 2-Year Notes | September 2010 | $2,617,688 | $(3,214) |
| |
| Notes to Schedule of Investments |
| AGC = Assured Guaranty Corporation |
| AGM = Assured Guaranty Municipal Corporation |
| Ambac = Ambac Assurance Corporation |
| FGIC = Financial Guaranty Insurance Company |
| GO = General Obligation |
| LOC = Letter of Credit |
| NATL = National Public Finance Guarantee Corporation |
| SBBPA = Standby Bond Purchase Agreement |
| VRDN = Variable Rate Demand Note. Interest reset date is indicated. Rate shown is effective at the period end. |
| (1) | Security, or a portion thereof, has been segregated for when-issued securities and/or futures contracts. At the period end, the aggregate value of |
| | securities pledged was $4,197,000. |
| (2) | When-issued security. |
| (3) | Escrowed to maturity in U.S. government securities or state and local government securities. |
Geographic classifications are unaudited.
See Notes to Financial Statements.
15
|
| Statement of Assets and Liabilities |
| | | |
| MAY 31, 2010 | | | |
| Assets | | | |
| Investment securities, at value (cost of $23,840,109) | | $24,533,242 |
| Cash | | | 19,643 |
| Receivable for capital shares sold | | | 15,361 |
| Interest receivable | | | 247,746 |
| | | | 24,815,992 |
| | | | |
| Liabilities | | | |
| Payable for investments purchased | | | 1,635,396 |
| Payable for capital shares redeemed | | | 5,163 |
| Payable for variation margin on futures contracts | | 5,062 |
| Service fees (and distribution fees — A Class) payable | | 2,288 |
| Distribution fees payable | | | 1,799 |
| Dividends payable | | | 6,535 |
| | | | 1,656,243 |
| | | | |
| Net Assets | | | $23,159,749 |
| | | | |
| Net Assets Consist of: | | | |
| Capital paid in | | | $22,449,564 |
| Undistributed net investment income | | | 6,598 |
| Undistributed net realized gain on investment transactions | | 13,668 |
| Net unrealized appreciation on investments | | | 689,919 |
| | | | $23,159,749 |
| |
| | Net assets | Shares outstanding | Net asset value per share |
| Investor Class | $12,136,052 | 1,136,863 | $10.68 |
| Institutional Class | $25,522 | 2,391 | $10.67 |
| A Class | $8,115,980 | 760,001 | $10.68* |
| C Class | $2,882,195 | 269,949 | $10.68 |
| *Maximum offering price $11.18 (net asset value divided by 0.955) | | |
| |
| |
| See Notes to Financial Statements. | | | |
16
| |
| FOR THE PERIOD ENDED MAY 31, 2010(1) | |
| Investment Income (Loss) | |
| Income: | |
| Interest | $ 440,104 |
| | |
| Expenses: | |
| Management fees | 77,707 |
| Distribution fees — C Class | 16,301 |
| Service fees — C Class | 5,433 |
| Distribution and service fees — A Class | 12,045 |
| Trustees’ fees and expenses | 439 |
| Other expenses | 239 |
| | 112,164 |
| Fees waived | (77,707) |
| | 34,457 |
| | |
| Net investment income (loss) | 405,647 |
| | |
| Realized and Unrealized Gain (Loss) | |
| Net realized gain (loss) on: | |
| Investment transactions | 26,112 |
| Futures contract transactions | 2,531 |
| | 28,643 |
| | |
| Change in net unrealized appreciation (depreciation) on: | |
| Investments | 693,133 |
| Futures contracts | (3,214) |
| | 689,919 |
| | |
| Net realized and unrealized gain (loss) | 718,562 |
| | |
| Net Increase (Decrease) in Net Assets Resulting from Operations | $1,124,209 |
| (1) June 30, 2009 (fund inception) through May 31, 2010. | |
| |
| |
| See Notes to Financial Statements. | |
17
|
| Statement of Changes in Net Assets |
| |
| PERIOD ENDED MAY 31, 2010(1) | |
| Increase (Decrease) in Net Assets | |
| Operations | |
| Net investment income (loss) | $ 405,647 |
| Net realized gain (loss) | 28,643 |
| Change in net unrealized appreciation (depreciation) | 689,919 |
| Net increase (decrease) in net assets resulting from operations | 1,124,209 |
| | |
| Distributions to Shareholders | |
| From net investment income: | |
| Investor Class | (187,737) |
| Institutional Class | (226) |
| A Class | (162,041) |
| C Class | (55,643) |
| From net realized gains: | |
| Investor Class | (6,324) |
| A Class | (5,992) |
| C Class | (2,659) |
| Decrease in net assets from distributions | (420,622) |
| | |
| Capital Share Transactions | |
| Net increase (decrease) in net assets from capital share transactions | 22,456,162 |
| | |
| Net increase (decrease) in net assets | 23,159,749 |
| | |
| Net Assets | |
| End of period | $23,159,749 |
| | |
| Undistributed net investment income | $6,598 |
| (1) June 30, 2009 (fund inception) through May 31, 2010. | |
| |
| |
| See Notes to Financial Statements. | |
18
|
| Notes to Financial Statements |
MAY 31, 2010
1. Organization and Summary of Significant Accounting Policies
Organization — American Century Municipal Trust (the trust) is registered under the Investment Company Act of 1940 (the 1940 Act) as an open-end management investment company. New York Tax-Free Fund (the fund) is one fund in a series issued by the trust. The fund is nondiversified under the 1940 Act. Prior to November 12, 2009, the fund was diversified under the 1940 Act. The fund’s investment objective is to seek to maximize total return through high current income that is exempt from federal and New York state and local income taxes. The fund invests primarily in investment-grade municipal obligations. The following is a summary of the fund’s significant accounting policies.
Multiple Class — The fund is authorized to issue the Investor Class, the Institutional Class, the A Class and the C Class. The A Class may incur an initial sales charge. The A Class and C Class may be subject to a contingent deferred sales charge. The share classes differ principally in their respective sales charges and distribution and shareholder servicing expenses and arrangements. All shares of the fund represent an equal pro rata interest in the net assets of the class to which such shares belong, and have identical voting, dividend, liquidation and other rights and the same terms and conditions, except for class specific expenses and exclusive rights to vote on matters affecting only individual classes. Income, non-class specific expenses, and realized and unrealized capital gains and losses of the fund are allocated t o each class of shares based on their relative net assets. The Investor Class, A Class and C Class commenced sale on June 30, 2009, the fund’s inception date. Sale of the Institutional Class commenced on March 1, 2010.
Security Valuations — Debt securities maturing in greater than 60 days at the time of purchase are valued at current market value as provided by a commercial pricing service or at the mean of the most recent bid and asked prices. Debt securities maturing within 60 days at the time of purchase may be valued at cost, plus or minus any amortized discount or premium. Investments in open-end management investment companies are valued at the reported net asset value. If an event occurs after the value of a security was established but before the net asset value per share was determined that was likely to materially change the net asset value, that security would be valued as determined in accordance with procedures adopted by the Board of Trustees. If the fund determines that the market price of a portfolio security is not readily available, or that the valuation methods mentioned above do not reflect the security’s fair value, such security is valued as determined by the Board of Trustees or its designee, in accordance with procedures adopted by the Board of Trustees, if such determination would materially impact a fund’s net asset value. Certain other circumstances may cause the fund to use alternative procedures to value a security such as: a security has been declared in default; trading in a security has been halted during the trading day; or there is a foreign market holiday and no trading will commence.
Security Transactions — For financial reporting purposes, security transactions are accounted for as of the trade date. Net realized gains and losses are determined on the identified cost basis, which is also used for federal income tax purposes.
Investment Income — Interest income is recorded on the accrual basis and includes accretion of discounts and amortization of premiums.
When-Issued — The fund may engage in securities transactions on a when-issued basis. Under these arrangements, the securities’ prices and yields are fixed on the date of the commitment, but payment and delivery are scheduled for a future date. During this period, securities are subject to market fluctuations. The fund will segregate cash, cash equivalents or other appropriate liquid securities on its records in amounts sufficient to meet the purchase price.
Income Tax Status — It is the fund’s policy to distribute substantially all net investment income and net realized gains to shareholders and to otherwise qualify as a regulated investment company under provisions of the Internal Revenue Code. All tax years for the fund remain subject to examination by tax authorities. At this time, management
19
believes there are no uncertain tax positions which, based on their technical merit, would not be sustained upon examination and for which it is reasonably possible that the total amounts of unrecognized tax benefits will significantly change in the next twelve months. Accordingly, no provision has been made for federal or state income taxes.
Distributions to Shareholders — Distributions from net investment income are declared daily and paid monthly. Distributions from net realized gains, if any, are generally declared and paid annually.
Indemnifications — Under the trust’s organizational documents, its officers and trustees are indemnified against certain liabilities arising out of the performance of their duties to the fund. In addition, in the normal course of business, the fund enters into contracts that provide general indemnifications. The maximum exposure under these arrangements is unknown as this would involve future claims that may be made against a fund. The risk of material loss from such claims is considered by management to be remote.
Use of Estimates — The financial statements are prepared in conformity with accounting principles generally accepted in the United States of America, which may require management to make certain estimates and assumptions at the date of the financial statements. Actual results could differ from these estimates.
Subsequent Events — In preparing the financial statements, management evaluated the impact of events or transactions occurring through the date the financial statements were issued that would merit recognition or disclosure.
2. Fees and Transactions with Related Parties
Management Fees — The trust has entered into a Management Agreement with American Century Investment Management, Inc. (ACIM) (the investment advisor), under which ACIM provides the fund with investment advisory and management services in exchange for a single, unified management fee (the fee) per class. The Agreement provides that all expenses of managing and operating the fund, except brokerage expenses, taxes, interest, fees and expenses of the independent trustees (including legal counsel fees), and extraordinary expenses, will be paid by ACIM. The fee is computed and accrued daily based on the daily net assets of the specific class of shares of the fund and paid monthly in arrears. The fee consists of (1) an Investment Category Fee based on the daily net assets of the fund and certain other accounts managed by the investm ent advisor that are in the same broad investment category as the fund and (2) a Complex Fee based on the assets of all the funds in the American Century Investments family of funds. The rates for the Investment Category Fee range from 0.3225% to 0.4400%. The rates for the Complex Fee range from 0.2500% to 0.3100% for the Investor Class, A Class and C Class. The Institutional Class is 0.2000% less at each point within the Complex Fee range. Effective June 30, 2009, the investment advisor voluntarily agreed to waive 0.07% of its management fee. The investment advisor expects this waiver to continue until July 31, 2011 and cannot terminate it without consulting the Board of Trustees. In addition, the investment advisor voluntarily waived the remainder of the fund’s management fee from June 30, 2009 through May 31, 2010. This 0.57% fee waiver for the Investor Class, A Class and C Class and 0.37% fee waiver for the Institutional Clas s was terminated by the investment advisor on June 30, 2010. The total amount of the waiver for each class of the fund for the period June 30, 2009 (fund inception) through May 31, 2010, was $33,151, $27, $30,679 and $13,850 for the Investor Class, Institutional Class, A Class and C Class, respectively. The effective annual management fee before waiver for each class for the period June 30, 2009 (fund inception) through May 31, 2010, was 0.64% for the Investor Class, A Class and C Class and 0.44% for the Institutional Class. The effective annual management fee after waiver for all classes for the period June 30, 2009 (fund inception) through May 31, 2010, was 0.00%.
20
Distribution and Service Fees — The Board of Trustees has adopted a separate Master Distribution and Individual Shareholder Services Plan for each of the A Class and C Class (collectively the plans), pursuant to Rule 12b-1 of the 1940 Act. The plans provide that the A Class will pay American Century Investment Services, Inc. (ACIS) an annual distribution and service fee of 0.25%. The plans provide that the C Class will pay ACIS an annual distribution fee of 0.75% and service fee of 0.25%. The fees are computed and accrued daily based on each class’s daily net assets and paid monthly in arrears. The fees are used to pay financial intermediaries for distribution and individual shareholder services. Fees incurred under the plans during the period June 30, 2009 (fund inception) through May 31, 2010, are detailed in the State ment of Operations.
Related Parties — Certain officers and trustees of the trust are also officers and/or directors of American Century Companies, Inc. (ACC), the parent of the trust’s investment advisor, ACIM, the distributor of the trust, ACIS, and the trust’s transfer agent, American Century Services, LLC. ACIM owns 41% of the outstanding shares of the fund.
The fund has a Mutual Funds Services Agreement with J.P. Morgan Investor Services Co. (JPMIS). JPMorgan Chase Bank (JPMCB) is a custodian of the fund. JPMIS and JPMCB are wholly owned subsidiaries of JPMorgan Chase & Co. (JPM). JPM is an equity investor in ACC.
3. Investment Transactions
Purchases and sales of investment securities, excluding short-term investments, for the period June 30, 2009 (fund inception) through May 31, 2010, were $21,829,673 and $1,878,967, respectively.
4. Capital Share Transactions
Transactions in shares of the fund were as follows (unlimited number of shares authorized):
| | | |
| | | Period ended May 31, 2010(1)(2) |
| | | Shares | Amount |
| Investor Class | | |
| Sold | | 1,205,903 | $12,579,195 |
| Issued in reinvestment of distributions | 17,908 | 188,076 |
| Redeemed | (86,948) | (914,387) |
| | | 1,136,863 | 11,852,884 |
| Institutional Class | | |
| Sold | | 2,369 | 25,000 |
| Issued in reinvestment of distributions | 22 | 226 |
| | | 2,391 | 25,226 |
| A Class | | |
| Sold | | 765,768 | 7,900,007 |
| Issued in reinvestment of distributions | 11,950 | 125,542 |
| Redeemed | (17,717) | (185,690) |
| | | 760,001 | 7,839,859 |
| C Class | | |
| Sold | | 268,734 | 2,725,665 |
| Issued in reinvestment of distributions | 4,537 | 47,567 |
| Redeemed | (3,322) | (35,039) |
| | | 269,949 | 2,738,193 |
| Net increase (decrease) | 2,169,204 | $22,456,162 |
| (1) | June 30, 2009 (fund inception) through May 31, 2010. | | |
| (2) | March 1, 2010 (commencement of sale) through May 31, 2010 for the Institutional Class. | | |
21
5. Fair Value Measurements
The fund’s securities valuation process is based on several considerations and may use multiple inputs to determine the fair value of the positions held by the fund. In conformity with accounting principles generally accepted in the United States of America, the inputs used to determine a valuation are classified into three broad levels as follows:
• Level 1 valuation inputs consist of unadjusted quoted prices in an active market for identical securities;
• Level 2 valuation inputs consist of significant direct or indirect observable market data (including quoted prices for similar securities, evaluations of subsequent market events, interest rates, prepayment speeds, credit risk, etc.); or
• Level 3 valuation inputs consist of significant unobservable inputs (including a fund’s own assumptions).
The level classification is based on the lowest level input that is significant to the fair valuation measurement. The valuation inputs are not an indication of the risks associated with investing in these securities or other financial instruments.
As of May 31, 2010, the valuation inputs used to determine the fair value of the fund’s investment securities and unrealized gain (loss) on futures contracts were classified as Level 2 and Level 1, respectively. The Schedule of Investments provides additional details on the fund’s portfolio holdings.
6. Derivative Instruments
Interest Rate Risk — The fund is subject to interest rate risk in the normal course of pursuing its investment objectives. The value of bonds generally declines as interest rates rise. A fund may enter into futures contracts based on a bond index or a specific underlying security. A fund may purchase futures contracts to gain exposure to increases in market value or sell futures contracts to protect against a decline in market value. Upon entering into a futures contract, a fund will segregate cash, cash equivalents or other appropriate liquid securities on its records in amounts sufficient to meet requirements. Subsequent payments (variation margin) are made or received daily, in cash, by a fund. The variation margin is equal to the daily change in the contract value and is recorded as unrealized gains and losses. A fund rec ognizes a realized gain or loss when the futures contract is closed or expires. Net realized and unrealized gains or losses occurring during the holding period of futures contracts are a component of net realized gain (loss) on futures contract transactions and change in net unrealized appreciation (depreciation) on futures contracts, respectively. One of the risks of entering into futures contracts is the possibility that the change in value of the contract may not correlate with the changes in value of the underlying securities. The interest rate risk derivative instruments held at period end as disclosed on the Schedule of Investments are indicative of the fund’s typical volume during the period.
The value of interest rate risk derivative instruments as of May 31, 2010, is disclosed on the Statement of Assets and Liabilities as a liability of $5,062 in payable for variation margin on futures contracts. For the period June 30, 2009 (fund inception) through May 31, 2010, the effect of interest rate risk derivative instruments on the Statement of Operations was $2,531 in net realized gain (loss) on futures contract transactions and $(3,214) in change in net unrealized appreciation (depreciation) on futures contracts.
22
7. Interfund Lending
The fund, along with certain other funds in the American Century Investments family of funds, may participate in an interfund lending program, pursuant to an Exemptive Order issued by the Securities and Exchange Commission (SEC). This program provides an alternative credit facility allowing the fund to borrow from or lend to other funds in the American Century Investments family of funds that permit such transactions. Interfund lending transactions are subject to each fund’s investment policies and borrowing and lending limits. The interfund loan rate earned/paid on interfund lending transactions is determined daily based on the average of certain current market rates. Interfund lending transactions normally extend only overnight, but can have a maximum duration of seven days. The program is subject to annual approval by the Board of Trustees. During the period June 30, 2009 (fund inception) through May 31, 2 010, the fund did not utilize the program.
8. Risk Factors
The fund concentrates its investments in a single state and therefore may have more exposure to credit risk related to the state of New York than a fund with a broader geographical diversification.
9. Federal Tax Information
The tax character of distributions paid during the period June 30, 2009 (fund inception) through May 31, 2010, was as follows:
| |
| Distributions Paid From | |
| Exempt income | $405,647 |
| Taxable ordinary income | $9,917 |
| Long-term capital gains | $5,058 |
The book-basis character of distributions made during the year from net investment income or net realized gains may differ from their ultimate characterization for federal income tax purposes. These differences reflect the differing character of certain income items and net realized gains and losses for financial statement and tax purposes, and may result in reclassification among certain capital accounts on the financial statements.
As of May 31, 2010, the federal tax cost of investments and the components of distributable earnings on a tax-basis were as follows:
| | |
| Federal tax cost of investments | $23,840,109 |
| Gross tax appreciation of investments | $693,133 |
| Gross tax depreciation of investments | — |
| Net tax appreciation (depreciation) of investments | $693,133 |
| Other book-to-tax adjustments | $ (7,318) |
| Net tax appreciation (depreciation) | $685,815 |
| Undistributed exempt income | $6,598 |
| Undistributed taxable income | $18,848 |
| Capital loss deferral | $(1,076) |
23
The difference between book-basis and tax-basis cost and unrealized appreciation (depreciation) is attributable primarily to the realization for tax purposes of unrealized gain (loss) on certain futures contracts. Other book-to-tax adjustments are attributable primarily to the tax deferral of losses on straddle positions.
The capital loss deferral listed on the previous page represents net capital losses incurred in the seven-month period ended May 31, 2010. The fund has elected to treat such losses as having been incurred in the following fiscal year for federal income tax purposes.
10. Corporate Event
As part of a long-standing estate and business succession plan established by ACC Co-Chairman James E. Stowers, Jr., the founder of American Century Investments, ACC Co-Chairman Richard W. Brown succeeded Mr. Stowers as trustee of a trust that holds a greater-than-25% voting interest in ACC, the parent corporation of each fund’s advisor. Under the 1940 Act, this is presumed to represent control of ACC even though it is less than a majority interest. The change of trustee may technically be considered a “change of control” of ACC and therefore also a change of control of each fund’s advisor even though there has been no change to their management and none is anticipated. The “change of control” resulted in the assignment of each fund’s investment advisory agreement. Under the 1940 Act, an assignment automatically terminated such agreement, making the approval of a new agreement necessary.
On February 18, 2010, the Board of Trustees approved interim investment advisory agreements under which each fund will be managed until new agreements are approved by fund shareholders. On April 1, 2010, the Board of Trustees approved new investment advisory agreements. The interim agreements and the new agreements are substantially identical to the terminated agreements (with the exception of different effective and termination dates) and will not result in changes in the management of American Century Investments, the funds, their investment objectives, fees or services provided. The new agreement for the fund was approved by shareholders at a Special Meeting of Shareholders on June 16, 2010. The new agreement went into effect on July 16, 2010. Management agreements for new share classes of the funds that were launched after February 16, 2010 did not terminate, have not been replaced by interim agreements, and do not require approval of new agreements.
11. Other Tax Information (Unaudited)
The following information is provided pursuant to provisions of the Internal Revenue Code.
The fund designates $399,112 as exempt interest dividends for the fiscal year ended May 31, 2010.
The fund hereby designates $5,058, or up to the maximum amount allowable, as long-term capital gain distributions for the fiscal year ended May 31, 2010.
The fund hereby designates $9,917 as qualified short-term capital gains for purposes of Internal Revenue Code Section 871.
24
| | |
| New York Tax-Free | |
| |
| Investor Class | |
| For a Share Outstanding Throughout the Period Indicated | |
| | | 2010(1) |
| Per-Share Data | |
| Net Asset Value, Beginning of Period | $10.00 |
| Income From Investment Operations | |
| Net Investment Income (Loss)(2) | 0.35 |
| Net Realized and Unrealized Gain (Loss) | 0.68 |
| Total From Investment Operations | 1.03 |
| Distributions | |
| From Net Investment Income | (0.34) |
| From Net Realized Gains | (0.01) |
| Total Distributions | (0.35) |
| Net Asset Value, End of Period | $10.68 |
| |
| Total Return(3) | 10.39% |
| | |
| Ratios/Supplemental Data | |
| Ratio of Operating Expenses to Average Net Assets | 0.00%(4)(5)(6) |
| Ratio of Operating Expenses to Average Net Assets (Before Expense Waiver) | 0.64%(5) |
| Ratio of Net Investment Income (Loss) to Average Net Assets | 3.60%(4)(5) |
| Ratio of Net Investment Income (Loss) to Average Net Assets (Before Expense Waiver) | 2.96%(5) |
| Portfolio Turnover Rate | 16% |
| Net Assets, End of Period (in thousands) | $12,136 |
| (1) | June 30, 2009 (fund inception) through May 31, 2010. | |
| (2) | Computed using average shares outstanding throughout the period. | |
| (3) | Total return assumes reinvestment of net investment income and capital gains distributions, if any. Total returns for periods less than one year |
| | are not annualized. Total returns are calculated based on the net asset value of the last business day. The total return of the classes may not |
| | precisely reflect the class expense differences because of the impact of calculating the net asset values to two decimal places. If net asset |
| | values were calculated to three decimal places, the total return differences would more closely reflect the class expense differences. The |
| | calculation of net asset values to two decimal places is made in accordance with SEC guidelines and does not result in any gain or loss of value |
| | between one class and another. | |
| (4) | Effective June 30, 2009, the investment advisor voluntarily agreed to waive its management fee. | |
| (5) | Annualized. | |
| (6) | Ratio is less than 0.005%. | |
See Notes to Financial Statements.
25
| | |
| New York Tax-Free | |
| |
| Institutional Class | |
| For a Share Outstanding Throughout the Period Indicated | |
| | | 2010(1) |
| Per-Share Data | |
| Net Asset Value, Beginning of Period | $10.55 |
| Income From Investment Operations | |
| Net Investment Income (Loss)(2) | 0.10 |
| Net Realized and Unrealized Gain (Loss) | 0.12 |
| Total From Investment Operations | 0.22 |
| Distributions | |
| From Net Investment Income | (0.10) |
| Net Asset Value, End of Period | $10.67 |
| |
| Total Return(3) | 2.05% |
| | |
| Ratios/Supplemental Data | |
| Ratio of Operating Expenses to Average Net Assets | 0.00%(4)(5)(6) |
| Ratio of Operating Expenses to Average Net Assets (Before Expense Waiver) | 0.44%(5) |
| Ratio of Net Investment Income (Loss) to Average Net Assets | 3.61%(4)(5) |
| Ratio of Net Investment Income (Loss) to Average Net Assets (Before Expense Waiver) | 3.17%(5) |
| Portfolio Turnover Rate | 16%(7) |
| Net Assets, End of Period (in thousands) | $26 |
| (1) | March 1, 2010 (commencement of sale) through May 31, 2010. | |
| (2) | Computed using average shares outstanding throughout the period. | |
| (3) | Total return assumes reinvestment of net investment income and capital gains distributions, if any. Total returns for periods less than one year |
| | are not annualized. Total returns are calculated based on the net asset value of the last business day. The total return of the classes may not |
| | precisely reflect the class expense differences because of the impact of calculating the net asset values to two decimal places. If net asset |
| | values were calculated to three decimal places, the total return differences would more closely reflect the class expense differences. The |
| | calculation of net asset values to two decimal places is made in accordance with SEC guidelines and does not result in any gain or loss of value |
| | between one class and another. | |
| (4) | Effective March 1, 2010, the investment advisor voluntarily agreed to waive its management fee. | |
| (5) | Annualized. | |
| (6) | Ratio is less than 0.005%. | |
| (7) | Portfolio turnover is calculated at the fund level. Percentage indicated was calculated for the period June 30, 2009 (fund inception) through |
| | May 31, 2010. | |
See Notes to Financial Statements.
26
| | |
| New York Tax-Free | |
| |
| A Class | |
| For a Share Outstanding Throughout the Period Indicated | |
| | | 2010(1) |
| Per-Share Data | |
| Net Asset Value, Beginning of Period | $10.00 |
| Income From Investment Operations | |
| Net Investment Income (Loss)(2) | 0.32 |
| Net Realized and Unrealized Gain (Loss) | 0.68 |
| Total From Investment Operations | 1.00 |
| Distributions | |
| From Net Investment Income | (0.31) |
| From Net Realized Gains | (0.01) |
| Total Distributions | (0.32) |
| Net Asset Value, End of Period | $10.68 |
| |
| Total Return(3) | 10.16% |
| | |
| Ratios/Supplemental Data | |
| Ratio of Operating Expenses to Average Net Assets | 0.25%(4)(5) |
| Ratio of Operating Expenses to Average Net Assets (Before Expense Waiver) | 0.89%(5) |
| Ratio of Net Investment Income (Loss) to Average Net Assets | 3.35%(4)(5) |
| Ratio of Net Investment Income (Loss) to Average Net Assets (Before Expense Waiver) | 2.71%(5) |
| Portfolio Turnover Rate | 16% |
| Net Assets, End of Period (in thousands) | $8,116 |
| (1) | June 30, 2009 (fund inception) through May 31, 2010. | |
| (2) | Computed using average shares outstanding throughout the period. | |
| (3) | Total return assumes reinvestment of net investment income and capital gains distributions, if any, and does not reflect applicable sales charges |
| | Total returns for periods less than one year are not annualized. Total returns are calculated based on the net asset value of the last business day. |
| | The total return of the classes may not precisely reflect the class expense differences because of the impact of calculating the net asset values |
| | to two decimal places. If net asset values were calculated to three decimal places, the total return differences would more closely reflect the |
| | class expense differences. The calculation of net asset values to two decimal places is made in accordance with SEC guidelines and does not |
| | result in any gain or loss of value between one class and another. | |
| (4) | Effective June 30, 2009, the investment advisor voluntarily agreed to waive its management fee. | |
| (5) | Annualized. | |
See Notes to Financial Statements.
27
| | |
| New York Tax-Free | |
| |
| C Class | |
| For a Share Outstanding Throughout the Period Indicated | |
| | | 2010(1) |
| Per-Share Data | |
| Net Asset Value, Beginning of Period | $10.00 |
| Income From Investment Operations | |
| Net Investment Income (Loss)(2) | 0.25 |
| Net Realized and Unrealized Gain (Loss) | 0.68 |
| Total From Investment Operations | 0.93 |
| Distributions | |
| From Net Investment Income | (0.24) |
| From Net Realized Gains | (0.01) |
| Total Distributions | (0.25) |
| Net Asset Value, End of Period | $10.68 |
| |
| Total Return(3) | 9.41% |
| | |
| Ratios/Supplemental Data | |
| Ratio of Operating Expenses to Average Net Assets | 1.00%(4)(5) |
| Ratio of Operating Expenses to Average Net Assets (Before Expense Waiver) | 1.64%(5) |
| Ratio of Net Investment Income (Loss) to Average Net Assets | 2.60%(4)(5) |
| Ratio of Net Investment Income (Loss) to Average Net Assets (Before Expense Waiver) | 1.96%(5) |
| Portfolio Turnover Rate | 16% |
| Net Assets, End of Period (in thousands) | $2,882 |
| (1) | June 30, 2009 (fund inception) through May 31, 2010. | |
| (2) | Computed using average shares outstanding throughout the period. | |
| (3) | Total return assumes reinvestment of net investment income and capital gains distributions, if any, and does not reflect applicable sales charges. |
| | Total returns for periods less than one year are not annualized. Total returns are calculated based on the net asset value of the last business day. |
| | The total return of the classes may not precisely reflect the class expense differences because of the impact of calculating the net asset values |
| | to two decimal places. If net asset values were calculated to three decimal places, the total return differences would more closely reflect the |
| | class expense differences. The calculation of net asset values to two decimal places is made in accordance with SEC guidelines and does not |
| | result in any gain or loss of value between one class and another. | |
| (4) | Effective June 30, 2009, the investment advisor voluntarily agreed to waive its management fee. | |
| (5) | Annualized. | |
See Notes to Financial Statements.
28
|
| Report of Independent Registered Public Accounting Firm |
To the Trustees of the American Century Municipal Trust
and Shareholders of the New York Tax-Free Fund:
In our opinion, the accompanying statement of assets and liabilities, including the schedule of investments, and the related statements of operations and of changes in net assets and the financial highlights present fairly, in all material respects, the financial position of the New York Tax-Free Fund (one of the five funds comprising the American Century Municipal Trust, hereafter referred to as the “Fund”) at May 31, 2010, and the results of its operations, the changes in its net assets and the financial highlights for the period June 30, 2009 (commencement of operations) through May 31, 2010, in conformity with accounting principles generally accepted in the United States of America. These financial statements and financial highlights (hereafter referred to as “financial statements”) are the responsibility of the Fund’s management; our responsibility is to express an opinion on these fi nancial statements based on our audit. We conducted our audit of these financial statements in accordance with the standards of the Public Company Accounting Oversight Board (United States). Those standards require that we plan and perform the audit to obtain reasonable assurance about whether the financial statements are free of material misstatement. An audit includes examining, on a test basis, evidence supporting the amounts and disclosures in the financial statements, assessing the accounting principles used and significant estimates made by management, and evaluating the overall financial statement presentation. We believe that our audit, which included confirmation of securities at May 31, 2010 by correspondence with the custodian and brokers, provides a reasonable basis for our opinion.
PricewaterhouseCoopers LLP
Kansas City, Missouri
July 22, 2010
29
A special meeting of shareholders was held on November 12, 2009, to vote on the following proposal. The proposal received the required number of votes of the fund, and was adopted. A summary of voting results is listed below.
Proposal:
To change the fund’s diversification status from diversified to nondiversified.
| | |
| For: | 7,271,606 |
| Withhold: | 396,984 |
| Abstain: | 75,531 |
30
The Board of Trustees
The individuals listed below serve as trustees of the fund. Each trustee will continue to serve in this capacity until death, retirement, resignation or removal from office. The mandatory retirement age for trustees who are not “interested persons,” as that term is defined in the Investment Company Act (independent trustees), is 73. However, the mandatory retirement age may be extended for a period not to exceed two years with the approval of the remaining independent trustees.
Mr. Thomas is the only trustee who is an “interested person” because he currently serves as President and Chief Executive Officer of American Century Companies, Inc. (ACC), the parent company of American Century Investment Management, Inc. (ACIM or the advisor).
The other trustees (more than three-fourths of the total number) are independent; that is, they have never been employees, directors or officers of, and have no financial interest in, ACC or any of its wholly owned, direct or indirect, subsidiaries, including ACIM, American Century Investment Services, Inc. (ACIS) and American Century Services, LLC (ACS). The trustees serve in this capacity for eight (in the case of Mr. Thomas, 15) registered investment companies in the American Century Investments family of funds.
The following presents additional information about the trustees. The mailing address for each trustee other than Mr. Thomas is 1665 Charleston Road, Mountain View, California 94043. The mailing address for Mr. Thomas is 4500 Main Street, Kansas City, Missouri 64111.
Independent Trustees
John Freidenrich
Year of Birth: 1937
Position(s) with the Fund: Trustee
Length of Time Served: Since 2005
Principal Occupation(s) During the Past Five Years: Founder, Member and Manager, Regis
Management Company, LLC (investment management firm) (April 2004 to present)
Number of Funds in Fund Complex Overseen by Trustee: 41
Other Directorships Held by Trustee: None
Education/Other Professional Experience: AB in Economics, Stanford University; LLB,
Stanford Law School; formerly, partner and founder, Ware and Freidenrich Law
Firm and Bay Partners; formerly, President, Board of Trustees, Stanford University
31
Ronald J. Gilson
Year of Birth: 1946
Position(s) with the Fund: Trustee and Chairman of the Board
Length of Time Served: Since 1995
Principal Occupation(s) During the Past Five Years: Charles J. Meyers Professor of Law and
Business, Stanford Law School (1979 to present); Marc and Eva Stern Professor of
Law and Business, Columbia University School of Law (1992 to present)
Number of Funds in Fund Complex Overseen by Trustee: 41
Other Directorships Held by Trustee: None
Education/Other Professional Experience: BA, Washington University; JD, Yale Law School;
formerly, attorney, Steinhart, Goldberg, Feigenbaum & Ladar
Frederick L. A. Grauer
Year of Birth: 1946
Position(s) with the Fund: Trustee
Length of Time Served: Since 2008
Principal Occupation(s) During the Past Five Years: Senior Advisor, BlackRock, Inc. (investment
management firm) (2010 to present); Senior Advisor, Barclays Global Investors
(investment management firm) (2003 to 2009)
Number of Funds in Fund Complex Overseen by Trustee: 41
Other Directorships Held by Trustee: None
Education/Other Professional Experience: BA in Economics, University of British Columbia;
MA in Economics, University of Chicago; PhD in Business, Stanford University;
formerly, Executive Chairman, Barclays Global Investors; Chairman and Chief
Executive Officer, Wells Fargo Nikko Investment Advisors; and Vice President,
Merrill Lynch Capital Markets Group; formerly, Director, New York Stock Exchange,
Chicago Mercantile Exchange and Columbia University; formerly, faculty member,
Graduate School of Business, Columbia University and Alfred P. Sloan School of
Management, Massachusetts Institute of Technology
Peter F. Pervere
Year of Birth: 1947
Position(s) with the Fund: Trustee
Length of Time Served: Since 2007
Principal Occupation(s) During the Past Five Years: Retired
Number of Funds in Fund Complex Overseen by Trustee: 41
Other Directorships Held by Trustee: Intraware, Inc. (2003 to 2009); Digital Impact, Inc.
(2003 to 2005)
Education/Other Professional Experience: BA in History, Stanford University; CPA; formerly,
Vice President and Chief Financial Officer, Commerce One, Inc. (software and
services provider); formerly, Vice President and Corporate Controller, Sybase, Inc.;
formerly with accounting firm of Arthur Young & Co.
32
Myron S. Scholes
Year of Birth: 1941
Position(s) with the Fund: Trustee
Length of Time Served: Since 1980
Principal Occupation(s) During the Past Five Years: Chairman, Platinum Grove Asset
Management, L.P. (asset manager) (1999 to 2009); Frank E. Buck Professor of
Finance-Emeritus, Stanford Graduate School of Business (1996 to present)
Number of Funds in Fund Complex Overseen by Trustee: 41
Other Directorships Held by Trustee: Dimensional Fund Advisors (investment advisor);
CME Group, Inc. (futures and options exchange)
Education/Other Professional Experience: BA in Economics, McMaster University (Ontario);
MBA and PhD, University of Chicago; formerly, Senior Research Fellow at the
Hoover Institute; formerly, Edward Eagle Brown Professor of Finance, University of
Chicago; recipient of the Alfred Nobel Memorial Prize in Economic Sciences
John B. Shoven
Year of Birth: 1947
Position(s) with the Fund: Trustee
Length of Time Served: Since 2002
Principal Occupation(s) During the Past Five Years: Professor of Economics, Stanford University
(1973 to present)
Number of Funds in Fund Complex Overseen by Trustee: 41
Other Directorships Held by Trustee: Cadence Design Systems; Exponent; Financial Engines;
PalmSource, Inc. (2002 to 2005); Watson Wyatt Worldwide (2002 to 2006)
Education/Other Professional Experience: BA in Physics, University of California; PhD in
Economics, Yale University; Director of the Stanford Institute for Economic Policy
Research (1999 to present); formerly, Chair of Economics and Dean of Humanities
and Sciences, Stanford University
Interested Trustee
Jonathan S. Thomas
Year of Birth: 1963
Position(s) with the Fund: Trustee and President
Length of Time Served: Since 2007
Principal Occupation(s) During the Past Five Years: President and Chief Executive Officer,
ACC (March 2007 to present); Chief Administrative Officer, ACC (February 2006 to
February 2007); Executive Vice President, ACC (November 2005 to February 2007).
Also serves as: Chief Executive Officer and Manager, ACS; Executive Vice President,
ACIM; Director, ACC, ACIM and other ACC subsidiaries. Global Chief Operating
Officer and Managing Director, Morgan Stanley (investment management)
(March 2000 to November 2005)
Number of Funds in Fund Complex Overseen by Trustee: 104
Other Directorships Held by Trustee: None
Education/Other Professional Experience: BA in Economics, University of Massachusetts;
MBA, Boston College; formerly held senior leadership roles with Fidelity
Investments, Boston Financial Services and Bank of America; serves on the Board of
Governors of the Investment Company Institute
33
Officers
The following table presents certain information about the executive officers of the fund. Each officer serves as an officer for each of the 15 investment companies in the American Century family of funds, unless otherwise noted. No officer is compensated for his or her service as an officer of the fund. The listed officers are interested persons of the fund and are appointed or re-appointed on an annual basis. The mailing address for each of the officers listed below is 4500 Main Street, Kansas City, Missouri 64111.
| | |
| Name | Offices with | |
| (Year of Birth) | the Fund | Principal Occupation(s) During the Past Five Years |
| Jonathan S. | Trustee and | President and Chief Executive Officer, ACC (March 2007 to present); Chief |
| Thomas | President | Administrative Officer, ACC (February 2006 to March 2007); Executive Vice |
| (1963) | since 2007 | President, ACC (November 2005 to February 2007). Also serves as: Chief |
| | | Executive Officer and Manager, ACS; Executive Vice President, ACIM; Director, |
| | | ACC, ACIM and other ACC subsidiaries. Global Chief Operating Officer and |
| | | Managing Director, Morgan Stanley (March 2000 to November 2005) |
| Barry Fink | Executive | Chief Operating Officer and Executive Vice President, ACC (September 2007 |
| (1955) | Vice President | to present); President, ACS (October 2007 to present); Managing Director, |
| | since 2007 | Morgan Stanley (2000 to 2007); Global General Counsel, Morgan Stanley |
| | | (2000 to 2006). Also serves as: Manager, ACS, and Director, ACC and |
| | | certain ACC subsidiaries |
| Maryanne L. | Chief Compliance | Chief Compliance Officer, American Century funds, ACIM and ACS (August |
| Roepke | Officer since 2006 | 2006 to present); Assistant Treasurer, ACC (January 1995 to August 2006); |
| (1956) | and Senior Vice | and Treasurer and Chief Financial Officer, various American Century funds |
| | President since | (July 2000 to August 2006). Also serves as: Senior Vice President, ACS |
| | 2000 | |
| Charles A. | General Counsel | Attorney, ACC (February 1994 to present); Vice President, ACC (November |
| Etherington | since 2007 and | 2005 to present); General Counsel, ACC (March 2007 to present); Also |
| (1957) | Senior Vice | serves as General Counsel, ACIM, ACS, ACIS and other ACC subsidiaries; |
| | President | and Senior Vice President, ACIM and ACS |
| | since 2006 | |
| Robert J. Leach | Vice President, | Vice President, ACS (February 2000 to present); and Controller, various |
| (1966) | Treasurer and | American Century funds (1997 to September 2006) |
| | Chief Financial | |
| | Officer since 2006 | |
| David H. Reinmiller | Vice President | Attorney, ACC (January 1994 to present); Associate General Counsel, ACC |
| (1963) | since 2001 | (January 2001 to present); Chief Compliance Officer, American Century |
| | | funds and ACIM (January 2001 to February 2005). Also serves as: Vice |
| | | President, ACIM and ACS |
| Ward D. Stauffer | Secretary | Attorney, ACC (June 2003 to Present) |
| (1960) | since 2005 | |
The SAI has additional information about the fund’s trustees and is available without charge, upon request, by calling 1-800-345-2021.
34
|
| Board Approval of Management Agreements |
American Century Investment Management, Inc. (“ACIM” or the “Advisor”) currently serves as investment advisor to the Fund under an interim management agreement (the “Interim Management Agreement”) between the Advisor and the Fund approved by the Fund’s Board of Trustees (the “Board”). The Advisor previously served as investment advisor to the Fund pursuant to a management agreement (the “Prior Management Agreement”) that terminated in accordance with its terms on February 16, 2010, as a result of a change of control of the Advisor’s parent company, American Century Companies, Inc. (“ACC”). The change in control occurred as the result of a change in the trustee of a trust created by James E. Stowers, Jr., the founder of American Century Investments that holds shares representing a significant interest in ACC stock. Mr. Stowers previously served a s the trustee of the trust. On February 16, 2010, Richard W. Brown, Co-Chairman of ACC with Mr. Stowers, became the trustee in accordance with the terms of the trust and Mr. Stowers’ long-standing estate and succession plan.
On February 18, 2010, the Board approved the Interim Management Agreement in accordance with Rule 15a-4 under the Investment Company Act to ensure continued management of the Fund by the Advisor after the termination of the Prior Management Agreement and until shareholder approval of a new management agreement (the “Proposed Management Agreement”) as required under the Act. The Board approved the Proposed Management Agreement and recommended its approval to shareholders. Fund shareholders approved the Proposed Management Agreement at a meeting on June 16, 2010.*
The Interim Management Agreement and the Proposed Management Agreement are substantially identical to the Prior Management Agreement except for their effective dates and the termination provisions of the Interim Management Agreement. Under the Interim and Proposed Management Agreements, the Advisor will provide the same services to the Fund and receive the same compensation rate as under the Prior Management Agreement.
Basis for Board Approval of Interim Management Agreement
In considering the approval of the Interim Management Agreement, Rule 15a-4 requires the Board to approve the contract within ten business days of the termination of the prior agreement and to determine that the compensation to be received under the interim agreement is no greater than would have been received under the prior agreement. In connection with the approval, the Board noted that it oversees on a continuous basis and evaluates at its quarterly meetings, directly and through the committees of the Board, the nature and quality of significant services provided by the Advisor, the investment performance of the Fund, shareholder services, audit and compliance functions and a variety of other matters relating to the Fund’s operations.
|
| *Management agreements for new share classes of the Fund launched after February 16, 2010, did not terminate, have not been replaced |
| by Interim Management Agreements, and do not require Board or shareholder approval at this time. |
35
In evaluating the Interim Management Agreement, the Board, assisted by the advice of its independent legal counsel, considered a number of factors in addition to those required by the rule with no one factor being determinative to its analysis. Among the factors considered by the Board were the circumstances and effect of the change of control, the fact that the Advisor will provide the same services and receive the same compensation rate as under the Prior Management Agreements, and that the change of control did not result in a change of the personnel managing the Fund. Upon completion of its analysis, the Board approved the Interim Management Agreement, determining that the continued management of the Fund by the Advisor was in the best interests of the Fund and Fund shareholders.
Basis for Board Approval of Proposed Management Agreement
At a meeting held on April 1, 2010, after considering all information presented, the Board approved, and determined to recommend that shareholders approve, the Proposed Management Agreement. In connection with that approval, the Board requested and reviewed extensive data and information compiled by the Advisor and certain independent providers of evaluation data concerning the Fund and services provided to the Fund by the Advisor. The Board oversees on a continuous basis and evaluates at its quarterly meetings, directly and through the committees of the Board, the nature and quality of significant services provided by the Advisor, the investment performance of the Fund, shareholder services, audit and compliance functions and a variety of other matters relating to the Fund’s operations. The information considered and the discussions held at the meetings included, but were not limited to:
• the nature, extent and quality of investment management, shareholder services and other services provided to the Fund;
• the wide range of programs and services the Advisor provides to the Fund and its shareholders on a routine and non-routine basis;
• the compliance policies, procedures, and regulatory experience of the Advisor;
• data comparing the cost of owning the Fund to the cost of owning similar funds;
• the fact that there will be no changes to the fees, services, or personnel who provide such services as compared to the Prior Management Agreement;
• data comparing the Fund’s performance to appropriate benchmarks and/ or a peer group of other mutual funds with similar investment objectives and strategies;
• financial data showing the profitability of the Fund to the Advisor and the overall profitability of the Advisor;
• data comparing services provided and charges to the Fund with those for other non-fund investment management clients of the Advisor; and
36
• consideration of collateral or “fall-out” benefits derived by the Advisor from the management of the Fund and potential sharing of economies of scale in connection with the management of the Fund.
The Board also considered whether there was any reason for not continuing the existing arrangement with the Advisor. In particular, the Board recognized that shareholders may have invested in the Fund on the strength of the Advisor’s industry standing and reputation and in the expectation that the Advisor will have a continuing role in providing advisory services to the Fund.
The Board considered all of the information provided by the Advisor, the independent data providers, and the Board’s independent legal counsel, and evaluated such information for the Fund. The Board did not identify any single factor as being all-important or controlling, and each Board member may have attributed different levels of importance to different factors. In deciding to approve the Proposed Management Agreement under the terms ultimately determined by the Board to be appropriate, the Board based its decision on a number of factors, including the following:
Nature, Extent and Quality of Services — Generally. Under the Proposed Management Agreement, the Advisor is responsible for providing or arranging for all services necessary for the operation of the Fund. The Board noted that under the Proposed Management Agreement, the Advisor provides or arranges at its own expense a wide variety of services including:
• constructing and designing the Fund
• portfolio research and security selection
• initial capitalization/funding
• securities trading
• Fund administration
• custody of Fund assets
• daily valuation of the Fund’s portfolio
• shareholder servicing and transfer agency, including shareholder
confirmations, recordkeeping and communications
• legal services
• regulatory and portfolio compliance
• financial reporting
• marketing and distribution
37
The Board noted that many of these services have expanded over time both in terms of quantity and complexity in response to shareholder demands, competition in the industry, changing distribution channels and the changing regulatory environment.
Investment Management Services. The investment management services provided to the Fund are complex and provide Fund shareholders access to professional money management, instant diversification of their investments within an asset class, the opportunity to easily diversify among asset classes, and liquidity. As a part of its general oversight and in evaluating investment performance, the Board expects the Advisor to manage the Fund in accordance with its investment objectives and approved strategies. In providing these services, the Advisor utilizes teams of investment professionals who require extensive information technology, research, training, compliance and other systems to conduct their business. The Board, directly and through its Portfolio Committee, regularly reviews investment performance information for the Fund, t ogether with comparative information for appropriate benchmarks and/or peer groups of similarly-managed funds, over different time horizons. If performance concerns are identified, the underperforming Fund receives special reviews until performance improves, during which time the Board discusses with the Advisor the reasons for such underperformance and any efforts being undertaken to improve performance.
Shareholder and Other Services. Under the Proposed Management Agreement, the Advisor will also provide the Fund with a comprehensive package of transfer agency, shareholder, and other services. The Board, directly and through the various committees of the Board, regularly reviews reports and evaluations of such services. These reports include, but are not limited to, information regarding the operational efficiency and accuracy of the shareholder and transfer agency services provided, staffing levels, shareholder satisfaction (as measured by external as well as internal sources), technology support, new products and services offered to Fund shareholders, securities trading activities, portfolio valuation services, auditing services, and legal and operational compliance activities. Certain aspects of shareholder and transfer ag ency service level efficiency and the quality of securities trading activities are measured by independent third party providers and are presented in comparison to other fund groups not managed by the Advisor.
Costs of Services Provided and Profitability. The Advisor provided detailed information concerning its cost of providing various services to the Fund, its profitability in managing the Fund, its overall profitability, and its financial condition. The Board reviewed with the Advisor the methodology used to prepare this financial information. The Board has also reviewed with the Advisor its methodology for compensating the investment professionals that provide services to the Fund as well as compensation to the five highest paid personnel of the Advisor. This financial information regarding the Advisor is considered in order to evaluate the Advisor’s financial condition, its ability to continue to provide services under the Proposed Management Agreement, and the reasonableness of the proposed management fees.
38
Ethics. The Board generally considers the Advisor’s commitment to providing quality services to shareholders and to conducting its business ethically. It noted that the Advisor’s practices generally meet or exceed industry best practices.
Economies of Scale. The Board also reviewed information provided by the Advisor regarding the possible existence of economies of scale in connection with the management of the Fund. The Board concluded that economies of scale are difficult to measure and predict with precision, especially on a fund-by-fund basis. The analysis of economies of scale is further complicated by the additional services and content provided by the Advisor and its reinvestment in its ability to provide and expand those services. Accordingly, the Board seeks to evaluate economies of scale by reviewing information, such as year-over-year profitability of the Advisor generally, the profitability of its management of the Fund specifically, and the expenses incurred by the Advisor in providing various functions to the Fund. The Board believes the Advisor i s appropriately sharing economies of scale through its competitive fee structure, offering competitive fees from fund inception, fee breakpoints as the fund complex and the Fund increases in size, and through reinvestment in its business to provide shareholders additional services and enhancements to existing services. In particular, separate breakpoint schedules based on the size of the entire fund complex and on the size of the Fund reflect the complexity of assessing economies of scale.
Comparison to Fees of Funds not Managed by the Advisor. Both the Prior and Proposed Management Agreements provide that the Fund pays the Advisor a single, all-inclusive (or unified) management fee for providing all services necessary for the management and operation of the Fund, other than brokerage expenses, taxes, interest, extraordinary expenses, and the fees and expenses of the Fund’s Independent Trustees (including their independent legal counsel) and expenses incurred in connection with the provision of shareholder services and distribution services under a plan adopted pursuant to Rule 12b-1 under the 1940 Act. Under the unified fee structure, the Advisor is responsible for providing all investment advisory, custody, audit, administrative, compliance, recordkeeping, marketing and shareholder services, or arranging and supervising third parties that provide such services. By contrast, most other funds are charged a variety of fees, including an investment advisory fee, a transfer agency fee, an administrative fee, distribution charges and other expenses. Other than their investment advisory fees and any applicable Rule 12b-1 distribution fees, the components of the total fees charged by these other funds may be increased without shareholder approval. The Board believes the unified fee structure is a benefit to Fund shareholders because it clearly discloses to shareholders the cost of owning Fund shares, and, since the unified fee cannot be increased without a vote of Fund shareholders, it shifts to the Advisor the risk of increased costs of operating the Fund and provides a direct incentive to minimize administrative inefficiencies. Part of the Board’s analysis of fee levels involves reviewing certain evaluative data compiled by an independent provider comparing the Fund’s unified fee to the total expense rat ios of similar funds not managed by the Advisor. The
39
Board concluded that the management fee to be paid by the Fund to the Advisor under the Proposed Management Agreement is reasonable in light of the services to be provided to the Fund.
Comparison to Fees and Services Provided to Other Clients of the Advisor. The Board also requested and received information from the Advisor concerning the nature and extent of the services, fees, and profitability of its advisory services to advisory clients other than the Fund. They observed that these varying types of client accounts require different services and involve different regulatory and entrepreneurial risks than the management of the Fund. The Board analyzed this information and concluded that the fees charged and services provided to the Fund were reasonable by comparison.
Collateral or “Fall-Out” Benefits Derived by the Advisor. The Board considered the existence of collateral benefits the Advisor may receive as a result of its relationship with the Fund. The Board concluded that the Advisor’s primary business is managing mutual funds and it generally does not use Fund or shareholder information to generate profits in other lines of business, and therefore does not derive any significant collateral benefits from them. The Board noted that the Advisor receives proprietary research from broker-dealers that execute Fund portfolio transactions and concluded that this research is likely to benefit Fund shareholders. The Board also determined that the Advisor is able to provide investment management services to certain clients other than the Fund, at least in part, due to its existing infrastructure built to serve the fund complex. The Board concluded, however, that the assets of those other clients are not material to the analysis and, in any event, are included with the assets of the Fund to determine breakpoints in the Fund’s fee schedule, provided they are managed using the same investment team and strategy.
Conclusion of the Board. As a result of this process, the Board, in the absence of particular circumstances and assisted by the advice of its independent legal counsel, taking into account all of the factors discussed above and the information provided by the Advisor and others, concluded that the Proposed Management Agreement be approved and recommended its approval to Fund shareholders.
40
Proxy Voting Guidelines
American Century Investment Management, Inc., the fund’s investment advisor, is responsible for exercising the voting rights associated with the securities purchased and/or held by the fund. A description of the policies and procedures the advisor uses in fulfilling this responsibility is available without charge, upon request, by calling 1-800-345-2021. It is also available on American Century Investments’ website at americancentury.com and on the Securities and Exchange Commission’s website at sec.gov. Information regarding how the investment advisor voted proxies relating to portfolio securities during the most recent 12-month period ended June 30 is available on the “About Us” page at americancentury.com. It is also available at sec.gov.
Quarterly Portfolio Disclosure
The fund files its complete schedule of portfolio holdings with the Securities and Exchange Commission (SEC) for the first and third quarters of each fiscal year on Form N-Q. The fund’s Forms N-Q are available on the SEC’s website at sec.gov, and may be reviewed and copied at the SEC’s Public Reference Room in Washington, DC. Information on the operation of the Public Reference Room may be obtained by calling 1-800-SEC-0330. The fund also makes its complete schedule of portfolio holdings for the most recent quarter of its fiscal year available on its website at americancentury.com and, upon request, by calling 1-800-345-2021.
41
The following indices are used to illustrate investment market, sector, or style performance or to serve as fund performance comparisons. They are not investment products available for purchase.
The Barclays Capital 5-Year General Obligation (GO) Bond Index is composed of investment-grade U.S. municipal securities, with maturities of four to six years, that are general obligations of a state or local government.
The Barclays Capital Long-Term Municipal Bond Index is composed of those securities included in the Barclays Capital Municipal Bond Index that have maturities greater than 22 years.
The Barclays Capital Municipal Bond Index is a market value-weighted index designed for the long-term tax-exempt bond market.
The Barclays Capital Non-Investment-Grade Municipal Bond Index is composed of non-investment grade U.S. municipal securities with a remaining maturity of one year or more.
The Barclays Capital U.S. Aggregate Index represents securities that are taxable, registered with the Securities and Exchange Commission, and U.S. dollar-denominated. The index covers the U.S. investment-grade fixed-rate bond market, with index components for government and corporate securities, mortgage pass-through securities, and asset-backed securities.
The Barclays Capital U.S. Treasury Index is composed of those securities included in the Barclays Capital U.S. Aggregate Index that are public obligations of the U.S. Treasury with a remaining maturity of one year or more.
42
43
44

| |
| |
| Contact Us | |
| americancentury.com | |
| Automated Information Line | 1-800-345-8765 |
| Investor Services Representative | 1-800-345-2021 or |
| | 816-531-5575 |
| Investors Using Advisors | 1-800-378-9878 |
| Business, Not-For-Profit, Employer-Sponsored | |
| Retirement Plans | 1-800-345-3533 |
| Banks and Trust Companies, Broker-Dealers, | |
| Financial Professionals, Insurance Companies | 1-800-345-6488 |
| Telecommunications Device for the Deaf | 1-800-634-4113 |
| American Century Municipal Trust | |
| Investment Advisor: | |
| American Century Investment Management, Inc. | |
| Kansas City, Missouri | |
This report and the statements it contains are submitted for the general
information of our shareholders. The report is not authorized for distribution to
prospective investors unless preceded or accompanied by an effective prospectus.
American Century Investment Services, Inc., Distributor
©2010 American Century Proprietary Holdings, Inc. All rights reserved.
1007
CL-ANN-68684
| | | |
| ITEM 2. CODE OF ETHICS. |
| (a) | | The registrant has adopted a Code of Ethics for Senior Financial Officers that applies to the |
| | | registrant’s principal executive officer, principal financial officer, principal accounting officer, |
| | | and persons performing similar functions. |
| | |
| (b) | | No response required. |
| | |
| (c) | | None. | |
| | | |
| (d) | | None. | |
| | | |
| (e) | | Not applicable. |
| | |
| (f) | | The registrant’s Code of Ethics for Senior Financial Officers was filed as Exhibit 12 (a)(1) to |
| | | American Century Asset Allocation Portfolios, Inc.’s Annual Certified Shareholder Report on |
| | | Form N-CSR, File No. 811-21591, on September 29, 2005, and is incorporated herein by |
| | | reference. | |
|
| ITEM 3. AUDIT COMMITTEE FINANCIAL EXPERT. |
| (a) | (1) | The registrant's board has determined that the registrant has at least one audit committee |
| | | financial expert serving on its audit committee. |
| | |
| (a) | (2) | Peter F. Pervere and Ronald J. Gilson are the registrant's designated audit committee financial |
| | | experts. They are "independent" as defined in Item 3 of Form N-CSR. |
| | |
| (a) | (3) | Not applicable. |
| | |
| (b) | | No response required. |
| | |
| (c) | | No response required. |
| | |
| (d) | | No response required. |
|
| ITEM 4. PRINCIPAL ACCOUNTANT FEES AND SERVICES. |
| (a) | | Audit Fees. | |
| |
| The aggregate fees billed for each of the last two fiscal years for professional services rendered by the |
| principal accountant for the audit of the registrant’s annual financial statements or services that are |
| normally provided by the accountant in connection with statutory and regulatory filings or engagements |
| for those fiscal years were as follows: |
| | | |
| | | FY 2009: | $109,709 |
| | | FY 2010: | $113,277 |
| | |
| (b) | | Audit-Related Fees. |
| | |
| The aggregate fees billed in each of the last two fiscal years for assurance and related services by the |
| principal accountant that are reasonably related to the performance of the audit of the registrant’s |
| financial statements and are not reported under paragraph (a) of this Item were as follows: |
| For services rendered to the registrant: |
| | | | |
| | FY 2009: | $0 |
| | FY 2010: | $0 |
| |
| | Fees required to be approved pursuant to paragraph (c)(7)(ii) of Rule 2-01 of Regulation S-X |
| | (relating to certain engagements for non-audit services with the registrant’s investment adviser |
| | and its affiliates): |
| |
| | FY 2009: | $0 |
| | FY 2010: | $0 |
| |
| (c) | Tax Fees. | | | |
| |
| The aggregate fees billed in each of the last two fiscal years for professional services rendered by the |
| principal accountant for tax compliance, tax advice, and tax planning were as follows: |
| |
| | For services rendered to the registrant: |
| |
| | FY 2009: | $26,200 |
| | FY 2010: | $7,700 |
| |
| | These services included assistance with communications and filings to the Internal Revenue |
| | Service for a change in accounting method. |
| |
| | Fees required to be approved pursuant to paragraph (c)(7)(ii) of Rule 2-01 of Regulation S-X |
| | (relating to certain engagements for non-audit services with the registrant’s investment adviser |
| | and its affiliates): |
| |
| | FY 2009: | $26,200 |
| | FY 2010: | $7,700 |
| |
| | These services included assistance with communications and filings to the Internal Revenue |
| | Service for a change in accounting method. |
| |
| (d) | All Other Fees. |
| |
| The aggregate fees billed in each of the last two fiscal years for products and services provided by the |
| principal accountant, other than the services reported in paragraphs (a) through (c) of this Item were as |
| follows: | | | | |
| |
| | For services rendered to the registrant: |
| |
| | FY 2009: | $0 |
| | FY 2010: | $0 |
| |
| | Fees required to be approved pursuant to paragraph (c)(7)(ii) of Rule 2-01 of Regulation S-X |
| | (relating to certain engagements for non-audit services with the registrant’s investment adviser |
| | and its affiliates): |
| |
| | FY 2009: | $0 |
| | FY 2010: | $0 |
| | | |
| (e) | (1) | In accordance with paragraph (c)(7)(i)(A) of Rule 2-01 of Regulation S-X, before the |
| | | accountant is engaged by the registrant to render audit or non-audit services, the engagement is |
| | | approved by the registrant’s audit committee. Pursuant to paragraph (c)(7)(ii) of Rule 2-01 of |
| | | Regulation S-X, the registrant’s audit committee also pre-approves its accountant’s |
| | | engagements for non-audit services with the registrant’s investment adviser, its parent company, |
| | | and any entity controlled by, or under common control with the investment adviser that |
| | | provides ongoing services to the registrant, if the engagement relates directly to the operations |
| | | and financial reporting of the registrant. |
| |
| (e) | (2) | All services described in each of paragraphs (b) through (d) of this Item were pre-approved |
| | | before the engagement by the registrant’s audit committee pursuant to paragraph (c)(7)(i)(A) of |
| | | Rule 2-01 of Regulation S-X. Consequently, none of such services were required to be |
| | | approved by the audit committee pursuant to paragraph (c)(7)(i)(C). |
| |
| (f) | | The percentage of hours expended on the principal accountant’s engagement to audit the |
| | | registrant’s financial statements for the most recent fiscal year that were attributed to work |
| | | performed by persons other than the principal accountant’s full-time, permanent employees was |
| | | less than 50%. | |
| |
| (g) | | The aggregate non-audit fees billed by the registrant’s accountant for services rendered to the |
| | | registrant, and rendered to the registrant’s investment adviser (not including any sub-adviser |
| | | whose role is primarily portfolio management and is subcontracted with or overseen by another |
| | | investment adviser), and any entity controlling, controlled by, or under common control with |
| | | the adviser that provides ongoing services to the registrant for each of the last two fiscal years |
| | | of the registrant were as follows: |
| |
| | | FY 2009: | $147,476 |
| | | FY 2010: | $191,177 |
| |
| (h) | | The registrant’s investment adviser and accountant have notified the registrant’s audit committee |
| | | of all non-audit services that were rendered by the registrant’s accountant to the registrant’s investment |
| | | adviser, its parent company, and any entity controlled by, or under common control with the investment |
| | | adviser that provides services to the registrant, which services were not required to be pre-approved |
| | | pursuant to paragraph (c)(7)(ii) of Rule 2-01 of Regulation S-X. The notification provided to the |
| | | registrant’s audit committee included sufficient details regarding such services to allow the registrant’s |
| | | audit committee to consider the continuing independence of its principal accountant. |
| |
| ITEM 5. AUDIT COMMITTEE OF LISTED REGISTRANTS. |
| |
| Not applicable. | |
| |
| ITEM 6. INVESTMENTS. |
| |
| (a) | | The schedule of investments is included as part of the report to stockholders filed under Item 1 |
| | | of this Form. | |
| |
| (b) | | Not applicable. |
| |
| ITEM 7. DISCLOSURE OF PROXY VOTING POLICIES AND PROCEDURES FOR |
| CLOSED-END MANAGEMENT INVESTMENT COMPANIES. |
| |
| Not applicable. | |
| | |
| ITEM 8. PORTFOLIO MANAGERS OF CLOSED-END MANAGEMENT |
| INVESTMENT COMPANIES. |
| |
| Not applicable. |
| |
| ITEM 9. PURCHASES OF EQUITY SECURITIES BY CLOSED-END MANAGEMENT |
| INVESTMENT COMPANY AND AFFILIATED PURCHASERS. |
| |
| Not applicable. |
| |
| ITEM 10. SUBMISSION OF MATTERS TO A VOTE OF SECURITY HOLDERS. |
| |
| During the reporting period, there were no material changes to the procedures by which shareholders may |
| recommend nominees to the registrant’s board. |
| |
| ITEM 11. CONTROLS AND PROCEDURES. |
| |
| (a) | | The registrant's principal executive officer and principal financial officer have concluded that |
| | | the registrant's disclosure controls and procedures (as defined in Rule 30a-3(c) under the |
| | | Investment Company Act of 1940) are effective based on their evaluation of these controls and |
| | | procedures as of a date within 90 days of the filing date of this report. |
| |
| (b) | | There were no changes in the registrant's internal control over financial reporting (as defined in |
| | | Rule 30a-3(d) under the Investment Company Act of 1940) that occurred during the registrant's |
| | | second fiscal quarter of the period covered by this report that have materially affected, or are |
| | | reasonably likely to materially affect, the registrant's internal control over financial reporting. |
| |
| ITEM 12. EXHIBITS. |
| |
| (a) | (1) | Registrant’s Code of Ethics for Senior Financial Officers, which is the subject of the disclosure |
| | | required by Item 2 of Form N-CSR, was filed as Exhibit 12(a)(1) to American Century Asset |
| | | Allocation Portfolios, Inc.’s Certified Shareholder Report on Form N-CSR, File No. 811-21591, |
| | | on September 29, 2005. |
| |
| (a) | (2) | Separate certifications by the registrant’s principal executive officer and principal financial |
| | | officer, pursuant to Section 302 of the Sarbanes-Oxley Act of 2002 and Rule 30a-2(a) under the |
| | | Investment Company Act of 1940, are filed and attached hereto as EX-99.CERT. |
| |
| (a) | (3) | Not applicable. |
| |
| (b) | | A certification by the registrant’s chief executive officer and chief financial officer, pursuant to |
| | | Section 906 of the Sarbanes-Oxley Act of 2002, is furnished and attached hereto as EX- |
| | | 99.906CERT. |
SIGNATURES
Pursuant to the requirements of the Securities Exchange Act of 1934 and the Investment Company Act of 1940, the registrant has duly caused this report to be signed on its behalf by the undersigned, thereunto duly authorized.
| | |
| Registrant: | American Century Municipal Trust |
| |
| By: | /s/ Jonathan S. Thomas |
| | Name: | Jonathan S. Thomas |
| | Title: | President |
| |
| Date: | July 30, 2010 |
Pursuant to the requirements of the Securities Exchange Act of 1934 and the Investment Company Act of 1940, this report has been signed below by the following persons on behalf of the registrant and in the capacities and on the dates indicated.
| | |
| By: | /s/ Jonathan S. Thomas |
| | Name: | Jonathan S. Thomas |
| | Title: | President |
| | | (principal executive officer) |
| |
| Date: | July 30, 2010 |
| | |
| By: | /s/ Robert J. Leach |
| | Name: | Robert J. Leach |
| | Title: | Vice President, Treasurer, and |
| | | Chief Financial Officer |
| | | (principal financial officer) |
| |
| Date: | July 30, 2010 |