UNITED STATES
SECURITIES AND EXCHANGE COMMISSION
Washington, D.C. 20549
FORM N-CSR
CERTIFIED SHAREHOLDER REPORT OF REGISTERED
MANAGEMENT INVESTMENT COMPANIES
| Investment Company Act file number | 811-04025 |
| | |
| | |
| | |
| AMERICAN CENTURY MUNICIPAL TRUST |
| (Exact name of registrant as specified in charter) |
| | |
| | |
| | |
| 4500 MAIN STREET, KANSAS CITY, MISSOURI | 64111 |
| (Address of principal executive offices) | (Zip Code) |
| | |
| | |
| | |
CHARLES A. ETHERINGTON 4500 MAIN STREET, KANSAS CITY, MISSOURI 64111 |
| (Name and address of agent for service) |
| | |
| | |
| Registrant’s telephone number, including area code: | 816-531-5575 |
| | |
| | |
| Date of fiscal year end: | 05-31 |
| | |
| | |
| Date of reporting period: | 05-31-2011 |
ITEM 1. REPORTS TO STOCKHOLDERS.
ANNUAL REPORT MAY 31, 2011
| | High-Yield Municipal Fund |
| President’s Letter | 2 |
| Market Perspective | 3 |
| Performance | 4 |
| Portfolio Commentary | 6 |
| Fund Characteristics | 8 |
| Shareholder Fee Example | 9 |
| Schedule of Investments | 11 |
| Statement of Assets and Liabilities | 18 |
| Statement of Operations | 19 |
| Statement of Changes in Net Assets | 20 |
| Notes to Financial Statements | 21 |
| Financial Highlights | 26 |
| Report of Independent Registered Public Accounting Firm | 31 |
| Proxy Voting Results | 32 |
| Management | 33 |
| Additional Information | 36 |
Any opinions expressed in this report reflect those of the author as of the date of the report, and do not necessarily represent the opinions of American Century Investments® or any other person in the American Century Investments organization. Any such opinions are subject to change at any time based upon market or other conditions and American Century Investments disclaims any responsibility to update such opinions. These opinions may not be relied upon as investment advice and, because investment decisions made by American Century Investments funds are based on numerous factors, may not be relied upon as an indication of trading intent on behalf of any American Century Investments fund. Security examples are used for representational purposes only and are not intended as recommendations to purchase or sell securities. Performance information for comparative indices and securities is provided to American Century Investments by third party vendors. To the best of American Century Investments’ knowledge, such information is accurate at the time of printing.
Jonathan Thomas
Dear Investor:
Thank you for reviewing this annual report for the period ended May 31, 2011. Our report offers investment performance and portfolio information, presented with the expert perspective and commentary of our portfolio management team.
This report remains one of our most important vehicles for conveying the information you need about your investment performance, and about the market factors and strategies that affect fund returns. For additional, updated information on fund performance, portfolio strategy, and the investment markets, we encourage you to visit our website, americancentury.com. Click on the “Fund Performance” and “Insights & News” headings at the top of our Individual Investors site.
Municipal Bond (Muni) Market Update
As described in greater detail on the following pages, muni market conditions have improved significantly since our semiannual report for the six months ended November 30, 2010. That reporting period concluded during a two-and-a-half month span (from the end of October 2010 to the middle of January 2011) when muni prices plunged and yields soared as a supply and demand imbalance (explained on page 3) roiled the market. That turbulence was compounded by overblown default fears fueled by highly publicized pessimistic analyst reports that helped trigger a wave of withdrawals from muni mutual funds.
As 2011 unfolded, muni issuance declined dramatically and demand surged—falling prices and relatively high yields attracted an influx of opportunistic “cross-over” (non-typical) buyers to the muni market. Munis rallied from mid-January through the end of the full 12-month reporting period, rewarding those who stayed the course and saw the turbulence as a buying opportunity. Muni defaults have not approached the rates projected by pessimistic pundits at the end of last year, and additional economic growth—as well as increased municipal government austerity and budget-balancing measures—have helped stabilize municipal credit conditions since then.
These developments over the more-recent six months are incorporated in the broader, enclosed 12-month Market Perspective and Portfolio Commentary from our muni portfolio management team. These dedicated experts will continue to diligently apply their knowledge and skills as they make daily investment decisions for you.
Sincerely,
Jonathan Thomas
President and Chief Executive Officer
American Century Investments
By David MacEwen, Chief Investment Officer, Fixed Income
Municipal bond (muni) indices advanced for the 12 months ended May 31, 2011 (see the table below), but these moderately positive returns masked considerable volatility, particularly during the last seven months of the period.
Munis rallied modestly through the first five months of the period as U.S. economic conditions generally improved, providing a lift to munis and other credit-sensitive instruments. But market conditions changed dramatically from November 2010 through January 2011 as a supply and demand imbalance triggered a sharp decline in the muni market. Supply rose substantially as muni issuers rushed to take advantage of the Build America Bonds (BABs) program (in which states and municipalities issue taxable securities with federally subsidized interest rates) before its expiration at the end of 2010. Meanwhile, demand cratered as credit concerns—sparked by persistent state budget deficits and exaggerated media predictions of widespread muni defaults—led to heavy outflows from muni mutual funds.
The muni market bottomed in mid-January and then rebounded during the remainder of the period as a number of opportunistic, non-traditional “cross-over” investors gravitated to relatively attractive muni yields. Limited new issuance also contributed favorably to muni market performance—new muni issuance in the first five months of 2011 fell by 51% compared with the same period in 2010, constrained by issuer austerity measures and the expiration of the BABs program, which accelerated into 2010 many new issues that would otherwise have come to market in early 2011.
However, the severe decline from November through January dropped munis to the lower end of the investment return spectrum in a 12-month period dominated by stocks and high-yield corporate bonds. In addition, munis generally trailed the returns of Treasury securities and the broad taxable bond market. Intermediate-term munis fared best as short-term munis were held in check by a stable interest rate policy from the Federal Reserve, while longer-term munis suffered disproportionately from muni fund outflows. From a credit and sector perspective, higher-quality munis outperformed lower-rated credits, while general obligation bonds outpaced tax revenue bonds. Within the revenue bond segment, essential services bonds posted the best results, while health care lagged.
| U.S. Fixed-Income Total Returns |
| For the 12 months ended May 31, 2011 |
| Barclays Capital Municipal Market Indices | | Barclays Capital U.S. Taxable Market Indices |
| 7 Year Municipal Bond | 5.22% | | Aggregate Bond | 5.84% |
| Municipal High Yield Bond | 4.04% | | Treasury Bond | 4.49% |
| Municipal Bond | 3.18% | | | |
| Long-Term Municipal Bond | 1.49% | | | |
| Total Returns as of May 31, 2011 |
| | | | Average Annual Returns | |
| | Ticker Symbol | 1 year | 5 years | 10 years | Since Inception | Inception Date |
| Investor Class | ABHYX | 1.76% | 1.16% | 4.07% | 4.15%(1) | 3/31/98 |
Barclays Capital Municipal Bond Index(2) | — | 3.18% | 4.78% | 5.02% | 5.08% | — |
Barclays Capital Long-Term Municipal Bond Index | — | 1.49% | 3.51% | 5.15% | 5.11% | — |
| Institutional Class | AYMIX | 1.97% | — | — | 4.11% | 3/1/10 |
A Class No sales charge* With sales charge* | AYMAX | 1.51% -3.11% | 0.91% -0.01% | — — | 2.98% 2.42% | 1/31/03 |
B Class No sales charge* With sales charge* | AYMBX | 0.75% -3.25% | 0.16% -0.04% | — — | 2.23% 2.23% | 1/31/03 |
| C Class | AYMCX | 0.75% | 0.13% | — | 2.40% | 7/24/02 |
*Sales charges include initial sales charges and contingent deferred sales charges (CDSCs), as applicable. A Class shares have a 4.50% maximum initial sales charge and may be subject to a maximum CDSC of 1.00%. B Class shares redeemed within six years of purchase are subject to a CDSC that declines from 5.00% during the first year after purchase to 0.00% the sixth year after purchase. C Class shares redeemed within 12 months of purchase are subject to a maximum CDSC of 1.00%. The SEC requires that mutual funds provide performance information net of maximum sales charges in all cases where charges could be applied.
| (1) | Returns would have been lower if a portion of the management fee had not been waived. |
| (2) | Effective August 1, 2010, the fund’s benchmark changed from Barclays Capital Long-Term Municipal Bond Index to Barclays Capital Municipal Bond Index. This change was effected to better align the benchmark’s duration with the fund’s duration. |
Data presented reflect past performance. Past performance is no guarantee of future results. Current performance may be higher or lower than the performance shown. Investment return and principal value will fluctuate, and redemption value may be more or less than original cost. To obtain performance data current to the most recent month end, please call 1-800-345-2021 or visit americancentury.com. As interest rates rise, bond values will decline. In addition, the lower-rated securities in which the fund invests are subject to greater credit risk, default risk and liquidity risk. Investment income may be subject to certain state and local taxes and, depending on your tax status, the federal alternative minimum tax (AMT). Capital gains are not exempt from state and federal income tax.
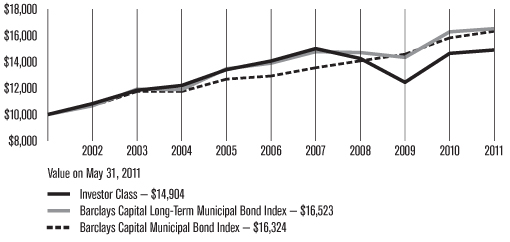
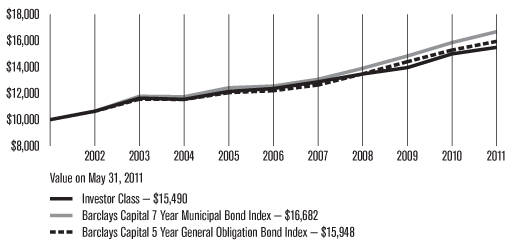
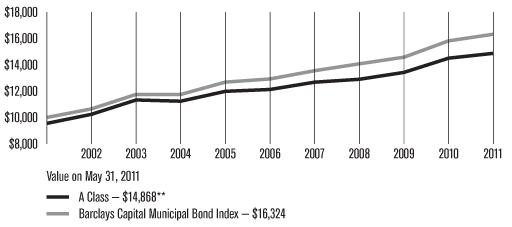
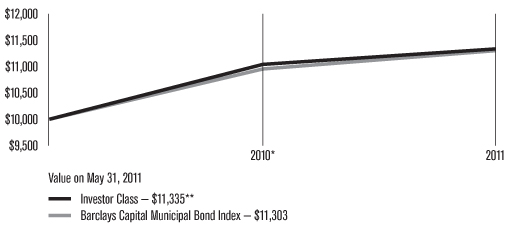
Unless otherwise indicated, performance reflects Investor Class shares; performance for other share classes will vary due to differences in fee structure. For information about other share classes available, please consult the prospectus. Data assumes reinvestment of dividends and capital gains, and none of the charts reflect the deduction of taxes that a shareholder would pay on fund distributions or the redemption of fund shares. Returns for the indices are provided for comparison. The fund’s total returns include operating expenses (such as transaction costs and management fees) that reduce returns, while the total returns of the indices do not.
| Growth of $10,000 Over 10 Years |
| $10,000 investment made May 31, 2001 |
| Total Annual Fund Operating Expenses |
| Investor Class | Institutional Class | A Class | B Class | C Class |
| 0.61% | 0.41% | 0.86% | 1.61% | 1.61% |
The total annual fund operating expenses shown is as stated in the fund’s prospectus current as of the date of this report. The prospectus may vary from the expense ratio shown elsewhere in this report because it is based on a different time period, includes acquired fund fees and expenses, and, if applicable, does not include fee waivers or expense reimbursements.
Data presented reflect past performance. Past performance is no guarantee of future results. Current performance may be higher or lower than the performance shown. Investment return and principal value will fluctuate, and redemption value may be more or less than original cost. To obtain performance data current to the most recent month end, please call 1-800-345-2021 or visit americancentury.com. As interest rates rise, bond values will decline. In addition, the lower-rated securities in which the fund invests are subject to greater credit risk, default risk and liquidity risk. Investment income may be subject to certain state and local taxes and, depending on your tax status, the federal alternative minimum tax (AMT). Capital gains are not exempt from state and federal income tax.
Unless otherwise indicated, performance reflects Investor Class shares; performance for other share classes will vary due to differences in fee structure. For information about other share classes available, please consult the prospectus. Data assumes reinvestment of dividends and capital gains, and none of the charts reflect the deduction of taxes that a shareholder would pay on fund distributions or the redemption of fund shares. Returns for the indices are provided for comparison. The fund’s total returns include operating expenses (such as transaction costs and management fees) that reduce returns, while the total returns of the indices do not.
Portfolio Manager: Steven Permut
Performance Summary
High-Yield Municipal returned 1.76%* for the fiscal year ended May 31, 2011. By comparison, the Barclays Capital Municipal Bond Index (representing investment-grade municipal bonds) returned 3.18%, while the Barclays Capital Municipal High Yield Bond Index (representing non-investment-grade municipal bonds) returned 4.04%**. In addition, the average return of the High-Yield Municipal Debt Funds tracked by Lipper Inc. was 1.62% for the 12-month period.*** (See page 4 and footnotes below for additional performance comparisons.)
The fund’s absolute return for the reporting period reflected the generally positive performance of municipal bond (muni) indices. The fund’s performance trailed the return of the broad, investment-grade Municipal Bond Index as lower-quality munis lagged investment-grade munis. However, the fund outpaced its Lipper peer group average.
Credit Environment
The improving economic environment over the past year led to gradual improvements in state and local tax receipts. In the first three months of 2011, state tax revenues were up more than 9% from the same period in 2010. Nonetheless, many state and local governments continue to wrestle with daunting budget deficits—holdovers from the Great Recession that have been exacerbated by lingering weakness in the labor and housing markets, as well as increasing pension and health care funding pressures. We saw credit rating downgrades across the spectrum of muni issuers, but despite dire warnings of widespread defaults, the few actual defaults were confined to smaller issuers, and the muni default rate remained at a fraction of the corporate bond default rate.
Governments at all levels are taking steps to close their budget gaps through a combination of austerity measures, reserve fund utilization, and tax increases, and we are seeing signs of progress. For example, the state of New York approved a balanced budget early for the first time since 1983, erasing a $10 billion shortfall. One added challenge for fiscal 2012 budgets is the loss of federal aid that states have received over the past several years. But we still believe that the worst of the difficulties are behind us.
Portfolio Positioning
The fund’s outperformance of its peer group average was driven in part by a greater emphasis on higher-quality securities, as the fund tends to be more conservatively positioned than many of its peers. This approach paid off during the reporting period as higher-rated securities outperformed, especially during the market volatility in late 2010 and early 2011. It was during this period that the fund generated the bulk of its outperformance versus the peer group average.
| * | All fund returns referenced in this commentary are for Investor Class shares. |
| ** | The Barclays Capital Municipal High Yield Bond Index’s average returns were 2.32% and 4.99% for the five- and ten-year periods ended May 31, 2011, respectively. |
| *** | The average returns for Lipper High-Yield Municipal Debt Funds category were 1.30% and 3.69% for the five- and ten-year periods ended May 31, 2011, respectively. Data provided by Lipper Inc. — A Reuters Company. © 2011 Reuters. All rights reserved. Any copying, republication or redistribution of Lipper content, including by caching, framing or similar means, is expressly prohibited without the prior written consent of Lipper. Lipper shall not be liable for any errors or delays in the content, or for any actions taken in reliance thereon. Lipper fund performance data is total return, and is preliminary and subject to revision. The data contained herein has been obtained from company reports, financial reporting services, periodicals and other resources believed to be reliable. Although carefully verified, data on compilations is not guaranteed by Lipper and may be incomplete. No offer or solicitations to buy or sell any of the securities herein is being made by Lipper. |
From a sector perspective, the largest weighting in the portfolio was land-secured bonds, which typically finance property development projects. These securities had been under pressure from the generally weak environment for real estate, but we began to see some improvements during the reporting period, especially in states that were especially hard hit by the downturn in residential and commercial real estate.
The fund also had a meaningful position in health care munis, particularly hospital-related bonds. These securities underperformed during the period as non-traditional cross-over buyers shunned unfamiliar credits in favor of larger, more liquid segments of the muni market.
Among the fund’s higher-quality holdings, we focused on essential services revenue bonds, which typically finance services such as water, sewer, and other utilities. Essential services bonds were popular among cross-over investors, and as a result they outperformed for the 12 months.
Since late 2009, the fund has been positioned for a flatter Treasury yield curve (a narrower gap between short- and long-term Treasury yields). However, this positioning weighed on performance over the past year as the Treasury yield curve grew steeper, and it remains near historically wide levels. We are confident that this positioning will pay off over time as the Treasury curve eventually reverts to more normal levels.
Outlook
As we look to the second half of 2011, we believe that the supply and demand imbalances that have impacted the muni market over the last seven months will gradually abate, and fundamental credit stories will have a greater impact on muni performance going forward. We also believe that muni defaults will remain well below the levels predicted by some analysts at the end of last year.
As a result, we intend to maintain our current positioning, which strikes a balance between lower-quality, higher-yielding securities such as land-secured and hospital bonds, and higher-quality securities such as essential services bonds.
| MAY 31, 2011 |
| Portfolio at a Glance | |
| Weighted Average Maturity | 19.7 years |
| Average Duration (Modified) | 7.9 years |
| | |
| 30-Day SEC Yields | |
| Investor Class | 5.69% |
| Institutional Class | 5.89% |
| A Class | 5.19% |
| B Class | 4.69% |
| C Class | 4.69% |
Investor Class 30-Day Tax Equivalent Yields(1) |
| 25.00% Tax Bracket | 7.59% |
| 28.00% Tax Bracket | 7.90% |
| 33.00% Tax Bracket | 8.49% |
| 35.00% Tax Bracket | 8.75% |
(1)The tax brackets indicated are for federal taxes only. Actual tax-equivalent yields may be lower, if alternative minimum tax is applicable. |
| | |
| Top Five States & Territories | % of net assets |
| Illinois | 9.2% |
| Florida | 8.2% |
| California | 8.2% |
| Colorado | 7.9% |
| Texas | 7.4% |
| | |
| Top Five Sectors | % of fund investments |
| Land Based | 22% |
| Hospital Revenue | 14% |
| Electric Revenue | 9% |
| Industrial Development/Pollution Control Revenue | 9% |
| Project Finance Revenue | 7% |
| | |
| Types of Investments in Portfolio | % of net assets |
| Municipal Securities | 99.5% |
| Other Assets and Liabilities | 0.5% |
Fund shareholders may incur two types of costs: (1) transaction costs, including sales charges (loads) on purchase payments and redemption/exchange fees; and (2) ongoing costs, including management fees; distribution and service (12b-1) fees; and other fund expenses. This example is intended to help you understand your ongoing costs (in dollars) of investing in your fund and to compare these costs with the ongoing cost of investing in other mutual funds.
The example is based on an investment of $1,000 made at the beginning of the period and held for the entire period from December 1, 2010 to May 31, 2011.
Actual Expenses
The table provides information about actual account values and actual expenses for each class. You may use the information, together with the amount you invested, to estimate the expenses that you paid over the period. First, identify the share class you own. Then simply divide your account value by $1,000 (for example, an $8,600 account value divided by $1,000 = 8.6), then multiply the result by the number under the heading “Expenses Paid During Period” to estimate the expenses you paid on your account during this period.
If you hold Investor Class shares of any American Century Investments fund, or Institutional Class shares of the American Century Diversified Bond Fund, in an American Century Investments account (i.e., not a financial intermediary or retirement plan account), American Century Investments may charge you a $12.50 semiannual account maintenance fee if the value of those shares is less than $10,000. We will redeem shares automatically in one of your accounts to pay the $12.50 fee. In determining your total eligible investment amount, we will include your investments in all personal accounts (including American Century Investments Brokerage accounts) registered under your Social Security number. Personal accounts include individual accounts, joint accounts, UGMA/UTMA accounts, personal trusts, Coverdell Education Savings Accounts and IRAs (including traditional, Roth, Rollover, SEP-, SARSEP- and SIMPLE-IRAs), and certain other retirement accounts. If you have only business, business retirement, employer-sponsored or American Century Investments Brokerage accounts, you are currently not subject to this fee. We will not charge the fee as long as you choose to manage your accounts exclusively online. If you are subject to the Account Maintenance Fee, your account value could be reduced by the fee amount.
Hypothetical Example for Comparison Purposes
The table also provides information about hypothetical account values and hypothetical expenses based on the actual expense ratio of each class of your fund and an assumed rate of return of 5% per year before expenses, which is not the actual return of a fund’s share class. The hypothetical account values and expenses may not be used to estimate the actual ending account balance or expenses you paid for the period. You may use this information to compare the ongoing costs of investing in your fund and other funds. To do so, compare this 5% hypothetical example with the 5% hypothetical examples that appear in the shareholder reports of the other funds.
Please note that the expenses shown in the table are meant to highlight your ongoing costs only and do not reflect any transactional costs, such as sales charges (loads) or redemption/exchange fees. Therefore, the table is useful in comparing ongoing costs only, and will not help you determine the relative total costs of owning different funds. In addition, if these transactional costs were included, your costs would have been higher.
| | Beginning Account Value 12/1/10 | Ending Account Value 5/31/11 | Expenses Paid During Period* 12/1/10 - 5/31/11 | Annualized Expense Ratio* |
| Actual |
| Investor Class | $1,000 | $1,010.10 | $3.06 | 0.61% |
| Institutional Class | $1,000 | $1,011.10 | $2.06 | 0.41% |
| A Class | $1,000 | $1,008.80 | $4.31 | 0.86% |
| B Class | $1,000 | $1,005.10 | $8.05 | 1.61% |
| C Class | $1,000 | $1,003.90 | $8.04 | 1.61% |
| Hypothetical |
| Investor Class | $1,000 | $1,021.89 | $3.07 | 0.61% |
| Institutional Class | $1,000 | $1,022.89 | $2.07 | 0.41% |
| A Class | $1,000 | $1,020.64 | $4.33 | 0.86% |
| B Class | $1,000 | $1,016.90 | $8.10 | 1.61% |
| C Class | $1,000 | $1,016.90 | $8.10 | 1.61% |
| * | Expenses are equal to the class’s annualized expense ratio listed in the table above, multiplied by the average account value over the period, multiplied by 182, the number of days in the most recent fiscal half-year, divided by 365, to reflect the one-half year period. |
| | | |
| | Principal Amount | Value |
| Municipal Securities — 99.5% |
| ALABAMA — 1.7% |
Courtland Industrial Development Board Environmental Improvement Rev., Series 2003 B, (International Paper Co.), 6.25%, 8/1/25(1) | $2,500,000 | $2,530,700 |
Selma Industrial Development Board Gulf Opportunity Zone Rev., Series 2010 A, (International Paper Co.), 5.80%, 5/1/34(1) | 1,500,000 | 1,505,085 |
| | | 4,035,785 |
| ARIZONA — 4.1% |
Mohave County Industrial Development Auth. Correctional Facilities Contract Rev., (Mohave Prison, LLC Expansion), 8.00%, 5/1/25(1) | 500,000 | 550,315 |
Pronghorn Ranch Community Facilities District GO, 6.40%, 7/15/29(1) | 3,015,000 | 2,672,617 |
Quailwood Meadows Community Facilities District GO, 6.00%, 7/15/22(2) | 1,120,000 | 1,029,459 |
Quailwood Meadows Community Facilities District GO, 6.125%, 7/15/29(2) | 2,000,000 | 1,719,100 |
Salt River Agricultural Improvement & Power District Rev., Series 2009 A, (Electric System Distribution), 5.00%, 1/1/39(1) | 2,000,000 | 2,062,920 |
Sundance Community Facilities District GO, 6.25%, 7/15/14, Prerefunded at 100% of Par(2)(3) | 395,000 | 460,381 |
Sundance Community Facilities District No. 2 Special Assessment Rev., 7.125%, 7/1/27(2) | 765,000 | 724,210 |
| Sundance Community Facilities District No. 3 Special Assessment Rev., 6.50%, 7/1/29 | 495,000 | 432,704 |
| | | 9,651,706 |
| CALIFORNIA — 8.2% |
| California Educational Facilities Auth. Rev., Series 2008 B, (Chapman University), VRDN, 0.15%, 6/1/11 (LOC: Bank of America N.A.) | 900,000 | 900,000 |
California Health Facilities Financing Auth. Rev., Series 2009 A, (Children’s Hospital of Orange County), 6.50%, 11/1/38(1) | 2,000,000 | 2,086,660 |
California Mobilehome Park Financing Auth. Rev., Series 2003 B, (Palomar Estates E&W), 7.00%, 9/15/36(1) | 2,000,000 | 1,967,140 |
California Municipal Finance Auth. Rev., (Community Hospital of Central California), 5.50%, 2/1/39(1) | 1,450,000 | 1,236,749 |
| California Statewide Communities Development Auth. Rev., (Lancer Educational Student Housing), 7.50%, 6/1/42 | 2,000,000 | 2,062,940 |
Golden State Tobacco Securitization Corp. Settlement Rev., Series 2007 A1, 5.75%, 6/1/47(1) | 2,075,000 | 1,430,505 |
Independent Cities Finance Auth. Mobilehome Park Rev., Series 2010 A, (Lamplighter Salinas), 6.15%, 7/15/40(1) | 4,000,000 | 3,827,720 |
Morongo Band of Mission Indians Rev., Series 2008 B, (Enterprise Casino Services), 6.50%, 3/1/28(1)(2) | 1,000,000 | 940,220 |
| Palm Springs Airport Passenger Facility Charge Rev., (Palm Springs International Airport), 6.40%, 7/1/23 | 250,000 | 230,612 |
| Palm Springs Airport Passenger Facility Charge Rev., (Palm Springs International Airport), 6.50%, 7/1/27 | 260,000 | 237,502 |
San Francisco City and County Redevelopment Financing Auth. Tax Allocation Rev., Series 2009 D, (Mission Bay South Redevelopment), 6.625%, 8/1/39(1) | 250,000 | 248,360 |
| Soledad Improvement Bond Act of 1915 District No. 2002-01 Special Assessment Rev., (Diamond Ridge), 6.75%, 9/2/33 | $1,000,000 | $999,860 |
| Sunnyvale Community Facilities District No. 1 Special Tax Rev., 7.75%, 8/1/32 | 1,500,000 | 1,475,280 |
Vallejo Multifamily Housing Rev., Series 1998 B, (Solano Affordable Housing), 8.25%, 4/1/39(2) | 1,540,000 | 1,563,685 |
Victorville Joint Powers Financing Auth. Lease Rev., Series 2007 A, (Cogeneration Facility), VRDN, 1.50%, 6/2/11 (LOC: BNP Paribas)(1) | 200,000 | 200,000 |
| | | 19,407,233 |
| COLORADO — 7.9% |
Arkansas River Power Auth. Rev., 5.00%, 10/1/20(1) | 1,815,000 | 1,881,048 |
| Colorado Educational & Cultural Facilities Auth. Rev., Series 2007 A10, (Jewish Federation), VRDN, 0.14%, 6/1/11 (LOC: Bank of America N.A.) | 1,000,000 | 1,000,000 |
| Colorado Health Facilities Auth. Rev., Series 2010 A, (Total Longterm Care), 6.00%, 11/15/30 | 500,000 | 488,770 |
Colorado Springs Hospital Rev., (Memorial Health System), 6.25%, 12/15/33(1) | 2,000,000 | 2,106,640 |
Denver Health & Hospital Auth. Healthcare Rev., Series 2009 A, 6.25%, 12/1/33(1) | 3,645,000 | 3,661,657 |
| Granby Ranch Metropolitan District GO, 6.75%, 12/1/36 | 3,000,000 | 2,686,830 |
One Horse Business Improvement District Rev., (Sales Tax Sharing), 6.00%, 6/1/24(1) | 3,000,000 | 2,625,870 |
| Plaza Metropolitan District No. 1 Tax Increment Allocation Rev., (Public Improvement Fee), 8.00%, 12/1/25 | 1,500,000 | 1,496,445 |
| Regional Transportation District Private Activity Rev., (Denver Transit Partners), 6.00%, 1/15/41 | 1,000,000 | 1,002,700 |
Todd Creek Farms Metropolitan District No. 1 Rev., 5.60%, 12/1/14(4) | 1,800,000 | 895,860 |
Todd Creek Farms Metropolitan District No. 1 Rev., 6.125%, 12/1/19(4) | 1,500,000 | 746,685 |
| | | 18,592,505 |
| CONNECTICUT — 1.3% |
| Connecticut Development Auth. Industrial Rev., (AFCO Cargo Buildings LLC), 8.00%, 4/1/30 | 1,000,000 | 662,390 |
| Connecticut Health & Educational Facilities Auth. Rev., Series 2008 B, VRDN, 0.15%, 6/1/11 (LOC: Bank of America N.A.) | 2,500,000 | 2,500,000 |
| | | 3,162,390 |
| DELAWARE — 0.7% |
Delaware State Economic Development Auth. Gas Facilities Rev., (Delmarva Power & Light Co.), 5.40%, 2/1/31(1) | 1,500,000 | 1,527,015 |
| FLORIDA — 8.2% |
Brevard County Industrial Development Rev., (TUFF Florida Institute of Technology), 6.75%, 11/1/39(1) | 3,000,000 | 2,949,540 |
| Capital Trust Agency Rev., Series 2010 A, (Air Cargo-aero Miami), 5.35%, 7/1/29 | 2,500,000 | 2,347,200 |
| Dupree Lakes Community Development District Special Assessment Rev., 6.83%, 11/1/15 | 1,970,000 | 1,906,310 |
| Florida Development Finance Corp. Educational Facilities Rev., Series 2010 A, (Renaissance Charter School), 6.00%, 9/15/30 | 1,390,000 | 1,258,881 |
Hillsborough County Industrial Development Health Facilities Auth. Rev., Series 2008 B, (University Community Hospital), 8.00%, 8/15/19, Prerefunded at 101% of Par(1)(3) | 1,500,000 | 2,098,710 |
Miami-Dade County Health Facilities Auth. Rev., Series 2008 A2, (Miami Children’s Hospital), VRDN, 4.55%, 8/1/13 (NATL)(1) | 2,000,000 | 2,092,360 |
Mid-Bay Bridge Auth. Springing Lien Rev., Series 2011 A, 7.25%, 10/1/40(1) | $2,000,000 | $2,026,680 |
Putnam County Development Auth. Pollution Control Rev., Series 2007 B, (Seminole Electric Cooperative, Inc.), VRDN, 5.35%, 5/1/18 (Ambac)(1) | 1,500,000 | 1,616,460 |
| South Lake County Hospital District Rev., Series 2010 A, (South Lake Hospital), 6.25%, 4/1/39 | 1,000,000 | 992,070 |
| South-Dade Venture Community Development District Special Assessment Rev., 6.125%, 5/1/34 | 1,245,000 | 1,164,424 |
| Village Community Development District No. 8 Special Assessment Rev., 6.125%, 5/1/39 | 1,000,000 | 974,510 |
| | | 19,427,145 |
| GEORGIA — 5.6% |
Appling County Development Auth. Pollution Control Rev., (Georgia Power Co. Plant Hatch), VRDN, 0.19%, 6/1/11(1) | 2,000,000 | 2,000,000 |
Atlanta Water & Wastewater Rev., Series 2009 A, 6.25%, 11/1/39(1) | 3,000,000 | 3,198,690 |
| De Kalb County Hospital Antic Auth. Rev., (De Kalb Medical Center, Inc.), 6.125%, 9/1/40 | 800,000 | 753,896 |
Georgia Municipal Electric Auth. Rev., Series 2008 D, (General Resolution), 6.00%, 1/1/23(1) | 3,000,000 | 3,397,440 |
Marietta Development Auth. Rev., (Life University, Inc.), 7.00%, 6/15/39(1) | 4,000,000 | 3,839,080 |
| | | 13,189,106 |
| GUAM — 1.8% |
Guam Government Department of Education COP., Series 2010 A, (John F. Kennedy High School), 6.625%, 12/1/30(1) | 1,000,000 | 953,500 |
Guam Government GO, Series 2009 A, 7.00%, 11/15/39(1) | 1,700,000 | 1,754,774 |
Guam Government Waterworks Auth. Rev., 6.00%, 7/1/25(1) | 1,500,000 | 1,442,070 |
| | | 4,150,344 |
| HAWAII — 0.7% |
| Hawaii State Department of Budget & Finance Rev., Series 2009 A, (15 Craigside), 9.00%, 11/15/44 | 1,500,000 | 1,640,895 |
| ILLINOIS — 9.2% |
| Bedford Park Tax Allocation Rev., 5.125%, 12/30/18 | 1,325,000 | 1,216,085 |
Chicago Tax Increment Allocation Rev., Series 2004 B, (Pilsen Redevelopment), (Junior Lien), 6.75%, 6/1/22(1) | 3,000,000 | 3,021,780 |
Hampshire Special Service Area No. 13 Special Tax Rev., (Tuscany Woods), 5.75%, 3/1/37(4) | 4,966,000 | 2,650,305 |
Illinois Finance Auth. Rev., (Navistar International Recovery Zone Facility), 6.50%, 10/15/40(1) | 1,500,000 | 1,542,210 |
Illinois Finance Auth. Rev., Series 2009 A, (Rush University Medical Center Obligation Group), 7.25%, 11/1/30(1) | 1,500,000 | 1,647,480 |
| Pingree Grove Special Service Area No. 7 Special Tax Rev., Series 2006-1, (Cambridge Lakes), 6.00%, 3/1/36 | 3,320,000 | 2,872,564 |
Railsplitter Tobacco Settlement Auth. Rev., 6.00%, 6/1/28(1) | 1,000,000 | 1,005,970 |
| Volo Village Special Service Area No. 3 Special Tax Rev., Series 2006-1, (Symphony Meadows), 6.00%, 3/1/36 | 3,300,000 | 2,566,707 |
| Yorkville Special Service Area No. 2005-109 Special Tax Rev., Series 2006-105, (Bristol Bay I), 5.875%, 3/1/36 | 5,885,000 | 5,073,870 |
| | | 21,596,971 |
| INDIANA — 0.9% |
Indiana Finance Auth. Rev., (United States Steel Corp.), 6.00%, 12/1/26(1) | 1,250,000 | 1,251,637 |
Indiana Finance Auth. Rev., Series 2009 A, (Drexel Foundation Educational Facility), 7.00%, 10/1/39(1) | 1,000,000 | 978,190 |
| | | 2,229,827 |
| LOUISIANA — 0.7% |
New Orleans Aviation Board Rev., Series 2009 A, (Consolidated Rental Car), 6.50%, 1/1/40(1) | $1,500,000 | $1,530,885 |
| MARYLAND — 3.7% |
| Anne Arundel County Special Obligation Tax Allocation Rev., (National Business Park), 6.10%, 7/1/40 | 1,000,000 | 945,480 |
| Baltimore Special Obligation Tax Allocation Rev., Series 2008 A, (Resh Park), 7.00%, 9/1/38 | 5,000,000 | 4,933,400 |
Maryland Economic Development Corp. Facilities Rev., (CNX Marine Terminals, Inc.), 5.75%, 9/1/25(1) | 1,000,000 | 977,290 |
| Maryland Economic Development Corp. Rev., Series 2010 A, (Transportation Facilities), 5.75%, 6/1/35 | 1,000,000 | 974,490 |
| Maryland Industrial Development Financing Auth. Rev., Series 2005 A, (Our Lady of Good Counsel High School), 6.00%, 5/1/35 | 1,000,000 | 957,180 |
| | | 8,787,840 |
| MASSACHUSETTS — 0.4% |
Massachusetts Water Resources Auth. Rev., Series 2011 B, 5.00%, 8/1/41(1) | 1,000,000 | 1,038,300 |
| MICHIGAN — 1.5% |
| Flint Hospital Building Auth. Rev., (Hurley Medical Center), 7.50%, 7/1/39 | 1,250,000 | 1,261,325 |
Lansing Board Water & Light Utility System Rev., Series 2011 A, 5.00%, 7/1/37(5) | 1,340,000 | 1,337,038 |
Wayne County GO, Series 2009 A, (Building Improvement), 6.75%, 11/1/39(1) | 990,000 | 1,020,621 |
| | | 3,618,984 |
| MISSOURI — 1.6% |
| 370/Missouri Bottom Road/Taussig Road Transportation Development District Rev., 7.20%, 5/1/33 | 860,000 | 799,172 |
| Kirkwood Industrial Development Auth. Rev., Series 2010 A, (Aberdeen Heights), 8.25%, 5/15/45 | 3,000,000 | 3,058,620 |
| | | 3,857,792 |
| NEBRASKA — 1.3% |
Santee Sioux Nation Tribal Health Care Rev., (Indian Health Service Joint Venture), 8.75%, 10/1/20(2) | 3,000,000 | 3,020,010 |
| NEVADA — 2.6% |
| Henderson Local Improvement District No. T-15 Special Assessment Rev., 6.10%, 3/1/24 | 1,320,000 | 1,192,858 |
Henderson Redevelopment Agency Tax Allocation Rev., Series 2002 B, 7.10%, 10/1/22(1) | 1,105,000 | 1,095,033 |
Henderson Redevelopment Agency Tax Allocation Rev., Series 2002 B, 7.20%, 10/1/25(1) | 350,000 | 341,659 |
Las Vegas Improvement District No. 607 Special Assessment Rev., 5.50%, 6/1/13(1) | 1,215,000 | 1,222,983 |
| Las Vegas Improvement District No. 808 & 810 Special Assessment Rev., Series 2007 23B, (Summerlin Village), 6.125%, 6/1/31 | 2,000,000 | 1,635,720 |
| Reno District No. 4 Special Assessment Rev., (Somersett Parkway), 5.45%, 12/1/11 | 650,000 | 652,444 |
| | | 6,140,697 |
| NEW JERSEY — 2.5% |
| New Jersey Economic Development Auth. Rev., Series 2006 B, (Gloucester Marine Terminal), 6.875%, 1/1/37 | 3,000,000 | 2,661,120 |
New Jersey Economic Development Auth. Rev., Series 2006 C, (Gloucester Marine Terminal), 6.50%, 1/1/15(2) | 2,000,000 | 1,939,820 |
| New Jersey Educational Facilities Auth. Rev., Series 2009 B, (University of Medicine & Dentistry), 7.50%, 12/1/32 | 1,200,000 | 1,349,940 |
| | | 5,950,880 |
| NEW MEXICO — 1.4% |
| Cabezon Public Improvement District Special Tax Rev., 6.30%, 9/1/34 | $1,490,000 | $1,258,588 |
| Montecito Estates Public Improvement District Levy Special Tax Rev., (City of Albuquerque), 7.00%, 10/1/37 | 1,185,000 | 1,017,666 |
Ventana West Public Improvement District Levy Special Tax Rev., 6.875%, 8/1/33(1) | 1,000,000 | 920,720 |
| | | 3,196,974 |
| NEW YORK — 3.5% |
Brooklyn Arena Local Development Corp. Rev., (Barclays Center), 6.25%, 7/15/40(1) | 800,000 | 804,960 |
New York City Transitional Finance Auth. Rev., Series 2011 E, (Future Tax Secured Bonds), 5.00%, 11/1/18(1) | 2,000,000 | 2,359,660 |
New York State Dormitory Auth. Rev., (Orange Regional Medical Center), 6.25%, 12/1/37(1) | 2,250,000 | 2,102,850 |
Onondaga County Industrial Development Agency Rev., (Air Cargo), 7.25%, 1/1/32(1) | 1,000,000 | 915,430 |
Port Auth. of New York & New Jersey Special Obligation Rev., (John F. Kennedy International Airport Terminal), 6.00%, 12/1/36(1) | 2,000,000 | 2,013,240 |
| | | 8,196,140 |
| NORTH CAROLINA — 5.1% |
North Carolina Eastern Municipal Power Agency Rev., Series 2009 A, 5.50%, 1/1/26(1) | 2,000,000 | 2,137,820 |
North Carolina Municipal Power Agency No. 1 Catawba Electric Rev., Series 2008 A, 5.25%, 1/1/16(1) | 4,645,000 | 5,332,553 |
North Carolina Municipal Power Agency No. 1 Catawba Electric Rev., Series 2008 A, 5.25%, 1/1/17(1) | 4,000,000 | 4,627,360 |
| | | 12,097,733 |
| OHIO — 2.1% |
Alliance Community Hospital Rev., (Alliance Obligated Group), VRDN, 0.15%, 6/1/11 (Radian) (LOC: JPMorgan Chase Bank N.A.)(1) | 1,600,000 | 1,600,000 |
| Ohio Higher Educational Facility Commission Rev., (Ashland University), 6.25%, 9/1/24 | 1,925,000 | 1,926,097 |
Pinnacle Community Infrastructure Financing Facilities Auth. Rev., Series 2004 A, 6.25%, 12/1/36(1) | 1,800,000 | 1,386,630 |
| | | 4,912,727 |
| OKLAHOMA — 1.3% |
Oklahoma City Industrial & Cultural Facilities Trust Rev., 6.75%, 1/1/23(1) | 750,000 | 677,520 |
| Tulsa County Industrial Auth. Senior Living Community Rev., Series 2010 A, (Montereau, Inc.), 7.25%, 11/1/40 | 2,500,000 | 2,493,750 |
| | | 3,171,270 |
| OREGON — 2.2% |
Forest Grove Student Housing Rev., (Oak Tree Foundation), 5.50%, 3/1/37(2) | 1,400,000 | 1,256,430 |
Oregon GO, Series 2011 J, 5.00%, 5/1/36(1) | 2,500,000 | 2,622,475 |
Oregon Health & Science University Rev., Series 2009 A, 5.75%, 7/1/39(1) | 1,300,000 | 1,362,361 |
| | | 5,241,266 |
| PENNSYLVANIA — 3.7% |
Allegheny County Industrial Development Auth. Rev., (Environmental Improvements), 6.75%, 11/1/24(1) | 1,000,000 | 1,068,400 |
Allegheny County Industrial Development Auth. Rev., (Environmental Improvements), 6.875%, 5/1/30(1) | 1,000,000 | 1,043,810 |
| Allegheny County Redevelopment Auth. Tax Allocation Rev., (Pittsburgh Mills), 5.60%, 7/1/23 | 1,500,000 | 1,365,855 |
| Pennsylvania Economic Development Financing Auth. Rev., Series 2009 A, (Albert Einstein Healthcare Network), 6.25%, 10/15/23 | $2,000,000 | $2,100,920 |
Philadelphia Gas Works Rev., Series 2009 A, (1998 General Ordinance), 5.00%, 8/1/16(1) | 1,440,000 | 1,573,373 |
Philadelphia Municipal Auth. Lease Rev., 6.50%, 4/1/39(1) | 1,500,000 | 1,561,185 |
| | | 8,713,543 |
| PUERTO RICO — 0.6% |
Puerto Rico GO, Series 2008 A, 6.00%, 7/1/38(1) | 1,500,000 | 1,513,665 |
| SOUTH CAROLINA — 0.6% |
South Carolina Jobs-Economic Development Auth. Hospital Rev., (Palmetto Health), 5.75%, 8/1/39(1) | 1,475,000 | 1,372,178 |
| TEXAS — 7.4% |
La Vernia Higher Education Finance Corp. Rev., Series 2009 A, (Kipp, Inc.), 6.25%, 8/15/39(1) | 1,000,000 | 1,006,890 |
Love Field Airport Modernization Corp. Special Tax Facilities Rev., (Southwest Airlines Co.), 5.25%, 11/1/40(1) | 2,500,000 | 2,261,050 |
North Texas Thruway Auth. Rev., Series 2008 H, (First Tier), VRDN, 5.00%, 1/1/13(1) | 5,300,000 | 5,576,713 |
| Tarrant County Cultural Education Facilities Finance Corp. Rev., (Air Force Village), 6.375%, 11/15/44 | 2,500,000 | 2,470,925 |
| Texas Private Activity Bond Surface Transportation Corp. Rev., (Senior Lien/LBJ Infrastructure), 7.00%, 6/30/40 | 3,000,000 | 3,190,260 |
Texas Public Finance Auth. Charter School Finance Corp. Rev., Series 2010 A, (Cosmos Foundation, Inc.), 6.20%, 2/15/40(1) | 1,500,000 | 1,428,555 |
| Travis County Health Facilities Development Corp. Rev., (Westminster Manor Health), 7.125%, 11/1/40 | 1,500,000 | 1,480,785 |
| | | 17,415,178 |
| U.S. VIRGIN ISLANDS — 1.5% |
| Virgin Islands Public Finance Auth. Rev., Series 2009 A, (Diageo Matching Fund Bonds), 6.75%, 10/1/37 | 2,000,000 | 2,096,220 |
Virgin Islands Public Finance Auth. Rev., Series 2010 B, (Subordinated Lien), 5.25%, 10/1/29(1) | 1,500,000 | 1,420,455 |
| | | 3,516,675 |
| VIRGINIA — 2.3% |
Fairfax County Economic Development Auth. Rev., (Silver Line Phase I), 5.00%, 4/1/36(1) | 570,000 | 590,338 |
Mosaic Community Development Auth. Tax Allocation Rev., Series 2011 A, 6.875%, 3/1/36(5) | 1,000,000 | 1,004,430 |
| Peninsula Town Center Community Development Auth. Rev., 6.45%, 9/1/37 | 3,000,000 | 2,742,450 |
Washington County Industrial Development Auth. Hospital Facility Rev., Series 2009 C, (Mountain States Health Alliance), 7.75%, 7/1/38(1) | 1,000,000 | 1,116,910 |
| | | 5,454,128 |
| WASHINGTON — 0.1% |
Port of Seattle Rev., Series 2000 B, 6.00%, 2/1/15 (NATL)(1) | 250,000 | 282,085 |
| WISCONSIN — 2.2% |
Wisconsin GO, Series 2011-1, 5.00%, 5/1/22(5) | 1,000,000 | 1,161,300 |
Wisconsin Health & Educational Facilities Auth. Rev., (Luther Hospital), 5.75%, 11/15/30(1) | 1,200,000 | 1,258,452 |
| Wisconsin Health & Educational Facilities Auth. Rev., Series 2004 A, (Southwest Health Center), 6.25%, 4/1/34 | 2,000,000 | 1,841,720 |
| Wisconsin Health & Educational Facilities Auth. Rev., Series 2009 A, (St. John’s Communities, Inc.), 7.625%, 9/15/39 | 1,000,000 | 1,007,560 |
| | | 5,269,032 |
| WYOMING — 0.9% |
Campbell County Solid Waste Facilities Rev., Series 2009 A, (Basin Electric Power Cooperative), 5.75%, 7/15/39(1) | $2,000,000 | $2,083,420 |
TOTAL INVESTMENT SECURITIES — 99.5%(Cost $241,166,568) | 234,992,324 |
| OTHER ASSETS AND LIABILITIES — 0.5% | 1,145,232 |
| TOTAL NET ASSETS — 100.0% | $236,137,556 |
| Futures Contracts |
| Contracts Purchased | Expiration Date | Underlying Face Amount at Value | Unrealized Gain (Loss) |
| 83 | U.S. Long Bond | September 2011 | $10,362,031 | $99,673 |
| | | | | |
| Contracts Sold | Expiration Date | Underlying Face Amount at Value | Unrealized Gain (Loss) |
| 255 | U.S. Treasury 2-Year Notes | September 2011 | $55,892,813 | $(104,168) |
Notes to Schedule of Investments
Ambac = Ambac Assurance Corporation
COP = Certificates of Participation
GO = General Obligation
LOC = Letter of Credit
NATL = National Public Finance Guarantee Corporation
Radian = Radian Asset Assurance, Inc.
VRDN = Variable Rate Demand Note. Interest reset date is indicated. Rate shown is effective at the period end.
| (1) | Security, or a portion thereof, has been segregated for when-issued securities and/or futures contracts. At the period end, the aggregate value of securities pledged was $69,758,000. |
| (2) | Security was purchased under Rule 144A of the Securities Act of 1933 or is a private placement and, unless registered under the Act or exempted from registration, may only be sold to qualified institutional investors. The aggregate value of these securities at the period end was $12,653,315, which represented 5.4% of total net assets. |
| (3) | Escrowed to maturity in U.S. government securities or state and local government securities. |
| (4) | Security is in default. |
See Notes to Financial Statements.
Statement of Assets and Liabilities |
| MAY 31, 2011 | |
| Assets | |
| Investment securities, at value (cost of $241,166,568) | | | $234,992,324 | |
| Cash | | | 233,621 | |
| Receivable for investments sold | | | 46,750 | |
| Receivable for capital shares sold | | | 833,666 | |
| Receivable for variation margin on futures contracts | | | 20,750 | |
| Interest receivable | | | 4,329,801 | |
| | | | 240,456,912 | |
| | | | | |
| Liabilities | |
| Payable for investments purchased | | | 3,476,472 | |
| Payable for capital shares redeemed | | | 419,448 | |
| Payable for variation margin on futures contracts | | | 19,922 | |
| Accrued management fees | | | 116,680 | |
| Distribution and service fees payable | | | 38,975 | |
| Dividends payable | | | 247,859 | |
| | | | 4,319,356 | |
| | | | | |
| Net Assets | | | $236,137,556 | |
| | | | | |
| Net Assets Consist of: | |
| Capital paid in | | | $285,490,488 | |
| Accumulated net realized loss | | | (43,174,193 | ) |
| Net unrealized depreciation | | | (6,178,739 | ) |
| | | | $236,137,556 | |
| | | | | | | | | | |
| | | Net assets | | Shares outstanding | | Net asset value per share |
| Investor Class | | | $126,327,424 | | | | 14,865,935 | | | | $8.50 | |
| Institutional Class | | | $4,829,006 | | | | 568,085 | | | | $8.50 | |
| A Class | | | $78,324,811 | | | | 9,217,837 | | | | $8.50 | * |
| B Class | | | $1,771,399 | | | | 208,476 | | | | $8.50 | |
| C Class | | | $24,884,916 | | | | 2,930,107 | | | | $8.49 | |
| * | Maximum offering price $8.90 (net asset value divided by 0.955) |
See Notes to Financial Statements.
| YEAR ENDED MAY 31, 2011 | |
| Investment Income (Loss) | |
| Income: | | | |
| Interest | | | $16,251,615 | |
| | | | | |
| Expenses: | | | | |
| Management fees | | | 1,624,965 | |
| Distribution and service fees: | | | | |
| A Class | | | 265,217 | |
| B Class | | | 22,643 | |
| C Class | | | 278,497 | |
| Trustees’ fees and expenses | | | 10,709 | |
| Other expenses | | | 14,150 | |
| | | | 2,216,181 | |
| | | | | |
| Net investment income (loss) | | | 14,035,434 | |
| | | | | |
| Realized and Unrealized Gain (Loss) | |
| Net realized gain (loss) on: | | | | |
| Investment transactions | | | (9,631,835 | ) |
| Futures contract transactions | | | (1,510,167 | ) |
| | | | (11,142,002 | ) |
| | | | | |
| Change in net unrealized appreciation (depreciation) on: | | | | |
| Investments | | | 67,981 | |
| Futures contracts | | | 137,670 | |
| | | | 205,651 | |
| | | | | |
| Net realized and unrealized gain (loss) | | | (10,936,351 | ) |
| | | | | |
| Net Increase (Decrease) in Net Assets Resulting from Operations | | | $3,099,083 | |
See Notes to Financial Statements.
Statement of Changes in Net Assets |
| YEARS ENDED MAY 31, 2011 AND MAY 31, 2010 | |
| Increase (Decrease) in Net Assets | | 2011 | | | 2010 | |
| Operations | |
| Net investment income (loss) | | | $14,035,434 | | | | $13,297,798 | |
| Net realized gain (loss) | | | (11,142,002 | ) | | | (15,331,567 | ) |
| Change in net unrealized appreciation (depreciation) | | | 205,651 | | | | 42,822,711 | |
| Net increase (decrease) in net assets resulting from operations | | | 3,099,083 | | | | 40,788,942 | |
| | | | | | | | | |
| Distributions to Shareholders | |
| From net investment income: | | | | | | | | |
| Investor Class | | | (7,202,834 | ) | | | (5,707,098 | ) |
| Institutional Class | | | (59,159 | ) | | | (319 | ) |
| A Class | | | (5,440,700 | ) | | | (6,284,384 | ) |
| B Class | | | (100,021 | ) | | | (127,227 | ) |
| C Class | | | (1,232,720 | ) | | | (1,179,101 | ) |
| Decrease in net assets from distributions | | | (14,035,434 | ) | | | (13,298,129 | ) |
| | | | | | | | | |
| Capital Share Transactions | |
| Net increase (decrease) in net assets from capital share transactions | | | (47,364,910 | ) | | | 45,154,745 | |
| | | | | | | | | |
| Net increase (decrease) in net assets | | | (58,301,261 | ) | | | 72,645,558 | |
| | | | | | | | | |
| Net Assets | |
| Beginning of period | | | 294,438,817 | | | | 221,793,259 | |
| End of period | | | $236,137,556 | | | | $294,438,817 | |
See Notes to Financial Statements.
Notes to Financial Statements |
MAY 31, 2011
1. Organization
American Century Municipal Trust (the trust) is registered under the Investment Company Act of 1940, as amended (the 1940 Act), as an open-end management investment company and is organized as a Massachusetts business trust. High-Yield Municipal Fund (the fund) is one fund in a series issued by the trust. The fund is nondiversified as defined under the 1940 Act. The fund’s investment objective is to seek high current income that is exempt from federal income taxes. Capital appreciation is a secondary objective. The fund pursues its objectives by investing a portion of its assets in lower-rated and unrated municipal securities.
The fund is authorized to issue the Investor Class, the Institutional Class, the A Class, the B Class and the C Class. The A Class may incur an initial sales charge. The A Class, B Class and C Class may be subject to a contingent deferred sales charge. The share classes differ principally in their respective sales charges and distribution and shareholder servicing expenses and arrangements. The Institutional Class is made available to institutional shareholders or through financial intermediaries whose clients do not require the same level of shareholder and administrative services as shareholders of other classes. As a result, the Institutional Class is charged a lower unified management fee. Sale of the Institutional Class commenced on March 1, 2010.
2. Significant Accounting Policies
The following is a summary of significant accounting policies consistently followed by the fund in preparation of its financial statements. The financial statements are prepared in conformity with accounting principles generally accepted in the United States of America, which may require management to make certain estimates and assumptions at the date of the financial statements. Actual results could differ from these estimates.
Investment Valuations — The fund determines the fair value of its investments and computes its net asset value per share as of the close of regular trading (usually 4 p.m. Eastern time) on the New York Stock Exchange (NYSE) on each day the NYSE is open.
Debt securities maturing in greater than 60 days at the time of purchase are valued at the evaluated mean as provided by independent pricing services or at the mean of the most recent bid and asked prices as provided by investment dealers. Debt securities maturing within 60 days at the time of purchase may be valued at cost, plus or minus any amortized discount or premium or at the evaluated mean as provided by an independent pricing service. Evaluated mean prices are commonly derived through utilization of market models, which may consider, among other factors, trade data, quotations from dealers and active market makers, relevant yield curve and spread data, related sector levels, creditworthiness, and other relevant market information on the same or comparable securities.
Exchange-traded futures contracts are valued at the settlement price as provided by the appropriate clearing corporation.
If the fund determines that the market price for a portfolio security is not readily available or the valuation methods mentioned above do not reflect a security’s fair value, such security is valued as determined in good faith by the Board of Trustees or its designee, in accordance with procedures adopted by the Board of Trustees. Circumstances that may cause the fund to use these procedures to value a security include, but are not limited to: a security has been declared in default; trading in a security has been halted during the trading day; there is a foreign market holiday and no trading occurred; or an event occurred between the close of a foreign exchange and the NYSE that may affect the value of a security.
Security Transactions — Security transactions are accounted for as of the trade date. Net realized gains and losses are determined on the identified cost basis, which is also used for federal income tax purposes.
Investment Income — Interest income is recorded on the accrual basis and includes accretion of discounts and amortization of premiums.
When-Issued — The fund may engage in securities transactions on a when-issued basis. Under these arrangements, the securities’ prices and yields are fixed on the date of the commitment, but payment and delivery are scheduled for a future date. During this period, securities are subject to market fluctuations. The fund will segregate cash, cash equivalents or other appropriate liquid securities on its records in amounts sufficient to meet the purchase price.
Income Tax Status — It is the fund’s policy to distribute substantially all net investment income and net realized gains to shareholders and to otherwise qualify as a regulated investment company under provisions of the Internal Revenue Code. The fund is no longer subject to examination by tax authorities for years prior to 2008. At this time, management believes there are no uncertain tax positions which, based on their technical merit, would not be sustained upon examination and for which it is reasonably possible that the total amounts of unrecognized tax benefits will significantly change in the next twelve months. Accordingly, no provision has been made for federal or state income taxes.
Multiple Class — All shares of the fund represent an equal pro rata interest in the net assets of the class to which such shares belong, and have identical voting, dividend, liquidation and other rights and the same terms and conditions, except for class specific expenses and exclusive rights to vote on matters affecting only individual classes. Income, non-class specific expenses, and realized and unrealized capital gains and losses of the fund are allocated to each class of shares based on their relative net assets.
Distributions to Shareholders — Distributions from net investment income are declared daily and paid monthly. Distributions from net realized gains, if any, are generally declared and paid annually.
Indemnifications — Under the trust’s organizational documents, its officers and trustees are indemnified against certain liabilities arising out of the performance of their duties to the fund. In addition, in the normal course of business, the fund enters into contracts that provide general indemnifications. The maximum exposure under these arrangements is unknown as this would involve future claims that may be made against a fund. The risk of material loss from such claims is considered by management to be remote.
3. Fees and Transactions with Related Parties
Management Fees — The trust has entered into a management agreement with American Century Investment Management, Inc. (ACIM) (the investment advisor), under which ACIM provides the fund with investment advisory and management services in exchange for a single, unified management fee (the fee) per class. The agreement provides that all expenses of managing and operating the fund, except distribution and service fees, brokerage expenses, taxes, interest, fees and expenses of the independent trustees (including legal counsel fees), and extraordinary expenses, will be paid by ACIM. The fee is computed and accrued daily based on each class’s daily net assets and paid monthly in arrears. The fee consists of (1) an Investment Category Fee based on the daily net assets of the fund and certain other accounts managed by the investment advisor that are in the same broad investment category as the fund and (2) a Complex Fee based on the assets of all the funds in the American Century Investments family of funds. The rates for the Investment Category Fee range from 0.2925% to 0.4100%. The rates for the Complex Fee range from 0.2500% to 0.3100% for the Investor Class, A Class, B Class and C Class. The Institutional Class is 0.2000% less at each point within the Complex Fee range. The effective annual management fee for each class for the year ended May 31, 2011 was 0.60% for the Investor Class, A Class, B Class and C Class and 0.40% for the Institutional Class.
Distribution and Service Fees — The Board of Trustees has adopted a separate Master Distribution and Individual Shareholder Services Plan for each of the A Class, B Class and C Class (collectively the plans), pursuant to Rule 12b-1 of the 1940 Act. The plans provide that the A Class will pay American Century Investment Services, Inc. (ACIS) an annual distribution and service fee of 0.25%. The plans provide that the B Class and C Class will each pay ACIS an annual distribution and service fee of 1.00%, of which 0.25% is paid for
individual shareholder services and 0.75% is paid for distribution services. The fees are computed and accrued daily based on each class’s daily net assets and paid monthly in arrears. The fees are used to pay financial intermediaries for distribution and individual shareholder services. Fees incurred under the plans during the year ended May 31, 2011 are detailed in the Statement of Operations.
Related Parties — Certain officers and trustees of the trust are also officers and/or directors of American Century Companies, Inc. (ACC), the parent of the trust’s investment advisor, ACIM, the distributor of the trust, ACIS, and the trust’s transfer agent, American Century Services, LLC.
The fund has a mutual funds services agreement with J.P. Morgan Investor Services Co. (JPMIS). JPMorgan Chase Bank (JPMCB) is a custodian of the fund. JPMIS and JPMCB are wholly owned subsidiaries of JPMorgan Chase & Co. (JPM). JPM is an equity investor in ACC.
4. Investment Transactions
Purchases and sales of investment securities, excluding short-term investments, for the year ended May 31, 2011 were $66,957,565 and $108,634,274, respectively.
5. Capital Share Transactions
Transactions in shares of the fund were as follows (unlimited number of shares authorized):
| | | | | | | |
| | | Year ended May 31, 2011 | | | Year ended May 31, 2010(1) | |
| | | Shares | | | Amount | | | Shares | | | Amount | |
| Investor Class | | | | | | | | | | | | |
| Sold | | | 10,040,466 | | | | $87,342,272 | | | | 8,211,992 | | | | $69,589,486 | |
| Issued in reinvestment of distributions | | | 656,725 | | | | 5,667,999 | | | | 522,768 | | | | 4,429,056 | |
| Redeemed | | | (10,820,930 | ) | | | (93,775,217 | ) | | | (4,182,197 | ) | | | (35,613,780 | ) |
| | | | (123,739 | ) | | | (764,946 | ) | | | 4,552,563 | | | | 38,404,762 | |
| Institutional Class | | | | | | | | | | | | | | | | |
| Sold | | | 653,675 | | | | 5,461,800 | | | | 2,886 | | | | 25,000 | |
| Issued in reinvestment of distributions | | | 7,040 | | | | 59,159 | | | | 37 | | | | 319 | |
| Redeemed | | | (95,553 | ) | | | (792,047 | ) | | | — | | | | — | |
| | | | 565,162 | | | | 4,728,912 | | | | 2,923 | | | | 25,319 | |
| A Class | | | | | | | | | | | | | | | | |
| Sold | | | 2,796,582 | | | | 24,215,335 | | | | 4,398,679 | | | | 37,187,350 | |
| Issued in reinvestment of distributions | | | 479,206 | | | | 4,150,973 | | | | 551,204 | | | | 4,645,556 | |
| Redeemed | | | (8,828,199 | ) | | | (75,619,829 | ) | | | (4,250,762 | ) | | | (35,933,107 | ) |
| | | | (5,552,411 | ) | | | (47,253,521 | ) | | | 699,121 | | | | 5,899,799 | |
| B Class | | | | | | | | | | | | | | | | |
| Sold | | | 6,951 | | | | 61,459 | | | | 29,502 | | | | 236,485 | |
| Issued in reinvestment of distributions | | | 7,071 | | | | 60,920 | | | | 7,014 | | | | 59,236 | |
| Redeemed | | | (104,719 | ) | | | (891,154 | ) | | | (88,495 | ) | | | (753,378 | ) |
| | | | (90,697 | ) | | | (768,775 | ) | | | (51,979 | ) | | | (457,657 | ) |
| C Class | | | | | | | | | | | | | | | | |
| Sold | | | 694,046 | | | | 6,028,066 | | | | 989,274 | | | | 8,350,837 | |
| Issued in reinvestment of distributions | | | 67,812 | | | | 584,225 | | | | 67,471 | | | | 568,633 | |
| Redeemed | | | (1,157,172 | ) | | | (9,918,871 | ) | | | (915,936 | ) | | | (7,636,948 | ) |
| | | | (395,314 | ) | | | (3,306,580 | ) | | | 140,809 | | | | 1,282,522 | |
| Net increase (decrease) | | | (5,596,999 | ) | | | $(47,364,910 | ) | | | 5,343,437 | | | | $45,154,745 | |
| (1) | March 1, 2010 (commencement of sale) through May 31, 2010 for the Institutional Class. |
6. Fair Value Measurements
The fund’s securities valuation process is based on several considerations and may use multiple inputs to determine the fair value of the positions held by the fund. In conformity with accounting principles generally accepted in the United States of America, the inputs used to determine a valuation are classified into three broad levels as follows:
| • | Level 1 valuation inputs consist of unadjusted quoted prices in an active market for identical securities; |
| • | Level 2 valuation inputs consist of direct or indirect observable market data (including quoted prices for similar securities, evaluations of subsequent market events, interest rates, prepayment speeds, credit risk, etc.); or |
| • | Level 3 valuation inputs consist of unobservable data (including a fund’s own assumptions). |
The level classification is based on the lowest level input that is significant to the fair valuation measurement. The valuation inputs are not necessarily an indication of the risks associated with investing in these securities or other financial instruments.
As of period end, the fund’s investment securities and unrealized gain (loss) on futures contracts were classified as Level 2 and Level 1, respectively. The Schedule of Investments provides additional information on the fund’s portfolio holdings.
7. Derivative Instruments
Interest Rate Risk — The fund is subject to interest rate risk in the normal course of pursuing its investment objectives. The value of bonds generally declines as interest rates rise. A fund may enter into futures contracts based on a bond index or a specific underlying security. A fund may purchase futures contracts to gain exposure to increases in market value or sell futures contracts to protect against a decline in market value. Upon entering into a futures contract, a fund will segregate cash, cash equivalents or other appropriate liquid securities on its records in amounts sufficient to meet requirements. Subsequent payments (variation margin) are made or received daily, in cash, by a fund. The variation margin is equal to the daily change in the contract value and is recorded as unrealized gains and losses. A fund recognizes a realized gain or loss when the futures contract is closed or expires. Net realized and unrealized gains or losses occurring during the holding period of futures contracts are a component of net realized gain (loss) on futures contract transactions and change in net unrealized appreciation (depreciation) on futures contracts, respectively. One of the risks of entering into futures contracts is the possibility that the change in value of the contract may not correlate with the changes in value of the underlying securities. The interest rate risk derivative instruments held at period end as disclosed on the Schedule of Investments are indicative of the fund’s typical volume during the period.
The value of interest rate risk derivative instruments as of May 31, 2011, is disclosed on the Statement of Assets and Liabilities as an asset of $20,750 in receivable for variation margin on futures contracts and as a liability of $19,922 in payable for variation margin on futures contracts. For the year ended May 31, 2011, the effect of interest rate risk derivative instruments on the Statement of Operations was $(1,510,167) in net realized gain (loss) on futures contract transactions and $137,670 in change in net unrealized appreciation (depreciation) on futures contracts.
8. Risk Factors
The fund invests primarily in lower-rated debt securities, which are subject to substantial risks including price volatility, liquidity and default risk.
9. Federal Tax Information
The tax character of distributions paid during the years ended May 31, 2011 and May 31, 2010 were as follows:
| | | 2011 | | 2010 |
| Distributions Paid From | | | | | | |
| Exempt income | | | $14,027,887 | | | | $13,298,129 | |
| Ordinary income | | | 7,547 | | | | — | |
| Long-term capital gains | | | — | | | | — | |
The book-basis character of distributions made during the year from net investment income or net realized gains may differ from their ultimate characterization for federal income tax purposes. These differences reflect the differing character of certain income items and net realized gains and losses for financial statement and tax purposes, and may result in reclassification among certain capital accounts on the financial statements.
As of May 31, 2011, the federal tax cost of investments and the components of distributable earnings on a tax-basis were as follows:
| | | | | |
| Federal tax cost of investments | | | $240,611,932 | |
| Gross tax appreciation of investments | | | $6,529,316 | |
| Gross tax depreciation of investments | | | (12,148,924 | ) |
| Net tax appreciation (depreciation) of investments | | | $(5,619,608 | ) |
| Net tax appreciation (depreciation) on derivatives | | | — | |
| Net tax appreciation (depreciation) | | | $(5,619,608 | ) |
| Accumulated capital losses | | | $(35,509,442 | ) |
| Capital loss deferral | | | $(8,223,882 | ) |
The difference between book-basis and tax-basis cost and unrealized appreciation (depreciation) is attributable primarily to the treatment of non-shareholder capital contributions and the realization for tax purposes of unrealized gains (losses) on futures contracts.
The accumulated capital losses represent net capital loss carryovers that may be used to offset future realized capital gains for federal income tax purposes. Future capital loss carryover utilization in any given year may be subject to Internal Revenue Code limitations. Capital loss carryovers expire as follows:
| | | | | | | | |
| 2012 | 2013 | 2014 | 2015 | 2016 | 2017 | 2018 | 2019 |
| $(145,918) | $(700,317) | — | — | $(4,227,228) | $(8,112,975) | $(11,481,481) | $(10,841,523) |
The capital loss deferral represents net capital losses incurred in the seven-month period ended May 31, 2011. The fund has elected to treat such losses as having been incurred in the following fiscal year for federal income tax purposes.
On December 22, 2010, the Regulated Investment Company Modernization Act of 2010 (the “Act”) was enacted, which changed various technical rules governing the tax treatment of regulated investment companies. The changes are generally effective for taxable years beginning after the date of enactment. Under the Act, the fund will be permitted to carry forward capital losses incurred in taxable years beginning after the date of enactment for an unlimited period. However, any losses incurred during those future taxable years will be required to be utilized prior to the losses incurred in pre-enactment taxable years, which carry an expiration date. As a result of this ordering rule, pre-enactment capital loss carryforwards may be more likely to expire unused.
| Investor Class | |
| For a Share Outstanding Throughout the Years Ended May 31 | |
| | | 2011 | | | 2010 | | | 2009 | | | 2008 | | | 2007 | |
| Per-Share Data | |
| Net Asset Value, Beginning of Period | | | $8.82 | | | | $7.91 | | | | $9.63 | | | | $10.68 | | | | $10.50 | |
| Income From Investment Operations | | | | | | | | | | | | | | | | | | | | |
| Net Investment Income (Loss) | | | 0.47 | (1) | | | 0.45 | (1) | | | 0.50 | | | | 0.52 | | | | 0.51 | |
| Net Realized and Unrealized Gain (Loss) | | | (0.32 | ) | | | 0.92 | | | | (1.72 | ) | | | (1.05 | ) | | | 0.18 | |
| Total From Investment Operations | | | 0.15 | | | | 1.37 | | | | (1.22 | ) | | | (0.53 | ) | | | 0.69 | |
| Distributions | | | | | | | | | | | | | | | | | | | | |
| From Net Investment Income | | | (0.47 | ) | | | (0.46 | ) | | | (0.50 | ) | | | (0.52 | ) | | | (0.51 | ) |
| Net Asset Value, End of Period | | | $8.50 | | | | $8.82 | | | | $7.91 | | | | $9.63 | | | | $10.68 | |
| | | | | | | | | | | | | | | | | | | | | |
Total Return(2) | | | 1.76 | % | | | 17.68 | % | | | (12.70 | )% | | | (5.01 | )% | | | 6.70 | % |
| | | | | | | | | | | | | | | | | | | | | |
| Ratios/Supplemental Data | |
Ratio of Operating Expenses to Average Net Assets | | | 0.61 | % | | | 0.61 | % | | | 0.62 | % | | | 0.62 | % | | | 0.62 | % |
Ratio of Net Investment Income (Loss) to Average Net Assets | | | 5.41 | % | | | 5.40 | % | | | 5.97 | % | | | 5.16 | % | | | 4.80 | % |
| Portfolio Turnover Rate | | | 27 | % | | | 25 | % | | | 44 | % | | | 69 | % | | | 36 | % |
| Net Assets, End of Period (in thousands) | | | $126,327 | | | | $132,196 | | | | $82,547 | | | | $87,127 | | | | $97,254 | |
| (1) | Computed using average shares outstanding throughout the period. |
| (2) | Total returns are calculated based on the net asset value of the last business day. Total returns for periods less than one year are not annualized. |
See Notes to Financial Statements.
| Institutional Class | |
| For a Share Outstanding Throughout the Years Ended May 31 (except as noted) | |
| | | 2011 | | | 2010(1) | |
| Per-Share Data | |
| Net Asset Value, Beginning of Period | | | $8.82 | | | | $8.66 | |
| Income From Investment Operations | | | | | | | | |
Net Investment Income (Loss)(2) | | | 0.49 | | | | 0.12 | |
| Net Realized and Unrealized Gain (Loss) | | | (0.32 | ) | | | 0.15 | |
| Total From Investment Operations | | | 0.17 | | | | 0.27 | |
| Distributions | | | | | | | | |
| From Net Investment Income | | | (0.49 | ) | | | (0.11 | ) |
| Net Asset Value, End of Period | | | $8.50 | | | | $8.82 | |
| | | | | | | | | |
Total Return(3) | | | 1.97 | % | | | 3.13 | % |
| | | | | | | | | |
| Ratios/Supplemental Data | |
| Ratio of Operating Expenses to Average Net Assets | | | 0.41 | % | | | 0.41 | %(4) |
| Ratio of Net Investment Income (Loss) to Average Net Assets | | | 5.61 | % | | | 5.50 | %(4) |
| Portfolio Turnover Rate | | | 27 | % | | | 25 | %(5) |
| Net Assets, End of Period (in thousands) | | | $4,829 | | | | $26 | |
| (1) | March 1, 2010 (commencement of sale) through May 31, 2010. |
| (2) | Computed using average shares outstanding throughout the period. |
| (3) | Total returns are calculated based on the net asset value of the last business day. Total returns for periods less than one year are not annualized. |
| (5) | Portfolio turnover is calculated at the fund level. Percentage indicated was calculated for the year ended May 31, 2010. |
See Notes to Financial Statements.
| A Class | |
| For a Share Outstanding Throughout the Years Ended May 31 | |
| | | 2011 | | | 2010 | | | 2009 | | | 2008 | | | 2007 | |
| Per-Share Data | |
| Net Asset Value, Beginning of Period | | | $8.82 | | | | $7.91 | | | | $9.63 | | | | $10.68 | | | | $10.50 | |
| Income From Investment Operations | | | | | | | | | | | | | | | | | | | | |
| Net Investment Income (Loss) | | | 0.45 | (1) | | | 0.43 | (1) | | | 0.48 | | | | 0.50 | | | | 0.48 | |
| Net Realized and Unrealized Gain (Loss) | | | (0.32 | ) | | | 0.91 | | | | (1.72 | ) | | | (1.05 | ) | | | 0.18 | |
| Total From Investment Operations | | | 0.13 | | | | 1.34 | | | | (1.24 | ) | | | (0.55 | ) | | | 0.66 | |
| Distributions | | | | | | | | | | | | | | | | | | | | |
| From Net Investment Income | | | (0.45 | ) | | | (0.43 | ) | | | (0.48 | ) | | | (0.50 | ) | | | (0.48 | ) |
| Net Asset Value, End of Period | | | $8.50 | | | | $8.82 | | | | $7.91 | | | | $9.63 | | | | $10.68 | |
| | | | | | | | | | | | | | | | | | | | | |
Total Return(2) | | | 1.51 | % | | | 17.39 | % | | | (12.92 | )% | | | (5.25 | )% | | | 6.43 | % |
| | | | | | | | | | | | | | | | | | | | | |
| Ratios/Supplemental Data | |
Ratio of Operating Expenses to Average Net Assets | | | 0.86 | % | | | 0.86 | % | | | 0.87 | % | | | 0.87 | % | | | 0.87 | % |
Ratio of Net Investment Income (Loss) to Average Net Assets | | | 5.16 | % | | | 5.15 | % | | | 5.72 | % | | | 4.91 | % | | | 4.55 | % |
| Portfolio Turnover Rate | | | 27 | % | | | 25 | % | | | 44 | % | | | 69 | % | | | 36 | % |
| Net Assets, End of Period (in thousands) | | | $78,325 | | | | $130,266 | | | | $111,293 | | | | $140,037 | | | | $158,622 | |
| (1) | Computed using average shares outstanding throughout the period. |
| (2) | Total returns are calculated based on the net asset value of the last business day and do not reflect applicable sales charges. Total returns for periods less than one year are not annualized. |
See Notes to Financial Statements.
| B Class | |
| For a Share Outstanding Throughout the Years Ended May 31 | |
| | | 2011 | | | 2010 | | | 2009 | | | 2008 | | | 2007 | |
| Per-Share Data | |
| Net Asset Value, Beginning of Period | | | $8.82 | | | | $7.91 | | | | $9.63 | | | | $10.68 | | | | $10.50 | |
| Income From Investment Operations | | | | | | | | | | | | | | | | | | | | |
| Net Investment Income (Loss) | | | 0.38 | (1) | | | 0.37 | (1) | | | 0.42 | | | | 0.42 | | | | 0.40 | |
| Net Realized and Unrealized Gain (Loss) | | | (0.32 | ) | | | 0.91 | | | | (1.72 | ) | | | (1.05 | ) | | | 0.18 | |
| Total From Investment Operations | | | 0.06 | | | | 1.28 | | | | (1.30 | ) | | | (0.63 | ) | | | 0.58 | |
| Distributions | | | | | | | | | | | | | | | | | | | | |
| From Net Investment Income | | | (0.38 | ) | | | (0.37 | ) | | | (0.42 | ) | | | (0.42 | ) | | | (0.40 | ) |
| Net Asset Value, End of Period | | | $8.50 | | | | $8.82 | | | | $7.91 | | | | $9.63 | | | | $10.68 | |
| | | | | | | | | | | | | | | | | | | | | |
Total Return(2) | | | 0.75 | % | | | 16.52 | % | | | (13.58 | )% | | | (5.96 | )% | | | 5.64 | % |
| | | | | | | | | | | | | | | | | | | | | |
| Ratios/Supplemental Data | |
Ratio of Operating Expenses to Average Net Assets | | | 1.61 | % | | | 1.61 | % | | | 1.62 | % | | | 1.62 | % | | | 1.62 | % |
Ratio of Net Investment Income (Loss) to Average Net Assets | | | 4.41 | % | | | 4.40 | % | | | 4.97 | % | | | 4.16 | % | | | 3.80 | % |
| Portfolio Turnover Rate | | | 27 | % | | | 25 | % | | | 44 | % | | | 69 | % | | | 36 | % |
| Net Assets, End of Period (in thousands) | | | $1,771 | | | | $2,638 | | | | $2,777 | | | | $3,805 | | | | $4,790 | |
| (1) | Computed using average shares outstanding throughout the period. |
| (2) | Total returns are calculated based on the net asset value of the last business day and do not reflect applicable sales charges. Total returns for periods less than one year are not annualized. |
See Notes to Financial Statements.
| C Class | |
| For a Share Outstanding Throughout the Years Ended May 31 | |
| | | 2011 | | | 2010 | | | 2009 | | | 2008 | | | 2007 | |
| Per-Share Data | |
| Net Asset Value, Beginning of Period | | | $8.81 | | | | $7.91 | | | | $9.63 | | | | $10.68 | | | | $10.50 | |
| Income From Investment Operations | | | | | | | | | | | | | | | | | | | | |
| Net Investment Income (Loss) | | | 0.38 | (1) | | | 0.37 | (1) | | | 0.41 | | | | 0.42 | | | | 0.40 | |
| Net Realized and Unrealized Gain (Loss) | | | (0.32 | ) | | | 0.90 | | | | (1.72 | ) | | | (1.05 | ) | | | 0.18 | |
| Total From Investment Operations | | | 0.06 | | | | 1.27 | | | | (1.31 | ) | | | (0.63 | ) | | | 0.58 | |
| Distributions | | | | | | | | | | | | | | | | | | | | |
| From Net Investment Income | | | (0.38 | ) | | | (0.37 | ) | | | (0.41 | ) | | | (0.42 | ) | | | (0.40 | ) |
| Net Asset Value, End of Period | | | $8.49 | | | | $8.81 | | | | $7.91 | | | | $9.63 | | | | $10.68 | |
| | | | | | | | | | | | | | | | | | | | | |
Total Return(2) | | | 0.75 | % | | | 16.39 | % | | | (13.58 | )% | | | (5.96 | )% | | | 5.64 | % |
| | | | | | | | | | | | | | | | | | | | | |
| Ratios/Supplemental Data | |
Ratio of Operating Expenses to Average Net Assets | | | 1.61 | % | | | 1.61 | % | | | 1.62 | % | | | 1.62 | % | | | 1.62 | % |
Ratio of Net Investment Income (Loss) to Average Net Assets | | | 4.41 | % | | | 4.40 | % | | | 4.97 | % | | | 4.16 | % | | | 3.80 | % |
| Portfolio Turnover Rate | | | 27 | % | | | 25 | % | | | 44 | % | | | 69 | % | | | 36 | % |
| Net Assets, End of Period (in thousands) | | | $24,885 | | | | $29,313 | | | | $25,176 | | | | $34,072 | | | | $38,287 | |
| (1) | Computed using average shares outstanding throughout the period. |
| (2) | Total returns are calculated based on the net asset value of the last business day and do not reflect applicable sales charges. Total returns for periods less than one year are not annualized. |
See Notes to Financial Statements.
Report of Independent Registered Public Accounting Firm |
To the Trustees of the American Century Municipal Trust and
Shareholders of the High-Yield Municipal Fund:
In our opinion, the accompanying statement of assets and liabilities, including the schedule of investments, and the related statements of operations and of changes in net assets and the financial highlights present fairly, in all material respects, the financial position of the High-Yield Municipal Fund (one of the five funds comprising the American Century Municipal Trust, hereafter referred to as the “Fund”) at May 31, 2011, the results of its operations for the year then ended, the changes in its net assets for each of the two years in the period then ended and the financial highlights for the periods presented, in conformity with accounting principles generally accepted in the United States of America. These financial statements and financial highlights (hereafter referred to as “financial statements”) are the responsibility of the Fund’s management; our responsibility is to express an opinion on these financial statements based on our audits. We conducted our audits of these financial statements in accordance with the standards of the Public Company Accounting Oversight Board (United States). Those standards require that we plan and perform the audit to obtain reasonable assurance about whether the financial statements are free of material misstatement. An audit includes examining, on a test basis, evidence supporting the amounts and disclosures in the financial statements, assessing the accounting principles used and significant estimates made by management, and evaluating the overall financial statement presentation. We believe that our audits, which included confirmation of securities at May 31, 2011 by correspondence with the custodian and brokers, provide a reasonable basis for our opinion.
PricewaterhouseCoopers LLP
Kansas City, Missouri
July 22, 2011
A special meeting of shareholders was held on June 16, 2010, to vote on the following proposals. Each proposal received the required number of votes and was adopted. A summary of voting results is listed below each proposal.
Proposal 1:
To elect one Trustee to the Board of Trustees of American Century Municipal Trust (the proposal was voted on by all shareholders of funds issued by American Century Municipal Trust):
| | | |
| Frederick L.A. Grauer | For: | 1,732,355,276 |
| | Withhold: | 67,363,643 |
| | Abstain: | 0 |
| | Broker Non-Vote: | 0 |
The other trustees whose term of office continued after the meeting include Jonathan S. Thomas, John Freidenrich, Ronald J. Gilson, Peter F. Pervere, Myron S. Scholes, and John B. Shoven.
Proposal 2:
To approve a management agreement between the fund and American Century Investment Management, Inc.:
| | | |
| Investor, A, B, and C Classes | For: | 138,838,298 |
| | Against: | 3,097,134 |
| | Abstain: | 5,005,505 |
| | Broker Non-Vote: | 59,320,007 |
Board of Trustees
The individuals listed below serve as trustees of the funds. Each trustee will continue to serve in this capacity until death, retirement, resignation or removal from office. The mandatory retirement age for trustees who are not “interested persons,” as that term is defined in the Investment Company Act (independent trustees), is 73. However, the mandatory retirement age may be extended for a period not to exceed two years with the approval of the remaining independent trustees.
Mr. Thomas is the only trustee who is an “interested person” because he currently serves as President and Chief Executive Officer of American Century Companies, Inc. (ACC), the parent company of American Century Investment Management, Inc. (ACIM or the advisor).
The other trustees (more than three-fourths of the total number) are independent; that is, they have never been employees, directors or officers of, and have no financial interest in, ACC or any of its wholly owned, direct or indirect, subsidiaries, including ACIM, American Century Investment Services, Inc. (ACIS) and American Century Services, LLC (ACS). The trustees serve in this capacity for eight (in the case of Mr. Thomas, 15) registered investment companies in the American Century Investments family of funds.
The following presents additional information about the trustees. The mailing address for each trustee other than Mr. Thomas is 1665 Charleston Road, Mountain View, California 94043. The mailing address for Mr. Thomas is 4500 Main Street, Kansas City, Missouri 64111.
| | | | | | |
Name (Year of Birth) | Position(s) Held with Funds | Length of Time Served | Principal Occupation(s) During Past 5 Years | Number of American Century Portfolios Overseen by Trustee | Other Directorships Held During Past 5 Years |
| Independent Trustees |
Tanya S. Beder (1955) | Trustee | Since 2011 | Chairman, SBCC Group Inc. (investment advisory services)(2006 to present); Fellow in Practice, International Center for Finance, Yale University School of Management (1985 to present); Chief Executive Officer, Tribeca Global Management LLC (asset management firm) (2004 to 2006) | 40 | None |
Jeremy I. Bulow (1954) | Trustee | Since 2011 | Professor of Economics, Stanford University, Graduate School of Business (1979 to present) | 40 | None |
John Freidenrich (1937) | Trustee | Since 2005 | Founder, Member and Manager, Regis Management Company, LLC (investment management firm) (April 2004 to present) | 40 | None |
| | | | | | |
Name (Year of Birth) | Position(s) Held with Funds | Length of Time Served | Principal Occupation(s) During Past 5 Years | Number of American Century Portfolios Overseen by Trustee | Other Directorships Held During Past 5 Years |
| Independent Trustees |
Ronald J. Gilson (1946) | Trustee and Chairman of the Board | Since 1995 | Charles J. Meyers Professor of Law and Business, Stanford Law School (1979 to present); Marc and Eva Stern Professor of Law and Business, Columbia University School of Law (1992 to present) | 40 | None |
Frederick L. A. Grauer (1946) | Trustee | Since 2008 | Senior Advisor, BlackRock, Inc. (investment management firm) (2010 to 2011); Senior Advisor, Barclays Global Investors (investment management firm) (2003 to 2009) | 40 | None |
Peter F. Pervere (1947) | Trustee | Since 2007 | Retired | 40 | Intraware, Inc. (2003 to 2009) |
Myron S. Scholes (1941) | Trustee | Since 1980 | Chairman, Platinum Grove Asset Management, L.P. (asset manager) (1999 to 2009); Frank E. Buck Professor of Finance-Emeritus, Stanford Graduate School of Business (1996 to present) | 40 | Dimensional Fund Advisors (investment advisor); CME Group, Inc. (futures and options exchange) |
John B. Shoven (1947) | Trustee | Since 2002 | Professor of Economics, Stanford University (1973 to present) | 40 | Cadence Design Systems; Exponent; Financial Engines; Watson Wyatt Worldwide (2002 to 2006) |
| |
| Interested Trustee |
Jonathan S. Thomas (1963) | Trustee and President | Since 2007 | President and Chief Executive Officer, ACC (March 2007 to present); Chief Administrative Officer, ACC (February 2006 to February 2007); Executive Vice President, ACC (November 2005 to February 2007). Also serves as: Chief Executive Officer and Manager, ACS; Executive Vice President, ACIM; Director, ACC, ACIM and other ACC subsidiaries | 104 | None |
Officers
The following table presents certain information about the executive officers of the funds. Each officer serves as an officer for each of the 15 investment companies in the American Century family of funds, unless otherwise noted. No officer is compensated for his or her service as an officer of the funds. The listed officers are interested persons of the funds and are appointed or re-appointed on an annual basis. The mailing address for each of the officers listed below is 4500 Main Street, Kansas City, Missouri 64111.
| | | |
Name (Year of Birth) | Offices with the Funds | Principal Occupation(s) During the Past Five Years |
| Officers |
Jonathan S.Thomas (1963) | Trustee and President since 2007 | President and Chief Executive Officer, ACC (March 2007 to present); Chief Administrative Officer, ACC (February 2006 to February 2007); Executive Vice President, ACC (November 2005 to February 2007). Also serves as: Chief Executive Officer and Manager, ACS; Executive Vice President, ACIM; Director, ACC, ACIM and other ACC subsidiaries |
Barry Fink (1955) | Executive Vice President since 2007 | Chief Operating Officer and Executive Vice President, ACC (September 2007 to present); President, ACS (October 2007 to present); Managing Director, Morgan Stanley (2000 to 2007); Global General Counsel, Morgan Stanley (2000 to 2006). Also serves as: Manager, ACS and Director, ACC and certain ACC subsidiaries |
Maryanne L. Roepke (1956) | Chief Compliance Officer since 2006 and Senior Vice President since 2000 | Chief Compliance Officer, American Century funds, ACIM and ACS (August 2006 to present); Assistant Treasurer, ACC (January 1995 to August 2006); and Treasurer and Chief Financial Officer, various American Century funds (July 2000 to August 2006). Also serves as: Senior Vice President, ACS |
Charles A. Etherington (1957) | General Counsel since 2007 and Senior Vice President since 2006 | Attorney, ACC (February 1994 to present); Vice President, ACC (November 2005 to present), General Counsel, ACC (March 2007 to present); Also serves as General Counsel, ACIM, ACS, ACIS and other ACC subsidiaries; and Senior Vice President, ACIM and ACS |
Robert J. Leach (1966) | Vice President, Treasurer and Chief Financial Officer since 2006 | Vice President, ACS (February 2000 to present); and Controller, various American Century funds (1997 to September 2006) |
David H. Reinmiller (1963) | Vice President since 2001 | Attorney, ACC (January 1994 to present); Associate General Counsel, ACC (January 2001 to present); Also serves as Vice President, ACIM and ACS |
Ward D. Stauffer (1960) | Secretary since 2005 | Attorney, ACC (June 2003 to Present) |
The Statement of Additional Information has additional information about the fund’s trustees and is available without charge, upon request, by calling 1-800-345-2021.
Proxy Voting Guidelines
American Century Investment Management, Inc., the fund’s investment advisor, is responsible for exercising the voting rights associated with the securities purchased and/or held by the fund. A description of the policies and procedures the advisor uses in fulfilling this responsibility is available without charge, upon request, by calling 1-800-345-2021. It is also available on American Century Investments’ website at americancentury.com and on the Securities and Exchange Commission’s website at sec.gov. Information regarding how the investment advisor voted proxies relating to portfolio securities during the most recent 12-month period ended June 30 is available on the “About Us” page at americancentury.com. It is also available at sec.gov.
Quarterly Portfolio Disclosure
The fund files its complete schedule of portfolio holdings with the Securities and Exchange Commission (SEC) for the first and third quarters of each fiscal year on Form N-Q. The fund’s Forms N-Q are available on the SEC’s website at sec.gov, and may be reviewed and copied at the SEC’s Public Reference Room in Washington, DC. Information on the operation of the Public Reference Room may be obtained by calling 1-800-SEC-0330. The fund also makes its complete schedule of portfolio holdings for the most recent quarter of its fiscal year available on its website at americancentury.com and, upon request, by calling 1-800-345-2021.
Other Tax Information
The following information is provided pursuant to provisions of the Internal Revenue Code.
The fund designates $14,046,716 as exempt interest dividends for the fiscal year ended May 31, 2011.
| Contact Us | americancentury.com |
| Automated Information Line | 1-800-345-8765 |
| Investor Services Representative | 1-800-345-2021 or 816-531-5575 |
| Investors Using Advisors | 1-800-378-9878 |
| Business, Not-For-Profit, Employer-Sponsored Retirement Plans | 1-800-345-3533 |
| Banks and Trust Companies, Broker-Dealers, Financial Professionals, Insurance Companies | 1-800-345-6488 |
| Telecommunications Device for the Deaf | 1-800-634-4113 |
American Century Municipal Trust
Investment Advisor:
American Century Investment Management, Inc.
Kansas City, Missouri
This report and the statements it contains are submitted for the general information of our shareholders. The report is not authorized for distribution to prospective investors unless preceded or accompanied by an effective prospectus.
©2011 American Century Proprietary Holdings, Inc. All rights reserved.
CL-ANN-72033 1107
ANNUAL REPORT MAY 31, 2011
| | Intermediate-Term Tax-Free Bond Fund |
| President’s Letter | 2 |
| Market Perspective | 3 |
| Performance | 4 |
| Portfolio Commentary | 6 |
| Fund Characteristics | 8 |
| Shareholder Fee Example | 9 |
| Schedule of Investments | 11 |
| Statement of Assets and Liabilities | 35 |
| Statement of Operations | 36 |
| Statement of Changes in Net Assets | 37 |
| Notes to Financial Statements | 38 |
| Financial Highlights | 43 |
| Report of Independent Registered Public Accounting Firm | 47 |
| Proxy Voting Results | 48 |
| Management | 49 |
| Additional Information | 52 |
Any opinions expressed in this report reflect those of the author as of the date of the report, and do not necessarily represent the opinions of American Century Investments® or any other person in the American Century Investments organization. Any such opinions are subject to change at any time based upon market or other conditions and American Century Investments disclaims any responsibility to update such opinions. These opinions may not be relied upon as investment advice and, because investment decisions made by American Century Investments funds are based on numerous factors, may not be relied upon as an indication of trading intent on behalf of any American Century Investments fund. Security examples are used for representational purposes only and are not intended as recommendations to purchase or sell securities. Performance information for comparative indices and securities is provided to American Century Investments by third party vendors. To the best of American Century Investments’ knowledge, such information is accurate at the time of printing.
Jonathan Thomas
Dear Investor:
Thank you for reviewing this annual report for the period ended May 31, 2011. Our report offers investment performance and portfolio information, presented with the expert perspective and commentary of our portfolio management team.
This report remains one of our most important vehicles for conveying the information you need about your investment performance, and about the market factors and strategies that affect fund returns. For additional, updated information on fund performance, portfolio strategy, and the investment markets, we encourage you to visit our website, americancentury.com. Click on the “Fund Performance” and “Insights & News” headings at the top of our Individual Investors site.
Municipal Bond (Muni) Market Update
As described in greater detail on the following pages, muni market conditions have improved significantly since our semiannual report for the six months ended November 30, 2010. That reporting period concluded during a two-and-a-half month span (from the end of October 2010 to the middle of January 2011) when muni prices plunged and yields soared as a supply and demand imbalance (explained on page 3) roiled the market. That turbulence was compounded by overblown default fears fueled by highly publicized pessimistic analyst reports that helped trigger a wave of withdrawals from muni mutual funds.
As 2011 unfolded, muni issuance declined dramatically and demand surged—falling prices and relatively high yields attracted an influx of opportunistic “cross-over” (non-typical) buyers to the muni market. Munis rallied from mid-January through the end of the full 12-month reporting period, rewarding those who stayed the course and saw the turbulence as a buying opportunity. Muni defaults have not approached the rates projected by pessimistic pundits at the end of last year, and additional economic growth—as well as increased municipal government austerity and budget-balancing measures—have helped stabilize municipal credit conditions since then.
These developments over the more-recent six months are incorporated in the broader, enclosed 12-month Market Perspective and Portfolio Commentary from our muni portfolio management team. These dedicated experts will continue to diligently apply their knowledge and skills as they make daily investment decisions for you.
Sincerely,
Jonathan Thomas
President and Chief Executive Officer
American Century Investments
By David MacEwen, Chief Investment Officer, Fixed Income
Municipal bond (muni) indices advanced for the 12 months ended May 31, 2011 (see the table below), but these moderately positive returns masked considerable volatility, particularly during the last seven months of the period.
Munis rallied modestly through the first five months of the period as U.S. economic conditions generally improved, providing a lift to munis and other credit-sensitive instruments. But market conditions changed dramatically from November 2010 through January 2011 as a supply and demand imbalance triggered a sharp decline in the muni market. Supply rose substantially as muni issuers rushed to take advantage of the Build America Bonds (BABs) program (in which states and municipalities issue taxable securities with federally subsidized interest rates) before its expiration at the end of 2010. Meanwhile, demand cratered as credit concerns—sparked by persistent state budget deficits and exaggerated media predictions of widespread muni defaults—led to heavy outflows from muni mutual funds.
The muni market bottomed in mid-January and then rebounded during the remainder of the period as a number of opportunistic, non-traditional “cross-over” investors gravitated to relatively attractive muni yields. Limited new issuance also contributed favorably to muni market performance—new muni issuance in the first five months of 2011 fell by 51% compared with the same period in 2010, constrained by issuer austerity measures and the expiration of the BABs program, which accelerated into 2010 many new issues that would otherwise have come to market in early 2011.
However, the severe decline from November through January dropped munis to the lower end of the investment return spectrum in a 12-month period dominated by stocks and high-yield corporate bonds. In addition, munis generally trailed the returns of Treasury securities and the broad taxable bond market. Intermediate-term munis fared best as short-term munis were held in check by a stable interest rate policy from the Federal Reserve, while longer-term munis suffered disproportionately from muni fund outflows. From a credit and sector perspective, higher-quality munis outperformed lower-rated credits, while general obligation bonds outpaced tax revenue bonds. Within the revenue bond segment, essential services bonds posted the best results, while health care lagged.
| U.S. Fixed-Income Total Returns |
| For the 12 months ended May 31, 2011 |
| Barclays Capital Municipal Market Indices | | Barclays Capital U.S. Taxable Market Indices |
| 7 Year Municipal Bond | 5.22% | | Aggregate Bond | 5.84% |
| Municipal High Yield Bond | 4.04% | | Treasury Bond | 4.49% |
| Municipal Bond | 3.18% | | | |
| Long-Term Municipal Bond | 1.49% | | |
| Total Returns as of May 31, 2011 |
| | | | Average Annual Returns | |
| | Ticker Symbol | 1 year | 5 years | 10 years | Since Inception | Inception Date |
| Investor Class | TWTIX | 3.31% | 4.61% | 4.47% | 5.26% | 3/2/87 |
Barclays Capital 7 Year Municipal Bond Index(1) | — | 5.22% | 5.85% | 5.25% | N/A(2) | — |
Barclays Capital 5 Year General Obligation Bond Index | — | 4.32% | 5.51% | 4.78% | 5.55%(3) | — |
| Institutional Class | AXBIX | 3.51% | 4.82% | — | 4.18% | 4/15/03 |
A Class No sales charge* With sales charge* | TWWOX | 3.05% -1.57% | — — | — — | 3.54% -0.21% | 3/1/10 |
| C Class | TWTCX | 2.28% | — | — | 2.70% | 3/1/10 |
| * | Sales charges include initial sales charges and contingent deferred sales charges (CDSCs), as applicable. A Class shares have a 4.50% maximum initial sales charge and may be subject to a maximum CDSC of 1.00%. C Class shares redeemed within 12 months of purchase are subject to a maximum CDSC of 1.00%. The SEC requires that mutual funds provide performance information net of maximum sales charges in all cases where charges could be applied. |
| (1) | Effective August 1, 2010, the fund’s benchmark changed from the Barclays Capital 5 Year General Obligation Bond Index to the Barclays Capital 7 Year Municipal Bond Index. This change was effected to better align the benchmark’s duration with the fund’s duration. |
| (2) | Benchmark data first available 1/1/90. |
| (3) | Since 2/28/87, the date nearest the Investor Class’s inception for which data are available. |
Data presented reflect past performance. Past performance is no guarantee of future results. Current performance may be higher or lower than the performance shown. Investment return and principal value will fluctuate, and redemption value may be more or less than original cost. To obtain performance data current to the most recent month end, please call 1-800-345-2021 or visit americancentury.com. As interest rates rise, bond values will decline. Investment income may be subject to certain state and local taxes and, depending on your tax status, the federal alternative minimum tax (AMT). Capital gains are not exempt from state and federal income tax.
Unless otherwise indicated, performance reflects Investor Class shares; performance for other share classes will vary due to differences in fee structure. For information about other share classes available, please consult the prospectus. Data assumes reinvestment of dividends and capital gains, and none of the charts reflect the deduction of taxes that a shareholder would pay on fund distributions or the redemption of fund shares. Returns for the indices are provided for comparison. The fund’s total returns include operating expenses (such as transaction costs and management fees) that reduce returns, while the total returns of the indices do not.
| Growth of $10,000 Over 10 Years |
| $10,000 investment made May 31, 2001 |
| Total Annual Fund Operating Expenses |
| Investor Class | Institutional Class | A Class | C Class |
| 0.48% | 0.28% | 0.73% | 1.48% |
The total annual fund operating expenses shown is as stated in the fund’s prospectus current as of the date of this report. The prospectus may vary from the expense ratio shown elsewhere in this report because it is based on a different time period, includes acquired fund fees and expenses, and, if applicable, does not include fee waivers or expense reimbursements.
Data presented reflect past performance. Past performance is no guarantee of future results. Current performance may be higher or lower than the performance shown. Investment return and principal value will fluctuate, and redemption value may be more or less than original cost. To obtain performance data current to the most recent month end, please call 1-800-345-2021 or visit americancentury.com. As interest rates rise, bond values will decline. Investment income may be subject to certain state and local taxes and, depending on your tax status, the federal alternative minimum tax (AMT). Capital gains are not exempt from state and federal income tax.
Unless otherwise indicated, performance reflects Investor Class shares; performance for other share classes will vary due to differences in fee structure. For information about other share classes available, please consult the prospectus. Data assumes reinvestment of dividends and capital gains, and none of the charts reflect the deduction of taxes that a shareholder would pay on fund distributions or the redemption of fund shares. Returns for the indices are provided for comparison. The fund’s total returns include operating expenses (such as transaction costs and management fees) that reduce returns, while the total returns of the indices do not.
Portfolio Managers: Alan Kruss, Joseph Gotelli, and Steven Permut
Performance Summary
Intermediate-Term Tax-Free Bond returned 3.31%* for the fiscal year ended May 31, 2011. By comparison, the Barclays Capital 7 Year Municipal Bond Index returned 5.22%, while the average return of the intermediate municipal debt funds tracked by Lipper Inc. was 3.36%.** (See page 4 and footnotes below for additional performance comparisons.)
The fund’s absolute return for the reporting period reflected the generally positive performance of broad municipal bond (muni) indices (see page 3). The fund’s performance was in line with the average return of its Lipper peer group but trailed the 7 Year index. According to Barclays Capital, this maturity segment produced the best returns in the muni market for the 12-month period. The portfolio’s weighted average maturity as of May 31, 2011, was 9.7 years.
Credit Environment
The improving economic environment over the past year led to gradual improvements in state and local tax receipts. In the first three months of 2011, state tax revenues were up more than 9% from the same period in 2010. Nonetheless, many state and local governments continue to wrestle with daunting budget deficits—holdovers from the Great Recession that have been exacerbated by lingering weakness in the labor and housing markets, as well as increasing pension and health care funding pressures. We saw credit rating downgrades across the spectrum of muni issuers, but despite dire warnings of widespread defaults, the few actual defaults were confined to smaller issuers, and the muni default rate remained at a fraction of the corporate bond default rate.
Governments at all levels are taking steps to close their budget gaps through a combination of austerity measures, reserve fund utilization, and tax increases, and we are seeing signs of progress. For example, the state of New York approved a balanced budget early for the first time since 1983, erasing a $10 billion shortfall. One added challenge for fiscal 2012 budgets is the loss of federal aid that states have received over the past several years. But we still believe that the worst of the difficulties are behind us.
Portfolio Positioning
The fund had a greater emphasis on higher-quality securities than its peer group, reflecting our policy of taking measured credit risk. This approach paid off during the reporting period as higher-rated securities outperformed, especially during the market volatility in late 2010 and early 2011.
| * | All fund returns referenced in this commentary are for Investor Class shares. |
| ** | The average returns for Lipper Intermediate Municipal Debt Funds category were 4.10% and 4.05% for the five- and ten-year periods ended May 31, 2011, respectively. Data provided by Lipper Inc. — A Reuters Company. © 2011 Reuters. All rights reserved. Any copying, republication or redistribution of Lipper content, including by caching, framing or similar means, is expressly prohibited without the prior written consent of Lipper. Lipper shall not be liable for any errors or delays in the content, or for any actions taken in reliance thereon. Lipper fund performance data is total return, and is preliminary and subject to revision. The data contained herein has been obtained from company reports, financial reporting services, periodicals and other resources believed to be reliable. Although carefully verified, data on compilations is not guaranteed by Lipper and may be incomplete. No offer or solicitations to buy or sell any of the securities herein is being made by Lipper. |
For much of the period, we limited the fund’s exposure to general obligation (GO) and local tax revenue bonds, given their budgetary challenges and the market’s response to them. However, non-traditional cross-over buyers that were drawn to the muni market in early 2011 flocked to large, liquid securities, including state GO bonds. As a result, our underweight position in GOs detracted from results. On the positive side, however, the fund benefited from individual security selection among GOs, with an emphasis on state GOs over local.
From a sector perspective, we focused on less economically sensitive sectors of the muni market. In particular, we emphasized essential services revenue bonds, which typically finance services such as water, sewer, and other utilities. Essential services bonds tend to be higher-quality securities, so they attracted demand from cross-over investors. Quality also factored into the underperformance of tobacco bonds, which are backed by a settlement agreement between 46 states and the major tobacco companies. Tobacco bonds tend to be lower-rated securities, which lagged during the period, so the fund’s limited exposure to these bonds contributed favorably to relative results.
We took most of our credit risk in the health care and higher education sectors, where we can use our fundamental credit research capabilities to find undervalued securities. However, the unusual supply and demand dynamics during the reporting period worked against these segments of the muni market, so our overweight positions detracted from performance.
Since late 2009, the fund has been positioned for a flatter Treasury yield curve (a narrower gap between short- and long-term Treasury yields). However, this positioning weighed on performance over the past year as the Treasury yield curve grew steeper, and it remains near historically wide levels. We are confident that this positioning will pay off over time as the Treasury curve eventually reverts to more normal levels.
Outlook
As we look to the second half of 2011, we believe that the supply and demand imbalances that have impacted the muni market over the last seven months will gradually abate, and fundamental credit stories will have a greater impact on muni performance going forward. We also believe that muni defaults will remain well below the levels predicted by some analysts at the end of last year.
As a result, we intend to maintain our current positioning, with an overweight position in high-quality essential services bonds, and selective investments in lower-rated health care and higher-education bonds. Among GOs, we remain underweight overall, but we favor state GOs over local GOs, as local governments face greater fiscal stress.
| MAY 31, 2011 | |
| Portfolio at a Glance | |
| Weighted Average Maturity | 9.7 years |
| Average Duration (Modified) | 5.2 years |
| | |
30-Day SEC Yields(1) | |
| Investor Class | 2.65% |
| Institutional Class | 2.85% |
| A Class | 2.29% |
| C Class | 1.66% |
Investor Class 30-Day Tax-Equivalent Yields(1)(2) | |
| 25.00% Tax Bracket | 3.53% |
| 28.00% Tax Bracket | 3.68% |
| 33.00% Tax Bracket | 3.96% |
| 35.00% Tax Bracket | 4.08% |
(1) Yields would have been lower if a portion of the management fee had not been waived. (2) The tax brackets indicated are for federal taxes only. Actual tax-equivalent yields may be lower, if alternative minimum tax is applicable. |
| | |
| Top Five States & Territories | % of net assets |
| California | 16.8% |
| New York | 10.8% |
| Texas | 6.1% |
| Pennsylvania | 5.6% |
| Illinois | 5.4% |
| | |
| Top Five Sectors | % of fund investments |
| General Obligation (GO) | 26% |
| Electric Revenue | 11% |
| Transportation Revenue | 11% |
| Hospital Revenue | 10% |
| Lease/Certificate of Participation | 9% |
| | |
| Types of Investments in Portfolio | % of net assets |
| Municipal Securities | 100.2% |
| Other Assets and Liabilities | (0.2)% |
Fund shareholders may incur two types of costs: (1) transaction costs, including sales charges (loads) on purchase payments and redemption/exchange fees; and (2) ongoing costs, including management fees; distribution and service (12b-1) fees; and other fund expenses. This example is intended to help you understand your ongoing costs (in dollars) of investing in your fund and to compare these costs with the ongoing cost of investing in other mutual funds.
The example is based on an investment of $1,000 made at the beginning of the period and held for the entire period from December 1, 2010 to May 31, 2011.
Actual Expenses
The table provides information about actual account values and actual expenses for each class. You may use the information, together with the amount you invested, to estimate the expenses that you paid over the period. First, identify the share class you own. Then simply divide your account value by $1,000 (for example, an $8,600 account value divided by $1,000 = 8.6), then multiply the result by the number under the heading “Expenses Paid During Period” to estimate the expenses you paid on your account during this period.
If you hold Investor Class shares of any American Century Investments fund, or Institutional Class shares of the American Century Diversified Bond Fund, in an American Century Investments account (i.e., not a financial intermediary or retirement plan account), American Century Investments may charge you a $12.50 semiannual account maintenance fee if the value of those shares is less than $10,000. We will redeem shares automatically in one of your accounts to pay the $12.50 fee. In determining your total eligible investment amount, we will include your investments in all personal accounts (including American Century Investments Brokerage accounts) registered under your Social Security number. Personal accounts include individual accounts, joint accounts, UGMA/UTMA accounts, personal trusts, Coverdell Education Savings Accounts and IRAs (including traditional, Roth, Rollover, SEP-, SARSEP- and SIMPLE-IRAs), and certain other retirement accounts. If you have only business, business retirement, employer-sponsored or American Century Investments Brokerage accounts, you are currently not subject to this fee. We will not charge the fee as long as you choose to manage your accounts exclusively online. If you are subject to the Account Maintenance Fee, your account value could be reduced by the fee amount.
Hypothetical Example for Comparison Purposes
The table also provides information about hypothetical account values and hypothetical expenses based on the actual expense ratio of each class of your fund and an assumed rate of return of 5% per year before expenses, which is not the actual return of a fund’s share class. The hypothetical account values and expenses may not be used to estimate the actual ending account balance or expenses you paid for the period. You may use this information to compare the ongoing costs of investing in your fund and other funds. To do so, compare this 5% hypothetical example with the 5% hypothetical examples that appear in the shareholder reports of the other funds.
Please note that the expenses shown in the table are meant to highlight your ongoing costs only and do not reflect any transactional costs, such as sales charges (loads) or redemption/exchange fees. Therefore, the table is useful in comparing ongoing costs only, and will not help you determine the relative total costs of owning different funds. In addition, if these transactional costs were included, your costs would have been higher.
| | | | | | | | | | | | | |
| | | Beginning Account Value 12/1/10 | | Ending Account Value 5/31/11 | | Expenses Paid During Period(1) 12/1/10 – 5/31/11 | | Annualized Expense Ratio(1) |
| Actual | | | | | | | | | | | | |
| Investor Class (after waiver) | | | $1,000 | | | | $1,020.10 | | | | $2.32 | | | | 0.46 | % |
| Investor Class (before waiver) | | | $1,000 | | | | $1,020.10 | (2) | | | $2.42 | | | | 0.48 | % |
| Institutional Class (after waiver) | | | $1,000 | | | | $1,021.10 | | | | $1.31 | | | | 0.26 | % |
| Institutional Class (before waiver) | | | $1,000 | | | | $1,021.10 | (2) | | | $1.41 | | | | 0.28 | % |
| A Class (after waiver) | | | $1,000 | | | | $1,018.80 | | | | $3.57 | | | | 0.71 | % |
| A Class (before waiver) | | | $1,000 | | | | $1,018.80 | (2) | | | $3.67 | | | | 0.73 | % |
| C Class (after waiver) | | | $1,000 | | | | $1,015.00 | | | | $7.33 | | | | 1.46 | % |
| C Class (before waiver) | | | $1,000 | | | | $1,015.00 | (2) | | | $7.44 | | | | 1.48 | % |
| Hypothetical | | | | | | | | | | | | | | | | |
| Investor Class (after waiver) | | | $1,000 | | | | $1,022.64 | | | | $2.32 | | | | 0.46 | % |
| Investor Class (before waiver) | | | $1,000 | | | | $1,022.54 | | | | $2.42 | | | | 0.48 | % |
| Institutional Class (after waiver) | | | $1,000 | | | | $1,023.64 | | | | $1.31 | | | | 0.26 | % |
| Institutional Class (before waiver) | | | $1,000 | | | | $1,023.54 | | | | $1.41 | | | | 0.28 | % |
| A Class (after waiver) | | | $1,000 | | | | $1,021.39 | | | | $3.58 | | | | 0.71 | % |
| A Class (before waiver) | | | $1,000 | | | | $1,021.29 | | | | $3.68 | | | | 0.73 | % |
| C Class (after waiver) | | | $1,000 | | | | $1,017.65 | | | | $7.34 | | | | 1.46 | % |
| C Class (before waiver) | | | $1,000 | | | | $1,017.55 | | | | $7.44 | | | | 1.48 | % |
| (1) | Expenses are equal to the class’s annualized expense ratio listed in the table above, multiplied by the average account value over the period, multiplied by 182, the number of days in the most recent fiscal half-year, divided by 365, to reflect the one-half year period. |
| (2) | Ending account value assumes the return earned after waiver and would have been lower if a portion of the management fee had not been waived. |
| | | | | | | |
| | | Principal Amount | | | Value | |
| Municipal Securities — 100.2% | |
| ALABAMA — 0.2% | |
East Central Industrial Development Auth. Rev., 5.25%, 9/1/13 (Ambac)(1) | | | $810,000 | | | | $812,641 | |
Helena Utilities Board Rev., 5.75%, 4/1/12, Prerefunded at 101% of Par (NATL)(1)(2) | | | 645,000 | | | | 680,243 | |
Helena Utilities Board Rev., 5.75%, 4/1/12, Prerefunded at 101% of Par (NATL)(1)(2) | | | 790,000 | | | | 833,165 | |
Helena Utilities Board Rev., 5.75%, 4/1/12, Prerefunded at 101% of Par (NATL)(1)(2) | | | 840,000 | | | | 885,898 | |
Helena Utilities Board Rev., 5.75%, 4/1/12, Prerefunded at 101% of Par (NATL)(1)(2) | | | 1,035,000 | | | | 1,091,552 | |
| | | | | | | | 4,303,499 | |
| ALASKA — 0.1% | |
Aleutians East Borough Project Rev., (Aleutian Pribilof Islands, Inc.), 5.00%, 6/1/20 (ACA)(1) | | | 1,875,000 | | | | 1,650,225 | |
| ARIZONA — 4.4% | |
Arizona Health Facilities Auth. Rev., (Blood Systems, Inc.), 4.00%, 4/1/12(1) | | | 1,275,000 | | | | 1,304,873 | |
Arizona Health Facilities Auth. Rev., (Blood Systems, Inc.), 5.00%, 4/1/21(1) | | | 1,000,000 | | | | 1,022,980 | |
Arizona Health Facilities Auth. Rev., Series 2007 B, (Banner Health), VRN, 1.01%, 7/1/11, resets quarterly at 67% of the 3-month LIBOR plus 0.81% with no caps(1) | | | 7,500,000 | | | | 5,158,875 | |
Arizona Health Facilities Auth. Rev., Series 2008 D, (Banner Health), 5.00%, 1/1/15(1) | | | 3,000,000 | | | | 3,285,690 | |
Arizona School Facilities Board Rev., (State School Improvement), 5.50%, 7/1/11, Prerefunded at 100% of Par(1)(2) | | | 1,750,000 | | | | 1,757,770 | |
Arizona State University COP, Series 2006 A, (University of Arizona), 5.00%, 6/1/18 (Ambac)(1) | | | 1,935,000 | | | | 2,091,967 | |
Arizona Tourism & Sports Auth. Rev., (Baseball Training Facilities), 5.00%, 7/1/11(1) | | | 1,000,000 | | | | 1,002,270 | |
Arizona Tourism & Sports Auth. Rev., (Baseball Training Facilities), 5.00%, 7/1/12(1) | | | 1,000,000 | | | | 1,026,970 | |
Arizona Tourism & Sports Auth. Rev., (Baseball Training Facilities), 5.00%, 7/1/13(1) | | | 1,880,000 | | | | 1,959,599 | |
Arizona Tourism & Sports Auth. Rev., Series 2003 A, (Multipurpose Stadium Facility), 5.25%, 7/1/17, Partially Prerefunded at 100% of Par (NATL)(1)(2) | | | 2,000,000 | | | | 2,062,760 | |
Arizona Water Infrastructure Finance Auth. Rev., Series 2010 A, 5.00%, 10/1/18(1) | | | 3,000,000 | | | | 3,575,340 | |
Arizona Water Infrastructure Finance Auth. Rev., Series 2010 A, (Water Quality), 5.00%, 10/1/30(1) | | | 5,000,000 | | | | 5,355,800 | |
Energy Management Services LLC Rev., (Arizona State University-Main Campus), 4.50%, 7/1/11 (NATL)(1) | | | 1,910,000 | | | | 1,916,838 | |
Energy Management Services LLC Rev., (Arizona State University-Main Campus), 4.50%, 7/1/12 (NATL)(1) | | | 2,130,000 | | | | 2,223,464 | |
Maricopa County Gilbert Unified School District No. 41 GO, 5.75%, 7/1/11 (AGM)(1) | | | 1,155,000 | | | | 1,160,313 | |
Maricopa County Phoenix Union High School District No. 210 GO, 4.75%, 7/1/11 (AGM)(1) | | | 1,445,000 | | | | 1,450,390 | |
Maricopa County Saddle Mountain Unified School District No. 90 GO, Series 2003 A, (School Improvements), 5.25%, 7/1/11(1) | | | 2,415,000 | | | | 2,421,835 | |
Maricopa County Saddle Mountain Unified School District No. 90 GO, Series 2003 A, (School Improvements), 5.25%, 7/1/12(1) | | | 2,000,000 | | | | 2,069,720 | |
Maricopa County Scottsdale Unified School District No. 48 GO, 6.60%, 7/1/12(1) | | | 1,000,000 | | | | 1,064,990 | |
Mohave County Industrial Development Auth. Correctional Facilities Contract Rev., (Mohave Prison, LLC Expansion), 8.00%, 5/1/25(1) | | | $5,000,000 | | | | $5,503,150 | |
Mohave County Industrial Development Auth. Rev., Series 2004 A, (Mohave Prison, LLC), 5.00%, 4/1/14 (XLCA)(1)(2) | | | 1,655,000 | | | | 1,855,288 | |
Navajo County Unified School District No. 20 Rev., Series 2006 A, 5.00%, 7/1/17 (NATL)(1) | | | 1,815,000 | | | | 2,065,706 | |
Phoenix Civic Improvement Corp. Airport Rev., Series 2010 A, (Junior Lien), 5.00%, 7/1/40(1) | | | 3,000,000 | | | | 2,856,480 | |
Phoenix Civic Improvement Corp. Wastewater System Rev., (Senior Lien), 5.50%, 7/1/24(1) | | | 1,750,000 | | | | 1,956,780 | |
Phoenix Civic Improvement Corp. Water System Rev., (Junior Lien), 5.50%, 7/1/19 (NATL/FGIC)(1) | | | 1,000,000 | | | | 1,046,580 | |
Phoenix GO, Series 1995 A, 6.25%, 7/1/17(1) | | | 1,070,000 | | | | 1,332,075 | |
Phoenix Industrial Development Auth. Government Office Lease Rev., (Capitol Mall LLC), 5.00%, 9/15/26 (Ambac)(1) | | | 1,750,000 | | | | 1,768,358 | |
Pima County Indian Oasis Elementary School District No. 40 Rev., Series 2002 A, 4.60%, 7/1/12, Prerefunded at 100% of Par (NATL)(1)(2) | | | 920,000 | | | | 961,777 | |
Pima County Indian Oasis-Baboquivari Unified School District No. 40 Rev., Series 2002 A, 4.60%, 7/1/13 (NATL)(1) | | | 280,000 | | | | 289,828 | |
Pima County Metropolitan Domestic Water Improvement District Rev., 5.25%, 7/1/18 (Ambac)(1) | | | 1,710,000 | | | | 1,933,446 | |
Pima County Metropolitan Domestic Water Improvement District Rev., 5.25%, 7/1/19 (Ambac)(1) | | | 1,800,000 | | | | 2,025,450 | |
Pima County Tucson School District No. 1 GO, 4.625%, 7/1/13 (AGM)(1) | | | 885,000 | | | | 921,090 | |
Pima County Tucson School District No. 1 GO, 4.625%, 7/1/13 (AGM)(1)(2) | | | 1,715,000 | | | | 1,796,222 | |
Pinal County Apache Junction Unified School District No. 43 GO, Series 2006 B, (School Improvements), 5.00%, 7/1/16, Prerefunded at 100% of Par (FGIC)(1)(2) | | | 775,000 | | | | 923,808 | |
Pinal County COP, 4.75%, 6/1/11, Prerefunded at 101% of Par (Ambac)(1)(2) | | | 820,000 | | | | 828,200 | |
Pinal County COP, 5.00%, 12/1/25(1) | | | 3,920,000 | | | | 3,947,479 | |
Queen Creek Improvement District No. 1 Special Assessment Rev., 5.00%, 1/1/16(1) | | | 1,000,000 | | | | 1,001,640 | |
Salt River Agricultural Improvement & Power District Rev., Series 2008 A, (Electric System Distribution), 5.00%, 1/1/38(1) | | | 4,900,000 | | | | 5,036,661 | |
Salt River Agricultural Improvement & Power District Rev., Series 2009 A, (Electric System Distribution), 5.00%, 1/1/39(1) | | | 4,060,000 | | | | 4,187,728 | |
South Tucson Municipal Property Corp. Rev., 5.50%, 6/1/11, Prerefunded at 100% of Par(1)(2) | | | 3,085,000 | | | | 3,085,000 | |
University of Arizona COP, Series 2002 A, 5.50%, 6/1/12, Prerefunded at 100% of Par (Ambac)(1)(2) | | | 1,505,000 | | | | 1,581,845 | |
| | | | | | | | 88,817,035 | |
| CALIFORNIA — 16.8% | |
California Department of Water Resources Power Supply Rev., Series 2005 F5, 5.00%, 5/1/22(1) | | | 6,215,000 | | | | 6,948,619 | |
California Department of Water Resources Power Supply Rev., Series 2005 G4, 5.00%, 5/1/16(1) | | | 2,450,000 | | | | 2,864,956 | |
California Department of Water Resources Power Supply Rev., Series 2008 AE, (Central Valley), 5.00%, 12/1/22(1) | | | 3,000,000 | | | | 3,378,510 | |
California Department of Water Resources Power Supply Rev., Series 2008 H, 5.00%, 5/1/21(1) | | | 10,000,000 | | | | 11,255,300 | |
California Department of Water Resources Power Supply Rev., Series 2009 AF, (Central Valley), 5.00%, 12/1/22(1) | | | $10,000,000 | | | | $11,399,900 | |
California Department of Water Resources Power Supply Rev., Series 2010 L, 5.00%, 5/1/19(1) | | | 5,000,000 | | | | 5,900,150 | |
California Department of Water Resources Power Supply Rev., Series 2010 M, 5.00%, 5/1/15(1) | | | 3,750,000 | | | | 4,303,650 | |
California Educational Facilities Auth. Rev., Series 2009 A, (Pomona College), 5.00%, 1/1/24(1) | | | 3,500,000 | | | | 3,909,885 | |
California GO, 5.00%, 10/1/16(1) | | | 10,000,000 | | | | 11,540,300 | |
California GO, 5.00%, 10/1/18(1) | | | 10,000,000 | | | | 11,533,500 | |
California GO, 5.75%, 4/1/31(1) | | | 16,630,000 | | | | 17,846,484 | |
California GO, 6.00%, 4/1/38(1) | | | 5,000,000 | | | | 5,335,400 | |
California GO, 5.50%, 11/1/39(1) | | | 10,000,000 | | | | 10,260,200 | |
California GO, Series 2009 B, VRDN, 5.00%, 7/1/14(1) | | | 8,000,000 | | | | 8,872,480 | |
California Health Facilities Financing Auth. Rev., Series 2008 A3, (Stanford Hospital), VRDN, 3.45%, 6/15/11(1) | | | 2,300,000 | | | | 2,302,737 | |
California Health Facilities Financing Auth. Rev., Series 2008 C, (Providence Health & Services), 6.50%, 10/1/18, Prerefunded at 100% of Par(2) | | | 35,000 | | | | 45,517 | |
California Health Facilities Financing Auth. Rev., Series 2008 C, (Providence Health & Services), 6.50%, 10/1/38(1) | | | 2,090,000 | | | | 2,278,978 | |
California Health Facilities Financing Auth. Rev., Series 2008 I, (Catholic Healthcare West), 5.125%, 7/1/22(1) | | | 5,725,000 | | | | 5,919,879 | |
California Health Facilities Financing Auth. Rev., Series 2009 A, (Adventist Health System West), 5.75%, 9/1/39(1) | | | 2,500,000 | | | | 2,465,400 | |
California Health Facilities Financing Auth. Rev., Series 2009 A, (Catholic Healthcare West), 5.50%, 7/1/22(1) | | | 5,000,000 | | | | 5,363,500 | |
California Health Facilities Financing Auth. Rev., Series 2009 A, (Children’s Hospital of Orange County), 6.50%, 11/1/38(1) | | | 10,000,000 | | | | 10,433,300 | |
California Municipal Finance Auth. Rev., (Community Hospital of Central California), 5.50%, 2/1/39(1) | | | 1,450,000 | | | | 1,236,748 | |
| California Municipal Finance Auth. Rev., Series 2010 A, (University of La Verne), 6.25%, 6/1/40 | | | 1,500,000 | | | | 1,490,070 | |
California Public Works Board Lease Rev., Series 2009 A, (Department General Services-Buildings 8 & 9), 6.25%, 4/1/34(1) | | | 4,000,000 | | | | 4,182,000 | |
California Public Works Board Lease Rev., Series 2009 G1, 5.00%, 10/1/16(1) | | | 10,000,000 | | | | 11,012,200 | |
California Public Works Board Lease Rev., Series 2009 I1, 5.375%, 11/1/22(1) | | | 8,000,000 | | | | 8,420,880 | |
California Statewide Communities Development Auth. Rev., (Proposition 1A Receivables), 5.00%, 6/15/13(1) | | | 14,500,000 | | | | 15,532,835 | |
California Statewide Communities Development Auth. Rev., Series 2001 B, (Kaiser Permanente), VRDN, 3.90%, 7/1/14(1) | | | 2,000,000 | | | | 2,133,160 | |
California Statewide Communities Development Auth. Rev., Series 2009 A, (Kaiser Permanente), 5.00%, 4/1/16(1) | | | 8,000,000 | | | | 8,982,480 | |
California Statewide Communities Development Auth. Water & Waste Rev., Series 2004 A, (Pooled Financing Program), 5.00%, 10/1/12 (AGM)(1)(2) | | | 230,000 | | | | 244,357 | |
California Statewide Communities Development Auth. Water & Waste Rev., Series 2004 A, (Pooled Financing Program), 5.00%, 10/1/12 (AGM)(1) | | | 845,000 | | | | 890,630 | |
California Statewide Communities Development Auth. Water & Waste Rev., Series 2004 A, (Pooled Financing Program), 5.25%, 10/1/13, Prerefunded at 101% of Par (AGM)(1)(2) | | | $430,000 | | | | $481,944 | |
California Statewide Communities Development Auth. Water & Waste Rev., Series 2004 A, (Pooled Financing Program), 5.25%, 10/1/19 (AGM)(1) | | | 1,570,000 | | | | 1,702,665 | |
Foothill-De Anza Community College District GO, Series 2007 B, 5.00%, 8/1/17 (Ambac)(1) | | | 3,510,000 | | | | 4,020,565 | |
Foothill-De Anza Community College District GO, Series 2007 B, (Election of 2006), 5.00%, 8/1/27 (Ambac)(1) | | | 1,725,000 | | | | 1,812,095 | |
Golden State Tobacco Securitization Corp. Settlement Rev., Series 2007 A1, 5.125%, 6/1/47(1) | | | 3,000,000 | | | | 1,866,090 | |
Hesperia Unified School District COP, (2007 Capital Improvement), 5.00%, 2/1/17 (Ambac)(1) | | | 1,070,000 | | | | 1,161,999 | |
Imperial Irrigation District COP, (Water System), 5.50%, 7/1/11, Prerefunded at 101% of Par (Ambac)(2) | | | 1,170,000 | | | | 1,186,848 | |
Imperial Irrigation District COP, (Water System), 5.50%, 7/1/29 (Ambac)(1) | | | 1,830,000 | | | | 1,848,703 | |
Los Angeles Community College District GO, Series 2008 E1, (Election of 2001), 5.00%, 8/1/20(1) | | | 2,250,000 | | | | 2,524,140 | |
Los Angeles Department of Water & Power Waterworks Rev., Series 2009 B, 5.00%, 7/1/20(1) | | | 5,000,000 | | | | 5,788,700 | |
Los Angeles Unified School District GO, Series 2009 D, 5.00%, 7/1/18(1) | | | 2,300,000 | | | | 2,667,862 | |
Los Angeles Unified School District GO, Series 2009 D, 5.00%, 7/1/20(1) | | | 6,065,000 | | | | 6,878,559 | |
Los Angeles Unified School District GO, Series 2009 I, 5.00%, 7/1/21(1) | | | 6,520,000 | | | | 7,268,822 | |
Manteca Unified School District GO, 5.25%, 8/1/14, Prerefunded at 100% of Par (AGM)(1)(2) | | | 2,200,000 | | | | 2,521,222 | |
Metropolitan Water District of Southern California Rev., Series 2009 C, 5.00%, 7/1/35(1) | | | 2,300,000 | | | | 2,385,813 | |
Metropolitan Water District of Southern California Rev., Series 2011 A2, VRDN, 0.30%, 6/2/11(3) | | | 7,500,000 | | | | 7,500,000 | |
Metropolitan Water District of Southern California Rev., Series 2011 A4, VRDN, 0.30%, 6/2/11(3) | | | 7,410,000 | | | | 7,410,000 | |
Northern California Power Agency Rev., Series 2008 C, (Hydroelectric Project Number One), 5.00%, 7/1/19 (AGC)(1) | | | 2,300,000 | | | | 2,614,479 | |
Northern California Power Agency Rev., Series 2008 C, (Hydroelectric Project Number One), 5.00%, 7/1/20 (AGC)(1) | | | 2,500,000 | | | | 2,808,400 | |
Northern California Power Agency Rev., Series 2008 C, (Hydroelectric Project Number One), 5.00%, 7/1/21 (AGC)(1) | | | 5,000,000 | | | | 5,541,200 | |
Northern California Power Agency Rev., Series 2010 A, 5.00%, 7/1/16(1) | | | 1,000,000 | | | | 1,143,260 | |
Northern California Power Agency Rev., Series 2010 A, 5.00%, 7/1/17(1) | | | 1,500,000 | | | | 1,719,030 | |
| Palomar Pomerado Health Care District COP, 6.00%, 11/1/41 | | | 5,735,000 | | | | 5,128,065 | |
Plumas Unified School District GO, 5.25%, 8/1/20 (AGM)(1) | | | 1,000,000 | | | | 1,140,290 | |
San Bernardino Community College District GO, Series 2008 A, (Election of 2002), 6.25%, 8/1/33(1) | | | 4,700,000 | | | | 5,227,622 | |
San Diego Public Facilities Financing Sewer Auth. Rev., Series 2010 A, 5.25%, 5/15/24(1) | | | 6,600,000 | | | | 7,373,124 | |
San Diego Public Facilities Financing Water Auth. Rev., Series 2010 A, 5.00%, 8/1/22(1) | | | 2,000,000 | | | | 2,249,120 | |
San Diego Public Facilities Financing Water Auth. Rev., Series 2010 A, 5.00%, 8/1/23(1) | | | 3,000,000 | | | | 3,319,380 | |
San Francisco City and County Airports Commission Rev., Series 2008-34F, 5.00%, 5/1/17 (AGC)(1) | | | $4,140,000 | | | | $4,717,116 | |
San Francisco Uptown Parking Corp. Rev., (Union Square), 5.50%, 7/1/15 (NATL)(1) | | | 1,505,000 | | | | 1,538,878 | |
San Francisco Uptown Parking Corp. Rev., (Union Square), 6.00%, 7/1/20 (NATL)(1) | | | 1,000,000 | | | | 1,023,940 | |
San Francisco Uptown Parking Corp. Rev., (Union Square), 6.00%, 7/1/31 (NATL)(1) | | | 2,000,000 | | | | 2,046,040 | |
San Marcos Public Facilities Auth. Tax Allocation Rev., Series 2006 A, (Project Area No. 3), 5.00%, 8/1/20 (Ambac)(1) | | | 1,525,000 | | | | 1,510,421 | |
Southern California Public Power Auth. Rev., Series 2008 A, (Southern Transmission), 5.00%, 7/1/22(1) | | | 2,875,000 | | | | 3,137,746 | |
Tuolumne Wind Project Auth. Rev., Series 2009 A, 5.625%, 1/1/29(1) | | | 2,800,000 | | | | 3,005,016 | |
Twin Rivers Unified School District COP, (Facility Bridge Program), VRDN, 3.50%, 5/31/13 (AGM)(1) | | | 10,000,000 | | | | 10,004,000 | |
Vernon Electric System Rev., Series 2009 A, 5.125%, 8/1/21(1) | | | 9,000,000 | | | | 9,254,520 | |
Vista COP, (Community Projects), 5.00%, 5/1/37 (NATL)(1) | | | 5,300,000 | | | | 4,817,170 | |
| | | | | | | | 336,628,849 | |
| COLORADO — 2.0% | |
Arapahoe County Water & Wastewater Public Improvement District GO, Series 2002 B, 5.75%, 12/1/17 (NATL)(1) | | | 1,100,000 | | | | 1,150,820 | |
Aurora Hospital Rev., (Children’s Hospital Association), 5.00%, 12/1/40(1) | | | 1,250,000 | | | | 1,154,163 | |
Colorado Educational & Cultural Facilities Auth. Rev., (Northwest Nazarene University Facilities), 4.60%, 11/1/16(1) | | | 760,000 | | | | 766,969 | |
| Colorado Educational & Cultural Facilities Auth. Rev., Series 2007 A10, (Jewish Federation), VRDN, 0.14%, 6/1/11 (LOC: Bank of America N.A.) | | | 1,800,000 | | | | 1,800,000 | |
Colorado Health Facilities Auth. Rev., (Catholic Health Initiatives), 6.00%, 10/1/23(1) | | | 1,500,000 | | | | 1,715,580 | |
Colorado Health Facilities Auth. Rev., (Yampa Valley Medical Center), 5.00%, 9/15/11(1) | | | 1,280,000 | | | | 1,289,382 | |
Colorado Health Facilities Auth. Rev., Series 2006 B, (Longmont United Hospital), 5.00%, 12/1/20 (Radian)(1) | | | 1,000,000 | | | | 1,010,240 | |
Colorado Water Resources & Power Development Auth. Rev., Series 2000 A, 6.25%, 9/1/16(1) | | | 50,000 | | | | 50,736 | |
Denver City and County Airport Rev., Series 2010 A, 5.00%, 11/15/21(1) | | | 2,500,000 | | | | 2,771,600 | |
Douglas & Elbert Counties School District No. Re-1 GO, Series 2002 B, 5.75%, 12/15/12, Prerefunded at 100% of Par (AGM)(1)(2) | | | 1,000,000 | | | | 1,082,070 | |
El Paso County School District No. 8 & Fountain-Fort Carson School District Finance Corp. COP, 4.25%, 12/15/13 (Ambac)(1) | | | 1,020,000 | | | | 1,031,740 | |
Regional Transportation District COP, Series 2010 A, 5.50%, 6/1/21(1) | | | 2,000,000 | | | | 2,256,140 | |
| Regional Transportation District Private Activity Rev., (Denver Transit Partners), 5.25%, 7/15/19 | | | 3,600,000 | | | | 3,771,828 | |
| Regional Transportation District Private Activity Rev., (Denver Transit Partners), 5.25%, 1/15/20 | | | 4,835,000 | | | | 4,966,270 | |
| Regional Transportation District Private Activity Rev., (Denver Transit Partners), 5.00%, 7/15/20 | | | 2,895,000 | | | | 2,924,413 | |
| Regional Transportation District Private Activity Rev., (Denver Transit Partners), 5.00%, 1/15/21 | | | 1,400,000 | | | | 1,390,424 | |
| Regional Transportation District Private Activity Rev., (Denver Transit Partners), 5.00%, 7/15/21 | | | 1,400,000 | | | | 1,390,046 | |
| Regional Transportation District Private Activity Rev., (Denver Transit Partners), 5.00%, 1/15/22 | | | $1,400,000 | | | | $1,373,932 | |
| Regional Transportation District Private Activity Rev., (Denver Transit Partners), 5.00%, 7/15/22 | | | 1,500,000 | | | | 1,471,095 | |
| Regional Transportation District Private Activity Rev., (Denver Transit Partners), 6.00%, 1/15/41 | | | 1,000,000 | | | | 1,002,700 | |
University of Colorado Enterprise System Rev., Series 2009 A, 5.25%, 6/1/30(1) | | | 1,200,000 | | | | 1,276,068 | |
University of Colorado Regents COP, 6.00%, 6/1/12, Prerefunded at 100% of Par (NATL-IBC)(1)(2) | | | 5,000,000 | | | | 5,274,400 | |
| | | | | | | | 40,920,616 | |
| CONNECTICUT — 1.4% | |
Bridgeport GO, Series 2004 A, 5.25%, 8/15/14, Prerefunded at 100% of Par (NATL)(1)(2) | | | 2,150,000 | | | | 2,460,632 | |
Connecticut Economic Recovery GO, Series 2009 A, 5.00%, 1/1/13(1) | | | 5,000,000 | | | | 5,356,450 | |
Connecticut Economic Recovery GO, Series 2009 A, 5.00%, 1/1/14(1) | | | 3,900,000 | | | | 4,316,364 | |
Connecticut GO, Series 2001 C, 5.50%, 12/15/13 (NATL-IBC)(1) | | | 4,000,000 | | | | 4,486,080 | |
Connecticut GO, Series 2006 C, 5.00%, 6/1/14(1) | | | 5,000,000 | | | | 5,607,000 | |
Connecticut GO, Series 2006 D, 5.00%, 11/1/15(1) | | | 1,595,000 | | | | 1,850,551 | |
Connecticut Health & Educational Facilities Auth. Rev., Series 2007 I, (Quinnipiac University), 5.00%, 7/1/16 (NATL)(1) | | | 2,660,000 | | | | 2,994,495 | |
| Connecticut Health & Educational Facilities Auth. Rev., Series 2008 B, VRDN, 0.15%, 6/1/11 (LOC: Bank of America N.A.) | | | 1,300,000 | | | | 1,300,000 | |
| | | | | | | | 28,371,572 | |
| DISTRICT OF COLUMBIA — 0.9% | |
District of Columbia Rev., (Gonzaga College High School), 5.20%, 7/1/12 (AGM)(1) | | | 835,000 | | | | 838,106 | |
District of Columbia Rev., Series 2010 A, 5.00%, 12/1/19(1) | | | 5,000,000 | | | | 5,931,250 | |
District of Columbia Water & Sewer Auth. Public Utility Rev., Series 2008 A, (Subordinated Lien), 5.00%, 10/1/34 (AGC)(1) | | | 1,200,000 | | | | 1,226,148 | |
Metropolitan Washington Airports Auth. Rev., Series 2009 A, (First Senior Lien), 5.00%, 10/1/39(1) | | | 5,000,000 | | | | 4,973,400 | |
Washington Metropolitan Area Transit Auth. Rev., Series 2009 A, 5.00%, 7/1/17(1) | | | 4,600,000 | | | | 5,302,650 | |
| | | | | | | | 18,271,554 | |
| FLORIDA — 4.0% | |
Citizens Property Insurance Corp. Rev., Series 2008 A1, (Second High Risk Notes), 5.00%, 6/1/11(1) | | | 2,500,000 | | | | 2,500,000 | |
Citizens Property Insurance Corp. Rev., Series 2010 A1, (Second High Risk Notes), 5.25%, 6/1/17(1) | | | 5,800,000 | | | | 6,217,890 | |
Collier County School Board COP, 5.50%, 2/15/12 (AGM)(1) | | | 1,475,000 | | | | 1,524,191 | |
Escambia County Solid Waste Disposal System Rev., (Gulf Power Co.), VRDN, 0.19%, 6/1/11(1) | | | 1,500,000 | | | | 1,500,000 | |
Florida Hurricane Catastrophe Fund Finance Corp. Rev., Series 2008 A, 5.00%, 7/1/13(1) | | | 10,000,000 | | | | 10,759,200 | |
| Florida Municipal Power Agency Rev., Series 2009 A, (All Requirements Power), 5.25%, 10/1/20 | | | 2,000,000 | | | | 2,218,500 | |
| Florida Municipal Power Agency Rev., Series 2009 A, (All Requirements Power), 5.25%, 10/1/21 | | | 3,470,000 | | | | 3,813,322 | |
Halifax Hospital Medical Center Rev., Series 2006 A, 5.25%, 6/1/16(1) | | | 1,000,000 | | | | 1,094,420 | |
Halifax Hospital Medical Center Rev., Series 2006 A, 5.25%, 6/1/18(1) | | | 900,000 | | | | 958,833 | |
Halifax Hospital Medical Center Rev., Series 2006 B1, 5.50%, 6/1/38 (AGM)(1) | | | 1,000,000 | | | | 997,910 | |
Halifax Hospital Medical Center Rev., Series 2006 B2, 5.375%, 6/1/31 (AGM)(1) | | | 2,000,000 | | | | 2,018,560 | |
Indian River County Rev., (Spring Training Facility), 5.25%, 4/1/15 (NATL/FGIC)(1) | | | $1,235,000 | | | | $1,251,747 | |
Jacksonville Health Facilities Auth. Rev., Series 2007 C, (Baptist Healthcare System), VRDN, 0.14%, 6/1/11 (LOC: Bank of America N.A.(1) | | | 550,000 | | | | 550,000 | |
JEA Electric System Rev., Series 2009 A, 5.50%, 10/1/39(1) | | | 10,000,000 | | | | 10,131,100 | |
Miami Parking Facilities Rev., 5.25%, 10/1/15 (NATL)(1) | | | 650,000 | | | | 722,898 | |
Miami-Dade County Aviation Department Rev., Series 2007 D, (Miami International Airport), 5.25%, 10/1/26 (AGM)(1) | | | 4,650,000 | | | | 4,859,575 | |
Miami-Dade County Aviation Department Rev., Series 2010 B, 5.00%, 10/1/41(1) | | | 3,000,000 | | | | 2,781,720 | |
Miami-Dade County GO, (Double Barreled Aviation), 5.00%, 7/1/17(1) | | | 200,000 | | | | 231,904 | |
Miami-Dade County School Board COP, Series 2001 C, 5.50%, 10/1/11, Prerefunded at 100% of Par (AGM)(1)(2) | | | 1,000,000 | | | | 1,017,490 | |
Orange County School Board COP, Series 2002 A, 5.50%, 8/1/12, Prerefunded at 100% of Par (NATL)(1)(2) | | | 1,875,000 | | | | 1,989,169 | |
Orlando & Orange County Expressway Auth. Rev., (Junior Lien), 6.50%, 7/1/11 (NATL/FGIC)(1) | | | 450,000 | | | | 452,169 | |
Orlando Utilities Commission System Rev., Series 2009 B, 5.00%, 10/1/33(1) | | | 2,000,000 | | | | 2,071,300 | |
Orlando Utilities Commission Water & Electric Rev., Series 1989 D, 6.75%, 10/1/17(1)(2) | | | 1,000,000 | | | | 1,168,770 | |
Palm Beach County Health Facilities Auth. Rev., Series 2010 A, (Bethesda Healthcare System), 5.25%, 7/1/40 (AGM)(1) | | | 6,250,000 | | | | 6,144,438 | |
Putnam County Development Auth. Pollution Control Rev., Series 2007 B, (Seminole Electric Cooperative, Inc.), VRDN, 5.35%, 5/1/18(Ambac)(1) | | | 1,500,000 | | | | 1,616,460 | |
| South Lake County Hospital District Rev., Series 2010 A, (South Lake Hospital), 6.25%, 4/1/39 | | | 3,250,000 | | | | 3,224,227 | |
| St. Petersburg Health Facilities Auth. Rev., Series 2009 A, (All Children’s Health Facilities), 6.50%, 11/15/39 | | | 4,700,000 | | | | 5,093,531 | |
Sumter County School Board COP, 5.50%, 7/2/12, Prerefunded at 100% of Par (NATL)(1)(2) | | | 1,000,000 | | | | 1,056,950 | |
Sunrise Florida Utilities System Rev., 5.20%, 10/1/22 (Ambac)(2) | | | 430,000 | | | | 503,599 | |
| Sunrise Florida Utilities System Rev., 5.20%, 10/1/22 (Ambac) | | | 570,000 | | | | 617,139 | |
Tampa Guaranteed Entitlement Rev., 6.00%, 10/1/18 (Ambac)(1) | | | 340,000 | | | | 379,919 | |
Tampa Water & Sewer Rev., 6.00%, 10/1/17 (AGM)(1) | | | 1,000,000 | | | | 1,211,290 | |
| | | | | | | | 80,678,221 | |
| GEORGIA — 3.8% | |
Appling County Development Auth. Pollution Control Rev., (Georgia Power Co. Plant Hatch), VRDN, 0.19%, 6/1/11(1) | | | 2,500,000 | | | | 2,500,000 | |
Athens-Clarke County Unified Government Water & Sewer Rev., 5.625%, 1/1/28(1) | | | 1,200,000 | | | | 1,319,424 | |
Atlanta Rev., Series 2009 A, 6.00%, 11/1/27(1) | | | 5,000,000 | | | | 5,474,600 | |
Atlanta Rev., Series 2009 A, 6.00%, 11/1/28(1) | | | 3,000,000 | | | | 3,265,140 | |
| De Kalb County Hospital Antic Auth. Rev., (De Kalb Medical Center, Inc.), 6.125%, 9/1/40 | | | 2,450,000 | | | | 2,308,807 | |
Floyd County Development Auth. Pollution Control Rev., (Georgia Power Co. Plant Hammond), VRDN, 0.19%, 6/1/11(1) | | | 2,900,000 | | | | 2,900,000 | |
Fulton County Development Auth. Rev., Series 2001 A, (TUFF/Atlanta Housing, LLC Project at Georgia State University), 5.50%, 9/1/18 (Ambac)(1) | | | 1,250,000 | | | | 1,279,825 | |
Georgia GO, Series 2009 G, 5.00%, 11/1/16(1) | | | 2,000,000 | | | | 2,378,660 | |
Georgia GO, Series 2009 I, 5.00%, 7/1/16(1) | | | $10,000,000 | | | | $11,816,900 | |
Georgia GO, Series 2009 I, 5.00%, 7/1/19(1) | | | 10,000,000 | | | | 12,042,400 | |
Georgia Municipal Electric Auth. Rev., Series 2008 A, (Project 1), 5.25%, 1/1/17(1) | | | 5,000,000 | | | | 5,644,150 | |
Georgia Municipal Electric Auth. Rev., Series 2008 D, (Project 1), 5.50%, 1/1/26(1) | | | 4,800,000 | | | | 5,158,944 | |
Georgia Municipal Electric Power Auth. Rev., Series 1991 V, 6.50%, 1/1/12 (NATL-IBC) (Bank of New York)(1)(2) | | | 60,000 | | | | 62,190 | |
Georgia Municipal Electric Power Auth. Rev., Series 1991 V, 6.50%, 1/1/12 (NATL-IBC) (Bank of New York)(1) | | | 190,000 | | | | 195,544 | |
Georgia Road & Tollway Auth. Rev., Series 2008 A, (Federal Highway Grant Antic Bonds), 5.00%, 6/1/16(1) | | | 6,350,000 | | | | 7,439,152 | |
Georgia Road & Tollway Auth. Rev., Series 2009 A, (Federal Highway Grant Antic Bonds), 5.00%, 6/1/21(1) | | | 4,000,000 | | | | 4,586,080 | |
LaGrange Water & Sewerage Rev., 5.00%, 1/1/12 (Ambac)(1) | | | 2,000,000 | | | | 2,050,740 | |
Marietta Development Auth. Rev., (Life University, Inc.), 6.25%, 6/15/20(1) | | | 930,000 | | | | 922,383 | |
Private Colleges & Universities Auth. Rev., Series 2009 B, (Emory University), 5.00%, 9/1/35(1) | | | 1,000,000 | | | | 1,032,330 | |
Putnam County Development Auth. Pollution Control Rev., (Georgia Power Co. – Plant Branch), VRDN, 0.19%, 6/1/11(1) | | | 4,100,000 | | | | 4,100,000 | |
| | | | | | | | 76,477,269 | |
| GUAM — 0.2% | |
Guam Government Department of Education COP., Series 2010 A, (John F. Kennedy High School), 6.875%, 12/1/40(1) | | | 1,500,000 | | | | 1,441,935 | |
Guam Government GO, Series 2009 A, 6.75%, 11/15/29(1) | | | 2,850,000 | | | | 2,901,215 | |
| | | | | | | | 4,343,150 | |
| HAWAII — 0.4% | |
Hawaii GO, Series 2010 DY, 5.00%, 2/1/15(1) | | | 1,000,000 | | | | 1,133,390 | |
Hawaii Pacific Health Special Purpose Rev., Series 2010 B, 5.75%, 7/1/40(1) | | | 800,000 | | | | 743,616 | |
Hawaii Pacific Health Rev., Series 2010 A, 5.50%, 7/1/40(1) | | | 3,500,000 | | | | 3,124,275 | |
Honolulu City and County GO, Series 2009 A, 5.00%, 4/1/21(1) | | | 3,000,000 | | | | 3,473,340 | |
| | | | | | | | 8,474,621 | |
IDAHO(5) | |
Idaho Health Facilities Auth. Rev., (St. Luke’s Regional Medical Center), 5.00%, 7/1/35 (AGM)(1) | | | 250,000 | | | | 252,628 | |
| ILLINOIS — 5.4% | |
Bedford Park GO, Series 2004 A, 5.25%, 12/15/20 (AGM)(1) | | | 2,000,000 | | | | 2,195,400 | |
Bourbonnais Industrial Project Rev., (Olivet Nazarene University), 5.00%, 11/1/20(1) | | | 1,235,000 | | | | 1,231,283 | |
Chicago Board of Education GO, Series 2008 C, 5.25%, 12/1/23(1) | | | 5,000,000 | | | | 5,204,850 | |
Chicago Board of Education GO, Series 2010 F, 5.00%, 12/1/14(1) | | | 1,050,000 | | | | 1,143,923 | |
Chicago Board of Education GO, Series 2010 F, 5.00%, 12/1/15(1) | | | 1,250,000 | | | | 1,374,225 | |
Chicago Board of Education GO, Series 2010 F, 5.00%, 12/1/16(1) | | | 1,300,000 | | | | 1,437,657 | |
Chicago O’Hare International Airport Rev., Series 1993 A, (Senior Lien), 5.00%, 1/1/12 (NATL-IBC)(1) | | | 4,000,000 | | | | 4,099,080 | |
Chicago O’Hare International Airport Rev., Series 2008 A, 5.00%, 1/1/12 (AGM)(1) | | | 2,310,000 | | | | 2,369,159 | |
Chicago O’Hare International Airport Rev., Series 2008 A, 5.00%, 1/1/13 (AGM)(1) | | | 2,200,000 | | | | 2,331,604 | |
Chicago O’Hare International Airport Rev., Series 2008 A, 5.00%, 1/1/14 (AGM)(1) | | | 4,000,000 | | | | 4,342,240 | |
Chicago O’Hare International Airport Rev., Series 2008 C, 4.00%, 1/1/17 (AGM)(1) | | | 600,000 | | | | 640,968 | |
Chicago O’Hare International Airport Rev., Series 2011 A, (Third Lien), 5.75%, 1/1/39(1) | | | $2,000,000 | | | | $2,043,480 | |
Chicago O’Hare International Airport Rev., Series 2011 B, (Third Lien), 5.00%, 1/1/16(1) | | | 1,000,000 | | | | 1,115,180 | |
Chicago O’Hare International Airport Rev., Series 2011 B, (Third Lien), 5.00%, 1/1/22(1) | | | 1,000,000 | | | | 1,071,110 | |
Chicago Rev., Series 2006 A, (Second Lien), 5.00%, 11/1/13 (Ambac)(1) | | | 1,015,000 | | | | 1,095,926 | |
Cicero GO, Series 2005 A, 5.25%, 1/1/20 (XLCA)(1) | | | 1,250,000 | | | | 1,253,988 | |
Cicero GO, Series 2005 A, 5.25%, 1/1/21 (XLCA)(1) | | | 1,000,000 | | | | 990,320 | |
Illinois Dedicated Tax Rev., (Civic Center), 6.25%, 12/15/20 (Ambac)(1) | | | 2,000,000 | | | | 2,271,300 | |
| Illinois Finance Auth. Rev., (Central DuPage Health), 5.00%, 11/1/27 | | | 3,595,000 | | | | 3,614,485 | |
Illinois Finance Auth. Rev., (Little Co. of Mary Hospital and Health Care Centers), 5.375%, 8/15/40(1) | | | 1,000,000 | | | | 906,640 | |
Illinois Finance Auth. Rev., Series 2008 D, (Advocate Health Care Network), 6.25%, 11/1/28(1) | | | 5,000,000 | | | | 5,516,550 | |
Illinois Finance Auth. Rev., Series 2009 C, (Rush University Medical Center), 6.375%, 11/1/29(1) | | | 5,000,000 | | | | 5,241,500 | |
Illinois Finance Auth. Rev., Series 2010 A, (Provena Health), 5.00%, 5/1/13(1) | | | 1,665,000 | | | | 1,712,952 | |
Illinois Finance Auth. Rev., Series 2010 A, (Provena Health), 5.00%, 5/1/14(1) | | | 1,000,000 | | | | 1,041,050 | |
| Illinois Finance Auth. Rev., Series 2010 A, (Provena Health), 5.25%, 5/1/16 | | | 1,000,000 | | | | 1,052,840 | |
Illinois Finance Auth. Rev., Series 2011 A, 6.00%, 8/15/41(1) | | | 2,000,000 | | | | 1,997,020 | |
Illinois GO, 5.50%, 8/1/15 (NATL)(1) | | | 1,795,000 | | | | 1,984,875 | |
Illinois GO, 5.00%, 1/1/17 (AGM)(1) | | | 9,800,000 | | | | 10,758,146 | |
Illinois GO, 5.00%, 1/1/20(1) | | | 1,000,000 | | | | 1,051,230 | |
Illinois Health Facilities Auth. Rev., Series 1992 C, (Evangelical Hospital), 6.75%, 4/15/12(1)(2) | | | 260,000 | | | | 262,145 | |
Illinois Sales Tax Rev., 5.00%, 6/15/17(1) | | | 3,000,000 | | | | 3,431,130 | |
Illinois State Toll Highway Auth. Rev., Series 2010 A1, 5.00%, 1/1/25(1) | | | 5,000,000 | | | | 5,185,200 | |
Kane County Community Unit School District No. 304 GO, 6.20%, 1/1/15, Prerefunded at 100% of Par (AGM)(1)(2) | | | 930,000 | | | | 1,101,780 | |
Metropolitan Pier & Exposition Auth. Rev., Series 2002 A, (Capital Appreciation-McCormick Place Exposition), 5.81%, 12/15/31 (NATL (1)(4) | | | 32,870,000 | | | | 9,760,418 | |
Metropolitan Pier & Exposition Auth. Rev., Series 2010 B2, (Taxable – McCormick), 5.00%, 6/15/50(1) | | | 2,750,000 | | | | 2,471,480 | |
Ogle Lee & De Kalb Counties Township High School District No. 212 GO, 6.00%, 12/1/11, Prerefunded at 100% of Par (NATL)(1)(2) | | | 1,035,000 | | | | 1,065,129 | |
Ogle Lee & De Kalb Counties Township High School District No. 212 GO, 6.00%, 12/1/11, Prerefunded at 100% of Par (NATL)(1)(2) | | | 1,145,000 | | | | 1,178,331 | |
Ogle Lee & De Kalb Counties Township High School District No. 212 GO, 6.00%, 12/1/18 (NATL)(1) | | | 75,000 | | | | 76,778 | |
Railsplitter Tobacco Settlement Auth. Rev., 5.00%, 6/1/17(1) | | | 6,000,000 | | | | 6,255,480 | |
Regional Transportation Auth. Rev., Series 1990 A, 7.20%, 11/1/20 (Ambac)(1) | | | 940,000 | | | | 1,131,017 | |
Rock Island-Mercer et al Counties Community College District No. 503 GO, Series 2008 A, (Black Hawk College), 4.00%, 12/1/11 (Ambac)(1) | | | 1,000,000 | | | | 1,015,270 | |
Southwestern Illinois Development Auth. Rev., (Triad School District No. 2), 5.00%, 10/1/18 (NATL)(1) | | | 1,000,000 | | | | 1,071,350 | |
University of Illinois COP, Series 2006 A, (Academic Facilities), 5.00%, 3/15/16 (Ambac)(1) | | | $3,270,000 | | | | $3,572,540 | |
| | | | | | | | 108,667,029 | |
| INDIANA — 1.2% | |
Hamilton Southeastern Consolidated School Building Corp. Rev., (Hamilton County), 4.25%, 7/15/20 (AGM)(1) | | | 1,000,000 | | | | 1,038,460 | |
Indiana Bond Bank Rev., Series 2006 A, 5.00%, 8/1/17 (AGM)(1) | | | 1,520,000 | | | | 1,736,083 | |
Indiana Bond Bank Rev., Series 2006 A, 5.00%, 8/1/18 (AGM)(1) | | | 1,600,000 | | | | 1,799,216 | |
Indiana Bond Bank Rev., Series 2006 A, 5.00%, 8/1/19 (AGM)(1) | | | 1,680,000 | | | | 1,860,331 | |
Indiana Finance Auth. Lease Rev., Series 2008 A1, 5.00%, 11/1/16(1) | | | 5,000,000 | | | | 5,749,700 | |
Indiana Municipal Power Agency Rev., Series 2009 B, (Power Supply System), 5.25%, 1/1/24(1) | | | 2,545,000 | | | | 2,746,920 | |
Indiana Municipal Power Agency Rev., Series 2009 B, (Power Supply System), 5.375%, 1/1/25(1) | | | 1,600,000 | | | | 1,717,200 | |
Indiana Transportation Finance Auth. Rev., Series 1990 A, 7.25%, 6/1/15(1) | | | 635,000 | | | | 710,095 | |
Indiana Transportation Finance Auth. Rev., Series 1990 A, 7.25%, 6/1/15, Prerefunded at 100% of Par(1)(2) | | | 75,000 | | | | 75,065 | |
Indianapolis Local Public Improvement Bond Bank Rev., Series 2002 A, (Water Works), 5.00%, 7/1/12 (NATL)(1) | | | 1,435,000 | | | | 1,500,436 | |
Mount Vernon of Hancock County Multi-School Building Corp. Rev., Series 2001 B, (First Mortgage), 5.75%, 7/15/11, Prerefunded at 100% of Par (Ambac)(1)(2) | | | 1,500,000 | | | | 1,510,005 | |
Valparaiso Middle Schools Building Corp. Rev., (First Mortgage), 5.75%, 7/15/11, Prerefunded at 100% of Par (FGIC)(1)(2) | | | 1,650,000 | | | | 1,661,253 | |
Zionsville Community Schools Building Corp. Rev., (First Mortgage), 5.75%, 1/15/12, Prerefunded at 100% of Par (FGIC)(1)(2) | | | 1,000,000 | | | | 1,034,580 | |
| | | | | | | | 23,139,344 | |
| IOWA — 0.4% | |
Iowa Finance Auth. Health Facilities Rev., Series 2006 A, (Development Care Initiatives), 5.25%, 7/1/13(1) | | | 1,485,000 | | | | 1,457,735 | |
Iowa Finance Auth. Health Facilities Rev., Series 2006 A, (Development Care Initiatives), 5.25%, 7/1/14(1) | | | 1,950,000 | | | | 1,888,556 | |
Iowa Finance Auth. Health Facilities Rev., Series 2006 A, (Development Care Initiatives), 5.25%, 7/1/16(1) | | | 1,690,000 | | | | 1,611,618 | |
Iowa Rev., Series 2009 A, (I-Jobs Program), 5.00%, 6/1/22(1) | | | 2,500,000 | | | | 2,843,000 | |
| | | | | | | | 7,800,909 | |
| KANSAS — 0.4% | |
Kansas State Department of Transportation Rev., Series 2009 A, 5.00%, 9/1/16(1) | | | 4,500,000 | | | | 5,324,895 | |
Wichita Hospital Facilities Rev., Series 2001 III, 5.25%, 11/15/13(1) | | | 1,280,000 | | | | 1,313,728 | |
Wichita Hospital Facilities Rev., Series 2001 III, 5.50%, 11/15/16(1) | | | 1,195,000 | | | | 1,223,811 | |
| | | | | | | | 7,862,434 | |
| KENTUCKY — 0.5% | |
Kentucky Asset/Liability Commission Agency Fund Rev., Series 2010 A, (Federal Highway Trust), 5.00%, 9/1/20(1) | | | 4,000,000 | | | | 4,659,760 | |
| Kentucky Economic Development Finance Auth. Rev., Series 2009 A, (Baptist Healthcare System), 5.375%, 8/15/24 | | | 3,000,000 | | | | 3,135,390 | |
| Kentucky Economic Development Finance Auth. Rev., Series 2009 A, (Baptist Healthcare System), 5.625%, 8/15/27 | | | 1,250,000 | | | | 1,322,237 | |
| | | | | | | | 9,117,387 | |
| LOUISIANA — 0.5% | |
Louisiana Public Facilities Auth. Rev., Series 2006 A, (Black & Gold Facilities), 4.00%, 7/1/13 (CIFG)(1) | | | 1,105,000 | | | | 1,099,298 | |
Louisiana Public Facilities Auth. Rev., Series 2006 A, (Black & Gold Facilities), 5.00%, 7/1/15 (CIFG)(1) | | | $1,205,000 | | | | $1,210,688 | |
Louisiana Public Facilities Auth. Rev., Series 2007 A, (Black & Gold Facilities), 5.00%, 7/1/22 (CIFG)(1) | | | 1,465,000 | | | | 1,496,512 | |
New Orleans Aviation Board Gulf Opportunity Zone Rev., Series 2010 A, (Passenger Facility Charge), 5.25%, 1/1/41(1) | | | 2,000,000 | | | | 1,986,520 | |
Regional Transit Auth. Sales Tax Rev., 5.00%, 12/1/17 (AGM)(1) | | | 1,000,000 | | | | 1,146,540 | |
Regional Transit Auth. Sales Tax Rev., 5.00%, 12/1/19 (AGM)(1) | | | 1,000,000 | | | | 1,136,140 | |
Regional Transit Auth. Sales Tax Rev., 5.00%, 12/1/20 (AGM)(1) | | | 1,250,000 | | | | 1,417,287 | |
| | | | | | | | 9,492,985 | |
| MAINE — 0.1% | |
Portland Airport Rev., 5.00%, 1/1/40 (AGM)(1) | | | 1,795,000 | | | | 1,799,272 | |
| MARYLAND — 1.6% | |
| Maryland Economic Development Corp. Rev., Series 2010 A, (Transportation Facilities), 5.75%, 6/1/35 | | | 1,000,000 | | | | 974,490 | |
Maryland GO, Series 2005 A, (Capital Improvement & Local Facilities), 5.25%, 2/15/15(1) | | | 10,000,000 | | | | 11,543,300 | |
Maryland GO, Series 2009 C, (State & Local Facilities Loan), 5.00%, 11/1/16(1) | | | 10,000,000 | | | | 11,916,400 | |
| Maryland Health & Higher Educational Facilities Auth. Rev., (Doctors Community Hospital), 5.75%, 7/1/38 | | | 2,400,000 | | | | 2,030,112 | |
Maryland Health & Higher Educational Facilities Auth. Rev., (Johns Hopkins Health System), VRDN, 3.65%, 11/15/11(1) | | | 1,000,000 | | | | 1,014,910 | |
Maryland Health & Higher Educational Facilities Auth. Rev., (Lifebridge Health Issue), 5.00%, 7/1/12(1) | | | 270,000 | | | | 281,038 | |
Maryland Health & Higher Educational Facilities Auth. Rev., (Lifebridge Health Issue), 5.00%, 7/1/13(1) | | | 1,565,000 | | | | 1,672,907 | |
Maryland Health & Higher Educational Facilities Auth. Rev., Series 2008 A, (Johns Hopkins University), 5.25%, 7/1/38(1) | | | 1,645,000 | | | | 1,742,071 | |
| | | | | | | | 31,175,228 | |
| MASSACHUSETTS — 4.3% | |
Massachusetts Bay Transportation Auth. Rev., Series 2008 A, (Assessment Bonds), 5.25%, 7/1/34(1) | | | 3,300,000 | | | | 3,500,937 | |
| Massachusetts Development Finance Agency Rev., (Suffolk University), 5.125%, 7/1/40 | | | 1,750,000 | | | | 1,533,927 | |
Massachusetts Development Finance Agency Rev., Series 2007 C, (Wheelock College), 5.00%, 10/1/17(1) | | | 1,760,000 | | | | 1,841,470 | |
Massachusetts Development Finance Agency Rev., Series 2009 V2, (Boston University), 2.875%, 10/1/14(1) | | | 5,000,000 | | | | 5,204,400 | |
Massachusetts Development Finance Agency Rev., Series 2010 A, (Emerson College), 5.00%, 1/1/40(1) | | | 4,175,000 | | | | 3,909,929 | |
Massachusetts GO, Series 2002 C, (Consolidated Loan of 2002), 5.50%, 11/1/12 (AGM)(1) | | | 10,000,000 | | | | 10,738,200 | |
Massachusetts GO, Series 2006 D, (Consolidated Loan of 2002), 5.00%, 8/1/14(1) | | | 2,500,000 | | | | 2,819,275 | |
Massachusetts GO, Series 2010 A, VRN, 0.56%, 6/2/11(1) | | | 5,000,000 | | | | 5,004,300 | |
Massachusetts Health & Educational Facilities Auth. Rev., (Boston Medical Center), 5.25%, 7/1/38(1) | | | 5,000,000 | | | | 4,136,850 | |
Massachusetts Health & Educational Facilities Auth. Rev., Series 1992 F, (Massachusetts General Hospital), 6.25%, 7/1/12 (Ambac)(1)(2) | | | 340,000 | | | | 346,875 | |
Massachusetts Health & Educational Facilities Auth. Rev., Series 2008 A, (Massachusetts Institute of Technology), 5.00%, 7/1/14(1) | | | 5,000,000 | | | | 5,648,900 | |
Massachusetts Health & Educational Facilities Auth. Rev., Series 2009 A, (Harvard University), 5.50%, 11/15/36(1) | | | $6,800,000 | | | | $7,440,356 | |
Massachusetts Health & Educational Facilities Auth. Rev., Series 2009 O, (Massachusetts Institute of Technology), 5.75%, 7/1/26(1) | | | 10,000,000 | | | | 11,587,300 | |
Massachusetts Health & Educational Facilities Auth. Rev., Series 2010 C, (Massachusetts Eye and Ear Infirmary), 5.375%, 7/1/35(1) | | | 2,000,000 | | | | 1,851,300 | |
Massachusetts Health & Educational Facilities Auth. Rev., Series 2010 G, (Umass Memorial), 5.00%, 7/1/20(1) | | | 1,500,000 | | | | 1,527,900 | |
Massachusetts Health & Educational Facilities Auth. Rev., Series 2010 G, (Umass Memorial), 5.00%, 7/1/21(1) | | | 1,050,000 | | | | 1,055,281 | |
Massachusetts Health & Educational Facilities Auth. Rev., Series 2010 H, (Winchester Hospital), 5.25%, 7/1/38(1) | | | 2,050,000 | | | | 1,755,395 | |
Massachusetts State Department of Transportation Metropolitan Highway Rev., Series 2010 B, (Metropolitan Senior), 5.00%, 1/1/23(1) | | | 1,000,000 | | | | 1,081,450 | |
Massachusetts State Department of Transportation Metropolitan Highway Rev., Series 2010 B, (Metropolitan Senior), 5.00%, 1/1/24(1) | | | 6,000,000 | | | | 6,452,400 | |
Massachusetts Water Resources Auth. Rev., Series 2011 B, 5.00%, 8/1/23(1) | | | 1,000,000 | | | | 1,160,400 | |
Massachusetts Water Resources Auth. Rev., Series 2011 B, 5.00%, 8/1/24(1) | | | 1,815,000 | | | | 2,073,166 | |
Massachusetts Water Resources Auth. Rev., Series 2011 B, 5.00%, 8/1/25(1) | | | 4,215,000 | | | | 4,749,083 | |
Massachusetts Water Resources Auth. Rev., Series 2011 B, 5.00%, 8/1/26(1) | | | 1,000,000 | | | | 1,116,910 | |
| | | | | | | | 86,536,004 | |
| MICHIGAN — 1.9% | |
Kalamazoo Public Schools GO, (Building & Site), 4.00%, 5/1/13 (AGM)(1) | | | 1,265,000 | | | | 1,334,752 | |
Kalamazoo Public Schools GO, (Building & Site), 5.25%, 5/1/16 (AGM)(1) | | | 1,545,000 | | | | 1,779,933 | |
Lansing Board of Water & Light Utility System Rev., Series 2011 A, 5.00%, 7/1/27(3) | | | 5,000,000 | | | | 5,244,100 | |
Michigan Higher Education Facilities Auth. Rev., (Limited Obligation-Hillsdale College), 5.00%, 3/1/26(1) | | | 2,345,000 | | | | 2,362,775 | |
Michigan State Building Auth. Rev., Series 2003 I, (Facilities Program), 5.25%, 10/15/11 (AGM)(1) | | | 5,000,000 | | | | 5,086,900 | |
Michigan State Building Auth. Rev., Series 2009 I, (Facilities Program), 5.25%, 10/15/20(1) | | | 4,000,000 | | | | 4,400,960 | |
Pontiac City School District GO, 5.00%, 5/1/13 (XLCA)(1) | | | 145,000 | | | | 150,469 | |
Pontiac City School District GO, 5.00%, 5/1/15 (XLCA)(1) | | | 1,110,000 | | | | 1,150,648 | |
Pontiac City School District GO, 5.00%, 5/1/16 (XLCA)(1) | | | 1,425,000 | | | | 1,470,643 | |
Pontiac City School District GO, 5.00%, 5/1/17 (XLCA)(1) | | | 1,370,000 | | | | 1,389,605 | |
Taylor GO, 5.00%, 9/1/11 (NATL)(1) | | | 575,000 | | | | 580,348 | |
Wayne Charter County Airport Rev., Series 2002 C, 5.00%, 12/1/11 (NATL/FGIC)(1) | | | 2,010,000 | | | | 2,053,637 | |
Wayne Charter County Airport Rev., Series 2002 C, 5.375%, 12/1/13 (NATL/FGIC)(1) | | | 2,215,000 | | | | 2,339,704 | |
Wayne Charter County Airport Rev., Series 2002 C, 5.375%, 12/1/14 (NATL/FGIC)(1) | | | 2,335,000 | | | | 2,453,968 | |
Wayne County Airport Auth. Rev., (Detroit Metropolitan Airport), 5.00%, 12/1/18 (NATL/FGIC)(1) | | | 3,000,000 | | | | 3,132,000 | |
Wayne County Airport Auth. Rev., (Detroit Metropolitan Airport), 5.00%, 12/1/19 (NATL/FGIC)(1) | | | 2,000,000 | | | | 2,080,840 | |
| | | | | | | | 37,011,282 | |
Minnesota GO, Series 2008 A, 5.00%, 6/1/13(1) | | | $10,000,000 | | | | $10,919,200 | |
Minnesota Higher Education Facilities Auth. Rev., Series 2005-6G, (St. John University), 5.00%, 10/1/12(1) | | | 1,500,000 | | | | 1,578,105 | |
| Minnesota Higher Education Facilities Auth. Rev., Series 2010-7B, (Gustavus Adolfus), 5.00%, 10/1/17 | | | 2,740,000 | | | | 3,100,255 | |
| Minnesota Higher Education Facilities Auth. Rev., Series 2010-7B, (Gustavus Adolfus), 5.00%, 10/1/20 | | | 2,680,000 | | | | 2,965,206 | |
| Minnesota Higher Education Facilities Auth. Rev., Series 2010-7B, (Gustavus Adolfus), 5.00%, 10/1/22 | | | 1,250,000 | | | | 1,351,300 | |
Rochester Health Care Facilities Rev., Series 2011 C, (Mayo Clinic), VRDN, 4.50%, 11/15/21(1) | | | 1,000,000 | | | | 1,072,690 | |
| | | | | | | | 20,986,756 | |
| MISSISSIPPI — 0.9% | |
Mississippi Development Bank Special Obligation Rev., Series 2006 A, (Biloxi, Mississippi), 5.00%, 11/1/15 (Ambac)(1) | | | 1,565,000 | | | | 1,742,847 | |
Mississippi Development Bank Special Obligation Rev., Series 2006 A, (Biloxi, Mississippi), 5.00%, 11/1/16 (Ambac)(1) | | | 1,645,000 | | | | 1,852,467 | |
Mississippi Development Bank Special Obligation Rev., Series 2006 A, (Municipal Energy Agency Power Supply), 5.00%, 3/1/17 (XLCA)(1) | | | 1,000,000 | | | | 1,061,920 | |
Mississippi Development Bank Special Obligation Rev., Series 2007 A, (Mississippi Development Bank), 5.00%, 7/1/19 (Ambac)(1) | | | 4,620,000 | | | | 5,034,506 | |
Mississippi Development Bank Special Obligation Rev., Series 2010 D, (Department of Corrections), 5.25%, 8/1/27(1) | | | 5,000,000 | | | | 5,288,450 | |
University of Southern Mississippi Educational Building Co. Rev., Series 2006 A, 5.00%, 3/1/17 (AGM)(1) | | | 1,195,000 | | | | 1,358,906 | |
University of Southern Mississippi Educational Building Co. Rev., Series 2006 A, 5.00%, 3/1/18 (AGM)(1) | | | 1,940,000 | | | | 2,173,712 | |
| | | | | | | | 18,512,808 | |
| MISSOURI — 0.8% | |
Jackson County Public Building Corp. Rev., Series 2006 A, (Capital Improvements), 5.00%, 12/1/15 (NATL)(1) | | | 1,425,000 | | | | 1,614,668 | |
Missouri Health & Educational Facilities Auth. Rev., Series 2008 A, (Washington University), 5.375%, 3/15/39(1) | | | 2,000,000 | | | | 2,133,180 | |
Missouri Highways & Transportation Commission Rev., Series 2006 A, (First Lien), 5.00%, 5/1/13(1) | | | 3,030,000 | | | | 3,297,791 | |
Missouri Highways & Transportation Commission Rev., Series 2010 A, 5.00%, 5/1/18(1) | | | 2,700,000 | | | | 3,224,988 | |
Missouri Joint Municipal Electric Utility Commission Rev., (Plum Point), 5.00%, 1/1/16 (NATL)(1) | | | 3,145,000 | | | | 3,424,339 | |
Platte County Industrial Development Auth. Rev., (Zona Rosa Retail), 5.00%, 12/1/32(1) | | | 1,000,000 | | | | 1,014,120 | |
St. Louis Municipal Finance Corp. Rev., Series 2006 A, (Carnahan Courthouse), 4.00%, 2/15/17 (Ambac)(1) | | | 1,000,000 | | | | 1,067,230 | |
| | | | | | | | 15,776,316 | |
MONTANA(5) | |
Montana Facility Finance Auth. Health Care Rev., (Kalispell Regional Medical Center), 5.00%, 7/1/35(1) | | | 655,000 | | | | 645,948 | |
| NEBRASKA — 0.4% | |
Nebraska Public Power District Rev., Series 2007 B, 5.00%, 1/1/13 (AGM)(1) | | | 2,000,000 | | | | 2,139,600 | |
Nebraska Public Power District Rev., Series 2008 B, 5.00%, 1/1/20(1) | | | 2,500,000 | | | | 2,792,675 | |
Omaha Public Power District Electric System Rev., Series 2007 A, 5.00%, 2/1/21(1) | | | $3,000,000 | | | | $3,338,010 | |
| | | | | | | | 8,270,285 | |
| NEVADA — 0.2% | |
Clark County Economic Development Rev., (University of Southern Nevada), 5.00%, 4/1/22 (Radian)(1) | | | 1,000,000 | | | | 903,320 | |
Reno Sales & Room Tax Rev., (ReTrac-Reno Transportation Rail Access Corridor) (Senior Lien), 5.50%, 6/1/12, Prerefunded at 100% of Par (Ambac)(1)(2) | | | 1,550,000 | | | | 1,631,235 | |
Reno Sales & Room Tax Rev., (ReTrac-Reno Transportation Rail Access Corridor) (Senior Lien), 5.50%, 6/1/12, Prerefunded at 100% of Par (Ambac)(1)(2) | | | 1,865,000 | | | | 1,962,745 | |
| | | | | | | | 4,497,300 | |
| NEW HAMPSHIRE — 0.3% | |
New Hampshire Health & Education Facilities Auth. Rev., (Dartmouth-Hitchcock), 5.00%, 8/1/40(1) | | | 2,000,000 | | | | 1,975,660 | |
New Hampshire Health & Education Facilities Auth. Rev., Series 2004 A, (Kendal at Hanover), 5.00%, 10/1/11(1) | | | 855,000 | | | | 861,780 | |
New Hampshire Health & Education Facilities Auth. Rev., Series 2004 A, (Kendal at Hanover), 5.00%, 10/1/12(1) | | | 180,000 | | | | 184,736 | |
New Hampshire Health & Education Facilities Auth. Rev., Series 2004 A, (Kendal at Hanover), 5.00%, 10/1/13(1) | | | 1,030,000 | | | | 1,070,613 | |
New Hampshire Health & Education Facilities Auth. Rev., Series 2004 A, (Kendal at Hanover), 5.00%, 10/1/18(1) | | | 1,960,000 | | | | 2,032,892 | |
| | | | | | | | 6,125,681 | |
| NEW JERSEY — 4.4% | |
New Jersey Economic Development Auth. Rev., Series 2008 Y, (School Facility Construction), 5.00%, 9/1/33(1) | | | 110,000 | | | | 109,919 | |
New Jersey Economic Development Auth. Rev., Series 2010 DD1, (School Facility Construction), 5.00%, 12/15/18(1) | | | 5,000,000 | | | | 5,515,100 | |
New Jersey GO, 5.00%, 8/1/14(1) | | | 5,000,000 | | | | 5,600,650 | |
New Jersey GO, 5.00%, 6/1/17(1) | | | 4,500,000 | | | | 5,212,845 | |
New Jersey GO, Series 2010 Q, 5.00%, 8/15/15(1) | | | 7,000,000 | | | | 8,005,200 | |
New Jersey Health Care Facilities Auth. Rev., (Hackensack University Medical Center), 5.00%, 1/1/34(1) | | | 1,050,000 | | | | 926,898 | |
New Jersey Health Care Facilities Financing Auth. Rev., (The Robert Wood Johnson Foundation), 5.00%, 7/1/31(1) | | | 1,725,000 | | | | 1,722,757 | |
New Jersey Sports & Exposition Auth. Rev., Series 2008 B, 5.00%, 9/1/18(1) | | | 7,300,000 | | | | 8,196,586 | |
New Jersey State Turnpike Auth. Rev., Series 2009 G, 5.00%, 1/1/18(1) | | | 1,700,000 | | | | 1,922,853 | |
New Jersey Transit Corp. COP, 5.00%, 10/1/12 (AGM)(1) | | | 4,235,000 | | | | 4,462,250 | |
New Jersey Transit Corp. COP, 5.00%, 10/1/13 (AGM)(1) | | | 5,595,000 | | | | 6,053,007 | |
New Jersey Transportation Trust Fund Auth. Rev., Series 2003 B2, 5.00%, 12/15/16(1) | | | 10,000,000 | | | | 11,204,200 | |
New Jersey Transportation Trust Fund Auth. Rev., Series 2004 B, 5.25%, 12/15/12 (NATL/FGIC)(1) | | | 7,400,000 | | | | 7,906,308 | |
New Jersey Transportation Trust Fund Auth. Rev., Series 2006 A, 5.25%, 12/15/20(1) | | | 15,000,000 | | | | 16,535,850 | |
New Jersey Transportation Trust Fund Auth. Rev., Series 2010 D, 5.00%, 12/15/17(1) | | | 4,750,000 | | | | 5,311,117 | |
| | | | | | | | 88,685,540 | |
| NEW MEXICO — 0.4% | |
New Mexico Finance Auth. State Transportation Rev., 5.00%, 6/15/17(1) | | | 1,000,000 | | | | 1,188,630 | |
New Mexico Finance Auth. State Transportation Rev., 5.00%, 6/15/18(1) | | | 3,000,000 | | | | 3,583,590 | |
New Mexico Finance Auth. State Transportation Rev., 4.00%, 6/15/19(1) | | | $2,000,000 | | | | $2,244,960 | |
San Juan County Gross Receipts Tax Rev., Series 2001 A, 5.75%, 9/15/11, Prerefunded at 101% of Par (Ambac)(1)(2) | | | 1,415,000 | | | | 1,451,960 | |
| | | | | | | | 8,469,140 | |
| NEW YORK — 10.8% | |
Brooklyn Arena Local Development Corp. Rev., (Barclays Center), 6.25%, 7/15/40(1) | | | 3,700,000 | | | | 3,722,940 | |
Metropolitan Transportation Auth. Rev., Series 2008 B, VRDN, 5.00%, 11/15/13(1) | | | 4,000,000 | | | | 4,362,920 | |
Metropolitan Transportation Auth. Rev., Series 2008 C, 6.25%, 11/15/23(1) | | | 5,000,000 | | | | 5,802,100 | |
Metropolitan Transportation Auth. Rev., Series 2010 G, 5.00%, 11/15/19(1) | | | 1,750,000 | | | | 1,979,775 | |
Nassau County Interim Finance Auth. Rev., Series 2009 A, (Secured Sales Tax), 5.00%, 11/15/21(1) | | | 1,800,000 | | | | 2,061,990 | |
Nassau County Interim Finance Auth. Rev., Series 2009 A, (Secured Sales Tax), 5.00%, 11/15/23(1) | | | 1,500,000 | | | | 1,685,835 | |
New York City Municipal Water Finance Auth. Water & Sewer Rev., Series 2008 C, 5.00%, 6/15/17(1) | | | 1,350,000 | | | | 1,596,145 | |
New York City Municipal Water Finance Auth. Water & Sewer Rev., Series 2009 EE, 5.00%, 6/15/39(1) | | | 8,400,000 | | | | 8,592,360 | |
New York City Municipal Water Finance Auth. Water & Sewer Rev., Series 2009 GG1, (Second General Resolution), 5.00%, 6/15/39(1) | | | 5,000,000 | | | | 5,121,200 | |
New York City Transitional Finance Auth. Rev., Series 2004 D2, (Future Tax Secured Bonds), 5.00%, 11/1/12(1) | | | 8,500,000 | | | | 9,056,920 | |
New York City Transitional Finance Auth. Rev., Series 2007 B, (Future Tax Secured Bonds), 5.00%, 11/1/19(1) | | | 8,000,000 | | | | 9,044,160 | |
New York City Transitional Finance Auth. Rev., Series 2009 S4, 5.50%, 1/15/39(1) | | | 1,700,000 | | | | 1,785,629 | |
New York City Transitional Finance Auth. Rev., Series 2011 C, (Future Tax Secured Bonds), 5.00%, 11/1/39(1) | | | 4,000,000 | | | | 4,128,720 | |
New York GO, Series 2003 I, 5.75%, 3/1/13, Prerefunded at 100% of Par(1)(2) | | | 5,000,000 | | | | 5,467,450 | |
New York GO, Series 2004 D, 5.00%, 11/1/17 (AGM)(1) | | | 5,195,000 | | | | 5,784,529 | |
New York GO, Series 2006 J1, 5.00%, 6/1/18(1) | | | 4,000,000 | | | | 4,481,440 | |
New York GO, Series 2008 J1, 5.00%, 8/1/13(1) | | | 5,855,000 | | | | 6,377,851 | |
New York GO, Series 2009 A, 5.00%, 2/15/39(1) | | | 1,700,000 | | | | 1,761,999 | |
New York GO, Series 2009 E, 5.00%, 8/1/16(1) | | | 2,600,000 | | | | 3,014,648 | |
New York GO, Series 2009 H1, 5.00%, 3/1/17(1) | | | 3,000,000 | | | | 3,468,480 | |
New York GO, Series 2009 H1, 5.00%, 3/1/22(1) | | | 7,000,000 | | | | 7,799,960 | |
New York GO, Series 2009 J1, 5.00%, 5/15/22(1) | | | 6,570,000 | | | | 7,332,646 | |
New York GO, Series 2010 E, 5.00%, 8/1/19(1) | | | 4,555,000 | | | | 5,301,018 | |
New York Local Government Assistance Corp. Rev., Series 2003 A5/6, 5.00%, 4/1/18(1) | | | 10,000,000 | | | | 11,745,000 | |
New York State Dormitory Auth. Rev., (Brooklyn Law School), 5.75%, 7/1/33(1) | | | 1,000,000 | | | | 1,070,590 | |
New York State Dormitory Auth. Rev., (Columbia University), 4.00%, 7/1/13(1) | | | 3,500,000 | | | | 3,761,520 | |
New York State Dormitory Auth. Rev., Series 1990 A, (UNIC Educational Facilities), 7.50%, 5/15/13 (NATL-IBC)(1) | | | 1,440,000 | | | | 1,606,262 | |
New York State Dormitory Auth. Rev., Series 2005 F, 5.00%, 3/15/12 (AGM)(1) | | | 1,000,000 | | | | 1,037,060 | |
New York State Dormitory Auth. Rev., Series 2008 B, 5.75%, 3/15/36(1) | | | 10,000,000 | | | | 10,988,600 | |
New York State Dormitory Auth. Rev., Series 2009 A, 5.25%, 2/15/25(1) | | | 8,825,000 | | | | 9,837,581 | |
New York State Dormitory Auth. Rev., Series 2009 A, 5.00%, 2/15/39(1) | | | 4,000,000 | | | | 4,096,040 | |
New York State Dormitory Auth. Rev., Series 2009 A, (North Shore Long Island Jewish Health System), 5.50%, 5/1/37(1) | | | $1,200,000 | | | | $1,205,292 | |
New York State Dormitory Auth. Rev., Series 2010 A, (Mount Sinai Hospital), 5.00%, 7/1/21(1) | | | 1,785,000 | | | | 1,926,836 | |
New York State Dormitory Auth. Rev., Series 2010 A, (Mount Sinai Hospital), 5.00%, 7/1/22(1) | | | 2,750,000 | | | | 2,918,878 | |
New York State Dormitory Auth. Rev., Series 2010 A, (Mount Sinai School of Medicine), 5.00%, 7/1/14(1) | | | 1,100,000 | | | | 1,199,561 | |
New York State Thruway Auth. Rev., Series 2009 A1, 5.00%, 4/1/23(1) | | | 3,000,000 | | | | 3,345,000 | |
New York State Urban Development Corp. Rev., Series 2009 C, (State Personal Income Tax), 5.00%, 12/15/15(1) | | | 3,000,000 | | | | 3,480,060 | |
New York State Urban Development Corp. Rev., Series 2009 C, (State Personal Income Tax), 5.00%, 12/15/17(1) | | | 7,000,000 | | | | 8,268,890 | |
Niagara Falls Bridge Commission Toll Rev., Series 1993 A, (Bridge System), 4.00%, 10/1/19 (AGC)(1) | | | 3,150,000 | | | | 3,355,033 | |
Niagara Falls Bridge Commission Toll Rev., Series 1993 B, 5.25%, 10/1/15 (NATL/FGIC)(1) | | | 710,000 | | | | 748,269 | |
Port Auth. of New York & New Jersey Special Obligation Rev., (John F. Kennedy International Airport Terminal), 5.00%, 12/1/20(1) | | | 850,000 | | | | 844,925 | |
Port Auth. of New York & New Jersey Special Obligation Rev., (John F. Kennedy International Airport Terminal), 6.00%, 12/1/42(1) | | | 2,600,000 | | | | 2,598,544 | |
Suffolk County Industrial Development Agency Rev., (New York Institute of Technology), 5.25%, 3/1/17(1) | | | 1,000,000 | | | | 1,071,700 | |
Suffolk County Industrial Development Agency Rev., (New York Institute of Technology), 5.25%, 3/1/18(1) | | | 1,000,000 | | | | 1,057,480 | |
Suffolk County Industrial Development Agency Rev., (New York Institute of Technology), 5.25%, 3/1/20(1) | | | 1,250,000 | | | | 1,299,150 | |
Suffolk County Industrial Development Agency Rev., (New York Institute of Technology), 5.00%, 3/1/26(1) | | | 1,175,000 | | | | 1,180,687 | |
Triborough Bridge & Tunnel Auth. Rev., Series 2008 B3, VRDN, 5.00%, 11/15/15(1) | | | 5,000,000 | | | | 5,635,900 | |
Triborough Bridge & Tunnel Auth. Rev., Series 2008 C, 5.00%, 11/15/38(1) | | | 10,000,000 | | | | 10,234,000 | |
Triborough Bridge & Tunnel Auth. Rev., Series 2010 A1, VRDN, 4.00%, 11/15/12(1) | | | 8,000,000 | | | | 8,393,600 | |
Troy Capital Resource Corp. Rev., Series 2010 A, (Rensselaer Polytechnic Institute), 5.125%, 9/1/40(1) | | | 3,040,000 | | | | 3,012,458 | |
| | | | | | | | 215,649,631 | |
| NORTH CAROLINA — 1.5% | |
Charlotte GO, 5.00%, 8/1/19(1) | | | 2,000,000 | | | | 2,353,980 | |
Charlotte Water & Sewer System Rev., 5.00%, 7/1/17(1) | | | 1,000,000 | | | | 1,191,280 | |
Greensboro Rev., (Combined Enterprise System), 5.25%, 6/1/20(1) | | | 2,060,000 | | | | 2,506,073 | |
North Carolina Eastern Municipal Power Agency Rev., Series 2009 A, 5.00%, 1/1/17(1) | | | 2,790,000 | | | | 3,148,208 | |
North Carolina Eastern Municipal Power Agency Rev., Series 2009 A, 5.00%, 1/1/18(1) | | | 2,955,000 | | | | 3,330,049 | |
North Carolina Eastern Municipal Power Agency Rev., Series 2009 B, 5.00%, 1/1/26(1) | | | 5,600,000 | | | | 5,807,144 | |
North Carolina Eastern Municipal Power Agency Rev., Series 2010 A, 5.00%, 1/1/15(1) | | | 3,000,000 | | | | 3,327,240 | |
North Carolina Municipal Power Agency No. 1 Catawba Electric Rev., Series 2003 A, 5.50%, 1/1/13(1)(2) | | | $640,000 | | | | $690,880 | |
North Carolina Municipal Power Agency No. 1 Catawba Electric Rev., Series 2003 A, 5.50%, 1/1/13(1) | | | 1,360,000 | | | | 1,457,566 | |
North Carolina Municipal Power Agency No. 1 Catawba Electric Rev., Series 2008 C, 5.25%, 1/1/19(1) | | | 2,500,000 | | | | 2,852,150 | |
North Carolina Municipal Power Agency No. 1 Catawba Electric Rev., Series 2008 C, 5.25%, 1/1/20(1) | | | 2,000,000 | | | | 2,253,600 | |
North Carolina Municipal Power Agency No. 1 Catawba Electric Rev., Series 2009 A, 5.00%, 1/1/30(1) | | | 1,800,000 | | | | 1,856,628 | |
| | | | | | | | 30,774,798 | |
| OHIO — 1.8% | |
American Municipal Power-Ohio, Inc., Rev., Series 2008 A, (Prairie State Energy Campus), 5.00%, 2/15/17(1) | | | 1,000,000 | | | | 1,107,600 | |
Cleveland COP, Series 2010 A, (Cleveland Stadium), 5.00%, 11/15/19(1) | | | 2,450,000 | | | | 2,641,761 | |
Mad River Local School District GO, (Classroom Facilities), 5.75%, 12/1/12, Prerefunded at 100% of Par (FGIC)(1)(2) | | | 1,150,000 | | | | 1,243,645 | |
Milford Exempt Village School District GO, (School Improvements), 6.00%, 12/1/11, Prerefunded at 100% of Par (AGM)(1)(2) | | | 1,700,000 | | | | 1,749,487 | |
Ohio GO, Series 2005 A, (Infrastructure Improvement), 5.00%, 9/1/11(1) | | | 1,005,000 | | | | 1,017,000 | |
Ohio GO, Series 2005 A, (Infrastructure Improvement), 5.00%, 9/1/12(1) | | | 1,365,000 | | | | 1,444,866 | |
Ohio Higher Educational Facility Commission Rev., (Oberlin College), 5.00%, 10/1/19(1) | | | 5,000,000 | | | | 5,805,500 | |
Ohio Higher Educational Facility Commission Rev., Series 1990 B, (Case Western Reserve University), 6.50%, 10/1/20(1) | | | 750,000 | | | | 903,435 | |
Ohio State University (The) Rev., Series 2009 A, 5.00%, 12/1/27(1) | | | 2,000,000 | | | | 2,130,500 | |
Ohio State University (The) Rev., Series 2010 A, 5.00%, 12/1/16(1) | | | 4,000,000 | | | | 4,701,320 | |
Ohio State Water Development Auth. Rev., (Drinking Water Assistance Fund), 5.00%, 6/1/18, Prerefunded at 100% of Par(1)(2) | | | 2,000,000 | | | | 2,409,520 | |
Ohio State Water Development Auth. Rev., (Water Pollution Control Loan Fund), 5.00%, 12/1/13(1) | | | 5,895,000 | | | | 6,530,658 | |
Summit County GO, 5.75%, 12/1/12, Prerefunded at 101% of Par (FGIC)(1)(2) | | | 1,505,000 | | | | 1,641,338 | |
Tri Valley Local School District GO, 5.75%, 6/1/12, Prerefunded at 100% of Par (FGIC)(1)(2) | | | 1,550,000 | | | | 1,635,436 | |
| | | | | | | | 34,962,066 | |
| OKLAHOMA — 0.6% | |
Comanche County Hospital Auth. Rev., 5.00%, 7/1/11 (Radian)(1) | | | 355,000 | | | | 355,792 | |
Comanche County Hospital Auth. Rev., 5.00%, 7/1/12 (Radian)(1) | | | 1,175,000 | | | | 1,204,398 | |
Oklahoma Development Finance Auth. Health System Rev., Series 2008 C, 5.50%, 8/15/22 (Obligated Group Consisting of INTEGRIS Baptist Medical Center, Inc., INTEGRIS South Oklahoma City Hospital Corp. and INTEGRIS Rural Heath, Inc.)(1) | | | 3,000,000 | | | | 3,326,220 | |
Pottawatomie County Facilities Auth. Rev., (Shawnee Public Schools), 5.00%, 9/1/13(1) | | | 1,610,000 | | | | 1,673,965 | |
Pottawatomie County Facilities Auth. Rev., (Shawnee Public Schools), 5.00%, 9/1/14(1) | | | 1,730,000 | | | | 1,791,225 | |
Pottawatomie County Facilities Auth. Rev., (Shawnee Public Schools), 5.00%, 9/1/15(1) | | | $1,710,000 | | | | $1,764,583 | |
Pottawatomie County Facilities Auth. Rev., (Shawnee Public Schools), 5.00%, 9/1/16(1) | | | 2,130,000 | | | | 2,193,176 | |
| | | | | | | | 12,309,359 | |
| OREGON — 0.6% | |
Oregon GO, Series 2011 J, 5.00%, 5/1/19(1) | | | 1,080,000 | | | | 1,287,522 | |
Oregon GO, Series 2011 J, 5.00%, 5/1/20(1) | | | 1,870,000 | | | | 2,231,490 | |
Oregon GO, Series 2011 J, 5.00%, 5/1/21(1) | | | 1,500,000 | | | | 1,790,445 | |
Oregon Health & Science University Rev., Series 2009 A, 5.75%, 7/1/39(1) | | | 2,900,000 | | | | 3,039,113 | |
Oregon State Department of Administrative Services COP, Series 2008 A, 5.00%, 5/1/13 (AGM)(1) | | | 2,840,000 | | | | 3,078,617 | |
| | | | | | | | 11,427,187 | |
| PENNSYLVANIA — 5.6% | |
Allegheny County Hospital Development Auth. Rev., Series 2008 A, (University of Pittsburgh Medical Center), 5.00%, 9/1/11(1) | | | 4,000,000 | | | | 4,047,560 | |
Allegheny County Hospital Development Auth. Rev., Series 2008 A, (University of Pittsburgh Medical Center), 5.00%, 9/1/12(1) | | | 6,210,000 | | | | 6,564,032 | |
Allegheny County Hospital Development Auth. Rev., Series 2008 A, (University of Pittsburgh Medical Center), 5.00%, 9/1/18(1) | | | 1,500,000 | | | | 1,697,970 | |
Allegheny County Industrial Development Auth. Rev., (Residential Resources, Inc.), 4.75%, 9/1/14(1) | | | 2,250,000 | | | | 2,329,268 | |
Central Dauphin School District GO, 7.00%, 2/1/16, Prerefunded at 100% of Par (NATL)(1)(2) | | | 1,150,000 | | | | 1,451,691 | |
East Stroudsburg Area School District GO, 7.75%, 9/1/16, Prerefunded at 100% of Par (AGM)(1)(2) | | | 2,580,000 | | | | 3,423,479 | |
Exeter Township GO, 5.25%, 7/15/15 (Ambac)(1) | | | 1,155,000 | | | | 1,329,936 | |
Exeter Township GO, 5.30%, 7/15/19 (Ambac)(1) | | | 1,830,000 | | | | 2,165,073 | |
Geisinger Auth. Health System Rev., VRN, 0.95%, 8/1/11, resets quarterly at 67% of the 3-month LIBOR plus 0.77% with no caps(1) | | | 5,000,000 | | | | 3,218,250 | |
Oxford Area School District GO, Series 2001 A, 5.50%, 2/15/12, Prerefunded at 100% of Par (FGIC)(1)(2) | | | 1,000,000 | | | | 1,037,420 | |
| Pennsylvania Economic Development Financing Auth. Rev., Series 2009 A, (Albert Einstein Healthcare Network), 6.25%, 10/15/23 | | | 5,000,000 | | | | 5,252,300 | |
Pennsylvania GO, 5.00%, 7/1/19(1) | | | 15,000,000 | | | | 17,851,050 | |
Pennsylvania GO, 5.375%, 7/1/18 (AGM)(1) | | | 1,070,000 | | | | 1,302,725 | |
Pennsylvania Higher Educational Facilities Auth. Rev., Series 2009 A, (University of Pennsylvania), 5.00%, 9/1/19(1) | | | 1,000,000 | | | | 1,190,880 | |
Pennsylvania Turnpike Commission Rev., Series 2009 B, 5.00%, 12/1/16(1) | | | 5,000,000 | | | | 5,743,000 | |
Pennsylvania Turnpike Commission Rev., Series 2009 B, 5.25%, 6/1/22(1) | | | 10,000,000 | | | | 10,691,800 | |
Philadelphia Rev., Series 2009 A, (1998 General Ordinance), 5.25%, 8/1/17(1) | | | 1,000,000 | | | | 1,106,430 | |
Philadelphia Water & Wastewater Rev., Series 2009 A, 5.25%, 1/1/36(1) | | | 1,415,000 | | | | 1,425,938 | |
Philadelphia Water & Wastewater Rev., Series 2010 A, 5.00%, 6/15/16(1) | | | 10,000,000 | | | | 11,175,100 | |
Philadelphia Water & Wastewater Rev., Series 2010 A, 5.00%, 6/15/17 (AGM)(1) | | | 5,000,000 | | | | 5,661,500 | |
Pittsburgh GO, Series 2006 B, 5.25%, 9/1/16 (AGM)(1) | | | 15,805,000 | | | | 17,736,055 | |
Scranton Parking Auth. Rev., 5.00%, 6/1/22 (Radian)(1) | | | 1,270,000 | | | | 1,249,972 | |
Westmoreland County Municipal Auth. Rev., 5.25%, 8/15/15, Prerefunded at 100% of Par (AGM)(1)(2) | | | 4,500,000 | | | | 5,247,180 | |
| | | | | | | | 112,898,609 | |
| PUERTO RICO — 4.5% | | | | | | | | |
Puerto Rico Aqueduct & Sewer Auth. Rev., Series 2008 A, (Senior Lien), 5.00%, 7/1/12(1) | | | $4,000,000 | | | | $4,121,120 | |
Puerto Rico Aqueduct & Sewer Auth. Rev., Series 2008 A, (Senior Lien), 5.00%, 7/1/14(1) | | | 12,550,000 | | | | 13,295,470 | |
Puerto Rico Aqueduct & Sewer Auth. Rev., Series 2008 A, (Senior Lien), 6.00%, 7/1/44(1) | | | 1,750,000 | | | | 1,751,890 | |
Puerto Rico Electric Power Auth. Rev., Series 2010 ZZ, 5.25%, 7/1/25(1) | | | 5,000,000 | | | | 5,010,500 | |
Puerto Rico Electric Power Auth. Rev., Series 2010 ZZ, 5.25%, 7/1/26(1) | | | 2,100,000 | | | | 2,095,569 | |
Puerto Rico GO, Series 2006 A, (Public Improvement), 5.25%, 7/1/23(1) | | | 1,975,000 | | | | 1,977,094 | |
Puerto Rico GO, Series 2006 B, (Public Improvement), 5.25%, 7/1/17(1) | | | 5,000,000 | | | | 5,293,000 | |
Puerto Rico GO, Series 2007 A, (Public Improvement), 5.50%, 7/1/17(1) | | | 2,675,000 | | | | 2,894,912 | |
Puerto Rico GO, Series 2008 A, 5.50%, 7/1/16(1) | | | 3,020,000 | | | | 3,283,555 | |
Puerto Rico GO, Series 2008 A, 5.125%, 7/1/28(1) | | | 3,000,000 | | | | 2,889,120 | |
Puerto Rico GO, Series 2011 C, (Public Improvement), 5.75%, 7/1/36(1) | | | 2,085,000 | | | | 2,054,934 | |
Puerto Rico Government Development Bank Rev., 4.75%, 12/1/15 (NATL)(1) | | | 17,750,000 | | | | 18,251,082 | |
Puerto Rico Government Development Bank Rev., Series 2006 B, (Senior Notes), 5.00%, 12/1/14(1) | | | 4,000,000 | | | | 4,251,600 | |
Puerto Rico Government Development Bank Rev., Series 2006 B, (Senior Notes), 5.00%, 12/1/16(1) | | | 2,000,000 | | | | 2,131,600 | |
Puerto Rico Infrastructure Financing Auth. Special Tax Rev., Series 2006 B, 5.00%, 7/1/13(1) | | | 1,750,000 | | | | 1,842,068 | |
Puerto Rico Municipal Finance Agency GO, Series 2005 A, 5.00%, 8/1/11(1) | | | 3,700,000 | | | | 3,722,200 | |
Puerto Rico Public Buildings Auth. Rev., Series 2004 I, (Government Facilities), 5.50%, 7/1/14, Prerefunded at 100% of Par(1)(2) | | | 5,000,000 | | | | 5,710,150 | |
Puerto Rico Public Buildings Auth. Rev., Series 2007 M, (Government Facilities), 5.50%, 7/1/12(1) | | | 2,000,000 | | | | 2,074,620 | |
Puerto Rico Public Buildings Auth. Rev., Series 2009 P, (Government Facilities), 6.75%, 7/1/36(1) | | | 6,700,000 | | | | 7,237,943 | |
| | | | | | | | 89,888,427 | |
| RHODE ISLAND — 0.1% | |
Rhode Island Depositors Economic Protection Corp. Rev., Series 1993 A, 6.25%, 8/1/16 (NATL)(1)(2) | | | 2,000,000 | | | | 2,465,500 | |
| SOUTH CAROLINA — 1.4% | |
Kershaw County Public Schools Foundation Installment Purchase Rev., (School Improvements), 5.00%, 12/1/17 (CIFG)(1) | | | 1,060,000 | | | | 1,160,562 | |
Kershaw County Public Schools Foundation Installment Purchase Rev., (School Improvements), 5.00%, 12/1/18 (CIFG)(1) | | | 2,260,000 | | | | 2,436,235 | |
Kershaw County Public Schools Foundation Installment Purchase Rev., (School Improvements), 5.00%, 12/1/19 (CIFG)(1) | | | 1,450,000 | | | | 1,538,508 | |
Kershaw County Public Schools Foundation Installment Purchase Rev., (School Improvements), 5.00%, 12/1/20 (CIFG)(1) | | | 3,000,000 | | | | 3,152,250 | |
Piedmont Municipal Power Agency Rev., 6.75%, 1/1/19 (FGIC)(1)(2) | | | 625,000 | | | | 809,188 | |
Piedmont Municipal Power Agency Rev., 6.75%, 1/1/19 (NATL/FGIC)(1) | | | 875,000 | | | | 1,082,987 | |
Piedmont Municipal Power Agency Rev., Series 1991 A, 6.50%, 1/1/16 (FGIC)(1)(2) | | | 140,000 | | | | 171,483 | |
Piedmont Municipal Power Agency Rev., Series 1991 A, 6.50%, 1/1/16 (FGIC)(1) | | | 375,000 | | | | 447,727 | |
Piedmont Municipal Power Agency Rev., Series 1991 A, 6.50%, 1/1/16 (FGIC)(1)(2) | | | 485,000 | | | | 594,067 | |
Piedmont Municipal Power Agency Rev., Series 2009 A3, 5.00%, 1/1/16(1) | | | $5,000,000 | | | | $5,622,200 | |
Piedmont Municipal Power Agency Rev., Series 2009 A3, 5.00%, 1/1/17(1) | | | 3,000,000 | | | | 3,376,020 | |
South Carolina Jobs-Economic Development Auth. Hospital Rev., (Palmetto Health), 5.75%, 8/1/39(1) | | | 2,700,000 | | | | 2,511,783 | |
South Carolina Ports Auth. Rev., 4.00%, 7/1/15(1) | | | 1,000,000 | | | | 1,076,810 | |
South Carolina Ports Auth. Rev., 5.00%, 7/1/16(1) | | | 2,695,000 | | | | 3,032,495 | |
Spartanburg County Health Services District, Inc. Hospital Rev., 5.50%, 4/15/16 (AGM)(1) | | | 1,095,000 | | | | 1,123,799 | |
Tobacco Settlement Revenue Management Auth. Rev., 5.00%, 6/1/18(1) | | | 515,000 | | | | 515,680 | |
| | | | | | | | 28,651,794 | |
| TENNESSEE — 0.5% | |
Chattanooga Health Educational & Housing Facility Board Rev., Series 2005 A, (Campus Development Foundation, Inc. Phase I LLC), 5.00%, 10/1/15(1) | | | 2,180,000 | | | | 2,258,807 | |
Johnson City Health & Educational Facilities Board Hospital Rev., (Mountain States Health Alliance), 6.00%, 7/1/38(1) | | | 1,750,000 | | | | 1,666,840 | |
Memphis Electric System Rev., 5.00%, 12/1/15(1) | | | 2,500,000 | | | | 2,901,600 | |
Memphis Electric System Rev., 5.00%, 12/1/16(1) | | | 1,000,000 | | | | 1,180,810 | |
Tennessee State School Board Auth. Rev., Series 2008 B, (Higher Educational Facilities), 5.125%, 5/1/33(1) | | | 1,000,000 | | | | 1,057,880 | |
| | | | | | | | 9,065,937 | |
| TEXAS — 6.1% | |
Allen Independent School District GO, (School Building), 5.25%, 2/15/34(1) | | | 3,325,000 | | | | 3,604,732 | |
Canadian River Municipal Water Auth. Rev., (Conjunctive Use Groundwater), 5.00%, 2/15/19 (Ambac)(1) | | | 1,000,000 | | | | 1,095,120 | |
Cash Special Utility District Rev., 5.25%, 9/1/24 (NATL)(1) | | | 2,035,000 | | | | 2,074,235 | |
Cypress-Fairbanks Independent School District GO, (Schoolhouse), 5.00%, 2/15/16 (PSF-GTD)(1) | | | 1,000,000 | | | | 1,169,730 | |
Dallas Area Rapid Transit Sales Tax Rev., Series 2010 A, (Senior Lien), 5.00%, 12/1/14(1) | | | 680,000 | | | | 775,091 | |
Dallas Area Rapid Transit Sales Tax Rev., Series 2010 A, (Senior Lien), 5.00%, 12/1/15(1) | | | 2,185,000 | | | | 2,543,296 | |
Dallas Area Rapid Transit Sales Tax Rev., Series 2010 A, (Senior Lien), 5.00%, 12/1/19(1) | | | 2,250,000 | | | | 2,678,535 | |
Dallas-Fort Worth International Airport Facilities Improvement Corp. Rev., Series 2009 A, 5.00%, 11/1/24(1) | | | 1,000,000 | | | | 1,037,730 | |
Donna Independent School District GO, 5.00%, 2/15/15 (PSF-GTD)(1) | | | 2,000,000 | | | | 2,285,560 | |
Edcouch-Elsa Independent School District GO, 5.00%, 2/15/14 (PSF-GTD)(1) | | | 1,115,000 | | | | 1,243,359 | |
Garza County Public Facility Corp. Rev., 5.00%, 10/1/11(1) | | | 610,000 | | | | 616,192 | |
Garza County Public Facility Corp. Rev., 5.00%, 10/1/13(1) | | | 2,015,000 | | | | 2,125,603 | |
Garza County Public Facility Corp. Rev., 5.25%, 10/1/14(1) | | | 1,115,000 | | | | 1,195,436 | |
Garza County Public Facility Corp. Rev., 5.25%, 10/1/15(1) | | | 1,225,000 | | | | 1,320,146 | |
Garza County Public Facility Corp. Rev., 5.25%, 10/1/16(1) | | | 1,145,000 | | | | 1,239,348 | |
Garza County Public Facility Corp. Rev., 5.50%, 10/1/16(1) | | | 1,000,000 | | | | 1,094,450 | |
Gregg County Health Facilities Development Corp. Rev., Series 2006 A, (Good Shepherd Medical Center), 5.00%, 10/1/16(1) | | | 1,000,000 | | | | 1,037,570 | |
Harris County Cultural Education Facilities Finance Corp. Rev., Series 2008 B, (The Methodist Hospital System), 5.50%, 12/1/18(1) | | | $2,500,000 | | | | $2,922,825 | |
Harris County Rev., Series 2009 C, 5.00%, 8/15/17(1) | | | 5,000,000 | | | | 5,838,750 | |
Hays Consolidated Independent School District GO, 6.32%, 8/15/11 (PSF-GTD)(1)(2)(4) | | | 700,000 | | | | 699,475 | |
Hays Consolidated Independent School District GO, 6.32%, 8/15/11 (PSF-GTD)(1)(4) | | | 2,300,000 | | | | 2,298,712 | |
Hidalgo County GO, 5.50%, 8/15/12, Prerefunded at 100% of Par (FGIC)(1)(2) | | | 1,295,000 | | | | 1,376,468 | |
Hidalgo County GO, 5.50%, 8/15/12, Prerefunded at 100% of Par (FGIC)(1)(2) | | | 1,750,000 | | | | 1,860,093 | |
Houston Airport System Rev., Series 2009 A, (Senior Lien), 5.50%, 7/1/39(1) | | | 4,000,000 | | | | 4,119,080 | |
Houston GO, Series 2009 A, (Public Improvement), 5.00%, 3/1/21(1) | | | 10,000,000 | | | | 11,418,000 | |
Laredo Community College District Combined Fee Rev., 5.25%, 8/1/35 (AGM)(1) | | | 690,000 | | | | 701,240 | |
Live Oak GO, 5.25%, 8/1/22 (NATL)(1) | | | 1,630,000 | | | | 1,693,048 | |
Lone Star College System GO, 5.00%, 8/15/21(1) | | | 1,000,000 | | | | 1,173,780 | |
Lone Star College System GO, 5.00%, 8/15/22(1) | | | 2,650,000 | | | | 3,075,087 | |
Lower Colorado River Auth. Rev., 5.00%, 5/15/15(1) | | | 800,000 | | | | 911,008 | |
Lower Colorado River Auth. Rev., (LCRA Transportation Services), 5.00%, 5/15/22(1) | | | 1,000,000 | | | | 1,090,510 | |
Lower Colorado River Auth. Rev., (LCRA Transportation Services), 5.00%, 5/15/23(1) | | | 3,435,000 | | | | 3,705,300 | |
Lower Colorado River Auth. Rev., (LCRA Transportation Services), 5.00%, 5/15/24(1) | | | 2,000,000 | | | | 2,138,240 | |
Lubbock Electric Light & Power System Rev., 4.00%, 4/15/14(1) | | | 2,000,000 | | | | 2,155,560 | |
Lubbock Electric Light & Power System Rev., 5.00%, 4/15/15(1) | | | 1,000,000 | | | | 1,128,270 | |
Lubbock Electric Light & Power System Rev., 5.00%, 4/15/16(1) | | | 2,000,000 | | | | 2,299,440 | |
Montgomery County GO, (Road), 5.50%, 3/1/14, Prerefunded at 100% of Par (Ambac)(1)(2) | | | 1,740,000 | | | | 1,964,773 | |
North Texas Thruway Auth. Rev., Series 2008 H, (First Tier), VRDN, 5.00%, 1/1/13(1) | | | 9,500,000 | | | | 9,995,995 | |
Pasadena Independent School District GO, Series 1996 A, 6.05%, 2/15/16 (PSF-GTD)(1) | | | 550,000 | | | | 666,897 | |
San Antonio Electric & Gas Rev., (Junior Lien), VRDN, 1.15%, 12/3/12 (LOC: BNP Paribas)(1) | | | 2,750,000 | | | | 2,763,915 | |
Southside Independent School District GO, Series 2004 A, 5.25%, 8/15/25 (PSF-GTD)(1) | | | 2,120,000 | | | | 2,317,838 | |
Tarrant County Cultural Education Facilities Finance Corp. Retirement Facility Rev., (Air Force Village Obligated Group), 5.00%, 5/15/1(1) | | | 1,000,000 | | | | 1,042,840 | |
Tarrant County Cultural Education Facilities Finance Corp. Rev., (Texas Health Resources), 5.00%, 11/15/40(1) | | | 5,000,000 | | | | 4,734,750 | |
Texas Municipal Power Agency Rev., (Subordinated Lien-Transmission), 5.00%, 9/1/15(1) | | | 1,000,000 | | | | 1,128,500 | |
Texas Municipal Power Agency Rev., (Subordinated Lien-Transmission), 5.00%, 9/1/20(1) | | | 1,500,000 | | | | 1,705,365 | |
Texas Public Finance Auth. Charter School Finance Corp. Rev., Series 2006 A, (KIPP, Inc.), 5.25%, 2/15/14 (ACA)(1) | | | 400,000 | | | | 415,580 | |
Texas Public Finance Auth. Rev., Series 2010 A, (Unemployment Compensation), 5.00%, 7/1/14(1) | | | 5,000,000 | | | | 5,609,800 | |
Texas State Transportation Commission Rev., Series 2006 A, (First Tier), 4.50%, 4/1/16(1) | | | 5,000,000 | | | | 5,744,600 | |
| University of North Texas Rev., Series 2009 A, (Financing System), 5.00%, 4/15/13 | | | 1,000,000 | | | | 1,084,850 | |
| University of North Texas Rev., Series 2009 A, (Financing System), 5.00%, 4/15/16 | | | $1,125,000 | | | | $1,314,450 | |
West Harris County Regional Water Auth. Rev., 5.00%, 12/15/35(1) | | | 750,000 | | | | 762,233 | |
West Oso Independent School District GO, 5.50%, 8/15/13, Prerefunded at 100% of Par (PSF-GTD)(1)(2) | | | 1,265,000 | | | | 1,404,289 | |
Williamson County GO, Series 2004 A, (Unlimited Tax Road & Refunding Bonds), 5.00%, 2/15/19 (NATL)(1) | | | 1,000,000 | | | | 1,190,400 | |
| | | | | | | | 121,588,094 | |
| U.S. VIRGIN ISLANDS — 0.8% | |
Virgin Islands Public Finance Auth. Rev., Series 2009 B, (Senior Lien), 5.00%, 10/1/17(1) | | | 6,950,000 | | | | 7,640,830 | |
Virgin Islands Public Finance Auth. Rev., Series 2010 A, (Matching Fund Loan Note, Senior Lien), 5.00%, 10/1/25(1) | | | 7,250,000 | | | | 7,201,860 | |
Virgin Islands Water & Power Auth. Rev., Series 2007 A, 5.00%, 7/1/24(1) | | | 1,500,000 | | | | 1,513,245 | |
| | | | | | | | 16,355,935 | |
| UTAH — 0.9% | |
Eagle Mountain City Gas & Electric Rev., 5.00%, 6/1/19 (Radian)(1) | | | 2,550,000 | | | | 2,607,426 | |
Intermountain Power Agency Rev., Series 2008 A, 5.25%, 7/1/20(1) | | | 3,500,000 | | | | 3,733,870 | |
Salt Lake City Hospital Rev., Series 1988A, (Intermountain Healthcare), 8.125%, 5/15/15(1)(2) | | | 510,000 | | | | 578,942 | |
Utah County Municipal Building Auth. Lease Rev., 5.25%, 11/1/11, Prerefunded at 100% of Par (Ambac)(1)(2) | | | 1,820,000 | | | | 1,858,511 | |
Utah County Municipal Building Auth. Lease Rev., 5.25%, 11/1/11, Prerefunded at 100% of Par (Ambac)(1)(2) | | | 1,915,000 | | | | 1,955,521 | |
Utah County Municipal Building Auth. Lease Rev., 5.50%, 11/1/11, Prerefunded at 100% of Par (Ambac)(1)(2) | | | 1,000,000 | | | | 1,022,200 | |
Utah GO, Series 2009 C, 5.00%, 7/1/18(1) | | | 4,000,000 | | | | 4,818,400 | |
West Valley City Sales Tax Rev., Series 2001 A, 5.50%, 7/15/11, Prerefunded at 100% of Par (NATL)(1)(2) | | | 1,305,000 | | | | 1,313,509 | |
| | | | | | | | 17,888,379 | |
| VERMONT — 0.2% | |
University of Vermont & State Agricultural College Rev., 5.00%, 10/1/19 (Ambac)(1) | | | 4,290,000 | | | | 4,830,926 | |
| VIRGINIA — 1.3% | |
Fairfax County COP, 5.30%, 4/15/23(1) | | | 1,500,000 | | | | 1,595,265 | |
Fairfax County Economic Development Auth. Rev., (Silver Line Phase I), 5.00%, 4/1/36(1) | | | 1,430,000 | | | | 1,481,022 | |
| Montgomery County Industrial Development Auth. Rev., (Tech Foundation), VRDN, 0.15%, 6/1/11 (LOC: Bank of America N.A.) | | | 6,000,000 | | | | 6,000,000 | |
Virginia College Building & Education Facilities Auth. Rev., Series 2009 A, (Public Higher Education Financing Program), 5.00%, 9/1/28(1) | | | 5,100,000 | | | | 5,482,704 | |
Virginia Resources Auth. Clean Water Rev., (State Revolving Fund), 5.00%, 10/1/16(1) | | | 5,120,000 | | | | 6,088,602 | |
Virginia Resources Auth. Clean Water Rev., (State Revolving Fund), 5.00%, 10/1/22(1) | | | 4,150,000 | | | | 4,798,521 | |
| Virginia Small Business Financing Auth. Rev., (Virginia State University Real Estate Foundation), VRDN, 0.16%, 6/1/11 (LOC: Bank of America N.A.) | | | 250,000 | | | | 250,000 | |
| | | | | | | | 25,696,114 | |
| WASHINGTON — 3.1% | |
Benton County Public Utility District No. 1 Electric Rev., Series 2001 A, 5.625%, 11/1/19 (AGM)(1) | | | 1,000,000 | | | | 1,018,080 | |
Cowlitz County Kelso School District No. 458 GO, 5.75%, 6/1/12, Prerefunded at 100% of Par (AGM/School Bond Guarantee)(1)(2) | | | 1,000,000 | | | | 1,055,120 | |
Energy Northwest Electric Rev., Series 2002 A, (Columbia Generating Station), 5.75%, 7/1/18 (NATL)(1) | | | $3,500,000 | | | | $3,679,830 | |
Energy Northwest Electric Rev., Series 2002 B, (Columbia Generating Station), 6.00%, 7/1/12, Prerefunded at 100% of Par (Ambac)(2) | | | 4,895,000 | | | | 5,198,490 | |
Energy Northwest Electric Rev., Series 2002 B, (Columbia Generating Station), 6.00%, 7/1/18 (Ambac)(1) | | | 5,105,000 | | | | 5,381,027 | |
Energy Northwest Electric Rev., Series 2008 D, (Columbia Generating Station), 5.00%, 7/1/12(1) | | | 2,375,000 | | | | 2,496,576 | |
Energy Northwest Electric Rev., Series 2009 A, (Project 3), 5.25%, 7/1/18(1) | | | 3,000,000 | | | | 3,606,000 | |
Energy Northwest Electric Rev., Series 2010 A, (Project 3), 5.00%, 7/1/18(1) | | | 5,115,000 | | | | 6,064,651 | |
Energy Northwest Wind Rev., 4.75%, 7/1/20 (NATL)(1) | | | 1,750,000 | | | | 1,824,288 | |
King County Public Hospital District No. 2 GO, (Evergreen Healthcare), 5.00%, 12/1/14 (NATL)(1) | | | 1,000,000 | | | | 1,108,540 | |
King County School District No. 414 Lake Washington GO, 5.75%, 12/1/12, Prerefunded at 100% of Par(1)(2) | | | 1,555,000 | | | | 1,681,204 | |
Kitsap County School District No. 303 Bainbridge Island GO, 5.00%, 12/1/17 (NATL/School Bond Guarantee)(1) | | | 1,000,000 | | | | 1,143,760 | |
Mason County School District No. 309 Shelton GO, 5.625%, 12/1/11, Prerefunded at 100% of Par (FGIC/School Bond Guarantee)(1)(2) | | | 1,260,000 | | | | 1,294,322 | |
Metropolitan Park District of Tacoma GO, 6.00%, 12/1/11, Prerefunded at 100% of Par (Ambac)(1)(2) | | | 1,000,000 | | | | 1,029,110 | |
Metropolitan Park District of Tacoma GO, 6.00%, 12/1/11, Prerefunded at 100% of Par (Ambac)(1)(2) | | | 1,120,000 | | | | 1,152,603 | |
Port Seattle Rev., Series 2010 B, (Intermediate Lien), 5.00%, 6/1/22(1) | | | 1,000,000 | | | | 1,109,080 | |
Seattle Municipal Light & Power Rev., Series 2010 B, 5.00%, 2/1/19(1) | | | 5,000,000 | | | | 5,916,400 | |
Snohomish County Edmonds School District No. 15 GO, 5.00%, 12/1/17 (NATL/FGIC/School Bond Guarantee)(1) | | | 6,690,000 | | | | 7,668,212 | |
Washington GO, Series 1990 A, 6.75%, 2/1/15(1) | | | 825,000 | | | | 916,798 | |
Washington Health Care Facilities Auth. Rev., Series 2006 D, (Providence Health & Services), 5.25%, 10/1/33 (AGM)(1) | | | 4,500,000 | | | | 4,577,625 | |
Whitman County Pullman School District No. 267 GO, 5.625%, 6/1/12, Prerefunded at 100% of Par (AGM/School Bond Guarantee)(1)(2) | | | 1,500,000 | | | | 1,580,025 | |
Yakima County School District No. 208 West Valley GO, 5.00%, 12/1/18 (NATL/School Bond Guarantee)(1) | | | 1,675,000 | | | | 1,902,850 | |
| | | | | | | | 61,404,591 | |
| WISCONSIN — 1.4% | |
Wisconsin Clean Water Rev., Series 1991-1, 6.875%, 6/1/11(1) | | | 710,000 | | | | 710,000 | |
Wisconsin GO, Series 2011-1, 5.00%, 5/1/19(3) | | | 5,000,000 | | | | 5,909,200 | |
Wisconsin GO, Series 2011-1, 5.00%, 5/1/20(3) | | | 3,000,000 | | | | 3,545,820 | |
Wisconsin GO, Series 2011-1, 5.00%, 5/1/21(3) | | | 2,500,000 | | | | 2,950,775 | |
Wisconsin Health & Educational Facilities Auth. Rev., (Luther Hospital), 5.50%, 11/15/22(1) | | | 4,655,000 | | | | 5,137,677 | |
Wisconsin Health & Educational Facilities Auth. Rev., (Luther Hospital), 5.75%, 11/15/30(1) | | | 5,800,000 | | | | 6,082,518 | |
| Wisconsin Health & Educational Facilities Auth. Rev., Series 2010 B, (Aurora Health Care), 5.00%, 7/15/13 | | | 2,000,000 | | | | 2,111,180 | |
Wisconsin Transportation Rev., Series 2008 A, 5.00%, 7/1/18(1) | | | 500,000 | | | | 595,725 | |
| | | | | | | | 27,042,895 | |
| | | | |
| | | Value | |
TOTAL INVESTMENT SECURITIES — 100.2% (Cost $1,924,096,143) | | | $2,006,661,129 | |
OTHER ASSETS AND LIABILITIES — (0.2)% | | | (3,037,709 | ) |
| TOTAL NET ASSETS — 100.0% | | | $2,003,623,420 | |
| Futures Contracts |
| Contracts Purchased | Expiration Date | Underlying Face Amount at Value | Unrealized Gain (Loss) |
| 717 | U.S. Long Bond | September 2011 | $89,512,969 | $861,027 |
| Contracts Sold | Expiration Date | Underlying Face Amount at Value | Unrealized Gain (Loss) |
| 2,196 | U.S. Treasury 2-Year Notes | September 2011 | $481,335,750 | $(897,066) |
Notes to Schedule of Investments
ACA = American Capital Access
AGC = Assured Guaranty Corporation
AGM = Assured Guaranty Municipal Corporation
Ambac = Ambac Assurance Corporation
CIFG = CDC IXIS Financial Guaranty North America
COP = Certificates of Participation
FGIC = Financial Guaranty Insurance Company
GO = General Obligation
LIBOR = London Interbank Offered Rate
LOC = Letter of Credit
NATL = National Public Finance Guarantee Corporation
NATL-IBC = National Public Finance Guarantee Corporation – Insured Bond Certificates
PSF-GTD = Permanent School Fund Guaranteed
Radian = Radian Asset Assurance, Inc.
resets = The frequency with which a security’s coupon changes, based on current market conditions or an underlying index. The more frequently a security resets, the less risk the investor is taking that the coupon will vary significantly from current market rates.
VRDN = Variable Rate Demand Note. Interest reset date is indicated. Rate shown is effective at the period end.
VRN = Variable Rate Note. Interest reset date is indicated. Rate shown is effective at the period end.
XLCA = XL Capital Ltd.
| (1) | Security, or a portion thereof, has been segregated for when-issued securities and/or futures contracts. At the period end, the aggregate value of securities pledged was $603,409,000. |
| (2) | Escrowed to maturity in U.S. government securities or state and local government securities. |
| (4) | Security is a zero-coupon municipal bond. The rate indicated is the yield to maturity at purchase. Zero-coupon securities are issued at a substantial discount from their value at maturity. |
| (5) | Category is less than 0.05% of total net assets. |
See Notes to Financial Statements.
Statement of Assets and Liabilities |
| MAY 31, 2011 | |
| Assets | |
| Investment securities, at value (cost of $1,924,096,143) | | | $2,006,661,129 | |
| Cash | | | 606,986 | |
| Receivable for investments sold | | | 1,769,557 | |
| Receivable for capital shares sold | | | 2,916,395 | |
| Receivable for variation margin on futures contracts | | | 179,250 | |
| Interest receivable | | | 28,820,838 | |
| | | | 2,040,954,155 | |
| | | | | |
| Liabilities | | | | |
| Payable for investments purchased | | | 32,918,392 | |
| Payable for capital shares redeemed | | | 2,669,812 | |
| Payable for variation margin on futures contracts | | | 171,562 | |
| Accrued management fees | | | 731,155 | |
| Distribution and service fees payable | | | 13,717 | |
| Dividends payable | | | 826,097 | |
| | | | 37,330,735 | |
| | | | | |
| Net Assets | | | $2,003,623,420 | |
| | | | | |
| Net Assets Consist of: | | | | |
| Capital paid in | | | $1,945,064,430 | |
| Accumulated net realized loss | | | (23,969,957 | ) |
| Net unrealized appreciation | | | 82,528,947 | |
| | | | $2,003,623,420 | |
| | | | | | | |
| | | Net assets | | Shares outstanding | | Net asset value per share |
| Investor Class | | | $1,717,929,899 | | | | 155,393,821 | | | | $11.06 | |
| Institutional Class | | | $245,758,535 | | | | 22,226,850 | | | | $11.06 | |
| A Class | | | $30,929,859 | | | | 2,797,009 | | | | $11.06 | * |
| C Class | | | $9,005,127 | | | | 815,087 | | | | $11.05 | |
| * | Maximum offering price $11.58 (net asset value divided by 0.955) |
See Notes to Financial Statements.
| YEAR ENDED MAY 31, 2011 | |
| Investment Income (Loss) | |
| Income: | | | |
| Interest | | | $80,976,720 | |
| | | | | |
| Expenses: | | | | |
| Management fees | | | 9,082,425 | |
| Distribution and service fees: | | | | |
| A Class | | | 49,238 | |
| C Class | | | 62,905 | |
| Trustees’ fees and expenses | | | 87,105 | |
| Other expenses | | | 39,182 | |
| | | | 9,320,855 | |
| Fees waived | | | (220,624 | ) |
| | | | 9,100,231 | |
| | | | | |
| Net investment income (loss) | | | 71,876,489 | |
| | | | | |
| Realized and Unrealized Gain (Loss) | | | | |
| Net realized gain (loss) on: | | | | |
| Investment transactions | | | (559,197 | ) |
| Futures contract transactions | | | (7,130,336 | ) |
| | | | (7,689,533 | ) |
| | | | | |
| Change in net unrealized appreciation (depreciation) on: | | | | |
| Investments | | | (5,489,145 | ) |
| Futures contracts | | | 761,599 | |
| | | | (4,727,546 | ) |
| | | | | |
| Net realized and unrealized gain (loss) | | | (12,417,079 | ) |
| | | | | |
| Net Increase (Decrease) in Net Assets Resulting from Operations | | | $59,459,410 | |
See Notes to Financial Statements.
Statement of Changes in Net Assets |
| YEARS ENDED MAY 31, 2011 AND MAY 31, 2010 | |
| Increase (Decrease) in Net Assets | | 2011 | | | 2010 | |
| Operations | |
| Net investment income (loss) | | | $71,876,489 | | | | $58,813,953 | |
| Net realized gain (loss) | | | (7,689,533 | ) | | | 140,676 | |
| Change in net unrealized appreciation (depreciation) | | | (4,727,546 | ) | | | 55,899,473 | |
| Net increase (decrease) in net assets resulting from operations | | | 59,459,410 | | | | 114,854,102 | |
| | | | | | | | | |
| Distributions to Shareholders | | | | | | | | |
| From net investment income: | | | | | | | | |
| Investor Class | | | (62,106,128 | ) | | | (52,623,677 | ) |
| Institutional Class | | | (8,961,553 | ) | | | (6,221,372 | ) |
| A Class | | | (648,282 | ) | | | (21,617 | ) |
| C Class | | | (160,526 | ) | | | (3,075 | ) |
| Decrease in net assets from distributions | | | (71,876,489 | ) | | | (58,869,741 | ) |
| | | | | | | | | |
| Capital Share Transactions | | | | | | | | |
| Net increase (decrease) in net assets from capital share transactions | | | 84,338,596 | | | | 565,416,373 | |
| | | | | | | | | |
| Net increase (decrease) in net assets | | | 71,921,517 | | | | 621,400,734 | |
| | | | | | | | | |
| Net Assets | | | | | | | | |
| Beginning of period | | | 1,931,701,903 | | | | 1,310,301,169 | |
| End of period | | | $2,003,623,420 | | | | $1,931,701,903 | |
See Notes to Financial Statements.
Notes to Financial Statements |
MAY 31, 2011
1. Organization
American Century Municipal Trust (the trust) is registered under the Investment Company Act of 1940, as amended (the 1940 Act), as an open-end management investment company and is organized as a Massachusetts business trust. Intermediate-Term Tax-Free Bond Fund (formerly Tax-Free Bond Fund) (the fund) is one fund in a series issued by the trust. The fund is diversified as defined under the 1940 Act. The fund’s investment objective is to seek safety of principal and high current income that is exempt from federal income tax. The fund pursues its objective by investing primarily in investment-grade municipal obligations.
The fund is authorized to issue the Investor Class, the Institutional Class, the A Class and the C Class. The A Class may incur an initial sales charge. The A Class and C Class may be subject to a contingent deferred sales charge. The share classes differ principally in their respective sales charges and distribution and shareholder servicing expenses and arrangements. The Institutional Class is made available to institutional shareholders or through financial intermediaries whose clients do not require the same level of shareholder and administrative services as shareholders of other classes. As a result, the Institutional Class is charged a lower unified management fee. Sale of the A Class and C Class commenced on March 1, 2010.
2. Significant Accounting Policies
The following is a summary of significant accounting policies consistently followed by the fund in preparation of its financial statements. The financial statements are prepared in conformity with accounting principles generally accepted in the United States of America, which may require management to make certain estimates and assumptions at the date of the financial statements. Actual results could differ from these estimates.
Investment Valuations — The fund determines the fair value of its investments and computes its net asset value per share as of the close of regular trading (usually 4 p.m. Eastern time) on the New York Stock Exchange (NYSE) on each day the NYSE is open.
Debt securities maturing in greater than 60 days at the time of purchase are valued at the evaluated mean as provided by independent pricing services or at the mean of the most recent bid and asked prices as provided by investment dealers. Debt securities maturing within 60 days at the time of purchase may be valued at cost, plus or minus any amortized discount or premium or at the evaluated mean as provided by an independent pricing service. Evaluated mean prices are commonly derived through utilization of market models, which may consider, among other factors, trade data, quotations from dealers and active market makers, relevant yield curve and spread data, related sector levels, creditworthiness, and other relevant market information on the same or comparable securities.
Exchange-traded futures contracts are valued at the settlement price as provided by the appropriate clearing corporation.
If the fund determines that the market price for a portfolio security is not readily available or the valuation methods mentioned above do not reflect a security’s fair value, such security is valued as determined in good faith by the Board of Trustees or its designee, in accordance with procedures adopted by the Board of Trustees. Circumstances that may cause the fund to use these procedures to value a security include, but are not limited to: a security has been declared in default; trading in a security has been halted during the trading day; there is a foreign market holiday and no trading occurred; or an event occurred between the close of a foreign exchange and the NYSE that may affect the value of a security.
Security Transactions — Security transactions are accounted for as of the trade date. Net realized gains and losses are determined on the identified cost basis, which is also used for federal income tax purposes.
Investment Income — Interest income is recorded on the accrual basis and includes accretion of discounts and amortization of premiums.
When-Issued — The fund may engage in securities transactions on a when-issued basis. Under these arrangements, the securities’ prices and yields are fixed on the date of the commitment, but payment and delivery are scheduled for a future date. During this period, securities are subject to market fluctuations. The fund will segregate cash, cash equivalents or other appropriate liquid securities on its records in amounts sufficient to meet the purchase price.
Income Tax Status — It is the fund’s policy to distribute substantially all net investment income and net realized gains to shareholders and to otherwise qualify as a regulated investment company under provisions of the Internal Revenue Code. The fund is no longer subject to examination by tax authorities for years prior to 2008. At this time, management believes there are no uncertain tax positions which, based on their technical merit, would not be sustained upon examination and for which it is reasonably possible that the total amounts of unrecognized tax benefits will significantly change in the next twelve months. Accordingly, no provision has been made for federal or state income taxes.
Multiple Class — All shares of the fund represent an equal pro rata interest in the net assets of the class to which such shares belong, and have identical voting, dividend, liquidation and other rights and the same terms and conditions, except for class specific expenses and exclusive rights to vote on matters affecting only individual classes. Income, non-class specific expenses, and realized and unrealized capital gains and losses of the fund are allocated to each class of shares based on their relative net assets.
Distributions to Shareholders — Distributions from net investment income are declared daily and paid monthly. Distributions from net realized gains, if any, are generally declared and paid annually.
Indemnifications — Under the trust’s organizational documents, its officers and trustees are indemnified against certain liabilities arising out of the performance of their duties to the fund. In addition, in the normal course of business, the fund enters into contracts that provide general indemnifications. The maximum exposure under these arrangements is unknown as this would involve future claims that may be made against a fund. The risk of material loss from such claims is considered by management to be remote.
3. Fees and Transactions with Related Parties
Management Fees — The trust has entered into a management agreement with American Century Investment Management, Inc. (ACIM) (the investment advisor), under which ACIM provides the fund with investment advisory and management services in exchange for a single, unified management fee (the fee) per class. The agreement provides that all expenses of managing and operating the fund, except distribution and service fees, brokerage expenses, taxes, interest, fees and expenses of the independent trustees (including legal counsel fees), and extraordinary expenses, will be paid by ACIM. The fee is computed and accrued daily based on each class’s daily net assets and paid monthly in arrears. The fee consists of (1) an Investment Category Fee based on the daily net assets of the fund and certain other accounts managed by the investment advisor that are in the same broad investment category as the fund and (2) a Complex Fee based on the assets of all the funds in the American Century Investments family of funds. The rates for the Investment Category Fee range from 0.1625% to 0.2800%. The rates for the Complex Fee range from 0.2500% to 0.3100% for the Investor Class, A Class and C Class. The Institutional Class is 0.2000% less at each point within the Complex Fee range. Effective August 1, 2010, the investment advisor voluntarily agreed to waive 0.013% of its management fee. The fee waiver continues through July 31, 2011. The total amount of the waiver for each class for the year ended May 31, 2011 was $191,108, $26,358, $2,397 and $761 for the Investor Class, Institutional Class, A Class and C Class, respectively. The effective annual management fee before waiver for each class for the year ended May 31, 2011 was 0.47% for the Investor Class, A Class and C Class and 0.27% for the Institutional Class. The effective annual management fee after waiver for each class for the year ended May 31, 2011 was 0.46% for the Investor Class, A Class and C Class and 0.26% for the Institutional Class.
Distribution and Service Fees — The Board of Trustees has adopted a separate Master Distribution and Individual Shareholder Services Plan for each of the A Class and C Class (collectively the plans), pursuant to Rule 12b-1 of the 1940 Act. The plans provide that the A Class will pay American Century Investment Services, Inc. (ACIS) an annual distribution and service fee of 0.25%. The plans provide that the C Class will pay ACIS an annual distribution and service fee of 1.00%, of which 0.25% is paid for individual shareholder services and 0.75% is paid for distribution services. The fees are computed and accrued daily based on each class’s daily net assets and paid monthly in arrears. The fees are used to pay financial intermediaries for distribution and individual shareholder services. Fees incurred under the plans during the year ended May 31, 2011 are detailed in the Statement of Operations.
Related Parties — Certain officers and trustees of the trust are also officers and/or directors of American Century Companies, Inc. (ACC), the parent of the trust’s investment advisor, ACIM, the distributor of the trust, ACIS, and the trust’s transfer agent, American Century Services, LLC.
The fund has a mutual funds services agreement with J.P. Morgan Investor Services Co. (JPMIS). JPMorgan Chase Bank (JPMCB) is a custodian of the fund. JPMIS and JPMCB are wholly owned subsidiaries of JPMorgan Chase & Co. (JPM). JPM is an equity investor in ACC.
4. Investment Transactions
Purchases and sales of investment securities, excluding short-term investments, for the year ended May 31, 2011 were $421,413,815 and $261,994,208, respectively.
5. Capital Share Transactions
Transactions in shares of the fund were as follows (unlimited number of shares authorized):
| | | | | | | |
| | | Year ended May 31, 2011 | | | Year ended May 31, 2010(1) | |
| | | Shares | | | Amount | | | Shares | | | Amount | |
| Investor Class | | | | | | | | | | | | |
| Sold | | | 51,217,652 | | | | $564,910,660 | | | | 73,822,029 | | | | $806,596,776 | |
| Issued in reinvestment of distributions | | | 4,946,484 | | | | 54,522,234 | | | | 4,214,681 | | | | 46,089,491 | |
| Redeemed | | | (54,540,332 | ) | | | (595,989,499 | ) | | | (36,255,147 | ) | | | (396,539,550 | ) |
| | | | 1,623,804 | | | | 23,443,395 | | | | 41,781,563 | | | | 456,146,717 | |
| Institutional Class | | | | | | | | | | | | | | | | |
| Sold | | | 10,886,822 | | | | 119,733,765 | | | | 12,249,630 | | | | 134,096,397 | |
| Issued in reinvestment of distributions | | | 643,930 | | | | 7,096,407 | | | | 509,099 | | | | 5,570,113 | |
| Redeemed | | | (9,233,817 | ) | | | (100,626,713 | ) | | | (3,283,012 | ) | | | (35,975,904 | ) |
| | | | 2,296,935 | | | | 26,203,459 | | | | 9,475,717 | | | | 103,690,606 | |
| A Class | | | | | | | | | | | | | | | | |
| Sold | | | 3,591,329 | | | | 39,823,177 | | | | 354,426 | | | | 3,895,639 | |
| Issued in reinvestment of distributions | | | 42,137 | | | | 462,638 | | | | 1,829 | | | | 20,231 | |
| Redeemed | | | (1,192,709 | ) | | | (12,976,665 | ) | | | (3 | ) | | | (37 | ) |
| | | | 2,440,757 | | | | 27,309,150 | | | | 356,252 | | | | 3,915,833 | |
| C Class | | | | | | | | | | | | | | | | |
| Sold | | | 806,430 | | | | 8,923,771 | | | | 150,727 | | | | 1,660,703 | |
| Issued in reinvestment of distributions | | | 11,574 | | | | 126,966 | | | | 255 | | | | 2,825 | |
| Redeemed | | | (153,871 | ) | | | (1,668,145 | ) | | | (28 | ) | | | (311 | ) |
| | | | 664,133 | | | | 7,382,592 | | | | 150,954 | | | | 1,663,217 | |
| Net increase (decrease) | | | 7,025,629 | | | | $84,338,596 | | | | 51,764,486 | | | | $565,416,373 | |
| (1) | March 1, 2010 (commencement of sale) through May 31, 2010 for the A Class and C Class. |
6. Fair Value Measurements
The fund’s securities valuation process is based on several considerations and may use multiple inputs to determine the fair value of the positions held by the fund. In conformity with accounting principles generally accepted in the United States of America, the inputs used to determine a valuation are classified into three broad levels as follows:
| • | Level 1 valuation inputs consist of unadjusted quoted prices in an active market for identical securities; |
| • | Level 2 valuation inputs consist of direct or indirect observable market data (including quoted prices for similar securities, evaluations of subsequent market events, interest rates, prepayment speeds, credit risk, etc.); or |
| • | Level 3 valuation inputs consist of unobservable data (including a fund’s own assumptions). |
The level classification is based on the lowest level input that is significant to the fair valuation measurement. The valuation inputs are not necessarily an indication of the risks associated with investing in these securities or other financial instruments.
As of period end, the fund’s investment securities and unrealized gain (loss) on futures contracts were classified as Level 2 and Level 1, respectively. The Schedule of Investments provides additional information on the fund’s portfolio holdings.
7. Derivative Instruments
Interest Rate Risk — The fund is subject to interest rate risk in the normal course of pursuing its investment objectives. The value of bonds generally declines as interest rates rise. A fund may enter into futures contracts based on a bond index or a specific underlying security. A fund may purchase futures contracts to gain exposure to increases in market value or sell futures contracts to protect against a decline in market value. Upon entering into a futures contract, a fund will segregate cash, cash equivalents or other appropriate liquid securities on its records in amounts sufficient to meet requirements. Subsequent payments (variation margin) are made or received daily, in cash, by a fund. The variation margin is equal to the daily change in the contract value and is recorded as unrealized gains and losses. A fund recognizes a realized gain or loss when the futures contract is closed or expires. Net realized and unrealized gains or losses occurring during the holding period of futures contracts are a component of net realized gain (loss) on futures contract transactions and change in net unrealized appreciation (depreciation) on futures contracts, respectively. One of the risks of entering into futures contracts is the possibility that the change in value of the contract may not correlate with the changes in value of the underlying securities. The interest rate risk derivative instruments held at period end as disclosed on the Schedule of Investments are indicative of the fund’s typical volume during the period.
The value of interest rate risk derivative instruments as of May 31, 2011, is disclosed on the Statement of Assets and Liabilities as an asset of $179,250 in receivable for variation margin on futures contracts and as a liability of $171,562 in payable for variation margin on futures contracts. For the year ended May 31, 2011, the effect of interest rate risk derivative instruments on the Statement of Operations was $(7,130,336) in net realized gain (loss) on futures contract transactions and $761,599 in change in net unrealized appreciation (depreciation) on futures contracts.
8. Federal Tax Information
The tax character of distributions paid during the years ended May 31, 2011 and
May 31, 2010 were as follows:
| | | | | |
| | | 2011 | | 2010 |
| Distributions Paid From | | | | | | |
| Exempt income | | | $71,845,300 | | | | $58,869,741 | |
| Taxable ordinary income | | | $31,189 | | | | — | |
The book-basis character of distributions made during the year from net investment income or net realized gains may differ from their ultimate characterization for federal income tax purposes. These differences reflect the differing character of certain income items and net realized gains and losses for financial statement and tax purposes, and may result in reclassification among certain capital accounts on the financial statements.
As of May 31, 2011, the federal tax cost of investments and the components of distributable earnings on a tax-basis were as follows:
| | | | | |
| Federal tax cost of investments | | | $1,924,096,143 | |
| Gross tax appreciation of investments | | | $92,111,904 | |
| Gross tax depreciation of investments | | | (9,546,918 | ) |
| Net tax appreciation (depreciation) of investments | | | $82,564,986 | |
| Other book-to-tax adjustments | | | $(2,352,660 | ) |
| Net tax appreciation (depreciation) | | | $80,212,326 | |
| Accumulated capital losses | | | $(15,803,355 | ) |
| Capital loss deferral | | | $(5,849,981 | ) |
The cost of investments for federal income tax purposes was the same as the cost for financial reporting purposes. The difference between book-basis and tax-basis unrealized appreciation (depreciation) is attributable primarily to the realization for tax purposes of unrealized gains (losses) on futures contracts. Other book-to-tax adjustments are attributable primarily to the tax deferral of losses on straddle positions.
The accumulated capital losses represent net capital loss carryovers that may be used to offset future realized capital gains for federal income tax purposes. Future capital loss carryover utilization in any given year may be subject to Internal Revenue Code limitations. Capital loss carryovers expire as follows:
| | | | | |
| 2015 | 2016 | 2017 | 2018 | 2019 |
| $(1,643,796) | — | $(3,280,979) | $(9,195,317) | $(1,683,263) |
The capital loss deferral represents net capital losses incurred in the seven-month period ended May 31, 2011. The fund has elected to treat such losses as having been incurred in the following fiscal year for federal income tax purposes.
On December 22, 2010, the Regulated Investment Company Modernization Act of 2010 (the “Act”) was enacted, which changed various technical rules governing the tax treatment of regulated investment companies. The changes are generally effective for taxable years beginning after the date of enactment. Under the Act, the fund will be permitted to carry forward capital losses incurred in taxable years beginning after the date of enactment for an unlimited period. However, any losses incurred during those future taxable years will be required to be utilized prior to the losses incurred in pre-enactment taxable years, which carry an expiration date. As a result of this ordering rule, pre-enactment capital loss carryforwards may be more likely to expire unused.
| Investor Class | |
| For a Share Outstanding Throughout the Years Ended May 31 | |
| | | 2011 | | | 2010 | | | 2009 | | | 2008 | | | 2007 | |
| Per-Share Data | |
| Net Asset Value, Beginning of Period | | | $11.09 | | | | $10.70 | | | | $10.74 | | | | $10.68 | | | | $10.67 | |
| Income From Investment Operations | | | | | | | | | | | | | | | | | | | | |
| Net Investment Income (Loss) | | | 0.39 | (1) | | | 0.40 | (1) | | | 0.41 | | | | 0.43 | | | | 0.42 | |
| Net Realized and Unrealized Gain (Loss) | | | (0.03 | ) | | | 0.39 | | | | (0.04 | ) | | | 0.06 | | | | 0.01 | |
| Total From Investment Operations | | | 0.36 | | | | 0.79 | | | | 0.37 | | | | 0.49 | | | | 0.43 | |
| Distributions | | | | | | | | | | | | | | | | | | | | |
| From Net Investment Income | | | (0.39 | ) | | | (0.40 | ) | | | (0.41 | ) | | | (0.43 | ) | | | (0.42 | ) |
| Net Asset Value, End of Period | | | $11.06 | | | | $11.09 | | | | $10.70 | | | | $10.74 | | | | $10.68 | |
| | | | | | | | | | | | | | | | | | | | | |
Total Return(2) | | | 3.31 | % | | | 7.48 | % | | | 3.58 | % | | | 4.66 | % | | | 4.08 | % |
| | | | | | | | | | | | | | | | | | | | | |
| Ratios/Supplemental Data | |
Ratio of Operating Expenses to Average Net Assets | | | 0.47 | %(3) | | | 0.48 | % | | | 0.49 | % | | | 0.49 | % | | | 0.49 | % |
Ratio of Net Investment Income (Loss) to Average Net Assets | | | 3.53 | %(3) | | | 3.61 | % | | | 3.89 | % | | | 4.00 | % | | | 3.91 | % |
| Portfolio Turnover Rate | | | 14 | % | | | 14 | % | | | 37 | % | | | 62 | % | | | 43 | % |
| Net Assets, End of Period (in thousands) | | | $1,717,930 | | | | $1,705,065 | | | | $1,198,419 | | | | $1,002,648 | | | | $709,988 | |
| (1) | Computed using average shares outstanding throughout the period. |
| (2) | Total returns are calculated based on the net asset value of the last business day. Total returns for periods less than one year are not annualized. |
| (3) | The ratio of operating expenses to average net assets and ratio of net investment income (loss) to average net assets would have been 0.48% and 3.52%, respectively, if a portion of the management fee had not been waived. |
See Notes to Financial Statements.
| Institutional Class | |
| For a Share Outstanding Throughout the Years Ended May 31 | |
| | | 2011 | | | 2010 | | | 2009 | | | 2008 | | | 2007 | |
| Per-Share Data | |
| Net Asset Value, Beginning of Period | | | $11.09 | | | | $10.70 | | | | $10.74 | | | | $10.68 | | | | $10.67 | |
| Income From Investment Operations | | | | | | | | | | | | | | | | | | | | |
| Net Investment Income (Loss) | | | 0.41 | (1) | | | 0.42 | (1) | | | 0.43 | | | | 0.45 | | | | 0.44 | |
| Net Realized and Unrealized Gain (Loss) | | | (0.03 | ) | | | 0.39 | | | | (0.04 | ) | | | 0.06 | | | | 0.01 | |
| Total From Investment Operations | | | 0.38 | | | | 0.81 | | | | 0.39 | | | | 0.51 | | | | 0.45 | |
| Distributions | | | | | | | | | | | | | | | | | | | | |
| From Net Investment Income | | | (0.41 | ) | | | (0.42 | ) | | | (0.43 | ) | | | (0.45 | ) | | | (0.44 | ) |
| Net Asset Value, End of Period | | | $11.06 | | | | $11.09 | | | | $10.70 | | | | $10.74 | | | | $10.68 | |
| | | | | | | | | | | | | | | | | | | | | |
Total Return(2) | | | 3.51 | % | | | 7.69 | % | | | 3.78 | % | | | 4.88 | % | | | 4.28 | % |
| | | | | | | | | | | | | | | | | | | | | |
| Ratios/Supplemental Data | |
Ratio of Operating Expenses to Average Net Assets | | | 0.27 | %(3) | | | 0.28 | % | | | 0.29 | % | | | 0.29 | % | | | 0.29 | % |
Ratio of Net Investment Income (Loss) to Average Net Assets | | | 3.73 | %(3) | | | 3.81 | % | | | 4.09 | % | | | 4.20 | % | | | 4.11 | % |
| Portfolio Turnover Rate | | | 14 | % | | | 14 | % | | | 37 | % | | | 62 | % | | | 43 | % |
| Net Assets, End of Period (in thousands) | | | $245,759 | | | | $221,014 | | | | $111,882 | | | | $67,895 | | | | $10,567 | |
| (1) | Computed using average shares outstanding throughout the period. |
| (2) | Total returns are calculated based on the net asset value of the last business day. Total returns for periods less than one year are not annualized. |
| (3) | The ratio of operating expenses to average net assets and ratio of net investment income (loss) to average net assets would have been 0.28% and 3.72%, respectively, if a portion of the management fee had not been waived. |
See Notes to Financial Statements.
| A Class | |
| For a Share Outstanding Throughout the Years Ended May 31 (except as noted) | |
| | | 2011 | | | 2010(1) | |
| Per-Share Data | |
| Net Asset Value, Beginning of Period | | | $11.09 | | | | $11.03 | |
| Income From Investment Operations | | | | | | | | |
Net Investment Income (Loss)(2) | | | 0.36 | | | | 0.09 | |
| Net Realized and Unrealized Gain (Loss) | | | (0.03 | ) | | | 0.06 | |
| Total From Investment Operations | | | 0.33 | | | | 0.15 | |
| Distributions | | | | | | | | |
| From Net Investment Income | | | (0.36 | ) | | | (0.09 | ) |
| Net Asset Value, End of Period | | | $11.06 | | | | $11.09 | |
| | | | | | | | | |
Total Return(3) | | | 3.05 | % | | | 1.35 | % |
| | | | | | | | | |
| Ratios/Supplemental Data | |
| Ratio of Operating Expenses to Average Net Assets | | | 0.72 | %(4) | | | 0.73 | %(5) |
| Ratio of Net Investment Income (Loss) to Average Net Assets | | | 3.28 | %(4) | | | 3.19 | %(5) |
| Portfolio Turnover Rate | | | 14 | % | | | 14 | %(6) |
| Net Assets, End of Period (in thousands) | | | $30,930 | | | | $3,951 | |
| (1) | March 1, 2010 (commencement of sale) through May 31, 2010. |
| (2) | Computed using average shares outstanding throughout the period. |
| (3) | Total returns are calculated based on the net asset value of the last business day and do not reflect applicable sales charges. Total returns for periods less than one year are not annualized. |
| (4) | The ratio of operating expenses to average net assets and ratio of net investment income (loss) to average net assets would have been 0.73% and 3.27%, respectively, if a portion of the management fee had not been waived. |
| (6) | Portfolio turnover is calculated at the fund level. Percentage indicated was calculated for the year ended May 31, 2010. |
See Notes to Financial Statements.
| C Class | |
| For a Share Outstanding Throughout the Years Ended May 31 (except as noted) | |
| | | 2011 | | | 2010(1) | |
| Per-Share Data | |
| Net Asset Value, Beginning of Period | | | $11.08 | | | | $11.03 | |
| Income From Investment Operations | | | | | | | | |
Net Investment Income (Loss)(2) | | | 0.28 | | | | 0.06 | |
| Net Realized and Unrealized Gain (Loss) | | | (0.03 | ) | | | 0.06 | |
| Total From Investment Operations | | | 0.25 | | | | 0.12 | |
| Distributions | | | | | | | | |
| From Net Investment Income | | | (0.28 | ) | | | (0.07 | ) |
| Net Asset Value, End of Period | | | $11.05 | | | | $11.08 | |
| | | | | | | | | |
Total Return(3) | | | 2.28 | % | | | 1.07 | % |
| | | | | | | | | |
| Ratios/Supplemental Data | |
| Ratio of Operating Expenses to Average Net Assets | | | 1.47 | %(4) | | | 1.48 | %(5) |
| Ratio of Net Investment Income (Loss) to Average Net Assets | | | 2.53 | %(4) | | | 2.33 | %(5) |
| Portfolio Turnover Rate | | | 14 | % | | | 14 | %(6) |
| Net Assets, End of Period (in thousands) | | | $9,005 | | | | $1,673 | |
| (1) | March 1, 2010 (commencement of sale) through May 31, 2010. |
| (2) | Computed using average shares outstanding throughout the period. |
| (3) | Total returns are calculated based on the net asset value of the last business day and do not reflect applicable sales charges. Total returns for periods less than one year are not annualized. |
| (4) | The ratio of operating expenses to average net assets and ratio of net investment income (loss) to average net assets would have been 1.48% and 2.52%, respectively, if a portion of the management fee had not been waived. |
| (6) | Portfolio turnover is calculated at the fund level. Percentage indicated was calculated for the year ended May 31, 2010. |
See Notes to Financial Statements.
Report of Independent Registered Public Accounting Firm |
To the Trustees of the American Century Municipal Trust
and Shareholders of the Intermediate-Term Tax-Free Bond Fund:
In our opinion, the accompanying statement of assets and liabilities, including the schedule of investments, and the related statements of operations and of changes in net assets and the financial highlights present fairly, in all material respects, the financial position of the Intermediate-Term Tax-Free Bond Fund (one of the five funds comprising the American Century Municipal Trust, hereafter referred to as the “Fund”) at May 31, 2011, the results of its operations for the year then ended, the changes in its net assets for each of the two years in the period then ended and the financial highlights for the periods presented, in conformity with accounting principles generally accepted in the United States of America. These financial statements and financial highlights (hereafter referred to as “financial statements”) are the responsibility of the Fund’s management; our responsibility is to express an opinion on these financial statements based on our audits. We conducted our audits of these financial statements in accordance with the standards of the Public Company Accounting Oversight Board (United States). Those standards require that we plan and perform the audit to obtain reasonable assurance about whether the financial statements are free of material misstatement. An audit includes examining, on a test basis, evidence supporting the amounts and disclosures in the financial statements, assessing the accounting principles used and significant estimates made by management, and evaluating the overall financial statement presentation. We believe that our audits, which included confirmation of securities at May 31, 2011 by correspondence with the custodian and brokers, provide a reasonable basis for our opinion.
PricewaterhouseCoopers LLP
Kansas City, Missouri
July 22, 2011
A special meeting of shareholders was held on June 16, 2010, to vote on the following proposals. Each proposal received the required number of votes and was adopted. A summary of voting results is listed below each proposal.
Proposal 1:
To elect one Trustee to the Board of Trustees of American Century Municipal Trust (the proposal was voted on by all shareholders of funds issued by
American Century Municipal Trust):
| | | |
| Frederick L.A. Grauer | For: | 1,732,355,276 |
| | Withhold: | 67,363,643 |
| | Abstain: | 0 |
| | Broker Non-Vote: | 0 |
The other trustees whose term of office continued after the meeting include Jonathan S. Thomas, John Freidenrich, Ronald J. Gilson, Peter F. Pervere, Myron S. Scholes, and John B. Shoven.
Proposal 2:
To approve a management agreement between the fund and American Century Investment Management, Inc.:
| | | |
| Investor Class | For: | 849,873,197 |
| | Against: | 20,829,626 |
| | Abstain: | 34,787,405 |
| | Broker Non-Vote: | 239,751,525 |
| | | |
| Institutional Class | For: | 107,159,557 |
| | Against: | 926,352 |
| | Abstain: | 1,732,655 |
| | Broker Non-Vote: | 70,719,163 |
Board of Trustees
The individuals listed below serve as trustees of the funds. Each trustee will continue to serve in this capacity until death, retirement, resignation or removal from office. The mandatory retirement age for trustees who are not “interested persons,” as that term is defined in the Investment Company Act (independent trustees), is 73. However, the mandatory retirement age may be extended for a period not to exceed two years with the approval of the remaining independent trustees.
Mr. Thomas is the only trustee who is an “interested person” because he currently serves as President and Chief Executive Officer of American Century Companies, Inc. (ACC), the parent company of American Century Investment Management, Inc. (ACIM or the advisor).
The other trustees (more than three-fourths of the total number) are independent; that is, they have never been employees, directors or officers of, and have no financial interest in, ACC or any of its wholly owned, direct or indirect, subsidiaries, including ACIM, American Century Investment Services, Inc. (ACIS) and American Century Services, LLC (ACS). The trustees serve in this capacity for eight (in the case of Mr. Thomas, 15) registered investment companies in the American Century Investments family of funds.
The following presents additional information about the trustees. The mailing address for each trustee other than Mr. Thomas is 1665 Charleston Road, Mountain View, California 94043. The mailing address for Mr. Thomas is 4500 Main Street, Kansas City, Missouri 64111.
| | | | | | |
Name (Year of Birth) | Position(s) Held with Funds | Length of Time Served | Principal Occupation(s) During Past 5 Years | Number of American Century Portfolios Overseen by Trustee | Other Directorships Held During Past 5 Years |
| Independent Trustees |
Tanya S. Beder (1955) | Trustee | Since 2011 | Chairman, SBCC Group Inc. (investment advisory services)(2006 to present); Fellow in Practice, International Center for Finance, Yale University School of Management (1985 to present); Chief Executive Officer, Tribeca Global Management LLC (asset management firm) (2004 to 2006) | 40 | None |
Jeremy I. Bulow (1954) | Trustee | Since 2011 | Professor of Economics, Stanford University, Graduate School of Business (1979 to present) | 40 | None |
John Freidenrich (1937) | Trustee | Since 2005 | Founder, Member and Manager, Regis Management Company, LLC (investment management firm) (April 2004 to present) | 40 | None |
| | | | | | |
Name (Year of Birth) | Position(s) Held with Funds | Length of Time Served | Principal Occupation(s) During Past 5 Years | Number of American Century Portfolios Overseen by Trustee | Other Directorships Held During Past 5 Years |
| Independent Trustees |
Ronald J. Gilson (1946) | Trustee and Chairman of the Board | Since 1995 | Charles J. Meyers Professor of Law and Business, Stanford Law School (1979 to present); Marc and Eva Stern Professor of Law and Business, Columbia University School of Law (1992 to present) | 40 | None |
Frederick L. A. Grauer (1946) | Trustee | Since 2008 | Senior Advisor, BlackRock, Inc. (investment management firm) (2010 to 2011); Senior Advisor, Barclays Global Investors (investment management firm) (2003 to 2009) | 40 | None |
Peter F. Pervere (1947) | Trustee | Since 2007 | Retired | 40 | Intraware, Inc. (2003 to 2009) |
Myron S. Scholes (1941) | Trustee | Since 1980 | Chairman, Platinum Grove Asset Management, L.P. (asset manager) (1999 to 2009); Frank E. Buck Professor of Finance-Emeritus, Stanford Graduate School of Business (1996 to present) | 40 | Dimensional Fund Advisors (investment advisor); CME Group, Inc. (futures and options exchange) |
John B. Shoven (1947) | Trustee | Since 2002 | Professor of Economics, Stanford University (1973 to present) | 40 | Cadence Design Systems; Exponent; Financial Engines; Watson Wyatt Worldwide (2002 to 2006) |
| |
| Interested Trustee |
Jonathan S. Thomas (1963) | Trustee and President | Since 2007 | President and Chief Executive Officer, ACC (March 2007 to present); Chief Administrative Officer, ACC (February 2006 to February 2007); Executive Vice President, ACC (November 2005 to February 2007). Also serves as: Chief Executive Officer and Manager, ACS; Executive Vice President, ACIM; Director, ACC, ACIM and other ACC subsidiaries | 104 | None |
Officers
The following table presents certain information about the executive officers of the funds. Each officer serves as an officer for each of the 15 investment companies in the American Century family of funds, unless otherwise noted. No officer is compensated for his or her service as an officer of the funds. The listed officers are interested persons of the funds and are appointed or re-appointed on an annual basis. The mailing address for each of the officers listed below is 4500 Main Street, Kansas City, Missouri 64111.
| | | |
Name (Year of Birth) | Offices with the Funds | Principal Occupation(s) During the Past Five Years |
| Officers |
Jonathan S. Thomas (1963) | Trustee and President since 2007 | President and Chief Executive Officer, ACC (March 2007 to present); Chief Administrative Officer, ACC (February 2006 to February 2007); Executive Vice President, ACC (November 2005 to February 2007). Also serves as: Chief Executive Officer and Manager, ACS; Executive Vice President, ACIM; Director, ACC, ACIM and other ACC subsidiaries |
Barry Fink (1955) | Executive Vice President since 2007 | Chief Operating Officer and Executive Vice President, ACC (September 2007 to present); President, ACS (October 2007 to present); Managing Director, Morgan Stanley (2000 to 2007); Global General Counsel, Morgan Stanley (2000 to 2006). Also serves as: Manager, ACS and Director, ACC and certain ACC subsidiaries |
Maryanne L. Roepke (1956) | Chief Compliance Officer since 2006 and Senior Vice President since 2000 | Chief Compliance Officer, American Century funds, ACIM and ACS (August 2006 to present); Assistant Treasurer, ACC (January 1995 to August 2006); and Treasurer and Chief Financial Officer, various American Century funds (July 2000 to August 2006). Also serves as: Senior Vice President, ACS |
Charles A. Etherington (1957) | General Counsel since 2007 and Senior Vice President since 2006 | Attorney, ACC (February 1994 to present); Vice President, ACC (November 2005 to present), General Counsel, ACC (March 2007 to present); Also serves as General Counsel, ACIM, ACS, ACIS and other ACC subsidiaries; and Senior Vice President, ACIM and ACS |
Robert J. Leach (1966) | Vice President, Treasurer and Chief Financial Officer since 2006 | Vice President, ACS (February 2000 to present); and Controller, various American Century funds (1997 to September 2006) |
David H. Reinmiller (1963) | Vice President since 2001 | Attorney, ACC (January 1994 to present); Associate General Counsel, ACC (January 2001 to present); Also serves as Vice President, ACIM and ACS |
Ward D. Stauffer (1960) | Secretary since 2005 | Attorney, ACC (June 2003 to Present) |
The Statement of Additional Information has additional information about the fund’s trustees and is available without charge, upon request, by calling 1-800-345-2021.
Proxy Voting Guidelines
American Century Investment Management, Inc., the fund’s investment advisor, is responsible for exercising the voting rights associated with the securities purchased and/or held by the fund. A description of the policies and procedures the advisor uses in fulfilling this responsibility is available without charge, upon request, by calling 1-800-345-2021. It is also available on American Century Investments’ website at americancentury.com and on the Securities and Exchange Commission’s website at sec.gov. Information regarding how the investment advisor voted proxies relating to portfolio securities during the most recent 12-month period ended June 30 is available on the “About Us” page at americancentury.com. It is also available at sec.gov.
Quarterly Portfolio Disclosure
The fund files its complete schedule of portfolio holdings with the Securities and Exchange Commission (SEC) for the first and third quarters of each fiscal year on Form N-Q. The fund’s Forms N-Q are available on the SEC’s website at sec.gov, and may be reviewed and copied at the SEC’s Public Reference Room in Washington, DC. Information on the operation of the Public Reference Room may be obtained by calling 1-800-SEC-0330. The fund also makes its complete schedule of portfolio holdings for the most recent quarter of its fiscal year available on its website at americancentury.com and, upon request, by calling 1-800-345-2021.
Other Tax Information
The following information is provided pursuant to provisions of the Internal Revenue Code.
The fund designates $71,654,562 as exempt interest dividends for the fiscal year ended May 31, 2011.
| Contact Us | americancentury.com |
| Automated Information Line | 1-800-345-8765 |
| Investor Services Representative | 1-800-345-2021 or 816-531-5575 |
| Investors Using Advisors | 1-800-378-9878 |
| Business, Not-For-Profit, Employer-Sponsored Retirement Plans | 1-800-345-3533 |
| Banks and Trust Companies, Broker-Dealers, Financial Professionals, Insurance Companies | 1-800-345-6488 |
| Telecommunications Device for the Deaf | 1-800-634-4113 |
American Century Municipal Trust
Investment Advisor:
American Century Investment Management, Inc.
Kansas City, Missouri
This report and the statements it contains are submitted for the general information of our shareholders. The report is not authorized for distribution to prospective investors unless preceded or accompanied by an effective prospectus.
©2011 American Century Proprietary Holdings, Inc. All rights reserved.
CL-ANN-72034 1107
ANNUAL REPORT MAY 31, 2011


| President’s Letter | 2 |
| Market Perspective | 3 |
| Performance | 4 |
| Portfolio Commentary | 6 |
| Fund Characteristics | 8 |
| Shareholder Fee Example | 9 |
| Schedule of Investments | 11 |
| Statement of Assets and Liabilities | 18 |
| Statement of Operations | 19 |
| Statement of Changes in Net Assets | 20 |
| Notes to Financial Statements | 21 |
| Financial Highlights | 26 |
| Report of Independent Registered Public Accounting Firm | 31 |
| Proxy Voting Results | 32 |
| Management | 33 |
| Additional Information | 36 |
Any opinions expressed in this report reflect those of the author as of the date of the report, and do not necessarily represent the opinions of American Century Investments® or any other person in the American Century Investments organization. Any such opinions are subject to change at any time based upon market or other conditions and American Century Investments disclaims any responsibility to update such opinions. These opinions may not be relied upon as investment advice and, because investment decisions made by American Century Investments funds are based on numerous factors, may not be relied upon as an indication of trading intent on behalf of any American Century Investments fund. Security examples are used for representational purposes only and are not intended as recommendations to purchase or sell securities. Performance information for comparative indices and securities is provided to American Century Investments by third party vendors. To the best of American Century Investments’ knowledge, such information is accurate at the time of printing.
Dear Investor:
Thank you for reviewing this annual report for the period ended May 31, 2011. Our report offers investment performance and portfolio information, presented with the expert perspective and commentary of our portfolio management team.
This report remains one of our most important vehicles for conveying the information you need about your investment performance, and about the market factors and strategies that affect fund returns. For additional, updated information on fund performance, portfolio strategy, and the investment markets, we encourage you to visit our website, americancentury.com. Click on the “Fund Performance” and “Insights & News” headings at the top of our Individual Investors site.
Municipal Bond (Muni) Market Update
As described in greater detail on the following pages, muni market conditions have improved significantly since our semiannual report for the six months ended November 30, 2010. That reporting period concluded during a two-and-a-half month span (from the end of October 2010 to the middle of January 2011) when muni prices plunged and yields soared as a supply and demand imbalance (explained on page 3) roiled the market. That turbulence was compounded by overblown default fears fueled by highly publicized pessimistic analyst reports that helped trigger a wave of withdrawals from muni mutual funds.
As 2011 unfolded, muni issuance declined dramatically and demand surged—falling prices and relatively high yields attracted an influx of opportunistic “cross-over” (non-typical) buyers to the muni market. Munis rallied from mid-January through the end of the full 12-month reporting period, rewarding those who stayed the course and saw the turbulence as a buying opportunity. Muni defaults have not approached the rates projected by pessimistic pundits at the end of last year, and additional economic growth—as well as increased municipal government austerity and budget-balancing measures—have helped stabilize municipal credit conditions since then.
These developments over the more-recent six months are incorporated in the broader, enclosed 12-month Market Perspective and Portfolio Commentary from our muni portfolio management team. These dedicated experts will continue to diligently apply their knowledge and skills as they make daily investment decisions for you.
Sincerely,
Jonathan Thomas
President and Chief Executive Officer
American Century Investments
By David MacEwen, Chief Investment Officer, Fixed Income
Municipal bond (muni) indices advanced for the 12 months ended May 31, 2011 (see the table below), but these moderately positive returns masked considerable volatility, particularly during the last seven months of the period.
Munis rallied modestly through the first five months of the period as U.S. economic conditions generally improved, providing a lift to munis and other credit-sensitive instruments. But market conditions changed dramatically from November 2010 through January 2011 as a supply and demand imbalance triggered a sharp decline in the muni market. Supply rose substantially as muni issuers rushed to take advantage of the Build America Bonds (BABs) program (in which states and municipalities issue taxable securities with federally subsidized interest rates) before its expiration at the end of 2010. Meanwhile, demand cratered as credit concerns—sparked by persistent state budget deficits and exaggerated media predictions of widespread muni defaults—led to heavy outflows from muni mutual funds.
The muni market bottomed in mid-January and then rebounded during the remainder of the period as a number of opportunistic, non-traditional “cross-over” investors gravitated to relatively attractive muni yields. Limited new issuance also contributed favorably to muni market performance—new muni issuance in the first five months of 2011 fell by 51% compared with the same period in 2010, constrained by issuer austerity measures and the expiration of the BABs program, which accelerated into 2010 many new issues that would otherwise have come to market in early 2011.
However, the severe decline from November through January dropped munis to the lower end of the investment return spectrum in a 12-month period dominated by stocks and high-yield corporate bonds. In addition, munis generally trailed the returns of Treasury securities and the broad taxable bond market. Intermediate-term munis fared best as short-term munis were held in check by a stable interest rate policy from the Federal Reserve, while longer-term munis suffered disproportionately from muni fund outflows. From a credit and sector perspective, higher-quality munis outperformed lower-rated credits, while general obligation bonds outpaced tax revenue bonds. Within the revenue bond segment, essential services bonds posted the best results, while health care lagged.
| U.S. Fixed-Income Total Returns |
| For the 12 months ended May 31, 2011 |
| Barclays Capital Municipal Market Indices | | Barclays Capital U.S. Taxable Market Indices |
| 7 Year Municipal Bond | 5.22% | | Aggregate Bond | 5.84% |
| Municipal High Yield Bond | 4.04% | | Treasury Bond | 4.49% |
| Municipal Bond | 3.18% | | | |
| Long-Term Municipal Bond | 1.49% | | | |
| Total Returns as of May 31, 2011 |
| | | | Average Annual Returns | |
| | Ticker Symbol | 1 year | 5 years | 10 years | Since Inception | Inception Date |
A Class No sales charge* With sales charge* | MMBAX | 2.52% -2.10% | 4.16% 3.22% | 4.52%(1) 4.04%(1) | 5.22%(1) 4.88%(1) | 3/31/97 |
Barclays Capital Municipal Bond Index | — | 3.18% | 4.78% | 5.02% | 5.47% | — |
| Investor Class | ACLVX | 2.77% | 4.42% | — | 4.37% | 4/3/06 |
| Institutional Class | ACLSX | 2.97% | 4.63% | — | 4.57% | 4/3/06 |
B Class No sales charge* With sales charge* | MMDBX | 1.76% -2.24% | 3.39% 3.21% | 3.79%(1) 3.79%(1) | 4.49%(1) 4.49%(1) | 3/31/97 |
| C Class | ACTCX | 1.76% | 3.39% | — | 3.34% | 4/3/06 |
| * | Sales charges include initial sales charges and contingent deferred sales charges (CDSCs), as applicable. A Class shares have a 4.50% maximum initial sales charge and may be subject to a maximum CDSC of 1.00%. B Class shares redeemed within six years of purchase are subject to a CDSC that declines from 5.00% during the first year after purchase to 0.00% the sixth year after purchase. C Class shares redeemed within 12 months of purchase are subject to a maximum CDSC of 1.00%. The SEC requires that mutual funds provide performance information net of maximum sales charges in all cases where charges could be applied. |
| (1) | Returns would have been lower if a portion of the fees had not been waived. |
Data presented reflect past performance. Past performance is no guarantee of future results. Current performance may be higher or lower than the performance shown. Investment return and principal value will fluctuate, and redemption value may be more or less than original cost. To obtain performance data current to the most recent month end, please call 1-800-345-2021 or visit americancentury.com. As interest rates rise, bond values will decline. Investment income may be subject to certain state and local taxes and, depending on your tax status, the federal alternative minimum tax (AMT). Capital gains are not exempt from state and federal income tax.
Unless otherwise indicated, performance reflects A Class shares; performance for other share classes will vary due to differences in fee structure. For information about other share classes available, please consult the prospectus. Data assumes reinvestment of dividends and capital gains, and none of the charts reflect the deduction of taxes that a shareholder would pay on fund distributions or the redemption of fund shares. Returns for the index are provided for comparison. The fund’s total returns include operating expenses (such as transaction costs and management fees) that reduce returns, while the total returns of the index do not.
| Growth of $10,000 Over 10 Years |
| $10,000 investment made May 31, 2001* |
| * | The A Class’s initial investment is $9,550 to reflect the maximum 4.50% initial sales charge. |
| ** | Ending value may have been lower if fees had not been waived. |
| Total Annual Fund Operating Expenses |
| Investor Class | Institutional Class | A Class | B Class | C Class |
| 0.48% | 0.28% | 0.73% | 1.48% | 1.48% |
The total annual fund operating expenses shown is as stated in the fund’s prospectus current as of the date of this report. The prospectus may vary from the expense ratio shown elsewhere in this report because it is based on a different time period, includes acquired fund fees and expenses, and, if applicable, does not include fee waivers or expense reimbursements.
Data presented reflect past performance. Past performance is no guarantee of future results. Current performance may be higher or lower than the performance shown. Investment return and principal value will fluctuate, and redemption value may be more or less than original cost. To obtain performance data current to the most recent month end, please call 1-800-345-2021 or visit americancentury.com. As interest rates rise, bond values will decline. Investment income may be subject to certain state and local taxes and, depending on your tax status, the federal alternative minimum tax (AMT). Capital gains are not exempt from state and federal income tax.
Unless otherwise indicated, performance reflects A Class shares; performance for other share classes will vary due to differences in fee structure. For information about other share classes available, please consult the prospectus. Data assumes reinvestment of dividends and capital gains, and none of the charts reflect the deduction of taxes that a shareholder would pay on fund distributions or the redemption of fund shares. Returns for the index are provided for comparison. The fund’s total returns include operating expenses (such as transaction costs and management fees) that reduce returns, while the total returns of the index do not.
Portfolio Managers: Alan Kruss, Joseph Gotelli, and Steven Permut
Performance Summary
Long-Term Tax-Free returned 2.52%* for the fiscal year ended May 31, 2011. By comparison, the Barclays Capital Municipal Bond Index returned 3.18%, while the average return of the general municipal debt funds tracked by Lipper Inc. was 2.00%.** (See page 4 and footnotes below for additional performance comparisons.)
The fund’s absolute return for the reporting period reflected the generally positive performance of municipal bond (muni) indices (see page 3). The fund’s performance trailed the return of the broad Municipal Bond Index, however, as long-term munis lagged the rest of the muni market, but the fund outpaced its Lipper peer group average.
Credit Environment
The improving economic environment over the past year led to gradual improvements in state and local tax receipts. In the first three months of 2011, state tax revenues were up more than 9% from the same period in 2010. Nonetheless, many state and local governments continue to wrestle with daunting budget deficits—holdovers from the Great Recession that have been exacerbated by lingering weakness in the labor and housing markets, as well as increasing pension and health care funding pressures. We saw credit rating downgrades across the spectrum of muni issuers, but despite dire warnings of widespread defaults, the few actual defaults were confined to smaller issuers, and the muni default rate remained at a fraction of the corporate bond default rate.
Governments at all levels are taking steps to close their budget gaps through a combination of austerity measures, reserve fund utilization, and tax increases, and we are seeing signs of progress. For example, the state of New York approved a balanced budget early for the first time since 1983, erasing a $10 billion shortfall. One added challenge for fiscal 2012 budgets is the loss of federal aid that states have received over the past several years. But we still believe that the worst of the difficulties are behind us.
Portfolio Positioning
The fund’s outperformance of its peer group average was driven in part by a greater emphasis on higher-quality securities, reflecting our policy of taking measured credit risk. This approach paid off during the reporting period as higher-rated securities outperformed, especially during the market volatility in late 2010 and early 2011.
| * | All fund returns referenced in this commentary are for A Class shares and are not reduced by sales charges. A Class shares are subject to a maximum sales charge of 4.50%. Had the sales charge been applied, returns would have been lower than those shown. |
| ** | The average returns for Lipper General Municipal Debt Funds category were 3.17% and 3.91% for the five- and ten-year periods ended May 31, 2011, respectively. Data provided by Lipper Inc. — A Reuters Company. © 2011 Reuters. All rights reserved. Any copying, republication or redistribution of Lipper content, including by caching, framing or similar means, is expressly prohibited without the prior written consent of Lipper. Lipper shall not be liable for any errors or delays in the content, or for any actions taken in reliance thereon. Lipper fund performance data is total return, and is preliminary and subject to revision. The data contained herein has been obtained from company reports, financial reporting services, periodicals and other resources believed to be reliable. Although carefully verified, data on compilations is not guaranteed by Lipper and may be incomplete. No offer or solicitations to buy or sell any of the securities herein is being made by Lipper. |
For much of the period, we limited the fund’s exposure to general obligation (GO) and local tax revenue bonds, given their budgetary challenges and the market’s response to them. However, non-traditional cross-over buyers that were drawn to the muni market in early 2011 flocked to large, liquid securities, including state GO bonds. As a result, our underweight position in GOs detracted from results. On the positive side, however, the fund benefited from individual security selection among GOs, with an emphasis on state GOs over local.
From a sector perspective, we focused on less economically sensitive sectors of the muni market. In particular, we emphasized essential services revenue bonds, which typically finance services such as water, sewer, and other utilities. Essential services bonds tend to be higher-quality securities, so they attracted demand from cross-over investors. Quality also factored into the underperformance of tobacco bonds, which are backed by a settlement agreement between 46 states and the major tobacco companies. Tobacco bonds tend to be lower-rated securities, which lagged during the period, so the fund’s limited exposure to these bonds contributed favorably to relative results.
We took most of our credit risk in the health care and higher education sectors, where we can use our fundamental credit research capabilities to find undervalued securities. However, the unusual supply and demand dynamics during the reporting period worked against these segments of the muni market, so our overweight positions detracted from performance.
Since late 2009, the fund has been positioned for a flatter Treasury yield curve (a narrower gap between short- and long-term Treasury yields). However, this positioning weighed on performance over the past year as the Treasury yield curve grew steeper, and it remains near historically wide levels. We are confident that this positioning will pay off over time as the Treasury curve eventually reverts to more normal levels.
Outlook
As we look to the second half of 2011, we believe that the supply and demand imbalances that have impacted the muni market over the last seven months will gradually abate, and fundamental credit stories will have a greater impact on muni performance going forward. We also believe that muni defaults will remain well below the levels predicted by some analysts at the end of last year.
As a result, we intend to maintain our current positioning, with an overweight position in high-quality essential services bonds, and selective investments in lower-rated health care and higher-education bonds. Among GOs, we remain underweight overall, but we favor state GOs over local GOs, as local governments face greater fiscal stress.
| MAY 31, 2011 |
| Portfolio at a Glance | |
| Weighted Average Maturity | 15.5 years |
| Average Duration (Modified) | 6.2 years |
| | |
| 30-Day SEC Yield | |
| Investor Class | 3.51% |
| Institutional Class | 3.71% |
| A Class | 3.12% |
| B Class | 2.52% |
| C Class | 2.52% |
| | |
A Class 30-Day Tax-Equivalent Yields(1) | |
| 25.00% Tax Bracket | 4.16% |
| 28.00% Tax Bracket | 4.33% |
| 33.00% Tax Bracket | 4.66% |
| 35.00% Tax Bracket | 4.80% |
(1)The tax brackets indicated are for federal taxes only. Actual tax-equivalent yields may be lower, if alternative minimum tax is applicable. |
| | |
| Top Five Sectors | % of fund investments |
| General Obligation (GO) | 24% |
| Hospital Revenue | 16% |
| Electric Revenue | 12% |
| Transportation Revenue | 12% |
| Water/Sewer/Gas Revenue | 7% |
| | |
| Top Five States & Territories | % of net assets |
| California | 18.0% |
| New York | 16.3% |
| Illinois | 6.8% |
| Texas | 6.6% |
| Puerto Rico | 5.1% |
| | |
| Types of Investments in Portfolio | % of net assets |
| Municipal Securities | 97.4% |
| Municipal Inverse Floaters | 0.3% |
| Other Assets and Liabilities | 2.3% |
Fund shareholders may incur two types of costs: (1) transaction costs, including sales charges (loads) on purchase payments and redemption/exchange fees; and (2) ongoing costs, including management fees; distribution and service (12b-1) fees; and other fund expenses. This example is intended to help you understand your ongoing costs (in dollars) of investing in your fund and to compare these costs with the ongoing cost of investing in other mutual funds.
The example is based on an investment of $1,000 made at the beginning of the period and held for the entire period from December 1, 2010 to May 31, 2011.
Actual Expenses
The table provides information about actual account values and actual expenses for each class. You may use the information, together with the amount you invested, to estimate the expenses that you paid over the period. First, identify the share class you own. Then simply divide your account value by $1,000 (for example, an $8,600 account value divided by $1,000 = 8.6), then multiply the result by the number under the heading “Expenses Paid During Period” to estimate the expenses you paid on your account during this period.
If you hold Investor Class shares of any American Century Investments fund, or Institutional Class shares of the American Century Diversified Bond Fund, in an American Century Investments account (i.e., not a financial intermediary or retirement plan account), American Century Investments may charge you a $12.50 semiannual account maintenance fee if the value of those shares is less than $10,000. We will redeem shares automatically in one of your accounts to pay the $12.50 fee. In determining your total eligible investment amount, we will include your investments in all personal accounts (including American Century Investments Brokerage accounts) registered under your Social Security number. Personal accounts include individual accounts, joint accounts, UGMA/UTMA accounts, personal trusts, Coverdell Education Savings Accounts and IRAs (including traditional, Roth, Rollover, SEP-, SARSEP- and SIMPLE-IRAs), and certain other retirement accounts. If you have only business, business retirement, employer-sponsored or American Century Investments Brokerage accounts, you are currently not subject to this fee. We will not charge the fee as long as you choose to manage your accounts exclusively online. If you are subject to the Account Maintenance Fee, your account value could be reduced by the fee amount.
Hypothetical Example for Comparison Purposes
The table also provides information about hypothetical account values and hypothetical expenses based on the actual expense ratio of each class of your fund and an assumed rate of return of 5% per year before expenses, which is not the actual return of a fund’s share class. The hypothetical account values and expenses may not be used to estimate the actual ending account balance or expenses you paid for the period. You may use this information to compare the ongoing costs of investing in your fund and other funds. To do so, compare this 5% hypothetical example with the 5% hypothetical examples that appear in the shareholder reports of the other funds.
Please note that the expenses shown in the table are meant to highlight your ongoing costs only and do not reflect any transactional costs, such as sales charges (loads) or redemption/exchange fees. Therefore, the table is useful in comparing ongoing costs only, and will not help you determine the relative total costs of owning different funds. In addition, if these transactional costs were included, your costs would have been higher.
| | | | | |
| | Beginning Account Value 12/1/10 | Ending Account Value 5/31/11 | Expenses Paid During Period* 12/1/10 – 5/31/11 | Annualized Expense Ratio* |
| Actual | | | | |
| Investor Class | $1,000 | $1,019.30 | $2.42 | 0.48% |
| Institutional Class | $1,000 | $1,020.30 | $1.41 | 0.28% |
| A Class | $1,000 | $1,018.00 | $3.67 | 0.73% |
| B Class | $1,000 | $1,014.30 | $7.43 | 1.48% |
| C Class | $1,000 | $1,014.30 | $7.43 | 1.48% |
| Hypothetical | | | | |
| Investor Class | $1,000 | $1,022.54 | $2.42 | 0.48% |
| Institutional Class | $1,000 | $1,023.54 | $1.41 | 0.28% |
| A Class | $1,000 | $1,021.29 | $3.68 | 0.73% |
| B Class | $1,000 | $1,017.55 | $7.44 | 1.48% |
| C Class | $1,000 | $1,017.55 | $7.44 | 1.48% |
| * | Expenses are equal to the class’s annualized expense ratio listed in the table above, multiplied by the average account value over the period, multiplied by 182, the number of days in the most recent fiscal half-year, divided by 365, to reflect the one-half year period. |
| | | | | | | |
| | | Principal Amount | | | Value | |
| Municipal Securities — 97.4% | |
| ALABAMA — 1.2% | |
East Alabama Health Care Facilities Auth. Rev., Series 2008 B, VRDN, 5.00%, 9/1/13(1) | | | $500,000 | | | | $526,500 | |
| ARIZONA — 2.6% | |
Mohave County Industrial Development Auth. Correctional Facilities Contract Rev., (Mohave Prison, LLC Expansion), 8.00%, 5/1/25(1) | | | 200,000 | | | | 220,126 | |
Phoenix Civic Improvement Corp. Wastewater System Rev., (Senior Lien), 5.50%, 7/1/24(1) | | | 250,000 | | | | 279,540 | |
Salt River Agricultural Improvement & Power District Rev., Series 2009 A, (Electric System Distribution), 5.00%, 1/1/39(1) | | | 335,000 | | | | 345,539 | |
University Medical Center Corp. Rev., 6.50%, 7/1/39(1) | | | 300,000 | | | | 305,826 | |
| | | | | | | | 1,151,031 | |
| CALIFORNIA — 18.0% | |
Anaheim Public Financing Auth. Rev., (Electric System Distribution), 5.25%, 10/1/34(1) | | | 400,000 | | | | 411,480 | |
Bay Area Toll Auth. Toll Bridge Rev., Series 2008 F1, (San Francisco Bay Area), 5.00%, 4/1/39(1) | | | 300,000 | | | | 301,272 | |
Bay Area Toll Auth. Toll Bridge Rev., Series 2009 F1, (San Francisco Bay Area), 5.125%, 4/1/39(1) | | | 200,000 | | | | 202,586 | |
California Department of Water Resources Power Supply Rev., Series 2005 F5, 5.00%, 5/1/22(1) | | | 300,000 | | | | 335,412 | |
California Department of Water Resources Power Supply Rev., Series 2005 G4, 5.00%, 5/1/16(1) | | | 100,000 | | | | 116,937 | |
California Department of Water Resources Power Supply Rev., Series 2008 H, 5.00%, 5/1/22(1) | | | 120,000 | | | | 134,165 | |
California GO, 5.00%, 6/1/25(1) | | | 130,000 | | | | 133,715 | |
California GO, 5.625%, 4/1/26(1) | | | 500,000 | | | | 536,245 | |
California GO, 5.75%, 4/1/27(1) | | | 500,000 | | | | 539,300 | |
California GO, 5.00%, 2/1/28 (Ambac)(1) | | | 200,000 | | | | 207,690 | |
California GO, 5.75%, 4/1/28(1) | | | 500,000 | | | | 535,900 | |
California Health Facilities Financing Auth. Rev., Series 2008 C, (Providence Health & Services), 6.50%, 10/1/18, Prerefunded at 100% of Par(2) | | | 5,000 | | | | 6,502 | |
California Health Facilities Financing Auth. Rev., Series 2008 C, (Providence Health & Services), 6.50%, 10/1/38(1) | | | 245,000 | | | | 267,153 | |
California Health Facilities Financing Auth. Rev., Series 2009 A, (Catholic Healthcare West), 6.00%, 7/1/39(1) | | | 300,000 | | | | 307,503 | |
California Public Works Board Lease Rev., Series 2005 A, (Department General Services - Butterfield), 5.00%, 6/1/15(1) | | | 110,000 | | | | 119,981 | |
California State University Systemwide Rev., Series 2009 A, 5.25%, 11/1/34(1) | | | 300,000 | | | | 302,013 | |
California Statewide Communities Development Auth. Rev., (Proposition 1A Receivables), 5.00%, 6/15/13(1) | | | 250,000 | | | | 267,807 | |
Chaffey Community College District GO, Series 2007 C, (Election of 2002), 5.00%, 6/1/32 (NATL)(1) | | | 265,000 | | | | 267,666 | |
Desert Sands Unified School District COP, (Financing), 5.00%, 3/1/18(1) | | | 50,000 | | | | 54,172 | |
Golden State Tobacco Securitization Corp. Settlement Rev., Series 2007 A1, 5.00%, 6/1/17(1) | | | 225,000 | | | | 226,971 | |
Golden State Tobacco Securitization Corp. Settlement Rev., Series 2007 A1, 5.125%, 6/1/47(1) | | | 200,000 | | | | 124,406 | |
Los Angeles Department of Airports Rev., Series 2010 B, (Los Angeles International Airport), 5.00%, 5/15/21(1) | | | $250,000 | | | | $271,560 | |
Los Angeles Department of Water & Power Rev., Series 2008 A1, (Power System), 5.25%, 7/1/38(1) | | | 250,000 | | | | 258,573 | |
Metropolitan Water District of Southern California Rev., Series 2009 C, 5.00%, 7/1/35(1) | | | 400,000 | | | | 414,924 | |
Northern California Power Agency Rev., Series 2009 A, (Geothermal Project No. 3), 5.25%, 7/1/24(1) | | | 200,000 | | | | 216,684 | |
| Palomar Pomerado Health Care District COP, 6.00%, 11/1/41 | | | 250,000 | | | | 223,543 | |
San Bernardino Community College District GO, Series 2008 A, (Election of 2002), 6.25%, 8/1/33(1) | | | 290,000 | | | | 322,555 | |
San Diego Public Facilities Financing Sewer Auth. Rev., Series 2010 A, 5.25%, 5/15/24(1) | | | 50,000 | | | | 55,857 | |
San Diego Public Facilities Financing Water Auth. Rev., Series 2010 A, 5.00%, 8/1/23(1) | | | 70,000 | | | | 77,452 | |
Tuolumne Wind Project Auth. Rev., Series 2009 A, 5.875%, 1/1/29(1) | | | 250,000 | | | | 272,288 | |
Vernon Electric System Rev., Series 2009 A, 5.50%, 8/1/15(1) | | | 420,000 | | | | 458,858 | |
| | | | | | | | 7,971,170 | |
| COLORADO — 1.5% | |
Colorado Health Facilities Auth. Rev., Series 2008 D, (Catholic Health Initiatives), 6.25%, 10/1/33(1) | | | 240,000 | | | | 259,740 | |
| Regional Transportation District Private Activity Rev., (Denver Transit Partners), 6.00%, 1/15/41 | | | 200,000 | | | | 200,540 | |
University of Colorado Enterprise System Rev., Series 2009 A, 5.25%, 6/1/30(1) | | | 200,000 | | | | 212,678 | |
| | | | | | | | 672,958 | |
| CONNECTICUT — 0.5% | |
Connecticut Health & Educational Facilities Auth. Rev., Series 2007 I, (Quinnipiac University), 5.00%, 7/1/17 (NATL)(1) | | | 200,000 | | | | 224,986 | |
| DELAWARE — 0.2% | |
New Castle County GO, Series 2009 A, 5.00%, 7/15/27(1) | | | 100,000 | | | | 109,413 | |
| DISTRICT OF COLUMBIA — 1.0% | |
Washington Metropolitan Area Transit Auth. Rev., Series 2009 A, 5.00%, 7/1/17(1) | | | 400,000 | | | | 461,100 | |
| FLORIDA — 2.5% | |
Citizens Property Insurance Corp. Rev., Series 2010 A1, (Second High Risk Notes), 5.25%, 6/1/17(1) | | | 200,000 | | | | 214,410 | |
Florida Board of Education Capital Outlay GO, Series 2007 G, 4.75%, 6/1/37 (NATL)(1) | | | 250,000 | | | | 250,072 | |
Miami-Dade County Educational Facilities Auth. Rev., Series 2008 A, (University of Miami), 5.50%, 4/1/38(1) | | | 200,000 | | | | 201,290 | |
Orlando Utilities Commission System Rev., Series 2009 B, 5.00%, 10/1/33(1) | | | 100,000 | | | | 103,565 | |
| St. Petersburg Health Facilities Auth. Rev., Series 2009 A, (All Children’s Health Facilities), 6.50%, 11/15/39 | | | 300,000 | | | | 325,119 | |
| | | | | | | | 1,094,456 | |
| GEORGIA — 3.2% | |
| Atlanta Airport Rev., Series 2010 C, 5.75%, 1/1/23 | | | 250,000 | | | | 284,855 | |
| Atlanta Airport Rev., Series 2010 C, 5.25%, 1/1/30 | | | 200,000 | | | | 204,910 | |
Fulton County Development Auth. Rev., Series 2001 A, (TUFF/Atlanta Housing, LLC Project at Georgia State University), 5.50%, 9/1/18 (Ambac)(1) | | | 500,000 | | | | 511,930 | |
Georgia Municipal Electric Power Auth. Rev., Series 1998 Y, (Project One Special Obligation), 6.40%, 1/1/13 (Ambac)(1) | | | 25,000 | | | | 26,258 | |
Metropolitan Atlanta Rapid Transit Auth. Rev., Series 2009 A, (Third Indenture), 5.00%, 7/1/39(1) | | | $400,000 | | | | $405,692 | |
| | | | | | | | 1,433,645 | |
| GUAM — 1.0% | |
Guam Government GO, Series 2009 A, 6.75%, 11/15/29(1) | | | 250,000 | | | | 254,492 | |
| Guam Power Auth. Rev., Series 2010 A, 5.50%, 10/1/40 | | | 200,000 | | | | 185,998 | |
| | | | | | | | 440,490 | |
| HAWAII — 0.4% | |
Hawaii Pacific Health Special Purpose Rev., Series 2010 B, 5.75%, 7/1/40(1) | | | 200,000 | | | | 185,904 | |
| IDAHO — 0.6% | |
Idaho Health Facilities Auth. Rev., (St. Luke’s Regional Medical Center), 5.00%, 7/1/35 (AGM)(1) | | | 250,000 | | | | 252,627 | |
| ILLINOIS — 6.8% | |
Chicago Board of Education GO, Series 2010 F, 5.00%, 12/1/14(1) | | | 200,000 | | | | 217,890 | |
Chicago Board of Education GO, Series 2010 F, 5.00%, 12/1/15(1) | | | 200,000 | | | | 219,876 | |
Chicago Board of Education GO, Series 2010 F, 5.00%, 12/1/16(1) | | | 200,000 | | | | 221,178 | |
Illinois Finance Auth. Rev., Series 2008 D, (Advocate Health Care Network), 6.25%, 11/1/28(1) | | | 200,000 | | | | 220,662 | |
Illinois Finance Auth. Rev., Series 2010 A, (Provena Health), 5.00%, 5/1/13(1) | | | 400,000 | | | | 411,520 | |
Illinois GO, 5.00%, 1/1/17 (AGM)(1) | | | 200,000 | | | | 219,554 | |
Illinois GO, Series 2006 A, 5.00%, 6/1/13(1) | | | 475,000 | | | | 502,541 | |
Metropolitan Pier & Exposition Auth. Rev., Series 2002 A, (Capital Appreciation-McCormick Place Exposition), 5.81%, 12/15/31 (NATL)(1)(3) | | | 825,000 | | | | 244,975 | |
Metropolitan Pier & Exposition Auth. Rev., Series 2010 B2, (Taxable - McCormick), 5.00%, 6/15/50(1) | | | 250,000 | | | | 224,680 | |
Railsplitter Tobacco Settlement Auth. Rev., 5.00%, 6/1/15(1) | | | 250,000 | | | | 265,708 | |
Railsplitter Tobacco Settlement Auth. Rev., 6.00%, 6/1/28(1) | | | 250,000 | | | | 251,492 | |
| | | | | | | | 3,000,076 | |
| INDIANA — 1.1% | |
Indiana Bond Bank Rev., Series 2006 A, (Special Program), 5.00%, 8/1/20 (AGM)(1) | | | 250,000 | | | | 274,045 | |
Indiana Municipal Power Agency Rev., Series 2009 B, (Power Supply System), 5.375%, 1/1/25(1) | | | 200,000 | | | | 214,650 | |
| | | | | | | | 488,695 | |
| KENTUCKY — 1.2% | |
Kentucky Property & Buildings Community Rev., 5.50%, 11/1/28(1) | | | 250,000 | | | | 267,803 | |
Kentucky Turnpike Auth. Economic Development Road Rev., Series 2008 A, (Revitalization), 5.00%, 7/1/17(1) | | | 240,000 | | | | 280,982 | |
| | | | | | | | 548,785 | |
| MARYLAND — 1.0% | |
Maryland Economic Development Corp. Student Housing Rev., (University of Maryland, College Park), 5.00%, 6/1/19(1) | | | 150,000 | | | | 161,163 | |
Maryland Health & Higher Educational Facilities Auth. Rev., Series 2008 A, (Johns Hopkins University), 5.00%, 7/1/18(1) | | | 225,000 | | | | 267,588 | |
| | | | | | | | 428,751 | |
| MASSACHUSETTS — 3.3% | |
Massachusetts Bay Transportation Auth. Rev., Series 2008 A, (Assessment Bonds), 5.25%, 7/1/34(1) | | | 200,000 | | | | 212,178 | |
| Massachusetts Development Finance Agency Rev., (Suffolk University), 5.125%, 7/1/40 | | | 250,000 | | | | 219,132 | |
Massachusetts GO, Series 2008 A, (Consolidated Loan), 5.00%, 8/1/24(1) | | | 200,000 | | | | 220,754 | |
Massachusetts Health & Educational Facilities Auth. Rev., (Boston Medical Center), 5.25%, 7/1/38(1) | | | 200,000 | | | | 165,474 | |
Massachusetts Health & Educational Facilities Auth. Rev., Series 2009 A, (Harvard University), 5.50%, 11/15/36(1) | | | $200,000 | | | | $218,834 | |
Massachusetts Health & Educational Facilities Auth. Rev., Series 2010 C, (Massachusetts Eye and Ear Infirmary), 5.375%, 7/1/35(1) | | | 250,000 | | | | 231,413 | |
Massachusetts Health & Educational Facilities Auth. Rev., Series 2010 H, (Winchester Hospital), 5.25%, 7/1/38(1) | | | 250,000 | | | | 214,073 | |
| | | | | | | | 1,481,858 | |
| MINNESOTA — 1.2% | |
Minneapolis-St. Paul Metropolitan Airports Commission Rev., Series 2007 B, 5.00%, 1/1/25 (NATL/FGIC)(1) | | | 300,000 | | | | 307,248 | |
Minnesota GO, 5.00%, 6/1/18(1) | | | 200,000 | | | | 229,244 | |
| | | | | | | | 536,492 | |
| MISSOURI — 0.6% | |
Missouri Health & Educational Facilities Auth. Rev., Series 2008 A, (Washington University), 5.375%, 3/15/39(1) | | | 250,000 | | | | 266,648 | |
| MONTANA — 0.2% | |
Montana Facility Finance Auth. Health Care Rev., (Kalispell Regional Medical Center), 5.00%, 7/1/35(1) | | | 95,000 | | | | 93,687 | |
| NEBRASKA — 0.4% | |
Nebraska Public Power District Rev., Series 2008 B, 5.00%, 1/1/24(1) | | | 150,000 | | | | 161,252 | |
| NEW JERSEY — 4.3% | |
Monmouth County GO, (County College Bonds), 4.00%, 9/15/19(1) | | | 250,000 | | | | 274,453 | |
New Jersey GO, 5.00%, 6/1/17(1) | | | 200,000 | | | | 231,682 | |
New Jersey GO, Series 2010 Q, 5.00%, 8/15/15(1) | | | 250,000 | | | | 285,900 | |
New Jersey Health Care Facilities Auth. Rev., (Hackensack University Medical Center), 5.00%, 1/1/34(1) | | | 200,000 | | | | 176,552 | |
New Jersey Health Care Facilities Financing Auth. Rev., (The Robert Wood Johnson Foundation), 5.00%, 7/1/31(1) | | | 200,000 | | | | 199,740 | |
New Jersey State Turnpike Auth. Rev., Series 2009 H, 5.00%, 1/1/36(1) | | | 250,000 | | | | 251,165 | |
New Jersey Transportation Trust Fund Auth. Rev., Series 2006 A, 5.25%, 12/15/20(1) | | | 205,000 | | | | 225,990 | |
New Jersey Transportation Trust Fund Auth. Rev., Series 2010 D, 5.00%, 12/15/17(1) | | | 250,000 | | | | 279,532 | |
| | | | | | | | 1,925,014 | |
| NEW YORK — 16.3% | |
Long Island Power Auth. Electric System Rev., Series 2008 A, 6.00%, 5/1/33(1) | | | 250,000 | | | | 274,645 | |
Long Island Power Auth. Electric System Rev., Series 2008 B, 5.25%, 4/1/19 (AGC-ICC)(1) | | | 150,000 | | | | 171,407 | |
Metropolitan Transportation Auth. Rev., Series 2008 C, 6.50%, 11/15/28(1) | | | 250,000 | | | | 288,115 | |
Metropolitan Transportation Auth. Rev., Series 2010 G, 5.00%, 11/15/19(1) | | | 250,000 | | | | 282,825 | |
New York City Municipal Water Finance Auth. Water & Sewer System Rev., Series 2004 C, 5.00%, 6/15/35(1) | | | 250,000 | | | | 252,060 | |
New York City Municipal Water Finance Auth. Water & Sewer System Rev., Series 2011 GG, (Second General Resolution), 5.00%, 6/15/43(1) | | | 250,000 | | | | 256,245 | |
New York City Transitional Finance Auth. Rev., Series 2004 D2, (Future Tax Secured Bonds), 5.00%, 11/1/12(1) | | | 215,000 | | | | 229,087 | |
New York City Transitional Finance Auth. Rev., Series 2009 S4, 5.50%, 1/15/39(1) | | | 300,000 | | | | 315,111 | |
New York City Transitional Finance Auth. Rev., Series 2011 C, (Future Tax Secured Bonds), 5.00%, 11/1/39(1) | | | 200,000 | | | | 206,436 | |
New York GO, Series 2009 A, 5.00%, 2/15/39(1) | | | 300,000 | | | | 310,941 | |
New York GO, Series 2009 C, 5.00%, 8/1/23(1) | | | 500,000 | | | | 556,080 | |
New York GO, Series 2009 E, 5.00%, 8/1/16(1) | | | $400,000 | | | | $463,792 | |
New York Local Government Assistance Corp. Rev., Series 2003 A5/6, 5.00%, 4/1/18(1) | | | 270,000 | | | | 317,115 | |
New York State Dormitory Auth. Rev., (Columbia University), 4.00%, 7/1/13(1) | | | 250,000 | | | | 268,680 | |
New York State Dormitory Auth. Rev., (Mental Health Services Facilities Improvement), 5.50%, 2/15/18(1) | | | 300,000 | | | | 350,853 | |
New York State Dormitory Auth. Rev., Series 2009 A, (North Shore Long Island Jewish Health System), 5.50%, 5/1/37(1) | | | 400,000 | | | | 401,764 | |
New York State Dormitory Auth. Rev., Series 2010 A, (Mount Sinai School of Medicine), 5.00%, 7/1/14(1) | | | 400,000 | | | | 436,204 | |
New York State Dormitory Auth. State Personal Income Tax Rev., Series 2008 A, 5.00%, 3/15/19(1) | | | 300,000 | | | | 346,734 | |
New York State Environmental Facilities Corp. Rev., Series 2009 A, 5.125%, 6/15/38(1) | | | 280,000 | | | | 290,256 | |
New York State Urban Development Corp. Rev., Series 2009 C, (State Personal Income Tax), 5.00%, 12/15/15(1) | | | 120,000 | | | | 139,202 | |
New York Urban Development Corp. State Personal Income Tax Rev., Series 2008 A1, (Economic Development & Housing), 5.00%, 12/15/22(1) | | | 340,000 | | | | 377,264 | |
Port Auth. of New York & New Jersey Special Obligation Rev., (John F. Kennedy International Airport Terminal), 6.00%, 12/1/42(1) | | | 250,000 | | | | 249,860 | |
Triborough Bridge & Tunnel Auth. Rev., Series 2008 C, 5.00%, 11/15/38(1) | | | 200,000 | | | | 204,680 | |
Troy Capital Resource Corp. Rev., Series 2010 A, (Rensselaer Polytechnic Institute), 5.125%, 9/1/40(1) | | | 250,000 | | | | 247,735 | |
| | | | | | | | 7,237,091 | |
| NORTH CAROLINA — 2.6% | |
North Carolina Eastern Municipal Power Agency Rev., Series 2008 C, 6.75%, 1/1/24(1) | | | 250,000 | | | | 293,685 | |
North Carolina Eastern Municipal Power Agency Rev., Series 2009 A, 5.00%, 1/1/18(1) | | | 300,000 | | | | 338,076 | |
North Carolina Municipal Power Agency No. 1 Catawba Electric Rev., Series 2003 A, 5.50%, 1/1/13(1)(2) | | | 45,000 | | | | 48,577 | |
North Carolina Municipal Power Agency No. 1 Catawba Electric Rev., Series 2003 A, 5.50%, 1/1/13(1) | | | 105,000 | | | | 112,533 | |
North Carolina Municipal Power Agency No. 1 Catawba Electric Rev., Series 2008 A, 5.25%, 1/1/16(1) | | | 300,000 | | | | 344,406 | |
| | | | | | | | 1,137,277 | |
| OREGON — 1.9% | |
Clackamas County Hospital Facility Auth. Rev., Series 2009 A, (Legacy Health System), 5.50%, 7/15/35(1) | | | 200,000 | | | | 199,722 | |
Oregon GO, Series 2009 A, (State Board of Higher Education), 5.00%, 8/1/38(1) | | | 300,000 | | | | 311,784 | |
Oregon Health & Science University Rev., Series 2009 A, 5.75%, 7/1/39(1) | | | 300,000 | | | | 314,391 | |
| | | | | | | | 825,897 | |
| PENNSYLVANIA — 4.0% | |
Allegheny County Industrial Development Auth. Rev., (Residential Resources, Inc.), 4.50%, 9/1/11(1) | | | 345,000 | | | | 346,570 | |
Central Dauphin School District GO, 7.00%, 2/1/16, Prerefunded at 100% of Par (NATL)(1)(2) | | | 500,000 | | | | 631,170 | |
Pennsylvania Turnpike Commission Rev., Series 2008 C, 6.00%, 6/1/28 (AGC)(1) | | | 200,000 | | | | 219,038 | |
Philadelphia Gas Works Rev., Series 2009 A, (1998 General Ordinance), 5.00%, 8/1/16(1) | | | 300,000 | | | | 327,786 | |
Philadelphia Water & Wastewater Rev., Series 2009 A, 5.25%, 1/1/36(1) | | | $250,000 | | | | $251,932 | |
| | | | | | | | 1,776,496 | |
| PUERTO RICO — 5.1% | |
Puerto Rico Aqueduct & Sewer Auth. Rev., Series 2008 A, (Senior Lien), 5.00%, 7/1/14(1) | | | 500,000 | | | | 529,700 | |
Puerto Rico GO, Series 2006 A, (Public Improvement), 5.25%, 7/1/23(1) | | | 250,000 | | | | 250,265 | |
Puerto Rico GO, Series 2008 A, 5.125%, 7/1/28(1) | | | 200,000 | | | | 192,608 | |
Puerto Rico GO, Series 2011 C, (Public Improvement), 5.75%, 7/1/36(1) | | | 385,000 | | | | 379,448 | |
Puerto Rico Highway & Transportation Auth. Rev., Series 2007 N, 5.25%, 7/1/30 (Ambac)(1) | | | 525,000 | | | | 503,003 | |
Puerto Rico Public Buildings Auth. Rev., Series 2009 Q, 5.625%, 7/1/39(1) | | | 400,000 | | | | 386,036 | |
| | | | | | | | 2,241,060 | |
| SOUTH CAROLINA — 0.4% | |
South Carolina Jobs-Economic Development Auth. Hospital Rev., (Palmetto Health), 5.75%, 8/1/39(1) | | | 175,000 | | | | 162,801 | |
| TENNESSEE — 0.6% | |
Metropolitan Government Nashville & Davidson County Health & Educational Facilities Board Rev., Series 2008 A, (Vanderbilt University), 5.00%, 10/1/15(1) | | | 225,000 | | | | 260,840 | |
| TEXAS — 6.3% | |
Dallas Area Rapid Transit Sales Tax Rev., Series 2010 A, (Senior Lien), 5.00%, 12/1/14(1) | | | 250,000 | | | | 284,960 | |
Dallas Area Rapid Transit Sales Tax Rev., Series 2010 A, (Senior Lien), 5.00%, 12/1/19(1) | | | 250,000 | | | | 297,615 | |
Harris County Toll Road Rev., Series 2009 A, (Senior Lien), 5.00%, 8/15/38(1) | | | 400,000 | | | | 407,384 | |
Houston Utility System Rev., Series 2011 A, (First Lien), 5.00%, 11/15/33(1) | | | 250,000 | | | | 258,658 | |
Lower Colorado River Auth. Rev., 5.00%, 5/15/15(1) | | | 200,000 | | | | 227,752 | |
North Texas Thruway Auth. Rev., (First Tier), 6.00%, 1/1/38(1) | | | 300,000 | | | | 308,565 | |
North Texas Thruway Auth. Rev., Series 2008 H, (First Tier), VRDN, 5.00%, 1/1/13(1) | | | 225,000 | | | | 236,747 | |
Tarrant County Cultural Education Facilities Finance Corp. Rev., (Scott & White Memorial Hospital and Scott, Sherwood & Brindley Foundation), 5.50%, 8/15/31(1) | | | 250,000 | | | | 252,940 | |
| University of North Texas Rev., Series 2009 A, 5.00%, 4/15/32 | | | 250,000 | | | | 258,447 | |
West Harris County Regional Water Auth. Rev., 5.00%, 12/15/35(1) | | | 250,000 | | | | 254,078 | |
| | | | | | | | 2,787,146 | |
| UTAH — 1.3% | |
Utah State Board of Regents Rev., Series 2006 A, (University of Utah Hospital), 5.25%, 8/1/21 (NATL)(1) | | | 250,000 | | | | 290,700 | |
Utah Transit Auth. Sales Tax Rev., Series 2008 A, 5.00%, 6/15/20(1) | | | 250,000 | | | | 288,035 | |
| | | | | | | | 578,735 | |
| U.S. VIRGIN ISLANDS — 0.6% | |
Virgin Islands Public Finance Auth. Rev., Series 2010 A, (Matching Fund Loan Note, Senior Lien), 5.00%, 10/1/25(1) | | | 250,000 | | | | 248,340 | |
| VERMONT — 0.3% | |
Vermont Educational & Health Buildings Financing Agency Rev., (Middlebury College), 5.00%, 11/1/40(1) | | | 150,000 | | | | 155,175 | |
| VIRGINIA — 1.0% | |
Virginia Resources Auth. Clean Water Rev., (State Revolving Fund), 5.00%, 10/1/16(1) | | | 200,000 | | | | 237,836 | |
Washington County Industrial Development Auth. Hospital Facility Rev., Series 2009 C, (Mountain States Health Alliance), 7.75%, 7/1/38(1) | | | 200,000 | | | | 223,382 | |
| | | | | | | | 461,218 | |
| WASHINGTON — 1.6% | |
Port of Seattle Rev., Series 2010 B, (Intermediate Lien), 5.00%, 6/1/30(1) | | | $200,000 | | | | $206,810 | |
Redmond GO, 5.00%, 12/1/21(1) | | | 250,000 | | | | 285,557 | |
Washington GO, Series 2008 A, 5.00%, 7/1/20(1) | | | 200,000 | | | | 230,378 | |
| | | | | | | | 722,745 | |
| WISCONSIN — 2.6% | |
Milwaukee Redevelopment Auth. Rev., (Milwaukee Public Schools - Neighborhood Schools Initiative), 5.125%, 8/1/13, Prerefunded at 100% of Par (Ambac)(1)(2) | | | 475,000 | | | | 521,868 | |
Wisconsin Health & Educational Facilities Auth. Rev., (ProHealth Care, Inc. Obligated Group), 6.625%, 2/15/39(1) | | | 300,000 | | | | 317,460 | |
Wisconsin Transportation Rev., Series 2008 A, 5.00%, 7/1/18(1) | | | 250,000 | | | | 297,863 | |
| | | | | | | | 1,137,191 | |
TOTAL MUNICIPAL SECURITIES(Cost $41,301,984) | | | | 43,187,550 | |
Municipal Inverse Floaters(4) — 0.3% | |
| TEXAS — 0.3% | |
Texas GO, VRN, Inverse Floater, 11.49%, 9/30/11(1)(Cost $111,381) | | | 110,000 | | | | 113,624 | |
TOTAL INVESTMENT SECURITIES — 97.7%(Cost $41,413,365) | | | | 43,301,174 | |
| OTHER ASSETS AND LIABILITIES — 2.3% | | | | 1,028,778 | |
| TOTAL NET ASSETS — 100.0% | | | | $44,329,952 | |
| Futures Contracts |
| Contracts Purchased | Expiration Date | Underlying Face Amount at Value | Unrealized Gain (Loss) |
| 16 | U.S. Long Bond | September 2011 | $1,997,500 | $19,214 |
| | | | | |
| Contracts Sold | Expiration Date | Underlying Face Amount at Value | Unrealized Gain (Loss) |
| 49 | U.S. Treasury 2-Year Notes | September 2011 | $10,740,188 | $(20,017) |
Notes to Schedule of Investments
AGC = Assured Guaranty Corporation
AGC-ICC = Assured Guaranty Corporation - Insured Custody Certificates
AGM = Assured Guaranty Municipal Corporation
Ambac = Ambac Assurance Corporation
COP = Certificates of Participation
FGIC = Financial Guaranty Insurance Company
GO = General Obligation
NATL = National Public Finance Guarantee Corporation
VRDN = Variable Rate Demand Note. Interest reset date is indicated. Rate shown is effective at the period end.
VRN = Variable Rate Note. Interest reset date is indicated. Rate shown is effective at the period end.
| (1) | Security, or a portion thereof, has been segregated for futures contracts. At the period end, the aggregate value of securities pledged was $12,738,000. |
| (2) | Escrowed to maturity in U.S. government securities or state and local government securities. |
| (3) | Security is a zero-coupon municipal bond. The rate indicated is the yield to maturity at purchase. Zero-coupon securities are issued at a substantial discount from their value at maturity. |
| (4) | Inverse floaters have interest rates that move inversely to market interest rates. Inverse floaters typically have durations longer than long-term bonds, which may cause their value to be more volatile than long-term bonds when interest rates change. Final maturity is indicated. |
See Notes to Financial Statements.
Statement of Assets and Liabilities |
| MAY 31, 2011 | |
| Assets | |
| Investment securities, at value (cost of $41,413,365) | | | $43,301,174 | |
| Cash | | | 388,086 | |
| Receivable for capital shares sold | | | 22,690 | |
| Receivable for variation margin on futures contracts | | | 4,000 | |
| Interest receivable | | | 701,558 | |
| | | | 44,417,508 | |
| | | | | |
| Liabilities | | | | |
| Payable for capital shares redeemed | | | 43,271 | |
| Payable for variation margin on futures contracts | | | 3,828 | |
| Accrued management fees | | | 17,750 | |
| Distribution and service fees payable | | | 6,829 | |
| Dividends payable | | | 15,878 | |
| | | | 87,556 | |
| | | | | |
| Net Assets | | | $44,329,952 | |
| | | | | |
| Net Assets Consist of: | | | | |
| Capital paid in | | | $44,017,482 | |
| Accumulated net investment loss | | | (194 | ) |
| Accumulated net realized loss | | | (1,574,342 | ) |
| Net unrealized appreciation | | | 1,887,006 | |
| | | | $44,329,952 | |
| | | | | | | |
| | | Net assets | | Shares outstanding | | Net asset value per share |
| Investor Class | | | $23,673,863 | | | | 2,173,555 | | | | $10.89 | |
| Institutional Class | | | $278,870 | | | | 25,613 | | | | $10.89 | |
| A Class | | | $16,820,135 | | | | 1,544,596 | | | | $10.89 | * |
| B Class | | | $356,559 | | | | 32,744 | | | | $10.89 | |
| C Class | | | $3,200,525 | | | | 293,885 | | | | $10.89 | |
| * | Maximum offering price $11.40 (net asset value divided by 0.955) |
See Notes to Financial Statements.
| YEAR ENDED MAY 31, 2011 | |
| Investment Income (Loss) | |
| Income: | | | |
| Interest | | | $1,923,261 | |
| | | | | |
| Expenses: | | | | |
| Management fees | | | 204,963 | |
| Distribution and service fees: | | | | |
| A Class | | | 53,785 | |
| B Class | | | 4,815 | |
| C Class | | | 43,814 | |
| Trustees’ fees and expenses | | | 1,883 | |
| Other expenses | | | 4,041 | |
| | | | 313,301 | |
| | | | | |
| Net investment income (loss) | | | 1,609,960 | |
| | | | | |
| Realized and Unrealized Gain (Loss) | | | | |
| Net realized gain (loss) on: | | | | |
| Investment transactions | | | (152,485 | ) |
| Futures contract transactions | | | (163,822 | ) |
| | | | (316,307 | ) |
| | | | | |
| Change in net unrealized appreciation (depreciation) on: | | | | |
| Investments | | | (409,216 | ) |
| Futures contracts | | | 14,881 | |
| | | | (394,335 | ) |
| | | | | |
| Net realized and unrealized gain (loss) | | | (710,642 | ) |
| | | | | |
| Net Increase (Decrease) in Net Assets Resulting from Operations | | | $899,318 | |
See Notes to Financial Statements.
Statement of Changes in Net Assets |
| YEARS ENDED MAY 31, 2011 AND MAY 31, 2010 | |
| Increase (Decrease) in Net Assets | | 2011 | | | 2010 | |
| Operations | |
| Net investment income (loss) | | | $1,609,960 | | | | $1,410,650 | |
| Net realized gain (loss) | | | (316,307 | ) | | | 271,439 | |
| Change in net unrealized appreciation (depreciation) | | | (394,335 | ) | | | 962,508 | |
| Net increase (decrease) in net assets resulting from operations | | | 899,318 | | | | 2,644,597 | |
| | | | | | | | | |
| Distributions to Shareholders | | | | | | | | |
| From net investment income: | | | | | | | | |
| Investor Class | | | (668,572 | ) | | | (274,892 | ) |
| Institutional Class | | | (9,795 | ) | | | (97,171 | ) |
| A Class | | | (789,367 | ) | | | (900,601 | ) |
| B Class | | | (14,064 | ) | | | (22,829 | ) |
| C Class | | | (128,162 | ) | | | (140,522 | ) |
| Decrease in net assets from distributions | | | (1,609,960 | ) | | | (1,436,015 | ) |
| | | | | | | | | |
| Capital Share Transactions | | | | | | | | |
| Net increase (decrease) in net assets from capital share transactions | | | 6,562,604 | | | | (10,048,893 | ) |
| | | | | | | | | |
| Net increase (decrease) in net assets | | | 5,851,962 | | | | (8,840,311 | ) |
| | | | | | | | | |
| Net Assets | | | | | | | | |
| Beginning of period | | | 38,477,990 | | | | 47,318,301 | |
| End of period | | | $44,329,952 | | | | $38,477,990 | |
| | | | | | | | | |
| Accumulated net investment loss | | | $(194 | ) | | | — | |
See Notes to Financial Statements.
Notes to Financial Statements |
MAY 31, 2011
1. Organization
American Century Municipal Trust (the trust) is registered under the Investment Company Act of 1940, as amended (the 1940 Act), as an open-end management investment company and is organized as a Massachusetts business trust. Long-Term Tax-Free Fund (the fund) is one fund in a series issued by the trust. The fund is diversified as defined under the 1940 Act. The fund’s investment objective is to seek high current income that is exempt from federal income taxes consistent with preservation of capital. The fund pursues its objective by investing primarily in long-term investment-grade municipal obligations.
The fund is authorized to issue the Investor Class, the Institutional Class, the A Class, the B Class and the C Class. The A Class may incur an initial sales charge. The A Class, B Class and C Class may be subject to a contingent deferred sales charge. The share classes differ principally in their respective sales charges and distribution and shareholder servicing expenses and arrangements. The Institutional Class is made available to institutional shareholders or through financial intermediaries whose clients do not require the same level of shareholder and administrative services as shareholders of other classes. As a result, the Institutional Class is charged a lower unified management fee.
2. Significant Accounting Policies
The following is a summary of significant accounting policies consistently followed by the fund in preparation of its financial statements. The financial statements are prepared in conformity with accounting principles generally accepted in the United States of America, which may require management to make certain estimates and assumptions at the date of the financial statements. Actual results could differ from these estimates.
Investment Valuations — The fund determines the fair value of its investments and computes its net asset value per share as of the close of regular trading (usually 4 p.m. Eastern time) on the New York Stock Exchange (NYSE) on each day the NYSE is open.
Debt securities maturing in greater than 60 days at the time of purchase are valued at the evaluated mean as provided by independent pricing services or at the mean of the most recent bid and asked prices as provided by investment dealers. Debt securities maturing within 60 days at the time of purchase may be valued at cost, plus or minus any amortized discount or premium or at the evaluated mean as provided by an independent pricing service. Evaluated mean prices are commonly derived through utilization of market models, which may consider, among other factors, trade data, quotations from dealers and active market makers, relevant yield curve and spread data, related sector levels, creditworthiness, and other relevant market information on the same or comparable securities.
Exchange-traded futures contracts are valued at the settlement price as provided by the appropriate clearing corporation.
If the fund determines that the market price for a portfolio security is not readily available or the valuation methods mentioned above do not reflect a security’s fair value, such security is valued as determined in good faith by the Board of Trustees or its designee, in accordance with procedures adopted by the Board of Trustees. Circumstances that may cause the fund to use these procedures to value a security include, but are not limited to: a security has been declared in default; trading in a security has been halted during the trading day; there is a foreign market holiday and no trading occurred; or an event occurred between the close of a foreign exchange and the NYSE that may affect the value of a security.
Security Transactions — Security transactions are accounted for as of the trade date. Net realized gains and losses are determined on the identified cost basis, which is also used for federal income tax purposes.
Investment Income — Interest income is recorded on the accrual basis and includes accretion of discounts and amortization of premiums.
When-Issued — The fund may engage in securities transactions on a when-issued basis. Under these arrangements, the securities’ prices and yields are fixed on the date of the commitment, but payment and delivery are scheduled for a future date. During this period, securities are subject to market fluctuations. The fund will segregate cash, cash equivalents or other appropriate liquid securities on its records in amounts sufficient to meet the purchase price.
Income Tax Status — It is the fund’s policy to distribute substantially all net investment income and net realized gains to shareholders and to otherwise qualify as a regulated investment company under provisions of the Internal Revenue Code. The fund is no longer subject to examination by tax authorities for years prior to 2008. At this time, management believes there are no uncertain tax positions which, based on their technical merit, would not be sustained upon examination and for which it is reasonably possible that the total amounts of unrecognized tax benefits will significantly change in the next twelve months. Accordingly, no provision has been made for federal or state income taxes.
Multiple Class — All shares of the fund represent an equal pro rata interest in the net assets of the class to which such shares belong, and have identical voting, dividend, liquidation and other rights and the same terms and conditions, except for class specific expenses and exclusive rights to vote on matters affecting only individual classes. Income, non-class specific expenses, and realized and unrealized capital gains and losses of the fund are allocated to each class of shares based on their relative net assets.
Distributions to Shareholders — Distributions from net investment income are declared daily and paid monthly. Distributions from net realized gains, if any, are generally declared and paid annually.
Indemnifications — Under the trust’s organizational documents, its officers and trustees are indemnified against certain liabilities arising out of the performance of their duties to the fund. In addition, in the normal course of business, the fund enters into contracts that provide general indemnifications. The maximum exposure under these arrangements is unknown as this would involve future claims that may be made against a fund. The risk of material loss from such claims is considered by management to be remote.
3. Fees and Transactions with Related Parties
Management Fees — The trust has entered into a management agreement with American Century Investment Management, Inc. (ACIM) (the investment advisor), under which ACIM provides the fund with investment advisory and management services in exchange for a single, unified management fee (the fee) per class. The agreement provides that all expenses of managing and operating the fund, except distribution and service fees, brokerage expenses, taxes, interest, fees and expenses of the independent trustees (including legal counsel fees), and extraordinary expenses, will be paid by ACIM. The fee is computed and accrued daily based on each class’s daily net assets and paid monthly in arrears. The fee consists of (1) an Investment Category Fee based on the daily net assets of the fund and certain other accounts managed by the investment advisor that are in the same broad investment category as the fund and (2) a Complex Fee based on the assets of all the funds in the American Century Investments family of funds. The rates for the Investment Category Fee range from 0.1625% to 0.2800%. The rates for the Complex Fee range from 0.2500% to 0.3100% for the Investor Class, A Class, B Class and C Class. The Institutional Class is 0.2000% less at each point within the Complex Fee range. The effective annual management fee for each class for the year ended May 31, 2011 was 0.47% for the Investor Class, A Class, B Class and C Class and 0.27% for the Institutional Class.
Distribution and Service Fees — The Board of Trustees has adopted a separate Master Distribution and Individual Shareholder Services Plan for each of the A Class, B Class and C Class (collectively the plans), pursuant to Rule 12b-1 of the 1940 Act. The plans provide that the A Class will pay American Century Investment Services, Inc. (ACIS) an annual distribution and service fee of 0.25%. The plans provide that the B Class and C Class will each pay ACIS an annual distribution and service fee of 1.00%, of which 0.25% is paid for individual shareholder services and 0.75% is paid for distribution services. The fees are computed and accrued daily based on each class’s daily net assets and paid monthly in
arrears. The fees are used to pay financial intermediaries for distribution and individual shareholder services. Fees incurred under the plans during the year ended May 31, 2011 are detailed in the Statement of Operations.
Related Parties — Certain officers and trustees of the trust are also officers and/or directors of American Century Companies, Inc. (ACC), the parent of the trust’s investment advisor, ACIM, the distributor of the trust, ACIS, and the trust’s transfer agent, American Century Services, LLC.
The fund has a mutual funds services agreement with J.P. Morgan Investor Services Co. (JPMIS). JPMorgan Chase Bank (JPMCB) is a custodian of the fund. JPMIS and JPMCB are wholly owned subsidiaries of JPMorgan Chase & Co. (JPM). JPM is an equity investor in ACC.
4. Investment Transactions
Purchases and sales of investment securities, excluding short-term investments, for the year ended May 31, 2011 were $16,355,255 and $9,232,421, respectively.
5. Capital Share Transactions
Transactions in shares of the fund were as follows (unlimited number of shares authorized):
| | | | | | | |
| | | Year ended May 31, 2011 | | | Year ended May 31, 2010 | |
| | | Shares | | | Amount | | | Shares | | | Amount | |
| Investor Class | | | | | | | | | | | | |
| Sold | | | 2,444,990 | | | | $26,475,838 | | | | 811,413 | | | | $8,827,225 | |
| Issued in reinvestment of distributions | | | 57,071 | | | | 617,819 | | | | 23,733 | | | | 257,652 | |
| Redeemed | | | (1,220,165 | ) | | | (13,132,148 | ) | | | (285,292 | ) | | | (3,092,653 | ) |
| | | | 1,281,896 | | | | 13,961,509 | | | | 549,854 | | | | 5,992,224 | |
| Institutional Class | | | | | | | | | | | | | | | | |
| Sold | | | 22,206 | | | | 250,246 | | | | 11,253 | | | | 121,300 | |
| Issued in reinvestment of distributions | | | 903 | | | | 9,795 | | | | 9,047 | | | | 95,125 | |
| Redeemed | | | (8,229 | ) | | | (89,825 | ) | | | (1,751,597 | ) | | | (18,437,296 | ) |
| | | | 14,880 | | | | 170,216 | | | | (1,731,297 | ) | | | (18,220,871 | ) |
| A Class | | | | | | | | | | | | | | | | |
| Sold | | | 369,226 | | | | 4,034,930 | | | | 900,790 | | | | 9,699,547 | |
| Issued in reinvestment of distributions | | | 61,707 | | | | 672,977 | | | | 69,793 | | | | 755,696 | |
| Redeemed | | | (1,030,311 | ) | | | (11,024,657 | ) | | | (772,429 | ) | | | (8,367,857 | ) |
| | | | (599,378 | ) | | | (6,316,750 | ) | | | 198,154 | | | | 2,087,386 | |
| B Class | | | | | | | | | | | | | | | | |
| Sold | | | — | | | | — | | | | 1,035 | | | | 11,150 | |
| Issued in reinvestment of distributions | | | 1,164 | | | | 12,700 | | | | 1,871 | | | | 20,217 | |
| Redeemed | | | (22,188 | ) | | | (242,385 | ) | | | (31,186 | ) | | | (340,312 | ) |
| | | | (21,024 | ) | | | (229,685 | ) | | | (28,280 | ) | | | (308,945 | ) |
| C Class | | | | | | | | | | | | | | | | |
| Sold | | | 103,357 | | | | 1,131,162 | | | | 202,429 | | | | 2,174,348 | |
| Issued in reinvestment of distributions | | | 10,882 | | | | 118,397 | | | | 10,166 | | | | 110,117 | |
| Redeemed | | | (212,966 | ) | | | (2,272,245 | ) | | | (173,723 | ) | | | (1,883,152 | ) |
| | | | (98,727 | ) | | | (1,022,686 | ) | | | 38,872 | | | | 401,313 | |
| Net increase (decrease) | | | 577,647 | | | | $6,562,604 | | | | (972,697 | ) | | | $(10,048,893 | ) |
6. Fair Value Measurements
The fund’s securities valuation process is based on several considerations and may use multiple inputs to determine the fair value of the positions held by the fund. In conformity with accounting principles generally accepted in the United States of America, the inputs used to determine a valuation are classified into three broad levels as follows:
| • | Level 1 valuation inputs consist of unadjusted quoted prices in an active market for identical securities; |
| • | Level 2 valuation inputs consist of direct or indirect observable market data (including quoted prices for similar securities, evaluations of subsequent market events, interest rates, prepayment speeds, credit risk, etc.); or |
| • | Level 3 valuation inputs consist of unobservable data (including a fund’s own assumptions). |
The level classification is based on the lowest level input that is significant to the fair valuation measurement. The valuation inputs are not necessarily an indication of the risks associated with investing in these securities or other financial instruments.
As of period end, the fund’s investment securities and unrealized gain (loss) on futures contracts were classified as Level 2 and Level 1, respectively. The Schedule of Investments provides additional information on the fund’s portfolio holdings.
7. Derivative Instruments
Interest Rate Risk — The fund is subject to interest rate risk in the normal course of pursuing its investment objectives. The value of bonds generally declines as interest rates rise. A fund may enter into futures contracts based on a bond index or a specific underlying security. A fund may purchase futures contracts to gain exposure to increases in market value or sell futures contracts to protect against a decline in market value. Upon entering into a futures contract, a fund will segregate cash, cash equivalents or other appropriate liquid securities on its records in amounts sufficient to meet requirements. Subsequent payments (variation margin) are made or received daily, in cash, by a fund. The variation margin is equal to the daily change in the contract value and is recorded as unrealized gains and losses. A fund recognizes a realized gain or loss when the futures contract is closed or expires. Net realized and unrealized gains or losses occurring during the holding period of futures contracts are a component of net realized gain (loss) on futures contract transactions and change in net unrealized appreciation (depreciation) on futures contracts, respectively. One of the risks of entering into futures contracts is the possibility that the change in value of the contract may not correlate with the changes in value of the underlying securities. The interest rate risk derivative instruments held at period end as disclosed on the Schedule of Investments are indicative of the fund’s typical volume during the period.
The value of interest rate risk derivative instruments as of May 31, 2011, is disclosed on the Statement of Assets and Liabilities as an asset of $4,000 in receivable for variation margin on futures contracts and as a liability of $3,828 in payable for variation margin on futures contracts. For the year ended May 31, 2011, the effect of interest rate risk derivative instruments on the Statement of Operations was $(163,822) in net realized gain (loss) on futures contract transactions and $14,881 in change in net unrealized appreciation (depreciation) on futures contracts.
8. Federal Tax Information
The tax character of distributions paid during the years ended May 31, 2011 and May 31, 2010 were as follows:
| | | | | | | |
| | | 2011 | | 2010 |
| Distributions Paid From | | | | | | |
| Exempt income | | | $1,608,145 | | | | $1,436,015 | |
| Taxable ordinary income | | | $1,815 | | | | — | |
| Long-term capital gains | | | — | | | | — | |
The book-basis character of distributions made during the year from net investment income or net realized gains may differ from their ultimate characterization for federal income tax purposes. These differences reflect the differing character of certain income items and net realized gains and losses for financial statement and tax purposes, and may result in reclassification among certain capital accounts on the financial statements.
As of May 31, 2011, the federal tax cost of investments and the components of distributable earnings on a tax-basis were as follows:
| | | | | |
| Federal tax cost of investments | | | $41,413,365 | |
| Gross tax appreciation of investments | | | $2,111,340 | |
| Gross tax depreciation of investments | | | (223,531 | ) |
| Net tax appreciation (depreciation) of investments | | | $1,887,809 | |
| Other book-to-tax adjustments | | | $(69,581 | ) |
| Net tax appreciation (depreciation) | | | $1,818,228 | |
| Accumulated capital losses | | | $(1,275,771 | ) |
| Capital loss deferral | | | $(229,987 | ) |
The cost of investments for federal income tax purposes was the same as the cost for financial reporting purposes. The difference between book-basis and tax-basis unrealized appreciation (depreciation) is attributable primarily to the realization for tax purposes of unrealized gains (losses) on futures contracts. Other book-to-tax adjustments are attributable primarily to the tax deferral of losses on straddle positions.
The accumulated capital losses represent net capital loss carryovers that may be used to offset future realized capital gains for federal income tax purposes. Future capital loss carryover utilization in any given year may be subject to Internal Revenue Code limitations. Capital loss carryovers expire as follows:
| | | | | | | | |
| 2012 | 2013 | 2014 | 2015 | 2016 | 2017 | 2018 | 2019 |
| $(8,266) | $(142,310) | $(389,668) | — | $(415,549) | $(175,946) | $(72,593) | $(71,439) |
The capital loss deferral represents net capital losses incurred in the seven-month period ended May 31, 2011. The fund has elected to treat such losses as having been incurred in the following fiscal year for federal income tax purposes.
On December 22, 2010, the Regulated Investment Company Modernization Act of 2010 (the “Act”) was enacted, which changed various technical rules governing the tax treatment of regulated investment companies. The changes are generally effective for taxable years beginning after the date of enactment. Under the Act, the fund will be permitted to carry forward capital losses incurred in taxable years beginning after the date of enactment for an unlimited period. However, any losses incurred during those future taxable years will be required to be utilized prior to the losses incurred in pre-enactment taxable years, which carry an expiration date. As a result of this ordering rule, pre-enactment capital loss carryforwards may be more likely to expire unused.
| Investor Class | |
| For a Share Outstanding Throughout the Years Ended May 31 | |
| | | 2011 | | | 2010 | | | 2009 | | | 2008 | | | 2007 | |
| Per-Share Data | |
| Net Asset Value, Beginning of Period | | | $11.02 | | | | $10.60 | | | | $10.56 | | | | $10.78 | | | | $10.70 | |
| Income From Investment Operations | | | | | | | | | | | | | | | | | | | | |
| Net Investment Income (Loss) | | | 0.43 | (1) | | | 0.44 | (1) | | | 0.39 | | | | 0.43 | | | | 0.43 | |
| Net Realized and Unrealized Gain (Loss) | | | (0.13 | ) | | | 0.42 | | | | 0.04 | | | | (0.22 | ) | | | 0.08 | |
| Total From Investment Operations | | | 0.30 | | | | 0.86 | | | | 0.43 | | | | 0.21 | | | | 0.51 | |
| Distributions | | | | | | | | | | | | | | | | | | | | |
| From Net Investment Income | | | (0.43 | ) | | | (0.44 | ) | | | (0.39 | ) | | | (0.43 | ) | | | (0.43 | ) |
| Net Asset Value, End of Period | | | $10.89 | | | | $11.02 | | | | $10.60 | | | | $10.56 | | | | $10.78 | |
| | | | | | | | | | | | | | | | | | | | | |
Total Return(2) | | | 2.77 | % | | | 8.32 | % | | | 4.32 | % | | | 1.99 | % | | | 4.84 | % |
| | | | | | | | | | | | | | | | | | | | | |
| Ratios/Supplemental Data | |
Ratio of Operating Expenses to Average Net Assets | | | 0.48 | % | | | 0.48 | % | | | 0.49 | % | | | 0.49 | % | | | 0.49 | % |
Ratio of Net Investment Income (Loss) to Average Net Assets | | | 3.94 | % | | | 4.04 | % | | | 3.84 | % | | | 4.02 | % | | | 4.00 | % |
| Portfolio Turnover Rate | | | 23 | % | | | 50 | % | | | 40 | % | | | 257 | % | | | 101 | % |
| Net Assets, End of Period (in thousands) | | | $23,674 | | | | $9,824 | | | | 3,622 | | | | $1,071 | | | | $222 | |
| (1) | Computed using average shares outstanding throughout the period. |
| (2) | Total returns are calculated based on the net asset value of the last business day. Total returns for periods less than one year are not annualized. |
See Notes to Financial Statements.
| Institutional Class | |
| For a Share Outstanding Throughout the Years Ended May 31 | |
| | | 2011 | | | 2010 | | | 2009 | | | 2008 | | | 2007 | |
| Per-Share Data | |
| Net Asset Value, Beginning of Period | | | $11.02 | | | | $10.60 | | | | $10.56 | | | | $10.78 | | | | $10.70 | |
| Income From Investment Operations | | | | | | | | | | | | | | | | | | | | |
| Net Investment Income (Loss) | | | 0.45 | (1) | | | 0.45 | (1) | | | 0.42 | | | | 0.45 | | | | 0.45 | |
| Net Realized and Unrealized Gain (Loss) | | | (0.13 | ) | | | 0.44 | | | | 0.04 | | | | (0.22 | ) | | | 0.08 | |
| Total From Investment Operations | | | 0.32 | | | | 0.89 | | | | 0.46 | | | | 0.23 | | | | 0.53 | |
| Distributions | | | | | | | | | | | | | | | | | | | | |
| From Net Investment Income | | | (0.45 | ) | | | (0.47 | ) | | | (0.42 | ) | | | (0.45 | ) | | | (0.45 | ) |
| Net Asset Value, End of Period | | | $10.89 | | | | $11.02 | | | | $10.60 | | | | $10.56 | | | | $10.78 | |
| | | | | | | | | | | | | | | | | | | | | |
Total Return(2) | | | 2.97 | % | | | 8.53 | % | | | 4.53 | % | | | 2.19 | % | | | 5.05 | % |
| | | | | | | | | | | | | | | | | | | | | |
| Ratios/Supplemental Data | |
Ratio of Operating Expenses to Average Net Assets | | | 0.28 | % | | | 0.28 | % | | | 0.29 | % | | | 0.29 | % | | | 0.29 | % |
Ratio of Net Investment Income (Loss) to Average Net Assets | | | 4.14 | % | | | 4.24 | % | | | 4.04 | % | | | 4.22 | % | | | 4.20 | % |
| Portfolio Turnover Rate | | | 23 | % | | | 50 | % | | | 40 | % | | | 257 | % | | | 101 | % |
| Net Assets, End of Period (in thousands) | | | $279 | | | | $118 | | | | $18,460 | | | | $17,661 | | | | $17,285 | |
| (1) | Computed using average shares outstanding throughout the period. |
| (2) | Total returns are calculated based on the net asset value of the last business day. Total returns for periods less than one year are not annualized. |
See Notes to Financial Statements.
| A Class | |
| For a Share Outstanding Throughout the Years Ended May 31 | |
| | | 2011 | | | 2010 | | | 2009 | | | 2008 | | | 2007 | |
| Per-Share Data | |
| Net Asset Value, Beginning of Period | | | $11.02 | | | | $10.60 | | | | $10.56 | | | | $10.78 | | | | $10.70 | |
| Income From Investment Operations | | | | | | | | | | | | | | | | | | | | |
| Net Investment Income (Loss) | | | 0.40 | (1) | | | 0.41 | (1) | | | 0.37 | | | | 0.40 | | | | 0.41 | |
| Net Realized and Unrealized Gain (Loss) | | | (0.13 | ) | | | 0.43 | | | | 0.04 | | | | (0.22 | ) | | | 0.08 | |
| Total From Investment Operations | | | 0.27 | | | | 0.84 | | | | 0.41 | | | | 0.18 | | | | 0.49 | |
| Distributions | | | | | | | | | | | | | | | | | | | | |
| From Net Investment Income | | | (0.40 | ) | | | (0.42 | ) | | | (0.37 | ) | | | (0.40 | ) | | | (0.41 | ) |
| Net Asset Value, End of Period | | | $10.89 | | | | $11.02 | | | | $10.60 | | | | $10.56 | | | | $10.78 | |
| | | | | | | | | | | | | | | | | | | | | |
Total Return(2) | | | 2.52 | % | | | 8.05 | % | | | 4.06 | % | | | 1.73 | % | | | 4.58 | % |
| | | | | | | | | | | | | | | | | | | | | |
| Ratios/Supplemental Data | |
Ratio of Operating Expenses to Average Net Assets | | | 0.73 | % | | | 0.73 | % | | | 0.74 | % | | | 0.74 | % | | | 0.74 | % |
Ratio of Net Investment Income (Loss) to Average Net Assets | | | 3.69 | % | | | 3.79 | % | | | 3.59 | % | | | 3.77 | % | | | 3.75 | % |
| Portfolio Turnover Rate | | | 23 | % | | | 50 | % | | | 40 | % | | | 257 | % | | | 101 | % |
| Net Assets, End of Period (in thousands) | | | $16,820 | | | | $23,618 | | | | $20,619 | | | | $9,320 | | | | $12,233 | |
| (1) | Computed using average shares outstanding throughout the period. |
| (2) | Total returns are calculated based on the net asset value of the last business day and do not reflect applicable sales charges. Total returns for periods less than one year are not annualized. |
See Notes to Financial Statements.
| B Class | |
| For a Share Outstanding Throughout the Years Ended May 31 | |
| | | 2011 | | | 2010 | | | 2009 | | | 2008 | | | 2007 | |
| Per-Share Data | |
| Net Asset Value, Beginning of Period | | | $11.02 | | | | $10.60 | | | | $10.56 | | | | $10.78 | | | | $10.70 | |
| Income From Investment Operations | | | | | | | | | | | | | | | | | | | | |
| Net Investment Income (Loss) | | | 0.32 | (1) | | | 0.33 | (1) | | | 0.29 | | | | 0.32 | | | | 0.32 | |
| Net Realized and Unrealized Gain (Loss) | | | (0.13 | ) | | | 0.43 | | | | 0.04 | | | | (0.22 | ) | | | 0.08 | |
| Total From Investment Operations | | | 0.19 | | | | 0.76 | | | | 0.33 | | | | 0.10 | | | | 0.40 | |
| Distributions | | | | | | | | | | | | | | | | | | | | |
| From Net Investment Income | | | (0.32 | ) | | | (0.34 | ) | | | (0.29 | ) | | | (0.32 | ) | | | (0.32 | ) |
| Net Asset Value, End of Period | | | $10.89 | | | | $11.02 | | | | $10.60 | | | | $10.56 | | | | $10.78 | |
| | | | | | | | | | | | | | | | | | | | | |
Total Return(2) | | | 1.76 | % | | | 7.24 | % | | | 3.38 | % | | | 0.87 | % | | | 3.80 | % |
| | | | | | | | | | | | | | | | | | | | | |
| Ratios/Supplemental Data | |
Ratio of Operating Expenses to Average Net Assets | | | 1.48 | % | | | 1.48 | % | | | 1.49 | % | | | 1.49 | % | | | 1.49 | % |
Ratio of Net Investment Income (Loss) to Average Net Assets | | | 2.94 | % | | | 3.04 | | | | 2.84 | % | | | 3.02 | % | | | 3.00 | % |
| Portfolio Turnover Rate | | | 23 | % | | | 50 | % | | | 40 | % | | | 257 | % | | | 101 | % |
| Net Assets, End of Period (in thousands) | | | $357 | | | | $592 | | | | $869 | | | | $1,158 | | | | $1,416 | |
| (1) | Computed using average shares outstanding throughout the period. |
| (2) | Total returns are calculated based on the net asset value of the last business day and do not reflect applicable sales charges. Total returns for periods less than one year are not annualized. |
See Notes to Financial Statements.
| C Class | |
| For a Share Outstanding Throughout the Years Ended May 31 | |
| | | 2011 | | | 2010 | | | 2009 | | | 2008 | | | 2007 | |
| Per-Share Data | |
| Net Asset Value, Beginning of Period | | | $11.02 | | | | $10.60 | | | | $10.56 | | | | $10.78 | | | | $10.70 | |
| Income From Investment Operations | | | | | | | | | | | | | | | | | | | | |
| Net Investment Income (Loss) | | | 0.32 | (1) | | | 0.33 | (1) | | | 0.29 | | | | 0.32 | | | | 0.32 | |
| Net Realized and Unrealized Gain (Loss) | | | (0.13 | ) | | | 0.43 | | | | 0.04 | | | | (0.22 | ) | | | 0.08 | |
| Total From Investment Operations | | | 0.19 | | | | 0.76 | | | | 0.33 | | | | 0.10 | | | | 0.40 | |
| Distributions | | | | | | | | | | | | | | | | | | | | |
| From Net Investment Income | | | (0.32 | ) | | | (0.34 | ) | | | (0.29 | ) | | | (0.32 | ) | | | (0.32 | ) |
| Net Asset Value, End of Period | | | $10.89 | | | | $11.02 | | | | $10.60 | | | | $10.56 | | | | $10.78 | |
| | | | | | | | | | | | | | | | | | | | | |
Total Return(2) | | | 1.76 | % | | | 7.25 | % | | | 3.28 | % | | | 0.98 | % | | | 3.80 | % |
| | | | | | | | | | | | | | | | | | | | | |
| Ratios/Supplemental Data | |
Ratio of Operating Expenses to Average Net Assets | | | 1.48 | % | | | 1.48 | % | | | 1.49 | % | | | 1.49 | % | | | 1.49 | % |
Ratio of Net Investment Income (Loss) to Average Net Assets | | | 2.94 | % | | | 3.04 | % | | | 2.84 | % | | | 3.02 | % | | | 3.00 | % |
| Portfolio Turnover Rate | | | 23 | % | | | 50 | % | | | 40 | % | | | 257 | % | | | 101 | % |
| Net Assets, End of Period (in thousands) | | | $3,201 | | | | $4,325 | | | | $3,749 | | | | $1,152 | | | | $41 | |
| (1) | Computed using average shares outstanding throughout the period. |
| (2) | Total returns are calculated based on the net asset value of the last business day and do not reflect applicable sales charges. Total returns for periods less than one year are not annualized. |
See Notes to Financial Statements.
Report of Independent Registered Public Accounting Firm |
To the Trustees of the American Century Municipal Trust
and Shareholders of the Long-Term Tax-Free Fund:
In our opinion, the accompanying statement of assets and liabilities, including the schedule of investments, and the related statements of operations and of changes in net assets and the financial highlights present fairly, in all material respects, the financial position of the Long-Term Tax-Free Fund (one of the five funds comprising the American Century Municipal Trust, hereafter referred to as the “Fund”) at May 31, 2011, the results of its operations for the year then ended, the changes in its net assets for each of the two years in the period then ended and the financial highlights for each of the five years in the period then ended, in conformity with accounting principles generally accepted in the United States of America. These financial statements and financial highlights (hereafter referred to as “financial statements”) are the responsibility of the Fund’s management; our responsibility is to express an opinion on these financial statements based on our audits. We conducted our audits of these financial statements in accordance with the standards of the Public Company Accounting Oversight Board (United States). Those standards require that we plan and perform the audit to obtain reasonable assurance about whether the financial statements are free of material misstatement. An audit includes examining, on a test basis, evidence supporting the amounts and disclosures in the financial statements, assessing the accounting principles used and significant estimates made by management, and evaluating the overall financial statement presentation. We believe that our audits, which included confirmation of securities at May 31, 2011 by correspondence with the custodian and brokers, provide a reasonable basis for our opinion.
PricewaterhouseCoopers LLP
Kansas City, Missouri
July 22, 2011
A special meeting of shareholders was held on June 16, 2010, to vote on the following proposals. Each proposal received the required number of votes and was adopted. A summary of voting results is listed below each proposal.
Proposal 1:
To elect one Trustee to the Board of Trustees of American Century Municipal Trust (the proposal was voted on by all shareholders of funds issued by
American Century Municipal Trust):
| | | |
| Frederick L.A. Grauer | For: | 1,732,355,276 |
| | Withhold: | 67,363,643 |
| | Abstain: | 0 |
| | Broker Non-Vote: | 0 |
The other trustees whose term of office continued after the meeting include Jonathan S. Thomas, John Freidenrich, Ronald J. Gilson, Peter F. Pervere, Myron S. Scholes, and John B. Shoven.
Proposal 2:
To approve a management agreement between the fund and American Century Investment Management, Inc.:
| | | |
| Investor, A, B and C Classes | For: | 20,804,091 |
| | Against: | 344,834 |
| | Abstain: | 407,593 |
| | Broker Non-Vote: | 13,106,456 |
| | | |
| Institutional Class | For: | 93,402 |
| | Against: | 0 |
| | Abstain: | 0 |
| | Broker Non-Vote: | 0 |
The individuals listed below serve as trustees of the funds. Each trustee will continue to serve in this capacity until death, retirement, resignation or removal from office. The mandatory retirement age for trustees who are not “interested persons,” as that term is defined in the Investment Company Act (independent trustees), is 73. However, the mandatory retirement age may be extended for a period not to exceed two years with the approval of the remaining independent trustees.
Mr. Thomas is the only trustee who is an “interested person” because he currently serves as President and Chief Executive Officer of American Century Companies, Inc. (ACC), the parent company of American Century Investment Management, Inc. (ACIM or the advisor).
The other trustees (more than three-fourths of the total number) are independent; that is, they have never been employees, directors or officers of, and have no financial interest in, ACC or any of its wholly owned, direct or indirect, subsidiaries, including ACIM, American Century Investment Services, Inc. (ACIS) and American Century Services, LLC (ACS). The trustees serve in this capacity for eight (in the case of Mr. Thomas, 15) registered investment companies in the American Century Investments family of funds.
The following presents additional information about the trustees. The mailing address for each trustee other than Mr. Thomas is 1665 Charleston Road, Mountain View, California 94043. The mailing address for Mr. Thomas is 4500 Main Street, Kansas City, Missouri 64111.
| | | | | | |
Name (Year of Birth) | Position(s) Held with Funds | Length of Time Served | Principal Occupation(s) During Past 5 Years | Number of American Century Portfolios Overseen by Trustee | Other Directorships Held During Past 5 Years |
| Independent Trustees |
Tanya S. Beder (1955) | Trustee | Since 2011 | Chairman, SBCC Group Inc. (investment advisory services)(2006 to present); Fellow in Practice, International Center for Finance, Yale University School of Management (1985 to present); Chief Executive Officer, Tribeca Global Management LLC (asset management firm) (2004 to 2006) | 40 | None |
Jeremy I. Bulow (1954) | Trustee | Since 2011 | Professor of Economics, Stanford University, Graduate School of Business (1979 to present) | 40 | None |
John Freidenrich (1937) | Trustee | Since 2005 | Founder, Member and Manager, Regis Management Company, LLC (investment management firm) (April 2004 to present) | 40 | None |
| | | | | | |
Name (Year of Birth) | Position(s) Held with Funds | Length of Time Served | Principal Occupation(s) During Past 5 Years | Number of American Century Portfolios Overseen by Trustee | Other Directorships Held During Past 5 Years |
| Independent Trustees |
Ronald J. Gilson (1946) | Trustee and Chairman of the Board | Since 1995 | Charles J. Meyers Professor of Law and Business, Stanford Law School (1979 to present); Marc and Eva Stern Professor of Law and Business, Columbia University School of Law (1992 to present) | 40 | None |
Frederick L. A. Grauer (1946) | Trustee | Since 2008 | Senior Advisor, BlackRock, Inc. (investment management firm) (2010 to 2011); Senior Advisor, Barclays Global Investors (investment management firm) (2003 to 2009) | 40 | None |
Peter F. Pervere (1947) | Trustee | Since 2007 | Retired | 40 | Intraware, Inc. (2003 to 2009) |
Myron S. Scholes (1941) | Trustee | Since 1980 | Chairman, Platinum Grove Asset Management, L.P. (asset manager) (1999 to 2009); Frank E. Buck Professor of Finance-Emeritus, Stanford Graduate School of Business (1996 to present) | 40 | Dimensional Fund Advisors (investment advisor); CME Group, Inc. (futures and options exchange) |
John B. Shoven (1947) | Trustee | Since 2002 | Professor of Economics, Stanford University (1973 to present) | 40 | Cadence Design Systems; Exponent; Financial Engines; Watson Wyatt Worldwide (2002 to 2006) |
| |
| Interested Trustee |
Jonathan S. Thomas (1963) | Trustee and President | Since 2007 | President and Chief Executive Officer, ACC (March 2007 to present); Chief Administrative Officer, ACC (February 2006 to February 2007); Executive Vice President, ACC (November 2005 to February 2007). Also serves as: Chief Executive Officer and Manager, ACS; Executive Vice President, ACIM; Director, ACC, ACIM and other ACC subsidiaries | 104 | None |
Officers
The following table presents certain information about the executive officers of the funds. Each officer serves as an officer for each of the 15 investment companies in the American Century family of funds, unless otherwise noted. No officer is compensated for his or her service as an officer of the funds. The listed officers are interested persons of the funds and are appointed or re-appointed on an annual basis. The mailing address for each of the officers listed below is 4500 Main Street, Kansas City, Missouri 64111.
| | | |
Name (Year of Birth) | Offices with the Funds | Principal Occupation(s) During the Past Five Years |
Jonathan S. Thomas (1963) | Trustee and President since 2007 | President and Chief Executive Officer, ACC (March 2007 to present); Chief Administrative Officer, ACC (February 2006 to February 2007); Executive Vice President, ACC (November 2005 to February 2007). Also serves as: Chief Executive Officer and Manager, ACS; Executive Vice President, ACIM; Director, ACC, ACIM and other ACC subsidiaries |
Barry Fink (1955) | Executive Vice President since 2007 | Chief Operating Officer and Executive Vice President, ACC (September 2007 to present); President, ACS (October 2007 to present); Managing Director, Morgan Stanley (2000 to 2007); Global General Counsel, Morgan Stanley (2000 to 2006). Also serves as: Manager, ACS and Director, ACC and certain ACC subsidiaries |
Maryanne L. Roepke (1956) | Chief Compliance Officer since 2006 and Senior Vice President since 2000 | Chief Compliance Officer, American Century funds, ACIM and ACS (August 2006 to present); Assistant Treasurer, ACC (January 1995 to August 2006); and Treasurer and Chief Financial Officer, various American Century funds (July 2000 to August 2006). Also serves as: Senior Vice President, ACS |
Charles A. Etherington (1957) | General Counsel since 2007 and Senior Vice President since 2006 | Attorney, ACC (February 1994 to present); Vice President, ACC (November 2005 to present), General Counsel, ACC (March 2007 to present); Also serves as General Counsel, ACIM, ACS, ACIS and other ACC subsidiaries; and Senior Vice President, ACIM and ACS |
Robert J. Leach (1966) | Vice President, Treasurer and Chief Financial Officer since 2006 | Vice President, ACS (February 2000 to present); and Controller, various American Century funds (1997 to September 2006) |
David H. Reinmiller (1963) | Vice President since 2001 | Attorney, ACC (January 1994 to present); Associate General Counsel, ACC (January 2001 to present); Also serves as Vice President, ACIM and ACS |
Ward D. Stauffer (1960) | Secretary since 2005 | Attorney, ACC (June 2003 to Present) |
The Statement of Additional Information has additional information about the fund’s trustees and is available without charge, upon request, by calling 1-800-345-2021.
Proxy Voting Guidelines
American Century Investment Management, Inc., the fund’s investment advisor, is responsible for exercising the voting rights associated with the securities purchased and/or held by the fund. A description of the policies and procedures the advisor uses in fulfilling this responsibility is available without charge, upon request, by calling 1-800-345-2021. It is also available on American Century Investments’ website at americancentury.com and on the Securities and Exchange Commission’s website at sec.gov. Information regarding how the investment advisor voted proxies relating to portfolio securities during the most recent 12-month period ended June 30 is available on the “About Us” page at americancentury.com. It is also available at sec.gov.
Quarterly Portfolio Disclosure
The fund files its complete schedule of portfolio holdings with the Securities and Exchange Commission (SEC) for the first and third quarters of each fiscal year on Form N-Q. The fund’s Forms N-Q are available on the SEC’s website at sec.gov, and may be reviewed and copied at the SEC’s Public Reference Room in Washington, DC. Information on the operation of the Public Reference Room may be obtained by calling 1-800-SEC-0330. The fund also makes its complete schedule of portfolio holdings for the most recent quarter of its fiscal year available on its website at americancentury.com and, upon request, by calling 1-800-345-2021.
Other Tax Information
The following information is provided pursuant to provisions of the Internal Revenue Code.
The fund designates $1,603,008 as exempt interest dividends for the fiscal year ended May 31, 2011.
| Contact Us | americancentury.com |
| Automated Information Line | 1-800-345-8765 |
| Investor Services Representative | 1-800-345-2021 or 816-531-5575 |
| Investors Using Advisors | 1-800-378-9878 |
| Business, Not-For-Profit, Employer-Sponsored Retirement Plans | 1-800-345-3533 |
| Banks and Trust Companies, Broker-Dealers, Financial Professionals, Insurance Companies | 1-800-345-6488 |
| Telecommunications Device for the Deaf | 1-800-634-4113 |
American Century Municipal Trust
Investment Advisor:
American Century Investment Management, Inc.
Kansas City, Missouri
This report and the statements it contains are submitted for the general information of our shareholders. The report is not authorized for distribution to prospective investors unless preceded or accompanied by an effective prospectus.
©2011 American Century Proprietary Holdings, Inc. All rights reserved.
CL-ANN-72032 1107
ANNUAL REPORT MAY 31, 2011
| President’s Letter | 2 |
| Market Perspective | 3 |
| Performance | 4 |
| Portfolio Commentary | 6 |
| Fund Characteristics | 8 |
| Shareholder Fee Example | 9 |
| Schedule of Investments | 11 |
| Statement of Assets and Liabilities | 17 |
| Statement of Operations | 18 |
| Statement of Changes in Net Assets | 19 |
| Notes to Financial Statements | 20 |
| Financial Highlights | 26 |
| Report of Independent Registered Public Accounting Firm | 30 |
| Proxy Voting Results | 31 |
| Management | 32 |
| Additional Information | 35 |
Any opinions expressed in this report reflect those of the author as of the date of the report, and do not necessarily represent the opinions of American Century Investments® or any other person in the American Century Investments organization. Any such opinions are subject to change at any time based upon market or other conditions and American Century Investments disclaims any responsibility to update such opinions. These opinions may not be relied upon as investment advice and, because investment decisions made by American Century Investments funds are based on numerous factors, may not be relied upon as an indication of trading intent on behalf of any American Century Investments fund. Security examples are used for representational purposes only and are not intended as recommendations to purchase or sell securities. Performance information for comparative indices and securities is provided to American Century Investments by third party vendors. To the best of American Century Investments’ knowledge, such information is accurate at the time of printing.
Jonathan Thomas
Dear Investor:
Thank you for reviewing this annual report for the period ended May 31, 2011. Our report offers investment performance and portfolio information, presented with the expert perspective and commentary of our portfolio management team.
This report remains one of our most important vehicles for conveying the information you need about your investment performance, and about the market factors and strategies that affect fund returns. For additional, updated information on fund performance, portfolio strategy, and the investment markets, we encourage you to visit our website, americancentury.com. Click on the “Fund Performance” and “Insights & News” headings at the top of our Individual Investors site.
Municipal Bond (Muni) Market Update
As described in greater detail on the following pages, muni market conditions have improved significantly since our semiannual report for the six months ended November 30, 2010. That reporting period concluded during a two-and-a-half month span (from the end of October 2010 to the middle of January 2011) when muni prices plunged and yields soared as a supply and demand imbalance (explained on page 3) roiled the market. That turbulence was compounded by overblown default fears fueled by highly publicized pessimistic analyst reports that helped trigger a wave of withdrawals from muni mutual funds.
As 2011 unfolded, muni issuance declined dramatically and demand surged—falling prices and relatively high yields attracted an influx of opportunistic “cross-over” (non-typical) buyers to the muni market. Munis rallied from mid-January through the end of the full 12-month reporting period, rewarding those who stayed the course and saw the turbulence as a buying opportunity. Muni defaults have not approached the rates projected by pessimistic pundits at the end of last year, and additional economic growth—as well as increased municipal government austerity and budget-balancing measures—have helped stabilize municipal credit conditions since then.
These developments over the more-recent six months are incorporated in the broader, enclosed 12-month Market Perspective and Portfolio Commentary from our muni portfolio management team. These dedicated experts will continue to diligently apply their knowledge and skills as they make daily investment decisions for you.
Sincerely,
Jonathan Thomas
President and Chief Executive Officer
American Century Investments
By David MacEwen, Chief Investment Officer, Fixed Income
Municipal bond (muni) indices advanced for the 12 months ended May 31, 2011 (see the table below), but these moderately positive returns masked considerable volatility, particularly during the last seven months of the period.
Munis rallied modestly through the first five months of the period as U.S. economic conditions generally improved, providing a lift to munis and other credit-sensitive instruments. But market conditions changed dramatically from November 2010 through January 2011 as a supply and demand imbalance triggered a sharp decline in the muni market. Supply rose substantially as muni issuers rushed to take advantage of the Build America Bonds (BABs) program (in which states and municipalities issue taxable securities with federally subsidized interest rates) before its expiration at the end of 2010. Meanwhile, demand cratered as credit concerns—sparked by persistent state budget deficits and exaggerated media predictions of widespread muni defaults—led to heavy outflows from muni mutual funds.
The muni market bottomed in mid-January and then rebounded during the remainder of the period as a number of opportunistic, non-traditional “cross-over” investors gravitated to relatively attractive muni yields. Limited new issuance also contributed favorably to muni market performance—new muni issuance in the first five months of 2011 fell by 51% compared with the same period in 2010, constrained by issuer austerity measures and the expiration of the BABs program, which accelerated into 2010 many new issues that would otherwise have come to market in early 2011.
However, the severe decline from November through January dropped munis to the lower end of the investment return spectrum in a 12-month period dominated by stocks and high-yield corporate bonds. In addition, munis generally trailed the returns of Treasury securities and the broad taxable bond market. Intermediate-term munis fared best as short-term munis were held in check by a stable interest rate policy from the Federal Reserve, while longer-term munis suffered disproportionately from muni fund outflows. From a credit and sector perspective, higher-quality munis outperformed lower-rated credits, while general obligation bonds outpaced tax revenue bonds. Within the revenue bond segment, essential services bonds posted the best results, while health care lagged.
| U.S. Fixed-Income Total Returns |
| For the 12 months ended May 31, 2011 |
| Barclays Capital Municipal Market Indices | | Barclays Capital U.S. Taxable Market Indices |
| 7 Year Municipal Bond | 5.22% | | Aggregate Bond | 5.84% |
| Municipal High Yield Bond | 4.04% | | Treasury Bond | 4.49% |
| Municipal Bond | 3.18% | | | |
| Long-Term Municipal Bond | 1.49% | | |
| Total Returns as of May 31, 2011 |
| | | | Average Annual Returns | |
| | Ticker Symbol | 1 year | Since Inception | Inception Date |
Investor Class(1) | ANYIX | 2.66% | 6.75% | 6/30/09 |
Barclays Capital Municipal Bond Index | — | 3.18% | 6.60% | — |
Institutional Class(1) | ANYOX | 2.95% | 4.03% | 3/1/10 |
A Class(1) No sales charge* With sales charge* | ANYAX | 2.40% -2.18% | 6.49% 3.97% | 6/30/09 |
C Class(1) | ANTCX | 1.64% | 5.70% | 6/30/09 |
| * | Sales charges include initial sales charges and contingent deferred sales charges (CDSCs), as applicable. A Class shares have a 4.50% maximum initial sales charge and may be subject to a maximum CDSC of 1.00%. C Class shares redeemed within 12 months of purchase are subject to a maximum CDSC of 1.00%. The SEC requires that mutual funds provide performance information net of maximum sales charges in all cases where charges could be applied. |
| (1) | Returns would have been lower if a portion of the management fee had not been waived. |
Data presented reflect past performance. Past performance is no guarantee of future results. Current performance may be higher or lower than the performance shown. Investment return and principal value will fluctuate, and redemption value may be more or less than original cost. To obtain performance data current to the most recent month end, please call 1-800-345-2021 or visit americancentury.com. As interest rates rise, bond values will decline. The fund concentrates its investments in a single state and therefore may have more exposure to credit risk related to the state of New York than a fund with a broader geographical diversification. Investment income may be subject to certain state and local taxes and, depending on your tax status, the federal alternative minimum tax (AMT). Capital gains are not exempt from state and federal income tax.
Unless otherwise indicated, performance reflects Investor Class shares; performance for other share classes will vary due to differences in fee structure. For information about other share classes available, please consult the prospectus. Data assumes reinvestment of dividends and capital gains, and none of the charts reflect the deduction of taxes that a shareholder would pay on fund distributions or the redemption of fund shares. Returns for the index are provided for comparison. The fund’s total returns include operating expenses (such as transaction costs and management fees) that reduce returns, while the total returns of the index do not.
| Growth of $10,000 Over Life of Class |
| $10,000 investment made June 30, 2009 |
��
| * | From 6/30/09, the Investor Class’s inception date. Not annualized. |
| ** | Ending value would have been lower if a portion of the management fee had not been waived. |
| Total Annual Fund Operating Expenses |
| Investor Class | Institutional Class | A Class | C Class |
| 0.64% | 0.44% | 0.89% | 1.64% |
The total annual fund operating expenses shown is as stated in the fund’s prospectus current as of the date of this report. The prospectus may vary from the expense ratio shown elsewhere in this report because it is based on a different time period, includes acquired fund fees and expenses, and, if applicable, does not include fee waivers or expense reimbursements.
Data presented reflect past performance. Past performance is no guarantee of future results. Current performance may be higher or lower than the performance shown. Investment return and principal value will fluctuate, and redemption value may be more or less than original cost. To obtain performance data current to the most recent month end, please call 1-800-345-2021 or visit americancentury.com. As interest rates rise, bond values will decline. The fund concentrates its investments in a single state and therefore may have more exposure to credit risk related to the state of New York than a fund with a broader geographical diversification. Investment income may be subject to certain state and local taxes and, depending on your tax status, the federal alternative minimum tax (AMT). Capital gains are not exempt from state and federal income tax.
Unless otherwise indicated, performance reflects Investor Class shares; performance for other share classes will vary due to differences in fee structure. For information about other share classes available, please consult the prospectus. Data assumes reinvestment of dividends and capital gains, and none of the charts reflect the deduction of taxes that a shareholder would pay on fund distributions or the redemption of fund shares. Returns for the index are provided for comparison. The fund’s total returns include operating expenses (such as transaction costs and management fees) that reduce returns, while the total returns of the index do not.
Portfolio Managers: Joseph Gotelli, Alan Kruss, and Steven Permut
Performance Summary
New York Tax-Free returned 2.66%* for the fiscal year ended May 31, 2011. By comparison, the Barclays Capital Municipal Bond Index returned 3.18%, while the average return of the New York municipal debt funds tracked by Lipper Inc. was 1.44%.** (See page 4 and footnotes below for additional performance comparisons.)
The fund’s absolute return for the reporting period reflected the generally positive performance of municipal bond (muni) indices (see page 3). The fund’s performance trailed the return of the broad Barclays Capital Municipal Bond Index, however, as New York munis lagged the broader municipal market, but the fund comfortably outpaced its Lipper peer group average.
Credit Environment
The improving economic environment over the past year led to gradual improvements in state and local tax receipts. In the first three months of 2011, state tax revenues were up more than 9% from the same period in 2010. Nonetheless, many state and local governments continue to wrestle with daunting budget deficits—holdovers from the Great Recession that have been exacerbated by lingering weakness in the labor and housing markets, as well as increasing pension and health care funding pressures. We saw credit rating downgrades across the spectrum of muni issuers, but despite dire warnings of widespread defaults, the few actual defaults were confined to smaller issuers, and the muni default rate remained at a fraction of the corporate bond default rate.
In New York, Governor Andrew Cuomo and the state legislature passed a budget for the 2012 fiscal year (which began on April 1) ahead of schedule for the first time since 1983. The balanced budget erased a $10 billion deficit through consolidation, spending caps, and cuts to education and health care. New York has solid credit ratings and a better pension situation than many other states, and it has been one of the more active states in issuing new bonds so far in 2011.
Portfolio Positioning
The fund’s outperformance of its peer group average was driven in part by a greater emphasis on higher-quality securities, reflecting our policy of taking measured credit risk. This approach paid off during the reporting period as higher-rated securities outperformed, especially during the market volatility in late 2010 and early 2011.
| * | All fund returns referenced in this commentary are for Investor Class shares. Returns would have been lower if a portion of the management fee had not been waived. |
| ** | The average return for Lipper New York Municipal Debt Funds category was 6.60% since the fund’s inception on June 30, 2009. Data provided by Lipper Inc. — A Reuters Company. © 2011 Reuters. All rights reserved. Any copying, republication or redistribution of Lipper content, including by caching, framing or similar means, is expressly prohibited without the prior written consent of Lipper. Lipper shall not be liable for any errors or delays in the content, or for any actions taken in reliance thereon. Lipper fund performance data is total return, and is preliminary and subject to revision. The data contained herein has been obtained from company reports, financial reporting services, periodicals and other resources believed to be reliable. Although carefully verified, data on compilations is not guaranteed by Lipper and may be incomplete. No offer or solicitations to buy or sell any of the securities herein is being made by Lipper. |
For much of the period, we limited the fund’s exposure to general obligation (GO) and local tax revenue bonds, given their budgetary challenges and the market’s response to them. However, non-traditional cross-over buyers that were drawn to the muni market in early 2011 flocked to large, liquid securities, including state GO bonds. As a result, our underweight position in GOs detracted from results. On the positive side, the fund benefited from individual security selection among GOs, with an emphasis on New York City GOs.
From a sector perspective, we focused on less economically sensitive sectors of the muni market. In particular, we emphasized essential services revenue bonds, which typically finance services such as water, sewer, and other utilities. Essential services bonds tend to be higher-quality securities, so they attracted demand from cross-over investors, which helped essential services bonds outperform for the 12 months.
We took most of our credit risk in the health care and higher education sectors, where we can use our fundamental credit research capabilities to find undervalued securities. However, the unusual supply and demand dynamics during the reporting period worked against these segments of the muni market, so our overweight positions detracted from performance.
The fund also held a modest position in munis issued by U.S. territories such as Guam and Puerto Rico. These securities have the same state and federal tax exemptions as New York munis, and we use them to add yield to the portfolio.
Since late 2009, the fund has been positioned for a flatter Treasury yield curve (a narrower gap between short- and long-term Treasury yields). However, this positioning weighed on performance over the past year as the Treasury yield curve grew steeper, and it remains near historically wide levels. We are confident that this positioning will pay off over time as the Treasury curve eventually reverts to more normal levels.
Outlook
As we look to the second half of 2011, we believe that the supply and demand imbalances that have impacted the muni market over the last seven months will gradually abate, and fundamental credit stories will have a greater impact on muni performance going forward. We also believe that muni defaults will remain well below the levels predicted by some analysts at the end of last year.
As a result, we intend to maintain our current positioning, with an overweight position in high-quality essential services bonds, and selective investments in lower-rated health care and higher-education bonds. The fund remains underweight in GOs.
| MAY 31, 2011 | |
| Portfolio at a Glance | |
| Weighted Average Maturity | 14.3 years |
| Average Duration (Modified) | 5.8 years |
| | |
30-Day SEC Yields(1) | |
| Investor Class | 2.93% |
| Institutional Class | 3.13% |
| A Class | 2.56% |
| C Class | 1.94% |
Investor Class 30-Day Tax-Equivalent Yields(1)(2) | |
| 30.14% Tax Bracket | 4.19% |
| 32.93% Tax Bracket | 4.37% |
| 38.26% Tax Bracket | 4.75% |
| 40.83% Tax Bracket | 4.95% |
(1)Yields would have been lower if a portion of the management fee had not been waived. (2)The tax brackets indicated are for combined state and federal income tax. Actual tax-equivalent yields may be lower, if alternative minimum tax is applicable. |
| | |
| Top Five Sectors | % of fund investments |
| Transportation Revenue | 20% |
| General Obligation (GO) | 15% |
| Water/Sewer/Gas Revenue | 13% |
| Special Tax Revenue/Severance Tax | 10% |
| Hospital Revenue | 7% |
| | |
| Types of Investments in Portfolio | % of net assets |
| Municipal Securities | 99.8% |
| Other Assets and Liabilities | 0.2% |
Fund shareholders may incur two types of costs: (1) transaction costs, including sales charges (loads) on purchase payments and redemption/exchange fees; and (2) ongoing costs, including management fees; distribution and service (12b-1) fees; and other fund expenses. This example is intended to help you understand your ongoing costs (in dollars) of investing in your fund and to compare these costs with the ongoing cost of investing in other mutual funds.
The example is based on an investment of $1,000 made at the beginning of the period and held for the entire period from December 1, 2010 to May 31, 2011.
Actual Expenses
The table provides information about actual account values and actual expenses for each class. You may use the information, together with the amount you invested, to estimate the expenses that you paid over the period. First, identify the share class you own. Then simply divide your account value by $1,000 (for example, an $8,600 account value divided by $1,000 = 8.6), then multiply the result by the number under the heading “Expenses Paid During Period” to estimate the expenses you paid on your account during this period.
If you hold Investor Class shares of any American Century Investments fund, or Institutional Class shares of the American Century Diversified Bond Fund, in an American Century Investments account (i.e., not a financial intermediary or retirement plan account), American Century Investments may charge you a $12.50 semiannual account maintenance fee if the value of those shares is less than $10,000. We will redeem shares automatically in one of your accounts to pay the $12.50 fee. In determining your total eligible investment amount, we will include your investments in all personal accounts (including American Century Investments Brokerage accounts) registered under your Social Security number. Personal accounts include individual accounts, joint accounts, UGMA/UTMA accounts, personal trusts, Coverdell Education Savings Accounts and IRAs (including traditional, Roth, Rollover, SEP-, SARSEP- and SIMPLE-IRAs), and certain other retirement accounts. If you have only business, business retirement, employer-sponsored or American Century Investments Brokerage accounts, you are currently not subject to this fee. We will not charge the fee as long as you choose to manage your accounts exclusively online. If you are subject to the Account Maintenance Fee, your account value could be reduced by the fee amount.
Hypothetical Example for Comparison Purposes
The table also provides information about hypothetical account values and hypothetical expenses based on the actual expense ratio of each class of your fund and an assumed rate of return of 5% per year before expenses, which is not the actual return of a fund’s share class. The hypothetical account values and expenses may not be used to estimate the actual ending account balance or expenses you paid for the period. You may use this information to compare the ongoing costs of investing in your fund and other funds. To do so, compare this 5% hypothetical example with the 5% hypothetical examples that appear in the shareholder reports of the other funds.
Please note that the expenses shown in the table are meant to highlight your ongoing costs only and do not reflect any transactional costs, such as sales charges (loads) or redemption/exchange fees. Therefore, the table is useful in comparing ongoing costs only, and will not help you determine the relative total costs of owning different funds. In addition, if these transactional costs were included, your costs would have been higher.
| | | | | | | | | | | | | |
| | | Beginning Account Value 12/1/10 | | Ending Account Value 5/31/11 | | Expenses Paid During Period(1) 12/1/10 – 5/31/11 | | Annualized Expense Ratio(1) |
| Actual | | | | | | | | | | | | |
| Investor Class (after waiver) | | | $1,000 | | | | $1,020.80 | | | | $2.87 | | | | 0.57 | % |
| Investor Class (before waiver) | | | $1,000 | | | | $1,020.80 | (2) | | | $3.22 | | | | 0.64 | % |
| Institutional Class (after waiver) | | | $1,000 | | | | $1,021.80 | | | | $1.87 | | | | 0.37 | % |
| Institutional Class (before waiver) | | | $1,000 | | | | $1,021.80 | (2) | | | $2.22 | | | | 0.44 | % |
| A Class (after waiver) | | | $1,000 | | | | $1,019.60 | | | | $4.13 | | | | 0.82 | % |
| A Class (before waiver) | | | $1,000 | | | | $1,019.60 | (2) | | | $4.48 | | | | 0.89 | % |
| C Class (after waiver) | | | $1,000 | | | | $1,015.80 | | | | $7.89 | | | | 1.57 | % |
| C Class (before waiver) | | | $1,000 | | | | $1,015.80 | (2) | | | $8.24 | | | | 1.64 | % |
| Hypothetical | | | | | | | | | | | | | | | | |
| Investor Class (after waiver) | | | $1,000 | | | | $1,022.09 | | | | $2.87 | | | | 0.57 | % |
| Investor Class (before waiver) | | | $1,000 | | | | $1,021.74 | | | | $3.23 | | | | 0.64 | % |
| Institutional Class (after waiver) | | | $1,000 | | | | $1,023.09 | | | | $1.87 | | | | 0.37 | % |
| Institutional Class (before waiver) | | | $1,000 | | | | $1,022.74 | | | | $2.22 | | | | 0.44 | % |
| A Class (after waiver) | | | $1,000 | | | | $1,020.84 | | | | $4.13 | | | | 0.82 | % |
| A Class (before waiver) | | | $1,000 | | | | $1,020.49 | | | | $4.48 | | | | 0.89 | % |
| C Class (after waiver) | | | $1,000 | | | | $1,017.10 | | | | $7.90 | | | | 1.57 | % |
| C Class (before waiver) | | | $1,000 | | | | $1,016.75 | | | | $8.25 | | | | 1.64 | % |
| (1) | Expenses are equal to the class’s annualized expense ratio listed in the table above, multiplied by the average account value over the period, multiplied by 182, the number of days in the most recent fiscal half-year, divided by 365, to reflect the one-half year period. |
| (2) | Ending account value assumes the return earned after waiver and would have been lower if a portion of the management fee had not been waived. |
| | | | | | | |
| | | Principal Amount | | | Value | |
| Municipal Securities — 99.8% | |
| GUAM — 0.9% | |
Guam Government GO, Series 2009 A, 7.00%, 11/15/39(1) | | | $50,000 | | | | $51,611 | |
| Guam Power Auth. Rev., Series 2010 A, 5.50%, 10/1/40 | | | 200,000 | | | | 185,998 | |
| | | | | | | | 237,609 | |
| NEW YORK — 97.1% | |
Albany County Airport Auth. Rev., Series 2010 A, 5.00%, 12/15/20 (AGM)(1) | | | 200,000 | | | | 222,110 | |
Brooklyn Arena Local Development Corp. Rev., (Barclays Center), 6.25%, 7/15/40(1) | | | 250,000 | | | | 251,550 | |
Buffalo & Erie County Industrial Land Development Corp. Rev., Series 2011 A, (Buffalo St. College Foundation Housing), 5.375%, 10/1/41(2) | | | 250,000 | | | | 248,498 | |
| Erie County Fiscal Stability Auth. Rev., Series 2010 B, (Sales Tax and State Aid Secured Bond), 5.00%, 7/1/17 | | | 300,000 | | | | 349,641 | |
Erie County Tobacco Asset Securitization Corp. Rev., Series 2005 A, 5.00%, 6/1/38(1) | | | 130,000 | | | | 92,030 | |
Erie County Water Auth. Rev., 5.00%, 12/1/18(1) | | | 300,000 | | | | 351,921 | |
Hudson Yards Infrastructure Corp. Rev., Series 2006 A, 5.00%, 2/15/47(1) | | | 300,000 | | | | 269,424 | |
| Long Island Power Auth. Electric System Rev., Series 1998-2B, VRDN, 0.15%, 6/1/11 (LOC: Bayerische Landesbank) | | | 200,000 | | | | 200,000 | |
Long Island Power Auth. Electric System Rev., Series 2003 B, 5.25%, 6/1/13(1) | | | 145,000 | | | | 157,466 | |
| Long Island Power Auth. Electric System Rev., Series 2003 C, 5.25%, 9/1/29 (CIFG) | | | 335,000 | | | | 361,023 | |
Long Island Power Auth. Electric System Rev., Series 2006 F, 5.00%, 5/1/17 (NATL)(1) | | | 100,000 | | | | 114,652 | |
Long Island Power Auth. Electric System Rev., Series 2008 A, 6.00%, 5/1/33(1) | | | 385,000 | | | | 422,953 | |
Metropolitan Transportation Auth. Dedicated Tax Fund Rev., Series 2009 B, 5.00%, 11/15/34(1) | | | 225,000 | | | | 229,423 | |
Metropolitan Transportation Auth. Dedicated Tax Fund Rev., Series 2011 A, 5.00%, 11/15/20(1) | | | 150,000 | | | | 172,551 | |
Metropolitan Transportation Auth. Rev., Series 2002 A, 5.50%, 11/15/14 (Ambac)(1) | | | 200,000 | | | | 225,968 | |
Metropolitan Transportation Auth. Rev., Series 2003 B, 5.25%, 11/15/21 (NATL/FGIC)(1) | | | 300,000 | | | | 342,189 | |
Metropolitan Transportation Auth. Rev., Series 2005 A, 5.50%, 11/15/17 (Ambac)(1) | | | 100,000 | | | | 117,053 | |
Metropolitan Transportation Auth. Rev., Series 2005 B, 5.25%, 11/15/23 (Ambac)(1) | | | 305,000 | | | | 342,939 | |
Metropolitan Transportation Auth. Rev., Series 2005 B, 5.00%, 11/15/26 (Ambac)(1) | | | 100,000 | | | | 101,936 | |
Metropolitan Transportation Auth. Rev., Series 2005 F, 5.00%, 11/15/15(1) | | | 175,000 | | | | 197,743 | |
Metropolitan Transportation Auth. Rev., Series 2006 A, 5.00%, 11/15/19(1) | | | 100,000 | | | | 108,871 | |
Metropolitan Transportation Auth. Rev., Series 2008 B, VRDN, 5.00%, 11/15/14(1) | | | 115,000 | | | | 128,174 | |
Metropolitan Transportation Auth. Rev., Series 2010 D, 5.00%, 11/15/16(1) | | | 100,000 | | | | 114,618 | |
Metropolitan Transportation Auth. Rev., Series 2010 D, 5.25%, 11/15/40(1) | | | 100,000 | | | | 101,149 | |
Metropolitan Transportation Auth. Service Contract Rev., Series 2002 A, 5.125%, 1/1/29(1) | | | 200,000 | | | | 201,058 | |
| Nassau County Bridge Auth. Rev., 5.00%, 10/1/40 | | | 200,000 | | | | 201,918 | |
Nassau County GO, Series 2009 E, 4.00%, 6/1/13(1) | | | 100,000 | | | | 104,639 | |
Nassau County Industrial Development Agency Rev., Series 2010 A, (New York Institute of Technology), 5.25%, 3/1/20(1) | | | 200,000 | | | | 217,736 | |
Nassau County Interim Finance Auth. Rev., Series 2005 D, (Sales Tax Secured Bond), 5.00%, 11/15/12 (NATL)(1) | | | $100,000 | | | | $106,757 | |
Nassau County Interim Finance Auth. Rev., Series 2005 D, (Sales Tax Secured Bond), 4.00%, 11/15/16 (NATL)(1) | | | 110,000 | | | | 121,504 | |
Nassau County Tobacco Settlement Corp. Rev., Series 2006 A3, 5.00%, 6/1/35(1) | | | 115,000 | | | | 81,834 | |
Nassau County Tobacco Settlement Corp. Rev., Series 2006 A3, 5.125%, 6/1/46(1) | | | 100,000 | | | | 62,006 | |
New York City Industrial Development Agency Rev., (Queens Baseball Stadium), 5.00%, 1/1/12 (Ambac)(1) | | | 115,000 | | | | 116,294 | |
New York City Industrial Development Agency Rev., (Queens Baseball Stadium), 5.00%, 1/1/20 (Ambac)(1) | | | 185,000 | | | | 183,276 | |
New York City Industrial Development Agency Rev., Series 2009 A, (New York Stock Exchange), 4.00%, 5/1/12(1) | | | 395,000 | | | | 407,352 | |
New York City Municipal Water Finance Auth. Water & Sewer Rev., Series 2007 A, 5.00%, 6/15/38(1) | | | 100,000 | | | | 101,219 | |
New York City Municipal Water Finance Auth. Water & Sewer Rev., Series 2008 DD, (Second General Resolution), 6.00%, 6/15/40(1) | | | 225,000 | | | | 246,512 | |
New York City Municipal Water Finance Auth. Water & Sewer Rev., Series 2009 BB, (Second General Resolution), 5.00%, 6/15/27(1) | | | 400,000 | | | | 433,696 | |
New York City Municipal Water Finance Auth. Water & Sewer Rev., Series 2009 EE, 5.00%, 6/15/16(1) | | | 115,000 | | | | 134,946 | |
New York City Municipal Water Finance Auth. Water & Sewer Rev., Series 2009 EE, 5.25%, 6/15/40(1) | | | 135,000 | | | | 141,255 | |
New York City Municipal Water Finance Auth. Water & Sewer Rev., Series 2009 GG1, (Second General Resolution), 5.00%, 6/15/39(1) | | | 200,000 | | | | 204,848 | |
New York City Municipal Water Finance Auth. Water & Sewer Rev., Series 2009 GG2, (Second General Resolution), 5.00%, 6/15/35(1) | | | 600,000 | | | | 616,980 | |
New York City Municipal Water Finance Auth. Water & Sewer Rev., Series 2010 FF, (Second General Resolution), 5.00%, 6/15/25(1) | | | 315,000 | | | | 349,663 | |
New York City Municipal Water Finance Auth. Water & Sewer Rev., Series 2011 EE, (Second General Resolution), 5.375%, 6/15/43(1) | | | 300,000 | | | | 318,615 | |
New York City Municipal Water Finance Auth. Water & Sewer System Rev., Series 2011 GG, (Second General Resolution), 5.00%, 6/15/43(1) | | | 200,000 | | | | 204,996 | |
New York City Transitional Finance Auth. Building Aid Rev., Series 2009 S5, 5.25%, 1/15/39(1) | | | 100,000 | | | | 103,322 | |
New York City Transitional Finance Auth. Rev., Series 1998 C, (Future Tax Secured Bonds), VRDN, 0.11%, 6/1/11 (LOC: Morgan Stanley Bank N.A.)(1) | | | 300,000 | | | | 300,000 | |
New York City Transitional Finance Auth. Rev., Series 2007 B, (Future Tax Secured Bonds), 5.00%, 11/1/13(1) | | | 145,000 | | | | 159,970 | |
New York City Transitional Finance Auth. Rev., Series 2009 A, (Future Tax Secured Bonds), 5.00%, 5/1/38(1) | | | 100,000 | | | | 102,859 | |
New York City Transitional Finance Auth. Rev., Series 2010 I2, (Future Tax Secured Bonds), 5.00%, 11/1/27(1) | | | 250,000 | | | | 272,205 | |
New York City Transitional Finance Auth. Rev., Series 2011 C, (Future Tax Secured Bonds), 5.00%, 11/1/39(1) | | | 100,000 | | | | 103,218 | |
New York City Trust for Cultural Resources Rev., Series 2008 A1, (Lincoln Center), VRDN, 0.13%, 6/1/11 (LOC: Bank of America N.A.)(1) | | | $100,000 | | | | $100,000 | |
New York City Trust for Cultural Resources Rev., Series 2008 A2, (Lincoln Center), VRDN, 0.13%, 6/1/11 (LOC: Bank of America N.A.)(1) | | | 200,000 | | | | 200,000 | |
New York City Trust for Cultural Resources Rev., Series 2009 A, (Carnegie Hall), 5.00%, 12/1/29(1) | | | 100,000 | | | | 104,469 | |
New York GO, Series 1994 H3, VRDN, 0.16%, 6/1/11 (AGM) (SBBPA: State Street Bank & Trust Co.)(1) | | | 100,000 | | | | 100,000 | |
New York GO, Series 2004 G, 5.00%, 8/1/14(1) | | | 180,000 | | | | 201,206 | |
New York GO, Series 2005 E2, VRDN, 0.14%, 6/1/11 (LOC: Bank of America N.A.)(1) | | | 200,000 | | | | 200,000 | |
New York GO, Series 2005 M, 5.00%, 4/1/15 (AGM)(1) | | | 325,000 | | | | 368,644 | |
New York GO, Series 2006 I8, VRDN, 0.13%, 6/1/11 (LOC: State Street Bank & Trust Co.)(1) | | | 200,000 | | | | 200,000 | |
New York GO, Series 2008 A, 4.00%, 3/1/13(1) | | | 125,000 | | | | 132,430 | |
New York GO, Series 2008 B1, 5.25%, 9/1/22(1) | | | 100,000 | | | | 112,169 | |
New York GO, Series 2008 C, 5.25%, 8/1/17(1) | | | 295,000 | | | | 346,631 | |
New York GO, Series 2009 C, 5.00%, 8/1/24(1) | | | 250,000 | | | | 273,563 | |
New York GO, Series 2009 E, 5.00%, 8/1/20(1) | | | 100,000 | | | | 115,036 | |
New York GO, Series 2009 I1, 5.00%, 4/1/24(1) | | | 200,000 | | | | 218,426 | |
New York GO, Series 2009 I1, 5.30%, 4/1/27(1) | | | 100,000 | | | | 108,593 | |
New York GO, Series 2009 I1, 5.375%, 4/1/36(1) | | | 600,000 | | | | 626,046 | |
New York GO, Series 2009 J1, 5.00%, 5/15/31(1) | | | 200,000 | | | | 207,502 | |
New York GO, Series 2009 J1, 5.00%, 5/15/36(1) | | | 125,000 | | | | 127,421 | |
New York Liberty Development Corp. Rev., (Goldman Sachs Headquarters), 5.25%, 10/1/35(1) | | | 200,000 | | | | 200,258 | |
New York State Dormitory Auth. Personal Income Tax Rev., Series 2008 B, 5.00%, 3/15/21(1) | | | 200,000 | | | | 228,920 | |
New York State Dormitory Auth. Personal Income Tax Rev., Series 2009 B, 5.00%, 2/15/18(1) | | | 240,000 | | | | 281,544 | |
New York State Dormitory Auth. Personal Income Tax Rev., Series 2009 D, 5.00%, 6/15/20(1) | | | 180,000 | | | | 209,369 | |
New York State Dormitory Auth. Rev., (Brooklyn Law School), 5.75%, 7/1/33(1) | | | 200,000 | | | | 214,118 | |
New York State Dormitory Auth. Rev., (Highland Hospital Rochester), 5.20%, 7/1/32(1) | | | 200,000 | | | | 199,482 | |
| New York State Dormitory Auth. Rev., (Manhattan Marymount), 5.00%, 7/1/14 | | | 200,000 | | | | 216,416 | |
New York State Dormitory Auth. Rev., (Mount Sinai School of Medicine), 5.25%, 7/1/24(1) | | | 200,000 | | | | 210,616 | |
New York State Dormitory Auth. Rev., (Yeshiva University), 5.00%, 9/1/38(1) | | | 200,000 | | | | 203,298 | |
New York State Dormitory Auth. Rev., Series 1998 C, (Memorial Sloan-Kettering Cancer Center), 5.25%, 7/1/13 (NATL)(1) | | | 100,000 | | | | 108,621 | |
New York State Dormitory Auth. Rev., Series 2005 A, (State University Educational Facilities), 5.50%, 5/15/17 (NATL/FGIC)(1) | | | 100,000 | | | | 117,708 | |
New York State Dormitory Auth. Rev., Series 2008 A2, (Memorial Sloan-Kettering Cancer Center), 5.00%, 7/1/26(1) | | | 150,000 | | | | 157,047 | |
New York State Dormitory Auth. Rev., Series 2008 B, (New York University), 5.00%, 7/1/22(1) | | | 100,000 | | | | 110,259 | |
New York State Dormitory Auth. Rev., Series 2009 A, (North Shore Long Island Jewish Health System), 5.50%, 5/1/30(1) | | | 100,000 | | | | 102,378 | |
New York State Dormitory Auth. Rev., Series 2009 A, (North Shore Long Island Jewish Health System), 5.50%, 5/1/37(1) | | | $400,000 | | | | $401,764 | |
New York State Dormitory Auth. Rev., Series 2009 A, (University of Rochester), 5.00%, 7/1/21(1) | | | 100,000 | | | | 111,036 | |
New York State Dormitory Auth. Rev., Series 2010 A, (Cornell University), 5.00%, 7/1/40(1) | | | 150,000 | | | | 156,275 | |
New York State Dormitory Auth. Rev., Series 2010 A, (Mount Sinai Hospital), 5.00%, 7/1/21(1) | | | 250,000 | | | | 269,865 | |
New York State Dormitory Auth. Rev., Series 2010 A, (Mount Sinai Hospital), 5.00%, 7/1/22(1) | | | 250,000 | | | | 265,352 | |
New York State Dormitory Auth. Rev., Series 2011 A, (Fordham University), 5.125%, 7/1/29(1) | | | 100,000 | | | | 103,337 | |
New York State Dormitory Auth. Rev., Series 2011 A, (NYU Hospitals Center), 6.00%, 7/1/40(1) | | | 150,000 | | | | 153,361 | |
New York State Environmental Facilities Corp. Clean Water & Drinking Rev., Series 2009 A, 5.00%, 6/15/29(1) | | | 130,000 | | | | 139,552 | |
New York State Local Government Assistance Corp. Rev., Series 2008 A, (Senior Lien), 5.00%, 4/1/20(1) | | | 225,000 | | | | 257,888 | |
New York State Local Government Assistance Corp. Rev., Series 2008 C, (Senior Lien), 5.00%, 4/1/15(1) | | | 265,000 | | | | 302,773 | |
New York State Power Auth. Rev., Series 2007 C, 5.00%, 11/15/14 (NATL)(1) | | | 130,000 | | | | 147,381 | |
New York State Thruway Auth. Highway & Bridge Trust Fund Rev., Series 2002 A, 5.25%, 4/1/12, Prerefunded at 100% of Par (AGM)(1)(3) | | | 100,000 | | | | 104,215 | |
New York State Thruway Auth. Rev., Series 2007 H, 5.00%, 1/1/14 (NATL)(1) | | | 150,000 | | | | 163,632 | |
New York State Thruway Auth. Second General Highway & Bridge Trust Fund Rev., Series 2005 B, 5.00%, 4/1/13 (NATL/FGIC)(1) | | | 245,000 | | | | 264,764 | |
New York State Thruway Auth. Second General Highway & Bridge Trust Fund Rev., Series 2010 A, 5.00%, 4/1/26(1) | | | 200,000 | | | | 218,406 | |
New York State Urban Development Corp. Rev., Series 2008 D, 5.25%, 1/1/21(1) | | | 100,000 | | | | 113,236 | |
New York State Urban Development Corp. Rev., Series 2009 A1, (State Personal Income Tax), 5.00%, 12/15/28(1) | | | 275,000 | | | | 294,682 | |
Niagara Falls Bridge Commission Toll Rev., Series 1993 A, (Bridge System), 4.00%, 10/1/19 (AGC)(1) | | | 200,000 | | | | 213,018 | |
Onondaga County Trust for Cultural Resources Rev., Series 2010 B, (Syracuse University), 5.00%, 12/1/15(1) | | | 170,000 | | | | 192,909 | |
Plainview Old Bethpage Central School District GO, 4.75%, 12/15/15(1) | | | 200,000 | | | | 232,128 | |
Port Auth. of New York & New Jersey Rev., (Consolidated Bonds-One Hundred Fifty-Third Series), 5.00%, 7/15/35(1) | | | 200,000 | | | | 205,352 | |
Port Auth. of New York & New Jersey Rev., (Consolidated Bonds-One Hundred Fifty-Third Series), 5.00%, 7/15/38(1) | | | 235,000 | | | | 240,569 | |
Port Auth. of New York & New Jersey Rev., (Consolidated Bonds-One Hundred Forty-Ninth Series), 5.00%, 11/15/21(1) | | | 100,000 | | | | 111,068 | |
Port Auth. of New York & New Jersey Rev., (Consolidated Bonds-One Hundred Sixty-Third Series), 5.00%, 7/15/32(1) | | | 275,000 | | | | 286,539 | |
Port Auth. of New York & New Jersey Special Obligation Rev., (John F. Kennedy International Airport Terminal), 5.00%, 12/1/20(1) | | | 150,000 | | | | 149,104 | |
Port Auth. of New York & New Jersey Special Obligation Rev., (John F. Kennedy International Airport Terminal), 6.00%, 12/1/42(1) | | | $150,000 | | | | $149,916 | |
| Rome City School District GO, 5.00%, 6/15/13 (NATL/FGIC) | | | 100,000 | | | | 107,852 | |
Sales Tax Asset Receivable Corp. Rev., Series 2004 A, 5.00%, 10/15/29 (Ambac)(1) | | | 100,000 | | | | 103,201 | |
Sales Tax Asset Receivable Corp. Rev., Series 2004 A, 5.00%, 10/15/32 (Ambac)(1) | | | 300,000 | | | | 307,221 | |
Saratoga County Water Auth. Rev., (Water System), 5.00%, 9/1/33(1) | | | 200,000 | | | | 206,426 | |
| South Colonie Central School District GO, 5.00%, 6/15/17 | | | 100,000 | | | | 116,385 | |
Syracuse GO, Series 2010 A, (Public Improvement), 5.00%, 12/15/17 (AGM)(1) | | | 200,000 | | | | 231,594 | |
Tobacco Settlement Financing Corp. Rev., Series 2003 B1C, 5.50%, 6/1/21(1) | | | 400,000 | | | | 423,992 | |
Town of Hempstead Local Development Corp. Rev., Series 2009 B, (Adelphi University), 5.25%, 2/1/39(1) | | | 200,000 | | | | 203,202 | |
Triborough Bridge & Tunnel Auth. Rev., Series 2002 B, 5.25%, 11/15/12(1) | | | 85,000 | | | | 91,039 | |
Triborough Bridge & Tunnel Auth. Rev., Series 2008 A, 5.00%, 11/15/20(1) | | | 200,000 | | | | 227,442 | |
Triborough Bridge & Tunnel Auth. Rev., Series 2008 A, 5.00%, 11/15/33(1) | | | 250,000 | | | | 257,765 | |
Triborough Bridge & Tunnel Auth. Rev., Series 2008 C, 5.00%, 11/15/38(1) | | | 200,000 | | | | 204,680 | |
Triborough Bridge & Tunnel Auth. Rev., Series 2008 D, 5.00%, 11/15/14(1) | | | 100,000 | | | | 112,571 | |
Triborough Bridge & Tunnel Auth. Rev., Series 2009 A2, 4.00%, 11/15/15(1) | | | 150,000 | | | | 166,171 | |
Triborough Bridge & Tunnel Auth. Rev., Series 2010 A1, VRDN, 4.00%, 11/15/12(1) | | | 350,000 | | | | 367,220 | |
| White Plains School District GO, 4.25%, 6/15/16, (AGC) | | | 100,000 | | | | 113,918 | |
| | | | | | | | 25,613,531 | |
| PUERTO RICO — 1.8% | |
Puerto Rico Electric Power Auth. Rev., Series 2003 NN, 5.25%, 7/1/23 (NATL)(1) | | | 250,000 | | | | 261,615 | |
Puerto Rico Sales Tax Financing Corp. Rev., Series 2009 A, 5.75%, 8/1/37(1) | | | 200,000 | | | | 202,214 | |
| | | | | | | | 463,829 | |
TOTAL INVESTMENT SECURITIES — 99.8%(Cost $25,737,671) | | | | 26,314,969 | |
| OTHER ASSETS AND LIABILITIES — 0.2% | | | | 49,917 | |
| TOTAL NET ASSETS — 100.0% | | | | $26,364,886 | |
| Futures Contracts |
| Contracts Purchased | Expiration Date | Underlying Face Amount at Value | Unrealized Gain (Loss) |
| 9 | U.S. Long Bond | September 2011 | $1,123,594 | $10,808 |
| Contracts Sold | Expiration Date | Underlying Face Amount at Value | Unrealized Gain (Loss) |
| 29 | U.S. Treasury 2-Year Notes | September 2011 | $6,356,438 | $(11,847) |
Notes to Schedule of Investments
AGC = Assured Guaranty Corporation
AGM = Assured Guaranty Municipal Corporation
Ambac = Ambac Assurance Corporation
CIFG = CDC IXIS Financial Guaranty North America
FGIC = Financial Guaranty Insurance Company
GO = General Obligation
LOC = Letter of Credit
NATL = National Public Finance Guarantee Corporation
SBBPA = Standby Bond Purchase Agreement
VRDN = Variable Rate Demand Note. Interest reset date is indicated. Rate shown is effective at the period end.
| (1) | Security, or a portion thereof, has been segregated for when-issued securities and/or futures contracts. At the period end, the aggregate value of securities pledged was $7,729,000. |
| (3) | Escrowed to maturity in U.S. government securities or state and local government securities. |
See Notes to Financial Statements.
Statement of Assets and Liabilities |
| MAY 31, 2011 | |
| Assets | |
| Investment securities, at value (cost of $25,737,671) | | | $26,314,969 | |
| Cash | | | 1,337 | |
| Receivable for capital shares sold | | | 350 | |
| Receivable for variation margin on futures contracts | | | 2,250 | |
| Dividends and Interest receivable | | | 323,882 | |
| | | | 26,642,788 | |
| | | | | |
| Liabilities | | | | |
| Payable for investments purchased | | | 245,755 | |
| Payable for capital shares redeemed | | | 6,160 | |
| Payable for variation margin on futures contracts | | | 2,266 | |
| Accrued management fees | | | 12,329 | |
| Distribution and service fee payable | | | 4,559 | |
| Dividends payable | | | 6,833 | |
| | | | 277,902 | |
| | | | | |
| Net Assets | | | $26,364,886 | |
| | | | | |
| Net Assets Consist of: | | | | |
| Capital paid in | | | $25,859,745 | |
| Accumulated net investment loss | | | (83 | ) |
| Accumulated net realized loss | | | (71,035 | ) |
| Net unrealized appreciation | | | 576,259 | |
| | | | $26,364,886 | |
| | | | | | | |
| | | Net assets | | Shares outstanding | | Net asset value per share |
| Investor Class | | | $13,238,029 | | | | 1,246,725 | | | | $10.62 | |
| Institutional Class | | | $596,063 | | | | 56,136 | | | | $10.62 | |
| A Class | | | $9,500,700 | | | | 894,387 | | | | $10.62 | * |
| C Class | | | $3,030,094 | | | | 285,320 | | | | $10.62 | |
*Maximum offering price $11.12 (net asset value divided by 0.955)
See Notes to Financial Statements.
| YEAR ENDED MAY 31, 2011 | |
| Investment Income (Loss) | |
| Income: | | | |
| Interest | | | $962,651 | |
| | | | | |
| Expenses: | | | | |
| Management fees | | | 167,643 | |
| Distribution and service fees: | | | | |
| A Class | | | 22,466 | |
| C Class | | | 30,140 | |
| Trustees’ fees and expenses | | | 1,133 | |
| Other expenses | | | 3,179 | |
| | | | 224,561 | |
| Fees waived | | | (29,926 | ) |
| | | | 194,635 | |
| | | | | |
| Net investment income (loss) | | | 768,016 | |
| | | | | |
| Realized and Unrealized Gain (Loss) | | | | |
| Net realized gain (loss) on: | | | | |
| Investment transactions | | | 30,968 | |
| Futures contract transactions | | | (96,823 | ) |
| | | | (65,855 | ) |
| | | | | |
| Change in net unrealized appreciation (depreciation) on: | | | | |
| Investments | | | (115,835 | ) |
| Futures contracts | | | 2,175 | |
| | | | (113,660 | ) |
| | | | | |
| Net realized and unrealized gain (loss) | | | (179,515 | ) |
| | | | | |
| Net Increase (Decrease) in Net Assets Resulting from Operations | | | $588,501 | |
See Notes to Financial Statements
Statement of Changes in Net Assets |
YEAR ENDED MAY 31, 2011 AND PERIOD ENDED MAY 31, 2010(1) | |
| Increase (Decrease) in Net Assets | | 2011 | | | 2010 | |
| Operations | |
| Net investment income (loss) | | | $768,016 | | | | $405,647 | |
| Net realized gain (loss) | | | (65,855 | ) | | | 28,643 | |
| Change in net unrealized appreciation (depreciation) | | | (113,660 | ) | | | 689,919 | |
| Net increase (decrease) in net assets resulting from operations | | | 588,501 | | | | 1,124,209 | |
| | | | | | | | | |
| Distributions to Shareholders | | | | | | | | |
| From net investment income: | | | | | | | | |
| Investor Class | | | (448,691 | ) | | | (187,737 | ) |
| Institutional Class | | | (3,977 | ) | | | (226 | ) |
| A Class | | | (258,152 | ) | | | (162,041 | ) |
| C Class | | | (63,794 | ) | | | (55,643 | ) |
| From net realized gains: | | | | | | | | |
| Investor Class | | | (10,389 | ) | | | (6,324 | ) |
| Institutional Class | | | (19 | ) | | | — | |
| A Class | | | (6,265 | ) | | | (5,992 | ) |
| C Class | | | (2,258 | ) | | | (2,659 | ) |
| Decrease in net assets from distributions | | | (793,545 | ) | | | (420,622 | ) |
| | | | | | | | | |
| Capital Share Transactions | | | | | | | | |
| Net increase (decrease) in net assets from capital share transactions | | | 3,410,181 | | | | 22,456,162 | |
| | | | | | | | | |
| | | | | | | | | |
| Net increase (decrease) in net assets | | | 3,205,137 | | | | 23,159,749 | |
| | | | | | | | | |
| Net Assets | | | | | | | | |
| Beginning of period | | | 23,159,749 | | | | — | |
| End of period | | | $26,364,886 | | | | $23,159,749 | |
| | | | | | | | | |
| Accumulated undistributed net investment income (loss) | | | $(83 | ) | | | $6,598 | |
| (1) | June 30, 2009 (fund inception) through May 31, 2010. |
See Notes to Financial Statements
Notes to Financial Statements |
MAY 31, 2011
1. Organization
American Century Municipal Trust (the trust) is registered under the Investment Company Act of 1940, as amended (the 1940 Act), as an open-end management investment company and is organized as a Massachusetts business trust. New York Tax-Free Fund (the fund) is one fund in a series issued by the trust. The fund is nondiversified as defined under the 1940 Act. The fund’s investment objective is to seek to maximize total return through high current income that is exempt from federal and New York state and local income taxes. The fund pursues its objective by investing primarily in investment-grade municipal obligations.
The fund is authorized to issue the Investor Class, the Institutional Class, the A Class and the C Class. The A Class may incur an initial sales charge. The A Class and C Class may be subject to a contingent deferred sales charge. The share classes differ principally in their respective sales charges and distribution and shareholder servicing expenses and arrangements. The Institutional Class is made available to institutional shareholders or through financial intermediaries whose clients do not require the same level of shareholder and administrative services as shareholders of other classes. As a result, the Institutional Class is charged a lower unified management fee. The Investor Class, A Class and C Class commenced sale on June 30, 2009, the fund’s inception date. Sale of the Institutional Class commenced on March 1, 2010.
2. Significant Accounting Policies
The following is a summary of significant accounting policies consistently followed by the fund in preparation of its financial statements. The financial statements are prepared in conformity with accounting principles generally accepted in the United States of America, which may require management to make certain estimates and assumptions at the date of the financial statements. Actual results could differ from these estimates.
Investment Valuations — The fund determines the fair value of its investments and computes its net asset value per share as of the close of regular trading (usually 4 p.m. Eastern time) on the New York Stock Exchange (NYSE) on each day the NYSE is open.
Debt securities maturing in greater than 60 days at the time of purchase are valued at the evaluated mean as provided by independent pricing services or at the mean of the most recent bid and asked prices as provided by investment dealers. Debt securities maturing within 60 days at the time of purchase may be valued at cost, plus or minus any amortized discount or premium or at the evaluated mean as provided by an independent pricing service. Evaluated mean prices are commonly derived through utilization of market models, which may consider, among other factors, trade data, quotations from dealers and active market makers, relevant yield curve and spread data, related sector levels, creditworthiness, and other relevant market information on the same or comparable securities.
Exchange-traded futures contracts are valued at the settlement price as provided by the appropriate clearing corporation.
If the fund determines that the market price for a portfolio security is not readily available or the valuation methods mentioned above do not reflect a security’s fair value, such security is valued as determined in good faith by the Board of Trustees or its designee, in accordance with procedures adopted by the Board of Trustees. Circumstances that may cause the fund to use these procedures to value a security include, but are not limited to: a security has been declared in default; trading in a security has been halted during the trading day; there is a foreign market holiday and no trading occurred; or an event occurred between the close of a foreign exchange and the NYSE that may affect the value of a security.
Security Transactions — Security transactions are accounted for as of the trade date. Net realized gains and losses are determined on the identified cost basis, which is also used for federal income tax purposes.
Investment Income — Interest income is recorded on the accrual basis and includes accretion of discounts and amortization of premiums.
When-Issued — The fund may engage in securities transactions on a when-issued basis. Under these arrangements, the securities’ prices and yields are fixed on the date of the commitment, but payment and delivery are scheduled for a future date. During this period, securities are subject to market fluctuations. The fund will segregate cash, cash equivalents or other appropriate liquid securities on its records in amounts sufficient to meet the purchase price.
Income Tax Status — It is the fund’s policy to distribute substantially all net investment income and net realized gains to shareholders and to otherwise qualify as a regulated investment company under provisions of the Internal Revenue Code. All tax years for the fund remain subject to examination by tax authorities. At this time, management believes there are no uncertain tax positions which, based on their technical merit, would not be sustained upon examination and for which it is reasonably possible that the total amounts of unrecognized tax benefits will significantly change in the next twelve months. Accordingly, no provision has been made for federal or state income taxes.
Multiple Class — All shares of the fund represent an equal pro rata interest in the net assets of the class to which such shares belong, and have identical voting, dividend, liquidation and other rights and the same terms and conditions, except for class specific expenses and exclusive rights to vote on matters affecting only individual classes. Income, non-class specific expenses, and realized and unrealized capital gains and losses of the fund are allocated to each class of shares based on their relative net assets.
Distributions to Shareholders — Distributions from net investment income are declared daily and paid monthly. Distributions from net realized gains, if any, are generally declared and paid annually.
Indemnifications — Under the trust’s organizational documents, its officers and trustees are indemnified against certain liabilities arising out of the performance of their duties to the fund. In addition, in the normal course of business, the fund enters into contracts that provide general indemnifications. The maximum exposure under these arrangements is unknown as this would involve future claims that may be made against a fund. The risk of material loss from such claims is considered by management to be remote.
3. Fees and Transactions with Related Parties
Management Fees — The trust has entered into a management agreement with American Century Investment Management, Inc. (ACIM) (the investment advisor), under which ACIM provides the fund with investment advisory and management services in exchange for a single, unified management fee (the fee) per class. The agreement provides that all expenses of managing and operating the fund, except distribution and service fees, brokerage expenses, taxes, interest, fees and expenses of the independent trustees (including legal counsel fees), and extraordinary expenses, will be paid by ACIM. The fee is computed and accrued daily based on each class’s daily net assets and paid monthly in arrears. The fee consists of (1) an Investment Category Fee based on the daily net assets of the fund and certain other accounts managed by the investment advisor that are in the same broad investment category as the fund and (2) a Complex Fee based on the assets of all the funds in the American Century Investments family of funds. The rates for the Investment Category Fee range from 0.3225% to 0.4400%. The rates for the Complex Fee range from 0.2500% to 0.3100% for the Investor Class, A Class and C Class. The Institutional Class is 0.2000% less at each point within the Complex Fee range. During the year ended May 31, 2011, the investment advisor voluntarily agreed to waive 0.07% of its management fee. The investment advisor expects the fee waiver to continue through July 31, 2011, and cannot terminate it without consulting the Board of Trustees. In addition, the investment advisor voluntarily waived the remainder of the fund’s management fee from June 1, 2010 through June 30, 2010. The total amount of the waiver for each class for the year ended May 31, 2011 was $16,492, $90, $9,920 and $3,424 for the Investor Class, Institutional Class, A Class and C Class, respectively. The effective annual management fee before waiver for each class for the year ended May 31, 2011 was 0.63% for the Investor Class, A Class and C Class and 0.43% for the Institutional Class. The effective annual management fee after waiver for each class for the year ended May 31, 2011 was 0.52% for the Investor Class, A Class and C Class and 0.35% for the Institutional Class.
Distribution and Service Fees — The Board of Trustees has adopted a separate Master Distribution and Individual Shareholder Services Plan for each of the A Class and C Class (collectively the plans), pursuant to Rule 12b-1 of the 1940 Act. The plans provide that the A Class will pay American Century Investment Services, Inc. (ACIS) an annual distribution and service fee of 0.25%. The plans provide that the C Class will pay ACIS an annual distribution and service fee of 1.00%, of which 0.25% is paid for individual shareholder services and 0.75% is paid for distribution services. The fees are computed and accrued daily based on each class’s daily net assets and paid monthly in arrears. The fees are used to pay financial intermediaries for distribution and individual shareholder services. Fees incurred under the plans during the year ended May 31, 2011 are detailed in the Statement of Operations.
Other Expenses — The fund’s total other expenses include the fees and expenses of the fund’s independent directors and their legal counsel, interest, and other miscellaneous expenses. A portion of these expenses was due to nonrecurring expenses paid by the fund. The impact of total other expenses to the ratio of operating expenses to average net assets for each class for the year ended May 31, 2011 was 0.02% for the Investor Class, A Class and
C Class and 0.01% for the Institutional Class.
Related Parties — Certain officers and trustees of the trust are also officers and/or directors of American Century Companies, Inc. (ACC), the parent of the trust’s investment advisor, ACIM, the distributor of the trust, ACIS, and the trust’s transfer agent, American Century Services, LLC. ACIM owns 41% of the outstanding shares of the fund. ACIM does not invest in the fund for the purpose of exercising management or control.
The fund has a mutual funds services agreement with J.P. Morgan Investor Services Co. (JPMIS). JPMorgan Chase Bank (JPMCB) is a custodian of the fund. JPMIS and JPMCB are wholly owned subsidiaries of JPMorgan Chase & Co. (JPM). JPM is an equity investor in ACC.
4. Investment Transactions
Purchases and sales of investment securities, excluding short-term investments, for the year ended May 31, 2011 were $9,431,036 and $5,195,702, respectively.
5. Capital Share Transactions
Transactions in shares of the fund were as follows (unlimited number of shares authorized):
| | | | | | | |
| | | Year ended May 31, 2011 | | | Period ended May 31, 2010(1)(2) | |
| | | Shares | | | Amount | | | Shares | | | Amount | |
| Investor Class | | | | | | | | | | | | |
| Sold | | | 536,869 | | | | $5,731,520 | | | | 1,205,903 | | | | $12,579,195 | |
| Issued in reinvestment of distributions | | | 42,481 | | | | 449,900 | | | | 17,908 | | | | 188,076 | |
| Redeemed | | | (469,488 | ) | | | (4,914,619 | ) | | | (86,948 | ) | | | (914,387 | ) |
| | | | 109,862 | | | | 1,266,801 | | | | 1,136,863 | | | | 11,852,884 | |
| Institutional Class | | | | | | | | | | | | | | | | |
| Sold | | | 53,422 | | | | 549,855 | | | | 2,369 | | | | 25,000 | |
| Issued in reinvestment of distributions | | | 379 | | | | 3,996 | | | | 22 | | | | 226 | |
| Redeemed | | | (56 | ) | | | (594 | ) | | | — | | | | — | |
| | | | 53,745 | | | | 553,257 | | | | 2,391 | | | | 25,226 | |
| A Class | | | | | | | | | | | | | | | | |
| Sold | | | 352,044 | | | | 3,711,251 | | | | 765,768 | | | | 7,900,007 | |
| Issued in reinvestment of distributions | | | 18,184 | | | | 192,085 | | | | 11,950 | | | | 125,542 | |
| Redeemed | | | (235,842 | ) | | | (2,484,882 | ) | | | (17,717 | ) | | | (185,690 | ) |
| | | | 134,386 | | | | 1,418,454 | | | | 760,001 | | | | 7,839,859 | |
| C Class | | | | | | | | | | | | | | | | |
| Sold | | | 41,848 | | | | 444,432 | | | | 268,734 | | | | 2,725,665 | |
| Issued in reinvestment of distributions | | | 5,399 | | | | 57,064 | | | | 4,537 | | | | 47,567 | |
| Redeemed | | | (31,876 | ) | | | (329,827 | ) | | | (3,322 | ) | | | (35,039 | ) |
| | | | 15,371 | | | | 171,669 | | | | 269,949 | | | | 2,738,193 | |
| Net increase (decrease) | | | 313,364 | | | | $3,410,181 | | | | 2,169,204 | | | | $22,456,162 | |
| (1) | June 30, 2009 (fund inception) through May 31, 2010 for the Investor Class, A Class and C Class. |
| (2) | March 1, 2010 (commencement of sale) through May 31, 2010 for the Institutional Class. |
6. Fair Value Measurements
The fund’s securities valuation process is based on several considerations and may use multiple inputs to determine the fair value of the positions held by the fund. In conformity with accounting principles generally accepted in the United States of America, the inputs used to determine a valuation are classified into three broad levels as follows:
| • | Level 1 valuation inputs consist of unadjusted quoted prices in an active market for identical securities; |
| • | Level 2 valuation inputs consist of direct or indirect observable market data (including quoted prices for similar securities, evaluations of subsequent market events, interest rates, prepayment speeds, credit risk, etc.); or |
| • | Level 3 valuation inputs consist of unobservable data (including a fund’s own assumptions). |
The level classification is based on the lowest level input that is significant to the fair valuation measurement. The valuation inputs are not necessarily an indication of the risks associated with investing in these securities or other financial instruments.
As of period end, the fund’s investment securities and unrealized gain (loss) on futures contracts were classified as Level 2 and Level 1, respectively. The Schedule of Investments provides additional information on the fund’s portfolio holdings.
7. Derivative Instruments
Interest Rate Risk — The fund is subject to interest rate risk in the normal course of pursuing its investment objectives. The value of bonds generally declines as interest rates rise. A fund may enter into futures contracts based on a bond index or a specific underlying security. A fund may purchase futures contracts to gain exposure to increases in market value or sell futures contracts to protect against a decline in market value. Upon entering into a futures contract, a fund will segregate cash, cash equivalents or other appropriate liquid securities on its records in amounts sufficient to meet requirements. Subsequent payments (variation margin) are made or received daily, in cash, by a fund. The variation margin is equal to the daily change in the contract value and is recorded as unrealized gains and losses. A fund recognizes a realized gain or loss when the futures contract is closed or expires. Net realized and unrealized gains or losses occurring during the holding period of futures contracts are a component of net realized gain (loss) on futures contract transactions and change in net unrealized appreciation (depreciation) on futures contracts, respectively. One of the risks of entering into futures contracts is the possibility that the change in value of the contract may not correlate with the changes in value of the underlying securities. The interest rate risk derivative instruments held at period end as disclosed on the Schedule of Investments are indicative of the fund’s typical volume during the period.
The value of interest rate risk derivative instruments as of May 31, 2011, is disclosed on the Statement of Assets and Liabilities as an asset of $2,250 in receivable for variation margin on futures contracts and as a liability of $2,266 in payable for variation margin on futures contracts. For the year ended May 31, 2011, the effect of interest rate risk derivative instruments on the Statement of Operations was $(96,823) in net realized gain (loss) on futures contract transactions and $2,175 in change in net unrealized appreciation (depreciation) on futures contracts.
8. Risk Factors
The fund concentrates its investments in a single state and therefore may have more exposure to credit risk related to the state of New York than a fund with a broader geographical diversification.
9. Federal Tax Information
The tax character of distributions paid during the year ended May 31, 2011 and the period June 30, 2009 (fund inception) through May 31, 2010 were as follows:
| | | | | | | |
| | | 2011 | | 2010 |
| Distributions Paid From | | | | | | |
| Exempt income | | | $774,697 | | | | $405,647 | |
| Taxable ordinary income | | | $18,848 | | | | $9,917 | |
| Long-term capital gains | | | — | | | | $5,058 | |
The book-basis character of distributions made during the year from net investment income or net realized gains may differ from their ultimate characterization for federal income tax purposes. These differences reflect the differing character of certain income items and net realized gains and losses for financial statement and tax purposes, and may result in reclassification among certain capital accounts on the financial statements.
As of May 31, 2011, the federal tax cost of investments and the components of distributable earnings on a tax-basis were as follows:
| | | | | |
| Federal tax cost of investments | | | $25,737,671 | |
| Gross tax appreciation of investments | | | $670,695 | |
| Gross tax depreciation of investments | | | (93,397 | ) |
| Net tax appreciation (depreciation) of investments | | | $577,298 | |
| Other book-to-tax adjustments | | | $(1,977 | ) |
| Net tax appreciation (depreciation) | | | $575,321 | |
| Accumulated capital losses | | | $(22,086 | ) |
| Capital loss deferral | | | $(48,094 | ) |
The cost of investments for federal income tax purposes was the same as the cost for financial reporting purposes. The difference between book-basis and tax-basis unrealized appreciation (depreciation) is attributable primarily to the realization for tax purposes of unrealized gains (losses) on futures contracts. Other book-to-tax adjustments are attributable primarily to the tax deferral of losses on straddle positions.
The accumulated capital losses represent net capital loss carryovers that may be used to offset future realized capital gains for federal income tax purposes. Future capital loss carryover utilization in any given year may be subject to Internal Revenue Code limitations. Capital loss carryovers expire in 2019.
The capital loss deferral represents net capital losses incurred in the seven-month period ended May 31, 2011. The fund has elected to treat such losses as having been incurred in the following fiscal year for federal income tax purposes.
On December 22, 2010, the Regulated Investment Company Modernization Act of 2010 (the “Act”) was enacted, which changed various technical rules governing the tax treatment of regulated investment companies. The changes are generally effective for taxable years beginning after the date of enactment. Under the Act, the fund will be permitted to carry forward capital losses incurred in taxable years beginning after the date of enactment for an unlimited period. However, any losses incurred during those future taxable years will be required to be utilized prior to the losses incurred in pre-enactment taxable years, which carry an expiration date. As a result of this ordering rule, pre-enactment capital loss carryforwards may be more likely to expire unused.
| Investor Class | |
| For a Share Outstanding Throughout the Years Ended May 31 (except as noted) | |
| | | 2011 | | | 2010(1) | |
| Per-Share Data | |
| Net Asset Value, Beginning of Period | | | $10.68 | | | | $10.00 | |
| Income From Investment Operations | | | | | | | | |
Net Investment Income (Loss)(2) | | | 0.33 | | | | 0.35 | |
| Net Realized and Unrealized Gain (Loss) | | | (0.05 | ) | | | 0.68 | |
| Total From Investment Operations | | | 0.28 | | | | 1.03 | |
| Distributions | | | | | | | | |
| From Net Investment Income | | | (0.33 | ) | | | (0.34 | ) |
| From Net Realized Gains | | | (0.01 | ) | | | (0.01 | ) |
| Total Distributions | | | (0.34 | ) | | | (0.35 | ) |
| Net Asset Value, End of Period | | | $10.62 | | | | $10.68 | |
| | | | | | | | | |
Total Return(3) | | | 2.66 | % | | | 10.39 | % |
| | | | | | | | | |
| Ratios/Supplemental Data | |
| Ratio of Operating Expenses to Average Net Assets | | | 0.54 | % | | | 0.00 | %(4)(5) |
| Ratio of Operating Expenses to Average Net Assets (Before Expense Waiver) | | | 0.65 | % | | | 0.64 | %(4) |
| Ratio of Net Investment Income (Loss) to Average Net Assets | | | 3.08 | % | | | 3.60 | %(4) |
Ratio of Net Investment Income (Loss) to Average Net Assets (Before Expense Waiver) | | | 2.97 | % | | | 2.96 | %(4) |
| Portfolio Turnover Rate | | | 21 | % | | | 16 | % |
| Net Assets, End of Period (in thousands) | | | $13,238 | | | | $12,136 | |
| (1) | June 30, 2009 (fund inception) through May 31, 2010. |
| (2) | Computed using average shares outstanding throughout the period. |
| (3) | Total returns are calculated based on the net asset value of the last business day. Total returns for periods less than one year are not annualized. |
| (5) | Ratio is less than 0.005%. |
See Notes to Financial Statements.
| Institutional Class | |
| For a Share Outstanding Throughout the Years Ended May 31 (except as noted) | |
| | | 2011 | | | 2010(1) | |
| Per-Share Data | |
| Net Asset Value, Beginning of Period | | | $10.67 | | | | $10.55 | |
| Income From Investment Operations | | | | | | | | |
Net Investment Income (Loss)(2) | | | 0.35 | | | | 0.10 | |
| Net Realized and Unrealized Gain (Loss) | | | (0.04 | ) | | | 0.12 | |
| Total From Investment Operations | | | 0.31 | | | | 0.22 | |
| Distributions | | | | | | | | |
| From Net Investment Income | | | (0.35 | ) | | | (0.10 | ) |
| From Net Realized Gains | | | (0.01 | ) | | | — | |
| Total Distributions | | | (0.36 | ) | | | (0.10 | ) |
| Net Asset Value, End of Period | | | $10.62 | | | | $10.67 | |
| | | | | | | | | |
Total Return(3) | | | 2.95 | % | | | 2.05 | % |
| | | | | | | | | |
| Ratios/Supplemental Data | |
| Ratio of Operating Expenses to Average Net Assets | | | 0.36 | % | | | 0.00 | %(4)(5) |
| Ratio of Operating Expenses to Average Net Assets (Before Expense Waiver) | | | 0.44 | % | | | 0.44 | %(4) |
| Ratio of Net Investment Income (Loss) to Average Net Assets | | | 3.26 | % | | | 3.61 | %(4) |
Ratio of Net Investment Income (Loss) to Average Net Assets (Before Expense Waiver) | | | 3.18 | % | | | 3.17 | %(4) |
| Portfolio Turnover Rate | | | 21 | % | | | 16 | %(6) |
| Net Assets, End of Period (in thousands) | | | $596 | | | | $26 | |
| (1) | March 1, 2010 (commencement of sale) through May 31, 2010. |
| (2) | Computed using average shares outstanding throughout the period. |
| (3) | Total returns are calculated based on the net asset value of the last business day. Total returns for periods less than one year are not annualized. |
| (5) | Ratio is less than 0.005%. |
| (6) | Portfolio turnover is calculated at the fund level. Percentage indicated was calculated for the period June 30, 2009 (fund inception) through May 31,2010. |
See Notes to Financial Statements.
| A Class | |
| For a Share Outstanding Throughout the Years Ended May 31 (except as noted) | |
| | | 2011 | | | 2010(1) | |
| Per-Share Data | |
| Net Asset Value, Beginning of Period | | | $10.68 | | | | $10.00 | |
| Income From Investment Operations | | | | | | | | |
Net Investment Income (Loss)(2) | | | 0.30 | | | | 0.32 | |
| Net Realized and Unrealized Gain (Loss) | | | (0.05 | ) | | | 0.68 | |
| Total From Investment Operations | | | 0.25 | | | | 1.00 | |
| Distributions | | | | | | | | |
| From Net Investment Income | | | (0.30 | ) | | | (0.31 | ) |
| From Net Realized Gains | | | (0.01 | ) | | | (0.01 | ) |
| Total Distributions | | | (0.31 | ) | | | (0.32 | ) |
| Net Asset Value, End of Period | | | $10.62 | | | | $10.68 | |
| | | | | | | | | |
Total Return(3) | | | 2.40 | % | | | 10.16 | % |
| | | | | | | | | |
| Ratios/Supplemental Data | |
| Ratio of Operating Expenses to Average Net Assets | | | 0.79 | % | | | 0.25 | %(4) |
| Ratio of Operating Expenses to Average Net Assets (Before Expense Waiver) | | | 0.90 | % | | | 0.89 | %(4) |
| Ratio of Net Investment Income (Loss) to Average Net Assets | | | 2.83 | % | | | 3.35 | %(4) |
Ratio of Net Investment Income (Loss) to Average Net Assets (Before Expense Waiver) | | | 2.72 | % | | | 2.71 | %(4) |
| Portfolio Turnover Rate | | | 21 | % | | | 16 | % |
| Net Assets, End of Period (in thousands) | | | $9,501 | | | | $8,116 | |
| (1) | June 30, 2009 (fund inception) through May 31, 2010. |
| (2) | Computed using average shares outstanding throughout the period. |
| (3) | Total returns are calculated based on the net asset value of the last business day and do not reflect applicable sales charges. Total returns for periods less than one year are not annualized. |
See Notes to Financial Statements.
| C Class | |
| For a Share Outstanding Throughout the Years Ended May 31 (except as noted) | |
| | | 2011 | | | 2010(1) | |
| Per-Share Data | |
| Net Asset Value, Beginning of Period | | | $10.68 | | | | $10.00 | |
| Income From Investment Operations | | | | | | | | |
Net Investment Income (Loss)(2) | | | 0.22 | | | | 0.25 | |
| Net Realized and Unrealized Gain (Loss) | | | (0.05 | ) | | | 0.68 | |
| Total From Investment Operations | | | 0.17 | | | | 0.93 | |
| Distributions | | | | | | | | |
| From Net Investment Income | | | (0.22 | ) | | | (0.24 | ) |
| From Net Realized Gains | | | (0.01 | ) | | | (0.01 | ) |
| Total Distributions | | | (0.23 | ) | | | (0.25 | ) |
| Net Asset Value, End of Period | | | $10.62 | | | | $10.68 | |
| | | | | | | | | |
Total Return(3) | | | 1.64 | % | | | 9.41 | % |
| | | | | | | | | |
| Ratios/Supplemental Data | |
| Ratio of Operating Expenses to Average Net Assets | | | 1.54 | % | | | 1.00 | %(4) |
| Ratio of Operating Expenses to Average Net Assets (Before Expense Waiver) | | | 1.65 | % | | | 1.64 | %(4) |
| Ratio of Net Investment Income (Loss) to Average Net Assets | | | 2.08 | % | | | 2.60 | %(4) |
Ratio of Net Investment Income (Loss) to Average Net Assets (Before Expense Waiver) | | | 1.97 | % | | | 1.96 | %(4) |
| Portfolio Turnover Rate | | | 21 | % | | | 16 | % |
| Net Assets, End of Period (in thousands) | | | $3,030 | | | | $2,882 | |
| (1) | June 30, 2009 (fund inception) through May 31, 2010. |
| (2) | Computed using average shares outstanding throughout the period. |
| (3) | Total returns are calculated based on the net asset value of the last business day and do not reflect applicable sales charges. Total returns for periods less than one year are not annualized. |
See Notes to Financial Statements.
Report of Independent Registered Public Accounting Firm |
To the Trustees of the American Century Municipal Trust
and Shareholders of the New York Tax-Free Bond Fund:
In our opinion, the accompanying statement of assets and liabilities, including the schedule of investments, and the related statements of operations and of changes in net assets and the financial highlights present fairly, in all material respects, the financial position of the New York Tax-Free Fund (one of the five funds comprising the American Century Municipal Trust, hereafter referred to as the “Fund”) at May 31, 2011, the results of its operations for the year then ended, the changes in its net assets for the year then ended and for the period June 30, 2009 through May 31, 2010 (commencement of operations) and the financial highlights for the periods presented in conformity with accounting principles generally accepted in the United States of America. These financial statements and financial highlights (hereafter referred to as “financial statements”) are the responsibility of the Fund’s management; our responsibility is to express an opinion on these financial statements based on our audits. We conducted our audits of these financial statements in accordance with the standards of the Public Company Accounting Oversight Board (United States). Those standards require that we plan and perform the audit to obtain reasonable assurance about whether the financial statements are free of material misstatement. An audit includes examining, on a test basis, evidence supporting the amounts and disclosures in the financial statements, assessing the accounting principles used and significant estimates made by management, and evaluating the overall financial statement presentation. We believe that our audits, which included confirmation of securities at May 31, 2011 by correspondence with the custodian and brokers, provide a reasonable basis for our opinion.
PricewaterhouseCoopers LLP
Kansas City, Missouri
July 22, 2011
A special meeting of shareholders was held on June 16, 2010, to vote on the following proposals. Each proposal received the required number of votes and was adopted. A summary of voting results is listed below each proposal.
Proposal 1:
To elect one Trustee to the Board of Trustees of American Century Municipal Trust (the proposal was voted on by all shareholders of funds issued by American Century Municipal Trust):
| | | |
| Frederick L.A. Grauer | For: | 1,732,355,276 |
| | Withhold: | 67,363,643 |
| | Abstain: | 0 |
| | Broker Non-Vote: | 0 |
The other trustees whose term of office continued after the meeting include Jonathan S. Thomas, John Freidenrich, Ronald J. Gilson, Peter F. Pervere, Myron S. Scholes, and John B. Shoven.
Proposal 2:
To approve a management agreement between the fund and American Century Investment Management, Inc.:
| | | |
| Investor, A, and C Classes | For: | 9,480,391 |
| | Against: | 150,880 |
| | Abstain: | 631,286 |
| | Broker Non-Vote: | 5,212,954 |
The individuals listed below serve as trustees of the funds. Each trustee will continue to serve in this capacity until death, retirement, resignation or removal from office. The mandatory retirement age for trustees who are not “interested persons,” as that term is defined in the Investment Company Act (independent trustees), is 73. However, the mandatory retirement age may be extended for a period not to exceed two years with the approval of the remaining independent trustees.
Mr. Thomas is the only trustee who is an “interested person” because he currently serves as President and Chief Executive Officer of American Century Companies, Inc. (ACC), the parent company of American Century Investment Management, Inc. (ACIM or the advisor).
The other trustees (more than three-fourths of the total number) are independent; that is, they have never been employees, directors or officers of, and have no financial interest in, ACC or any of its wholly owned, direct or indirect, subsidiaries, including ACIM, American Century Investment Services, Inc. (ACIS) and American Century Services, LLC (ACS). The trustees serve in this capacity for eight (in the case of Mr. Thomas, 15) registered investment companies in the American Century Investments family of funds.
The following presents additional information about the trustees. The mailing address for each trustee other than Mr. Thomas is 1665 Charleston Road, Mountain View, California 94043. The mailing address for Mr. Thomas is 4500 Main Street, Kansas City, Missouri 64111.
| | | | | | |
Name (Year of Birth) | Position(s) Held with Funds | Length of Time Served | Principal Occupation(s) During Past 5 Years | Number of American Century Portfolios Overseen by Trustee | Other Directorships Held During Past 5 Years |
| Independent Trustees |
Tanya S. Beder (1955) | Trustee | Since 2011 | Chairman, SBCC Group Inc. (investment advisory services)(2006 to present); Fellow in Practice, International Center for Finance, Yale University School of Management (1985 to present); Chief Executive Officer, Tribeca Global Management LLC (asset management firm) (2004 to 2006) | 40 | None |
Jeremy I. Bulow (1954) | Trustee | Since 2011 | Professor of Economics, Stanford University, Graduate School of Business (1979 to present) | 40 | None |
John Freidenrich (1937) | Trustee | Since 2005 | Founder, Member and Manager, Regis Management Company, LLC (investment management firm) (April 2004 to present) | 40 | None |
| | | | | | |
Name (Year of Birth) | Position(s) Held with Funds | Length of Time Served | Principal Occupation(s) During Past 5 Years | Number of American Century Portfolios Overseen by Trustee | Other Directorships Held During Past 5 Years |
| Independent Trustees |
Ronald J. Gilson (1946) | Trustee and Chairman of the Board | Since 1995 | Charles J. Meyers Professor of Law and Business, Stanford Law School (1979 to present); Marc and Eva Stern Professor of Law and Business, Columbia University School of Law (1992 to present) | 40 | None |
Frederick L. A. Grauer (1946) | Trustee | Since 2008 | Senior Advisor, BlackRock, Inc. (investment management firm) (2010 to 2011); Senior Advisor, Barclays Global Investors (investment management firm) (2003 to 2009) | 40 | None |
Peter F. Pervere (1947) | Trustee | Since 2007 | Retired | 40 | Intraware, Inc. (2003 to 2009) |
Myron S. Scholes (1941) | Trustee | Since 1980 | Chairman, Platinum Grove Asset Management, L.P. (asset manager) (1999 to 2009); Frank E. Buck Professor of Finance-Emeritus, Stanford Graduate School of Business (1996 to present) | 40 | Dimensional Fund Advisors (investment advisor); CME Group, Inc. (futures and options exchange) |
John B. Shoven (1947) | Trustee | Since 2002 | Professor of Economics, Stanford University (1973 to present) | 40 | Cadence Design Systems; Exponent; Financial Engines; Watson Wyatt Worldwide (2002 to 2006) |
| |
| Interested Trustee |
Jonathan S. Thomas (1963) | Trustee and President | Since 2007 | President and Chief Executive Officer, ACC (March 2007 to present); Chief Administrative Officer, ACC (February 2006 to February 2007); Executive Vice President, ACC (November 2005 to February 2007). Also serves as: Chief Executive Officer and Manager, ACS; Executive Vice President, ACIM; Director, ACC, ACIM and other ACC subsidiaries | 104 | None |
Officers
The following table presents certain information about the executive officers of the funds. Each officer serves as an officer for each of the 15 investment companies in the American Century family of funds, unless otherwise noted. No officer is compensated for his or her service as an officer of the funds. The listed officers are interested persons of the funds and are appointed or re-appointed on an annual basis. The mailing address for each of the officers listed below is 4500 Main Street, Kansas City, Missouri 64111.
| | | |
Name (Year of Birth) | Offices with the Funds | Principal Occupation(s) During the Past Five Years |
| Officers |
Jonathan S. Thomas (1963) | Trustee and President since 2007 | President and Chief Executive Officer, ACC (March 2007 to present); Chief Administrative Officer, ACC (February 2006 to February 2007); Executive Vice President, ACC (November 2005 to February 2007). Also serves as: Chief Executive Officer and Manager, ACS; Executive Vice President, ACIM; Director, ACC, ACIM and other ACC subsidiaries |
Barry Fink (1955) | Executive Vice President since 2007 | Chief Operating Officer and Executive Vice President, ACC (September 2007 to present); President, ACS (October 2007 to present); Managing Director, Morgan Stanley (2000 to 2007); Global General Counsel, Morgan Stanley (2000 to 2006). Also serves as: Manager, ACS and Director, ACC and certain ACC subsidiaries |
Maryanne L. Roepke (1956) | Chief Compliance Officer since 2006 and Senior Vice President since 2000 | Chief Compliance Officer, American Century funds, ACIM and ACS (August 2006 to present); Assistant Treasurer, ACC (January 1995 to August 2006); and Treasurer and Chief Financial Officer, various American Century funds (July 2000 to August 2006). Also serves as: Senior Vice President, ACS |
Charles A. Etherington (1957) | General Counsel since 2007 and Senior Vice President since 2006 | Attorney, ACC (February 1994 to present); Vice President, ACC (November 2005 to present), General Counsel, ACC (March 2007 to present); Also serves as General Counsel, ACIM, ACS, ACIS and other ACC subsidiaries; and Senior Vice President, ACIM and ACS |
Robert J. Leach (1966) | Vice President, Treasurer and Chief Financial Officer since 2006 | Vice President, ACS (February 2000 to present); and Controller, various American Century funds (1997 to September 2006) |
David H. Reinmiller (1963) | Vice President since 2001 | Attorney, ACC (January 1994 to present); Associate General Counsel, ACC (January 2001 to present); Also serves as Vice President, ACIM and ACS |
Ward D. Stauffer (1960) | Secretary since 2005 | Attorney, ACC (June 2003 to Present) |
The Statement of Additional Information has additional information about the fund’s trustees and is available without charge, upon request, by calling 1-800-345-2021.
Proxy Voting Guidelines
American Century Investment Management, Inc., the fund’s investment advisor, is responsible for exercising the voting rights associated with the securities purchased and/or held by the fund. A description of the policies and procedures the advisor uses in fulfilling this responsibility is available without charge, upon request, by calling 1-800-345-2021. It is also available on American Century Investments’ website at americancentury.com and on the Securities and Exchange Commission’s website at sec.gov. Information regarding how the investment advisor voted proxies relating to portfolio securities during the most recent 12-month period ended June 30 is available on the “About Us” page at americancentury.com. It is also available at sec.gov.
Quarterly Portfolio Disclosure
The fund files its complete schedule of portfolio holdings with the Securities and Exchange Commission (SEC) for the first and third quarters of each fiscal year on Form N-Q. The fund’s Forms N-Q are available on the SEC’s website at sec.gov, and may be reviewed and copied at the SEC’s Public Reference Room in Washington, DC. Information on the operation of the Public Reference Room may be obtained by calling 1-800-SEC-0330. The fund also makes its complete schedule of portfolio holdings for the most recent quarter of its fiscal year available on its website at americancentury.com and, upon request, by calling 1-800-345-2021.
Other Tax Information
The following information is provided pursuant to provisions of the Internal Revenue Code.
The fund designates $774,399 as exempt interest dividends for the fiscal year ended May 31, 2011.
| Contact Us | americancentury.com |
| Automated Information Line | 1-800-345-8765 |
| Investor Services Representative | 1-800-345-2021 or 816-531-5575 |
| Investors Using Advisors | 1-800-378-9878 |
| Business, Not-For-Profit, Employer-Sponsored Retirement Plans | 1-800-345-3533 |
| Banks and Trust Companies, Broker-Dealers, Financial Professionals, Insurance Companies | 1-800-345-6488 |
| Telecommunications Device for the Deaf | 1-800-634-4113 |
American Century Municipal Trust
Investment Advisor:
American Century Investment Management, Inc.
Kansas City, Missouri
This report and the statements it contains are submitted for the general information of our shareholders. The report is not authorized for distribution to prospective investors unless preceded or accompanied by an effective prospectus.
©2011 American Century Proprietary Holdings, Inc. All rights reserved.
CL-ANN-72036 1107
ANNUAL REPORT MAY 31, 2011
| | Tax-Free Money Market Fund |
| President’s Letter | 2 |
| Market Perspective | 3 |
| Performance | 4 |
| Fund Characteristics | 5 |
| Shareholder Fee Example | 6 |
| Schedule of Investments | 8 |
| Statement of Assets and Liabilities | 12 |
| Statement of Operations | 13 |
| Statement of Changes in Net Assets | 14 |
| Notes to Financial Statements | 15 |
| Financial Highlights | 18 |
| Report of Independent Registered Public Accounting Firm | 19 |
| Proxy Voting Results | 20 |
| Management | 21 |
| Additional Information | 24 |
Any opinions expressed in this report reflect those of the author as of the date of the report, and do not necessarily represent the opinions of American Century Investments® or any other person in the American Century Investments organization. Any such opinions are subject to change at any time based upon market or other conditions and American Century Investments disclaims any responsibility to update such opinions. These opinions may not be relied upon as investment advice and, because investment decisions made by American Century Investments funds are based on numerous factors, may not be relied upon as an indication of trading intent on behalf of any American Century Investments fund. Security examples are used for representational purposes only and are not intended as recommendations to purchase or sell securities. Performance information for comparative indices and securities is provided to American Century Investments by third party vendors. To the best of American Century Investments’ knowledge, such information is accurate at the time of printing.
Jonathan Thomas
Dear Investor:
Thank you for reviewing this annual report for the period ended May 31, 2011. Our report offers investment performance and portfolio information, presented with the expert perspective and commentary of our portfolio management team.
This report remains one of our most important vehicles for conveying the information you need about your investment performance, and about the market factors and strategies that affect fund returns. For additional, updated information on fund performance, portfolio strategy, and the investment markets, we encourage you to visit our website, americancentury.com. Click on the “Fund Performance” and “Insights & News” headings at the top of our Individual Investors site.
Municipal Bond (Muni) Market Update
As described in greater detail on the following pages, muni market conditions have improved significantly since our semiannual report for the six months ended November 30, 2010. That reporting period concluded during a two-and-a-half month span (from the end of October 2010 to the middle of January 2011) when muni prices plunged and yields soared as a supply and demand imbalance (explained on page 3) roiled the market. That turbulence was compounded by overblown default fears fueled by highly publicized pessimistic analyst reports that helped trigger a wave of withdrawals from muni mutual funds.
As 2011 unfolded, muni issuance declined dramatically and demand surged—falling prices and relatively high yields attracted an influx of opportunistic “cross-over” (non-typical) buyers to the muni market. Munis rallied from mid-January through the end of the full 12-month reporting period, rewarding those who stayed the course and saw the turbulence as a buying opportunity. Muni defaults have not approached the rates projected by pessimistic pundits at the end of last year, and additional economic growth—as well as increased municipal government austerity and budget-balancing measures—have helped stabilize municipal credit conditions since then.
These developments over the more-recent six months are incorporated in the broader, enclosed 12-month Market Perspective from our muni portfolio management team. These dedicated experts will continue to diligently apply their knowledge and skills as they make daily investment decisions for you.
Sincerely,
Jonathan Thomas
President and Chief Executive Officer
American Century Investments
By David MacEwen, Chief Investment Officer, Fixed Income
Municipal bond (muni) indices advanced for the 12 months ended May 31, 2011 (see the table below), but these moderately positive returns masked considerable volatility, particularly during the last seven months of the period.
Munis rallied modestly through the first five months of the period as U.S. economic conditions generally improved, providing a lift to munis and other credit-sensitive instruments. But market conditions changed dramatically from November 2010 through January 2011 as a supply and demand imbalance triggered a sharp decline in the muni market. Supply rose substantially as muni issuers rushed to take advantage of the Build America Bonds (BABs) program (in which states and municipalities issue taxable securities with federally subsidized interest rates) before its expiration at the end of 2010. Meanwhile, demand cratered as credit concerns—sparked by persistent state budget deficits and exaggerated media predictions of widespread muni defaults—led to heavy outflows from muni mutual funds.
The muni market bottomed in mid-January and then rebounded during the remainder of the period as a number of opportunistic, non-traditional “cross-over” investors gravitated to relatively attractive muni yields. Limited new issuance also contributed favorably to muni market performance—new muni issuance in the first five months of 2011 fell by 51% compared with the same period in 2010, constrained by issuer austerity measures and the expiration of the BABs program, which accelerated into 2010 many new issues that would otherwise have come to market in early 2011.
However, the severe decline from November through January dropped munis to the lower end of the investment return spectrum in a 12-month period dominated by stocks and high-yield corporate bonds. In addition, munis generally trailed the returns of Treasury securities and the broad taxable bond market. Intermediate-term munis fared best as short-term munis were held in check by a stable interest rate policy from the Federal Reserve, while longer-term munis suffered disproportionately from muni fund outflows. From a credit and sector perspective, higher-quality munis outperformed lower-rated credits, while general obligation bonds outpaced tax revenue bonds. Within the revenue bond segment, essential services bonds posted the best results, while health care lagged.
| U.S. Fixed-Income Total Returns |
| For the 12 months ended May 31, 2011 |
| Barclays Capital Municipal Market Indices | | Barclays Capital U.S. Taxable Market Indices |
| 7 Year Municipal Bond | 5.22% | | Aggregate Bond | 5.84% |
| Municipal High Yield Bond | 4.04% | | Treasury Bond | 4.49% |
| Municipal Bond | 3.18% | | | |
| Long-Term Municipal Bond | 1.49% | | | |
| Total Returns as of May 31, 2011 |
| | | | Average Annual Returns | |
| | Ticker Symbol | 1 year | 5 years | 10 years | Since Inception | Inception Date |
| Investor Class | BNTXX | 0.07%(1) | 1.58% | 1.51% | 2.99%(1) | 7/31/84 |
| (1) | Returns would have been lower if a portion of the management fee had not been waived. |
| Total Annual Fund Operating Expenses |
Investor Class 0.51% |
The total annual fund operating expenses shown is as stated in the fund’s prospectus current as of the date of this report. The prospectus may vary from the expense ratio shown elsewhere in this report because it is based on a different time period, includes acquired fund fees and expenses, and, if applicable, does not include fee waivers or expense reimbursements.
Data presented reflect past performance. Past performance is no guarantee of future results. Current performance may be higher or lower than the performance shown. To obtain performance data current to the most recent month end, please call 1-800-345-2021 or visit americancentury.com. Investment income may be subject to certain state and local taxes and, depending on your tax status, the federal alternative minimum tax (AMT). Capital gains are not exempt from state and federal income tax.
An investment in the fund is not insured or guaranteed by the Federal Deposit Insurance Corporation or any other government agency. Although the fund seeks to preserve the value of your investment at $1.00 per share, it is possible to lose money by investing in the fund.
The 7-day current yield more closely reflects the current earnings of the fund than the total return.
| MAY 31, 2011 |
| 7-Day Current Yield |
After waiver(1) | 0.01% |
| Before waiver | -0.06% |
| 7-Day Effective Yield |
After waiver(1) | 0.01% |
7-Day Tax-Equivalent Current Yields(1)(2) | |
| 25.00% Tax Bracket | 0.01% |
| 28.00% Tax Bracket | 0.01% |
| 33.00% Tax Bracket | 0.01% |
| 35.00% Tax Bracket | 0.02% |
(1)Yields would have been lower if a portion of the management fee had not been waived. |
(2)The tax brackets indicated are for federal taxes only. Actual tax-equivalent yields may be lower, if alternative minimum tax is applicable. |
| | |
| Portfolio at a Glance | |
| Weighted Average Maturity | 10 days |
| Weighted Average Life | 12 days |
| | |
| Portfolio Composition by Maturity | % of fund investments |
| 1-30 days | 97% |
| 31-90 days | — |
| 91-180 days | 3% |
| More than 180 days | — |
Fund shareholders may incur two types of costs: (1) transaction costs, including sales charges (loads) on purchase payments and redemption/exchange fees; and (2) ongoing costs, including management fees; distribution and service (12b-1) fees; and other fund expenses. This example is intended to help you understand your ongoing costs (in dollars) of investing in your fund and to compare these costs with the ongoing cost of investing in other mutual funds.
The example is based on an investment of $1,000 made at the beginning of the period and held for the entire period from December 1, 2010 to May 31, 2011.
Actual Expenses
The table provides information about actual account values and actual expenses for each class. You may use the information, together with the amount you invested, to estimate the expenses that you paid over the period. First, identify the share class you own. Then simply divide your account value by $1,000 (for example, an $8,600 account value divided by $1,000 = 8.6), then multiply the result by the number under the heading “Expenses Paid During Period” to estimate the expenses you paid on your account during this period.
If you hold Investor Class shares of any American Century Investments fund, or Institutional Class shares of the American Century Diversified Bond Fund, in an American Century Investments account (i.e., not a financial intermediary or retirement plan account), American Century Investments may charge you a $12.50 semiannual account maintenance fee if the value of those shares is less than $10,000. We will redeem shares automatically in one of your accounts to pay the $12.50 fee. In determining your total eligible investment amount, we will include your investments in all personal accounts (including American Century Investments Brokerage accounts) registered under your Social Security number. Personal accounts include individual accounts, joint accounts, UGMA/UTMA accounts, personal trusts, Coverdell Education Savings Accounts and IRAs (including traditional, Roth, Rollover, SEP-, SARSEP- and SIMPLE-IRAs), and certain other retirement accounts. If you have only business, business retirement, employer-sponsored or American Century Investments Brokerage accounts, you are currently not subject to this fee. We will not charge the fee as long as you choose to manage your accounts exclusively online. If you are subject to the Account Maintenance Fee, your account value could be reduced by the fee amount.
Hypothetical Example for Comparison Purposes
The table also provides information about hypothetical account values and hypothetical expenses based on the actual expense ratio of each class of your fund and an assumed rate of return of 5% per year before expenses, which is not the actual return of a fund’s share class. The hypothetical account values and expenses may not be used to estimate the actual ending account balance or expenses you paid for the period. You may use this information to compare the ongoing costs of investing in your fund and other funds. To do so, compare this 5% hypothetical example with the 5% hypothetical examples that appear in the shareholder reports of the other funds.
Please note that the expenses shown in the table are meant to highlight your ongoing costs only and do not reflect any transactional costs, such as sales charges (loads) or redemption/exchange fees. Therefore, the table is useful in comparing ongoing costs only, and will not help you determine the relative total costs of owning different funds. In addition, if these transactional costs were included, your costs would have been higher.
| | | | | | | | | |
| | | Beginning Account Value 12/1/10 | | Ending Account Value 5/31/11 | | Expenses Paid During Period(1) 12/1/10 - 5/31/11 | | Annualized Expense Ratio(1) |
| Actual | |
Investor Class (after waiver) | | | $1,000 | | | | $1,000.40 | | | | $2.19 | | | | 0.44 | % |
Investor Class (before waiver) | | | $1,000 | | | | $1,000.40 | (2) | | | $2.49 | | | | 0.50 | % |
| Hypothetical | |
Investor Class (after waiver) | | | $1,000 | | | | $1,022.74 | | | | $2.22 | | | | 0.44 | % |
Investor Class (before waiver) | | | $1,000 | | | | $1,022.44 | | | | $2.52 | | | | 0.50 | % |
| (1) | Expenses are equal to the class’s annualized expense ratio listed in the table above, multiplied by the average account value over the period, multiplied by 182, the number of days in the most recent fiscal half-year, divided by 365, to reflect the one-half year period. |
| (2) | Ending account value assumes the return earned after waiver and would have been lower if a portion of the management fee had not been waived. |
| | | | | | | |
| | | Principal Amount | | | Value | |
| Municipal Securities — 99.0% | |
| ALABAMA — 0.9% | |
| Troy Health Care Auth. Rev., (Southeast Rural Health), VRDN, 0.28%, 6/2/11 (LOC: Troy Bank and Trust Co. and FHLB) | | | $2,075,000 | | | | $2,075,000 | |
| CALIFORNIA — 17.3% | |
| Alameda County Industrial Development Auth. Rev., (BAT Properties LLC), VRDN, 0.33%, 6/2/11 (LOC: Bank of the West) | | | 4,100,000 | | | | 4,100,000 | |
| California School Cash Reserve Program Auth. Rev., Series 2010 B, 2.00%, 6/1/11 | | | 1,800,000 | | | | 1,800,000 | |
| California Statewide Communities Development Auth. Rev., (Trinity Children & Family), VRDN, 0.38%, 6/1/11 (LOC: Citizens Business Bank and California State Teacher’s Retirement) | | | 620,000 | | | | 620,000 | |
| Los Angeles Unified School District Tax & Rev. Anticipation Notes GO, Series 2010 A, 2.00%, 6/30/11 | | | 3,000,000 | | | | 3,003,148 | |
| Riverside County Rev., (Teeter Notes), 2.00%, 10/12/11 | | | 2,680,000 | | | | 2,692,598 | |
| Santa Rosa Wastewater Rev., Series 2004 A, VRDN, 0.33%, 6/2/11 (LOC: Landesbank Baden-Wurttemberg) | | | 16,900,000 | | | | 16,900,000 | |
| Victorville Joint Powers Financing Auth. Lease Rev., Series 2007 A, (Cogeneration Facility), VRDN, 1.50%, 6/2/11 (LOC: BNP Paribas) | | | 11,840,000 | | | | 11,840,000 | |
| | | | | | | | 40,955,746 | |
| COLORADO — 2.4% | |
| Avon Industrial Development Rev., (Kroger Co.), VRDN, 0.25%, 6/1/11 (LOC: U.S. Bank N.A.) | | | 2,745,000 | | | | 2,745,000 | |
| Thornton Industrial Development Rev., (Kroger Co.), VRDN, 0.25%, 6/1/11 (LOC: U.S. Bank N.A.) | | | 2,900,000 | | | | 2,900,000 | |
| | | | | | | | 5,645,000 | |
| DELAWARE — 7.1% | |
| Delaware Health Facilities Auth. Rev., (Beebe Medical Center), VRDN, 0.26%, 6/2/11 (LOC: PNC Bank N.A.) | | | 16,805,000 | | | | 16,805,000 | |
| FLORIDA — 4.4% | |
| DeSoto County Industrial Development Rev., (Tremron, Inc.), VRDN, 0.29%, 6/2/11 (LOC: Branch Banking & Trust Co.) | | | 2,000,000 | | | | 2,000,000 | |
| Escambia County Solid Waste Disposal System Rev., (Gulf Power Co.), VRDN, 0.19%, 6/1/11 | | | 4,800,000 | | | | 4,800,000 | |
JP Morgan Chase Trust Rev., Series 2009-3439, (PUTTERs/DRIVERs), VRDN, 0.28%, 6/2/11 (AGM-CR/XLCA) (LIQ FAC: JPMorgan Chase Bank N.A.)(1) | | | 3,695,000 | | | | 3,695,000 | |
| | | | | | | | 10,495,000 | |
| GEORGIA — 8.2% | |
| Clayton County Multi-Family Housing Auth. Rev., Series 1990 B, (Kimberly Forest), VRDN, 0.94%, 6/1/11 (AGM) (SBBPA: Societe Generale) | | | 6,155,000 | | | | 6,155,000 | |
| Clayton County Multi-Family Housing Auth. Rev., Series 1990 C, (Villa Rouge Apartments), VRDN, 0.94%, 6/1/11 (AGM) (SBBPA: Societe Generale) | | | 6,955,000 | | | | 6,955,000 | |
| Clayton County Multi-Family Housing Auth. Rev., Series 1990 D, (Kings Arms Apartments), VRDN, 0.94%, 6/1/11 (AGM) (SBBPA: Societe Generale) | | | 3,315,000 | | | | 3,315,000 | |
| Savannah Economic Development Auth. Rev., (YMCA of Coastal Georgia, Inc.), VRDN, 0.22%, 6/1/11 (LOC: Bank of America N.A.) | | | 1,460,000 | | | | 1,460,000 | |
| Stephens County Development Auth. Solid Waste Disposable Facilities Rev., (Caterpillar, Inc.), VRDN, 0.53%, 6/2/11 | | | 1,520,000 | | | | 1,520,000 | |
| | | | | | | | 19,405,000 | |
| HAWAII — 0.4% | |
| Hawaii State Department of Budget & Finance Rev., Series 1999 A, (Palama Meat Co.), VRDN, 0.35%, 6/2/11 (LOC: Wells Fargo Bank N.A.) | | | $1,000,000 | | | | $1,000,000 | |
| ILLINOIS — 6.8% | |
Illinois Development Finance Auth. Rev., (Solomon Schechter Day School), VRDN, 0.40%, 6/1/11 (LOC: Bank of America N.A.)(1) | | | 4,000,000 | | | | 4,000,000 | |
| Illinois Finance Auth. Rev., (Merit School of Music), VRDN, 0.40%, 6/1/11 (LOC: Bank of America N.A.) | | | 1,900,000 | | | | 1,900,000 | |
Illinois Finance Auth. Rev., (Village of Oak Park Residence), VRDN, 0.33%, 6/1/11 (LOC: Bank of America N.A.)(1) | | | 4,000,000 | | | | 4,000,000 | |
| Illinois Housing Development Auth. Multi-Family Housing Rev., (Rome Meadows), VRDN, 0.59%, 6/2/11 (LOC: First National Bank and FHLB) | | | 1,910,000 | | | | 1,910,000 | |
| McCook Rev., Series 1996 A, (St. Andrew Society), VRDN, 0.20%, 6/1/11 (LOC: Northern Trust Company) | | | 600,000 | | | | 600,000 | |
| McCook Rev., Series 1996 B, (St. Andrew Society), VRDN, 0.20%, 6/1/11 (LOC: Northern Trust Company) | | | 1,700,000 | | | | 1,700,000 | |
| Rock Island County Metropolitan Airport Auth. Rev., (Elliott Aviation), VRDN, 0.37%, 6/1/11 (LOC: U.S. Bank N.A.) | | | 2,155,000 | | | | 2,155,000 | |
| | | | | | | | 16,265,000 | |
| INDIANA — 2.2% | |
Indiana Finance Auth. Industrial Development Rev., (TTP, Inc.), VRDN, 0.48%, 6/1/11 (LOC: Bank of America N.A.)(1) | | | 2,135,000 | | | | 2,135,000 | |
| Indiana Health Facility Financing Auth. Rev., (Stone Belt Arc, Inc.), VRDN, 0.40%, 6/1/11 (LOC: JPMorgan Chase Bank N.A.) | | | 400,000 | | | | 400,000 | |
| Jasper County Industrial Development Rev., (Newberry Farms LLC), VRDN, 0.33%, 6/1/11 (LOC: Farm Credit Services of America and Bank of the West) | | | 2,800,000 | | | | 2,800,000 | |
| | | | | | | | 5,335,000 | |
| IOWA — 2.6% | |
| Iowa Finance Auth. Economic Development Rev., Series 2009 B, (Midwestern Disaster Area), VRDN, 0.25%, 6/1/11 | | | 4,000,000 | | | | 4,000,000 | |
| Iowa Finance Auth. Industrial Development Rev., (Embria Health Sciences), VRDN, 0.35%, 6/2/11 (LOC: Wells Fargo Bank N.A.) | | | 1,000,000 | | | | 1,000,000 | |
| Iowa Higher Education Loan Auth. Rev., (Des Moines), VRDN, 0.13%, 6/1/11 (LOC: U.S. Bank N.A.) | | | 1,150,000 | | | | 1,150,000 | |
| | | | | | | | 6,150,000 | |
| KANSAS — 0.5% | |
Shawnee Private Activity Rev., (Simmons Co.), VRDN, 0.35%, 6/1/11 (LOC: Wells Fargo Bank N.A.)(1) | | | 1,310,000 | | | | 1,310,000 | |
| KENTUCKY — 0.4% | |
| Winchester Industrial Building Rev., (Kroger Co.), VRDN, 0.25%, 6/1/11 (LOC: U.S. Bank N.A.) | | | 1,000,000 | | | | 1,000,000 | |
| LOUISIANA — 2.3% | |
| Louisiana Local Government Environmental Facilities & Community Development Auth. Rev., (Hollybrook Enterprises LLC), VRDN, 0.28%, 6/1/11 (LOC: First South Farm Credit and Wells Fargo Bank N.A.) | | | 1,760,000 | | | | 1,760,000 | |
| Terrebonne Economic Development Auth. Gulf Opportunity Zone Rev., (Buquet Distribution Co.), VRDN, 0.44%, 6/2/11 (LOC: Community Bank and FHLB) | | | 3,680,000 | | | | 3,680,000 | |
| | | | | | | | 5,440,000 | |
| MAINE — 0.5% | |
| Dover-Foxcroft Rev., (Pleasant River), VRDN, 0.33%, 6/1/11 (LOC: CoBANK ACB and Wells Fargo Bank N.A.) | | | 1,160,000 | | | | 1,160,000 | |
| MARYLAND — 3.6% | |
| Baltimore Industrial Development Auth. Rev., (Baltimore Capital Acquisition), VRDN, 0.20%, 6/1/11 (LOC: Bayerische Landesbank) | | | $7,395,000 | | | | $7,395,000 | |
| Maryland Economic Development Corp. Rev., (Blind Industries & Services), VRDN, 0.28%, 6/1/11 (LOC: Bank of America N.A.) | | | 1,215,000 | | | | 1,215,000 | |
| | | | | | | | 8,610,000 | |
| MASSACHUSETTS — 3.0% | |
Macon Trust Various States Rev., Series 2007-344, VRDN, 0.35%, 6/1/11 (LOC: Bank of America N.A.) (LIQ FAC: Bank of America N.A.)(1) | | | 5,618,000 | | | | 5,618,000 | |
| Massachusetts Industrial Finance Agency. Rev., (Abbott Box Co., Inc.), VRDN, 0.41%, 6/1/11 (LOC: Sovereign Bank F.S.B. and Bank of New York) | | | 1,415,000 | | | | 1,415,000 | |
| | | | | | | | 7,033,000 | |
| MISSISSIPPI — 0.7% | |
| Mississippi Business Finance Corp. Rev., Series 2004 B, VRDN, 0.30%, 6/1/11 (LOC: Wells Fargo Bank N.A.) | | | 1,715,000 | | | | 1,715,000 | |
| MISSOURI — 2.4% | |
| St. Louis County Industrial Development Educational Facilities Auth. Rev., (Gateway Academy), VRDN, 0.28%, 6/2/11 (LOC: Midland States Bank N.A. & FHLB) | | | 5,650,000 | | | | 5,650,000 | |
| NEW YORK — 1.3% | |
| New York City Capital Resources Corp. Rev., Series 2008 B3, (Various Loan Enhanced Assistance), VRDN, 0.27%, 6/1/11 (LOC: Bank of America N.A.) | | | 2,500,000 | | | | 2,500,000 | |
| New York City Industrial Development Agency Civic Facility Rev., (Peninsula Hospital Center), VRDN, 0.66%, 6/2/11 (LOC: JPMorgan Chase Bank N.A.) | | | 595,000 | | | | 595,000 | |
| | | | | | | | 3,095,000 | |
| NORTH CAROLINA — 2.7% | |
| Buncombe County GO, Series 2002 B, VRDN, 0.28%, 6/2/11 (SBBPA: Wells Fargo Bank N.A.) | | | 1,050,000 | | | | 1,050,000 | |
Iredell County Industrial Facilities & Pollution Control Financing Auth. Rev., (Valspar Corp.), VRDN, 0.35%, 6/2/11 (LOC: Wells Fargo Bank N.A.)(1) | | | 1,100,000 | | | | 1,100,000 | |
| North Carolina Capital Facilities Finance Agency Rev., (Montessori Children’s Center), VRDN, 0.29%, 6/1/11 (LOC: Bank of America N.A.) | | | 1,175,000 | | | | 1,175,000 | |
| North Carolina Housing Finance Agency Rev., Series 2000 A, (Appalachian Student Housing Corp.), VRDN, 0.28%, 6/1/11 (LOC: Wells Fargo Bank N.A.) | | | 710,000 | | | | 710,000 | |
| North Carolina Medical Care Commission Health Care Facilities Rev., (Carolina Village, Inc.), VRDN, 0.28%, 6/2/11 (LOC: First Citizens Bank and Trust Co. and Wells Fargo Bank N.A.) | | | 1,400,000 | | | | 1,400,000 | |
North Carolina Medical Care Commission Health Care Facilities Rev., (Stanley Total Living Center), VRDN, 0.28%, 6/2/11 (LOC: Wells Fargo Bank N.A.)(1) | | | 905,000 | | | | 905,000 | |
| | | | | | | | 6,340,000 | |
| OHIO — 1.1% | |
| Allen County Health Care Facilities Rev., (Mennonite Memorial Home), VRDN, 0.28%, 6/2/11 (LOC: Wells Fargo Bank N.A.) | | | 940,000 | | | | 940,000 | |
| University of Toledo Rev., Series 2008 B, VRDN, 0.15%, 6/1/11 (LOC: JPMorgan Chase & Co.) | | | 1,600,000 | | | | 1,600,000 | |
| | | | | | | | 2,540,000 | |
| OKLAHOMA — 1.4% | |
Guymon Utilities Auth. Rev., (Seaboard Corp.), VRDN, 0.30%, 6/1/11 (LOC: Bank of the West)(1) | | | 3,300,000 | | | | 3,300,000 | |
| PENNSYLVANIA — 4.8% | |
| Berks County Municipal Auth. Rev., Series 2009 A5, (Reading Hospital & Medical Center), VRN,0.38%, 6/2/11 | | | $11,285,000 | | | | $11,285,000 | |
| PUERTO RICO — 0.5% | |
Austin Trust Various States Rev., Series 2008-355, VRDN, 0.34%, 6/1/11 (LOC: Bank of America N.A.) (SBBPA: Bank of America N.A.)(1) | | | 1,084,000 | | | | 1,084,000 | |
| TENNESSEE — 3.3% | |
| Bradley County Industrial Development Board Rev., (Kroger Co.), VRDN, 0.25%, 6/1/11 (LOC: Bank of Nova Scotia) | | | 7,880,000 | | | | 7,880,000 | |
| TEXAS — 14.2% | |
| Brazos Harbor Industrial Development Corp. Rev., (BASF Corp.), VRDN, 0.32%, 6/1/11 | | | 11,500,000 | | | | 11,500,000 | |
| Crawford Education Facilities Corp. Rev., Series 2004 A, (University Parking System), VRDN, 0.40%, 6/2/11 (LOC: BNP Paribas) | | | 9,500,000 | | | | 9,500,000 | |
| Hale County Industrial Development Corp. Rev., (Struikmans), VRDN, 0.33%, 6/1/11 (LOC: Farm Credit Services of America and Bank of the West) | | | 3,000,000 | | | | 3,000,000 | |
| Muleshoe Economic Development Corp. Industrial Development Rev., (John Lyle & Grace Ajean), VRDN, 0.28%, 6/2/11 (LOC: Wells Fargo Bank N.A.) | | | 4,755,000 | | | | 4,755,000 | |
| Texas Tax & Revenue Anticipation Notes Rev., 2.00%, 8/31/11 | | | 5,000,000 | | | | 5,020,743 | |
| | | | | | | | 33,775,743 | |
| WASHINGTON — 2.3% | |
| Washington Economic Development Finance Auth. Rev., Series 2007 E, (Mesa Dairy LLC.), VRDN, 0.28%, 6/2/11 (LOC: Citizens Business Bank and Wells Fargo Bank N.A.) | | | 3,780,000 | | | | 3,780,000 | |
| Washington Finance Commission Nonprofit Housing Rev., (Nikkei Manor), VRDN, 0.49%, 6/1/11 (LOC: Bank of America N.A.) | | | 1,750,000 | | | | 1,750,000 | |
| | | | | | | | 5,530,000 | |
| WISCONSIN — 1.7% | |
| Milwaukee Redevelopment Auth. Rev., (La Causa, Inc.), VRDN, 0.42%, 6/1/11 (LOC: U.S. Bank N.A.) | | | 2,175,000 | | | | 2,175,000 | |
| Wisconsin Health & Educational Facilities Auth. Rev., (Edgewood College), VRDN, 0.13%, 6/1/11 (LOC: U.S. Bank N.A.) | | | 1,450,000 | | | | 1,450,000 | |
| Wisconsin Health & Educational Facilities Auth. Rev., Series 2008 A, (ProHealth Care, Inc.), VRDN, 0.13%, 6/1/11 (LOC: U.S. Bank N.A.) | | | 500,000 | | | | 500,000 | |
| | | | | | | | 4,125,000 | |
| TOTAL INVESTMENT SECURITIES — 99.0% | | | | 235,003,489 | |
| OTHER ASSETS AND LIABILITIES — 1.0% | | | | 2,385,300 | |
| TOTAL NET ASSETS — 100.0% | | | | $237,388,789 | |
Notes to Schedule of Investments
AGM = Assured Guaranty Municipal Corporation
AGM-CR = Assured Guaranty Municipal Corporation -
Custodian Receipts
DRIVERs = Derivative Inverse Tax-Exempt Receipts
FHLB = Federal Home Loan Bank
GO = General Obligation
LIQ FAC = Liquidity Facilities
LOC = Letter of Credit
PUTTERs = Puttable Tax-Exempt Receipts
SBBPA = Standby Bond Purchase Agreement
VRDN = Variable Rate Demand Note. Interest reset date is indicated. Rate shown is effective at the period end.
VRN = Variable Rate Note. Interest reset date is indicated. Rate shown is effective at the period end.
XLCA = XL Capital Ltd.
| (1) | Security was purchased under Rule 144A or Section 4(2) of the Securities Act of 1933 or is a private placement and, unless registered under the Act or exempted from registration, may only be sold to qualified institutional investors. The aggregate value of these securities at the period end was $27,147,000, which represented 11.4% of total net assets. None of these securities were considered illiquid. |
See Notes to Financial Statements.
Statement of Assets and Liabilities |
| MAY 31, 2011 | |
| Assets | |
| Investment securities, at value (amortized cost and cost for federal tax purposes) | | | $235,003,489 | |
| Cash | | | 673,140 | |
| Receivable for investments sold | | | 1,475,046 | |
| Receivable for capital shares sold | | | 456,605 | |
| Interest receivable | | | 293,593 | |
| | | | 237,901,873 | |
| | | | | |
| Liabilities | |
| Payable for capital shares redeemed | | | 425,331 | |
| Accrued management fees | | | 87,636 | |
| Dividends payable | | | 117 | |
| | | | 513,084 | |
| Net Assets | | | $237,388,789 | |
| | | | | |
| Investor Class Capital Shares | |
| Shares outstanding (unlimited number of shares authorized) | | | 237,411,874 | |
| | | | | |
| Net Asset Value Per Share | | | $1.00 | |
| | | | | |
| Net Assets Consist of: | |
| Capital paid in | | | $237,392,044 | |
| Accumulated net realized loss | | | (3,255 | ) |
| | | | $237,388,789 | |
See Notes to Financial Statements.
| YEAR ENDED MAY 31, 2011 | |
| Investment Income (Loss) | |
| Income: | | | |
| Interest | | | $1,313,129 | |
| | | | | |
| Expenses: | | | | |
| Management fees | | | 1,254,064 | |
| Trustees’ fees and expenses | | | 11,118 | |
| Other expenses | | | 5,325 | |
| | | | 1,270,507 | |
| Fees waived | | | (138,407 | ) |
| | | | 1,132,100 | |
| | | | | |
| Net investment income (loss) | | | 181,029 | |
| | | | | |
| Net realized gain (loss) on investment transactions | | | 11,425 | |
| | | | | |
| Net Increase (Decrease) in Net Assets Resulting from Operations | | | $192,454 | |
See Notes to Financial Statements.
Statement of Changes in Net Assets |
| YEARS ENDED MAY 31, 2011 AND MAY 31, 2010 | |
| Increase (Decrease) in Net Assets | | 2011 | | | 2010 | |
| Operations | |
| Net investment income (loss) | | | $181,029 | | | | $636,176 | |
| Net realized gain (loss) | | | 11,425 | | | | 1,777 | |
| Net increase (decrease) in net assets resulting from operations | | | 192,454 | | | | 637,953 | |
| | | | | | | | | |
| Distributions to Shareholders | |
| From net investment income | | | (181,029 | ) | | | (636,176 | ) |
| | | | | | | | | |
| Capital Share Transactions | |
| Proceeds from shares sold | | | 132,562,468 | | | | 202,106,984 | |
| Proceeds from reinvestment of distributions | | | 175,398 | | | | 606,100 | |
| Payments for shares redeemed | | | (176,234,786 | ) | | | (256,608,412 | ) |
| Net increase (decrease) in net assets from capital share transactions | | | (43,496,920 | ) | | | (53,895,328 | ) |
| | | | | | | | | |
| | | | | | | | | |
| Net increase (decrease) in net assets | | | (43,485,495 | ) | | | (53,893,551 | ) |
| | | | | | | | | |
| Net Assets | |
| Beginning of period | | | 280,874,284 | | | | 334,767,835 | |
| End of period | | | $237,388,789 | | | | $280,874,284 | |
| | | | | | | | | |
| Transactions in Shares of the Fund | |
| Sold | | | 132,562,468 | | | | 202,106,984 | |
| Issued in reinvestment of distributions | | | 175,398 | | | | 606,100 | |
| Redeemed | | | (176,234,786 | ) | | | (256,608,412 | ) |
| Net increase (decrease) in shares of the fund | | | (43,496,920 | ) | | | (53,895,328 | ) |
See Notes to Financial Statements.
Notes to Financial Statements |
MAY 31, 2011
1. Organization
American Century Municipal Trust (the trust) is registered under the Investment Company Act of 1940, as amended (the 1940 Act), as an open-end management investment company and is organized as a Massachusetts business trust. Tax-Free Money Market Fund (the fund) is one fund in a series issued by the trust. The fund is diversified as defined under Rule 2a-7 of the 1940 Act. The fund’s investment objective is to seek safety of principal and high current income that is exempt from federal income tax. The fund pursues its objective by investing primarily in cash-equivalent, high-quality municipal obligations.
2. Significant Accounting Policies
The following is a summary of significant accounting policies consistently followed by the fund in preparation of its financial statements. The financial statements are prepared in conformity with accounting principles generally accepted in the United States of America, which may require management to make certain estimates and assumptions at the date of the financial statements. Actual results could differ from these estimates.
Investment Valuations — The fund determines the fair value of its investments and computes its net asset value per share as of the close of regular trading (usually 4 p.m. Eastern time) on the New York Stock Exchange (NYSE) on each day the NYSE is open. Securities are generally valued at amortized cost, which approximates fair value. When such valuations do not reflect fair value, securities are valued as determined in good faith by the Board of Trustees or its designee, in accordance with procedures adopted by the Board of Trustees.
Security Transactions — Security transactions are accounted for as of the trade date. Net realized gains and losses are determined on the identified cost basis, which is also used for federal income tax purposes.
Investment Income — Interest income is recorded on the accrual basis and includes accretion of discounts and amortization of premiums.
Income Tax Status — It is the fund’s policy to distribute substantially all net investment income and net realized gains to shareholders and to otherwise qualify as a regulated investment company under provisions of the Internal Revenue Code. The fund is no longer subject to examination by tax authorities for years prior to 2008. At this time, management believes there are no uncertain tax positions which, based on their technical merit, would not be sustained upon examination and for which it is reasonably possible that the total amounts of unrecognized tax benefits will significantly change in the next twelve months. Accordingly, no provision has been made for federal or state income taxes.
Distributions to Shareholders — Distributions from net investment income are declared daily and paid monthly. The fund may make short-term capital gains distributions to comply with the distribution requirements of the Internal Revenue Code. The fund does not expect to realize any long-term capital gains, and accordingly, does not expect to pay any long-term capital gains distributions.
Indemnifications — Under the trust’s organizational documents, its officers and trustees are indemnified against certain liabilities arising out of the performance of their duties to the fund. In addition, in the normal course of business, the fund enters into contracts that provide general indemnifications. The maximum exposure under these arrangements is unknown as this would involve future claims that may be made against a fund. The risk of material loss from such claims is considered by management to be remote.
3. Fees and Transactions with Related Parties
Management Fees — The trust has entered into a management agreement with American Century Investment Management, Inc. (ACIM) (the investment advisor), under which ACIM provides the fund with investment advisory and management services in exchange for a single, unified management fee (the fee). The agreement provides that all expenses of managing and operating the fund, except distribution and service fees, brokerage expenses, taxes, interest, fees and expenses of the independent trustees (including legal counsel fees), and extraordinary expenses, will be paid by ACIM. The fee is computed and accrued daily based on the daily net assets of the fund and paid monthly in arrears. The fee consists of (1) an Investment Category Fee based on the daily net assets of the fund and certain other accounts managed by the investment advisor that are in the same broad investment category as the fund and (2) a Complex Fee based on the assets of all the funds in the American Century Investments family of funds. The rates for the Investment Category Fee range from 0.1570% to 0.2700%. The rates for the Complex Fee range from 0.2500% to 0.3100%. In order to maintain a positive yield, ACIM may voluntarily waive a portion of its management fee on a daily basis. During the year ended May 31, 2011, the investment advisor voluntarily agreed to waive 0.054% of its management fee. The fee waiver continues through July 31, 2011. The effective annual management fee for the year ended May 31, 2011 was 0.49% before waiver and 0.44% after waiver.
Related Parties — Certain officers and trustees of the trust are also officers and/or directors of American Century Companies, Inc. (ACC), the parent of the trust’s investment advisor, ACIM, the distributor of the trust, American Century Investment Services, Inc., and the trust’s transfer agent, American Century Services, LLC.
The fund has a mutual funds services agreement with J.P. Morgan Investor Services Co. (JPMIS). JPMorgan Chase Bank (JPMCB) is a custodian of the fund. JPMIS and JPMCB are wholly owned subsidiaries of JPMorgan Chase & Co. (JPM). JPM is an equity investor in ACC.
4. Fair Value Measurements
The fund’s securities valuation process is based on several considerations and may use multiple inputs to determine the fair value of the positions held by the fund. In conformity with accounting principles generally accepted in the United States of America, the inputs used to determine a valuation are classified into three broad levels as follows:
| • | Level 1 valuation inputs consist of unadjusted quoted prices in an active market for identical securities; |
| • | Level 2 valuation inputs consist of direct or indirect observable market data (including quoted prices for similar securities, evaluations of subsequent market events, interest rates, prepayment speeds, credit risk, etc.); or |
| • | Level 3 valuation inputs consist of unobservable data (including a fund’s own assumptions). |
The level classification is based on the lowest level input that is significant to the fair valuation measurement. The valuation inputs are not necessarily an indication of the risks associated with investing in these securities or other financial instruments.
As of period end, the fund’s investment securities were classified as Level 2. The Schedule of Investments provides additional information on the fund’s portfolio holdings.
5. Federal Tax Information
The tax character of distributions paid during the years ended May 31, 2011 and May 31, 2010 were as follows:
| | | | | | | |
| | | 2011 | | 2010 |
| Distributions Paid From | | | | | | |
| Exempt income | | | $181,029 | | | | $636,176 | |
| Long-term capital gains | | | — | | | | — | |
The book-basis character of distributions made during the year from net investment income or net realized gains may differ from their ultimate characterization for federal income tax purposes. These differences reflect the differing character of certain income items and net realized gains and losses for financial statement and tax purposes, and may result in reclassification among certain capital accounts on the financial statements.
As of May 31, 2011, the fund had accumulated capital losses of $(3,255), which represent net capital loss carryovers that may be used to offset future realized capital gains for federal income tax purposes. Future capital loss carryover utilization in any given year may be subject to Internal Revenue Code limitations. Capital loss carryovers expire in 2018.
On December 22, 2010, the Regulated Investment Company Modernization Act of 2010 (the “Act”) was enacted, which changed various technical rules governing the tax treatment of regulated investment companies. The changes are generally effective for taxable years beginning after the date of enactment. Under the Act, the fund will be permitted to carry forward capital losses incurred in taxable years beginning after the date of enactment for an unlimited period. However, any losses incurred during those future taxable years will be required to be utilized prior to the losses incurred in pre-enactment taxable years, which carry an expiration date. As a result of this ordering rule, pre-enactment capital loss carryforwards may be more likely to expire unused.
| Investor Class | |
| For a Share Outstanding Throughout the Years Ended May 31 | |
| | | 2011 | | | 2010 | | | 2009 | | | 2008 | | | 2007 | |
| Per-Share Data | |
| Net Asset Value, Beginning of Period | | | $1.00 | | | | $1.00 | | | | $1.00 | | | | $1.00 | | | | $1.00 | |
| Income From Investment Operations | | | | | | | | | | | | | | | | | | | | |
| Net Investment Income (Loss) | | | — | (1) | | | — | (1) | | | 0.01 | | | | 0.03 | | | | 0.03 | |
| Distributions | | | | | | | | | | | | | | | | | | | | |
| From Net Investment Income | | | — | (1) | | | — | (1) | | | (0.01 | ) | | | (0.03 | ) | | | (0.03 | ) |
| Net Asset Value, End of Period | | | $1.00 | | | | $1.00 | | | | $1.00 | | | | $1.00 | | | | $1.00 | |
| | | | | | | | | | | | | | | | | | | | | |
Total Return(2) | | | 0.07 | % | | | 0.20 | % | | | 1.47 | % | | | 2.97 | % | | | 3.26 | % |
| | | | | | |
| Ratios/Supplemental Data | |
Ratio of Operating Expenses to Average Net Assets | | | 0.45 | % | | | 0.46 | % | | | 0.50 | % | | | 0.51 | % | | | 0.52 | % |
Ratio of Operating Expenses to Average Net Assets (Before Expense Waiver) | | | 0.50 | % | | | 0.51 | % | | | 0.53 | % | | | 0.51 | % | | | 0.52 | % |
Ratio of Net Investment Income (Loss) to Average Net Assets | | | 0.07 | % | | | 0.20 | % | | | 1.45 | % | | | 2.91 | % | | | 3.22 | % |
Ratio of Net Investment Income (Loss) to Average Net Assets (Before Expense Waiver) | | | 0.02 | % | | | 0.15 | % | | | 1.42 | % | | | 2.91 | % | | | 3.22 | % |
| Net Assets, End of Period (in thousands) | | | $237,389 | | | | $280,874 | | | | $334,768 | | | | $313,542 | | | | $275,733 | |
| (1) | Per-share amount was less than $0.005. |
| (2) | Total returns are calculated based on the net asset value of the last business day. Total returns for period less than one year are not annualized. |
See Notes to Financial Statements.
Report of Independent Registered Public Accounting Firm |
To the Trustees of the American Century Municipal Trust
and Shareholders of the Tax-Free Money Market Fund:
In our opinion, the accompanying statement of assets and liabilities, including the schedule of investments, and the related statements of operations and of changes in net assets and the financial highlights present fairly, in all material respects, the financial position of the Tax-Free Money Market Fund (one of the five funds comprising the American Century Municipal Trust, hereafter referred to as the “Fund”) at May 31, 2011, the results of its operations for the year then ended, the changes in its net assets for each of the two years in the period then ended and the financial highlights for each of the five years in the period then ended, in conformity with accounting principles generally accepted in the United States of America. These financial statements and financial highlights (hereafter referred to as “financial statements”) are the responsibility of the Fund’s management; our responsibility is to express an opinion on these financial statements based on our audits. We conducted our audits of these financial statements in accordance with the standards of the Public Company Accounting Oversight Board (United States). Those standards require that we plan and perform the audit to obtain reasonable assurance about whether the financial statements are free of material misstatement. An audit includes examining, on a test basis, evidence supporting the amounts and disclosures in the financial statements, assessing the accounting principles used and significant estimates made by management, and evaluating the overall financial statement presentation. We believe that our audits, which included confirmation of securities at May 31, 2011 by correspondence with the custodian, provide a reasonable basis for our opinion.
PricewaterhouseCoopers LLP
Kansas City, Missouri
July 22, 2011
A special meeting of shareholders was held on June 16, 2010, to vote on the following proposals. Each proposal received the required number of votes and was adopted. A summary of voting results is listed below each proposal.
Proposal 1:
To elect one Trustee to the Board of Trustees of American Century Municipal Trust (the proposal was voted on by all shareholders of funds issued by American Century Municipal Trust):
| | | |
| Frederick L.A. Grauer | For: | 1,732,355,276 |
| | Withhold: | 67,363,643 |
| | Abstain: | 0 |
| | Broker Non-Vote: | 0 |
The other trustees whose term of office continued after the meeting include Jonathan S. Thomas, John Freidenrich, Ronald J. Gilson, Peter F. Pervere, Myron S. Scholes, and John B. Shoven.
Proposal 2:
To approve a management agreement between the fund and American Century Investment Management, Inc.:
| | | |
| Investor Class | For: | 172,716,582 |
| | Against: | 4,568,124 |
| | Abstain: | 7,110,168 |
| | Broker Non-Vote: | 32,910,909 |
The individuals listed below serve as trustees of the funds. Each trustee will continue to serve in this capacity until death, retirement, resignation or removal from office. The mandatory retirement age for trustees who are not “interested persons,” as that term is defined in the Investment Company Act (independent trustees), is 73. However, the mandatory retirement age may be extended for a period not to exceed two years with the approval of the remaining independent trustees.
Mr. Thomas is the only trustee who is an “interested person” because he currently serves as President and Chief Executive Officer of American Century Companies, Inc. (ACC), the parent company of American Century Investment Management, Inc. (ACIM or the advisor).
The other trustees (more than three-fourths of the total number) are independent; that is, they have never been employees, directors or officers of, and have no financial interest in, ACC or any of its wholly owned, direct or indirect, subsidiaries, including ACIM, American Century Investment Services, Inc. (ACIS) and American Century Services, LLC (ACS). The trustees serve in this capacity for eight (in the case of Mr. Thomas, 15) registered investment companies in the American Century Investments family of funds.
The following presents additional information about the trustees. The mailing address for each trustee other than Mr. Thomas is 1665 Charleston Road, Mountain View, California 94043. The mailing address for Mr. Thomas is 4500 Main Street, Kansas City, Missouri 64111.
| | | | | | |
Name (Year of Birth) | Position(s) Held with Funds | Length of Time Served | Principal Occupation(s) During Past 5 Years | Number of American Century Portfolios Overseen by Trustee | Other Directorships Held During Past 5 Years |
| Independent Trustees |
Tanya S. Beder (1955) | Trustee | Since 2011 | Chairman, SBCC Group Inc. (investment advisory services)(2006 to present); Fellow in Practice, International Center for Finance, Yale University School of Management (1985 to present); Chief Executive Officer, Tribeca Global Management LLC (asset management firm) (2004 to 2006) | 40 | None |
Jeremy I. Bulow (1954) | Trustee | Since 2011 | Professor of Economics, Stanford University, Graduate School of Business (1979 to present) | 40 | None |
John Freidenrich (1937) | Trustee | Since 2005 | Founder, Member and Manager, Regis Management Company, LLC (investment management firm) (April 2004 to present) | 40 | None |
| | | | | | |
Name (Year of Birth) | Position(s) Held with Funds | Length of Time Served | Principal Occupation(s) During Past 5 Years | Number of American Century Portfolios Overseen by Trustee | Other Directorships Held During Past 5 Years |
| Independent Trustees |
Ronald J. Gilson (1946) | Trustee and Chairman of the Board | Since 1995 | Charles J. Meyers Professor of Law and Business, Stanford Law School (1979 to present); Marc and Eva Stern Professor of Law and Business, Columbia University School of Law (1992 to present) | 40 | None |
Frederick L. A. Grauer (1946) | Trustee | Since 2008 | Senior Advisor, BlackRock, Inc. (investment management firm) (2010 to 2011); Senior Advisor, Barclays Global Investors (investment management firm) (2003 to 2009) | 40 | None |
Peter F. Pervere (1947) | Trustee | Since 2007 | Retired | 40 | Intraware, Inc. (2003 to 2009) |
Myron S. Scholes (1941) | Trustee | Since 1980 | Chairman, Platinum Grove Asset Management, L.P. (asset manager) (1999 to 2009); Frank E. Buck Professor of Finance-Emeritus, Stanford Graduate School of Business (1996 to present) | 40 | Dimensional Fund Advisors (investment advisor); CME Group, Inc. (futures and options exchange) |
John B. Shoven (1947) | Trustee | Since 2002 | Professor of Economics, Stanford University (1973 to present) | 40 | Cadence Design Systems; Exponent; Financial Engines; Watson Wyatt Worldwide (2002 to 2006) |
| |
| Interested Trustee |
Jonathan S. Thomas (1963) | Trustee and President | Since 2007 | President and Chief Executive Officer, ACC (March 2007 to present); Chief Administrative Officer, ACC (February 2006 to February 2007); Executive Vice President, ACC (November 2005 to February 2007). Also serves as: Chief Executive Officer and Manager, ACS; Executive Vice President, ACIM; Director, ACC, ACIM and other ACC subsidiaries | 104 | None |
Officers
The following table presents certain information about the executive officers of the funds. Each officer serves as an officer for each of the 15 investment companies in the American Century family of funds, unless otherwise noted. No officer is compensated for his or her service as an officer of the funds. The listed officers are interested persons of the funds and are appointed or re-appointed on an annual basis. The mailing address for each of the officers listed below is 4500 Main Street, Kansas City, Missouri 64111.
| | | |
Name (Year of Birth) | Offices with the Funds | Principal Occupation(s) During the Past Five Years |
| Officers |
Jonathan S.Thomas (1963) | Trustee and President since 2007 | President and Chief Executive Officer, ACC (March 2007 to present); Chief Administrative Officer, ACC (February 2006 to February 2007); Executive Vice President, ACC (November 2005 to February 2007). Also serves as: Chief Executive Officer and Manager, ACS; Executive Vice President, ACIM; Director, ACC, ACIM and other ACC subsidiaries |
Barry Fink (1955) | Executive Vice President since 2007 | Chief Operating Officer and Executive Vice President, ACC (September 2007 to present); President, ACS (October 2007 to present); Managing Director, Morgan Stanley (2000 to 2007); Global General Counsel, Morgan Stanley (2000 to 2006). Also serves as: Manager, ACS and Director, ACC and certain ACC subsidiaries |
Maryanne L. Roepke (1956) | Chief Compliance Officer since 2006 and Senior Vice President since 2000 | Chief Compliance Officer, American Century funds, ACIM and ACS (August 2006 to present); Assistant Treasurer, ACC (January 1995 to August 2006); and Treasurer and Chief Financial Officer, various American Century funds (July 2000 to August 2006). Also serves as: Senior Vice President, ACS |
Charles A. Etherington (1957) | General Counsel since 2007 and Senior Vice President since 2006 | Attorney, ACC (February 1994 to present); Vice President, ACC (November 2005 to present), General Counsel, ACC (March 2007 to present); Also serves as General Counsel, ACIM, ACS, ACIS and other ACC subsidiaries; and Senior Vice President, ACIM and ACS |
Robert J. Leach (1966) | Vice President, Treasurer and Chief Financial Officer since 2006 | Vice President, ACS (February 2000 to present); and Controller, various American Century funds (1997 to September 2006) |
David H. Reinmiller (1963) | Vice President since 2001 | Attorney, ACC (January 1994 to present); Associate General Counsel, ACC (January 2001 to present); Also serves as Vice President, ACIM and ACS |
Ward D. Stauffer (1960) | Secretary since 2005 | Attorney, ACC (June 2003 to Present) |
The Statement of Additional Information has additional information about the fund’s trustees and is available without charge, upon request, by calling 1-800-345-2021.
Proxy Voting Guidelines
American Century Investment Management, Inc., the fund’s investment advisor, is responsible for exercising the voting rights associated with the securities purchased and/or held by the fund. A description of the policies and procedures the advisor uses in fulfilling this responsibility is available without charge, upon request, by calling 1-800-345-2021. It is also available on American Century Investments’ website at americancentury.com and on the Securities and Exchange Commission’s website at sec.gov. Information regarding how the investment advisor voted proxies relating to portfolio securities during the most recent 12-month period ended June 30 is available on the “About Us” page at americancentury.com. It is also available at sec.gov.
Quarterly Portfolio Disclosure
The fund files its complete schedule of portfolio holdings with the Securities and Exchange Commission (SEC) for the first and third quarters of each fiscal year on Form N-Q. The fund’s Forms N-Q are available on the SEC’s website at sec.gov, and may be reviewed and copied at the SEC’s Public Reference Room in Washington, DC. Information on the operation of the Public Reference Room may be obtained by calling 1-800-SEC-0330. The fund also makes its complete schedule of portfolio holdings for the most recent quarter of its fiscal year available on its website at americancentury.com and, upon request, by calling 1-800-345-2021.
Other Tax Information
The following information is provided pursuant to provisions of the Internal Revenue Code.
The fund designates $181,415 as exempt interest dividends for the fiscal year ended May 31, 2011.
| Contact Us | americancentury.com |
| Automated Information Line | 1-800-345-8765 |
| Investor Services Representative | 1-800-345-2021 or 816-531-5575 |
| Investors Using Advisors | 1-800-378-9878 |
| Business, Not-For-Profit, Employer-Sponsored Retirement Plans | 1-800-345-3533 |
| Banks and Trust Companies, Broker-Dealers, Financial Professionals, Insurance Companies | 1-800-345-6488 |
| Telecommunications Device for the Deaf | 1-800-634-4113 |
American Century Municipal Trust
Investment Advisor:
American Century Investment Management, Inc.
Kansas City, Missouri
This report and the statements it contains are submitted for the general information of our shareholders. The report is not authorized for distribution to prospective investors unless preceded or accompanied by an effective prospectus.
©2011 American Century Proprietary Holdings, Inc. All rights reserved.
CL-ANN-72035 1107
ITEM 2. CODE OF ETHICS.
| (a) | The registrant has adopted a Code of Ethics for Senior Financial Officers that applies to the registrant’s principal executive officer, principal financial officer, principal accounting officer, and persons performing similar functions. |
| (f) | The registrant’s Code of Ethics for Senior Financial Officers was filed as Exhibit 12 (a)(1) to American Century Asset Allocation Portfolios, Inc.’s Annual Certified Shareholder Report on Form N-CSR, File No. 811-21591, on September 29, 2005, and is incorporated herein by reference. |
ITEM 3. AUDIT COMMITTEE FINANCIAL EXPERT.
| (a)(1) | The registrant's board has determined that the registrant has at least one audit committee financial expert serving on its audit committee. |
| (a)(2) | Peter F. Pervere and Ronald J. Gilson are the registrant's designated audit committee financial experts. They are "independent" as defined in Item 3 of Form N-CSR. |
ITEM 4. PRINCIPAL ACCOUNTANT FEES AND SERVICES.
The aggregate fees billed for each of the last two fiscal years for professional services rendered by the principal accountant for the audit of the registrant’s annual financial statements or services that are normally provided by the accountant in connection with statutory and regulatory filings or engagements for those fiscal years were as follows:
FY 2010: $113,277
FY 2011: $113,262
The aggregate fees billed in each of the last two fiscal years for assurance and related services by the principal accountant that are reasonably related to the performance of the audit of the registrant’s financial statements and are not reported under paragraph (a) of this Item were as follows:
| | For services rendered to the registrant: |
Fees required to be approved pursuant to paragraph (c)(7)(ii) of Rule 2-01 of Regulation S-X (relating to certain engagements for non-audit services with the registrant’s investment adviser and its affiliates):
The aggregate fees billed in each of the last two fiscal years for professional services rendered by the principal accountant for tax compliance, tax advice, and tax planning were as follows:
| | For services rendered to the registrant: |
FY 2010: $7,700
FY 2011: $0
These services included assistance with communications and filings to the Internal Revenue Service for a change in accounting method.
Fees required to be approved pursuant to paragraph (c)(7)(ii) of Rule 2-01 of Regulation S-X (relating to certain engagements for non-audit services with the registrant’s investment adviser and its affiliates):
FY 2010: $7,700
FY 2011: $0
| These services included assistance with communications and filings to the Internal Revenue Service for a change in accounting method. |
The aggregate fees billed in each of the last two fiscal years for products and services provided by the principal accountant, other than the services reported in paragraphs (a) through (c) of this Item were as follows:
| | For services rendered to the registrant: |
Fees required to be approved pursuant to paragraph (c)(7)(ii) of Rule 2-01 of Regulation S-X (relating to certain engagements for non-audit services with the registrant’s investment adviser and its affiliates):
| (e)(1) | In accordance with paragraph (c)(7)(i)(A) of Rule 2-01 of Regulation S-X, before the accountant is engaged by the registrant to render audit or non-audit services, the engagement is approved by the registrant’s audit committee. Pursuant to paragraph (c)(7)(ii) of Rule 2-01 of Regulation S-X, the registrant’s audit committee also pre-approves its accountant’s engagements for non-audit services with the registrant’s investment adviser, its parent company, and any entity controlled by, or under common control with the investment adviser that provides ongoing services to the registrant, if the engagement relates directly to the operations and financial reporting of the registrant. |
| (e)(2) | All services described in each of paragraphs (b) through (d) of this Item were pre-approved before the engagement by the registrant’s audit committee pursuant to paragraph (c)(7)(i)(A) of Rule 2-01 of Regulation S-X. Consequently, none of such services were required to be approved by the audit committee pursuant to paragraph (c)(7)(i)(C). |
| (f) | The percentage of hours expended on the principal accountant’s engagement to audit the registrant’s financial statements for the most recent fiscal year that were attributed to work performed by persons other than the principal accountant’s full-time, permanent employees was less than 50%. |
| (g) | The aggregate non-audit fees billed by the registrant’s accountant for services rendered to the registrant, and rendered to the registrant’s investment adviser (not including any sub-adviser whose role is primarily portfolio management and is subcontracted with or overseen by another investment adviser), and any entity controlling, controlled by, or under common control with the adviser that provides ongoing services to the registrant for each of the last two fiscal years of the registrant were as follows: |
FY 2010: $191,177
FY 2011: $161,109
| (h) | The registrant’s investment adviser and accountant have notified the registrant’s audit committee of all non-audit services that were rendered by the registrant’s accountant to the registrant’s investment adviser, its parent company, and any entity controlled by, or under common control with the investment adviser that provides services to the registrant, which services were not required to be pre-approved pursuant to paragraph (c)(7)(ii) of Rule 2-01 of Regulation S-X. The notification provided to the registrant’s audit committee included sufficient details regarding such services to allow the registrant’s audit committee to consider the continuing independence of its principal accountant. |
ITEM 5. AUDIT COMMITTEE OF LISTED REGISTRANTS.
Not applicable.
ITEM 6. INVESTMENTS.
| (a) | The schedule of investments is included as part of the report to stockholders filed under Item 1 of this Form. |
ITEM 7. DISCLOSURE OF PROXY VOTING POLICIES AND PROCEDURES FOR CLOSED-END MANAGEMENT INVESTMENT COMPANIES.
Not applicable.
ITEM 8. PORTFOLIO MANAGERS OF CLOSED-END MANAGEMENT INVESTMENT COMPANIES.
Not applicable.
ITEM 9. PURCHASES OF EQUITY SECURITIES BY CLOSED-END MANAGEMENT INVESTMENT COMPANY AND AFFILIATED PURCHASERS.
Not applicable.
ITEM 10. SUBMISSION OF MATTERS TO A VOTE OF SECURITY HOLDERS.
During the reporting period, there were no material changes to the procedures by which shareholders may recommend nominees to the registrant’s board.
ITEM 11. CONTROLS AND PROCEDURES.
| (a) | The registrant's principal executive officer and principal financial officer have concluded that the registrant's disclosure controls and procedures (as defined in Rule 30a-3(c) under the Investment Company Act of 1940) are effective based on their evaluation of these controls and procedures as of a date within 90 days of the filing date of this report. |
| (b) | There were no changes in the registrant's internal control over financial reporting (as defined in Rule 30a-3(d) under the Investment Company Act of 1940) that occurred during the registrant's second fiscal quarter of the period covered by this report that have materially affected, or are reasonably likely to materially affect, the registrant's internal control over financial reporting. |
ITEM 12. EXHIBITS.
| (a)(1) | Registrant’s Code of Ethics for Senior Financial Officers, which is the subject of the disclosure required by Item 2 of Form N-CSR, was filed as Exhibit 12(a)(1) to American Century Asset Allocation Portfolios, Inc.’s Certified Shareholder Report on Form N-CSR, File No. 811-21591, on September 29, 2005. |
| (a)(2) | Separate certifications by the registrant’s principal executive officer and principal financial officer, pursuant to Section 302 of the Sarbanes-Oxley Act of 2002 and Rule 30a-2(a) under the Investment Company Act of 1940, are filed and attached hereto as EX-99.CERT. |
| (b) | A certification by the registrant’s chief executive officer and chief financial officer, pursuant to Section 906 of the Sarbanes-Oxley Act of 2002, is furnished and attached hereto as EX-99.906CERT. |
SIGNATURES
Pursuant to the requirements of the Securities Exchange Act of 1934 and the Investment Company Act of 1940, the registrant has duly caused this report to be signed on its behalf by the undersigned, thereunto duly authorized.
| Registrant: | AMERICAN CENTURY MUNICIPAL TRUST | |
| | | | |
| | | | |
| By: | /s/ Jonathan S. Thomas | |
| | Name: | Jonathan S. Thomas | |
| | Title: | President | |
| | | | |
| Date: | July 29, 2011 | |
| | | |
Pursuant to the requirements of the Securities Exchange Act of 1934 and the Investment Company Act of 1940, this report has been signed below by the following persons on behalf of the registrant and in the capacities and on the dates indicated.
| By: | /s/ Jonathan S. Thomas | |
| | Name: | Jonathan S. Thomas | |
| | Title: | President | |
| | | (principal executive officer) | |
| | | | |
| | | | |
| Date: | July 29, 2011 | |
| By: | /s/ Robert J. Leach | |
| | Name: | Robert J. Leach | |
| | Title: | Vice President, Treasurer, and | |
| | | Chief Financial Officer | |
| | | (principal financial officer) | |
| | | | |
| Date: | July 29, 2011 | |