UNITED STATES
SECURITIES AND EXCHANGE COMMISSION
Washington, D.C. 20549
FORM N-CSR
CERTIFIED SHAREHOLDER REPORT OF REGISTERED
MANAGEMENT INVESTMENT COMPANIES
| Investment Company Act file number: | 811-04024 | |
| Exact name of registrant as specified in charter: | Dryden California Municipal Fund | |
| Address of principal executive offices: | Gateway Center 3, | |
| 100 Mulberry Street, | ||
| Newark, New Jersey 07102 | ||
| Name and address of agent for service: | Deborah A. Docs | |
| Gateway Center 3, | ||
| 100 Mulberry Street, | ||
| Newark, New Jersey 07102 | ||
| Registrant’s telephone number, including area code: | 973-367-7521 | |
| Date of fiscal year end: | 8/31/2005 | |
| Date of reporting period: | 8/31/2005 | |
Item 1 – Reports to Stockholders – [ INSERT REPORT ]

Dryden California Municipal Fund/California Series
| AUGUST 31, 2005 | ANNUAL REPORT |

FUND TYPE
Municipal bond
OBJECTIVE
Maximize current income that is exempt from California state and federal income taxes, consistent with the preservation
of capital
This report is not authorized for distribution to prospective investors unless preceded or accompanied by a current prospectus.
The views expressed in this report and information about the Series’ portfolio holdings are for the period covered by this report and are subject to change thereafter.
JennisonDryden is a registered trademark of The Prudential Insurance Company of America.

October 14, 2005
Dear Shareholder:
We hope you find the annual report for the California Series informative and useful. As a JennisonDryden mutual fund shareholder, you may be thinking about where you can find additional growth opportunities. You could invest in last year’s top-performing asset class and hope history repeats itself or you could stay in cash while waiting for the “right moment” to invest.
Instead, we believe it is better to take advantage of developing domestic and global investment opportunities through a diversified portfolio of stock and bond mutual funds. A diversified asset allocation offers two potential advantages. It helps you manage downside risk by not being overly exposed to any particular asset class, plus it gives you a better opportunity to have at least some of your assets in the right place at the right time. Your financial professional can help you create a diversified investment plan that may include mutual funds covering all the basic asset classes and that reflects your personal investor profile and tolerance for risk.
JennisonDryden Mutual Funds gives you a wide range of choices that can help you make progress toward your financial goals. Our funds offer the experience, resources, and professional discipline of three leading asset managers. They are recognized and respected in the institutional market and by discerning investors for excellence in their respective strategies. JennisonDryden equity funds are advised by Jennison Associates LLC or Quantitative Management Associates LLC (QMA). Prudential Investment Management, Inc. (PIM) advises the JennisonDryden fixed income and money market funds. Jennison Associates, QMA, and PIM are registered investment advisers and Prudential Financial companies.
Thank you for choosing JennisonDryden Mutual Funds.
Sincerely,

Judy A. Rice, President
Dryden California Municipal Fund/California Series
| Dryden California Municipal Fund/California Series | 1 |
Your Series’ Performance
Series objective
The investment objective of the Dryden California Municipal Fund/California Series (the Series) is to maximize current income that is exempt from California state and federal income taxes, consistent with the preservation of capital. There can be no assurance that the Series will achieve its investment objective.
Performance data quoted represent past performance. Past performance does not guarantee future results. The investment return and principal value of an investment will fluctuate, so that an investor’s shares, when redeemed, may be worth more or less than their original cost. Current performance may be lower or higher than the past performance data quoted. An investor may obtain performance data as of the most recent month-end by visiting our website at www.jennisondryden.com or by calling (800) 225-1852. The maximum initial sales charge is 4.00% (Class A shares).
| Cumulative Total Returns1 as of 8/31/05 | ||||||||||
| One Year | Five Years | Ten Years | Since Inception2 | |||||||
Class A | 5.05 | % | 30.68 | % | 74.50% (74.21) | 163.02% (162.58) | ||||
Class B | 4.79 | 29.07 | 69.38 (69.09) | 302.81 (281.57) | ||||||
Class C | 4.53 | 27.48 | 65.25 (64.96) | 77.37 (77.07) | ||||||
Class Z | 5.30 | 32.18 | N/A | 67.63 (67.49) | ||||||
Lehman Brothers Municipal Bond Index3 | 5.31 | 36.19 | 82.55 | *** | ||||||
Lipper California (CA) Muni Debt Funds Avg.4 | 5.88 | 30.80 | 73.46 | **** | ||||||
| Average Annual Total Returns1 as of 9/30/05 | ||||||||||
| One Year | Five Years | Ten Years | Since Inception2 | |||||||
Class A | –0.44 | % | 4.64 | % | 5.18% (5.16) | 6.03% (6.02) | ||||
Class B | –1.49 | 5.08 | 5.29 (5.27) | 6.81 (6.50) | ||||||
Class C | 2.13 | 4.98 | 5.03 (5.01) | 5.19 (5.17) | ||||||
Class Z | 3.97 | 5.74 | N/A | 5.81 (5.80) | ||||||
Lehman Brothers Municipal Bond Index3 | 4.05 | 6.34 | 6.06 | *** | ||||||
Lipper California (CA) Muni Debt Funds Avg.4 | 4.52 | 5.49 | 5.50 | **** | ||||||
| Distributions and Yields1 as of 8/31/05 | ||||||||||||
| Total Distributions Paid for 12 Months | 30-Day SEC Yield | Taxable Equivalent 30-Day Yield5 at Tax Rates of | ||||||||||
| 33% | 35% | |||||||||||
Class A | $ | 0.79 | 2.87 | % | 4.72 | % | 4.87 | % | ||||
Class B | $ | 0.76 | 2.75 | 4.53 | 4.66 | |||||||
Class C | $ | 0.73 | 2.50 | 4.11 | 4.24 | |||||||
Class Z | $ | 0.82 | 3.24 | 5.33 | 5.50 | |||||||
| 2 | Visit our website at www.jennisondryden.com |
The cumulative total returns do not reflect the deduction of applicable sales charges. If reflected, the applicable sales charges would reduce the cumulative total returns performance quoted. Class A shares are subject to a maximum front-end sales charge of 4.00%. Under certain circumstances, Class A shares may be subject to a contingent deferred sales charge (CDSC) of 1%. Class B and Class C shares are subject to a maximum CDSC of 5% and 1% respectively. Class Z shares are not subject to a sales charge.
1Source: Prudential Investments LLC and Lipper Inc. The average annual total returns take into account applicable sales charges. During certain periods shown, fee waivers and/or expense reimbursements were in effect. Without such fee waivers and expense reimbursements, the returns for the share classes would have been lower. Class A, Class B, and Class C shares are subject to an annual distribution and service (12b-1) fee of up to 0.3%, 0.5%, and 1.0% respectively. Approximately seven years after purchase, Class B shares will automatically convert to Class A shares on a quarterly basis. Class Z shares are not subject to a 12b-1 fee. The returns in the tables do not reflect the deduction of taxes that a shareholder would pay on Fund distributions or following the redemption of Fund shares. Without waiver of fees and/or expense subsidization, the Series’ returns would have been lower, as indicated in parentheses.
2Inception dates: Class A, 1/22/90; Class B, 9/19/84; Class C, 8/1/94; and Class Z, 9/18/96.
3The Lehman Brothers Municipal Bond Index is an unmanaged index of over 39,000 long-term investment-grade municipal bonds. It gives a broad look at how long-term investment-grade municipal bonds have performed.
4The Lipper CA Muni Debt Funds Average (Lipper Average) represents returns based on an average return of all funds in the Lipper CA Muni Debt Funds category for the periods noted. Funds in the Lipper Average limit their assets to those securities that are exempt from taxation in California.
5Taxable equivalent yields reflect federal and applicable state tax rates.
Investors cannot invest directly in an index. The returns for the Lehman Brothers Municipal Bond Index would be lower if they included the effects of sales charges, operating expenses of a mutual fund, or taxes. Returns for the Lipper Average reflect the deduction of operating expenses, but not sales charges or taxes.
***Lehman Brothers Municipal Bond Index Closest Month-End to Inception cumulative total returns as of 8/31/05 are 186.60% for Class A, 429.73% for Class B, 99.42% for Class C, and 71.08% for Class Z. Lehman Brothers Municipal Bond Index Closest Month-End to Inception average annual total returns as of 9/30/05 are 6.91% for Class A, 8.23% for Class B, 6.31% for Class C, and 6.07% for Class Z.
****Lipper Average Closest Month-End to Inception cumulative total returns as of 8/31/05 are 169.01% for Class A, 363.64% for Class B, 87.08% for Class C, and 61.58% for Class Z. Lipper Average Closest Month-End to Inception average annual total returns as of 9/30/05 are 6.47% for Class A, 7.54% for Class B, 5.69% for Class C, and 5.38% for Class Z.
| Dryden California Municipal Fund/California Series | 3 |
Your Series’ Performance (continued)
| Five Largest Issues expressed as a percentage of net assets as of 8/31/05 | |||
Orange Cnty. Loc. Trans. Auth., 2/14/11, 6.20% | 5.8 | % | |
So. California Pub. Pwr. Auth., 7/01/16, Zero Coupon | 5.2 | ||
California St. Hsg. Agcy. Rev., Sngl. Fam. Mtge. Ser. A, 2/01/15, Zero Coupon | 4.1 | ||
Santa Margarita/Dana Point Auth., Ser. B, M.B.I.A., Rev., 8/01/12, 7.25% | 3.7 | ||
Los Angeles Cnty., Correctional Facs. Proj. C.O.P., 9/01/10, Zero Coupon | 3.2 |
Issues are subject to change.
| Credit Quality expressed as a percentage of net assets as of 8/31/05 | |||
Aaa | 63.2 | % | |
Aa | 12.9 | ||
A | 15.2 | ||
Baa | 3.6 | ||
Not Rated | 4.5 | ||
Total Investments | 99.4 | ||
Other assets in excess of liabilities | 0.6 | ||
Net Assets | 100.0 | % | |
Source: Moody’s rating, defaulting to S&P when not rated by Moody’s. Credit quality is subject to change.
| 4 | Visit our website at www.jennisondryden.com |
Investment Adviser’s Report
Prudential Investment Management, Inc.
Key national and local factors influence municipal market
The Federal Reserve’s latest campaign to increase short-term interest rates was one of the most significant developments that influenced the municipal bond market during the Series’ fiscal year that began September 1, 2004. Important events also occurred at the state level. California’s improving financial health helped trim its budget deficit, which strengthened the Golden State’s general obligation (GO) bonds to such an extent that they were upgraded by prominent credit rating agencies. For the 12-month reporting period ended August 31, 2005, the municipal bond market returned 5.31%, outperforming the U.S. Treasury market that returned 4.12%, based respectively on the Lehman Brothers Municipal Bond Index (the Index) and the Lehman Brothers U.S. Treasury Index.
The Series’ holdings were diversified across many sectors of the California municipal securities market to spread risk. However, an overweight exposure to municipal bonds in the 10-year maturity category was among the factors that detracted from the Series’ returns, which caused it to underperform the Index. The Series also trailed its Lipper California Municipal Debt Funds Average.
Federal Reserve Chairman notes unusual market behavior
Fed policymakers hoped to gradually withdraw some of the excessive monetary stimulus from the U.S. economy to curb mounting inflationary pressures. They raised the target for the federal funds rate on overnight loans between banks eight times by a quarter percentage point, lifting the key rate from 1.50% to 3.50%. Short-term municipal bond yields rose considerably, as these bond yields are the most sensitive to changes in the federal funds rate. (This caused their prices to decline because bond prices move in the opposite direction of their yields.) Overall, intermediate-term municipal bond yields declined slightly while, surprisingly, long-term municipal bond yields declined significantly. Even Fed Chairman Alan Greenspan, while speaking to Congress in February 2005, admitted he was puzzled by the unusual behavior of long-term interest rates in general.
Too large an exposure to intermediate-term municipal bonds
The change in yields created a pronounced flattening in the slope of the municipal bond yield curve, which shows yields on tax-exempt bonds from the shortest to the longest maturities. The change in yields also meant that short- and intermediate-term municipal bonds underperformed long-term municipal bonds for the reporting period.
As previously mentioned, the Series’ overweight exposure to municipal bonds in the 10-year (intermediate) maturity category hurt its performance relative to the Index.
| Dryden California Municipal Fund/California Series | 5 |
Investment Adviser’s Report (continued)
Nevertheless, the Series continues to have an overweight exposure to these bonds for two key reasons:
| n | Selling a large amount of them to purchase longer-term municipal bonds would have resulted in realized capital gains that would have lessened the advantage of the Series’ tax-exempt dividend payments. |
| n | The intermediate-term municipal bonds provided the Series with attractive interest income, so we remain reluctant to sell them. |
Overweight exposure to zero coupon bonds aided the Series
The Series benefited from the rally in long-term municipal bonds by having a greater exposure to zero coupon bonds than the Index. Zero coupon bonds are so named because they pay no periodic interest and are sold at discount prices to compensate for their lack of periodic interest payments. Zero coupon bonds are also very sensitive to changes in interest rates. As long-term yields declined, long-term zero coupon bond prices climbed rapidly, enabling them to perform better than other municipal bonds.
Underweight exposure to California GO bonds hurt the Series
As mentioned earlier, California’s GO bonds were upgraded by major credit rating agencies, but we believe the State still needs to bring structural balance to its budget so that projected revenues match projected expenditures. That said, California GO bonds still performed well during the reporting period, and the Series’ underweight exposure to them detracted from its performance relative to the Index. We usually maintain an underweight exposure to California GO bonds as they are backed by the taxing authority of the State of California and tend to provide lower yields than other bonds that are only secured by revenues from specific projects.
Tobacco-related bonds had mixed impact on Series
The tobacco-related sector of the municipal bond market remains volatile. However, certain legal developments widely believed to favor tobacco firms helped boost the value of tobacco-related municipal bonds during the reporting period, even though there is no assurance that these rulings will not be overturned, in whole or in part, by another court. In addition, California refunded some of its Golden State Tobacco Securitization Asset-Backed Bonds (Golden State Tobacco Bonds). This means the State of California placed in an escrow account U.S. Treasury securities whose interest and principal will be used to pay off the Golden State Tobacco Bonds. The refunded debt securities no longer depend on funds of participating tobacco firms paid under the Master Settlement Agreement (MSA) signed in 1998 or appropriated funds of the State of California.
| 6 | Visit our website at www.jennisondryden.com |
Our investment strategy in the tobacco-related sector had a mixed impact on the Series’ relative performance. The Series had an underweight exposure to Golden State Tobacco Bonds that are backed solely by MSA funds. Although these bonds are lower rated because they depend on only one source of revenue, they still performed well. Therefore having an underweight exposure to them detracted from the Series’ returns relative to the Index. On the other hand, the Series’ overweight position in the refunded Golden State Tobacco Bonds benefited its performance relative to the Index.
| Dryden California Municipal Fund/California Series | 7 |
Fees and Expenses (Unaudited)
As a shareholder of the Series, you incur two types of costs: (1) transaction costs, including sales charges (loads) on purchase payments and redemptions, as applicable, and (2) ongoing costs, including management fees, distribution and/or service (12b-1) fees, and other Series expenses, as applicable. This example is intended to help you understand your ongoing costs (in dollars) of investing in the Series and to compare these costs with the ongoing costs of investing in other mutual funds.
The example is based on an investment of $1,000 invested on March 1, 2005, at the beginning of the period, and held through the six-month period ended August 31, 2005.
The Series’ transfer agent may charge additional fees to holders of certain accounts that are not included in the expenses shown in the table on the following page. These fees apply to Individual Retirement Accounts (IRAs) and Section 403(b) accounts. As of the close of the six-month period covered by the table, IRA fees included an annual maintenance fee of $15 per account (subject to a maximum annual maintenance fee of $25 for all accounts held by the same shareholder). Section 403(b) accounts are charged an annual $25 fiduciary maintenance fee. Some of the fees may vary in amount, or may be waived, based on your total account balance or the number of JennisonDryden or Strategic Partners Funds, including the Series, that you own. You should consider the additional fees that were charged to your Series account over the six-month period when you estimate the total ongoing expenses paid over the period and the impact of these fees on your ending account value, as these additional expenses are not reflected in the information provided in the expense table. Additional fees have the effect of reducing investment returns.
Actual Expenses
The first line for each share class in the table on the following page provides information about actual account values and actual expenses. You may use the information on this line, together with the amount you invested, to estimate the expenses that you paid over the period. Simply divide your account value by $1,000 (for example, an $8,600 account value ÷ $1,000 = 8.6), then multiply the result by the number on the first line under the heading “Expenses Paid During the Six-Month Period” to estimate the expenses you paid on your account during this period.
Hypothetical Example for Comparison Purposes
The second line for each share class in the table on the following page provides information about hypothetical account values and hypothetical expenses based on the Series’ actual expense ratio and an assumed rate of return of 5% per year before expenses, which is not the Series’ actual return. The hypothetical account values and
| 8 | Visit our website at www.jennisondryden.com |
expenses may not be used to estimate the actual ending account balance or expenses you paid for the period. You may use this information to compare the ongoing costs of investing in the Series and other funds. To do so, compare this 5% hypothetical example with the 5% hypothetical examples that appear in the shareholder reports of the other funds.
Please note that the expenses shown in the table are meant to highlight your ongoing costs only, and do not reflect any transactional costs such as sales charges (loads). Therefore the second line for each share class in the table is useful in comparing ongoing costs only, and will not help you determine the relative total costs of owning different funds. In addition, if these transactional costs were included, your costs would have been higher.
Dryden California California Series | Beginning Account Value March 1, 2005 | Ending Account August 31, 2005 | Annualized Expense Ratio Based on the Six-Month Period | Expenses Paid Month Period* | ||||||||||
| Class A | Actual | $ | 1,000.00 | $ | 1,027.12 | 1.09 | % | $ | 5.57 | |||||
| Hypothetical | $ | 1,000.00 | $ | 1,019.71 | 1.09 | % | $ | 5.55 | ||||||
| Class B | Actual | $ | 1,000.00 | $ | 1,025.81 | 1.34 | % | $ | 6.84 | |||||
| Hypothetical | $ | 1,000.00 | $ | 1,018.45 | 1.34 | % | $ | 6.82 | ||||||
| Class C | Actual | $ | 1,000.00 | $ | 1,024.60 | 1.59 | % | $ | 8.11 | |||||
| Hypothetical | $ | 1,000.00 | $ | 1,017.19 | 1.59 | % | $ | 8.08 | ||||||
| Class Z | Actual | $ | 1,000.00 | $ | 1,028.38 | 0.84 | % | $ | 4.29 | |||||
| Hypothetical | $ | 1,000.00 | $ | 1,020.97 | 0.84 | % | $ | 4.28 | ||||||
* Series expenses for each share class are equal to the annualized expense ratio for each share class (provided in the table), multiplied by the average account value over the period, multiplied by the 184 days in the six-month period ended August 31, 2005, and divided by the 365 days in the Series’ fiscal year ended August 31, 2005 (to reflect the six-month period).
| Dryden California Municipal Fund/California Series | 9 |
This Page Intentionally Left Blank
Portfolio of Investments
as of August 31, 2005
| Description (a) | Moody’s Rating (Unaudited) | Interest Rate | Maturity Date | Principal Amount (000) | Value (Note 1) | ||||||||
LONG-TERM INVESTMENTS 97.8% | |||||||||||||
Municipal Bonds | |||||||||||||
Abag Fin. Auth. Rev., Schs. of Sacred Heart, Ser. A | Baa3 | 6.45% | 6/01/30 | $ | 1,500 | $ | 1,614,525 | ||||||
Antelope Valley California Health Care Dist. Ser. A, F.S.A. | Aaa | 5.20 | 1/01/17 | 1,000 | 1,062,730 | ||||||||
Baldwin Park Uni. Sch. Dis., | |||||||||||||
Election of 2002, F.S.A. | Aaa | 5.00 | 8/01/22 | 1,065 | (e) | 1,183,705 | |||||||
California Edl. Facs. Auth. | |||||||||||||
Rev., Rfdg., Pepperdine Univ., Ser. A, A.M.B.A.C. | Aaa | 5.00 | 12/01/35 | 500 | 536,020 | ||||||||
California Edl. Facs. Auth. | |||||||||||||
Rev., Ponoma College, Ser. A, C.A.B.S. | Aaa | Zero | 7/01/32 | 1,580 | 459,022 | ||||||||
California Hlth. Facs. Fin. Auth. Rev., Ref., Cedars Sinai Med. Ctr. | A3 | 5.00 | 11/15/21 | 1,000 | 1,056,430 | ||||||||
California St. Econ. Recov., | |||||||||||||
Ser. A, G.O. | A2 | 5.50 | 4/01/30 | 2,000 | 2,260,100 | ||||||||
California St. Hsg. Fin. Agcy. Rev., Sngl. Fam. Mtge., Ser. A | Aa2 | Zero | 2/01/15 | 8,420 | 4,021,981 | ||||||||
California St. Pub. Works Brd. Dept. Mental Hlth., Lease Rev. | A3 | 5.50 | 6/01/18 | 1,970 | 2,209,414 | ||||||||
Various Univ. of California Projs., Ser. D | Aa2 | 5.00 | 5/01/20 | 1,000 | 1,080,300 | ||||||||
California St., G.O., M.B.I.A. | Aaa | 5.25 | 2/01/27 | 1,500 | 1,620,255 | ||||||||
California Statewide Cmntys. Dev. Auth. Rev., Kaiser Permanente, Ser. B | A3 | 3.90 | 8/01/31 | 500 | 498,055 | ||||||||
Capistrano Uni. Sch. Dist. Cmnty. Facs. Dist. Spec. Tax C.A.B.S., F.G.I.C. | Aaa | Zero | 9/01/32 | 2,000 | 576,600 | ||||||||
Corona-Norco Uni. Sch. Dist. Spec. Tax, Cmnty. Facs. Dist. No. 98-1, M.B.I.A. | Aaa | 5.00 | 9/01/22 | 1,060 | 1,132,705 | ||||||||
See Notes to Financial Statements.
| Dryden California Municipal Fund/California Series | 11 |
Portfolio of Investments
as of August 31, 2005 Cont’d.
| Description (a) | Moody’s Rating (Unaudited) | Interest Rate | Maturity Date | Principal Amount (000) | Value (Note 1) | ||||||||
Golden St. Tobacco Secur. | |||||||||||||
Corp., Tobacco Settlement Rev., C.A.B.S., Asset Bkd. Ser. A, A.M.B.A.C. | Aaa | Zero | 6/01/23 | $ | 1,000 | $ | 824,100 | ||||||
Enhanced Asset Bkd., Ser. B | Aaa | 5.50% | 6/01/19 | 595 | (e) | 621,215 | |||||||
Enhanced Asset Bkd., Ser. B | Aaa | 5.625 | 6/01/20 | 675 | (e) | 706,165 | |||||||
Enhanced Asset Bkd., Ser. B | Aaa | 5.50 | 6/01/43 | 1,500 | (e) | 1,702,335 | |||||||
Ser. 2003-A-1 | Baa3 | 6.75 | 6/01/39 | 750 | 864,615 | ||||||||
La Mesa-Spring Valley | |||||||||||||
California Sch. Dist. G.O., | |||||||||||||
Elec. Of 2002 Ser. B, | |||||||||||||
C.A.B.S., F.G.I.C. | Aaa | Zero | 8/01/23 | 2,000 | 896,360 | ||||||||
La Quinta California Fin. | |||||||||||||
Auth. Local A.M.B.A.C. | Aaa | 5.25 | 9/01/24 | 500 | 550,820 | ||||||||
Long Beach Redev. Agcy., Dist. No. 3, Spec. Tax Rev. (cost $2,950,530; purchased 10/18/93) | NR | 6.375 | 9/01/23 | 3,000 | (g)(h) | 3,183,420 | |||||||
Los Angeles California Cmnty. Coll. Dist. Ser. A, G.O., M.B.I.A. | Aaa | 5.50 | 8/01/17 | 2,800 | (e) | 3,148,236 | |||||||
Los Angeles California Cmnty. Redev. Agcy. Lease Rev., Vermont Manchester Social Services Proj., A.M.B.A.C. | Aaa | 5.00 | 9/01/25 | 500 | 532,390 | ||||||||
Los Angeles California Unified Sch. Dist. C.O.P., Admin. Bldg. Proj., Ser. B, A.M.B.A.C. | Aaa | 5.00 | 10/01/31 | 1,500 | 1,562,955 | ||||||||
Election of 1997, Ser. F, | |||||||||||||
G.O., F.G.I.C. | Aaa | 5.00 | 7/01/21 | 1,000 | 1,084,530 | ||||||||
Los Angeles Cnty., | |||||||||||||
Correctional Facs. Proj., | |||||||||||||
C.O.P., M.B.I.A., E.T.M. | Aaa | Zero | 9/01/10 | 3,770 | (e) | 3,190,966 | |||||||
Los Angeles Hbr. Dept. Rev., | |||||||||||||
Ser. B, A.M.T. | Aa2 | 5.375 | 11/01/23 | 1,000 | 1,030,200 | ||||||||
See Notes to Financial Statements.
| 12 | Visit our website at www.jennisondryden.com |
| Description (a) | Moody’s Rating (Unaudited) | Interest Rate | Maturity Date | Principal Amount (000) | Value (Note 1) | ||||||||
Metro. Wtr. Dist. of Southern | |||||||||||||
California Waterworks Rev., Linked, S.A.V.R.S. & R.I.B.S. | Aa2 | 5.75% | 8/10/18 | $ | 1,000 | $ | 1,182,100 | ||||||
Unrfd. Balance Ser. A | Aa2 | 5.75 | 7/01/21 | 2,240 | 2,699,334 | ||||||||
MidPeninsula Regional Open Space Dist. of California, Fin. Auth. Rev., A.M.B.A.C. | Aaa | 5.00 | 9/01/34 | 2,000 | 2,116,880 | ||||||||
Orange Cnty. Loc. Trans. Auth., Linked, T.C.R.S., A.M.B.A.C. | Aaa | 6.20 | 2/14/11 | 5,000 | 5,691,100 | ||||||||
Spec. Tax Rev., R.I.B.S. | Aa2 | 9.48(b) | 2/14/11 | 750 | (h) | 957,330 | |||||||
Puerto Rico Comnwlth., Ser. 642A G.O., M.B.I.A., R.I.T.E.S. | NR | 8.37(b) | 7/01/10 | 1,000 | (h) | 1,234,200 | |||||||
Redding Elec. Sys. Rev., C.O.P., Linked, R.I.B.S., M.B.I.A., E.T.M. | Aaa | 10.17(b) | 7/01/22 | 1,750 | (e)(h) | 2,532,215 | |||||||
S.A.V.R.S., R.I.B.S., M.B.I.A., E.T.M. | Aaa | 6.368 | 7/01/22 | 50 | (e) | 61,175 | |||||||
Sacramento City Fin. Auth. Rev., Cap. Impv., Ser. A, A.M.B.A.C. | Aaa | 5.00 | 12/01/26 | 2,000 | (e) | 2,191,680 | |||||||
City Hall & Redev. Projs., | |||||||||||||
Ser. A, F.S.A. | Aaa | 5.375 | 12/01/19 | 1,000 | (e) | 1,126,800 | |||||||
Sacramento Mun. Utility Dist. Elec. Rev., Ser. N, M.B.I.A. | Aaa | 5.00 | 8/15/28 | 2,500 | 2,617,775 | ||||||||
San Diego Redev., Agcy. Tax | |||||||||||||
Alloc. North Bay Redev. | Baa1 | 5.875 | 9/01/29 | 1,000 | 1,049,100 | ||||||||
San Diego Uni. Sch. Dist., | |||||||||||||
Election of 1998, Ser. B, | |||||||||||||
G.O., M.B.I.A. | Aaa | 6.00 | 7/01/19 | 1,000 | 1,227,650 | ||||||||
San Francisco City & Cnty., | |||||||||||||
Redev. Agcy., Lease Rev., | |||||||||||||
C.A.B.S. | A1 | Zero | 7/01/09 | 2,000 | 1,741,720 | ||||||||
See Notes to Financial Statements.
| Dryden California Municipal Fund/California Series | 13 |
Portfolio of Investments
as of August 31, 2005 Cont’d.
| Description (a) | Moody’s Rating (Unaudited) | Interest Rate | Maturity Date | Principal Amount (000) | Value (Note 1) | ||||||||
Santa Margarita/Dana Point | |||||||||||||
Auth., Impvt. Dists. 3, Ser. B, M.B.I.A. | Aaa | 7.25% | 8/01/08 | $ | 1,000 | $ | 1,116,270 | ||||||
Impvt. Dists. 3, Ser. B, | |||||||||||||
M.B.I.A. | Aaa | 7.25 | 8/01/09 | 1,400 | 1,610,896 | ||||||||
Impvt. Dists. 3, Ser. B, | |||||||||||||
M.B.I.A. | Aaa | 7.25 | 8/01/14 | 1,000 | 1,280,470 | ||||||||
Ser. A, M.B.I.A., Rev. | Aaa | 7.25 | 8/01/13 | 1,990 | 2,495,301 | ||||||||
Ser. B, M.B.I.A., Rev. | Aaa | 7.25 | 8/01/12 | 3,000 | 3,699,180 | ||||||||
Santa Maria Joint Union H.S., | |||||||||||||
Dist., Election 2004, C.A.B.S., G.O., F.G.I.C. | Aaa | Zero | 8/01/29 | 1,250 | 418,788 | ||||||||
So. California Pub. Pwr. | |||||||||||||
Auth., | |||||||||||||
Proj. Rev. | A2 | 6.75 | 7/01/10 | 2,265 | (d) | 2,584,184 | |||||||
Proj. Rev. | A2 | 6.75 | 7/01/11 | 1,195 | 1,387,980 | ||||||||
Proj. Rev. | A2 | 6.75 | 7/01/13 | 1,000 | 1,192,950 | ||||||||
Proj. Rev., A.M.B.A.C., E.T.M. | Aaa | Zero | 7/01/16 | 7,925 | (e) | 5,154,658 | |||||||
Torrance California Hosp. | |||||||||||||
Rev., Torrance Mem. Med. Ctr., Ser. A | A1 | 6.00 | 6/01/22 | 2,000 | 2,220,520 | ||||||||
Univ. California Hosp. Rev. | |||||||||||||
UCLA Med. Ctr., Ser. A, | |||||||||||||
A.M.B.A.C. | Aaa | 5.25 | 5/15/30 | 2,000 | 2,153,640 | ||||||||
Univ. California Rev. Multi. | |||||||||||||
Purpose Proj., Ser. O, | |||||||||||||
F.G.I.C. | Aaa | 5.125 | 9/01/31 | 2,500 | 2,634,050 | ||||||||
Val Verde Uni. Sch. Dist., | |||||||||||||
C.O.P., Ref. & Sch. Constr. | |||||||||||||
Proj., Ser. B, F.G.I.C. | AAA(c) | 5.00 | 1/01/35 | 500 | 530,200 | ||||||||
Victor Elementary Sch. Dist., | |||||||||||||
Ser. A, G.O., F.G.I.C. | Aaa | 5.375 | 8/01/19 | 1,290 | 1,430,726 | ||||||||
Virgin Islands Pub. Fin. Auth. | |||||||||||||
Rev., Gross Rcpts. Taxes Ln. | |||||||||||||
Nt., F.S.A. | Aaa | 5.25 | 10/01/21 | 1,000 | 1,115,350 | ||||||||
Total long-term investments (cost $87,389,263) | 96,664,371 | ||||||||||||
See Notes to Financial Statements.
| 14 | Visit our website at www.jennisondryden.com |
| Description (a) | Moody’s Rating (Unaudited) | Interest Rate | Maturity Date | Principal Amount (000) | Value (Note 1) | |||||||
SHORT-TERM INVESTMENTS 1.6% | ||||||||||||
Municipal Bonds | ||||||||||||
California Hsg. Fin. Agcy. | ||||||||||||
Rev., Home Mtge., Ser. J, | ||||||||||||
A.M.T., F.S.A., F.R.D.D. | VMIG1 | 2.37%(f) | 9/01/05 | $ | 200 | $ | 200,000 | |||||
California Poll. Ctrl. Fin. | ||||||||||||
Auth. Rev., Atlantic Richfield Co. Proj., Ser. A, F.R.D.D., A.M.T. | VMIG1 | 2.32(f) | 9/01/05 | 1,400 | 1,400,000 | |||||||
Total short-term investments (cost $1,600,000) | 1,600,000 | |||||||||||
Total Investments 99.4% (cost $88,989,263; Note 5) | 98,264,371 | |||||||||||
Other assets in excess of liabilities(i) 0.6% | 587,461 | |||||||||||
Net Assets 100% | $ | 98,851,832 | ||||||||||
| (a) | The following abbreviations are used in the portfolio descriptions: |
A.M.B.A.C.—American Municipal Bond Assurance Corporation.
A.M.T.—Alternative Minimum Tax.
C.A.B.S.—Capital Appreciation Bonds.
C.O.P.—Certificates of Participation.
E.T.M.—Escrowed to Maturity.
F.G.I.C.—Financial Guaranty Insurance Company.
F.R.D.D.—Floating Rate (Daily) Demand Note. (f)
F.S.A.—Financial Security Assurance.
G.O.—General Obligation.
M.B.I.A.—Municipal Bond Insurance Corporation.
R.I.B.S.—Residual Interest Bonds.
R.I.T.E.S.—Residual Interest Tax Exempt Securities Receipts.
S.A.V.R.S.—Select Auction Variable Rate Securities.
T.C.R.S.—Transferable Custodial Receipts.
NR—Not Rated by Moody’s or Standard & Poor’s.
The fund’s current Statement of Additional Information contains a description of Moody’s and Standard & Poor’s ratings.
| (b) | Inverse floating rate bond. The coupon is inversely indexed to a floating interest rate. Rate shown is the rate in effect at August 31, 2005. |
See Notes to Financial Statements.
| Dryden California Municipal Fund/California Series | 15 |
Portfolio of Investments
as of August 31, 2005 Cont’d.
| (c) | Standard & Poor’s rating. |
| (d) | Partial principal amount pledged as collateral for financial futures contracts. |
| (e) | Prerefunded issues are secured by escrowed cash and/or direct U.S. guaranteed obligations. |
| (f) | For purposes of amortized cost valuation, the maturity date of Floating Rate Demand Notes is considered to be the later of the next date on which the security can be redeemed at par, or the next date on which the rate of interest is adjusted. Rate shown is the rate in effect at August 31, 2005. |
| (g) | Indicates a restricted security. The cost was $2,950,530. The value of $3,183,420 represents 3.2% of net assets. |
| (h) | Indicates a security that has been deemed illiquid. |
| (i) | Other assets in excess of liabilities include net unrealized appreciation (depreciation) on financial futures contracts as follows: |
Open financial futures contracts outstanding at August 31, 2005:
| Number of Contracts | Type | Expiration Date | Value at August 31, 2005 | Value at Trade Date | Unrealized Appreciation (Depreciation) | |||||||||||
| Long Positions: | ||||||||||||||||
| 10 | U.S. Treasury 2 Yr Notes | Dec. 2005 | $ | 2,070,938 | $ | 2,063,464 | $ | 7,474 | ||||||||
| Short Positions: | ||||||||||||||||
| 79 | U.S. Treasury 10 Yr Notes | Dec. 2005 | (8,854,171 | ) | (8,735,638 | ) | (118,533 | ) | ||||||||
| 44 | U.S. Treasury 5 Yr Notes | Dec. 2005 | (4,768,500 | ) | (4,718,314 | ) | (50,186 | ) | ||||||||
| 2 | U.S. Treasury Bonds | Dec. 2005 | (236,062 | ) | (232,431 | ) | (3,631 | ) | ||||||||
| (172,350 | ) | |||||||||||||||
| $ | (164,876 | ) | ||||||||||||||
The industry classification of portfolio holdings and other assets in excess of liabilities shown as a percentage of net assets as of August 31, 2005 were as follows:
Special Tax/Assessment District | 23.6 | % | |
Power | 15.7 | ||
Education | 13.5 | ||
Lease-Backed Certificate of Participation | 13.3 | ||
General Obligation | 10.8 | ||
Healthcare | 7.1 | ||
Housing | 4.1 | ||
Tobacco Appropriated | 3.9 | ||
Water & Sewer | 3.9 | ||
Short-Term Investments | 1.6 | ||
Transportation | 1.0 | ||
Tobacco | 0.9 | ||
Total Investments | 99.4 | ||
Other assets in excess of liabilities | 0.6 | ||
Total | 100.0 | % | |
Industry classification is subject to change.
See Notes to Financial Statements.
| 16 | Visit our website at www.jennisondryden.com |
Financial Statements
| AUGUST 31, 2005 | ANNUAL REPORT |
Dryden California Municipal Fund
California Series
Statement of Assets and Liabilities
as of August 31, 2005
Assets | ||||
Investments, at value (cost $88,989,263) | $ | 98,264,371 | ||
Cash | 76,711 | |||
Interest receivable | 849,325 | |||
Prepaid expenses | 700 | |||
Total assets | 99,191,107 | |||
Liabilities | ||||
Accrued expenses | 100,612 | |||
Dividends payable | 59,974 | |||
Due to broker-variation margin | 57,125 | |||
Management fee payable | 41,825 | |||
Payable for Series shares reacquired | 37,835 | |||
Distribution fee payable | 23,757 | |||
Deferred Trustees’ fees | 14,940 | |||
Transfer agent fee payable | 3,207 | |||
Total liabilities | 339,275 | |||
Net Assets | $ | 98,851,832 | ||
Net assets were comprised of: | ||||
Shares of beneficial interest, at par | $ | 84,053 | ||
Paid-in capital in excess of par | 89,093,360 | |||
| 89,177,413 | ||||
Accumulated of net investment loss | (53,318 | ) | ||
Accumulated net realized gain on investments | 617,505 | |||
Net unrealized appreciation on investments | 9,110,232 | |||
Net assets, August 31, 2005 | $ | 98,851,832 | ||
See Notes to Financial Statements.
| 18 | Visit our website at www.jennisondryden.com |
Class A | |||
Net asset value and redemption price per share | $ | 11.76 | |
Maximum sales charge (4% of offering price) | 0.49 | ||
Maximum offering price to public | $ | 12.25 | |
Class B | |||
Net asset value, offering price and redemption price per share | $ | 11.76 | |
Class C | |||
Net asset value, offering price and redemption price per share | $ | 11.76 | |
Class Z | |||
Net asset value, offering price and redemption price per share | $ | 11.76 | |
See Notes to Financial Statements.
| Dryden California Municipal Fund/California Series | 19 |
Statement of Operations
Year Ended August 31, 2005
Net Investment Income | ||||
Income | ||||
Interest | $ | 5,274,169 | ||
Expenses | ||||
Management fee | 527,459 | |||
Distribution fee—Class A | 214,527 | |||
Distribution fee—Class B | 75,101 | |||
Distribution fee—Class C | 11,578 | |||
Custodian’s fees and expenses | 105,000 | |||
Registration fees | 48,000 | |||
Reports to shareholders | 46,000 | |||
Transfer agent’s fees and expenses (including affiliated fees of $35,000) | 46,000 | |||
Legal fees and expenses | 33,000 | |||
Audit fee | 24,000 | |||
Trustees’ fees | 13,000 | |||
Miscellaneous | 9,834 | |||
Total expenses | 1,153,499 | |||
Net investment income | 4,120,670 | |||
Realized And Unrealized Gain (Loss) On Investments | ||||
Net realized gain on: | ||||
Investment transactions | 360,171 | |||
Financial futures transactions | 78,162 | |||
| 438,333 | ||||
Net change in unrealized appreciation (depreciation) on: | ||||
Investments | 719,032 | |||
Financial futures contracts | (146,494 | ) | ||
| 572,538 | ||||
Net gain on investments | 1,010,871 | |||
Net Increase In Net Assets Resulting From Operations | $ | 5,131,541 | ||
See Notes to Financial Statements.
| 20 | Visit our website at www.jennisondryden.com |
Statement of Changes in Net Assets
| Year Ended August 31, | ||||||||
| 2005 | 2004 | |||||||
Increase (Decrease) In Net Assets | ||||||||
Operations | ||||||||
Net investment income | $ | 4,120,670 | $ | 4,710,823 | ||||
Net realized gain on investments | 438,333 | 4,262,556 | ||||||
Net change in unrealized appreciation (depreciation) on investments | 572,538 | (2,295,396 | ) | |||||
Net increase in net assets resulting from operations | 5,131,541 | 6,677,983 | ||||||
Dividends and distributions (Note 1) | ||||||||
Dividends from net investment income | ||||||||
Class A | (3,364,662 | ) | (3,695,744 | ) | ||||
Class B | (551,277 | ) | (726,345 | ) | ||||
Class C | (52,808 | ) | (73,929 | ) | ||||
Class Z | (129,662 | ) | (200,892 | ) | ||||
| (4,098,409 | ) | (4,696,910 | ) | |||||
Distributions from net realized gains | ||||||||
Class A | (2,399,014 | ) | (1,462,100 | ) | ||||
Class B | (467,445 | ) | (319,113 | ) | ||||
Class C | (45,246 | ) | (34,029 | ) | ||||
Class Z | (117,944 | ) | (91,318 | ) | ||||
| (3,029,649 | ) | (1,906,560 | ) | |||||
Series share transactions (Net of share conversions) (Note 6) | ||||||||
Net proceeds from shares sold | 3,585,103 | 9,360,453 | ||||||
Net asset value of shares issued in reinvestment of dividends and distributions | 4,404,396 | 3,991,685 | ||||||
Cost of shares reacquired | (20,299,225 | ) | (25,439,241 | ) | ||||
Net decrease in net assets from Series share transactions | (12,309,726 | ) | (12,087,103 | ) | ||||
Total decrease | (14,306,243 | ) | (12,012,590 | ) | ||||
Net Assets | ||||||||
Beginning of year | 113,158,075 | 125,170,665 | ||||||
End of year | $ | 98,851,832 | $ | 113,158,075 | ||||
See Notes to Financial Statements.
| Dryden California Municipal Fund/California Series | 21 |
Notes to Financial Statements
Dryden California Municipal Fund (the “Fund”), is registered under the Investment Company Act of 1940 as an open-end management investment company. The Fund was organized as a Massachusetts business trust on May 18, 1984 and consists of two series. These financial statements relate only to California Series (the ‘Series’). The financial statements of the other series are not presented herein. The assets of each series are invested in separate, independently managed portfolios. The Series commenced investment operations on September 19, 1984. The Series is diversified and seeks to achieve its investment objective of obtaining the maximum amount of income exempt from federal and California state income taxes with the minimum of risk by investing in “investment grade” tax-exempt securities whose ratings are within the four highest ratings categories by a nationally recognized statistical rating organization or, if not rated, are of comparable quality. The ability of the issuers of the securities held by the Series to meet their obligations may be affected by economic developments in a specific state, industry or region.
Note 1. Accounting Policies
The following is a summary of significant accounting policies followed by the Fund, and the Series, in the preparation of its financial statements.
Securities Valuations: The Fund values municipal securities (including commitments to purchase such securities on a “when-issued” basis) as of the close of trading on the New York Stock Exchange, on the basis of prices provided by a pricing service which uses information with respect to transactions in comparable securities and various relationships between securities in determining values. Securities listed on a securities exchange (other than options on securities and indices) are valued at the last sale price on such exchange on the day of valuation or, if there was no sale on such day, at the mean between the last reported bid and asked prices, or at the last bid price on such day in the absence of an asked price. Securities traded via Nasdaq are valued at the Nasdaq Official Closing Price (NOCP) on the day of valuation, or if there was no NOCP, at the last sale price. Securities that are actively traded in the over-the-counter market, including listed securities for which the primary market is believed by Prudential Investments LLC (“PI” or “Manager”) in consultation with the subadviser, to be over-the-counter, are valued at market value using prices provided, by an independent pricing agent or principal market marker. Futures contracts and options thereon traded on a commodities exchange or board of trade are valued at the last sale price at the close of trading on such exchange or board of trade or, if there was no sale on the applicable commodities exchange or board of trade on such day, at the mean between the most recently quoted prices on such exchange or board of trade or
| 22 | Visit our website at www.jennisondryden.com |
at the last bid price in the absence of an asked price. Prices may be obtained from independent pricing services which use information provided by market makers or estimates of market values obtained from yield data relating to investments or securities with similar characteristics. Securities for which reliable market quotations are not readily available or whose values have been affected by events occurring after the close of the security’s foreign market and before the Fund’s normal pricing time, are valued at fair value in accordance with Board of Trustees’ approved fair valuation procedures. When determining the fair valuation of securities some of the factors influencing the valuation include, the nature of any restrictions on disposition of the securities; assessment of the general liquidity of the securities; the issuer’s financial condition and the markets in which it does business; the cost of the investment; the size of the holding and the capitalization of issuer; the prices of any recent transactions or bids/offers for such securities or any comparable securities; any available analyst media or other reports or information deemed reliable by the investment adviser regarding the issuer or the markets or industry in which it operates. Using fair value to price securities may result in a value that is different from a security’s most recent closing price and from the price used by other mutual funds to calculate their net asset values.
Short-term securities which mature in sixty days or less are valued at amortized cost, which approximates market value. The amortized cost method involves valuing a security at its cost on the date of purchase and thereafter assuming a constant amortization to maturity of the difference between the principal amount due at maturity and cost. Short-term securities which mature in more than sixty days are valued at current market quotations.
Restricted Securities: The Series may hold up to 15% of its net assets in illiquid securities, including those which are restricted as to disposition under securities law (“restricted securities”). The restricted securities held by the Series at August 31, 2005 include registration rights under which the Series may demand registration by the issuers. Restricted securities, sometimes referred to as private placements, are valued pursuant to the valuation procedures noted above.
Financial Futures Contracts: A financial futures contract is an agreement to purchase (long) or sell (short) an agreed amount of securities at a set price for delivery on a future date. Upon entering into a financial futures contract, the Series is required to pledge to the broker an amount of cash and/or other assets equal to a certain percentage of the contract amount. This amount is known as the “initial margin.” Subsequent payments, known as “variation margin,” are made or received by the Series each day, depending on the daily fluctuations in the value of the underlying security. Such variation margin is recorded for financial statement purposes on a daily
| Dryden California Municipal Fund/California Series | 23 |
Notes to Financial Statements
Cont’d
basis as unrealized gain or loss. When the contract expires or is closed, the gain or loss is realized and is presented in the Statement of Operations as net realized gain or loss on financial futures contracts.
The Series invests in financial futures contracts in order to hedge its existing portfolio securities, or securities the Series intends to purchase, against fluctuations in value caused by changes in prevailing interest rates or market conditions. Should interest rates move unexpectedly, the Series may not achieve the anticipated benefits of the financial futures contracts and may realize a loss. The use of futures transactions involves the risk of imperfect correlation in movements in the price of futures contracts, interest rates and the underlying hedged assets.
Inverse Floaters: The Series invests in variable rate securities commonly called “inverse floaters”. The interest rates on these securities have an inverse relationship to the interest rate of other securities or the value of an index. Changes in interest rates on the other security or index inversely affect the rate paid on the inverse floater, and the inverse floater’s price will be more volatile than that of a fixed-rate bond. Additionally, some of these securities contain a “leverage factor” whereby the interest rate moves inversely by a “factor” to the benchmark rate. Certain interest rate movements and other market factors can substantially affect the liquidity of inverse floating rate notes.
Options: The Series may either purchase or write options in order to hedge against adverse market movements or fluctuations in value caused by changes in prevailing interest rates with respect to securities, which the Series currently owns or intends to purchase. The Series’ principal reason for writing options is to realize, through receipt of premiums, a greater current return than would be realized on the underlying security alone. When the Series purchases an option, it pays a premium and an amount equal to that premium is recorded as an asset. When the Series writes an option, it receives a premium and an amount equal to that premium is recorded as a liability. The asset or liability is adjusted daily to reflect the current market value of the option. If an option expires unexercised, the Series realizes a gain or loss to the extent of the premium received or paid. If an option is exercised, the premium received or paid is recorded as an adjustment to the proceeds from the sale or the cost of the purchase determining whether the Series has realized a gain or loss. The difference between the premium and the amount received or paid on effecting a closing purchase or sale transaction is also treated as a realized gain or loss. Gain or loss on purchased options is included in net realized gain or loss on investment transactions. Gain or loss on written options is presented separately as net realized gain or loss on options written.
| 24 | Visit our website at www.jennisondryden.com |
The Series, as writer of an option, may have no control over whether the underlying securities may be sold (called) or purchased (put). As a result, the Series bears the market risk of an unfavorable change in the price of the security underlying the written option. The Series, as purchaser of an option, bears the risk of the potential inability of the counterparties to meet the terms of their contracts.
Interest Rate Swaps: The Series may enter into interest rate swaps. In a simple interest rate swap, one investor pays a floating rate of interest on a notional principal amount and receives a fixed rate of interest on the same notional principal amount for a specified period of time. Alternatively, an investor may pay a fixed rate and receive a floating rate. Interest rate swaps were conceived as asset/liability management tools. In more complex swaps, the notional principal amount may decline (or amortize) over time.
During the term of the swap, changes in the value of the swap are recognized as unrealized gains or losses by “marking-to-market” to reflect the market value of the swap. When the swap is terminated, the Series will record a realized gain or loss equal to the difference between the proceeds from (or cost of) the closing transaction and the Series’ basis in the contract, if any.
The Series is exposed to credit loss in the event of non-performance by the other party to the interest rate swap. However, the Series does not anticipate non-performance by any counterparty.
Written options, future contracts and swap contracts involve elements of both market and certain risk in excess of the amounts reflected in the Statement of Assets and Liabilities.
Securities Transactions and Net Investment Income: Securities transactions are recorded on the trade date. Realized and unrealized gains and losses from securities transactions are calculated on the identified cost basis. Interest income, including amortization of premium and accretion of discount on debt securities, as required, is recorded on the accrual basis. Expenses are recorded on the accrual basis.
Net investment income or loss (other than distribution fees, which are charged directly to the respective class) and realized and unrealized gains and losses are allocated daily to each class of shares based upon the relative proportion of net assets of each class at the beginning of the day.
Taxes: For federal income tax purposes, each series in the Fund is treated as a separate taxpaying entity. It is the Series’ policy to continue to meet the requirements of the Internal Revenue Code applicable to regulated investment companies and to
| Dryden California Municipal Fund/California Series | 25 |
Notes to Financial Statements
Cont’d
distribute all of its taxable net income and capital gains, if any, to shareholders. Therefore, no federal income tax provision is required.
Dividends and Distributions: The Series declares daily dividends from net investment income. Payment of dividends is made monthly. Distributions of net capital gains, if any, are made annually. Dividends and distributions to shareholders, which are determined in accordance with federal income tax regulation and which may differ from generally accepted accounting principles, are recorded on the ex-dividend date. Permanent book/tax differences relating to income and gains are reclassified amongst undistributed net investment income, accumulated net realized gain or loss and paid-in capital in excess of par, as appropriate.
Custody Fee Credits: The Fund has an arrangement with its custodian bank, whereby uninvested assets earn credits which reduce the fees charged by the custodian. The Fund could have invested a portion of the assets utilized in connection with the expense offset arrangements in an income producing asset if they had not entered into such arrangements.
Estimates: The preparation of the financial statements requires management to make estimates and assumptions that affect the reported amounts and disclosures in the financial statements. Actual results could differ from those estimates.
Note 2. Agreements
The Fund has a management agreement with PI. Pursuant to this agreement, PI has responsibility for all investment advisory services and supervises the subadviser’s performance of such services. PI has entered into a subadvisory agreement with Prudential Investment Management, Inc. (“PIM”). The subadvisory agreement provides that PIM will furnish investment advisory services in connection with the management of the Series. In connection therewith, PIM is obligated to keep certain books and records of the Series. PI pays for the services of PIM, the cost of compensation of officers of the Series, occupancy and certain clerical and bookkeeping costs of the Series. The Series bears all other costs and expenses.
The management fee paid to PI is accrued daily and payable monthly, at an annual rate of .50 of 1% of the average daily net assets up to and including $1 billion and .45 of 1% of such average daily net assets in excess of $1 billion of the Series. The effective management fee was .50 of 1% for the year ended August 31, 2005.
| 26 | Visit our website at www.jennisondryden.com |
The Series has a distribution agreement with Prudential Investment Management Services LLC (“PIMS”), which acts as the distributor of the Class A, Class B, Class C and Class Z shares of the Series. The Series compensates PIMS for distributing and servicing the Series’ Class A, Class B and Class C shares, pursuant to plans of distribution (the “Class A, B and C Plans”), regardless of expenses actually incurred by it. The distribution fees are accrued daily and payable monthly. No distribution or service fees are paid to PIMS as distributor for Class Z shares of the Series.
Pursuant to the Class A, B and C Plans, the Series compensates PIMS for distribution-related activities at an annual rate of up to .30 of 1%, .50 of 1% and 1% of the average daily net assets of the Class A, B and C shares, respectively. PIMS has contractually agreed to limit such fees to .25% and .75 of 1% of the Class A and C shares, respectively.
PIMS has advised the Series that they received approximately $28,000 in front-end sales charges resulting from sales of Class A shares during the year ended August 31, 2005. From these fees, PIMS paid such sales charges to affiliated broker-dealers, which in turn paid commissions to salespersons and incurred other distribution costs.
PIMS has advised the Series that for the year ended August 31, 2005, it received approximately $18,600 in contingent deferred sales charges imposed upon redemptions by Class B shareholders.
PI, PIMS and PIM are indirect, wholly-owned subsidiaries of Prudential Financial, Inc. (“Prudential”).
The Series, along with other affiliated registered investment companies (the “Companies”), was a party to a syndicated credit agreement (“SCA”) with a group of banks. For the period from September 1, 2004 through October 29, 2004, the SCA provided for a commitment of $500 million. Interest on any borrowings under the SCA would be incurred at market rates. The Companies paid a commitment fee of .08 of 1% of the unused portion of the SCA. The commitment fee is accrued daily and paid quarterly and is allocated to the Companies pro rata, based on net assets. The purpose of the SCA is to serve as an alternative source of funding for capital share redemptions. The expiration date of the SCA was October 29, 2004. Effective October 29, 2004, the Companies entered into a revised credit agreement with two banks. The commitment under the revised credit agreement continues to be $500 million. The Companies pay a commitment fee of .075 of 1% of the unused portion of the revised credit agreement. The expiration date of the revised credit agreement is October 28, 2005. The Series did not borrow any amounts pursuant to the SCA during the year ended August 31, 2005.
| Dryden California Municipal Fund/California Series | 27 |
Notes to Financial Statements
Cont’d
Note 3. Other Transactions with Affiliates
Prudential Mutual Fund Services LLC (“PMFS”), an affiliate of PI and an indirect, wholly-owned subsidiary of Prudential, serves as the Fund’s transfer agent. Transfer agent fees and expenses in the Statement of Operations include certain out-of-pocket expenses paid to nonaffiliates, where applicable.
The Series pays networking fees to affiliated and unaffiliated broker/dealers. These networking fees are payments made to broker/dealers that clear mutual fund transactions through a national clearing system, First Clearing Corporation, an affiliate of PI, served as a broker/dealer. The Series incurred approximately $7,600 in total networking fees. These amounts are included in transfer agent’s fees and expenses in the Statement of Operations.
Note 4. Portfolio Securities
Purchases and sales of portfolio securities, other than short-term investments, for the year ended August 31, 2005 were $12,906,189 and $26,563,225 respectively.
Note 5. Distributions and Tax Information
In order to present accumulated net investment loss and accumulated net realized gains on the Statement of Assets and liabilities that more closely represent their tax character, certain adjustments have been made to accumulated net investment loss and accumulated net realized gain on investments. For the year ended August 31, 2005, the adjustments were to increase accumulated net investment loss by $22,261 and increase accumulated net realized gain by $22,261 due to the difference in treatment of accreting market discount between financial and tax reporting. Net investment income, net realized gains and net assets were not affected by this change.
For the years ended August 31, 2005 and August 31, 2004, the tax character of distributions, as reflected in the Statement of Changes in Net Assets, were as follows:
Year | Tax-Exempt | Ordinary | Long-Term | Total | ||||
| 2005 | $4,098,409 | — | $3,029,649 | $7,128,058 | ||||
| 2004 | $4,696,910 | $124,036 | $1,782,524 | $6,603,470 |
| 28 | Visit our website at www.jennisondryden.com |
As of August 31, 2005, the accumulated undistributed earnings on a tax basis were $21,596 of tax-exempt income (including a timing difference of $59,974 for dividends payable) and $329,024 of long-term capital gain.
The United States federal income tax basis of the Series’ investments and the net unrealized appreciation as of August 31, 2005 were as follows:
Tax Basis of Investments | Appreciation | Depreciation | Net Unrealized | |||
| $88,865,658 | $9,403,982 | $5,269 | $9,398,713 |
The difference between book basis and tax basis is attributable to the difference in the treatment of premium amortization and accreting market discount for book and tax purposes.
Note 6. Capital
The Series offers Class A, Class B, Class C and Class Z shares. Class A shares are sold with a front-end sales charge of up to 4%. All investors who purchase Class A shares in an amount of $1 million or more and sell these shares within 12 months of purchase are subject to a contingent deferred sales charge (CDSC) of 1%, including investors who purchase their shares through broker-dealers affiliated with Prudential. Class B shares are sold with a CDSC which declines from 5% to zero depending upon the period of time the shares are held. Class C shares purchased are subject to a CDSC of 1% within 12 months from the date of purchase. Class B shares will automatically convert to Class A shares on a quarterly basis approximately seven years after purchase. A special exchange privilege is also available for shareholders who qualify to purchase Class A shares at net asset value. Class Z shares are not subject to any sales or redemption charge and are offered exclusively for sale to limited group of investors.
The Series has authorized an unlimited number of shares of beneficial interest of each class at $.01 par value per share.
| Dryden California Municipal Fund/California Series | 29 |
Notes to Financial Statements
Cont’d
Transactions in shares of beneficial interest were as follows:
Class A | Shares | Amount | |||||
Year ended August 31, 2005: | |||||||
Shares sold | 214,511 | $ | 2,526,807 | ||||
Shares issued in reinvestment of dividends and distributions | 302,902 | 3,546,351 | |||||
Shares reacquired | (1,210,685 | ) | (14,246,368 | ) | |||
Net increase (decrease) in shares outstanding before conversion | (693,272 | ) | (8,173,210 | ) | |||
Shares issued upon conversion from Class B | 273,488 | 3,208,384 | |||||
Net increase (decrease) in shares outstanding | (419,784 | ) | $ | (4,964,826 | ) | ||
Year ended August 31, 2004: | |||||||
Shares sold | 341,993 | $ | 4,105,547 | ||||
Shares issued in reinvestment of dividends and distributions | 259,117 | 3,116,626 | |||||
Shares reacquired | (1,347,278 | ) | �� | (16,060,612 | ) | ||
Net increase (decrease) in shares outstanding before conversion | (746,168 | ) | (8,838,439 | ) | |||
Shares issued upon conversion from Class B | 134,385 | 1,619,117 | |||||
Net increase (decrease) in shares outstanding | (611,783 | ) | $ | (7,219,322 | ) | ||
Class B | |||||||
Year ended August 31, 2005: | |||||||
Shares sold | 40,166 | $ | 474,961 | ||||
Shares issued in reinvestment of dividends and distributions | 47,172 | 552,076 | |||||
Shares reacquired | (210,671 | ) | (2,462,222 | ) | |||
Net increase (decrease) in shares outstanding before conversion | (123,333 | ) | (1,435,185 | ) | |||
Shares reacquired upon conversion into Class A | (273,488 | ) | (3,208,384 | ) | |||
Net increase (decrease) in shares outstanding | (396,821 | ) | $ | (4,643,569 | ) | ||
Year ended August 31, 2004: | |||||||
Shares sold | 63,757 | $ | 764,836 | ||||
Shares issued in reinvestment of dividends and distributions | 46,396 | 558,519 | |||||
Shares reacquired | (270,220 | ) | (3,207,869 | ) | |||
Net increase (decrease) in shares outstanding before conversion | (160,067 | ) | (1,884,514 | ) | |||
Shares reacquired upon conversion into Class A | (134,439 | ) | (1,619,117 | ) | |||
Net increase (decrease) in shares outstanding | (294,506 | ) | $ | (3,503,631 | ) | ||
| 30 | Visit our website at www.jennisondryden.com |
Class C | Shares | Amount | |||||
Year ended August 31, 2005: | |||||||
Shares sold | 5,678 | $ | 66,900 | ||||
Shares issued in reinvestment of dividends and distributions | 7,451 | 87,219 | |||||
Shares reacquired | (35,116 | ) | (414,773 | ) | |||
Net increase (decrease) in shares outstanding | (21,987 | ) | $ | (260,654 | ) | ||
Year ended August 31, 2004: | |||||||
Shares sold | 10,855 | $ | 132,326 | ||||
Shares issued in reinvestment of dividends and distributions | 7,455 | 89,714 | |||||
Shares reacquired | (83,932 | ) | (1,004,262 | ) | |||
Net increase (decrease) in shares outstanding | (65,622 | ) | $ | (782,222 | ) | ||
Class Z | |||||||
Year ended August 31, 2005: | |||||||
Shares sold | 43,571 | $ | 516,435 | ||||
Shares issued in reinvestment of dividends and distributions | 18,671 | 218,750 | |||||
Shares reacquired | (270,420 | ) | (3,175,862 | ) | |||
Net increase (decrease) in shares outstanding | (208,178 | ) | $ | (2,440,677 | ) | ||
Year ended August 31, 2004: | |||||||
Shares sold | 363,951 | $ | 4,357,744 | ||||
Shares issued in reinvestment of dividends and distributions | 18,845 | 226,826 | |||||
Shares reacquired | (431,062 | ) | (5,166,498 | ) | |||
Net increase (decrease) in shares outstanding | (48,266 | ) | $ | (581,928 | ) | ||
| Dryden California Municipal Fund/California Series | 31 |
Financial Highlights
| Class A | ||||
| Year Ended August 31, 2005 | ||||
Per Share Operating Performace: | ||||
Net Asset Value, Beginning Of Year | $ | 11.97 | ||
Income from investment operations | ||||
Net investment income | .46 | |||
Net realized and unrealized gain (loss) on investment transactions | .12 | |||
Total from investment operations | .58 | |||
Less Distributions | ||||
Dividends from net investment income | (.46 | ) | ||
Distributions from net realized gains | (.33 | ) | ||
Total distributions | (.79 | ) | ||
Net asset value, end of year | $ | 11.76 | ||
Total Return(a): | 5.05 | % | ||
Ratios/Supplemental Data: | ||||
Net assets, end of year (000) | $ | 82,726 | ||
Average net assets (000) | $ | 85,811 | ||
Ratios to average net assets: | ||||
Expenses, including distribution and service (12b-1) fees(c) | 1.06 | % | ||
Expenses, excluding distribution and service (12b-1) fees | .81 | % | ||
Net investment income | 3.94 | % | ||
For Class A, B, C and Z shares: | ||||
Portfolio turnover rate | 13 | % | ||
| (a) | Total return does not consider the effects of sales loads. Total return is calculated assuming a purchase of shares on the first day and a sale on the last day of each year reported, and includes reinvestment of dividends and distributions. |
| (b) | Effective September 1, 2001, the Series has adopted the provisions of the AICPA Audit and Accounting Guide for Investment Companies and began accreting market discount on debt securities. The effect of this change for the year ended August 31, 2002 was to increase net investment income and decrease net realized and unrealized gain (loss) per share by less than $.005 and increase the ratio of net investment income from 4.37% to 4.38%. Per share amounts and ratios for the year ended prior to August 31, 2002 have not been restated to reflect this change in presentation. |
| (c) | The distributor of the Series contractually agreed to limit its distribution and service (12b-1) fees to .25 of 1% on the average daily net assets of Class A shares. |
See Notes to Financial Statements.
| 32 | Visit our website at www.jennisondryden.com |
| Class A | ||||||||||||||
| Year Ended August 31, | ||||||||||||||
| 2004 | 2003 | 2002(b) | 2001 | |||||||||||
| $ | 11.95 | $ | 12.30 | $ | 12.36 | $ | 11.78 | |||||||
| .47 | .51 | .53 | .56 | |||||||||||
| .20 | (.27 | ) | .05 | .58 | ||||||||||
| .67 | .24 | .58 | 1.14 | |||||||||||
| (.47 | ) | (.51 | ) | (.53 | ) | (.56 | ) | |||||||
| (.18 | ) | (.08 | ) | (.11 | ) | — | ||||||||
| (.65 | ) | (.59 | ) | (.64 | ) | (.56 | ) | |||||||
| $ | 11.97 | $ | 11.95 | $ | 12.30 | $ | 12.36 | |||||||
| 5.75 | % | 2.02 | % | 4.92 | % | 9.91 | % | |||||||
| $ | 89,239 | $ | 96,409 | $ | 102,729 | $ | 103,368 | |||||||
| $ | 94,033 | $ | 103,428 | $ | 102,429 | $ | 99,324 | |||||||
| 1.04 | % | .97 | % | .97 | % | .98 | % | |||||||
| .79 | % | .72 | % | .72 | % | .73 | % | |||||||
| 3.94 | % | 4.22 | % | 4.38 | % | 4.66 | % | |||||||
| 74 | % | 63 | % | 30 | % | 48 | % | |||||||
See Notes to Financial Statements.
| Dryden California Municipal Fund/California Series | 33 |
Financial Highlights
Cont’d
| Class B | ||||
| Year Ended August 31, 2005 | ||||
Per Share Operating Performace: | ||||
Net Asset Value, Beginning Of Year | $ | 11.97 | ||
Income from investment operations | ||||
Net investment income | .43 | |||
Net realized and unrealized gain (loss) on investment transactions | .12 | |||
Total from investment operations | .55 | |||
Less Distributions | ||||
Dividends from net investment income | (.43 | ) | ||
Distributions from net realized gains | (.33 | ) | ||
Total distributions | (.76 | ) | ||
Net asset value, end of year | $ | 11.76 | ||
Total Return(a): | 4.79 | % | ||
Ratios/Supplemental Data: | ||||
Net assets, end of year (000) | $ | 12,689 | ||
Average net assets (000) | $ | 15,020 | ||
Ratios to average net assets: | ||||
Expenses, including distribution and service (12b-1) fees | 1.31 | % | ||
Expenses, excluding distribution and service (12b-1) fees | .81 | % | ||
Net investment income | 3.69 | % | ||
| (a) | Total return does not consider the effects of sales loads. Total return is calculated assuming a purchase of shares on the first day and a sale on the last day of each year reported, and includes reinvestment of dividends and distributions. |
| (b) | Effective September 1, 2001, the Series has adopted the provisions of the AICPA Audit and Accounting Guide for Investment Companies and began accreting market discount on debt securities. The effect of this change for the year ended August 31, 2002 was to increase net investment income and decrease net realized and unrealized gain (loss) per share by less than $.005 and no effect on the ratio of net investment income. Per share amounts and ratios for the year ended prior to August 31, 2002 have not been restated to reflect this change in presentation. |
See Notes to Financial Statements.
| 34 | Visit our website at www.jennisondryden.com |
| Class B | ||||||||||||||
| Year Ended August 31, | ||||||||||||||
| 2004 | 2003 | 2002(b) | 2001 | |||||||||||
| $ | 11.95 | $ | 12.30 | $ | 12.36 | $ | 11.78 | |||||||
| .44 | .48 | .50 | .53 | |||||||||||
| .20 | (.27 | ) | .05 | .58 | ||||||||||
| .64 | .21 | .55 | 1.11 | |||||||||||
| (.44 | ) | (.48 | ) | (.50 | ) | (.53 | ) | |||||||
| (.18 | ) | (.08 | ) | (.11 | ) | — | ||||||||
| (.62 | ) | (.56 | ) | (.61 | ) | (.53 | ) | |||||||
| $ | 11.97 | $ | 11.95 | $ | 12.30 | $ | 12.36 | |||||||
| 5.48 | % | 1.76 | % | 4.67 | % | 9.63 | % | |||||||
| $ | 17,666 | $ | 21,157 | $ | 25,787 | $ | 27,554 | |||||||
| $ | 19,723 | $ | 23,862 | $ | 26,110 | $ | 28,540 | |||||||
| 1.29 | % | 1.22 | % | 1.22 | % | 1.23 | % | |||||||
| .79 | % | .72 | % | .72 | % | .73 | % | |||||||
| 3.69 | % | 3.97 | % | 4.13 | % | 4.41 | % | |||||||
See Notes to Financial Statements.
| Dryden California Municipal Fund/California Series | 35 |
Financial Highlights
Cont’d
| Class C | ||||
| Year Ended August 31, 2005 | ||||
Per Share Operating Performace: | ||||
Net Asset Value, Beginning Of Year | $ | 11.97 | ||
Income from investment operations | ||||
Net investment income | .40 | |||
Net realized and unrealized gain (loss) on investment transactions | .12 | |||
Total from investment operations | .52 | |||
Less Distributions | ||||
Dividends from net investment income | (.40 | ) | ||
Distributions from net realized gains | (.33 | ) | ||
Total distributions | (.73 | ) | ||
Net asset value, end of year | $ | 11.76 | ||
Total Return(a): | 4.53 | % | ||
Ratios/Supplemental Data: | ||||
Net assets, end of year (000) | $ | 1,447 | ||
Average net assets (000) | $ | 1,544 | ||
Ratios to average net assets: | ||||
Expenses, including distribution and service (12b-1) fees(c) | 1.56 | % | ||
Expenses, excluding distribution and service (12b-1) fees | .81 | % | ||
Net investment income | 3.44 | % | ||
| (a) | Total return does not consider the effects of sales loads. Total return is calculated assuming a purchase of shares on the first day and a sale on the last day of each year reported, and includes reinvestment of dividends and distributions. |
| (b) | Effective September 1, 2001, the Series has adopted the provisions of the AICPA Audit and Accounting Guide for Investment Companies and began accreting market discount on debt securities. The effect of this change for the year ended August 31, 2002 was to increase net investment income and decrease net realized and unrealized gain (loss) per share by less than $.005 and no effect on the ratio of net investment income. Per share amounts and ratios for the year ended prior to August 31, 2002 have not been restated to reflect this change in presentation. |
| (c) | The distributor of the Series contractually agreed to limit its distribution and service (12b-1) fees to .75 of 1% on the average daily net assets of Class C shares. |
See Notes to Financial Statements.
| 36 | Visit our website at www.jennisondryden.com |
| Class C | ||||||||||||||
| Year Ended August 31, | ||||||||||||||
| 2004 | 2003 | 2002(b) | 2001 | |||||||||||
| $ | 11.95 | $ | 12.30 | $ | 12.36 | $ | 11.78 | |||||||
| .41 | .45 | .47 | .50 | |||||||||||
| .20 | (.27 | ) | .05 | .58 | ||||||||||
| .61 | .18 | .52 | 1.08 | |||||||||||
| (.41 | ) | (.45 | ) | (.47 | ) | (.50 | ) | |||||||
| (.18 | ) | (.08 | ) | (.11 | ) | — | ||||||||
| (.59 | ) | (.53 | ) | (.58 | ) | (.50 | ) | |||||||
| $ | 11.97 | $ | 11.95 | $ | 12.30 | $ | 12.36 | |||||||
| 5.22 | % | 1.51 | % | 4.41 | % | 9.36 | % | |||||||
| $ | 1,736 | $ | 2,518 | $ | 2,098 | $ | 1,519 | |||||||
| $ | 2,148 | $ | 2,271 | $ | 1,778 | $ | 1,226 | |||||||
| 1.54 | % | 1.47 | % | 1.47 | % | 1.48 | % | |||||||
| .79 | % | .72 | % | .72 | % | .73 | % | |||||||
| 3.45 | % | 3.74 | % | 3.89 | % | 4.14 | % | |||||||
See Notes to Financial Statements.
| Dryden California Municipal Fund/California Series | 37 |
Financial Highlights
Cont’d
| Class Z | ||||
| Year Ended August 31, 2005 | ||||
Per Share Operating Performace: | ||||
Net Asset Value, Beginning Of Year | $ | 11.97 | ||
Income from investment operations | ||||
Net investment income | .49 | |||
Net realized and unrealized gain (loss) on investment transactions | .12 | |||
Total from investment operations | .61 | |||
Less Distributions | ||||
Dividends from net investment income | (.49 | ) | ||
Distributions from net realized gains | (.33 | ) | ||
Total distributions | (.82 | ) | ||
Net asset value, end of year | $ | 11.76 | ||
Total Return(a): | 5.30 | % | ||
Ratios/Supplemental Data: | ||||
Net assets, end of year (000) | $ | 1,990 | ||
Average net assets (000) | $ | 3,117 | ||
Ratios to average net assets: | ||||
Expenses, including distribution and service (12b-1) fees | .81 | % | ||
Expenses, excluding distribution and service (12b-1) fees | .81 | % | ||
Net investment income | 4.18 | % | ||
| (a) | Total return is calculated assuming a purchase of shares on the first day and a sale on the last day of each year reported, and includes reinvestment of dividends and distributions. |
| (b) | Effective September 1, 2001, the Series has adopted the provisions of the AICPA Audit and Accounting Guide for Investment Companies and began accreting market discount on debt securities. The effect of this change for the year ended August 31, 2002 was to increase net investment income and decrease net realized and unrealized gain (loss) per share by less than $.005 and no effect on the ratio of net investment income. Per share amounts and ratios for the year ended prior to August 31, 2002 have not been restated to reflect this change in presentation. |
See Notes to Financial Statements.
| 38 | Visit our website at www.jennisondryden.com |
| Class Z | ||||||||||||||
| Year Ended August 31, | ||||||||||||||
| 2004 | 2003 | 2002(b) | 2001 | |||||||||||
| $ | 11.95 | $ | 12.30 | $ | 12.37 | $ | 11.79 | |||||||
| .50 | .54 | .56 | .59 | |||||||||||
| .20 | (.27 | ) | .04 | .58 | ||||||||||
| .70 | .27 | .60 | 1.17 | |||||||||||
| (.50 | ) | (.54 | ) | (.56 | ) | (.59 | ) | |||||||
| (.18 | ) | (.08 | ) | (.11 | ) | — | ||||||||
| (.68 | ) | (.62 | ) | (.67 | ) | (.59 | ) | |||||||
| $ | 11.97 | $ | 11.95 | $ | 12.30 | $ | 12.37 | |||||||
| 6.01 | % | 2.27 | % | 5.09 | % | 10.17 | % | |||||||
| $ | 4,517 | $ | 5,087 | $ | 3,832 | $ | 2,298 | |||||||
| $ | 4,805 | $ | 4,300 | $ | 2,778 | $ | 1,708 | |||||||
| .79 | % | .72 | % | .72 | % | .73 | % | |||||||
| .79 | % | .72 | % | .72 | % | .73 | % | |||||||
| 4.19 | % | 4.49 | % | 4.64 | % | 4.90 | % | |||||||
See Notes to Financial Statements.
| Dryden California Municipal Fund/California Series | 39 |
Report of Independent Registered Public Accounting Firm
The Board of Trustees and Shareholders of
Dryden California Municipal Fund—California Series:
We have audited the accompanying statement of assets and liabilities of the Dryden California Municipal Fund—California Series (one of the portfolios constituting Dryden California Municipal Fund, hereafter referred to as the “Series”), including the portfolio of investments, as of August 31, 2005, and the related statement of operations for the year then ended, and the statements of changes in net assets and the financial highlights for each of years in the two-year period then ended. These financial statements and financial highlights are the responsibility of the Series’ management. Our responsibility is to express an opinion on these financial statements and financial highlights based on our audits. The financial highlights for the years presented prior to the year ended August 31, 2004 were audited by another independent registered public accounting firm, whose report dated October 22, 2003, expressed an unqualified opinion thereon.
We conducted our audits in accordance with the standards of the Public Company Accounting Oversight Board (United States). Those standards require that we plan and perform the audit to obtain reasonable assurance about whether the financial statements and financial highlights are free of material misstatement. An audit includes examining, on a test basis, evidence supporting the amounts and disclosures in the financial statements. Our procedures included confirmation of securities owned as of August 31, 2005, by correspondence with the custodian and brokers or by other appropriate auditing procedures where replies from brokers were not received. An audit also includes assessing the accounting principles used and significant estimates made by management, as well as evaluating the overall financial statement presentation. We believe that our audits provide a reasonable basis for our opinion.
In our opinion, the financial statements and financial highlights referred to above present fairly, in all material respects, the financial position of the Series as of August 31, 2005, and the results of its operations for the year then ended, and the changes in its net assets and the financial highlights for each of the years in the two-year period then ended, in conformity with U.S. generally accepted accounting principles.

New York, New York
October 25, 2005
| 40 | Visit our website at www.jennisondryden.com |
Federal Income Tax Information
(Unaudited)
We are required by the Internal Revenue Code to advise you within 60 days of the Series’ fiscal year end (August 31, 2005) as to the federal income tax status of dividends paid during such fiscal year. Accordingly, we are advising you that during its fiscal year ended August 31, 2005, dividends paid from net investment income of $.4617 per Class A share, $.4321 per Class B share, $.4028 per Class C share and $.4901 per Class Z shares were all federally tax-exempt interest dividends. In addition, the Series paid to Class A, B, C and Z shareholders a long-term capital gain distribution of $.3290, which is taxable as such.
We wish to advise you that the corporate dividends received deduction for the Series is zero. Only funds that invest in U.S. equity securities are entitled to pass-through a corporate dividends received deduction.
In January 2006, you will be advised on IRS Form 1099 DIV or substitute 1099 DIV as to the federal tax status of the distributions received by you in calendar 2005.
| Dryden California Municipal Fund/California Series | 41 |
Management of the Fund
(Unaudited)
Information pertaining to the Trustees of the Fund is set forth below. Trustees who are not deemed to be “interested persons” of the Fund, as defined in the Investment Company Act of 1940 as amended, (the 1940 Act) are referred to as “Independent Trustees.” Trustees who are deemed to be “interested persons” of the Fund are referred to as “Interested Trustees.” “Fund Complex”† consists of the Fund and any other investment companies managed by PI.
Independent Trustees(2)
Linda W. Bynoe (53), Trustee since 2005(3) Oversees 88 portfolios in Fund complex.
Principal Occupations (last 5 years): President and Chief Executive Officer (since March 1995) of Telemat Ltd.; formerly Vice President at Morgan Stanley & Co.
Other Directorships held:(4) Director of Dynegy Inc. (since September 2002) and Simon Property Group, Inc. (since May 2003); Director (since August 2005) of The High Yield Plus Fund, Inc.
David E.A. Carson (71), Trustee since 2003(3) Oversees 92 portfolios in Fund complex
Principal occupations (last 5 years): Formerly Director (January 2000-May 2000), Chairman (January 1999-December 1999), Chairman and Chief Executive Officer (January 1998-December 1998) and President, Chairman and Chief Executive Officer (1983-1997) of People’s Bank.
Other Directorships held:(4) Director (since 2004) of The High Yield Plus Fund, Inc.
Robert E. La Blanc (71), Trustee since 2003(3) Oversees 89 portfolios in Fund complex
Principal occupations (last 5 years): President (since 1981) of Robert E. La Blanc Associates, Inc. (telecommunications).
Other Directorships held:(4) Director of Chartered Semiconductor Manufacturing, Ltd. (since 1998); Computer Associates International, Inc. (software company) (since 2002); FiberNet Telecom Group, Inc. (telecom company) (since 2003); Director (since April 1999) of The High Yield Plus Fund, Inc.
Douglas H. McCorkindale (66), Trustee since 2003(3) Oversees 89 portfolios in Fund complex
Principal occupations (last 5 years): Chairman (since February 2001) of Gannett Co. Inc. (publishing and media); formerly Chief Executive Officer (June 2000-July 2005), President (September 1997-July 2005) and Vice Chairman (March 1984-May 2000) of Gannett Co. Inc.
Other Directorships held:(4) Director of Gannett Co. Inc., Director of Continental Airlines, Inc. (since May 1993); Director of Lockheed Martin Corp. (aerospace and defense) (since May 2001); Director of The High Yield Plus Fund, Inc. (since 1996).
Richard A. Redeker (62), Trustee since 1993(3) Oversees 89 portfolios in Fund complex
Principal occupations (last 5 years): Management Consultant; Director of Invesmart, Inc. (since 2001) and Director of Penn Tank Lines, Inc. (since 1999).
Other Directorships held:(4) Director (since January 2005) of The High Yield Plus Fund, Inc.
| 42 | Visit our website at www.jennisondryden.com |
Robin B. Smith (66), Trustee since 2003(3) Oversees 90 portfolios in Fund complex
Principal occupations (last 5 years): Chairman of the Board (since January 2003) of Publishers Clearing House (direct marketing); formerly Chairman and Chief Executive Officer (August 1996-January 2003) of Publishers Clearing House.
Other Directorships held:(4) Director of BellSouth Corporation (since 1992); Director (since January 2005) of The High Yield Plus Fund, Inc.
Stephen G. Stoneburn (62), Trustee since 2003(3) Oversees 89 portfolios in Fund complex
Principal occupations (last 5 years): President and Chief Executive Officer (since June 1996) of Quadrant Media Corp. (a publishing company); formerly President (June 1995-June 1996) of Argus Integrated Media, Inc.; Senior Vice President and Managing Director (January 1993-1995) of Cowles Business Media and Senior Vice President of Fairchild Publications, Inc. (1975-1989).
Other Directorships held:(4) Director (since January 2005) of The High Yield Plus Fund, Inc.
Clay T. Whitehead (66), Trustee since 2003(3) Oversees 90 portfolios in Fund complex
Principal occupations (last 5 years): President (since 1983) of National Exchange Inc. (new business development firm).
Other Directorships held:(4) Director (since 2000) of The High Yield Plus Fund, Inc.
Interested Trustees(1)
Judy A. Rice (57), President since 2003 and Trustee since 2000(3) Oversees 89 portfolios in Fund complex
Principal occupations (last 5 years): President, Chief Executive Officer, Chief Operating Officer and Officer-in-Charge (since February 2003) of PI; Vice President (since February 1999) of Prudential Investment Management Services LLC; President, Chief Executive Officer and Officer-in-Charge (since April 2003) of Prudential Mutual Fund Services LLC; formerly Executive Vice President (September 1999-February 2003) of PI; Member of Board of Governors of the Money Management Institute.
Other Directorships held:(4) Director (since August 2005) of The High Yield Plus Fund, Inc.
Robert F. Gunia (58), Vice President and Trustee since 1996(3) Oversees 160 portfolios in Fund complex
Principal occupations (last 5 years): Chief Administrative Officer (since September 1999) and Executive Vice President (since December 1996) of Prudential Investments LLC; President (since April 1999) of Prudential Investment Management Services LLC; Executive Vice President (since March 1999) and Treasurer (since May 2000) of Prudential Mutual Fund Services LLC.
Other Directorships held:(4) Vice President and Director (since May 1989) and Treasurer (since 1999) of The Asia Pacific Fund, Inc.; Vice President (since 2004) and Director (since August 2005) of The High Yield Plus Fund, Inc.
Information pertaining to the Officers of the Fund who are not also Trustees is set forth below.
Officers(2)
Kathryn L. Quirk (52), Chief Legal Officer since 2005(3)
Principal occupations (last 5 years): Vice President and Corporate Counsel (since September 2004) of Prudential; Executive Vice President, Chief Legal Officer and Secretary (since July 2005) of Prudential Investments LLC and Prudential Mutual Fund Services LLC; formerly Chief Risk Officer and Corporate Secretary (1997-2002) of Zurich Scudder Investments, Inc.
| Dryden California Municipal Fund/California Series | 43 |
Management of the Fund
(Unaudited) Cont’d.
Grace C. Torres (46), Treasurer and Principal Financial and Accounting Officer since 1996(3)
Principal occupations (last 5 years): Assistant Treasurer (since March 1999) and Senior Vice President (since September 1999) of PI; Assistant Treasurer (since May 2003) and Vice President (since June 2005) of American Skandia Investment Services, Inc.; Senior Vice President and Assistant Treasurer (since May 2003) of American Skandia Advisory Services, Inc.; formerly Senior Vice President (May 2003-June 2005) of American Skandia Investment Services, Inc.
Deborah A. Docs (47), Secretary since 1998(3)
Principal occupations (last 5 years): Vice President and Corporates Counsel (since January 2001) of Prudential; Vice President (since December 1996) and Assistant Secretary (since March 1999) of PI; formerly Vice President and Assistant Secretary (May 2003-June 2005) of American Skandia Investment Services, Inc.
Jonathan D. Shain (47), Assistant Secretary since 2004(3)
Principal occupations (last 5 years): Vice President and Corporate Counsel (since August 1998) of Prudential; Vice President and Assistant Secretary (since May 2001) of PI; Vice President and Assistant Secretary (since February 2001) of PMFS; formerly Vice President and Assistant Secretary (May 2003-June 2005) of American Skandia Investment Services, Inc.
Maryanne Ryan (41), Anti-Money Laundering Compliance Officer since 2002(3)
Principal occupations (last 5 years): Anti-Money Laundering Officer and Vice President (since April 2002) of Pruco Securities Corporation; Vice President and Bank Secrecy Act Officer (since July 2002) of Prudential Trust Company; Anti-Money Laundering Officer (since April 2003) of PI.
Lee D. Augsburger (46), Chief Compliance Officer since 2004(3)
Principal occupations (last 5 years): Senior Vice President and Chief Compliance Officer (since April 2003) of PI; Vice President (since November 2000) and Chief Compliance Officer (since October 2000) of Prudential Investment Management, Inc.; Chief Compliance Officer and Senior Vice President (since May 2003) of American Skandia Investment Services, Inc.; Chief Compliance Officer (since October 2004) of Quantitative Management Associates LLC.
| † | The Fund Complex consists of all investment companies managed by PI. The Funds for which PI serves as manager include JennisonDryden Mutual Funds, Strategic Partners Funds, The Prudential Variable Contract Accounts 2, 10, 11, The Target Portfolio Trust, The Prudential Series Fund, Inc., American Skandia Trust and Prudential’s Gibraltar Fund. |
| (1) | “Interested” Trustee, as defined in the 1940 Act, by reason of employment with the Manager (Prudential Investments LLC or PI), the Subadviser (Prudential Investment Management, Inc. or PIM) or the Distributor (Prudential Investment Management Services LLC or PIMS). |
| (2) | Unless otherwise noted, the address of the Trustees and Officers is c/o: Prudential Investments LLC, Gateway Center Three, 100 Mulberry Street, Newark, NJ 07102. |
| (3) | There is no set term of office for Trustees and Officers. The Independent Trustees have adopted a retirement policy, which calls for the retirement of Trustees on December 31 of the year in which they reach the age of 75. The table shows the individuals length of service as Trustee and/or Officer. |
| (4) | This column includes only directorships of companies required to register, or file reports with the SEC under the Securities and Exchange Act of 1934 (that is, “public companies”) or other investment companies registered under the 1940 Act. |
| 44 | Visit our website at www.jennisondryden.com |
Approval of Advisory Agreements
The Board of Trustees (the “Board”) of Dryden California Municipal Fund oversees the management of the California Series (the “Fund”), and, as required by law, determines annually whether to renew the Fund’s management agreement with Prudential Investments LLC (“PI”) and the Fund’s subadvisory agreement with Prudential Investment Management, Inc. (“PIM”). In considering the renewal of the agreements, the Board, including a majority of the Independent Trustees, met on May 24, 2005 and June 23, 2005 and approved the renewal of the agreements through July 31, 2006, after concluding that renewal of the agreements was in the best interests of the Fund and its shareholders.
In advance of the meetings, the Board received materials relating to the agreements, and had the opportunity to ask questions and request further information in connection with their consideration. Among other things, the Board considered comparisons with other mutual funds in relevant Peer Universes and Peer Groups. Peer Universes and Peer Groups are mutual funds grouped by investment style. The mutual funds included in each Peer Universe or Peer Group were objectively determined solely by Lipper Inc. (“Lipper”), an independent provider of mutual fund data. The comparisons placed the Fund in various quartiles over one-year, three-year and five-year time periods ending December 31, with the first quartile being the best 25% of the mutual funds (for performance, the best performing mutual funds and, for expenses, the lowest cost mutual funds).
In approving the agreements, the Board, including the Independent Trustees advised by independent legal counsel, considered the factors they deemed relevant, including the nature, quality and extent of services provided, the performance of the Fund, the profitability of PI and its affiliates, expenses and fees, and the potential for economies of scale that may be shared with the Fund and its shareholders. In their deliberations, the Trustees did not identify any single factor that was dispositive and each Trustee attributed different weights to the various factors. In connection with their deliberations, the Board considered information provided by PI throughout the year at regular Board meetings, presentations from portfolio managers and other information, as well as information furnished at or in advance of the meetings on May 24, 2005 and June 23, 2005.
The Trustees determined that the overall arrangements between the Fund and PI, which serves as the Fund’s investment manager pursuant to a management agreement, and between PI and PIM, which serves as the Fund’s subadviser pursuant to the terms of a subadvisory agreement with PI, are fair and reasonable in light of the services performed, fees charged and such other matters as the Trustees considered relevant in the exercise of their business judgment.
| Dryden California Municipal Fund/California Series |
Approval of Advisory Agreements (continued)
Several of the material factors and conclusions that formed the basis for the Trustees’ reaching their determinations to approve the continuance of the agreements are separately discussed below.
Nature, Quality and Extent of Services
The Board received and considered information regarding the nature and extent of services provided to the Fund by PI and PIM. The Board considered the services provided by PI, including but not limited to the oversight of the subadviser for the Fund, as well as the provision of recordkeeping, compliance, and other services to the Fund. With respect to PI’s oversight of the subadviser, the Board noted that PI’s Strategic Investment Research Group (“SIRG”), which is a business unit of PI, is responsible for monitoring and reporting to the Board on the performance and operations of the subadviser. The Board also considered that PI pays the salaries of all of the officers and non-independent Trustees of the Fund. The Board also considered the investment subadvisory services provided by PIM, as well as adherence to the Fund’s investment restrictions and compliance with applicable Fund policies and procedures.
The Board reviewed the qualifications, backgrounds and responsibilities of PI’s senior management responsible for the oversight of the Fund and PIM, and also reviewed the qualifications, backgrounds and responsibilities of PIM’s portfolio managers who are responsible for the day-to-day management of the Fund’s portfolio. The Board was provided with information pertaining to PI’s and PIM’s organizational structure, senior management, investment operations, and other relevant information pertaining to both PI and PIM. The Board also noted that it received favorable compliance reports from the Fund’s Chief Compliance Officer (CCO) as to both PI and PIM. The Board noted that PIM is affiliated with PI.
The Board concluded that it was satisfied with the nature, extent and quality of the investment management services provided by PI and the subadvisory services provided to the Fund by PIM, and that there was a reasonable basis on which to conclude that the Fund benefits from the services provided by PI and PIM under the management and subadvisory agreements.
Performance of California Series
The Board received and considered information about the Fund’s historical performance, noting that, for periods ending December 31, 2004, the Fund had achieved performance that was in the second quartile for the three-year, five-year and ten-year periods and performance that was in the fourth quartile, over a one-year period. This performance information was in relation to the group of comparable
| Visit our website at www.jennisondryden.com |
funds in a Peer Universe. The Board also noted that the Fund’s underperformance was primarily attributable to a decision by PIM to maintain positions in short- and intermediate-duration bonds in order to avoid realizing capital gains, and to the decision to underweight the tobacco sector, which performed well for the period. The Board noted that PIM had begun to implement strategies in order to address the Fund’s underperformance, and that PIM had recently hired a new lead portfolio manager.
The Board noted that the Fund’s long-term performance had been satisfactory and concluded that in light of the changes being implemented by PIM, it was reasonable to approve the continuance of the management and subadvisory agreements and to continue to monitor the steps being taken to improve performance as well as the performance record being developed by the new lead portfolio manager.
Fees and Expenses
The Board considered the management fee for the Fund as compared to the management fee charged by PI to other funds and accounts and the fee charged by other advisers to comparable mutual funds as provided by Lipper.
The Fund’s management fee of 0.500% ranked in the second quartile in its Peer Group. The Board concluded that the management and subadvisory fees are reasonable.
Costs of Services and Profits Realized by PI
The Board was provided with information on the profitability of PI and its affiliates in serving as the Fund’s investment manager. The Board discussed with PI the methodology utilized in assembling the information regarding profitability and considered its reasonableness. The Board recognized that it is difficult to make comparisons of profitability from fund management contracts because comparative information is not generally publicly available and is affected by numerous factors, including the structure of the particular investment manager, the types of funds it manages, its business mix, numerous assumptions regarding allocations and the investment manager’s capital structure and cost of capital. The Board did not separately consider the profitability of the subadviser, an affiliate of PI, as its profitability was reflected in the profitability report for PI. Taking these factors into account, the Board concluded that the profitability of PI and its affiliates in relation to the services rendered was not unreasonable.
| Dryden California Municipal Fund/California Series |
Approval of Advisory Agreements (continued)
Economies of Scale
The Board noted that the management fee schedule for the Fund includes breakpoints, which have the effect of decreasing the fee rate as assets increase, but at the current level of assets the Fund does not realize the effect of those rate reductions. The Board received and discussed information concerning whether PI realizes economies of scale as the Fund’s assets grow beyond current levels. The Board took note that the Fund’s fee structure would result in benefits to Fund shareholders when (and if) assets reach the levels at which the fee rate is reduced. These benefits will accrue whether or not PI is then realizing any economies of scale.
Other Benefits to PI and PIM
The Board considered potential ancillary benefits that might be received by PI and PIM and their affiliates as a result of their relationship with the Fund. The Board concluded that potential benefits to be derived by PI included transfer agency fees received by the Fund’s transfer agent (which is affiliated with PI), as well as reputational or other intangible benefits resulting from PI’s association with the Fund. The Board concluded that the potential benefits to be derived by PIM included those generally resulting from an increase in assets under management, specifically, potential access to additional research resources and reputational benefits. The Board concluded that the benefits derived by PI and PIM were consistent with the types of benefits generally derived by investment managers and subadvisers to mutual funds.
| Visit our website at www.jennisondryden.com |
Growth of a $10,000 Investment
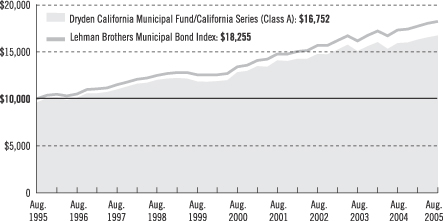
| Average Annual Total Returns (With Sales Charges) as of 8/31/05 | ||||||||||
| One Year | Five Years | Ten Years | Since Inception | |||||||
Class A | 0.85 | % | 4.64 | % | 5.30% (5.28) | 6.11% (6.10) | ||||
Class B | –0.12 | 5.07 | 5.41 (5.39) | 6.88 (6.60) | ||||||
Class C | 3.55 | 4.98 | 5.15 (5.13) | 5.31 (5.29) | ||||||
Class Z | 5.30 | 5.74 | N/A | 5.94 (5.93) | ||||||
| Average Annual Total Returns (Without Sales Charges) as of 8/31/05 | ||||||||||
| One Year | Five Years | Ten Years | Since Inception | |||||||
Class A | 5.05 | % | 5.50 | % | 5.73% (5.71) | 6.39% (6.38) | ||||
Class B | 4.79 | 5.24 | 5.41 (5.39) | 6.88 (6.60) | ||||||
Class C | 4.53 | 4.98 | 5.15 (5.13) | 5.31 (5.29) | ||||||
Class Z | 5.30 | 5.74 | N/A | 5.94 (5.93) | ||||||
Performance data quoted represent past performance. Past performance does not guarantee future results. The investment return and principal value of an investment will fluctuate, so that an investor’s shares, when redeemed, may be worth more or less than their original cost. Current performance may be lower or higher than the past performance data quoted. An investor may obtain performance data as of the most recent month-end by visiting our website at www.jennisondryden.com or by calling (800) 225-1852. The maximum initial sales charge is 4.00% (Class A shares).
| Visit our website at www.jennisondryden.com |
Source: Prudential Investments LLC and Lipper Inc.
Inception dates: Class A, 1/22/90; Class B, 9/19/84; Class C, 8/1/94; and Class Z, 9/18/96.
The graph compares a $10,000 investment in the Dryden California Municipal Fund/California Series (Class A shares) with a similar investment in the Lehman Brothers Municipal Bond Index by portraying the initial account values at the beginning of the 10-year period for Class A shares (August 31, 1995) and the account values at the end of the current fiscal year (August 31, 2005), as measured on a quarterly basis. For purposes of the graph, and unless otherwise indicated, it has been assumed that (a) the maximum applicable front-end sales charge was deducted from the initial $10,000 investment in Class A shares; (b) all recurring fees (including management fees) were deducted; and (c) all dividends and distributions were reinvested. The line graph provides information for Class A shares only. As indicated in the tables provided earlier, performance for Class B, Class C, and Class Z shares will vary due to the differing charges and expenses applicable to each share class (as indicated in the following paragraphs). Without a distribution and service (12b-1) fee waiver of 0.05% for Class A shares through August 31, 2005, the returns shown in the graph and for Class A shares in the tables would have been lower.
The Lehman Brothers Municipal Bond Index is an unmanaged index of over 39,000 long-term investment-grade municipal bonds. It gives a broad look at how long-term investment-grade municipal bonds have performed. The Index’s total returns include the reinvestment of all dividends, but do not include the effects of sales charges, operating expenses of a mutual fund, or taxes. The returns for the Index would be lower if they included the effects of sales charges, operating expenses, or taxes. The securities that comprise the Index may differ substantially from the securities in the Series. This is not the only index that may be used to characterize performance of municipal bond funds. Other indexes may portray different comparative performance. Investors cannot invest directly in an index.
Class A shares are subject to a maximum front-end sales charge of 4.00% and a 12b-1 fee of up to 0.30% annually. Investors who purchase Class A shares in an amount of $1 million or more do not pay a front-end sales charge, but are subject to a contingent deferred sales charge (CDSC) of 1% for shares sold within 12 months of purchase. Class B shares are subject to a declining CDSC of 5%, 4%, 3%, 2%, 1%, and 1% respectively for the first six years after purchase and a 12b-1 fee of up to 0.50% annually. Approximately seven years after purchase, Class B shares will automatically convert to Class A shares on a quarterly basis. Class C shares are subject to a CDSC of 1% for 12 months from the date of purchase and the annual 12b-1 fee will remain up to 1%. Class Z shares are not subject to a sales charge or 12b-1 fee. The returns on investment in the graph and the returns in the tables do not reflect the deduction of taxes that a shareholder would pay on Fund distributions or following the redemption of Fund shares. Without waiver of fees and/or expense subsidization, the Series’ returns would have been lower, as indicated in parentheses.
| Dryden California Municipal Fund/California Series |
| n MAIL | n TELEPHONE | n WEBSITE | ||
Gateway Center Three 100 Mulberry Street Newark, NJ 07102 | (800) 225-1852 | www.jennisondryden.com |
| PROXY VOTING |
| The Board of Trustees of the Fund has delegated to the Series’ investment subadviser the responsibility for voting any proxies and maintaining proxy recordkeeping with respect to the Series. A description of these proxy voting policies and procedures is available without charge, upon request, by calling (800) 225-1852 or by visiting the Securities and Exchange Commission’s (the Commission) website at www.sec.gov. Information regarding how the Series voted proxies relating to portfolio securities during the most recent 12-month period ended June 30, 2005, is available on the Series’ website at www.jennisondryden.com and on the Commission’s website at www.sec.gov. |
| TRUSTEES |
| Linda W. Bynoe • David E.A. Carson • Robert F. Gunia • Robert E. La Blanc • Douglas H. McCorkindale • Richard A. Redeker • Judy A. Rice • Robin B. Smith • Stephen G. Stoneburn • Clay T. Whitehead |
| OFFICERS |
| Judy A. Rice, President • Robert F. Gunia, Vice President • Grace C. Torres, Treasurer and Principal Financial and Accounting Officer • Kathryn L. Quirk, Chief Legal Officer • Deborah A. Docs, Secretary • Jonathan D. Shain, Assistant Secretary • Maryanne Ryan, Anti-Money Laundering Compliance Officer • Lee D. Augsburger, Chief Compliance Officer |
| MANAGER | Prudential Investments LLC | Gateway Center Three 100 Mulberry Street Newark, NJ 07102 | ||
| INVESTMENT SUBADVISER | Prudential Investment Management, Inc. | Gateway Center Two 100 Mulberry Street Newark, NJ 07102 | ||
| DISTRIBUTOR | Prudential Investment Management Services LLC | Gateway Center Three 100 Mulberry Street Newark, NJ 07102 | ||
| CUSTODIAN | ||||
| Through September 11, 2005 | State Street Bank and Trust Company | One Heritage Drive North Quincy, MA 02171 | ||
| Effective September 12, 2005 | The Bank of New York | One Wall Street New York, NY 10286 | ||
| TRANSFER AGENT | Prudential Mutual Fund Services LLC | PO Box 8098 Philadelphia, PA 19176 | ||
INDEPENDENT REGISTERED PUBLIC ACCOUNTING FIRM | KPMG LLP | 345 Park Avenue New York, NY 10154 | ||
| FUND COUNSEL | Shearman & Sterling LLP | 599 Lexington Avenue New York, NY 10022 | ||
| An investor should consider the investment objectives, risks, charges, and expenses of the Series carefully before investing. The prospectus for the Series contains this and other information about the Series. An investor may obtain a prospectus by visiting our website at www.jennisondryden.com or by calling (800) 225-1852. The prospectus should be read carefully before investing. |
| E-DELIVERY |
| To receive your mutual fund documents on-line, go to www.icsdelivery.com/prudential/funds and enroll. Instead of receiving printed documents by mail, you will receive notification via e-mail when new materials are available. You can cancel your enrollment or change your e-mail address at any time by clicking on the change/cancel enrollment option at the icsdelivery website address. |
| SHAREHOLDER COMMUNICATIONS WITH TRUSTEES |
| Shareholders can communicate directly with the Board of Trustees by writing to the Chair of the Board, Dryden California Municipal Fund/California Series, PO Box 13964, Philadelphia, PA 19176. Shareholders can communicate directly with an individual Trustee by writing to the same address. Communications are not screened before being delivered to the addressee. |
| AVAILABILITY OF PORTFOLIO SCHEDULE |
| The Series files its complete schedule of portfolio holdings with the Securities and Exchange Commission (the Commission) for the first and third quarters of each fiscal year on Form N-Q. The Series’ Forms N-Q are available on the Commission’s website at www.sec.gov. The Series’ Forms N-Q may also be reviewed and copied at the Commission’s Public Reference Room in Washington, D.C. Information on the operation and location of the Public Reference Room may be obtained by calling (800) SEC-0330 (732-0330). The Series will provide a full list of its portfolio holdings as of the end of each month on its website at www.jennisondryden.com approximately 30 days after the end of the month. |
| The Series’ Statement of Additional Information contains additional information about the Series’ Trustees and is available without charge upon request by calling (800) 225-1852. |
Mutual Funds:
| ARE NOT INSURED BY THE FDIC OR ANY FEDERAL GOVERNMENT AGENCY | MAY LOSE VALUE | ARE NOT A DEPOSIT OF OR GUARANTEED BY ANY BANK OR ANY BANK AFFILIATE |

| Dryden California Municipal Fund/California Series | ||||||||||||
| Share Class | A | B | C | Z | ||||||||
NASDAQ | PRMCX | PBCMX | PCCSX | PZCSX | ||||||||
CUSIP | 262433881 | 262433873 | 262433865 | 262433857 | ||||||||
MF116E IFS-A110263 Ed. 10/2005

Dryden California Municipal Fund/California Income Series
| AUGUST 31, 2005 | ANNUAL REPORT |

FUND TYPE
Municipal bond
OBJECTIVE
Maximize current income that is exempt from California state and federal income taxes, consistent with the preservation of capital
This report is not authorized for distribution to prospective investors unless preceded or accompanied by a current prospectus.
The views expressed in this report and information about the Series’ portfolio holdings are for the period covered by this report and are subject to change thereafter.
JennisonDryden is a registered trademark of The Prudential Insurance Company of America.

October 14, 2005
Dear Shareholder:
We hope you find the annual report for the California Income Series informative and useful. As a JennisonDryden mutual fund shareholder, you may be thinking about where you can find additional growth opportunities. You could invest in last year’s top-performing asset class and hope that history repeats itself or you could stay in cash while waiting for the “right moment” to invest.
Instead, we believe it is better to take advantage of developing domestic and global investment opportunities through a diversified portfolio of stock and bond mutual funds. A diversified asset allocation offers two potential advantages. It helps you manage downside risk by not being overly exposed to any particular asset class, plus it gives you a better opportunity to have at least some of your assets in the right place at the right time. Your financial professional can help you create a diversified investment plan that may include mutual funds covering all the basic asset classes and that reflects your personal investor profile and tolerance for risk.
JennisonDryden Mutual Funds gives you a wide range of choices that can help you make progress toward your financial goals. Our funds offer the experience, resources, and professional discipline of three leading asset managers. They are recognized and respected in the institutional market and by discerning investors for excellence in their respective strategies. JennisonDryden equity funds are advised by Jennison Associates LLC or Quantitative Management Associates LLC (QMA). Prudential Investment Management, Inc. (PIM) advises the JennisonDryden fixed income and money market funds. Jennison Associates, QMA, and PIM are registered investment advisers and Prudential Financial companies.
Thank you for choosing JennisonDryden Mutual Funds.
Sincerely,

Judy A. Rice, President
Dryden California Municipal Fund/California Income Series
| Dryden California Municipal Fund/California Income Series | 1 |
Your Series’ Performance
Series objective
The investment objective of the Dryden California Municipal Fund/California Income Series (the Series) is to maximize current income that is exempt from California state and federal income taxes, consistent with the preservation of capital. There can be no assurance that the Series will achieve its investment objective.
Performance data quoted represent past performance. Past performance does not guarantee future results. The investment return and principal value of an investment will fluctuate, so that an investor’s shares, when redeemed, may be worth more or less than their original cost. Current performance may be lower or higher than the past performance data quoted. An investor may obtain performance data as of the most recent month-end by visiting our website at www.jennisondryden.com or by calling (800) 225-1852. The maximum initial sales charge is 4.00% (Class A shares).
| Cumulative Total Returns1 as of 8/31/05 | ||||||||||
| One Year | Five Years | Ten Years | Since Inception2 | |||||||
Class A | 6.02 | % | 31.98 | % | 79.99% (79.18) | 170.12% (162.36) | ||||
Class B | 5.76 | 30.24 | 74.71 (73.93) | 87.82 (85.46) | ||||||
Class C | 5.50 | 28.63 | 70.40 (69.64) | 83.16 (81.51) | ||||||
Class Z | 6.29 | 33.76 | N/A | 70.42 (70.12) | ||||||
Lehman Brothers Municipal Bond Index3 | 5.31 | 36.19 | 82.55 | *** | ||||||
Lipper California (CA) Muni Debt Funds Avg.4 | 5.88 | 30.80 | 73.46 | **** | ||||||
| Average Annual Total Returns1 as of 9/30/05 | ||||||||||
| One Year | Five Years | Ten Years | Since Inception2 | |||||||
Class A | 0.41 | % | 4.85 | % | 5.49% (5.44) | 6.58% (6.37) | ||||
Class B | –0.67 | 5.27 | 5.61 (5.56) | 5.40 (5.29) | ||||||
Class C | 3.07 | 5.17 | 5.35 (5.30) | 5.49 (5.40) | ||||||
Class Z | 4.85 | 6.01 | N/A | 6.00 (5.97) | ||||||
Lehman Brothers Municipal Bond Index3 | 4.05 | 6.34 | 6.06 | *** | ||||||
Lipper California (CA) Muni Debt Funds Avg.4 | 4.52 | 5.49 | 5.50 | **** | ||||||
| Distributions and Yields1 as of 8/31/05 | ||||||||||||
| Taxable Equivalent 30-Day Yield5 at Tax Rates of | ||||||||||||
| Total Distributions Paid for 12 Months | 30-Day SEC Yield | 33% | 35% | |||||||||
Class A | $ | 0.46 | 2.90 | % | 4.77 | % | 4.92 | % | ||||
Class B | $ | 0.43 | 2.77 | 4.56 | 4.70 | |||||||
Class C | $ | 0.40 | 2.52 | 4.15 | 4.27 | |||||||
Class Z | $ | 0.48 | 3.27 | 5.38 | 5.55 | |||||||
| 2 | Visit our website at www.jennisondryden.com |
The cumulative total returns do not reflect the deduction of applicable sales charges. If reflected, the applicable sales charges would reduce the cumulative total returns performance quoted. Class A shares are subject to a maximum front-end sales charge of 4.00%. Under certain circumstances, Class A shares may be subject to a contingent deferred sales charge (CDSC) of 1%. Class B and Class C shares are subject to a maximum CDSC of 5% and 1% respectively. Class Z shares are not subject to a sales charge.
1Source: Prudential Investments LLC and Lipper Inc. The average annual total returns take into account applicable sales charges. During certain periods shown, fee waivers and/or expense reimbursements were in effect. Without such fee waivers and expense reimbursements, the returns for the share classes would have been lower. Class A, Class B, and Class C shares are subject to an annual distribution and service (12b-1) fee of up to 0.3%, 0.5%, and 1.0% respectively. Approximately seven years after purchase, Class B shares will automatically convert to Class A shares on a quarterly basis. Class Z shares are not subject to a 12b-1 fee. The returns in the tables do not reflect the deduction of taxes that a shareholder would pay on Fund distributions or following the redemption of Fund shares. Without waiver of fees and/or expense subsidization, the Series’ returns would have been lower, as indicated in parentheses.
2Inception dates: Class A, 12/3/90; Class B, 12/7/93; Class C, 8/1/94; and Class Z, 9/18/96.
3The Lehman Brothers Municipal Bond Index is an unmanaged index of over 39,000 long-term investment-grade municipal bonds. It gives a broad look at how long-term investment-grade municipal bonds have performed.
4The Lipper CA Muni Debt Funds Average (Lipper Average) represents returns based on an average return of all funds in the Lipper CA Muni Debt Funds category for the periods noted. Funds in the Lipper Average limit their assets to those securities that are exempt from taxation in California.
5Taxable equivalent yields reflect federal and applicable state tax rates.
Investors cannot invest directly in an index. The returns for the Lehman Brothers Municipal Bond Index would be lower if they included the effects of sales charges, operating expenses of a mutual fund, or taxes. Returns for the Lipper Average reflect the deduction of operating expenses, but not sales charges or taxes.
***Lehman Brothers Municipal Bond Index Closest Month-End to Inception cumulative total returns as of 8/31/05 are 167.03% for Class A, 98.14% for Class B, 99.42% for Class C, and 71.08% for Class Z. Lehman Brothers Municipal Bond Index Closest Month-End to Inception average annual total returns as of 9/30/05 are 6.80% for Class A, 5.89% for Class B, 6.31% for Class C, and 6.07% for Class Z.
****Lipper Average Closest Month-End to Inception cumulative total returns as of 8/31/05 are 151.03% for Class A, 86.14% for Class B, 87.08% for Class C, and 61.58% for Class Z. Lipper Average Closest Month-End to Inception average annual total returns as of 9/30/05 are 6.35% for Class A, 5.32% for Class B, 5.69% for Class C, and 5.38% for Class Z.
| Dryden California Municipal Fund/California Income Series | 3 |
Your Series’ Performance (continued)
| Five Largest Issues expressed as a percentage of net assets as of 8/31/05 | |||
Foothill/Eastern Trans. Corr. Agcy., Toll Rd. Rev., 1/01/13, 7.15% | 3.0 | % | |
Southern Pub. Pwr. Auth., Palo Verde Proj., 7/01/16, Zero Coupon | 2.9 | ||
Orange Cnty. Loc. Trans. Auth., Sales. Tax Rev., 2/14/11, 6.20% | 2.4 | ||
California St. Pub. Wks. Brd., Rev., Dept. Mental Hlth., 6/01/18, 5.50% | 2.4 | ||
California Edl. Facs. Auth. Rev., Rfdg. Stanford Univ., 11/01/21, 5.00% | 2.1 |
Issues are subject to change.
| Credit Quality expressed as a percentage of net assets as of 8/31/05 | |||
Aaa | 52.9 | % | |
Aa | 3.6 | ||
A | 10.9 | ||
Baa | 7.1 | ||
Ba | 1.4 | ||
B | 0.5 | ||
Not Rated | 22.6 | ||
Total Investments | 99.0 | ||
Other assets in excess of liabilities | 1.0 | ||
Net Assets | 100.0 | % | |
Source: Moody’s rating, defaulting to S&P when not rated by Moody’s.
Credit quality is subject to change.
| 4 | Visit our website at www.jennisondryden.com |
Investment Adviser’s Report
Prudential Investment Management, Inc.
Key national and local factors influence municipal market
The Federal Reserve’s latest campaign to boost short-term interest rates was one of the most significant developments that influenced the municipal bond market during the Series’ fiscal year that began September 1, 2004. Important events also occurred at the state level. California’s improving financial health helped trim its budget deficit, which strengthened the Golden State’s general obligation (GO) bonds to such an extent that they were upgraded by prominent credit-rating agencies. For the 12-month reporting period ended August 31, 2005, the municipal bond market returned 5.31%, outperforming the U.S. Treasury market that returned 4.12%, based on the Lehman Brothers Municipal Bond Index (the Index) and the Lehman Brothers U.S. Treasury Index respectively.
The Series’ holdings were diversified across many sectors of the California municipal securities market to spread risk. However, it was our select emphasis on a few sectors that helped the Series’ share classes outperform the Index. The Series’ Class A and Class Z shares posted returns that exceeded the Lipper California Muni Debt Funds Average (Lipper Average), but the Series’ Class B and Class C shares trailed the Lipper Average.
Federal Reserve Chairman notes unusual market behavior
Fed policymakers hoped to gradually withdraw some of the excessive monetary stimulus from the U.S. economy to curb mounting inflationary pressures. They raised the target for the federal funds rate on overnight loans between banks eight times by a quarter percentage point, lifting the key rate from 1.50% to 3.50%. Short-term municipal bond yields rose considerably as these bond yields are the most sensitive to changes in the federal funds rate. (This caused their prices to decline because bond prices move in the opposite direction of their yields.) Overall, intermediate-term municipal bond yields declined slightly while, surprisingly, long-term municipal bond yields declined significantly. Even Fed Chairman Alan Greenspan, while speaking to Congress in February 2005, admitted he was puzzled by the unusual behavior of long-term interest rates in general.
Overweight exposure to zero coupon bonds aided the Series
The change in yields created a pronounced flattening in the slope of the municipal bond yield curve, which shows yields on tax-exempt bonds from the shortest to the longest maturities. The change in yields also meant that short- and intermediate-term municipal bonds underperformed long-term municipal bonds for the reporting period. Under these market conditions, the Series benefited from having a greater exposure to long-term zero coupon bonds than the Index. Zero coupon bonds are so named because they pay no periodic interest and are sold at discount prices to compensate
| Dryden California Municipal Fund/California Income Series | 5 |
Investment Adviser’s Report (continued)
for their lack of periodic interest payments. Zero coupon bonds are also very sensitive to changes in interest rates. Therefore, as long-term yields declined, long-term zero coupon bond prices climbed rapidly, enabling them to perform better than other municipal bonds for the reporting period.
Emphasis on lower-quality municipal bonds worked well
Another positive for the Series was its large position in lower-quality municipal bonds, many of which were not rated. Lower-quality bonds, with their relatively attractive yields, performed better than higher-quality bonds in what was essentially a low-interest-rate environment. Among the Series’ holdings of lower-quality bonds were special tax/assessment district bonds, which represented the Series’ largest sector concentration and an overweight exposure relative to the Index. The bonds help finance the development of public infrastructure for residential communities in California where special taxes levied on parcels of land are sufficient to pay debt service on the bonds. The sector benefited from a fundamentally strong real estate market as well as investors’ search for municipal bonds with attractive yields.
Underweight exposure to California GO bonds hurt the Series
As mentioned earlier, California’s GO bonds were upgraded by major credit-rating agencies, but we believe the state still needs to bring structural balance to its budget so that projected revenues match projected expenditures. That said, California GO bonds still performed well during the reporting period, and the Series’ underweight exposure to them detracted from its performance relative to the Index. We usually maintain an underweight exposure to California GO bonds as they are backed by the taxing authority of the state of California and tend to provide lower yields than other bonds that are only secured by revenues from specific projects.
Tobacco-related bonds had mixed impact on Series
The tobacco-related sector of the municipal bond market remains volatile. However, certain legal developments widely believed to favor tobacco firms helped boost the value of tobacco-related municipal bonds during the reporting period, even though there is no assurance that these rulings will not be overturned, in whole or in part, by another court. In addition, California refunded some of its Golden State Tobacco Securitization Asset-Backed Bonds (Golden State Tobacco Bonds). This means the state of California placed in an escrow account U.S. Treasury securities whose interest and principal will be used to pay off the Golden State Tobacco Bonds. The refunded debt securities no longer depend on funds of participating tobacco firms paid under the Master Settlement Agreement (MSA) signed in 1998 or appropriated funds of the state of California.
| 6 | Visit our website at www.jennisondryden.com |
Our investment strategy in the tobacco-related sector had a mixed impact on the Series’ relative performance. The Series had an underweight exposure to Golden State Tobacco Bonds that are backed solely by MSA funds. Although these bonds are lower rated because they depend on only one source of revenue, they still performed well. Therefore having an underweight exposure to them detracted from the Series’ returns relative to the Index. On the other hand, the Series’ overweight position in the refunded Golden State Tobacco Bonds benefited its performance relative to the Index.
| Dryden California Municipal Fund/California Income Series | 7 |
Fees and Expenses (Unaudited)
As a shareholder of the Series, you incur two types of costs: (1) transaction costs, including sales charges (loads) on purchase payments and redemptions, as applicable, and (2) ongoing costs, including management fees, distribution and/or service (12b-1) fees, and other Series expenses, as applicable. This example is intended to help you understand your ongoing costs (in dollars) of investing in the Series and to compare these costs with the ongoing costs of investing in other mutual funds.
The example is based on an investment of $1,000 invested on March 1, 2005, at the beginning of the period, and held through the six-month period ended August 31, 2005.
The Series’ transfer agent may charge additional fees to holders of certain accounts that are not included in the expenses shown in the table on the following page. These fees apply to Individual Retirement Accounts (IRAs) and Section 403(b) accounts. As of the close of the six-month period covered by the table, IRA fees included an annual maintenance fee of $15 per account (subject to a maximum annual maintenance fee of $25 for all accounts held by the same shareholder). Section 403(b) accounts are charged an annual $25 fiduciary maintenance fee. Some of the fees may vary in amount, or may be waived, based on your total account balance or the number of JennisonDryden or Strategic Partners Funds, including the Series, that you own. You should consider the additional fees that were charged to your Series account over the six-month period when you estimate the total ongoing expenses paid over the period and the impact of these fees on your ending account value, as these additional expenses are not reflected in the information provided in the expense table. Additional fees have the effect of reducing investment returns.
Actual Expenses
The first line for each share class in the table on the following page provides information about actual account values and actual expenses. You may use the information on this line, together with the amount you invested, to estimate the expenses that you paid over the period. Simply divide your account value by $1,000 (for example, an $8,600 account value ÷ $1,000 = 8.6), then multiply the result by the number on the first line under the heading “Expenses Paid During the Six-Month Period” to estimate the expenses you paid on your account during this period.
Hypothetical Example for Comparison Purposes
The second line for each share class in the table on the following page provides information about hypothetical account values and hypothetical expenses based on the Series’ actual expense ratio and an assumed rate of return of 5% per year before expenses, which is not the Series’ actual return. The hypothetical account values and
| 8 | Visit our website at www.jennisondryden.com |
expenses may not be used to estimate the actual ending account balance or expenses you paid for the period. You may use this information to compare the ongoing costs of investing in the Series and other funds. To do so, compare this 5% hypothetical example with the 5% hypothetical examples that appear in the shareholder reports of the other funds.
Please note that the expenses shown in the table are meant to highlight your ongoing costs only, and do not reflect any transactional costs such as sales charges (loads). Therefore the second line for each share class in the table is useful in comparing ongoing costs only, and will not help you determine the relative total costs of owning different funds. In addition, if these transactional costs were included, your costs would have been higher.
| Dryden California Municipal Fund/ California Income Series | Beginning Account Value March 1, 2005 | Ending Account Value August 31, 2005 | Annualized Expense Ratio Based on the Six-Month Period | Expenses Paid During the Six- Month Period* | ||||||||||
| Class A | Actual | $ | 1,000.00 | $ | 1,031.71 | 0.94 | % | $ | 4.81 | |||||
| Hypothetical | $ | 1,000.00 | $ | 1,020.47 | 0.94 | % | $ | 4.79 | ||||||
| Class B | Actual | $ | 1,000.00 | $ | 1,030.50 | 1.19 | % | $ | 6.09 | |||||
| Hypothetical | $ | 1,000.00 | $ | 1,019.21 | 1.19 | % | $ | 6.06 | ||||||
| Class C | Actual | $ | 1,000.00 | $ | 1,029.19 | 1.44 | % | $ | 7.37 | |||||
| Hypothetical | $ | 1,000.00 | $ | 1,017.95 | 1.44 | % | $ | 7.32 | ||||||
| Class Z | Actual | $ | 1,000.00 | $ | 1,033.02 | 0.69 | % | $ | 3.54 | |||||
| Hypothetical | $ | 1,000.00 | $ | 1,021.73 | 0.69 | % | $ | 3.52 | ||||||
* Series expenses for each share class are equal to the annualized expense ratio for each share class (provided in the table), multiplied by the average account value over the period, multiplied by the 184 days in the six-month period ended August 31, 2005, and divided by the 365 days in the Series’ fiscal year ended August 31, 2005 (to reflect the six-month period).
| Dryden California Municipal Fund/California Income Series | 9 |
This Page Intentionally Left Blank
Portfolio of Investments
as of August 31, 2005
| Description (a) | Moody’s Rating (Unaudited) | Interest Rate | Maturity Date | Principal Amount (000) | Value (Note 1) | |||||||
LONG-TERM INVESTMENTS 99.0% | ||||||||||||
Municipal Bonds | ||||||||||||
Abag Fin. Auth. For Nonprofit Corp. Rev., San Diego Hosp. Assoc., Ser. C | Baa1 | 5.375% | 3/01/21 | $ | 1,665 | $ | 1,780,301 | |||||
Brea Redev. Agcy., Rfdg., Tax Alloc., Ser. A, A.M.B.A.C. | Aaa | 5.50 | 8/01/19 | 3,350 | 3,741,950 | |||||||
California Edl. Facs. Auth. Rev., | ||||||||||||
Pomona Coll., Ser. A, C.A.B.S. | Aaa | Zero | 7/01/31 | 3,155 | 959,783 | |||||||
Rfdg. Pepperdine Univ., Ser. A, A.M.B.A.C. | Aaa | 5.00 | 12/01/35 | 500 | 536,020 | |||||||
Rfdg. Stanford Univ., Ser. R | Aaa | 5.00 | 11/01/21 | 3,700 | 3,979,757 | |||||||
California Hlth. Facs. Fin. Auth. Rev., Ref. Cedars Sinai Med. Ctr. | A3 | 5.00 | 11/15/21 | 1,000 | 1,056,430 | |||||||
California Infrastructure & Econ. Dev. Bk. Rev., Scripps Research Inst., Ser. A | Aa3 | 5.75 | 7/01/30 | 1,500 | 1,599,615 | |||||||
California Poll. Ctrl. Fin. Auth. Sld. Wste. Disp. Rev., Wste. Mgmt. Inc. Proj., Ser. B, A.M.T. | BBB(c) | 5.00 | 7/01/27 | 500 | 507,705 | |||||||
California Rural Home Mtge. Fin. Auth., Sngl. Fam. Mtge. Rev., Mtge. Bkd. Secs., Ser. D, F.N.M.A., G.N.M.A., A.M.T. | AAA(c) | 6.00 | 12/01/31 | 230 | 231,201 | |||||||
California St. Cmnty. Cap. Apprec. Cmnty. Facs., Dist. No. 97-1, C.A.B.S. | NR | Zero | 9/01/22 | 4,440 | 1,730,534 | |||||||
California St. Dept. Wtr. Res. Pwr., Ser. A | A2 | 5.00 | 5/01/17 | 3,320 | 3,556,052 | |||||||
California St. Pub. Wks. Brd., Rev., Dept. Mental Hlth., Ser. A | A3 | 5.50 | 6/01/18 | 4,000 | 4,486,120 | |||||||
See Notes to Financial Statements.
| Dryden California Municipal Fund/California Income Series | 11 |
Portfolio of Investments
as of August 31, 2005 Cont’d.
| Description (a) | Moody’s Rating (Unaudited) | Interest Rate | Maturity Date | Principal Amount (000) | Value (Note 1) | ||||||||
Various Univ. California Projs., Ser. D | Aa2 | 5.00% | 5/01/20 | $ | 1,000 | $ | 1,080,300 | ||||||
California St. Univ. Rev. & Coll., Systemwide, Ser. A, A.M.B.A.C. | Aaa | 5.50 | 11/01/16 | 1,350 | 1,519,763 | ||||||||
California St., | |||||||||||||
G.O. | A2 | 5.50 | 4/01/30 | 3,000 | 3,390,150 | ||||||||
G.O., A.M.B.A.C. | Aaa | 5.50 | 3/01/16 | 2,000 | 2,209,080 | ||||||||
G.O., M.B.I.A. | Aaa | 5.25 | 2/01/27 | 2,500 | 2,700,425 | ||||||||
California Statewide Cmntys. Dev. Auth. Rev, Kaiser Permanente, Ser. B | A3 | 3.90 | 8/01/31 | 1,000 | 996,110 | ||||||||
California Statewide Cmntys. Dev. Auth., C.O.P., F.S.A., E.T.M. | Aaa | 5.30 | 12/01/15 | 1,900 | (e) | 1,975,772 | |||||||
Capistrano California Univ. Sch. Dist. Cmnty. Fac. Dist. Spec. Tax Cap. Apprec., F.G.I.C., C.A.B.S. | Aaa | Zero | 9/01/32 | 2,955 | (e) | 851,927 | |||||||
Central California Joint Pwrs. Hlth. Fin. Auth., Cmnty. Hosps., C.O.P. | Baa2 | 6.00 | 2/01/30 | 2,000 | 2,112,260 | ||||||||
Chula Vista Cmnty. Redev. Agcy., Rfdg. Tax Alloc. Sub. Bayfront, Ser. C | NR | 8.25 | 5/01/24 | 1,500 | 1,596,750 | ||||||||
Davis Pub. Facs. Fin. Auth., Mace Ranch, Ser. A | NR | 6.60 | 9/01/25 | 1,325 | 1,389,037 | ||||||||
El Dorado Cnty., Spec. Tax, | |||||||||||||
Cmnty. Facs., Dist. No. 92-1 | NR | 6.125 | 9/01/16 | 1,000 | 1,067,330 | ||||||||
Cmnty. Facs., Dist. No. 92-1 | NR | 6.25 | 9/01/29 | 475 | 498,779 | ||||||||
Emeryville Pub. Fin. Auth. Rev., Emeryville Redev. Proj., Ser. A, M.B.I.A. | Aaa | 5.25 | 9/01/20 | 1,635 | 1,798,418 | ||||||||
Folsom Spec. Tax, | |||||||||||||
Cmnty. Facs., Dist. No. 10 | NR | 6.875 | 9/01/19 | 2,000 | 2,204,040 | ||||||||
Cmnty. Facs., Dist. No. 7 | NR | 6.00 | 9/01/24 | 2,500 | 2,677,725 | ||||||||
See Notes to Financial Statements.
| 12 | Visit our website at www.jennisondryden.com |
| Description (a) | Moody’s Rating (Unaudited) | Interest Rate | Maturity Date | Principal Amount (000) | Value (Note 1) | ||||||||
Foothill/Eastern Trans. Corr. Agcy., Toll Rd. Rev., | |||||||||||||
Conv., Sr. Lien, Ser. A, Zero Coupon (until 1/01/05), C.A.B.S. | AAA(c) | 7.15% | 1/01/13 | $ | 4,750 | (e) | $ | 5,613,693 | |||||
Conv., Zero Coupon (until 7/15/09), C.A.B.S. | Baa3 | Zero | 1/15/28 | 2,890 | 2,489,330 | ||||||||
Gateway Impvt. Auth. Rev., Marin City Cmnty. Facs. Dist., Ser. A | NR | 7.75 | 9/01/25 | 2,070 | (e) | 2,111,400 | |||||||
Glendale Redev. Agcy. Tax Alloc. Rev., Central Glendale Redev. Proj., M.B.I.A. | Aaa | 5.25 | 12/01/19 | 3,275 | 3,593,821 | ||||||||
Golden St. Tobacco Securitization | |||||||||||||
Asset-Bkd., Ser. 2003-A-1 | Baa3 | 6.75 | 6/01/39 | 1,950 | 2,247,999 | ||||||||
Asset-Bkd., Ser. A, C.A.B.S., A.M.B.A.C. | Aaa | Zero | 6/01/23 | 2,000 | 1,648,200 | ||||||||
Asset-Bkd., Ser. B | Aaa | 5.625 | 6/01/20 | 1,000 | (e) | 1,046,170 | |||||||
Asset-Bkd., Ser. B | Aaa | 5.50 | 6/01/43 | 3,000 | (e) | 3,404,670 | |||||||
Golden West Sch. Fin. Auth., California Rev., C.A.B.S., Rfdg. Ser. A., M.B.I.A. | Aaa | Zero | 2/01/19 | 2,110 | 1,187,614 | ||||||||
La Quinta California Fin. Auth. Local, Rfdg. Proj., Ser. A, A.M.B.A.C. | Aaa | 5.25 | 9/01/24 | 1,000 | 1,101,640 | ||||||||
La Quinta Redev. Agcy., Tax Alloc., M.B.I.A. | |||||||||||||
Rfdg. Proj. Area No. 1 | Aaa | 7.30 | 9/01/10 | 1,000 | 1,184,860 | ||||||||
Rfdg. Proj. Area No. 1 | Aaa | 7.30 | 9/01/11 | 1,000 | 1,211,940 | ||||||||
Lake Elsinore California Spec. Tax, Cmnty. Facs. Dist., No. 3 Impt., Area No. 1 | NR | 5.25 | 9/01/35 | 1,225 | 1,241,342 | ||||||||
Lincoln Impvt. Bond Act of 1915, Pub. Fin Auth., Twelve Bridges | NR | 6.20 | 9/02/25 | 2,615 | 2,777,731 | ||||||||
Long Beach Hbr. Rev., Rfdg. Ser. A, A.M.T., F.G.I.C. | Aaa | 6.00 | 5/15/19 | 3,000 | 3,547,800 | ||||||||
See Notes to Financial Statements.
| Dryden California Municipal Fund/California Income Series | 13 |
Portfolio of Investments
as of August 31, 2005 Cont’d.
| Description (a) | Moody’s Rating (Unaudited) | Interest Rate | Maturity Date | Principal Amount (000) | Value (Note 1) | ||||||||
Los Angeles Cmnty. Redev. Agcy., Bunker Hill Proj., Ser. A, F.S.A. | Aaa | 5.00% | 12/01/22 | $ | 2,720 | $ | 2,930,582 | ||||||
Manchester Social Svcs. Proj., A.M.B.A.C. | Aaa | 5.00 | 9/01/25 | 1,000 | 1,064,780 | ||||||||
Los Angeles Hbr. Dept. Rev., A.M.T., Ser. B | Aa2 | 5.375 | 11/01/23 | 2,000 | 2,060,400 | ||||||||
Los Angeles Uni. Sch. Dist., Ser. F, G.O., F.G.I.C. | Aaa | 5.00 | 7/01/21 | 750 | 813,398 | ||||||||
Lynwood Pub. Fin. Auth. Rev., Wtr. Sys. Impvt. Proj. | BBB+(c) | 6.50 | 6/01/21 | 1,500 | 1,574,100 | ||||||||
Metro. Wtr. Dist. of Southern California, Waterworks Rev., Linked S.A.V.R.S. & R.I.B.S. | Aa2 | 5.75 | 8/10/18 | 1,000 | 1,182,100 | ||||||||
MidPeninsula Reg. Open Space Dist., Rfdg. Proj., A.M.B.A.C. | Aaa | 5.00 | 9/01/34 | 1,500 | 1,587,660 | ||||||||
Norco Spec. Tax Cmnty. Facs., Dist. No. 97-1 | NR | 7.10 | 10/01/30 | 1,320 | 1,449,664 | ||||||||
Ontario California Impvt. Bond Act of 1915, Assmt. Dist. 100C, Cmnty. Ctr. III | NR | 8.00 | 9/02/11 | 535 | 560,728 | ||||||||
Orange Cnty. Cmnty. Facs. Dist., Spec. Tax Rev., No. 01-1, Ladera Ranch, Ser. A | NR | 6.00 | 8/15/25 | 1,350 | 1,456,083 | ||||||||
Orange Cnty. Loc. Trans. Auth., | |||||||||||||
Sales Tax Rev., Linked S.A.V.R.S. & R.I.B.S., A.M.B.A.C., T.C.R.S. | Aaa | 6.20 | 2/14/11 | 4,000 | (f) | 4,552,880 | |||||||
Spec. Tax Rev., Linked S.A.V.R.S. & R.I.B.S. | Aa2 | 9.48(d) | 2/14/11 | 750 | (g) | 957,330 | |||||||
Perris Cmnty. Facs. Dist., Spec. Tax No. 01-2, Ser. A | NR | 6.25 | 9/01/23 | 2,000 | 2,186,880 | ||||||||
Pico Rivera California Wtr. Auth. Rev., Wtr. Sys. Proj., | Aaa | 5.50 | 5/01/29 | 1,500 | 1,776,495 | ||||||||
See Notes to Financial Statements.
| 14 | Visit our website at www.jennisondryden.com |
| Description (a) | Moody’s Rating (Unaudited) | Interest Rate | Maturity Date | Principal Amount (000) | Value (Note 1) | ||||||||
Pittsburg California Redev. Agcy. Tax Alloc., | Aaa | 5.80% | 8/01/34 | $ | 2,700 | $ | 3,134,430 | ||||||
Los Medanos Cmnty. Dev. Proj., A.M.B.A.C. | Aaa | Zero | 8/01/26 | 1,375 | 532,180 | ||||||||
Poway Cmnty., Facs., Dist. No. 88-1, Pkwy. Bus. Ctr. | NR | 6.75 | 8/15/15 | 1,000 | 1,099,610 | ||||||||
Puerto Rico Comnwlth., Rites, PA 642A, G.O., M.B.I.A. | NR | 8.37(d) | 7/01/10 | 1,000 | (g) | 1,234,200 | |||||||
Puerto Rico Comnwlth., Hwy. & Trans. Auth. Rev, | |||||||||||||
Ser. G, F.G.I.C. | Aaa | 5.25 | 7/01/16 | 2,000 | 2,236,440 | ||||||||
Ser. G, F.G.I.C. | Aaa | 5.25 | 7/01/17 | 1,260 | 1,407,130 | ||||||||
Ser. J, F.G.I.C. | Aaa | 5.00 | 7/01/20 | 2,155 | 2,355,846 | ||||||||
Puerto Rico Pub. Bldgs. Auth., Gtd. Pub. Ed. & Hlth. Facs., Ser. J, E.T.M., C.A.B.S. | Baa2 | Zero | 7/01/06 | 145 | (e) | 141,585 | |||||||
Redding Elec. Sys. Rev., | |||||||||||||
Linked S.A.V.R.S. & R.I.B.S., M.B.I.A. | Aaa | 6.368 | 7/01/22 | 50 | (e) | 61,174 | |||||||
M.B.I.A., R.I.B.S. | Aaa | 10.17(d) | 7/01/22 | 1,850 | (g) | 2,676,913 | |||||||
Rio Vista Impvt. Bond Act of 1915, Assmt. Dist. No. 96-1, River View Pt. | NR | 7.50 | 9/02/22 | 1,670 | 1,780,103 | ||||||||
Riverside Cnty. Asset Leasing Corp., Leasehold Rev., Hosp. Proj., Ser. B, M.B.I.A. | Aaa | 5.70 | 6/01/16 | 1,500 | 1,707,285 | ||||||||
Riverside Cnty. Cmnty. Facs. Dist., Spl. Tax No. 04-2 Lake Hills | NR | 5.00 | 9/01/25 | 1,000 | 1,008,220 | ||||||||
Riverside Uni. Sch. | |||||||||||||
Dist. Spec. Tax, Cmnty. Facs., Dist. No. 7, Ser. A | NR | 6.90 | 9/01/20 | 1,320 | 1,451,234 | ||||||||
Dist. No. 7, Ser. A | NR | 7.00 | 9/01/30 | 1,000 | 1,141,350 | ||||||||
See Notes to Financial Statements.
| Dryden California Municipal Fund/California Income Series | 15 |
Portfolio of Investments
as of August 31, 2005 Cont’d.
| Description (a) | Moody’s Rating (Unaudited) | Interest Rate | Maturity Date | Principal Amount (000) | Value (Note 1) | ||||||||
Rocklin Uni. Sch. Dist., Ser. C, C.A.B.S., M.B.I.A., G.O. | Aaa | Zero | 8/01/16 | $ | 1,400 | $ | 896,980 | ||||||
Roseville California Spec. Tax, Highland Cmnty. Facs., Dist. No. 1 | NR | 6.30% | 9/01/25 | 1,815 | 1,991,799 | ||||||||
Woodcreek Cmnty. Facs., Dist. No. 1 | NR | 6.375 | 9/01/27 | 1,000 | 1,081,800 | ||||||||
Sacramento City. Fin. Auth., Ser. B, M.B.I.A., C.A.B.S | Aaa | Zero | 11/01/17 | 5,695 | 3,438,641 | ||||||||
Tax Alloc. Comb. Proj., Ser. B, M.B.I.A., C.A.B.S. | Aaa | Zero | 11/01/16 | 5,700 | 3,614,940 | ||||||||
Sacramento Impvt. Bond Act of 1915, Willowcreek II, Assmt. Dist. No. 96-1 | NR | 6.70 | 9/02/22 | 2,420 | 2,515,590 | ||||||||
San Diego California Uni. Sch. Dist. Election 1998, Ser. C, G.O., F.S.A. | Aaa | 5.00 | 7/01/19 | 1,000 | 1,103,200 | ||||||||
San Diego Redev. Agcy., Tax Alloc., North Bay Redev. | Baa1 | 5.875 | 9/01/29 | 2,000 | 2,098,200 | ||||||||
San Diego Spec. Tax Cmnty. Facs. Dist. No. 1, Ser. B | NR | 7.10 | 9/01/20 | 2,000 | (e) | 2,040,000 | |||||||
San Francisco City & Cnty. Redev. Agcy., Lease Rev., C.A.B.S. | A1 | Zero | 7/01/06 | 1,500 | 1,461,555 | ||||||||
C.A.B.S. | A1 | Zero | 7/01/07 | 2,250 | 2,116,125 | ||||||||
San Joaquin Hills Trans. Corridor Agcy., Toll Rd. Rev., Jr. Lien, C.A.B.S., E.T.M. | AAA(c) | Zero | 1/01/11 | 2,000 | (e) | 1,667,360 | |||||||
San Leandro Cmnty. Facs., Spec. Tax, Dist. No. 1 | NR | 6.50 | 9/01/25 | 2,160 | 2,354,098 | ||||||||
Santa Margarita Wtr. Dist. Spec. Tax, Cmnty. Facs., Dist. No. 99-1 | NR | 6.25 | 9/01/29 | 2,000 | 2,139,020 | ||||||||
Santa Margarita, Dana Point Auth., Impvt. Dists., 3,3A, 4,4A, Ser. B, M.B.I.A. | Aaa | 7.25 | 8/01/14 | 1,000 | 1,280,470 | ||||||||
Santa Maria Joint Union H.S., Dist., C.A.B.S., Election 2004, G.O., F.G.I.C. | Aaa | Zero | 8/01/27 | 1,505 | 550,965 | ||||||||
See Notes to Financial Statements.
| 16 | Visit our website at www.jennisondryden.com |
| Description (a) | Moody’s Rating (Unaudited) | Interest Rate | Maturity Date | Principal Amount (000) | Value (Note 1) | |||||||||
South Orange Cnty., Pub. Fin. Auth., Sr. Lien, Ser. A, M.B.I.A. | Aaa | 7.00% | 9/01/10 | $ | 2,535 | $ | 2,967,395 | |||||||
Southern California Pub. Pwr. Auth., Pwr. Proj. Rev. | A2 | 6.75 | 7/01/10 | 3,000 | 3,422,760 | |||||||||
Southern Pub. Pwr. Auth., Pwr. Proj. Rev., Rfdg., Palo Verde Proj., Ser. C, A.M.B.A.C., E.T.M. | Aaa | Zero | 7/01/16 | 8,400 | (e) | 5,463,612 | ||||||||
Sulphur Springs Uni. Sch. Dist., Int. Accrual, Ser. A, M.B.I.A., G.O. | Aaa | Zero | 9/01/11 | 3,000 | 2,444,370 | |||||||||
Univ. California Research Facs., Rev., Ser. E, A.M.B.A.C. | Aaa | 5.00 | 9/01/18 | 2,000 | 2,147,100 | |||||||||
Val Verde Uni. Sch. Dist., C.O.P., Ref. & Sch. Constr. Proj., Ser. B, F.G.I.C. | AAA(c) | 5.00 | 1/01/35 | 500 | 530,200 | |||||||||
Vallejo, Touro Univ., C.O.P. | Ba2 | 7.375 | 6/01/29 | 2,500 | 2,686,800 | |||||||||
Valley Hlth. Sys., California Hosp. Rev., Impvt. Proj., Ser. A | B+(c) | 6.50 | 5/15/25 | 1,000 | 1,004,290 | |||||||||
Victor Elem. Sch. | Aaa | 5.375 | 8/01/20 | 1,455 | 1,602,479 | |||||||||
Ser. A | Aaa | 5.375 | 8/01/21 | 1,635 | 1,800,723 | |||||||||
West Contra Costa Uni. Sch. Dist., C.O.P. | Baa3 | 6.875 | 1/01/09 | 490 | 496,076 | |||||||||
Total long-term investments | 187,678,872 | |||||||||||||
SHORT-TERM INVESTMENTS | ||||||||||||||
Short Term Investments | ||||||||||||||
California St., Mun. Secs. Trust Rcpts., SGA 135, G.O., A.M.B.A.C., T.C.R.S., F.R.D.D. (cost $100,000) | A-1+(c) | 2.28 | 9/01/05 | (b) | 100 | 100,000 | ||||||||
Total Investments 99.0% | 187,778,872 | |||||||||||||
Other assets in excess of liabilities(h) 1.0% | 1,833,964 | |||||||||||||
Net Assets 100% | $ | 189,612,836 | ||||||||||||
See Notes to Financial Statements.
| Dryden California Municipal Fund/California Income Series | 17 |
Portfolio of Investments
as of August 31, 2005 Cont’d.
| (a) | The following abbreviations are used in the portfolio descriptions: |
A.M.B.A.C.—American Municipal Bond Assurance Corporation.
A.M.T.—Alternative Minimum Tax.
C.A.B.S.—Capital Appreciation Bonds.
C.O.P.—Certificates of Participation.
E.T.M.—Escrowed to Maturity.
F.G.I.C.—Financial Guaranty Insurance Company.
F.N.M.A.—Federal National Mortgage Association.
F.R.D.D.—Floating Rate (Daily) Demand Note(b).
F.S.A.—Financial Security Assurance.
G.N.M.A.—Government National Mortgage Association.
G.O.—General Obligation.
M.B.I.A.—Municipal Bond Insurance Corporation.
R.I.B.S.—Residual Interest Bearing Securities.
S.A.V.R.S.—Select Auction Variable Rate Securities.
T.C.R.S.—Transferable Custodial Receipts.
NR—Not Rated by Moody’s or Standard & Poor’s.
The fund’s current Statement of Additional Information contains a description of Moody’s and Standard & Poor’s ratings.
| (b) | For purposes of amortized cost valuation, the maturity date of Floating Rate Demand Notes is considered to be the later of the next date on which the security can be redeemed at par, or the next date on which the rate of interest is adjusted. |
| (c) | Standard & Poor’s Rating. |
| (d) | Inverse floating rate bond. The coupon is inversely indexed to a floating interest rate. The rate shown is the rate at August 31, 2005. |
| (e) | Prerefunded issues are secured by escrowed cash and/or direct U.S. guaranteed obligations. |
| (f) | Security segregated as collateral for futures contracts. |
| (g) | Indicates a security that has been deemed illiquid. |
| (h) | Other assets in excess of liabilities included net unrealized appreciation (depreciation) on financial futures as follows: |
Open futures contracts outstanding at August 31, 2005:
| Number of Contracts | Type | Expiration Date | Value at Date | Value at August 31, 2005 | Unrealized Appreciation/ (Depreciation) | |||||||||
| Long Positions: | ||||||||||||||
| 11 | U.S. Treasury 2 yr. Notes | Dec. 05 | $ | 2,269,810 | $ | 2,278,031 | $ | 8,221 | ||||||
| Short Positions: | ||||||||||||||
| 80 | U.S. Treasury 10 yr. Notes | Dec. 05 | 8,846,278 | 8,966,250 | (119,972 | ) | ||||||||
| 23 | U.S. Treasury 5 yr. Notes | Dec. 05 | 2,465,101 | 2,492,625 | (27,524 | ) | ||||||||
| 28 | U.S. Treasury Bonds | Dec. 05 | 3,254,038 | 3,304,875 | (50,837 | ) | ||||||||
| $ | (190,112 | ) | ||||||||||||
See Notes to Financial Statements.
| 18 | Visit our website at www.jennisondryden.com |
The Industry classification of portfolio holdings and other assets in excess of liabilities shown as a percentage of net assets as of August 31, 2005 were as follows:
Special Tax/Assessment District | 41.5 | % | |
Transportation | 11.3 | ||
General Obligation | 10.2 | ||
Power | 8.0 | ||
Education | 7.4 | ||
Lease-Backed Certificate of Participation | 6.9 | ||
Healthcare | 5.6 | ||
Tobacco Appropriated | 3.2 | ||
Water & Sewer | 2.4 | ||
Tobacco | 1.2 | ||
Other | 0.8 | ||
Corporate-Backed IDB & PCR | 0.3 | ||
Housing | 0.1 | ||
Short-Term Investments | 0.1 | ||
Total Investments | 99.0 | ||
Other assets in excess of liabilities | 1.0 | ||
Total | 100.0 | % | |
Industry classification is subject to change.
See Notes to Financial Statements.
| Dryden California Municipal Fund/California Income Series | 19 |
Statement of Assets and Liabilities
as of August 31, 2005
Assets | |||
Investments, at value (cost $169,358,991) | $ | 187,778,872 | |
Cash | 129,618 | ||
Interest receivable | 2,582,306 | ||
Receivable for Series shares sold | 41,869 | ||
Prepaid expenses | 1,294 | ||
Total assets | 190,533,959 | ||
Liabilities | |||
Payable for Series shares reacquired | 403,832 | ||
Accrued expenses | 173,163 | ||
Dividends payable | 126,579 | ||
Management fee payable | 80,274 | ||
Due to broker—variation margin | 65,219 | ||
Distribution fee payable | 50,082 | ||
Deferred trustees’ fees | 16,551 | ||
Transfer agent fee payable | 5,423 | ||
Total liabilities | 921,123 | ||
Net Assets | $ | 189,612,836 | |
Net assets were comprised of: | |||
Shares of beneficial interest, at par | $ | 170,279 | |
Paid-in capital in excess of par | 170,255,594 | ||
| 170,425,873 | |||
Undistributed net investment income | 107,526 | ||
Accumulated net realized gain on investments | 849,668 | ||
Net unrealized appreciation on investments | 18,229,769 | ||
Net assets, August 31, 2005 | $ | 189,612,836 | |
See Notes to Financial Statements.
| 20 | Visit our website at www.jennisondryden.com |
Class A | |||
Net asset value and redemption price per share | $ | 11.14 | |
Maximum sales charge (4.00% of offering price) | 0.46 | ||
Maximum offering price to public | $ | 11.60 | |
Class B | |||
Net asset value, offering price and redemption price per share | $ | 11.14 | |
Class C | |||
Net asset value and redemption price per share | $ | 11.14 | |
Class Z | |||
Net asset value, offering price and redemption price per share | $ | 11.14 | |
See Notes to Financial Statements.
| Dryden California Municipal Fund/California Income Series | 21 |
Statement of Operations
Year Ended August 31, 2005
Net Investment Income | ||||
Income | ||||
Interest | $ | 9,971,013 | ||
Expenses | ||||
Management fee | 980,039 | |||
Distribution fee—Class A | 353,217 | |||
Distribution fee—Class B | 204,470 | |||
Distribution fee—Class C | 65,444 | |||
Custodian’s fees and expenses | 117,000 | |||
Reports to shareholders | 60,000 | |||
Transfer agent’s fees and expenses (including affiliated expense of $45,000) | 53,000 | |||
Registration fees | 50,000 | |||
Legal fees and expenses | 29,000 | |||
Audit fee | 23,000 | |||
Trustees’ fees | 14,000 | |||
Miscellaneous | 15,875 | |||
Total expenses | 1,965,045 | |||
Net investment income | 8,005,968 | |||
Realized And Unrealized Gain (Loss) On Investments | ||||
Net realized gain (loss) on: | ||||
Investment transactions | 1,222,601 | |||
Financial futures transactions | (143,937 | ) | ||
| 1,078,664 | ||||
Net change in unrealized appreciation (depreciation) on: | ||||
Investments | 2,201,386 | |||
Financial futures contracts | (38,732 | ) | ||
| 2,162,654 | ||||
Net gain on investments | 3,241,318 | |||
Net Increase In Net Assets Resulting From Operations | $ | 11,247,286 | ||
See Notes to Financial Statements.
| 22 | Visit our website at www.jennisondryden.com |
Statement of Changes in Net Assets
| Year Ended August 31, | ||||||||
| 2005 | 2004 | |||||||
Increase (Decrease) In Net Assets | ||||||||
Operations | ||||||||
Net investment income | $ | 8,005,968 | $ | 8,962,314 | ||||
Net realized gain on investments | 1,078,664 | 1,684,672 | ||||||
Net change in unrealized appreciation on investments | 2,162,654 | 3,026,327 | ||||||
Net increase in net assets resulting from operations | 11,247,286 | 13,673,313 | ||||||
Dividends and distributions (Note 1) | ||||||||
Dividends from net investment income | ||||||||
Class A | (5,852,158 | ) | (6,255,435 | ) | ||||
Class B | (1,588,600 | ) | (2,055,475 | ) | ||||
Class C | (318,072 | ) | (331,169 | ) | ||||
Class Z | (223,577 | ) | (303,093 | ) | ||||
| (7,982,407 | ) | (8,945,172 | ) | |||||
Distributions from net realized gains | ||||||||
Class A | — | (2,247,359 | ) | |||||
Class B | — | (803,256 | ) | |||||
Class C | — | (134,430 | ) | |||||
Class Z | — | (82,703 | ) | |||||
| — | (3,267,748 | ) | ||||||
Series share transactions (Net of share conversions) (Note 6) | ||||||||
Net proceeds from shares sold | 9,878,079 | 19,861,648 | ||||||
Net asset value of shares issued in reinvestment of dividends and distributions | 3,933,092 | 5,976,996 | ||||||
Cost of shares reacquired | (32,709,426 | ) | (53,331,286 | ) | ||||
Net decrease in net assets from Series share transactions | (18,898,255 | ) | (27,492,642 | ) | ||||
Total decrease | (15,633,376 | ) | (26,032,249 | ) | ||||
Net Assets | ||||||||
Beginning of year | 205,246,212 | 231,278,461 | ||||||
End of year(a) | $ | 189,612,836 | $ | 205,246,212 | ||||
(a) Includes undistributed net investment income of: | $ | 107,526 | $ | 107,526 | ||||
See Notes to Financial Statements.
| Dryden California Municipal Fund/California Income Series | 23 |
Notes to Financial Statements
Dryden California Municipal Fund (the “Fund”), is registered under the Investment Company Act of 1940, as an open-end management investment company. The Fund was organized as a Massachusetts business trust on May 18, 1984 and consists of two series. These financial statements relate to California Income Series. The financial statements of the other series are not presented herein. The assets of each series are invested in separate, independently managed portfolios. The Series commenced investment operations on December 3, 1990. The Series is diversified and seeks to achieve its investment objective of obtaining the maximum amount of income exempt from federal and California state income taxes with the minimum of risk. The Series will invest primarily in investment grade municipal obligations but may also invest a portion of its assets in lower-quality municipal obligations or in nonrated securities which are of comparable quality. The ability of the issuers of the securities held by the Series to meet their obligations may be affected by economic developments in a specific state, industry or region.
Note 1. Accounting Policies
The following is a summary of significant accounting policies followed by the Fund and the Series in preparation of its financial statements.
Securities Valuations: The Series values municipal securities (including commitments to purchase such securities on a “when-issued” basis) as of the close of trading on the New York Stock Exchange, on the basis of prices provided by a pricing service which uses information with respect to transactions in comparable securities and various relationships between securities in determining values. Securities listed on a securities exchange (other than options on securities and indices) are valued at the last sale price on such exchange on the day of valuation or, if there was no sale on such day, at the mean between the last reported bid and asked prices, or at the last bid price on such day in the absence of an asked price. Securities that are actively traded in the over-the-counter market, including listed securities for which the primary market is believed by Prudential Investments LLC (“PI” or “Manager”) in consultation with the subadvisor, to be over-the-counter, are valued at market value using prices provided, by an independent pricing agent or principal market maker. Options on securities and indices traded on an exchange are valued at their last sales price as of the close of trading on an applicable exchange, or if there was no sale, at the mean between the most recently quoted bid and asked prices on such exchanges.
Futures contracts and options thereon traded on a commodities exchange or board of trade are valued at the last sale price at the close of trading on such exchange or
| 24 | Visit our website at www.jennisondryden.com |
board of trade or, if there was no sale on the applicable commodities exchange or board of trade on such day, at the mean between the most recently quoted prices on such exchange or board of trade or at the last bid price in the absence of an asked price. Certain fixed income securities for which daily market quotations are not readily available may be valued with reference to fixed income securities whose prices are more readily available, pursuant to guidelines established by Board of Trustees. Prices may be obtained from independent pricing services which use information provided by market makers or estimates of market values obtained from yield data relating to investments or securities with similar characteristics. Securities for which reliable market quotations are not readily available, or for which the pricing service does not provide a valuation methodology, or does not present fair value, are valued at fair value in accordance with Board of Trustees’ approved fair valuation procedures. When determining the fair valuation of securities some of the factors influencing the valuation include, the nature of any restrictions on disposition of the securities; assessment of the general liquidity of the securities; the issuer’s financial condition and the markets in which it does business; the cost of the investment; the size of the holding and the capitalization of issuer; the prices of any recent transactions or bids/offers for such securities or any comparable securities; any available analyst media or other reports or information deemed reliable by the investment adviser regarding the issuer or the markets or industry in which it operates. Using fair value to price securities may result in a value that is different from a security’s most recent closing price and from the price used by other mutual funds to calculate their net asset values.
Short-term securities, which mature in sixty days or less are valued at amortized cost, which approximates market value. The amortized cost method involves valuing a security at its cost on the date of purchase and thereafter assuming a constant amortization to maturity of the difference between the principal amount due at maturity and cost. Short-term securities which mature in more than sixty days are valued at current market quotations.
Restricted Securities: The Series may hold up to 15% of its net assets in illiquid securities, including those which are restricted as to disposition under securities law (“restricted securities”). Restricted securities include registration rights under which the Series may demand registration by the issuers. Restricted securities, sometimes referred to as private placements, are valued pursuant to the valuation procedures noted above.
Financial Futures Contracts: A financial futures contract is an agreement to purchase (long) or sell (short) an agreed amount of securities at a set price for delivery on a future date. Upon entering into a financial futures contract, the Series is required to
| Dryden California Municipal Fund/California Income Series | 25 |
Notes to Financial Statements
Cont’d
pledge to the broker an amount of cash and/or other assets equal to a certain percentage of the contract amount. This amount is known as the “initial margin.” Subsequent payments, known as “variation margin,” are made or received by the Series each day, depending on the daily fluctuations in the value of the underlying security. Such variation margin is recorded for financial statement purposes on a daily basis as unrealized gain or loss. When the contract expires or is closed, the gain or loss is realized and is presented in the Statement of Operations as net realized gain or loss on financial futures transactions.
The Series invests in financial futures contracts in order to hedge its existing portfolio securities or securities the Series intends to purchase, against fluctuations in value caused by changes in prevailing interest rates. Should interest rates move unexpectedly, the Series may not achieve the anticipated benefits of the financial futures contracts and may realize a loss. The use of futures transactions involves the risk of imperfect correlation in movements in the price of futures contracts, interest rates and the underlying hedged assets.
Interest Rate Swaps: The Series may enter into interest rate swaps. In a simple interest rate swap, one investor pays a floating rate of interest on a notional principal amount and receives a fixed rate of interest on the same notional principal amount for a specified period of time. Alternatively, an investor may pay a fixed rate and receive a floating rate. Interest rate swaps were conceived as asset/liability management tools. In more complex swaps, the notional principal amount may decline (or amortize) over time.
During the term of the swap, changes in the value of the swap are recorded as unrealized gains or losses by “marking-to-market” to reflect the market value of the swap. When the swap is terminated, the Series will record a realized gain (loss) equal to the difference between the proceeds from (or cost of) the closing transaction and the Series’ basis in the contract, if any.
The Series is exposed to credit loss in the event of non-performance by the other party to the interest rate swap. However, the Series does not anticipate non-performance by any counterparty.
Financial future contracts, written options and swap contracts involve elements of both market and credit risk in excess of the amounts reflected in the Statement of Assets and Liabilities.
| 26 | Visit our website at www.jennisondryden.com |
Inverse Floaters: The Series invests in variable rate securities commonly called “inverse floaters”. The interest rates on these securities have an inverse relationship to the interest rate of other securities or the value of an index. Changes in interest rates on the other security or index inversely affect the rate paid on the inverse floater, and the inverse floater’s price will be more volatile than that of a fixed-rate bond. Additionally, some of these securities contain a “leverage factor” whereby the interest rate moves inversely by a “factor” to the benchmark rate. Certain interest rate movements and other market factors can substantially affect the liquidity of inverse floating rate notes.
When-Issued/Delayed Delivery Securities: Securities purchased or sold on a when-issued or delayed-delivery basis may be settled a month or more after trade date; interest income is not accrued until settlement date. At the time a Series enters into such transactions, it instructs the custodian to segregate assets with a current value at least equal to the amount of its when-issued or delayed-delivery purchase commitments.
Securities Transactions and Net Investment Income: Securities transactions are recorded on the trade date. Realized gains or losses on sales of securities are calculated on the identified cost basis. Interest income, including amortization of premium and accretion of discount on debt securities, as required is recorded on the accrual basis.
Net investment income or loss (other than distribution fees which are charged directly to the respective class) and unrealized and realized gains (losses) are allocated daily to each class of shares based upon the relative proportion of net assets of each class at the beginning of the day.
Dividends and Distributions: The Series declares daily dividends from net investment income and paid monthly. Distributions of net capital gains, if any, are made at least annually.
Dividends and distributions to shareholders, which are determined in accordance with federal income tax regulation and which may differ from generally accepted accounting principles, are recorded on the ex-dividend date. Permanent book/tax differences relating to income and gains are reclassified amongst net investment income, accumulated net realized gain or loss and paid-in-capital in excess of par, as appropriate.
Taxes: For federal income tax purposes, each series in the Fund is treated as a separate taxpaying entity. It is the Series’ policy to meet the requirements of the Internal Revenue Code applicable to regulated investment companies and to distribute all of its net income and capital gains, if any, to shareholders. Therefore, no federal income tax provision is required.
| Dryden California Municipal Fund/California Income Series | 27 |
Notes to Financial Statements
Cont’d
Estimates: The preparation of the financial statements requires management to make estimates and assumptions that affect the reported amounts and disclosures in the financial statements. Actual results could differ from those estimates.
Note 2. Agreements
The Fund has a management agreement with Prudential Investments LLC (“PI”). Pursuant to this agreement, PI has responsibility for all investment advisory services and supervises the subadviser’s performance of such services. PI has entered into a subadvisory agreement with The Prudential Investment Management, Inc. (“PIM”). The subadvisory agreement provides that PIM furnishes investment advisory services in connection with the management of the Series. In connection therewith, PIM is obligated to keep certain books and records of the Series. PI pays for the services of PIM, the cost of compensation of officers of the Series, occupancy and certain clerical and bookkeeping costs of the Series. The Series bears all other costs and expenses.
The management fee paid to PI is accrued daily and payable monthly, at an annual rate of .50 of 1% of the Series’ average daily net assets up to and including $1 billion and .45% of the Series average daily net assets in excess of $1 billion. The effective management fee rate was .50 of 1% for the year ended August 31, 2005.
The Series has a distribution agreement with Prudential Investment Management Services LLC (“PIMS”), which acts as the distributor of the Class A, Class B, Class C and Class Z shares of the Series. The Series compensates PIMS for distributing and servicing the Series’ Class A, Class B and Class C shares, pursuant to plans of distribution (the “Class A, B and C Plans”), regardless of expenses actually incurred by PIMS. The distribution fees for Class A, Class B and Class C shares are accrued daily and payable monthly. No distribution or service fees are paid to PIMS as distributor of the Class Z shares of the Series.
Pursuant to the Class A, Class B and Class C Plans, the Series compensates PIMS for distribution-related activities at an annual rate of up to .30 of 1%, .50 of 1% and 1% of the average daily net assets of the Class A, B and C shares, respectively. PIMS has contractually agreed to limit such fees to .25 of 1% and .75 of 1% of the Class A and Class C shares, respectively for the year ended August 31, 2005.
PIMS has advised the Series that it received approximately $64,600 in front-end sales charges resulting from sales of Class A shares, during the year ended August 31, 2005.
| 28 | Visit our website at www.jennisondryden.com |
From these fees, PIMS paid a substantial part of such sales charges to affiliated broker-dealers which in turn paid commissions to sales persons and incurred other distribution costs.
PIMS has advised the Series that for the year ended August 31, 2005, it received approximately $56,900 and $5,100 in contingent deferred sales charges imposed upon certain redemptions by Class B and Class C shareholders, respectively.
PI, PIMS and PIM are indirect wholly owned subsidiaries of Prudential Financial, Inc. (“Prudential”).
The Fund, along with other affiliated registered investment companies (the “Funds”), is a party to a syndicated credit agreement (“SCA”) with two banks. For the period May 1, 2004 through October 29, 2004, the SCA provided for a commitment of $500 million. Interest on any borrowings under the SCA would be incurred at market rates. The Funds paid a commitment fee of .08 of 1% of the unused portion of the SCA. The commitment fee is accrued daily and paid quarterly and is allocated to the Funds pro-rata based on net assets. The purpose of the SCA is to serve as an alternative source of funding for capital share redemptions. The expiration date of the SCA was October 29, 2004. Effective October 29, 2004, the Funds entered into a revised credit agreement with two banks. The commitment under the revised credit agreement continues to be $500 million. The Funds pay a commitment fee of .075 of 1% of the unused portion of the revised credit agreement. The expiration of the revised SCA is October 28, 2005. The Fund did not borrow any amounts pursuant to the SCA during the year ended August 31, 2005.
Note 3. Other Transactions with Affiliates
Prudential Mutual Fund Services LLC (“PMFS”), an affiliate of PI and an indirect wholly owned subsidiary of Prudential, serves as the Fund’s transfer agent. Transfer agent fees and expenses in the Statement of Operations include certain out-of-pocket expenses paid to nonaffiliates.
The Fund pays networking fees to affiliated and unaffiliated broker/dealers. These networking fees are payments made to broker/dealers that clear mutual fund transactions through a national clearing system. The Series incurred approximately $15,800 in total networking fees. These amounts are included in transfer agent’s fees and expenses in the Statement of Operations.
For the year ended August 31, 2005, the Series did not pay any brokerage commissions to Wachovia.
| Dryden California Municipal Fund/California Income Series | 29 |
Notes to Financial Statements
Cont’d
Note 4. Portfolio Securities
Purchases and sales of portfolio securities of the Series, excluding short-term investments, for the year ended August 31, 2005 were $21,251,472 and $39,565,176 respectively.
Note 5. Tax Distributions and Information
In order to present undistributed net investment income (loss) and accumulated net realized gains (losses) on the Statement of Assets and Liabilities that more closely represent their tax character, certain adjustments have been made to paid-in-capital in excess of par, undistributed net investment income (loss) and accumulated net realized gain (loss) on investments.
For the year ended August 31, 2005, the adjustments were to decrease undistributed net investment income and increase accumulated net realized gain by $23,561 due to the difference in the treatment of accreting market discount and premium amortization between financial and tax reporting. Net investment income, net realized losses and net assets were not affected by this change.
Tax character of distributions paid during the year ended August 31, 2005 were:
Tax-Exempt | Ordinary | Long-Term | Total | |||
| $7,982,407 | $— | $— | $7,982,407 |
Tax character of distributions paid during the year ended August 31, 2004 were:
Tax-Exempt | Ordinary | Long-Term | Total | |||
| $8,945,172 | $— | $3,267,748 | $12,212,920 |
As of August 31, 2005, the components of distributable earnings on a tax basis were $250,656 (includes a timing difference of $126,579 for dividends payable) and $465,349 of tax exempt income and long-term capital gains, respectively.
The United States federal income tax basis of the Series’ investments and the net unrealized appreciation as of August 31, 2005 were as follows:
Tax Basis | Appreciation | Depreciation | Net Unrealized | |||
| $169,164,788 | $18,627,047 | $12,963 | $18,614,084 |
| 30 | Visit our website at www.jennisondryden.com |
The difference between book basis and tax basis was primarily attributable to the difference in the treatment of accreting market discount and premium amortization for book and tax purposes.
Note 6. Capital
The Series offers Class A, Class B, Class C and Class Z shares. Class A shares are sold with a front-end sales charge of up to 4%. All investors who purchase Class A shares in an amount of $1 million or more and sell these shares within 12 months of purchase are subject to a contingent deferred sales charge (CDSC) of 1%, including investors who purchase their shares through broker-dealers affiliated with Prudential Financial, Inc. Class B shares are sold with a CDSC which declines from 5% to zero depending on the period of time the shares are held. Class C shares sold within 12 months of purchase are subject to a CDSC of 1%. Class B shares automatically convert to Class A shares on a quarterly basis approximately seven years after purchase. A special exchange privilege is also available for shareholders who qualify to purchase Class A shares at net asset value. Class Z shares are not subject to any sales or redemption charge and are offered exclusively for sale to a limited group of investors.
The Fund has authorized an unlimited number of shares of beneficial interest for each class at $.01 par value per share.
Transactions in shares of beneficial interest for the fiscal years ended August 31, 2005 and 2004 were as follows:
Class A | Shares | Amount | |||||
Year ended August 31, 2005: | |||||||
Shares sold | 583,116 | $ | 6,440,167 | ||||
Shares issued in reinvestment of distributions | 245,452 | 2,709,255 | |||||
Shares reacquired | (1,838,859 | ) | (20,257,830 | ) | |||
Net increase (decrease) in shares outstanding before conversion | (1,010,291 | ) | (11,108,408 | ) | |||
Shares issued upon conversion from Class B | 652,103 | 7,177,012 | |||||
Net increase (decrease) in shares outstanding | (358,188 | ) | $ | (3,931,396 | ) | ||
Year ended August 31, 2004: | |||||||
Shares sold | 1,033,659 | $ | 11,317,710 | ||||
Shares issued in reinvestment of distributions | 359,165 | 3,933,590 | |||||
Shares reacquired | (3,259,257 | ) | (35,491,035 | ) | |||
Net increase (decrease) in shares outstanding before conversion | (1,866,433 | ) | (20,239,735 | ) | |||
Shares issued upon conversion from Class B | 381,688 | 4,189,697 | |||||
Net increase (decrease) in shares outstanding | (1,484,745 | ) | $ | (16,050,038 | ) | ||
| Dryden California Municipal Fund/California Income Series | 31 |
Notes to Financial Statements
Cont’d
Class B | Shares | Amount | |||||
Year ended August 31, 2005: | |||||||
Shares sold | 75,999 | $ | 837,112 | ||||
Shares issued in reinvestment of distributions | 72,098 | 795,705 | |||||
Shares reacquired | (689,188 | ) | (7,594,473 | ) | |||
Net increase (decrease) in shares outstanding before conversion | (541,091 | ) | (5,961,656 | ) | |||
Shares reacquired upon conversion to Class A | (652,103 | ) | (7,177,012 | ) | |||
Net increase (decrease) in shares outstanding | (1,193,194 | ) | $ | (13,138,668 | ) | ||
Year ended August 31, 2004: | |||||||
Shares sold | 208,004 | $ | 2,280,202 | ||||
Shares issued in reinvestment of distributions | 136,568 | 1,496,437 | |||||
Shares reacquired | (890,197 | ) | (9,654,298 | ) | |||
Net increase (decrease) in shares outstanding before conversion | (545,625 | ) | (5,877,659 | ) | |||
Shares reacquired upon conversion to Class A | (381,688 | ) | (4,189,697 | ) | |||
Net increase (decrease) in shares outstanding | (927,313 | ) | $ | (10,067,356 | ) | ||
Class C | |||||||
Year ended August 31, 2005: | |||||||
Shares sold | 134,559 | $ | 1,484,412 | ||||
Shares issued in reinvestment of distributions | 18,894 | 208,527 | |||||
Shares reacquired | (233,201 | ) | (2,570,856 | ) | |||
Net increase (decrease) in shares outstanding | (79,748 | ) | $ | (877,917 | ) | ||
Year ended August 31, 2004: | |||||||
Shares sold | 102,573 | $ | 1,125,181 | ||||
Shares issued in reinvestment of distributions | 31,493 | 344,969 | |||||
Shares reacquired | (172,419 | ) | (1,882,193 | ) | |||
Net increase (decrease) in shares outstanding | (38,353 | ) | $ | (412,043 | ) | ||
Class Z | |||||||
Year ended August 31, 2005: | |||||||
Shares sold | 101,174 | $ | 1,116,388 | ||||
Shares issued in reinvestment of distributions | 19,890 | 219,605 | |||||
Shares reacquired | (207,521 | ) | (2,286,267 | ) | |||
Net increase (decrease) in shares outstanding | (86,457 | ) | $ | (950,274 | ) | ||
Year ended August 31, 2004: | |||||||
Shares sold | 468,660 | $ | 5,138,555 | ||||
Shares issued in reinvestment of distributions | 18,467 | 202,000 | |||||
Shares reacquired | (582,222 | ) | (6,303,760 | ) | |||
Net increase (decrease) in shares outstanding | (95,095 | ) | $ | (963,205 | ) | ||
| 32 | Visit our website at www.jennisondryden.com |
Financial Highlights
| AUGUST 31, 2005 | ANNUAL REPORT |
Dryden California Municipal Fund/California Income Series
Financial Highlights
| Class A | ||||
| Year Ended August 31, 2005 | ||||
Per Share Operating Performance: | ||||
Net Asset Value, Beginning Of Year | $ | 10.95 | ||
Income from investment operations | ||||
Net investment income | .46 | |||
Net realized and unrealized gain (loss) on investment transactions | .19 | |||
Total from investment operations | .65 | |||
Less Dividends and Distributions | ||||
Dividends from net investment income | (.46 | ) | ||
Distributions from net realized gains | — | |||
Distributions in excess of net investment income | — | |||
Total dividends and distributions | (.46 | ) | ||
Net asset value, end of year | $ | 11.14 | ||
Total Return(a): | 6.02 | % | ||
Ratios/Supplemental Data: | ||||
Net assets, end of year (000) | $ | 141,564 | ||
Average net assets (000) | $ | 141,287 | ||
Ratios to average net assets: | ||||
Expenses, including distribution and service (12b-1) fees(d) | .93 | % | ||
Expenses, excluding distribution and service (12b-1) fees | .68 | % | ||
Net investment income | 4.15 | % | ||
For Class A, B, C and Z shares: | ||||
Portfolio turnover rate | 11 | % | ||
| (a) | Total return does not consider the effects of sales loads. Total return is calculated assuming a purchase of shares on the first day and a sale on the last day of each year reported and includes reinvestment of dividends and distributions. |
| (b) | Less than $.005 per share. |
| (c) | Effective September 1, 2001 the Series has adopted the provisions of the AICPA Audit and Accounting Guide for Investment Companies and began accreting market discount on debt securities. There was no effect of this change for the year ended August 31, 2002 on net investment income per share or net realized and unrealized gain/(loss) per share or on the ratio of net investment income. Per share amounts and ratios for the years ended prior to August 31, 2002 have not been restated to reflect this change in presentation. |
| (d) | The distributor of the Series has contractually agreed to limited its distributions and service (12b-1) fees to .25 of 1% of the daily net assets of Class A shares. |
See Notes to Financial Statements.
| 34 | Visit our website at www.jennisondryden.com |
| Class A | ||||||||||||||
| Year Ended August 31, | ||||||||||||||
| 2004 | 2003 | 2002(c) | 2001 | |||||||||||
| $ | 10.86 | $ | 11.09 | $ | 11.11 | $ | 10.66 | |||||||
| .45 | .47 | .49 | .52 | |||||||||||
| .25 | (.23 | ) | (.01 | ) | .45 | |||||||||
| .70 | .24 | .48 | .97 | |||||||||||
| (.45 | ) | (.47 | ) | (.50 | ) | (.52 | ) | |||||||
| (.16 | ) | — | — | — | ||||||||||
| — | — | — | — | (b) | ||||||||||
| (.61 | ) | (.47 | ) | (.50 | ) | (.52 | ) | |||||||
| $ | 10.95 | $ | 10.86 | $ | 11.09 | $ | 11.11 | |||||||
| 6.55 | % | 2.20 | % | 4.54 | % | 9.35 | % | |||||||
| $ | 143,120 | $ | 158,120 | $ | 172,623 | $ | 167,009 | |||||||
| $ | 151,980 | $ | 171,193 | $ | 169,196 | $ | 164,424 | |||||||
| .92 | % | .90 | % | .87 | % | .87 | % | |||||||
| .67 | % | .65 | % | .62 | % | .62 | % | |||||||
| 4.12 | % | 4.32 | % | 4.55 | % | 4.83 | % | |||||||
| 38 | % | 59 | % | 23 | % | 32 | % | |||||||
See Notes to Financial Statements.
| Dryden California Municipal Fund/California Income Series | 35 |
Financial Highlights
Cont’d
| Class B | ||||
| Year Ended August 31, 2005 | ||||
Per Share Operating Performance: | ||||
Net Asset Value, Beginning Of Year | $ | 10.95 | ||
Income from investment operations | ||||
Net investment income | .43 | |||
Net realized and unrealized gain (loss) on investment transactions | .19 | |||
Total from investment operations | .62 | |||
Less Dividends and Distributions | ||||
Dividends from net investment income | (.43 | ) | ||
Distributions from net realized gains | — | |||
Distributions in excess of net investment income | — | |||
Total dividends and distributions | (.43 | ) | ||
Net asset value, end of year | $ | 11.14 | ||
Total Return(a): | 5.76 | % | ||
Ratios/Supplemental Data: | ||||
Net assets, end of year (000) | $ | 35,061 | ||
Average net assets (000) | $ | 40,894 | ||
Ratios to average net assets: | ||||
Expenses, including distribution and service (12b-1) fees | 1.18 | % | ||
Expenses, excluding distribution and service (12b-1) fees | .68 | % | ||
Net investment income | 3.90 | % | ||
| (a) | Total return does not consider the effects of sales loads. Total return is calculated assuming a purchase of shares on the first day and a sale on the last day of each year reported and includes reinvestment of dividends and distributions. |
| (b) | Less than $.005 per share. |
| (c) | Effective September 1, 2001 the Series has adopted the provisions of the AICPA Audit and Accounting Guide for Investment Companies and began accreting market discount on debt securities. There was no effect of this change for the year ended August 31, 2002 on net investment income per share or net realized and unrealized gain/(loss) per share. The effect of this change on the ratio of net investment income was an increase from 4.30% to 4.31%. Per share amounts and ratios for the years ended prior to August 31, 2002 have not been restated to reflect this change in presentation. |
See Notes to Financial Statements.
| 36 | Visit our website at www.jennisondryden.com |
| Class B | ||||||||||||||
| Year Ended August 31, | ||||||||||||||
| 2004 | 2003 | 2002(c) | 2001 | |||||||||||
| $ | 10.86 | $ | 11.09 | $ | 11.11 | $ | 10.67 | |||||||
| .42 | .45 | .47 | .49 | |||||||||||
| .25 | (.23 | ) | (.01 | ) | .44 | |||||||||
| .67 | .22 | .46 | .93 | |||||||||||
| (.42 | ) | (.45 | ) | (.48 | ) | (.49 | ) | |||||||
| (.16 | ) | — | — | — | ||||||||||
| — | — | — | — | (b) | ||||||||||
| (.58 | ) | (.45 | ) | (.48 | ) | (.49 | ) | |||||||
| $ | 10.95 | $ | 10.86 | $ | 11.09 | $ | 11.11 | |||||||
| 6.29 | % | 1.94 | % | 4.29 | % | 8.98 | % | |||||||
| $ | 47,536 | $ | 57,234 | $ | 70,308 | $ | 78,237 | |||||||
| $ | 53,143 | $ | 65,204 | $ | 72,864 | $ | 79,046 | |||||||
| 1.17 | % | 1.15 | % | 1.12 | % | 1.12 | % | |||||||
| .67 | % | .65 | % | .62 | % | .62 | % | |||||||
| 3.87 | % | 4.07 | % | 4.31 | % | 4.58 | % | |||||||
See Notes to Financial Statements.
| Dryden California Municipal Fund/California Income Series | 37 |
Financial Highlights
Cont’d
| Class C | ||||
| Year Ended August 31, 2005 | ||||
Per Share Operating Performance: | ||||
Net Asset Value, Beginning Of Year | $ | 10.95 | ||
Income from investment operations | ||||
Net investment income | .40 | |||
Net realized and unrealized gain (loss) on investment transactions | .19 | |||
Total from investment operations | .59 | |||
Less Dividends and Distributions | ||||
Dividends from net investment income | (.40 | ) | ||
Distributions from net realized gains | — | |||
Distributions in excess of net investment income | — | |||
Total dividends and distributions | (.40 | ) | ||
Net asset value, end of year | $ | 11.14 | ||
Total Return(a): | 5.50 | % | ||
Ratios/Supplemental Data: | ||||
Net assets, end of year (000) | $ | 8,251 | ||
Average net assets (000) | $ | 8,726 | ||
Ratios to average net assets: | ||||
Expenses, including distribution and service (12b-1) fees(d) | 1.43 | % | ||
Expenses, excluding distribution and service (12b-1) fees | .68 | % | ||
Net investment income | 3.66 | % | ||
| (a) | Total return does not consider the effects of sales loads. Total return is calculated assuming a purchase of shares on the first day and a sale on the last day of each year reported and includes reinvestment of dividends and distributions. |
| (b) | Less than $.005 per share. |
| (c) | Effective September 1, 2001 the Series has adopted the provisions of the AICPA Audit and Accounting Guide for Investment Companies and began accreting market discount on debt securities. There was no effect of this change for the year ended August 31, 2002 on net investment income per share or net realized and unrealized gain/(loss) per share. The effect of this change on the ratio of net investment income was an increase from 4.06% to 4.07%. Per share amounts and ratios for the years ended prior to August 31, 2002 have not been restated to reflect this change in presentation. |
| (d) | The distributor of the Series has contractually agreed to limited its distributions and service (12b-1) fees to .75 of 1% of the daily net assets of Class C shares. |
See Notes to Financial Statements.
| 38 | Visit our website at www.jennisondryden.com |
| Class C | ||||||||||||||
| Year Ended August 31, | ||||||||||||||
| 2004 | 2003 | 2002(c) | 2001 | |||||||||||
| $ | 10.86 | $ | 11.09 | $ | 11.11 | $ | 10.67 | |||||||
| .40 | .42 | .44 | .47 | |||||||||||
| .25 | (.23 | ) | (.01 | ) | .44 | |||||||||
| .65 | .19 | .43 | .91 | |||||||||||
| (.40 | ) | (.42 | ) | (.45 | ) | (.47 | ) | |||||||
| (.16 | ) | — | — | — | ||||||||||
| — | — | — | — | (b) | ||||||||||
| (.56 | ) | (.42 | ) | (.45 | ) | (.47 | ) | |||||||
| $ | 10.95 | $ | 10.86 | $ | 11.09 | $ | 11.11 | |||||||
| 6.03 | % | 1.69 | % | 4.02 | % | 8.71 | % | |||||||
| $ | 8,986 | $ | 9,332 | $ | 10,071 | $ | 9,394 | |||||||
| $ | 9,164 | $ | 9,804 | $ | 9,188 | $ | 8,346 | |||||||
| 1.42 | % | 1.40 | % | 1.37 | % | 1.37 | % | |||||||
| .67 | % | .65 | % | .62 | % | .62 | % | |||||||
| 3.62 | % | 3.82 | % | 4.07 | % | 4.33 | % | |||||||
See Notes to Financial Statements.
| Dryden California Municipal Fund/California Income Series | 39 |
Financial Highlights
Cont’d
| Class Z | ||||
| Year Ended August 31, 2005 | ||||
Per Share Operating Performance: | ||||
Net Asset Value, Beginning Of Year | $ | 10.95 | ||
Income from investment operations | ||||
Net investment income | .48 | |||
Net realized and unrealized gain (loss) on investment transactions | .19 | |||
Total from investment operations | .67 | |||
Less Dividends and Distributions | ||||
Dividends from net investment income | (.48 | ) | ||
Distributions from net realized gains | — | |||
Distributions in excess of net investment income | — | |||
Total dividends and distributions | (.48 | ) | ||
Net asset value, end of year | $ | 11.14 | ||
Total Return(a): | 6.29 | % | ||
Ratios/Supplemental Data: | ||||
Net assets, end of year (000) | $ | 4,737 | ||
Average net assets (000) | $ | 5,101 | ||
Ratios to average net assets: | ||||
Expenses, including distribution and service (12b-1) fees | .68 | % | ||
Expenses, excluding distribution and service (12b-1) fees | .68 | % | ||
Net investment income | 4.39 | % | ||
| (a) | Total return is calculated assuming a purchase of shares on the first day and a sale on the last day of each purchase of shares on the first day and a sale on the last day of each year reported and includes reinvestment of dividends and distributions. |
| (b) | Less than $.005 per share. |
| (c) | Effective September 1, 2001 the Series has adopted the provisions of the AICPA Audit and Accounting Guide for Investment Companies and began accreting market discount on debt securities. There was no effect of this change for the year ended August 31, 2002 on net investment income per share or net realized and unrealized gain/(loss) per share or on the ratio of net investment income. Per share amounts and ratios for the years ended prior to August 31, 2002 have not been restated to reflect this change in presentation. |
See Notes to Financial Statements.
| 40 | Visit our website at www.jennisondryden.com |
| Class Z | ||||||||||||||
| Year Ended August 31, | ||||||||||||||
| 2004 | 2003 | 2002(c) | 2001 | |||||||||||
| $ | 10.86 | $ | 11.09 | $ | 11.11 | $ | 10.65 | |||||||
| .48 | .50 | .52 | .55 | |||||||||||
| .25 | (.23 | ) | (.01 | ) | .46 | |||||||||
| .73 | .27 | .51 | 1.01 | |||||||||||
| (.48 | ) | (.50 | ) | (.53 | ) | (.55 | ) | |||||||
| (.16 | ) | — | — | — | ||||||||||
| — | — | — | — | (b) | ||||||||||
| (.64 | ) | (.50 | ) | (.53 | ) | (.55 | ) | |||||||
| $ | 10.95 | $ | 10.86 | $ | 11.09 | $ | 11.11 | |||||||
| 6.82 | % | 2.45 | % | 4.80 | % | 9.72 | % | |||||||
| $ | 5,604 | $ | 6,592 | $ | 6,148 | $ | 4,052 | |||||||
| $ | 6,958 | $ | 6,118 | $ | 4,712 | $ | 4,292 | |||||||
| .67 | % | .65 | % | .62 | % | .62 | % | |||||||
| .67 | % | .65 | % | .62 | % | .62 | % | |||||||
| 4.36 | % | 4.58 | % | 4.78 | % | 5.09 | % | |||||||
See Notes to Financial Statements.
| Dryden California Municipal Fund/California Income Series | 41 |
Report of Independent Registered Public
Accounting Firm
The Board of Trustees and Shareholders of
Dryden Municipal Series Fund—California Income Series:
We have audited the accompanying statement of assets and liabilities of the Dryden Municipal Series Fund—California Income Series (one of the portfolios constituting Dryden Municipal Series Fund, hereafter referred to as the “Series”), including the portfolio of investments, as of August 31, 2005, and the related statement of operations for the year then ended, and the statements of changes in net assets and the financial highlights for each of years in the two-year period then ended. These financial statements and financial highlights are the responsibility of the Series’ management. Our responsibility is to express an opinion on these financial statements and financial highlights based on our audits. The financial highlights for the years presented prior to the year ended August 31, 2004 were audited by another independent registered public accounting firm, whose report dated October 22, 2003, expressed an unqualified opinion thereon.
We conducted our audits in accordance with the standards of the Public Company Accounting Oversight Board (United States). Those standards require that we plan and perform the audit to obtain reasonable assurance about whether the financial statements and financial highlights are free of material misstatement. An audit includes examining, on a test basis, evidence supporting the amounts and disclosures in the financial statements. Our procedures included confirmation of securities owned as of August 31, 2005, by correspondence with the custodian and brokers or by other appropriate auditing procedures where replies from brokers were not received. An audit also includes assessing the accounting principles used and significant estimates made by management, as well as evaluating the overall financial statement presentation. We believe that our audits provide a reasonable basis for our opinion.
In our opinion, the financial statements and financial highlights referred to above present fairly, in all material respects, the financial position of the Series as of August 31, 2005, and the results of its operations for the year then ended, and the changes in its net assets and the financial highlights for each of the years in the two-year period then ended, in conformity with U.S. generally accepted accounting principles.

New York, New York
October 25, 2005
| 42 | Visit our website at www.jennisondryden.com |
Federal Income Tax Information
(Unaudited)
We are required by the Internal Revenue Code to advise you within 60 days of the Series’ fiscal year end (August 31, 2005) as to the federal income tax status of dividends paid during such fiscal year. Accordingly, we are advising you that during its fiscal year ended August 31, 2005, dividends paid from net investment income of $.4564 per Class A share, $.4289 per Class B share, $.4014 per Class C share and $.4842 per Class Z shares were all federally tax-exempt interest dividends.
We wish to advise you that the corporate dividends received deduction for the Series is zero. Only funds that invest in U.S. equity securities are entitled to pass-through a corporate dividends received deduction.
In January 2006, you will be advised on IRS Form 1099 DIV or substitute 1099 DIV as to the federal tax status of the distributions received by you in calendar 2005.
| Dryden California Municipal Fund/California Income Series | 43 |
Management of the Fund
(Unaudited)
Information pertaining to the Trustees of the Fund is set forth below. Trustees who are not deemed to be “interested persons” of the Fund, as defined in the Investment Company Act of 1940 as amended, (the 1940 Act) are referred to as “Independent Trustees.” Trustees who are deemed to be “interested persons” of the Fund are referred to as “Interested Trustees.” “Fund Complex”† consists of the Fund and any other investment companies managed by PI.
Independent Trustees(2)
Linda W. Bynoe (53), Trustee since 2005(3) Oversees 88 portfolios in Fund complex.
Principal Occupations (last 5 years): President and Chief Executive Officer (since March 1995) of Telemat Ltd.; formerly Vice President at Morgan Stanley & Co.
Other Directorships held:(4) Director of Dynegy Inc. (since September 2002) and Simon Property Group, Inc. (since May 2003); Director (since August 2005) of The High Yield Plus Fund, Inc.
David E.A. Carson (71), Trustee since 2003(3) Oversees 92 portfolios in Fund complex
Principal occupations (last 5 years): Formerly Director (January 2000-May 2000), Chairman (January 1999-December 1999), Chairman and Chief Executive Officer (January 1998-December 1998) and President, Chairman and Chief Executive Officer (1983-1997) of People’s Bank.
Other Directorships held:(4) Director (since 2004) of The High Yield Plus Fund, Inc.
Robert E. La Blanc (71), Trustee since 2003(3) Oversees 89 portfolios in Fund complex
Principal occupations (last 5 years): President (since 1981) of Robert E. La Blanc Associates, Inc. (telecommunications); Director of Chartered Semiconductor Manufacturing, Ltd. (since 1998); Computer Associates International, Inc. (since 2002) (software company); FiberNet Telecom Group, Inc. (since 2003) (telecom company); Director (since April 1999) of The High Yield Plus Fund, Inc.
Other Directorships held:(4) Director of Chartered Semiconductor Manufacturing, Ltd. (since 1998); Titan Corporation (electronics) (since 1995); Computer Associates International, Inc. (software company) (since 2002); FiberNet Telecom Group, Inc. (telecom company) (since 2003); Director (since April 1999) of The High Yield Plus Fund, Inc.
Douglas H. McCorkindale (66), Trustee since 2003(3) Oversees 89 portfolios in Fund complex
Principal occupations (last 5 years): Chairman (since February 2001) of Gannett Co. Inc. (publishing and media); formerly Chief Executive Officer (June 2000-July 2005), President (September 1997-July 2005) and Vice Chairman (March 1984-May 2000) of Gannett Co. Inc.
Other Directorships held:(4) Director of Gannett Co. Inc., Director of Continental Airlines, Inc. (since May 1993); Director of Lockheed Martin Corp. (aerospace and defense) (since May 2001); Director of The High Yield Plus Fund, Inc. (since 1996).
Richard A. Redeker (62), Trustee since 1993(3) Oversees 89 portfolios in Fund complex
Principal occupations (last 5 years): Management Consultant; Director of Invesmart, Inc. (since 2001) and Director of Penn Tank Lines, Inc. (since 1999).
Other Directorships held:(4) Director (since January 2005) of The High Yield Plus Fund, Inc.
| 44 | Visit our website at www.jennisondryden.com |
Robin B. Smith (66), Trustee since 2003(3) Oversees 90 portfolios in Fund complex
Principal occupations (last 5 years): Chairman of the Board (since January 2003) of Publishers Clearing House (direct marketing); formerly Chairman and Chief Executive Officer (August 1996-January 2003) of Publishers Clearing House.
Other Directorships held:(4) Director of BellSouth Corporation (since 1992); Director (since January 2005) of The High Yield Plus Fund, Inc.
Stephen G. Stoneburn (62), Trustee since 2003(3) Oversees 89 portfolios in Fund complex
Principal occupations (last 5 years): President and Chief Executive Officer (since June 1996) of Quadrant Media Corp. (a publishing company); formerly President (June 1995-June 1996) of Argus Integrated Media, Inc.; Senior Vice President and Managing Director (January 1993-1995) of Cowles Business Media and Senior Vice President of Fairchild Publications, Inc. (1975-1989).
Other Directorships held:(4) Director (since January 2005) of The High Yield Plus Fund, Inc.
Clay T. Whitehead (66), Trustee since 2003(3) Oversees 90 portfolios in Fund complex
Principal occupations (last 5 years): President (since 1983) of National Exchange Inc. (new business development firm).
Other Directorships held:(4) Director (since 2000) of The High Yield Plus Fund, Inc.
Interested Trustees(1)
Judy A. Rice (57), President since 2003 and Trustee since 2000(3) Oversees 89 portfolios in Fund complex
Principal occupations (last 5 years): President, Chief Executive Officer, Chief Operating Officer and Officer-in-Charge (since February 2003) of PI; Vice President (since February 1999) of Prudential Investment Management Services LLC; President, Chief Executive Officer and Officer-in-Charge (since April 2003) of Prudential Mutual Fund Services LLC; formerly Executive Vice President (September 1999-February 2003) of PI; Member of Board of Governors of the Money Management Institute.
Other Directorships held:(4) Director (since August 2005) of The High Yield Plus Fund, Inc.
Robert F. Gunia (58), Vice President and Trustee since 1996(3) Oversees 160 portfolios in Fund complex
Principal occupations (last 5 years): Chief Administrative Officer (since September 1999) and Executive Vice President (since December 1996) of Prudential Investments LLC; President (since April 1999) of Prudential Investment Management Services LLC; Executive Vice President (since March 1999) and Treasurer (since May 2000) of Prudential Mutual Fund Services LLC.
Other Directorships held:(4) Vice President and Director (since May 1989) and Treasurer (since 1999) of The Asia Pacific Fund, Inc.; Vice President (since 2004) and Director (since August 2005) of The High Yield Plus Fund, Inc.
Information pertaining to the Officers of the Fund who are not also Trustees is set forth below.
Officers(2)
Kathryn L. Quirk (52), Chief Legal Officer since 2005(3)
Principal occupations (last 5 years): Vice President and Corporate Counsel (since September 2004) of Prudential; Executive Vice President, Chief Legal Officer and Secretary (since July 2005) of Prudential Investments LLC and Prudential Mutual Fund Services LLC; formerly Chief Risk Officer and Corporate Secretary (1997-2002) of Zurich Scudder Investments, Inc.
| Dryden California Municipal Fund/California Income Series | 45 |
Management of the Fund
(Unaudited) Cont’d.
Grace C. Torres (46), Treasurer and Principal Financial and Accounting Officer since 1996(3)
Principal occupations (last 5 years): Assistant Treasurer (since March 1999) and Senior Vice President (since September 1999) of PI; Assistant Treasurer (since May 2003) and Vice President (since June 2005) of American Skandia Investment Services, Inc.; Senior Vice President and Assistant Treasurer (since May 2003) of American Skandia Advisory Services, Inc.; formerly Senior Vice President (May 2003-June 2005) of American Skandia Investment Services, Inc.
Deborah A. Docs (47), Secretary since 1998(3)
Principal occupations (last 5 years): Vice President and Corporates Counsel (since January 2001) of Prudential; Vice President (since December 1996) and Assistant Secretary (since March 1999) of PI; formerly Vice President and Assistant Secretary (May 2003-June 2005) of American Skandia Investment Services, Inc.
Jonathan D. Shain (47), Assistant Secretary since 2004(3)
Principal occupations (last 5 years): Vice President and Corporate Counsel (since August 1998) of Prudential; Vice President and Assistant Secretary (since May 2001) of PI; Vice President and Assistant Secretary (since February 2001) of PMFS; formerly Vice President and Assistant Secretary (May 2003-June 2005) of American Skandia Investment Services, Inc.
Maryanne Ryan (41), Anti-Money Laundering Compliance Officer since 2002(3)
Principal occupations (last 5 years): Anti-Money Laundering Officer and Vice President (since April 2002) of Pruco Securities Corporation; Vice President and Bank Secrecy Act Officer (since July 2002) of Prudential Trust Company; Anti-Money Laundering Officer (since April 2003) of PI.
Lee D. Augsburger (46), Chief Compliance Officer since 2004(3)
Principal occupations (last 5 years): Senior Vice President and Chief Compliance Officer (since April 2003) of PI; Vice President (since November 2000) and Chief Compliance Officer (since October 2000) of Prudential Investment Management, Inc.; Chief Compliance Officer and Senior Vice President (since May 2003) of American Skandia Investment Services, Inc.; Chief Compliance Officer (since October 2004) of Quantitative Management Associates LLC.
| † | The Fund Complex consists of all investment companies managed by PI. The Funds for which PI serves as manager include JennisonDryden Mutual Funds, Strategic Partners Funds, The Prudential Variable Contract Accounts 2, 10, 11, The Target Portfolio Trust, The Prudential Series Fund, Inc., American Skandia Trust and Prudential’s Gibraltar Fund. |
| (1) | “Interested” Trustee, as defined in the 1940 Act, by reason of employment with the Manager (Prudential Investments LLC or PI), the Subadviser (Prudential Investment Management, Inc. or PIM) or the Distributor (Prudential Investment Management Services LLC or PIMS). |
| (2) | Unless otherwise noted, the address of the Trustees and Officers is c/o: Prudential Investments LLC, Gateway Center Three, 100 Mulberry Street, Newark, NJ 07102. |
| (3) | There is no set term of office for Trustees and Officers. The Independent Trustees have adopted a retirement policy, which calls for the retirement of Trustees on December 31 of the year in which they reach the age of 75. The table shows the individuals length of service as Trustee and/or Officer. |
| (4) | This column includes only directorships of companies required to register, or file reports with the SEC under the Securities and Exchange Act of 1934 (that is, “public companies”) or other investment companies registered under the 1940 Act. |
| 46 | Visit our website at www.jennisondryden.com |
Approval of Advisory Agreements
The Board of Trustees (the “Board”) of Dryden California Municipal Fund oversees the management of the California Income Series (the “Fund”), and, as required by law, determines annually whether to renew the Fund’s management agreement with Prudential Investments LLC (“PI”) and the Fund’s subadvisory agreement with Prudential Investment Management, Inc. (“PIM”). In considering the renewal of the agreements, the Board, including a majority of the Independent Trustees, met on May 24, 2005 and June 23, 2005 and approved the renewal of the agreements through July 31, 2006, after concluding that renewal of the agreements was in the best interests of the Fund and its shareholders.
In advance of the meetings, the Board received materials relating to the agreements, and had the opportunity to ask questions and request further information in connection with their consideration. Among other things, the Board considered comparisons with other mutual funds in relevant Peer Universes and Peer Groups. Peer Universes and Peer Groups are mutual funds grouped by investment style. The mutual funds included in each Peer Universe or Peer Group were objectively determined solely by Lipper Inc. (“Lipper”), an independent provider of mutual fund data. The comparisons placed the Fund in various quartiles over one-year, three-year and five-year time periods ending December 31, with the first quartile being the best 25% of the mutual funds (for performance, the best performing mutual funds and, for expenses, the lowest cost mutual funds).
In approving the agreements, the Board, including the Independent Trustees advised by independent legal counsel, considered the factors they deemed relevant, including the nature, quality and extent of services provided, the performance of the Fund, the profitability of PI and its affiliates, expenses and fees, and the potential for economies of scale that may be shared with the Fund and its shareholders. In their deliberations, the Trustees did not identify any single factor that was dispositive and each Trustee attributed different weights to the various factors. In connection with their deliberations, the Board considered information provided by PI throughout the year at regular Board meetings, presentations from portfolio managers and other information, as well as information furnished at or in advance of the meetings on May 24, 2005 and June 23, 2005.
The Trustees determined that the overall arrangements between the Fund and PI, which serves as the Fund’s investment manager pursuant to a management agreement, and between PI and PIM, which serves as the Fund’s subadviser pursuant to the terms of a subadvisory agreement with PI, are fair and reasonable in light of the services performed, fees charged and such other matters as the Trustees considered relevant in the exercise of their business judgment.
| Dryden California Municipal Fund/California Income Series |
Approval of Advisory Agreements (continued)
Several of the material factors and conclusions that formed the basis for the Trustees’ reaching their determinations to approve the continuance of the agreements are separately discussed below.
Nature, Quality and Extent of Services
The Board received and considered information regarding the nature and extent of services provided to the Fund by PI and PIM. The Board considered the services provided by PI, including but not limited to the oversight of the subadviser for the Fund, as well as the provision of recordkeeping, compliance, and other services to the Fund. With respect to PI’s oversight of the subadviser, the Board noted that PI’s Strategic Investment Research Group (“SIRG”), which is a business unit of PI, is responsible for monitoring and reporting to PI’s senior management on the performance and operations of the subadviser. The Board also considered that PI pays the salaries of all of the officers and non-independent Trustees of the Fund. The Board also considered the investment subadvisory services provided by PIM, as well as adherence to the Fund’s investment restrictions and compliance with applicable Fund policies and procedures.
The Board reviewed the qualifications, backgrounds and responsibilities of PI’s senior management responsible for the oversight of the Fund and PIM, and also reviewed the qualifications, backgrounds and responsibilities of PIM’s portfolio managers who are responsible for the day-to-day management of the Fund’s portfolio. The Board was provided with information pertaining to PI’s and PIM’s organizational structure, senior management, investment operations, and other relevant information pertaining to both PI and PIM. The Board also noted that it received favorable compliance reports from the Fund’s Chief Compliance Officer (CCO) as to both PI and PIM. The Board noted that PIM is affiliated with PI.
The Board concluded that it was satisfied with the nature, extent and quality of the investment management services provided by PI and the subadvisory services provided to the Fund by PIM, and that there was a reasonable basis on which to conclude that the Fund benefits from the services provided by PI and PIM under the management and subadvisory agreements.
Performance of California Income Series
The Board received and considered information about the Fund’s historical performance, noting that, for periods ending December 31, 2004, the Fund had achieved performance that was in the second quartile for the three and ten-year periods and performance that was in the third quartile over the one and five-year
| Visit our website at www.jennisondryden.com |
periods. This performance information was in relation to the group of comparable funds in a Peer Universe. The Board also noted that the Fund’s underperformance was primarily attributable to a decision by PIM to maintain positions in short- and intermediate-duration bonds in order to avoid realizing capital gains, and to the decision to underweight the tobacco sector, which performed well for the period. The Board noted that PIM had begun to implement strategies in order to address the Fund’s underperformance, and that PIM had recently hired a new lead portfolio manager.
The Board concluded that it was reasonable to approve the continuance of the management and subadvisory agreements and to continue to monitor the steps being taken to improve performance as well as the performance record being developed by the new lead portfolio manager.
Fees and Expenses
The Board considered the management fee for the Fund as compared to the management fee charged by PI to other funds and accounts and the fee charged by other advisers to comparable mutual funds as provided by Lipper.
The Fund’s management fee of 0.500% ranked in the second quartile in its Peer Group. The Board concluded that the management and subadvisory fees are reasonable.
Costs of Services and Profits Realized by PI
The Board was provided with information on the profitability of PI and its affiliates in serving as the Fund’s investment manager. The Board discussed with PI the methodology utilized in assembling the information regarding profitability and considered its reasonableness. The Board recognized that it is difficult to make comparisons of profitability from fund management contracts because comparative information is not generally publicly available and is affected by numerous factors, including the structure of the particular investment manager, the types of funds it manages, its business mix, numerous assumptions regarding allocations and the investment manager’s capital structure and cost of capital. The Board did not separately consider the profitability of the subadviser, an affiliate of PI, as its profitability was reflected in the profitability report for PI. Taking these factors into account, the Board concluded that the profitability of PI and its affiliates in relation to the services rendered was not unreasonable.
| Dryden California Municipal Fund/California Income Series |
Approval of Advisory Agreements (continued)
Economies of Scale
The Board noted that the management fee schedule for the Fund includes breakpoints, which have the effect of decreasing the fee rate as assets increase, but at the current level of assets the Fund does not realize the effect of those rate reductions. The Board received and discussed information concerning whether PI realizes economies of scale as the Fund’s assets grow beyond current levels. The Board took note that the Fund’s fee structure would result in benefits to Fund shareholders when (and if) assets reach the levels at which the fee rate is reduced. These benefits will accrue whether or not PI is then realizing any economies of scale.
Other Benefits to PI and PIM
The Board considered potential ancillary benefits that might be received by PI and PIM and their affiliates as a result of their relationship with the Fund. The Board concluded that potential benefits to be derived by PI included transfer agency fees received by the Fund’s transfer agent (which is affiliated with PI), as well as reputational or other intangible benefits resulting from PI’s association with the Fund. The Board concluded that the potential benefits to be derived by PIM included those generally resulting from an increase in assets under management, specifically, potential access to additional research resources and reputational benefits. The Board concluded that the benefits derived by PI and PIM were consistent with the types of benefits generally derived by investment managers and subadvisers to mutual funds.
| Visit our website at www.jennisondryden.com |
Growth of a $10,000 Investment
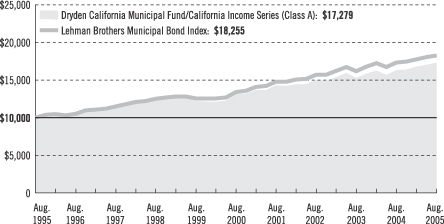
| Average Annual Total Returns (With Sales Charges) as of 8/31/05 | ||||||||||
| One Year | Five Years | Ten Years | Since Inception | |||||||
Class A | 1.78 | % | 4.85 | % | 5.62% (5.57) | 6.68% (6.46) | ||||
Class B | 0.76 | 5.26 | 5.74 (5.69) | 5.52 (5.40) | ||||||
Class C | 4.50 | 5.16 | 5.47 (5.43) | 5.61 (5.52) | ||||||
Class Z | 6.29 | 5.99 | N/A | 6.14 (6.11) | ||||||
| Average Annual Total Returns (Without Sales Charges) as of 8/31/05 | ||||||||||
| One Year | Five Years | Ten Years | Since Inception | |||||||
Class A | 6.02 | % | 5.71 | % | 6.05% (6.01) | 6.97% (6.76) | ||||
Class B | 5.76 | 5.43 | 5.74 (5.69) | 5.52 (5.40) | ||||||
Class C | 5.50 | 5.16 | 5.47 (5.43) | 5.61 (5.52) | ||||||
Class Z | 6.29 | 5.99 | N/A | 6.14 (6.11) | ||||||
Performance data quoted represent past performance. Past performance does not guarantee future results. The investment return and principal value of an investment will fluctuate, so that an investor’s shares, when redeemed, may be worth more or less than their original cost. Current performance may be lower or higher than the past performance data quoted. An investor may obtain performance data as of the most recent month-end by visiting our website at www.jennisondryden.com or by calling (800) 225-1852. The maximum initial sales charge is 4.00% (Class A shares).
| Visit our website at www.jennisondryden.com |
Source: Prudential Investments LLC and Lipper Inc.
Inception dates: Class A, 12/3/90; Class B, 12/7/93; Class C, 8/1/94; and Class Z, 9/18/96.
The graph compares a $10,000 investment in the Dryden California Municipal Fund/California Income Series (Class A shares) with a similar investment in the Lehman Brothers Municipal Bond Index by portraying the initial account values at the beginning of the 10-year period for Class A shares (August 31, 1995) and the account values at the end of the current fiscal year (August 31, 2005), as measured on a quarterly basis. For purposes of the graph, and unless otherwise indicated, it has been assumed that (a) the maximum applicable front-end sales charge was deducted from the initial $10,000 investment in Class A shares; (b) all recurring fees (including management fees) were deducted; and (c) all dividends and distributions were reinvested. The line graph provides information for Class A shares only. As indicated in the tables provided earlier, performance for Class B, Class C, and Class Z shares will vary due to the differing charges and expenses applicable to each share class (as indicated in the following paragraphs). Without a distribution and service (12b-1) fee waiver of 0.05% for Class A shares through August 31, 2005, the returns shown in the graph and for Class A shares in the tables would have been lower.
The Lehman Brothers Municipal Bond Index is an unmanaged index of over 39,000 long-term investment-grade municipal bonds. It gives a broad look at how long-term investment-grade municipal bonds have performed. The Index’s total returns include the reinvestment of all dividends, but do not include the effects of sales charges, operating expenses of a mutual fund, or taxes. The returns for the Index would be lower if they included the effects of sales charges, operating expenses, or taxes. The securities that comprise the Index may differ substantially from the securities in the Fund. This is not the only index that may be used to characterize performance of municipal bond funds. Other indexes may portray different comparative performance. Investors cannot invest directly in an index.
Class A shares are subject to a maximum front-end sales charge of 4.00% and a 12b-1 fee of up to 0.30% annually. Investors who purchase Class A shares in an amount of $1 million or more do not pay a front-end sales charge, but are subject to a contingent deferred sales charge (CDSC) of 1% for shares sold within 12 months of purchase. Class B shares are subject to a declining CDSC of 5%, 4%, 3%, 2%, 1%, and 1% respectively for the first six years after purchase and a 12b-1 fee of up to 0.50% annually. Approximately seven years after purchase, Class B shares will automatically convert to Class A shares on a quarterly basis. Class C shares are subject to a CDSC of 1% for 12 months from the date of purchase and the annual 12b-1 fee will remain up to 1%. Class Z shares are not subject to a sales charge or 12b-1 fee. The returns on investment in the graph and the returns in the tables do not reflect the deduction of taxes that a shareholder would pay on Fund distributions or following the redemption of Fund shares. Without waiver of fees and/or expense subsidization, the Series’ returns would have been lower, as indicated in parentheses.
| Dryden California Municipal Fund/California Income Series |
| n MAIL | n TELEPHONE | n WEBSITE | ||
Gateway Center Three 100 Mulberry Street Newark, NJ 07102 | (800) 225-1852 | www.jennisondryden.com |
| PROXY VOTING |
| The Board of Trustees of the Fund has delegated to the Series’ investment subadviser the responsibility for voting any proxies and maintaining proxy recordkeeping with respect to the Series. A description of these proxy voting policies and procedures is available without charge, upon request, by calling (800) 225-1852 or by visiting the Securities and Exchange Commission’s (the Commission) website at www.sec.gov. Information regarding how the Series voted proxies relating to portfolio securities during the most recent 12-month period ended June 30, 2005, is available on the Series’ website at www.jennisondryden.com and on the Commission’s website at www.sec.gov. |
| TRUSTEES |
| Linda W. Bynoe • David E.A. Carson • Robert F. Gunia • Robert E. La Blanc • Douglas H. McCorkindale • Richard A. Redeker • Judy A. Rice • Robin B. Smith • Stephen G. Stoneburn • Clay T. Whitehead |
| OFFICERS |
| Judy A. Rice, President • Robert F. Gunia, Vice President • Grace C. Torres, Treasurer and Principal Financial and Accounting Officer • Kathryn L. Quirk, Chief Legal Officer • Deborah A. Docs, Secretary • Jonathan D. Shain, Assistant Secretary • Maryanne Ryan, Anti-Money Laundering Compliance Officer • Lee D. Augsburger, Chief Compliance Officer |
| MANAGER | Prudential Investments LLC | Gateway Center Three 100 Mulberry Street Newark, NJ 07102 | ||
| INVESTMENT SUBADVISER | Prudential Investment Management, Inc. | Gateway Center Two 100 Mulberry Street Newark, NJ 07102 | ||
| DISTRIBUTOR | Prudential Investment Management Services LLC | Gateway Center Three 100 Mulberry Street Newark, NJ 07102 | ||
| CUSTODIAN | ||||
| Through September 11, 2005 | State Street Bank and Trust Company | One Heritage Drive North Quincy, MA 02171 | ||
| Effective September 12, 2005 | The Bank of New York | One Wall Street New York, NY 10286 | ||
| TRANSFER AGENT | Prudential Mutual Fund Services LLC | PO Box 8098 Philadelphia, PA 19176 | ||
| INDEPENDENT REGISTERED PUBLIC ACCOUNTING FIRM | KPMG LLP | 345 Park Avenue New York, NY 10154 | ||
| FUND COUNSEL | Shearman & Sterling LLP | 599 Lexington Avenue New York, NY 10022 | ||
| An investor should consider the investment objectives, risks, charges, and expenses of the Series carefully before investing. The prospectus for the Series contains this and other information about the Series. An investor may obtain a prospectus by visiting our website at www.jennisondryden.com or by calling (800) 225-1852. The prospectus should be read carefully before investing. |
| E-DELIVERY |
| To receive your mutual fund documents on-line, go to www.icsdelivery.com/prudential/funds and enroll. Instead of receiving printed documents by mail, you will receive notification via e-mail when new materials are available. You can cancel your enrollment or change your e-mail address at any time by clicking on the change/cancel enrollment option at the icsdelivery website address. |
| SHAREHOLDER COMMUNICATIONS WITH TRUSTEES |
| Shareholders can communicate directly with the Board of Trustees by writing to the Chair of the Board, Dryden California Municipal Fund/California Income Series, PO Box 13964, Philadelphia, PA 19176. Shareholders can communicate directly with an individual Trustee by writing to the same address. Communications are not screened before being delivered to the addressee. |
| AVAILABILITY OF PORTFOLIO SCHEDULE |
| The Series files its complete schedule of portfolio holdings with the Securities and Exchange Commission (the Commission) for the first and third quarters of each fiscal year on Form N-Q. The Series’ Forms N-Q are available on the Commission’s website at www.sec.gov. The Series’ Forms N-Q may also be reviewed and copied at the Commission’s Public Reference Room in Washington, D.C. Information on the operation and location of the Public Reference Room may be obtained by calling (800) SEC-0330 (732-0330). The Series will provide a full list of its portfolio holdings as of the end of each month on its website at www.jennisondryden.com approximately 30 days after the end of the month. |
| The Series’ Statement of Additional Information contains additional information about the Series’ Trustees and is available without charge upon request by calling (800) 225-1852. |
Mutual Funds:
| ARE NOT INSURED BY THE FDIC OR ANY FEDERAL GOVERNMENT AGENCY | MAY LOSE VALUE | ARE NOT A DEPOSIT OF OR GUARANTEED BY ANY BANK OR ANY BANK AFFILIATE |

| Dryden California Municipal Fund/California Income Series | ||||||||||||
| Share Class | A | B | C | Z | ||||||||
NASDAQ | PBCAX | PCAIX | PCICX | PCIZX | ||||||||
CUSIP | 262433105 | 262433204 | 262433303 | 262433402 | ||||||||
MF146E IFS-A110259 Ed. 10/2005
Item 2 – Code of Ethics – – See Exhibit (a)
As of the end of the period covered by this report, the registrant has adopted a code of ethics (the “Section 406 Standards for Investment Companies – Ethical Standards for Principal Executive and Financial Officers”) that applies to the registrant’s Principal Executive Officer and Principal Financial Officer; the registrant’s Principal Financial Officer also serves as the Principal Accounting Officer.
The registrant hereby undertakes to provide any person, without charge, upon request, a copy of the code of ethics. To request a copy of the code of ethics, contact the registrant 973-367-7521, and ask for a copy of the Section 406 Standards for Investment Companies - Ethical Standards for Principal Executive and Financial Officers.
Item 3 – Audit Committee Financial Expert –
The registrant’s Board has determined that Mr. David Carson, member of the Board’s Audit Committee is an “audit committee financial expert,” and that he is “independent,” for purposes of this Item.
Item 4 – Principal Accountant Fees and Services –
(a) Audit Fees
For the fiscal years ended August 31, 2005 and August 31, 2004, KPMG LLP (“KPMG”), the Registrant’s principal accountant, billed the Registrant $46,500 and $61,900, respectively, for professional services rendered for the audit of the Registrant’s annual financial statements or services that are normally provided in connection with statutory and regulatory filings.
(b) Audit-Related Fees
None.
(c) Tax Fees
None.
(d) All Other Fees
None.
(e) (1) Audit Committee Pre-Approval Policies and Procedures
THE PRUDENTIAL MUTUAL FUNDS
AUDIT COMMITTEE POLICY
on
Pre-Approval of Services Provided by the Independent Accountants
The Audit Committee of each Prudential Mutual Fund is charged with the responsibility to monitor the independence of the Fund’s independent accountants. As part of this responsibility, the Audit Committee must pre-approve any independent accounting firm’s engagement to render audit and/or permissible non-audit services, as required by law. In evaluating a proposed engagement of the independent accountants, the Audit Committee will assess the effect that the engagement might reasonably be expected to have on the accountant’s independence. The Committee’s evaluation will be based on:
| • | a review of the nature of the professional services expected to be provided, |
| • | a review of the safeguards put into place by the accounting firm to safeguard independence, and |
| • | periodic meetings with the accounting firm. |
Policy for Audit and Non-Audit Services Provided to the Funds
On an annual basis, the scope of audits for each Fund, audit fees and expenses, and audit-related and non-audit services (and fees proposed in respect thereof) proposed to be performed by the Fund’s independent accountants will be presented by the Treasurer and the independent accountants to the Audit Committee for review and, as appropriate, approval prior to the initiation of such services. Such presentation shall be accompanied by confirmation by both the Treasurer and the independent accountants that the proposed services will not adversely affect the independence of the independent accountants. Proposed services shall be described in sufficient detail to enable the Audit Committee to assess the appropriateness of such services and fees, and the compatibility of the provision of such services with the auditor’s independence. The Committee shall receive periodic reports on the progress of the audit and other services which are approved by the Committee or by the Committee Chair pursuant to authority delegated in this Policy.
The categories of services enumerated under “Audit Services”, “Audit-related Services”, and “Tax Services” are intended to provide guidance to the Treasurer and the independent accountants as to those categories of services which the Committee believes are generally consistent with the independence of the independent accountants and which the Committee (or the Committee Chair) would expect upon the presentation of specific proposals to pre-approve. The enumerated categories are not intended as an exclusive list of audit, audit-related or tax services which the Committee (or the Committee Chair) would consider for pre-approval.
Audit Services
The following categories of audit services are considered to be consistent with the role of the Fund’s independent accountants:
| • | Annual Fund financial statement audits |
| • | Seed audits (related to new product filings, as required) |
| • | SEC and regulatory filings and consents |
Audit-related Services
The following categories of audit-related services are considered to be consistent with the role of the Fund’s independent accountants:
| • | Accounting consultations |
| • | Fund merger support services |
| • | Agreed Upon Procedure Reports |
| • | Attestation Reports |
| • | Other Internal Control Reports |
Individual audit-related services that fall within one of these categories and are not presented to the Audit Committee as part of the annual pre-approval process will be subject to pre-approval by the Committee Chair (or any other Committee member on whom this responsibility has been delegated) so long as the estimated fee for those services does not exceed $50,000.
Tax Services
The following categories of tax services are considered to be consistent with the role of the Fund’s independent accountants:
| • | Tax compliance services related to the filing or amendment of the following: |
| • | Federal, state and local income tax compliance; and, |
| • | Sales and use tax compliance |
| • | Timely RIC qualification reviews |
| • | Tax distribution analysis and planning |
| • | Tax authority examination services |
| • | Tax appeals support services |
| • | Accounting methods studies |
| • | Fund merger support services |
| • | Tax consulting services and related projects |
Individual tax services that fall within one of these categories and are not presented to the Audit Committee as part of the annual pre-approval process will be subject to pre-approval by the Committee Chair (or any other Committee member on whom this responsibility has been delegated) so long as the estimated fee for those services does not exceed $50,000.
Other Non-audit Services
Certain non-audit services that the independent accountants are legally permitted to render will be subject to pre-approval by the Committee or by one or more Committee members to whom the Committee has delegated this authority and who will report to the full Committee any pre-approval decisions made pursuant to this Policy. Non-audit services presented for pre-approval pursuant to this paragraph will be accompanied by a confirmation from both the Treasurer and the independent accountants that the proposed services will not adversely affect the independence of the independent accountants.
Proscribed Services
The Fund’s independent accountants will not render services in the following categories of non-audit services:
| • | Bookkeeping or other services related to the accounting records or financial statements of the Fund |
| • | Financial information systems design and implementation |
| • | Appraisal or valuation services, fairness opinions, or contribution-in-kind reports |
| • | Actuarial services |
| • | Internal audit outsourcing services |
| • | Management functions or human resources |
| • | Broker or dealer, investment adviser, or investment banking services |
| • | Legal services and expert services unrelated to the audit |
| • | Any other service that the Public Company Accounting Oversight Board determines, by regulation, is impermissible. |
Pre-approval of Non-Audit Services Provided to Other Entities Within the Prudential Fund Complex
Certain non-audit services provided to Prudential Investments LLC or any of its affiliates that also provide ongoing services to the Prudential Mutual Funds will be subject to pre-approval by the Audit Committee. The only non-audit services provided to these entities that will require pre-approval are those related directly to the operations and financial reporting of the Funds. Individual projects that are not presented to the Audit Committee as part of the annual pre-approval process, will be subject to pre-approval by the Committee Chair (or any other Committee member on whom this responsibility has been delegated) so long as the estimated fee for those services does not exceed $50,000. Services presented for pre-approval pursuant to this paragraph will be accompanied by a confirmation from both the Treasurer and the independent accountants that the proposed services will not adversely affect the independence of the independent accountants.
Although the Audit Committee will not pre-approve all services provided to Prudential Investments LLC and its affiliates, the Committee will receive an annual report from the Fund’s independent accounting firm showing the aggregate fees for all services provided to Prudential Investments and its affiliates.
(e) (2) Percentage of services referred to in 4(b)- (4)(d) that were approved by the audit committee –
Not applicable.
| (f) | Percentage of hours expended attributable to work performed by other than full time employees of principal accountant if greater than 50%. |
Not applicable.
(g) Non-Audit Fees
Not applicable to Registrant for the fiscal years 2005 and 2004. The aggregate non-audit fees billed by KPMG for services rendered to the registrant’s investment adviser and any entity controlling, controlled by, or under common control with the investment adviser that provides ongoing services to the registrant for the fiscal year 2005 was $56,000. The aggregate non-audit fees billed by KPMG for services rendered to the registrant’s investment adviser and any entity controlling, controlled by, or under common control with the investment adviser that provides ongoing services to the registrant for the fiscal year 2004 was $28,500.
(h) Principal Accountants Independence
Not applicable as KPMG has not provided non-audit services to the registrant’s investment adviser and any entity controlling, controlled by, or under common control with the investment adviser that provides ongoing services to the registrant that were not pre-approved pursuant to Rule 2-01(c)(7)(ii) of Regulation S-X.
Item 5 – Audit Committee of Listed Registrants – Not applicable.
Item 6 – Schedule of Investments – The schedule is included as part of the report to shareholders filed under Item 1 of this Form.
Item 7 – Disclosure of Proxy Voting Policies and Procedures for Closed-End Management Investment Companies – Not applicable.
Item 8 – Portfolio Managers of Closed-End Management Investment Companies – Not applicable.
Item 9 – Purchases of Equity Securities by Closed-End Management Investment Company and Affiliated Purchasers – Not applicable.
Item 10 – Submission of Matters to a Vote of Security Holders – Not applicable.
Item 11 – Controls and Procedures
| (a) | It is the conclusion of the registrant’s principal executive officer and principal financial officer that the effectiveness of the registrant’s current disclosure controls and procedures (such disclosure controls and procedures having been evaluated within 90 days of the date of this filing) provide reasonable assurance that the information required to be disclosed by the registrant has been recorded, processed, summarized and reported within the time period specified in the Commission’s rules and forms and that the information required to be disclosed by the registrant has been accumulated and communicated to the registrant’s principal executive officer and principal financial officer in order to allow timely decisions regarding required disclosure. |
| (b) | There has been no significant change in the registrant’s internal control over financial reporting that occurred during the registrant’s most recent fiscal half-year of the period covered by this report that has materially affected, or is likely to materially affect, the registrant’s internal control over financial reporting. |
Item 12 – Exhibits
| (a) | (1) Code of Ethics – Attached hereto as Exhibit EX-99.CODE-ETH |
| (2) Certifications pursuant to Section 302 of the Sarbanes-Oxley Act – Attached hereto as Exhibit EX-99.CERT. |
| (3) Any written solicitation to purchase securities under Rule 23c-1. – Not applicable. |
| (b) | Certifications pursuant to Section 906 of the Sarbanes-Oxley Act – Attached hereto as Exhibit EX-99.906CERT. |
| (2) | Certifications pursuant to Section 302 of the Sarbanes-Oxley Act – Attached hereto as Exhibit EX-99.CERT. |
| (3) | Any written solicitation to purchase securities under Rule 23c-1. – Not applicable. |
| (b) | Certifications pursuant to Section 906 of the Sarbanes-Oxley Act – Attached hereto as Exhibit EX-99.906CERT. |
SIGNATURES
Pursuant to the requirements of the Securities Exchange Act of 1934 and the Investment Company Act of 1940, the registrant has duly caused this report to be signed on its behalf by the undersigned, thereunto duly authorized.
(Registrant) Dryden California Municipal Fund
| By (Signature and Title)* | /s/ Deborah A. Docs | |
| Deborah A. Docs | ||
| Secretary | ||
Date October 13, 2005
Pursuant to the requirements of the Securities Exchange Act of 1934 and the Investment Company Act of 1940, this report has been signed below by the following persons on behalf of the registrant and in the capacities and on the dates indicated.
| By (Signature and Title)* | /s/ Judy A. Rice | |
| Judy A. Rice | ||
| President and Principal Executive Officer |
Date October 13, 2005
| By (Signature and Title)* | /s/ Grace C. Torres | |
| Grace C. Torres | ||
| Treasurer and Principal Financial Officer | ||
Date October 13, 2005
| * | Print the name and title of each signing officer under his or her signature. |