UNITED STATES
SECURITIES AND EXCHANGE COMMISSION
WASHINGTON, D.C. 20549
FORM N-CSR
CERTIFIED SHAREHOLDER REPORT OF REGISTERED
MANAGEMENT INVESTMENT COMPANIES
Investment Company Act file number 811-1810
Oppenheimer Global Fund
(Exact name of registrant as specified in charter)
6803 South Tucson Way, Centennial, Colorado 80112-3924
(Address of principal executive offices) (Zip code)
Arthur S. Gabinet
OFI Global Asset Management, Inc.
Two World Financial Center, New York, New York 10281-1008
(Name and address of agent for service)
Registrant’s telephone number, including area code: (303) 768-3200
Date of fiscal year end: September 30
Date of reporting period: 3/28/2013
Item 1. Reports to Stockholders.

Table of Contents
Class A Shares
AVERAGE ANNUAL TOTAL RETURNS AT 3/28/13
| | | | | | | | |
| | | Class A Shares of the Fund | | | | |
| | | Without Sales Charge | | With Sales Charge | | MSCI AC World Index | | MSCI World Index |
6-Month | | 14.89% | | 8.29% | | 9.57% | | 10.41% |
|
1-Year | | 13.59 | | 7.05 | | 10.55 | | 11.85 |
|
5-Year | | 4.57 | | 3.34 | | 2.06 | | 2.23 |
|
10-Year | | 11.34 | | 10.68 | | 9.36 | | 8.88 |
|
The performance data quoted represents past performance, which does not guarantee future results. The investment return and principal value of an investment in the Fund will fluctuate so that an investor’s shares, when redeemed, may be worth more or less than their original cost. Fund returns include changes in share price, reinvested distributions, and a 5.75% maximum applicable sales charge except where “without sales charge” is indicated. Current performance may be lower or higher than the performance quoted. Returns do not consider capital gains or income taxes on an individual’s investment. Returns for periods of less than one year are cumulative and not annualized. For performance data current to the most recent month-end, visit oppenheimerfunds.com or call 1.800.CALL OPP (225.5677).
March 28, 2013 was the last business day of the Fund’s reporting period. See Note 1 of the accompanying Notes to Financial Statements. Index returns are calculated through March 31, 2013.
2 OPPENHEIMER GLOBAL FUND
Fund Performance Discussion
The Fund’s Class A shares (without sales charge) produced a return of 14.89% during the reporting period, outperforming the MSCI AC World Index (the “Index”), which returned 9.57%. Contributors to the Fund’s performance were broad based, with meaningful contributions from holdings in information technology, financials, consumer discretionary, industrials, health care and consumer staples. On a country basis, the Fund’s holdings in the United States, Sweden, Germany and the Netherlands were of particular strength.
MARKET OVERVIEW
Although macroeconomic concerns remained during the period, global equities performed positively on the back of improved investor sentiment. Central banks throughout the world took action to help bolster the markets. In Europe, the European Central Bank (the “ECB”) committed to potentially unlimited bond purchases to ease financing pressure on countries such as Spain and Italy. Under the plan, these and other members of the European Union (excluding Greece) would be able to maintain access to funding at sustainable interest rates, on the condition that they continue with strict reform programs. In the U.S., the Federal Reserve (the “Fed”) introduced a third round of quantitative easing, under which it announced plans to purchase mortgage-backed bonds on a monthly basis until the labor market shows signs of substantial improvement. In addition to these actions, concerns regarding an economic slowdown in the emerging markets also eased, in the hope that China’s new leadership may adopt more stimulative fiscal policies than their predecessors.
Global markets experienced some pullback in the wake of the U.S. presidential election as investors contemplated the potential effect of higher taxes on the world’s largest economy and the possible repercussions on others. Non-U.S. markets eventually shrugged off this worry, while emerging markets did so to a greater degree. The lack of visibility about resolution of the “fiscal cliff” also weighed further on both business and consumer spending before the U.S. Congress enacted a last minute temporary resolution in early January 2013. In addition, the onset of a package of broad federal spending cuts, known as the sequestration, kicked in after Congress could not come to an agreement on the federal budget. These developments were not enough to halt the overall positive performance of equities, which resumed an upward trend through the end of the reporting period.
FUND REVIEW
On an individual stock basis, Telefonaktiebolaget LM Ericsson (“Ericsson”), European Aeronautic Defence & Space Co. NV (“EADS”), PPR and UBS AG, all of which
OPPENHEIMER GLOBAL FUND 3
were top ten weighted holdings, made the strongest positive impact on Fund returns. Ericsson is a world-leading provider of telecommunications equipment and related services to mobile and fixed network operators. Ericsson announced strong equipment sales growth as North American operators increased their capex spending significantly. In Europe, operators are beginning transition from widening coverage areas with hardware purchases to deepening service delivery with software upgrades. With its dominance of the installed infrastructure, we believe Ericsson is poised to benefit from this higher margin business.
EADS is the Franco-German manufacturer of Airbus planes. The company is enjoying strong sales and earnings as it supplies a world air fleet that is renewing itself and expanding. EADS, like most aircraft manufacturers, has some defense business, but at roughly 25% of earnings, the percentage is significantly below that of its chief rival, Boeing. Consequently, EADS has been less affected by declining defense spending in the U.S. and Europe.
PPR (which is changing its name to Kering) has gradually transformed itself over the past 20 years into a leading luxury player in apparel and jewelry with brands such as Gucci, YSL, Stella McCartney and Bottega Veneta. PPR is benefiting from strong demand growth for luxury goods, especially in emerging markets. We believe that this is a long-term secular trend and that strong
brands confer a durable competitive advantage to their holders.
UBS has one of the leading wealth management franchises in the world. The firm has made the decision to focus on this core business and gradually withdraw from investment banking, a significantly less profitable, more capital intensive activity. With this redeployment of capital, we believe shareholders may potentially receive more of the benefit of UBS’ strong position in a wealth management industry experiencing strong secular growth worldwide.
While detractors from performance were limited this period, the most significant was Fusion-io, Inc. Fusion-io produces solid state data storage components. The market for this technology is at an early stage of development, and therefore Fusion-io’s stock tends to be relatively volatile. During the reporting period, investors were disappointed by revenues that were below aggressive projections as the company’s two biggest clients, Apple and Facebook, slowed their data center expansion. Growth in sales to other customers accelerated and the customer base of large companies continues to expand. We believe the data storage market will increasingly move toward solid state technology, and Fusion-io’s leading intellectual property in this area positions the company to be a key beneficiary of this secular trend.
Nidec Corp. and Technip SA detracted from performance to a lesser degree. Nidec, a
4 OPPENHEIMER GLOBAL FUND
Japanese company, experienced declines largely due to the negative sentiment generated by weak PC sales. Nidec manufactures roughly 80% of the brushless motors used in disc drives, which are in turn used in PCs. However, disc drives are also used in data warehouses. The adoption of mobile devices that is driving down PC usage is also driving up demand for the data warehouses that comprise the “computer cloud” upon which mobile devices rely. We believe growth in data warehouses that generates disc drive demand has the potential to counteract the decline in PC-generated demand.
Technip is a global oil service company. During the period, shares of Technip suffered from investors’ negative read-through of competitor Saipem’s poor results. Technip, by contrast, announced results in line with analyst expectations, but investors’ caution on the sector led to the sell-off. We retain our conviction in Technip, a company we have owned for over 10 years and that we know very well. Business is strong with rising volumes, backlog and margins.
STRATEGY & OUTLOOK
Regardless of whether we are in a fast or a slow growth world, we believe the companies in the Fund have the potential to grow at above the general rate of the economies in which they operate by virtue of the secular currents driving them and their advantages globally. We have a long-term investment horizon and build the portfolio from the bottom up, focusing on businesses
advantaged by long-term trends. We invest in companies that we believe are capable of producing solid and sustainable growth through the business cycle, that have made strong returns on invested capital, and that demonstrate good cash flow generation characteristics. We are patient investors and wait for those companies to be out of favor so they are reasonably priced when we buy.
While we are underweight financials, we have been increasing the Fund’s exposure to the sector by adding to names we already own. We think financial institutions that are in the consumer lending business will do well. Capital is relatively short, and the purveyors of capital who can raise it cheaply should get paid. The improving U.S. housing market has lifted housing prices. This in turn should increase consumer confidence, as household balance sheets get better. Job creation is also a result of improving housing values, as small business owners tend to be funded by the value of the real estate they own. Moreover, financial institutions appear reasonably valued and collateral on their balance sheets does not seem to be overstated, as in the past.
With regard to the recent events in Cyprus, while we do not view them as positive, we do think the outcome was the best of the range of choices that could have been made. The outcome reinforces our view that the Europeans will at some stage reflate, as the U.S. and Japan have done, and that the Euro will decline against the U.S. dollar as a result. Monetary easing in Europe would also have
OPPENHEIMER GLOBAL FUND 5
the effect of enabling reform to happen at a more rapid pace, in our opinion. We note that we have already seen some improvement in Spain and Portugal, for instance, in their export numbers and some labor market changes.
In our view, it is much easier to implement reform in a reflationary than a deflationary environment and so we are positive on recent events in Japan. As reflation takes hold and real interest rates turn negative, we expect that bank deposits will be put to more productive use and Japanese corporations will employ their capital more profitably. Given the extreme risk averseness in Japan after 20 years of deflation, we do not expect this to
happen quickly, but we do expect it to happen.
In emerging markets, we think that valuations have improved. We are positive on India, where we expect spending to rise as we move toward next year’s elections. In Latin America, Mexico and the Andean region are performing well, but Brazil has been a disappointment and pressure is building for policy changes there.
| | |
 | |  |
| | Rajeev Bhaman Portfolio Manager |
6 OPPENHEIMER GLOBAL FUND
Top Holdings and Allocations*
| | | | |
TOP TEN COMMON STOCK HOLDINGS | |
| |
Telefonaktiebolaget LM Ericsson, Cl. B | | | 3.6% | |
| | | | |
European Aeronautic Defence & Space Co. NV | | | 2.4 | |
| | | | |
SAP AG | | | 2.3 | |
| | | | |
eBay, Inc. | | | 2.2 | |
| | | | |
Google, Inc., Cl. A | | | 2.2 | |
| | | | |
Siemens AG | | | 2.0 | |
| | | | |
UBS AG | | | 2.0 | |
| | | | |
PPR | | | 2.0 | |
| | | | |
LVMH Moet Hennessy Louis Vuitton SA | | | 2.0 | |
| | | | |
Colgate-Palmolive Co. | | | 2.0 | |
| |
Portfolio holdings and allocations are subject to change. Percentages are as of March 28, 2013, and are based on net assets. For more current Fund holdings, please visit oppenheimerfunds.com.
| | | | |
TOP TEN GEOGRAPHICAL HOLDINGS | |
| |
United States | | | 39.6% | |
| | | | |
Germany | | | 10.4 | |
| | | | |
Japan | | | 8.2 | |
| | | | |
France | | | 6.0 | |
| | | | |
Sweden | | | 5.3 | |
| | | | |
Switzerland | | | 4.9 | |
| | | | |
Brazil | | | 4.1 | |
| | | | |
India | | | 3.7 | |
| | | | |
Spain | | | 3.6 | |
| | | | |
United Kingdom | | | 3.4 | |
| |
Portfolio holdings and allocation are subject to change. Percentages are as of March 28, 2013, and are based on total market value of investments.
REGIONAL ALLOCATION
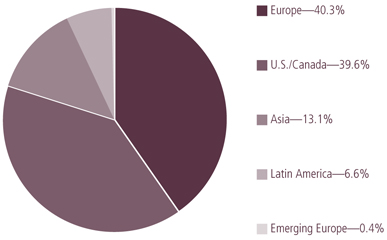
Portfolio holdings and allocations are subject to change. Percentages are as of March 28, 2013, and are based on the total market value of investments.
*March 28, 2013 was the last business day of the Fund’s reporting period. See Note 1 of the accompanying Notes to Financial Statements.
OPPENHEIMER GLOBAL FUND 7
Share Class Performance
AVERAGE ANNUAL TOTAL RETURNS WITHOUT SALES CHARGE AS OF 3/28/13
| | | | | | | | | | | | | | | | | | | | |
| | | Inception Date | | | 6-Month | | | 1-Year | | | 5-Year | | | 10-Year | |
Class A (OPPAX) | | | 12/22/69 | | | | 14.89% | | | | 13.59% | | | | 4.57% | | | | 11.34% | |
Class B (OGLBX) | | | 8/17/93 | | | | 14.40% | | | | 12.63% | | | | 3.68% | | | | 10.80% | |
Class C (OGLCX) | | | 10/2/95 | | | | 14.49% | | | | 12.79% | | | | 3.79% | | | | 10.50% | |
Class I (OGLIX) | | | 1/27/12 | | | | 15.18% | | | | 14.15% | | | | 19.42% | * | | | N/A | |
Class N (OGLNX) | | | 3/1/01 | | | | 14.71% | | | | 13.21% | | | | 4.24% | | | | 10.93% | |
Class Y (OGLYX) | | | 11/17/98 | | | | 15.06% | | | | 13.92% | | | | 4.92% | | | | 11.69% | |
AVERAGE ANNUAL TOTAL RETURNS WITH SALES CHARGE AS OF 3/28/13
| | | | | | | | | | | | | | | | | | | | |
| | | Inception Date | | | 6-Month | | | 1-Year | | | 5-Year | | | 10-Year | |
Class A (OPPAX) | | | 12/22/69 | | | | 8.29% | | | | 7.05% | | | | 3.34% | | | | 10.68% | |
Class B (OGLBX) | | | 8/17/93 | | | | 9.40% | | | | 7.63% | | | | 3.33% | | | | 10.80% | |
Class C (OGLCX) | | | 10/2/95 | | | | 13.49% | | | | 11.79% | | | | 3.79% | | | | 10.50% | |
Class I (OGLIX) | | | 1/27/12 | | | | 15.18% | | | | 14.15% | | | | 19.42% | * | | | N/A | |
Class N (OGLNX) | | | 3/1/01 | | | | 13.71% | | | | 12.21% | | | | 4.24% | | | | 10.93% | |
Class Y (OGLYX) | | | 11/17/98 | | | | 15.06% | | | | 13.92% | | | | 4.92% | | | | 11.69% | |
*Shows performance since inception.
The performance data quoted represents past performance, which does not guarantee future results. The investment return and principal value of an investment in the Fund will fluctuate so that an investor’s shares, when redeemed, may be worth more or less than their original cost. Current performance may be lower or higher than the performance quoted. Returns do not consider capital gains or income taxes on an individual’s investment. For performance data current to the most recent month-end, visit oppenheimerfunds.com or call 1.800.CALL OPP (225.5677). Fund returns include changes in share price, reinvested distributions, and the applicable sales charge: for Class A shares, the current maximum initial sales charge of 5.75%; for Class B shares, the contingent deferred sales charge of 5% (1-year) and 2% (5-year); and for Class C and N shares, the contingent deferred sales charge of 1% for the 1-year period. There is no sales charge for Class I and Y shares. Because Class B shares convert to Class A shares 72 months after purchase, the 10-year return for Class B shares uses Class A performance for the period after conversion. Returns for periods of less than one year are cumulative and not annualized.
March 28, 2013 was the last business day of the Fund’s reporting period. See Note 1 of the accompanying Notes to Financial Statements.
The Fund’s performance is compared to the performance of the MSCI AC World Index, a free float-adjusted market capitalization weighted index that is designed to measure the equity market performance of developed and emerging markets and the MSCI World Index, an index of issuers listed on the stock exchanges of foreign countries and the United States. It is widely recognized as a measure of global stock market performance. The Fund has changed its benchmark from the MSCI World Index to the MSCI AC World Index, which it believes is a more appropriate measure of the Fund’s performance. Indices are unmanaged and cannot be
8 OPPENHEIMER GLOBAL FUND
purchased by investors. Index performance includes reinvestment of income, but does not reflect transaction costs, fees, expenses or taxes. Index performance is shown for illustrative purposes only as a benchmark for the Fund’s performance, and does not predict or depict performance of the Fund. The Fund’s performance reflects the effects of the Fund’s business and operating expenses.
The Fund’s investment strategy and focus can change over time. The mention of specific fund holdings does not constitute a recommendation by OppenheimerFunds, Inc. or its affiliates.
Before investing in any of the Oppenheimer funds, investors should carefully consider a fund’s investment objectives, risks, charges and expenses. Fund prospectuses and summary prospectuses contain this and other information about the funds, and may be obtained by asking your financial advisor, visiting oppenheimerfunds.com, or calling 1.800.CALL OPP (225.5677). Read prospectuses and summary prospectuses carefully before investing.
Shares of Oppenheimer funds are not deposits or obligations of any bank, are not guaranteed by any bank, are not insured by the FDIC or any other agency, and involve investment risks, including the possible loss of the principal amount invested.
OPPENHEIMER GLOBAL FUND 9
Fund Expenses
Fund Expenses. As a shareholder of the Fund, you incur two types of costs: (1) transaction costs, which may include sales charges (loads) on purchase payments, contingent deferred sales charges on redemptions; and (2) ongoing costs, including management fees; distribution and service fees; and other Fund expenses. These examples are intended to help you understand your ongoing costs (in dollars) of investing in the Fund and to compare these costs with the ongoing costs of investing in other mutual funds.
The examples are based on an investment of $1,000.00 invested at the beginning of the period and held for the entire 6-month period ended March 28, 2013.
Actual Expenses. The first section of the table provides information about actual account values and actual expenses. You may use the information in this section for the class of shares you hold, together with the amount you invested, to estimate the expense that you paid over the period. Simply divide your account value by $1,000.00 (for example, an $8,600.00 account value divided by $1,000.00 = 8.60), then multiply the result by the number in the first section under the heading entitled “Expenses Paid During Period” to estimate the expenses you paid on your account during this period.
Hypothetical Example for Comparison Purposes. The second section of the table provides information about hypothetical account values and hypothetical expenses based on the Fund’s actual expense ratio for each class of shares, and an assumed rate of return of 5% per year for each class before expenses, which is not the actual return. The hypothetical account values and expenses may not be used to estimate the actual ending account balance or expenses you paid for the period. You may use this information to compare the ongoing costs of investing in the Fund and other funds. To do so, compare this 5% hypothetical example for the class of shares you hold with the 5% hypothetical examples that appear in the shareholder reports of the other funds.
Please note that the expenses shown in the table are meant to highlight your ongoing costs only and do not reflect any transactional costs, such as front-end or contingent deferred sales charges (loads), or a $12.00 fee imposed annually on accounts valued at less than $500.00 (subject to exceptions described in the Statement of Additional Information). Therefore, the “hypothetical” section of the table is useful in comparing ongoing costs only, and will not help you determine the relative total costs of owning different funds. In addition, if these transactional costs were included, your costs would have been higher.
10 OPPENHEIMER GLOBAL FUND
| | | | | | | | | | | | |
| Actual | | Beginning
Account Value
October 1, 2012 | | | Ending
Account Value
March 28, 2013 | | | Expenses
Paid During
6 Months Ended
March 28, 2013 | |
| |
Class A | | $ | 1,000.00 | | | $ | 1,148.90 | | | $ | 6.18 | |
| |
Class B | | | 1,000.00 | | | | 1,144.00 | | | | 10.72 | |
| |
Class C | | | 1,000.00 | | | | 1,144.90 | | | | 9.88 | |
| |
Class I | | | 1,000.00 | | | | 1,151.80 | | | | 3.70 | |
| |
Class N | | | 1,000.00 | | | | 1,147.10 | | | | 7.98 | |
| |
Class Y | | | 1,000.00 | | | | 1,150.60 | | | | 4.76 | |
| | | |
| Hypothetical | | | | | | | | | |
(5% return before expenses) | | | | | | | | | | | | |
| |
Class A | | | 1,000.00 | | | | 1,018.78 | | | | 5.81 | |
| |
Class B | | | 1,000.00 | | | | 1,014.57 | | | | 10.08 | |
| |
Class C | | | 1,000.00 | | | | 1,015.35 | | | | 9.28 | |
| |
Class I | | | 1,000.00 | | | | 1,021.09 | | | | 3.47 | |
| |
Class N | | | 1,000.00 | | | | 1,017.12 | | | | 7.50 | |
| |
Class Y | | | 1,000.00 | | | | 1,020.11 | | | | 4.47 | |
Expenses are equal to the Fund’s annualized expense ratio for that class, multiplied by the average account value over the period, multiplied by 179/365 (to reflect the one-half year period). Those annualized expense ratios, excluding indirect expenses from affiliated fund, based on the 6-month period ended March 28, 2013 are as follows:
| | | | | | | | |
| Class | | Expense Ratios | | | |
| | |
Class A | | | 1.17% | | |
| | |
Class B | | | 2.03 | | |
| | |
Class C | | | 1.87 | | |
| | |
Class I | | | 0.70 | | |
| | |
Class N | | | 1.51 | | |
| | |
Class Y | | | 0.90 | | |
The expense ratios reflect voluntary waivers and/or reimbursements of expenses by the Fund’s Manager and Transfer Agent. Some of these undertakings may be modified or terminated at any time, as indicated in the Fund’s prospectus. The “Financial Highlights” tables in the Fund’s financial statements, included in this report, also show the gross expense ratios, without such waivers or reimbursements and reduction to custodian expenses, if applicable.
OPPENHEIMER GLOBAL FUND 11
| | | | |
| | STATEMENT OF INVESTMENTS March 28, 2013* / Unaudited | | |
| | | | | | | | | | | | |
| | | Shares | | | Value | | | | | |
| | | | | |
Common Stocks—99.5% | | | | | | | | | |
| | | | | |
Consumer Discretionary—17.1% | | | | | | | | | |
| | | | | |
Automobiles—1.9% | | | | | | | | | | | | |
Bayerische Motoren Werke (BMW) AG, Preference | | | 2,667,317 | | | $ | 170,390,861 | | | | | |
| | | | | |
Hotels, Restaurants & Leisure—3.5% | | | | | | | | | |
Carnival Corp. | | | 3,433,772 | | | | 117,778,380 | | | | | |
| | | | | |
Lottomatica Group SpA | | | 1,511,954 | | | | 35,525,340 | | | | | |
| | | | | |
McDonald’s Corp. | | | 1,659,740 | | | | 165,459,481 | | | | | |
| | | | | | | | | | | | |
| | | | | | | 318,763,201 | | | | | |
| | | | | |
Media—3.4% | | | | | | | | | | | | |
Grupo Televisa SAB, Sponsored ADR | | | 3,221,764 | | | | 85,731,140 | | | | | |
| | | | | |
Walt Disney Co. (The) | | | 3,121,460 | | | | 177,298,928 | | | | | |
| | | | | |
Zee Entertainment Enterprises Ltd. | | | 14,003,568 | | | | 54,365,278 | | | | | |
| | | | | | | | | | | | |
| | | | | | | 317,395,346 | | | | | |
| | | | | |
Multiline Retail—2.0% | | | | | | | | | | | | |
PPR | | | 831,151 | | | | 182,611,427 | | | | | |
| | | | | |
Specialty Retail—3.2% | | | | | | | | | | | | |
Industria de Diseno Textil SA (Inditex) | | | 1,178,063 | | | | 156,993,769 | | | | | |
| | | | | |
Tiffany & Co. | | | 2,027,028 | | | | 140,959,527 | | | | | |
| | | | | | | | | | | | |
| | | | | | | 297,953,296 | | | | | |
| | | | | |
Textiles, Apparel & Luxury Goods—3.1% | | | | | |
Brunello Cucinelli SpA1 | | | 488,470 | | | | 10,281,305 | | | | | |
| | | | | |
LVMH Moet Hennessy Louis Vuitton SA | | | 1,059,000 | | | | 181,766,456 | | | | | |
| | | | | |
Tod’s SpA | | | 665,885 | | | | 95,343,175 | | | | | |
| | | | | | | | | | | | |
| | | | | | | 287,390,936 | | | | | |
| | | | | | | | | | | | |
| | | | | |
Consumer Staples—8.3% | | | | | | | | | |
| | | | | |
Beverages—3.1% | | | | | | | | | | | | |
Carlsberg AS, Cl. B | | | 683,173 | | | | 66,480,283 | | | | | |
| | | | | |
Compania de Bebidas das Americas, Preference, ADR | | | 1,979,850 | | | | 83,807,051 | | | | | |
| | | | | |
Fomento Economico Mexicano SAB de CV, UBD | | | 12,554,873 | | | | 142,519,940 | | | | | |
| | | | | | | | | | | | |
| | | | | | | 292,807,274 | | | | | |
| | | | | |
Food & Staples Retailing—0.1% | | | | | | | | | |
E-Mart Co. Ltd. | | | 41,488 | | | | 8,184,986 | | | | | |
| | | | | |
Food Products—3.1% | | | | | | | | | | | | |
Nestle SA | | | 1,547,381 | | | | 111,901,091 | | | | | |
| | | | | |
Unilever plc | | | 4,113,239 | | | | 173,996,126 | | | | | |
| | | | | | | | | | | | |
| | | | | | | 285,897,217 | | | | | |
| | | | | |
Household Products—2.0% | | | | | | | | | |
Colgate-Palmolive Co. | | | 1,535,170 | | | | 181,196,115 | | | | | |
| | | | | | | | |
| | | Shares | | | Value | |
| |
Energy—3.3% | | | | | | | | |
| |
Energy Equipment & Services—2.6% | | | | | |
Technip SA | | | 1,427,630 | | | $ | 146,363,999 | |
| |
Transocean Ltd.1 | | | 1,719,028 | | | | 89,320,695 | |
| | | | | | | | |
| | | | | | | 235,684,694 | |
| |
Oil, Gas & Consumable Fuels—0.7% | | | | | |
Repsol SA | | | 3,266,060 | | | | 66,357,593 | |
| | | | | | | | |
| |
Financials—17.7% | | | | | | | | |
| |
Capital Markets—3.5% | | | | | | | | |
Credit Suisse Group AG1 | | | 2,121,829 | | | | 55,998,152 | |
| |
Goldman Sachs Group, Inc. (The) | | | 566,391 | | | | 83,344,436 | |
| |
UBS AG1 | | | 11,935,149 | | | | 182,931,021 | |
| | | | | | | | |
| | | | | | | 322,273,609 | |
| |
Commercial Banks—5.1% | | | | | | | | |
Banco Bilbao Vizcaya Argentaria SA | | | 12,602,025 | | | | 109,889,495 | |
| |
ICICI Bank Ltd., Sponsored ADR | | | 3,270,460 | | | | 140,302,734 | |
| |
Itau Unibanco Holding SA, Preference, ADR | | | 5,552,700 | | | | 98,838,060 | |
| |
Societe Generale1 | | | 1,128,956 | | | | 37,243,288 | |
| |
Sumitomo Mitsui Financial Group, Inc. | | | 2,116,900 | | | | 86,868,180 | |
| | | | | | | | |
| | | | | | | 473,141,757 | |
| |
Diversified Financial Services—3.8% | | | | | |
BM&FBovespa SA | | | 14,069,700 | | | | 94,621,909 | |
| |
Citigroup, Inc. | | | 1,659,790 | | | | 73,429,110 | |
| |
McGraw-Hill Cos., Inc. (The) | | | 2,795,039 | | | | 145,565,631 | |
| |
Moscow Exchange (The)1 | | | 19,142,006 | | | | 33,498,510 | |
| | | | | | | | |
| | | | | | | 347,115,160 | |
| |
Insurance—4.8% | | | | | | | | |
Allianz SE | | | 1,068,444 | | | | 145,107,523 | |
| |
Dai-ichi Life Insurance Co. Ltd. (The) | | | 73,498 | | | | 98,737,154 | |
| |
Fidelity National Financial, Inc., Cl. A | | | 2,331,060 | | | | 58,812,644 | |
| |
Prudential plc | | | 8,271,549 | | | | 134,598,133 | |
| | | | | | | | |
| | | | | | | 437,255,454 | |
| |
Real Estate Management & Development—0.5% | |
DLF Ltd. | | | 10,603,848 | | | | 46,347,862 | |
| | | | | | | | |
| |
Health Care—10.7% | | | | | | | | |
| |
Biotechnology—2.2% | | | | | | | | |
Gilead Sciences, Inc.1 | | | 1,943,560 | | | | 95,098,391 | |
| |
Medivation, Inc.1 | | | 488,981 | | | | 22,869,641 | |
| |
Theravance, Inc.1 | | | 2,045,545 | | | | 48,315,773 | |
| |
ThromboGenics NV1 | | | 313,553 | | | | 15,108,470 | |
12 OPPENHEIMER GLOBAL FUND
| | | | | | | | | | | | |
| | | Shares | | | Value | | | | | |
| | | | | |
Biotechnology (Continued) | | | | | | | | | | | | |
Vertex Pharmaceuticals, Inc.1 | | | 449,690 | | | $ | 24,723,956 | | | | | |
| | | | | | | | | | | | |
| | | | | | | 206,116,231 | | | | | |
| | | | | |
Health Care Equipment & Supplies—2.0% | | | | | | | | | |
St. Jude Medical, Inc. | | | 997,330 | | | | 40,332,025 | | | | | |
| | | | | |
Swiss Medical SA1,2,3 | | | 49,975,200 | | | | 13,655,074 | | | | | |
| | | | | |
Zimmer Holdings, Inc. | | | 1,807,844 | | | | 135,986,026 | | | | | |
| | | | | | | | | | | | |
| | | | | | | 189,973,125 | | | | | |
| | | | | |
Health Care Providers & Services—3.4% | | | | | | | | | |
Aetna, Inc. | | | 2,874,379 | | | | 146,938,254 | | | | | |
| | | | | |
WellPoint, Inc. | | | 2,528,935 | | | | 167,491,365 | | | | | |
| | | | | | | | | | | | |
| | | | | | | 314,429,619 | | | | | |
| | | | | |
Pharmaceuticals—3.1% | | | | | | | | | | | | |
Allergan, Inc. | | | 316,610 | | | | 35,343,174 | | | | | |
| | | | | |
Bayer AG | | | 1,431,426 | | | | 147,652,262 | | | | | |
| | | | | |
Roche Holding AG | | | 435,697 | | | | 101,431,620 | | | | | |
| | | | | | | | | | | | |
| | | | | | | 284,427,056 | | | | | |
| | | | | | | | | | | | |
| | | | | |
Industrials—13.3% | | | | | | | | | | | | |
| | | | | |
Aerospace & Defense—3.5% | | | | | | | | | | | | |
Embraer SA, ADR | | | 2,782,135 | | | | 99,238,755 | | | | | |
| | | | | |
European Aeronautic Defence & Space Co. | | | 4,402,408 | | | | 224,036,097 | | | | | |
| | | | | | | | | | | | |
| | | | | | | 323,274,852 | | | | | |
| | | | | |
Air Freight & Couriers—1.1% | | | | | | | | | | | | |
United Parcel Service, Inc., Cl. B | | | 1,160,680 | | | | 99,702,412 | | | | | |
| | | | | |
Building Products—1.6% | | | | | | | | | | | | |
Assa Abloy AB, Cl. B | | | 3,708,331 | | | | 151,427,808 | | | | | |
| | | | | |
Construction & Engineering—0.8% | | | | | | | | | |
FLSmidth & Co. AS | | | 1,109,390 | | | | 67,399,565 | | | | | |
| | | | | |
Electrical Equipment—2.0% | | | | | | | | | | | | |
Emerson Electric Co. | | | 1,481,960 | | | | 82,797,105 | | | | | |
| | | | | |
Nidec Corp. | | | 843,008 | | | | 50,509,768 | | | | | |
| | | | | |
Prysmian SpA | | | 2,377,571 | | | | 48,915,414 | | | | | |
| | | | | | | | | | | | |
| | | | | | | 182,222,287 | | | | | |
| | | | | |
Industrial Conglomerates—3.6% | | | | | | | | | |
3M Co. | | | 1,351,510 | | | | 143,679,028 | | | | | |
| | | | | |
Siemens AG | | | 1,706,851 | | | | 183,851,499 | | | | | |
| | | | | | | | | | | | |
| | | | | | | 327,530,527 | | | | | |
| | | | | |
Machinery—0.7% | | | | | | | | | | | | |
FANUC Corp. | | | 398,600 | | | | 61,323,094 | | | | | |
| | | | | | | | | | | | |
| | | | | |
Information Technology—26.0% | | | | | | | | | |
| | | | | |
Communications Equipment—4.6% | | | | | | | | | |
Juniper Networks, Inc.1 | | | 4,849,912 | | | | 89,917,368 | | | | | |
| | | | | |
Telefonaktiebolaget LM Ericsson, Cl. B | | | 26,599,561 | | | | 331,445,988 | | | | | |
| | | | | | | | | | | | |
| | | | | | | 421,363,356 | | | | | |
| | | | | |
Computers & Peripherals—0.5% | | | | | | | | | |
Fusion-io, Inc.1 | | | 2,708,522 | | | | 44,338,505 | | | | | |
| | | | | | | | |
| | | Shares | | | Value | |
| |
Electronic Equipment, Instruments, & Components—3.4% | |
Hoya Corp. | | | 463,576 | | | $ | 8,696,821 | |
| |
Keyence Corp. | | | 371,553 | | | | 114,146,235 | |
| |
Kyocera Corp. | | | 589,100 | | | | 54,083,080 | |
| |
Murata Manufacturing Co. Ltd. | | | 1,881,204 | | | | 142,152,051 | |
| | | | | | | | |
| | | | | | | 319,078,187 | |
| |
Internet Software & Services—5.0% | | | | | |
eBay, Inc.1 | | | 3,712,098 | | | | 201,269,954 | |
| |
Facebook, Inc., Cl. A1 | | | 2,279,870 | | | | 58,319,075 | |
| |
Google, Inc., Cl. A1 | | | 251,900 | | | | 200,016,157 | |
| | | | | | | | |
| | | | | | | 459,605,186 | |
| |
IT Services—1.1% | | | | | | | | |
Infosys Ltd. | | | 1,827,345 | | | | 97,619,307 | |
| |
Semiconductors & Semiconductor Equipment—4.5% | |
Altera Corp. | | | 4,717,207 | | | | 167,319,332 | |
| |
Maxim Integrated Products, Inc. | | | 4,874,905 | | | | 159,165,648 | |
| |
Taiwan Semiconductor Manufacturing Co. Ltd. | | | 26,242,726 | | | | 87,760,976 | |
| | | | | | | | |
| | | | | | | 414,245,956 | |
| |
Software—6.9% | | | | | | | | |
Adobe Systems, Inc.1 | | | 3,447,164 | | | | 149,986,106 | |
| |
Intuit, Inc. | | | 2,206,690 | | | | 144,869,198 | |
| |
Microsoft Corp. | | | 4,427,812 | | | | 126,679,701 | |
| |
SAP AG | | | 2,700,251 | | | | 216,332,294 | |
| | | | | | | | |
| | | | | | | 637,867,299 | |
| | | | | | | | |
| |
Materials—1.2% | | | | | | | | |
| |
Chemicals—1.0% | | | | | | | | |
Linde AG | | | 495,579 | | | | 92,144,163 | |
| |
Metals & Mining—0.2% | | | | | | | | |
Iluka Resources Ltd. | | | 1,811,148 | | | | 17,709,111 | |
| | | | | | | | |
| |
Telecommunication Services—1.4% | | | | | |
| |
Wireless Telecommunication Services—1.4% | | | | | |
KDDI Corp. | | | 3,185,600 | | | | 133,279,114 | |
| | | | | | | | |
| |
Utilities—0.5% | | | | | | | | |
| |
Electric Utilities—0.5% | | | | | | | | |
Fortum OYJ | | | 2,500,355 | | | | 50,539,695 | |
| | | | | | | | |
Total Common Stocks (Cost $5,913,414,804) | | | | | | | 9,166,383,243 | |
OPPENHEIMER GLOBAL FUND 13
| | | | |
| | STATEMENT OF INVESTMENTS Unaudited / (Continued) | | |
| | | | | | | | | | |
| | | Shares | | | Value | | | |
| | | |
Investment Company—0.2% | | | | | | | | | | |
Oppenheimer Institutional Money Market Fund, Cl. E, 0.14%2,4 | | | | | | | | | | |
(Cost $16,026,738) | | | 16,026,738 | | | $ | 16,026,738 | | | |
| | | | | | | | | | |
| | | | | | | | |
| | | | | | Value | |
| |
Total Investments, at Value | | | | | | | | |
(Cost $5,929,441,542) | | | 99.7% | | | $ | 9,182,409,981 | |
| |
Assets in Excess of Other Liabilities | | | 0.3 | | | | 30,038,196 | |
| | | | |
Net Assets | | | 100.0% | | | $ | 9,212,448,177 | |
| | | | |
Footnotes to Statement of Investments
* March 28, 2013 represents the last day of the Fund’s semiannual period. See Note 1 of the accompanying Notes.
1. Non-income producing security.
2. Is or was an affiliate, as defined in the Investment Company Act of 1940, at or during the period ended March 28, 2013, by virtue of the Fund owning at least 5% of the voting securities of the issuer or as a result of the Fund and the issuer having the same investment adviser. Transactions during the period in which the issuer was an affiliate are as follows:
| | | | | | | | | | | | | | | | |
| | | Shares
September 28,
2012a | | | Gross
Additions | | | Gross
Reductions | | | Shares
March 28,
2013 | |
| |
Oppenheimer Institutional Money Market Fund, Cl. E | | | 2,399,404 | | | | 304,520,190 | | | | 290,892,856 | | | | 16,026,738 | |
Swiss Medical SA | | | 49,975,200 | | | | — | | | | — | | | | 49,975,200 | |
| | | | |
| | | | | | | | | Value | | | Income | |
| |
Oppenheimer Institutional Money Market Fund, Cl. E | | | | | | | | | | $ | 16,026,738 | | | $ | 10,379 | |
Swiss Medical SA | | | | | | | | | | | 13,655,074 | | | | — | |
| | | | | | | | | | | | |
| | | | | | | | | | $ | 29,681,812 | | | $ | 10,379 | |
| | | | | | | | | | | | |
a. September 28, 2012 represents the last business day of the Fund’s 2012 fiscal year. See Note 1 of the accompanying Notes.
3. Restricted security. The aggregate value of restricted securities as of March 28, 2013 was $13,655,074, which represents 0.15% of the Fund’s net assets. See Note 7 of the accompanying Notes. Information concerning restricted securities is as follows:
| | | | | | | | | | | | | | | | |
| Security | | Acquisition
Dates | | | Cost | | | Value | | | Unrealized
Depreciation | |
| |
Swiss Medical SA | | | 5/16/94-8/31/11 | | | $ | 30,390,000 | | | $ | 13,655,074 | | | $ | 16,734,926 | |
4. Rate shown is the 7-day yield as of March 28, 2013.
Distribution of investments representing geographic holdings, as a percentage of total investments at value, is as follows:
| | | | | | | | | | | | | | | | |
| Geographic Holdings | | Value | | | | | | | | | Percent | | | |
|
United States | | $ | 3,634,349,879 | | | | | | | | | | 39.6% | | | |
Germany | | | 955,478,602 | | | | | | | | | | 10.4 | | | |
Japan | | | 749,795,497 | | | | | | | | | | 8.2 | | | |
France | | | 547,985,170 | | | | | | | | | | 6.0 | | | |
Sweden | | | 482,873,796 | | | | | | | | | | 5.3 | | | |
Switzerland | | | 452,261,884 | | | | | | | | | | 4.9 | | | |
Brazil | | | 376,505,775 | | | | | | | | | | 4.1 | | | |
India | | | 338,635,181 | | | | | | | | | | 3.7 | | | |
Spain | | | 333,240,857 | | | | | | | | | | 3.6 | | | |
United Kingdom | | | 308,594,259 | | | | | | | | | | 3.4 | | | |
Mexico | | | 228,251,080 | | | | | | | | | | 2.4 | | | |
Netherlands | | | 224,036,097 | | | | | | | | | | 2.4 | | | |
14 OPPENHEIMER GLOBAL FUND
Footnotes to Statement of Investments (Continued)
| | | | | | | | | | |
| Geographic Holdings (Continued) | | Value | | | Percent | | | |
|
Italy | | $ | 190,065,234 | | | | 2.1% | | | |
Denmark | | | 133,879,848 | | | | 1.5 | | | |
Taiwan | | | 87,760,976 | | | | 0.9 | | | |
Finland | | | 50,539,695 | | | | 0.5 | | | |
Russia | | | 33,498,510 | | | | 0.4 | | | |
Australia | | | 17,709,111 | | | | 0.2 | | | |
Belgium | | | 15,108,470 | | | | 0.2 | | | |
Argentina | | | 13,655,074 | | | | 0.1 | | | |
South Korea | | | 8,184,986 | | | | 0.1 | | | |
| | | |
Total | | $ | 9,182,409,981 | | | | 100.0% | | | |
| | | |
| | | | | | | | | | | | |
|
Spot Currency Exchange Contracts as of March 28, 2013 are as follows: |
| | | | | | | | | | | | | | | | | | | | | | | | |
Broker/Contract Description | | Buy/
Sell | | | Contract
Amount
(000’s) | | | Expiration
Dates | | | Value | | | Unrealized
Appreciation | | | Unrealized
Depreciation | |
| |
Barclays Capital | | | | | | | | | | | | | | | | | | | | | | | | |
Japanese Yen (JPY) | | | Sell | | | | 213,441 | JPY | | | 4/2/13 | | | $ | 2,267,390 | | | | $ – | | | | $ 713 | |
| |
Citigroup | | | | | | | | | | | | | | | | | | | | | | | | |
Japanese Yen (JPY) | | | Sell | | | | 350,963 | JPY | | | 4/1/13 | | | | 3,728,298 | | | | – | | | | 5,082 | |
| |
Deutsche Bank Securities, Inc. | | | | | | | | | | | | | | | | | | | | | | | | |
Euro (EUR) | | | Sell | | | | 7,378 | EUR | | | 4/3/13 | | | | 9,457,266 | | | | 1,623 | | | | – | |
| |
JPMorgan Chase | | | | | | | | | | | | | | | | | | | | | | | | |
Japanese Yen (JPY) | | | Sell | | | | 628,898 | JPY | | | 4/1/13 | | | | 6,680,812 | | | | – | | | | 9,942 | |
| | | | | | | | | | | | | | | | | | | | |
| | | | | | |
Total unrealized appreciation and depreciation | | | | | | | | | | | | | | | | | | | $ 1,623 | | | | $ 15,737 | |
| | | | | | | | | | | | | | | | | | | | |
See accompanying Notes to Financial Statements.
OPPENHEIMER GLOBAL FUND 15
| | | | |
| | |
| | STATEMENT OF ASSETS AND LIABILITIES March 28, 20131 Unaudited | | |
| | | | |
| |
Assets | | | | |
Investments, at value—see accompanying statement of investments: | | | | |
Unaffiliated companies (cost $5,883,024,804) | | $ | 9,152,728,169 | |
Affiliated companies (cost $46,416,738) | | | 29,681,812 | |
| | | | |
| | | 9,182,409,981 | |
| |
Cash | | | 2,039,823 | |
| |
Cash—foreign currencies (cost $6,680,812) | | | 6,680,812 | |
| |
Unrealized appreciation on foreign currency exchange contracts | | | 1,623 | |
| |
Receivables and other assets: | | | | |
Investments sold | | | 15,452,953 | |
Shares of beneficial interest sold | | | 12,673,513 | |
Dividends | | | 12,575,956 | |
Other | | | 2,363,758 | |
| | | | |
Total assets | | | 9,234,198,419 | |
|
| |
Liabilities | | | | |
Unrealized depreciation on foreign currency exchange contracts | | | 15,737 | |
| |
Payables and other liabilities: | | | | |
Shares of beneficial interest redeemed | | | 15,728,545 | |
Trustees’ compensation | | | 2,516,326 | |
Transfer and shareholder servicing agent fees | | | 1,772,845 | |
Distribution and service plan fees | | | 1,486,914 | |
Shareholder communications | | | 177,776 | |
Other | | | 52,099 | |
| | | | |
Total liabilities | | | 21,750,242 | |
|
| |
Net Assets | | $ | 9,212,448,177 | |
| | | | |
|
| |
Composition of Net Assets | | | | |
Paid-in capital | | $ | 5,827,161,792 | |
| |
Accumulated net investment income | | | 16,665,814 | |
| |
Accumulated net realized gain on investments and foreign currency transactions | | | 115,628,131 | |
| |
Net unrealized appreciation on investments and translation of assets and liabilities denominated in foreign currencies | | | 3,252,992,440 | |
| | | | |
Net Assets | | $ | 9,212,448,177 | |
| | | | |
1. March 28, 2013 represents the last business day of the Fund’s semiannual period. See Note 1 of the accompanying Notes.
16 OPPENHEIMER GLOBAL FUND
| | | | |
| |
Net Asset Value Per Share | | | | |
Class A Shares: | | | | |
Net asset value and redemption price per share (based on net assets of $7,028,272,811 and 101,744,040 shares of beneficial interest outstanding) | | $ | 69.08 | |
Maximum offering price per share (net asset value plus sales charge of 5.75% of offering price) | | $ | 73.29 | |
| |
Class B Shares: | | | | |
Net asset value, redemption price (excludes applicable contingent deferred sales charge) and offering price per share (based on net assets of $155,592,017 and 2,434,897 shares of beneficial interest outstanding) | | $ | 63.90 | |
| |
Class C Shares: | | | | |
Net asset value, redemption price (excludes applicable contingent deferred sales charge) and offering price per share (based on net assets of $626,890,085 and 9,670,930 shares of beneficial interest outstanding) | | $ | 64.82 | |
| |
Class I Shares: | | | | |
Net asset value, redemption price and offering price per share (based on net assets of $46,577,599 and 673,158 shares of beneficial interest outstanding) | | $ | 69.19 | |
| |
Class N Shares: | | | | |
Net asset value, redemption price (excludes applicable contingent deferred sales charge) and offering price per share (based on net assets of $201,622,368 and 2,929,922 shares of beneficial interest outstanding) | | $ | 68.81 | |
| |
Class Y Shares: | | | | |
Net asset value, redemption price and offering price per share (based on net assets of $1,153,493,297 and 16,677,303 shares of beneficial interest outstanding) | | $ | 69.17 | |
See accompanying Notes to Financial Statements.
OPPENHEIMER GLOBAL FUND 17
| | | | |
| | |
| | STATEMENTOF OPERATIONS For the Six Months Ended March 28, 20131 Unaudited | | |
| | | | | | |
| |
Investment Income | | | | | | |
Dividends: | | | | | | |
Unaffiliated companies (net of foreign withholding taxes of $4,670,522) | | | | $ | 72,791,350 | |
Affiliated companies | | | | | 10,379 | |
| |
Interest | | | | | 1,922 | |
| | | | | | |
Total investment income | | | | | 72,803,651 | |
|
| |
Expenses | | | | | | |
Management fees | | | | | 28,652,599 | |
| |
Distribution and service plan fees: | | | | | | |
Class A | | | | | 7,814,387 | |
Class B | | | | | 776,267 | |
Class C | | | | | 2,944,738 | |
Class N | | | | | 473,731 | |
| |
Transfer and shareholder servicing agent fees: | | | | | | |
Class A | | | | | 8,974,783 | |
Class B | | | | | 371,489 | |
Class C | | | | | 632,323 | |
Class I | | | | | 4,353 | |
Class N | | | | | 344,138 | |
Class Y | | | | | 1,176,753 | |
| |
Shareholder communications: | | | | | | |
Class A | | | | | 155,541 | |
Class B | | | | | 25,817 | |
Class C | | | | | 24,602 | |
Class I | | | | | 85 | |
Class N | | | | | 4,502 | |
Class Y | | | | | 10,617 | |
| |
Custodian fees and expenses | | | | | 500,455 | |
| |
Trustees’ compensation | | | | | 210,194 | |
| |
Other | | | | | 217,531 | |
| | | | | | |
Total expenses | | | | | 53,314,905 | |
Less waivers and reimbursements of expenses | | | | | (105,709) | |
| | | | | | |
Net expenses | | | | | 53,209,196 | |
| | |
| | | | | | |
Net Investment Income | | | | | 19,594,455 | |
1. March 28, 2013 represents the last day of the Funds semiannual period. See Note 1 of the accompanying Notes.
18 OPPENHEIMER GLOBAL FUND
| | | | |
| | |
| | STATEMENT OF OPERATIONS Unaudited / (Continued) | | |
| | | | |
| |
Realized and Unrealized Gain (Loss) | | | | |
Net realized gain on: | | | | |
Investments from unaffiliated companies | | $ | 189,334,890 | |
Foreign currency transactions | | | 102,329 | |
| | | | |
Net realized gain | | | 189,437,219 | |
| |
Net change in unrealized appreciation/depreciation on: | | | | |
Investments | | | 1,148,318,296 | |
Translation of assets and liabilities denominated in foreign currencies | | | (142,050,095) | |
| | | | |
Net change in unrealized appreciation/depreciation | | | 1,006,268,201 | |
|
| |
Net Increase in Net Assets Resulting from Operations | | $ | 1,215,299,875 | |
| | | | |
See accompanying Notes to Financial Statements.
OPPENHEIMER GLOBAL FUND 19
| | | | |
| | |
| | STATEMENTSOF CHANGES IN NET ASSETS | | |
| | | | | | | | |
| | | Six Months Ended
March 28, 20131
(Unaudited) | | | Year Ended
September 28,
20121 | |
| |
Operations | | | | | | | | |
Net investment income | | $ | 19,594,455 | | | $ | 78,304,116 | |
| |
Net realized gain | | | 189,437,219 | | | | 24,195,058 | |
| |
Net change in unrealized appreciation/depreciation | | | 1,006,268,201 | | | | 1,401,165,559 | |
| | | | | | | | |
Net increase in net assets resulting from operations | | | 1,215,299,875 | | | | 1,503,664,733 | |
|
| |
Dividends and/or Distributions to Shareholders | | | | | | | | |
Dividends from net investment income: | | | | | | | | |
Class A | | | (65,741,979) | | | | (122,995,858) | |
Class B | | | (222,097) | | | | (1,672,837) | |
Class C | | | (2,344,820) | | | | (6,946,078) | |
Class I | | | (200,784) | | | | — | |
Class N | | | (1,214,430) | | | | (3,060,177) | |
Class Y | | | (13,359,955) | | | | (16,463,572) | |
| | | | |
| | | (83,084,065) | | | | (151,138,522) | |
|
| |
Distributions from net realized gain: | | | | | | | | |
Class A | | | (10,891,818) | | | | (1,821,891) | |
Class B | | | (281,578) | | | | (60,157) | |
Class C | | | (1,038,462) | | | | (179,662) | |
Class I | | | (22,007) | | | | — | |
Class N | | | (316,746) | | | | (56,805) | |
Class Y | | | (1,678,281) | | | | (209,646) | |
| | | | |
| | | (14,228,892) | | | | (2,328,161) | |
|
| |
Beneficial Interest Transactions | | | | | | | | |
Net increase (decrease) in net assets resulting from beneficial interest transactions: | | | | | | | | |
Class A | | | (339,930,281) | | | | (724,764,047) | |
Class B | | | (29,053,799) | | | | (64,989,113) | |
Class C | | | (31,646,064) | | | | (97,381,209) | |
Class I | | | 30,367,418 | | | | 12,235,015 | |
Class N | | | (16,100,836) | | | | (31,489,738) | |
Class Y | | | 44,165,014 | | | | 155,906,635 | |
| | | | | | | | |
| | | (342,198,548) | | | | (750,482,457) | |
|
| |
Net Assets | | | | | | | | |
Total increase | | | 755,788,370 | | | | 599,715,593 | |
| |
Beginning of period | | | 8,436,659,807 | | | | 7,836,944,214 | |
| | | | | | | | |
| | |
End of period (including accumulated net investment income of $16,665,814 and $80,155,424, respectively) | | $ | 9,212,448,177 | | | $ | 8,436,659,807 | |
| | | | |
1. March 28, 2012 and September 28, 2012 represents the last business day of the Fund’s respective reporting periods. See Note 1 of the accompanying Notes.
See accompanying Notes to Financial Statements.
20 OPPENHEIMER GLOBAL FUND
| | | | | | | | | | | | | | | | | | | | | | | | |
| Class A | | Six Months
Ended March 28,
20131
(Unaudited) | | | Year Ended
September 28,
20121 | | | Year Ended
September 30,
2011 | | | Year Ended
September 30,
2010 | | | Year Ended
September 30,
2009 | | | Year Ended
September 30,
2008 �� | |
| |
Per Share Operating Data | | | | | | | | | | | | | | | | | | | | | | | | |
Net asset value, beginning of period | | $ | 60.82 | | | $ | 51.78 | | | $ | 56.31 | | | $ | 50.85 | | | $ | 54.88 | | | $ | 81.53 | |
| |
Income (loss) from investment operations: | | | | | | | | | | | | | | | | | | | | | | | | |
Net investment income2 | | | 0.16 | | | | 0.56 | | | | 1.06 | | | | 0.41 | | | | 0.43 | | | | 0.83 | |
Net realized and unrealized gain (loss) | | | 8.82 | | | | 9.56 | | | | (4.66) | | | | 5.33 | | | | (0.44) | | | | (22.19) | |
| | | | |
Total from investment operations | | | 8.98 | | | | 10.12 | | | | (3.60) | | | | 5.74 | | | | (0.01) | | | | (21.36) | |
| |
Dividends and/or distributions to shareholders: | | | | | | | | | | | | | | | | | | | | | | | | |
Dividends from net investment income | | | (0.63) | | | | (1.06) | | | | (0.50) | | | | (0.28) | | | | (0.93) | | | | (0.68) | |
Distributions from net realized gain | | | (0.10) | | | | (0.02) | | | | (0.43) | | | | 0.00 | | | | (3.09) | | | | (4.61) | |
| | | | |
Total dividends and/or distributions to shareholders | | | (0.73) | | | | (1.08) | | | | (0.93) | | | | (0.28) | | | | (4.02) | | | | (5.29) | |
| |
Net asset value, end of period | | $ | 69.07 | | | $ | 60.82 | | | $ | 51.78 | | | $ | 56.31 | | | $ | 50.85 | | | $ | 54.88 | |
| | | | |
| |
Total Return, at Net Asset Value3 | | | 14.89% | | | | 19.80% | | | | (6.59)% | | | | 11.32% | | | | 3.58% | | | | (27.90)% | |
| |
Ratios/Supplemental Data | | | | | | | | | | | | | | | | | | | | | | | | |
Net assets, end of period (in thousands) | | $ | 7,028,273 | | | $ | 6,509,607 | | | $ | 6,181,685 | | | $ | 7,282,538 | | | $ | 7,191,702 | | | $ | 8,663,347 | |
| |
Average net assets (in thousands) | | $ | 6,774,934 | | | $ | 6,551,108 | | | $ | 7,646,696 | | | $ | 7,229,903 | | | $ | 6,099,806 | | | $ | 11,573,269 | |
| |
Ratios to average net assets:4 | | | | | | | | | | | | | | | | | | | | | | | | |
Net investment income | | | 0.48% | | | | 0.99% | | | | 1.74% | | | | 0.78% | | | | 1.05% | | | | 1.22% | |
Total expenses5 | | | 1.17% | | | | 1.22% | | | | 1.16% | | | | 1.20% | | | | 1.27% | | | | 1.09% | |
Expenses after payments, waivers and/or reimbursements and reduction to custodian expenses | | | 1.17% | | | | 1.22% | | | | 1.16% | | | | 1.20% | | | | 1.26% | | | | 1.09% | |
| |
Portfolio turnover rate | | | 5% | | | | 12% | | | | 13% | | | | 13% | | | | 8% | | | | 10% | |
OPPENHEIMER GLOBAL FUND 21
| | | | |
| | |
| | FINANCIAL HIGHLIGHTS (Continued) | | |
1. March 28, 2013 and September 28, 2012 represents the last business day of the Fund’s respective reporting periods. See Note 1 of the accompanying Notes.
2. Per share amounts calculated based on the average shares outstanding during the period.
3. Assumes an initial investment on the business day before the first day of the fiscal period, with all dividends and distributions reinvested in additional shares on the reinvestment date, and redemption at the net asset value calculated on the last business day of the fiscal period. Sales charges are not reflected in the total returns. Total returns are not annualized for periods less than one full year. Returns do not reflect the deduction of taxes that a shareholder would pay on fund distributions or the redemption of fund shares.
4. Annualized for periods less than one full year.
5. Total expenses including indirect expenses from affiliated fund were as follows:
| | | | |
Six Months Ended March 28, 2013 | | | 1.17 | % |
Year Ended September 28, 2012 | | | 1.22 | % |
Year Ended September 30, 2011 | | | 1.16 | % |
Year Ended September 30, 2010 | | | 1.20 | % |
Year Ended September 30, 2009 | | | 1.27 | % |
Year Ended September 30, 2008 | | | 1.09 | % |
See accompanying Notes to Financial Statements.
22 OPPENHEIMER GLOBAL FUND
| | | | | | | | | | | | | | | | | | | | | | | | |
| Class B | | Six Months
Ended
March 28,
20131
(Unaudited) | | | Year Ended
September 28,
20121 | | | Year Ended
September 30,
2011 | | | Year Ended
September 30,
2010 | | | Year Ended
September 30,
2009 | | | Year Ended
September 30,
2008 | |
| |
Per Share Operating Data | | | | | | | | | | | | | | | | | | | | | | | | |
Net asset value, beginning of period | | $ | 56.03 | | | $ | 47.59 | | | $ | 51.82 | | | $ | 46.96 | | | $ | 50.67 | | | $ | 75.58 | |
| |
Income (loss) from investment operations: | | | | | | | | | | | | | | | | | | | | | | | | |
Net investment income (loss)2 | | | (0.12) | | | | 0.06 | | | | 0.44 | | | | (0.06) | | | | 0.08 | | | | 0.23 | |
Net realized and unrealized gain (loss) | | | 8.16 | | | | 8.84 | | | | (4.24) | | | | 4.92 | | | | (0.35) | | | | (20.52) | |
| | | | |
Total from investment operations | | | 8.04 | | | | 8.90 | | | | (3.80) | | | | 4.86 | | | | (0.27) | | | | (20.29) | |
| |
Dividends and/or distributions to shareholders: | | | | | | | | | | | | | | | | | | | | | | | | |
Dividends from net investment income | | | (0.08) | | | | (0.44) | | | | 0.00 | | | | 0.00 | | | | (0.35) | | | | (0.01) | |
Distributions from net realized gain | | | (0.10) | | | | (0.02) | | | | (0.43) | | | | 0.00 | | | | (3.09) | | | | (4.61) | |
| | | | |
Total dividends and/or distributions to shareholders | | | (0.18) | | | | (0.46) | | | | (0.43) | | | | 0.00 | | | | (3.44) | | | | (4.62) | |
| |
Net asset value, end of period | | $ | 63.89 | | | $ | 56.03 | | | $ | 47.59 | | | $ | 51.82 | | | $ | 46.96 | | | $ | 50.67 | |
| | | | |
| |
Total Return, at Net Asset Value3 | | | 14.40% | | | | 18.81% | | | | (7.44)% | | | | 10.35% | | | | 2.74% | | | | (28.47)% | |
| |
Ratios/Supplemental Data | | | | | | | | | | | | | | | | | | | | | | | | |
Net assets, end of period (in thousands) | | $ | 155,592 | | | $ | 163,538 | | | $ | 197,530 | | | $ | 308,804 | | | $ | 397,381 | | | $ | 559,138 | |
| |
Average net assets (in thousands) | | $ | 159,210 | | | $ | 182,874 | | | $ | 282,805 | | | $ | 344,445 | | | $ | 364,488 | | | $ | 856,275 | |
| |
Ratios to average net assets:4 | | | | | | | | | | | | | | | | | | | | | | | | |
Net investment income (loss) | | | (0.39)% | | | | 0.11% | | | | 0.77% | | | | (0.12)% | | | | 0.22% | | | | 0.37% | |
Total expenses5 | | | 2.15% | | | | 2.24% | | | | 2.20% | | | | 2.23% | | | | 2.28% | | | | 1.88% | |
Expenses after payments, waivers and/or reimbursements and reduction to custodian expenses | | | 2.03% | | | | 2.07% | | | | 2.07% | | | | 2.07% | | | | 2.08% | | | | 1.88% | |
| |
Portfolio turnover rate | | | 5% | | | | 12% | | | | 13% | | | | 13% | | | | 8% | | | | 10% | |
OPPENHEIMER GLOBAL FUND 23
| | | | |
| | |
| | FINANCIAL HIGHLIGHTS (Continued) | | |
1. March 28, 2013 and September 28, 2012 represents the last business day of the Fund’s respective reporting periods. See Note 1 of the accompanying Notes.
2. Per share amounts calculated based on the average shares outstanding during the period.
3. Assumes an initial investment on the business day before the first day of the fiscal period, with all dividends and distributions reinvested in additional shares on the reinvestment date, and redemption at the net asset value calculated on the last business day of the fiscal period. Sales charges are not reflected in the total returns. Total returns are not annualized for periods less than one full year. Returns do not reflect the deduction of taxes that a shareholder would pay on fund distributions or the redemption of fund shares.
4. Annualized for periods less than one full year.
5. Total expenses including indirect expenses from affiliated fund were as follows:
| | | | |
Six Months Ended March 28, 2013 | | | 2.15 | % |
Year Ended September 28, 2012 | | | 2.24 | % |
Year Ended September 30, 2011 | | | 2.20 | % |
Year Ended September 30, 2010 | | | 2.23 | % |
Year Ended September 30, 2009 | | | 2.28 | % |
Year Ended September 30, 2008 | | | 1.88 | % |
See accompanying Notes to Financial Statements.
24 OPPENHEIMER GLOBAL FUND
| | | | | | | | | | | | | | | | | | | | | | | | |
| Class C | | Six Months
Ended
March 28,
20131
(Unaudited) | | | Year Ended
September 28,
20121 | | | Year Ended
September 30,
2011 | | | Year Ended
September 30,
2010 | | | Year Ended
September 30,
2009 | | | Year Ended
September 30,
2008 | |
| |
Per Share Operating Data | | | | | | | | | | | | | | | | | | | | | | | | |
Net asset value, beginning of period | | $ | 56.93 | | | $ | 48.46 | | | $ | 52.78 | | | $ | 47.76 | | | $ | 51.57 | | | $ | 76.93 | |
| |
Income (loss) from investment operations: | | | | | | | | | | | | | | | | | | | | | | | | |
Net investment income (loss)2 | | | (0.06) | | | | 0.14 | | | | 0.56 | | | | 0.01 | | | | 0.11 | | | | 0.30 | |
Net realized and unrealized gain (loss) | | | 8.28 | | | | 8.96 | | | | (4.34) | | | | 5.01 | | | | (0.38) | | | | (20.92) | |
| | | | |
Total from investment operations | | | 8.22 | | | | 9.10 | | | | (3.78) | | | | 5.02 | | | | (0.27) | | | | (20.62) | |
| |
Dividends and/or distributions to shareholders: | | | | | | | | | | | | | | | | | | | | | | | | |
Dividends from net investment income | | | (0.24) | | | | (0.61) | | | | (0.11) | | | | 0.00 | | | | (0.45) | | | | (0.13) | |
Distributions from net realized gain | | | (0.10) | | | | (0.02) | | | | (0.43) | | | | 0.00 | | | | (3.09) | | | | (4.61) | |
| | | | |
Total dividends and/or distributions to shareholders | | | (0.34) | | | | (0.63) | | | | (0.54) | | | | 0.00 | | | | (3.54) | | | | (4.74) | |
| |
Net asset value, end of period | | $ | 64.81 | | | $ | 56.93 | | | $ | 48.46 | | | $ | 52.78 | | | $ | 47.76 | | | $ | 51.57 | |
| | | | |
| |
Total Return, at Net Asset Value3 | | | 14.49% | | | | 18.93% | | | | (7.30)% | | | | 10.51% | | | | 2.78% | | | | (28.44)% | |
| |
Ratios/Supplemental Data | | | | | | | | | | | | | | | | | | | | | | | | |
Net assets, end of period (in thousands) | | $ | 626,890 | | | $ | 580,390 | | | $ | 581,865 | | | $ | 712,439 | | | $ | 735,502 | | | $ | 928,311 | |
| |
Average net assets (in thousands) | | $ | 604,724 | | | $ | 591,634 | | | $ | 735,113 | | | $ | 721,680 | | | $ | 637,892 | | | $ | 1,273,124 | |
| |
Ratios to average net assets:4 | | | | | | | | | | | | | | | | | | | | | | | | |
Net investment income (loss) | | | (0.21)% | | | | 0.26% | | | | 0.98% | | | | 0.02% | | | | 0.28% | | | | 0.47% | |
Total expenses5 | | | 1.87% | | | | 1.94% | | | | 1.91% | | | | 1.95% | | | | 2.04% | | | | 1.83% | |
Expenses after payments, waivers and/or reimbursements and reduction to custodian expenses | | | 1.87% | | | | 1.94% | | | | 1.91% | | | | 1.95% | | | | 2.03% | | | | 1.83% | |
| |
Portfolio turnover rate | | | 5% | | | | 12% | | | | 13% | | | | 13% | | | | 8% | | | | 10% | |
OPPENHEIMER GLOBAL FUND 25
| | | | |
| | |
| | FINANCIAL HIGHLIGHTS (Continued) | | |
1. March 28, 2013 and September 28, 2012 represents the last business day of the Fund’s respective reporting periods. See Note 1 of the accompanying Notes.
2. Per share amounts calculated based on the average shares outstanding during the period.
3. Assumes an initial investment on the business day before the first day of the fiscal period, with all dividends and distributions reinvested in additional shares on the reinvestment date, and redemption at the net asset value calculated on the last business day of the fiscal period. Sales charges are not reflected in the total returns. Total returns are not annualized for periods less than one full year. Returns do not reflect the deduction of taxes that a shareholder would pay on fund distributions or the redemption of fund shares.
4. Annualized for periods less than one full year.
5. Total expenses including indirect expenses from affiliated fund were as follows:
| | | | |
Six Months Ended March 28, 2013 | | | 1.87 | % |
Year Ended September 28, 2012 | | | 1.94 | % |
Year Ended September 30, 2011 | | | 1.91 | % |
Year Ended September 30, 2010 | | | 1.95 | % |
Year Ended September 30, 2009 | | | 2.04 | % |
Year Ended September 30, 2008 | | | 1.83 | % |
See accompanying Notes to Financial Statements.
26 OPPENHEIMER GLOBAL FUND
| | | | | | | | |
| Class I | | Six Months
Ended
March 28,
20131
(Unaudited) | | | Period Ended
September 28,
20121,2 | |
| |
Per Share Operating Data | | | | | | | | |
Net asset value, beginning of period | | $ | 61.08 | | | $ | 57.08 | |
| |
Income (loss) from investment operations: | | | | | | | | |
Net investment income3 | | | 0.31 | | | | 0.53 | |
Net realized and unrealized gain | | | 8.86 | | | | 3.47 | |
| | | | |
Total from investment operations | | | 9.17 | | | | 4.00 | |
| |
Dividends and/or distributions to shareholders: | | | | | | | | |
Dividends from net investment income | | | (0.96) | | | | 0.00 | |
Distributions from net realized gain | | | (0.10) | | | | 0.00 | |
| | | | |
Total dividends and/or distributions to shareholders | | | (1.06) | | | | 0.00 | |
| |
Net asset value, end of period | | $ | 69.19 | | | $ | 61.08 | |
| | | | |
| |
Total Return, at Net Asset Value4 | | | 15.18% | | | | 7.01% | |
| |
Ratios/Supplemental Data | | | | | | | | |
Net assets, end of period (in thousands) | | $ | 46,578 | | | $ | 12,762 | |
| |
Average net assets (in thousands) | | $ | 30,367 | | | $ | 6,763 | |
| |
Ratios to average net assets:5 | | | | | | | | |
Net investment income | | | 0.93% | | | | 1.37% | |
Total expenses6 | | | 0.70% | | | | 0.73% | |
Expenses after payments, waivers and/or reimbursements and reduction to custodian expenses | | | 0.70% | | | | 0.73% | |
| |
Portfolio turnover rate | | | 5% | | | | 12% | |
OPPENHEIMER GLOBAL FUND 27
| | | | |
| | |
| | FINANCIAL HIGHLIGHTS (Continued) | | |
1. March 28, 2013 and September 28, 2012 represents the last business day of the Fund’s respective reporting periods. See Note 1 of the accompanying Notes.
2. For the period from January 27, 2012 (inception of offering) to September 28, 2012.
3. Per share amounts calculated based on the average shares outstanding during the period.
4. Assumes an initial investment on the business day before the first day of the fiscal period, with all dividends and distributions reinvested in additional shares on the reinvestment date, and redemption at the net asset value calculated on the last business day of the fiscal period. Sales charges are not reflected in the total returns. Total returns are not annualized for periods less than one full year. Returns do not reflect the deduction of taxes that a shareholder would pay on fund distributions or the redemption of fund shares.
5. Annualized for periods less than one full year.
6. Total expenses including indirect expenses from affiliated fund were as follows:
| | | | |
Six Months Ended March 28, 2013 | | | 0.70 | % |
Period Ended September 28, 2012 | | | 0.73 | % |
See accompanying Notes to Financial Statements.
28 OPPENHEIMER GLOBAL FUND
| | | | | | | | | | | | | | | | | | | | | | | | |
| Class N | | Six Months
Ended
March 28,
20131
(Unaudited) | | | Year Ended
September 28,
20121 | | | Year Ended
September 30,
2011 | | | Year Ended
September 30,
2010 | | | Year Ended
September 30,
2009 | | | Year Ended
September 30,
2008 | |
| |
Per Share Operating Data | | | | | | | | | | | | | | | | | | | | | | | | |
Net asset value, beginning of period | | $ | 60.47 | | | $ | 51.46 | | | $ | 55.96 | | | $ | 50.57 | | | $ | 54.39 | | | $ | 80.81 | |
| |
Income (loss) from investment operations: | | | | | | | | | | | | | | | | | | | | | | | | |
Net investment income2 | | | 0.05 | | | | 0.38 | | | | 0.85 | | | | 0.27 | | | | 0.30 | | | | 0.55 | |
Net realized and unrealized gain (loss) | | | 8.78 | | | | 9.49 | | | | (4.63) | | | | 5.30 | | | | (0.36) | | | | (22.02) | |
| | | | |
Total from investment operations | | | 8.83 | | | | 9.87 | | | | (3.78) | | | | 5.57 | | | | (0.06) | | | | (21.47) | |
| |
Dividends and/or distributions to shareholders: | | | | | | | | | | | | | | | | | | | | | | | | |
Dividends from net investment income | | | (0.40) | | | | (0.84) | | | | (0.29) | | | | (0.18) | | | | (0.67) | | | | (0.34) | |
Distributions from net realized gain | | | (0.10) | | | | (0.02) | | | | (0.43) | | | | 0.00 | | | | (3.09) | | | | (4.61) | |
| | | | |
Total dividends and/or distributions to shareholders | | | (0.50) | | | | (0.86) | | | | (0.72) | | | | (0.18) | | | | (3.76) | | | | (4.95) | |
| |
Net asset value, end of period | | $ | 68.80 | | | $ | 60.47 | | | $ | 51.46 | | | $ | 55.96 | | | $ | 50.57 | | | $ | 54.39 | |
| | | | |
| |
Total Return, at Net Asset Value3 | | | 14.71% | | | | 19.40% | | | | (6.91)% | | | | 11.04% | | | | 3.26% | | | | (28.18)% | |
| |
Ratios/Supplemental Data | | | | | | | | | | | | | | | | | | | | | | | | |
Net assets, end of period (in thousands) | | $ | 201,622 | | | $ | 192,647 | | | $ | 192,212 | | | $ | 228,375 | | | $ | 227,912 | | | $ | 269,219 | |
| |
Average net assets (in thousands) | | $ | 195,275 | | | $ | 203,213 | | | $ | 237,342 | | | $ | 226,536 | | | $ | 190,548 | | | $ | 379,408 | |
| |
Ratios to average net assets:4 | | | | | | | | | | | | | | | | | | | | | | | | |
Net investment income | | | 0.14% | | | | 0.67% | | | | 1.39% | | | | 0.51% | | | | 0.75% | | | | 0.82% | |
Total expenses5 | | | 1.52% | | | | 1.55% | | | | 1.50% | | | | 1.47% | | | | 1.88% | | | | 1.50% | |
Expenses after payments, waivers and/or reimbursements and reduction to custodian expenses | | | 1.51% | | | | 1.55% | | | | 1.50% | | | | 1.47% | | | | 1.55% | | | | 1.49% | |
| |
Portfolio turnover rate | | | 5% | | | | 12% | | | | 13% | | | | 13% | | | | 8% | | | | 10% | |
OPPENHEIMER GLOBAL FUND 29
| | | | |
| | |
| | FINANCIAL HIGHLIGHTS (Continued) | | |
1. March 28, 2013 and September 28, 2012 represents the last business day of the Fund’s respective reporting periods. See Note 1 of the accompanying Notes.
2. Per share amounts calculated based on the average shares outstanding during the period.
3. Assumes an initial investment on the business day before the first day of the fiscal period, with all dividends and distributions reinvested in additional shares on the reinvestment date, and redemption at the net asset value calculated on the last business day of the fiscal period. Sales charges are not reflected in the total returns. Total returns are not annualized for periods less than one full year. Returns do not reflect the deduction of taxes that a shareholder would pay on fund distributions or the redemption of fund shares.
4. Annualized for periods less than one full year.
5. Total expenses including indirect expenses from affiliated fund were as follows:
| | | | |
Six Months Ended March 28, 2013 | | | 1.52 | % |
Year Ended September 28, 2012 | | | 1.55 | % |
Year Ended September 30, 2011 | | | 1.50 | % |
Year Ended September 30, 2010 | | | 1.47 | % |
Year Ended September 30, 2009 | | | 1.88 | % |
Year Ended September 30, 2008 | | | 1.50 | % |
See accompanying Notes to Financial Statements.
30 OPPENHEIMER GLOBAL FUND
| | | | | | | | | | | | | | | | | | | | | | | | |
| Class Y | | Six Months
Ended
March 28,
20131
(Unaudited) | | | Year Ended
September 28,
20121 | | | Year Ended
September 30,
2011 | | | Year Ended
September 30,
2010 | | | Year Ended
September 30,
2009 | | | Year Ended
September 30,
2008 | |
| |
Per Share Operating Data | | | | | | | | | | | | | | | | | | | | | | | | |
Net asset value, beginning of period | | $ | 61.00 | | | $ | 51.95 | | | $ | 56.52 | | | $ | 51.02 | | | $ | 55.25 | | | $ | 82.04 | |
| |
Income (loss) from investment operations: | | | | | | | | | | | | | | | | | | | | | | | | |
Net investment income2 | | | 0.25 | | | | 0.72 | | | | 1.26 | | | | 0.66 | | | | 0.61 | | | | 1.13 | |
Net realized and unrealized gain (loss) | | | 8.84 | | | | 9.58 | | | | (4.72) | | | | 5.29 | | | | (0.53) | | | | (22.34) | |
| | | | |
Total from investment operations | | | 9.09 | | | | 10.30 | | | | (3.46) | | | | 5.95 | | | | 0.08 | | | | (21.21) | |
| |
Dividends and/or distributions to shareholders: | | | | | | | | | | | | | | | | | | | | | | | | |
Dividends from net investment income | | | (0.83) | | | | (1.23) | | | | (0.68) | | | | (0.45) | | | | (1.22) | | | | (0.97) | |
Distributions from net realized gain | | | (0.10) | | | | (0.02) | | | | (0.43) | | | | 0.00 | | | | (3.09) | | | | (4.61) | |
| | | | |
Total dividends and/or distributions to shareholders | | | (0.93) | | | | (1.25) | | | | (1.11) | | | | (0.45) | | | | (4.31) | | | | (5.58) | |
| |
Net asset value, end of period | | $ | 69.16 | | | $ | 61.00 | | | $ | 51.95 | | | $ | 56 .52 | | | $ | 51.02 | | | $ | 55.25 | |
| | | | |
| |
Total Return, at Net Asset Value3 | | | 15.06% | | | | 20.15% | | | | (6.36)% | | | | 11.72% | | | | 4.02% | | | | (27.61)% | |
| |
Ratios/Supplemental Data | | | | | | | | | | | | | | | | | | | | | | | | |
Net assets, end of period (in thousands) | | $ | 1,153,493 | | | $ | 977,716 | | | $ | 683,652 | | | $ | 577,600 | | | $ | 845,597 | | | $ | 788,833 | |
| |
Average net assets (in thousands) | | $ | 1,055,864 | | | $ | 839,762 | | | $ | 713,559 | | | $ | 788,663 | | | $ | 714,502 | | | $ | 975,493 | |
| |
Ratios to average net assets:4 | | | | | | | | | | | | | | | | | | | | | | | | |
Net investment income | | | 0.76% | | | | 1.26% | | | | 2.07% | | | | 1.24% | | | | 1.50% | | | | 1.65% | |
Total expenses5 | | | 0.90% | | | | 0.93% | | | | 0.92% | | | | 0.83% | | | | 0.85% | | | | 0.70% | |
Expenses after payments, waivers and/or reimbursements and reduction to custodian expenses | | | 0.90% | | | | 0.93% | | | | 0.90% | | | | 0.83% | | | | 0.85% | | | | 0.70% | |
| |
Portfolio turnover rate | | | 5% | | | | 12% | | | | 13% | | | | 13% | | | | 8% | | | | 10% | |
OPPENHEIMER GLOBAL FUND 31
| | | | |
| | |
| | FINANCIAL HIGHLIGHTS (Continued) | | |
1. March 28, 2013 and September 28, 2012 represents the last business day of the Fund’s respective reporting periods. See Note 1 of the accompanying Notes.
2. Per share amounts calculated based on the average shares outstanding during the period.
3. Assumes an initial investment on the business day before the first day of the fiscal period, with all dividends and distributions reinvested in additional shares on the reinvestment date, and redemption at the net asset value calculated on the last business day of the fiscal period. Sales charges are not reflected in the total returns. Total returns are not annualized for periods less than one full year. Returns do not reflect the deduction of taxes that a shareholder would pay on fund distributions or the redemption of fund shares.
4. Annualized for periods less than one full year.
5. Total expenses including indirect expenses from affiliated fund were as follows:
| | | | |
Six Months Ended March 28, 2013 | | | 0.90 | % |
Year Ended September 28, 2012 | | | 0.93 | % |
Year Ended September 30, 2011 | | | 0.92 | % |
Year Ended September 30, 2010 | | | 0.83 | % |
Year Ended September 30, 2009 | | | 0.85 | % |
Year Ended September 30, 2008 | | | 0.70 | % |
See accompanying Notes to Financial Statements.
32 OPPENHEIMER GLOBAL FUND
| | | | |
| | |
| | NOTESTO FINANCIAL STATEMENTS | | |
1. Significant Accounting Policies
Oppenheimer Global Fund (the “Fund”) is registered under the Investment Company Act of 1940, as amended, as an open-end management investment company. The Fund’s investment objective is to seek capital appreciation. The Fund’s investment adviser was OppenheimerFunds, Inc. (“OFI” or the “Sub-Adviser”) through December 31, 2012. Effective January 1, 2013, the Fund’s investment adviser is OFI Global Asset Management, Inc. (“OFI Global” or the “Manager”), a wholly-owned subsidiary of OFI. The Manager has entered into a sub-advisory agreement with OFI, as of the same effective date.
The Fund offers Class A, Class C, Class I, Class N and Class Y shares, and previously offered Class B shares for new purchase through June 29, 2012. Subsequent to that date, no new purchases of Class B shares are permitted, however reinvestment of dividend and/or capital gain distributions and exchanges of Class B shares into and from other Oppenheimer funds will be allowed. Class A shares are sold at their offering price, which is normally net asset value plus a front-end sales charge. Class C and Class N shares are sold, and Class B shares were sold, without a front-end sales charge but may be subject to a contingent deferred sales charge (“CDSC”). Class N shares are sold only through retirement plans. Retirement plans that offer Class N shares may impose charges on those accounts. Class I and Class Y shares are sold to certain institutional investors or intermediaries without either a front-end sales charge or a CDSC, however, the intermediaries may impose charges on their accountholders who beneficially own Class I and Class Y shares. All classes of shares have identical rights and voting privileges with respect to the Fund in general and exclusive voting rights on matters that affect that class alone. Earnings, net assets and net asset value per share may differ due to each class having its own expenses, such as transfer and shareholder servicing agent fees and shareholder communications, directly attributable to that class. Class A, B, C and N shares have separate distribution and/or service plans under which they pay fees. Class I and Class Y shares do not pay such fees. Class B shares will automatically convert to Class A shares 72 months after the date of purchase.
The following is a summary of significant accounting policies consistently followed by the Fund.
Semiannual and Annual Periods. The last day of the Fund’s semiannual period was the last day the New York Stock Exchange was open for trading. The Fund’s financial statements have been presented through that date to maintain consistency with the Fund’s net asset value calculations used for shareholder transactions.
The last day of the Fund’s fiscal year was the last day the New York Stock Exchange was open for trading. The Fund’s financial statements have been presented through that date to maintain consistency with the Fund’s net asset value calculations used for shareholder transactions.
Investment in Oppenheimer Institutional Money Market Fund. The Fund is permitted to invest daily available cash balances in an affiliated money market fund. The Fund may invest the available cash in Class E shares of Oppenheimer Institutional Money Market Fund (“IMMF”) to seek current income while preserving liquidity. IMMF is a registered open-end management investment company, regulated as a money market fund under the Investment
OPPENHEIMER GLOBAL FUND 33
| | | | |
| | |
| | NOTES TO FINANCIAL STATEMENTS Unaudited / (Continued) | | |
| | | | |
| | 1. Significant Accounting Policies (Continued) | | |
Company Act of 1940, as amended. The Manager is the investment adviser of IMMF, and the Sub-Adviser provides investment and related advisory services to IMMF. When applicable, the Fund’s investment in IMMF is included in the Statement of Investments. Shares of IMMF are valued at their net asset value per share. As a shareholder, the Fund is subject to its proportional share of IMMF’s Class E expenses, including its management fee. The Manager will waive fees and/or reimburse Fund expenses in an amount equal to the indirect management fees incurred through the Fund’s investment in IMMF.
Foreign Currency Translation. The Fund’s accounting records are maintained in U.S. dollars. The values of securities denominated in foreign currencies and amounts related to the purchase and sale of foreign securities and foreign investment income are translated into U.S. dollars as of the close of the Exchange, normally 4:00 P.M. Eastern time, on each day the Exchange is open for trading. Foreign exchange rates may be valued primarily using a reliable bank, dealer or service authorized by the Board of Trustees.
Reported net realized gains and losses from foreign currency transactions arise from sales of portfolio securities, sales and maturities of short-term securities, sales of foreign currencies, exchange rate fluctuations between the trade and settlement dates on securities transactions, and the difference between the amounts of dividends, interest, and foreign withholding taxes recorded on the Fund’s books and the U.S. dollar equivalent of the amounts actually received or paid. Net unrealized appreciation and depreciation on the translation of assets and liabilities denominated in foreign currencies arise from changes in the values of assets and liabilities, including investments in securities at fiscal period end, resulting from changes in exchange rates.
The effect of changes in foreign currency exchange rates on investments is separately identified from the fluctuations arising from changes in market values of securities held and reported with all other foreign currency gains and losses in the Fund’s Statement of Operations.
Allocation of Income, Expenses, Gains and Losses. Income, expenses (other than those attributable to a specific class), gains and losses are allocated on a daily basis to each class of shares based upon the relative proportion of net assets represented by such class. Operating expenses directly attributable to a specific class are charged against the operations of that class.
Federal Taxes. The Fund intends to comply with provisions of the Internal Revenue Code applicable to regulated investment companies and to distribute substantially all of its investment company taxable income, including any net realized gain on investments not offset by capital loss carryforwards, if any, to shareholders. Therefore, no federal income or excise tax provision is required. The Fund files income tax returns in U.S. federal and applicable state jurisdictions. The statute of limitations on the Fund’s tax return filings generally remain open for the three preceding fiscal reporting period ends.
During the fiscal year ended September 28, 2012, the Fund utilized did not utilize any capital loss carryforward to offset capital gains realized in that fiscal year. Details of the fiscal
34 OPPENHEIMER GLOBAL FUND
| | | | |
| | |
| | | | |
| | | | |
| | 1. Significant Accounting Policies (Continued) | | |
year ended September 28, 2012 capital loss carryforwards are included in the table below. Capital loss carryforwards with no expiration, if any, must be utilized prior to those with expiration dates. Capital losses with no expiration will be carried forward to future years if not offset by gains.
| | |
| Expiring | | |
|
No expiration | | $11,199,476 |
As of March 28, 2013, it is estimated that the Fund will have no capital loss carryforwards. The estimated capital loss carryforward represents the carryforward as of the end of the last fiscal year, increased or decreased by capital losses or gains realized in the first six months of the current fiscal year. During the six months ended March 28, 2013, it is estimated that the Fund will utilize $11,199,476 of capital loss carryforward to offset realized capital gains.
Net investment income (loss) and net realized gain (loss) may differ for financial statement and tax purposes. The character of dividends and distributions made during the fiscal year from net investment income or net realized gains may differ from their ultimate characterization for federal income tax purposes. Also, due to timing of dividends and distributions, the fiscal year in which amounts are distributed may differ from the fiscal year in which the income or net realized gain was recorded by the Fund.
The aggregate cost of securities and other investments and the composition of unrealized appreciation and depreciation of securities and other investments for federal income tax purposes as of March 28, 2013 are noted in the following table. The primary difference between book and tax appreciation or depreciation of securities and other investments, if applicable, is attributable to the tax deferral of losses or tax realization of financial statement unrealized gain or loss.
| | | | |
Federal tax cost of securities | | $ | 5,973,561,670 | |
Federal tax cost of other investments | | | 6,680,812 | |
| | | | |
Total federal tax cost | | $ | 5,980,242,482 | |
| | | | |
Gross unrealized appreciation | | $ | 3,446,384,632 | |
Gross unrealized depreciation | | | (237,536,321) | |
| | | | |
Net unrealized appreciation | | $ | 3,208,848,311 | |
| | | | |
Trustees’ Compensation. The Fund has adopted an unfunded retirement plan (the “Plan”) for the Fund’s independent trustees. Benefits are based on years of service and fees paid to each trustee during their period of service. The Plan was frozen with respect to adding new participants effective December 31, 2006 (the “Freeze Date”) and existing Plan Participants as of the Freeze Date will continue to receive accrued benefits under the Plan. Active independent trustees as of the Freeze Date have each elected a distribution method with respect to their benefits under the Plan. During the six months ended March 28, 2013, the Fund’s projected benefit obligations, payments to retired trustees and accumulated liability were as follows:
| | | | |
Projected Benefit Obligations Increased | | $ | 130,168 | |
Payments Made to Retired Trustees | | | 182,860 | |
Accumulated Liability as of March 28, 2013 | | | 1,338,204 | |
OPPENHEIMER GLOBAL FUND 35
| | | | |
| | |
| | NOTES TO FINANCIAL STATEMENTS Unaudited / (Continued) | | |
| | | | |
| | 1. Significant Accounting Policies (Continued) | | |
The Board of Trustees has adopted a compensation deferral plan for independent trustees that enables trustees to elect to defer receipt of all or a portion of the annual compensation they are entitled to receive from the Fund. For purposes of determining the amount owed to the Trustee under the plan, deferred amounts are treated as though equal dollar amounts had been invested in shares of the Fund or in other Oppenheimer funds selected by the Trustee. The Fund purchases shares of the funds selected for deferral by the Trustee in amounts equal to his or her deemed investment, resulting in a Fund asset equal to the deferred compensation liability. Such assets are included as a component of “Other” within the asset section of the Statement of Assets and Liabilities. Deferral of trustees’ fees under the plan will not affect the net assets of the Fund, and will not materially affect the Fund’s assets, liabilities or net investment income per share. Amounts will be deferred until distributed in accordance with the compensation deferral plan.
Dividends and Distributions to Shareholders. Dividends and distributions to shareholders, which are determined in accordance with income tax regulations and may differ from U.S. generally accepted accounting principles, are recorded on the ex-dividend date. Income and capital gain distributions, if any, are declared and paid annually or at other times as deemed necessary by the Manager. The tax character of distributions is determined as of the Fund’s fiscal year end. Therefore, a portion of the Fund’s distributions made to shareholders prior to the Fund’s fiscal year end may ultimately be categorized as a tax return of capital.
Investment Income. Dividend income is recorded on the ex-dividend date or upon ex-dividend notification in the case of certain foreign dividends where the ex-dividend date may have passed. Non-cash dividends included in dividend income, if any, are recorded at the fair market value of the securities received. Interest income is recognized on an accrual basis. Discount and premium, which are included in interest income on the Statement of Operations, are amortized or accreted daily.
Custodian Fees. “Custodian fees and expenses” in the Statement of Operations may include interest expense incurred by the Fund on any cash overdrafts of its custodian account during the period. Such cash overdrafts may result from the effects of failed trades in portfolio securities and from cash outflows resulting from unanticipated shareholder redemption activity. The Fund pays interest to its custodian on such cash overdrafts, to the extent they are not offset by positive cash balances maintained by the Fund, at a rate equal to the Federal Funds Rate plus 0.50%. The “Reduction to custodian expenses” line item, if applicable, represents earnings on cash balances maintained by the Fund during the period. Such interest expense and other custodian fees may be paid with these earnings.
Security Transactions. Security transactions are recorded on the trade date. Realized gains and losses on securities sold are determined on the basis of identified cost.
36 OPPENHEIMER GLOBAL FUND
| | | | |
| | |
| | | | |
| | | | |
| | 1. Significant Accounting Policies (Continued) | | |
Indemnifications. The Fund’s organizational documents provide current and former trustees and officers with a limited indemnification against liabilities arising in connection with the performance of their duties to the Fund. In the normal course of business, the Fund may also enter into contracts that provide general indemnifications. The Fund’s maximum exposure under these arrangements is unknown as this would be dependent on future claims that may be made against the Fund. The risk of material loss from such claims is considered remote.
Other. The preparation of financial statements in conformity with accounting principles generally accepted in the United States of America requires management to make estimates and assumptions that affect the reported amounts of assets and liabilities and disclosure of contingent assets and liabilities at the date of the financial statements and the reported amounts of increases and decreases in net assets from operations during the reporting period. Actual results could differ from those estimates.
2. Securities Valuation
The Fund calculates the net asset value of its shares as of the close of the New York Stock Exchange (the “Exchange”), normally 4:00 P.M. Eastern time, on each day the Exchange is open for trading.
The Fund’s Board has adopted procedures for the valuation of the Fund’s securities and has delegated the day-to-day responsibility for valuation determinations under those procedures to the Manager. The Manager has established a Valuation Committee which is responsible for determining a “fair valuation” for any security for which market quotations are not “readily available.” The Valuation Committee’s fair valuation determinations are subject to review, approval and ratification by the Fund’s Board at its next regularly scheduled meeting covering the calendar quarter in which the fair valuation was determined.
Valuation Methods and Inputs
Securities are valued using unadjusted quoted market prices, when available, as supplied primarily by third party pricing services or dealers.
The following methodologies are used to determine the market value or the fair value of the types of securities described below:
Securities traded on a registered U.S. securities exchange (including exchange-traded derivatives other than futures and futures options) are valued based on the last sale price of the security reported on the principal exchange on which it is traded, prior to the time when the Fund’s assets are valued. In the absence of a sale, the security is valued at the last sale price on the prior trading day, if it is within the spread of the current day’s closing “bid” and “asked” prices, and if not, at the current day’s closing bid price. A security of a foreign issuer traded on a foreign exchange but not listed on a registered U.S. securities exchange is valued based on the last sale price on the principal exchange on which the security is traded, as identified by the third party pricing service used by the Manager, prior to the time when the Fund’s assets are valued. If the last sale price is unavailable, the security is valued at the most recent official closing price on the principal exchange on which it is traded. If the last sales
OPPENHEIMER GLOBAL FUND 37
| | | | |
| | |
| | NOTES TO FINANCIAL STATEMENTS Unaudited / (Continued) | | |
| | | | |
| | 2. Securities Valuation (Continued) | | |
price or official closing price for a foreign security is not available, the security is valued at the mean between the bid and asked price per the exchange or, if not available from the exchange, obtained from two dealers. If bid and asked prices are not available from either the exchange or two dealers, the security is valued by using one of the following methodologies (listed in order of priority); (1) using a bid from the exchange, (2) the mean between the bid and asked price as provided by a single dealer, or (3) a bid from a single dealer.
Shares of a registered investment company that are not traded on an exchange are valued at that investment company’s net asset value per share.
Corporate and government debt securities (of U.S. or foreign issuers) and municipal debt securities, event-linked bonds, loans, mortgage-backed securities, collateralized mortgage obligations, and asset-backed securities are valued at the mean between the “bid” and “asked” prices utilizing evaluated prices obtained from third party pricing services or broker-dealers who may use matrix pricing methods to determine the evaluated prices.
Short-term money market type debt securities with a remaining maturity of sixty days or less are valued at cost adjusted by the amortization of discount or premium to maturity (amortized cost), which approximates market value. Short-term debt securities with a remaining maturity in excess of sixty days are valued at the mean between the “bid” and “asked” prices utilizing evaluated prices obtained from third party pricing services or broker-dealers.
Forward foreign currency exchange contracts are valued utilizing current and forward currency rates obtained from third party pricing services. When the settlement date of a contract is an interim date for which a quotation is not available, interpolated values are derived using the nearest dated forward currency rate.
A description of the standard inputs that may generally be considered by the third party pricing vendors in determining their evaluated prices is provided below.
| | |
| Security Type | | Standard inputs generally considered by third- party pricing vendors |
|
| Corporate debt, government debt, municipal, mortgage-backed and asset-backed securities | | Reported trade data, broker-dealer price quotations, benchmark yields, issuer spreads on comparable securities, the credit quality, yield, maturity, and other appropriate factors. |
|
| Loans | | Information obtained from market participants regarding reported trade data and broker-dealer price quotations. |
|
| Event-linked bonds | | Information obtained from market participants regarding reported trade data and broker-dealer price quotations. |
If a market value or price cannot be determined for a security using the methodologies described above, or if, in the “good faith” opinion of the Manager, the market value or price obtained does not constitute a “readily available market quotation,” or a significant event has occurred that would materially affect the value of the security the security is fair valued either (i) by a standardized fair valuation methodology applicable to the security type or the
38 OPPENHEIMER GLOBAL FUND
| | | | |
| | |
| | | | |
| | | | |
| | 2. Securities Valuation (Continued) | | |
significant event as previously approved by the Valuation Committee and the Fund’s Board or (ii) as determined in good faith by the Manager’s Valuation Committee. The Valuation Committee considers all relevant facts that are reasonably available, through either public information or information available to the Manager, when determining the fair value of a security. Fair value determinations by the Manager are subject to review, approval and ratification by the Fund’s Board at its next regularly scheduled meeting covering the calendar quarter in which the fair valuation was determined. Those fair valuation standardized methodologies include, but are not limited to, valuing securities at the last sale price or initially at cost and subsequently adjusting the value based on: changes in company specific fundamentals, changes in an appropriate securities index, or changes in the value of similar securities which may be further adjusted for any discounts related to security-specific resale restrictions. When possible, such methodologies use observable market inputs such as unadjusted quoted prices of similar securities, observable interest rates, currency rates and yield curves. The methodologies used for valuing securities are not necessarily an indication of the risks associated with investing in those securities nor can it be assured that the Fund can obtain the fair value assigned to a security if it were to sell the security.
To assess the continuing appropriateness of security valuations, the Manager, or its third party service provider who is subject to oversight by the Manager, regularly compares prior day prices, prices on comparable securities, and sale prices to the current day prices and challenges those prices exceeding certain tolerance levels with the third party pricing service or broker source. For those securities valued by fair valuations, whether through a standardized fair valuation methodology or a fair valuation determination, the Valuation Committee reviews and affirms the reasonableness of the valuations based on such methodologies and fair valuation determinations on a regular basis after considering all relevant information that is reasonably available.
Classifications
Each investment asset or liability of the Fund is assigned a level at measurement date based on the significance and source of the inputs to its valuation. Various data inputs are used in determining the value of each of the Fund’s investments as of the reporting period end. These data inputs are categorized in the following hierarchy under applicable financial accounting standards:
1) Level 1-unadjusted quoted prices in active markets for identical assets or liabilities (including securities actively traded on a securities exchange)
2) Level 2-inputs other than unadjusted quoted prices that are observable for the asset or liability (such as unadjusted quoted prices for similar assets and market corroborated inputs such as interest rates, prepayment speeds, credit risks, etc.)
3) Level 3-significant unobservable inputs (including the Manager’s own judgments about assumptions that market participants would use in pricing the asset or liability).
The inputs used for valuing securities are not necessarily an indication of the risks associated with investing in those securities.
OPPENHEIMER GLOBAL FUND 39
| | | | |
| | |
| | NOTES TO FINANCIAL STATEMENTS Unaudited / (Continued) | | |
| | | | |
| | 2. Securities Valuation (Continued) | | |
The table below categorizes amounts that are included in the Fund’s Statement of Assets and Liabilities as of March 28, 2013 based on valuation input level:
| | | | | | | | | | | | | | | | |
| | | Level 1—
Unadjusted
Quoted Prices | | | Level 2— Other Significant
Observable Inputs | | | Level 3—
Significant
Unobservable
Inputs | | | Value | |
| |
Assets Table | | | | | | | | | | | | | | | | |
Investments, at Value: | | | | | | | | | | | | | | | | |
Common Stocks | | | | | | | | | | | | | | | | |
Consumer Discretionary | | $ | 1,417,511,298 | | | $ | 156,993,769 | | | $ | — | | | $ | 1,574,505,067 | |
Consumer Staples | | | 625,565,652 | | | | 142,519,940 | | | | — | | | | 768,085,592 | |
Energy | | | 302,042,287 | | | | — | | | | — | | | | 302,042,287 | |
Financials | | | 1,056,451,578 | | | | 569,682,264 | | | | — | | | | 1,626,133,842 | |
Health Care | | | 981,290,957 | | | | — | | | | 13,655,074 | | | | 994,946,031 | |
Industrials | | | 1,033,648,118 | | | | 179,232,427 | | | | — | | | | 1,212,880,545 | |
Information Technology | | | 1,986,117,123 | | | | 408,000,673 | | | | — | | | | 2,394,117,796 | |
Materials | | | 92,144,163 | | | | 17,709,111 | | | | — | | | | 109,853,274 | |
Telecommunication Services | | | — | | | | 133,279,114 | | | | — | | | | 133,279,114 | |
Utilities | | | — | | | | 50,539,695 | | | | — | | | | 50,539,695 | |
Investment Company | | | 16,026,738 | | | | — | | | | — | | | | 16,026,738 | |
| | | | |
Total Investments, at Value | | | 7,510,797,914 | | | | 1,657,956,993 | | | | 13,655,074 | | | | 9,182,409,981 | |
Other Financial Instruments: | | | | | | | | | | | | | | | | |
Foreign currency exchange contracts | | | — | | | | 1,623 | | | | — | | | | 1,623 | |
| | | | |
Total Assets | | $ | 7,510,797,914 | | | $ | 1,657,958,616 | | | $ | 13,655,074 | | | $ | 9,182,411,604 | |
| | | | |
| | | | |
Liability Table | | | | | | | | | | | | | | | | |
Other Financial Instruments: | | | | | | | | | | | | | | | | |
Foreign currency exchange contracts | | $ | — | | | $ | (15,737) | | | $ | — | | | $ | (15,737) | |
| | | | |
Total Liabilities | | $ | — | | | $ | (15,737) | | | $ | — | | | $ | (15,737) | |
| | | | |
Currency contracts and forwards, if any, are reported at their unrealized appreciation/ depreciation at measurement date, which represents the change in the contract’s value from trade date. Futures, if any, are reported at their variation margin at measurement date, which represents the amount due to/from the Fund at that date. All additional assets and liabilities included in the above table are reported at their market value at measurement date.
40 OPPENHEIMER GLOBAL FUND
| | | | |
| | |
| | | | |
| | | | |
| | 2. Securities Valuation (Continued) | | |
The table below shows the significant transfers between Level 1 and Level 2. The Fund’s policy is to recognized transfers in and transfers out as of the beginning of the reporting period.
| | | | | | | | | | | | | | | | |
| | | Transfers into
Level 1* | | | Transfers out of
Level 1** | | | Transfers into
Level 2** | | | Transfers out of
Level 2* | |
| |
Assets Table | | | | | | | | | | | | | | | | |
Investments, at Value: | | | | | | | | | | | | | | | | |
Common Stocks | | | | | | | | | | | | | | | | |
Consumer Discretionary | | $ | 272,356,960 | | | $ | (182,610,683) | | | $ | 182,610,683 | | | $ | (272,356,960) | |
Consumer Staples | | | — | | | | (151,555,354) | | | | 151,555,354 | | | | — | |
Energy | | | 220,994,130 | | | | — | | | | — | | | | (220,994,130) | |
Financials | | | — | | | | (246,987,252) | | | | 246,987,252 | | | | — | |
Industrials | | | 182,522,191 | | | | (117,059,722) | | | | 117,059,722 | | | | (182,522,191) | |
Information Technology | | | 88,628,027 | | | | (151,188,091) | | | | 151,188,091 | | | | (88,628,027) | |
Telecommunication Services | | | — | | | | (123,684,880) | | | | 123,684,880 | | | | — | |
Utilities | | | — | | | | (46,043,437) | | | | 46,043,437 | | | | — | |
| | | | |
Total Assets | | $ | 764,501,308 | | | $ | (1,019,129,419) | | | $ | 1,019,129,419 | | | $ | (764,501,308) | |
| | | | |
*Transferred from Level 2 to Level 1 due to the presence of a readily available unadjusted quoted market price.
**Transferred from Level 1 to Level 2 because of the absence of a readily available unadjusted quoted market price due to a significant event occurring before the Fund’s assets were valued but after the close of the securities’ respective exchanges.
3. Shares of Beneficial Interest
The Fund has authorized an unlimited number of no par value shares of beneficial interest of each class. Transactions in shares of beneficial interest were as follows:
| | | | | | | | | | | | | | | | |
| | | Six Months Ended March 28, 2013 | | | Year Ended September 28, 20121 | |
| | | Shares | | | Amount | | | Shares | | | Amount | |
| |
Class A | | | | | | | | | | | | | | | | |
Sold | | | 5,486,960 | | | $ | 359,603,036 | | | | 12,246,264 | | | $ | 690,246,933 | |
Dividends and/or distributions reinvested | | | 1,159,330 | | | | 73,269,591 | | | | 2,220,834 | | | | 119,147,768 | |
Redeemed | | | (11,936,661) | | | | (772,802,908) | | | | (26,808,189) | | | | (1,534,158,748) | |
| | | | |
Net decrease | | | (5,290,371) | | | $ | (339,930,281) | | | | (12,341,091) | | | $ | (724,764,047) | |
| | | | |
| | | | | | | | | | | | | | | | |
| |
Class B | | | | | | | | | | | | | | | | |
Sold | | | 23,070 | | | $ | 1,415,285 | | | | 302,358 | | | $ | 15,901,696 | |
Dividends and/or distributions reinvested | | | 8,429 | | | | 493,928 | | | | 33,796 | | | | 1,681,718 | |
Redeemed | | | (515,497) | | | | (30,963,012) | | | | (1,567,487) | | | | (82,572,527) | |
| | | | |
Net decrease | | | (483,998) | | | $ | (29,053,799) | | | | (1,231,333) | | | $ | (64,989,113) | |
| | | | |
| | | | | | | | | | | | | | | | |
| |
Class C | | | | | | | | | | | | | | | | |
Sold | | | 416,719 | | | $ | 25,706,983 | | | | 744,834 | | | $ | 39,916,412 | |
Dividends and/or distributions reinvested | | | 51,606 | | | | 3,066,923 | | | | 126,985 | | | | 6,413,996 | |
Redeemed | | | (991,615) | | | | (60,419,970) | | | | (2,685,591) | | | | (143,711,617) | |
| | | | |
Net decrease | | | (523,290) | | | $ | (31,646,064) | | | | (1,813,772) | | | $ | (97,381,209) | |
| | | | |
OPPENHEIMER GLOBAL FUND 41
| | | | |
| | |
| | NOTES TO FINANCIAL STATEMENTS Unaudited / (Continued) | | |
3. Shares of Beneficial Interest
| | | | | | | | | | | | | | | | |
| | | Six Months Ended March 28, 2013 | | | Year Ended September 28, 20121 | |
| | | Shares | | | Amount | | | Shares | | | Amount | |
| |
Class I | | | | | | | | | | | | | | | | |
Sold | | | 496,473 | | | $ | 32,533,118 | | | | 219,573 | | | $ | 12,841,283 | |
Dividends and/or distributions reinvested | | | 3,521 | | | | 222,605 | | | | — | | | | — | |
Redeemed | | | (35,764) | | | | (2,388,305) | | | | (10,645) | | | | (606,268) | |
| | | | |
Net increase | | | 464,230 | | | $ | 30,367,418 | | | | 208,928 | | | $ | 12,235,015 | |
| | | | |
|
| |
Class N | | | | | | | | | | | | | | | | |
Sold | | | 346,601 | | | $ | 22,740,503 | | | | 831,885 | | | $ | 47,267,623 | |
Dividends and/or distributions reinvested | | | 23,590 | | | | 1,486,874 | | | | 56,509 | | | | 3,022,652 | |
Redeemed | | | (626,058) | | | | (40,328,213) | | | | (1,437,982) | | | | (81,780,013) | |
| | | | |
Net decrease | | | (255,867) | | | $ | (16,100,836) | | | | (549,588) | | | $ | (31,489,738) | |
| | | | |
|
| |
Class Y | | | | | | | | | | | | | | | | |
Sold | | | 2,551,335 | | | $ | 168,022,336 | | | | 6,237,485 | | | $ | 350,588,039 | |
Dividends and/or distributions reinvested | | | 229,298 | | | | 14,498,536 | | | | 296,521 | | | | 15,920,190 | |
Redeemed | | | (2,130,794) | | | | (138,355,858) | | | | (3,665,897) | | | | (210,601,594) | |
| | | | |
Net increase | | | 649,839 | | | $ | 44,165,014 | | | | 2,868,109 | | | $ | 155,906,635 | |
| | | | |
1. For the year ended September 28, 2012, for Class A, Class B, Class C, Class N and Class Y shares, and for the period from January 27, 2012 (inception of offering) to September 28, 2012, for Class I shares.
4. Purchases and Sales of Securities
The aggregate cost of purchases and proceeds from sales of securities, other than short-term obligations and investments in IMMF, for the six months ended March 28, 2013, were as follows:
| | | | | | | | |
| | | Purchases | | | Sales | |
| |
Investment securities | | $ | 424,572,893 | | | $ | 882,458,831 | |
5. Fees and Other Transactions with Affiliates
Management Fees. Under the investment advisory agreement, the Fund pays the Manager a management fee based on the daily net assets of the Fund at an annual rate as shown in the following table:
| | | | |
| Fee Schedule | | | |
| |
Up to $250 million | | | 0.80% | |
Next $250 million | | | 0.77 | |
Next $500 million | | | 0.75 | |
Next $1 billion | | | 0.69 | |
Next $1.5 billion | | | 0.67 | |
Next $2.5 billion | | | 0.65 | |
Next $2.5 billion | | | 0.63 | |
42 OPPENHEIMER GLOBAL FUND
| | | | |
| | |
| | | | |
| | | | |
| | 5. Fees and Other Transactions with Affiliates (Continued) | | |
| | | | |
| Fee Schedule Continued | | | |
| |
Next $2.5 billion | | | 0.60% | |
Next $4 billion | | | 0.58 | |
Next $8 billion | | | 0.56 | |
Over $23 billion | | | 0.54 | |
Sub-Adviser Fees. The Manager has retained the Sub-Adviser to provide the day-to-day portfolio management of the Fund. Under the Sub-Advisory Agreement, the Manager pays the Sub-Adviser an annual fee in monthly installments, equal to a percentage of the investment management fee collected by the Manager from the Fund, which shall be calculated after any investment management fee waivers. The fee paid to the Sub-Adviser is paid by the Manager, not by the Fund.
Transfer Agent Fees. OppenheimerFunds Services (“OFS”), a division of OFI, acted as the transfer and shareholder servicing agent for the Fund through December 31, 2012. Effective January 1, 2013, OFI Global (the “Transfer Agent”) will serve as the transfer and shareholder servicing agent for the Fund. The Fund pays the Transfer Agent a per account fee.
Additionally, Class Y shares are subject to minimum fees of $10,000 annually for assets of $10 million or more. The Class Y shares are subject to the minimum fees in the event that the per account fee does not equal or exceed the applicable minimum fees. The Transfer Agent may voluntarily waive the minimum fees.
Sub-Transfer Agent Fees. Effective January 1, 2013, the Transfer Agent has retained Shareholder Services, Inc., a wholly-owned subsidiary of OFI, (the “Sub-Transfer Agent”) to provide the day-to-day transfer agent and shareholder servicing of the Fund. Under the Sub-Transfer Agency Agreement, the Transfer Agent pays the Sub-Transfer Agent an annual fee in monthly installments, equal to a percentage of the transfer agent fee collected by the Transfer Agent from the Fund, which shall be calculated after any applicable fee waivers. The fee paid to the Sub-Transfer Agent is paid by the Transfer Agent, not by the Fund.
Distribution and Service Plan (12b-1) Fees. Under its General Distributor’s Agreement with the Fund, OppenheimerFunds Distributor, Inc. (the “Distributor”) acts as the Fund’s principal underwriter in the continuous public offering of the Fund’s classes of shares.
Service Plan for Class A Shares. The Fund has adopted a Service Plan (the “Plan”) for Class A shares under Rule 12b-1 of the Investment Company Act of 1940. Under the Plan, the Fund reimburses the Distributor for a portion of its costs incurred for services provided to accounts that hold Class A shares. Reimbursement is made periodically at an annual rate of up to 0.25% of the daily net assets of Class A shares of the Fund. The Distributor currently uses all of those fees to pay dealers, brokers, banks and other financial institutions periodically for providing personal service and maintenance of accounts of their customers that hold Class A shares. Any unreimbursed expenses the Distributor incurs with respect to Class A shares in any fiscal year cannot be recovered in subsequent periods. Fees incurred by the Fund under the Plan are detailed in the Statement of Operations.
OPPENHEIMER GLOBAL FUND 43
| | | | |
| | |
| | NOTES TO FINANCIAL STATEMENTS Unaudited / (Continued) | | |
| | | | |
| | 5. Fees and Other Transactions with Affiliates (Continued) | | |
Distribution and Service Plans for Class B, Class C and Class N Shares. The Fund has adopted Distribution and Service Plans (the “Plans”) for Class B, Class C and Class N shares under Rule 12b-1 of the Investment Company Act of 1940 to compensate the Distributor for its services in connection with the distribution of those shares and servicing accounts. Under the Plans, the Fund pays the Distributor an annual asset-based sales charge of 0.75% on Class B and Class C shares daily net assets and 0.25% on Class N shares daily net assets. The Distributor also receives a service fee of 0.25% per year under each plan. If either the Class B, Class C or Class N plan is terminated by the Fund or by the shareholders of a class, the Board of Trustees and its independent trustees must determine whether the Distributor shall be entitled to payment from the Fund of all or a portion of the service fee and/or asset-based sales charge in respect to shares sold prior to the effective date of such termination. Fees incurred by the Fund under the Plans are detailed in the Statement of Operations. The Distributor determines its uncompensated expenses under the Plans at calendar quarter ends. The Distributor’s aggregate uncompensated expenses under the Plans at March 31, 2013 were as follows:
| | | | |
Class C | | | $21,224,802 | |
Class N | | | 5,799,484 | |
Sales Charges. Front-end sales charges and contingent deferred sales charges (“CDSC”) do not represent expenses of the Fund. They are deducted from the proceeds of sales of Fund shares prior to investment or from redemption proceeds prior to remittance, as applicable. The sales charges retained by the Distributor from the sale of shares and the CDSC retained by the Distributor on the redemption of shares is shown in the following table for the period indicated.
| | | | | | | | | | | | | | | | | | | | |
| Six Months Ended | | Class A Front-End
Sales Charges
Retained by
Distributor | | | Class A
Contingent
Deferred Sales
Charges
Retained by
Distributor | | | Class B
Contingent
Deferred Sales
Charges
Retained by
Distributor | | | Class C
Contingent
Deferred Sales
Charges
Retained by
Distributor | | | Class N
Contingent
Deferred Sales
Charges
Retained by
Distributor | |
| |
March 28, 2013 | | | $402,190 | | | | $2,602 | | | | $97,314 | | | | $8,622 | | | | $689 | |
Waivers and Reimbursements of Expenses. The Manager will waive fees and/or reimburse Fund expenses in an amount equal to the indirect management fees incurred through the Fund’s investment in IMMF. During the six months ended March 28, 2013, the Manager waived fees and/or reimbursed the Fund $6,781 for IMMF management fees.
The Transfer Agent has voluntarily agreed to limit transfer and shareholder servicing agent fees for Classes B, C, N and Y shares to 0.35% of average annual net assets per class and for Class A shares to 0.30% of average annual net assets of the class.
44 OPPENHEIMER GLOBAL FUND
| | | | |
| | |
| | | | |
| | | | |
| | 5. Fees and Other Transactions with Affiliates (Continued) | | |
During the six months ended March 28, 2013, the Transfer Agent waived transfer and shareholder servicing agent fees as follows:
| | | | |
Class B | | | $94,941 | |
Class N | | | 3,987 | |
Some of these undertakings may be modified or terminated at any time; some may not be modified or terminated until after one year from the date of the current prospectus, as indicated therein.
6. Risk Exposures and the Use of Derivative Instruments
The Fund’s investment objectives not only permit the Fund to purchase investment securities, they also allow the Fund to enter into various types of derivatives contracts, including, but not limited to, futures contracts, forward foreign currency exchange contracts, credit default swaps, interest rate swaps, total return swaps, and purchased and written options. In doing so, the Fund will employ strategies in differing combinations to permit it to increase, decrease, or change the level or types of exposure to market risk factors. Central to those strategies are features inherent to derivatives that make them more attractive for this purpose than equity and debt securities: they require little or no initial cash investment, they can focus exposure on only certain selected risk factors, and they may not require the ultimate receipt or delivery of the underlying security (or securities) to the contract. This may allow the Fund to pursue its objectives more quickly and efficiently than if it were to make direct purchases or sales of securities capable of effecting a similar response to market factors.
Market Risk Factors. In accordance with its investment objectives, the Fund may use derivatives to increase or decrease its exposure to one or more of the following market risk factors:
Commodity Risk. Commodity risk relates to the change in value of commodities or commodity indexes as they relate to increases or decreases in the commodities market. Commodities are physical assets that have tangible properties. Examples of these types of assets are crude oil, heating oil, metals, livestock, and agricultural products.
Credit Risk. Credit risk relates to the ability of the issuer to meet interest and principal payments, or both, as they come due. In general, lower-grade, higher-yield bonds are subject to credit risk to a greater extent than lower-yield, higher-quality bonds.
Equity Risk. Equity risk relates to the change in value of equity securities as they relate to increases or decreases in the general market.
Foreign Exchange Rate Risk. Foreign exchange rate risk relates to the change in the U.S. dollar value of a security held that is denominated in a foreign currency. The U.S. dollar value of a foreign currency denominated security will decrease as the dollar appreciates against the currency, while the U.S. dollar value will increase as the dollar depreciates against the currency.
Interest Rate Risk. Interest rate risk refers to the fluctuations in value of fixed-income securities resulting from the inverse relationship between price and yield. For example, an increase in general interest rates will tend to reduce the market value of already issued fixed-income investments, and a decline in general interest rates will tend to increase their value. In addition, debt securities with longer maturities, which tend to have higher yields, are subject to potentially greater fluctuations in value from changes in interest rates than obligations with shorter maturities.
OPPENHEIMER GLOBAL FUND 45
| | | | |
| | |
| | NOTES TO FINANCIAL STATEMENTS Unaudited / (Continued) | | |
| | | | |
| | 6. Risk Exposures and the Use of Derivative Instruments (Continued) | | |
Volatility Risk. Volatility risk refers to the magnitude of the movement, but not the direction of the movement, in a financial instrument’s price over a defined time period. Large increases or decreases in a financial instrument’s price over a relative time period typically indicate greater volatility risk, while small increases or decreases in its price typically indicate lower volatility risk.
The Fund’s actual exposures to these market risk factors during the period are discussed in further detail, by derivative type, below.
Risks of Investing in Derivatives. The Fund’s use of derivatives can result in losses due to unanticipated changes in the market risk factors and the overall market. In instances where the Fund is using derivatives to decrease, or hedge, exposures to market risk factors for securities held by the Fund, there are also risks that those derivatives may not perform as expected resulting in losses for the combined or hedged positions.
Derivatives may have little or no initial cash investment relative to their market value exposure and therefore can produce significant gains or losses in excess of their cost. This use of embedded leverage allows the Fund to increase its market value exposure relative to its net assets and can substantially increase the volatility of the Fund’s performance.
Additional associated risks from investing in derivatives also exist and potentially could have significant effects on the valuation of the derivative and the Fund. Typically, the associated risks are not the risks that the Fund is attempting to increase or decrease exposure to, per its investment objectives, but are the additional risks from investing in derivatives. Examples of these associated risks are liquidity risk, which is the risk that the Fund will not be able to sell the derivative in the open market in a timely manner, and counterparty credit risk, which is the risk that the counterparty will not fulfill its obligation to the Fund. Associated risks can be different for each type of derivative and are discussed by each derivative type in the notes that follow.
Counterparty Credit Risk. Certain derivative positions are subject to counterparty credit risk, which is the risk that the counterparty will not fulfill its obligation to the Fund. The Fund’s derivative counterparties are financial institutions who are subject to market conditions that may weaken their financial position. The Fund intends to enter into financial transactions with counterparties that the Manager believes to be creditworthy at the time of the transaction. As of March 28, 2013, the maximum amount of loss that the Fund would incur if the counterparties to its derivative transactions failed to perform would be $1,623, which represents gross payments to be received by the Fund on these derivative contracts were they to be unwound as of period end.
Credit Related Contingent Features. The Fund’s agreements with derivative counterparties have several credit related contingent features that if triggered would allow its derivatives counterparties to close out and demand payment or additional collateral to cover their exposure from the Fund. Credit related contingent features are established between the Fund and its derivatives counterparties to reduce the risk that the Fund will
46 OPPENHEIMER GLOBAL FUND
| | | | |
| | |
| | | | |
| | | | |
| | 6. Risk Exposures and the Use of Derivative Instruments (Continued) | | |
not fulfill its payment obligations to its counterparties. These triggering features include, but are not limited to, a percentage decrease in the Fund’s net assets and or a percentage decrease in the Fund’s Net Asset Value or NAV. The contingent features are established within the Fund’s International Swap and Derivatives Association, Inc. master agreements which govern certain positions in swaps, over-the-counter options and swaptions, and forward currency exchange contracts for each individual counterparty.
Valuations of derivative instruments as of March 28, 2013 are as follows:
| | | | | | | | | | | | |
| | | Asset Derivatives | | | Liability Derivatives | |
Derivatives Not Accounted for as Hedging Instruments | | Statement of Assets
and Liabilities Location | | Value | | | Statement of Assets and
Liabilities Location | | Value | |
| |
Foreign exchange contracts | | Unrealized appreciation on
foreign currency exchange
contracts | | | $1,623 | | | Unrealized depreciation on
foreign currency exchange
contracts | | | $15,737 | |
The effect of derivative instruments on the Statement of Operations is as follows:
| | | | |
| Derivatives Not Accounted for as Hedging Instruments | | Foreign currency transactions | |
| |
Foreign exchange contracts | | | $(44,168) | |
| | | | |
| Derivatives Not Accounted for as Hedging Instruments | | Translation of assets and liabilities
denominated in foreign currencies | |
| |
Foreign exchange contracts | | | $3,039 | |
Foreign Currency Exchange Contracts
The Fund may enter into foreign currency exchange contracts (“forward contracts”) for the purchase or sale of a foreign currency at a negotiated rate at a future date.
Forward contracts are reported on a schedule following the Statement of Investments. The unrealized appreciation (depreciation) is reported in the Statement of Assets and Liabilities as a receivable or payable and in the Statement of Operations within the change in unrealized appreciation (depreciation). At contract close, the difference between the original cost of the contract and the value at the close date is recorded as a realized gain (loss) in the Statement of Operations.
The Fund has purchased and sold certain forward foreign currency exchange contracts of different currencies in order to acquire currencies to pay for or sell currencies to acquire related foreign securities purchase and sale transactions, respectively, or to convert foreign currencies to U.S. dollars from related foreign securities transactions. These foreign currency exchange contracts are negotiated at the current spot exchange rate with settlement typically within two business days thereafter.
During the six months ended March 28, 2013, the Fund had daily average contract amounts on forward foreign currency contracts to buy and sell of $3,116,474 and $12,303,320, respectively.
OPPENHEIMER GLOBAL FUND 47
| | | | |
| | |
| | NOTES TO FINANCIAL STATEMENTS Unaudited / (Continued) | | |
| | | | |
| | 6. Risk Exposures and the Use of Derivative Instruments (Continued) | | |
Additional associated risk to the Fund includes counterparty credit risk. Counterparty credit risk arises from the possibility that the counterparty will default.
7. Restricted Securities
As of March 28, 2013, investments in securities included issues that are restricted. A restricted security may have a contractual restriction on its resale and is valued under methods approved by the Board of Trustees as reflecting fair value. Securities that are restricted are marked with an applicable footnote on the Statement of Investments. Restricted securities are reported on a schedule following the Statement of Investments.
8. Pending Litigation
Since 2009, a number of class action lawsuits have been pending in federal courts against OppenheimerFunds, Inc. (“OFI”), OppenheimerFunds Distributor, Inc., the Fund’s principal underwriter and distributor (the “Distributor”), and certain funds (but not including the Fund) advised by the Manager and distributed by the Distributor (the “Defendant Funds”). Several of these lawsuits also name as defendants certain officers and current and former trustees of the respective Defendant Funds. The lawsuits raise claims under federal securities law and allege, among other things, that the disclosure documents of the respective Defendant Funds contained misrepresentations and omissions and that the respective Defendant Funds’ investment policies were not followed. The plaintiffs in these actions seek unspecified damages, equitable relief and awards of attorneys’ fees and litigation expenses. The Defendant Funds’ Boards of Trustees have also engaged counsel to represent the Funds and the present and former Independent Trustees named in those suits.
Other class action and individual lawsuits have been filed since 2008 in various state and federal courts against OFI and certain of its affiliates by investors seeking to recover investments they allegedly lost as a result of the “Ponzi” scheme run by Bernard L. Madoff and his firm, Bernard L. Madoff Investment Securities, LLC (“BLMIS”). Plaintiffs in these suits allege that they suffered losses as a result of their investments in several funds managed by an affiliate of OFI and assert a variety of claims, including breach of fiduciary duty, fraud, negligent misrepresentation, unjust enrichment, and violation of federal and state securities laws and regulations, among others. They seek unspecified damages, equitable relief and awards of attorneys’ fees and litigation expenses. Neither the Distributor, nor any of the Oppenheimer mutual funds, their independent trustees or directors are named as defendants in these lawsuits. None of the Oppenheimer mutual funds invested in any funds or accounts managed by Madoff or BLMIS. On February 28, 2011, a stipulation of partial settlement of three groups of consolidated putative class action lawsuits relating to these matters was filed in the U.S. District Court for the Southern District of New York. On August 19, 2011, the court entered an order and final judgment approving the settlement as fair, reasonable and adequate. In September 2011, certain parties filed notices of appeal from the court’s order approving the settlement. The settlement does not resolve other outstanding lawsuits against OFI and its affiliates relating to BLMIS.
48 OPPENHEIMER GLOBAL FUND
| | | | |
| | |
| | | | |
| | | | |
| | 8. Pending Litigation (Continued) | | |
On April 16, 2010, a lawsuit was filed in New York state court against (i) OFI, (ii) an affiliate of OFI and (iii) AAArdvark IV Funding Limited (“AAArdvark IV”), an entity advised by OFI’s affiliate, in connection with investments made by the plaintiffs in AAArdvark IV. Plaintiffs allege breach of contract and common law fraud claims against the defendants and seek compensatory damages, costs and disbursements, including attorney fees. On April 11, 2013, the court granted defendants’ motion for summary judgment, dismissing plaintiffs’ fraud claim with prejudice and dismissing their contract claim without prejudice, and granted plaintiffs leave to replead their contract claim to assert a cause of action for specific performance within 30 days. The court’s decision is subject to appeal. On July 15, 2011, a lawsuit was filed in New York state court against OFI, an affiliate of OFI and AAArdvark Funding Limited (“AAArdvark I”), an entity advised by OFI’s affiliate, in connection with investments made by the plaintiffs in AAArdvark I. The complaint alleges breach of contract and common law fraud claims against the defendants and seeks compensatory damages, costs and disbursements, including attorney fees. On November 9, 2011, a lawsuit was filed in New York state court against OFI, an affiliate of OFI and AAArdvark XS Funding Limited (“AAArdvark XS”), an entity advised by OFI’s affiliate, in connection with investments made by the plaintiffs in AAArdvark XS. The complaint alleges breach of contract against the defendants and seeks compensatory damages, costs and disbursements, including attorney fees.
OFI believes the lawsuits and appeals described above are without legal merit and, with the exception of actions it has settled, is defending against them vigorously. While it is premature to render any opinion as to the outcome in these lawsuits, or whether any costs that the Defendant Funds may bear in defending the suits might not be reimbursed by insurance, OFI believes that these suits should not impair the ability of OFI or the Distributor to perform their respective duties to the Fund, and that the outcome of all of the suits together should not have any material effect on the operations of any of the Oppenheimer mutual funds.
OPPENHEIMER GLOBAL FUND 49
| | | | |
| | |
| | PORTFOLIO PROXY VOTING POLICIES AND PROCEDURES; UPDATES TO STATEMENTS OF INVESTMENTS Unaudited | | |
| | | | |
The Fund has adopted Portfolio Proxy Voting Policies and Procedures under which the Fund votes proxies relating to securities (“portfolio proxies”) held by the Fund. A description of the Fund’s Portfolio Proxy Voting Policies and Procedures is available (i) without charge, upon request, by calling the Fund toll-free at 1.800.CALL OPP (225.5677), (ii) on the Fund’s website at oppenheimerfunds.com, and (iii) on the SEC’s website at www.sec.gov. In addition, the Fund is required to file Form N-PX, with its complete proxy voting record for the 12 months ended June 30th, no later than August 31st of each year. The Fund’s voting record is available (i) without charge, upon request, by calling the Fund toll-free at 1.800.CALL OPP (225.5677), and (ii) in the Form N-PX filing on the SEC’s website at www.sec.gov.
The Fund files its complete schedule of portfolio holdings with the SEC for the first quarter and the third quarter of each fiscal year on Form N-Q. The Fund’s Form N-Q filings are available on the SEC’s website at www.sec.gov. Those forms may be reviewed and copied at the SEC’s Public Reference Room in Washington, D.C. Information on the operation of the Public Reference Room may be obtained by calling 1-800-SEC-0330.
Householding—Delivery of Shareholder Documents
This is to inform you about OppenheimerFunds’ “householding” policy. If more than one member of your household maintains an account in a particular fund, OppenheimerFunds will mail only one copy of the fund’s prospectus (or, if available, the fund’s summary prospectus), annual and semiannual report and privacy policy. The consolidation of these mailings, called householding, benefits your fund through reduced mailing expense, and benefits you by reducing the volume of mail you receive from OppenheimerFunds. Householding does not affect the delivery of your account statements.
Please note that we will continue to household these mailings for as long as you remain an OppenheimerFunds shareholder, unless you request otherwise. If you prefer to receive multiple copies of these materials, please call us at 1.800.CALL-OPP (225-5677). You may also notify us in writing or via email. We will begin sending you individual copies of the prospectus (or, if available, the summary prospectus), reports and privacy policy within 30 days of receiving your request to stop householding.
50 OPPENHEIMER GLOBAL FUND
| | | | |
| Trustees and Officers | | Brian F. Wruble, Chairman of the Board of Trustees and Trustee | | |
| | David K. Downes, Trustee | | |
| | Matthew P. Fink, Trustee | | |
| | Edmund P. Giambastiani, Jr., Advisory Board Member | | |
| | Phillip A. Griffiths, Trustee | | |
| | Mary F. Miller, Trustee | | |
| | Joel W. Motley, Trustee | | |
| | Joanne Pace, Advisory Board Member | | |
| | Mary Ann Tynan, Trustee | | |
| | Joseph M. Wikler, Trustee | | |
| | Peter I. Wold, Trustee | | |
| | William F. Glavin, Jr., President and Principal Executive Officer | | |
| | Rajeev Bhaman, Vice President | | |
| | Arthur S. Gabinet, Secretary and Chief Legal Officer | | |
| | Christina M. Nasta, Vice President and Chief Business Officer | | |
| | Mark S. Vandehey, Vice President and Chief Compliance Officer | | |
| | Brian W. Wixted, Treasurer and Principal Financial & Accounting Officer | | |
| | |
| Manager | | OFI Global Asset Management, Inc. | | |
| | |
| Sub-Adviser | | OppenheimerFunds, Inc. | | |
| | |
| Distributor | | OppenheimerFunds Distributor, Inc. | | |
| | |
| Transfer and | | OFI Global Asset Management, Inc. | | |
| Shareholder Servicing | | | | |
| Agent | | | | |
| | |
| Sub-Transfer Agent | | Shareholder Services, Inc. | | |
| | DBA OppenheimerFunds Services | | |
| | |
| Independent | | KPMGLLP | | |
| Registered Public | | | | |
| Accounting Firm | | | | |
| | |
| Legal Counsel | | Kramer Levin Naftalis & Frankel LLP | | |
| | |
| | The financial statements included herein have been taken from the records of the Fund without examination of those records by the independent registered public accounting firm. | | |
© 2013 OppenheimerFunds, Inc. All rights reserved.
OPPENHEIMER GLOBAL FUND 51
As an Oppenheimer fund shareholder, you are entitled to know how we protect your personal information and how we limit its disclosure.
Information Sources
We obtain nonpublic personal information about our shareholders from the following sources:
| | — | | Applications or other forms | |
| | — | | When you create a user ID and password for online account access | |
| | — | | When you enroll in eDocs Direct, our electronic document delivery service | |
| | — | | Your transactions with us, our affiliates or others | |
| | — | | A software program on our website, often referred to as a “cookie,” which indicates which parts of our site you’ve visited | |
| | — | | When you set up challenge questions to reset your password online | |
If you visit oppenheimerfunds.com and do not log on to the secure account information areas, we do not obtain any personal information about you. When you do log on to a secure area, we do obtain your user ID and password to identify you. We also use this information to provide you with products and services you have requested, to inform you about products and services that you may be interested in and assist you in other ways.
We do not collect personal information through our website unless you willingly provide it to us, either directly by email or in those areas of the website that request information. In order to update your personal information (including your mailing address, email address and phone number) you must first log on and visit your user profile.
If you have set your browser to warn you before accepting cookies, you will receive the warning message with each cookie. You can refuse cookies by turning them off in your browser. However, doing so may limit your access to certain sections of our website.
We use cookies to help us improve and manage our website. For example, cookies help us recognize new versus repeat visitors to the site, track the pages visited, and enable some special features on the website. This data helps us provide a better service for our website visitors.
Protection of Information
We do not disclose any non-public personal information (such as names on a customer list) about current or former customers to anyone, except as permitted by law.
Disclosure of Information
We send your financial advisor (as designated by you) copies of confirmations, account statements and other documents reporting activity in your fund accounts. We may also use details about you and your investments to help us, our financial service affiliates, or firms that jointly market their financial products and services with ours, to better serve your investment needs or suggest financial services or educational material that may be of interest to you. If this requires us to provide you with an opportunity to “opt in” or “opt out” of such information sharing with a firm not affiliated with us, you will receive notification on how to do so, before any such sharing takes place.
Right of Refusal
We will not disclose your personal information to unaffiliated third parties (except as permitted by law), unless we first offer you a reasonable opportunity to refuse or “opt out” of such disclosure.
52 OPPENHEIMER GLOBAL FUND
Internet Security and Encryption
In general, the email services provided by our website are encrypted and provide a secure and private means of communication with us. To protect your own privacy, confidential and/or personal information should only be communicated via email when you are advised that you are using a secure website.
As a security measure, we do not include personal or account information in non-secure emails, and we advise you not to send such information to us in non-secure emails. Instead, you may take advantage of the secure features of our website to encrypt your email correspondence. To do this, you will need to use a browser that supports Secure Sockets Layer (SSL) protocol.
We do not guarantee or warrant that any part of our website, including files available for download, are free of viruses or other harmful code. It is your responsibility to take appropriate precautions, such as use of an anti-virus software package, to protect your computer hardware and software.
| | — | | All transactions, including redemptions, exchanges and purchases, are secured by SSL and 128-bit encryption. SSL is used to establish a secure connection between your PC and OppenheimerFunds’ server. It transmits information in an encrypted and scrambled format. | |
| | — | | Encryption is achieved through an electronic scrambling technology that uses a “key” to code and then decode the data. Encryption acts like the cable converter box you may have on your television set. It scrambles data with a secret code so that no one can make sense of it while it is being transmitted. When the data reaches its destination, the same software unscrambles the data. | |
| | — | | You can exit the secure area by either closing your browser, or for added security, you can use the Log Out button before you close your browser. | |
Other Security Measures
We maintain physical, electronic and procedural safeguards to protect your personal account information. Our employees and agents have access to that information only so that they may offer you products or provide services, for example, when responding to your account questions.
How You Can Help
You can also do your part to keep your account information private and to prevent unauthorized transactions. If you obtain a user ID and password for your account, do not allow it to be used by anyone else. Also, take special precautions when accessing your account on a computer used by others.
Who We Are
This joint notice describes the privacy policies of the Oppenheimer funds, OppenheimerFunds, Inc., and each of its financial institution subsidiaries, the trustee of OppenheimerFunds Individual Retirement Accounts (IRAs) and the custodian of the OppenheimerFunds 403(b)(7) tax sheltered custodial accounts. It applies to all Oppenheimer fund accounts you presently have, or may open in the future, using your Social Security number—whether or not you remain a shareholder of our funds. This notice was last updated November 2012. In the event it is updated or changed, we will post an updated notice on our website at oppenheimerfunds.com. If you have any questions about these privacy policies, write to us at P.O. Box 5270, Denver, CO 80217-5270, email us by clicking on the Contact Us section of our website at oppenheimerfunds.com or call us at 1.800.CALL OPP (225.5677).
OPPENHEIMER GLOBAL FUND 53
THIS PAGE INTENTIONALLY LEFT BLANK.
54 OPPENHEIMER GLOBAL FUND
THIS PAGE INTENTIONALLY LEFT BLANK.
OPPENHEIMER GLOBAL FUND 55

Item 2. Code of Ethics.
Not applicable to semiannual reports.
Item 3. Audit Committee Financial Expert.
Not applicable to semiannual reports.
Item 4. Principal Accountant Fees and Services.
Not applicable to semiannual reports.
Item 5. Audit Committee of Listed Registrants
Not applicable.
Item 6. Schedule of Investments.
a) Not applicable. The complete schedule of investments is included in Item 1 of this Form N-CSR.
b) Not applicable.
Item 7. Disclosure of Proxy Voting Policies and Procedures for Closed-End Management Investment Companies.
Not applicable.
Item 8. Portfolio Managers of Closed-End Management Investment Companies.
Not applicable.
Item 9. Purchases of Equity Securities by Closed-End Management Investment Company and Affiliated Purchasers.
Not applicable.
Item 10. Submission of Matters to a Vote of Security Holders.
The Fund’s Governance Committee Provisions with Respect to Nominations of Directors/Trustees to the Respective Boards
None
Item 11. Controls and Procedures.
Based on their evaluation of the registrant’s disclosure controls and procedures (as defined in rule 30a-3(c) under the Investment Company Act of 1940 (17 CFR 270.30a-3(c)) as of 3/28/2013, the registrant’s principal executive officer and principal financial officer found the registrant’s disclosure controls and procedures to provide reasonable assurances that information required to be disclosed by the registrant in the reports that it files under the Securities Exchange Act of 1934 (a) is accumulated and communicated to registrant’s management, including its principal executive officer and principal financial officer, to allow timely decisions regarding required disclosure, and (b) is recorded, processed, summarized and reported, within the time periods specified in the rules and forms adopted by the U.S. Securities and Exchange Commission.
There have been no changes in the registrant’s internal controls over financial reporting that occurred during the registrant’s second fiscal quarter of the period covered by this report that have materially affected, or are reasonably likely to materially affect, the registrant’s internal control over financial reporting.
Item 12. Exhibits.
| (a) | (1) Not applicable to semiannual reports. |
(2) Exhibits attached hereto.
(3) Not applicable.
| (b) | Exhibit attached hereto. |
SIGNATURES
Pursuant to the requirements of the Securities Exchange Act of 1934 and the Investment Company Act of 1940, the registrant has duly caused this report to be signed on its behalf by the undersigned, thereunto duly authorized.
Oppenheimer Global Fund
| | |
| By: | | /s/ William F. Glavin, Jr. |
| | William F. Glavin, Jr. |
| | Principal Executive Officer |
| Date: | | 5/8/2013 |
Pursuant to the requirements of the Securities Exchange Act of 1934 and the Investment Company Act of 1940, this report has been signed below by the following persons on behalf of the registrant and in the capacities and on the dates indicated.
| | |
| By: | | /s/ William F. Glavin, Jr. |
| | William F. Glavin, Jr. |
| | Principal Executive Officer |
| Date: | | 5/8/2013 |
| | |
| By: | | /s/ Brian W. Wixted |
| | Brian W. Wixted |
| | Principal Financial Officer |
| Date: | | 5/8/2013 |