UNITED STATES
SECURITIES AND EXCHANGE COMMISSION
WASHINGTON, D.C. 20549
FORM N-CSR
CERTIFIED SHAREHOLDER REPORT OF REGISTERED
MANAGEMENT INVESTMENT COMPANIES
Investment Company Act file number 811-1810
Oppenheimer Global Fund
(Exact name of registrant as specified in charter)
6803 South Tucson Way, Centennial, Colorado 80112-3924
(Address of principal executive offices) (Zip code)
Arthur S. Gabinet
OFI Global Asset Management, Inc.
225 Liberty Street, New York, New York 10281-1008
(Name and address of agent for service)
Registrant’s telephone number, including area code: (303) 768-3200
Date of fiscal year end: September 30
Date of reporting period: 3/31/2015
Item 1. Reports to Stockholders.
Table of Contents
Class A Shares
AVERAGE ANNUAL TOTAL RETURNS AT 3/31/15
| | | | | | |
| | | Class A Shares of the Fund | | |
| | | Without Sales Charge | | With Sales Charge | | MSCI All Country (AC)
World Index |
6-Month | | 7.05% | | 0.90% | | 2.73% |
1-Year | | 8.82 | | 2.57 | | 5.42 |
5-Year | | 10.84 | | 9.53 | | 8.99 |
10-Year | | 7.86 | | 7.22 | | 6.44 |
Performance data quoted represents past performance, which does not guarantee future results. The investment return and principal value of an investment in the Fund will fluctuate so that an investor’s shares, when redeemed, may be worth more or less than their original cost. Fund returns include changes in share price, reinvested distributions, and a 5.75% maximum applicable sales charge except where “without sales charge” is indicated. Current performance may be lower or higher than the performance quoted. Returns do not consider capital gains or income taxes on an individual’s investment. Returns for periods of less than one year are cumulative and not annualized. For performance data current to the most recent month-end, visit oppenheimerfunds.com or call 1.800.CALL OPP (225.5677).
2 OPPENHEIMER GLOBAL FUND
Fund Performance Discussion
The Fund’s Class A shares (without sales charge) produced a return of 7.05% during the reporting period. In comparison, the Fund’s benchmark, the MSCI All Country (AC) World Index (the “Index”), returned 2.73% during the same period. The Fund outperformed the Index in eight out of ten sectors, led by stock selection and an overweight in health care, an underweight in energy, and stock selection and an overweight in information technology. The Fund underperformed the Index in consumer staples and consumer discretionary primarily due to stock selection.
MARKET OVERVIEW
For the overall six-month period, stocks in the U.S. generally outperformed other developed market and emerging market equities. Over the first half of the reporting period, the prospects of another European recession, a weakening euro and falling oil prices were among the factors contributing to the volatility of global stock markets. In the face of these uncertainties, equity investors gravitated to the relative safety of U.S. stocks, making it one of the best performing markets in the fourth quarter of 2014. However, over the first quarter 2015, perhaps the most dominant market event was the U.S. dollar surge. It comes as no surprise then, that U.S. stock market averages trailed most developed market bourses during this time by a significant amount, even after adjusting for currency. The underperformance of U.S. stocks during this time was not enough to offset their outperformance over the fourth quarter of 2014.
While we do not disregard macro events, our main focus tends to be on the microeconomic characteristics of individual companies and their valuations. Regardless of how macro
events unfold, we believe companies with strong, durable, economic traits, purchased at sensible prices are likely to have good long-run returns. We don’t construct portfolios to be optimized for specific predictions of the economic environment. We seek to hold a portfolio of investments that is robust in a wide array of environments. In effect, we seek to be a Fund for all seasons.
FUND REVIEW
The largest positive contributors during the six-month reporting period were Celldex Therapeutics, Inc., McGraw Hill Financial, Inc. and Aetna, Inc.
Celldex is a biotechnology company focused on the treatment of cancer. It has a pipeline of therapeutic antibodies and immune system modulators that can be used alone or in combination with other therapies. Part of Celldex’s focus is on orphan, or rare, diseases which can be very lucrative. During the reporting period, Celldex reported strong clinical trial results for one of its key drugs and the stock responded positively.
3 OPPENHEIMER GLOBAL FUND
McGraw Hill Financial has been engaged for some time in a sweeping restructuring, which is now showing results. At period end, the company is largely operating in the business of ratings. It owns Standard & Poor’s and J.D. Power, among others. As the banking industry moves to a more regulated form, capital markets will be a more important mechanism for funding. Capital market offerings typically require ratings. McGraw Hill is well positioned for this.
Aetna is a diversified health care benefits company that benefited as the requirements of the Affordable Care Act (Obamacare) helped drive subscriptions.
Top detractors from performance included Technip SA, Banco Bilbao Vizcaya Argentaria SA (“BBVA”) and Embraer SA.
Technip, a French company, is a global leader in project management, construction and engineering services provided to companies in the energy industry. 2014 was a challenging year for the company as the geopolitical issues in Russia generated concerns for an important project that Technip was recently awarded there. The stock has also been negatively impacted by concerns about the capital expenditure plans of large energy companies in light of falling oil prices. While we cannot predict when the oil markets will stabilize, we believe there is structural demand for Technip’s services that supports its backlog of projects.
BBVA is one of the largest banks in Spain and has over 50% of its earnings coming from Latin America. The stock has been weak on the back of worries about a deteriorating macroeconomic environment in Europe, and Latin American growth rates that were below market expectations. There are some signs of stabilization in Spain and an acceleration of growth in markets like Mexico. Additionally, a cost cutting program and lower funding costs should improve profitability. More importantly for long-term investors, we believe BBVA has the opportunity to expand into faster growing markets and has the capital to fund that expansion.
Embraer, a Brazilian company, is one of the largest builders of aircraft in the world and produces competitive products in its segments. It is particularly strong in mid-size commercial jets, which are benefiting from emerging market demand. Negative sentiment surrounding the outlook for the Brazilian economy has hurt the stock.
STRATEGY & OUTLOOK
Currency seems to be on everyone’s list of concerns given the sharp rise in the U.S. dollar. However, our decisions are about companies, not geographies or currencies. This does not mean we have no opinions. We have, in fact, had an opinion about the euro. We believed it would decline, though we did not concern ourselves with the timing of it.
4 OPPENHEIMER GLOBAL FUND
In the case of our largest performance contributor in the first quarter of 2015, Airbus, currency added an element of opportunity. The base case for the company rests in the duopolistic nature of its competitive position, structurally rising demand for its products and the price at which it was available to us. Currency added another. The company’s share price dropped by around 30% in 2014 as it seems investors were focused on transitory factors. We believe Airbus is a terrific business. Its costs are mostly in euros, while its revenues are in U.S. dollars. It has a 10-year order backlog. Currency is not the main idea; however, it adds some optionality.
Last summer, Janet Yellen did us a favor in Congressional testimony. She noted that valuations for biotechs appeared “substantially stretched.” This of course knocked down the prices of some companies that we were delighted to purchase or add to at lower prices. Most of these have performed very well in the period since. We opened a new position in BioMarin Pharmaceutical after it declined by 18% in 2014. It has since performed strongly.
Biotechs have some characteristics we find attractive. Firstly, the economic logic is pretty clear. First-in-class treatments can have a revolutionary impact on an earnings stream. Secondly, we feel advantaged in our ability to parse the complexity of both the science and economic logic of the businesses. Thirdly, biotechs, as with other health care ideas, are typically less impacted by the economy, so there is both an opportunity element and a diversification element. Given the periodic volatility attached to pipeline developments, we don’t concentrate our positions as we might with other industries.
The Fund is a long-term, growth-oriented investment portfolio. We use a bottom-up, fundamental approach, and seek to invest only in high quality companies with above-average, sustainable growth characteristics. We seek to add value via our individual stock selection, and make no effort to mimic the weights assigned to the Index by sector, region or country. Valuation is a critical part of our investment criteria. Assuming we properly understand a given set of business economics, our return structure is principally a function of paying an appropriate price.
| | |
 | | 
Rajeev Bhaman, CFA Portfolio Manager |
|
5 OPPENHEIMER GLOBAL FUND
Top Holdings and Allocations
TOP TEN COMMON STOCK HOLDINGS
| | | | |
| | |
McGraw Hill Financial, Inc. | | | 2.8% | |
| | |
Telefonaktiebolaget LM Ericsson, Cl. B | | | 2.5 | |
| |
Murata Manufacturing Co. Ltd. | | | 2.3 | |
| |
Altera Corp. | | | 2.2 | |
| |
eBay, Inc. | | | 2.2 | |
| | |
Airbus Group NV | | | 2.1 | |
| |
Walt Disney Co. (The) | | | 2.0 | |
| |
Aetna, Inc. | | | 2.0 | |
| | |
Anthem, Inc. | | | 2.0 | |
| | |
Colgate-Palmolive Co. | | | 1.9 | |
Portfolio holdings and allocations are subject to change. Percentages are as of March 31, 2015, and are based on net assets. For more current Fund holdings, please visit oppenheimerfunds.com.
TOP TEN GEOGRAPHICAL HOLDINGS
| | | | |
| | |
United States | | | 44.5% | |
| |
Japan | | | 11.4 | |
| |
Germany | | | 9.9 | |
| |
Switzerland | | | 5.1 | |
| |
France | | | 4.9 | |
| |
United Kingdom | | | 4.1 | |
| |
Sweden | | | 4.0 | |
| |
Spain | | | 3.5 | |
| |
India | | | 3.2 | |
| |
Brazil | | | 2.6 | |
Portfolio holdings and allocation are subject to change. Percentages are as of March 31, 2015, and are based on total market value of investments.
REGIONAL ALLOCATION
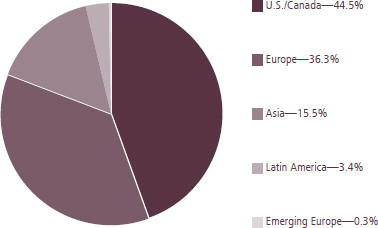
Portfolio holdings and allocations are subject to change. Percentages are as of March 31, 2015, and are based on the total market value of investments.
6 OPPENHEIMER GLOBAL FUND
Share Class Performance
AVERAGE ANNUAL TOTAL RETURNS WITHOUT SALES CHARGE AS OF 3/31/15
| | | | | | | | | | | | | | | | | | | | |
| | | Inception
Date | | | 6-Month | | | 1-Year | | | 5-Year | | | 10-Year | |
Class A (OPPAX) | | | 12/22/69 | | | | 7.05% | | | | 8.82% | | | | 10.84% | | | | 7.86% | |
Class B (OGLBX) | | | 8/17/93 | | | | 6.65% | | | | 7.99% | | | | 9.89% | | | | 7.34% | |
Class C (OGLCX) | | | 10/2/95 | | | | 6.65% | | | | 7.99% | | | | 10.02% | | | | 7.06% | |
Class I (OGLIX) | | | 1/27/12 | | | | 7.29% | | | | 9.31% | | | | 16.22%* | | | | N/A | |
Class R (OGLNX) | | | 3/1/01 | | | | 6.90% | | | | 8.53% | | | | 10.50% | | | | 7.51% | |
Class Y (OGLYX) | | | 11/17/98 | | | | 7.18% | | | | 9.07% | | | | 11.13% | | | | 8.21% | |
AVERAGE ANNUAL TOTAL RETURNS WITH SALES CHARGE AS OF 3/31/15
| | | | | | | | | | | | | | | | | | | | |
| | | Inception
Date | | | 6-Month | | | 1-Year | | | 5-Year | | | 10-Year | |
Class A (OPPAX) | | | 12/22/69 | | | | 0.90% | | | | 2.57% | | | | 9.53% | | | | 7.22% | |
Class B (OGLBX) | | | 8/17/93 | | | | 1.65% | | | | 2.99% | | | | 9.62% | | | | 7.34% | |
Class C (OGLCX) | | | 10/2/95 | | | | 5.65% | | | | 6.99% | | | | 10.02% | | | | 7.06% | |
Class I (OGLIX) | | | 1/27/12 | | | | 7.29% | | | | 9.31% | | | | 16.22%* | | | | N/A | |
Class R (OGLNX) | | | 3/1/01 | | | | 5.90% | | | | 7.53% | | | | 10.50% | | | | 7.51% | |
Class Y (OGLYX) | | | 11/17/98 | | | | 7.18% | | | | 9.07% | | | | 11.13% | | | | 8.21% | |
* Shows performance since inception.
Performance data quoted represents past performance, which does not guarantee future results. The investment return and principal value of an investment in the Fund will fluctuate so that an investor’s shares, when redeemed, may be worth more or less than their original cost. Current performance may be lower or higher than the performance quoted. Returns do not consider capital gains or income taxes on an individual’s investment. Returns for periods of less than one year are cumulative and not annualized. For performance data current to the most recent month-end, visit oppenheimerfunds.com or call 1.800.CALL OPP (225.5677). Fund returns include changes in share price, reinvested distributions, and the applicable sales charge: for Class A shares, the current maximum initial sales charge of 5.75%; for Class B shares, the contingent deferred sales charge (“CDSC”) of 5% (1-year) and 2% (5-year); and for Class C shares, the CDSC of 1% for the 1-year period. Prior to 7/1/14, Class R shares were named Class N shares. Beginning 7/1/14, new purchases of Class R shares will no longer be subject to a CDSC upon redemption (any CDSC will remain in effect for purchases prior to 7/1/14). There is no sales charge for Class I and Class Y shares. Because Class B shares convert to Class A shares 72 months after purchase, the 10-year return for Class B shares uses Class A performance for the period after conversion.
The Fund’s performance is compared to the performance of the MSCI All Country (AC) World Index, a free float-adjusted market capitalization weighted index that is designed to measure the equity market performance of developed and emerging markets. The Index is unmanaged and cannot be purchased directly by investors. While index comparisons may be useful to provide a benchmark for the Fund’s performance, it must be noted that the Fund’s investments are not limited to the investments comprising the Index. Index performance includes reinvestment of income, but does not reflect transaction costs, fees, expenses or
7 OPPENHEIMER GLOBAL FUND
taxes. Index performance is shown for illustrative purposes only as a benchmark for the Fund’s performance, and does not predict or depict performance of the Fund. The Fund’s performance reflects the effects of the Fund’s business and operating expenses.
The Fund’s investment strategy and focus can change over time. The mention of specific fund holdings does not constitute a recommendation by OppenheimerFunds, Inc. or its affiliates.
Before investing in any of the Oppenheimer funds, investors should carefully consider a fund’s investment objectives, risks, charges and expenses. Fund prospectuses and summary prospectuses contain this and other information about the funds, and may be obtained by asking your financial advisor, visiting oppenheimerfunds.com, or calling 1.800.CALL OPP (225.5677). Read prospectuses and summary prospectuses carefully before investing.
Shares of Oppenheimer funds are not deposits or obligations of any bank, are not guaranteed by any bank, are not insured by the FDIC or any other agency, and involve investment risks, including the possible loss of the principal amount invested.
8 OPPENHEIMER GLOBAL FUND
Fund Expenses
Fund Expenses. As a shareholder of the Fund, you incur two types of costs: (1) transaction costs, which may include sales charges (loads) on purchase payments, contingent deferred sales charges on redemptions; and (2) ongoing costs, including management fees; distribution and service fees; and other Fund expenses. These examples are intended to help you understand your ongoing costs (in dollars) of investing in the Fund and to compare these costs with the ongoing costs of investing in other mutual funds.
The examples are based on an investment of $1,000.00 invested at the beginning of the period and held for the entire 6-month period ended March 31, 2015.
Actual Expenses. The first section of the table provides information about actual account values and actual expenses. You may use the information in this section for the class of shares you hold, together with the amount you invested, to estimate the expense that you paid over the period. Simply divide your account value by $1,000.00 (for example, an $8,600.00 account value divided by $1,000.00 = 8.60), then multiply the result by the number in the first section under the heading entitled “Expenses Paid During 6 Months Ended March 31, 2015” to estimate the expenses you paid on your account during this period.
Hypothetical Example for Comparison Purposes. The second section of the table provides information about hypothetical account values and hypothetical expenses based on the Fund’s actual expense ratio for each class of shares, and an assumed rate of return of 5% per year for each class before expenses, which is not the Fund’s actual return. The hypothetical account values and expenses may not be used to estimate the actual ending account balance or expenses you paid for the period. You may use this information to compare the ongoing costs of investing in the Fund and other funds. To do so, compare this 5% hypothetical example for the class of shares you hold with the 5% hypothetical examples that appear in the shareholder reports of the other funds.
Please note that the expenses shown in the table are meant to highlight your ongoing costs only and do not reflect any transactional costs, such as front-end or contingent deferred sales charges (loads). Therefore, the “hypothetical” section of the table is useful in comparing ongoing costs only, and will not help you determine the relative total costs of owning different funds. In addition, if these transactional costs were included, your costs would have been higher.
9 OPPENHEIMER GLOBAL FUND
| | | | | | | | | | | | |
| Actual | | Beginning
Account
Value
October 1, 2014 | | | Ending
Account
Value
March 31, 2015 | | | Expenses
Paid During
6 Months Ended
March 31, 2015 | |
Class A | | | $ 1,000.00 | | | | $ 1,070.50 | | | | $ 5.85 | |
Class B | | | 1,000.00 | | | | 1,066.50 | | | | 9.78 | |
Class C | | | 1,000.00 | | | | 1,066.50 | | | | 9.78 | |
Class I | | | 1,000.00 | | | | 1,072.90 | | | | 3.62 | |
Class R | | | 1,000.00 | | | | 1,069.00 | | | | 7.19 | |
Class Y | | | 1,000.00 | | | | 1,071.80 | | | | 4.61 | |
| | | |
| Hypothetical | | | | | | | | | |
(5% return before expenses) | | | | | | | | | | | | |
Class A | | | 1,000.00 | | | | 1,019.30 | | | | 5.70 | |
Class B | | | 1,000.00 | | | | 1,015.51 | | | | 9.54 | |
Class C | | | 1,000.00 | | | | 1,015.51 | | | | 9.54 | |
Class I | | | 1,000.00 | | | | 1,021.44 | | | | 3.53 | |
Class R | | | 1,000.00 | | | | 1,018.00 | | | | 7.02 | |
Class Y | | | 1,000.00 | | | | 1,020.49 | | | | 4.49 | |
Expenses are equal to the Fund’s annualized expense ratio for that class, multiplied by the average account value over the period, multiplied by 182/365 (to reflect the one-half year period). Those annualized expense ratios, excluding indirect expenses from affiliated funds, based on the 6-month period ended March 31, 2015 are as follows:
| | | | |
| Class | | Expense Ratios | |
Class A | | | 1.13% | |
Class B | | | 1.89 | |
Class C | | | 1.89 | |
Class I | | | 0.70 | |
Class R | | | 1.39 | |
Class Y | | | 0.89 | |
The expense ratios reflect voluntary and/or contractual waivers and/or reimbursements of expenses by the Fund’s Manager. Some of these undertakings may be modified or terminated at any time, as indicated in the Fund’s prospectus. The “Financial Highlights” tables in the Fund’s financial statements, included in this report, also show the gross expense ratios, without such waivers or reimbursements and reduction to custodian expenses, if applicable.
10 OPPENHEIMER GLOBAL FUND
STATEMENT OF INVESTMENTS March 31, 2015 Unaudited
| | | | | | | | |
| | | Shares | | | Value | |
Common Stocks—97.2% | |
Consumer Discretionary—11.1% | |
Hotels, Restaurants & Leisure—1.2% | |
| GTECH SpA | | | 2,697,740 | | | $ | 53,491,502 | |
| McDonald’s Corp. | | | 780,570 | | | | 76,058,741 | |
| | | | | | | | |
| | | | | | | | 129,550,243 | |
Internet & Catalog Retail—0.6% | |
| JD.com, Inc., ADR1 | | | 1,983,606 | | | | 58,278,344 | |
Media—2.6% | | | | | | | | |
| Walt Disney Co. (The) | | | 2,021,140 | | | | 211,997,374 | |
| Zee Entertainment Enterprises Ltd. | | | 10,974,158 | | | | 59,831,860 | |
| | | | | | | | |
| | | | | | | | 271,829,234 | |
Specialty Retail—3.0% | | | | | | | | |
| Inditex SA | | | 5,539,757 | | | | 177,616,378 | |
| Tiffany & Co. | | | 1,509,638 | | | | 132,863,240 | |
| | | | | | | | |
| | | | | | | | 310,479,618 | |
Textiles, Apparel & Luxury Goods—3.7% | |
| Brunello Cucinelli SpA | | | 409,786 | | | | 7,210,471 | |
| Kering | | | 705,891 | | | | 137,975,607 | |
| LVMH Moet Hennessy Louis Vuitton SE | | | 1,059,000 | | | | 186,894,424 | |
| Tod’s SpA | | | 603,520 | | | | 54,768,482 | |
| | | | | | | | |
| | | | | | | | 386,848,984 | |
Consumer Staples—5.9% | |
Beverages—1.3% | | | | | | | | |
| Ambev SA, ADR | | | 9,899,250 | | | | 57,019,680 | |
| Fomento Economico Mexicano SAB de CV, ADR1 | | | 826,173 | | | | 77,247,175 | |
| | | | | | | | |
| | | | | | | | 134,266,855 | |
Food Products—2.7% | | | | | | | | |
| Nestle SA | | | 1,374,966 | | | | 103,809,149 | |
| Unilever plc | | | 4,186,949 | | | | 174,630,569 | |
| | | | | | | | |
| | | | | | | | 278,439,718 | |
Household Products—1.9% | | | | | |
Colgate-Palmolive Co. | | | 2,931,778 | | | | 203,289,487 | |
Energy—1.6% | | | | | | | | |
Energy Equipment & Services—1.0% | |
| Technip SA | | | 1,642,460 | | | | 99,544,959 | |
| | | | | | | | |
| | | Shares | | | Value | |
Oil, Gas & Consumable Fuels—0.6% | |
Repsol SA | | | 3,421,873 | | | $ | 63,638,033 | |
Financials—22.0% | |
Capital Markets—5.4% | |
| Credit Suisse Group | | | | | | | | |
| AG1 | | | 4,628,220 | | | | 124,599,693 | |
| Deutsche Bank AG | | | 2,580,279 | | | | 89,773,137 | |
| Goldman Sachs Group, Inc. (The) | | | 823,348 | | | | 154,764,724 | |
| UBS Group AG1 | | | 10,293,583 | | | | 193,186,169 | |
| | | | | | | | |
| | | | | | | | 562,323,723 | |
Commercial Banks—6.9% | |
| Banco Bilbao | | | | | | | | |
| Vizcaya Argentaria SA | | | 11,865,671 | | | | 119,746,994 | |
| Citigroup, Inc. | | | 3,891,510 | | | | 200,490,595 | |
| ICICI Bank Ltd., Sponsored ADR | | | 15,126,365 | | | | 156,709,141 | |
| Itau Unibanco Holding SA, ADR | | | 5,845,917 | | | | 64,655,842 | |
| Societe Generale SA | | | 1,830,816 | | | | 88,515,222 | |
| Sumitomo Mitsui Financial Group, Inc. | | | 2,380,100 | | | | 91,203,697 | |
| | | | | | | | |
| | | | | | | | 721,321,491 | |
Diversified Financial Services—3.3% | |
| BM&FBovespa SA - Bolsa de Valores Mercadorias e Futuros | | | 14,776,700 | | | | 51,670,183 | |
| McGraw Hill Financial, Inc. | | | 2,795,039 | | | | 289,007,032 | |
| | | | | | | | |
| | | | | | | | 340,677,215 | |
Insurance—5.4% | |
| Allianz SE | | | 1,024,498 | | | | 178,018,541 | |
| Dai-ichi Life Insurance Co. Ltd. (The) | | | 7,727,800 | | | | 112,271,054 | |
| FNF Group | | | 2,202,260 | | | | 80,955,078 | |
| Prudential plc | | | 7,786,990 | | | | 192,807,502 | |
| | | | | | | | |
| | | | | | | | 564,052,175 | |
Real Estate Management & Development—1.0% | |
| DLF Ltd. | | | 43,566,942 | | | | 109,731,592 | |
11 OPPENHEIMER GLOBAL FUND
STATEMENT OF INVESTMENTS Unaudited / Continued
| | | | | | | | |
| | | Shares | | | Value | |
Health Care—17.6% | |
Biotechnology—7.9% | |
| ACADIA Pharmaceuticals, Inc.1 | | | 1,814,519 | | | $ | 59,135,174 | |
| Biogen, Inc.1 | | | 278,040 | | | | 117,399,610 | |
| BioMarin Pharmaceutical, Inc.1 | | | 777,784 | | | | 96,927,442 | |
| Bluebird Bio, Inc.1 | | | 287,460 | | | | 34,716,544 | |
| Celldex Therapeutics, Inc.1 | | | 4,292,539 | | | | 119,633,062 | |
| Circassia Pharmaceuticals plc1,3 | | | 11,273,030 | | | | 46,791,049 | |
| Clovis Oncology, Inc.1 | | | 804,600 | | | | 59,725,458 | |
| Gilead Sciences, Inc.1 | | | 1,335,570 | | | | 131,059,484 | |
| Medivation, Inc.1 | | | 408,551 | | | | 52,731,678 | |
| Vertex Pharmaceuticals, Inc.1 | | | 893,897 | | | | 105,453,029 | |
| | | | | | | | |
| | | | | | | | 823,572,530 | |
Health Care Equipment & Supplies—2.0% | |
| St. Jude Medical, Inc. | | | 997,330 | | | | 65,225,382 | |
| Swiss Medical SA1,2,3 | | | 182,400,000 | | | | 17,671,824 | |
| Zimmer Holdings, Inc. | | | 1,044,024 | | | | 122,693,700 | |
| | | | | | | | |
| | | | | | | | 205,590,906 | |
Health Care Providers & Services—4.0% | |
| Aetna, Inc. | | | 1,981,729 | | | | 211,113,591 | |
| Anthem, Inc. | | | 1,355,115 | | | | 209,243,307 | |
| | | | | | | | |
| | | | | | | | 420,356,898 | |
Pharmaceuticals—3.7% | |
| Bayer AG | | | 1,166,182 | | | | 175,224,923 | |
| Roche Holding AG | | | 340,115 | | | | 93,784,228 | |
| Shire plc | | | 931,722 | | | | 74,090,854 | |
| Theravance Biopharma, Inc.1 | | | 588,092 | | | | 10,203,396 | |
| Theravance, Inc. | | | 2,324,924 | | | | 36,547,805 | |
| | | | | | | | |
| | | | | | | | 389,851,206 | |
Industrials—11.8% | |
Aerospace & Defense—2.9% | |
| Airbus Group NV | | | 3,405,838 | | | | 221,312,852 | |
| | | | | | | | |
| | | Shares | | | Value | |
Aerospace & Defense (Continued) | |
| Embraer SA, | | | | | | | | |
| Sponsored ADR | | | 2,686,315 | | | $ | 82,604,186 | |
| | | | | | | | |
| | | | | | | | 303,917,038 | |
Air Freight & Couriers—1.1% | |
United Parcel Service, Inc., Cl. B | | | 1,160,680 | | | | 112,516,319 | |
Building Products—1.5% | |
Assa Abloy AB, Cl. B | | | 2,711,069 | | | | 161,583,066 | |
Construction & Engineering—0.4% | |
FLSmidth & Co. AS | | | 942,633 | | | | 42,433,508 | |
Electrical Equipment—2.5% | |
| Emerson Electric Co. | | | 1,401,240 | | | | 79,338,209 | |
| Nidec Corp. | | | 2,075,216 | | | | 138,008,859 | |
| Prysmian SpA | | | 1,899,226 | | | | 39,125,860 | |
| | | | | | | | |
| | | | | | | | 256,472,928 | |
Industrial Conglomerates—2.6% | |
| 3M Co. | | | 926,680 | | | | 152,855,866 | |
| Seibu Holdings, Inc. | | | 838,700 | | | | 21,689,413 | |
| Siemens AG | | | 845,686 | | | | 91,557,832 | |
| | | | | | | | |
| | | | | | | | 266,103,111 | |
Machinery—0.8% | |
FANUC Corp. | | | 398,600 | | | | 87,104,735 | |
Information Technology—24.0% | |
Communications Equipment—2.5% | |
Telefonaktiebolaget LM Ericsson, Cl. B | | | 20,558,110 | | | | 258,001,210 | |
Electronic Equipment, Instruments, & Components—5.4% | |
| Keyence Corp. | | | 346,453 | | | | 189,235,824 | |
| Kyocera Corp. | | | 2,278,400 | | | | 125,047,360 | |
| Murata Manufacturing Co. Ltd. | | | 1,775,904 | | | | 244,666,006 | |
| | | | | | | | |
| | | | | | | | 558,949,190 | |
Internet Software & Services—6.8% | |
| eBay, Inc.1 | | | 3,916,898 | | | | 225,926,676 | |
| Facebook, Inc., Cl. A1 | | | 1,910,980 | | | | 157,111,221 | |
| Google, Inc., Cl. A1 | | | 288,100 | | | | 159,809,070 | |
| Google, Inc., Cl. C1 | | | 260,030 | | | | 142,496,440 | |
12 OPPENHEIMER GLOBAL FUND
| | | | | | | | |
| | | Shares | | | Value | |
Internet Software & Services (Continued) | |
| Qihoo 360 Technology Co. Ltd., ADR1 | | | 568,170 | | | $ | 29,090,304 | |
| | | | | | | | |
| | | | | | | 714,433,711 | |
IT Services—0.1% | |
| Earthport plc1,3 | | | 25,232,055 | | | | 16,429,036 | |
Semiconductors & Semiconductor Equipment—4.0% | |
| Altera Corp. | | | 5,458,877 | | | | 234,240,412 | |
| Maxim Integrated Products, Inc. | | | 5,243,335 | | | | 182,520,491 | |
| | | | | | | | |
| | | | | | | 416,760,903 | |
Software—5.2% | |
| Adobe Systems, Inc.1 | | | 2,352,874 | | | | 173,971,504 | |
| Intuit, Inc. | | | 1,911,290 | | | | 185,318,678 | |
| SAP SE | | | 2,483,510 | | | | 180,341,630 | |
| | | | | | | | |
| | | | | | | 539,631,812 | |
Materials—1.5% | |
Chemicals—1.1% | |
| Linde AG | | | 547,037 | | | | 111,523,973 | |
Metals & Mining—0.4% | |
| Alrosa AO | | | 24,239,815 | | | | 29,970,422 | |
| Vale SA, Cl. B, Sponsored ADR | | | 3,003,270 | | | | 16,968,476 | |
| | | | | | | | |
| | | | | | | 46,938,898 | |
Telecommunication Services—1.7% | |
Wireless Telecommunication Services—1.7% | |
| KDDI Corp. | | | 7,685,700 | | | | 174,128,196 | |
| | | | | | | | |
Total Common Stocks (Cost $5,592,222,364) | | | | | | | 10,140,570,845 | |
| | | | | | | | |
| | | Shares | | | Value | |
Preferred Stocks—2.0% | | | | | |
| Bayerische Motoren Werke (BMW) AG, Preference | | | 2,190,741 | | | $ | 202,855,237 | |
| Zee Entertainment Enterprises Ltd., 6% Cum. Non-Cv. | | | 294,074,928 | | | | 3,900,245 | |
| | | | | | | | |
| Total Preferred Stocks | | | | | | | | |
| (Cost $73,468,394) | | | | | | | 206,755,482 | |
Rights, Warrants and Certificates—0.0% | |
Banco Bilbao Vizcaya Argentaria SA Rts., Strike Price 1EUR, Exp. 4/14/151 (Cost $0) | | | 11,865,671 | | | | 1,709,647 | |
Investment Company—0.6% | | | | | |
Oppenheimer Institutional Money Market Fund, Cl. E, 0.12%3,4 (Cost $59,730,705) | | | 59,730,705 | | | | 59,730,705 | |
Total Investments, at Value (Cost $5,725,421,463) | | | 99.8 | % | | | 10,408,766,679 | |
| Net Other Assets (Liabilities) | | | 0.2 | | | | 17,773,070 | |
| | | | |
| Net Assets | | | 100.0 | % | | $ | 10,426,539,749 | |
| | | | |
Footnotes to Statement of Investments
Strike price is reported in U.S. Dollars, except for those denoted in the following currency:
EUR Euro
1. Non-income producing security.
2. Restricted security. The aggregate value of restricted securities as of March 31, 2015 was $17,671,824, which represents 0.17% of the Fund’s net assets. See Note 4 of the accompanying Notes. Information concerning restricted securities is as follows:
| | | | | | | | | | | | | | | | |
| Security | | Acquisition
Dates | | | Cost | | | Value | | | Unrealized
Depreciation | |
| Swiss Medical SA | | | 5/16/94-7/10/02 | | | $ | 30,390,000 | | | | $ 17,671,824 | | | $ | 12,718,176 | |
13 OPPENHEIMER GLOBAL FUND
|
| STATEMENT OF INVESTMENTS Unaudited / Continued |
Footnotes to Statement of Investments (Continued)
3. Is or was an affiliate, as defined in the Investment Company Act of 1940, as amended, at or during the period ended March 31, 2015, by virtue of the Fund owning at least 5% of the voting securities of the issuer or as a result of the Fund and the issuer having the same investment adviser. Transactions during the period in which the issuer was an affiliate are as follows:
| | | | | | | | | | | | | | | | |
| | | Shares September 30, 2014 | | | Gross Additions | | | Gross Reductions | | | Shares March 31, 2015 | |
| Circassia Pharmaceuticals plc | | | 8,965,210 | | | | 2,307,820 | | | | — | | | | 11,273,030 | |
| Earthport plc | | | 22,095,077 | | | | 3,136,978 | | | | — | | | | 25,232,055 | |
| Oppenheimer Institutional Money Market Fund, Cl. E | | | — | | | | 335,058,849 | | | | 275,328,144 | | | | 59,730,705 | |
| Swiss Medical SA | | | 49,975,200 | | | | 182,400,000 | a | | | 49,975,200 | a | | | 182,400,000 | |
| | | | | | | | |
| | | Value | | | Income | |
| Circassia Pharmaceuticals plc | | $ | 46,791,049 | | | $ | — | |
| Earthport plc | | | 16,429,036 | | | | — | |
| Oppenheimer Institutional Money Market Fund, Cl. E | | | 59,730,705 | | | | 6,686 | |
| Swiss Medical SA | | | 17,671,824 | | | | — | |
| | | | |
| Total | | $ | 140,622,614 | | | $ | 6,686 | |
| | | | |
a. All or a portion is the result of a corporate action.
4. Rate shown is the 7-day yield as of March 31, 2015.
Distribution of investments representing geographic holdings, as a percentage of total investments at value, is as follows:
| | | | | | | | |
| Geographic Holdings | | Value | | | Percent | |
| United States | | $ | 4,636,867,129 | | | | 44.5 | % |
| Japan | | | 1,183,355,144 | | | | 11.4 | |
| Germany | | | 1,029,295,273 | | | | 9.9 | |
| Switzerland | | | 533,051,063 | | | | 5.1 | |
| France | | | 512,930,211 | | | | 4.9 | |
| United Kingdom | | | 430,658,156 | | | | 4.1 | |
| Sweden | | | 419,584,275 | | | | 4.0 | |
| Spain | | | 362,711,052 | | | | 3.5 | |
| India | | | 330,172,838 | | | | 3.2 | |
| Brazil | | | 272,918,367 | | | | 2.6 | |
| Netherlands | | | 221,312,852 | | | | 2.1 | |
| Italy | | | 154,596,315 | | | | 1.5 | |
| China | | | 87,368,648 | | | | 0.9 | |
| Mexico | | | 77,247,176 | | | | 0.8 | |
| Ireland | | | 74,090,854 | | | | 0.7 | |
| Denmark | | | 42,433,508 | | | | 0.4 | |
| Russia | | | 29,970,422 | | | | 0.3 | |
| Cayman Islands | | | 10,203,396 | | | | 0.1 | |
| | | | |
| Total | | $ | 10,408,766,679 | | | | 100.0 | % |
| | | | |
See accompanying Notes to Financial Statements.
14 OPPENHEIMER GLOBAL FUND
STATEMENT OF ASSETS AND LIABILITIES March 31, 2015 Unaudited
| | | | |
Assets | | | | |
| Investments, at value—see accompanying statement of investments: | | | | |
| Unaffiliated companies (cost $5,563,493,941) | | $ | 10,268,144,065 | |
| Affiliated companies (cost $161,927,522) | | | 140,622,614 | |
| | | | |
| | | | 10,408,766,679 | |
| Cash | | | 6,847,125 | |
| Receivables and other assets: | | | | |
| Dividends | | | 23,438,963 | |
| Investments sold | | | 956,221 | |
| Shares of beneficial interest sold | | | 617,833 | |
| Other | | | 1,072,358 | |
| | | | |
Total assets | | | 10,441,699,179 | |
Liabilities | | | | |
| Payables and other liabilities: | | | | |
| Shares of beneficial interest redeemed | | | 8,788,822 | |
| Trustees’ compensation | | | 2,221,056 | |
| Distribution and service plan fees | | | 1,855,735 | |
| Investments purchased | | | 1,124,896 | |
| Foreign capital gains tax | | | 919,646 | |
| Shareholder communications | | | 13,352 | |
| Other | | | 235,923 | |
| | | | |
Total liabilities | | | 15,159,430 | |
Net Assets | | $ | 10,426,539,749 | |
| | | | |
| | | | |
Composition of Net Assets | | | | |
| Paid-in capital | | $ | 5,455,816,538 | |
| Accumulated net investment income | | | 9,024,447 | |
| Accumulated net realized gain on investments and foreign currency transactions | | | 281,006,832 | |
| Net unrealized appreciation on investments and translation of assets and liabilities denominated in foreign currencies | | | 4,680,691,932 | |
| | | | |
Net Assets | | $ | 10,426,539,749 | |
| | | | |
15 OPPENHEIMER GLOBAL FUND
STATEMENT OF ASSETS AND LIABILITIES Unaudited / Continued
| | | | |
Net Asset Value Per Share | | | | |
| Class A Shares: | | | | |
| Net asset value and redemption price per share (based on net assets of $7,672,659,313 and 94,038,779 shares of beneficial interest outstanding) | | $ | 81.59 | |
| |
| Maximum offering price per share (net asset value plus sales charge of 5.75% of offering price) | | $ | 86.57 | |
Class B Shares: | | | | |
| Net asset value, redemption price (excludes applicable contingent deferred sales charge) and offering price per share (based on net assets of $91,774,249 and 1,224,426 shares of beneficial interest outstanding) | | $ | 74.95 | |
Class C Shares: | | | | |
| Net asset value, redemption price (excludes applicable contingent deferred sales charge) and offering price per share (based on net assets of $721,760,504 and 9,500,235 shares of beneficial interest outstanding) | | $ | 75.97 | |
Class I Shares: | | | | |
| Net asset value, redemption price and offering price per share (based on net assets of $437,148,807 and 5,348,969 shares of beneficial interest outstanding) | | $ | 81.73 | |
Class R Shares: | | | | |
| Net asset value, redemption price (excludes applicable contingent deferred sales charge) and offering price per share (based on net assets of $241,922,077 and 2,978,454 shares of beneficial interest outstanding) | | $ | 81.22 | |
Class Y Shares: | | | | |
| Net asset value, redemption price and offering price per share (based on net assets of $1,261,274,799 and 15,433,786 shares of beneficial interest outstanding) | | $ | 81.72 | |
See accompanying Notes to Financial Statements.
16 OPPENHEIMER GLOBAL FUND
STATEMENT OF OPERATIONS For the Six Months Ended March 31, 2015 Unaudited
| | | | |
Investment Income | | | | |
| Dividends: | | | | |
| Unaffiliated companies (net of foreign withholding taxes of $5,992,103) | | $ | 75,424,684 | |
| Affiliated companies | | | 6,686 | |
| Interest | | | 1,034 | |
| Portfolio lending fees | | | 1,679,628 | |
| | | | |
Total investment income | | | 77,112,032 | |
Expenses | | | | |
| Management fees | | | 32,971,638 | |
| Distribution and service plan fees: | | | | |
| Class A | | | 8,711,833 | |
| Class B | | | 482,364 | |
| Class C | | | 3,437,694 | |
| Class R | | | 582,075 | |
| Transfer and shareholder servicing agent fees: | | | | |
| Class A | | | 8,110,141 | |
| Class B | | | 106,502 | |
| Class C | | | 757,619 | |
| Class I | | | 57,658 | |
| Class R | | | 256,799 | |
| Class Y | | | 1,407,287 | |
| Shareholder communications: | | | | |
| Class A | | | 25,105 | |
| Class B | | | 2,385 | |
| Class C | | | 3,955 | |
| Class I | | | 123 | |
| Class R | | | 1,055 | |
| Class Y | | | 3,721 | |
| Custodian fees and expenses | | | 419,516 | |
| Trustees’ compensation | | | 81,203 | |
| Other | | | 355,370 | |
| | | | |
| Total expenses | | | 57,774,043 | |
| Less reduction to custodian expenses | | | (952 | ) |
| Less waivers and reimbursements of expenses | | | (6,238 | ) |
| | | | |
| Net expenses | | | 57,766,853 | |
| Net Investment Income | | | 19,345,179 | |
17 OPPENHEIMER GLOBAL FUND
STATEMENT OF OPERATIONS Unaudited / Continued
| | | | |
Realized and Unrealized Gain (Loss) | | | | |
| Net realized gain (loss) on: | | | | |
| Investments from unaffiliated companies | | $ | 344,316,591 | |
| Foreign currency transactions | | | (691,629 | ) |
| | | | |
| Net realized gain | | | 343,624,962 | |
| Net change in unrealized appreciation/depreciation on: | | | | |
| Investments (net of foreign capital gains tax of $ 919,646) | | | 651,989,765 | |
| Translation of assets and liabilities denominated in foreign currencies | | | (324,998,850 | ) |
| | | | |
Net change in unrealized appreciation/depreciation | | | 326,990,915 | |
| Net Increase in Net Assets Resulting from Operations | | $ | 689,961,056 | |
| | | | |
See accompanying Notes to Financial Statements.
18 OPPENHEIMER GLOBAL FUND
STATEMENTS OF CHANGES IN NET ASSETS
| | | | | | | | |
| | | Six Months Ended
March 31, 2015
(Unaudited) | | | Year Ended
September 30, 2014 | |
| Operations | | | | | | |
| Net investment income | | $ | 19,345,179 | | | $ | 74,073,733 | |
| Net realized gain | | | 343,624,962 | | | | 549,159,144 | |
| Net change in unrealized appreciation/depreciation | | | 326,990,915 | | | | 361,838,330 | |
| | | | | | | | |
| Net increase in net assets resulting from operations | | | 689,961,056 | | | | 985,071,207 | |
| Dividends and/or Distributions to Shareholders | | | | | | |
| Dividends from net investment income: | | | | | | | | |
| Class A | | | (61,467,461 | ) | | | (59,393,783 | ) |
| Class C | | | (1,022,421 | ) | | | (1,359,373 | ) |
| Class I | | | (4,518,661 | ) | | | (1,357,791 | ) |
| Class R1 | | | (1,345,570 | ) | | | (1,274,996 | ) |
| Class Y | | | (12,695,076 | ) | | | (14,486,460 | ) |
| | | | |
| | | (81,049,189 | ) | | | (77,872,403 | ) |
| Distributions from net realized gain: | | | | | | | | |
| Class A | | | (353,319,441 | ) | | | (221,947,310 | ) |
| Class B | | | (5,047,241 | ) | | | (4,372,006 | ) |
| Class C | | | (34,937,537 | ) | | | (21,297,482 | ) |
| Class I | | | (16,921,008 | ) | | | (3,195,806 | ) |
| Class R1 | | | (11,142,468 | ) | | | (6,673,285 | ) |
| Class Y | | | (58,127,451 | ) | | | (40,209,096 | ) |
| | | | |
| | | (479,495,146 | ) | | | (297,694,985 | ) |
| Beneficial Interest Transactions | | | | | | |
| Net increase (decrease) in net assets resulting from beneficial interest transactions: | | | | | | | | |
| Class A | | | 226,320,733 | | | | (597,086,402 | ) |
| Class B | | | (18,631,893 | ) | | | (42,468,601 | ) |
| Class C | | | 17,735,343 | | | | (9,603,269 | ) |
| Class I | | | 86,028,568 | | | | 267,533,826 | |
| Class R1 | | | 1,843,884 | | | | 9,429,498 | |
| Class Y | | | (232,935,419 | ) | | | 66,066,541 | |
| | | | | | | | |
| | | 80,361,216 | | | | (306,128,407 | ) |
| Net Assets | | | | | | |
| Total increase | | | 209,777,937 | | | | 303,375,412 | |
| Beginning of period | | | 10,216,761,812 | | | | 9,913,386,400 | |
| | | | | | | | |
| End of period (including accumulated net investment income of $9,024,447 and $70,728,457, respectively) | | $ | 10,426,539,749 | | | $ | 10,216,761,812 | |
| | | | |
1. Effective July 1, 2014, Class N shares were renamed Class R. See Note 2 of the accompanying Notes.
See accompanying Notes to Financial Statements.
19 OPPENHEIMER GLOBAL FUND
FINANCIAL HIGHLIGHTS
| | | | | | | | | | | | | | | | | | | | | | | | |
| Class A | | Six Months
Ended March 31, 2015
(Unaudited) | | | Year Ended
September 30, 2014 | | | Year Ended
September 30, 2013 | | | Year Ended
September 28, 20121 | | | Year Ended
September 30, 2011 | | | Year Ended
September 30, 2010 | |
Per Share Operating Data | | | | | | | | | | | | | | | | | | | | | | | | |
Net asset value, beginning of period | | $ | 80.61 | | | $ | 76.06 | | | $ | 60.82 | | | $ | 51.78 | | | $ | 56.31 | | | $ | 50.85 | |
Income (loss) from investment operations: | | | | | | | | | | | | | | | | | | | | | | | | |
Net investment income2 | | | 0.16 | | | | 0.58 | | | | 0.61 | | | | 0.56 | | | | 1.06 | | | | 0.41 | |
Net realized and unrealized gain (loss) | | | 5.30 | | | | 6.87 | | | | 15.36 | | | | 9.56 | | | | (4.66) | | | | 5.33 | |
| | | | |
Total from investment operations | | | 5.46 | | | | 7.45 | | | | 15.97 | | | | 10.12 | | | | (3.60) | | | | 5.74 | |
Dividends and/or distributions to shareholders: | | | | | | | | | | | | | | | | | | | | | | | | |
Dividends from net investment income | | | (0.66) | | | | (0.61) | | | | (0.63) | | | | (1.06) | | | | (0.50) | | | | (0.28) | |
Distributions from net realized gain | | | (3.82) | | | | (2.29) | | | | (0.10) | | | | (0.02) | | | | (0.43) | | | | 0.00 | |
| | | | |
| Total dividends and/or distributions to shareholders | | | (4.48) | | | | (2.90) | | | | (0.73) | | | | (1.08) | | | | (0.93) | | | | (0.28) | |
Net asset value, end of period | | $ | 81.59 | | | $ | 80.61 | | | $ | 76.06 | | | $ | 60.82 | | | $ | 51.78 | | | $ | 56.31 | |
| | | | |
Total Return, at Net Asset Value3 | | | 7.05 | % | | | 10.01 | % | | | 26.52 | % | | | 19.80 | % | | | (6.59) | % | | | 11.32 | % |
| | | | | | | | | |
Ratios/Supplemental Data | | | | | | | | | | | | | | | | | | | | | | | | |
Net assets, end of period (in thousands) | | $ | 7,672,659 | | | $ | 7,351,617 | | | $ | 7,497,366 | | | $ | 6,509,607 | | | $ | 6,181,685 | | | $ | 7,282,538 | |
Average net assets (in thousands) | | $ | 7,395,769 | | | $ | 7,648,870 | | | $ | 7,017,280 | | | $ | 6,551,108 | | | $ | 7,646,696 | | | $ | 7,229,903 | |
Ratios to average net assets:4 | | | | | | | | | | | | | | | | | | | | | | | | |
Net investment income | | | 0.41 | % | | | 0.72 | % | | | 0.89 | % | | | 0.99 | % | | | 1.74 | % | | | 0.78 | % |
Total expenses5 | | | 1.13 | % | | | 1.14 | % | | | 1.19 | % | | | 1.22 | % | | | 1.16 | % | | | 1.20 | % |
| Expenses after payments, waivers and/or reimbursements and reduction to custodian expenses | | | 1.13 | % | | | 1.14 | % | | | 1.19 | % | | | 1.22 | % | | | 1.16 | % | | | 1.20 | % |
Portfolio turnover rate | | | 3 | % | | | 11 | % | | | 11 | % | | | 12 | % | | | 13 | % | | | 13 | % |
20 OPPENHEIMER GLOBAL FUND
1. September 28, 2012 represents the last business day of the Fund’s reporting period.
2. Per share amounts calculated based on the average shares outstanding during the period.
3. Assumes an initial investment on the business day before the first day of the fiscal period, with all dividends and distributions reinvested in additional shares on the reinvestment date, and redemption at the net asset value calculated on the last business day of the fiscal period. Sales charges are not reflected in the total returns. Total returns are not annualized for periods less than one full year. Returns do not reflect the deduction of taxes that a shareholder would pay on fund distributions or the redemption of fund shares. The returns do not include adjustments in accordance with generally accepted accounting principles required at the period end for financial reporting purposes.
4. Annualized for periods less than one full year.
5. Total expenses including indirect expenses from affiliated fund fees and expenses were as follows:
| | |
Six Months Ended March 31, 2015 | | 1.13% |
Year Ended September 30, 2014 | | 1.14% |
Year Ended September 30, 2013 | | 1.19% |
Year Ended September 28, 2012 | | 1.22% |
Year Ended September 30, 2011 | | 1.16% |
Year Ended September 30, 2010 | | 1.20% |
See accompanying Notes to Financial Statements.
21 OPPENHEIMER GLOBAL FUND
FINANCIAL HIGHLIGHTS Continued
| | | | | | | | | | | | | | | | | | | | | | | | |
| Class B | | Six Months
Ended
March 31,
2015
(Unaudited) | | | Year Ended
September
30, 2014 | | | Year Ended
September
30, 2013 | | | Year Ended
September
28, 20121 | | | Year Ended
September
30, 2011 | | | Year Ended
September
30, 2010 | |
Per Share Operating Data | | | | | | | | | | | | | | | | | | | | | | | | |
Net asset value, beginning of period | | $ | 74.03 | | | $ | 70.04 | | | $ | 56.03 | | | $ | 47.59 | | | $ | 51.82 | | | $ | 46.96 | |
| Income (loss) from investment operations: | | | | | | | | | | | | | | | | | | | | | | | | |
| Net investment income (loss)2 | | | (0.14 | ) | | | (0.08 | ) | | | (0.02 | ) | | | 0.06 | | | | 0.44 | | | | (0.06 | ) |
| Net realized and unrealized gain (loss) | | | 4.88 | | | | 6.36 | | | | 14.21 | | | | 8.84 | | | | (4.24 | ) | | | 4.92 | |
| | | | |
| Total from investment operations | | | 4.74 | | | | 6.28 | | | | 14.19 | | | | 8.90 | | | | (3.80 | ) | | | 4.86 | |
| Dividends and/or distributions to shareholders: | | | | | | | | | | | | | | | | | | | | | | | | |
| Dividends from net investment income | | | 0.00 | | | | 0.00 | | | | (0.08 | ) | | | (0.44 | ) | | | 0.00 | | | | 0.00 | |
| Distributions from net realized gain | | | (3.82 | ) | | | (2.29 | ) | | | (0.10 | ) | | | (0.02 | ) | | | (0.43 | ) | | | 0.00 | |
| | | | |
| Total dividends and/or distributions to shareholders | | | (3.82 | ) | | | (2.29 | ) | | | (0.18 | ) | | | (0.46 | ) | | | (0.43 | ) | | | 0.00 | |
| Net asset value, end of period | | $ | 74.95 | | | $ | 74.03 | | | $ | 70.04 | | | $ | 56.03 | | | $ | 47.59 | | | $ | 51.82 | |
| | | | |
Total Return, at Net Asset Value3 | | | 6 .65 | % | | | 9.14 | % | | | 25.39% | | | | 18.81% | | | | (7.44)% | | | | 10.35% | |
| | | | | | | | | |
Ratios/Supplemental Data | | | | | | | | | | | | | | | | | | | | | | | | |
| Net assets, end of period (in thousands) | | $ | 91,774 | | | $ | 109,495 | | | $ | 144,206 | | | $ | 163,538 | | | $ | 197,530 | | | $ | 308,804 | |
| Average net assets (in thousands) | | $ | 97,011 | | | $ | 128,588 | | | $ | 152,754 | | | $ | 182,874 | | | $ | 282,805 | | | $ | 344,445 | |
| Ratios to average net assets:4 | | | | | | | | | | | | | | | | | | | | | | | | |
| Net investment income (loss) | | | (0.38 | )% | | | (0.11 | )% | | | (0.03 | )% | | | 0.11 | % | | | 0.77 | % | | | (0.12 | )% |
| Total expenses5 | | | 1.89 | % | | | 1.98 | % | | | 2.20 | % | | | 2.24 | % | | | 2.20 | % | | | 2.23 | % |
| Expenses after payments, waivers and/or reimbursements and reduction to custodian expenses | | | 1.89 | % | | | 1.95 | % | | | 2.10 | % | | | 2.07 | % | | | 2.07 | % | | | 2.07 | % |
| Portfolio turnover rate | | | 3 | % | | | 11 | % | | | 11 | % | | | 12 | % | | | 13 | % | | | 13 | % |
1. September 28, 2012 represents the last business day of the Fund’s reporting period.
2. Per share amounts calculated based on the average shares outstanding during the period.
3. Assumes an initial investment on the business day before the first day of the fiscal period, with all dividends and distributions reinvested in additional shares on the reinvestment date, and redemption at the net asset value calculated on the last business day of the fiscal period. Sales charges are not reflected in the total returns. Total returns are not annualized for periods less than one full year. Returns do not reflect the deduction of taxes that a shareholder would pay on fund distributions or the redemption of fund shares. The returns do not include adjustments in accordance with generally accepted accounting principles required at the period end for financial reporting purposes.
4. Annualized for periods less than one full year.
5. Total expenses including indirect expenses from affiliated fund fees and expenses were as follows:
| | |
Six Months Ended March 31, 2015 | | 1.89% |
Year Ended September 30, 2014 | | 1.98% |
Year Ended September 30, 2013 | | 2.20% |
Year Ended September 28, 2012 | | 2.24% |
Year Ended September 30, 2011 | | 2.20% |
Year Ended September 30, 2010 | | 2.23% |
See accompanying Notes to Financial Statements.
22 OPPENHEIMER GLOBAL FUND
| | | | | | | | | | | | | | | | | | | | | | | | |
| Class C | | Six Months
Ended March 31,
2015
(Unaudited) | | | Year Ended
September
30, 2014 | | | Year Ended
September
30, 2013 | | | Year Ended
September
28, 20121 | | | Year Ended
September
30, 2011 | | | Year Ended
September
30, 2010 | |
Per Share Operating Data | | | | | | | | | | | | | | | | | | | | | | | | |
Net asset value, beginning of period | | $ | 75.10 | | | $ | 71.11 | | | $ | 56.93 | | | $ | 48.46 | | | $ | 52.78 | | | $ | 47.76 | |
| Income (loss) from investment operations: | | | | | | | | | | | | | | | | | | | | | | | | |
| Net investment income (loss)2 | | | (0.13 | ) | | | (0.01 | ) | | | 0.11 | | | | 0.14 | | | | 0.56 | | | | 0.01 | |
| Net realized and unrealized gain (loss) | | | 4.93 | | | | 6.44 | | | | 14.41 | | | | 8.96 | | | | (4.34 | ) | | | 5.01 | |
| | | | |
Total from investment operations | | | 4.80 | | | | 6.43 | | | | 14.52 | | | | 9.10 | | | | (3.78) | | | | 5.02 | |
| Dividends and/or distributions to shareholders: | | | | | | | | | | | | | | | | | | | | | | | | |
| Dividends from net investment income | | | (0.11 | ) | | | (0.15 | ) | | | (0.24 | ) | | | (0.61 | ) | | | (0.11 | ) | | | 0.00 | |
| Distributions from net realized gain | | | (3.82 | ) | | | (2.29 | ) | | | (0.10 | ) | | | (0.02 | ) | | | (0.43 | ) | | | 0.00 | |
| | | | |
Total dividends and/or distributions to shareholders | | | (3.93 | ) | | | (2.44 | ) | | | (0.34 | ) | | | (0.63 | ) | | | (0.54 | ) | | | 0.00 | |
| Net asset value, end of period | | $ | 75.97 | | | $ | 75.10 | | | $ | 71.11 | | | $ | 56.93 | | | $ | 48.46 | | | $ | 52.78 | |
| | | | |
Total Return, at Net Asset Value3 | | | 6.65 | % | | | 9.20 | % | | | 25.62 | % | | | 18.93 | % | | | (7.30 | )% | | | 10 .51 | % |
| | | | | | | | | |
Ratios/Supplemental Data | | | | | | | | | | | | | | | | | | | | | | | | |
Net assets, end of period (in thousands) | | $ | 721,761 | | | $ | 695,102 | | | $ | 666,584 | | | $ | 580,390 | | | $ | 581,865 | | | $ | 712,439 | |
Average net assets (in thousands) | | $ | 690,951 | | | $ | 699,835 | | | $ | 623,949 | | | $ | 591,634 | | | $ | 735,113 | | | $ | 721,680 | |
| Ratios to average net assets:4 | | | | | | | | | | | | | | | | | | | | | | | | |
| Net investment income (loss) | | | (0.36 | )% | | | (0.01 | )% | | | 0.18 | % | | | 0.26 | % | | | 0.98 | % | | | 0.02 | % |
| Total expenses5 | | | 1.89 | % | | | 1.88 | % | | | 1.90 | % | | | 1.94 | % | | | 1.91 | % | | | 1.95 | % |
| Expenses after payments, waivers and/or reimbursements and reduction to custodian expenses | | | 1.89 | % | | | 1.88 | % | | | 1.90 | % | | | 1.94 | % | | | 1.91 | % | | | 1.95 | % |
| Portfolio turnover rate | | | 3 | % | | | 11 | % | | | 11 | % | | | 12 | % | | | 13 | % | | | 13 | % |
1. September 28, 2012 represents the last business day of the Fund’s reporting period.
2. Per share amounts calculated based on the average shares outstanding during the period.
3. Assumes an initial investment on the business day before the first day of the fiscal period, with all dividends and distributions reinvested in additional shares on the reinvestment date, and redemption at the net asset value calculated on the last business day of the fiscal period. Sales charges are not reflected in the total returns. Total returns are not annualized for periods less than one full year. Returns do not reflect the deduction of taxes that a shareholder would pay on fund distributions or the redemption of fund shares. The returns do not include adjustments in accordance with generally accepted accounting principles required at the period end for financial reporting purposes.
4. Annualized for periods less than one full year.
5. Total expenses including indirect expenses from affiliated fund fees and expenses were as follows:
| | |
Six Months Ended March 31, 2015 | | 1.89% |
Year Ended September 30, 2014 | | 1.88% |
Year Ended September 30, 2013 | | 1.90% |
Year Ended September 28, 2012 | | 1.94% |
Year Ended September 30, 2011 | | 1.91% |
Year Ended September 30, 2010 | | 1.95% |
See accompanying Notes to Financial Statements.
23 OPPENHEIMER GLOBAL FUND
FINANCIAL HIGHLIGHTS Continued
| | | | | | | | | | | | | | | | |
| Class I | | Six Months
Ended
March 31,
2015
(Unaudited) | | | Year Ended
September
30, 2014 | | | Year Ended
September
30, 2013 | | | Period Ended
September
28, 20121,2 | |
Per Share Operating Data | | | | | | | | | | | | | | | | |
| Net asset value, beginning of period | | $ | 80.92 | | | $ | 76.36 | | | $ | 61.08 | | | $ | 57.08 | |
| Income (loss) from investment operations: | | | | | | | | | | | | | | | | |
| Net investment income3 | | | 0.33 | | | | 1.08 | | | | 0.99 | | | | 0.53 | |
| Net realized and unrealized gain | | | 5.32 | | | | 6.74 | | | | 15.35 | | | | 3.47 | |
| | | | |
| Total from investment operations | | | 5.65 | | | | 7.82 | | | | 16.34 | | | | 4.00 | |
| Dividends and/or distributions to shareholders: | | | | | | | | | | | | | | | | |
| Dividends from net investment income | | | (1.02 | ) | | | (0.97 | ) | | | (0.96 | ) | | | 0.00 | |
| Distributions from net realized gain | | | (3.82 | ) | | | (2.29 | ) | | | (0.10 | ) | | | 0.00 | |
| | | | |
| Total dividends and/or distributions to shareholders | | | (4.84 | ) | | | (3.26 | ) | | | (1.06 | ) | | | 0.00 | |
| Net asset value, end of period | | $ | 81.73 | | | $ | 80.92 | | | $ | 76.36 | | | $ | 61.08 | |
| | | | |
| | | | | | | | | | | | | | | | |
Total Return, at Net Asset Value4 | | | 7.29 | % | | | 10.49 | % | | | 27.12 | % | | | 7.01 | % |
| | | | | | | | | | | | | | | | |
Ratios/Supplemental Data | | | | | | | | | | | | | | | | |
| Net assets, end of period (in thousands) | | $ | 437,149 | | | $ | 343,373 | | | $ | 60,732 | | | $ | 12,762 | |
| Average net assets (in thousands) | | $ | 386,430 | | | $ | 252,001 | | | $ | 41,484 | | | $ | 6,763 | |
| Ratios to average net assets:5 | | | | | | | | | | | | | | | | |
| Net investment income | | | 0.84 | % | | | 1.35 | % | | | 1.40 | % | | | 1.37 | % |
| Total expenses6 | | | 0.70 | % | | | 0.70 | % | | | 0.71 | % | | | 0.73 | % |
| Expenses after payments, waivers and/or reimbursements and reduction to custodian expenses | | | 0.70 | % | | | 0.70 | % | | | 0.71 | % | | | 0.73 | % |
| Portfolio turnover rate | | | 3 | % | | | 11 | % | | | 11 | % | | | 12 | % |
1. September 28, 2012 represents the last business day of the Fund’s reporting period.
2. For the period from January 27, 2012 (inception of offering) to September 28, 2012.
3. Per share amounts calculated based on the average shares outstanding during the period.
4. Assumes an initial investment on the business day before the first day of the fiscal period, with all dividends and distributions reinvested in additional shares on the reinvestment date, and redemptions at the net asset value calculated on the last business day of the fiscal period. Sales charges are not reflected in the total returns. Total returns are not annualized for periods less than one full year. Returns do not reflect the deduction of taxes that a shareholder would pay on fund distributions or the redemption of fund shares. The returns do not include adjustments in accordance with generally accepted accounting principles required at the period end for financial reporting purposes.
5. Annualized for periods less than one full year.
6. Total expenses including indirect expenses from affiliated fund fees and expenses were as follows:
| | |
Six Months Ended March 31, 2015 | | 0.70% |
Year Ended September 30, 2014 | | 0.70% |
Year Ended September 30, 2013 | | 0.71% |
Period Ended September 28, 2012 | | 0.73% |
See accompanying Notes to Financial Statements.
24 OPPENHEIMER GLOBAL FUND
| | | | | | | | | | | | | | | | | | | | | | | | |
| Class R | | Six Months Ended March 31, 2015 (Unaudited) | | | Year Ended September 30, 2014 | | | Year Ended September 30, 2013 | | | Year Ended September 28, 20121 | | | Year Ended September 30, 2011 | | | Year Ended September 30, 2010 | |
Per Share Operating Data | | | | | | | | | | | | | | | | | | | | | | | | |
| Net asset value, beginning of period | | $ | 80.17 | | | $ | 75.68 | | | $ | 60.47 | | | $ | 51.46 | | | $ | 55.96 | | | $ | 50.57 | |
| Income (loss) from investment operations: | | | | | | | | | | | | | | | | | | | | | | | | |
| Net investment income2 | | | 0.06 | | | | 0.37 | | | | 0.41 | | | | 0.38 | | | | 0.85 | | | | 0.27 | |
| Net realized and unrealized gain (loss) | | | 5.27 | | | | 6.85 | | | | 15.30 | | | | 9.49 | | | | (4.63 | ) | | | 5.30 | |
| | | | |
| Total from investment operations | | | 5.33 | | | | 7.22 | | | | 15.71 | | | | 9.87 | | | | (3.78 | ) | | | 5.57 | |
| Dividends and/or distributions to shareholders: | | | | | | | | | | | | | | | | | | | | | | | | |
| Dividends from net investment income | | | (0.46 | ) | | | (0.44 | ) | | | (0.40 | ) | | | (0.84 | ) | | | (0.29 | ) | | | (0.18 | ) |
| Distributions from net realized gain | | | (3.82 | ) | | | (2.29 | ) | | | (0.10 | ) | | | (0.02 | ) | | | (0.43 | ) | | | 0.00 | |
| | | | |
| Total dividends and/or distributions to shareholders | | | (4.28 | ) | | | (2.73 | ) | | | (0.50 | ) | | | (0.86 | ) | | | (0.72 | ) | | | (0.18 | ) |
| Net asset value, end of period | | $ | 81.22 | | | $ | 80.17 | | | $ | 75.68 | | | $ | 60.47 | | | $ | 51 .46 | | | $ | 55 .96 | |
| | | | |
| | | | | | | | | |
Total Return, at Net Asset Value3 | | | 6.90 | % | | | 9.73 | % | | | 26.16 | % | | | 19.40 | % | | | (6.91 | )% | | | 11.04 | % |
| | | | | | | | | |
Ratios/Supplemental Data | | | | | | | | | | | | | | | | | | | | | | | | |
| Net assets, end of period (in thousands) | | $ | 241,922 | | | $ | 236,838 | | | $ | 214,310 | | | $ | 192,647 | | | $ | 192,212 | | | $ | 228,375 | |
| Average net assets (in thousands) | | $ | 234,174 | | | $ | 232,983 | | | $ | 200,060 | | | $ | 203,213 | | | $ | 237,342 | | | $ | 226,536 | |
| Ratios to average net assets:4 | | | | | | | | | | | | | | | | | | | | | | | | |
| Net investment income | | | 0.14 | % | | | 0.47 | % | | | 0.60 | % | | | 0.67 | % | | | 1.39 | % | | | 0.51 | % |
| Total expenses5 | | | 1.39 | % | | | 1.40 | % | | | 1.47 | % | | | 1.55 | % | | | 1.50 | % | | | 1.47 | % |
| Expenses after payments, waivers and/or reimbursements and reduction to custodian expenses | | | 1.39 | % | | | 1.40 | % | | | 1.47 | % | | | 1.55 | % | | | 1.50 | % | | | 1.47 | % |
| Portfolio turnover rate | | | 3 | % | | | 11 | % | | | 11 | % | | | 12 | % | | | 13 | % | | | 13 | % |
1. September 28, 2012 represents the last business day of the Fund’s reporting period.
2. Per share amounts calculated based on the average shares outstanding during the period.
3. Assumes an initial investment on the business day before the first day of the fiscal period, with all dividends and distributions reinvested in additional shares on the reinvestment date, and redemption at the net asset value calculated on the last business day of the fiscal period. Sales charges are not reflected in the total returns. Total returns are not annualized for periods less than one full year. Returns do not reflect the deduction of taxes that a shareholder would pay on fund distributions or the redemption of fund shares. The returns do not include adjustments in accordance with generally accepted accounting principles required at the period end for financial reporting purposes.
4. Annualized for periods less than one full year.
5. Total expenses including indirect expenses from affiliated fund fees and expenses were as follows:
| | |
Six Months Ended March 31, 2015 | | 1.39% |
Year Ended September 30, 2014 | | 1.40% |
Year Ended September 30, 2013 | | 1.47% |
Year Ended September 28, 2012 | | 1.55% |
Year Ended September 30, 2011 | | 1.50% |
Year Ended September 30, 2010 | | 1.47% |
See accompanying Notes to Financial Statements.
25 OPPENHEIMER GLOBAL FUND
FINANCIAL HIGHLIGHTS Continued
| | | | | | | | | | | | | | | | | | | | | | | | |
| Class Y | | Six Months Ended March 31, 2015 (Unaudited) | | | Year Ended September 30, 2014 | | | Year Ended September 30, 2013 | | | Year Ended September 28, 20121 | | | Year Ended September 30, 2011 | | | Year Ended September 30, 2010 | |
Per Share Operating Data | | | | | | | | | | | | | | | | | | | | | | | | |
| Net asset value, beginning of period | | $ | 80.81 | | | $ | 76.25 | | | $ | 61.00 | | | $ | 51.95 | | | $ | 56.52 | | | $ | 51.02 | |
| Income (loss) from investment operations: | | | | | | | | | | | | | | | | | | | | | | | | |
| Net investment income2 | | | 0.24 | | | | 0.79 | | | | 0.80 | | | | 0.72 | | | | 1.26 | | | | 0.66 | |
| Net realized and unrealized gain (loss) | | | 5.32 | | | | 6.88 | | | | 15.38 | | | | 9.58 | | | | (4.72 | ) | | | 5.29 | |
| | | | |
| Total from investment operations | | | 5.56 | | | | 7.67 | | | | 16.18 | | | | 10.30 | | | | (3.46 | ) | | | 5.95 | |
| Dividends and/or distributions to shareholders: | | | | | | | | | | | | | | | | | | | | | | | | |
| Dividends from net investment income | | | (0.83 | ) | | | (0.82 | ) | | | (0.83 | ) | | | (1.23 | ) | | | (0.68 | ) | | | (0.45 | ) |
| Distributions from net realized gain | | | (3.82 | ) | | | (2.29 | ) | | | (0.10 | ) | | | (0.02 | ) | | | (0.43 | ) | | | 0.00 | |
| | | | |
| Total dividends and/or distributions to shareholders | | | (4.65 | ) | | | (3.11 | ) | | | (0.93 | ) | | | (1.25 | ) | | | (1.11 | ) | | | (0.45 | ) |
| Net asset value, end of period | | $ | 81.72 | | | $ | 80.81 | | | $ | 76.25 | | | $ | 61.00 | | | $ | 51.95 | | | $ | 56.52 | |
| | | | |
| | | | | | | | | |
Total Return, at Net Asset Value3 | | | 7.18 | % | | | 10.30 | % | | | 26.85 | % | | | 20.15 | % | | | (6.36 | )% | | | 11.72 | % |
| | | | | | | | | |
Ratios/Supplemental Data | | | | | | | | | | | | | | | | | | | | | | | | |
| Net assets, end of period (in thousands) | | $ | 1,261,275 | | | $ | 1,480,337 | | | $ | 1,330,188 | | | $ | 977,716 | | | $ | 683,652 | | | $ | 577,600 | |
| Average net assets (in thousands) | | $ | 1,281,868 | | | $ | 1,454,338 | | | $ | 1,147,539 | | | $ | 839,762 | | | $ | 713,559 | | | $ | 788,663 | |
| Ratios to average net assets:4 | | | | | | | | | | | | | | | | | | | | | | | | |
| Net investment income | | | 0.61 | % | | | 0.99 | % | | | 1.16 | % | | | 1.26 | % | | | 2.07 | % | | | 1.24 | % |
| Total expenses5 | | | 0.89 | % | | | 0.89 | % | | | 0.92 | % | | | 0.93 | % | | | 0.92 | % | | | 0.83 | % |
| Expenses after payments, waivers and/or reimbursements and reduction to custodian expenses | | | 0.89 | % | | | 0.89 | % | | | 0.92 | % | | | 0.93 | % | | | 0.90 | % | | | 0.83 | % |
| Portfolio turnover rate | | | 3 | % | | | 11 | % | | | 11 | % | | | 12 | % | | | 13 | % | | | 13 | % |
26 OPPENHEIMER GLOBAL FUND
1. September 28, 2012 represents the last business day of the Fund’s reporting period.
2. Per share amounts calculated based on the average shares outstanding during the period.
3. Assumes an initial investment on the business day before the first day of the fiscal period, with all dividends and distributions reinvested in additional shares on the reinvestment date, and redemptions at the net asset value calculated on the last business day of the fiscal period. Sales charges are not reflected in the total returns. Total returns are not annualized for periods less than one full year. Returns do not reflect the deduction of taxes that a shareholder would pay on fund distributions or the redemption of fund shares. The returns do not include adjustments in accordance with generally accepted accounting principles required at the period end for financial reporting purposes.
4. Annualized for periods less than one full year.
5. Total expenses including indirect expenses from affiliated fund fees and expenses were as follows:
| | |
Six Months Ended March 31, 2015 | | 0.89% |
Year Ended September 30, 2014 | | 0.89% |
Year Ended September 30, 2013 | | 0.92% |
Year Ended September 28, 2012 | | 0.93% |
Year Ended September 30, 2011 | | 0.92% |
Year Ended September 30, 2010 | | 0.83% |
See accompanying Notes to Financial Statements.
27 OPPENHEIMER GLOBAL FUND
NOTES TO FINANCIAL STATEMENTS March 31, 2015 Unaudited
1. Organization
Oppenheimer Global Fund (the “Fund”) is a diversified open-end management investment company registered under the Investment Company Act of 1940 (“1940 Act”), as amended. The Fund’s investment objective is to seek capital appreciation. The Fund’s investment adviser is OFI Global Asset Management, Inc. (“OFI Global” or the “Manager”), a wholly-owned subsidiary of OppenheimerFunds, Inc. (“OFI” or the “Sub-Adviser”). The Manager has entered into a sub-advisory agreement with OFI.
The Fund offers Class A, Class C, Class I, Class R and Class Y shares, and previously offered Class B shares for new purchase through June 29, 2012. Subsequent to that date, no new purchases of Class B shares are permitted, however reinvestment of dividend and/or capital gain distributions and exchanges of Class B shares into and from other Oppenheimer funds will be allowed. As of July 1, 2014, Class N shares were renamed Class R shares. Class N shares subject to a contingent deferred sales charge (“CDSC”) on July 1, 2014, will continue to be subject to a CDSC after the shares are renamed. Purchases of Class R shares occurring on or after July 1, 2014, will not be subject to a CDSC upon redemption. Class A shares are sold at their offering price, which is normally net asset value plus a front-end sales charge. Class C and Class R shares are sold, and Class B shares were sold, without a front-end sales charge but may be subject to a contingent deferred sales charge (“CDSC”). Class R shares are sold only through retirement plans. Retirement plans that offer Class R shares may impose charges on those accounts. Class I and Class Y shares are sold to certain institutional investors or intermediaries without either a front-end sales charge or a CDSC, however, the intermediaries may impose charges on their accountholders who beneficially own Class I and Class Y shares. All classes of shares have identical rights and voting privileges with respect to the Fund in general and exclusive voting rights on matters that affect that class alone. Earnings, net assets and net asset value per share may differ due to each class having its own expenses, such as transfer and shareholder servicing agent fees and shareholder communications, directly attributable to that class. Class A, B, C and R shares have separate distribution and/or service plans under which they pay fees. Class I and Class Y shares do not pay such fees. Class B shares will automatically convert to Class A shares 72 months after the date of purchase.
The following is a summary of significant accounting policies consistently followed by the Fund.
2. Significant Accounting Policies
Security Valuation. All investments in securities are recorded at their estimated fair value, as described in Note 3.
Foreign Currency Translation. The Fund’s accounting records are maintained in U.S. dollars. The values of securities denominated in foreign currencies and amounts related to the purchase and sale of foreign securities and foreign investment income are translated into U.S. dollars as of the close of the New York Stock Exchange (the “Exchange”), normally 4:00 P.M. Eastern time, on each day the Exchange is open for trading. Foreign exchange rates may be valued primarily using a reliable bank, dealer or service authorized by the Board of Trustees.
28 OPPENHEIMER GLOBAL FUND
2. Significant Accounting Policies (Continued)
Reported net realized gains and losses from foreign currency transactions arise from sales of portfolio securities, sales and maturities of short-term securities, sales of foreign currencies, exchange rate fluctuations between the trade and settlement dates on securities transactions, and the difference between the amounts of dividends, interest, and foreign withholding taxes recorded on the Fund’s books and the U.S. dollar equivalent of the amounts actually received or paid. Net unrealized appreciation and depreciation on the translation of assets and liabilities denominated in foreign currencies arise from changes in the values of assets and liabilities, including investments in securities at fiscal period end, resulting from changes in exchange rates.
The effect of changes in foreign currency exchange rates on investments is separately identified from the fluctuations arising from changes in market values of securities held and reported with all other foreign currency gains and losses in the Fund’s Statement of Operations.
Allocation of Income, Expenses, Gains and Losses. Income, expenses (other than those attributable to a specific class), gains and losses are allocated on a daily basis to each class of shares based upon the relative proportion of net assets represented by such class. Operating expenses directly attributable to a specific class are charged against the operations of that class.
Dividends and Distributions to Shareholders. Dividends and distributions to shareholders, which are determined in accordance with income tax regulations and may differ from U.S. generally accepted accounting principles, are recorded on the ex-dividend date. Income and capital gain distributions, if any, are declared and paid annually or at other times as deemed necessary by the Manager.
The tax character of distributions is determined as of the Fund’s fiscal year end. Therefore, a portion of the Fund’s distributions made to shareholders prior to the Fund’s fiscal year end may ultimately be categorized as a tax return of capital.
Investment Income. Dividend income is recorded on the ex-dividend date or upon ex-dividend notification in the case of certain foreign dividends where the ex-dividend date may have passed. Non-cash dividends included in dividend income, if any, are recorded at the fair market value of the securities received. Interest income is recognized on an accrual basis. Discount and premium, which are included in interest income on the Statement of Operations, are amortized or accreted daily.
Custodian Fees. “Custodian fees and expenses” in the Statement of Operations may include interest expense incurred by the Fund on any cash overdrafts of its custodian account during the period. Such cash overdrafts may result from the effects of failed trades in portfolio securities and from cash outflows resulting from unanticipated shareholder redemption activity. The Fund pays interest to its custodian on such cash overdrafts, to the extent they are not offset by positive cash balances maintained by the Fund, at a rate equal to the Federal Funds Rate plus 0.50%. The “Reduction to custodian expenses” line item, if applicable,
29 OPPENHEIMER GLOBAL FUND
NOTES TO FINANCIAL STATEMENTS Unaudited / Continued
2. Significant Accounting Policies (Continued)
represents earnings on cash balances maintained by the Fund during the period. Such interest expense and other custodian fees may be paid with these earnings.
Security Transactions. Security transactions are recorded on the trade date. Realized gains and losses on securities sold are determined on the basis of identified cost.
Indemnifications. The Fund’s organizational documents provide current and former Trustees and officers with a limited indemnification against liabilities arising in connection with the performance of their duties to the Fund. In the normal course of business, the Fund may also enter into contracts that provide general indemnifications. The Fund’s maximum exposure under these arrangements is unknown as this would be dependent on future claims that may be made against the Fund. The risk of material loss from such claims is considered remote.
Federal Taxes. The Fund intends to comply with provisions of the Internal Revenue Code applicable to regulated investment companies and to distribute substantially all of its investment company taxable income to shareholders. Therefore, no federal income or excise tax provision is required. The Fund files income tax returns in U.S. federal and applicable state jurisdictions. The statute of limitations on the Fund’s tax return filings generally remain open for the three preceding fiscal reporting period ends.
During the fiscal year ended September 30, 2014, the Fund did not utilize any capital loss carryforward to offset capital gains realized in that fiscal year.
Net investment income (loss) and net realized gain (loss) may differ for financial statement and tax purposes. The character of dividends and distributions made during the fiscal year from net investment income or net realized gains are determined in accordance with federal income tax requirements, which may differ from the character of net investment income or net realized gains presented in those financial statements in accordance with GAAP. Also, due to timing of dividends and distributions, the fiscal year in which amounts are distributed may differ from the fiscal year in which the income or net realized gain was recorded by the Fund.
The aggregate cost of securities and other investments and the composition of unrealized appreciation and depreciation of securities and other investments for federal income tax purposes as of March 31, 2015 are noted in the following table. The primary difference between book and tax appreciation or depreciation of securities and other investments, if applicable, is attributable to the tax deferral of losses or tax realization of financial statement unrealized gain or loss.
| | | | |
| Federal tax cost of securities | | $ | 5,765,687,704 | |
| | | | |
| Gross unrealized appreciation | | $ | 5,169,548,949 | |
| Gross unrealized depreciation | | | (526,469,974 | ) |
| | | | |
| Net unrealized appreciation | | $ | 4,643,078,975 | |
| | | | |
Certain foreign countries impose a tax on capital gains which is accrued by the Fund based on unrealized appreciation, if any, on affected securities. The tax is paid when the gain is realized.
30 OPPENHEIMER GLOBAL FUND
2. Significant Accounting Policies (Continued)
Use of Estimates. The preparation of financial statements in conformity with accounting principles generally accepted in the United States of America requires management to make estimates and assumptions that affect the reported amounts of assets and liabilities and disclosure of contingent assets and liabilities at the date of the financial statements and the reported amounts of increases and decreases in net assets from operations during the reporting period. Actual results could differ from those estimates.
3. Securities Valuation
The Fund calculates the net asset value of its shares as of the close of the New York Stock Exchange (the “Exchange”), normally 4:00 P.M. Eastern time, on each day the Exchange is open for trading.
The Fund’s Board has adopted procedures for the valuation of the Fund’s securities and has delegated the day-to-day responsibility for valuation determinations under those procedures to the Manager. The Manager has established a Valuation Committee which is responsible for determining a “fair valuation” for any security for which market quotations are not “readily available.” The Valuation Committee’s fair valuation determinations are subject to review, approval and ratification by the Fund’s Board at its next regularly scheduled meeting covering the calendar quarter in which the fair valuation was determined.
Valuation Methods and Inputs
Securities are valued using unadjusted quoted market prices, when available, as supplied primarily by third party pricing services or dealers.
The following methodologies are used to determine the market value or the fair value of the types of securities described below:
Securities traded on a registered U.S. securities exchange (including exchange-traded derivatives other than futures and futures options) are valued based on the last sale price of the security reported on the principal exchange on which it is traded, prior to the time when the Fund’s assets are valued. In the absence of a sale, the security is valued at the last sale price on the prior trading day, if it is within the spread of the current day’s closing “bid” and “asked” prices, and if not, at the current day’s closing bid price. A security of a foreign issuer traded on a foreign exchange, but not listed on a registered U.S. securities exchange, is valued based on the last sale price on the principal exchange on which the security is traded, as identified by the third party pricing service used by the Manager, prior to the time when the Fund’s assets are valued. If the last sale price is unavailable, the security is valued at the most recent official closing price on the principal exchange on which it is traded. If the last sales price or official closing price for a foreign security is not available, the security is valued at the mean between the bid and asked price per the exchange or, if not available from the exchange, obtained from two dealers. If bid and asked prices are not available from either the exchange or two dealers, the security is valued by using one of the following methodologies (listed in order of priority): (1) using a bid from the exchange, (2) the mean between the bid and asked price as provided by a single dealer, or (3) a bid from a single dealer.
Shares of a registered investment company that are not traded on an exchange are valued at that investment company’s net asset value per share.
31 OPPENHEIMER GLOBAL FUND
NOTES TO FINANCIAL STATEMENTS Unaudited / Continued
3. Securities Valuation (Continued)
Corporate and government debt securities (of U.S. or foreign issuers) and municipal debt securities, event-linked bonds, loans, mortgage-backed securities, collateralized mortgage obligations, and asset-backed securities are valued at the mean between the “bid” and “asked” prices utilizing evaluated prices obtained from third party pricing services or broker-dealers who may use matrix pricing methods to determine the evaluated prices.
Short-term money market type debt securities with a remaining maturity of sixty days or less are valued at cost adjusted by the amortization of discount or premium to maturity (amortized cost), which approximates market value. Short-term debt securities with a remaining maturity in excess of sixty days are valued at the mean between the “bid” and “asked” prices utilizing evaluated prices obtained from third party pricing services or broker-dealers.
A description of the standard inputs that may generally be considered by the third party pricing vendors in determining their evaluated prices is provided below.
| | |
Security Type | | Standard inputs generally considered by third-party pricing vendors |
| Corporate debt, government debt, municipal, mortgage-backed and asset-backed securities | | Reported trade data, broker-dealer price quotations, benchmark yields, issuer spreads on comparable securities, the credit quality, yield, maturity, and other appropriate factors. |
Loans | | Information obtained from market participants regarding reported trade data and broker-dealer price quotations. |
Event-linked bonds | | Information obtained from market participants regarding reported trade data and broker-dealer price quotations. |
If a market value or price cannot be determined for a security using the methodologies described above, or if, in the “good faith” opinion of the Manager, the market value or price obtained does not constitute a “readily available market quotation,” or a significant event has occurred that would materially affect the value of the security, the security is fair valued either (i) by a standardized fair valuation methodology applicable to the security type or the significant event as previously approved by the Valuation Committee and the Fund’s Board or (ii) as determined in good faith by the Manager’s Valuation Committee. The Valuation Committee considers all relevant facts that are reasonably available, through either public information or information available to the Manager, when determining the fair value of a security. Fair value determinations by the Manager are subject to review, approval and ratification by the Fund’s Board at its next regularly scheduled meeting covering the calendar quarter in which the fair valuation was determined. Those fair valuation standardized methodologies include, but are not limited to, valuing securities at the last sale price or initially at cost and subsequently adjusting the value based on: changes in company specific fundamentals, changes in an appropriate securities index, or changes in the value of similar securities which may be further adjusted for any discounts related to security-specific resale restrictions. When possible, such methodologies use observable market inputs such as unadjusted quoted prices of similar securities, observable interest rates, currency rates and yield curves. The methodologies used for valuing securities are not necessarily an indication of the risks associated with investing in those securities nor can it be assured that the Fund can obtain the fair value assigned to a security if it were to sell the security.
32 OPPENHEIMER GLOBAL FUND
3. Securities Valuation (Continued)
To assess the continuing appropriateness of security valuations, the Manager, or its third party service provider who is subject to oversight by the Manager, regularly compares prior day prices, prices on comparable securities, and sale prices to the current day prices and challenges those prices exceeding certain tolerance levels with the third party pricing service or broker source. For those securities valued by fair valuations, whether through a standardized fair valuation methodology or a fair valuation determination, the Valuation Committee reviews and affirms the reasonableness of the valuations based on such methodologies and fair valuation determinations on a regular basis after considering all relevant information that is reasonably available.
Classifications
Each investment asset or liability of the Fund is assigned a level at measurement date based on the significance and source of the inputs to its valuation. Various data inputs are used in determining the value of each of the Fund’s investments as of the reporting period end. These data inputs are categorized in the following hierarchy under applicable financial accounting standards:
1) Level 1-unadjusted quoted prices in active markets for identical assets or liabilities (including securities actively traded on a securities exchange)
2) Level 2-inputs other than unadjusted quoted prices that are observable for the asset or liability (such as unadjusted quoted prices for similar assets and market corroborated inputs such as interest rates, prepayment speeds, credit risks, etc.)
3) Level 3-significant unobservable inputs (including the Manager’s own judgments about assumptions that market participants would use in pricing the asset or liability).
The inputs used for valuing securities are not necessarily an indication of the risks associated with investing in those securities.
The table below categorizes amounts that are included in the Fund’s Statement of Assets and Liabilities as of March 31, 2015 based on valuation input level:
| | | | | | | | | | | | | | | | |
| | | Level 1—
Unadjusted
Quoted Prices | | | Level 2— Other Significant
Observable Inputs | | | Level 3—
Significant
Unobservable
Inputs | | | Value | |
Assets Table | | | | | | | | | | | | | | | | |
Investments, at Value: | | | | | | | | | | | | | | | | |
| Common Stocks | | | | | | | | | | | | | | | | |
Consumer Discretionary | | $ | 479,197,699 | | | $ | 677,788,724 | | | $ | — | | | $ | 1,156,986,423 | |
Consumer Staples | | | 337,556,342 | | | | 278,439,718 | | | | — | | | | 615,996,060 | |
Energy | | | — | | | | 163,182,992 | | | | — | | | | 163,182,992 | |
Financials | | | 946,582,412 | | | | 1,351,523,784 | | | | — | | | | 2,298,106,196 | |
Health Care | | | 1,431,808,662 | | | | 389,891,054 | | | | 17,671,824 | | | | 1,839,371,540 | |
Industrials | | | 427,314,580 | | | | 802,816,125 | | | | — | | | | 1,230,130,705 | |
Information Technology | | | 1,490,484,796 | | | | 1,013,721,066 | | | | — | | | | 2,504,205,862 | |
Materials | | | 16,968,476 | | | | 141,494,395 | | | | — | | | | 158,462,871 | |
Telecommunication Services | | | — | | | | 174,128,196 | | | | — | | | | 174,128,196 | |
33 OPPENHEIMER GLOBAL FUND
NOTES TO FINANCIAL STATEMENTS Unaudited / Continued
3. Securities Valuation (Continued)
| | | | | | | | | | | | | | | | |
| | | Level 1—
Unadjusted
Quoted Prices | | | Level 2—
Other Significant
Observable Inputs | | | Level 3—
Significant
Unobservable
Inputs | | | Value | |
Investments, at Value: (Continued) | | | | | | | | | | | | | | | | |
| Preferred Stocks | | $ | 3,900,245 | | | $ | 202,855,237 | | | $ | — | | | $ | 206,755,482 | |
| Rights, Warrants and Certificates | | | — | | | | 1,709,647 | | | | — | | | | 1,709,647 | |
| Investment Company | | | 59,730,705 | | | | — | | | | — | | | | 59,730,705 | |
| | | | |
| Total Assets | | $ | 5,193,543,917 | �� | | $ | 5,197,550,938 | | | $ | 17,671,824 | | | $ | 10,408,766,679 | |
| | | | |
Forward currency exchange contracts and futures contracts, if any, are reported at their unrealized appreciation/depreciation at measurement date, which represents the change in the contract’s value from trade date. All additional assets and liabilities included in the above table are reported at their market value at measurement date.
4. Investments and Risks
Investment in Oppenheimer Institutional Money Market Fund. The Fund is permitted to invest daily available cash balances in an affiliated money market fund. The Fund may invest the available cash in Class E shares of Oppenheimer Institutional Money Market Fund (“IMMF”) to seek current income while preserving liquidity or for defensive purposes. IMMF is a registered open-end management investment company, regulated as a money market fund under the 1940 Act. The Manager is the investment adviser of IMMF, and the Sub-Adviser provides investment and related advisory services to IMMF. When applicable, the Fund’s investment in IMMF is included in the Statement of Investments. Shares of IMMF are valued at their net asset value per share. As a shareholder, the Fund is subject to its proportional share of IMMF’s Class E expenses, including its management fee. The Manager will waive fees and/or reimburse Fund expenses in an amount equal to the indirect management fees incurred through the Fund’s investment in IMMF.
Restricted Securities. As of March 31, 2015, investments in securities included issues that are restricted. A restricted security may have a contractual restriction on its resale and is valued under methods approved by the Board of Trustees as reflecting fair value. Securities that are restricted are marked with an applicable footnote on the Statement of Investments. Restricted securities are reported on a schedule following the Statement of Investments.
Equity Security Risk. Stocks and other equity securities fluctuate in price. The value of the Fund’s portfolio may be affected by changes in the equity markets generally. Equity markets may experience significant short-term volatility and may fall sharply at times. Different markets may behave differently from each other and U.S. equity markets may move in the opposite direction from one or more foreign stock markets. Adverse events in any part of the equity or fixed-income markets may have unexpected negative effects on other market segments.
The prices of individual equity securities generally do not all move in the same direction at the same time and a variety of factors can affect the price of a particular company’s securities. These factors may include, but are not limited to, poor earnings reports, a loss of customers,
34 OPPENHEIMER GLOBAL FUND
4. Investments and Risks (Continued)
litigation against the company, general unfavorable performance of the company’s sector or industry, or changes in government regulations affecting the company or its industry.
5. Shares of Beneficial Interest
The Fund has authorized an unlimited number of no par value shares of beneficial interest of each class. Transactions in shares of beneficial interest were as follows:
| | | | | | | | | | | | | | | | |
| | | Six Months Ended March 31, 2015 | | | Year Ended September 30, 2014 | |
| | | Shares | | | Amount | | | Shares | | | Amount | |
Class A | | | | | | | | | | | | | | | | |
| Sold | | | 7,263,576 | | | $ | 576,603,232 | | | | 8,362,465 | | | $ | 660,529,985 | |
| Dividends and/or distributions reinvested | | | 5,126,001 | | | | 398,495,311 | | | | 3,537,182 | | | | 270,276,051 | |
| Redeemed | | | (9,549,374 | ) | | | (748,777,810 | ) | | | (19,274,099 | ) | | | (1,527,892,438 | ) |
| | | | |
| Net increase (decrease) | | | 2,840,203 | | | $ | 226,320,733 | | | | (7,374,452 | ) | | $ | (597,086,402 | ) |
| | | | |
| | | | | | | | | | | | | | | | |
Class B | | | | | | | | | | | | | | | | |
| Sold | | | 16,670 | | | $ | 1,215,004 | | | | 36,133 | | | $ | 2,635,190 | |
| Dividends and/or distributions reinvested | | | 69,299 | | | | 4,961,092 | | | | 60,977 | | | | 4,305,576 | |
| Redeemed | | | (340,555 | ) | | | (24,807,989 | ) | | | (677,141 | ) | | | (49,409,367 | ) |
| | | | |
| Net decrease | | | (254,586 | ) | | $ | (18,631,893 | ) | | | (580,031 | ) | | $ | (42,468,601 | ) |
| | | | |
| | | | | | | | | | | | | | | | |
Class C | | | | | | | | | | | | | | | | |
| Sold | | | 507,095 | | | $ | 37,279,336 | | | | 937,815 | | | $ | 69,276,525 | |
| Dividends and/or distributions reinvested | | | 457,857 | | | | 33,222,129 | | | | 290,692 | | | | 20,819,357 | |
| Redeemed | | | (720,710 | ) | | | (52,766,122 | ) | | | (1,346,426 | ) | | | (99,699,151 | ) |
| | | | |
| Net increase (decrease) | | | 244,242 | | | $ | 17,735,343 | | | | (117,919 | ) | | $ | (9,603,269 | ) |
| | | | |
| | | | | | | | | | | | | | | | |
Class I | | | | | | | | | | | | | | | | |
| Sold | | | 1,404,036 | | | $ | 109,928,032 | | | | 3,995,535 | | | $ | 311,346,899 | |
| Dividends and/or distributions reinvested | | | 275,603 | | | | 21,433,640 | | | | 59,501 | | | | 4,548,235 | |
| Redeemed | | | (574,035 | ) | | | (45,333,104 | ) | | | (606,986 | ) | | | (48,361,308 | ) |
| | | | |
| Net increase | | | 1,105,604 | | | $ | 86,028,568 | | | | 3,448,050 | | | $ | 267,533,826 | |
| | | | |
| | | | | | | | | | | | | | | | |
Class R1 | | | | | | | | | | | | | | | | |
| Sold | | | 286,865 | | | $ | 22,334,128 | | | | 816,662 | | | $ | 64,309,606 | |
| Dividends and/or distributions reinvested | | | 157,236 | | | | 12,179,523 | | | | 101,056 | | | | 7,695,408 | |
| Redeemed | | | (419,814 | ) | | | (32,669,767 | ) | | | (795,177 | ) | | | (62,575,516 | ) |
| | | | |
| Net increase | | | 24,287 | | | $ | 1,843,884 | | | | 122,541 | | | $ | 9,429,498 | |
| | | | |
| |
1. Effective July 1, 2014, Class N shares were renamed Class R. | | | | | |
35 OPPENHEIMER GLOBAL FUND
NOTES TO FINANCIAL STATEMENTS Unaudited / Continued
5. Shares of Beneficial Interest (Continued)
| | | | | | | | | | | | | | | | |
| | | Six Months Ended March 31, 2015 | | | Year Ended September 30, 2014 | |
| | | Shares | | | Amount | | | Shares | | | Amount | |
Class Y | | | | | | | | | | | | | | | | |
| Sold | | | 2,389,159 | | | $ | 188,195,725 | | | | 5,814,516 | | | $ | 459,080,594 | |
| Dividends and/or distributions reinvested | | | 857,366 | | | | 66,711,676 | | | | 678,354 | | | | 51,853,409 | |
| Redeemed | | | (6,131,941 | ) | | | (487,842,820 | ) | | | (5,617,626 | ) | | | (444,867,462 | ) |
| | | | |
| Net increase (decrease) | | | (2,885,416 | ) | | $ | (232,935,419 | ) | | | 875,244 | | | $ | 66,066,541 | |
| | | | |
6. Purchases and Sales of Securities
The aggregate cost of purchases and proceeds from sales of securities, other than short-term obligations and investments in IMMF, for the six months ended March 31, 2015 were as follows:
| | | | | | | | |
| | | Purchases | | | Sales | |
| Investment securities | | $ | 261,311,799 | | | $ | 813,271,909 | |
7. Fees and Other Transactions with Affiliates
Management Fees. Under the investment advisory agreement, the Fund pays the Manager a management fee based on the daily net assets of the Fund at an annual rate as shown in the following table:
| | | | |
| Fee Schedule | | | |
| Up to $250 million | | | 0.80 | % |
| Next $250 million | | | 0.77 | |
| Next $500 million | | | 0.75 | |
| Next $1 billion | | | 0.69 | |
| Next $1.5 billion | | | 0.67 | |
| Next $2.5 billion | | | 0.65 | |
| Next $2.5 billion | | | 0.63 | |
| Next $2.5 billion | | | 0.60 | |
| Next $4.0 billion | | | 0.58 | |
| Next $8.0 billion | | | 0.56 | |
| Over $23 billion | | | 0.54 | |
The Fund’s management fee for the fiscal six months ended March 31, 2015 was 0.66% of average annual net assets before any applicable waivers.
Sub-Adviser Fees. The Manager has retained the Sub-Adviser to provide the day-to-day portfolio management of the Fund. Under the Sub-Advisory Agreement, the Manager pays the Sub-Adviser an annual fee in monthly installments, equal to a percentage of the investment management fee collected by the Manager from the Fund, which shall be calculated after any investment management fee waivers. The fee paid to the Sub-Adviser is paid by the Manager, not by the Fund.
Transfer Agent Fees. OFI Global (the “Transfer Agent”) serves as the transfer and shareholder servicing agent for the Fund. The Fund pays the Transfer Agent a fee based on
36 OPPENHEIMER GLOBAL FUND
7. Fees and Other Transactions with Affiliates (Continued)
annual net assets. Fees incurred and average net assets for each class with respect to these services are detailed in the Statement of Operations and Financial Highlights, respectively.
Sub-Transfer Agent Fees. The Transfer Agent has retained Shareholder Services, Inc., a wholly-owned subsidiary of OFI (the “Sub-Transfer Agent”), to provide the day-to-day transfer agent and shareholder servicing of the Fund. Under the Sub-Transfer Agency Agreement, the Transfer Agent pays the Sub-Transfer Agent an annual fee in monthly installments, equal to a percentage of the transfer agent fee collected by the Transfer Agent from the Fund, which shall be calculated after any applicable fee waivers. The fee paid to the Sub-Transfer Agent is paid by the Transfer Agent, not by the Fund.
Trustees’ Compensation. The Fund has adopted an unfunded retirement plan (the “Plan”) for the Fund’s Independent Trustees. Benefits are based on years of service and fees paid to each Trustee during their period of service. The Plan was frozen with respect to adding new participants effective December 31, 2006 (the “Freeze Date”) and existing Plan Participants as of the Freeze Date will continue to receive accrued benefits under the Plan. Active Independent Trustees as of the Freeze Date have each elected a distribution method with respect to their benefits under the Plan. During the six months ended March 31, 2015, the Fund’s projected benefit obligations, payments to retired Trustees and accumulated liability were as follows:
| | | | |
| Projected Benefit Obligations Increased | | $ | — | |
| Payments Made to Retired Trustees | | | 145,547 | |
| Accumulated Liability as of March 31, 2015 | | | 1,153,452 | |
The Fund’s Board of Trustees (“Board”) has adopted a compensation deferral plan for Independent Trustees that enables Trustees to elect to defer receipt of all or a portion of the annual compensation they are entitled to receive from the Fund. For purposes of determining the amount owed to the Trustee under the plan, deferred amounts are treated as though equal dollar amounts had been invested in shares of the Fund or in other Oppenheimer funds selected by the Trustee. The Fund purchases shares of the funds selected for deferral by the Trustee in amounts equal to his or her deemed investment, resulting in a Fund asset equal to the deferred compensation liability. Such assets are included as a component of “Other” within the asset section of the Statement of Assets and Liabilities. Deferral of Trustees’ fees under the plan will not affect the net assets of the Fund and will not materially affect the Fund’s assets, liabilities or net investment income per share. Amounts will be deferred until distributed in accordance with the compensation deferral plan.
Distribution and Service Plan (12b-1) Fees. Under its General Distributor’s Agreement with the Fund, OppenheimerFunds Distributor, Inc. (the “Distributor”) acts as the Fund’s principal underwriter in the continuous public offering of the Fund’s classes of shares.
Service Plan for Class A Shares. The Fund has adopted a Service Plan (the “Plan”) for Class A shares pursuant to Rule 12b-1 under the 1940 Act. Under the Plan, the Fund
37 OPPENHEIMER GLOBAL FUND
NOTES TO FINANCIAL STATEMENTS Unaudited / Continued
7. Fees and Other Transactions with Affiliates (Continued)
reimburses the Distributor for a portion of its costs incurred for services provided to accounts that hold Class A shares. Reimbursement is made periodically at an annual rate of up to 0.25% of the daily net assets of Class A shares of the Fund. The Distributor currently uses all of those fees to pay dealers, brokers, banks and other financial institutions periodically for providing personal service and maintenance of accounts of their customers that hold Class A shares. Any unreimbursed expenses the Distributor incurs with respect to Class A shares in any fiscal year cannot be recovered in subsequent periods. Fees incurred by the Fund under the Plan are detailed in the Statement of Operations.
Distribution and Service Plans for Class B, Class C and Class R Shares. The Fund has adopted Distribution and Service Plans (the “Plans”) for Class B, Class C and Class R shares pursuant to Rule 12b-1 under the 1940 Act to compensate the Distributor for distributing those share classes, maintaining accounts and providing shareholder services. Under the Plans, the Fund pays the Distributor an annual asset-based sales charge of 0.75% on Class B and Class C shares daily net assets and 0.25% on Class R shares daily net assets. The Fund also pays a service fee under the Plans at an annual rate of 0.25% of daily net assets. The Plans continue in effect from year to year only if the Fund’s Board of Trustees vote annually to approve its continuance at an in person meeting called for that purpose. Fees incurred by the Fund under the Plans are detailed in the Statement of Operations.
Sales Charges. Front-end sales charges and CDSC do not represent expenses of the Fund. They are deducted from the proceeds of sales of Fund shares prior to investment or from redemption proceeds prior to remittance, as applicable. The sales charges retained by the Distributor from the sale of shares and the CDSC retained by the Distributor on the redemption of shares is shown in the following table for the period indicated.
| | | | | | | | | | | | | | | | | | | | |
| Six Months Ended | | Class A Front-End
Sales Charges
Retained by
Distributor | | | Class A
Contingent
Deferred Sales
Charges
Retained by
Distributor | | | Class B
Contingent
Deferred Sales
Charges
Retained by
Distributor | | | Class C
Contingent
Deferred Sales
Charges
Retained by
Distributor | | | Class R
Contingent
Deferred Sales
Charges
Retained by
Distributor | |
| March 31, 2015 | | | $322,845 | | | | $1,706 | | | | $41,059 | | | | $15,741 | | | | $653 | |
Waivers and Reimbursements of Expenses. The Manager will waive fees and/or reimburse Fund expenses in an amount equal to the indirect management fees incurred through the Fund’s investment in IMMF. During the six months ended March 31, 2015, the Manager waived fees and/or reimbursed the Fund $6,238 for IMMF management fees.
Waivers and/or reimbursements may be modified or terminated as set forth according to the terms in the prospectus.
38 OPPENHEIMER GLOBAL FUND
8. Borrowings
Securities Lending. The Fund lends portfolio securities from time to time in order to earn additional income in the form of fees, or interest on cash or securities received as collateral. The loans are secured by collateral (either securities, letters of credit, or cash) in an amount of at least 102% of the market value of the loaned U.S. securities, and at least 105% of the market value of loaned foreign securities during the period of the loan. The market value of the loaned securities is determined at the close of each business day and any additional required collateral is delivered to the Fund on the next business day. If the borrower defaults on its obligation to return the securities loaned because of insolvency or other reasons, the Fund could experience delays and cost in recovering the securities loaned or in gaining access to the collateral. The Fund continues to receive the economic benefit of interest or dividends paid on the securities loaned in the form of a substitute payment received from the borrower and recognizes the change in the fair value of the securities loaned that may occur during the term of the loan. The Fund has the right under the lending agreement to recover the securities from the borrower on demand. As of March 31, 2015, the Fund had no securities on loan.
9. Pending Litigation
In 2009, seven class action lawsuits were filed in the U.S. District Court for the District of Colorado against OppenheimerFunds, Inc. (“OFI”), OppenheimerFunds Distributor, Inc., the Fund’s principal underwriter and distributor (the “Distributor”), and certain funds (but not including the Fund) advised by OFI Global Asset Management, Inc. and distributed by the Distributor (the “Defendant Funds”). The lawsuits also named as defendants certain officers and current and former trustees of the respective Defendant Funds. The lawsuits raised claims under federal securities laws and alleged, among other things, that the disclosure documents of the respective Defendant Funds contained misrepresentations and omissions and that the respective Defendant Funds’ investment policies were not followed. The plaintiffs in these actions sought unspecified damages, equitable relief and awards of attorneys’ fees and litigation expenses. The Defendant Funds’ Boards of Trustees also engaged counsel to represent the Funds and the present and former Independent Trustees named in those suits. In March 2014, the parties in six of these lawsuits executed stipulations and agreements of settlement resolving those actions. In July 2014, the court entered an order and final judgment approving the settlements as fair, reasonable and adequate. The settlements do not resolve a seventh outstanding lawsuit relating to Oppenheimer Rochester California Municipal Fund (the “California Fund Suit”). OFI believes the California Fund Suit is without legal merit and is defending the suit vigorously. While it is premature to render any opinion as to the outcome in the California Fund Suit, or whether any costs that OFI may bear in defending the California Fund Suit might not be reimbursed by insurance, OFI believes the California Fund Suit should not impair the ability of OFI or the Distributor to perform their respective duties to the Fund, and that the outcome of the California Fund Suit should not have any material effect on the operations of any of the Oppenheimer funds.
39 OPPENHEIMER GLOBAL FUND
PORTFOLIO PROXY VOTING POLICIES AND PROCEDURES;
UPDATES TO STATEMENTS OF INVESTMENTS Unaudited
The Fund has adopted Portfolio Proxy Voting Policies and Procedures under which the Fund votes proxies relating to securities (“portfolio proxies”) held by the Fund. A description of the Fund’s Portfolio Proxy Voting Policies and Procedures is available (i) without charge, upon request, by calling the Fund toll-free at 1.800.CALL OPP (225.5677), (ii) on the Fund’s website at www.oppenheimerfunds.com, and (iii) on the SEC’s website at www.sec.gov. In addition, the Fund is required to file Form N-PX, with its complete proxy voting record for the 12 months ended June 30th, no later than August 31st of each year. The Fund’s voting record is available (i) without charge, upon request, by calling the Fund toll-free at 1.800.CALL OPP (225.5677), and (ii) in the Form N-PX filing on the SEC’s website at www.sec.gov.
The Fund files its complete schedule of portfolio holdings with the SEC for the first quarter and the third quarter of each fiscal year on Form N-Q. The Fund’s Form N-Q filings are available on the SEC’s website at www.sec.gov. Those forms may be reviewed and copied at the SEC’s Public Reference Room in Washington, D.C. Information on the operation of the Public Reference Room may be obtained by calling 1-800-SEC-0330.
Householding—Delivery of Shareholder Documents
This is to inform you about OppenheimerFunds’ “householding” policy. If more than one member of your household maintains an account in a particular fund, OppenheimerFunds will mail only one copy of the fund’s prospectus (or, if available, the fund’s summary prospectus), annual and semiannual report and privacy policy. The consolidation of these mailings, called householding, benefits your fund through reduced mailing expense, and benefits you by reducing the volume of mail you receive from OppenheimerFunds. Householding does not affect the delivery of your account statements.
Please note that we will continue to household these mailings for as long as you remain an OppenheimerFunds shareholder, unless you request otherwise. If you prefer to receive multiple copies of these materials, please call us at 1.800.CALL-OPP (225-5677). You may also notify us in writing or via email. We will begin sending you individual copies of the prospectus (or, if available, the summary prospectus), reports and privacy policy within 30 days of receiving your request to stop householding.
40 OPPENHEIMER GLOBAL FUND
OPPENHEIMER GLOBAL FUND
| | | | |
| | |
| Trustees and Officers | | Brian F. Wruble, Chairman of the Board of Trustees and Trustee David K. Downes, Trustee Matthew P. Fink, Trustee Edmund P. Giambastiani, Jr., Trustee Elizabeth Krentzman, Trustee Mary F. Miller, Trustee Joel W. Motley, Trustee Joanne Pace, Trustee Daniel Vandivort, Trustee Rajeev Bhaman, Vice President William F. Glavin, Jr., Trustee Arthur P. Steinmetz, President and Principal Executive Officer Arthur S. Gabinet, Secretary and Chief Legal Officer Jennifer Sexton, Vice President and Chief Business Officer Mary Ann Picciotto, Chief Compliance Officer and Chief Anti-Money Laundering Officer Brian W. Wixted, Treasurer and Principal Financial & Accounting Officer | | |
| | |
| Manager | | OFI Global Asset Management, Inc. | | |
| | |
| Sub-Adviser | | OppenheimerFunds, Inc. | | |
| | |
| Distributor | | OppenheimerFunds Distributor, Inc. | | |
| | |
| Transfer and Shareholder Servicing Agent | | OFI Global Asset Management, Inc. | | |
| | |
| Sub-Transfer Agent | | Shareholder Services, Inc. DBA OppenheimerFunds Services | | |
| | |
Independent Registered Public Accounting Firm | | KPMG LLP | | |
| | |
| Legal Counsel | | Kramer Levin Naftalis & Frankel LLP | | |
| | |
| | The financial statements included herein have been taken from the records of the Fund without examination of those records by the independent registered public accounting firm. | | |
© 2015 OppenheimerFunds, Inc. All rights reserved.
41 OPPENHEIMER GLOBAL FUND
PRIVACY POLICY NOTICE
As an Oppenheimer fund shareholder, you are entitled to know how we protect your personal information and how we limit its disclosure.
Information Sources
We obtain nonpublic personal information about our shareholders from the following sources:
| — | | Applications or other forms |
| — | | When you create a user ID and password for online account access |
| — | | When you enroll in eDocs Direct, our electronic document delivery service |
| — | | Your transactions with us, our affiliates or others |
| — | | A software program on our website, often referred to as a “cookie,” which indicates which parts of our site you’ve visited |
| — | | When you set up challenge questions to reset your password online |
If you visit oppenheimerfunds.com and do not log on to the secure account information areas, we do not obtain any personal information about you. When you do log on to a secure area, we do obtain your user ID and password to identify you. We also use this information to provide you with products and services you have requested, to inform you about products and services that you may be interested in and assist you in other ways.
We do not collect personal information through our website unless you willingly provide it to us, either directly by email or in those areas of the website that request information. In order to update your personal information (including your mailing address, email address and phone number) you must first log on and visit your user profile.
If you have set your browser to warn you before accepting cookies, you will receive the warning message with each cookie. You can refuse cookies by turning them off in your browser. However, doing so may limit your access to certain sections of our website.
We use cookies to help us improve and manage our website. For example, cookies help us recognize new versus repeat visitors to the site, track the pages visited, and enable some special features on the website. This data helps us provide a better service for our website visitors.
Protection of Information
We do not disclose any non-public personal information (such as names on a customer list) about current or former customers to anyone, except as permitted by law.
Disclosure of Information
Copies of confirmations, account statements and other documents reporting activity in your fund accounts are made available to your financial advisor (as designated by you). We may also use details about you and your investments to help us, our financial service affiliates, or firms that jointly market their financial products and services with ours, to better serve your investment needs or suggest financial services or educational material that may be of interest to you. If this requires us to provide you with an opportunity to “opt in” or “opt out” of such information sharing with a firm not affiliated with us, you will receive notification on how to do so, before any such sharing takes place.
Right of Refusal
We will not disclose your personal information to unaffiliated third parties (except as permitted by law), unless we first offer you a reasonable opportunity to refuse or “opt out” of such disclosure.
42 OPPENHEIMER GLOBAL FUND
Internet Security and Encryption
In general, the email services provided by our website are encrypted and provide a secure and private means of communication with us. To protect your own privacy, confidential and/or personal information should only be communicated via email when you are advised that you are using a secure website.
As a security measure, we do not include personal or account information in non-secure emails, and we advise you not to send such information to us in non-secure emails. Instead, you may take advantage of the secure features of our website to encrypt your email correspondence. To do this, you will need to use a browser that supports Secure Sockets Layer (SSL) protocol.
We do not guarantee or warrant that any part of our website, including files available for download, are free of viruses or other harmful code. It is your responsibility to take appropriate precautions, such as use of an anti-virus software package, to protect your computer hardware and software.
| — | | All transactions, including redemptions, exchanges and purchases, are secured by SSL and 256-bit encryption. SSL is used to establish a secure connection between your PC and OppenheimerFunds’ server. It transmits information in an encrypted and scrambled format. |
| — | | Encryption is achieved through an electronic scrambling technology that uses a “key” to code and then decode the data. Encryption acts like the cable converter box you may have on your television set. It scrambles data with a secret code so that no one can make sense of it while it is being transmitted. When the data reaches its destination, the same software unscrambles the data. |
| — | | You can exit the secure area by either closing your browser, or for added security, you can use the Log Out button before you close your browser. |
Other Security Measures
We maintain physical, electronic and procedural safeguards to protect your personal account information. Our employees and agents have access to that information only so that they may offer you products or provide services, for example, when responding to your account questions.
How You Can Help
You can also do your part to keep your account information private and to prevent unauthorized transactions. If you obtain a user ID and password for your account, do not allow it to be used by anyone else. Also, take special precautions when accessing your account on a computer used by others.
Who We Are
This joint notice describes the privacy policies of the Oppenheimer funds, OppenheimerFunds, Inc., each of its investment adviser subsidiaries, OppenheimerFunds Distributor, Inc. and OFI Global Trust Co. It applies to all Oppenheimer fund accounts you presently have, or may open in the future, using your Social Security number—whether or not you remain a shareholder of our funds. This notice was last updated March 2015. In the event it is updated or changed, we will post an updated notice on our website at oppenheimerfunds.com. If you have any questions about this privacy policy, write to us at P.O. Box 5270, Denver, CO 80217-5270, email us by clicking on the Contact Us section of our website at oppenheimerfunds.com or call us at 1.800.CALL OPP (225.5677).
43 OPPENHEIMER GLOBAL FUND
THIS PAGE INTENTIONALLY LEFT BLANK.
44 OPPENHEIMER GLOBAL FUND
THIS PAGE INTENTIONALLY LEFT BLANK.
45 OPPENHEIMER GLOBAL FUND
THIS PAGE INTENTIONALLY LEFT BLANK.
46 OPPENHEIMER GLOBAL FUND
THIS PAGE INTENTIONALLY LEFT BLANK
47 OPPENHEIMER GLOBAL FUND
| | | | |
| | | | |
| |  | | |
| | |
| | OppenheimerFunds® | | |
| | The Right Way | | |
| | to Invest | | |
| | |
| | Visit us at oppenheimerfunds.com for 24-hr access to account information and transactions or call us at 800 CALL OPP (800 225 5677) for 24-hr automated information and automated transactions. Representatives also available Mon–Fri 8am-8pm ET. | | |
Visit Us
oppenheimerfunds.com
Call Us
800 225 5677
Follow Us
| | | | |

| | Oppenheimer funds are distributed by OppenheimerFunds Distributor, Inc. 225 Liberty Street, New York, NY 10281-1008 © 2015 OppenheimerFunds Distributor, Inc. All rights reserved. RS0330.001.0315 May 27, 2015 | | |
Item 2. Code of Ethics.
Not applicable to semiannual reports.
Item 3. Audit Committee Financial Expert.
Not applicable to semiannual reports.
Item 4. Principal Accountant Fees and Services.
Not applicable to semiannual reports.
Item 5. Audit Committee of Listed Registrants
Not applicable.
Item 6. Schedule of Investments.
a) Not applicable. The complete schedule of investments is included in Item 1 of this Form N-CSR.
b) Not applicable.
Item 7. Disclosure of Proxy Voting Policies and Procedures for Closed-End Management Investment Companies.
Not applicable.
Item 8. Portfolio Managers of Closed-End Management Investment Companies.
Not applicable.
Item 9. Purchases of Equity Securities by Closed-End Management Investment Company and Affiliated Purchasers.
Not applicable.
Item 10. Submission of Matters to a Vote of Security Holders.
The Fund’s Governance Committee Provisions with Respect to Nominations of Directors/Trustees to the Respective Boards
None
Item 11. Controls and Procedures.
Based on their evaluation of the registrant’s disclosure controls and procedures (as defined in rule 30a-3(c) under the Investment Company Act of 1940 (17 CFR 270.30a-3(c)) as of 3/31/2015, the registrant’s principal executive officer and principal financial officer found the registrant’s disclosure controls and procedures to provide reasonable assurances that information required to be disclosed by the registrant in the reports that it files under the Securities Exchange Act of 1934 (a) is accumulated and communicated to registrant’s management, including its principal executive officer and principal financial officer, to allow timely decisions regarding required disclosure, and (b) is recorded, processed, summarized and reported, within the time periods specified in the rules and forms adopted by the U.S. Securities and Exchange Commission.
There have been no changes in the registrant’s internal controls over financial reporting that occurred during the registrant’s second fiscal quarter of the period covered by this report that have materially affected, or are reasonably likely to materially affect, the registrant’s internal control over financial reporting.
Item 12. Exhibits.
| (a) | (1) Not applicable to semiannual reports. |
(2) Exhibits attached hereto.
(3) Not applicable.
| (b) | Exhibit attached hereto. |
SIGNATURES
Pursuant to the requirements of the Securities Exchange Act of 1934 and the Investment Company Act of 1940, the registrant has duly caused this report to be signed on its behalf by the undersigned, thereunto duly authorized.
| | |
| Oppenheimer Global Fund |
| |
| By: | | /s/ Arthur P. Steinmetz |
| | Arthur P. Steinmetz |
| | Principal Executive Officer |
| Date: | | 5/12/2015 |
Pursuant to the requirements of the Securities Exchange Act of 1934 and the Investment Company Act of 1940, this report has been signed below by the following persons on behalf of the registrant and in the capacities and on the dates indicated.
| | |
| By: | | /s/ Arthur P. Steinmetz |
| | Arthur P. Steinmetz |
| | Principal Executive Officer |
| Date: | | 5/12/2015 |
| | |
| By: | | /s/ Brian W. Wixted |
| | Brian W. Wixted |
| | Principal Financial Officer |
| Date: | | 5/12/2015 |